UNITED STATES
SECURITIES AND EXCHANGE COMMISSION
Washington, D.C. 20549
FORM 20-F
(Mark One)
| REGISTRATION STATEMENT PURSUANT TO SECTION 12(b) or (g) OF THE SECURITIES EXCHANGE ACT OF 1934 | |||||
OR
| ANNUAL REPORT PURSUANT TO SECTION 13 OR 15(d) OF THE SECURITIES EXCHANGE ACT OF 1934 | |||||
For the fiscal year ended 31 December 2023
OR
| TRANSITION REPORT PURSUANT TO SECTION 13 OR 15(d) OF THE SECURITIES EXCHANGE ACT OF 1934 | |||||
OR
| SHELL COMPANY REPORT PURSUANT TO SECTION 13 OR 15(d) OF THE SECURITIES EXCHANGE ACT OF 1934 | |||||
Commission file number: 1-06262
BP p.l.c.
(Exact name of Registrant as specified in its charter)
England and Wales
(Jurisdiction of incorporation or organization)
(Address of principal executive offices)
BP p.l.c.
Tel +44 (0) 20 7496 4000
Fax +44 (0) 20 7496 4630
(Name, Telephone, E-mail and/or Facsimile number and Address of Company Contact Person)
Securities registered or to be registered pursuant to Section 12(b) of the Act
| Title of each class | Trading Symbol(s) | Name of each exchange on which registered | |||||||||
| * | |||||||||||
BP/27C | |||||||||||
| * | Not for trading, but only in connection with the registration of American Depositary Shares, pursuant to the requirements of the Securities and Exchange Commission | ||||
Securities registered or to be registered pursuant to Section 12(g) of the Act.
None
Securities for which there is a reporting obligation pursuant to Section 15(d) of the Act.
None
Indicate the number of outstanding shares of each of the issuer’s classes of capital or common stock as of the close of the period covered by the annual report.
| Ordinary Shares of 25c each | |||||
| Cumulative First Preference Shares of £1 each | |||||
| Cumulative Second Preference Shares of £1 each | |||||
Indicate by check mark if the registrant is a well-known seasoned issuer, as defined in Rule 405 of the Securities Act. Yes ☒ No ☐
If this report is an annual or transition report, indicate by check mark if the registrant is not required to file reports pursuant to Section 13 or 15(d) of the Securities Exchange Act of 1934. Yes ☐ No ☒
Note—Checking the box above will not relieve any registrant required to file reports pursuant to Section 13 or 15(d) of the Securities Exchange Act of 1934 from their obligations under those Sections.
Indicate by check mark whether the Registrant (1) has filed all reports required to be filed by Section 13 or 15(d) of the Securities Exchange Act of 1934 during the preceding 12 months (or for such shorter period that the Registrant was required to file such reports), and (2) has been subject to such filing requirements for the past 90 days. Yes ☒ No ☐
Indicate by check mark whether the registrant has submitted electronically every Interactive Data File required to be submitted pursuant to Rule 405 of Regulation S-T (§ 232.405 of this chapter) during the preceding 12 months (or for such shorter period that the registrant was required to submit such files). Yes ☒ No ☐
Indicate by check mark whether the registrant is a large accelerated filer, an accelerated filer, a non-accelerated filer, or an emerging growth company. See definition of “large accelerated filer,” “accelerated filer,” and “emerging growth company” in Rule 12b-2 of the Exchange Act. (Check one):
If an emerging growth company that prepares its financial statements in accordance with U.S. GAAP, indicate by check mark if the registrant has elected not to use the extended transition period for complying with any new or revised financial accounting standards† provided pursuant to Section 13(a) of the Exchange Act. ☐
† The term “new or revised financial accounting standard” refers to any update issued by the Financial Accounting Standards Board to its Accounting Standards Codification after April 5, 2012.
Indicate by check mark whether the registrant has filed a report on and attestation to its management’s assessment of the effectiveness of its internal control over financial reporting under Section 404(b) of the Sarbanes-Oxley Act (15 U.S.C. 7262(b)) by the registered public accounting firm that prepared or issued its audit report. ☒
If securities are registered pursuant to Section 12(b) of the Act, indicate by check mark whether the financial statements of the registrant included in the filing reflect the correction of an error to previously issued financial statements. ☒
Indicate by check mark whether any of those error corrections are restatements that required a recovery analysis of incentive- based compensation received by any of the registrant’s executive officers during the relevant recovery period pursuant to §240.10D-1(b). ☐
Indicate by check mark which basis of accounting the registrant has used to prepare the financial statements included in this filing:
U.S. GAAP ☐ | by the International Accounting Standards Board ☒ | Other ☐ | ||||||||||||
If “Other” has been checked in response to the previous question, indicate by check mark which financial statement item the registrant has elected to follow.
Item 17 ☐ Item 18 ☐
If this is an annual report, indicate by check mark whether the registrant is a shell company (as defined in Rule 12b-2 of the Exchange Act). Yes ☐ No ☒
From IOC to IEC International Oil Company to Integrated Energy Company bp Annual Report and Form 20-F 2023
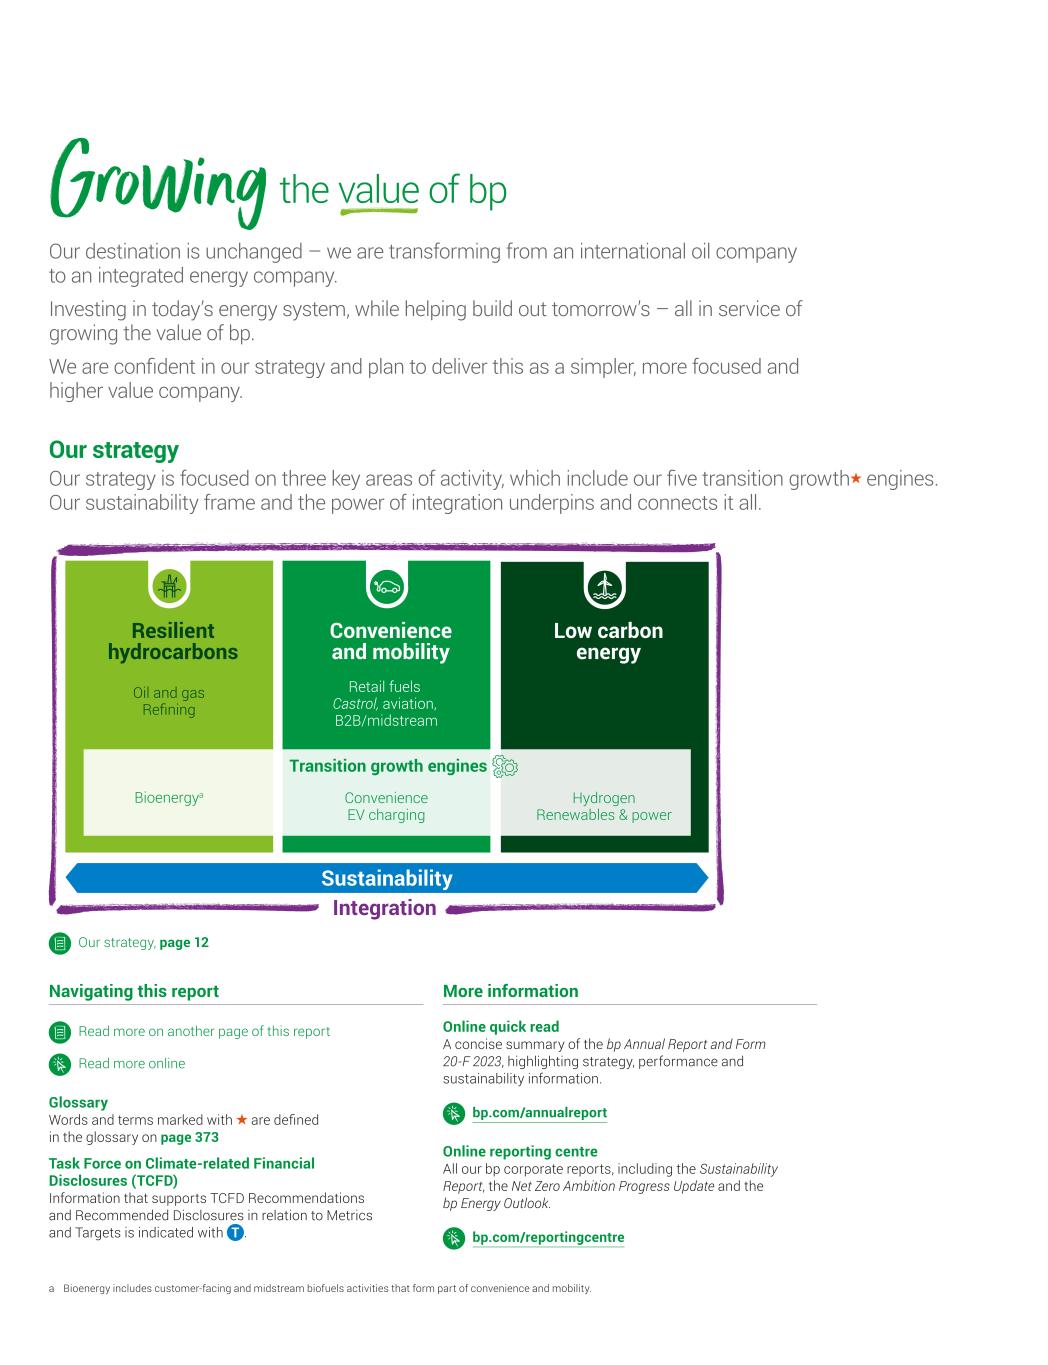
Sustainability Integration Transition growth engines Convenience and mobility Bioenergya Hydrogen Renewables & power Convenience EV charging Oil and gas Refining Retail fuels Castrol, aviation, B2B/midstream Low carbon energy Resilient hydrocarbons Online quick read A concise summary of the bp Annual Report and Form 20-F 2023, highlighting strategy, performance and sustainability information. bp.com/annualreport Online reporting centre All our bp corporate reports, including the Sustainability Report, the Net Zero Ambition Progress Update and the bp Energy Outlook. bp.com/reportingcentre Navigating this report More information Read more on another page of this report Read more online Glossary Words and terms marked with are defined in the glossary on page 373 Task Force on Climate-related Financial Disclosures (TCFD) Information that supports TCFD Recommendations and Recommended Disclosures in relation to Metrics and Targets is indicated with . a Bioenergy includes customer-facing and midstream biofuels activities that form part of convenience and mobility. Our strategy Our strategy is focused on three key areas of activity, which include our five transition growth engines. Our sustainability frame and the power of integration underpins and connects it all. Our destination is unchanged – we are transforming from an international oil company to an integrated energy company. Investing in today’s energy system, while helping build out tomorrow’s – all in service of growing the value of bp. We are confident in our strategy and plan to deliver this as a simpler, more focused and higher value company. Growing the value of bp Our strategy, page 12
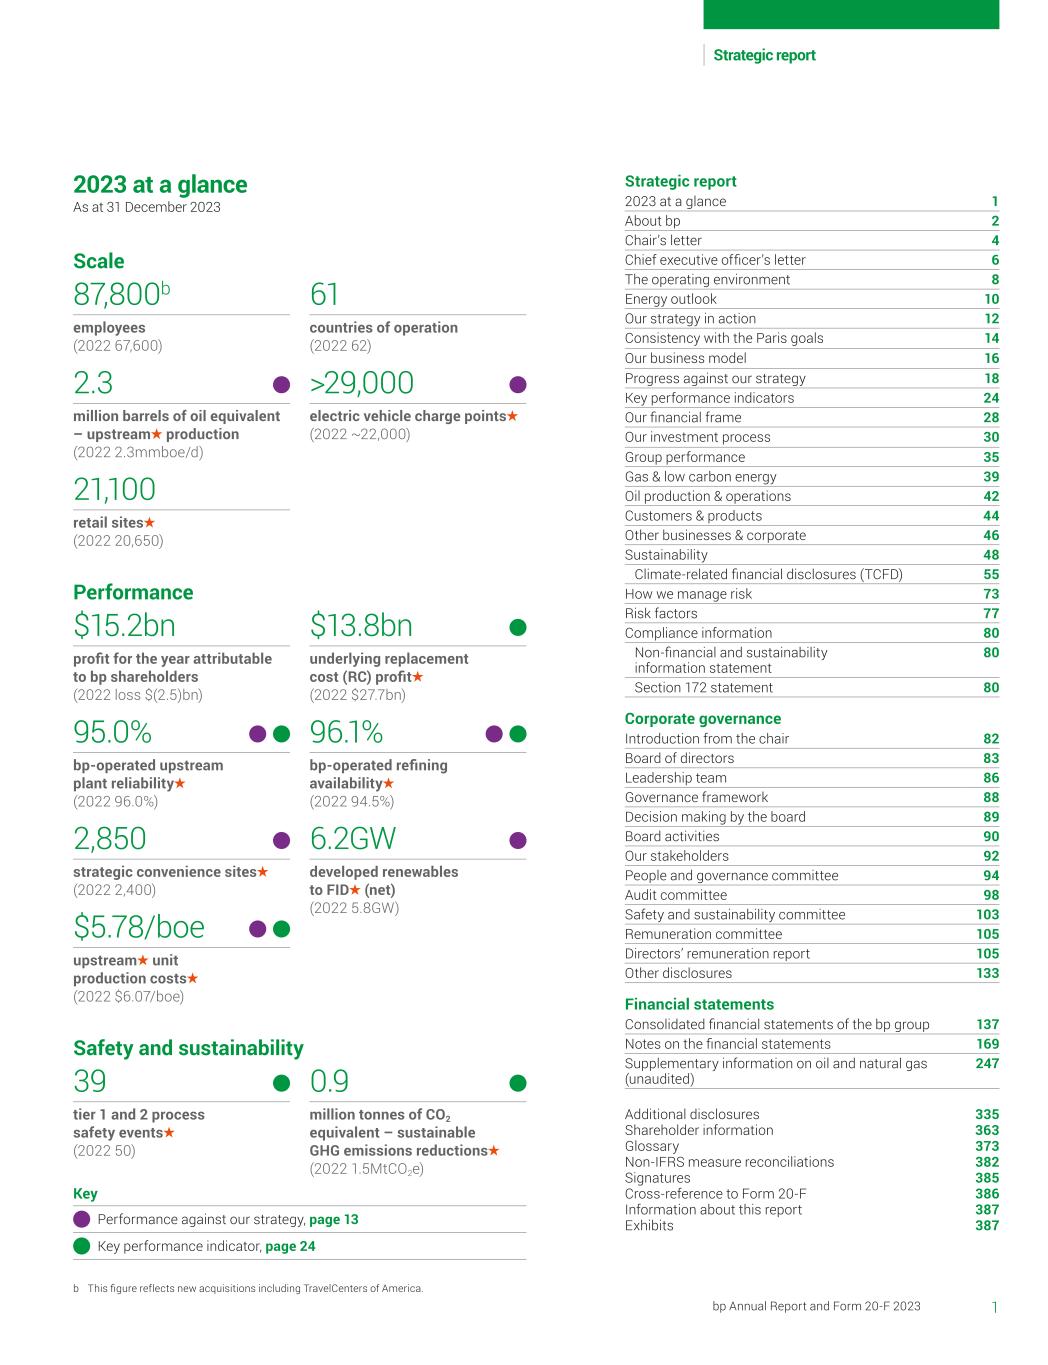
1bp Annual Report and Form 20-F 2023 Strategic report Scale Performance Safety and sustainability 2023 at a glance As at 31 December 2023 87,800b employees (2022 67,600) $15.2bn profit for the year attributable to bp shareholders (2022 loss $(2.5)bn) 39 tier 1 and 2 process safety events (2022 50) 95.0% bp-operated upstream plant reliability (2022 96.0%) 2,850 strategic convenience sites (2022 2,400) $5.78/boe upstream unit production costs (2022 $6.07/boe) 2.3 million barrels of oil equivalent – upstream production (2022 2.3mmboe/d) 21,100 retail sites (2022 20,650) 61 countries of operation (2022 62) $13.8bn underlying replacement cost (RC) profit (2022 $27.7bn) 0.9 million tonnes of CO2 equivalent – sustainable GHG emissions reductions (2022 1.5MtCO2e) 96.1% bp-operated refining availability (2022 94.5%) 6.2GW developed renewables to FID (net) (2022 5.8GW) >29,000 electric vehicle charge points (2022 ~22,000) Strategic report 2023 at a glance 1 About bp 2 Chair’s letter 4 Chief executive officer’s letter 6 The operating environment 8 Energy outlook 10 Our strategy in action 12 Consistency with the Paris goals 14 Our business model 16 Progress against our strategy 18 Key performance indicators 24 Our financial frame 28 Our investment process 30 Group performance 35 Gas & low carbon energy 39 Oil production & operations 42 Customers & products 44 Other businesses & corporate 46 Sustainability 48 Climate-related financial disclosures (TCFD) 55 How we manage risk 73 Risk factors 77 Compliance information 80 Non-financial and sustainability information statement 80 Section 172 statement 80 Corporate governance Introduction from the chair 82 Board of directors 83 Leadership team 86 Governance framework 88 Decision making by the board 89 Board activities 90 Our stakeholders 92 People and governance committee 94 Audit committee 98 Safety and sustainability committee 103 Remuneration committee 105 Directors’ remuneration report 105 Other disclosures 133 Financial statements Consolidated financial statements of the bp group 137 Notes on the financial statements 169 Supplementary information on oil and natural gas (unaudited) 247 Additional disclosures 335 Shareholder information 363 Glossary 373 Non-IFRS measure reconciliations 382 Signatures 385 Cross-reference to Form 20-F 386 Information about this report 387 Exhibits 387 Key Performance against our strategy, page 13 Key performance indicator, page 24 b This figure reflects new acquisitions including TravelCenters of America.
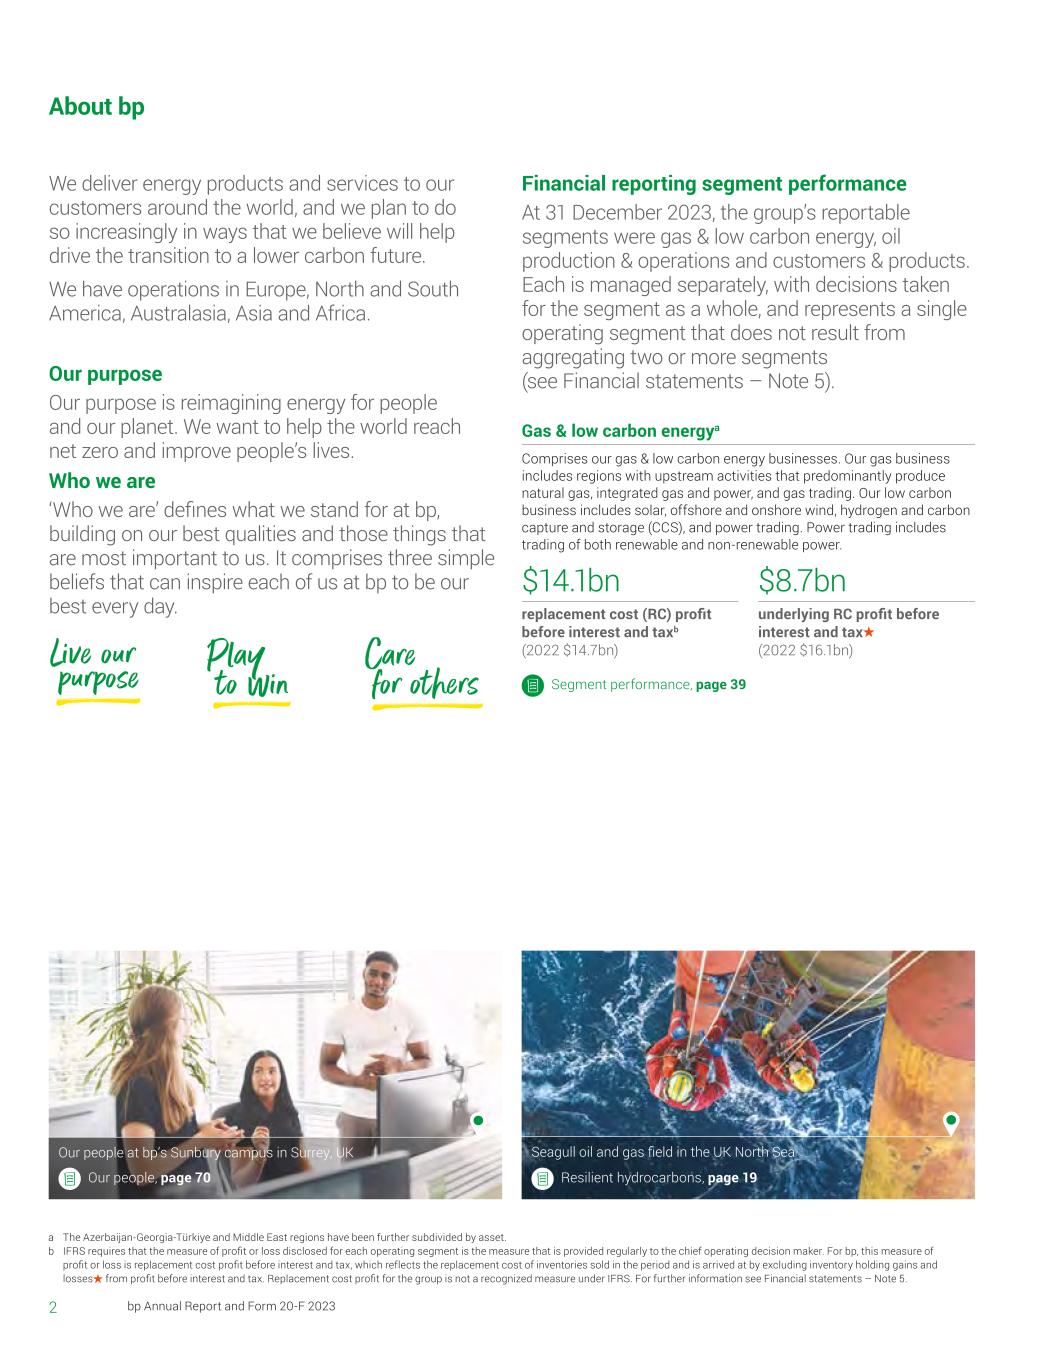
2 bp Annual Report and Form 20-F 2023 About bp We deliver energy products and services to our customers around the world, and we plan to do so increasingly in ways that we believe will help drive the transition to a lower carbon future. We have operations in Europe, North and South America, Australasia, Asia and Africa. Financial reporting segment performance At 31 December 2023, the group’s reportable segments were gas & low carbon energy, oil production & operations and customers & products. Each is managed separately, with decisions taken for the segment as a whole, and represents a single operating segment that does not result from aggregating two or more segments (see Financial statements – Note 5).Our purpose Our purpose is reimagining energy for people and our planet. We want to help the world reach net zero and improve people’s lives. Who we are ‘Who we are’ defines what we stand for at bp, building on our best qualities and those things that are most important to us. It comprises three simple beliefs that can inspire each of us at bp to be our best every day. Gas & low carbon energya Comprises our gas & low carbon energy businesses. Our gas business includes regions with upstream activities that predominantly produce natural gas, integrated gas and power, and gas trading. Our low carbon business includes solar, offshore and onshore wind, hydrogen and carbon capture and storage (CCS), and power trading. Power trading includes trading of both renewable and non-renewable power. $14.1bn replacement cost (RC) profit before interest and taxb (2022 $14.7bn) $8.7bn underlying RC profit before interest and tax (2022 $16.1bn) Segment performance, page 39 a The Azerbaijan-Georgia-Türkiye and Middle East regions have been further subdivided by asset. b IFRS requires that the measure of profit or loss disclosed for each operating segment is the measure that is provided regularly to the chief operating decision maker. For bp, this measure of profit or loss is replacement cost profit before interest and tax, which reflects the replacement cost of inventories sold in the period and is arrived at by excluding inventory holding gains and losses from profit before interest and tax. Replacement cost profit for the group is not a recognized measure under IFRS. For further information see Financial statements – Note 5. Our people at bp’s Sunbury campus in Surrey, UK Seagull oil and gas field in the UK North Sea Resilient hydrocarbons, page 19Our people, page 70 Live our purpose Play to win Care for others
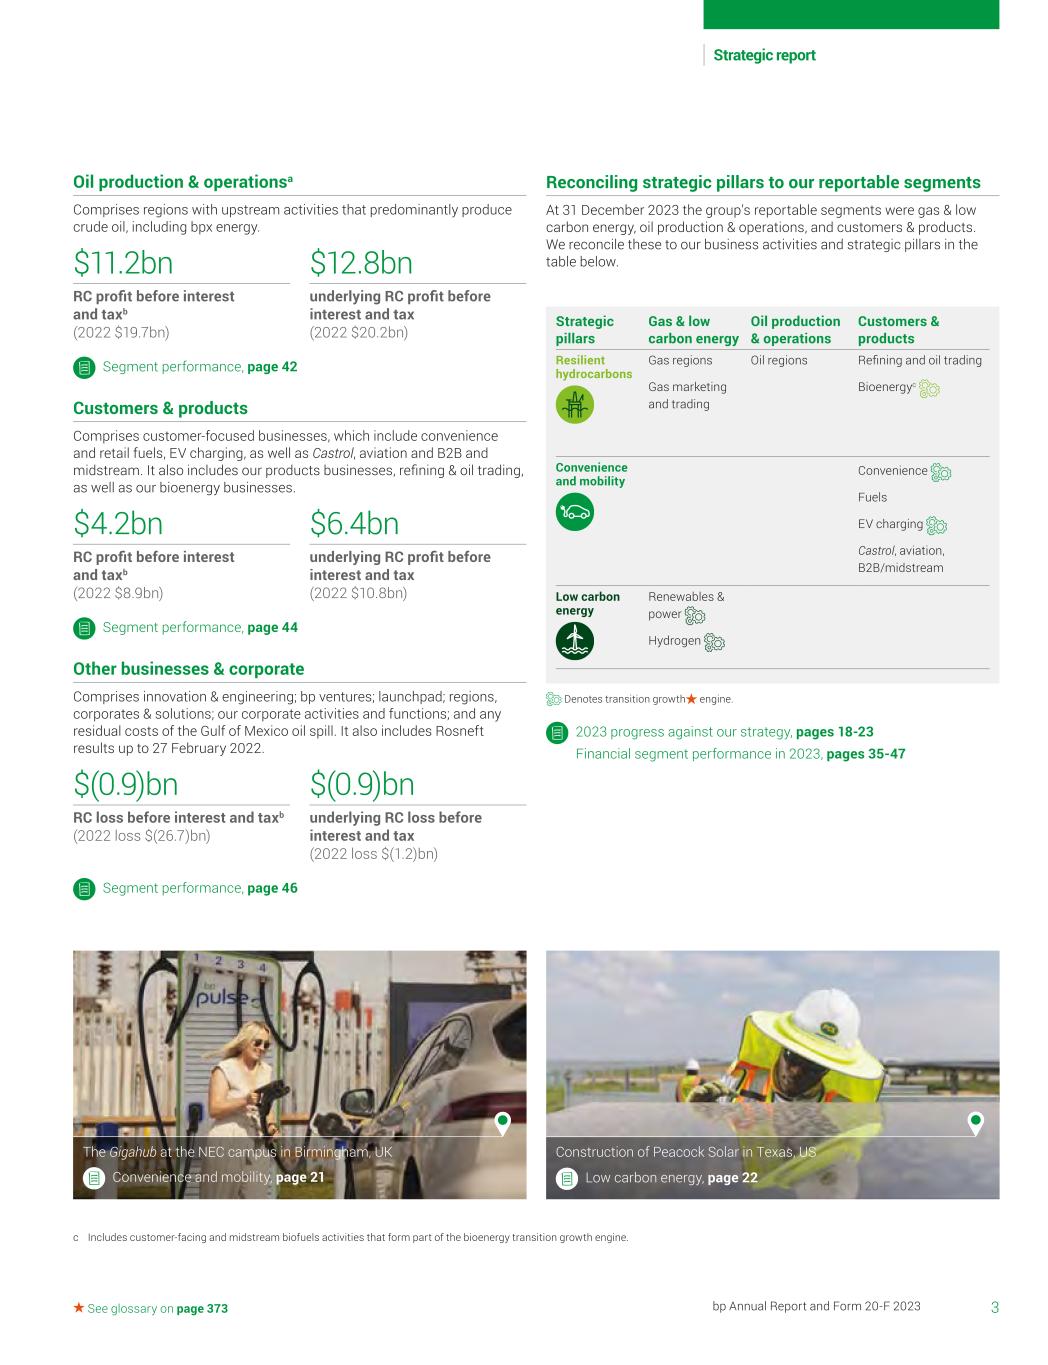
3bp Annual Report and Form 20-F 2023 Strategic report See glossary on page 373 Oil production & operationsa Comprises regions with upstream activities that predominantly produce crude oil, including bpx energy. $11.2bn RC profit before interest and taxb (2022 $19.7bn) $12.8bn underlying RC profit before interest and tax (2022 $20.2bn) Segment performance, page 42 Customers & products Comprises customer-focused businesses, which include convenience and retail fuels, EV charging, as well as Castrol, aviation and B2B and midstream. It also includes our products businesses, refining & oil trading, as well as our bioenergy businesses. $4.2bn RC profit before interest and taxb (2022 $8.9bn) $6.4bn underlying RC profit before interest and tax (2022 $10.8bn) Segment performance, page 44 Other businesses & corporate Comprises innovation & engineering; bp ventures; launchpad; regions, corporates & solutions; our corporate activities and functions; and any residual costs of the Gulf of Mexico oil spill. It also includes Rosneft results up to 27 February 2022. $(0.9)bn RC loss before interest and taxb (2022 loss $(26.7)bn) $(0.9)bn underlying RC loss before interest and tax (2022 loss $(1.2)bn) Segment performance, page 46 Reconciling strategic pillars to our reportable segments At 31 December 2023 the group’s reportable segments were gas & low carbon energy, oil production & operations, and customers & products. We reconcile these to our business activities and strategic pillars in the table below. c Includes customer-facing and midstream biofuels activities that form part of the bioenergy transition growth engine. Construction of Peacock Solar in Texas, US The Gigahub at the NEC campus in Birmingham, UK Low carbon energy, page 22Convenience and mobility, page 21 Denotes transition growth engine. 2023 progress against our strategy, pages 18-23 Financial segment performance in 2023, pages 35-47 Strategic pillars Gas & low carbon energy Oil production & operations Customers & products Resilient hydrocarbons Gas regions Gas marketing and trading Oil regions Refining and oil trading Bioenergyc Convenience and mobility Convenience Fuels EV charging Castrol, aviation, B2B/midstream Low carbon energy Renewables & power Hydrogen
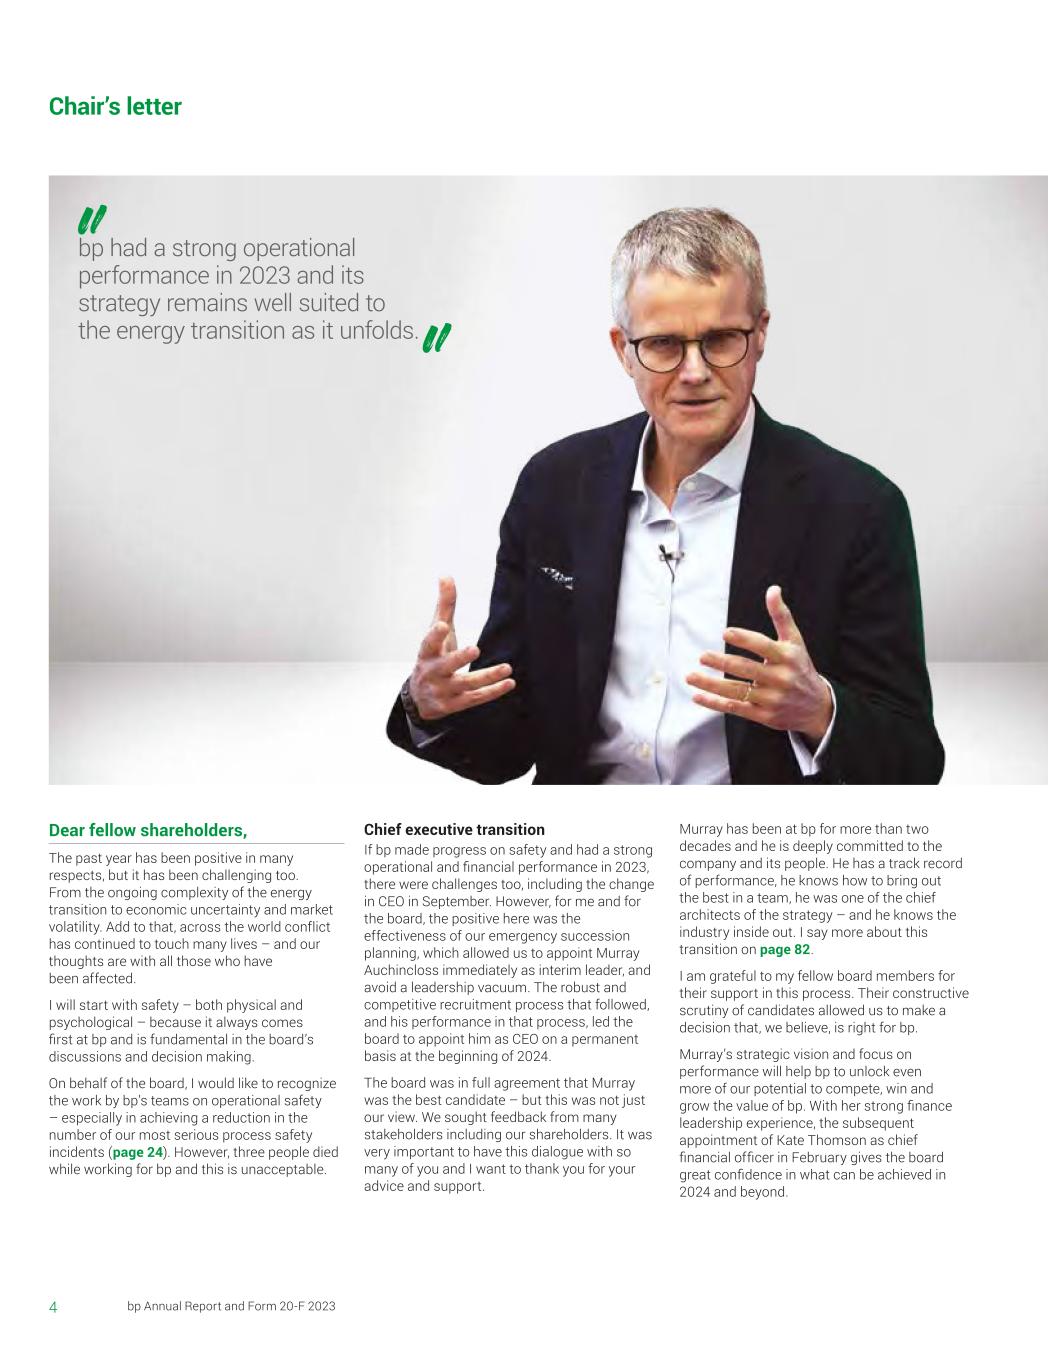
4 bp Annual Report and Form 20-F 2023 Chair’s letter Dear fellow shareholders, The past year has been positive in many respects, but it has been challenging too. From the ongoing complexity of the energy transition to economic uncertainty and market volatility. Add to that, across the world conflict has continued to touch many lives – and our thoughts are with all those who have been affected. I will start with safety – both physical and psychological – because it always comes first at bp and is fundamental in the board’s discussions and decision making. On behalf of the board, I would like to recognize the work by bp’s teams on operational safety – especially in achieving a reduction in the number of our most serious process safety incidents (page 24). However, three people died while working for bp and this is unacceptable. Chief executive transition If bp made progress on safety and had a strong operational and financial performance in 2023, there were challenges too, including the change in CEO in September. However, for me and for the board, the positive here was the effectiveness of our emergency succession planning, which allowed us to appoint Murray Auchincloss immediately as interim leader, and avoid a leadership vacuum. The robust and competitive recruitment process that followed, and his performance in that process, led the board to appoint him as CEO on a permanent basis at the beginning of 2024. The board was in full agreement that Murray was the best candidate – but this was not just our view. We sought feedback from many stakeholders including our shareholders. It was very important to have this dialogue with so many of you and I want to thank you for your advice and support. Murray has been at bp for more than two decades and he is deeply committed to the company and its people. He has a track record of performance, he knows how to bring out the best in a team, he was one of the chief architects of the strategy – and he knows the industry inside out. I say more about this transition on page 82. I am grateful to my fellow board members for their support in this process. Their constructive scrutiny of candidates allowed us to make a decision that, we believe, is right for bp. Murray’s strategic vision and focus on performance will help bp to unlock even more of our potential to compete, win and grow the value of bp. With her strong finance leadership experience, the subsequent appointment of Kate Thomson as chief financial officer in February gives the board great confidence in what can be achieved in 2024 and beyond. bp had a strong operational performance in 2023 and its strategy remains well suited to the energy transition as it unfolds.
5bp Annual Report and Form 20-F 2023 Strategic report See glossary on page 373 Strategic direction This leadership transition marks a new chapter for the company, but not a new strategic direction. This year, it has become even clearer that the world needs a better, more balanced energy system. One that is secure, affordable and lower carbon. bp’s strategy to go from an international oil company to an integrated energy company is designed both to help build a better system and to create value for shareholders while doing so. bp had a strong operational performance in 2023 and its strategy remains well suited to the energy transition as it unfolds. The global move to a lower carbon energy system is not straightforward and presents both challenges and opportunities for an energy company like bp. With global markets remaining unpredictable, flexibility will be important and the strategy allows for this. Role of culture As bp’s business activities evolve, the strength of its culture is paramount. It builds trust within bp’s teams, encourages better performance and helps bp to attract and keep the best talent. A key aspect of this is its speak-up culture. bp encourages everyone to raise any concerns they have, including when they see something they think is inconsistent with the code of conduct or is unsafe or unlawful. bp tools allow them to do this safely, securely, in confidence and without fear of retaliation (see page 72). Closing thanks Every day, bp teams continue to go to work on rigs, in our refineries, in offices, at sea, at our retail sites and at our solar and wind installations – to mention just some of bp’s many areas of operation. I want to thank them all for the considerable progress bp made in 2023. I also want to thank Paula Rosput Reynolds and Sir John Sawers for their distinguished service. Over almost nine years, Paula has been a valued member of the board, including roles as chair of the remuneration committee (Remco) and senior independent director (SID). I am pleased that Amanda Blanc will take on the role of SID and, for an interim period, Tushar Morzaria the role of Remco chair, both with effect from the end of our annual general meeting in April 2024. Sir John’s considerable work since 2015 includes supporting our safety and sustainability committee and our people and governance committee – and he has been highly regarded as chair of our geopolitical advisory council. Both will step down at the end of our annual general meeting in April 2024. I will close with a final thank you. As I look back at this year, one of the highlights for me personally has been my meetings with you, my fellow shareholders – this year more than ever. In a time of internal change and external uncertainty, I want to thank you for your advice, your belief in bp – and for your trust and support throughout. Helge Lund Chair 8 March 2024 $6.5bn share buybacks announced from our 2023 surplus cash flow $4.8bn total dividends distributed to bp shareholders
6 bp Annual Report and Form 20-F 2023 Chief executive officer’s letter Dear fellow shareholders, Thank you for your support over the last year, especially during the period of leadership transition. It is an honour to lead your company as CEO. Our destination is unchanged. We’re moving from an international oil company to an integrated energy company – IOC to IEC. We’re investing in today’s energy system, which is mainly oil and gas, while building out tomorrow’s. And we are focused on growing the value of bp. Safety first Safety always comes first in everything we do. In 2023 three people lost their lives while working for bp – a contractor at bpx energy and two colleagues at our newly acquired TravelCenters of America business. We will never accept this as part of doing business. Our goal is the elimination of all fatalities, life-changing injuries and the most serious process safety incidents. In 2023 we continued to make progress on process safety, but there is always more to do. We need to constantly reinforce and build on our operating culture across the business, rigorously applying our Operating Management System (OMS), embedding the Lifesaving Rules and living our Safety Leadership Principles. We are determined to keep building a safer bp. A year of delivery In 2023 we delivered a resilient operational and financial performance, with earnings (adjusted EBITDA ) of $43.7 billiona and operating cash flow of $32.0 billion. This contributed to: • Profit for the year attributable to bp shareholders of $15.2 billion. • Underlying replacement cost profit of $13.8 billion. • Return on average capital employed (ROACE) of 18.1%b. • Net debt reduced to $20.9 billionc – its lowest in a decade. In turn this has allowed us to deliver competitive distributions to our shareholders: • A 10% increase in the dividend per ordinary share (compared with the fourth quarter of 2022). • $6.5 billion in share buybacks from our 2023 surplus cash flow . • 17% reduction in issued share capital between the end of the first quarter of 2021 and 31 December 2023. We continue to maintain a disciplined financial frame. The strength of our underlying financial performance, the disciplined approach to strengthening the balance sheet over the last few years, and our confidence in our drive towards 2025 gave us the capacity to update the financial frame earlier this year. As we announced in February 2024, we have tightened our capital expenditure guidance and enhanced our share buyback guidance, all while continuing to prioritize a strong balance sheet and strong investment grade credit rating. Strategic progress We are four years into our journey from IOC to IEC. Our strategy is based on the judgement that oil and gas will be needed for decades, but that a global shift to lower carbon energy is well underway. Since the pace of that shift is uncertain we will continue to be flexible and pragmatic, responding to changing demand and societal need, as we did in February 2023. Our strategic progress in 2023 included: • Oil and gas production growth of 2.6%, underpinned by strong growth from bpx energy and good management of our base business. • Strong underlying year-on-year growth in our convenience gross margin . • EV charge points up 35% globally, energy sold up 150%. • Biogas supply volumes up 80%, biofuels production up 18%. • 21.1GW net growth in our renewables pipeline. • 1.1mtpa net growth in our hydrogen pipeline . • Completed the planned implementation of methane measurement approach across our operated upstream oil and gas assets. a Adjusted EBITDA for the group is a non-IFRS measure and its nearest IFRS-equivalent measure is profit for the year 2023. b ROACE is a non-IFRS measure and its nearest IFRS measures of numerator and denominator are profit for the year 2023 attributable to bp shareholders of $15.2 billion and total equity at the end of 2023 of $85.5 billion respectively. c Net debt is a non-IFRS measure and its nearest IFRS-equivalent measure is finance debt at the end of 2023. Nearest IFRS-equivalent measures $15.9bn profit for the year 2023a 17.8% profit for the year 2023 attributable to bp shareholders divided by total equity at 31 December 2023b $52.0bn finance debt at the end of 2023c

7bp Annual Report and Form 20-F 2023 Strategic report See glossary on page 373 As we drive to 2025, we will focus on executing to deliver value. Growing the value of bp The last few years were about generating options. As we drive to 2025, we will focus on executing to deliver value. To guide that effort, we’ve set out six near-term priorities for bp. These are: to keep improving safety and reducing emissions. To make the company simpler and more focused. To become more efficient by putting technology and digitization at the heart of what we do. To progress our growth projects. To invest to maximize returns. All while maintaining our commitment to shareholder distributions. bp is a great company. We have high-quality resources, outstanding science and engineering, strong partnerships, a world-class trading capability, and above all great people. Six priorities to grow the value of bp 1. Improve safety and reduce emissions. 2. Drive a focus in the business on activities that create the most value. 3. Deliver the next wave of efficiency – including technology and global capability hubs. 4. Deliver the next set of growth projects that provide growth through to 2030 and beyond. 5. Optimize ROACE through disciplined investment allocation. 6. Grow shareholder returns. Read more: page 29 I believe very few companies can deliver what we offer. It’s why I’ve never been more confident that we can win in this transition as a simpler, more focused and higher value bp. Last but not least, thank you for your continued support, and a big thank you to the whole bp team for working incredibly hard in what was at times an uncertain year. Murray Auchincloss Chief executive officer 8 March 2024
8 bp Annual Report and Form 20-F 2023 The operating environment Energy markets Through 2023 energy markets and prices were volatile as demand and supply flows continued to adjust to post-COVID-19 recoveries in demand and disruptions caused by the Russia-Ukraine war. Concerns about energy security and emissions continued to boost renewables as the world transitions towards a lower carbon future. Economic growth was uneven across regions, as past increases in energy prices and steep rises in interest rates had varying effects in different countries. Inflation rates fell significantly as the effects of past increases in food and energy prices on annual inflation eased. However, inflation across much of the world remained above central banks’ targets, and a combination of squeezed incomes and the sharp tightening in monetary policy contributed to a below-average growth rate of around 3% for the global economy in 2023. Growth in advanced economies was 1.5%a, with weakness in the euro area contrasting with continued robust growth in the US. Emerging economies grew by around 4%a, with China experiencing a rebound in growth to 5.2%a as it emerged from COVID-19 lockdowns. Expansion of other emerging economies was dampened by higher interest rates and weak demand for their exports. Oil Oil prices were elevated across much of 2023, supported by a combination of robust oil demand growth and OPEC production cuts. Brent averaged $83/bbl in 2023, down from $101/bbl in the previous year. Global oil demand grew by 2.3mmb/d to 101.7mmb/d in 2023b. The structural post-COVID-19 rebound of mobility ( jet and gasoline), including a significant increase in Chinese oil demand of 1.7mmb/db, supported the well-above-trend growth. A combination of official and voluntary cuts caused OPEC+ production to fall by 390kb/db in 2023, led by Saudi Arabia, which accounted for a 900kb/d contraction versus 2022b. However, these reductions were offset by strong growth in non-OPEC+ supplies, which increased by 2.3mmb/d in 2023b, with the US accounting for two-thirds of that increaseb. Natural gas A combination of a relatively warm European winter in 2022-23 and muted European gas demand caused European and Asian natural gas prices to fall early in 2023. Even so, European gas prices in 2023 were still double their 2015-2019 average levelc following the loss of the majority of Russian pipeline gas supply to the EU in 2022. Asian liquefied natural gas (LNG) prices followed European gas prices lower in 2023, and moved back to trading predominantly at a premium to European prices in a reversal of the trend seen in 2022. The increased demand for LNG cargoes following the loss of Russian gas pipeline supply to the EU, combined with below-average growth in new LNG supply capacity in 2023, meant the global LNG market remained sensitive to supply risks, for example reacting strongly to potential outages in Australia. In the US, Henry Hub (HH) gas prices averaged 61%d lower than in 2022 as the growth in dry natural gas production outpaced demand. Lower HH prices incentivized coal-to-gas switching in the power sector, and heightened demand for cooling during summer heatwaves helped to avoid storage congestion. US gas storage stocks were 13%e above historical average levels at the end of 2023. In response to the lower prices, the number of US gas rigs operating declined by a third from its peak in 2022f. Refining marker margin We use a global refining marker margin (RMM) to track the refining margin environment. Global RMM fell from the record highs reached in 2022, when Russia’s invasion of Ukraine caused significant disruption to refining operations and established trade flows. RMM values averaged $25.8/bbl, $7.3/bbl lower than in 2022g, mainly due to elevated refinery output, including as a result of new capacity additions. Power and renewables Total solar and wind capacity additions in 2023 were expected to have reached around 380GW (on alternating current basis), a record increase historically, and more than 100GW higher than in 2022h, with the increase driven mainly by China and solar photovoltaic (PV) deployment. The ongoing effects of the Russia-Ukraine war have increased countries’ focus on their energy security, supporting greater deployment of renewable energy capacity. Higher commodity prices, rises in interest rates and continued supply chain bottlenecks led to some increases in costs for solar and wind power in several countries. The offshore wind sector was particularly affected, and some projects were cancelled as their economic viability was eroded. However, we saw governments in many key offshore wind markets remain committed to achieving their offshore wind targets and developing their domestic offshore supply chains, providing continued support to the sector. bp operates across volatile energy markets. Here we discuss broader economic trends we have observed that influence our sector as a whole. a IMF World Economic Outlook, October 2023 update. b IEA Oil Market Report, January 2024. c Platts Dutch TTF Day Ahead price. d Platts Henry Hub cash price. e Weekly Natural Gas Storage Report, EIA. f Baker Hughes Rig Count. g The RMM may not be representative of the margin achieved by bp in any period because of bp’s particular refinery configurations and crude and product slates. In addition, the RMM does not include estimates of energy or other variable costs. h IEA Renewables 2023 report; PV capacity additions converted from DC to AC basis by dividing by 1.25.
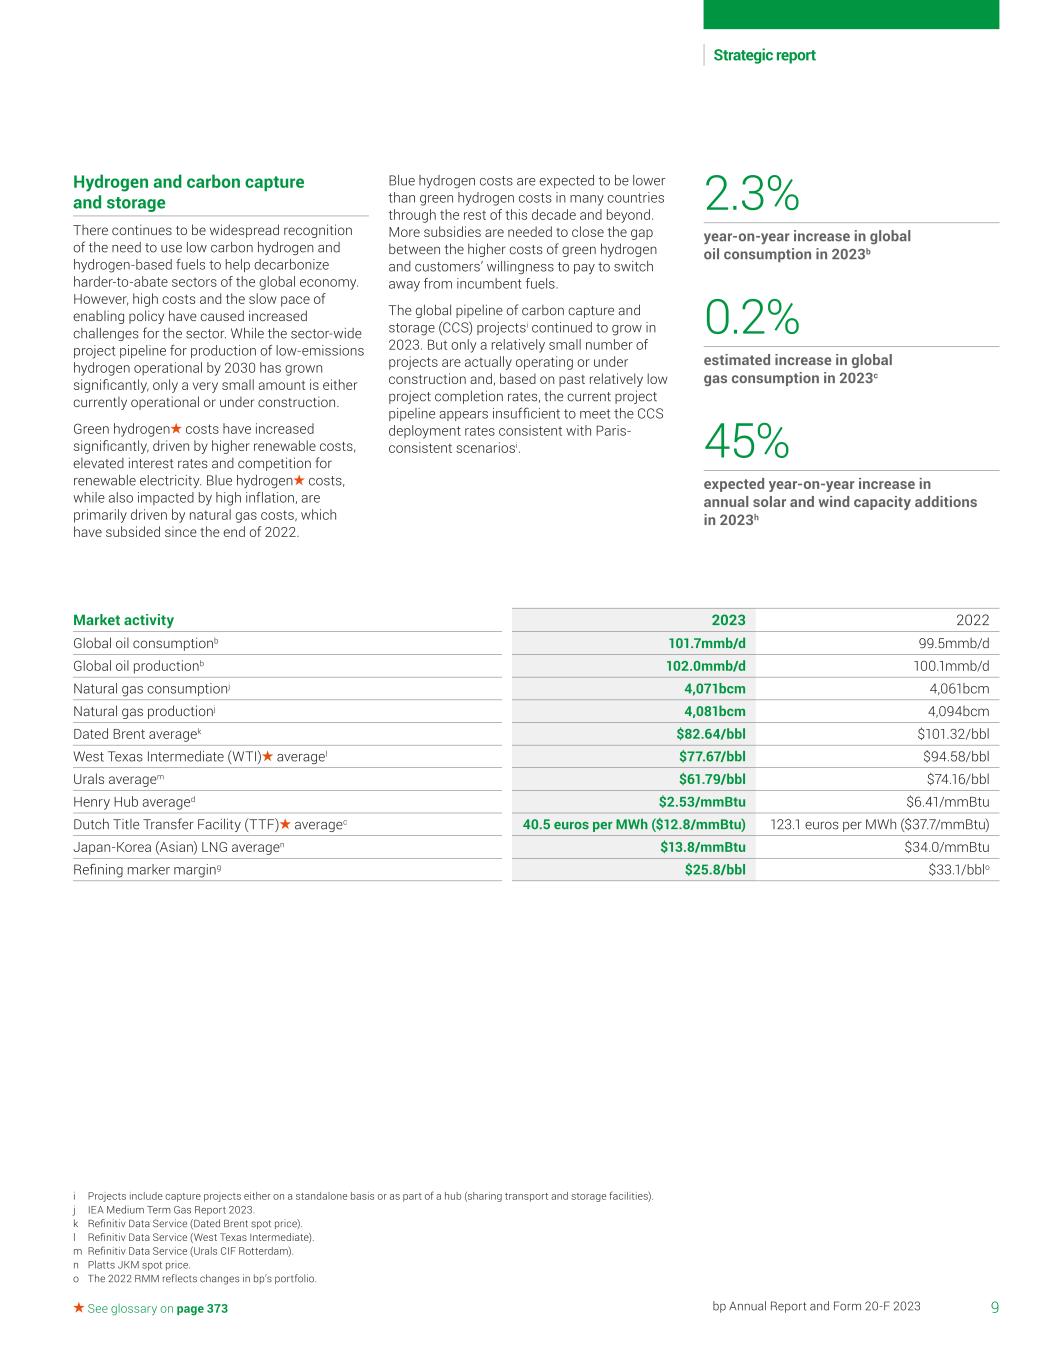
9bp Annual Report and Form 20-F 2023 Strategic report See glossary on page 373 Hydrogen and carbon capture and storage There continues to be widespread recognition of the need to use low carbon hydrogen and hydrogen-based fuels to help decarbonize harder-to-abate sectors of the global economy. However, high costs and the slow pace of enabling policy have caused increased challenges for the sector. While the sector-wide project pipeline for production of low-emissions hydrogen operational by 2030 has grown significantly, only a very small amount is either currently operational or under construction. Green hydrogen costs have increased significantly, driven by higher renewable costs, elevated interest rates and competition for renewable electricity. Blue hydrogen costs, while also impacted by high inflation, are primarily driven by natural gas costs, which have subsided since the end of 2022. Blue hydrogen costs are expected to be lower than green hydrogen costs in many countries through the rest of this decade and beyond. More subsidies are needed to close the gap between the higher costs of green hydrogen and customers’ willingness to pay to switch away from incumbent fuels. The global pipeline of carbon capture and storage (CCS) projectsi continued to grow in 2023. But only a relatively small number of projects are actually operating or under construction and, based on past relatively low project completion rates, the current project pipeline appears insufficient to meet the CCS deployment rates consistent with Paris- consistent scenariosi. 2.3% year-on-year increase in global oil consumption in 2023b 0.2% estimated increase in global gas consumption in 2023c 45% expected year-on-year increase in annual solar and wind capacity additions in 2023h Market activity 2023 2022 Global oil consumptionb 101.7mmb/d 99.5mmb/d Global oil productionb 102.0mmb/d 100.1mmb/d Natural gas consumptionj 4,071bcm 4,061bcm Natural gas productionj 4,081bcm 4,094bcm Dated Brent averagek $82.64/bbl $101.32/bbl West Texas Intermediate (WTI) averagel $77.67/bbl $94.58/bbl Urals averagem $61.79/bbl $74.16/bbl Henry Hub averaged $2.53/mmBtu $6.41/mmBtu Dutch Title Transfer Facility (TTF) averagec 40.5 euros per MWh ($12.8/mmBtu) 123.1 euros per MWh ($37.7/mmBtu) Japan-Korea (Asian) LNG averagen $13.8/mmBtu $34.0/mmBtu Refining marker marging $25.8/bbl $33.1/bblo i Projects include capture projects either on a standalone basis or as part of a hub (sharing transport and storage facilities). j IEA Medium Term Gas Report 2023. k Refinitiv Data Service (Dated Brent spot price). l Refinitiv Data Service (West Texas Intermediate). m Refinitiv Data Service (Urals CIF Rotterdam). n Platts JKM spot price. o The 2022 RMM reflects changes in bp’s portfolio.
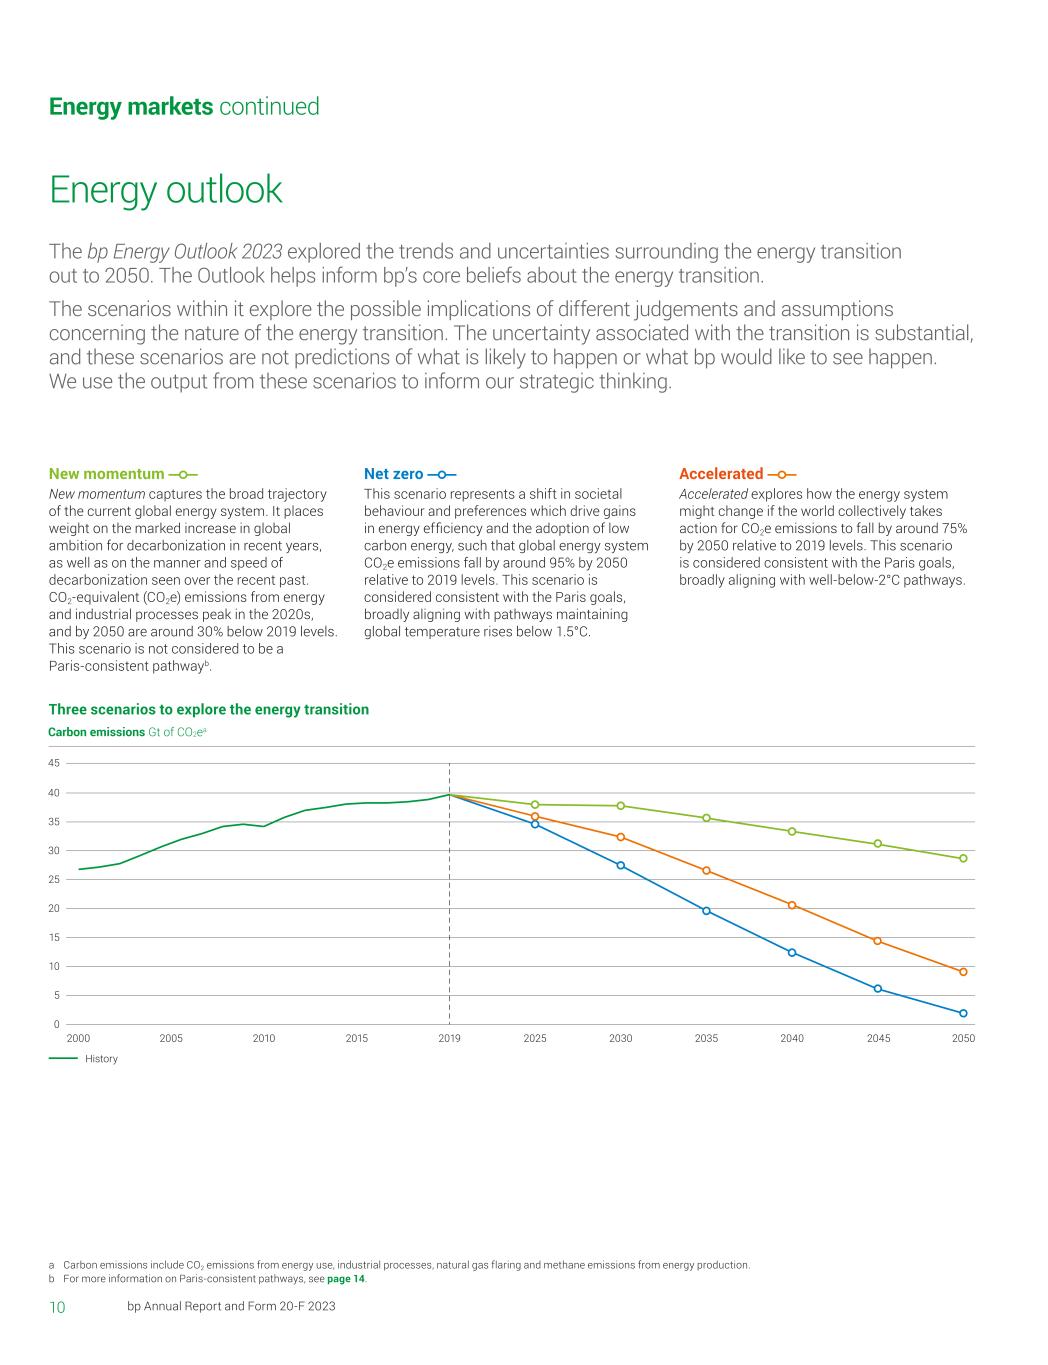
Carbon emissions Gt of CO2ea 10 bp Annual Report and Form 20-F 2023 Energy outlook Energy markets continued The bp Energy Outlook 2023 explored the trends and uncertainties surrounding the energy transition out to 2050. The Outlook helps inform bp’s core beliefs about the energy transition. The scenarios within it explore the possible implications of different judgements and assumptions concerning the nature of the energy transition. The uncertainty associated with the transition is substantial, and these scenarios are not predictions of what is likely to happen or what bp would like to see happen. We use the output from these scenarios to inform our strategic thinking. a Carbon emissions include CO2 emissions from energy use, industrial processes, natural gas flaring and methane emissions from energy production. b For more information on Paris-consistent pathways, see page 14. New momentum New momentum captures the broad trajectory of the current global energy system. It places weight on the marked increase in global ambition for decarbonization in recent years, as well as on the manner and speed of decarbonization seen over the recent past. CO2-equivalent (CO2e) emissions from energy and industrial processes peak in the 2020s, and by 2050 are around 30% below 2019 levels. This scenario is not considered to be a Paris-consistent pathwayb. Net zero This scenario represents a shift in societal behaviour and preferences which drive gains in energy efficiency and the adoption of low carbon energy, such that global energy system CO2e emissions fall by around 95% by 2050 relative to 2019 levels. This scenario is considered consistent with the Paris goals, broadly aligning with pathways maintaining global temperature rises below 1.5°C. Accelerated Accelerated explores how the energy system might change if the world collectively takes action for CO2e emissions to fall by around 75% by 2050 relative to 2019 levels. This scenario is considered consistent with the Paris goals, broadly aligning with well-below-2°C pathways. Three scenarios to explore the energy transition
11bp Annual Report and Form 20-F 2023 Strategic report See glossary on page 373 bp Energy Outlook 2023 updates In January 2023 we published the bp Energy Outlook 2023 (2023 Outlook). This was updated from the 2022 Outlook to consider two major developments: the Russia-Ukraine war and the passing of the US Inflation Reduction Act (IRA). The Russia-Ukraine war was judged likely to have a persistent effect on the future path of the global energy system, causing a change in the composition of global energy supplies, reducing economic growth, and increasing countries’ focus on energy security. Also modelled was the IRA, which included a package of largely supply-side measures supporting low carbon energy sources and decarbonization technologies in the US. In July 2023 we released an additional chapter of the bp Energy Outlook, ‘How energy is used’, which considers the outlook for the end uses of energy over the next 30 years. This chapter discusses energy use in the transport, industry and buildings sectors of the global economy. It showed that, in all three scenarios outlined on page 10, electricity increasingly replaces oil as the main energy carrier for light road vehicles in the transport sector. Heavier vehicles also electrify, although hydrogen and biomethane also play a role in some applications. Industry also gradually electrifies, but at a slower rate than transport due to the difficulties of electrifying high-temperature heat, with heavy industry also making use of low carbon hydrogen and bioenergy. In the buildings sector, growth in overall energy demand slows as space heating and cooking appliances become more efficient and energy conservation increases. The share of electricity in the energy used by buildings rises as fossil fuel boilers are replaced by heat pumps and emerging economies phase out traditional biomass. We plan to continue to update the bp Energy Outlook in response to new developments in the energy transition. bp.com/energyoutlook Scenarios for strategic decision making We use scenarios to inform strategy, manage risk, and improve decision making. Some scenarios start from today and project forward over a timeframe in which the current structure of the energy system helps to inform the pace and nature of the transition path. Others start in the future, breaking free from the inherent inertia in the energy system, and look back to the present from that new perspective. In thinking about appropriate scenarios to inform our strategy, we used both approaches. How scenarios inform our strategy The use of scenarios described in the 2023 Outlook, and those from other organizations, aids our understanding of the energy transition and helps us to think about how different outcomes might impact our strategy. The use of a broad range of scenarios to inform our strategy supports our efforts to make it robust and resilient to the range of uncertainty we face. By considering various time horizons, we can identify key milestones or signposts which might emerge over the next five, 10 or 30 years and inform our view of the key sources of uncertainty affecting the global energy system. We actively monitor for changes in the external environment and refresh or review the scenarios as needed in response to these signals, as we did with the Russia-Ukraine war and the impact of the IRA in the 2023 Outlook. For the purposes of testing the resilience of our strategy to the range of uncertainty in the energy transition, we have used scenarios drawn from other credible sources such as the World Business Council for Sustainable Development (WBCSD) ‘Climate Scenario Analysis Reference Approach for Companies in the Energy System’, the Intergovernmental Panel on Climate Change (IPCC) and the International Energy Agency (IEA). Read more on our resilience analysis and the outcome of that work on page 64 How we create scenarios We quantify a range of scenarios in the 2023 Outlook using our global energy modelling system. This comprises a suite of models to help us understand the supply and demand dynamics of the global energy system. The modelling framework uses historical data based on the Energy Institute’s Statistical Review of World Energyc, the IEA’s data and a range of other data sets. Each scenario is determined by a set of key assumptions, including population and economic growth, pace of technological change, resource constraints and government policies. These are informed by expert views from external organizations including the United Nations, Oxford Economics and Rystad Energy. We benchmark our scenarios against external organizations including the IEA, the IPCC, IHS Markit and the Network for Greening the Financial System (NGFS). The modelling techniques used vary by sector and include a combination of econometric modelling, least-cost optimization, adoption curves and consumer choice modelling. c Production of the Statistical Review of World Energy passed from bp to the Energy Institute in 2023. It is available online energyinst.org/statistical-review
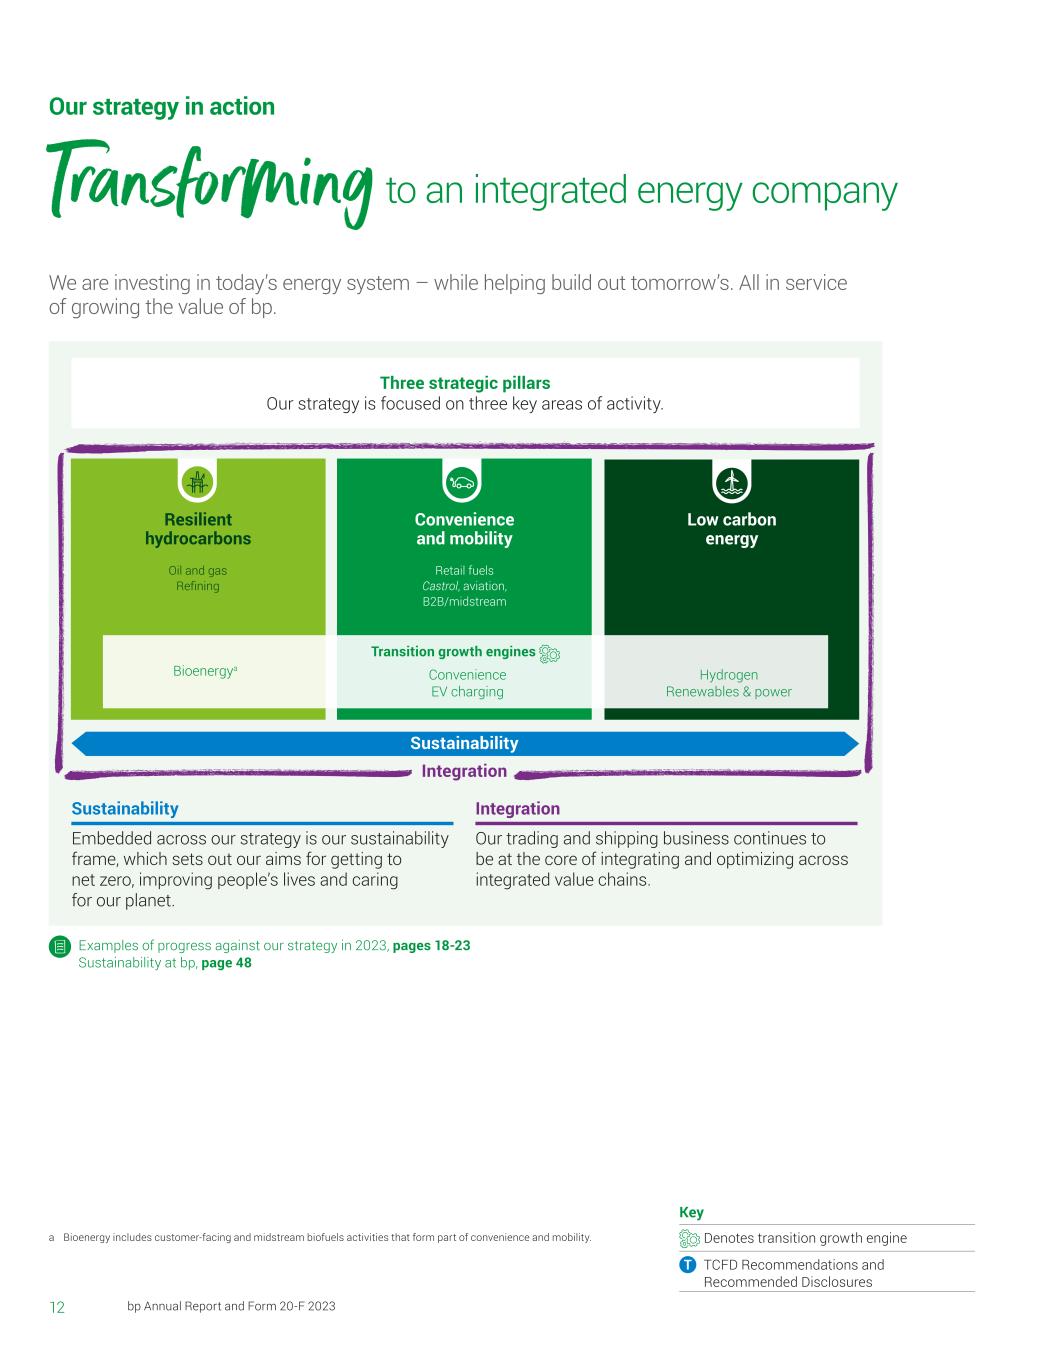
12 bp Annual Report and Form 20-F 2023 Transforming to an integrated energy company Our strategy in action We are investing in today’s energy system – while helping build out tomorrow’s. All in service of growing the value of bp. a Bioenergy includes customer-facing and midstream biofuels activities that form part of convenience and mobility. Sustainability Embedded across our strategy is our sustainability frame, which sets out our aims for getting to net zero, improving people’s lives and caring for our planet. Integration Our trading and shipping business continues to be at the core of integrating and optimizing across integrated value chains. Key Denotes transition growth engine TCFD Recommendations and Recommended Disclosures Examples of progress against our strategy in 2023, pages 18-23 Sustainability at bp, page 48 Convenience EV charging Sustainability Integration Transition growth engines Bioenergya Hydrogen Renewables & power Three strategic pillars Our strategy is focused on three key areas of activity. Oil and gas Refining Retail fuels Castrol, aviation, B2B/midstream Convenience and mobility Low carbon energy Resilient hydrocarbons
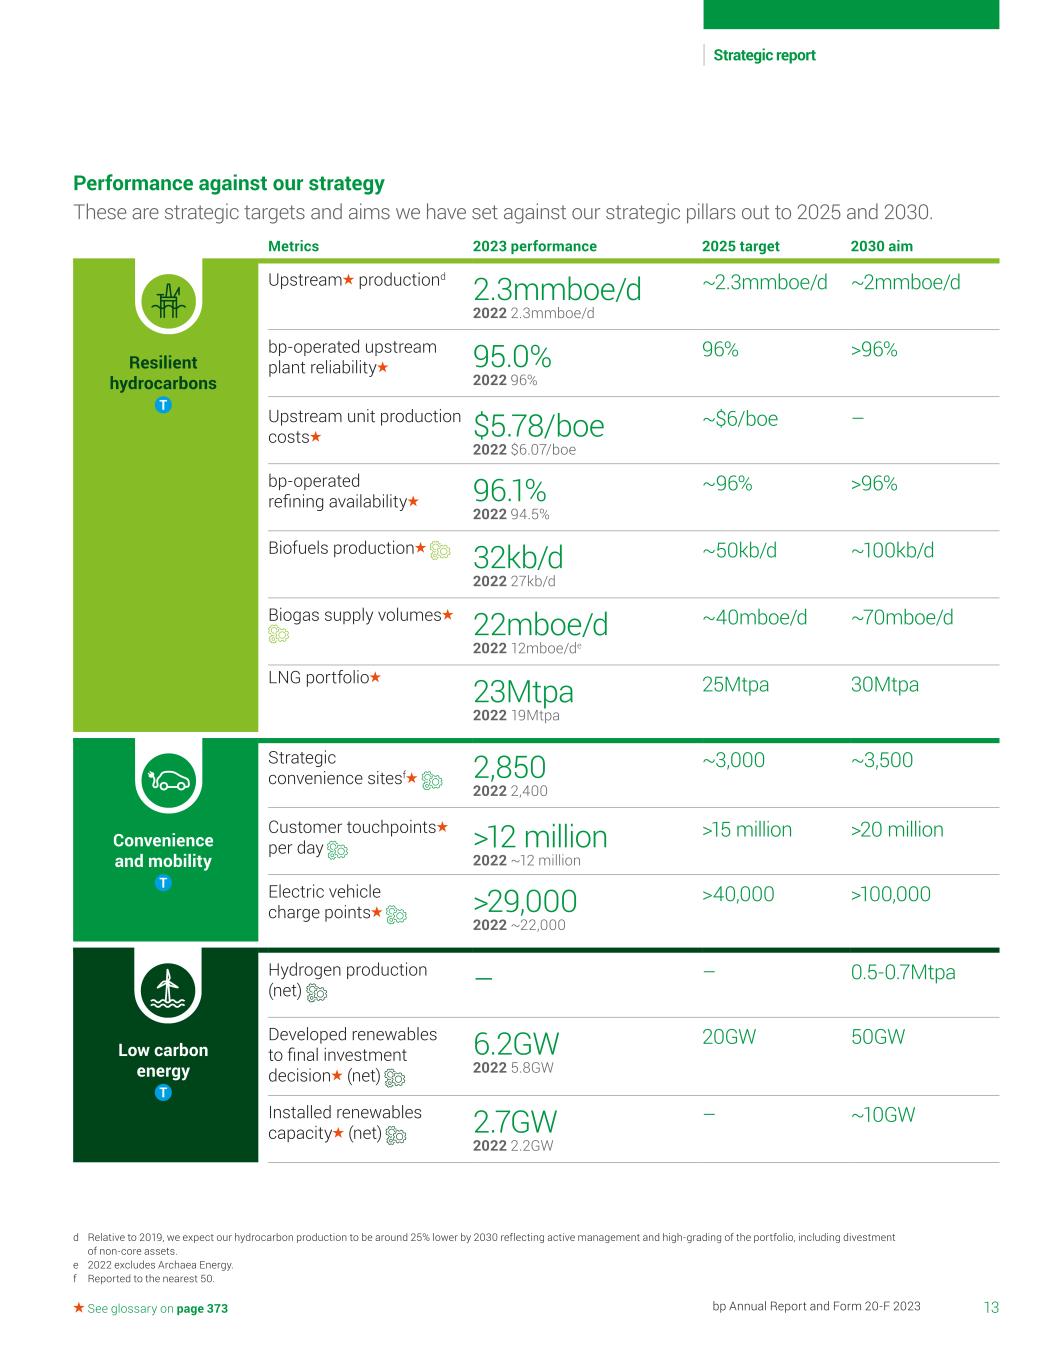
13bp Annual Report and Form 20-F 2023 Strategic report See glossary on page 373 d Relative to 2019, we expect our hydrocarbon production to be around 25% lower by 2030 reflecting active management and high-grading of the portfolio, including divestment of non-core assets. e 2022 excludes Archaea Energy. f Reported to the nearest 50. Performance against our strategy These are strategic targets and aims we have set against our strategic pillars out to 2025 and 2030. Metrics 2023 performance 2025 target 2030 aim Resilient hydrocarbons Upstream productiond 2.3mmboe/d 2022 2.3mmboe/d ~2.3mmboe/d ~2mmboe/d bp-operated upstream plant reliability 95.0% 2022 96% 96% >96% Upstream unit production costs $5.78/boe 2022 $6.07/boe ~$6/boe – bp-operated refining availability 96.1% 2022 94.5% ~96% >96% Biofuels production 32kb/d 2022 27kb/d ~50kb/d ~100kb/d Biogas supply volumes 22mboe/d 2022 12mboe/de ~40mboe/d ~70mboe/d LNG portfolio 23Mtpa 2022 19Mtpa 25Mtpa 30Mtpa Convenience and mobility Strategic convenience sitesf 2,850 2022 2,400 ~3,000 ~3,500 Customer touchpoints per day >12 million 2022 ~12 million >15 million >20 million Electric vehicle charge points >29,000 2022 ~22,000 >40,000 >100,000 Low carbon energy Hydrogen production (net) – – 0.5-0.7Mtpa Developed renewables to final investment decision (net) 6.2GW 2022 5.8GW 20GW 50GW Installed renewables capacity (net) 2.7GW 2022 2.2GW – ~10GW
14 bp Annual Report and Form 20-F 2023 Pursuing a strategy that is consistent with the Paris goals Consistency with the Paris goals What we mean by Paris-consistent The 2019 CA100+ resolution requires us to disclose the strategy that the board considers in good faith to be consistent with the Paris goals. When we refer to ‘consistency with Paris’ we consider this to mean consistency with the world meeting the temperature goal set out in Articles 2.1(a) and 4.1 of the Paris Agreement on Climate Change . The Paris goals, which we support, were reaffirmed under the UAE Consensus at COP28 in December 2023, by the Sharm el-Sheikh Implementation Plan agreed by the Parties at COP27 in November 2022, and the Glasgow Climate Pact agreed by the Parties at COP26 in November 2021. We believe the world is on an unsustainable path, and the carbon budget to meet the Paris goals is running out. bp’s strategy is informed by these considerations. It is designed to create long-term value for shareholders, while enabling delivery of our net zero ambition – to become a net zero company by 2050 or sooner, and to help the world get to net zero. It is designed to be resilient to the uncertainty of the energy transition across many different potential pathways, including various Paris-consistent pathways. In the bp Annual Report and Form 20-F 2021 we set out, based on three key principles, why the board considers our strategy to be consistent with the Paris goals. Here we set out, on the same three grounds, why the board continues to consider this to be the case. Informed by Paris-consistent energy transition scenarios The speed and nature of the energy transition is uncertain, and so we consider a range of scenarios from multiple sources including the bp Energy Outlook to inform our beliefs about the energy transition and to develop and test our strategic thinking. This helps to reinforce our confidence in the robustness and resilience of our strategy to the range of uncertainty we face. We are confident that our approach is science- based. We see the Intergovernmental Panel on Climate Change (IPCC) as the most authoritative source of information on the science of climate change, and we use it and other sources to inform our strategy. The IPCC highlights that there are a range of global pathways by which the world can meet the Paris goals, with differing implications for regions, industry sectors and sources of energy. The bp Energy Outlook 2023 updated the 2022 Outlook to reflect the significant developments in global energy markets over the preceding year, including the possible impact of the Russia-Ukraine war on the pace of the energy transition. It includes three main scenarios – two of which we regard as Paris-consistent (Accelerated and Net Zero) – that we use to inform our strategy. Energy outlook page 10 and bp.com/energyoutlook Strategic resilience We believe our strategy positions bp for success and resilience in a Paris-consistent world – a world that is progressing on one of the many global trajectories considered to be Paris-consistent, and ultimately meets the Paris goals. The strategy diversifies bp’s portfolio and business interests, reducing the risk that challenges facing a single business area might adversely affect bp’s strategic resilience. In addition, within the inevitable constraints associated with factors such as long-term capital investments, contractual commitments and organizational capabilities at any given time, bp’s ability to maintain its strategic resilience rests, in part, on the governance used to keep the strategy and associated targets and aims under review in light of new information and changes in circumstances. In our climate-related financial disclosures on page 63, we describe how we have conducted an analysis to test our view of the resilience of our strategy to different climate-related scenarios, using the update on strategic progress presented in February 2023. This includes scenarios that are classified by the World Business Council for Sustainable Development (WBCSD) to be consistent with well-below 2°C and 1.5°C outcomesa. As further explained on page 64, while the results of any such analysis must be treated with caution overall, this resilience test again reinforced our confidence in the continued resilience of our strategy to a wide range of ways in which the energy system could evolve throughout this decade, including in scenarios consistent with limiting temperature rise to 1.5°C. The analysis also again highlighted that, while WBCSD data may point towards a broad directional correlation between oil price and the temperature goal with which scenarios are associated, there is considerable uncertainty as to the extent of this correlation. This is demonstrated by the range within, and overlap between, the prices indicated for each scenario family. In the version of the WBCSD catalogue used for the analysis, the lowest oil price is associated with a 1.5°C scenario; however a number of the 1.5°C and well-below 2°C scenarios have oil prices in 2030 that are substantially higher. And when compared to bp’s own central oil price case planning assumption for 2030, the oil price in a number of the well-below 2°C scenarios is also higher, supporting our view that our oil price planning assumption is broadly consistent with Paris-consistent scenarios. a Our 2023 analysis used data from the WBCSD Climate Scenario Catalogue version 2.0, published on 31 March 2023 and downloaded on 1 February 2024, which includes scenarios considered to be consistent with well-below 2°C and 1.5°C outcomes.
15bp Annual Report and Form 20-F 2023 Strategic report See glossary on page 373 Contributes to net zero We believe that our strategy enables bp to make a positive contribution to the world achieving net zero greenhouse gas (GHG) emissions and meeting the Paris goals – outcomes which we believe to be in the best interests of bp as well as beneficial to society generally. We see huge opportunity in the energy transition – the transformation of the energy system that we believe to be a necessary feature of the world’s efforts to meet the Paris goals. There are many ways a company at the heart of the energy sector can make a meaningful contribution to the world getting to net zero. In addition to investing in and scaling our own lower carbon businesses, these include: policy advocacy and seeking to use the company’s influence with trade associations that conduct climate-related advocacy; low carbon collaboration and support for others in their own decarbonization efforts (such as cities and corporates); and making venturing investments in promising new businesses and technologies that have the potential to contribute to the energy transition. bp seeks to advance these areas through our aims in support of our net zero ambition, including aims 6-10 which are focused on activities which can help the world get to net zero, see page 50. And, as we pursue our strategy, our diversification and the growth of our low carbon businesses may also contribute to helping the world get to net zero. Some ways of contributing are more readily measured by quantitative metrics than others – but all can be important, whether or not they translate into GHG reductions for bp. For example, in Teesside in the UK, we continue to work to advance components of the East Coast Cluster – a vision for decarbonizing local heavy industries at scale, with CO2 from their emissions taken offshore for permanent storage through Northern Endurance Partnership’s carbon capture and storage facilities. In 2023 two bp-led lower carbon projects, Net Zero Teesside Power and H2Teesside, part of the East Coast Cluster, were chosen to proceed to negotiations for government support. bp and Equinor were awarded a carbon storage licence by the North Sea Transition Authority, which will enable the development of further CO2 storage sites. Together with Equinor we now hold four storage licences on behalf of the Northern Endurance Partnership. There is potential to store up to 23 million tonnes of CO2 a year in the southern North Sea by 2035. As a further illustration, in terms of low carbon investment , by 2030 we aim to increase to 50GW the amount of developed renewables to FID , supported by the capital expenditure we plan to invest in our transition growth engines. This aim supports the Paris goals by increasing the low carbon options available to energy consumers. However, it does not reduce our Scope 1, 2 or 3 emissions. And it may not result in a decrease in the overall carbon intensity of bp’s sold products, because that is dependent on the extent to which we – rather than another party such as a buyer of the developed project – market the resulting renewable power, which is a commercial consideration. Where we do not directly sell that power, our development of the renewables is effectively ‘invisible’ in terms of our GHG metrics. As another example, our aim 6 is to more actively advocate for policies that support net zero, including carbon pricing. Helping policymakers to design and put in place low carbon policies that support the transition to net zero can help deliver our strategy and capitalize on the huge opportunities associated with achieving the Paris goals, but the benefit of such advocacy, if successful, extends well beyond any implications for bp’s own GHG metrics. That is because well-designed low carbon policies can also advance the decarbonization of a whole economy – something potentially of far greater impact than anything a single company can achieve through its own portfolio. We publish examples of our activity in support of aim 6 online at bp.com/advocacyactivities. Responding to increased shareholder interest in Paris consistency In 2019 the board recommended that shareholders support a special resolution requisitioned by Climate Action 100+ (CA100+) on climate change disclosures. The CA100+ resolution passed with more than 99% of votes cast. This is the fifth year we have included responses throughout the annual report and we have adopted a similar approach to previous years. The CA100+ resolution, which includes safeguards such as protections for commercially confidential and competitively sensitive information, is on page 373. Key terms related to this resolution response are indicated with and defined in the glossary on page 373. These should be reviewed with the following information. Element of the CA100+ resolution Related content Where Strategy that the board considers in good faith to be consistent with the Paris goals. Our strategy and business model 12 & 16 Pursuing a strategy that is consistent with the Paris goals 14 How bp evaluates each new material capex investment for consistency with the Paris goals and other outcomes relevant to bp strategy. Our investment process 30 Disclosure of bp’s principal metrics and relevant targets or goals over the short, medium and long term, consistent with the Paris goals. Key performance indicators 24 Sustainability: net zero targets and aims See ’TCFD Metrics & Targets’ for an overview 49 68 Anticipated levels of investment in: (i) Oil and gas resources and reserves. (ii) Other energy sources and technologies. Financial frame: disciplined investment allocation 28 Investment in non-oil and gas 31 bp’s targets to promote operational GHG reductions. Sustainability: net zero targets and aims (in table) 49 Estimated carbon intensity of bp’s energy products and progress over time. Sustainability: aim 3 49 Any linkage between above targets and executive pay remuneration. Directors’ remuneration report 2023 annual bonus outcome 2024 remuneration policy 105 114 119
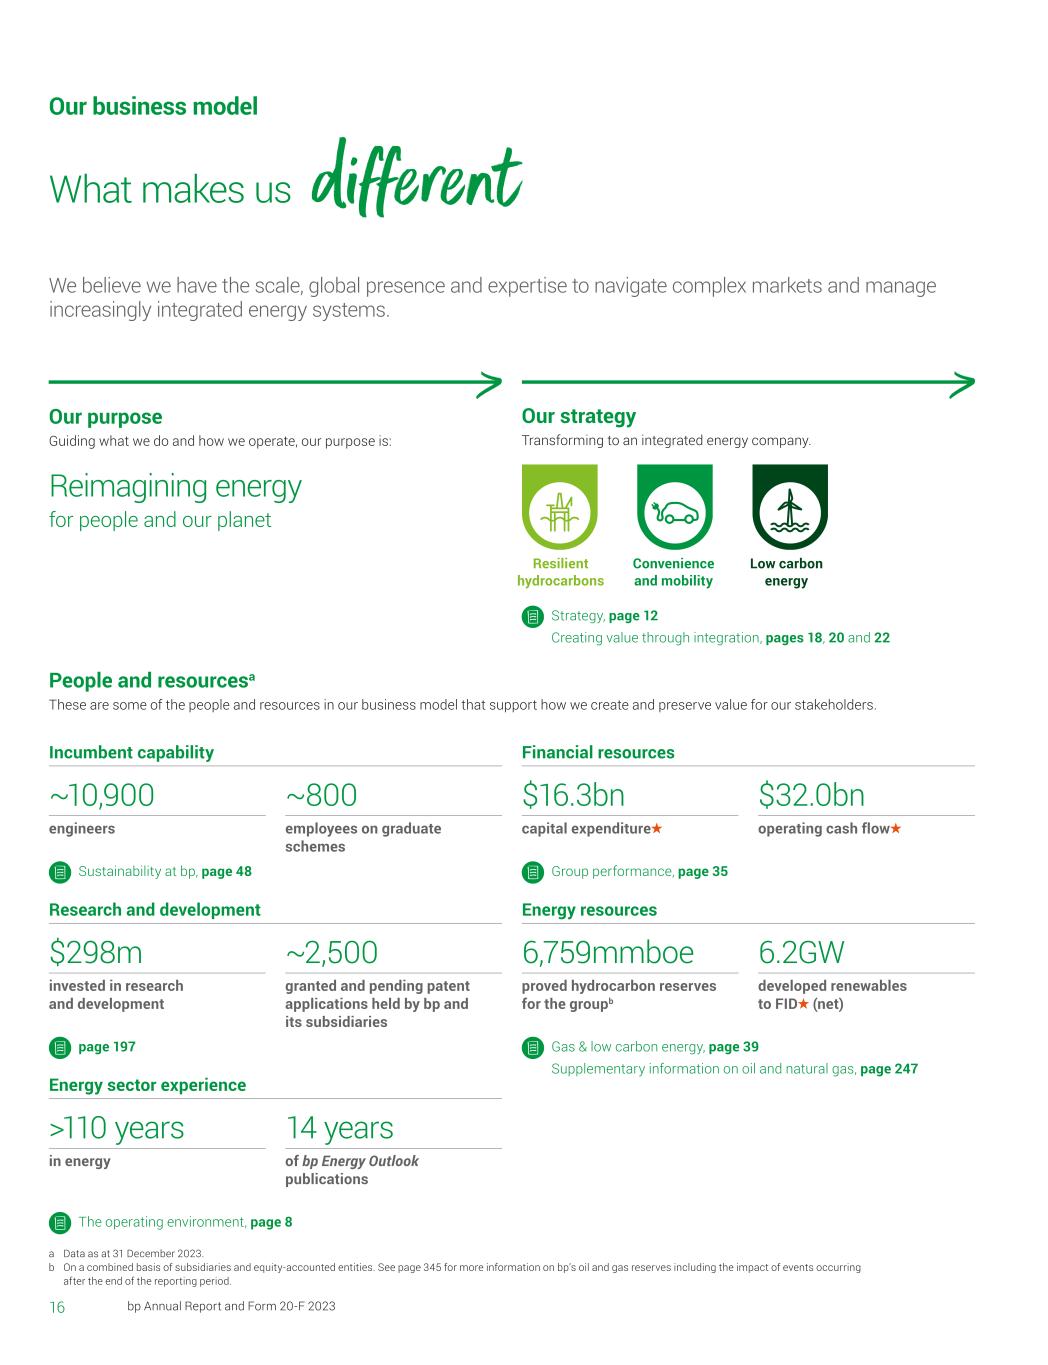
16 bp Annual Report and Form 20-F 2023 What makes us different Our business model We believe we have the scale, global presence and expertise to navigate complex markets and manage increasingly integrated energy systems. Our purpose Guiding what we do and how we operate, our purpose is: Reimagining energy for people and our planet Our strategy Transforming to an integrated energy company. Resilient hydrocarbons Convenience and mobility Low carbon energy People and resourcesa These are some of the people and resources in our business model that support how we create and preserve value for our stakeholders. ~10,900 engineers Sustainability at bp, page 48 $16.3bn capital expenditure Group performance, page 35 $298m invested in research and development page 197 6,759mmboe proved hydrocarbon reserves for the groupb Gas & low carbon energy, page 39 Supplementary information on oil and natural gas, page 247 >110 years in energy The operating environment, page 8 ~800 employees on graduate schemes $32.0bn operating cash flow ~2,500 granted and pending patent applications held by bp and its subsidiaries 6.2GW developed renewables to FID (net) 14 years of bp Energy Outlook publications Incumbent capability Financial resources Research and development Energy resources Energy sector experience Strategy, page 12 Creating value through integration, pages 18, 20 and 22 a Data as at 31 December 2023. b On a combined basis of subsidiaries and equity-accounted entities. See page 345 for more information on bp’s oil and gas reserves including the impact of events occurring after the end of the reporting period.
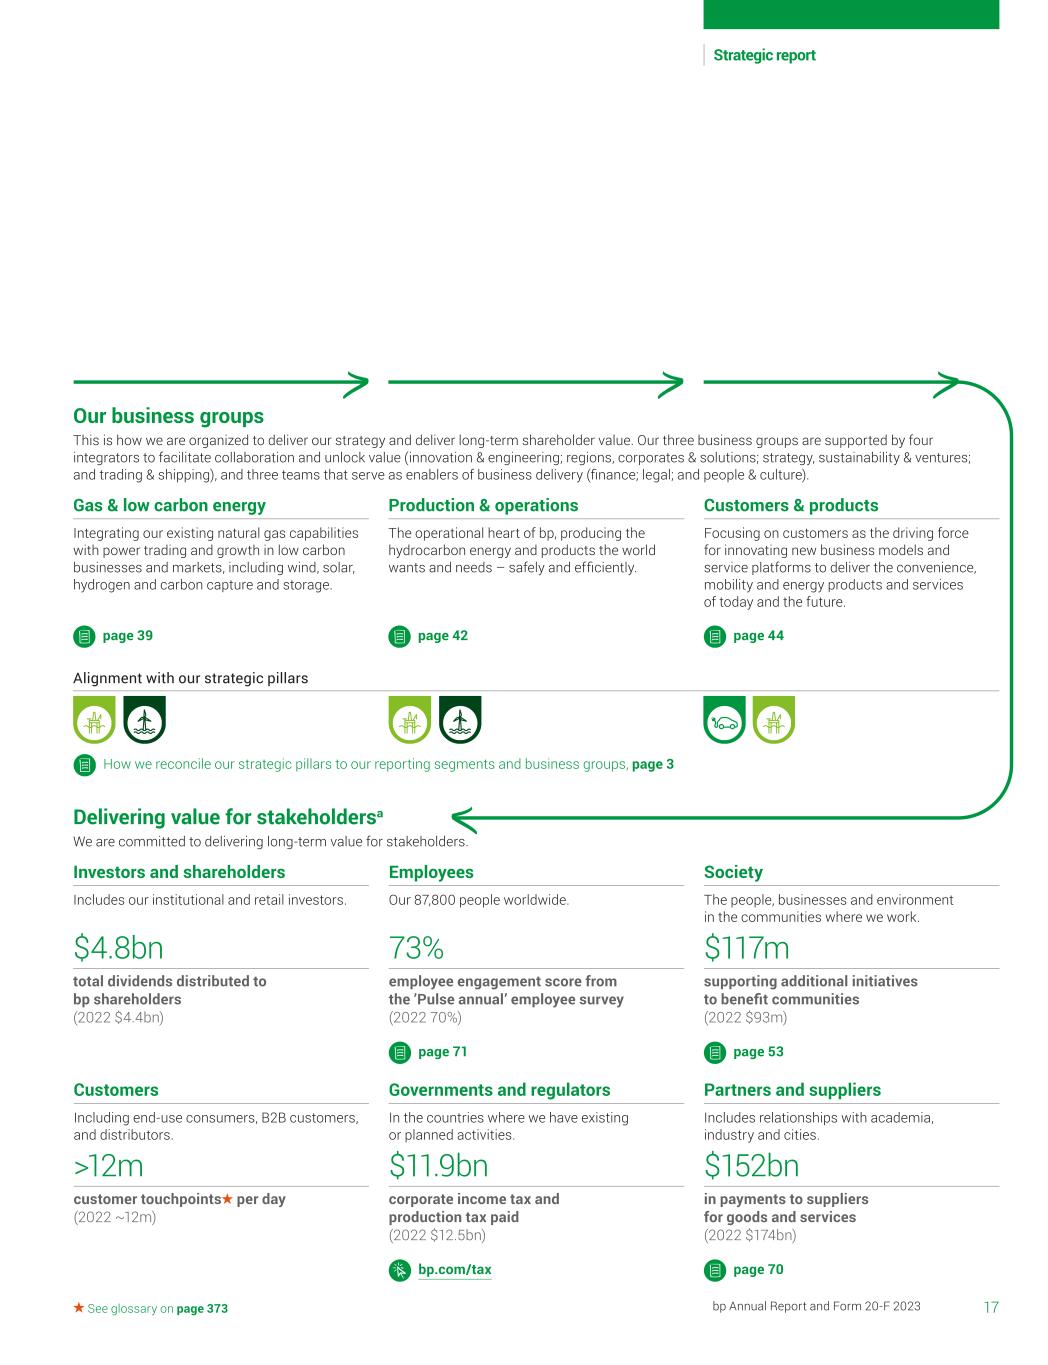
17bp Annual Report and Form 20-F 2023 Strategic report See glossary on page 373 Our business groups This is how we are organized to deliver our strategy and deliver long-term shareholder value. Our three business groups are supported by four integrators to facilitate collaboration and unlock value (innovation & engineering; regions, corporates & solutions; strategy, sustainability & ventures; and trading & shipping), and three teams that serve as enablers of business delivery (finance; legal; and people & culture). Delivering value for stakeholdersa We are committed to delivering long-term value for stakeholders. $4.8bn total dividends distributed to bp shareholders (2022 $4.4bn) >12m customer touchpoints per day (2022 ~12m) 73% employee engagement score from the ’Pulse annual’ employee survey (2022 70%) page 71 $11.9bn corporate income tax and production tax paid (2022 $12.5bn) bp.com/tax $117m supporting additional initiatives to benefit communities (2022 $93m) page 53 $152bn in payments to suppliers for goods and services (2022 $174bn) page 70 Gas & low carbon energy Integrating our existing natural gas capabilities with power trading and growth in low carbon businesses and markets, including wind, solar, hydrogen and carbon capture and storage. Production & operations The operational heart of bp, producing the hydrocarbon energy and products the world wants and needs – safely and efficiently. Customers & products Focusing on customers as the driving force for innovating new business models and service platforms to deliver the convenience, mobility and energy products and services of today and the future. Investors and shareholders Includes our institutional and retail investors. Customers Including end-use consumers, B2B customers, and distributors. Employees Our 87,800 people worldwide. Governments and regulators In the countries where we have existing or planned activities. Society The people, businesses and environment in the communities where we work. Partners and suppliers Includes relationships with academia, industry and cities. Alignment with our strategic pillars How we reconcile our strategic pillars to our reporting segments and business groups, page 3 page 39 page 42 page 44

18 bp Annual Report and Form 20-F 2023 Progress against our strategy Resilient hydrocarbons A resilient oil and gas business is an essential part of our transformation to an integrated energy company. Our focus remains on safely delivering value, maximizing returns and cash flow, and reducing emissions. Transition growth engines Bioenergy: Demand from our customers for bioenergy is growing. That’s why we are working to scale up our established bioenergy business. We are increasing our biogas supply, growing our biofuels production , helping our customers decarbonize and expanding our trading capabilities. Renewable gas at Archaea Energy We started up our first Archaea Modular Design (AMD) plant in Indiana, US in October 2023. AMD allows the plant to be built on skids with interchangeable components for faster builds. The plant converts landfill gas (a form of greenhouse gas) by capturing it from landfill and converting it to electricity, heat or renewable natural gas (RNG). This helps to improve local air quality and provide lower carbon fuel for homes, businesses and transportation. It is the first of 15-20 new plants we aim to bring online per year through 2025, with Archaea Energy production volumes contributing to our 2025 target of around 40mboe/d of biogas supply volumes (see page 13). 3,200scfm Medora RNG plant processing capacity Bingo goes online Our onshore oil and gas business, bpx energy, invested $1.4 billion in Texas’s Permian Basin in 2023. In August we completed our second central processing facility, Bingo. This follows Grand Slam, which came online in 2021. Methane certification We became the first energy major to verify the methane intensity of its entire US onshore operated natural gas portfolio, with bpx energy gaining certification from MiQ, an independent not-for-profit, in March 2023. The certification is independently audited and gives us a better understanding of methane intensity and source emissions, helping us develop plans to reduce emissions further. Our aim 4 progress, page 49 This is a powerful step forward in our net zero journey to capture landfill emissions and provide customers with lower carbon fuel. Starlee Sykes CEO Archaea Energy Bingo in the Permian Basin, Texas, US Archaea Energy RNG plant in Medora, Indiana, US
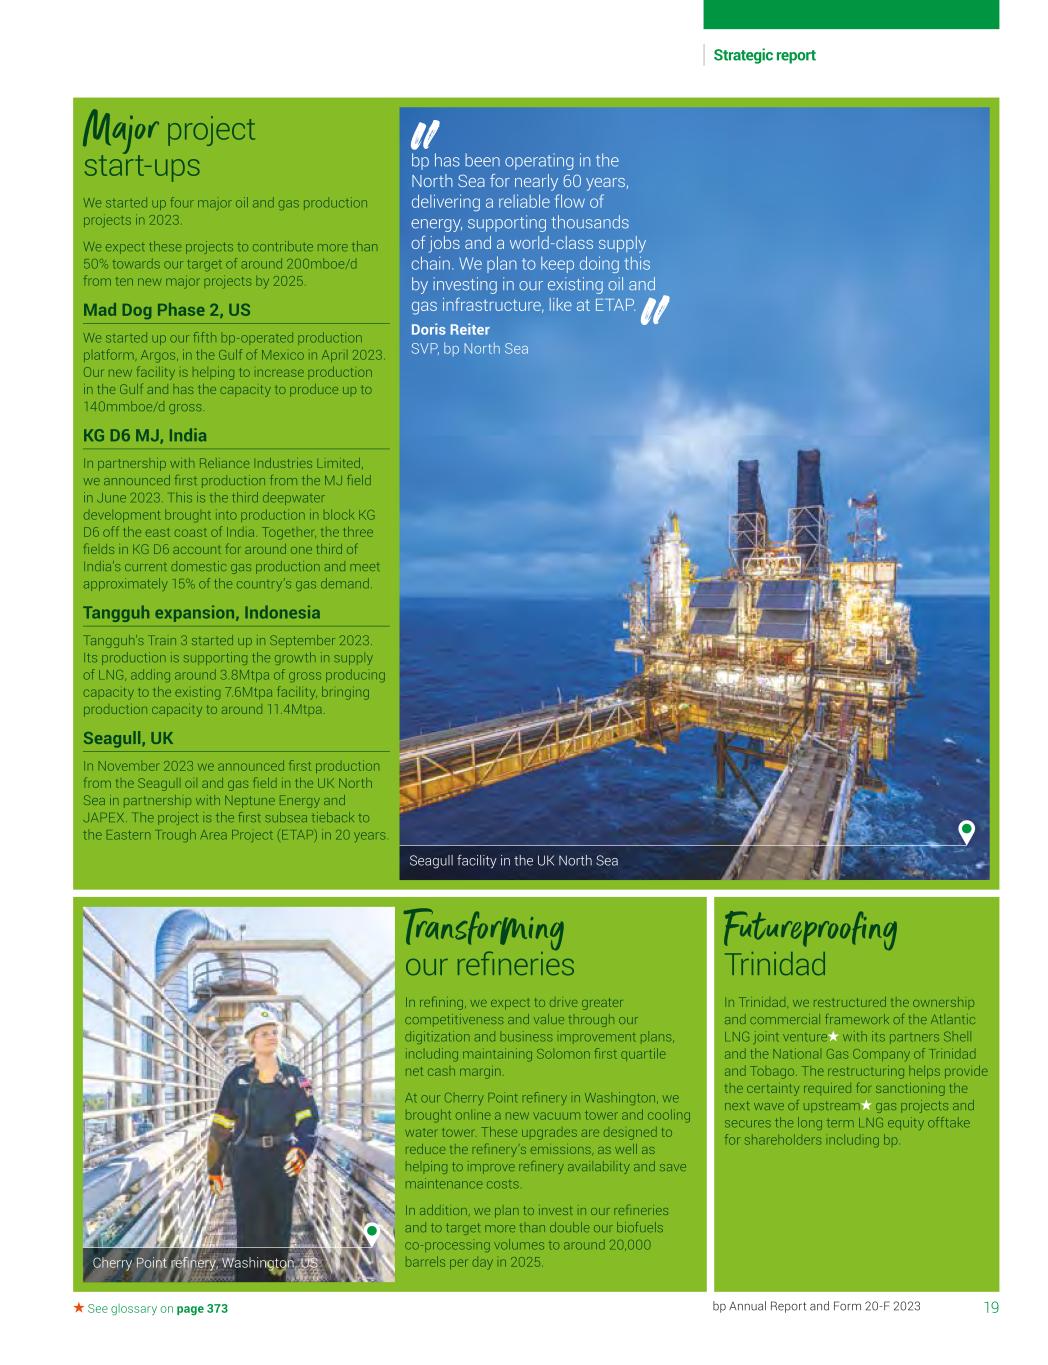
19bp Annual Report and Form 20-F 2023 Strategic report See glossary on page 373 Transforming our refineries In refining, we expect to drive greater competitiveness and value through our digitization and business improvement plans, including maintaining Solomon first quartile net cash margin. At our Cherry Point refinery in Washington, we brought online a new vacuum tower and cooling water tower. These upgrades are designed to reduce the refinery’s emissions, as well as helping to improve refinery availability and save maintenance costs. In addition, we plan to invest in our refineries and to target more than double our biofuels co-processing volumes to around 20,000 barrels per day in 2025. Futureproofing Trinidad In Trinidad, we restructured the ownership and commercial framework of the Atlantic LNG joint venture with its partners Shell and the National Gas Company of Trinidad and Tobago. The restructuring helps provide the certainty required for sanctioning the next wave of upstream gas projects and secures the long term LNG equity offtake for shareholders including bp. Major project start-ups We started up four major oil and gas production projects in 2023. We expect these projects to contribute more than 50% towards our target of around 200mboe/d from ten new major projects by 2025. Mad Dog Phase 2, US We started up our fifth bp-operated production platform, Argos, in the Gulf of Mexico in April 2023. Our new facility is helping to increase production in the Gulf and has the capacity to produce up to 140mmboe/d gross. KG D6 MJ, India In partnership with Reliance Industries Limited, we announced first production from the MJ field in June 2023. This is the third deepwater development brought into production in block KG D6 off the east coast of India. Together, the three fields in KG D6 account for around one third of India’s current domestic gas production and meet approximately 15% of the country’s gas demand. Tangguh expansion, Indonesia Tangguh’s Train 3 started up in September 2023. Its production is supporting the growth in supply of LNG, adding around 3.8Mtpa of gross producing capacity to the existing 7.6Mtpa facility, bringing production capacity to around 11.4Mtpa. Seagull, UK In November 2023 we announced first production from the Seagull oil and gas field in the UK North Sea in partnership with Neptune Energy and JAPEX. The project is the first subsea tieback to the Eastern Trough Area Project (ETAP) in 20 years. Cherry Point refinery, Washington, US Seagull facility in the UK North Sea bp has been operating in the North Sea for nearly 60 years, delivering a reliable flow of energy, supporting thousands of jobs and a world-class supply chain. We plan to keep doing this by investing in our existing oil and gas infrastructure, like at ETAP. Doris Reiter SVP, bp North Sea

20 bp Annual Report and Form 20-F 2023 Progress against our strategy continued Convenience and mobility By bringing our capabilities and reach in convenience together with EV charging, we aim to provide customer-focused, lower carbon transport solutions over time. We are also focused on growth in our differentiated fuels, Castrol, aviation, B2B and midstream including biofuels businesses. Transition growth engines Convenience: In this growing sector, our scale, premium locations, leading brands and strategic partnerships enable us to deliver differentiated offers for our customers. We have a proven track record of resilient gross margin growth against a challenging backdrop, which underpins confidence in delivery of our strategy. We will continue to expand our footprint, which the TravelCenters of America acquisition has accelerated. EV charging: This sector is moving at pace, and we see significant value through our focus on fast charging to on-the-go customers. We are focused on the largest EV car parcs across the US, UK, China and Germany, and our joint venture partnerships in India and Iberia. US retail boost We completed the purchase of TravelCenters of America in May 2023. The deal adds a network of around 290 retail sites on major highways across the US. It is expected to almost doublea our global convenience gross margin , supporting the growth of our convenience and mobility business. By integrating bp pulse, our fast- growing EV charging business, along with biofuels and renewable natural gas businesses – and in time, hydrogen – we aim to respond to our customers’ changing mobility needs. Emma Delaney EVP customers & products TravelCenters of America retail site in Ohio, US Growing convenience We strengthened our strategic convenience partnerships and customer offers in 2023. REWE To Go: bp and Lekkerland extended their successful partnership to continue to deliver REWE To Go stores at Aral retail sites until 2028. This is bp’s largest European convenience supply agreement and brings together Germany’s largest forecourt brand with one of the country’s leading convenience specialists in support of bp’s convenience transition growth engine delivery. Auchan, Poland: We signed an agreement with leading convenience retailer, Auchan, with plans to add more than 100 stores to our retail network. The partnership supports our aim to grow our strategic convenience sites and convenience gross margin globally. BPme: We strengthened our BPme Rewards loyalty scheme with the launch of loyalty pricing, giving customers exclusive discounts on retail store products at around 300 bp-owned retail sites across the UK. bp retail site in West Sussex, UK a On an annualized basis when compared with 2022.

21bp Annual Report and Form 20-F 2023 Strategic report See glossary on page 373 bp pulse EV charging at the Gigahub in Birmingham, UK Accelerating EV We expanded our EV charging network in 2023, and demonstrated profitability in our on-the-go business in Germany and our joint venture, bp Xiajou in China. In the US: We announced a $500 million investment in the US over the next two to three years. As part of this, bp pulse entered into an agreement with Tesla for the future purchase of $100 million of ultra-fast chargers that will be installed across our bp pulse network in the US. The first time Tesla’s ultra-fast chargers will be deployed on an independent EV charging network. In the UK: We opened the UK’s largest public EV charging hub in partnership with The EV Network and NEC Group in September. The Gigahub is located at the heart of the UK motorway network at the NEC campus in the West Midlands, with capacity to charge up to 180 EVs simultaneously. In Iberia: In December 2023 we formed a joint venture with Iberdrola to accelerate EV charging infrastructure roll-out in Spain and Portugal. The joint venture plans to invest up to €1 billion and install 5,000 fast EV charge points by 2025 and around 11,700 by 2030. SAF in action We are aiming to be a leading supplier of sustainable aviation fuel (SAF), as we look to help decarbonize the aviation sector. Air bp made its first SAF sale in March 2023. The International Sustainability and Carbon Certification (ISCC) EU SAF was produced through co-processing at our Castellón refinery in Spain. It was first used on a flight from Zaragoza, Spain to North America with LATAM Cargo Chile. This is a milestone in the development of using existing refineries to meet SAF demand produced from sustainable feedstocks. Supplied by bp and Virent, the first 100% SAF-fuelled commercial transatlantic flight flew from London Heathrow to JFK airport in New York in November 2023. Leading in EV-fluids In Castrol, our leading position in advanced EV-fluids was further strengthened in 2023. Three out of four of the world’s major vehicle manufacturers use Castrol ON products as part of their factory fillb. And we are investing in our technology centres including a new EV laboratory in Shanghai, China and a new laboratory in New Jersey, US. Virgin Atlantic flight before take-off at London Heathrow airport, UK b Based on GlobalData report for 2023 for top 20 selling global OEMs (total new vehicles sales). ~150% GWh increase in energy sales volume since 2022
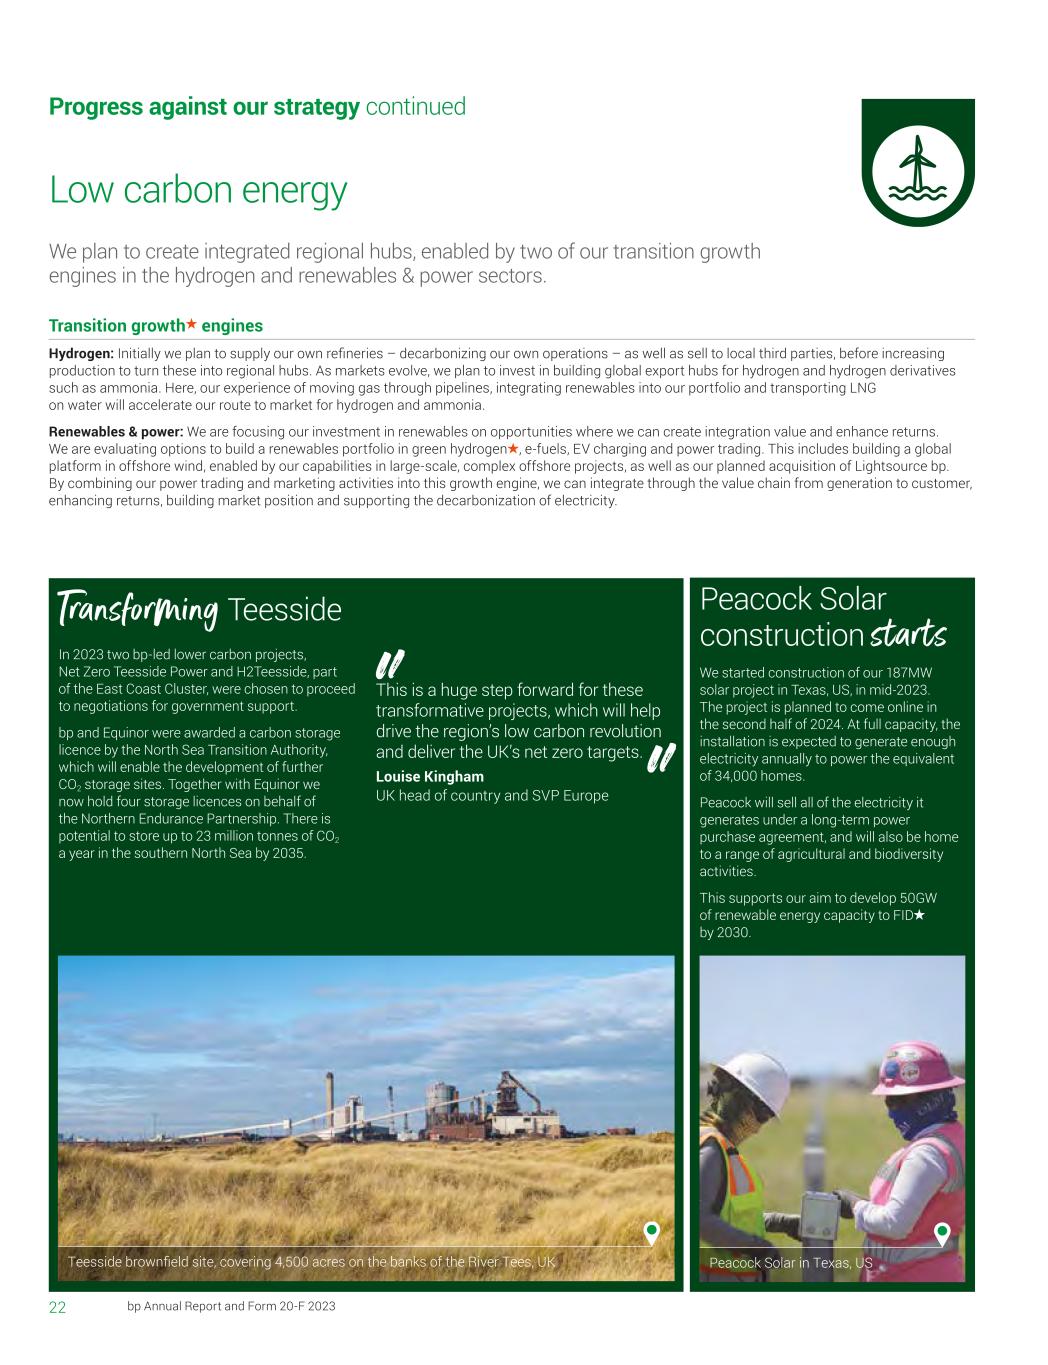
22 bp Annual Report and Form 20-F 2023 Progress against our strategy continued Low carbon energy We plan to create integrated regional hubs, enabled by two of our transition growth engines in the hydrogen and renewables & power sectors. Transition growth engines Hydrogen: Initially we plan to supply our own refineries – decarbonizing our own operations – as well as sell to local third parties, before increasing production to turn these into regional hubs. As markets evolve, we plan to invest in building global export hubs for hydrogen and hydrogen derivatives such as ammonia. Here, our experience of moving gas through pipelines, integrating renewables into our portfolio and transporting LNG on water will accelerate our route to market for hydrogen and ammonia. Renewables & power: We are focusing our investment in renewables on opportunities where we can create integration value and enhance returns. We are evaluating options to build a renewables portfolio in green hydrogen , e-fuels, EV charging and power trading. This includes building a global platform in offshore wind, enabled by our capabilities in large-scale, complex offshore projects, as well as our planned acquisition of Lightsource bp. By combining our power trading and marketing activities into this growth engine, we can integrate through the value chain from generation to customer, enhancing returns, building market position and supporting the decarbonization of electricity. Transforming Teesside In 2023 two bp-led lower carbon projects, Net Zero Teesside Power and H2Teesside, part of the East Coast Cluster, were chosen to proceed to negotiations for government support. bp and Equinor were awarded a carbon storage licence by the North Sea Transition Authority, which will enable the development of further CO2 storage sites. Together with Equinor we now hold four storage licences on behalf of the Northern Endurance Partnership. There is potential to store up to 23 million tonnes of CO2 a year in the southern North Sea by 2035. This is a huge step forward for these transformative projects, which will help drive the region’s low carbon revolution and deliver the UK’s net zero targets. Louise Kingham UK head of country and SVP Europe Peacock Solar construction starts We started construction of our 187MW solar project in Texas, US, in mid-2023. The project is planned to come online in the second half of 2024. At full capacity, the installation is expected to generate enough electricity annually to power the equivalent of 34,000 homes. Peacock will sell all of the electricity it generates under a long-term power purchase agreement, and will also be home to a range of agricultural and biodiversity activities. This supports our aim to develop 50GW of renewable energy capacity to FID by 2030. Teesside brownfield site, covering 4,500 acres on the banks of the River Tees, UK Peacock Solar in Texas, US

23bp Annual Report and Form 20-F 2023 Strategic report See glossary on page 373 Helping Japan decarbonize We signed a memorandum of understanding (MOU) with Japan’s second-largest power company, Chubu Electric, to explore opportunities for decarbonization in the country and wider Asia region. The MOU includes exploring the feasibility of collecting, aggregating, using and transporting CO2 from major emitters in Japan’s Nagoya port to storage sites through a carbon capture and storage hub. This could help decarbonize a range of the port’s carbon-intensive industrial businesses, which account for 3% of Japan’s total emissions, supporting its ambition to cut emissions by 35% by 2030. Lightsource bp acquisition In November 2023 we agreed to acquire the remaining 50.03% interest in Lightsource bp which we did not already own. Subject to regulatory approvals, the deal is expected to close in the second half of 2024. The acquisition aims to scale up Lightsource bp and create additional value by applying complementary capabilities and strengths to help meet the growing demand for low carbon power from our transition growth engines. Upgrading Fowler Ridge We completed a major technology upgrade at our Fowler Ridge 1 wind farm in Indiana, US. The upgrade will help the site produce more power, more efficiently and with greater reliability. The new Vestas turbines are expected to produce up to 40% more energy. The decommissioned blades will be recycled, avoiding up to 1,500 tonnes of metal going to landfill. Hydrogen in Spain In 2023 we launched plans for a green hydrogen cluster called HyVal, at our Castellón refinery in the Valencia region of Spain. This project is a substantial upgrade for the wind farm and another investment in bp’s low carbon energy future. Orlando Alvarez Chair and president, bp America We will continue to scale this successful business, and also apply its capabilities and expertise to help meet the growing demand for low carbon power from our transition growth engines. Anja Dotzenrath EVP gas & low carbon energy Wind bid wins We have been successful in two offshore wind bids in Germany – our first in continental Europe. We will lead the development, construction and operation of these projects, and expect to connect them to the grid by the end of 2030. Integration opportunity: We expect the renewable power from these projects will support our green hydrogen and biofuels production , electric mobility growth and refinery decarbonization, as well as wider industry decarbonization in Germany. 4GW total potential generating capacity from the two sites Fowler Ridge wind farm in Indiana, US Solar farm in Norfolk, UK
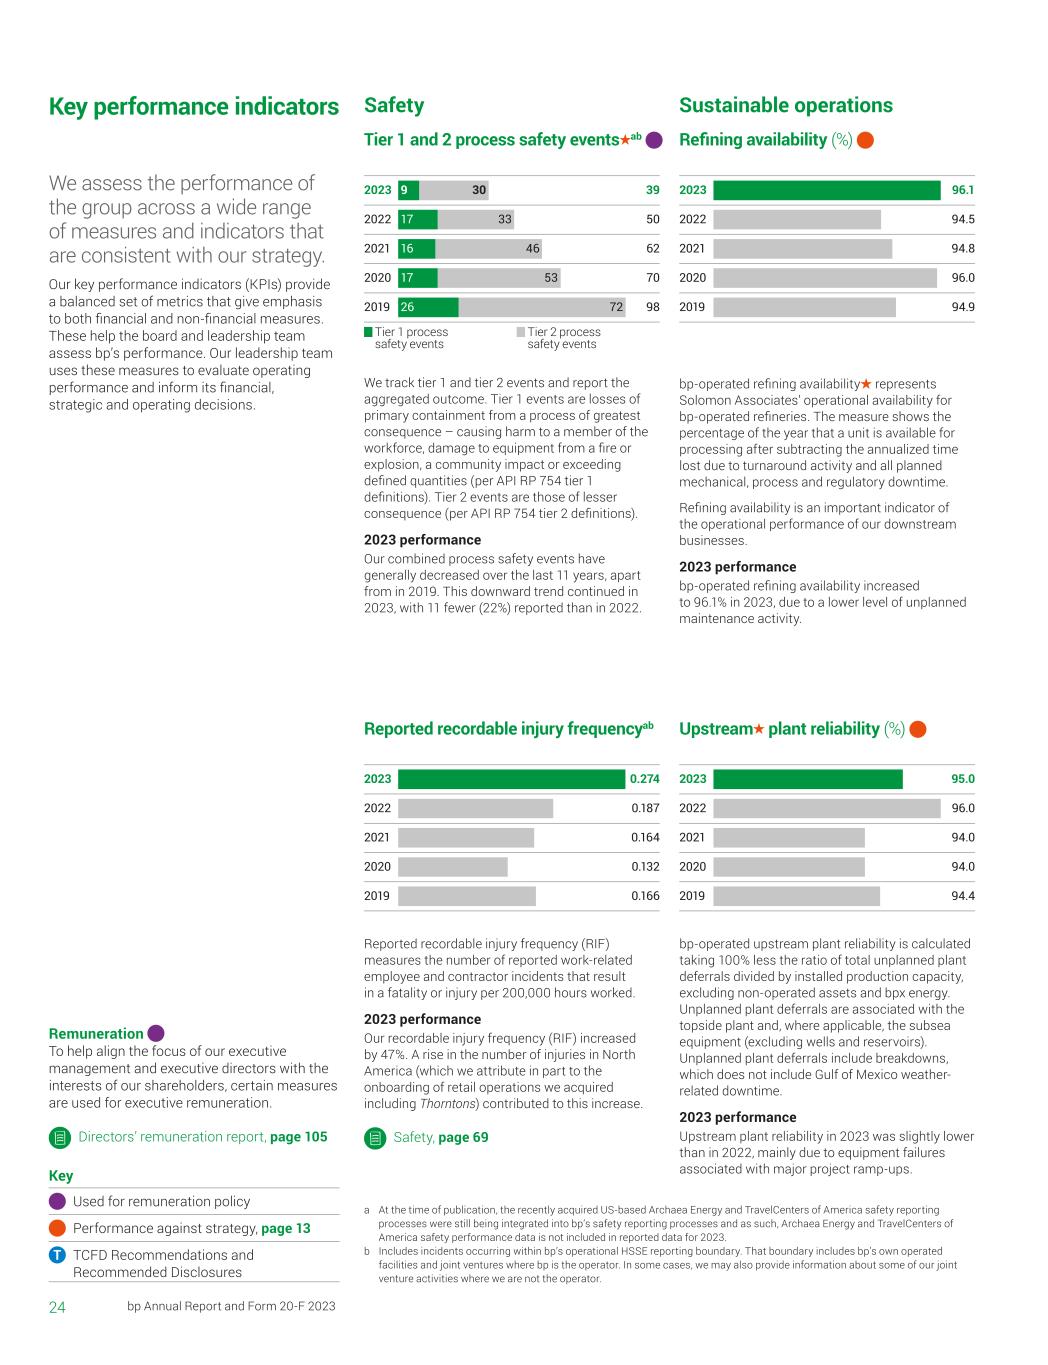
2022 0.187 2023 0.274 2021 0.164 2020 0.132 2019 0.166 2022 94.5 2023 96.1 2021 94.8 2020 96.0 2019 94.9 2022 96.0 2023 95.0 2021 94.0 2020 94.0 2019 94.4 2022 5017 33 2023 399 30 2021 6216 46 2020 7017 53 2019 9826 72 Tier 1 process safety events Tier 2 process safety events 24 bp Annual Report and Form 20-F 2023 Key performance indicators We assess the performance of the group across a wide range of measures and indicators that are consistent with our strategy. Our key performance indicators (KPIs) provide a balanced set of metrics that give emphasis to both financial and non-financial measures. These help the board and leadership team assess bp’s performance. Our leadership team uses these measures to evaluate operating performance and inform its financial, strategic and operating decisions. We track tier 1 and tier 2 events and report the aggregated outcome. Tier 1 events are losses of primary containment from a process of greatest consequence – causing harm to a member of the workforce, damage to equipment from a fire or explosion, a community impact or exceeding defined quantities (per API RP 754 tier 1 definitions). Tier 2 events are those of lesser consequence (per API RP 754 tier 2 definitions). 2023 performance Our combined process safety events have generally decreased over the last 11 years, apart from in 2019. This downward trend continued in 2023, with 11 fewer (22%) reported than in 2022. Reported recordable injury frequency (RIF) measures the number of reported work-related employee and contractor incidents that result in a fatality or injury per 200,000 hours worked. 2023 performance Our recordable injury frequency (RIF) increased by 47%. A rise in the number of injuries in North America (which we attribute in part to the onboarding of retail operations we acquired including Thorntons) contributed to this increase. Safety, page 69 bp-operated refining availability represents Solomon Associates’ operational availability for bp-operated refineries. The measure shows the percentage of the year that a unit is available for processing after subtracting the annualized time lost due to turnaround activity and all planned mechanical, process and regulatory downtime. Refining availability is an important indicator of the operational performance of our downstream businesses. 2023 performance bp-operated refining availability increased to 96.1% in 2023, due to a lower level of unplanned maintenance activity. bp-operated upstream plant reliability is calculated taking 100% less the ratio of total unplanned plant deferrals divided by installed production capacity, excluding non-operated assets and bpx energy. Unplanned plant deferrals are associated with the topside plant and, where applicable, the subsea equipment (excluding wells and reservoirs). Unplanned plant deferrals include breakdowns, which does not include Gulf of Mexico weather- related downtime. 2023 performance Upstream plant reliability in 2023 was slightly lower than in 2022, mainly due to equipment failures associated with major project ramp-ups. Reported recordable injury frequencyab Upstream plant reliability (%) Tier 1 and 2 process safety events ab Refining availability (%) Safety Sustainable operations Remuneration To help align the focus of our executive management and executive directors with the interests of our shareholders, certain measures are used for executive remuneration. Directors’ remuneration report, page 105 Key Used for remuneration policy Performance against strategy, page 13 TCFD Recommendations and Recommended Disclosures a At the time of publication, the recently acquired US-based Archaea Energy and TravelCenters of America safety reporting processes were still being integrated into bp’s safety reporting processes and as such, Archaea Energy and TravelCenters of America safety performance data is not included in reported data for 2023. b Includes incidents occurring within bp’s operational HSSE reporting boundary. That boundary includes bp’s own operated facilities and joint ventures where bp is the operator. In some cases, we may also provide information about some of our joint venture activities where we are not the operator.
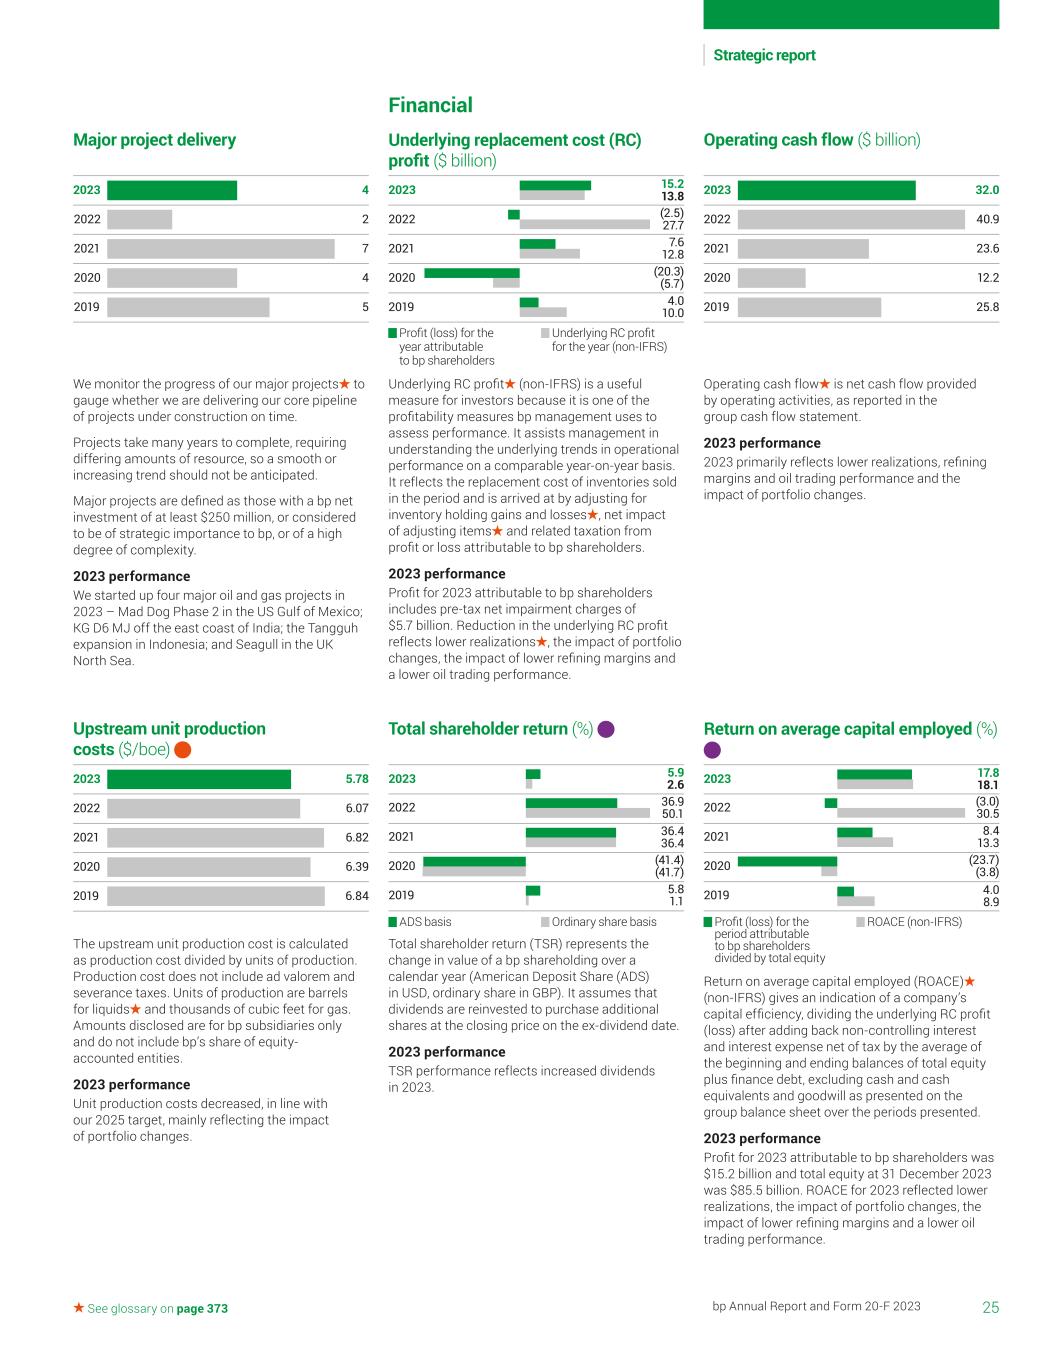
2022 2 2023 4 2021 7 2020 4 2019 5 2022 6.07 2023 5.78 2021 6.82 2020 6.39 2019 6.84 2022 7.6 2023 (2.5) 2021 (20.3)2020 4.02019 12.8 27.7 15.2 13.8 (5.7) 10.0 Profit (loss) for the year attributable to bp shareholders Underlying RC profit for the year (non-IFRS) 2022 40.9 2023 32.0 2021 23.6 2020 12.2 2019 25.8 2022 (41.4) 2023 36.42021 5.8 2020 2019 (41.7) 36.4 5.9 2.6 36.9 50.1 1.1 ADS basis Ordinary share basis 2022 (23.7) 2023 8.42021 4.0 2020 2019 (3.8) 13.3 17.8 18.1 (3.0) 30.5 8.9 Profit (loss) for the period attributable to bp shareholders divided by total equity ROACE (non-IFRS) 25bp Annual Report and Form 20-F 2023 Strategic report See glossary on page 373 We monitor the progress of our major projects to gauge whether we are delivering our core pipeline of projects under construction on time. Projects take many years to complete, requiring differing amounts of resource, so a smooth or increasing trend should not be anticipated. Major projects are defined as those with a bp net investment of at least $250 million, or considered to be of strategic importance to bp, or of a high degree of complexity. 2023 performance We started up four major oil and gas projects in 2023 – Mad Dog Phase 2 in the US Gulf of Mexico; KG D6 MJ off the east coast of India; the Tangguh expansion in Indonesia; and Seagull in the UK North Sea. The upstream unit production cost is calculated as production cost divided by units of production. Production cost does not include ad valorem and severance taxes. Units of production are barrels for liquids and thousands of cubic feet for gas. Amounts disclosed are for bp subsidiaries only and do not include bp’s share of equity- accounted entities. 2023 performance Unit production costs decreased, in line with our 2025 target, mainly reflecting the impact of portfolio changes. Underlying RC profit (non-IFRS) is a useful measure for investors because it is one of the profitability measures bp management uses to assess performance. It assists management in understanding the underlying trends in operational performance on a comparable year-on-year basis. It reflects the replacement cost of inventories sold in the period and is arrived at by adjusting for inventory holding gains and losses , net impact of adjusting items and related taxation from profit or loss attributable to bp shareholders. 2023 performance Profit for 2023 attributable to bp shareholders includes pre-tax net impairment charges of $5.7 billion. Reduction in the underlying RC profit reflects lower realizations , the impact of portfolio changes, the impact of lower refining margins and a lower oil trading performance. Total shareholder return (TSR) represents the change in value of a bp shareholding over a calendar year (American Deposit Share (ADS) in USD, ordinary share in GBP). It assumes that dividends are reinvested to purchase additional shares at the closing price on the ex-dividend date. 2023 performance TSR performance reflects increased dividends in 2023. Operating cash flow is net cash flow provided by operating activities, as reported in the group cash flow statement. 2023 performance 2023 primarily reflects lower realizations, refining margins and oil trading performance and the impact of portfolio changes. Return on average capital employed (ROACE) (non-IFRS) gives an indication of a company’s capital efficiency, dividing the underlying RC profit (loss) after adding back non-controlling interest and interest expense net of tax by the average of the beginning and ending balances of total equity plus finance debt, excluding cash and cash equivalents and goodwill as presented on the group balance sheet over the periods presented. 2023 performance Profit for 2023 attributable to bp shareholders was $15.2 billion and total equity at 31 December 2023 was $85.5 billion. ROACE for 2023 reflected lower realizations, the impact of portfolio changes, the impact of lower refining margins and a lower oil trading performance. Upstream unit production costs ($/boe) Total shareholder return (%) Return on average capital employed (%) Underlying replacement cost (RC) profit ($ billion) Operating cash flow ($ billion) Major project delivery Financial
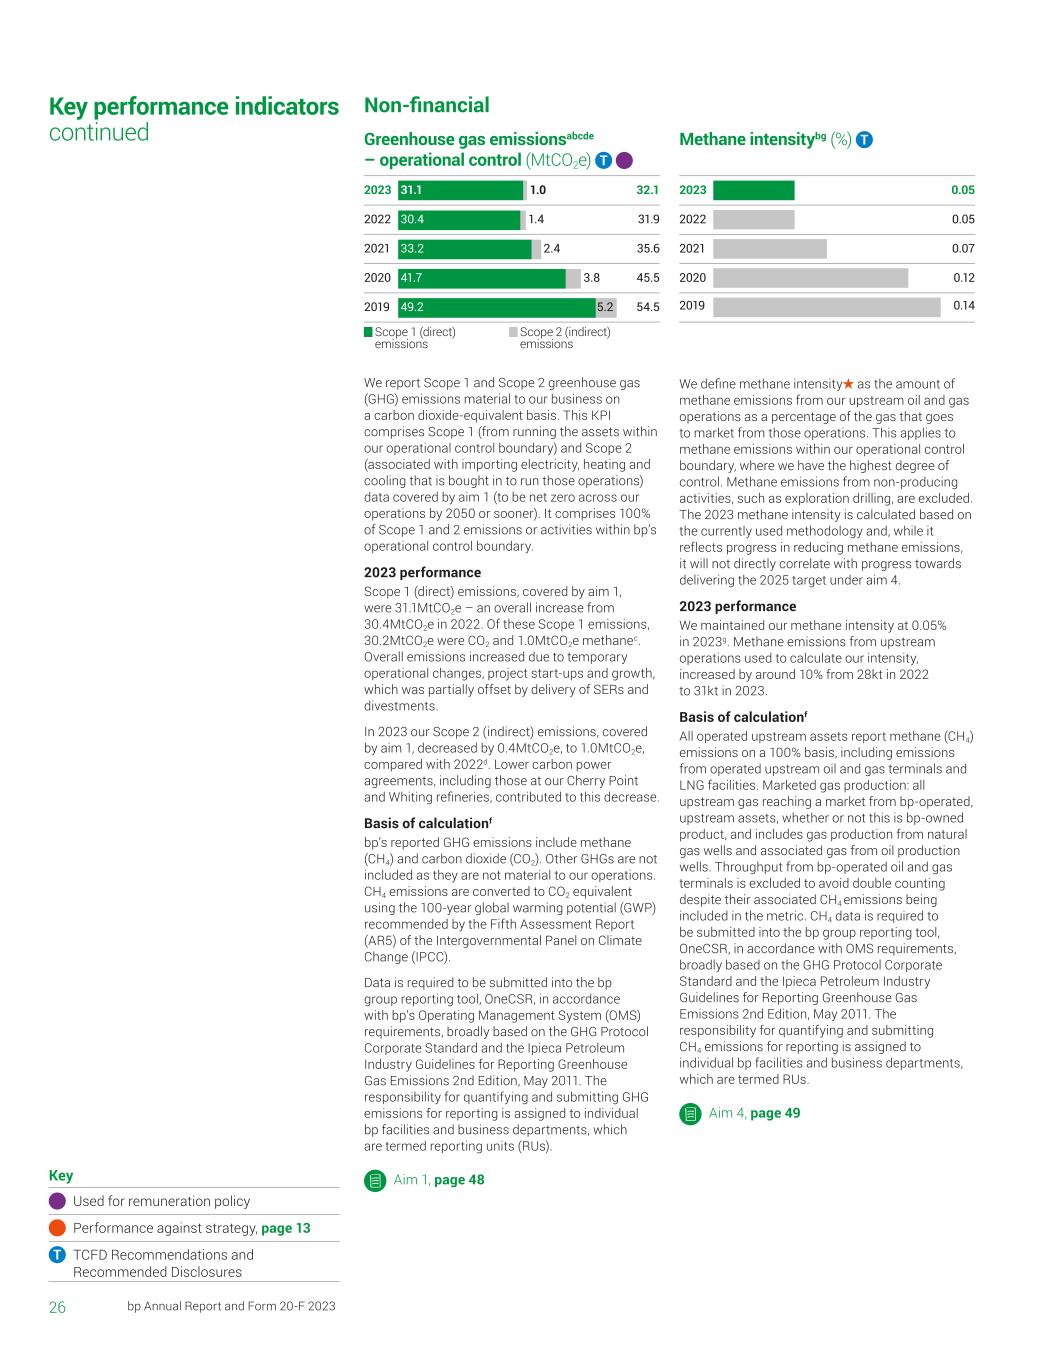
30.4 33.2 2.4 41.7 3.8 49.2 5.2 2022 31.9 2023 2021 35.6 2020 45.5 2019 54.5 32.131.1 1.0 1.4 Scope 1 (direct) emissions Scope 2 (indirect) emissions 2022 0.05 2023 0.05 2021 0.07 2020 2019 0.12 0.14 26 bp Annual Report and Form 20-F 2023 Key performance indicators continued Key Used for remuneration policy Performance against strategy, page 13 TCFD Recommendations and Recommended Disclosures We report Scope 1 and Scope 2 greenhouse gas (GHG) emissions material to our business on a carbon dioxide-equivalent basis. This KPI comprises Scope 1 (from running the assets within our operational control boundary) and Scope 2 (associated with importing electricity, heating and cooling that is bought in to run those operations) data covered by aim 1 (to be net zero across our operations by 2050 or sooner). It comprises 100% of Scope 1 and 2 emissions or activities within bp’s operational control boundary. 2023 performance Scope 1 (direct) emissions, covered by aim 1, were 31.1MtCO2e – an overall increase from 30.4MtCO2e in 2022. Of these Scope 1 emissions, 30.2MtCO2e were CO2 and 1.0MtCO2e methanec. Overall emissions increased due to temporary operational changes, project start-ups and growth, which was partially offset by delivery of SERs and divestments. In 2023 our Scope 2 (indirect) emissions, covered by aim 1, decreased by 0.4MtCO2e, to 1.0MtCO2e, compared with 2022d. Lower carbon power agreements, including those at our Cherry Point and Whiting refineries, contributed to this decrease. Basis of calculationf bp’s reported GHG emissions include methane (CH4) and carbon dioxide (CO2). Other GHGs are not included as they are not material to our operations. CH4 emissions are converted to CO2 equivalent using the 100-year global warming potential (GWP) recommended by the Fifth Assessment Report (AR5) of the Intergovernmental Panel on Climate Change (IPCC). Data is required to be submitted into the bp group reporting tool, OneCSR, in accordance with bp’s Operating Management System (OMS) requirements, broadly based on the GHG Protocol Corporate Standard and the Ipieca Petroleum Industry Guidelines for Reporting Greenhouse Gas Emissions 2nd Edition, May 2011. The responsibility for quantifying and submitting GHG emissions for reporting is assigned to individual bp facilities and business departments, which are termed reporting units (RUs). Aim 1, page 48 We define methane intensity as the amount of methane emissions from our upstream oil and gas operations as a percentage of the gas that goes to market from those operations. This applies to methane emissions within our operational control boundary, where we have the highest degree of control. Methane emissions from non-producing activities, such as exploration drilling, are excluded. The 2023 methane intensity is calculated based on the currently used methodology and, while it reflects progress in reducing methane emissions, it will not directly correlate with progress towards delivering the 2025 target under aim 4. 2023 performance We maintained our methane intensity at 0.05% in 2023g. Methane emissions from upstream operations used to calculate our intensity, increased by around 10% from 28kt in 2022 to 31kt in 2023. Basis of calculationf All operated upstream assets report methane (CH4) emissions on a 100% basis, including emissions from operated upstream oil and gas terminals and LNG facilities. Marketed gas production: all upstream gas reaching a market from bp-operated, upstream assets, whether or not this is bp-owned product, and includes gas production from natural gas wells and associated gas from oil production wells. Throughput from bp-operated oil and gas terminals is excluded to avoid double counting despite their associated CH4 emissions being included in the metric. CH4 data is required to be submitted into the bp group reporting tool, OneCSR, in accordance with OMS requirements, broadly based on the GHG Protocol Corporate Standard and the Ipieca Petroleum Industry Guidelines for Reporting Greenhouse Gas Emissions 2nd Edition, May 2011. The responsibility for quantifying and submitting CH4 emissions for reporting is assigned to individual bp facilities and business departments, which are termed RUs. Aim 4, page 49 Greenhouse gas emissionsabcde – operational control (MtCO2e) Methane intensitybg (%) Non-financial
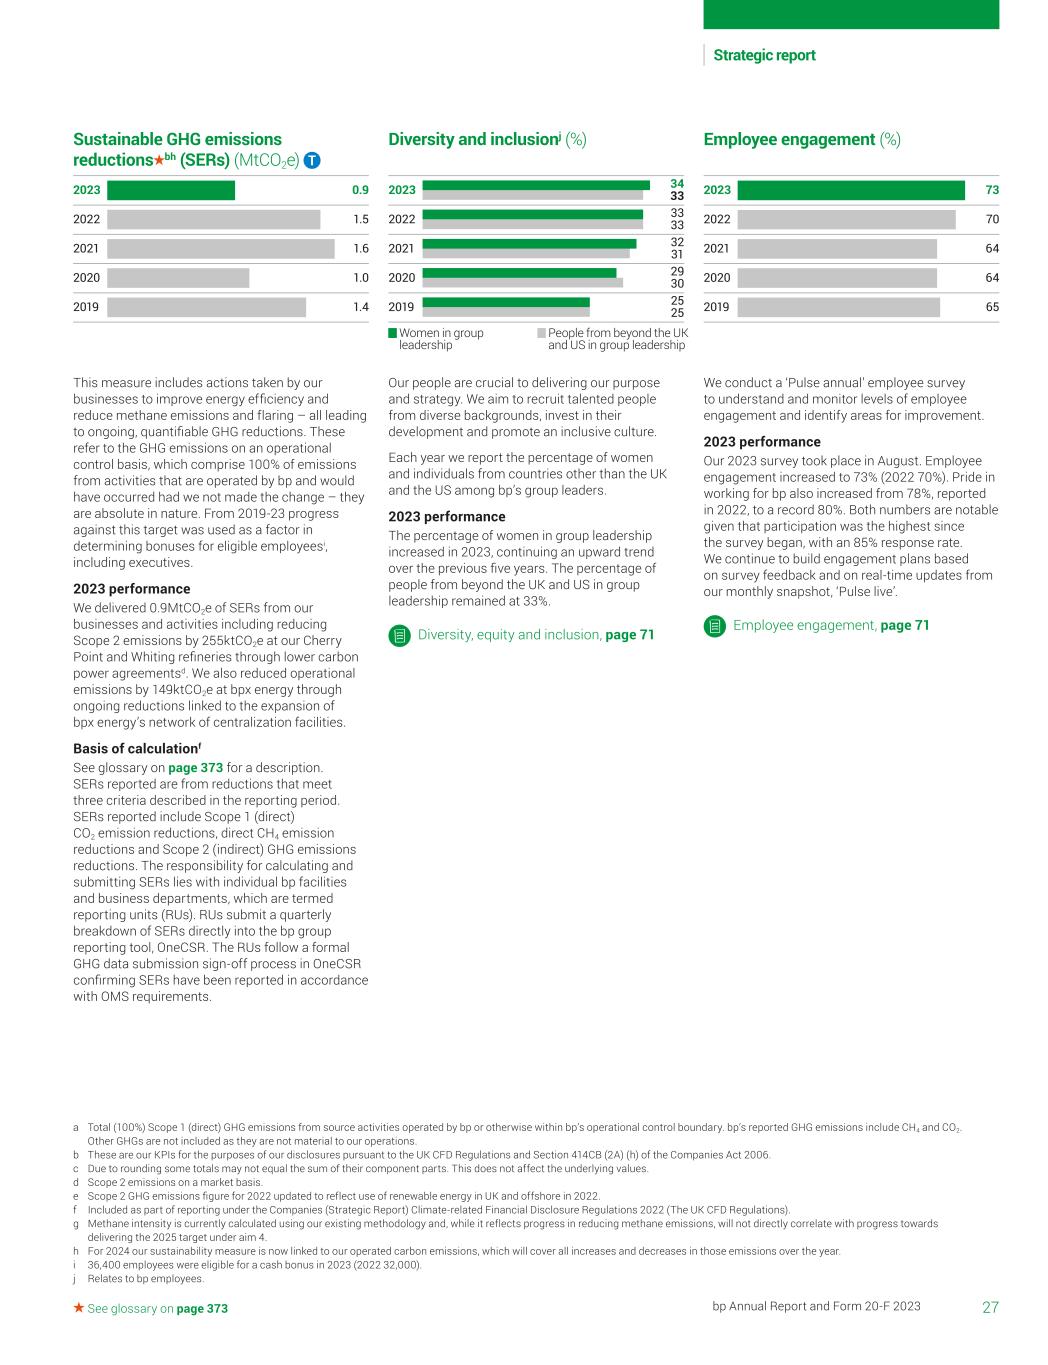
2022 1.5 2023 0.9 2021 1.6 2020 1.0 2019 1.4 2022 70 2023 73 2021 64 2020 64 2019 65 2022 29 2023 33 2021 25 2020 2019 30 31 32 33 34 33 25 Women in group leadership People from beyond the UK and US in group leadership 27bp Annual Report and Form 20-F 2023 Strategic report See glossary on page 373 Our people are crucial to delivering our purpose and strategy. We aim to recruit talented people from diverse backgrounds, invest in their development and promote an inclusive culture. Each year we report the percentage of women and individuals from countries other than the UK and the US among bp’s group leaders. 2023 performance The percentage of women in group leadership increased in 2023, continuing an upward trend over the previous five years. The percentage of people from beyond the UK and US in group leadership remained at 33%. Diversity, equity and inclusion, page 71 We conduct a ‘Pulse annual’ employee survey to understand and monitor levels of employee engagement and identify areas for improvement. 2023 performance Our 2023 survey took place in August. Employee engagement increased to 73% (2022 70%). Pride in working for bp also increased from 78%, reported in 2022, to a record 80%. Both numbers are notable given that participation was the highest since the survey began, with an 85% response rate. We continue to build engagement plans based on survey feedback and on real-time updates from our monthly snapshot, ‘Pulse live’. Employee engagement, page 71 This measure includes actions taken by our businesses to improve energy efficiency and reduce methane emissions and flaring – all leading to ongoing, quantifiable GHG reductions. These refer to the GHG emissions on an operational control basis, which comprise 100% of emissions from activities that are operated by bp and would have occurred had we not made the change – they are absolute in nature. From 2019-23 progress against this target was used as a factor in determining bonuses for eligible employeesi, including executives. 2023 performance We delivered 0.9MtCO2e of SERs from our businesses and activities including reducing Scope 2 emissions by 255ktCO2e at our Cherry Point and Whiting refineries through lower carbon power agreementsd. We also reduced operational emissions by 149ktCO2e at bpx energy through ongoing reductions linked to the expansion of bpx energy’s network of centralization facilities. Basis of calculationf See glossary on page 373 for a description. SERs reported are from reductions that meet three criteria described in the reporting period. SERs reported include Scope 1 (direct) CO2 emission reductions, direct CH4 emission reductions and Scope 2 (indirect) GHG emissions reductions. The responsibility for calculating and submitting SERs lies with individual bp facilities and business departments, which are termed reporting units (RUs). RUs submit a quarterly breakdown of SERs directly into the bp group reporting tool, OneCSR. The RUs follow a formal GHG data submission sign-off process in OneCSR confirming SERs have been reported in accordance with OMS requirements. Diversity and inclusionj (%) Employee engagement (%) Sustainable GHG emissions reductions bh (SERs) (MtCO2e) a Total (100%) Scope 1 (direct) GHG emissions from source activities operated by bp or otherwise within bp’s operational control boundary. bp’s reported GHG emissions include CH4 and CO2. Other GHGs are not included as they are not material to our operations. b These are our KPIs for the purposes of our disclosures pursuant to the UK CFD Regulations and Section 414CB (2A) (h) of the Companies Act 2006. c Due to rounding some totals may not equal the sum of their component parts. This does not affect the underlying values. d Scope 2 emissions on a market basis. e Scope 2 GHG emissions figure for 2022 updated to reflect use of renewable energy in UK and offshore in 2022. f Included as part of reporting under the Companies (Strategic Report) Climate-related Financial Disclosure Regulations 2022 (The UK CFD Regulations). g Methane intensity is currently calculated using our existing methodology and, while it reflects progress in reducing methane emissions, will not directly correlate with progress towards delivering the 2025 target under aim 4. h For 2024 our sustainability measure is now linked to our operated carbon emissions, which will cover all increases and decreases in those emissions over the year. i 36,400 employees were eligible for a cash bonus in 2023 (2022 32,000). j Relates to bp employees.
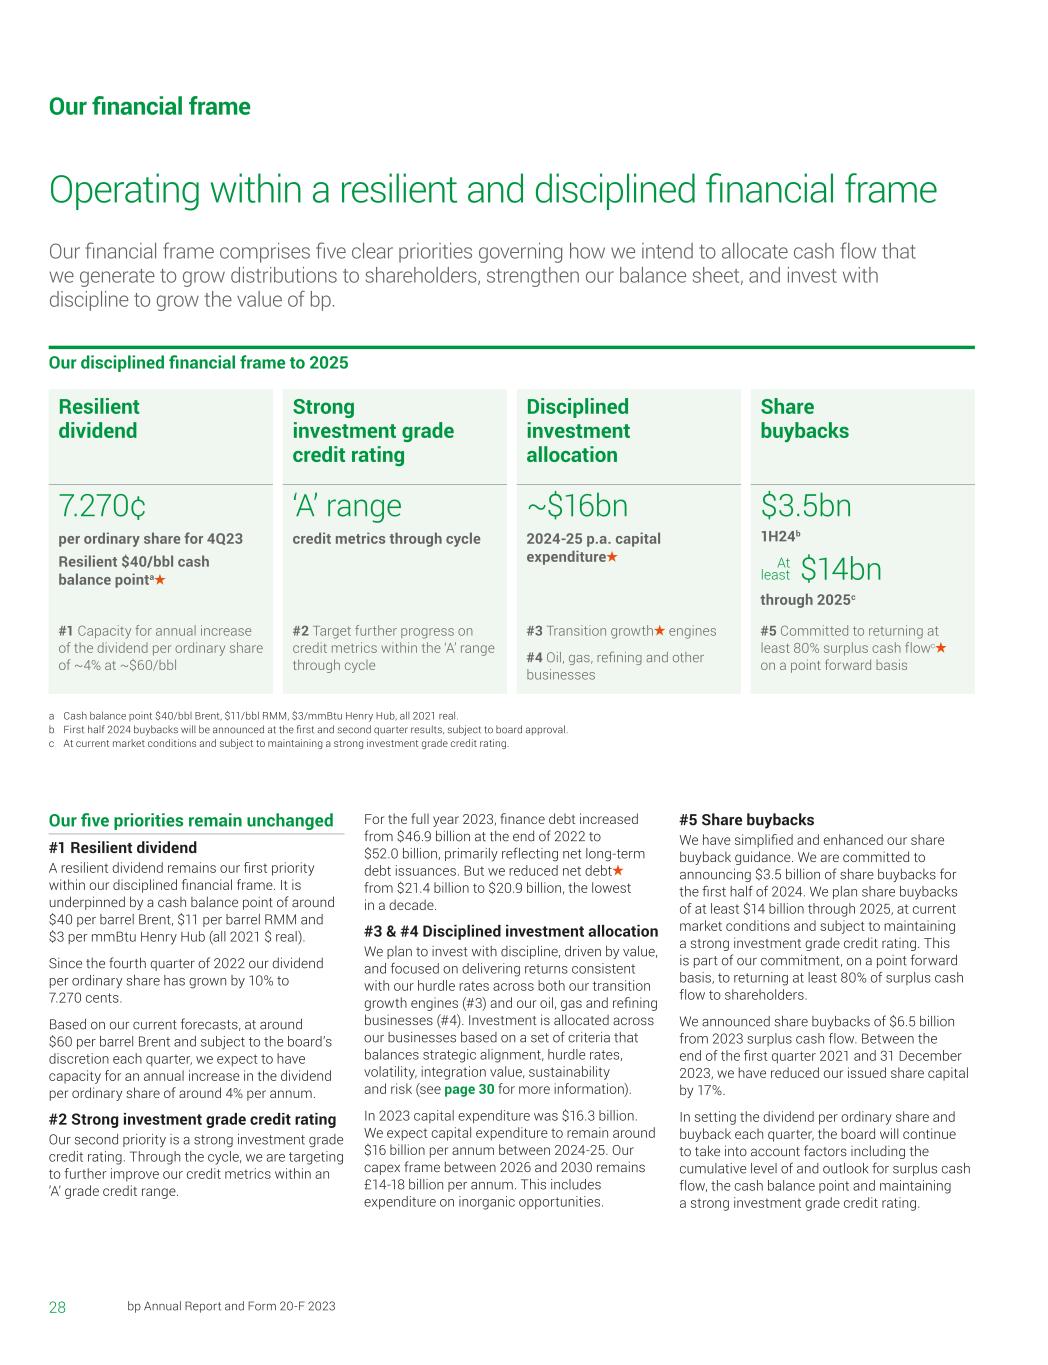
28 bp Annual Report and Form 20-F 2023 Operating within a resilient and disciplined financial frame Our financial frame For the full year 2023, finance debt increased from $46.9 billion at the end of 2022 to $52.0 billion, primarily reflecting net long-term debt issuances. But we reduced net debt from $21.4 billion to $20.9 billion, the lowest in a decade. #3 & #4 Disciplined investment allocation We plan to invest with discipline, driven by value, and focused on delivering returns consistent with our hurdle rates across both our transition growth engines (#3) and our oil, gas and refining businesses (#4). Investment is allocated across our businesses based on a set of criteria that balances strategic alignment, hurdle rates, volatility, integration value, sustainability and risk (see page 30 for more information). In 2023 capital expenditure was $16.3 billion. We expect capital expenditure to remain around $16 billion per annum between 2024-25. Our capex frame between 2026 and 2030 remains £14-18 billion per annum. This includes expenditure on inorganic opportunities. #5 Share buybacks We have simplified and enhanced our share buyback guidance. We are committed to announcing $3.5 billion of share buybacks for the first half of 2024. We plan share buybacks of at least $14 billion through 2025, at current market conditions and subject to maintaining a strong investment grade credit rating. This is part of our commitment, on a point forward basis, to returning at least 80% of surplus cash flow to shareholders. We announced share buybacks of $6.5 billion from 2023 surplus cash flow. Between the end of the first quarter 2021 and 31 December 2023, we have reduced our issued share capital by 17%. In setting the dividend per ordinary share and buyback each quarter, the board will continue to take into account factors including the cumulative level of and outlook for surplus cash flow, the cash balance point and maintaining a strong investment grade credit rating. a Cash balance point $40/bbl Brent, $11/bbl RMM, $3/mmBtu Henry Hub, all 2021 real. b First half 2024 buybacks will be announced at the first and second quarter results, subject to board approval. c At current market conditions and subject to maintaining a strong investment grade credit rating. Our disciplined financial frame to 2025 7.270¢ per ordinary share for 4Q23 Resilient $40/bbl cash balance pointa ‘A’ range credit metrics through cycle ~$16bn 2024-25 p.a. capital expenditure $3.5bn 1H24b At least $14bn through 2025c Resilient dividend Strong investment grade credit rating Share buybacks Disciplined investment allocation #1 Capacity for annual increase of the dividend per ordinary share of ~4% at ~$60/bbl #2 Target further progress on credit metrics within the ‘A’ range through cycle #3 Transition growth engines #4 Oil, gas, refining and other businesses #5 Committed to returning at least 80% surplus cash flowc on a point forward basis Our financial frame comprises five clear priorities governing how we intend to allocate cash flow that we generate to grow distributions to shareholders, strengthen our balance sheet, and invest with discipline to grow the value of bp. Our five priorities remain unchanged #1 Resilient dividend A resilient dividend remains our first priority within our disciplined financial frame. It is underpinned by a cash balance point of around $40 per barrel Brent, $11 per barrel RMM and $3 per mmBtu Henry Hub (all 2021 $ real). Since the fourth quarter of 2022 our dividend per ordinary share has grown by 10% to 7.270 cents. Based on our current forecasts, at around $60 per barrel Brent and subject to the board’s discretion each quarter, we expect to have capacity for an annual increase in the dividend per ordinary share of around 4% per annum. #2 Strong investment grade credit rating Our second priority is a strong investment grade credit rating. Through the cycle, we are targeting to further improve our credit metrics within an ’A’ grade credit range.
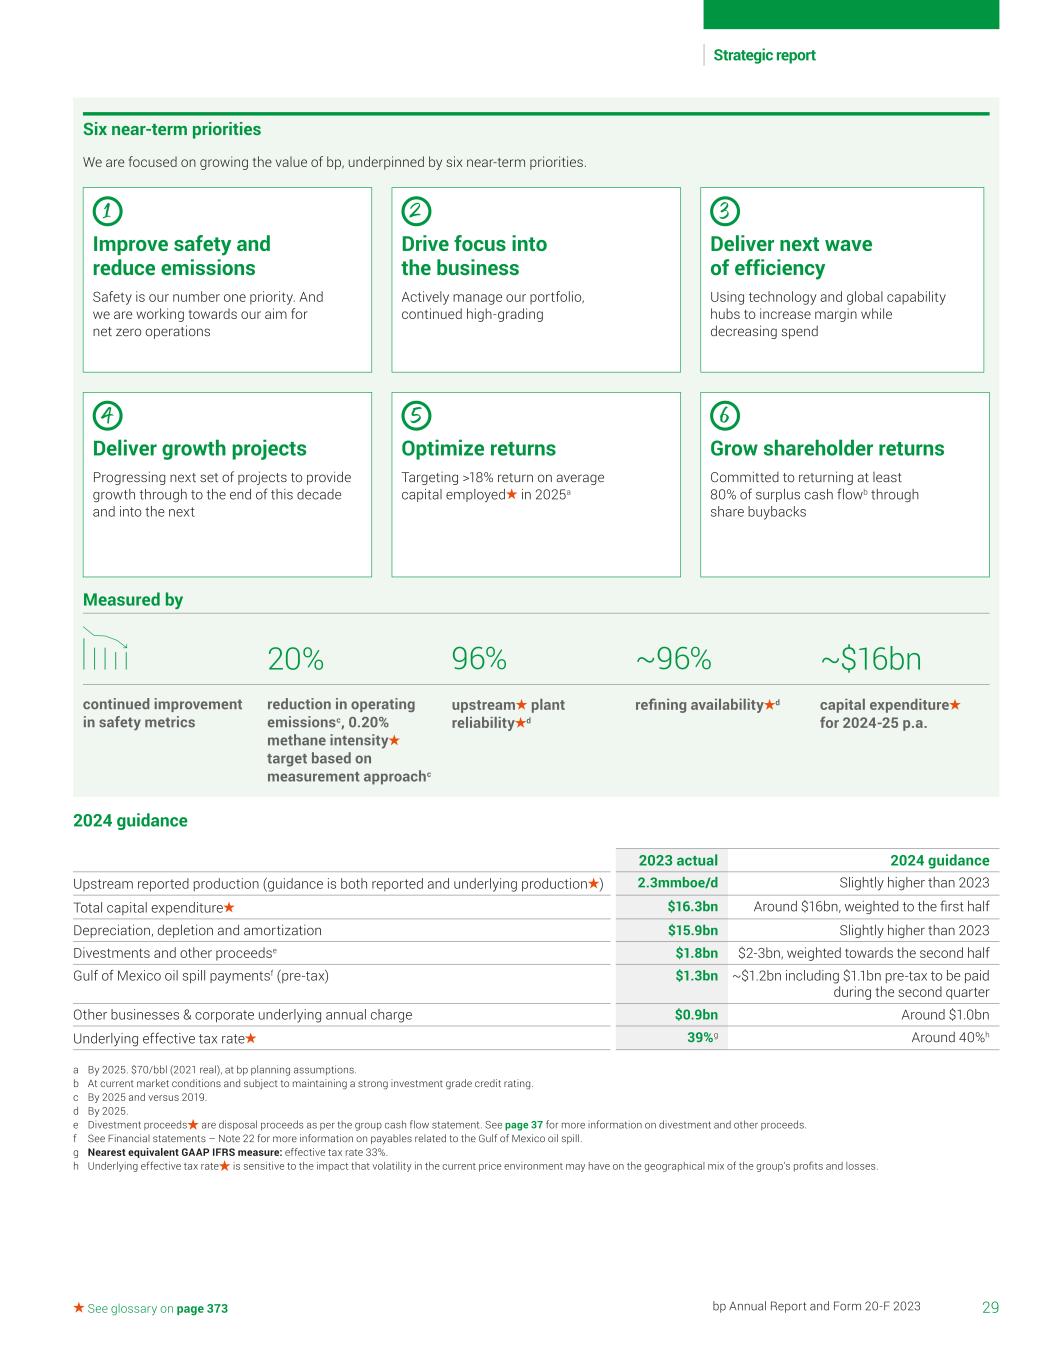
29bp Annual Report and Form 20-F 2023 Strategic report See glossary on page 373 2024 guidance 2023 actual 2024 guidance Upstream reported production (guidance is both reported and underlying production ) 2.3mmboe/d Slightly higher than 2023 Total capital expenditure $16.3bn Around $16bn, weighted to the first half Depreciation, depletion and amortization $15.9bn Slightly higher than 2023 Divestments and other proceedse $1.8bn $2-3bn, weighted towards the second half Gulf of Mexico oil spill paymentsf (pre-tax) $1.3bn ~$1.2bn including $1.1bn pre-tax to be paid during the second quarter Other businesses & corporate underlying annual charge $0.9bn Around $1.0bn Underlying effective tax rate 39%g Around 40%h a By 2025. $70/bbl (2021 real), at bp planning assumptions. b At current market conditions and subject to maintaining a strong investment grade credit rating. c By 2025 and versus 2019. d By 2025. e Divestment proceeds are disposal proceeds as per the group cash flow statement. See page 37 for more information on divestment and other proceeds. f See Financial statements – Note 22 for more information on payables related to the Gulf of Mexico oil spill. g Nearest equivalent GAAP IFRS measure: effective tax rate 33%. h Underlying effective tax rate is sensitive to the impact that volatility in the current price environment may have on the geographical mix of the group’s profits and losses. Six near-term priorities We are focused on growing the value of bp, underpinned by six near-term priorities. Improve safety and reduce emissions Safety is our number one priority. And we are working towards our aim for net zero operations Deliver growth projects Progressing next set of projects to provide growth through to the end of this decade and into the next Drive focus into the business Actively manage our portfolio, continued high-grading Optimize returns Targeting >18% return on average capital employed in 2025a Deliver next wave of efficiency Using technology and global capability hubs to increase margin while decreasing spend Grow shareholder returns Committed to returning at least 80% of surplus cash flowb through share buybacks Measured by continued improvement in safety metrics reduction in operating emissionsc, 0.20% methane intensity target based on measurement approachc 20% upstream plant reliability d refining availability d 96% ~96% capital expenditure for 2024-25 p.a. ~$16bn 1 4 2 5 3 6
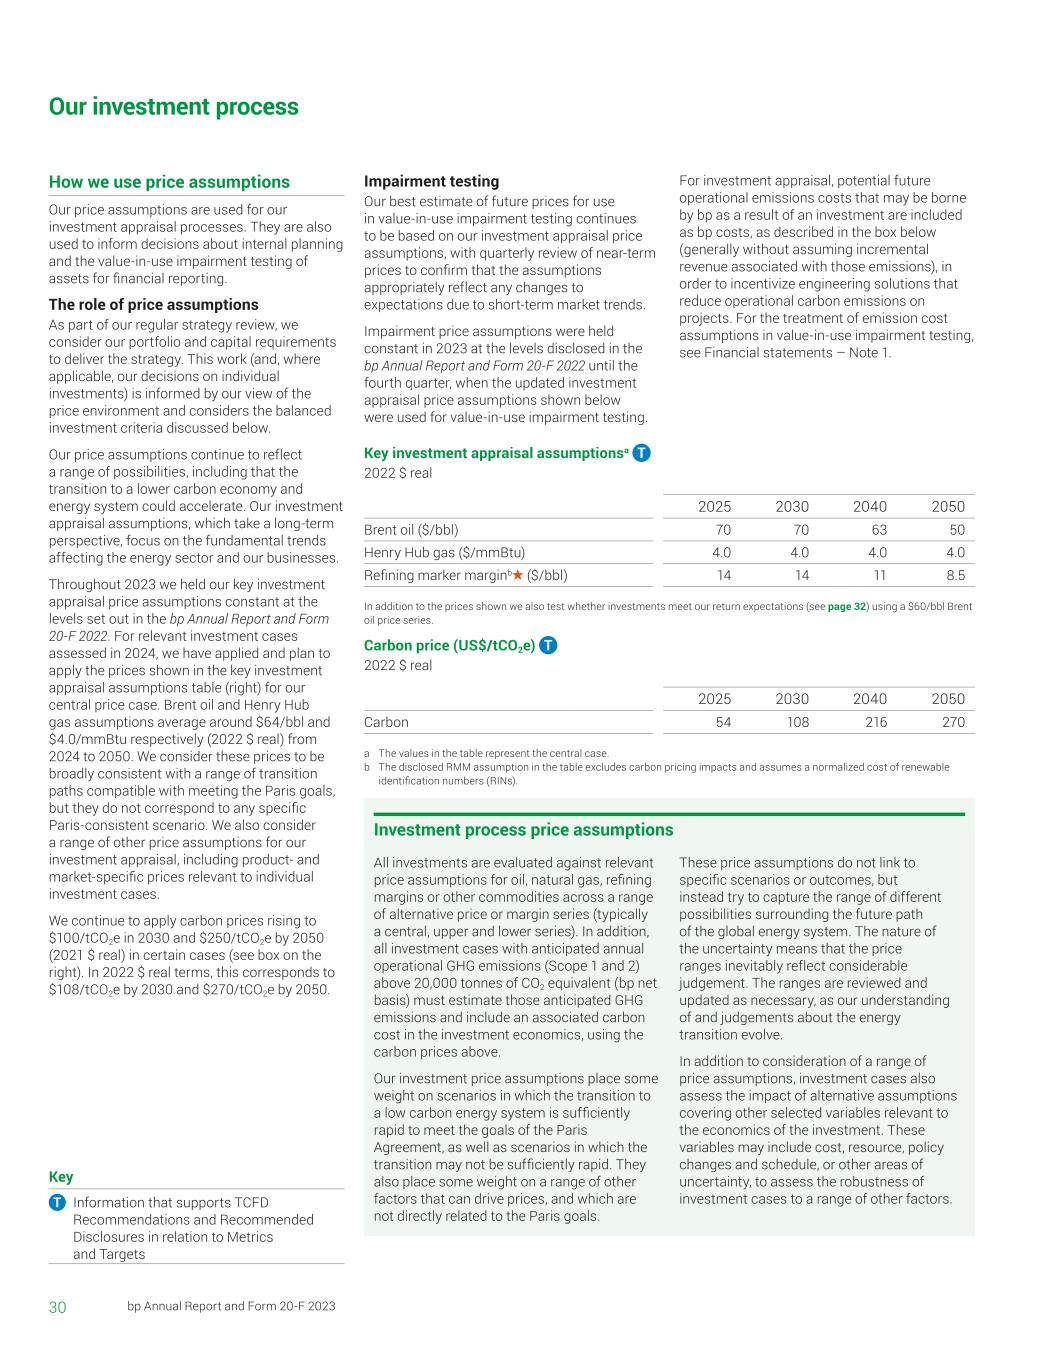
30 bp Annual Report and Form 20-F 2023 Our investment process How we use price assumptions Our price assumptions are used for our investment appraisal processes. They are also used to inform decisions about internal planning and the value-in-use impairment testing of assets for financial reporting. The role of price assumptions As part of our regular strategy review, we consider our portfolio and capital requirements to deliver the strategy. This work (and, where applicable, our decisions on individual investments) is informed by our view of the price environment and considers the balanced investment criteria discussed below. Our price assumptions continue to reflect a range of possibilities, including that the transition to a lower carbon economy and energy system could accelerate. Our investment appraisal assumptions, which take a long-term perspective, focus on the fundamental trends affecting the energy sector and our businesses. Throughout 2023 we held our key investment appraisal price assumptions constant at the levels set out in the bp Annual Report and Form 20-F 2022. For relevant investment cases assessed in 2024, we have applied and plan to apply the prices shown in the key investment appraisal assumptions table (right) for our central price case. Brent oil and Henry Hub gas assumptions average around $64/bbl and $4.0/mmBtu respectively (2022 $ real) from 2024 to 2050. We consider these prices to be broadly consistent with a range of transition paths compatible with meeting the Paris goals, but they do not correspond to any specific Paris-consistent scenario. We also consider a range of other price assumptions for our investment appraisal, including product- and market-specific prices relevant to individual investment cases. We continue to apply carbon prices rising to $100/tCO2e in 2030 and $250/tCO2e by 2050 (2021 $ real) in certain cases (see box on the right). In 2022 $ real terms, this corresponds to $108/tCO2e by 2030 and $270/tCO2e by 2050. Impairment testing Our best estimate of future prices for use in value-in-use impairment testing continues to be based on our investment appraisal price assumptions, with quarterly review of near-term prices to confirm that the assumptions appropriately reflect any changes to expectations due to short-term market trends. Impairment price assumptions were held constant in 2023 at the levels disclosed in the bp Annual Report and Form 20-F 2022 until the fourth quarter, when the updated investment appraisal price assumptions shown below were used for value-in-use impairment testing. For investment appraisal, potential future operational emissions costs that may be borne by bp as a result of an investment are included as bp costs, as described in the box below (generally without assuming incremental revenue associated with those emissions), in order to incentivize engineering solutions that reduce operational carbon emissions on projects. For the treatment of emission cost assumptions in value-in-use impairment testing, see Financial statements – Note 1. Key investment appraisal assumptionsa 2022 $ real 2025 2030 2040 2050 Brent oil ($/bbl) 70 70 63 50 Henry Hub gas ($/mmBtu) 4.0 4.0 4.0 4.0 Refining marker marginb ($/bbl) 14 14 11 8.5 In addition to the prices shown we also test whether investments meet our return expectations (see page 32) using a $60/bbl Brent oil price series. Carbon price (US$/tCO2e) 2022 $ real 2025 2030 2040 2050 Carbon 54 108 216 270 a The values in the table represent the central case. b The disclosed RMM assumption in the table excludes carbon pricing impacts and assumes a normalized cost of renewable identification numbers (RINs). Investment process price assumptions All investments are evaluated against relevant price assumptions for oil, natural gas, refining margins or other commodities across a range of alternative price or margin series (typically a central, upper and lower series). In addition, all investment cases with anticipated annual operational GHG emissions (Scope 1 and 2) above 20,000 tonnes of CO2 equivalent (bp net basis) must estimate those anticipated GHG emissions and include an associated carbon cost in the investment economics, using the carbon prices above. Our investment price assumptions place some weight on scenarios in which the transition to a low carbon energy system is sufficiently rapid to meet the goals of the Paris Agreement, as well as scenarios in which the transition may not be sufficiently rapid. They also place some weight on a range of other factors that can drive prices, and which are not directly related to the Paris goals. These price assumptions do not link to specific scenarios or outcomes, but instead try to capture the range of different possibilities surrounding the future path of the global energy system. The nature of the uncertainty means that the price ranges inevitably reflect considerable judgement. The ranges are reviewed and updated as necessary, as our understanding of and judgements about the energy transition evolve. In addition to consideration of a range of price assumptions, investment cases also assess the impact of alternative assumptions covering other selected variables relevant to the economics of the investment. These variables may include cost, resource, policy changes and schedule, or other areas of uncertainty, to assess the robustness of investment cases to a range of other factors. Key Information that supports TCFD Recommendations and Recommended Disclosures in relation to Metrics and Targets
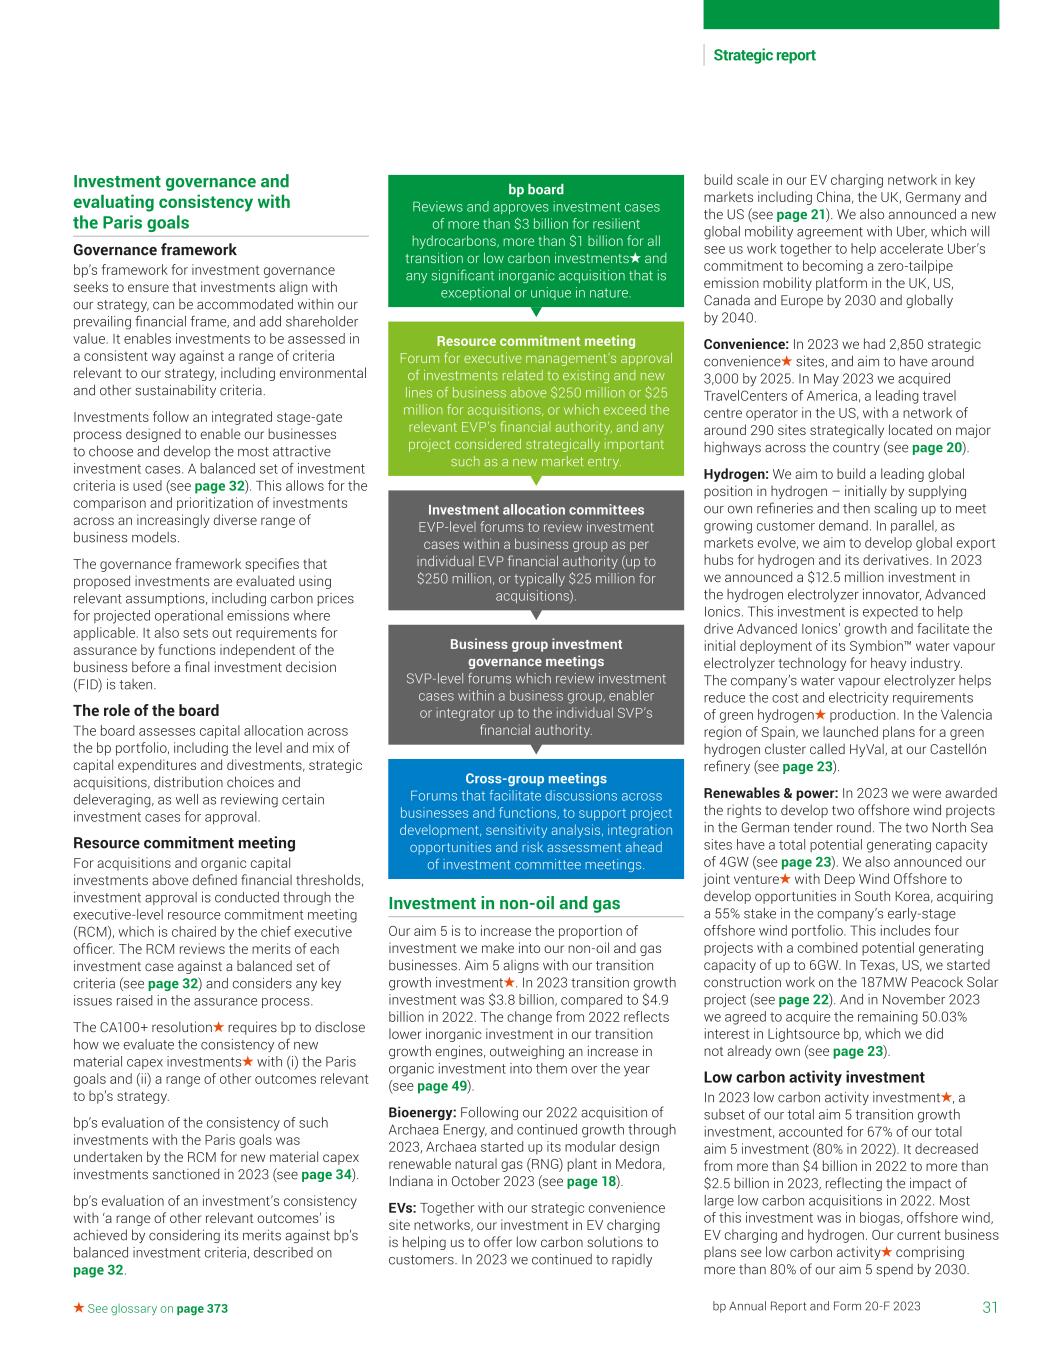
31bp Annual Report and Form 20-F 2023 Strategic report See glossary on page 373 Investment governance and evaluating consistency with the Paris goals Governance framework bp’s framework for investment governance seeks to ensure that investments align with our strategy, can be accommodated within our prevailing financial frame, and add shareholder value. It enables investments to be assessed in a consistent way against a range of criteria relevant to our strategy, including environmental and other sustainability criteria. Investments follow an integrated stage-gate process designed to enable our businesses to choose and develop the most attractive investment cases. A balanced set of investment criteria is used (see page 32). This allows for the comparison and prioritization of investments across an increasingly diverse range of business models. The governance framework specifies that proposed investments are evaluated using relevant assumptions, including carbon prices for projected operational emissions where applicable. It also sets out requirements for assurance by functions independent of the business before a final investment decision (FID) is taken. The role of the board The board assesses capital allocation across the bp portfolio, including the level and mix of capital expenditures and divestments, strategic acquisitions, distribution choices and deleveraging, as well as reviewing certain investment cases for approval. Resource commitment meeting For acquisitions and organic capital investments above defined financial thresholds, investment approval is conducted through the executive-level resource commitment meeting (RCM), which is chaired by the chief executive officer. The RCM reviews the merits of each investment case against a balanced set of criteria (see page 32) and considers any key issues raised in the assurance process. The CA100+ resolution requires bp to disclose how we evaluate the consistency of new material capex investments with (i) the Paris goals and (ii) a range of other outcomes relevant to bp’s strategy. bp’s evaluation of the consistency of such investments with the Paris goals was undertaken by the RCM for new material capex investments sanctioned in 2023 (see page 34). bp’s evaluation of an investment’s consistency with ‘a range of other relevant outcomes’ is achieved by considering its merits against bp’s balanced investment criteria, described on page 32. bp board Reviews and approves investment cases of more than $3 billion for resilient hydrocarbons, more than $1 billion for all transition or low carbon investments and any significant inorganic acquisition that is exceptional or unique in nature. Resource commitment meeting Forum for executive management’s approval of investments related to existing and new lines of business above $250 million or $25 million for acquisitions, or which exceed the relevant EVP’s financial authority, and any project considered strategically important such as a new market entry. Investment allocation committees EVP-level forums to review investment cases within a business group as per individual EVP financial authority (up to $250 million, or typically $25 million for acquisitions). Business group investment governance meetings SVP-level forums which review investment cases within a business group, enabler or integrator up to the individual SVP’s financial authority. Cross-group meetings Forums that facilitate discussions across businesses and functions, to support project development, sensitivity analysis, integration opportunities and risk assessment ahead of investment committee meetings. Investment in non-oil and gas Our aim 5 is to increase the proportion of investment we make into our non-oil and gas businesses. Aim 5 aligns with our transition growth investment . In 2023 transition growth investment was $3.8 billion, compared to $4.9 billion in 2022. The change from 2022 reflects lower inorganic investment in our transition growth engines, outweighing an increase in organic investment into them over the year (see page 49). Bioenergy: Following our 2022 acquisition of Archaea Energy, and continued growth through 2023, Archaea started up its modular design renewable natural gas (RNG) plant in Medora, Indiana in October 2023 (see page 18). EVs: Together with our strategic convenience site networks, our investment in EV charging is helping us to offer low carbon solutions to customers. In 2023 we continued to rapidly build scale in our EV charging network in key markets including China, the UK, Germany and the US (see page 21). We also announced a new global mobility agreement with Uber, which will see us work together to help accelerate Uber’s commitment to becoming a zero-tailpipe emission mobility platform in the UK, US, Canada and Europe by 2030 and globally by 2040. Convenience: In 2023 we had 2,850 strategic convenience sites, and aim to have around 3,000 by 2025. In May 2023 we acquired TravelCenters of America, a leading travel centre operator in the US, with a network of around 290 sites strategically located on major highways across the country (see page 20). Hydrogen: We aim to build a leading global position in hydrogen – initially by supplying our own refineries and then scaling up to meet growing customer demand. In parallel, as markets evolve, we aim to develop global export hubs for hydrogen and its derivatives. In 2023 we announced a $12.5 million investment in the hydrogen electrolyzer innovator, Advanced Ionics. This investment is expected to help drive Advanced Ionics’ growth and facilitate the initial deployment of its Symbion™ water vapour electrolyzer technology for heavy industry. The company’s water vapour electrolyzer helps reduce the cost and electricity requirements of green hydrogen production. In the Valencia region of Spain, we launched plans for a green hydrogen cluster called HyVal, at our Castellón refinery (see page 23). Renewables & power: In 2023 we were awarded the rights to develop two offshore wind projects in the German tender round. The two North Sea sites have a total potential generating capacity of 4GW (see page 23). We also announced our joint venture with Deep Wind Offshore to develop opportunities in South Korea, acquiring a 55% stake in the company’s early-stage offshore wind portfolio. This includes four projects with a combined potential generating capacity of up to 6GW. In Texas, US, we started construction work on the 187MW Peacock Solar project (see page 22). And in November 2023 we agreed to acquire the remaining 50.03% interest in Lightsource bp, which we did not already own (see page 23). Low carbon activity investment In 2023 low carbon activity investment , a subset of our total aim 5 transition growth investment, accounted for 67% of our total aim 5 investment (80% in 2022). It decreased from more than $4 billion in 2022 to more than $2.5 billion in 2023, reflecting the impact of large low carbon acquisitions in 2022. Most of this investment was in biogas, offshore wind, EV charging and hydrogen. Our current business plans see low carbon activity comprising more than 80% of our aim 5 spend by 2030.
32 bp Annual Report and Form 20-F 2023 Our investment process continued Balanced investment criteria All investment cases must set out their investment merits and are considered against a set of six balanced investment criteria – although investment decisions may also take other factors into account as appropriate. This standardized approach is intended to create a level playing field for decision making and allows portfolio-wide comparisons of investment cases. The decision to endorse an investment based on the information provided represents our evaluation that it is consistent with what the 2019 CA100+ resolution refers to as ‘a range of other outcomes relevant to bp’s strategy’. The six balanced investment criteria are: Strategic alignment: For all investment cases, we consider whether the investment supports delivery of our strategy, including our net zero aims. We also assess if the investment case involves distinctive capability that bp has, or intends to develop, and whether it adds to an existing ‘scale’ business within the portfolio or could help us create one. Safety and risks: For all investment cases, we provide an assessment of the key risks to the investment that have a significantly higher probability than usual or have a significantly greater impact (relative to the size of the project) were they to occur. Safety risk management at bp is underpinned by our Operating Management System (OMS) that is designed to help us sustainably deliver safe, reliable and compliant bp operations. Sustainability: For all investment cases, we consider how any proposed business opportunity is connected to the energy transition, societal needs and the environment. This approach is underpinned by our purpose and sustainability frame. All RCM cases must consider significant impacts of an investment on key sustainability aims, informed by our sustainability assessment template for investment cases (for our use of carbon prices, see box on page 30). Investment economics: For all investment cases, we consider investment economics against a range of relevant measures. Depending on the nature of the investment case, these may include return expectations (internal rate of return or IRR), net present value, discounted payback, and profitability index, reflecting assumptions about relevant commodity prices, margins and carbon prices (see page 30). The forward economics of an investment case are considered against the differentiated IRRs, applicable to that case at the time of the investment decision, depending on the business. We also refer to these expectations as hurdle rates, although as noted, each case is assessed according to its combined merit against our full set of balanced criteria. 1. For our resilient hydrocarbons portfolio, we seek a payback of less than 10 years for upstream oil and refining and 15 years for upstream gas; together with an IRR of 15-20%. 2. For bioenergy, we seek an IRR in excess of 15%. 3. For our convenience and EV charging businesses, we seek portfolio-level returns in excess of 15%. 4. For our hydrogen investments, we expect double-digit (unlevered) IRR. 5. For renewables investments, we seek an unlevered IRR of 6-8%. For each investment, the relevant return expectations above are assessed using our central price assumptions. For additional capital discipline for investments in oil and gas production, we also compare the central price hurdle above (15-20%) to a case in which the Brent oil price starts at $60/bbl and later declines to the level of our key appraisal assumptions by 2050 (see page 30). In addition, for investments in our oil and gas and refined products businesses, as well as any other investments that do not fall within one of the specific businesses set out above, we also compare the IRR in our lower-price case to a cost of capital hurdle rate. Volatility and rateability: Our investment economics metrics also consider the degree of uncertainty of the cash flows when considering investment cases. For example, some cases have more certainty of future costs and revenue projections. Variation in net present values for the key variables in an investment case are quantified by sensitivity analysis to give a range of potential outcomes against our key investment hurdles. Optionality and integration: Our assessment considers the degree of optionality offered by a project – the ability to adapt our business to changing circumstances. This could be an option to sell a product with a floor price, or the right to purchase additional equity in a joint venture at specific terms. Other types of options include the right to develop (or not develop) extensions to existing projects, or to change the course of a project’s development depending on market circumstances. We likewise seek out integration along value chains across multiple products, services, geographies and customers. For example, our gas production can supply liquefaction plants whose LNG is monetized by our trading business. Likewise, future carbon sequestration projects may allow us to add value to our gas production by converting it to low carbon power.
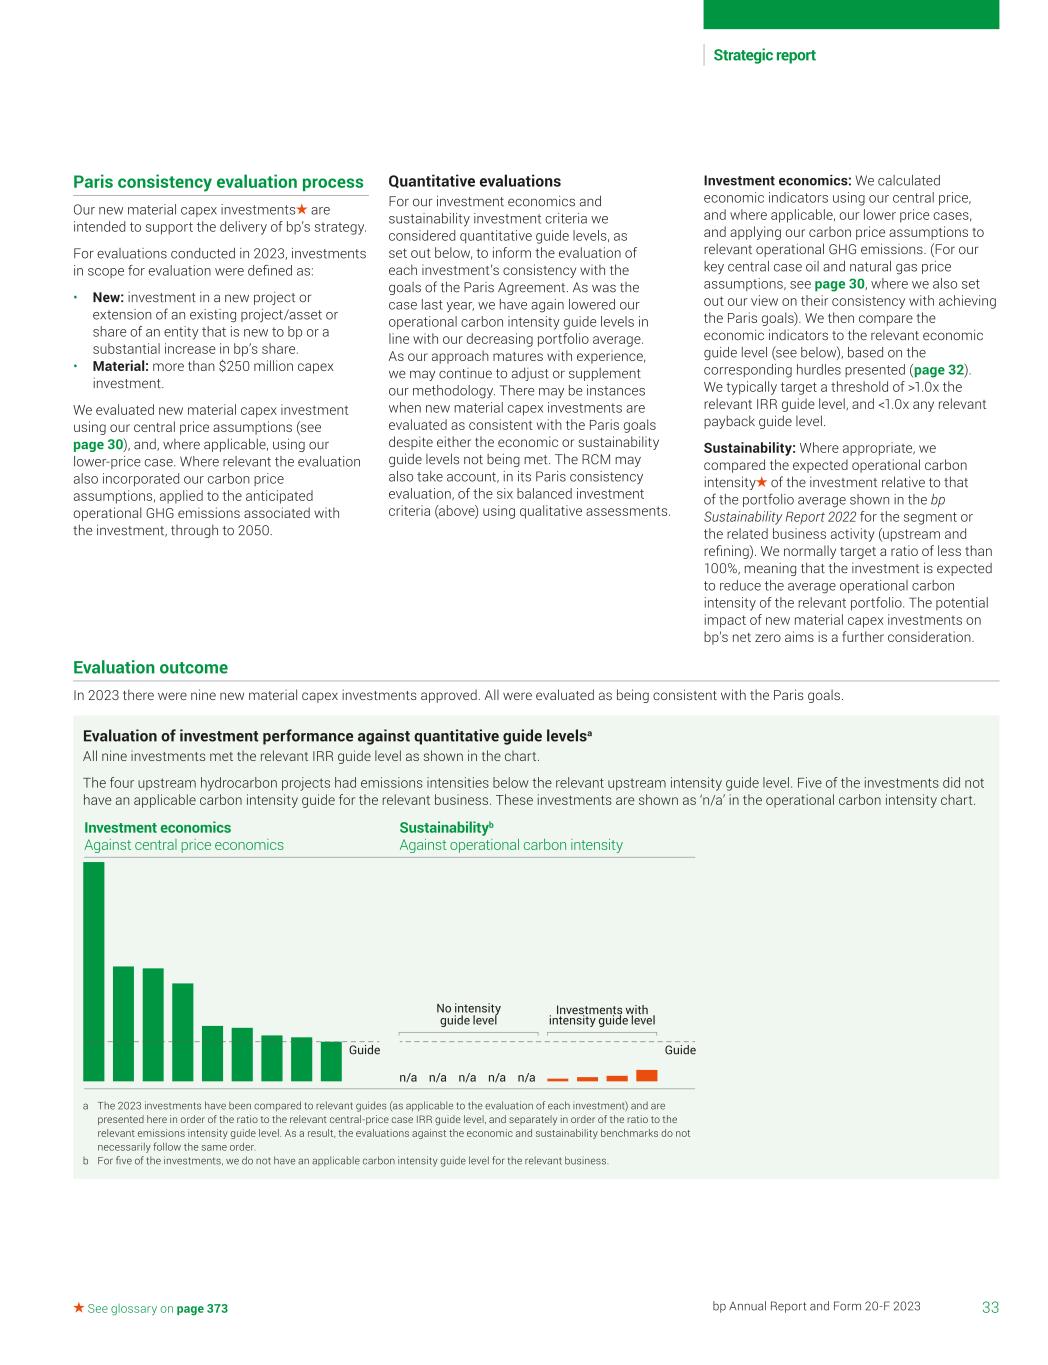
Investment economics Against central price economics Sustainabilityb Against operational carbon intensity Guide Guide Investments with intensity guide level No intensity guide level n/a n/a n/a n/a n/a 33bp Annual Report and Form 20-F 2023 Strategic report See glossary on page 373 Paris consistency evaluation process Our new material capex investments are intended to support the delivery of bp’s strategy. For evaluations conducted in 2023, investments in scope for evaluation were defined as: • New: investment in a new project or extension of an existing project/asset or share of an entity that is new to bp or a substantial increase in bp’s share. • Material: more than $250 million capex investment. We evaluated new material capex investment using our central price assumptions (see page 30), and, where applicable, using our lower-price case. Where relevant the evaluation also incorporated our carbon price assumptions, applied to the anticipated operational GHG emissions associated with the investment, through to 2050. Quantitative evaluations For our investment economics and sustainability investment criteria we considered quantitative guide levels, as set out below, to inform the evaluation of each investment’s consistency with the goals of the Paris Agreement. As was the case last year, we have again lowered our operational carbon intensity guide levels in line with our decreasing portfolio average. As our approach matures with experience, we may continue to adjust or supplement our methodology. There may be instances when new material capex investments are evaluated as consistent with the Paris goals despite either the economic or sustainability guide levels not being met. The RCM may also take account, in its Paris consistency evaluation, of the six balanced investment criteria (above) using qualitative assessments. Evaluation outcome In 2023 there were nine new material capex investments approved. All were evaluated as being consistent with the Paris goals. a The 2023 investments have been compared to relevant guides (as applicable to the evaluation of each investment) and are presented here in order of the ratio to the relevant central-price case IRR guide level, and separately in order of the ratio to the relevant emissions intensity guide level. As a result, the evaluations against the economic and sustainability benchmarks do not necessarily follow the same order. b For five of the investments, we do not have an applicable carbon intensity guide level for the relevant business. Investment economics: We calculated economic indicators using our central price, and where applicable, our lower price cases, and applying our carbon price assumptions to relevant operational GHG emissions. (For our key central case oil and natural gas price assumptions, see page 30, where we also set out our view on their consistency with achieving the Paris goals). We then compare the economic indicators to the relevant economic guide level (see below), based on the corresponding hurdles presented (page 32). We typically target a threshold of >1.0x the relevant IRR guide level, and <1.0x any relevant payback guide level. Sustainability: Where appropriate, we compared the expected operational carbon intensity of the investment relative to that of the portfolio average shown in the bp Sustainability Report 2022 for the segment or the related business activity (upstream and refining). We normally target a ratio of less than 100%, meaning that the investment is expected to reduce the average operational carbon intensity of the relevant portfolio. The potential impact of new material capex investments on bp’s net zero aims is a further consideration. Evaluation of investment performance against quantitative guide levelsa All nine investments met the relevant IRR guide level as shown in the chart. The four upstream hydrocarbon projects had emissions intensities below the relevant upstream intensity guide level. Five of the investments did not have an applicable carbon intensity guide for the relevant business. These investments are shown as ‘n/a’ in the operational carbon intensity chart.
34 bp Annual Report and Form 20-F 2023 Decisions taken in 2023 In 2023 there were nine new material capex investment decisions evaluated for Paris consistency: Our investment process continued Argos Gulf of Mexico The Argos Southwest Extension project aims to deliver production from a new drill centre in the Mad Dog field, tied back to existing equipment with subsea infrastructure. Argos is our most digitally advanced platform operating in the Gulf of Mexico, and is key to our strategy of building capacity to produce around 400,000boe/d. We expect volumes to average around 350,000boe/d through the second half of the decade. Oman Block 61 The investment involves the development and construction of a wellsite for a large number of wells and flowlines in Oman. The programme supports delivery of supply commitments and enables optimal depletion of the reservoir. Murlach Redevelopment Murlach is a two-well subsea tieback to existing infrastructure in the North Sea. The use of existing infrastructure is expected to help keep down development costs and operational carbon intensity, which is expected to be significantly below bp’s average for its upstream operations. TravelCenters of America bp completed its purchase of TravelCenters of America, one of the biggest networks of highway travel centres in the US, adding a network of around 290 sites, strategically located on major highways across the US. The deal is expected to almost doublea our global convenience gross margin and, over time, brings potential growth opportunities in four of our five transition growth engines. Power and gas supply acquisition bp has agreed to acquire GETEC ENERGIE GmbH, a leading independent supplier of energy to commercial and industrial (C&I) customers, with operations in Germany, the Netherlands, Austria, Belgium, and Poland. On completion the acquisition will significantly expand our European power and gas C&I supply presence. bp pulse On-The-Go US bp continued to advance its growth strategy in EV charging, approving a programme of investment of $500 million in EV charging infrastructure in the US, including an agreement with Tesla for the future purchase of $100 million of ultra-fast chargers in the US. The investment will facilitate the expansion of the bp pulse public network across the US, while also enabling support for EV fleet customers by deploying chargers at their private depots. Offshore German wind auction bp was awarded the rights to develop two offshore wind projects in the North Sea in Germany, marking our entry into offshore wind in continental Europe. We expect renewable power from these projects to support our green hydrogen and biofuels production , electric mobility growth and refinery decarbonization, as well as wider industry decarbonization in Germany. Raven Infills The Raven Infills Project is a two-well subsea tieback to existing Raven infrastructure in Egypt. The project’s expected operational carbon intensity is significantly below bp’s average for upstream operations. Lightsource bp acquisition Subject to regulatory approval, bp agreed to acquire the remaining 50.03% interest in Lightsource bp, one of the world’s leading developers and operators of utility-scale solar and battery storage assets. Lightsource bp operates with a capital-light, ‘develop, engineer, construct and farm down’ business model, which is designed to create value by selling interests in developed assets to strategic partners. The acquisition is expected to help meet growing demand for low carbon power from our transition growth engines. a On an annualized basis when compared with 2022.
35bp Annual Report and Form 20-F 2023 Strategic report See glossary on page 373 Group performance A year of delivery Financial and operating performance $ million except per share amounts 2023 2022 2021 Sales and other operating revenues 210,130 241,392 157,739 Profit before interest and tax 27,348 18,039 18,082 Finance costs and net finance income/expense relating to pensions and other post-retirement benefits (3,599) (2,634) (2,855) Taxation (7,869) (16,762) (6,740) Profit (loss) for the year 15,880 (1,357) 8,487 Non-controlling interest (641) (1,130) (922) Profit (loss) for the year attributable to bp shareholders 15,239 (2,487) 7,565 Inventory holding (gains) losses , before tax 1,236 (1,351) (3,655) Taxation charge (credit) on inventory holding gains and losses (292) 332 829 Replacement cost (RC) profit (loss) 16,183 (3,506) 4,739 Net (favourable) adverse impact of adjusting items a, before tax (1,143) 29,781 8,697 Total taxation charge (credit) on adjusting items (1,204) 1,378 (621) Underlying RC profit 13,836 27,653 12,815 Adjusted EBIDA 34,345 45,695 30,783 Adjusted EBITDA 43,710 60,747 37,315 Dividend paid per ordinary share (cents) 27.760 22.932 21.420 Dividend paid per ordinary share (pence) 22.328 18.624 15.538 Profit (loss) per ordinary share (cents) 87.78 (13.10) 37.57 Profit (loss) per ADS (dollars) 5.27 (0.79) 2.25 Underlying RC profit per ordinary share (cents) 79.69 145.63 63.65 Underlying RC profit per ADS (dollars) 4.78 8.74 3.82 Adjusting itemsa Gains on sale of businesses and fixed assets 361 3,866 1,851 Net impairment and losses on sale of businesses and fixed assets (5,838) (5,920) 1,123 Environmental and other provisions (647) 325 (1,536) Restructuring, integration and rationalization costs 37 34 (249) Fair value accounting effects (FVAEs)b 9,403 (3,501) (8,075) Rosneft — (24,033) (291) Gulf of Mexico oil spill (57) (84) (70) Other (1,711) (43) (668) Total before interest and taxation 1,548 (29,356) (7,915) Finance costs (405) (425) (782) 1,143 (29,781) (8,697) Adjusting items total taxation 1,204 (1,378) 621 2,347 (31,159) (8,076) a See page 337 for more information. b See page 338 for information on the cumulative impact of FVAEs. bp delivered strong underlying financial performance in 2023 – we raised the dividend per ordinary share by 10% to 7.270 cents for the second quarter of 2023 and bought back $7.9 billion of shares. We remain focused on strengthening the balance sheet. As we look forward, we are staying disciplined, tightening our capital expenditure frame and simplifying and enhancing our share buyback guidance through 2025. Kate Thomson Chief financial officer $15.2bn $13.8bn $32.0bn profit attributable to bp shareholders (2022 loss $(2.5)bn) underlying replacement cost (RC) profit (2022 profit $27.7bn) operating cash flow (2022 $40.9bn)
36 bp Annual Report and Form 20-F 2023 Group performance continued At 31 December 2023 the group's reportable segments are gas & low carbon energy, oil production & operations and customers & products. Each is managed separately, with decisions taken for the segment as a whole, and represent a single operating segment that does not result from aggregating two or more segments. See Financial statements – Note 5 Segmental analysis. Results The profit for the year ended 31 December 2023 attributable to bp shareholders was $15.2 billion, compared with a loss of $2.5 billion in 2022. Adjusting for inventory holding losses, RC profit was $16.2 billion, compared with a loss of $3.5 billion in 2022. After adjusting RC profit for a net impact of items, which bp has classified as adjusting (adjusting items) of $2.3 billion (on a post-tax basis), underlying RC profit for the year ended 31 December 2023 was $13.8 billion. The result reflected lower realizations, the impact of portfolio changes, the impact of lower refining margins and a lower oil trading performance. For 2022, after adjusting RC profit for a net adverse impact of adjusting items of $31.2 billion (on a post-tax basis), underlying RC profit was $27.7 billion. The result reflected higher gas and liquids realizations and higher refining margins, partially offset by higher tax and the absence of bp’s share of earnings from Rosneft. For a discussion of bp’s financial and operating performance for the years ending 31 December 2021 and 31 December 2022, see bp's Annual Report and Form 20-F 2022, pages 32-44. Adjusting items In 2023 the net favourable pre-tax impact of items, which bp has classified as adjusting (adjusting items) was $1.1 billion including: • Favourable fair value accounting effects (FVAEs) relative to management’s measure of performance of $9.4 billion primarily due to a decline in the forward price of LNG during 2023. Under IFRS, reported earnings include the mark-to-market value of the hedges used to risk-manage LNG contracts, but not of the LNG contracts themselves. The underlying result includes the mark-to- market value of the hedges but also recognizes changes in value of the LNG contracts being risk managed. The impacts of FVAEs relative to management’s internal measure of performance are provided on page 338. • Net impairment charges of $5.7 billion largely as a result of changes in the group’s price and discount rate assumptions, activity phasing and economic forecasts (in particular related to the Gelsenkirchen refinery). • In addition, $1.3 billion net impairment charges were reported through equity- accounted earnings (reported within the ‘other’ category), of which $1.1 billion relates to our US offshore wind projects. In 2022 the net adverse pre-tax impact of adjusting items was $29.8 billion including: • A pre-tax charge of $24.0 billion relating to bp’s decision to exit its 19.75% shareholding in Rosneft. • Adverse FVAEs relative to management’s measure of performance of $3.5 billion primarily arising from an increase in forward gas prices during the year and the changes in the fair value of derivatives entered into by the group to manage currency exposure and interest rate risks relating to hybrid bonds. Under IFRS, reported earnings include the mark-to-market value of the hedges used to risk-manage LNG contracts, but not of the LNG contracts themselves. The underlying result includes the mark-to-market value of the hedges but also recognizes changes in value of the LNG contracts being risk managed. The impacts of FVAEs relative to management’s internal measure of performance are provided on page 338. • Net impairment charges of $4.8 billion principally as a result of expected portfolio changes in our oil production & operations segment, the annual review of price assumptions used for investment appraisal and value-in-use impairment testing and the annual review of discount rates used for impairment tests; partially offset by • A non-taxable gain of $1.9 billion arising from the contribution of bp's Angolan business to Azule Energy. See Financial statements – Note 4 for more information on impairments, and pages 337 and 338 for more information on adjusting items and FVAEs. Taxation The charge for corporate income taxes was $7,869 million in 2023 compared with $16,762 million in 2022. The decrease mainly reflects lower taxable profits. The effective tax rate (ETR) on the profit before taxation for the year in 2023 was 33%, compared with 109% in 2022. The ETR on the profit before taxation for the year in 2023 was impacted by fair value accounting effect gains and other adjusting items. The ETR on the profit before taxation for the year in 2022 was impacted by the pre-tax charges relating to bp’s decision to exit its shareholding in Rosneft, and the UK Energy Profits Levy. Excluding inventory holding impacts and adjusting items, the underlying ETR in 2023 was 39% compared with 34% in 2022. The underlying ETR in 2023 is higher due to changes in the geographical mix of profits and the increased impact of the UK Energy Profits Levy. The underlying ETR for 2024 is expected to be around 40% but is sensitive to the impact that volatility in the current price environment may have on the geographical mix of the group’s profits and losses. Underlying ETR is a non-IFRS measure. A reconciliation to IFRS information is provided on page 382. Outlook for 2024 2024 guidance • bp expects both reported and underlying upstream production to be slightly higher compared with 2023. Within this, bp expects underlying production from oil production & operations to be higher and production from gas & low carbon energy to be lower. • In its customers business, bp expects continued growth from convenience, including a full-year contribution from TravelCenters of America, a stronger contribution from Castrol underpinned by volume growth in focus markets, and continued margin growth from bp pulse driven by higher energy sold. In addition, bp expects fuel margins to remain sensitive to the cost of supply. • In products, bp expects a lower level of industry refining margins, with realized margins impacted by narrower North American heavy crude oil differentials. bp expects refinery turnaround activity to have a similar impact on both throughput and financial performance compared to 2023, with phasing of activity in 2024 heavily weighted towards the second half. • bp expects the other businesses & corporate underlying annual charge to be around $1.0 billion for 2024. The charge may vary from quarter to quarter.
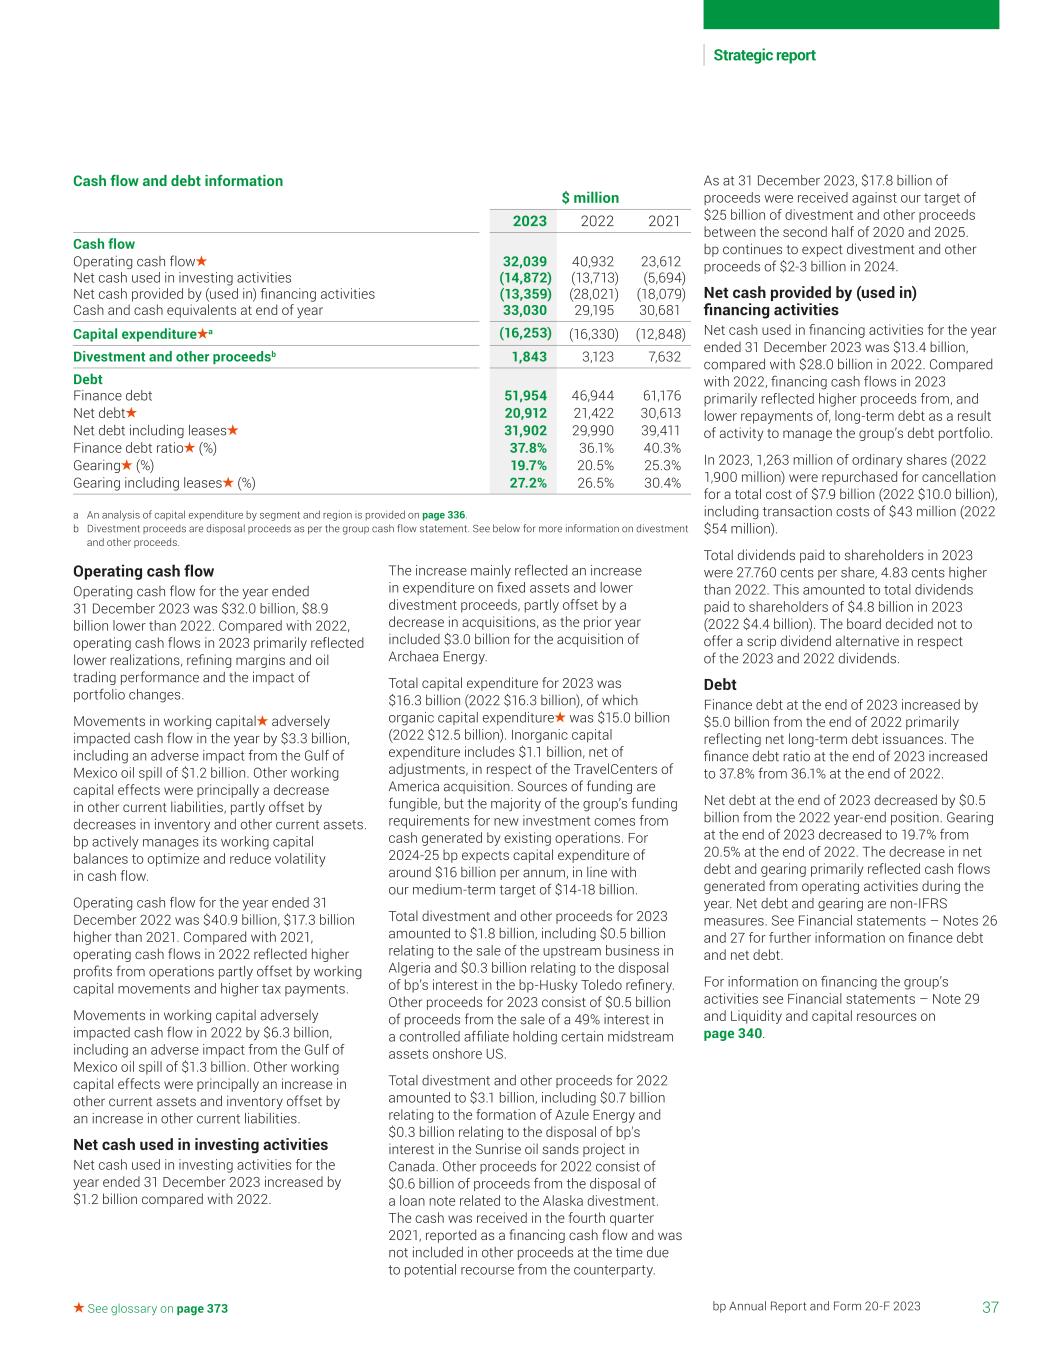
37bp Annual Report and Form 20-F 2023 Strategic report See glossary on page 373 Operating cash flow Operating cash flow for the year ended 31 December 2023 was $32.0 billion, $8.9 billion lower than 2022. Compared with 2022, operating cash flows in 2023 primarily reflected lower realizations, refining margins and oil trading performance and the impact of portfolio changes. Movements in working capital adversely impacted cash flow in the year by $3.3 billion, including an adverse impact from the Gulf of Mexico oil spill of $1.2 billion. Other working capital effects were principally a decrease in other current liabilities, partly offset by decreases in inventory and other current assets. bp actively manages its working capital balances to optimize and reduce volatility in cash flow. Operating cash flow for the year ended 31 December 2022 was $40.9 billion, $17.3 billion higher than 2021. Compared with 2021, operating cash flows in 2022 reflected higher profits from operations partly offset by working capital movements and higher tax payments. Movements in working capital adversely impacted cash flow in 2022 by $6.3 billion, including an adverse impact from the Gulf of Mexico oil spill of $1.3 billion. Other working capital effects were principally an increase in other current assets and inventory offset by an increase in other current liabilities. Net cash used in investing activities Net cash used in investing activities for the year ended 31 December 2023 increased by $1.2 billion compared with 2022. The increase mainly reflected an increase in expenditure on fixed assets and lower divestment proceeds, partly offset by a decrease in acquisitions, as the prior year included $3.0 billion for the acquisition of Archaea Energy. Total capital expenditure for 2023 was $16.3 billion (2022 $16.3 billion), of which organic capital expenditure was $15.0 billion (2022 $12.5 billion). Inorganic capital expenditure includes $1.1 billion, net of adjustments, in respect of the TravelCenters of America acquisition. Sources of funding are fungible, but the majority of the group’s funding requirements for new investment comes from cash generated by existing operations. For 2024-25 bp expects capital expenditure of around $16 billion per annum, in line with our medium-term target of $14-18 billion. Total divestment and other proceeds for 2023 amounted to $1.8 billion, including $0.5 billion relating to the sale of the upstream business in Algeria and $0.3 billion relating to the disposal of bp’s interest in the bp-Husky Toledo refinery. Other proceeds for 2023 consist of $0.5 billion of proceeds from the sale of a 49% interest in a controlled affiliate holding certain midstream assets onshore US. Total divestment and other proceeds for 2022 amounted to $3.1 billion, including $0.7 billion relating to the formation of Azule Energy and $0.3 billion relating to the disposal of bp's interest in the Sunrise oil sands project in Canada. Other proceeds for 2022 consist of $0.6 billion of proceeds from the disposal of a loan note related to the Alaska divestment. The cash was received in the fourth quarter 2021, reported as a financing cash flow and was not included in other proceeds at the time due to potential recourse from the counterparty. As at 31 December 2023, $17.8 billion of proceeds were received against our target of $25 billion of divestment and other proceeds between the second half of 2020 and 2025. bp continues to expect divestment and other proceeds of $2-3 billion in 2024. Net cash provided by (used in) financing activities Net cash used in financing activities for the year ended 31 December 2023 was $13.4 billion, compared with $28.0 billion in 2022. Compared with 2022, financing cash flows in 2023 primarily reflected higher proceeds from, and lower repayments of, long-term debt as a result of activity to manage the group’s debt portfolio. In 2023, 1,263 million of ordinary shares (2022 1,900 million) were repurchased for cancellation for a total cost of $7.9 billion (2022 $10.0 billion), including transaction costs of $43 million (2022 $54 million). Total dividends paid to shareholders in 2023 were 27.760 cents per share, 4.83 cents higher than 2022. This amounted to total dividends paid to shareholders of $4.8 billion in 2023 (2022 $4.4 billion). The board decided not to offer a scrip dividend alternative in respect of the 2023 and 2022 dividends. Debt Finance debt at the end of 2023 increased by $5.0 billion from the end of 2022 primarily reflecting net long-term debt issuances. The finance debt ratio at the end of 2023 increased to 37.8% from 36.1% at the end of 2022. Net debt at the end of 2023 decreased by $0.5 billion from the 2022 year-end position. Gearing at the end of 2023 decreased to 19.7% from 20.5% at the end of 2022. The decrease in net debt and gearing primarily reflected cash flows generated from operating activities during the year. Net debt and gearing are non-IFRS measures. See Financial statements – Notes 26 and 27 for further information on finance debt and net debt. For information on financing the group’s activities see Financial statements – Note 29 and Liquidity and capital resources on page 340. Cash flow and debt information $ million 2023 2022 2021 Cash flow Operating cash flow 32,039 40,932 23,612 Net cash used in investing activities (14,872) (13,713) (5,694) Net cash provided by (used in) financing activities (13,359) (28,021) (18,079) Cash and cash equivalents at end of year 33,030 29,195 30,681 Capital expenditure a (16,253) (16,330) (12,848) Divestment and other proceedsb 1,843 3,123 7,632 Debt Finance debt 51,954 46,944 61,176 Net debt 20,912 21,422 30,613 Net debt including leases 31,902 29,990 39,411 Finance debt ratio (%) 37.8% 36.1% 40.3% Gearing (%) 19.7% 20.5% 25.3% Gearing including leases (%) 27.2% 26.5% 30.4% a An analysis of capital expenditure by segment and region is provided on page 336. b Divestment proceeds are disposal proceeds as per the group cash flow statement. See below for more information on divestment and other proceeds.
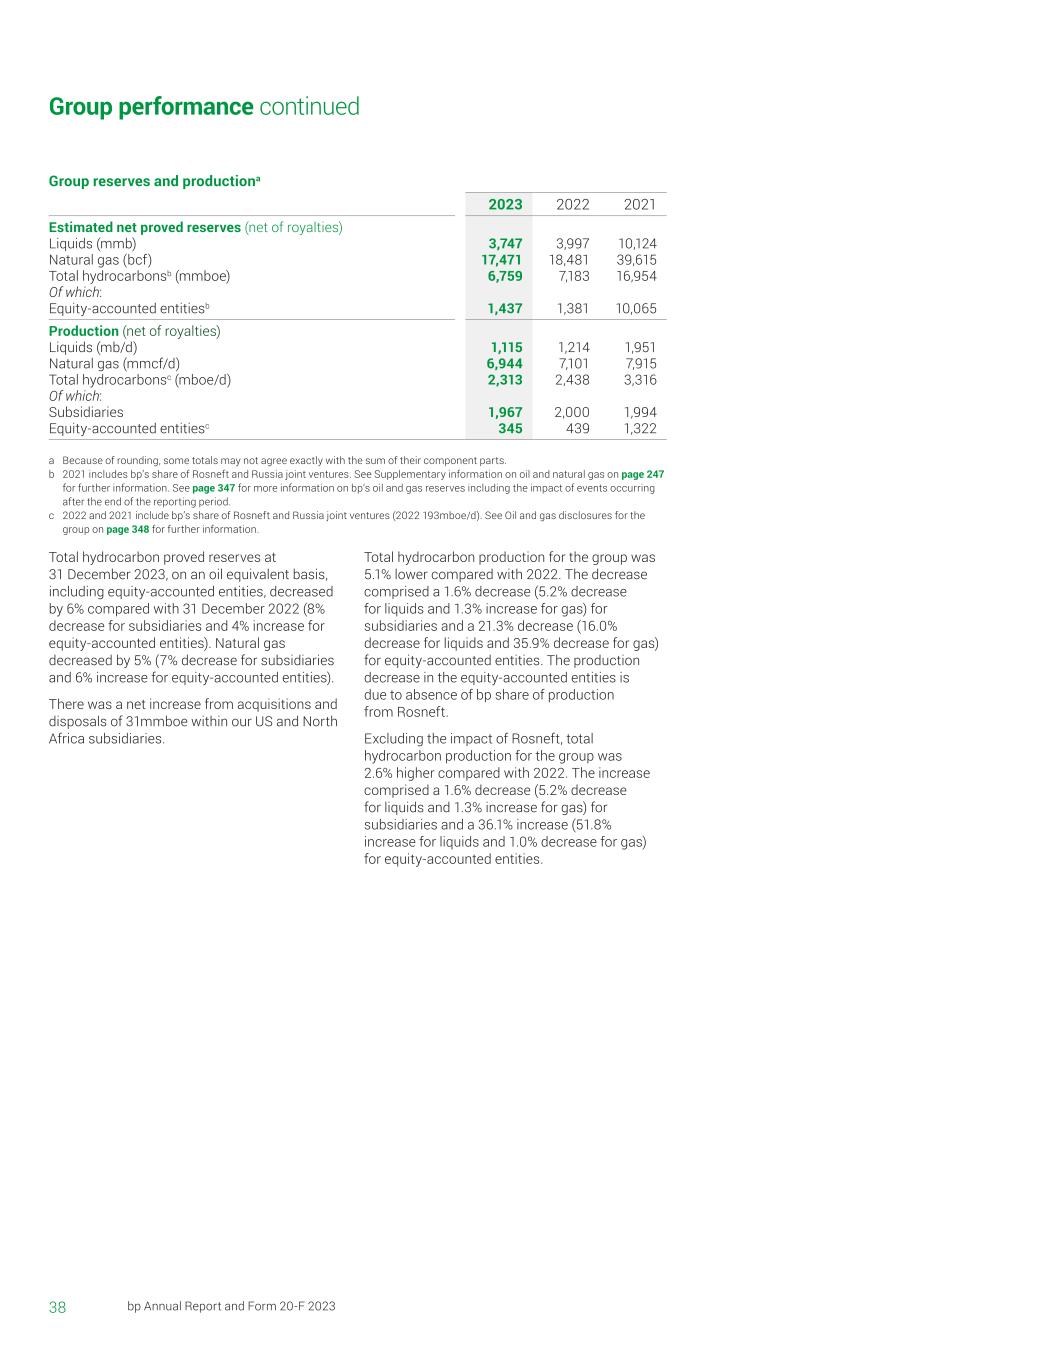
38 bp Annual Report and Form 20-F 2023 Group performance continued Total hydrocarbon proved reserves at 31 December 2023, on an oil equivalent basis, including equity-accounted entities, decreased by 6% compared with 31 December 2022 (8% decrease for subsidiaries and 4% increase for equity-accounted entities). Natural gas decreased by 5% (7% decrease for subsidiaries and 6% increase for equity-accounted entities). There was a net increase from acquisitions and disposals of 31mmboe within our US and North Africa subsidiaries. Total hydrocarbon production for the group was 5.1% lower compared with 2022. The decrease comprised a 1.6% decrease (5.2% decrease for liquids and 1.3% increase for gas) for subsidiaries and a 21.3% decrease (16.0% decrease for liquids and 35.9% decrease for gas) for equity-accounted entities. The production decrease in the equity-accounted entities is due to absence of bp share of production from Rosneft. Excluding the impact of Rosneft, total hydrocarbon production for the group was 2.6% higher compared with 2022. The increase comprised a 1.6% decrease (5.2% decrease for liquids and 1.3% increase for gas) for subsidiaries and a 36.1% increase (51.8% increase for liquids and 1.0% decrease for gas) for equity-accounted entities. Group reserves and productiona 2023 2022 2021 Estimated net proved reserves (net of royalties) Liquids (mmb) 3,747 3,997 10,124 Natural gas (bcf) 17,471 18,481 39,615 Total hydrocarbonsb (mmboe) 6,759 7,183 16,954 Of which: Equity-accounted entitiesb 1,437 1,381 10,065 Production (net of royalties) Liquids (mb/d) 1,115 1,214 1,951 Natural gas (mmcf/d) 6,944 7,101 7,915 Total hydrocarbonsc (mboe/d) 2,313 2,438 3,316 Of which: Subsidiaries 1,967 2,000 1,994 Equity-accounted entitiesc 345 439 1,322 a Because of rounding, some totals may not agree exactly with the sum of their component parts. b 2021 includes bp’s share of Rosneft and Russia joint ventures. See Supplementary information on oil and natural gas on page 247 for further information. See page 347 for more information on bp’s oil and gas reserves including the impact of events occurring after the end of the reporting period. c 2022 and 2021 include bp’s share of Rosneft and Russia joint ventures (2022 193mboe/d). See Oil and gas disclosures for the group on page 348 for further information.
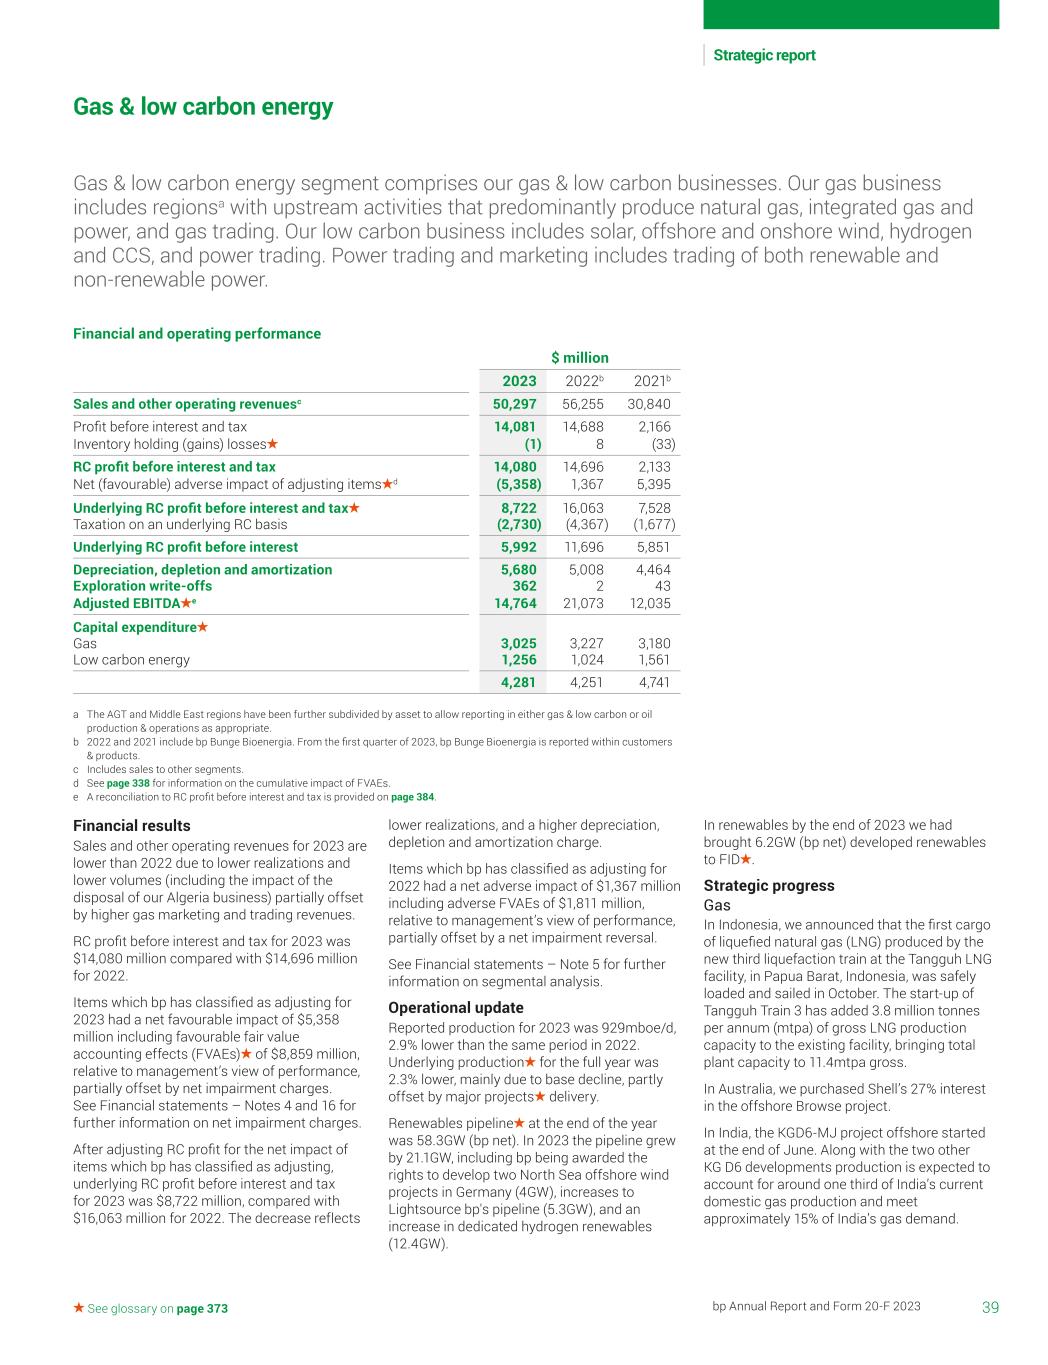
39bp Annual Report and Form 20-F 2023 Strategic report See glossary on page 373 Gas & low carbon energy Gas & low carbon energy segment comprises our gas & low carbon businesses. Our gas business includes regionsa with upstream activities that predominantly produce natural gas, integrated gas and power, and gas trading. Our low carbon business includes solar, offshore and onshore wind, hydrogen and CCS, and power trading. Power trading and marketing includes trading of both renewable and non-renewable power. Financial results Sales and other operating revenues for 2023 are lower than 2022 due to lower realizations and lower volumes (including the impact of the disposal of our Algeria business) partially offset by higher gas marketing and trading revenues. RC profit before interest and tax for 2023 was $14,080 million compared with $14,696 million for 2022. Items which bp has classified as adjusting for 2023 had a net favourable impact of $5,358 million including favourable fair value accounting effects (FVAEs) of $8,859 million, relative to management’s view of performance, partially offset by net impairment charges. See Financial statements – Notes 4 and 16 for further information on net impairment charges. After adjusting RC profit for the net impact of items which bp has classified as adjusting, underlying RC profit before interest and tax for 2023 was $8,722 million, compared with $16,063 million for 2022. The decrease reflects lower realizations, and a higher depreciation, depletion and amortization charge. Items which bp has classified as adjusting for 2022 had a net adverse impact of $1,367 million including adverse FVAEs of $1,811 million, relative to management’s view of performance, partially offset by a net impairment reversal. See Financial statements – Note 5 for further information on segmental analysis. Operational update Reported production for 2023 was 929mboe/d, 2.9% lower than the same period in 2022. Underlying production for the full year was 2.3% lower, mainly due to base decline, partly offset by major projects delivery. Renewables pipeline at the end of the year was 58.3GW (bp net). In 2023 the pipeline grew by 21.1GW, including bp being awarded the rights to develop two North Sea offshore wind projects in Germany (4GW), increases to Lightsource bp's pipeline (5.3GW), and an increase in dedicated hydrogen renewables (12.4GW). In renewables by the end of 2023 we had brought 6.2GW (bp net) developed renewables to FID . Strategic progress Gas In Indonesia, we announced that the first cargo of liquefied natural gas (LNG) produced by the new third liquefaction train at the Tangguh LNG facility, in Papua Barat, Indonesia, was safely loaded and sailed in October. The start-up of Tangguh Train 3 has added 3.8 million tonnes per annum (mtpa) of gross LNG production capacity to the existing facility, bringing total plant capacity to 11.4mtpa gross. In Australia, we purchased Shell’s 27% interest in the offshore Browse project. In India, the KGD6-MJ project offshore started at the end of June. Along with the two other KG D6 developments production is expected to account for around one third of India’s current domestic gas production and meet approximately 15% of India’s gas demand. Financial and operating performance $ million 2023 2022b 2021b Sales and other operating revenuesc 50,297 56,255 30,840 Profit before interest and tax 14,081 14,688 2,166 Inventory holding (gains) losses (1) 8 (33) RC profit before interest and tax 14,080 14,696 2,133 Net (favourable) adverse impact of adjusting items d (5,358) 1,367 5,395 Underlying RC profit before interest and tax 8,722 16,063 7,528 Taxation on an underlying RC basis (2,730) (4,367) (1,677) Underlying RC profit before interest 5,992 11,696 5,851 Depreciation, depletion and amortization 5,680 5,008 4,464 Exploration write-offs 362 2 43 Adjusted EBITDA e 14,764 21,073 12,035 Capital expenditure Gas 3,025 3,227 3,180 Low carbon energy 1,256 1,024 1,561 4,281 4,251 4,741 a The AGT and Middle East regions have been further subdivided by asset to allow reporting in either gas & low carbon or oil production & operations as appropriate. b 2022 and 2021 include bp Bunge Bioenergia. From the first quarter of 2023, bp Bunge Bioenergia is reported within customers & products. c Includes sales to other segments. d See page 338 for information on the cumulative impact of FVAEs. e A reconciliation to RC profit before interest and tax is provided on page 384.
40 bp Annual Report and Form 20-F 2023 Gas & low carbon energy continued In Trinidad, we restructured the ownership and commercial framework of Atlantic LNG joint venture with its partners Shell and the National Gas Company of Trinidad & Tobago. The restructuring helps provide the certainty required for sanctioning the next wave of upstream gas projects and secures the long-term LNG equity offtake for shareholders, including bp. In addition, we and our partner Shell, were awarded three deepwater exploration blocks off Trinidad’s east coast. In Senegal, we have exited the Cayar Offshore Profond production sharing contract and transferred operatorship of Yakaar-Teranga gas resource to Kosmos Energy. In March 2023 we confirmed that, together with ADNOC, we made a non-binding offer to take NewMed Energy private through an acquisition of the free float and a partial acquisition of Delek’s stake, which would result in bp and ADNOC holding 50% of NewMed Energy. On 14 February 2024 bp announced the formation of a new joint venture in Egypt (bp 51%, ADNOC 49%) under which, subject to regulatory approvals, bp will contribute its interests in three non-operated development concessions as well as exploration agreements in Egypt, and ADNOC will make a proportionate cash contribution. LNG portfolio • In July bp and OMV announced the signing of a long-term agreement to supply up to 1mtpa of LNG for 10 years from 2026. This builds on bp in May agreeing 2bcm per year of regasification capacity for 20 years at the Gate terminal in Rotterdam. • In September we announced our third long-term LNG offtake contract from Woodfibre’s British Columbia LNG facility with firm offtake totalling 1.95mtpa and any additional production on a flexible offtake basis. • In November we signed a nine-year sales and purchase agreement (SPA) with state-owned Oman LNG to buy one million metric tonnes per annum of LNG starting 2026. See Oil and gas disclosures for the group on page 342 for more information on oil and gas operations in the regions. Low carbon energy Hydrogen and carbon capture and storage In hydrogen and carbon capture and storage (CCS), we progressed an additional 1.1mtpa net to bp of hydrogen opportunities for a total of 2.9mtpa to project pipeline (concept development stage). Our progress in hydrogen is focused on growing scale in key regionally integrated markets, such as Europe and the US, using our refineries as demand anchors. As hydrogen markets develop, we aim to create a portfolio of globally advantaged supply hubs. • In February 2023 we launched plans for a low carbon green hydrogen cluster called HyVal, at our Castellón refinery in the Valencia region of Spain. • In the UK, in March 2023 we announced that two bp-led lower carbon projects, Net Zero Teesside Power and H2Teesside, part of the East Coast Cluster, were selected to proceed to negotiations for government support. • In April we signed an agreement with Harbour Energy to take 40% stake in the Viking CCS project in the North Sea. • In October in the US, the Midwest Alliance for Clean Hydrogen (MachH2), of which we are a member, was selected by the US Department of Energy’s Office of Clean Energy. • Demonstrations to develop a Regional Clean Hydrogen Hub. Under the proposals, it would include blue hydrogen production near our Whiting refinery. Renewables and power Offshore wind In offshore wind, in 2023 we continued to build our position with access to the German and Korean markets in addition to the UK and US. These positions in offshore wind will enable us to leverage integration opportunities with green hydrogen, EV mobility and power trading as we build the business. • In Scotland, we announced a successful bid in the Innovation and Targeted Oil and Gas (INTOG) Scottish offshore wind leasing round, bp’s first step in floating offshore wind. • In Korea, we announced the formation of a joint venture with Deep Wind Offshore to develop offshore wind opportunities in South Korea, which includes four projects across the Korean peninsula with a potential generating capacity of up to 6GW. • In July we were awarded the rights to develop two North Sea offshore wind projects in Germany. The sites are located 130km and 150km offshore, in water depths of about 40m, and have a total potential generating capacity of 4GW, raising our global offshore wind pipeline to 9.3GW. • In January 2024, we signed an agreement with Equinor under which we will restructure our US offshore wind project investments. Subject to approvals, we will be able to assume full ownership of the Beacon projects, and Equinor will assume full ownership of the Empire projects. bp plans to independently pursue future US offshore wind opportunities. Onshore renewables In solar, we announced we have agreed to acquire the remaining 50.03% of Lightsource bp (LSbp). LSbp is one of the world’s leading developers and operators of utility-scale solar and battery storage assets, with 1,200 employees in 19 countries. LSbp has a hopper of 39GW of renewables pipeline and an additional 25GW of early stage opportunities. The transaction is expected to close in the second half of 2024, subject to regulatory approvals. In support of hydrogen projects, the onshore renewables pipeline has increased by 12.4GW. Power trading In January 2024 we announced we have agreed to acquire GETEC ENERGIE GmbH, a leading independent supplier of energy to commercial and industrial customers in Germany, subject to regulatory approvals.
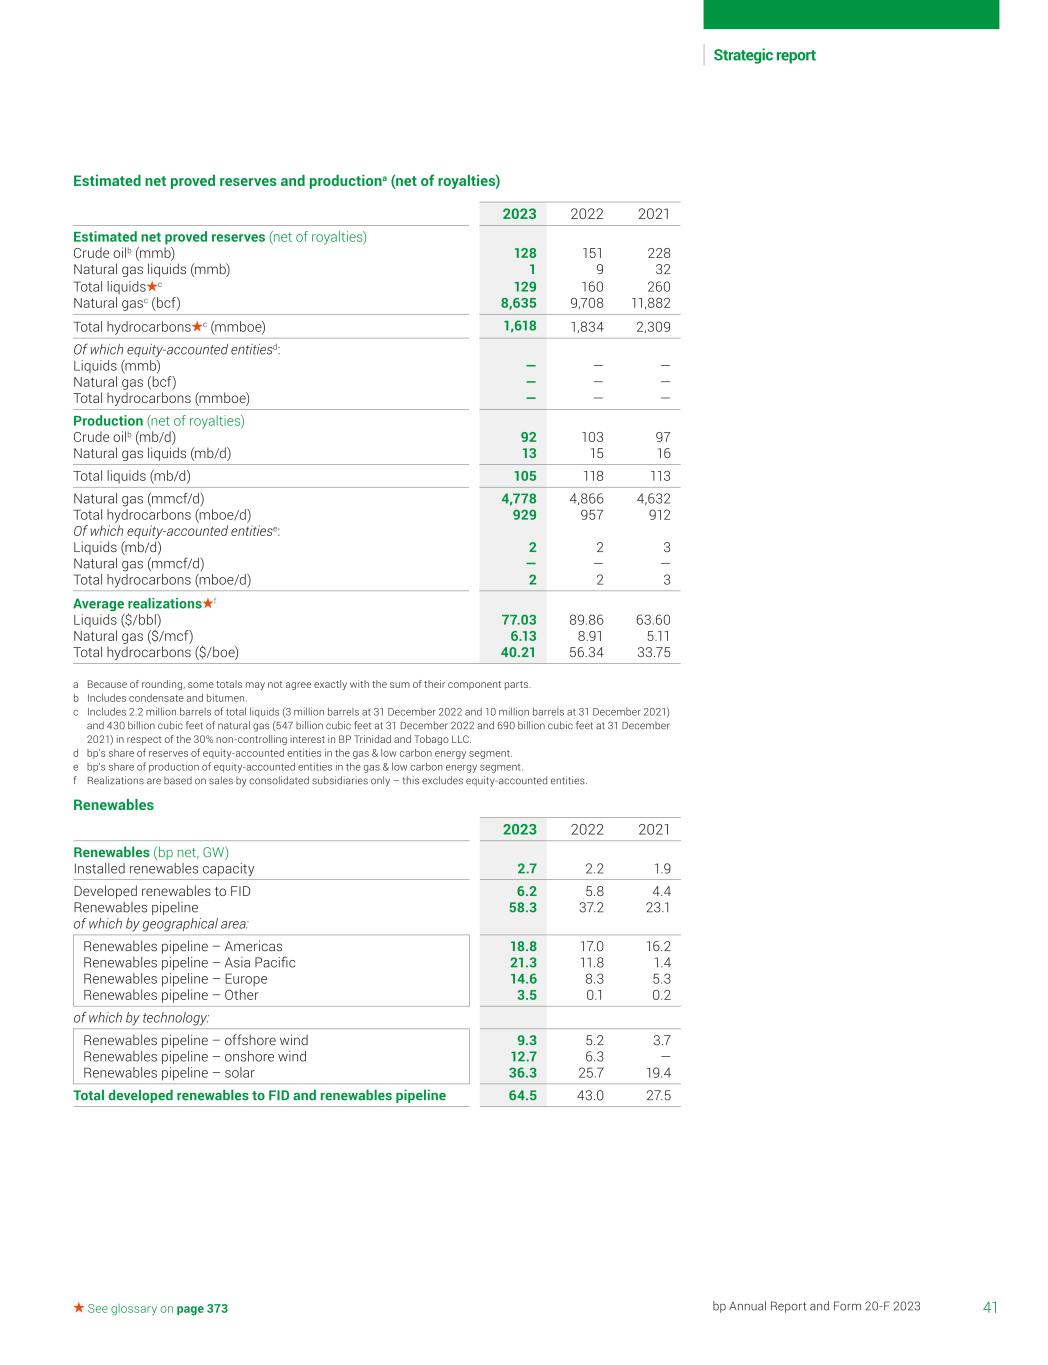
41bp Annual Report and Form 20-F 2023 Strategic report See glossary on page 373 Estimated net proved reserves and productiona (net of royalties) 2023 2022 2021 Estimated net proved reserves (net of royalties) Crude oilb (mmb) 128 151 228 Natural gas liquids (mmb) 1 9 32 Total liquids c 129 160 260 Natural gasc (bcf) 8,635 9,708 11,882 Total hydrocarbons c (mmboe) 1,618 1,834 2,309 Of which equity-accounted entitiesd: Liquids (mmb) — — — Natural gas (bcf) — — — Total hydrocarbons (mmboe) — — — Production (net of royalties) Crude oilb (mb/d) 92 103 97 Natural gas liquids (mb/d) 13 15 16 Total liquids (mb/d) 105 118 113 Natural gas (mmcf/d) 4,778 4,866 4,632 Total hydrocarbons (mboe/d) 929 957 912 Of which equity-accounted entitiese: Liquids (mb/d) 2 2 3 Natural gas (mmcf/d) — — — Total hydrocarbons (mboe/d) 2 2 3 Average realizations f Liquids ($/bbl) 77.03 89.86 63.60 Natural gas ($/mcf) 6.13 8.91 5.11 Total hydrocarbons ($/boe) 40.21 56.34 33.75 a Because of rounding, some totals may not agree exactly with the sum of their component parts. b Includes condensate and bitumen. c Includes 2.2 million barrels of total liquids (3 million barrels at 31 December 2022 and 10 million barrels at 31 December 2021) and 430 billion cubic feet of natural gas (547 billion cubic feet at 31 December 2022 and 690 billion cubic feet at 31 December 2021) in respect of the 30% non-controlling interest in BP Trinidad and Tobago LLC. d bp’s share of reserves of equity-accounted entities in the gas & low carbon energy segment. e bp’s share of production of equity-accounted entities in the gas & low carbon energy segment. f Realizations are based on sales by consolidated subsidiaries only – this excludes equity-accounted entities. Renewables 2023 2022 2021 Renewables (bp net, GW) Installed renewables capacity 2.7 2.2 1.9 Developed renewables to FID 6.2 5.8 4.4 Renewables pipeline 58.3 37.2 23.1 of which by geographical area: Renewables pipeline – Americas 18.8 17.0 16.2 Renewables pipeline – Asia Pacific 21.3 11.8 1.4 Renewables pipeline – Europe 14.6 8.3 5.3 Renewables pipeline – Other 3.5 0.1 0.2 of which by technology: Renewables pipeline – offshore wind 9.3 5.2 3.7 Renewables pipeline – onshore wind 12.7 6.3 — Renewables pipeline – solar 36.3 25.7 19.4 Total developed renewables to FID and renewables pipeline 64.5 43.0 27.5
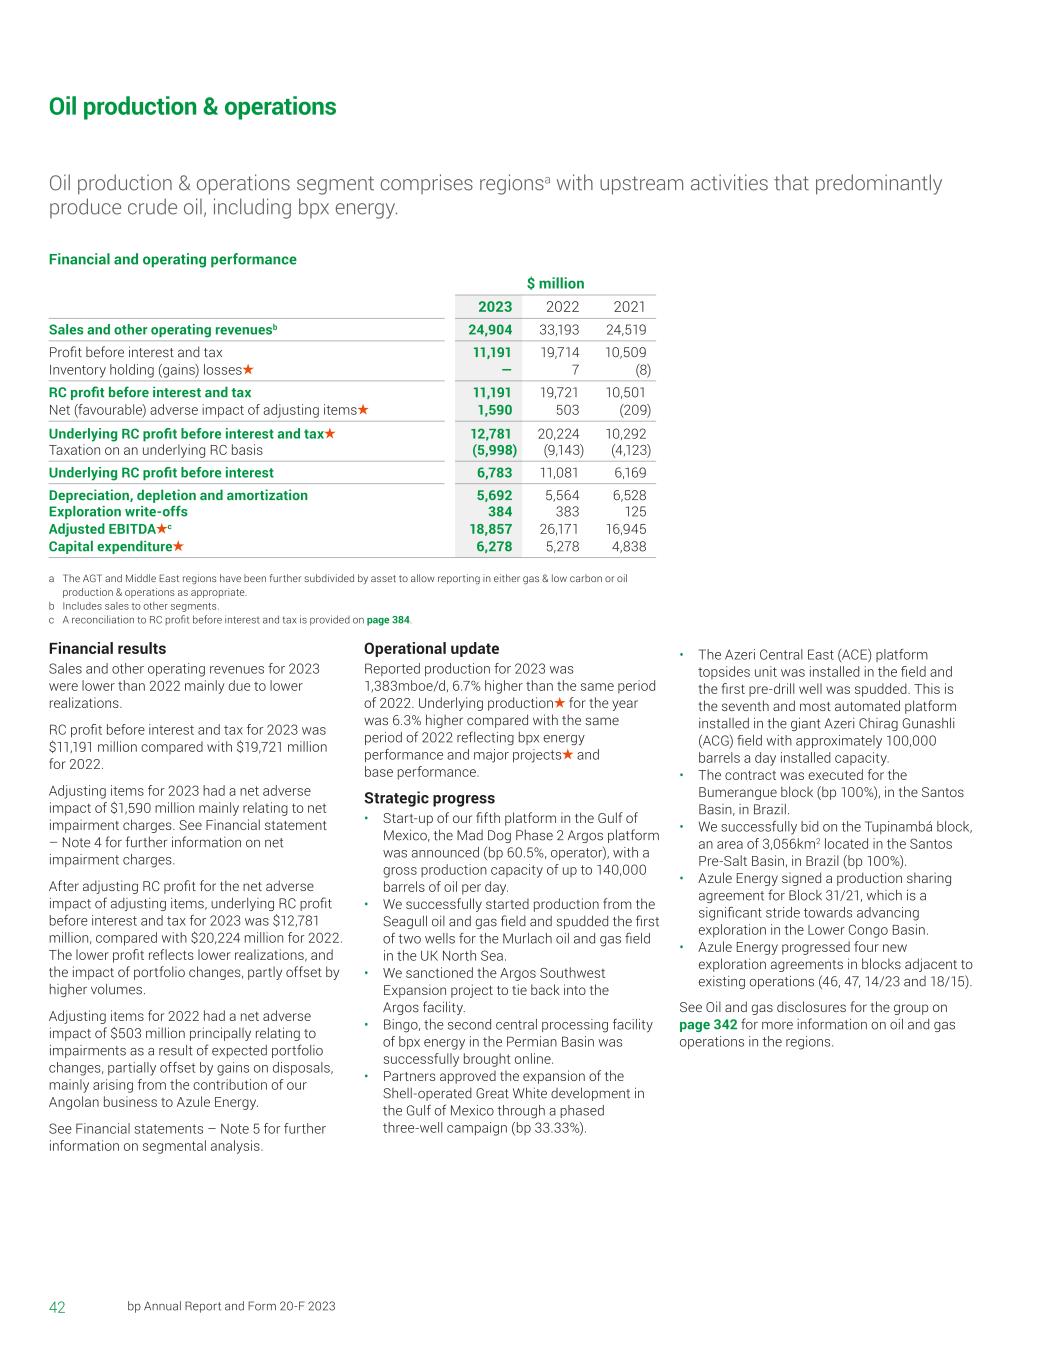
42 bp Annual Report and Form 20-F 2023 Oil production & operations Oil production & operations segment comprises regionsa with upstream activities that predominantly produce crude oil, including bpx energy. Financial results Sales and other operating revenues for 2023 were lower than 2022 mainly due to lower realizations. RC profit before interest and tax for 2023 was $11,191 million compared with $19,721 million for 2022. Adjusting items for 2023 had a net adverse impact of $1,590 million mainly relating to net impairment charges. See Financial statement – Note 4 for further information on net impairment charges. After adjusting RC profit for the net adverse impact of adjusting items, underlying RC profit before interest and tax for 2023 was $12,781 million, compared with $20,224 million for 2022. The lower profit reflects lower realizations, and the impact of portfolio changes, partly offset by higher volumes. Adjusting items for 2022 had a net adverse impact of $503 million principally relating to impairments as a result of expected portfolio changes, partially offset by gains on disposals, mainly arising from the contribution of our Angolan business to Azule Energy. See Financial statements – Note 5 for further information on segmental analysis. Operational update Reported production for 2023 was 1,383mboe/d, 6.7% higher than the same period of 2022. Underlying production for the year was 6.3% higher compared with the same period of 2022 reflecting bpx energy performance and major projects and base performance. Strategic progress • Start-up of our fifth platform in the Gulf of Mexico, the Mad Dog Phase 2 Argos platform was announced (bp 60.5%, operator), with a gross production capacity of up to 140,000 barrels of oil per day. • We successfully started production from the Seagull oil and gas field and spudded the first of two wells for the Murlach oil and gas field in the UK North Sea. • We sanctioned the Argos Southwest Expansion project to tie back into the Argos facility. • Bingo, the second central processing facility of bpx energy in the Permian Basin was successfully brought online. • Partners approved the expansion of the Shell-operated Great White development in the Gulf of Mexico through a phased three-well campaign (bp 33.33%). • The Azeri Central East (ACE) platform topsides unit was installed in the field and the first pre-drill well was spudded. This is the seventh and most automated platform installed in the giant Azeri Chirag Gunashli (ACG) field with approximately 100,000 barrels a day installed capacity. • The contract was executed for the Bumerangue block (bp 100%), in the Santos Basin, in Brazil. • We successfully bid on the Tupinambá block, an area of 3,056km2 located in the Santos Pre-Salt Basin, in Brazil (bp 100%). • Azule Energy signed a production sharing agreement for Block 31/21, which is a significant stride towards advancing exploration in the Lower Congo Basin. • Azule Energy progressed four new exploration agreements in blocks adjacent to existing operations (46, 47, 14/23 and 18/15). See Oil and gas disclosures for the group on page 342 for more information on oil and gas operations in the regions. Financial and operating performance $ million 2023 2022 2021 Sales and other operating revenuesb 24,904 33,193 24,519 Profit before interest and tax 11,191 19,714 10,509 Inventory holding (gains) losses — 7 (8) RC profit before interest and tax 11,191 19,721 10,501 Net (favourable) adverse impact of adjusting items 1,590 503 (209) Underlying RC profit before interest and tax 12,781 20,224 10,292 Taxation on an underlying RC basis (5,998) (9,143) (4,123) Underlying RC profit before interest 6,783 11,081 6,169 Depreciation, depletion and amortization 5,692 5,564 6,528 Exploration write-offs 384 383 125 Adjusted EBITDA c 18,857 26,171 16,945 Capital expenditure 6,278 5,278 4,838 a The AGT and Middle East regions have been further subdivided by asset to allow reporting in either gas & low carbon or oil production & operations as appropriate. b Includes sales to other segments. c A reconciliation to RC profit before interest and tax is provided on page 384.
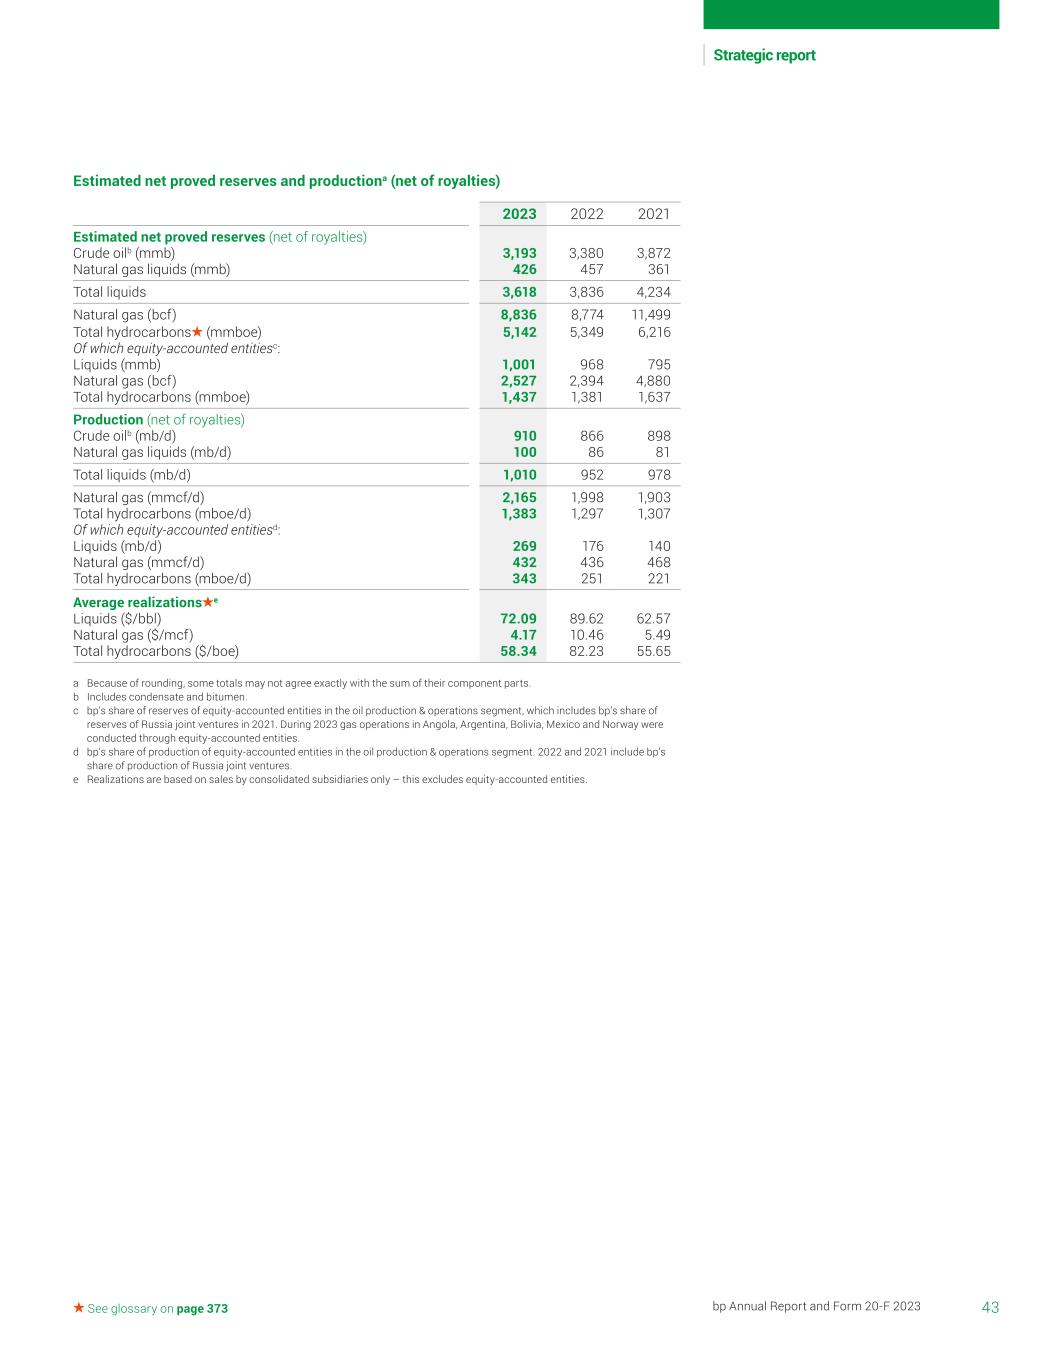
43bp Annual Report and Form 20-F 2023 Strategic report See glossary on page 373 Estimated net proved reserves and productiona (net of royalties) 2023 2022 2021 Estimated net proved reserves (net of royalties) Crude oilb (mmb) 3,193 3,380 3,872 Natural gas liquids (mmb) 426 457 361 Total liquids 3,618 3,836 4,234 Natural gas (bcf) 8,836 8,774 11,499 Total hydrocarbons (mmboe) 5,142 5,349 6,216 Of which equity-accounted entitiesc: Liquids (mmb) 1,001 968 795 Natural gas (bcf) 2,527 2,394 4,880 Total hydrocarbons (mmboe) 1,437 1,381 1,637 Production (net of royalties) Crude oilb (mb/d) 910 866 898 Natural gas liquids (mb/d) 100 86 81 Total liquids (mb/d) 1,010 952 978 Natural gas (mmcf/d) 2,165 1,998 1,903 Total hydrocarbons (mboe/d) 1,383 1,297 1,307 Of which equity-accounted entitiesd: Liquids (mb/d) 269 176 140 Natural gas (mmcf/d) 432 436 468 Total hydrocarbons (mboe/d) 343 251 221 Average realizations e Liquids ($/bbl) 72.09 89.62 62.57 Natural gas ($/mcf) 4.17 10.46 5.49 Total hydrocarbons ($/boe) 58.34 82.23 55.65 a Because of rounding, some totals may not agree exactly with the sum of their component parts. b Includes condensate and bitumen. c bp’s share of reserves of equity-accounted entities in the oil production & operations segment, which includes bp’s share of reserves of Russia joint ventures in 2021. During 2023 gas operations in Angola, Argentina, Bolivia, Mexico and Norway were conducted through equity-accounted entities. d bp’s share of production of equity-accounted entities in the oil production & operations segment. 2022 and 2021 include bp’s share of production of Russia joint ventures. e Realizations are based on sales by consolidated subsidiaries only – this excludes equity-accounted entities.
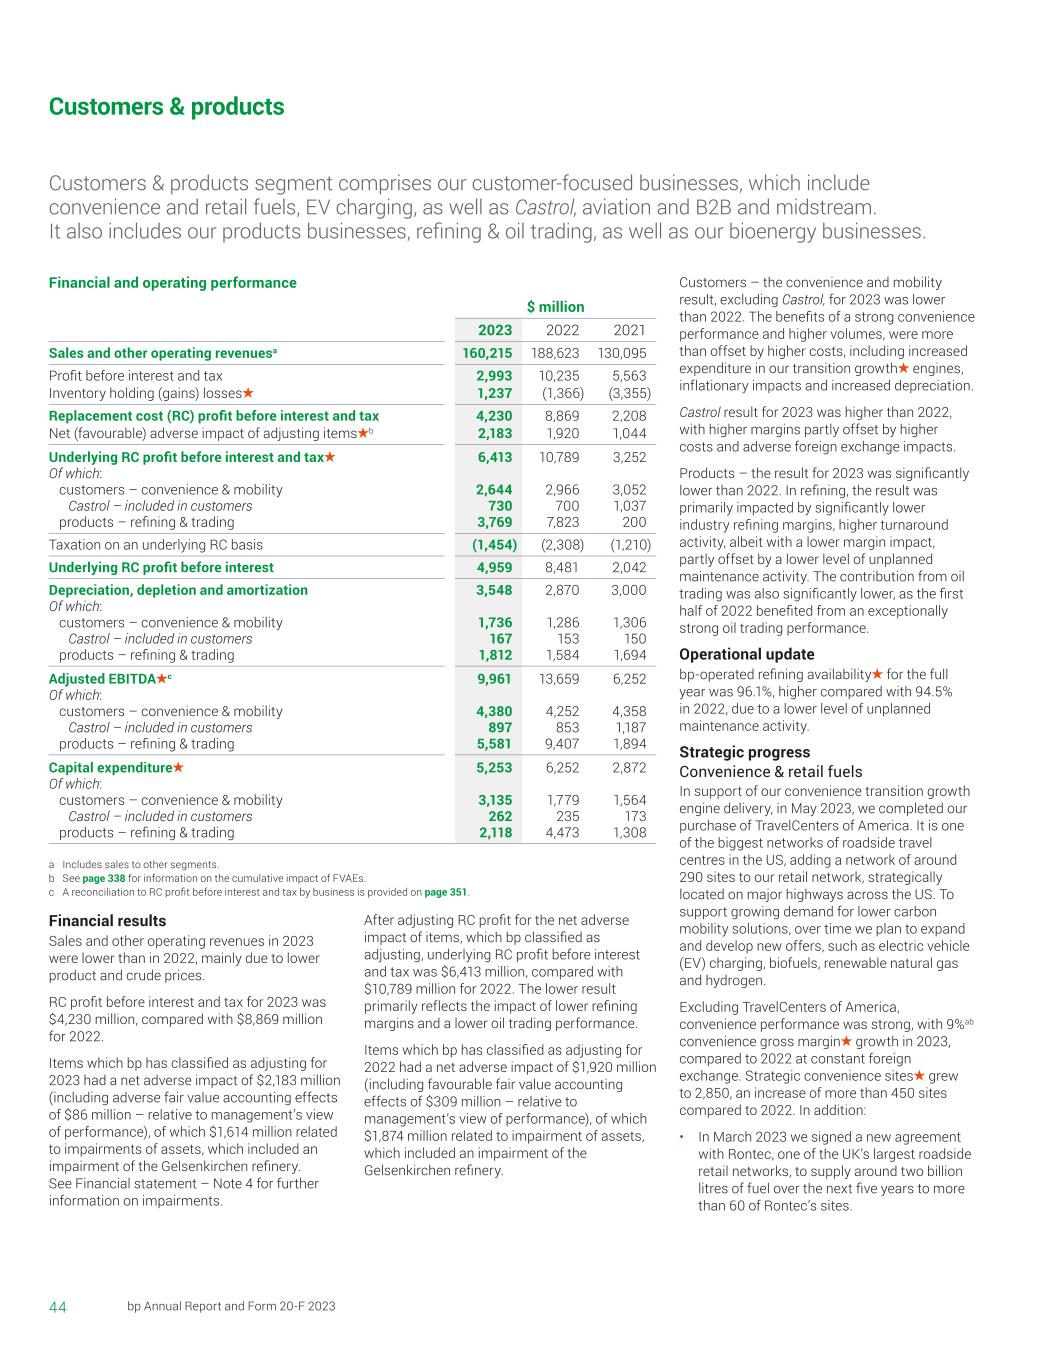
44 bp Annual Report and Form 20-F 2023 Customers & products Customers & products segment comprises our customer-focused businesses, which include convenience and retail fuels, EV charging, as well as Castrol, aviation and B2B and midstream. It also includes our products businesses, refining & oil trading, as well as our bioenergy businesses. Financial results Sales and other operating revenues in 2023 were lower than in 2022, mainly due to lower product and crude prices. RC profit before interest and tax for 2023 was $4,230 million, compared with $8,869 million for 2022. Items which bp has classified as adjusting for 2023 had a net adverse impact of $2,183 million (including adverse fair value accounting effects of $86 million – relative to management’s view of performance), of which $1,614 million related to impairments of assets, which included an impairment of the Gelsenkirchen refinery. See Financial statement – Note 4 for further information on impairments. After adjusting RC profit for the net adverse impact of items, which bp classified as adjusting, underlying RC profit before interest and tax was $6,413 million, compared with $10,789 million for 2022. The lower result primarily reflects the impact of lower refining margins and a lower oil trading performance. Items which bp has classified as adjusting for 2022 had a net adverse impact of $1,920 million (including favourable fair value accounting effects of $309 million – relative to management’s view of performance), of which $1,874 million related to impairment of assets, which included an impairment of the Gelsenkirchen refinery. Customers – the convenience and mobility result, excluding Castrol, for 2023 was lower than 2022. The benefits of a strong convenience performance and higher volumes, were more than offset by higher costs, including increased expenditure in our transition growth engines, inflationary impacts and increased depreciation. Castrol result for 2023 was higher than 2022, with higher margins partly offset by higher costs and adverse foreign exchange impacts. Products – the result for 2023 was significantly lower than 2022. In refining, the result was primarily impacted by significantly lower industry refining margins, higher turnaround activity, albeit with a lower margin impact, partly offset by a lower level of unplanned maintenance activity. The contribution from oil trading was also significantly lower, as the first half of 2022 benefited from an exceptionally strong oil trading performance. Operational update bp-operated refining availability for the full year was 96.1%, higher compared with 94.5% in 2022, due to a lower level of unplanned maintenance activity. Strategic progress Convenience & retail fuels In support of our convenience transition growth engine delivery, in May 2023, we completed our purchase of TravelCenters of America. It is one of the biggest networks of roadside travel centres in the US, adding a network of around 290 sites to our retail network, strategically located on major highways across the US. To support growing demand for lower carbon mobility solutions, over time we plan to expand and develop new offers, such as electric vehicle (EV) charging, biofuels, renewable natural gas and hydrogen. Excluding TravelCenters of America, convenience performance was strong, with 9%ab convenience gross margin growth in 2023, compared to 2022 at constant foreign exchange. Strategic convenience sites grew to 2,850, an increase of more than 450 sites compared to 2022. In addition: • In March 2023 we signed a new agreement with Rontec, one of the UK’s largest roadside retail networks, to supply around two billion litres of fuel over the next five years to more than 60 of Rontec’s sites. Financial and operating performance $ million 2023 2022 2021 Sales and other operating revenuesa 160,215 188,623 130,095 Profit before interest and tax 2,993 10,235 5,563 Inventory holding (gains) losses 1,237 (1,366) (3,355) Replacement cost (RC) profit before interest and tax 4,230 8,869 2,208 Net (favourable) adverse impact of adjusting items b 2,183 1,920 1,044 Underlying RC profit before interest and tax 6,413 10,789 3,252 Of which: customers – convenience & mobility 2,644 2,966 3,052 Castrol – included in customers 730 700 1,037 products – refining & trading 3,769 7,823 200 Taxation on an underlying RC basis (1,454) (2,308) (1,210) Underlying RC profit before interest 4,959 8,481 2,042 Depreciation, depletion and amortization 3,548 2,870 3,000 Of which: customers – convenience & mobility 1,736 1,286 1,306 Castrol – included in customers 167 153 150 products – refining & trading 1,812 1,584 1,694 Adjusted EBITDA c 9,961 13,659 6,252 Of which: customers – convenience & mobility 4,380 4,252 4,358 Castrol – included in customers 897 853 1,187 products – refining & trading 5,581 9,407 1,894 Capital expenditure 5,253 6,252 2,872 Of which: customers – convenience & mobility 3,135 1,779 1,564 Castrol – included in customers 262 235 173 products – refining & trading 2,118 4,473 1,308 a Includes sales to other segments. b See page 338 for information on the cumulative impact of FVAEs. c A reconciliation to RC profit before interest and tax by business is provided on page 351.
45bp Annual Report and Form 20-F 2023 Strategic report See glossary on page 373 • In July bp and Lekkerland extended their successful partnership to deliver REWE To Go stores at Aral retail sites until 2028. This is our largest European convenience supply agreement and brings together Germany's largest forecourt brand with one of the country's leading convenience specialists in support of our convenience growth engine delivery. • In August we signed an agreement with Auchan to extend its successful strategic convenience partnership in Poland, with plans to add more than 100 EasyAuchan stores to its retail network by the end of 2025. • In September 2023, we strengthened our BPme Rewards loyalty scheme with the launch of loyalty pricing, giving customers exclusive discounts on retail store products at around 300 bp-owned retail sites across the UK. • In November we entered into an agreement to sell the Türkiye ground fuels business to Petrol Ofisi. This includes the group's interest in three joint venture terminals in Türkiye. Completion of the sale is subject to regulatory approvals. EV charging EV charging continues to show strong momentum. EV charge points installed and energy sold in the year grew by around 35% and 150% respectively, compared to 2022, with charge points now over 29,000. On 1 December bp and Iberdrola formed a joint venture to accelerate EV charging infrastructure roll-out in Spain and Portugal, with plans to invest up to €1 billion and install 5,000 fast EV charge points by 2025 and around 11,700 by 2030. In addition: • In March 2023 bp pulse announced a new global mobility agreement with Uber, which will see the companies work together to help accelerate Uber’s commitment to become a global zero-tailpipe emissions mobility platform by 2040. • In August we announced we had approved $500 million of investment in the US to begin building our EV network over the next two to three years. As part of this investment, in October 2023, we announced we had entered into an agreement with Tesla for the future purchase of $100 million of ultra-fast chargers. • In September bp pulse, The EV Network and NEC Group, launched the UK’s largest public EV charging hub at the NEC campus in Birmingham, UK. The new Gigahub at the NEC has capacity to charge up to 180 EVs simultaneously. • In January 2024 we continued to invest in fast-growing southern districts in China, and acquired 3,000 charge points through the bp Xiajou joint venture. Castrol Castrol continued to grow its independent branded workshops, adding around 4,500 workshops in 2023, compared to 2022, with workshops now over 34,000 in total. Castrol also strengthened its market leading position in advanced EV-fluids, as now three out of four of the world’s major vehicle manufacturers use Castrol ON products as part of their factory fillc. In addition: • In June Castrol signed a strategic co- operation protocol with Yiwu TNFia, one of the largest automobile service chains in East China, positioning Castrol to expand its share of products in Yiwu TNFia’s large and growing network of auto workshops. Castrol continued to invest in its technology centres in 2023: • In May Castrol opened its new EV lab at Castrol China Technology Centre in Shanghai, to focus on developing and testing EV fluids. The expansion supports bp’s strategy to drive lower-carbon mobility in China and to help customers achieve their sustainability goals. • In September Castrol opened the Castrol Americas Technology Center, in Wayne, New Jersey. This is a 12,000 square foot, state-of-the-art laboratory to develop and test fluids for EVs, engine and driveline oils and industrial lubricants. Bioenergy In October bp’s Archaea Energy announced the official start-up of its original Archaea Modular Design (AMD) renewable natural gas plant in Medora, Indiana, located next to a landfill site owned by Rumpke Waste and Recycling. • In December bp’s Archaea Energy announced it had brought two more renewable natural gas plants online, the Monty plant in Kentucky and the Red Top plant in California. In addition: • In February 2023 bp and BHP, one of the world’s largest iron ore producers, announced a partnership to trial the use of blended diesel with hydrogenated vegetable oil (HVO) to assist BHP to reduce carbon emissions from its iron ore operations in Western Australia. • In March 2023 Air bp announced the first sale of International Sustainability and Carbon Certification (ISCC) EU sustainable aviation fuel produced at bp’s Castellón refinery in Spain, to the LATAM Group, one of Latin America’s largest airlines. • In April our Rotterdam refinery in the Netherlands, became the first bp refinery to co-process Nuseed Carinta Oil as part of our partnership with Nuseed. Nuseed Carinata Oil is a sustainable low carbon biofuel feedstock which we plan to use in our refineries, as well as onward marketing. • In November Air bp collaborated with Virgin Atlantic, Rolls Royce, Boeing, and others, to fuel the first 100% sustainable aviation fuel (SAF) transatlantic flight by a commercial airline. The SAF was a blend derived from inputs supplied by Air bp and Virent. Together, this enabled up to 70% lifecycle carbon emission savings compared to the conventional jet fuel it replaced. Refining We continue to high grade our portfolio: • On 28 February 2023 bp completed the sale of its 50% interest in the bp-Husky Toledo refinery in Ohio, US, to Cenovus Energy, its partner in the facility. • In May our Cherry Point refinery in the US successfully commissioned the hydrocracker improvement project and cooling water infrastructure project. The new vacuum tower and cooling water tower are now online and are expected to improve availability, reduce maintenance costs and CO2 emissions. a Nearest equivalent IFRS measure to change in convenience gross margin: Change in replacement cost profit before interest and tax for the customers & products segment is -52% for 2023 compared with 2022. b At constant foreign exchange – values are at end 2023 foreign exchange rates, excluding TravelCenters of America and adjusted for other portfolio changes. c Based on GlobalData report for 2023 for top 20 selling global OEMs (total new vehicle sales).
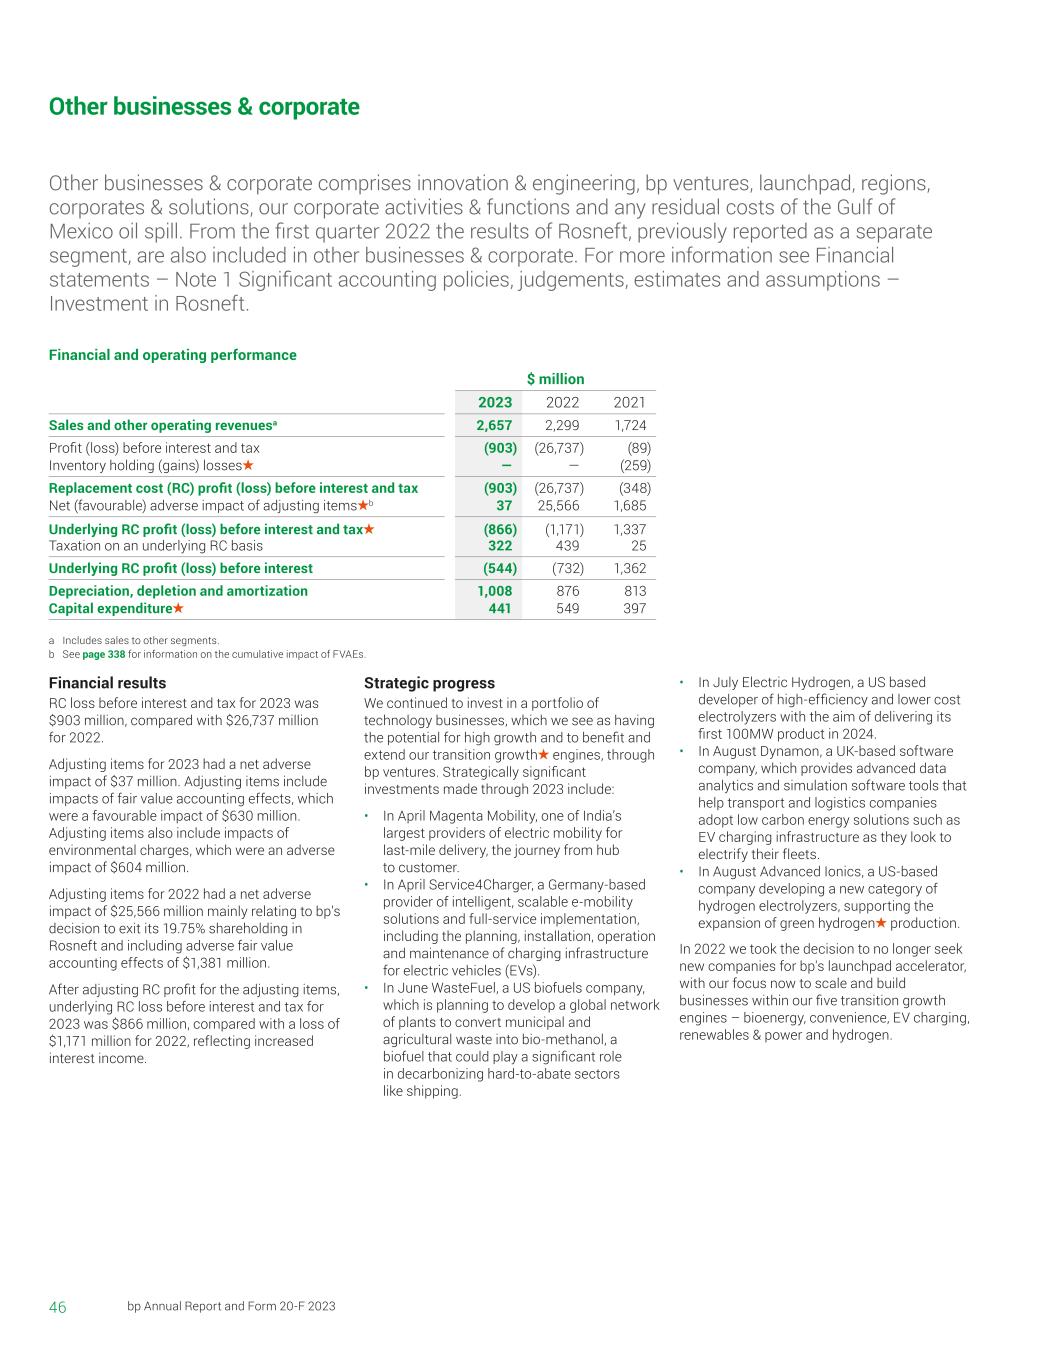
46 bp Annual Report and Form 20-F 2023 Other businesses & corporate Other businesses & corporate comprises innovation & engineering, bp ventures, launchpad, regions, corporates & solutions, our corporate activities & functions and any residual costs of the Gulf of Mexico oil spill. From the first quarter 2022 the results of Rosneft, previously reported as a separate segment, are also included in other businesses & corporate. For more information see Financial statements – Note 1 Significant accounting policies, judgements, estimates and assumptions – Investment in Rosneft. Financial results RC loss before interest and tax for 2023 was $903 million, compared with $26,737 million for 2022. Adjusting items for 2023 had a net adverse impact of $37 million. Adjusting items include impacts of fair value accounting effects, which were a favourable impact of $630 million. Adjusting items also include impacts of environmental charges, which were an adverse impact of $604 million. Adjusting items for 2022 had a net adverse impact of $25,566 million mainly relating to bp’s decision to exit its 19.75% shareholding in Rosneft and including adverse fair value accounting effects of $1,381 million. After adjusting RC profit for the adjusting items, underlying RC loss before interest and tax for 2023 was $866 million, compared with a loss of $1,171 million for 2022, reflecting increased interest income. Strategic progress We continued to invest in a portfolio of technology businesses, which we see as having the potential for high growth and to benefit and extend our transition growth engines, through bp ventures. Strategically significant investments made through 2023 include: • In April Magenta Mobility, one of India’s largest providers of electric mobility for last-mile delivery, the journey from hub to customer. • In April Service4Charger, a Germany-based provider of intelligent, scalable e-mobility solutions and full-service implementation, including the planning, installation, operation and maintenance of charging infrastructure for electric vehicles (EVs). • In June WasteFuel, a US biofuels company, which is planning to develop a global network of plants to convert municipal and agricultural waste into bio-methanol, a biofuel that could play a significant role in decarbonizing hard-to-abate sectors like shipping. • In July Electric Hydrogen, a US based developer of high-efficiency and lower cost electrolyzers with the aim of delivering its first 100MW product in 2024. • In August Dynamon, a UK-based software company, which provides advanced data analytics and simulation software tools that help transport and logistics companies adopt low carbon energy solutions such as EV charging infrastructure as they look to electrify their fleets. • In August Advanced Ionics, a US-based company developing a new category of hydrogen electrolyzers, supporting the expansion of green hydrogen production. In 2022 we took the decision to no longer seek new companies for bp's launchpad accelerator, with our focus now to scale and build businesses within our five transition growth engines – bioenergy, convenience, EV charging, renewables & power and hydrogen. Financial and operating performance $ million 2023 2022 2021 Sales and other operating revenuesa 2,657 2,299 1,724 Profit (loss) before interest and tax (903) (26,737) (89) Inventory holding (gains) losses — — (259) Replacement cost (RC) profit (loss) before interest and tax (903) (26,737) (348) Net (favourable) adverse impact of adjusting items b 37 25,566 1,685 Underlying RC profit (loss) before interest and tax (866) (1,171) 1,337 Taxation on an underlying RC basis 322 439 25 Underlying RC profit (loss) before interest (544) (732) 1,362 Depreciation, depletion and amortization 1,008 876 813 Capital expenditure 441 549 397 a Includes sales to other segments. b See page 338 for information on the cumulative impact of FVAEs.
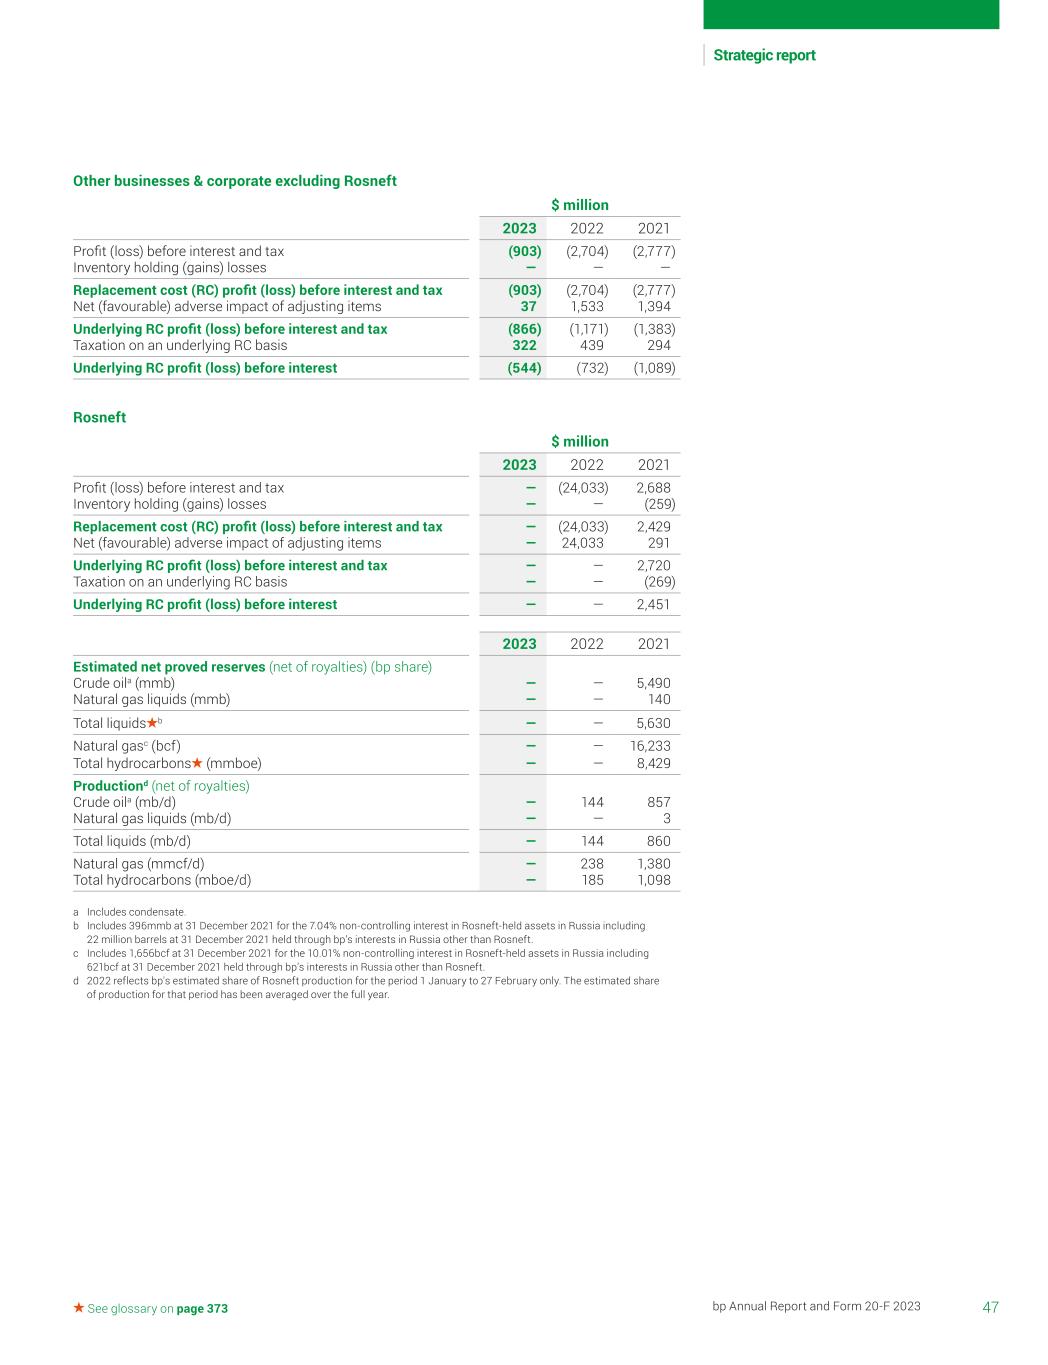
47bp Annual Report and Form 20-F 2023 Strategic report See glossary on page 373 Other businesses & corporate excluding Rosneft $ million 2023 2022 2021 Profit (loss) before interest and tax (903) (2,704) (2,777) Inventory holding (gains) losses — — — Replacement cost (RC) profit (loss) before interest and tax (903) (2,704) (2,777) Net (favourable) adverse impact of adjusting items 37 1,533 1,394 Underlying RC profit (loss) before interest and tax (866) (1,171) (1,383) Taxation on an underlying RC basis 322 439 294 Underlying RC profit (loss) before interest (544) (732) (1,089) Rosneft $ million 2023 2022 2021 Profit (loss) before interest and tax — (24,033) 2,688 Inventory holding (gains) losses — — (259) Replacement cost (RC) profit (loss) before interest and tax — (24,033) 2,429 Net (favourable) adverse impact of adjusting items — 24,033 291 Underlying RC profit (loss) before interest and tax — — 2,720 Taxation on an underlying RC basis — — (269) Underlying RC profit (loss) before interest — — 2,451 2023 2022 2021 Estimated net proved reserves (net of royalties) (bp share) Crude oila (mmb) — — 5,490 Natural gas liquids (mmb) — — 140 Total liquids b — — 5,630 Natural gasc (bcf) — — 16,233 Total hydrocarbons (mmboe) — — 8,429 Productiond (net of royalties) Crude oila (mb/d) — 144 857 Natural gas liquids (mb/d) — — 3 Total liquids (mb/d) — 144 860 Natural gas (mmcf/d) — 238 1,380 Total hydrocarbons (mboe/d) — 185 1,098 a Includes condensate. b Includes 396mmb at 31 December 2021 for the 7.04% non-controlling interest in Rosneft-held assets in Russia including 22 million barrels at 31 December 2021 held through bp’s interests in Russia other than Rosneft. c Includes 1,656bcf at 31 December 2021 for the 10.01% non-controlling interest in Rosneft-held assets in Russia including 621bcf at 31 December 2021 held through bp’s interests in Russia other than Rosneft. d 2022 reflects bp's estimated share of Rosneft production for the period 1 January to 27 February only. The estimated share of production for that period has been averaged over the full year.
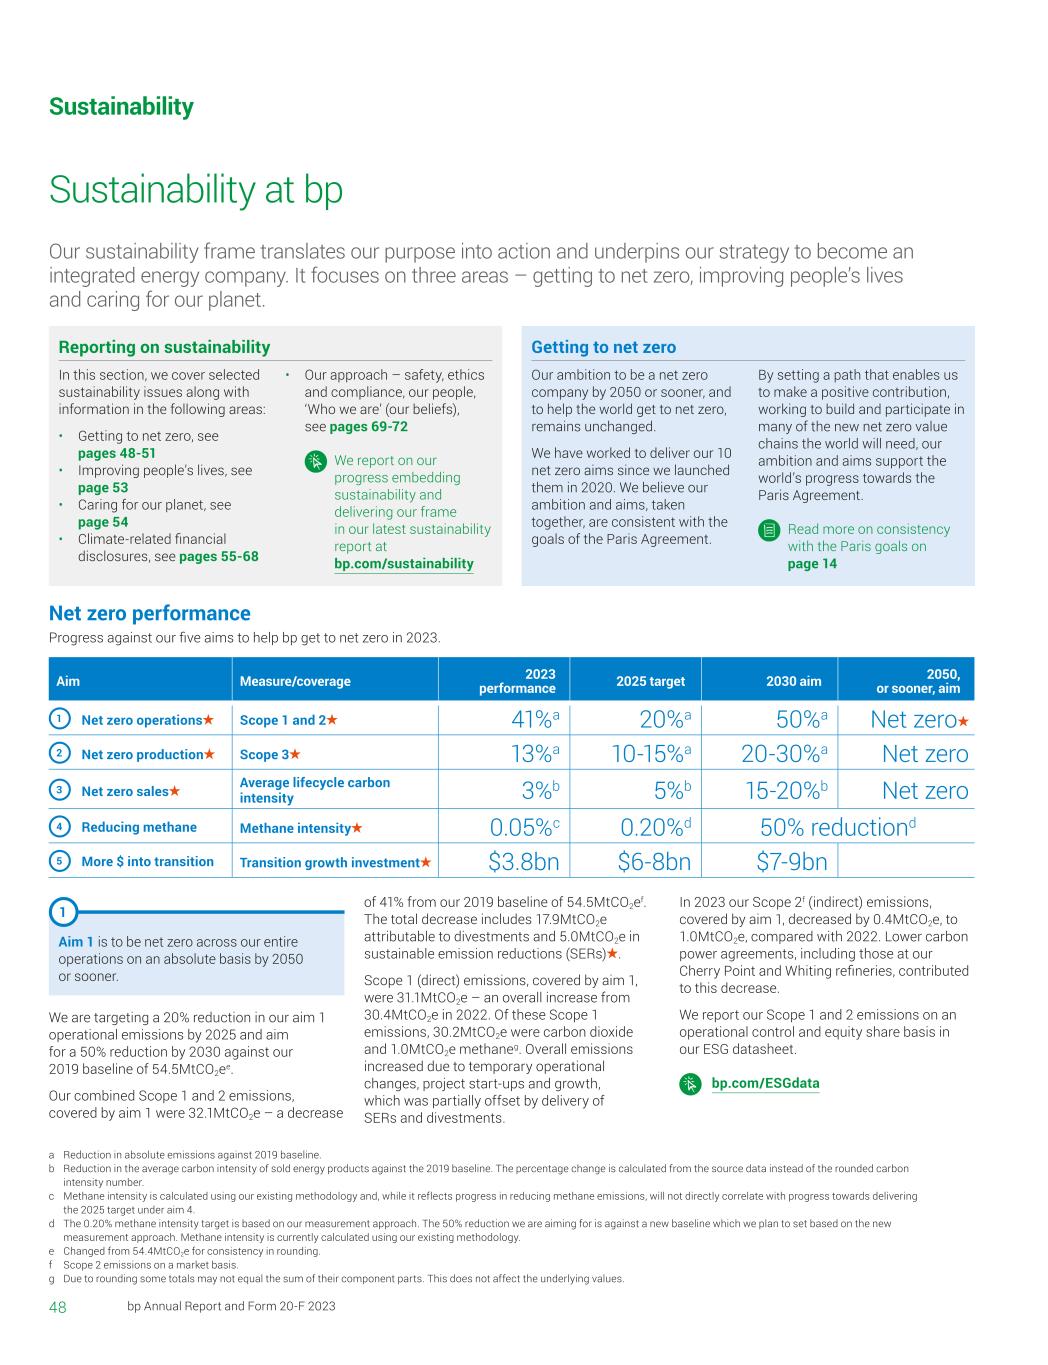
48 bp Annual Report and Form 20-F 2023 Sustainability at bp Sustainability Our sustainability frame translates our purpose into action and underpins our strategy to become an integrated energy company. It focuses on three areas – getting to net zero, improving people’s lives and caring for our planet. Reporting on sustainability In this section, we cover selected sustainability issues along with information in the following areas: • Getting to net zero, see pages 48-51 • Improving people’s lives, see page 53 • Caring for our planet, see page 54 • Climate-related financial disclosures, see pages 55-68 • Our approach – safety, ethics and compliance, our people, ‘Who we are’ (our beliefs), see pages 69-72 We report on our progress embedding sustainability and delivering our frame in our latest sustainability report at bp.com/sustainability Getting to net zero Our ambition to be a net zero company by 2050 or sooner, and to help the world get to net zero, remains unchanged. We have worked to deliver our 10 net zero aims since we launched them in 2020. We believe our ambition and aims, taken together, are consistent with the goals of the Paris Agreement. By setting a path that enables us to make a positive contribution, working to build and participate in many of the new net zero value chains the world will need, our ambition and aims support the world’s progress towards the Paris Agreement. Read more on consistency with the Paris goals on page 14 Net zero performance Progress against our five aims to help bp get to net zero in 2023. Aim Measure/coverage 2023 performance 2025 target 2030 aim 2050, or sooner, aim 1 Net zero operations Scope 1 and 2 41%a 20%a 50%a Net zero 2 Net zero production Scope 3 13%a 10-15%a 20-30%a Net zero 3 Net zero sales Average lifecycle carbon intensity 3%b 5%b 15-20%b Net zero 4 Reducing methane Methane intensity 0.05%c 0.20%d 50% reductiond 5 More $ into transition Transition growth investment $3.8bn $6-8bn $7-9bn 1 Aim 1 is to be net zero across our entire operations on an absolute basis by 2050 or sooner. We are targeting a 20% reduction in our aim 1 operational emissions by 2025 and aim for a 50% reduction by 2030 against our 2019 baseline of 54.5MtCO2ee. Our combined Scope 1 and 2 emissions, covered by aim 1 were 32.1MtCO2e – a decrease of 41% from our 2019 baseline of 54.5MtCO2ef. The total decrease includes 17.9MtCO2e attributable to divestments and 5.0MtCO2e in sustainable emission reductions (SERs) . Scope 1 (direct) emissions, covered by aim 1, were 31.1MtCO2e – an overall increase from 30.4MtCO2e in 2022. Of these Scope 1 emissions, 30.2MtCO2e were carbon dioxide and 1.0MtCO2e methaneg. Overall emissions increased due to temporary operational changes, project start-ups and growth, which was partially offset by delivery of SERs and divestments. a Reduction in absolute emissions against 2019 baseline. b Reduction in the average carbon intensity of sold energy products against the 2019 baseline. The percentage change is calculated from the source data instead of the rounded carbon intensity number. c Methane intensity is calculated using our existing methodology and, while it reflects progress in reducing methane emissions, will not directly correlate with progress towards delivering the 2025 target under aim 4. d The 0.20% methane intensity target is based on our measurement approach. The 50% reduction we are aiming for is against a new baseline which we plan to set based on the new measurement approach. Methane intensity is currently calculated using our existing methodology. e Changed from 54.4MtCO2e for consistency in rounding. f Scope 2 emissions on a market basis. g Due to rounding some totals may not equal the sum of their component parts. This does not affect the underlying values. In 2023 our Scope 2f (indirect) emissions, covered by aim 1, decreased by 0.4MtCO2e, to 1.0MtCO2e, compared with 2022. Lower carbon power agreements, including those at our Cherry Point and Whiting refineries, contributed to this decrease. We report our Scope 1 and 2 emissions on an operational control and equity share basis in our ESG datasheet. bp.com/ESGdata
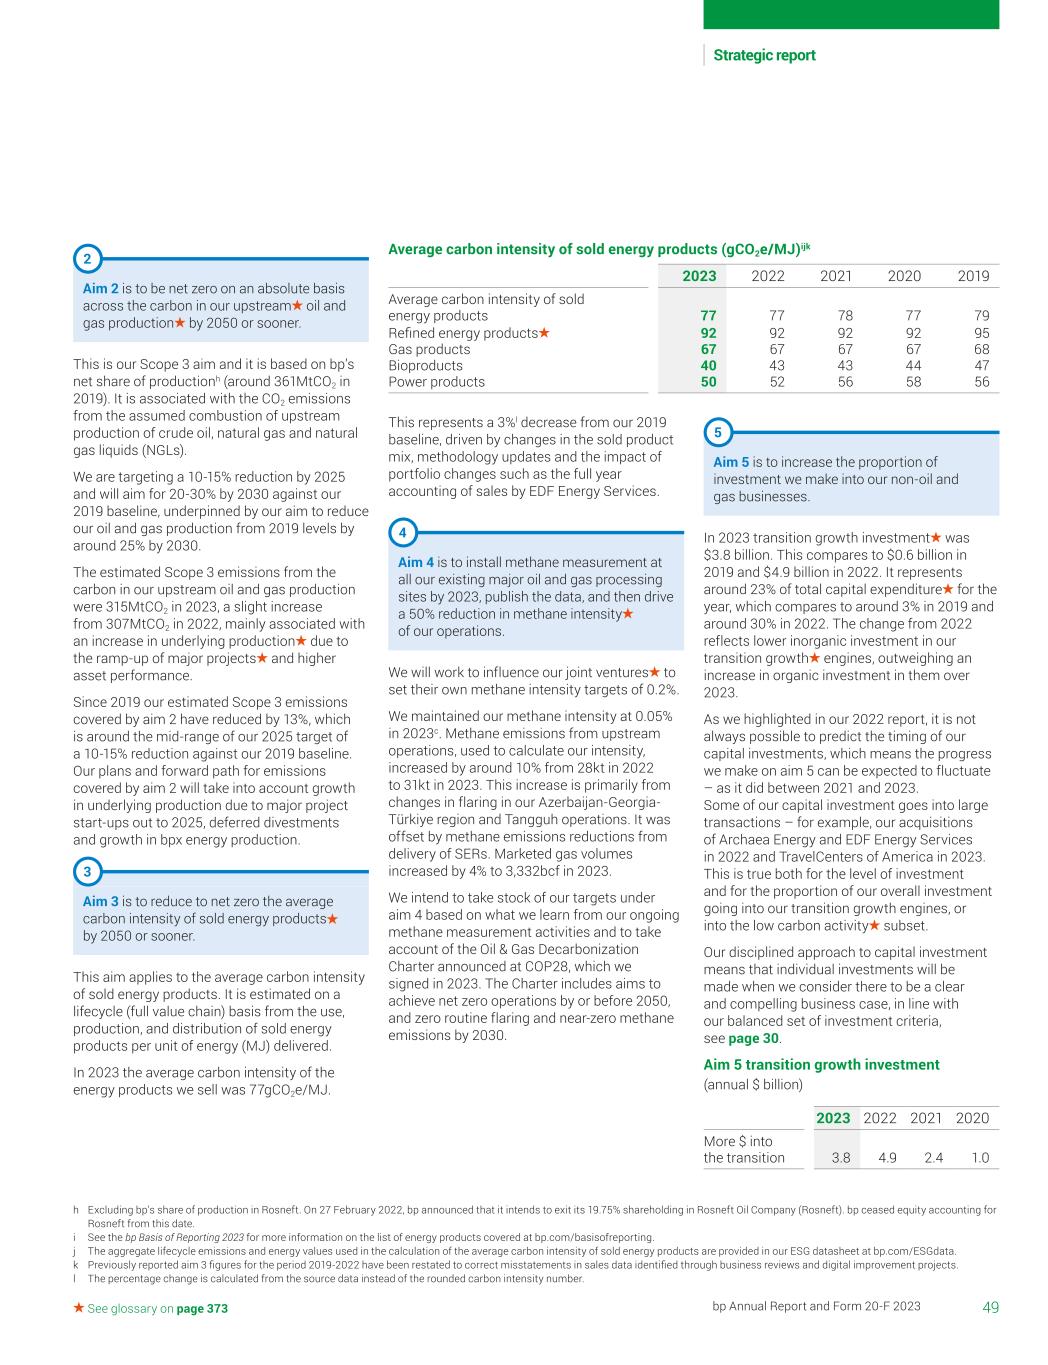
49bp Annual Report and Form 20-F 2023 Strategic report See glossary on page 373 h Excluding bp’s share of production in Rosneft. On 27 February 2022, bp announced that it intends to exit its 19.75% shareholding in Rosneft Oil Company (Rosneft). bp ceased equity accounting for Rosneft from this date. i See the bp Basis of Reporting 2023 for more information on the list of energy products covered at bp.com/basisofreporting. j The aggregate lifecycle emissions and energy values used in the calculation of the average carbon intensity of sold energy products are provided in our ESG datasheet at bp.com/ESGdata. k Previously reported aim 3 figures for the period 2019-2022 have been restated to correct misstatements in sales data identified through business reviews and digital improvement projects. l The percentage change is calculated from the source data instead of the rounded carbon intensity number. 2 Aim 2 is to be net zero on an absolute basis across the carbon in our upstream oil and gas production by 2050 or sooner. This is our Scope 3 aim and it is based on bp’s net share of productionh (around 361MtCO2 in 2019). It is associated with the CO2 emissions from the assumed combustion of upstream production of crude oil, natural gas and natural gas liquids (NGLs). We are targeting a 10-15% reduction by 2025 and will aim for 20-30% by 2030 against our 2019 baseline, underpinned by our aim to reduce our oil and gas production from 2019 levels by around 25% by 2030. The estimated Scope 3 emissions from the carbon in our upstream oil and gas production were 315MtCO2 in 2023, a slight increase from 307MtCO2 in 2022, mainly associated with an increase in underlying production due to the ramp-up of major projects and higher asset performance. Since 2019 our estimated Scope 3 emissions covered by aim 2 have reduced by 13%, which is around the mid-range of our 2025 target of a 10-15% reduction against our 2019 baseline. Our plans and forward path for emissions covered by aim 2 will take into account growth in underlying production due to major project start-ups out to 2025, deferred divestments and growth in bpx energy production. 3 Aim 3 is to reduce to net zero the average carbon intensity of sold energy products by 2050 or sooner. This aim applies to the average carbon intensity of sold energy products. It is estimated on a lifecycle (full value chain) basis from the use, production, and distribution of sold energy products per unit of energy (MJ) delivered. In 2023 the average carbon intensity of the energy products we sell was 77gCO2e/MJ. This represents a 3%l decrease from our 2019 baseline, driven by changes in the sold product mix, methodology updates and the impact of portfolio changes such as the full year accounting of sales by EDF Energy Services. 4 Aim 4 is to install methane measurement at all our existing major oil and gas processing sites by 2023, publish the data, and then drive a 50% reduction in methane intensity of our operations. We will work to influence our joint ventures to set their own methane intensity targets of 0.2%. We maintained our methane intensity at 0.05% in 2023c. Methane emissions from upstream operations, used to calculate our intensity, increased by around 10% from 28kt in 2022 to 31kt in 2023. This increase is primarily from changes in flaring in our Azerbaijan-Georgia- Türkiye region and Tangguh operations. It was offset by methane emissions reductions from delivery of SERs. Marketed gas volumes increased by 4% to 3,332bcf in 2023. We intend to take stock of our targets under aim 4 based on what we learn from our ongoing methane measurement activities and to take account of the Oil & Gas Decarbonization Charter announced at COP28, which we signed in 2023. The Charter includes aims to achieve net zero operations by or before 2050, and zero routine flaring and near-zero methane emissions by 2030. 5 Aim 5 is to increase the proportion of investment we make into our non-oil and gas businesses. In 2023 transition growth investment was $3.8 billion. This compares to $0.6 billion in 2019 and $4.9 billion in 2022. It represents around 23% of total capital expenditure for the year, which compares to around 3% in 2019 and around 30% in 2022. The change from 2022 reflects lower inorganic investment in our transition growth engines, outweighing an increase in organic investment in them over 2023. As we highlighted in our 2022 report, it is not always possible to predict the timing of our capital investments, which means the progress we make on aim 5 can be expected to fluctuate – as it did between 2021 and 2023. Some of our capital investment goes into large transactions – for example, our acquisitions of Archaea Energy and EDF Energy Services in 2022 and TravelCenters of America in 2023. This is true both for the level of investment and for the proportion of our overall investment going into our transition growth engines, or into the low carbon activity subset. Our disciplined approach to capital investment means that individual investments will be made when we consider there to be a clear and compelling business case, in line with our balanced set of investment criteria, see page 30. Aim 5 transition growth investment (annual $ billion) 2023 2022 2021 2020 More $ into the transition 3.8 4.9 2.4 1.0 Average carbon intensity of sold energy products (gCO2e/MJ)ijk 2023 2022 2021 2020 2019 Average carbon intensity of sold energy products 77 77 78 77 79 Refined energy products 92 92 92 92 95 Gas products 67 67 67 67 68 Bioproducts 40 43 43 44 47 Power products 50 52 56 58 56
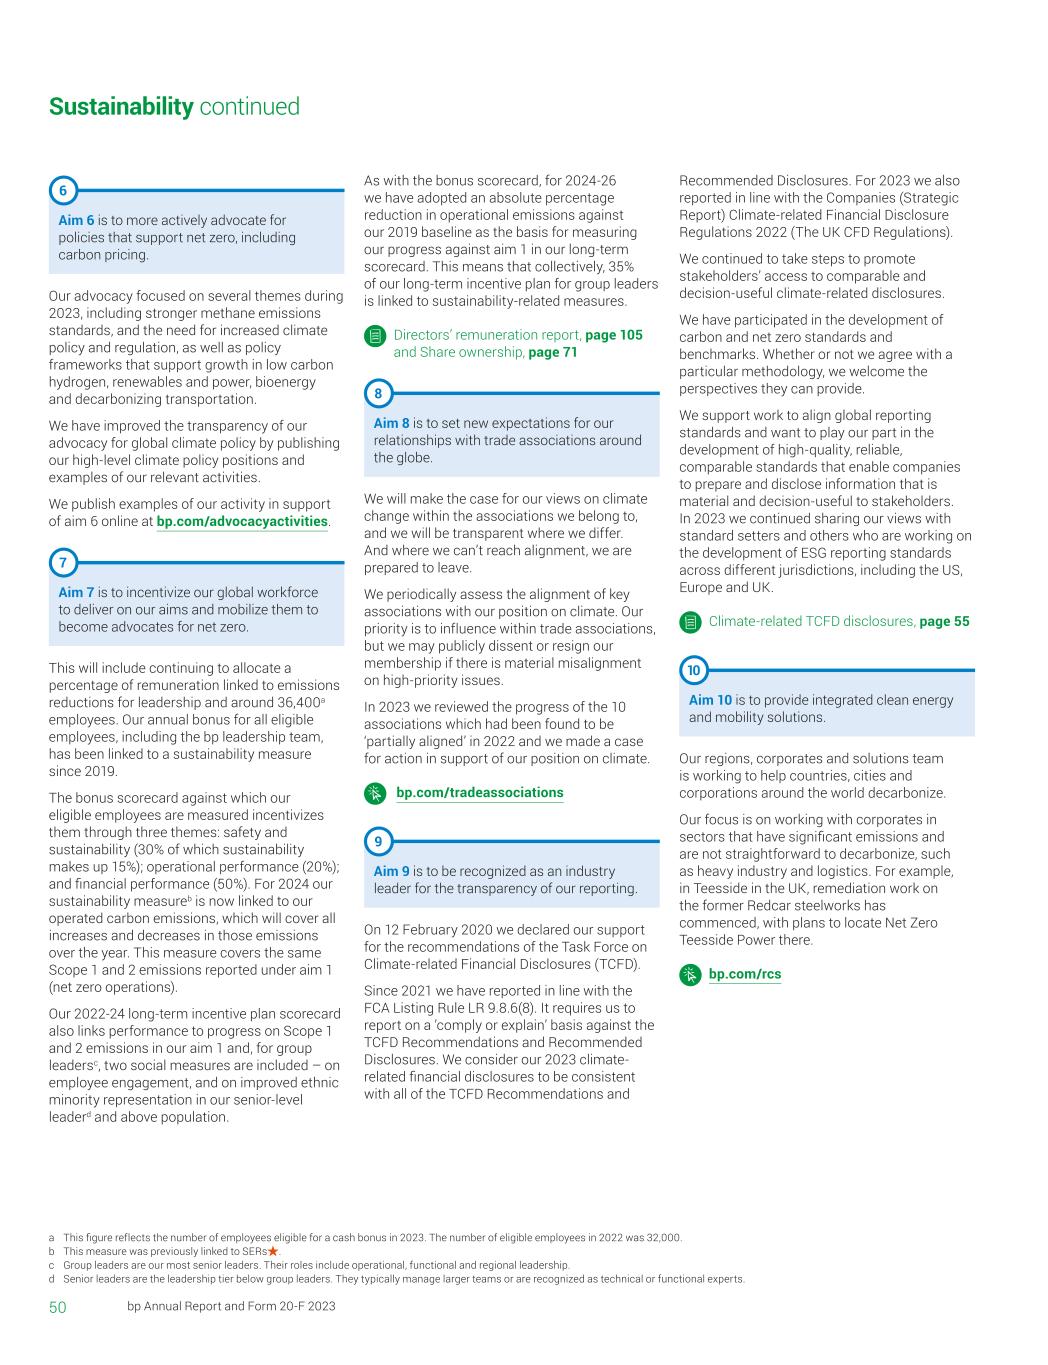
50 bp Annual Report and Form 20-F 2023 6 Aim 6 is to more actively advocate for policies that support net zero, including carbon pricing. Our advocacy focused on several themes during 2023, including stronger methane emissions standards, and the need for increased climate policy and regulation, as well as policy frameworks that support growth in low carbon hydrogen, renewables and power, bioenergy and decarbonizing transportation. We have improved the transparency of our advocacy for global climate policy by publishing our high-level climate policy positions and examples of our relevant activities. We publish examples of our activity in support of aim 6 online at bp.com/advocacyactivities. 7 Aim 7 is to incentivize our global workforce to deliver on our aims and mobilize them to become advocates for net zero. This will include continuing to allocate a percentage of remuneration linked to emissions reductions for leadership and around 36,400a employees. Our annual bonus for all eligible employees, including the bp leadership team, has been linked to a sustainability measure since 2019. The bonus scorecard against which our eligible employees are measured incentivizes them through three themes: safety and sustainability (30% of which sustainability makes up 15%); operational performance (20%); and financial performance (50%). For 2024 our sustainability measureb is now linked to our operated carbon emissions, which will cover all increases and decreases in those emissions over the year. This measure covers the same Scope 1 and 2 emissions reported under aim 1 (net zero operations). Our 2022-24 long-term incentive plan scorecard also links performance to progress on Scope 1 and 2 emissions in our aim 1 and, for group leadersc, two social measures are included – on employee engagement, and on improved ethnic minority representation in our senior-level leaderd and above population. As with the bonus scorecard, for 2024-26 we have adopted an absolute percentage reduction in operational emissions against our 2019 baseline as the basis for measuring our progress against aim 1 in our long-term scorecard. This means that collectively, 35% of our long-term incentive plan for group leaders is linked to sustainability-related measures. Directors’ remuneration report, page 105 and Share ownership, page 71 8 Aim 8 is to set new expectations for our relationships with trade associations around the globe. We will make the case for our views on climate change within the associations we belong to, and we will be transparent where we differ. And where we can’t reach alignment, we are prepared to leave. We periodically assess the alignment of key associations with our position on climate. Our priority is to influence within trade associations, but we may publicly dissent or resign our membership if there is material misalignment on high-priority issues. In 2023 we reviewed the progress of the 10 associations which had been found to be ‘partially aligned’ in 2022 and we made a case for action in support of our position on climate. bp.com/tradeassociations 9 Aim 9 is to be recognized as an industry leader for the transparency of our reporting. On 12 February 2020 we declared our support for the recommendations of the Task Force on Climate-related Financial Disclosures (TCFD). Since 2021 we have reported in line with the FCA Listing Rule LR 9.8.6(8). It requires us to report on a ’comply or explain’ basis against the TCFD Recommendations and Recommended Disclosures. We consider our 2023 climate- related financial disclosures to be consistent with all of the TCFD Recommendations and Recommended Disclosures. For 2023 we also reported in line with the Companies (Strategic Report) Climate-related Financial Disclosure Regulations 2022 (The UK CFD Regulations). We continued to take steps to promote stakeholders’ access to comparable and decision-useful climate-related disclosures. We have participated in the development of carbon and net zero standards and benchmarks. Whether or not we agree with a particular methodology, we welcome the perspectives they can provide. We support work to align global reporting standards and want to play our part in the development of high-quality, reliable, comparable standards that enable companies to prepare and disclose information that is material and decision-useful to stakeholders. In 2023 we continued sharing our views with standard setters and others who are working on the development of ESG reporting standards across different jurisdictions, including the US, Europe and UK. Climate-related TCFD disclosures, page 55 10 Aim 10 is to provide integrated clean energy and mobility solutions. Our regions, corporates and solutions team is working to help countries, cities and corporations around the world decarbonize. Our focus is on working with corporates in sectors that have significant emissions and are not straightforward to decarbonize, such as heavy industry and logistics. For example, in Teesside in the UK, remediation work on the former Redcar steelworks has commenced, with plans to locate Net Zero Teesside Power there. bp.com/rcs Sustainability continued a This figure reflects the number of employees eligible for a cash bonus in 2023. The number of eligible employees in 2022 was 32,000. b This measure was previously linked to SERs . c Group leaders are our most senior leaders. Their roles include operational, functional and regional leadership. d Senior leaders are the leadership tier below group leaders. They typically manage larger teams or are recognized as technical or functional experts.
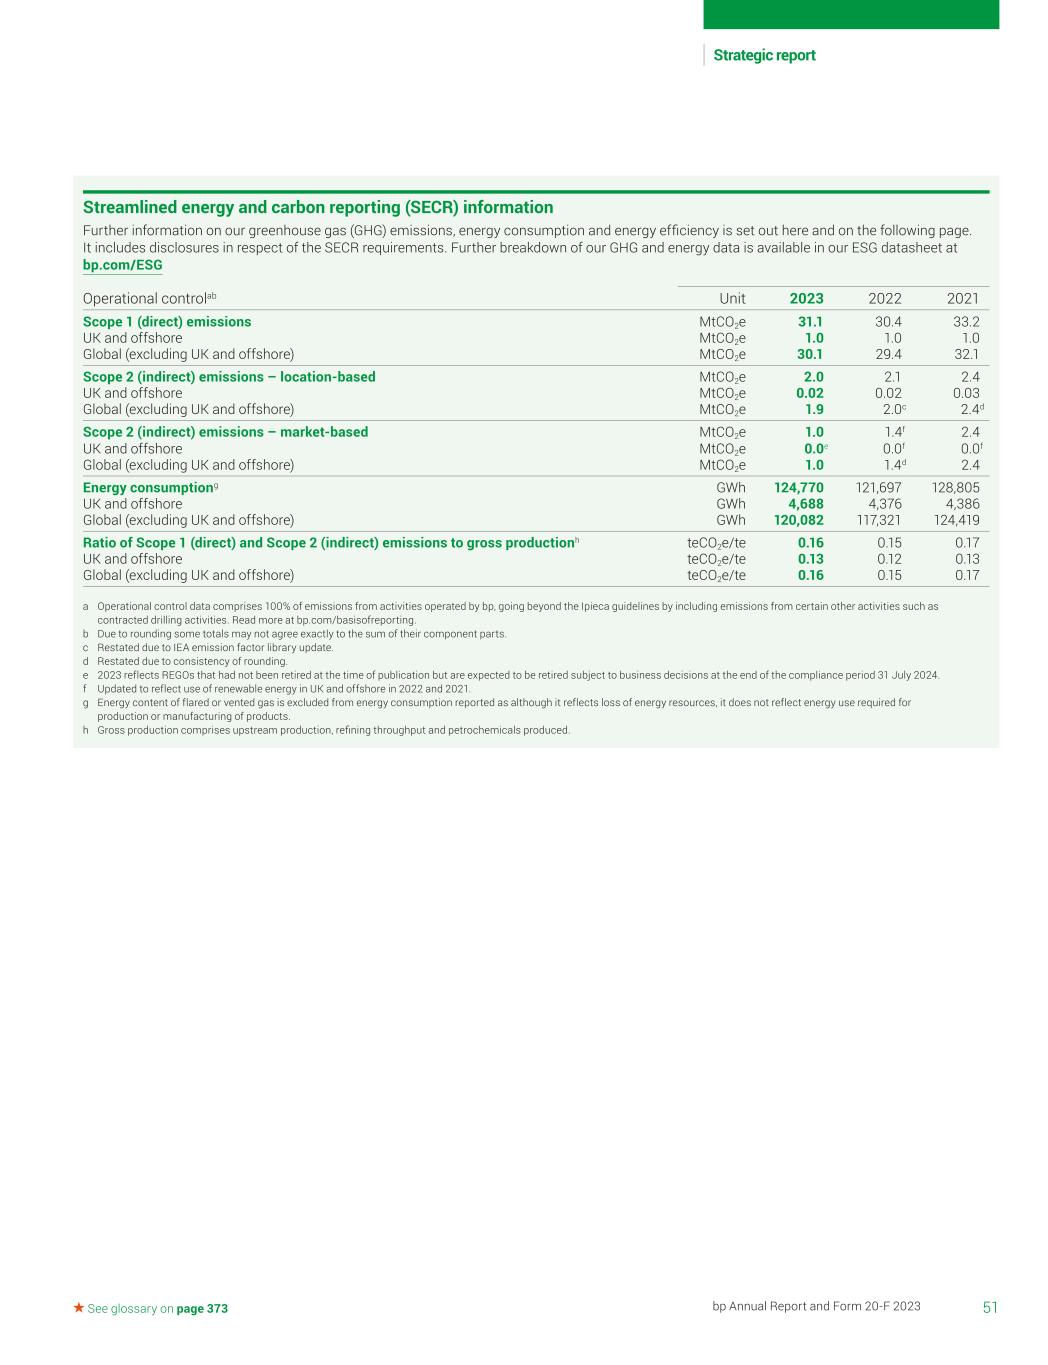
51bp Annual Report and Form 20-F 2023 Strategic report See glossary on page 373 Streamlined energy and carbon reporting (SECR) information Further information on our greenhouse gas (GHG) emissions, energy consumption and energy efficiency is set out here and on the following page. It includes disclosures in respect of the SECR requirements. Further breakdown of our GHG and energy data is available in our ESG datasheet at bp.com/ESG Operational controlab Unit 2023 2022 2021 Scope 1 (direct) emissions MtCO2e 31.1 30.4 33.2 UK and offshore MtCO2e 1.0 1.0 1.0 Global (excluding UK and offshore) MtCO2e 30.1 29.4 32.1 Scope 2 (indirect) emissions – location-based MtCO2e 2.0 2.1 2.4 UK and offshore MtCO2e 0.02 0.02 0.03 Global (excluding UK and offshore) MtCO2e 1.9 2.0c 2.4d Scope 2 (indirect) emissions – market-based MtCO2e 1.0 1.4f 2.4 UK and offshore MtCO2e 0.0e 0.0f 0.0f Global (excluding UK and offshore) MtCO2e 1.0 1.4d 2.4 Energy consumptiong GWh 124,770 121,697 128,805 UK and offshore GWh 4,688 4,376 4,386 Global (excluding UK and offshore) GWh 120,082 117,321 124,419 Ratio of Scope 1 (direct) and Scope 2 (indirect) emissions to gross productionh teCO2e/te 0.16 0.15 0.17 UK and offshore teCO2e/te 0.13 0.12 0.13 Global (excluding UK and offshore) teCO2e/te 0.16 0.15 0.17 a Operational control data comprises 100% of emissions from activities operated by bp, going beyond the Ipieca guidelines by including emissions from certain other activities such as contracted drilling activities. Read more at bp.com/basisofreporting. b Due to rounding some totals may not agree exactly to the sum of their component parts. c Restated due to IEA emission factor library update. d Restated due to consistency of rounding. e 2023 reflects REGOs that had not been retired at the time of publication but are expected to be retired subject to business decisions at the end of the compliance period 31 July 2024. f Updated to reflect use of renewable energy in UK and offshore in 2022 and 2021. g Energy content of flared or vented gas is excluded from energy consumption reported as although it reflects loss of energy resources, it does not reflect energy use required for production or manufacturing of products. h Gross production comprises upstream production, refining throughput and petrochemicals produced.
52 bp Annual Report and Form 20-F 2023 Streamlined energy and carbon reporting (SECR) information continued Energy efficiency measures Since 2016 we have delivered 8.9MtCO2e of sustainable emissions reductions (SERs) across our operated sites. This is our key metric for tracking annual reductions in GHG emissions from energy efficiency savings and direct GHG emissions. A total of 172 SERs projects in 2023 contributed to reductions of 0.9MtCO2e. This is in addition to the 152 SER projects and associated reduction of 1.5MtCO2e in 2022. Those included reduced fuel consumption in the North Sea, waste heat recovery in the Azerbaijan-Georgia-Türkiye (AGT) region and the automation of gas turbine generators, also known as power export optimization, in Oman. It also included projects across bpx energy sites in the US Permian Basin for example, electrification and removal of existing compressors to reduce fuel use. Energy efficiency activities in 2023 included: • The implementation of bottom-up approaches to energy forecasting and management so our employees at sites better understand the energy balance of production assets. This has enabled them to avoid emissions by reducing the amount of additional equipment running for a given throughput of oil and gas. • The creation of a global energy dashboard for refining within bp Solutions to enable real-time performance management at sites. The tool is currently available for use by the energy sub-discipline network, which includes bp Solutions and site energy engineers. • bpx energy: projects focused on improving energy efficiency, including further electrification in Texas, conversion of continuous chemical treatment to a batch process reducing energy demand, and installation of solar air compressors to reduce reliance on imported electricity. The connection of multiple wells to our Bingo central delivery point reduces wellsite footprint and results in infrastructure emission reductions. The facility also utilizes instrument air instead of natural gas to operate pneumatic devices. In Eagle Ford, the Hawkville North East central facility point is undergoing an expansion to replace natural gas-driven compressors with electric-driven compressors. bpx energy has also been decommissioning legacy central delivery points that use natural gas-driven pneumatics and compressors and reroute them through a new central delivery point, utilizing electric- driven equipment. • Refining: projects delivered across refining included cooling water infrastructure and hydrocracker improvement projects to reduce emissions and production optimization at Lingen. • North Sea: operations have delivered a series of compressor optimization projects. ETAP has upgraded a gas turbine generator with a new combustion system that maintains power output and reduces fuel demand. Clair Ridge has optimized compressor discharge pressure to reduce compression power demand while still maintaining stable production rates. • Gulf of Mexico: projects included turbine generator controls upgrades to reduce fuel consumption, trialling a reduced spinning reserve (see definition in next paragraph), LED light replacement and water injection pump optimization. Optimization assessments conducted on drilling operations at Mad Dog have reduced the number of diesel generators being used on site. Equipment upgrades are taking place across Thunder Horse with the replacement of older T-Gens units with more energy efficient ones. Alongside this, the pressure of export gas compressors is being lowered, resulting in slightly lower power requirements. As part of managing energy efficiency, we take a portfolio-wide approach to assessing and prioritizing spinning reserve reduction opportunities. Spinning reserve involves running additional power generation machines to provide an excess of energy supply. This can help to protect production from plant vulnerabilities, including power generation reliability. Reducing spinning reserve can increase exposure to power fluctuations for production. We take a risk-based approach when considering reducing the number of running machines. This allows bp to realize emissions and maintenance cost reductions from fewer running machines, while managing the associated production risk. In production and operations we held energy and carbon workshops in the North Sea, Tangguh, AGT and the Gulf of Mexico. Each refinery developed draft plans for what it plans to do for energy reduction between now and 2030. These ideas are across maintenance, optimization and projects. In 2023 we finished developing our real-time digital carbon and energy dashboards for all refineries to monitor energy performance and alert employees when energy use is high. In refining we held workshops at Whiting and Gelsenkirchen to develop new energy reduction ideas. These ideas were then prioritized and developed at Whiting and Gelsenkirchen, and introduced at Cherry Point. bp is involved in several external groups working on energy efficiency, including the Oil & Gas Climate Initiative (OGCI), the International Association of Oil & Gas Producers (IOGP) and Energy Star. We run an annual training course for new chemical engineers, which includes energy efficiency and we offer GHG emissions and energy efficiency training for more experienced engineers and practitioners. Reporting methodology Our approach to reporting GHG emissions broadly follows the Ipieca, API, IOGP Petroleum Industry Guidelines and the GHG Protocol for Reporting GHG Emissions. We calculate GHG emissions based on fuel consumption and fuel properties for major sources, such as flares. We report CO2 and methane. We do not include nitrous oxide, hydrofluorocarbons, perfluorocarbons and sulphur hexafluoride as they are not material to our operations and it is not currently practical to collect this data at scale. Energy consumption is monitored and reported centrally from all operated sites by fuel type. This includes all energy, both imported and self- produced, used to run our operations and aligned with our GHG reporting boundary, but excludes energy content of flared or vented gas. Although flaring and venting reflects loss of energy resources, it does not reflect energy use required for production or manufacturing of products. Ratio of Scope 1 and Scope 2 emissions to gross production bp reports a ratio of Scope 1 and Scope 2 emissions to gross production, see SECR table on page 51. This covers all our Scope 1 and Scope 2 emissions on an operational control boundary basis and uses gross operated sales from our operated oil and gas facilities, refinery throughput and petrochemicals produced. The denominator uses output from production businesses, refineries and petrochemical facilities, which account for 96% of total operated emissions. The intensity ratio has improved due to our aim 1 reductions, as described on page 48. The ratio provided in the SECR table uses production and throughput from our operated upstream, refining and chemicals businesses as a measure of output which can be consistently reported against. We report data on a consolidated basis in the Annual Report and Form 20-F and this differs to the production and throughput used for the ratio in the SECR table, which aligns with the operated emissions reporting boundary. Sustainability continued
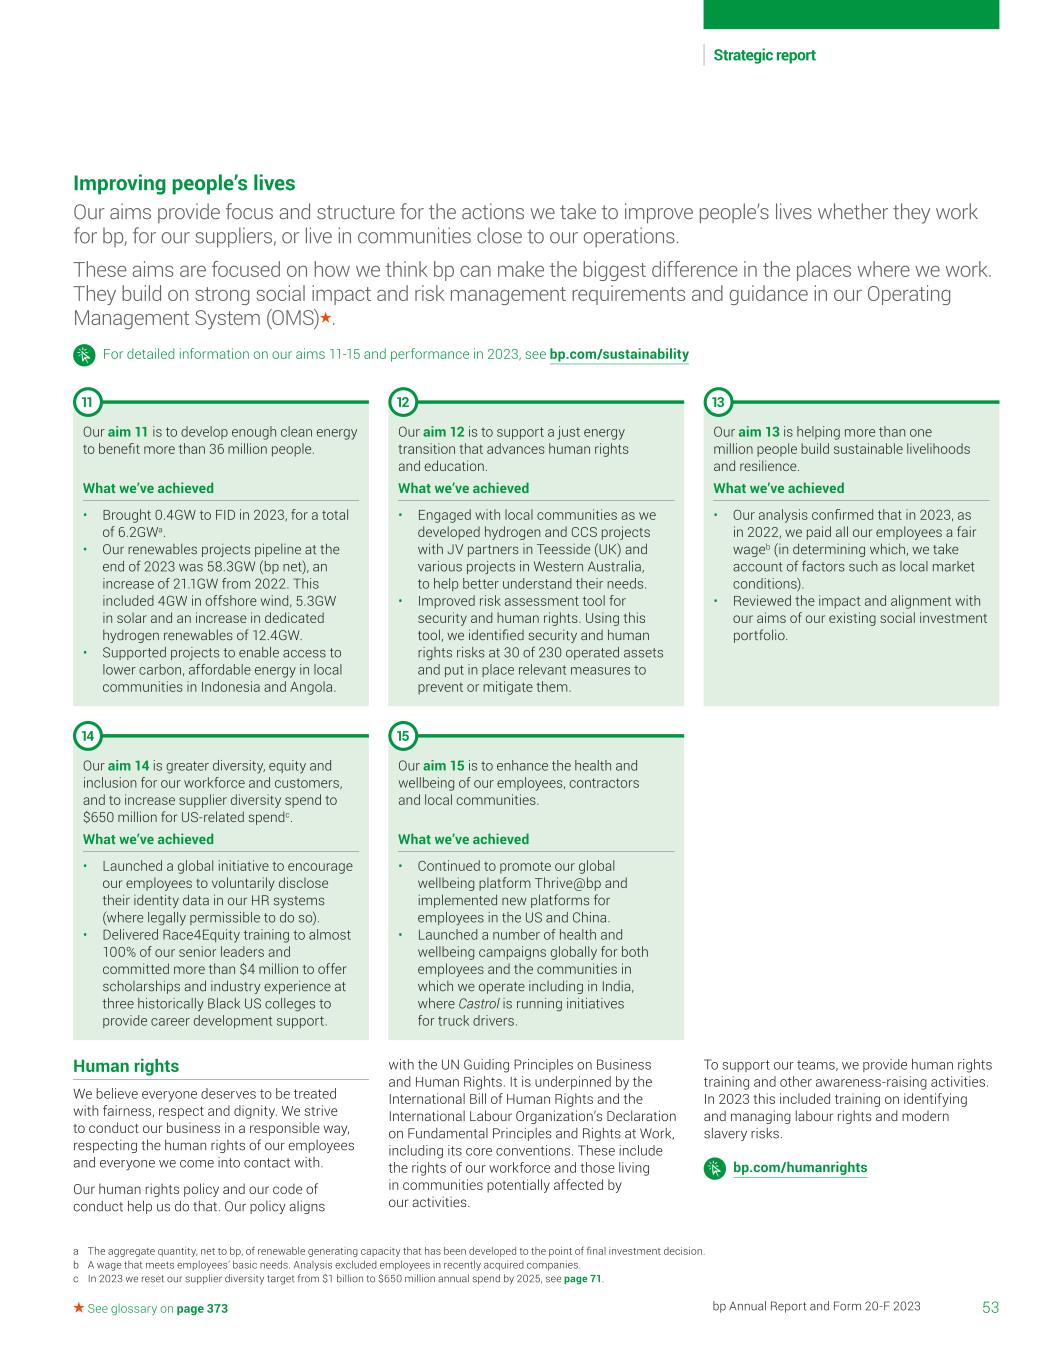
53bp Annual Report and Form 20-F 2023 Strategic report See glossary on page 373 Improving people’s lives Our aims provide focus and structure for the actions we take to improve people’s lives whether they work for bp, for our suppliers, or live in communities close to our operations. These aims are focused on how we think bp can make the biggest difference in the places where we work. They build on strong social impact and risk management requirements and guidance in our Operating Management System (OMS) . For detailed information on our aims 11-15 and performance in 2023, see bp.com/sustainability Human rights We believe everyone deserves to be treated with fairness, respect and dignity. We strive to conduct our business in a responsible way, respecting the human rights of our employees and everyone we come into contact with. Our human rights policy and our code of conduct help us do that. Our policy aligns 11 Our aim 11 is to develop enough clean energy to benefit more than 36 million people. What we’ve achieved • Brought 0.4GW to FID in 2023, for a total of 6.2GWa. • Our renewables projects pipeline at the end of 2023 was 58.3GW (bp net), an increase of 21.1GW from 2022. This included 4GW in offshore wind, 5.3GW in solar and an increase in dedicated hydrogen renewables of 12.4GW. • Supported projects to enable access to lower carbon, affordable energy in local communities in Indonesia and Angola. 14 Our aim 14 is greater diversity, equity and inclusion for our workforce and customers, and to increase supplier diversity spend to $650 million for US-related spendc. What we’ve achieved • Launched a global initiative to encourage our employees to voluntarily disclose their identity data in our HR systems (where legally permissible to do so). • Delivered Race4Equity training to almost 100% of our senior leaders and committed more than $4 million to offer scholarships and industry experience at three historically Black US colleges to provide career development support. 13 Our aim 13 is helping more than one million people build sustainable livelihoods and resilience. What we’ve achieved • Our analysis confirmed that in 2023, as in 2022, we paid all our employees a fair wageb (in determining which, we take account of factors such as local market conditions). • Reviewed the impact and alignment with our aims of our existing social investment portfolio. 12 Our aim 12 is to support a just energy transition that advances human rights and education. What we’ve achieved • Engaged with local communities as we developed hydrogen and CCS projects with JV partners in Teesside (UK) and various projects in Western Australia, to help better understand their needs. • Improved risk assessment tool for security and human rights. Using this tool, we identified security and human rights risks at 30 of 230 operated assets and put in place relevant measures to prevent or mitigate them. 15 Our aim 15 is to enhance the health and wellbeing of our employees, contractors and local communities. What we’ve achieved • Continued to promote our global wellbeing platform Thrive@bp and implemented new platforms for employees in the US and China. • Launched a number of health and wellbeing campaigns globally for both employees and the communities in which we operate including in India, where Castrol is running initiatives for truck drivers. with the UN Guiding Principles on Business and Human Rights. It is underpinned by the International Bill of Human Rights and the International Labour Organization’s Declaration on Fundamental Principles and Rights at Work, including its core conventions. These include the rights of our workforce and those living in communities potentially affected by our activities. a The aggregate quantity, net to bp, of renewable generating capacity that has been developed to the point of final investment decision. b A wage that meets employees’ basic needs. Analysis excluded employees in recently acquired companies. c In 2023 we reset our supplier diversity target from $1 billion to $650 million annual spend by 2025, see page 71. To support our teams, we provide human rights training and other awareness-raising activities. In 2023 this included training on identifying and managing labour rights and modern slavery risks. bp.com/humanrights
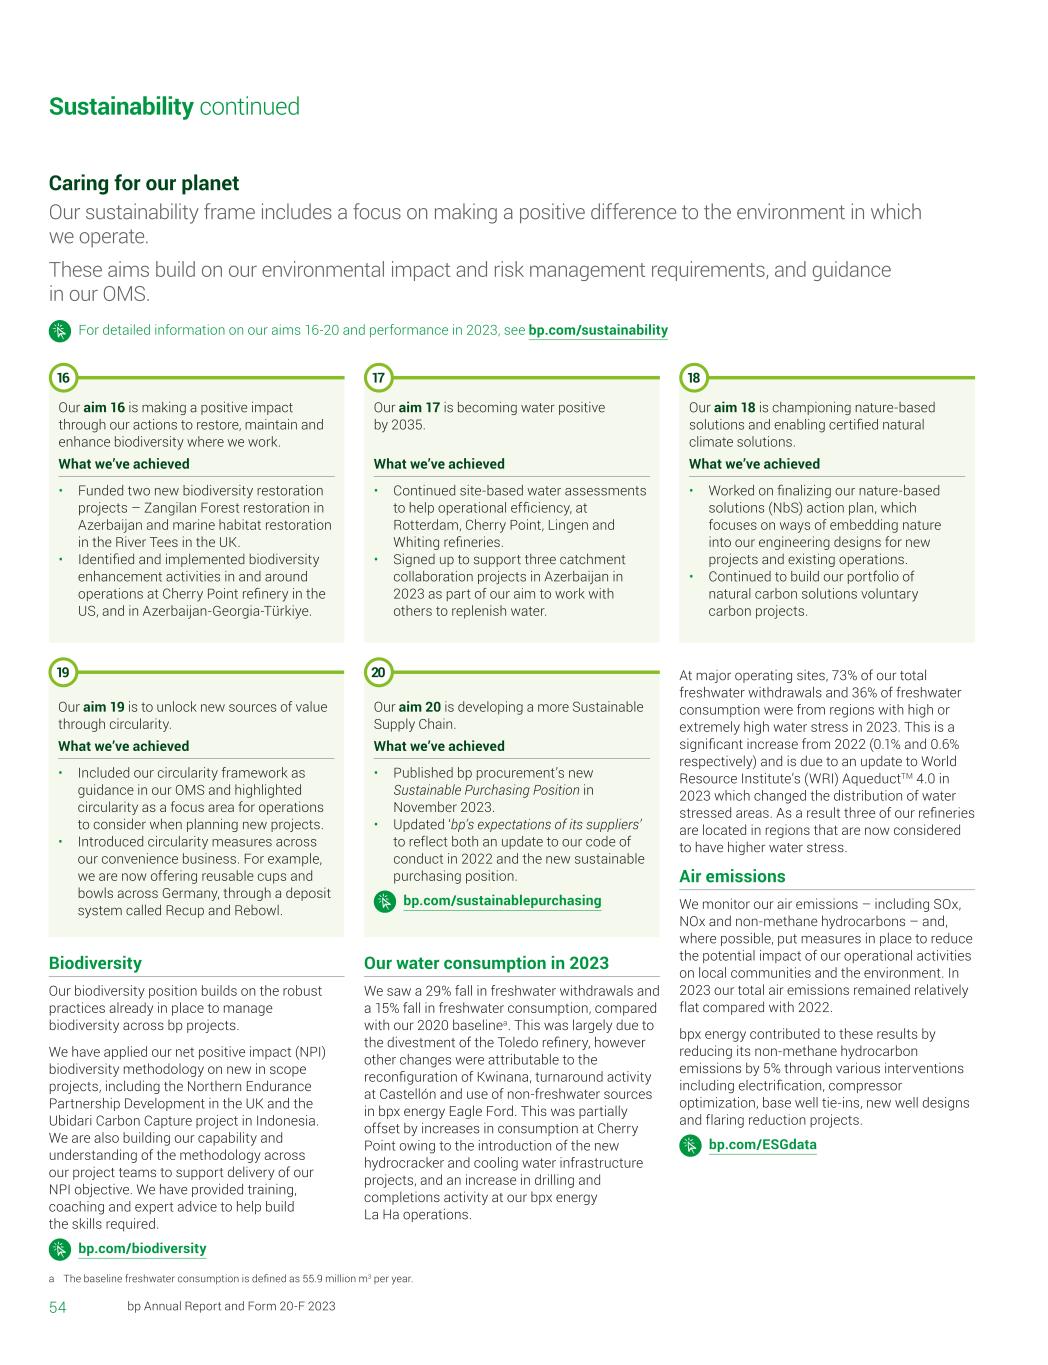
54 bp Annual Report and Form 20-F 2023 Caring for our planet Our sustainability frame includes a focus on making a positive difference to the environment in which we operate. These aims build on our environmental impact and risk management requirements, and guidance in our OMS. For detailed information on our aims 16-20 and performance in 2023, see bp.com/sustainability Biodiversity Our biodiversity position builds on the robust practices already in place to manage biodiversity across bp projects. We have applied our net positive impact (NPI) biodiversity methodology on new in scope projects, including the Northern Endurance Partnership Development in the UK and the Ubidari Carbon Capture project in Indonesia. We are also building our capability and understanding of the methodology across our project teams to support delivery of our NPI objective. We have provided training, coaching and expert advice to help build the skills required. bp.com/biodiversity 19 Our aim 19 is to unlock new sources of value through circularity. What we’ve achieved • Included our circularity framework as guidance in our OMS and highlighted circularity as a focus area for operations to consider when planning new projects. • Introduced circularity measures across our convenience business. For example, we are now offering reusable cups and bowls across Germany, through a deposit system called Recup and Rebowl. 18 Our aim 18 is championing nature-based solutions and enabling certified natural climate solutions. What we’ve achieved • Worked on finalizing our nature-based solutions (NbS) action plan, which focuses on ways of embedding nature into our engineering designs for new projects and existing operations. • Continued to build our portfolio of natural carbon solutions voluntary carbon projects. 17 Our aim 17 is becoming water positive by 2035. What we’ve achieved • Continued site-based water assessments to help operational efficiency, at Rotterdam, Cherry Point, Lingen and Whiting refineries. • Signed up to support three catchment collaboration projects in Azerbaijan in 2023 as part of our aim to work with others to replenish water. 20 Our aim 20 is developing a more Sustainable Supply Chain. What we’ve achieved • Published bp procurement’s new Sustainable Purchasing Position in November 2023. • Updated ‘bp’s expectations of its suppliers’ to reflect both an update to our code of conduct in 2022 and the new sustainable purchasing position. bp.com/sustainablepurchasing Our water consumption in 2023 We saw a 29% fall in freshwater withdrawals and a 15% fall in freshwater consumption, compared with our 2020 baselinea. This was largely due to the divestment of the Toledo refinery, however other changes were attributable to the reconfiguration of Kwinana, turnaround activity at Castellón and use of non-freshwater sources in bpx energy Eagle Ford. This was partially offset by increases in consumption at Cherry Point owing to the introduction of the new hydrocracker and cooling water infrastructure projects, and an increase in drilling and completions activity at our bpx energy La Ha operations. At major operating sites, 73% of our total freshwater withdrawals and 36% of freshwater consumption were from regions with high or extremely high water stress in 2023. This is a significant increase from 2022 (0.1% and 0.6% respectively) and is due to an update to World Resource Institute’s (WRI) AqueductTM 4.0 in 2023 which changed the distribution of water stressed areas. As a result three of our refineries are located in regions that are now considered to have higher water stress. Air emissions We monitor our air emissions – including SOx, NOx and non-methane hydrocarbons – and, where possible, put measures in place to reduce the potential impact of our operational activities on local communities and the environment. In 2023 our total air emissions remained relatively flat compared with 2022. bpx energy contributed to these results by reducing its non-methane hydrocarbon emissions by 5% through various interventions including electrification, compressor optimization, base well tie-ins, new well designs and flaring reduction projects. bp.com/ESGdata 16 Our aim 16 is making a positive impact through our actions to restore, maintain and enhance biodiversity where we work. What we’ve achieved • Funded two new biodiversity restoration projects – Zangilan Forest restoration in Azerbaijan and marine habitat restoration in the River Tees in the UK. • Identified and implemented biodiversity enhancement activities in and around operations at Cherry Point refinery in the US, and in Azerbaijan-Georgia-Türkiye. Sustainability continued a The baseline freshwater consumption is defined as 55.9 million m3 per year.
55bp Annual Report and Form 20-F 2023 Strategic report See glossary on page 373 We support the recommendations of the Task Force on Climate-related Financial Disclosures (TCFD), which was established by the Financial Stability Board to improve the reporting of climate-related risks and opportunities. Climate-related financial disclosuresa Our aim 9 is to be a recognized industry leader in the transparency of reporting and we want to work constructively, where possible, with the TCFD, and others, to develop good practices and standards for transparency. In 2023 we continued to work with the World Business Council for Sustainable Development (WBCSD) in relation to their ongoing ’Climate Scenario Analysis Reference Approach for Companies in the Energy System’. Read about how we have used the WBCSD Scenario Catalogueb to inform our own scenario analysis on page 66. TCFD statement We report in line with the FCA Listing Rule LR 9.8.6(8)c, which requires us to report on a ‘comply or explain’ basis against the TCFD Recommendations and Recommended Disclosures in respect of the financial year ended 31 December 2023d. We consider our climate-related financial disclosures to be consistent with all of the TCFD Recommendations and Recommended Disclosures and that they are therefore compliant with Listing Rule 9.8.6(8). We have set out our disclosures against each TCFD Recommended Disclosure and in doing so have covered both the Recommended Disclosure and the related Recommendatione. We have made disclosures that take into consideration references made to the materiality of information in the Recommendations related to Strategy and Metrics and Targets. In determining materiality for these purposes we considered whether particular information may have the potential to influence the economic decisions of our shareholders. We have also, where appropriate, considered the TCFD guidance and other supporting materials referred to in the Listing Rulesf. In the Strategy (b) section below, we describe elements of our plans for the transition to a lower carbon economy as we execute our strategy. As explained on page 14, we consider our strategy to be consistent with the goals of the Paris Agreement. The strategy has been developed taking into consideration, among other things, the bp Energy Outlook 2023 scenarios (described on page 10), which take account of climate commitments and pledges made by countries in which we operate alongside a range of other factors. In preparing our disclosures we have made several judgements, and while we are satisfied that they are consistent with the TCFD Recommendations, Recommended Disclosures and reporting requirements under the UK CFD Regulations, we will continue to evaluate our options for future disclosures. We will monitor guidance as it evolves and consider opportunities to enhance our disclosures. Governance TCFD Recommendation: Disclose the organization’s governance around climate-related issues and opportunities. Recommended Disclosure: a. Describe the board’s oversight of climate-related risks and opportunities. b. Describe management’s role in assessing and managing climate-related risks and opportunities. The role of the board is to promote the long-term sustainable success of the company, generating value for our shareholders while having regard to the interests of our other stakeholders and the impact of our operations on the communities where we operate and the environment. In performing this role, the board sets and monitors bp’s strategy. It is responsible for monitoring bp’s management and operations and obtaining assurance about the delivery of its strategy. Any changes to the company’s purpose, strategy and values (which we call ‘Who we are’) are reserved for the board for approval in accordance with the board-approved corporate governance framework. The board’s responsibilities extend to oversight of bp’s internal control and risk management framework, including climate-related risks and opportunities. These responsibilities are set out in the terms of reference of the board, available online at bp.com/governance. The board considers that our strategy allows bp to be flexible to adapt to the evolution of the external environment, including market changes, to remain consistent with the Paris goals, see page 33. The board and its committees have oversight of climate-related issuesg, which include climate-related risks and opportunities. Board and committee activities in respect of climate- related risks and opportunities are set out within the board activities section and committee reports respectively, which can be found on the pages detailed in the table on page 56. Climate-related risks and opportunities were discussed at each board meeting covering strategy in 2023, and the committees considered climate-related issues where appropriate to do so in fulfilling their responsibilities. Oral reports from each of the committee chairs are given at board meetings to keep the board apprised of the relevant matters discussed including, where applicable, climate-related risks and opportunities. The board also reviewed documents containing climate-related disclosures. a This section provides disclosures pursuant to the FCA Listing Rule LR 9.8.6(8) and in line with the Companies (Strategic Report) (Climate-related Financial Disclosure) Regulations 2022 (The UK CFD Regulations). In the main, we consider our TCFD disclosures achieve UK CFD compliance. Where additional information has been provided beyond our TCFD disclosures to achieve compliance with the CFD Regulations, this has been specifically called out. b Our 2023 analysis used data from the WBCSD Climate Scenario Catalogue version 2.0, published on 31-03-2023 and downloaded on 01-02-2024. c https://www.handbook.fca.org.uk/instrument/2020/FCA_2020_75.pdf. d In considering the consistency of our disclosures with the TCFD Recommendations and Recommended Disclosures we have had regard to, among other things, the documents referred to in LR 9.8.6B and 6C, as applicable to the financial year 2023. e In preparing the disclosures we have referred to the TCFD implementation guidance ’Annex: Implementing the Recommendations of the Task Force on Climate-related Financial Disclosures (October 2021)’, available from fsb-tcfd.org/publication. f LR 9.8.6B and LR 9.8.6C. g We interpret the term ’climate-related issues’ to relate primarily to those climate-related risks and opportunities for bp which are relevant to the delivery of long-term shareholder value in the context of the low carbon transition.
56 bp Annual Report and Form 20-F 2023 The board continues to develop its knowledge and expertise on climate-related and sustainability matters. For example, in 2023, the board took part in the following: Renewables and power transition growth engine update Included recent progress on and plans for offshore wind. Held to assist the board in remaining abreast of key energy transition risks and opportunities. Hydrogen transition growth engine update Held to assist the board in remaining abreast of key energy transition risks and opportunities. Energy and economic update The briefing was given by our chief economist on developments shaping the key political and societal trends currently affecting the energy transition, following publication of the bp Energy Outlook 2023 in January 2023. Given to assist the board in remaining abreast of key developments fundamental to implementation of bp’s strategy and net zero ambition and aims. The board is due to receive further updates on bp’s transition growth engines and climate and sustainability in 2024. Our company secretary’s office manages the process by which board and committee agendas are set and works closely with teams in bp to develop materials that assist the board to discharge its responsibilities, including in respect of climate-related issues. The board believes its members possess the necessary expertise related to climate change and sustainability to support the group’s strategy. In particular, six of our non-executive directors have specific climate change and sustainability expertise, as set out here. This determination is based on an assessment of their background and experience, with focus on their background in the energy sector, experience in executive roles and depth of experience in sustainability and climate change, including climate-related risks and opportunities. For more general director skills information, see page 96, for director’s biographies see pages 83-85 and bp.com/board • Dame Amanda Blanc is the current serving CEO at Aviva plc and has held several executive roles across the industry. She is co-chair of the UK Transition Taskforce and Principal Member of Glasgow Financial Alliance for Net Zero (GFANZ). • Helge Lund has extensive experience in the energy sector and deep knowledge and global experience including stakeholder considerations regarding climate change risk and opportunities. He has chaired the board through the development of bp’s strategy and net zero ambition and continues to have oversight of the delivery of that strategy. He served as a member of the UN Secretary- General’s Advisory Group on Sustainable Energy from 2011 to 2014. • Hina Nagarajan has over 30 years’ experience in senior roles within the customer-focused FMCG sector, which is invaluable in support of bp’s convenience transition growth engine. As CEO of United Spirits Limited (Diageo plc’s listed Indian subsidiary), she has overseen the implementation of Diageo India’s 10-year ESG action plan, and its Society 2030 mission, in addition to a number of other sustainability initiatives. • Johannes Teyssen brings CEO experience from his time at EoN, where under his leadership, it split its hydrocarbons and non-hydrocarbons businesses – giving him significant experience of considering climate-related risks and opportunities. He has sat on bp’s safety and sustainability committee since 2021. He is a director of Alpiq Holding AG, a Swiss energy services provider and electricity producer in Europe. • Melody Meyer has deep-rooted operational experience in the energy sector which equips her to advise on climate-related risks and opportunities. She has chaired bp’s safety and sustainability committee since November 2019, which oversees the implementation of bp’s sustainability framework and net zero ambition. • Satish Pai has extensive experience in the resource and energies industries. He is managing director of metals company, Hindalco Industries Limited, and leads the company’s Sustainability Board in overseeing sustainability initiatives – such as sustainable mining practices, energy conservation and recycling. He has served on the bp safety and sustainability committee since March 2023. Board and committees’ consideration of climate-related issues For examples from the year ended 31 December 2023, see the text indicated with a on the pages set out below. The board pages 90-91 People and governance committee page 94 Audit committee page 98 Safety and sustainability committee page 103 Remuneration committee page 105 Climate-related financial disclosures continued
57bp Annual Report and Form 20-F 2023 Strategic report See glossary on page 373 The role of management The board, subject to certain conditions and limitations, delegates day-to-day management of the business of the company to the CEO. The CEO is responsible for proposing bp’s strategy to the board for approval and leading the bp leadership team in delivering bp’s strategy and annual plan. Under this delegation, the CEO is responsible for overseeing the implementation of a comprehensive system of internal controls that are designed to, among other things (a) identify and manage risks that are material to bp, (b) protect bp’s assets, and (c) monitor the application of bp’s resources in a manner that meets external regulatory standards. Risks, for these purposes, include the climate-related risks and opportunities for bp associated with the issue of climate change and the transition to a lower carbon economy. This is set out in the CEO role profile at bp.com/board. The assessment and management of climate- related risks and opportunities is embedded across bp at various levels and delegated authority flows down from the board through the CEO. See page 73 for more information on risk governance and oversight. Management consideration of climate-related risks and opportunities is organized as follows: Resource commitment meeting Forum for approval of investments related to existing and new lines of business above $250 million or $25 million for acquisitions, or which exceed the relevant EVP financial authority, and any project considered strategically important such as a new market entry, see page 31. Group sustainability committee Provides oversight, challenge and support in the implementation of bp’s sustainability frame and the management of potentially significant non-operational sustainability (including climate-related) risks and opportunities. It met four times in 2023. During 2023 the committee considered progress embedding sustainability, performance against targets and bp’s position on certain strategic sustainability issues that present risks or opportunities to delivery. This committee is chaired by the EVP strategy, sustainability & ventures (SS&V) and comprises members of the bp leadership team. The outputs from the committee are shared with the board and its committees, including the safety and sustainability committee, as appropriate. Group operational risk committee Provides oversight of safety and operational risk management performance for the group, where appropriate. Climate-related factors may affect certain sources of safety and operational risk, such as severe weather events. Group financial risk committee Monitors the effectiveness of bp’s financial reporting, systems of internal control and financial risk management, namely material group financial risks. In 2023, in relation to climate-related risks and opportunities, it considered the proposed TCFD strategy disclosures and planned approach to assurance and verification of non-financial reporting (including climate-related reporting) ahead of discussion with the audit committee. 2023 activity Where considered appropriate, climate-related risks and opportunities were discussed at bp leadership team meetings in 2023 as part of regular business performance updates produced for these meetings. The bp leadership team provides oversight of risk, including climate-related risk, through the various committees described on page 73. The leadership team is informed about and monitors emerging risks via the ’emerging risk’ paper, produced by our SVP treasury, which focuses primarily on short- to medium-term emerging risk. Members of the leadership team receive information on the longer-term risks and opportunities associated with the energy transition via updates produced by our chief economist. These papers are shared with the board. SVP level and beyond The bp leadership team is supported by bp’s senior-level leadership and their respective teams, with dedicated business and functional expertise focused on climate-related risks and opportunities or on matters which may be affected by such risks and opportunities. This includes: health, safety, environment and carbon; risk; strategy and sustainability (which includes our carbon ambition, policy and economics teams). Alignment between group, business and functional leaders is fostered through other meetings, for example, the Strategy and Sustainability Management Forum in C&P or the TCFD working group which leads the preparation of bp’s TCFD disclosures. Acquired businesses Integration plans are developed to transition acquired businesses into bp’s system of internal control, over an appropriate timeframe.
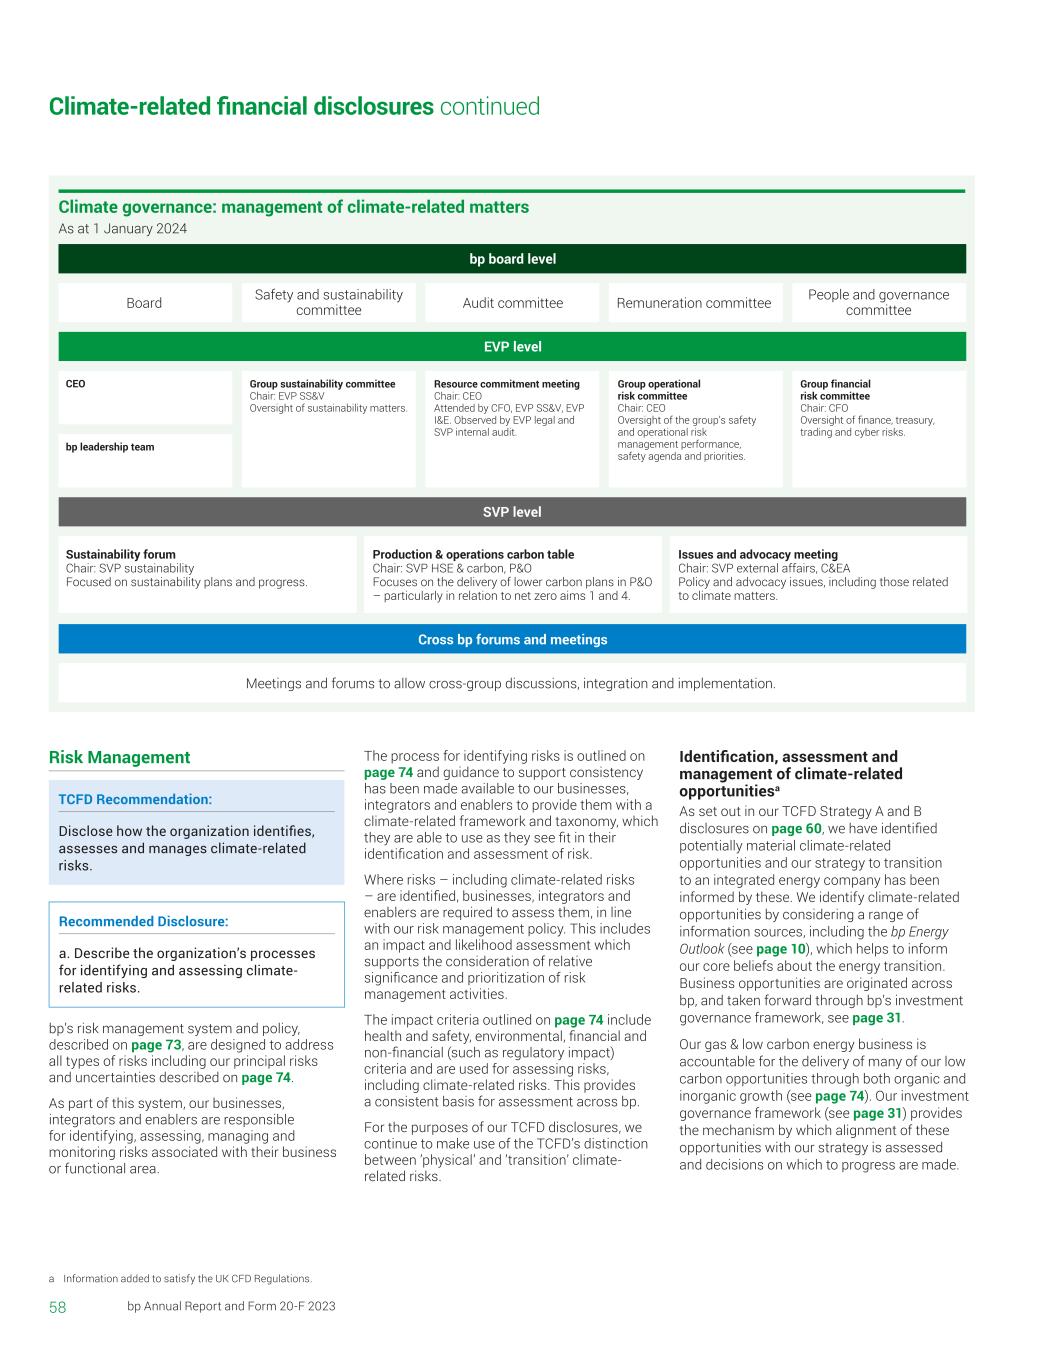
Climate governance: management of climate-related matters As at 1 January 2024 Board CEO bp leadership team Safety and sustainability committee Audit committee Remuneration committee People and governance committee bp board level EVP level Meetings and forums to allow cross-group discussions, integration and implementation. SVP level Cross bp forums and meetings Group sustainability committee Chair: EVP SS&V Oversight of sustainability matters. Group operational risk committee Chair: CEO Oversight of the group’s safety and operational risk management performance, safety agenda and priorities. Group financial risk committee Chair: CFO Oversight of finance, treasury, trading and cyber risks. Resource commitment meeting Chair: CEO Attended by CFO, EVP SS&V, EVP I&E. Observed by EVP legal and SVP internal audit. Sustainability forum Chair: SVP sustainability Focused on sustainability plans and progress. Production & operations carbon table Chair: SVP HSE & carbon, P&O Focuses on the delivery of lower carbon plans in P&O – particularly in relation to net zero aims 1 and 4. Issues and advocacy meeting Chair: SVP external affairs, C&EA Policy and advocacy issues, including those related to climate matters. 58 bp Annual Report and Form 20-F 2023 Risk Management TCFD Recommendation: Disclose how the organization identifies, assesses and manages climate-related risks. Recommended Disclosure: a. Describe the organization’s processes for identifying and assessing climate- related risks. bp’s risk management system and policy, described on page 73, are designed to address all types of risks including our principal risks and uncertainties described on page 74. As part of this system, our businesses, integrators and enablers are responsible for identifying, assessing, managing and monitoring risks associated with their business or functional area. The process for identifying risks is outlined on page 74 and guidance to support consistency has been made available to our businesses, integrators and enablers to provide them with a climate-related framework and taxonomy, which they are able to use as they see fit in their identification and assessment of risk. Where risks – including climate-related risks – are identified, businesses, integrators and enablers are required to assess them, in line with our risk management policy. This includes an impact and likelihood assessment which supports the consideration of relative significance and prioritization of risk management activities. The impact criteria outlined on page 74 include health and safety, environmental, financial and non-financial (such as regulatory impact) criteria and are used for assessing risks, including climate-related risks. This provides a consistent basis for assessment across bp. For the purposes of our TCFD disclosures, we continue to make use of the TCFD’s distinction between ’physical’ and ’transition’ climate- related risks. Identification, assessment and management of climate-related opportunitiesa As set out in our TCFD Strategy A and B disclosures on page 60, we have identified potentially material climate-related opportunities and our strategy to transition to an integrated energy company has been informed by these. We identify climate-related opportunities by considering a range of information sources, including the bp Energy Outlook (see page 10), which helps to inform our core beliefs about the energy transition. Business opportunities are originated across bp, and taken forward through bp’s investment governance framework, see page 31. Our gas & low carbon energy business is accountable for the delivery of many of our low carbon opportunities through both organic and inorganic growth (see page 74). Our investment governance framework (see page 31) provides the mechanism by which alignment of these opportunities with our strategy is assessed and decisions on which to progress are made. Climate-related financial disclosures continued a Information added to satisfy the UK CFD Regulations.
59bp Annual Report and Form 20-F 2023 Strategic report See glossary on page 373 Recommended Disclosure: b. Describe the organization’s processes for managing climate-related risks. c. Describe how processes for identifying, assessing and managing climate-related risks are integrated into the organization’s overall Risk Management. Risk Management process Risks which may be identified include potential effects on operations at asset level, performance at business level and developments at regional level from extreme weather or the transition to a lower carbon economy. As part of our annual process the bp leadership team and board review the group’s principal risks and uncertainties. Climate change and the transition to a lower carbon economy continues to be identified as a principal risk, see page 75. It covers various aspects of how risks associated with the energy transition could manifest. Physical risks such as extreme weather, which may be affected or intensified by climate change, are covered in our principal risks related to safety and operations. Physical risk Physical risks are typically identified at the asset or project level and are managed depending on the level of risk assessed. In the North Sea and Gulf of Mexico, regions more prone to severe weather conditions, our offshore facilities monitor meteorological and oceanographic conditions through the collection of measurements. This data is collated and periodically compared against the ’Basis of Design’ for the facility. If significant differences are observed, then this may trigger an update to the ’Basis of Design’, prompting action to reassess risks such as structural integrity and station-keeping and if necessary, implement additional risk mitigations, for example updating procedures for shutting down and removing personnel from facilities ahead of severe weather events. Updates may also be made as a result of other new knowledge, analysis methods and data, including climate projections where appropriate. Our major projects are required to assess the potential impact of severe weather and projected climate-related physical impacts. Where relevant, potential changes in environmental conditions, such as sea level rise and ambient temperatures, over the expected lifetime of a project are to be considered as part of the design process. Building on a modelling exercise conducted in 2022, in 2023 we implemented a screening approach to support identification of potential severe weather and physical climate-related hazards at operational sites. Screening was conducted for a number of onshore sites and, where potential hazards have been identified, and as appropriate, this enables further work to be carried out to assess potential risks and implement appropriate management measures. For other assets, such as our retail sites , that are typically not exposed to a comparable level of severe weather risk, climate-related risks such as flooding or wind damage may be managed where appropriate through the emergency response plans and business continuity plans which are mandated through company-wide policies. Additionally, at a group level we recognize risk associated with the potential for increased water scarcity due to climate change and other factors and the impact this could have on our operations and in the catchments where we operate. In order to understand the water-related challenges that we face, we review our water impacts, risks and opportunities at our major operating sites. These reviews consider the quantity and quality of water used as well as any regulatory requirements. Over time, we anticipate site-level activities in support of our aim 17 contributing to our management of water-related risks and opportunities. Under aim 17, we aim to replenish more fresh water than we consume in our operations by being more efficient in operational freshwater use and effluent management. And, by collaborating with others to replenish fresh water in stressed and scarce catchment areas where we operate. Transition risk The board appraises bp’s strategy and monitors bp’s management and operations to obtain assurance over the delivery of its strategy. This approach enables the effective management of climate-related transition risks and opportunities facing bp associated with the energy transition. For the purposes of our TCFD disclosures, we have grouped transition risks identified by our businesses, integrators and enablers, into the three broad material climate- related transition risks to bp, see page 61. However, we continue to assess and manage the component parts of those broad transition risks, including: Policy and legal risks Our policy and partnerships team monitors and develops policy positions in line with bp’s sustainability aims. This team works with our regional organization as well as corporate entities to discuss regional and global policy trends and support external positioning and interactions relating to policy and advocacy topics. Our group sustainability committee provides oversight of sustainability matters and our issues and advocacy meeting covers emerging advocacy issues. Our legal team manages bp’s litigation, including climate-related litigation and advises on the management of associated risks. This includes the use of internal lawyers and, where appropriate, external counsel. Market risks In developing our business strategies, we consider market risks, controls and mitigations, including future demand in the different geographies in which we might operate, the competitive landscape and the potential value proposition. We manage these risks through our investment decisions, our hedging and optimization activity, and through key business processes, including the group investment assurance and approval process. Reputational risks Our investor relations and communications & external affairs (C&EA) teams work to mitigate reputation-related risks, which include the risk of shareholder action. Our investor relations team co-ordinates engagement with key investors on both a bilateral basis and through investor initiatives to support understanding of bp’s strategy and gain insights to inform feedback they provide to the group. Our C&EA team manages corporate reputation through identification and monitoring of key issues and both proactive and reactive engagement with relevant stakeholder groups to communicate bp’s positions. Under our aim 6, which is to actively advocate for policies that promote net zero, the team also leads advocacy campaigns for policies that support net zero, see page 50. Technology risks Our technology team works to both mitigate risks and identify opportunities associated with evolving and emerging technologies that play a role in the changing global energy system. The team generates technology assessments and disruptive technology reports for review by bp senior executives and the recommendations are overseen by the bp leadership team, through the Innovation Advisory Council. In appropriate cases this helps to underpin and appraise the business case for new investments, new partnerships, new customer offers or new business models where these are being driven by technology innovation.
60 bp Annual Report and Form 20-F 2023 Strategy TCFD Recommendation: Disclose the actual and potential impacts of climate-related risks and opportunities on the organization’s business, strategy and financial planning where such information is material. Recommended Disclosure: a. Describe the climate-related risk and opportunities that the organization has identified over the short, medium, and long term. In setting and monitoring delivery of bp’s strategy, the board and leadership team consider climate-related risks and opportunities across the: • Short term (to 2025): aligning with our near-term business and financial planning timeframe. • Medium term (to 2030): aligning with our group business outlook timeframe, and enabling us to think beyond our short-term targets and adjust course if appropriate. • Long term (to 2050): using scenarios to help explore the wide range of uncertainties surrounding the energy transition over the next 30 years. For more detail on our approach, see page 11. TCFD categorizes climate-related transition risk and opportunity as follows: policy and legal, market, reputation and technology. It also refers to climate-related acute and chronic physical risks and opportunities. Risks in each of these categories have been identified using a risk management process that our businesses, integrators and enablers are required to follow. For more about how the relative significance of identified risks is evaluated, see Risk Management on page 58. Climate-related transition risks and opportunities At a group level, we have identified three broad, material climate-related transition risks, underpinned by underlying risks that are assessed and managed through the risk process outlined overleaf on page 61. These transition risks may cut across our short-, medium- and long-term time horizons; however, we indicate below wherever there is a particular time horizon in which the risk has been considered. The transition risks are also global in nature, so we do not discuss specific geographies here, but the underlying risks refer to specific geographies a Underlying risks are specific, for example, local or business-specific risks identified by specific bp entities through the risk processes described above under Risk Management. b This is not intended to be an exhaustive list of our plans for the transition, but rather illustrative of some of the core elements of our plans. where appropriatea. We also see significant potential for upside – or opportunity – associated with some of these risks. These are discussed under each risk on page 61 and in relation to Recommended Disclosure (b) we also describe the potential impacts of both the risks and opportunities to bp. Climate-related physical risks The physical risks we have identified primarily relate to severe weather and often represent potential for increased drivers for safety and operational risks to our operations, particularly process safety, personal safety, and environmental risks, see Risk factors page 77. In addition, we have identified the potential for changes in the availability of freshwater, including as a result of climate change, as a risk to some of our operations. Higher instances of extreme weather also have the potential to impact supply chains and critical infrastructure, such as air and sea ports, as well as our customers. We recognize that we could also face other forms of physical climate-related risk over the longer term, for example associated with changes in sea level rise, extreme temperatures and flooding, which could impact our operations. As these risks are primarily operational, and location-specific, they are not grouped in the same way as transition risks. Offshore facilities In the case of our offshore facilities, climate change could create greater uncertainty around frequency and/or intensity of severe weather events, such as extreme waves, loop currents, and storms, particularly in the medium to long term. These factors could affect the future risk profile of an asset over its lifetime, and could also impact production or costs. Water resources Water resources are increasingly under pressure from various factors, including climate change, and this poses a potential risk to some of our operations that depend on the availability of freshwater. Based on analysis using the World Resources Institute (WRI) Aqueduct Global Water Risk Atlas, eight of our 17 major operating sites in 2023 were located in regions with medium to extremely high water stress. We have identified the potential for this risk to increase in the medium term. For more on water consumption, see page 54. Climate-related financial disclosures continued In common with other businesses around the world, in the longer term we could face adverse market or value chain conditions associated with large-scale cumulative impacts of physical climate change if global mitigation and adaptation efforts are insufficient or unsuccessful. We support the goals of the Paris Agreement and believe that the best mitigation against these types of physical risk is to seek to contribute along with others to the success of global climate mitigation efforts. Our strategy seeks to position us to make such a positive contribution. We do not currently foresee any material opportunities arising from changes in the physical environment as a result of climate change. However, the actions we are taking to make our operations more resilient, for example through improving efficiency of our freshwater use, may also bring about benefits such as reduced costs. Recommended Disclosure: b. Describe the impact of climate-related risks and opportunities on the organization’s businesses, strategy, and financial planning. bp’s plans for the energy transition We describe below how we believe our strategy and net zero ambition are both good for business and support society’s drive towards the Paris goals. In this section we talk about some of our plans for the transition and where we do so we have identified these with .b Throughout the strategic report we set out bp’s strategy and plans for the energy transition. This includes our progress against our strategic pillars and transition growth engines, see pages 18-23. Our progress against our net zero aims and the actions we are taking to help the world get to net zero are described on pages 48-50. Our strategy is to transition to be an integrated energy company, focused on delivering solutions for customers. This strategy, together with our net zero ambition and aims (see page 48), has been informed by various inputs, including the climate-related risks and opportunities associated with the energy transition described above; the same is true of our financial and business processes. We describe how we use scenarios to inform our strategy on page 11.
61bp Annual Report and Form 20-F 2023 Strategic report See glossary on page 373 Our ambition is to be a net zero company by 2050 or sooner, and to help the world get to net zero. Resilient hydrocarbons: recognizing the uncertainty that the energy transition presents to our hydrocarbons business, our focus for that area of our business remains on high-grading our portfolio while maximizing returns and cash flow and working to reduce operational emissions. This focus is underpinned by a resource base that allows us to choose the best investments and the optionality to allocate capital through the transition; we also plan to divest around 200,000 barrels of oil equivalent per day of lower margin assets by 2030. We have made strong progress on improving operational reliability and commerciality across our portfolio over the past few years, which we expect to help enhance the resilience of those assets through the transition. We expect our 2030 production to be around 2mmboe/d after divestments. To enable resilience to lower oil and gas prices which could result from the transition, as well as to deliver value, we intend to maintain the disciplined application of our balanced investment criteria, which include the consideration of hurdle rates of 15-20% from a balanced portfolio across oil and gas. We also intend to drive capital productivity through strong execution capability and sustain cost efficiency and reliability improvements. See more about our investment process on page 30. We are aiming for the Scope 1 and 2 emissions from our operations – the majority of which are associated with the operating assets in our hydrocarbons portfolio (refining and upstream oil and gas combined) – to be 50% lower in 2030 than in 2019, and the Scope 3 emissions associated with our upstream oil and gas production to be 20-30% lower in 2030 than in 2019, see page 48. Climate-related transition risks and opportunities #1 The value of our hydrocarbon business could be impacted by climate change and the energy transition. Changes in policy, legislation, consumer preferences or markets as a result of growing concerns about climate change and the energy transition could reduce demand for fossil fuels or lower their price relative to our financial planning assumptions, particularly in the medium to long term, negatively impacting returns from or the value of our hydrocarbon businesses. Changes in regulations, including carbon pricing and fossil fuel policies, could also impact compliance and operating costs in our oil and natural gas production and refining businesses. Alternatively, demand and/or prices for oil and natural gas and refined products during the next decade could be higher than our financial planning assumptions under certain transition pathways, including those aligned with the Paris agreement. This could strengthen returns from our hydrocarbon businesses (including securing higher proceeds from assets we choose to divest) which may enable us to deliver enhanced shareholder value, further strengthen our balance sheet and grow investment in the transition, in line with our financial frame. #2 Our ability to grow or deliver expected returns from our transition growth engines could be impacted by the energy transition. Several factors could restrict the growth of our transition engines or returns from them. These factors include: lack of, or insufficient development and application of, policies, regulations and frameworks that support low carbon businesses; insufficient consumer demand for our low carbon offering; strong competition in the market; or the insufficiently rapid development of supporting technologies and infrastructure or constraints on supply chains for low carbon energies. This could particularly impact bp in the short to medium term as we seek to grow our low carbon businesses but could also represent a longer-term risk. Alternatively, demand, policy support or enabling technology and supply chain growth for renewables could support a more rapid portfolio shift with expansion of our low carbon businesses and higher returns from them. Some low carbon businesses, including renewable power, bioenergy and emerging technologies such as hydrogen and carbon capture and storage (CCS), rely on policy support to promote growth. Our aim 6 is to advocate more actively for policies that support net zero, including carbon pricing (see page 50). Changes in customer preferences, pace of technology and infrastructure development and costs could impact the markets for low carbon products and services. For example, the pace of adoption of electric vehicles (EV) could impact utilization rates, and consequently returns, from our EV charging networks. We recognize that the pace of our transition relative to our core low carbon target sectors and regions is important. If we move more slowly than those markets, we may miss investment opportunities and customers may prefer different suppliers with potential negative consequences to demand for our products and to our reputation. If we move faster than these markets, we risk investing in technologies or low carbon products that are unsuccessful because there is insufficient demand for them. However, our investment may also help to stimulate demand and provide us with a leading position in growth markets. #3 Our ability to implement our strategy could be impacted by changing stakeholder attitudes towards the energy sector, climate change and the energy transition. Negative perceptions of the energy sector, or bp, could have a number of consequences, for example: adverse litigation; reputational impacts, including our ability to attract and retain talent; and shareholder action. These consequences could affect us in the short, medium or long term. Alternatively, increased support from our stakeholders could enable access to additional capital and new investors, strengthening our ability to deliver our strategy and enabling faster growth of our low carbon businesses. The bp Energy Outlook 2023 (see page 10) suggests that the increased attention on energy security is likely to accelerate the energy transition. Together with the strategic progress we are making, this gives us growing confidence in the opportunities of the energy transition. Perceived inconsistencies between the pace of bp’s transition and societal expectations could have reputational and commercial impacts that might impair our ability to deliver our strategy. However, we also see potential to positively differentiate bp, by delivering against our strategy, ambition and aims.
62 bp Annual Report and Form 20-F 2023 We see cash flow from our oil and gas businesses as helping to fund our investment into transition growth engines, while delivering shareholder value and helping maintain a strong balance sheet. The climate-related transition risks we have identified may also impact demand for certain refined products in the future, potentially leading to lower refinery margins and requiring less efficient refineries to be retired. Consequently, we are continuing to drive greater competitiveness and value from our refineries, targeting around 96% Solomon refining availability by 2025 and to maintain Solomon first quartile net cash margins. Our refineries are also a foundation for both our bioenergy and hydrogen transition growth engines. In biofuels, we plan to grow production to around 100,000 barrels per day by 2030 (of which ~20,000 barrels would be from co- processing at our refineries). In hydrogen, our existing refining demand is intended to be an anchor to build scale. As a result, we expect throughput to be sustained around current levels while the average carbon intensity of our refined products declines. Taking account of some of the climate-related transition opportunities we have identified, we also aim to increase biogas supply volumes , leveraging our position as the largest US biogas supplier to the road transportation sector and expanding our presence in Europe and internationally. Convenience and mobility: given the opportunities in low carbon mobility that the energy transition offers, we are growing our EV charging network and seek to be a partner of choice for our customers as they navigate the energy transition. We are also expanding our Castrol business into the EV and industrial coolant sectors, and aiming to be a sector leader in sustainable aviation fuel (SAF) as the aviation industry transitions. We recognize the risk of a decline in demand for conventional vehicle fuels and products due to the energy transition and we are working to increase the efficiency and resiliency of our existing fuels and lubricants businesses through operating cost reductions and margin optimization. Our convenience (non-fuels) business is a sizeable and growing part of our mobility ecosystem underpinned by global growth in the convenience and food on-the-go sector. Forecourt convenience is expected to grow in general, even in markets where we see faster fuels declines, helping us to retain and redevelop our retail sites through the energy transition as we deploy new energy sources. Our acquisition of TravelCenters of America in 2023 enables us to respond to demand growth signals and further expand our low carbon fuels offer and our non-fuel offer in the US. We will increase the resilience of our existing fuels network by growing our presence on major transit routes and with fleet customers. Our integrated business model across biofuels, hydrogen, liquefied natural gas (LNG) and electricity also helps to provide security of supply and to safeguard margins in a potentially supply-constrained faster transition or during periods of high market volatility. However, the speed of the energy transition may impact the pace at which the EV, SAF, biofuels, hydrogen and LNG sectors develop, which could impact revenue from these opportunities. Low carbon energy: we recognize the opportunity to scale up our low carbon energy businesses over the next decade underpinned by growing demand and regulatory support. In hydrogen, our ambition remains to become a global leader. We aim to leverage bp’s existing refinery demand and growing biofuels ambitions to build regional supply positions, providing low carbon hydrogen and hydrogen derivative solutions to our customers in line with the development of the hydrogen sector. We aim to selectively pursue opportunities to grow our low carbon hydrogen production where there is regulatory support and CCS access (blue hydrogen ) or significant sustained cost benefit (green hydrogen ). To mitigate uncertainties in the future pace of transition, our hydrogen opportunities are preferentially focused on advantaged locations, while our global hopper offers ongoing investment flexibility. In renewable power, we are focusing our investments in opportunities where we can create integration value and enhanced returns, participating in service of green hydrogen, and e-fuels, EV charging and power trading (including flexible generation). We are building a global position in offshore wind, enabled by our capability in large-scale, complex offshore projects, and continue to progress a solar development and sell model with Lightsource bp. Within this, we aim to deliver, and largely operate, around 10GW net installed capacity in offshore wind, solar and onshore wind by 2030. As the energy transition drives increasing electrification of the global energy system, our power trading business, which trades renewable and non-renewable electricity, allows us to optimize across the power value chain, from generation, including renewables and flexible generation, across grid markets, to customers. This becomes a differentiating factor in unlocking the full potential value of renewables for bp and helps position us for further electrification of the energy system as well as for further decarbonization of electricity. It may also increasingly help optimize across other value chains like green hydrogen and advanced mobility, that may be dependent on power as an anchor commodity. We retain the ability to flex capital between our transition growth engines to optimize returns, recognizing the potential for the transition to occur faster or slower than anticipated and on different pathways. To help maintain resilience to the possibility of a slower transition, we also continue to consider whether the necessary regulatory support is in place and seek to secure a customer-backed route to market for a reasonable share of energy produced by our renewable power and hydrogen projects prior to final investment. Impact on technology We are investing in digital and technology solutions that can help to generate value for bp, manage risk and help accelerate the transition through focused scale-up and innovation. Over time, we expect our research and development spend to be increasingly focused on technologies with the potential to reduce carbon emissions and enable our new low carbon businesses. See page 46 for examples of technology investments in 2023. We recognize the potential for disruptive technologies to impact our strategy. Alongside our research and development investments, our bp ventures portfolio also includes investments in emerging technologies and business models that may help enable the transition to a low carbon economy. Physical risk The potential impacts of the types of physical risks we have identified could include reduced production, throughput or sales – for example as a result of damage to facilities or supply chain disruption – or in a most extreme case loss of life or an asset. Due to uncertainties associated with the impact of climate change on severe weather events in the future, it is difficult to quantify the potential impacts associated with any increase in these risks as a result of climate change. Climate-related financial disclosures continued
63bp Annual Report and Form 20-F 2023 Strategic report See glossary on page 373 Having considered both geographic factors and the ability of climate models to adequately represent future trends in physical climate parameters, we seek to take the uncertainties concerning climate-related physical risk into account in our approach to design and operating criteria for existing assets and new major projects . Where appropriate, we have updated our metocean design criteria to include consideration of both forward-looking and historic models, including climate and synthetic models, in an attempt to mitigate both models and extrapolation uncertainty. The particular models chosen will depend in part on geographic location. See Risk Management, page 58, for how we manage these uncertainties. As a step in seeking to improve the resilience of our operations to the physical changes that might result from climate change that we have described above, we have undertaken screening of present-day and future potential physical risk exposure for selected key assets and identified those sites with potential for heightened exposure to physical risks in order to prioritize these for further site-based assessment. As part of this prioritized approach, in 2023 we completed a detailed site-based study at our Castellón refinery in Spain, which found that the weather hazard contributing the most to risks at site is intense summer storms. Taking account of the results of the study, the Castellón integrity management team are assessing new risk barriers to support mitigation of potential risks. Recognizing the potential impact of climate change on water resources, as part of our aim 17 to become water positive by 2035, we are taking steps to be more efficient in operational freshwater use and effluent management (see page 54). Impacts on our financial planning Capital allocation: We plan to invest sufficient capital to execute our strategy, enabling us to mitigate the risks and capture the opportunities we have identified. As part of our annual planning processes, we assess the distribution of capital across our business areas, including consideration of market evolution. In February 2024 we announced that we expect capital expenditure to be around $16 billion in 2024 and 2025; and in a range of $14-18 billion through to 2030. We expect the proportion of that investment directed annually towards our five transition growth engines to have grown by 2030 compared to 2024. To help maintain resilience to the pace of transition and access opportunities, we will continue to flex capital as policies, technologies and markets evolve. Access to capital: While there is potential for concerns about the energy transition to impact banks’ or debt investors’ appetite to finance hydrocarbon activity, we do not anticipate any material change to funding in the short to medium term, and our financial frame includes working to maintain a strong investment grade credit rating, targeting further progress on credit metrics within the ’A’ range. In 2022 we reduced our net debt by over $9 billion and by a further $0.5 billion in 2023. Since the end of 2019 we have repurchased around $24 billion of short-dated existing bonds and issued over $12 billion of new bonds with a duration of 20 years or longer, more than doubling the duration of our debt book to over 10 years. Additionally, we have continued to have good access to the commercial paper markets. Subject to maintaining a strong investment grade credit rating, we intend to allocate around 20% of surplus cash flow in 2024 to further strengthen the balance sheet. We provide more detail on financial risk factors, including liquidity risk in Financial statements – Note 29. Investment criteria: Investments are evaluated against a balanced set of investment criteria; the economic criteria utilize a set of price assumptions that reflect our view of market evolution (for our key investment appraisal price assumptions see page 30). In addition, the investment economics for all investment cases where annual greenhouse gas (GHG) emissions from operations are anticipated to exceed specific thresholds include a carbon price for those emissions, that rises to $100/teCO2e (2021 $ real) in 2030. When taking investment decisions we continue to consider six balanced investment criteria – including sustainability (see page 32). Impacts on financial performance and position Assessing the impact of climate change and the energy transition requires the use of a number of judgements and estimates. We have set out the significant accounting policies, judgements and estimates used in assessing the impact of climate change in Financial statements – Note 1. This includes information on pricing, useful economic lives, timing of implementation of policies or decommissioning provisions, and assumptions related to how each might change over time and how such assumptions may impact our currently reported assets and liabilities. Our price assumptions, including those set out on page 30, reflect a range of future possible scenarios and take account of the potential impact of climate-related risks and opportunities as well as current economic and geopolitical factors. Consequently, impairment losses and impairment reversals consider inputs that arise from climate change and the energy transition. It is not possible to quantify separately the impact of these different inputs on our impairments. However, in conducting our impairment sensitivity tests, that in part reflect transition downside risk, we consider prices within the range covered by the 1.5°C scenario family within the WBCSD data sets used for TCFD resilience testing below. Financial statements – Note 1 provides information on impairment assumptions and sensitivities. Note 4 provides information on gains and losses on disposal or closure of business and operations, and impairments and impairment reversals, and Note 8 provides information on impairment losses relating to exploration for and evaluation of oil and natural gas resources. See Financial statements – Note 1, Note 4 and Note 8 for more information. Recommended Disclosure: c. Describe the resilience of the organization’s strategy, taking into consideration different climate-related scenarios, including a 2°C or lower scenario. Our strategy is designed to be resilient to a range of climate-related scenarios, including those consistent with well-below 2°C and 1.5°C outcomes, see pages 14-15. As in 2022, to help test our view of this, we have assessed the resilience of our strategy to different climate-related scenarios, including 1.5°C consistent scenarios. We did this in three steps: 1. First, we evaluated all business areas in our portfolio by i) quantitatively assessing their financial significance, in the context of bp’s total financial frame, to understand the potential scale of financial/strategic impact that could be put at risk if exposed to transition uncertainty, including 1.5°C; and ii) considered whether there is a key variable – such as price, margin or demand – which would represent a principal transition driver of such risk.
64 bp Annual Report and Form 20-F 2023 2. Second, we quantitatively assessed the impact, to each business area, of potential transition exposure scenarios in 2030 – the point in our planning horizon at which there is widest transition uncertainty. – For each of those business areas with both sufficient scale and for which a specific transition risk driver was identified – which collectively represent over 80% of our 2030 adjusted EBITDA outlook – we performed a scenario analysis focused on that transition risk driver, across a range of transition pathwaysa, including 1.5°C, as set out below and in our methodology summary on page 66. – For each of the remaining business areas we performed a simplified quantitative scenario analysis, by testing the financial impact of ’a scenario in which each business area’s expected 2030 adjusted EBITDA is assumed to be reduced to zero – an outcome at least as detrimental to that business area’s adjusted EBITDA as could reasonably be expected to result from business-as-usual (BAU), well- below-2°C and 1.5°C transition pathways’. In this way, all business areas were quantitatively tested at, or beyond, a range of transition scenarios. 3. Finally, on the basis of the results of steps 1 and 2, we identified those business areas for which the possible consequences of the downside scenario(s) were sufficiently significant to potentially jeopardize group strategic resilience – the only business areas for which this was found to be the case were oil and gas production with respect to their exposure to oil price. For these business areas we assessed the potential implications for bp’s strategic resilience (as defined below) over the full period from 2025 to 2030. To undertake steps 2 and 3, we identified financial criteria which can be modelled as proxies for strategic resilience – choosing to do this through three lenses: our ability to continue to (i) deliver a resilient dividend to shareholders, (ii) maintain a strong investment grade credit rating, and (iii) make disciplined investment allocations within our capital frame. These are consistent with our assessment in 2022. This is not intended to represent a ’definition’ of resilience beyond the purposes of this exercise, and a core assumption of this analysis is necessarily that, aside from any implications of the scenarios being tested, including potential controllable mitigations such as capital or cost management that we might naturally expect to take in response, bp will deliver the assumed underlying strategic and financial priorities out to 2030. Our approach, described in more detail in box ’Our approach to testing resilience to transition risk’ on page 66, is directly applicable to transition risks #1 and #2 – as well as their associated opportunities – as these lend themselves to a financially quantified scenario- based analysis. The approach does not directly address transition risk #3 – however, we believe that some of the potential drivers for transition risk #3, namely policy and societal trends, may be implicit in these scenarios, and we believe that the successful execution of our strategy will, over time, help to mitigate this risk to bp as well as positioning us to take advantage of the potential associated opportunities. This scenario analysis exercise also does not directly address climate- related physical risk, our strategic resilience to which is further discussed below. Key insights from our scenario analysis and resilience test While the results of any such analysis must be treated with caution – each is necessarily dependent on numerous assumptions and methodological choices, and each has its own limitations – overall, this analysis and resilience test reinforced our confidence in the continued resilience of our strategy to a wide range of transition scenarios, including those consistent with limiting temperature rise to 1.5°C, and in particular, as our greatest transition exposure, to oil price scenarios, tested to 2030. In undertaking this analysis we observed: • There is considerable uncertainty across, and often within, each WBCSD Scenario Catalogue family in the pace and nature of the transition to 2030 – and therefore considerable range of financial impact across some of the variables selected for the analysis, reflecting the complexity and interdependencies of the energy transition (see table on page 67). Generally, we observed that the faster the pace of transition, the greater the uncertainty in the exact shape of the resulting energy system in 2030. • Oil price is likely to remain the main source of climate-related transition uncertainty for our strategy through to 2030, reflecting both the wide range of potential pathways and the contribution to our expected total adjusted EBITDA over this period, that oil-price-linked businesses representb. In the 1.5°C family, the potential downside suggested by the lowest oil prices is around 27% of group adjusted EBITDA in 2030. However, in a number of the scenarios based on the WBCSD Scenario Catalogue ranges, including those consistent with well-below 2°C and BAU families, oil price could offer a financial upside relative to our reference 2030 group business outlook. • Even with the most extreme low oil price environment in any of the scenarios, sustained over the period from 2025-30c and taking into account our ability to optimize our capital within the frames set out in our strategy (last communicated at the 10-11 October 2023 investor update), in our analysis we are able to deliver across the three lenses we use to consider strategic resilience, described above. • The maximum potential scale of downside impact on our 2030 expected group adjusted EBITDA (across the 1.5°C, well-below 2°C and BAU scenarios) from our other natural gas businesses was <6%,while from each of our conventional refining, fuels and low carbon activities was modelled to be <4%. • Our diversified portfolio helps mitigate the implications for our strategic resilience of the exposure of any of one of the individual business areas to the identified risk. It is reasonable to consider each potential outcome in isolation since the outcomes for different business areas vary across scenarios (see table on page 67). • In a BAU scenario, we believe our transitioning strategy mitigates the risk of what we and others have referred to as a ’delayed and disorderly’ transition, which might follow in the medium to long term. Should the growth of any one of our in-scope transition growth engine areas be challenged by the downside range in the relevant variable, our analysis suggests that the impact of this on group adjusted EBITDA in 2030 would not be sufficient to impact the resilience of our strategy, as described above, in that timeframe. a Although such scenarios do not and cannot represent all possible futures, we value them as a simplified and schematic way to consider the potential implications of, and uncertainty inherent within, a range of possible energy transition pathways to a future bp portfolio mix. b Note that for the purposes of our scenario analysis and resilience test, we have assessed the impact of oil price across both our oil production businesses and those natural gas businesses for which commercial outcomes are linked to oil price. c Our multi-year (2023-30) oil price resilience test considered sustained low oil prices consistent with the most extreme WBCSD Scenario Catalogue 2025 and 2030 scenarios – for 2025 the IEA (World Energy Model Net Zero Energy 2050) price at $52/bbl, and for 2030 the UN PRI (Inevitable Policy Response Required Policy Scenario) at $31.8/bbl (both 2021 $ real, and then inflated in line with bp’s other planning assumptions). Climate-related financial disclosures continued
65bp Annual Report and Form 20-F 2023 Strategic report See glossary on page 373 It is important to note that insights from this analysis are necessarily limited by the scenarios, methodologies and business assumptions used. The analysis should not be taken as a prediction of the future. Maintaining strategic resilience to the transition Taking into consideration potential constraints associated with factors such as long-term capital investment, contractual commitments and organizational capabilities at any given time, bp’s ability to maintain strategic resilience rests, in part, on the governance used to keep the strategy under review in light of new information and changing circumstances. To enable us to understand and respond to the changing pace of the energy transition, we monitor and assess key indicators and metrics, such as policy development, renewables installed capacity, EV sales and low carbon technology costs. Our strategy and capital allocation, the associated risks, opportunities and their implications for our resilience are all reviewed by the bp leadership team and the board and updated as they consider appropriate. Resilience to physical risk As described on page 62, we have identified a number of physical risks which may affect our business and assets, the frequency or severity of which could be affected by climate change. Exposure to physical climate-related risk is highly dependent on geographical location and on factors such as asset design, and we seek to manage these risks accordingly. We consider that our approach to managing these risks, described in Risk Management Recommended Disclosure b) on page 59, supports our strategic resilience to them. For the purposes of this Recommended Disclosure, we have considered the potential for physical risks to bp-operated assets to increase as a result of climate change (namely, increases in the potential frequency or intensity of extreme weather events) to such an extent as to have the potential to impact the resilience of our strategy. During 2022, we undertook an analysis of potential changes in certain physical conditions, such as air temperature, precipitation, sea level rise and wave heights, for our onshore and offshore major operating sites, based on Shared Socioeconomic Pathwayd (SSP) emission scenarios 1-2.6, 2-4.5 and 5-8.5. Even in the highest emissions pathway (SSP5-8.5) the results of our analysis suggest that, on the basis of the 50th percentile values and compared to the baseline used (1991-2020), changes in the physical parameters considered are generally unlikely to be significant over the medium term. There is, however, uncertainty across different scenarios and wider variances were observed when looking at the 5th and 95th percentile values. Where the data do suggest greater potential for climate-related changes in physical conditions, we intend to consider whether further work is necessary to understand the potential for those changes to adversely impact our operations. For example, modelled changes in extreme precipitation by 2030 (50th percentile values) are less than 10% across all onshore major operating sites apart from Oman – where we have already undertaken hydrological studies and flood risk assessments that have supported the development of our operations there. Our transition risk scenario analysis identified impacts on the earnings of our oil-priced businesses as having the most potential to impact the resilience of our strategy in 2030. Therefore, and viewing resilience through the same lenses that we describe above, we have considered the extent to which our oil and gas production business would need to be impacted by evolving physical risk over the same timeframe for the scale of financial impact to be sufficient to jeopardize the resilience of our strategy out to 2030. We concluded that a significant proportion of our combined oil and gas portfolio would need to be either permanently shut in or temporarily shut down to jeopardize our strategic resilience in this way. Historically, severe weather risks to our operated assets have not occurred at a scale which could reduce earnings so significantly as to jeopardize the resilience of our strategy. As reflected in the latest science from the IPCC, it is in the nature of climate-induced severe weather events that their occurrence, intensity and severity are unpredictable and uncertain. Our own analysis on major operating sites, described above, is consistent with this IPCC view. Despite this uncertainty, we have found no definitive basis in either the IPCC report or the limited number of detailed studies we have undertaken (see page 62), to conclude that climate-change-induced increases in the frequency or severity of severe weather events would be likely to result, at any point in time out to 2030, in disruption and shutdowns across our oil and gas portfolio on a scale that would reduce earnings so significantly as to jeopardize the resilience of our strategy. For the purposes of this Recommended Disclosure, the resilience of our strategy was considered separately for the relevant transition and physical risks; accordingly, we did not seek to take account of any interdependencies or cumulative effects between the two types of climate-related risk, and the associated potential financial impact. d SSPs have been developed by the climate change research community to describe plausible major global developments that together would lead in the future to different challenges for mitigation and adaptation to climate change. The SSPs are based on five narratives describing alternative socioeconomic developments, including sustainable development, regional rivalry, inequality, fossil-fuelled development and middle-of-the-road development.
66 bp Annual Report and Form 20-F 2023 Our approach to testing resilience to transition risk Most of our analysis focused on our medium- term time horizon (2030) – far enough ahead to provide a divergent range of scenarios, while not so far ahead that it is unrealistic to attempt to generate credible financial metrics for bp, or an individual business area within bp. For variables considered most significant (see below), we also assessed resilience over the period 2025-30. Our analysis sought to quantify the potential impact of a range of scenarios, including those consistent with 1.5°C, on bp’s currently held (at the time the analysis was completed) internal reference group business outlook to 2030. This outlook is used for internal corporate planning and holds a current deterministic view of our portfolio, activity set, cost and capital frame. The outlook used in our analysis aligned to the strategic direction shared at the 10-11 October 2023 investor update, and the financials lie within the range of financial outcomes set out in that announcement.a The steps we took as part of our scenario analysis approach are outlined here at a high level. 1. Whole company assessment: We defined, through quantitative analysis, which business areas could have both the financial scale and clear transition exposures to potentially impact bp’s strategic resilience. a. We assessed the business areas in our portfolio by i) quantitatively evaluating each business area’s ’potential significance’ – i.e. its expected contribution to bp group adjusted EBITDA in 2030 and therefore the quantum of financial impact that might be put at risk by transition uncertainty (including pathways consistent with 1.5°C); and ii) by identifying, for each, whether there were primary potential value driver(s) that different transition pathways might impact (’transition risk driver(s)’). This was performed to allocate the most appropriate analysis technique to that business (see 1b and 1c). b. Ten business areas (see table on page 67), representing over 80% of our expected 2030 adjusted EBITDA, were identified as both providing a potentially significant financial contribution and facing primary transition risk drivers, and accordingly were subjected to the driver-based scenario analysis set out in steps 2a-2c below. c. The remaining business areas were taken forward to a simplified scenario analysis, per step 2d below. 2. Scenario analysis: We tested the financial impact of transition on all of bp’s business areas in 2030 through either specific ’driver-based’ scenario modelling (that includes 1.5°C and current policies), or by ’simplified’ conservative scenario analysis, that modelled cases likely to be beyond these ranges. a. For the driver-based scenario analysis, we selected the primary transition risk driver(s) for each business area – the variable(s) from the WBCSD Scenario Catalogue representing what we consider to be the primary driver(s) of that business area’s exposure to the energy transition. For each transition risk driver, we extracted the full range of 2030 outcomes within each scenario ’family’. Given the global nature of the transition risks and opportunities we have identified, we used the ’world’ values in the Catalogue except for gas price (see table on page 67). b. By calibrating the WBCSD Scenario Catalogue 2030 scenarios to relevant business metrics underpinning our strategic planning (for example, oil price or EV demand/utilization), we modelled the impact of each variable, across the full range of scenarios and each scenario family, on the 2030 expected earnings (adjusted EBITDA) for the associated business area(s). For example, we applied an earnings rule of thumb deemed appropriate to the period in question to the deviation of oil prices in WBCSD versus our reference case price. This analysis was unmitigated (see ’Other key considerations’). c. This enabled us to assess the potential for each scenario to materially impact group adjusted EBITDA in 2030 (and by implication associated cash flows), against the reference group business outlook. By modelling the specific business area within the reference group business outlook (described in step 1b above), its exposure to the most extreme range of the respective scenario could be assessed to identify which (if any) variables(s) and scenario(s) could have the potential to impact strategic resilience (as defined below) most materially, and as such, which business areas should be carried forward into a multi-year resilience assessment. d. For the simplified scenario analysis, we took a simpler conservative approach, by evaluating whether a scenario in which each business area’s expected 2030 adjusted EBITDA is assumed to be reduced to zero – an outcome at least as detrimental to that business area’s adjusted EBITDA as could reasonably be expected to result from ranges associated with the trajectory of each of the 1.5°C, 2°C or BAU scenario families – could have the potential to impact strategic resilience (as defined below) materially. 3. Multi-year resilience test: This step tested bp’s resilience to the exposure of any sufficiently material business areas to downside scenarios that may have the potential to jeopardize the ability to generate surplus cash flow and a strong cash cover ratio and gearing level – financial metrics that were treated for the purposes of the analysis as representing financial evidence of delivery of bp’s strategic priorities. From step 2, only the exposure to oil price was assessed as sufficiently material in this sense, and hence carried forward for multi-year resilience analysis. Our multi-year (2025-30) oil price resilience test considered sustained low oil prices consistent with the most extreme WBCSD Scenario Catalogue 2025 and 2030 scenarios – for 2025 the IEA (World Energy Model Net Zero Energy 2050) price at $52/bbl, and for 2030 the UN PRI (Inevitable Policy Response Required Policy Scenario) at $31.8/bbl (both 2021 $ real). Other key considerations • For the purposes of steps 2 and 3, we considered the resilience of our strategy to climate-related transition risk through the three lenses described on page 61. We defined the following as proxy indicators for these lenses: – Group surplus cash flow, to confirm whether after funding, among other things, capital spend within our disclosed capital frame (10-11 October 2023 investor update) and the dividend/ share assumed in our reference group business outlook, sufficient surplus cash flow remains to maintain or reduce net debt and/or make share buybacks. – Healthy cash cover ratio and gearing as indicators of the ability to maintain a strong investment grade credit rating. a As was the case for the analysis presented in the bp Annual Report and Form 20-F 2021, the financials used do not include any reference to the shareholding in Rosneft that bp announced its intention to exit from on 27 February 2022. Climate-related financial disclosures continued
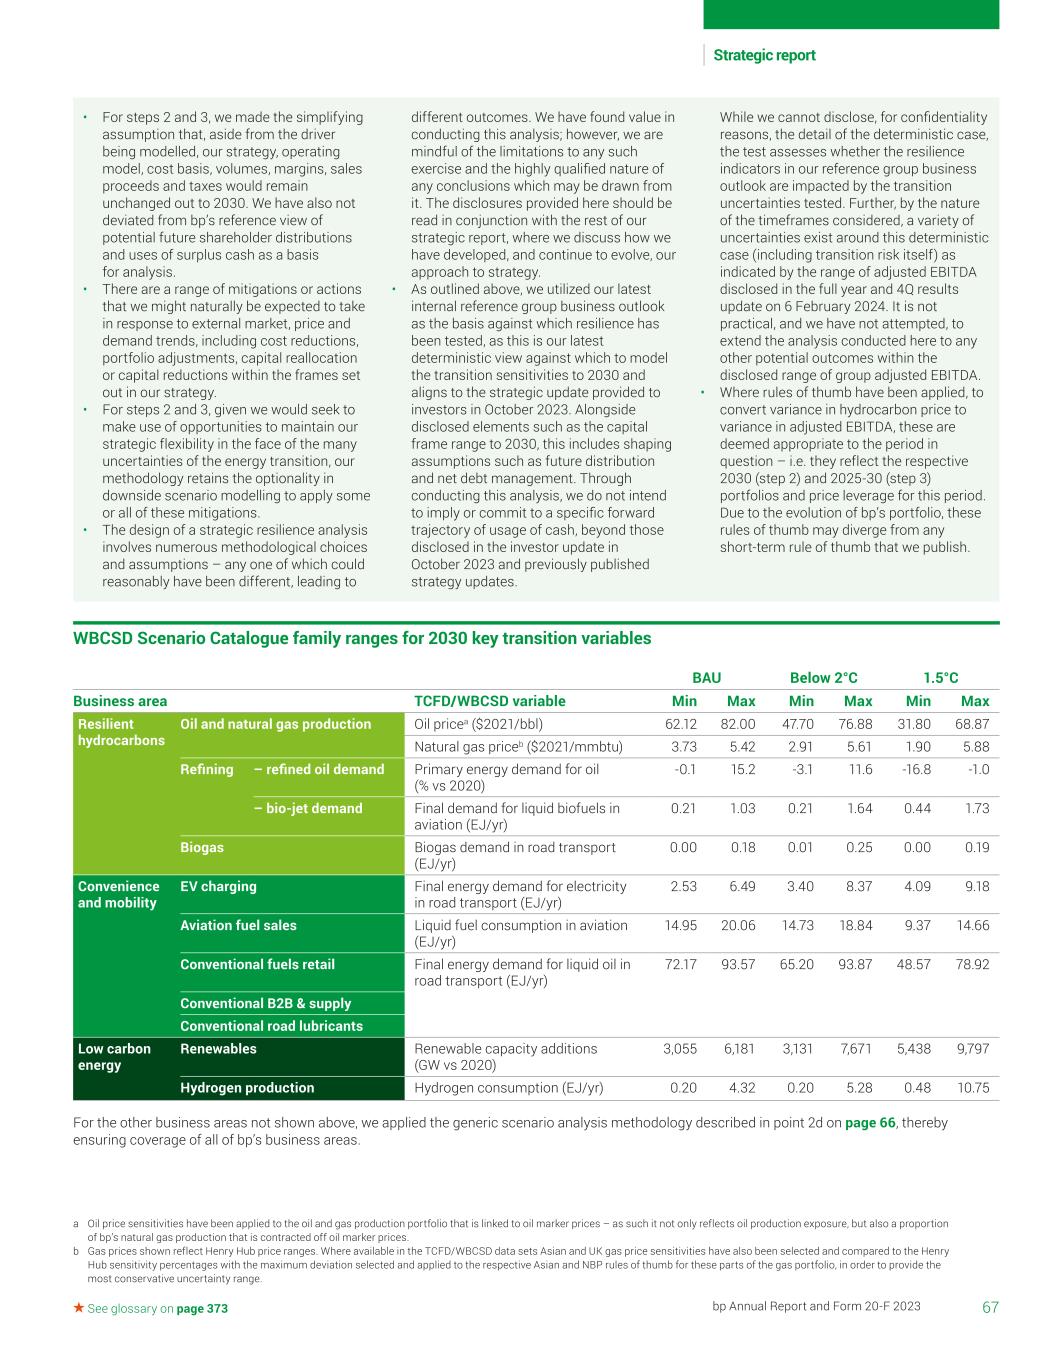
67bp Annual Report and Form 20-F 2023 Strategic report See glossary on page 373 • For steps 2 and 3, we made the simplifying assumption that, aside from the driver being modelled, our strategy, operating model, cost basis, volumes, margins, sales proceeds and taxes would remain unchanged out to 2030. We have also not deviated from bp’s reference view of potential future shareholder distributions and uses of surplus cash as a basis for analysis. • There are a range of mitigations or actions that we might naturally be expected to take in response to external market, price and demand trends, including cost reductions, portfolio adjustments, capital reallocation or capital reductions within the frames set out in our strategy. • For steps 2 and 3, given we would seek to make use of opportunities to maintain our strategic flexibility in the face of the many uncertainties of the energy transition, our methodology retains the optionality in downside scenario modelling to apply some or all of these mitigations. • The design of a strategic resilience analysis involves numerous methodological choices and assumptions – any one of which could reasonably have been different, leading to different outcomes. We have found value in conducting this analysis; however, we are mindful of the limitations to any such exercise and the highly qualified nature of any conclusions which may be drawn from it. The disclosures provided here should be read in conjunction with the rest of our strategic report, where we discuss how we have developed, and continue to evolve, our approach to strategy. • As outlined above, we utilized our latest internal reference group business outlook as the basis against which resilience has been tested, as this is our latest deterministic view against which to model the transition sensitivities to 2030 and aligns to the strategic update provided to investors in October 2023. Alongside disclosed elements such as the capital frame range to 2030, this includes shaping assumptions such as future distribution and net debt management. Through conducting this analysis, we do not intend to imply or commit to a specific forward trajectory of usage of cash, beyond those disclosed in the investor update in October 2023 and previously published strategy updates. While we cannot disclose, for confidentiality reasons, the detail of the deterministic case, the test assesses whether the resilience indicators in our reference group business outlook are impacted by the transition uncertainties tested. Further, by the nature of the timeframes considered, a variety of uncertainties exist around this deterministic case (including transition risk itself) as indicated by the range of adjusted EBITDA disclosed in the full year and 4Q results update on 6 February 2024. It is not practical, and we have not attempted, to extend the analysis conducted here to any other potential outcomes within the disclosed range of group adjusted EBITDA. • Where rules of thumb have been applied, to convert variance in hydrocarbon price to variance in adjusted EBITDA, these are deemed appropriate to the period in question – i.e. they reflect the respective 2030 (step 2) and 2025-30 (step 3) portfolios and price leverage for this period. Due to the evolution of bp’s portfolio, these rules of thumb may diverge from any short-term rule of thumb that we publish. WBCSD Scenario Catalogue family ranges for 2030 key transition variables BAU Below 2°C 1.5°C Business area TCFD/WBCSD variable Min Max Min Max Min Max Resilient hydrocarbons Oil and natural gas production Oil pricea ($2021/bbl) 62.12 82.00 47.70 76.88 31.80 68.87 Natural gas priceb ($2021/mmbtu) 3.73 5.42 2.91 5.61 1.90 5.88 Refining – refined oil demand Primary energy demand for oil (% vs 2020) -0.1 15.2 -3.1 11.6 -16.8 -1.0 – bio-jet demand Final demand for liquid biofuels in aviation (EJ/yr) 0.21 1.03 0.21 1.64 0.44 1.73 Biogas Biogas demand in road transport (EJ/yr) 0.00 0.18 0.01 0.25 0.00 0.19 Convenience and mobility EV charging Final energy demand for electricity in road transport (EJ/yr) 2.53 6.49 3.40 8.37 4.09 9.18 Aviation fuel sales Liquid fuel consumption in aviation (EJ/yr) 14.95 20.06 14.73 18.84 9.37 14.66 Conventional fuels retail Final energy demand for liquid oil in road transport (EJ/yr) 72.17 93.57 65.20 93.87 48.57 78.92 Conventional B2B & supply Conventional road lubricants Low carbon energy Renewables Renewable capacity additions (GW vs 2020) 3,055 6,181 3,131 7,671 5,438 9,797 Hydrogen production Hydrogen consumption (EJ/yr) 0.20 4.32 0.20 5.28 0.48 10.75 For the other business areas not shown above, we applied the generic scenario analysis methodology described in point 2d on page 66, thereby ensuring coverage of all of bp’s business areas. a Oil price sensitivities have been applied to the oil and gas production portfolio that is linked to oil marker prices – as such it not only reflects oil production exposure, but also a proportion of bp’s natural gas production that is contracted off oil marker prices. b Gas prices shown reflect Henry Hub price ranges. Where available in the TCFD/WBCSD data sets Asian and UK gas price sensitivities have also been selected and compared to the Henry Hub sensitivity percentages with the maximum deviation selected and applied to the respective Asian and NBP rules of thumb for these parts of the gas portfolio, in order to provide the most conservative uncertainty range.
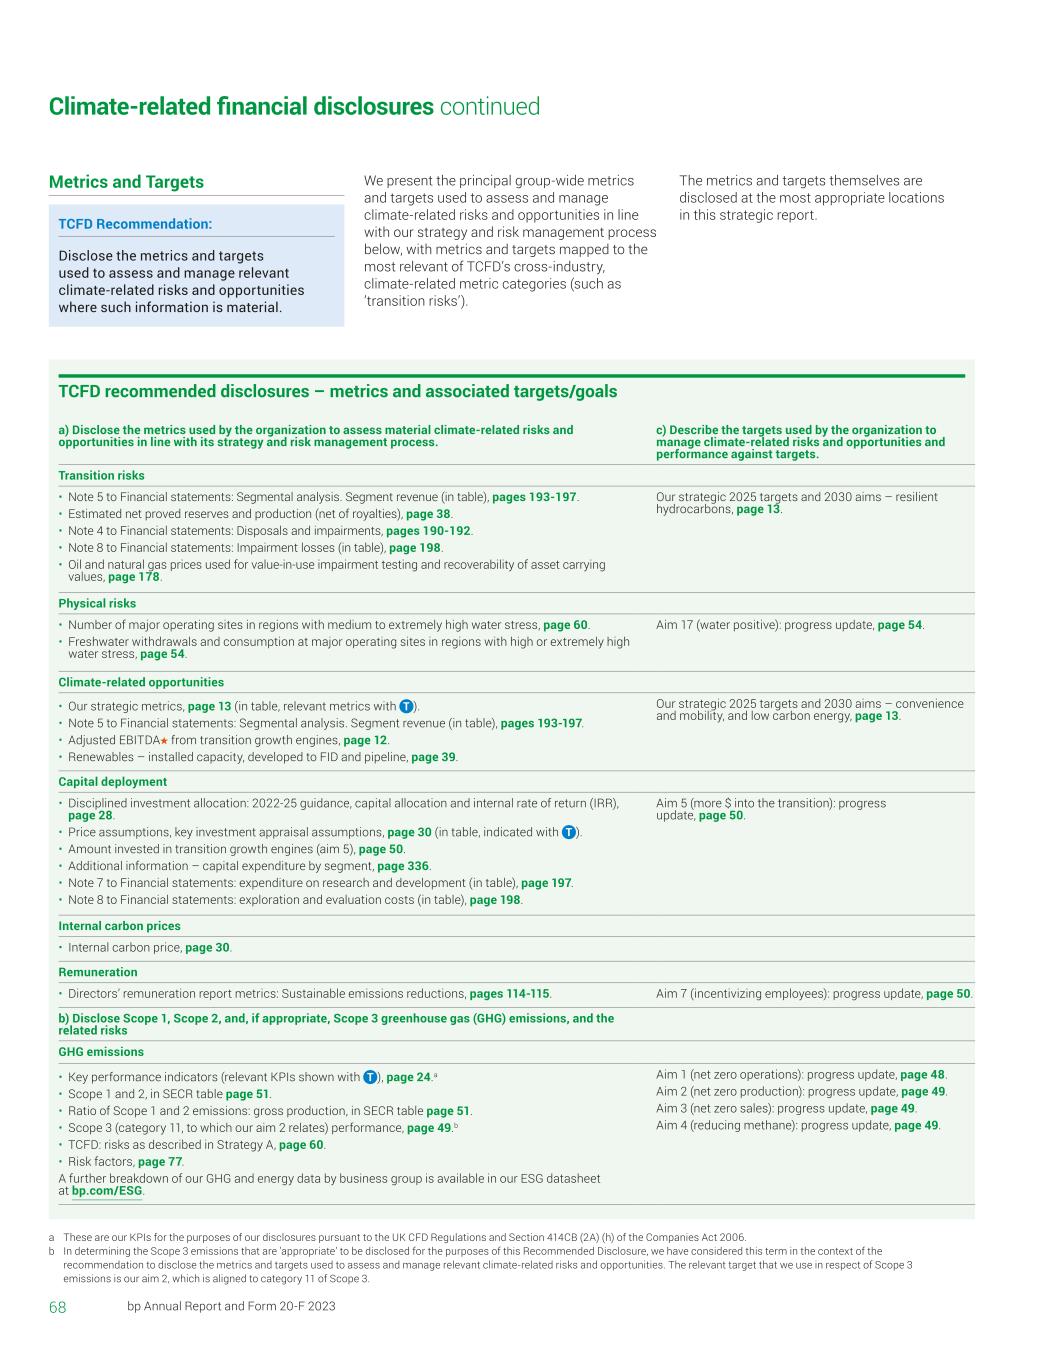
68 bp Annual Report and Form 20-F 2023 a These are our KPIs for the purposes of our disclosures pursuant to the UK CFD Regulations and Section 414CB (2A) (h) of the Companies Act 2006. b In determining the Scope 3 emissions that are ’appropriate’ to be disclosed for the purposes of this Recommended Disclosure, we have considered this term in the context of the recommendation to disclose the metrics and targets used to assess and manage relevant climate-related risks and opportunities. The relevant target that we use in respect of Scope 3 emissions is our aim 2, which is aligned to category 11 of Scope 3. Metrics and Targets TCFD Recommendation: Disclose the metrics and targets used to assess and manage relevant climate-related risks and opportunities where such information is material. We present the principal group-wide metrics and targets used to assess and manage climate-related risks and opportunities in line with our strategy and risk management process below, with metrics and targets mapped to the most relevant of TCFD’s cross-industry, climate-related metric categories (such as ’transition risks’). TCFD recommended disclosures – metrics and associated targets/goals a) Disclose the metrics used by the organization to assess material climate-related risks and opportunities in line with its strategy and risk management process. c) Describe the targets used by the organization to manage climate-related risks and opportunities and performance against targets. Transition risks • Note 5 to Financial statements: Segmental analysis. Segment revenue (in table), pages 193-197. • Estimated net proved reserves and production (net of royalties), page 38. • Note 4 to Financial statements: Disposals and impairments, pages 190-192. • Note 8 to Financial statements: Impairment losses (in table), page 198. • Oil and natural gas prices used for value-in-use impairment testing and recoverability of asset carrying values, page 178. Our strategic 2025 targets and 2030 aims – resilient hydrocarbons, page 13. Physical risks • Number of major operating sites in regions with medium to extremely high water stress, page 60. • Freshwater withdrawals and consumption at major operating sites in regions with high or extremely high water stress, page 54. Aim 17 (water positive): progress update, page 54. Climate-related opportunities • Our strategic metrics, page 13 (in table, relevant metrics with ). • Note 5 to Financial statements: Segmental analysis. Segment revenue (in table), pages 193-197. • Adjusted EBITDA from transition growth engines, page 12. • Renewables – installed capacity, developed to FID and pipeline, page 39. Our strategic 2025 targets and 2030 aims – convenience and mobility, and low carbon energy, page 13. Capital deployment • Disciplined investment allocation: 2022-25 guidance, capital allocation and internal rate of return (IRR), page 28. • Price assumptions, key investment appraisal assumptions, page 30 (in table, indicated with ). • Amount invested in transition growth engines (aim 5), page 50. • Additional information – capital expenditure by segment, page 336. • Note 7 to Financial statements: expenditure on research and development (in table), page 197. • Note 8 to Financial statements: exploration and evaluation costs (in table), page 198. Aim 5 (more $ into the transition): progress update, page 50. Internal carbon prices • Internal carbon price, page 30. Remuneration • Directors’ remuneration report metrics: Sustainable emissions reductions, pages 114-115. Aim 7 (incentivizing employees): progress update, page 50. b) Disclose Scope 1, Scope 2, and, if appropriate, Scope 3 greenhouse gas (GHG) emissions, and the related risks GHG emissions • Key performance indicators (relevant KPIs shown with ), page 24.a • Scope 1 and 2, in SECR table page 51. • Ratio of Scope 1 and 2 emissions: gross production, in SECR table page 51. • Scope 3 (category 11, to which our aim 2 relates) performance, page 49.b • TCFD: risks as described in Strategy A, page 60. • Risk factors, page 77. A further breakdown of our GHG and energy data by business group is available in our ESG datasheet at bp.com/ESG. Aim 1 (net zero operations): progress update, page 48. Aim 2 (net zero production): progress update, page 49. Aim 3 (net zero sales): progress update, page 49. Aim 4 (reducing methane): progress update, page 49. Climate-related financial disclosures continued The metrics and targets themselves are disclosed at the most appropriate locations in this strategic report.
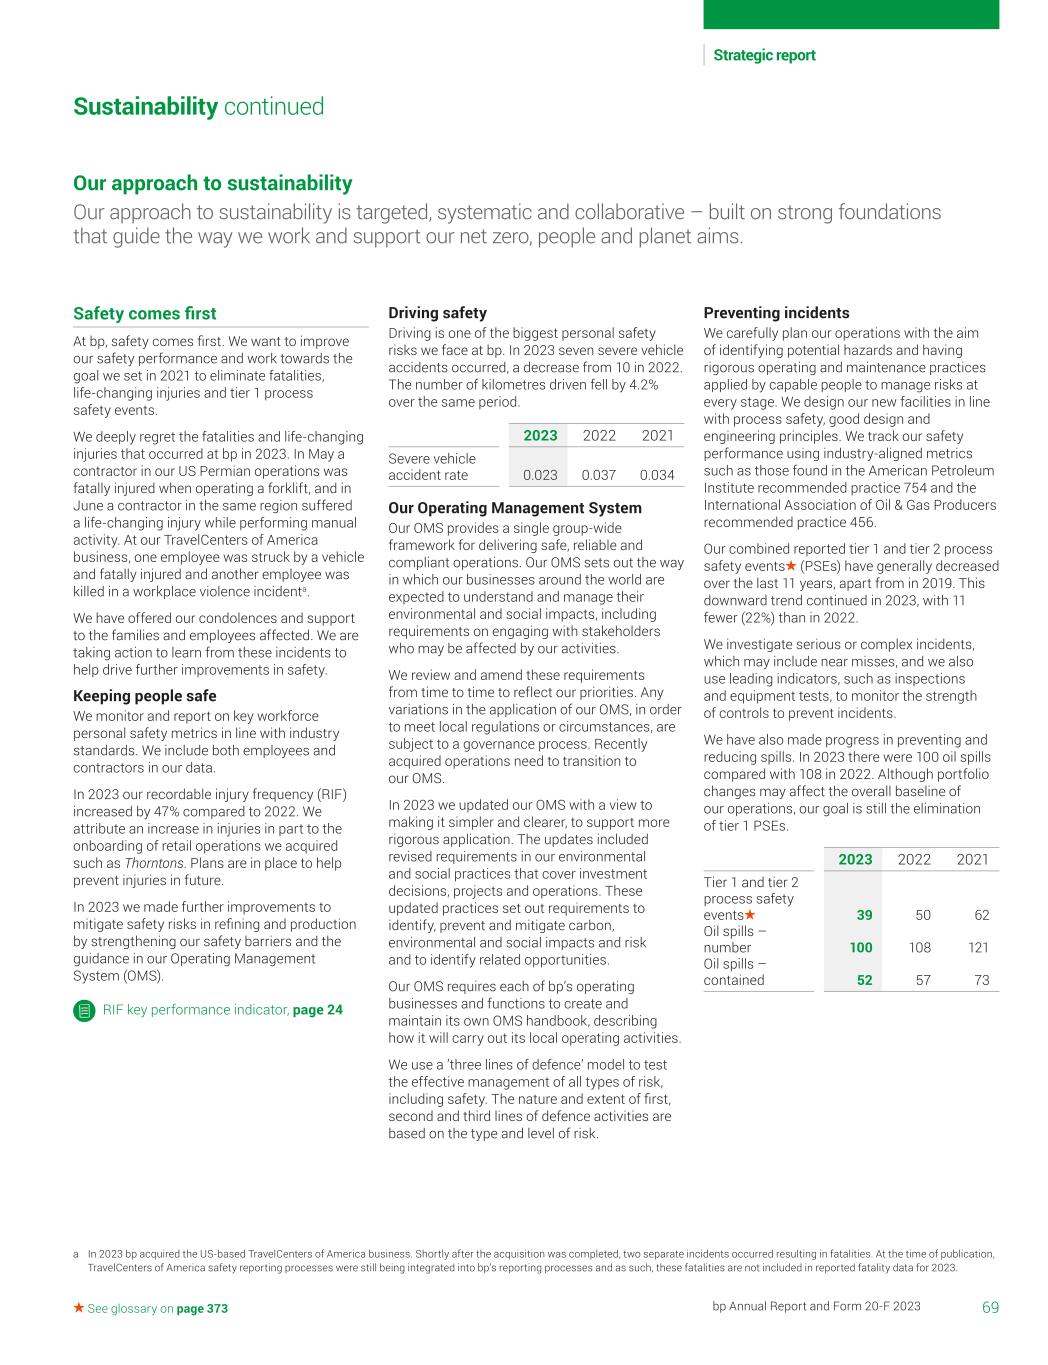
69bp Annual Report and Form 20-F 2023 Strategic report See glossary on page 373 Our approach to sustainability Our approach to sustainability is targeted, systematic and collaborative – built on strong foundations that guide the way we work and support our net zero, people and planet aims. Sustainability continued Safety comes first At bp, safety comes first. We want to improve our safety performance and work towards the goal we set in 2021 to eliminate fatalities, life-changing injuries and tier 1 process safety events. We deeply regret the fatalities and life-changing injuries that occurred at bp in 2023. In May a contractor in our US Permian operations was fatally injured when operating a forklift, and in June a contractor in the same region suffered a life-changing injury while performing manual activity. At our TravelCenters of America business, one employee was struck by a vehicle and fatally injured and another employee was killed in a workplace violence incidenta. We have offered our condolences and support to the families and employees affected. We are taking action to learn from these incidents to help drive further improvements in safety. Keeping people safe We monitor and report on key workforce personal safety metrics in line with industry standards. We include both employees and contractors in our data. In 2023 our recordable injury frequency (RIF) increased by 47% compared to 2022. We attribute an increase in injuries in part to the onboarding of retail operations we acquired such as Thorntons. Plans are in place to help prevent injuries in future. In 2023 we made further improvements to mitigate safety risks in refining and production by strengthening our safety barriers and the guidance in our Operating Management System (OMS). RIF key performance indicator, page 24 Driving safety Driving is one of the biggest personal safety risks we face at bp. In 2023 seven severe vehicle accidents occurred, a decrease from 10 in 2022. The number of kilometres driven fell by 4.2% over the same period. 2023 2022 2021 Severe vehicle accident rate 0.023 0.037 0.034 Our Operating Management System Our OMS provides a single group-wide framework for delivering safe, reliable and compliant operations. Our OMS sets out the way in which our businesses around the world are expected to understand and manage their environmental and social impacts, including requirements on engaging with stakeholders who may be affected by our activities. We review and amend these requirements from time to time to reflect our priorities. Any variations in the application of our OMS, in order to meet local regulations or circumstances, are subject to a governance process. Recently acquired operations need to transition to our OMS. In 2023 we updated our OMS with a view to making it simpler and clearer, to support more rigorous application. The updates included revised requirements in our environmental and social practices that cover investment decisions, projects and operations. These updated practices set out requirements to identify, prevent and mitigate carbon, environmental and social impacts and risk and to identify related opportunities. Our OMS requires each of bp’s operating businesses and functions to create and maintain its own OMS handbook, describing how it will carry out its local operating activities. We use a ’three lines of defence’ model to test the effective management of all types of risk, including safety. The nature and extent of first, second and third lines of defence activities are based on the type and level of risk. Preventing incidents We carefully plan our operations with the aim of identifying potential hazards and having rigorous operating and maintenance practices applied by capable people to manage risks at every stage. We design our new facilities in line with process safety, good design and engineering principles. We track our safety performance using industry-aligned metrics such as those found in the American Petroleum Institute recommended practice 754 and the International Association of Oil & Gas Producers recommended practice 456. Our combined reported tier 1 and tier 2 process safety events (PSEs) have generally decreased over the last 11 years, apart from in 2019. This downward trend continued in 2023, with 11 fewer (22%) than in 2022. We investigate serious or complex incidents, which may include near misses, and we also use leading indicators, such as inspections and equipment tests, to monitor the strength of controls to prevent incidents. We have also made progress in preventing and reducing spills. In 2023 there were 100 oil spills compared with 108 in 2022. Although portfolio changes may affect the overall baseline of our operations, our goal is still the elimination of tier 1 PSEs. 2023 2022 2021 Tier 1 and tier 2 process safety events 39 50 62 Oil spills – number 100 108 121 Oil spills – contained 52 57 73 a In 2023 bp acquired the US-based TravelCenters of America business. Shortly after the acquisition was completed, two separate incidents occurred resulting in fatalities. At the time of publication, TravelCenters of America safety reporting processes were still being integrated into bp’s reporting processes and as such, these fatalities are not included in reported fatality data for 2023.
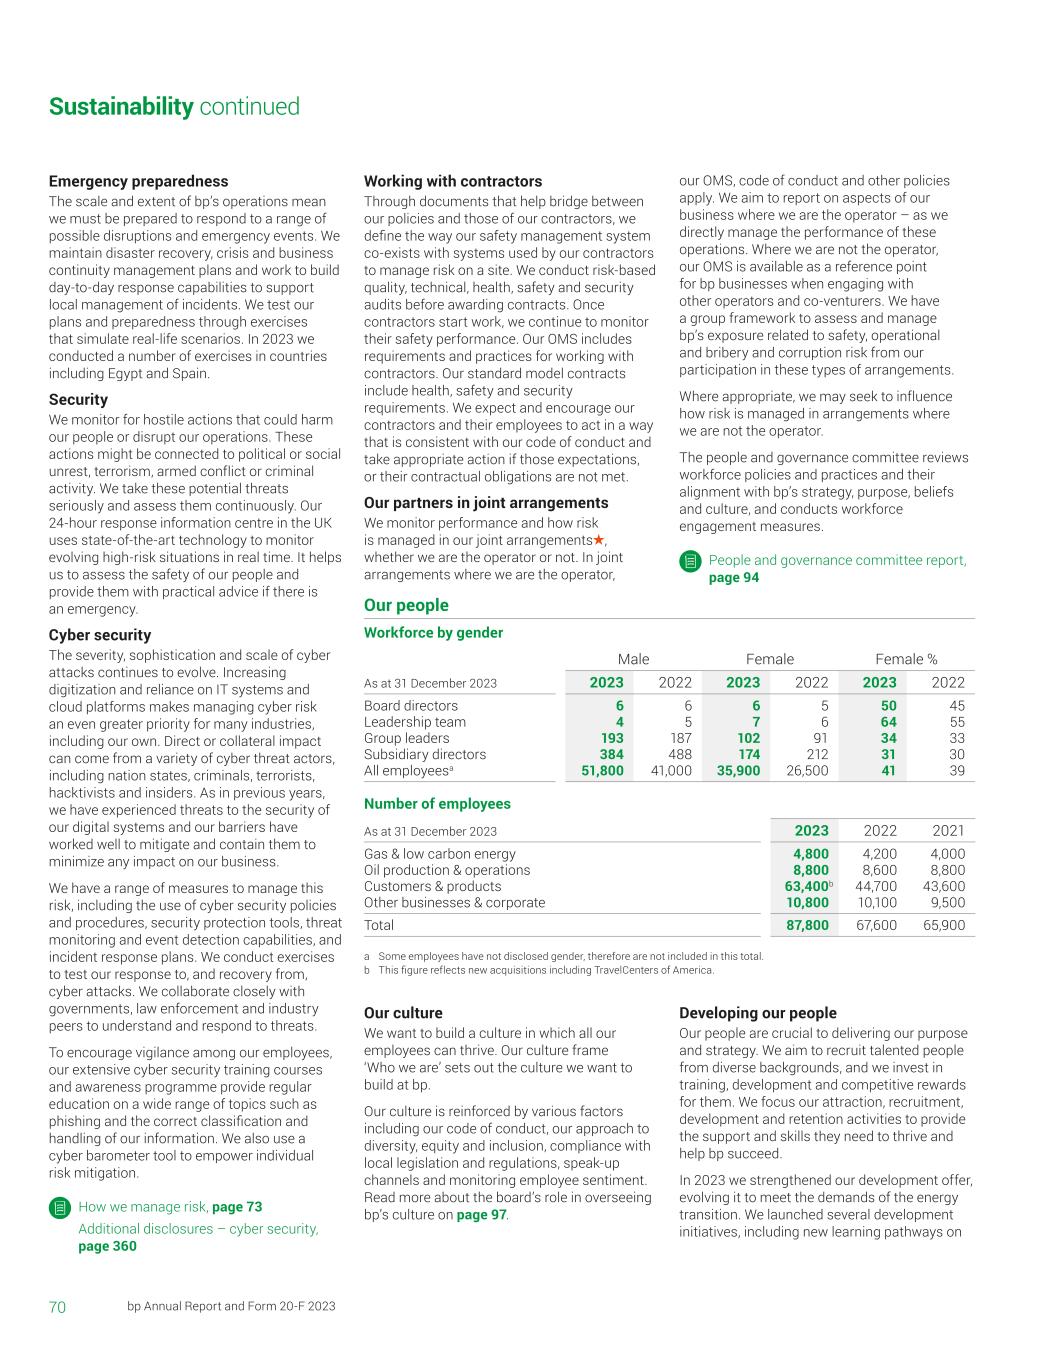
70 bp Annual Report and Form 20-F 2023 Emergency preparedness The scale and extent of bp’s operations mean we must be prepared to respond to a range of possible disruptions and emergency events. We maintain disaster recovery, crisis and business continuity management plans and work to build day-to-day response capabilities to support local management of incidents. We test our plans and preparedness through exercises that simulate real-life scenarios. In 2023 we conducted a number of exercises in countries including Egypt and Spain. Security We monitor for hostile actions that could harm our people or disrupt our operations. These actions might be connected to political or social unrest, terrorism, armed conflict or criminal activity. We take these potential threats seriously and assess them continuously. Our 24-hour response information centre in the UK uses state-of-the-art technology to monitor evolving high-risk situations in real time. It helps us to assess the safety of our people and provide them with practical advice if there is an emergency. Cyber security The severity, sophistication and scale of cyber attacks continues to evolve. Increasing digitization and reliance on IT systems and cloud platforms makes managing cyber risk an even greater priority for many industries, including our own. Direct or collateral impact can come from a variety of cyber threat actors, including nation states, criminals, terrorists, hacktivists and insiders. As in previous years, we have experienced threats to the security of our digital systems and our barriers have worked well to mitigate and contain them to minimize any impact on our business. We have a range of measures to manage this risk, including the use of cyber security policies and procedures, security protection tools, threat monitoring and event detection capabilities, and incident response plans. We conduct exercises to test our response to, and recovery from, cyber attacks. We collaborate closely with governments, law enforcement and industry peers to understand and respond to threats. To encourage vigilance among our employees, our extensive cyber security training courses and awareness programme provide regular education on a wide range of topics such as phishing and the correct classification and handling of our information. We also use a cyber barometer tool to empower individual risk mitigation. How we manage risk, page 73 Additional disclosures – cyber security, page 360 Working with contractors Through documents that help bridge between our policies and those of our contractors, we define the way our safety management system co-exists with systems used by our contractors to manage risk on a site. We conduct risk-based quality, technical, health, safety and security audits before awarding contracts. Once contractors start work, we continue to monitor their safety performance. Our OMS includes requirements and practices for working with contractors. Our standard model contracts include health, safety and security requirements. We expect and encourage our contractors and their employees to act in a way that is consistent with our code of conduct and take appropriate action if those expectations, or their contractual obligations are not met. Our partners in joint arrangements We monitor performance and how risk is managed in our joint arrangements , whether we are the operator or not. In joint arrangements where we are the operator, Our people Workforce by gender Male Female Female % As at 31 December 2023 2023 2022 2023 2022 2023 2022 Board directors 6 6 6 5 50 45 Leadership team 4 5 7 6 64 55 Group leaders 193 187 102 91 34 33 Subsidiary directors 384 488 174 212 31 30 All employeesa 51,800 41,000 35,900 26,500 41 39 Number of employees As at 31 December 2023 2023 2022 2021 Gas & low carbon energy 4,800 4,200 4,000 Oil production & operations 8,800 8,600 8,800 Customers & products 63,400b 44,700 43,600 Other businesses & corporate 10,800 10,100 9,500 Total 87,800 67,600 65,900 a Some employees have not disclosed gender, therefore are not included in this total. b This figure reflects new acquisitions including TravelCenters of America. Our culture We want to build a culture in which all our employees can thrive. Our culture frame ‘Who we are’ sets out the culture we want to build at bp. Our culture is reinforced by various factors including our code of conduct, our approach to diversity, equity and inclusion, compliance with local legislation and regulations, speak-up channels and monitoring employee sentiment. Read more about the board’s role in overseeing bp’s culture on page 97. Developing our people Our people are crucial to delivering our purpose and strategy. We aim to recruit talented people from diverse backgrounds, and we invest in training, development and competitive rewards for them. We focus our attraction, recruitment, development and retention activities to provide the support and skills they need to thrive and help bp succeed. In 2023 we strengthened our development offer, evolving it to meet the demands of the energy transition. We launched several development initiatives, including new learning pathways on Sustainability continued our OMS, code of conduct and other policies apply. We aim to report on aspects of our business where we are the operator – as we directly manage the performance of these operations. Where we are not the operator, our OMS is available as a reference point for bp businesses when engaging with other operators and co-venturers. We have a group framework to assess and manage bp’s exposure related to safety, operational and bribery and corruption risk from our participation in these types of arrangements. Where appropriate, we may seek to influence how risk is managed in arrangements where we are not the operator. The people and governance committee reviews workforce policies and practices and their alignment with bp’s strategy, purpose, beliefs and culture, and conducts workforce engagement measures. People and governance committee report, page 94
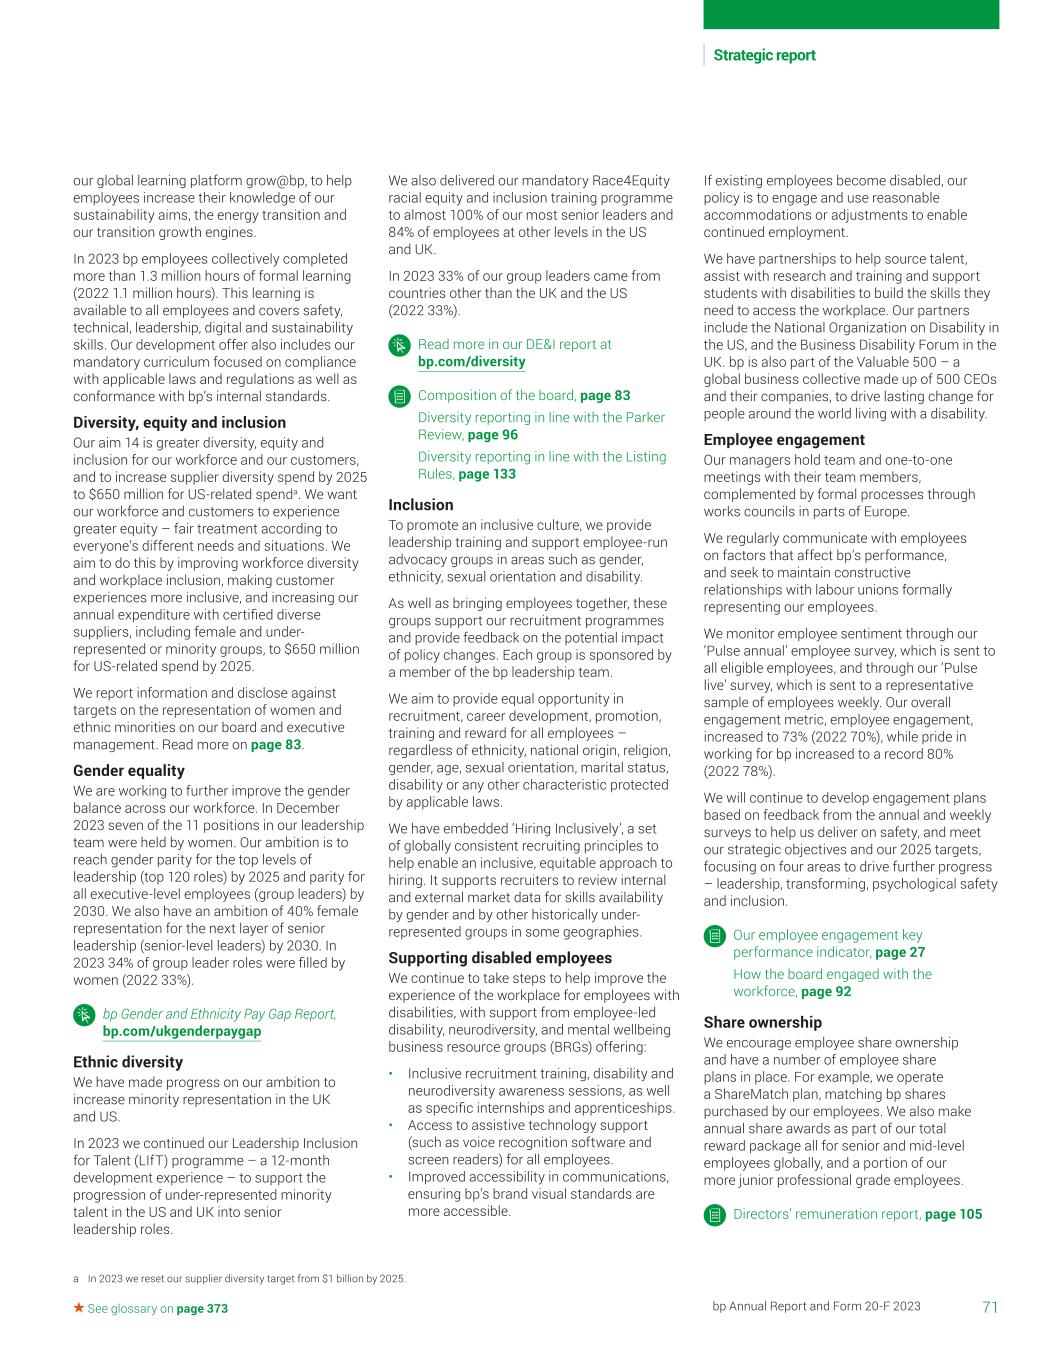
71bp Annual Report and Form 20-F 2023 Strategic report See glossary on page 373 our global learning platform grow@bp, to help employees increase their knowledge of our sustainability aims, the energy transition and our transition growth engines. In 2023 bp employees collectively completed more than 1.3 million hours of formal learning (2022 1.1 million hours). This learning is available to all employees and covers safety, technical, leadership, digital and sustainability skills. Our development offer also includes our mandatory curriculum focused on compliance with applicable laws and regulations as well as conformance with bp’s internal standards. Diversity, equity and inclusion Our aim 14 is greater diversity, equity and inclusion for our workforce and our customers, and to increase supplier diversity spend by 2025 to $650 million for US-related spenda. We want our workforce and customers to experience greater equity – fair treatment according to everyone’s different needs and situations. We aim to do this by improving workforce diversity and workplace inclusion, making customer experiences more inclusive, and increasing our annual expenditure with certified diverse suppliers, including female and under- represented or minority groups, to $650 million for US-related spend by 2025. We report information and disclose against targets on the representation of women and ethnic minorities on our board and executive management. Read more on page 83. Gender equality We are working to further improve the gender balance across our workforce. In December 2023 seven of the 11 positions in our leadership team were held by women. Our ambition is to reach gender parity for the top levels of leadership (top 120 roles) by 2025 and parity for all executive-level employees (group leaders) by 2030. We also have an ambition of 40% female representation for the next layer of senior leadership (senior-level leaders) by 2030. In 2023 34% of group leader roles were filled by women (2022 33%). bp Gender and Ethnicity Pay Gap Report, bp.com/ukgenderpaygap Ethnic diversity We have made progress on our ambition to increase minority representation in the UK and US. In 2023 we continued our Leadership Inclusion for Talent (LIfT) programme – a 12-month development experience – to support the progression of under-represented minority talent in the US and UK into senior leadership roles. We also delivered our mandatory Race4Equity racial equity and inclusion training programme to almost 100% of our most senior leaders and 84% of employees at other levels in the US and UK. In 2023 33% of our group leaders came from countries other than the UK and the US (2022 33%). Read more in our DE&I report at bp.com/diversity Composition of the board, page 83 Diversity reporting in line with the Parker Review, page 96 Diversity reporting in line with the Listing Rules, page 133 Inclusion To promote an inclusive culture, we provide leadership training and support employee-run advocacy groups in areas such as gender, ethnicity, sexual orientation and disability. As well as bringing employees together, these groups support our recruitment programmes and provide feedback on the potential impact of policy changes. Each group is sponsored by a member of the bp leadership team. We aim to provide equal opportunity in recruitment, career development, promotion, training and reward for all employees – regardless of ethnicity, national origin, religion, gender, age, sexual orientation, marital status, disability or any other characteristic protected by applicable laws. We have embedded ’Hiring Inclusively’, a set of globally consistent recruiting principles to help enable an inclusive, equitable approach to hiring. It supports recruiters to review internal and external market data for skills availability by gender and by other historically under- represented groups in some geographies. Supporting disabled employees We continue to take steps to help improve the experience of the workplace for employees with disabilities, with support from employee-led disability, neurodiversity, and mental wellbeing business resource groups (BRGs) offering: • Inclusive recruitment training, disability and neurodiversity awareness sessions, as well as specific internships and apprenticeships. • Access to assistive technology support (such as voice recognition software and screen readers) for all employees. • Improved accessibility in communications, ensuring bp’s brand visual standards are more accessible. If existing employees become disabled, our policy is to engage and use reasonable accommodations or adjustments to enable continued employment. We have partnerships to help source talent, assist with research and training and support students with disabilities to build the skills they need to access the workplace. Our partners include the National Organization on Disability in the US, and the Business Disability Forum in the UK. bp is also part of the Valuable 500 – a global business collective made up of 500 CEOs and their companies, to drive lasting change for people around the world living with a disability. Employee engagement Our managers hold team and one-to-one meetings with their team members, complemented by formal processes through works councils in parts of Europe. We regularly communicate with employees on factors that affect bp’s performance, and seek to maintain constructive relationships with labour unions formally representing our employees. We monitor employee sentiment through our ’Pulse annual’ employee survey, which is sent to all eligible employees, and through our ’Pulse live’ survey, which is sent to a representative sample of employees weekly. Our overall engagement metric, employee engagement, increased to 73% (2022 70%), while pride in working for bp increased to a record 80% (2022 78%). We will continue to develop engagement plans based on feedback from the annual and weekly surveys to help us deliver on safety, and meet our strategic objectives and our 2025 targets, focusing on four areas to drive further progress – leadership, transforming, psychological safety and inclusion. Our employee engagement key performance indicator, page 27 How the board engaged with the workforce, page 92 Share ownership We encourage employee share ownership and have a number of employee share plans in place. For example, we operate a ShareMatch plan, matching bp shares purchased by our employees. We also make annual share awards as part of our total reward package all for senior and mid-level employees globally, and a portion of our more junior professional grade employees. Directors’ remuneration report, page 105 a In 2023 we reset our supplier diversity target from $1 billion by 2025.
72 bp Annual Report and Form 20-F 2023 Mental health and wellbeing We include an employee wellbeing index in our ‘Pulse annual’ employee survey and weekly ‘Pulse live’ surveys. Results from 2023 showed that employee wellbeing increased by four points to 72% (2022 68%). We took further action to create workplaces where people can talk openly about mental health and get help if they need it. We updated our mental health training programmes, which are designed to build employees’ awareness and their ability to care for themselves and others. Ethics and compliance Our code of conduct Our code sets standards and expectations for how we do the right thing and empowers our employees to speak up without fear of retaliation. It puts safety first, and together with our Safety Leadership Principles and Operating Management System (OMS), helps us make safe and ethical decisions, act responsibly, comply with applicable laws and deliver on our sustainability frame. Our code applies to all bp employees, officers and board members. Our regular mandatory training and communications help employees understand how to apply our code and how to raise questions or concerns. All bp employees are required to confirm annually that they have read and understand our code and complied with its principles. We expect and encourage all our contractors and their employees to act in ways that are consistent with it. Any concerns or enquiries can be raised through multiple speak-up channels. These include line managers, senior leaders, and contacts in our people & culture, ethics & compliance or legal teams. We also have a confidential global helpline, OpenTalk. It is available in 75 languages and can be accessed all day, every day on the telephone or internet, by employees, the wider workforce, communities, business partners and other stakeholders. In most locations, anyone has the right to contact OpenTalk anonymously except where this is prohibited by law. Any instances where we believe individuals have fallen short of our expectations, set out in our beliefs, ‘Who we are’ and our code of conduct, are taken very seriously and, where appropriate, a formal investigation is carried out. We may take action in response to reported concerns, for example through training and monitoring trends in our ‘Pulse annual’ employee survey data to help proactively mitigate issues around misconduct. We follow a disciplinary process and will issue sanctions where appropriate, which may include dismissal. We received more than 2,250 concerns or enquiries through these channels in 2023 (2022 1,350). In 2023 around 66 separations resulted from non-conformance with our code or unethical behavioura. As in 2022 the most frequently raised concerns related to bullying, harassment and discrimination, with these accounting for around half of all concerns. The second most common issue was alleged fraud. bp.com/codeofconduct Anti-bribery and corruption We operate in parts of the world where bribery and corruption present a high risk. We have a responsibility to our employees, our shareholders and the countries and communities in which we do business to be ethical and lawful in all our work. Our code of conduct explicitly prohibits engaging in bribery or corruption in any form. Our group-wide anti-bribery and corruption policies and procedures include measures and guidance to assess risks, understand relevant laws and report concerns. They apply to all bp-operated businesses. We provide appropriate training including for those employees in locations or roles assessed to be at a higher risk of bribery and corruption. In 2023 around 10,500 employees completed anti-bribery and corruption training as part of our ethics and compliance risk-based learning. This is higher than the 7,500 employees trained in 2022, due to the rolling time schedule we use to assign training. We also conduct anti-bribery compliance audits on selected suppliers to assess their conformance with our anti-bribery and corruption contractual requirements. We take corrective action with suppliers and business partners who fail to meet our expectations, which may include terminating contracts. In 2023 we issued 31 ABC supplier audit reports. (2022 37). Political donations and activity We prohibit the use of bp funds or resources to support any political candidate or party. We recognize the rights of our employees to participate in the political process and these rights are governed by the applicable laws in the countries where we operate. Our stance on political activity is set out in the bp code of conduct. In the US we provide administrative support for the bp employee political action committee (PAC) – a non-partisan, employee-led committee that encourages voluntary employee participation in the political process. All bp employee PAC contributions are weighed against the PAC’s criteria for candidate support and reviewed for compliance with federal and state law before funds are passed to the recipients requested by our employees, and are publicly reported in accordance with US election laws. Donations to political candidates made by the PAC are from employee contributions and not bp funds. Tax transparency Our code of conduct informs the responsible approach we take to managing taxes. We have adopted the B Team responsible tax principles and we engage in open and constructive dialogue with governments and tax authorities. We comply with the tax legislation of the countries in which we operate and we do not tolerate the facilitation of tax evasion by people who act for or on behalf of bp. We are committed to transparency around our tax principles and the taxes we pay. We paid $11.9 billion in corporate income and production taxes to governments in 2023 (2022 $12.5 billion). bp Tax Report, bp.com/tax Sustainability continued a This total excludes exits of contractors, suppliers, vendors and employees at our retail and heliport sites.
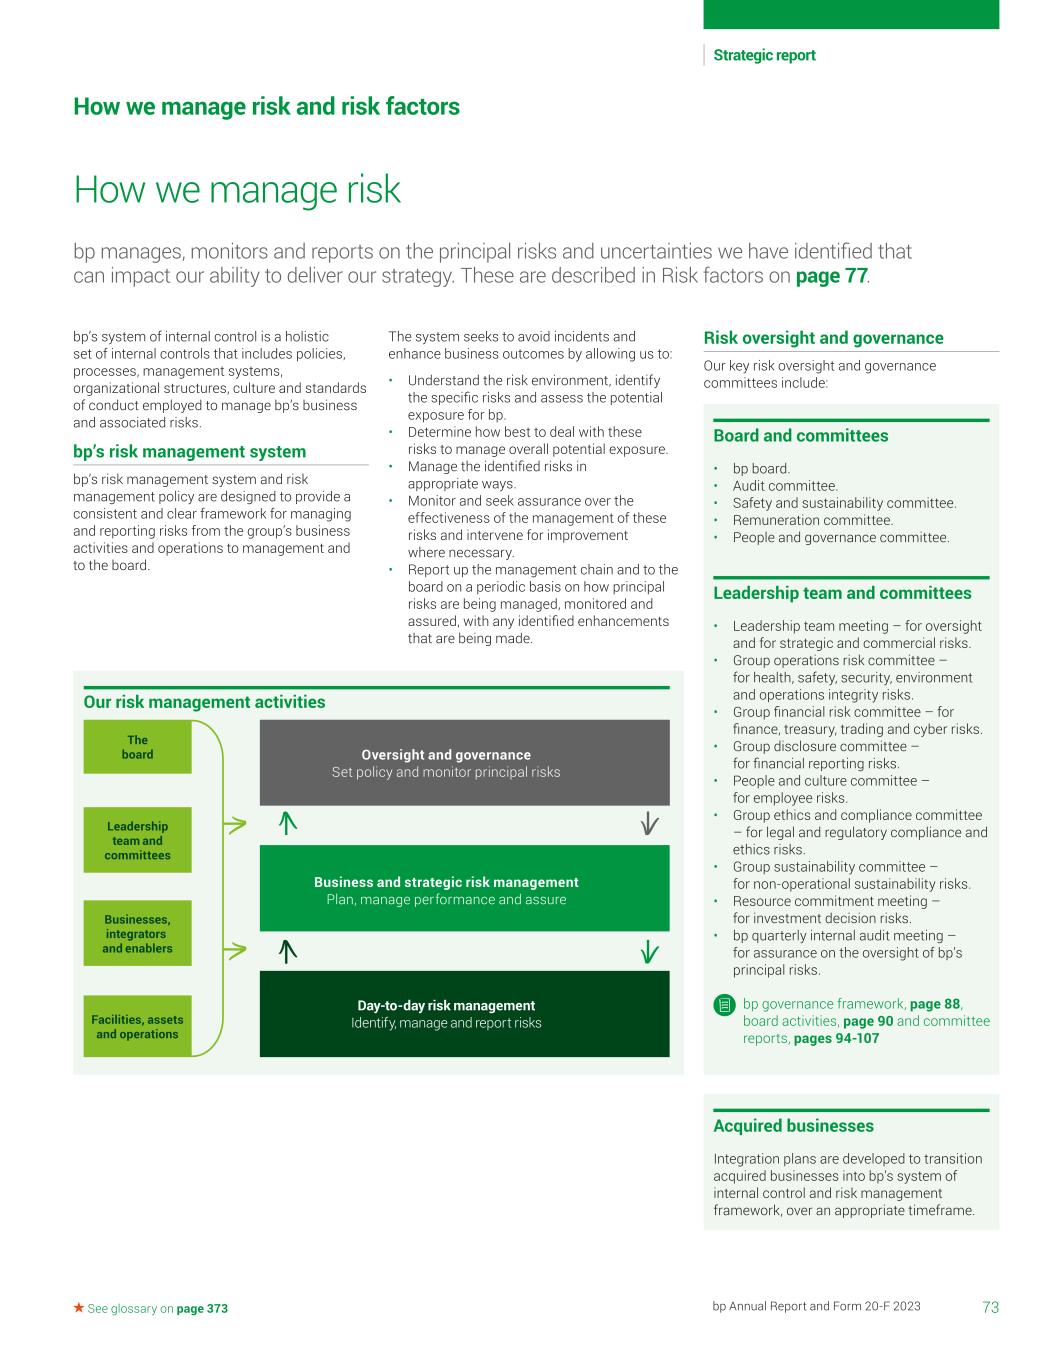
Leadership team and committees The board Our risk management activities Oversight and governance Set policy and monitor principal risks Day-to-day risk management Identify, manage and report risks Businesses, integrators and enablers Facilities, assets and operations Business and strategic risk management Plan, manage performance and assure 73bp Annual Report and Form 20-F 2023 Strategic report See glossary on page 373 bp’s system of internal control is a holistic set of internal controls that includes policies, processes, management systems, organizational structures, culture and standards of conduct employed to manage bp’s business and associated risks. bp’s risk management system bp’s risk management system and risk management policy are designed to provide a consistent and clear framework for managing and reporting risks from the group’s business activities and operations to management and to the board. The system seeks to avoid incidents and enhance business outcomes by allowing us to: • Understand the risk environment, identify the specific risks and assess the potential exposure for bp. • Determine how best to deal with these risks to manage overall potential exposure. • Manage the identified risks in appropriate ways. • Monitor and seek assurance over the effectiveness of the management of these risks and intervene for improvement where necessary. • Report up the management chain and to the board on a periodic basis on how principal risks are being managed, monitored and assured, with any identified enhancements that are being made. How we manage risk How we manage risk and risk factors bp manages, monitors and reports on the principal risks and uncertainties we have identified that can impact our ability to deliver our strategy. These are described in Risk factors on page 77. Risk oversight and governance Our key risk oversight and governance committees include: Board and committees • bp board. • Audit committee. • Safety and sustainability committee. • Remuneration committee. • People and governance committee. Leadership team and committees • Leadership team meeting – for oversight and for strategic and commercial risks. • Group operations risk committee – for health, safety, security, environment and operations integrity risks. • Group financial risk committee – for finance, treasury, trading and cyber risks. • Group disclosure committee – for financial reporting risks. • People and culture committee – for employee risks. • Group ethics and compliance committee – for legal and regulatory compliance and ethics risks. • Group sustainability committee – for non-operational sustainability risks. • Resource commitment meeting – for investment decision risks. • bp quarterly internal audit meeting – for assurance on the oversight of bp’s principal risks. bp governance framework, page 88, board activities, page 90 and committee reports, pages 94-107 Acquired businesses Integration plans are developed to transition acquired businesses into bp’s system of internal control and risk management framework, over an appropriate timeframe.
74 bp Annual Report and Form 20-F 2023 Day-to-day risk management Management and employees at our facilities, assets, and within our businesses, integrators and enablers seek to identify and manage risk, promoting safe, compliant and reliable operations. bp requirements, which take into account applicable laws and regulations, underpin the practical plans developed to help reduce risk and deliver safe, compliant and reliable operations as well as greater efficiency and sustainable financial results. Business and strategic risk management Our businesses, integrators and enablers integrate risk management into key business processes such as strategy, planning, performance management, resource and capital allocation and project appraisal. They do this by using a standard framework for collating risk data, assessing risk management activities, making further improvements and in connection with planning new activities. Oversight and governance Throughout 2023, management, the leadership team, the board and relevant committees provided oversight of how principal risks to bp were identified, assessed and managed. They supported appropriate governance of risk management including having relevant policies in place to help manage risks. Such oversight may include internal audit reports, group risk reports and reviews of the outcomes of business processes including strategy, planning and resource and capital allocation. bp’s group risk team analyses the group’s risk profile and maintains the group’s risk management system. bp’s internal audit team provides independent assurance to the chief executive and board as to whether the group’s system of internal control is adequately designed and operating effectively to respond appropriately to the risks that are significant to bp. Risk management processes We aim for a consistent basis of measuring risk to: • Establish a common understanding of risks on a like-for-like basis, taking into account potential impact and likelihood. • Report risks and their management to the appropriate levels of the organization. • Inform prioritization of specific risk management activities and resource allocation. bp’s risk management policy sets out requirements for the group to follow. These requirements support the consideration of three risk types: • Strategic and commercial. • Safety and operational. • Compliance and control. Risk identification – businesses, integrators and enablers identify risks across the risk types. Risks are identified on an ongoing basis – this can be done using a range of approaches including workshops, subject- matter expertise, hazard identification processes and engineering requirements. Risk assessment – identified risks are assessed for potential impact and likelihood across a number of criteria, including health and safety, environmental, financial and non-financial (includes reputation and regulatory impact levels). This aims to provide a consistent basis for the evaluation of potential impact and likelihood, facilitating a comparison across different risks. Risk management and monitoring – risk management activities are prioritized where improvements are needed based on a number of factors, including the risk assessment, strength of existing risk management measures, strategy and plans and legal and regulatory requirements. Risk management measures, including mitigations, are identified for each risk and monitored to the extent considered appropriate. To support leadership oversight of decisions relating to risk management, the appropriate organizational level (EVP, SVP, VP) are notified of risks and asked to endorse risk management measures, depending on the assessed potential impact and likelihood. As part of bp’s annual planning process, the leadership team and the board review the group’s principal risks and uncertainties. These may be updated during the year in response to changes in internal and external circumstances. There can be no certainty that our risk management activities will mitigate or prevent these, or other risks, from occurring. Further details of the principal risks and uncertainties faced are set out in Risk factors on page 77. Our risk profile The nature of our business operations is long term, resulting in many of our risks being enduring in nature. However, risks can develop and evolve over time and their potential impact or likelihood may vary in response to internal and external events. These may include emerging risks which are considered through existing processes, including emerging risk communications to the board, bp’s risk management system, the bp Energy Outlook, bp’s technology-related news and insights publications, and ongoing emerging technology scanning and group strategic reviews. We describe above how risks are managed. The following section provides examples of the particular risk management activities for each of bp’s principal risks. Strategic and commercial risks Prices and markets Our financial performance is impacted by fluctuating prices of oil, gas and refined products, technological change, exchange rate fluctuations, and the general macroeconomic outlook. Our strategy is designed to accommodate a range of scenarios and be resilient to the volatility in the energy markets. This is supported through a diversified portfolio, a strong balance sheet and operating within a resilient and disciplined financial frame. We test our investment and project development costs against a range of pricing and exchange assumptions. Accessing and progressing hydrocarbon resources and low carbon opportunities Inability to access and progress hydrocarbon resources and low carbon opportunities could adversely affect delivery of our strategy. For hydrocarbon resources our subsurface team is accountable for the delivery of high- value, carbon-efficient resources to deliver predictable and reliable investments today, as well as the long-term renewal of our hydrocarbon resources. Additionally, the subsurface team partners with innovation & engineering to prioritize technology development needs for the future. Our gas & low carbon energy business is accountable for the delivery of many of our low carbon opportunities through both organic and inorganic growth. This includes the development of our offshore wind, solar, onshore wind, hydrogen and carbon capture, use and storage businesses. How we manage risk and risk factors continued
75bp Annual Report and Form 20-F 2023 Strategic report See glossary on page 373 Major project delivery Failure to invest in the best opportunities or deliver major projects successfully could adversely affect our financial performance. We seek to manage this risk through our projects organization which exists to frame, build and execute projects across bp. The organization contains capability which includes the centre of expertise for appraisal and optimization, expertise to manage the design and build of projects and programmes, and collaboration with our businesses and enablers to ensure project objectives are met. The projects team delivers using its major projects common process which is systematically reviewed and continuously improved. Geopolitical The diverse locations of our business activities and operations around the world expose us to a wide range of political developments and consequent changes to the economic and operating environment. Geopolitical risk is inherent to many regions in which we operate, and heightened political or social tensions or changes in key relationships could adversely affect the group. We seek to manage this risk at multiple levels, through: • Identifying macro-level geopolitical trends in the geopolitical advisory council. • Providing a clear focal point for political risk management in our regions, corporates & solutions business. • Monitoring how geopolitical trends create risk at the country level through changes to our baseline threat assessments. More broadly, we manage the risk on a day-to-day basis through development and maintenance of relationships with governments and stakeholders, and by being trusted partners in each country and region. In addition, we closely monitor events and implement risk mitigation plans where deemed appropriate. Financial liquidity External market conditions can impact our financial performance. Supply and demand and the prices achieved for our products can be affected by a wide range of factors including political developments, interest rates, consumer preferences for low carbon energy, global economic conditions, access to capital markets and the influence of OPEC+. We seek to manage this risk through bp’s diversified portfolio, our financial framework, liquidity stress testing, maintaining a significant cash buffer, regular reviews of market conditions and our planning and investment processes. Energy markets, page 8 Liquidity and capital resources, page 340 Liquidity, financial capacity and financial, including credit, exposure, page 77 Joint arrangements and contractors Varying levels of control over the standards, operations and compliance of our partners including non-operated joint ventures (NOJVs), contractors and sub-contractors could result in legal liability and reputational damage. bp’s exposure in NOJVs is primarily managed by the NOJV-facing business team in the business or entity where ownership of bp’s interest in the NOJV sits. Support, verification and assurance is provided by the NOJV solutions team, safety and operational risk assurance, ethics & compliance functional assurance and group internal audit to drive a focused, deliberate and systematic approach to the set-up and management of bp’s interests and exposure in NOJVs. Our relationships with contractors are managed through the bp procurement processes with appropriate requirements incorporated into contractual arrangements. Cyber security Both targeted and indiscriminate threats to the security of our digital infrastructure and those of third parties continue to evolve rapidly and are increasingly prevalent across industries worldwide. We seek to manage this risk through a range of measures, which include cyber security standards, security protection tools, ongoing detection and monitoring of threats and testing of cyber response and recovery procedures. We collaborate with governments, law enforcement agencies and industry peers to understand and respond to new and emerging cyber threats. We build awareness with our employees, share information on incidents with leadership for continuous learning and conduct regular exercises, including with the leadership team, to test response and recovery procedures. For further detail on cyber security disclosures see page 360. Climate change and the transition to a lower carbon economy Developments in policy, law, regulation, technology and markets, including societal and investor sentiment, related to the issue of climate change and the transition to a lower carbon economy could increase costs, reduce revenues, constrain our operations and affect our business plans and financial performance. Risks associated with climate change and the transition to a lower carbon economy impact many elements of our strategy and, as such, these risks are managed through key business processes including setting the bp strategy and annual plan, capital allocation and investment decisions. The outputs of these key business processes are reviewed in line with the cadence of these activities. See page 59 for more information on how transition risks are managed. Competition Inability to remain efficient, maintain a high- quality portfolio of assets and innovate could negatively impact delivery of our strategy in a highly competitive market. We seek to manage this risk through our strategy, sustainability and ventures team by providing external insights on the economic, energy, market and competitive environment. Our strategy, sustainability and portfolio management teams use these insights to help define a resilient strategy for bp, including decisions related to portfolio, business development and resource allocation. The ventures team provides commercial innovation capacity that allows us to build new businesses. Talent and capability Inability to attract, develop and retain people with necessary skills and capabilities could negatively impact delivery of our strategy. Our people and culture team oversees all hiring activity for bp globally, both professional hiring and early careers. They help to ensure that the right talent and people capability is in place, using local market analysis, people analytics and insights to underpin our strategic workforce planning. Talent leadership focuses on translating bp’s diversity, equity and inclusion ambitions and global framework for action into a robust and diverse talent pipeline. See page 71 for more information.
76 bp Annual Report and Form 20-F 2023 Crisis management and business continuity Failure to address an incident effectively could potentially disrupt our business or exacerbate the legal, financial or operational impacts of the crisis event. Incidents that could potentially disrupt our business are addressed using emergency response and business continuity plans which are mandated through company-wide policies. We use internationally recognized incident command structures and for significant events business support teams and executive support teams are established to provide oversight and management. In addition, we provide a trained cadre of crisis professionals and niche expertise for deployment across the company through our mutual response team. Insurance Our insurance strategy could expose the group to material uninsured losses. Our insurance team is accountable for aligning our insurance approach with bp’s strategy and engaging with the businesses, integrators and enablers to determine the appropriate level of insurance. We retain in-house expertise and partner with insurance industry leaders. Our captive insurance companies are regulated within the jurisdictions in which they operate. Safety and operational risks Process safety, personal safety and environmental risks Exposure to a wide range of health, safety and environmental risks could cause harm to people, the environment and our assets and result in regulatory action, legal liability, business interruption, increased costs, damage to our reputation and potentially denial of our licence to operate. Our Operating Management System (OMS) helps us manage these risks and drive performance improvements. It sets out the standards and requirements which govern key risk management activities such as inspection, maintenance, testing, business continuity and crisis response planning and competency development. In addition, we conduct our drilling activity through a wells organization in order to promote a consistent approach for designing, constructing and managing wells. Drilling and production Challenging operational environments and other uncertainties could impact drilling and production activities. Our production and operations business group brings together all our hydrocarbon operations and our distinctive capabilities in one place to safely deliver competitive returns. The enablers, in particular wells and production, are accountable for safety, risk, quality and operational delivery. They execute capital and operational activity and manage associated expenditure. Security Hostile acts such as terrorism, activism, insider acts or piracy could harm our people and disrupt our operations. We monitor for emerging threats and vulnerabilities to manage our physical and information security. Our intelligence, security and crisis management teams provide strategic and operational risk management to our businesses through a network of regional security managers who provide front-line risk management as well as conduct assurance activities through a team independent of the business. We continue to monitor threats globally and maintain disaster recovery, crisis and business continuity management plans. Product quality Supplying customers with off-specification products could damage our reputation, lead to regulatory action and legal liability, and impact our financial performance. bp’s product quality policy is aligned with our OMS and sets requirements for our business to meet specifications and applicable legal and regulatory requirements. Compliance and control risks Ethical misconduct and legal or regulatory non-compliance Ethical misconduct or breaches of applicable laws or regulations could damage our reputation, result in litigation, regulatory action and penalties, adversely affect results and shareholder value, and potentially affect our licence to operate. Our code of conduct, the foundation of who we are, is applicable to all employees and central to managing this risk. Additionally, we have various group requirements and training covering areas such as anti-bribery and corruption, anti-money laundering, competition/ anti-trust law, data privacy and international trade regulations. We offer an independent confidential helpline, OpenTalk, for employees, contractors and other third parties with the option to raise concerns anonymously. Regulation Changes in the law and regulation could increase costs, constrain our operations and affect our strategy, business plans and financial performance. Our businesses, integrators and enablers all seek to identify, assess and manage legal and regulatory risks relevant to bp’s operations, strategy, business plans and financial performance. To support this work, we seek to develop co-operative relationships with governmental authorities in line with our code of conduct, to allow appropriate focus on areas of potential risk or uncertainty, while also protecting bp’s interests within the law. Trading non-compliance In the normal course of business, we are subject to risks around our trading activities which could arise from shortcomings or failures in our systems, risk management methodology, internal control processes or employee conduct. We have specific operating standards and control processes to manage these risks, including guidelines specific to trading, and seek to monitor compliance through our dedicated compliance teams. We also seek to maintain a positive and collaborative relationship with regulators and the industry at large. Reporting Failure to accurately report our data could lead to regulatory action, legal liability and reputational damage. Our accounting reporting and control team provides assurance of the control environment and is accountable for building control and compliance into finance processes and digital systems. How we manage risk and risk factors continued
77bp Annual Report and Form 20-F 2023 Strategic report See glossary on page 373 Strategic and commercial risks Prices and markets: our financial performance is impacted by fluctuating prices of oil, gas and refined products, technological change, exchange rate fluctuations, and the general macroeconomic outlook. Oil, gas and product prices are subject to international supply and demand and margins can be volatile. Political developments, fluctuations to the supply of either oil and gas developments or to alternative low carbon energy sources, technological change, global economic conditions, public health situations, the introduction of new carbon costs and the influence of OPEC+ can impact supply and demand and prices for our products. Decreases in oil, gas or product prices could have an adverse effect on revenue, margins, profitability and cash flows. If these reductions are significant or for a prolonged period, we may have to write down assets and reassess the viability of certain projects, which may impact future cash flows, profit, capital expenditure , the ability to work within our financial frame and maintain our long-term investment programme. Conversely, an increase in oil, gas and product prices may not improve margin performance as there could be increased fiscal take, cost inflation and more onerous terms for access to resources. The profitability of our refining activities can be volatile, with periodic oversupply or supply tightness in regional markets and fluctuations in demand. Exchange rate fluctuations can create currency exposures and impact underlying costs and revenues. Crude oil prices are generally set in US dollars, while products vary in currency. Many of our major project development costs are denominated in local currencies, which may be subject to fluctuations against the US dollar. Accessing and progressing hydrocarbon resources and low carbon opportunities: inability to access and progress hydrocarbon resources and low carbon opportunities could adversely affect delivery of our strategy. Risk factors The risks discussed below, separately or in combination, could have a material adverse effect on the implementation of our strategy, our business, financial performance, results of operations, cash flow, liquidity, prospects, shareholder value and returns and reputation. Delivery of our strategy depends partly on our ability to progress hydrocarbon resources from our existing portfolio and access new resources in our existing core regions. Our ability to progress upstream resources and develop technologies at a level in line with our strategic outlook for hydrocarbon production could impact our future production and financial performance. Furthermore, our ability to access low carbon opportunities and the commercial terms associated with those opportunities could impact our financial performance and the pace of our transition to an integrated energy company in line with our strategy. Major project delivery: failure to invest in the best opportunities or deliver major projects successfully could adversely affect our financial performance. We face challenges in developing major projects, particularly in geographically and technically challenging areas. Poor investment choice, efficiency or delivery, inflation, supply chain, or operational challenges at any major project that underpins production or production growth, could adversely affect our financial performance. Geopolitical: exposure to a range of political developments and consequent changes to the operating and regulatory environment could cause business disruption. We operate and may seek new opportunities in countries, regions and cities where political, economic and social transition may take place. Political instability, changes to the regulatory environment or taxation, international trade disputes and barriers to free trade, international sanctions, expropriation or nationalization of property, civil strife, strikes, insurrections, acts of terrorism, acts of war and public health situations (including the outbreak of an epidemic or pandemic) may disrupt or curtail our operations, business activities or investments. These may in turn cause production to decline, limit our ability to pursue new opportunities, affect the recoverability of our assets and our related earnings and cash flow or cause us to incur additional costs, particularly due to the long-term nature of many of our projects and significant capital expenditure required. Trade restrictions, international sanctions or any other actions taken by governmental authorities or other relevant persons have had and could continue to have an impact on global energy supply and demand, market volatility and the prices of oil, gas and products. Liquidity, financial capacity and financial, including credit, exposure: failure to work within our financial framework could impact our ability to operate and result in financial loss. Failure to accurately forecast or work within our financial framework could impact our ability to operate and result in financial loss. Trade and other receivables, including overdue receivables, may not be recovered, divestments may not be successfully completed and a substantial and unexpected cash call or funding request could disrupt our financial framework or overwhelm our ability to meet our obligations. An event such as a significant operational incident, legal proceedings or a geopolitical event in an area where we have significant activities, could reduce our financial liquidity and our credit ratings. Credit rating downgrades could potentially increase financing costs and limit access to financing or engagement in our trading activities on acceptable terms, which could put pressure on the group’s liquidity. They could also potentially require the company to review the funding arrangements with the bp pension trustees. In the event of extended constraints on our ability to obtain financing, we could be required to reduce capital expenditure or increase asset disposals in order to provide additional liquidity. Liquidity and capital resources, page 340 Financial statements – Note 29 Joint arrangements and contractors: varying levels of control over the standards, operations and compliance of our partners, including non-operated joint ventures (NOJV’s), contractors and sub-contractors could result in legal liability and reputational damage.
78 bp Annual Report and Form 20-F 2023 We conduct many of our activities through joint arrangements, partners or with contractors and sub-contractors where we may have limited influence and control over the performance of such activities. Our partners and contractors are responsible for the adequacy of their resources and capabilities. If these are found to be lacking, there may be financial, reputational, operational or safety exposures for bp. Should an incident occur in an activity that bp participates in, our partners and contractors may be unable or unwilling to fully compensate us against costs we may incur on their behalf or on behalf of the arrangement. Where we do not have operational control of a joint arrangement or direct oversight of contractor activity, we may still be pursued by regulators or claimants, and may still be the focus for interest groups or media attention in the event of an incident. Digital infrastructure, cyber security and data protection: breach or failure of our or third parties’ digital infrastructure or cyber security, including loss or misuse of sensitive information could damage our operations, increase costs and damage our reputation. The energy industry is subject to fast-evolving risks, including ransomware, from cyber threat actors, including nation states, criminals, terrorists, hacktivists and insiders. Current geopolitical factors have increased these risks. There is also growing regulation around data protection and data privacy, critical national infrastructure and the evolving opportunities and threats from artificial intelligence. A breach or failure of our or third parties’ digital infrastructure – including control systems – due to breaches of our cyber defences, or those of third parties, negligence, intentional misconduct or other reasons, could seriously disrupt our operations. This could result in the loss or misuse of data or sensitive information, including employees’ and customers’ personal data, injury to people, disruption to our business, harm to the environment or our assets, legal or regulatory breaches, legal liability and significant costs including fines, cost of remediation or reputational consequences. Furthermore, the rapid detection of attempts to gain unauthorized access to our digital infrastructure, often through the use of sophisticated and co-ordinated means, is a challenge and any delay or failure to detect could compound these potential harms. Cyber security disclosures, page 360 Climate change and the transition to a lower carbon economy: developments in policy, law, regulation, technology and markets, including societal and investor sentiment, related to the issue of climate change and the transition to a lower carbon economy could increase costs, reduce revenues, constrain our operations and affect our business plans and financial performance. Laws, regulations, policies, obligations, government actions, social attitudes and customer preferences relating to climate change and the transition to a lower carbon economy, including the pace of change to any of these factors, and also the pace of the transition itself, could have adverse impacts on our business including on our access to and realization of competitive opportunities in any of our strategic pillars, a decline in demand for, or constraints on our ability to sell certain products, constraints on production and supply, adverse litigation and regulatory or litigation outcomes, increased costs from compliance and increased provisions for environmental and legal liabilities. Investor preferences and sentiment are influenced by environmental, social and governance (ESG) considerations including climate change and the transition to a lower carbon economy. Changes in those preferences and sentiment could affect our access to capital markets and our attractiveness to potential investors, potentially resulting in reduced access to financing, increased financing costs and impacts upon our business plans and financial performance. Technological improvements or innovations that support the transition to a lower carbon economy, and customer preferences or regulatory incentives that alter fuel or power choices, could impact demand for oil and gas. Depending on the nature and speed of any such changes and our response, these changes could increase costs, reduce our profitability, reduce demand for certain products, limit our access to new opportunities, require us to write down certain assets or curtail or cease certain operations, and affect investor sentiment, our access to capital markets, our competitiveness and financial performance. Policy, legal, regulatory, technological and market developments related to climate change could also affect future price assumptions used in the assessment of recoverability of asset carrying values including goodwill, the judgement as to whether there is continued intent to develop exploration and appraisal intangible assets, the timing of decommissioning of assets and the useful economic lives of assets used for the calculation of depreciation and amortization. Climate-related financial disclosures, page 55 and Financial statements – Note 1 and Note 33 Competition: inability to remain efficient, maintain a high-quality portfolio of assets and innovate could negatively impact delivery of our strategy in a highly competitive market. Our strategic progress and performance could be impeded if we are unable to control our development and operating costs and margins, if we fail to scale our businesses at pace, or to sustain, develop and operate a high-quality portfolio of assets efficiently. Furthermore, as we transition from an international oil company to an integrated energy company, we face an expanded and rapidly evolving range of competitors in the sectors in which we operate. We could be adversely affected if competitors offer superior terms for access rights or licences, or if our innovation in areas such as new low carbon technologies, digital, customer offer, exploration, production, refining, manufacturing or renewable energy lags behind those of our competitors. Our performance could also be negatively impacted if we fail to protect our intellectual property. Talent and capability: inability to attract, develop and retain people with necessary skills and capabilities could negatively impact delivery of our strategy. The sectors in which we operate face increasing challenges to attract and retain diverse, skilled and capable talent. An inability to successfully recruit, develop and retain core skills and capabilities and to reskill existing talent could negatively impact delivery of our strategy. Crisis management and business continuity: failure to address an incident effectively could potentially disrupt our business. Our reputation and business activities could be negatively impacted if we do not respond, or are perceived not to respond, in an appropriate manner to any major crisis. Insurance: our insurance strategy could expose the group to material uninsured losses. bp insures in situations where this is legally and contractually required. Some risks are insured with third parties and reinsured by group insurance companies. Uninsured losses could have a material adverse effect on our financial position, particularly if they arise at a time when we are facing material costs as a result of a significant operational event which could put pressure on our liquidity and cash flows. How we manage risk and risk factors continued
79bp Annual Report and Form 20-F 2023 Strategic report See glossary on page 373 Safety and operational risks Process safety, personal safety, and environmental risks: exposure to a wide range of health, safety and environmental risks could cause harm to people, the environment and our assets and result in regulatory action, legal liability, business interruption, increased costs, damage to our reputation and potentially denial of our licence to operate. Technical integrity failure, natural disasters, extreme weather or a change in its frequency or severity, human error and other adverse events or conditions, including breach of digital security, could lead to loss of containment of hazardous materials, including hydrocarbons . This could also lead to fires, explosions or other personal and process safety incidents when drilling wells, constructing and operating facilities; in addition to activities associated with transportation by road, sea or pipeline. There can be no certainty that our OMS or other policies and procedures will adequately identify all process safety, personal safety and environmental risks or that all our operating activities, including acquired businesses, will be conducted in conformance with these systems. Safety, page 69 Such events or conditions or inability to provide safe environments for our workforce and the public while at our facilities, premises or during transportation, could lead to injuries, loss of life or environmental damage. As a result, we could face regulatory action and legal liability, including penalties and remediation obligations, increased costs and potentially denial of our licence to operate. Our activities are sometimes conducted in hazardous, remote or environmentally sensitive locations, where the consequences of such events or conditions could be greater than in other locations. Drilling and production: challenging operational environments and other uncertainties could impact drilling and production activities. Our activities require high levels of investment and are sometimes conducted in challenging environments such as those prone to natural disasters and extreme weather, which heightens the risks of technical integrity failure. The physical characteristics of an oil or natural gas field, and cost of drilling, completing or operating wells are often uncertain. We may be required to curtail, delay or cancel drilling operations or stop production because of a variety of factors, including unexpected drilling conditions, pressure or irregularities in geological formations, equipment failures or accidents, adverse weather conditions and compliance with governmental requirements. Security: hostile acts against our employees and activities could cause harm to people and disrupt our operations. Acts of terrorism, piracy, sabotage, activism and similar activities directed against our operations and facilities, pipelines, transportation or digital infrastructure could cause harm to people and severely disrupt operations. Our activities could also be severely affected by conflict, civil strife or political unrest. Product quality: supplying customers with off-specification products could damage our reputation, lead to regulatory action and legal liability, and impact our financial performance. Failure to meet product quality specifications could cause harm to people and the environment, damage our reputation, result in regulatory action and legal liability, and impact financial performance. Compliance and control risks Ethical misconduct and non-compliance: ethical misconduct or breaches of applicable laws by our businesses or our employees could be damaging to our reputation, and could result in litigation, regulatory action and penalties. Incidents of ethical misconduct or non- compliance with applicable laws and regulations, including anti-bribery and corruption, competition and antitrust, data privacy, and anti-fraud laws, trade restrictions or other sanctions, could damage our reputation, and result in litigation, regulatory action, penalties and potentially affect our licence to operate. In relation to trade restrictions or other sanctions, current geopolitical factors have increased these risks. Regulation: changes in the law and regulation could increase costs, constrain our operations and affect our strategy, business plans and financial performance. Our businesses and operations are subject to the laws and regulations applicable in each country, state or other regional or local area in which they occur. These laws and regulations result in an often complex, uncertain and changing legal and regulatory environment for our global businesses and operations. Changes in laws or regulations, including how they are interpreted and enforced, can and do impact all aspects of our business. Royalties and taxes, particularly those applied to our hydrocarbon activities, tend to be high compared with those imposed on similar commercial activities. In certain jurisdictions there is also a degree of uncertainty relating to tax law interpretation and changes. Governments may change their fiscal and regulatory frameworks in response to public pressure on finances or for other policy reasons, resulting in increased amounts payable to them or their agencies. Changes in law or regulation could increase the compliance and litigation risk and costs, reduce our profitability, reduce demand for or constrain our ability to sell certain products, limit our access to new opportunities, require us to divest or write down certain assets or curtail or cease certain operations, or affect the adequacy of our provisions for pensions, tax, decommissioning, environmental and legal liabilities. Changes in laws or regulations could result in the nationalization, expropriation, cancellation, non-renewal or renegotiation of our interests, assets and related rights. Potential changes to pension or financial market regulation could also impact funding requirements of the group. Following the Gulf of Mexico oil spill, we may be subjected to a higher level of fines or penalties imposed in relation to any alleged breaches of laws or regulations, which could result in increased costs. Regulation of the group’s business, pages 353-357 Trading and treasury trading activities: ineffective oversight of trading and treasury trading activities could lead to business disruption, financial loss, regulatory intervention or damage to our reputation and affect our permissions to trade. We are subject to operational risk around our trading and treasury trading activities in financial and commodity markets, some of which are regulated. Failure to process, manage and monitor a large number of complex transactions across many markets and currencies while complying with all regulatory requirements could hinder profitable trading opportunities. There is a risk that a single trader or a group of traders could act outside of our delegations and controls, leading to regulatory intervention and resulting in financial loss, fines and potentially damaging our reputation, and could affect our permissions to trade. Financial statements – Note 29 Reporting: failure to accurately report our data could lead to regulatory action, legal liability and reputational damage. External reporting of financial and non-financial data, including reserves estimates, relies on the integrity of the control environment, our systems and people operating them. Failure to report data accurately and in compliance with applicable standards could result in regulatory action, legal liability and damage to our reputation.
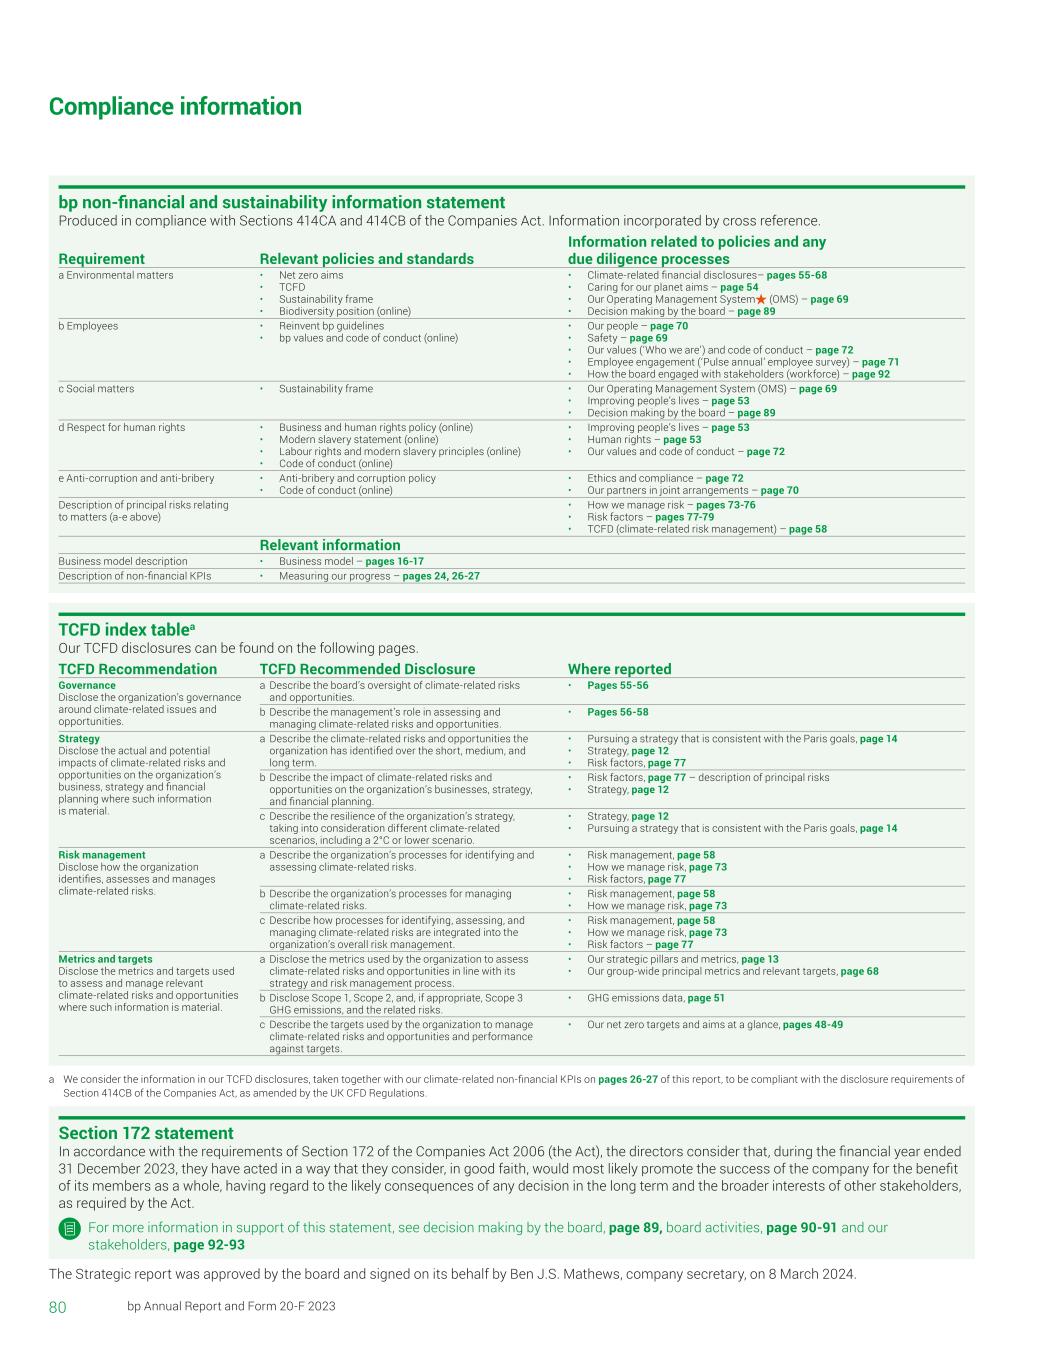
80 bp Annual Report and Form 20-F 2023 Compliance information bp non-financial and sustainability information statement Produced in compliance with Sections 414CA and 414CB of the Companies Act. Information incorporated by cross reference. Requirement Relevant policies and standards Information related to policies and any due diligence processes a Environmental matters • Net zero aims • TCFD • Sustainability frame • Biodiversity position (online) • Climate-related financial disclosures– pages 55-68 • Caring for our planet aims – page 54 • Our Operating Management System (OMS) – page 69 • Decision making by the board – page 89 b Employees • Reinvent bp guidelines • bp values and code of conduct (online) • Our people – page 70 • Safety – page 69 • Our values (‘Who we are’) and code of conduct – page 72 • Employee engagement (‘Pulse annual’ employee survey) – page 71 • How the board engaged with stakeholders (workforce) – page 92 c Social matters • Sustainability frame • Our Operating Management System (OMS) – page 69 • Improving people’s lives – page 53 • Decision making by the board – page 89 d Respect for human rights • Business and human rights policy (online) • Modern slavery statement (online) • Labour rights and modern slavery principles (online) • Code of conduct (online) • Improving people’s lives – page 53 • Human rights – page 53 • Our values and code of conduct – page 72 e Anti-corruption and anti-bribery • Anti-bribery and corruption policy • Code of conduct (online) • Ethics and compliance – page 72 • Our partners in joint arrangements – page 70 Description of principal risks relating to matters (a-e above) • How we manage risk – pages 73-76 • Risk factors – pages 77-79 • TCFD (climate-related risk management) – page 58 Relevant information Business model description • Business model – pages 16-17 Description of non-financial KPIs • Measuring our progress – pages 24, 26-27 TCFD index tablea Our TCFD disclosures can be found on the following pages. TCFD Recommendation TCFD Recommended Disclosure Where reported Governance Disclose the organization’s governance around climate-related issues and opportunities. a Describe the board’s oversight of climate-related risks and opportunities. • Pages 55-56 b Describe the management’s role in assessing and managing climate-related risks and opportunities. • Pages 56-58 Strategy Disclose the actual and potential impacts of climate-related risks and opportunities on the organization’s business, strategy and financial planning where such information is material. a Describe the climate-related risks and opportunities the organization has identified over the short, medium, and long term. • Pursuing a strategy that is consistent with the Paris goals, page 14 • Strategy, page 12 • Risk factors, page 77 b Describe the impact of climate-related risks and opportunities on the organization’s businesses, strategy, and financial planning. • Risk factors, page 77 – description of principal risks • Strategy, page 12 c Describe the resilience of the organization’s strategy, taking into consideration different climate-related scenarios, including a 2°C or lower scenario. • Strategy, page 12 • Pursuing a strategy that is consistent with the Paris goals, page 14 Risk management Disclose how the organization identifies, assesses and manages climate-related risks. a Describe the organization’s processes for identifying and assessing climate-related risks. • Risk management, page 58 • How we manage risk, page 73 • Risk factors, page 77 b Describe the organization’s processes for managing climate-related risks. • Risk management, page 58 • How we manage risk, page 73 c Describe how processes for identifying, assessing, and managing climate-related risks are integrated into the organization’s overall risk management. • Risk management, page 58 • How we manage risk, page 73 • Risk factors – page 77 Metrics and targets Disclose the metrics and targets used to assess and manage relevant climate-related risks and opportunities where such information is material. a Disclose the metrics used by the organization to assess climate-related risks and opportunities in line with its strategy and risk management process. • Our strategic pillars and metrics, page 13 • Our group-wide principal metrics and relevant targets, page 68 b Disclose Scope 1, Scope 2, and, if appropriate, Scope 3 GHG emissions, and the related risks. • GHG emissions data, page 51 c Describe the targets used by the organization to manage climate-related risks and opportunities and performance against targets. • Our net zero targets and aims at a glance, pages 48-49 Section 172 statement In accordance with the requirements of Section 172 of the Companies Act 2006 (the Act), the directors consider that, during the financial year ended 31 December 2023, they have acted in a way that they consider, in good faith, would most likely promote the success of the company for the benefit of its members as a whole, having regard to the likely consequences of any decision in the long term and the broader interests of other stakeholders, as required by the Act. For more information in support of this statement, see decision making by the board, page 89, board activities, page 90-91 and our stakeholders, page 92-93 The Strategic report was approved by the board and signed on its behalf by Ben J.S. Mathews, company secretary, on 8 March 2024. a We consider the information in our TCFD disclosures, taken together with our climate-related non-financial KPIs on pages 26-27 of this report, to be compliant with the disclosure requirements of Section 414CB of the Companies Act, as amended by the UK CFD Regulations.

81bp Annual Report and Form 20-F 2023 Corporate governance Introduction from the chair 82 Board of directors 83 Leadership team 86 Governance framework 88 Decision making by the board 89 Board activities 90 Our stakeholders 92 People and governance committee 94 Audit committee 98 Safety and sustainability committee 103 Remuneration committee 105 Directors’ remuneration report 105 Other disclosures 133 Corporate governance Tangguh renewable natural gas plant, Indonesia

82 bp Annual Report and Form 20-F 2023 Introduction from the chair Dear fellow shareholders, Each year seems to bring more challenges for company boards – a more demanding operating environment in the context of geopolitical shifts, technology advancements and of course, the ongoing complexity of the energy transition. Our corporate governance framework was established in 2020, recognising the need for it to be both dynamic and flexible in its application to a range of different situations. Looking back on 2023, it’s safe to say that it has served us well. The framework provides a clear mandate and defines responsibilities for the board’s main committees. It has enabled the board to apply its time to the most important areas requiring its focus and expertise. In 2023 these included responding to an ever-changing macro environment and the appointment of a new chief executive officer (CEO) and chief financial officer (CFO). Underpinned by this framework, throughout the year, the board has extensively engaged with stakeholders – and with shareholders, in particular. This engagement has been particularly valuable and has informed the board’s discussions and decision making. Executive director succession bp’s succession plans are routinely reviewed by the board’s people and governance committee and we were able to activate those plans swiftly last year. The board appointed an interim CEO within hours of the former CEO’s resignation in September, implementing an emergency succession process for this most important executive role. Our governance framework provided a similarly clear structure for us to progress through to the permanent appointments of Murray Auchincloss (previously CFO) as CEO and, in turn, Kate Thomson as CFO. This was all achieved within five months of the former CEO’s departure. Although conducted at pace, the selection process was robust, competitive and resulted in full agreement among the board on the best candidates for these roles. See page 95 for more details. Murray cares deeply about bp and its people. He brings in-depth understanding of the opportunities and challenges in the energy transition and he has demonstrated leadership that is focused on teamwork, performance and delivery. Kate’s appointment recognizes her detailed understanding of bp and the energy and finance sectors, combined with deep technical expertise. Throughout this period of change, the board has maintained a constructive and productive relationship with the leadership team. Focus on culture As a board, we are conscious of our responsibility to assess and monitor bp’s culture and to seek assurance from the leadership team that corrective action is being taken where practices or behaviours are not aligned with the company’s ‘Who we are’ culture frame. With this in mind, a dedicated committee of the board was established in 2023 on an interim basis with a focus on psychological safety and speaking up. The committee’s work was supported by data-led analysis and workforce engagement sessions. The committee has served us well and its activities have provided a fresh foundation for the people and governance committee to now assume its responsibilities supporting the board in its assessment and monitoring of culture. Purposeful engagement Among the most rewarding experiences in 2023 was to see first-hand some of the work bp is doing around the world, particularly meeting the people delivering our strategy on the ground. Our safety and sustainability committee travelled to Indonesia and visited bp’s liquefied natural gas facility at Tangguh, seeing for themselves the positive effect of our operations on the local community. Members of the board also went to the US, visiting operations in the Permian Basin and the Thunder Horse platform in the Gulf of Mexico, and in the UK they met our internal audit and finance teams in Sunbury and the trading and shipping teams in London. I also enjoyed meetings with people across bp, learning more about the business and the challenges being faced – and these views have been reflected in our board conversations. This experience was complemented by our bespoke workforce engagement programme which allows my board colleagues to participate in small groups focusing on set themes. Having the themes aligned with the board’s agenda for the year gave us a good insight into the views and concerns of a broad range of the bp workforce and further informed our discussions and the decisions we have taken. Board evolution Paula Rosput Reynolds and Sir John Sawers will both shortly reach the end of their nine years’ tenure on our board and will step down at the end of our annual general meeting in April 2024. I thank them for their valued service to bp. I am pleased that Amanda Blanc will take on the role of senior independent director and, for an interim period, Tushar Morzaria will become chair of the remuneration committee. Having undertaken a thorough assessment of time commitment (see page 133) the board is satisfied that they each have sufficient capacity to dedicate the time necessary for these roles. The board continues to evolve, and I am pleased to say that with over 50% female and over 20% ethnic minority representation we exceed both the targets set out in the new UK Listing Rules and the 2027 Parker Review targets relating to ethnic diversity on UK boards. There is, of course, always more to do and I thank my board colleagues for their dedicated service in 2023 and their ongoing commitment to your company. Closing thanks I would like to close by thanking the bp teams who have continued to operate bp safely and effectively and its leadership for their focus. And finally, I would like to thank you, fellow shareholders, for your continued confidence in bp. Helge Lund Chair 8 March 2024 Throughout the year, the board has extensively engaged with stakeholders – and with shareholders, in particular.

6 March 2024 7 March 2023 7 March 2024 6 March 2023 Female Male 1. 2. 3. 3. Non-UK/USa 6 1. UK 2. US 3 March 2023 4 4 March 2024 4 5 a Norway, India, Canada, Germany 1. 2. 3. 3. 7-9 years 2 1. 1-3 years 2. 4-6 years 6 March 2023 3 6 March 2024 3 2 83bp Annual Report and Form 20-F 2023 Corporate governance See glossary on page 373 Board of directors As at 8 March 2024 Board gender diversity Board nationality Non-executive directors’ tenure Committee membership key Chair Remuneration committee Audit committee People and governance committee Safety and sustainability committee Appointed Board: 26 July 2018; chair: 1 January 2019 Nationality Norwegian External appointments • Chair of Novo Nordisk AS. • Operating advisor to Clayton Dubilier & Rice. • Member of the Board of Trustees of the International Crisis Group. • Member of the European Round Table for Industry. • Mentor at Chair Mentors International. Significant past appointments • Chief executive of BG Group. • President and chief executive officer of Equinor and Aker Kvaerner. • Executive of Aker RGI and Hafslund Nycomed. • Non-executive director of Schlumberger and Nokia. • Member of the United Nations Secretary-General’s Advisory Group on Sustainable Energy. • Consultant at McKinsey & Company. • Parliamentary group political advisor of the Conservative party, Norway. Key skills and experience • Distinguished career as a leader in the energy sector with deep industry knowledge and global business experience. • Helge drives cohesion, constructive challenge and oversight of bp’s strategy and net zero ambition through forward-looking and innovative leadership of the board. Appointed Executive director: 1 July 2020; chief executive officer: 17 January 2024 Nationality Canadian External appointments • Board member of Aker BP ASA. • Main committee member of The 100 Group. Significant past appointments • Joined Amoco in 1992 and then bp when the two companies merged in 1998. • Senior roles in finance and management at bp, across tax, business development, mergers and acquisitions and performance management. • Chief of staff to bp chief executive officer. • CFO BP p.l.c. • Interim CEO BP p.l.c. Key skills and experience • Murray drives bp’s strategy to transform bp from an international oil company to an integrated energy company and has extensive experience and knowledge of the energy sector. • Provides deep insight into bp’s assets and businesses through broad experience across the group, extensive financial expertise and experience. Appointed 2 February 2024 Nationality British External appointments • Board member of Aker BP ASA. • Member of the European Round Table for CFOs. Significant past appointments • Joined bp in 2004. • Group treasurer, BP p.l.c. • Group head of tax, BP p.l.c. • SVP finance for production & operations, BP p.l.c. • Interim CFO BP p.l.c. Key skills and experience • Kate has a detailed understanding and experience of the energy sector. • Provides deep technical insight from her broad experience of leading teams across the group in tax, treasury and commercial finance. Helge Lund Chair Murray Auchincloss Chief executive officer (CEO) Kate Thomson Chief financial officer (CFO) Board at a glance Director biographies Further biographical details for each director are available online at bp.com/whoweare

84 bp Annual Report and Form 20-F 2023 Tushar Morzaria Independent non-executive director Pamela Daley Independent non-executive director Melody Meyer Independent non-executive director Dame Amanda Blanc Independent non-executive director Appointed 1 September 2020 Nationality British External appointments • Non-executive director of Legal & General Group plc. • Non-executive chairman of EMEA Investment Banking, Barclays. Significant past appointments • Group finance director and member of the board of Barclays PLC 2013 to 2022. • Various senior roles at JP Morgan, including CFO of its Corporate & Investment Bank. Key skills and experience • Over 25 years of strategic financial management, investment banking, operational and regulatory relations experience. • Breadth of knowledge and insight into financial, tax, treasury, investor relations and strategic matters. • Strong experience in delivering corporate change programmes while maintaining a focus on performance. Appointed 26 July 2018 Nationality American External appointments • Director of BlackRock, Inc. • Director of SecureWorks, Inc. Significant past appointments • Various senior executive roles at General Electric Company (GE), including senior vice president of business development 2004 to 2013. • Senior vice president and senior advisor to the chair at GE in 2013. • Director of BG Group plc 2014 to 2016. • Director of Patheon N.V. 2016 to 2017. • Partner at Morgan, Lewis & Bockius. Key skills and experience • Qualified lawyer with a wealth of global business and strategic experience. • Board-level experience of the UK oil and gas industry and executive experience in highly regulated industries. Appointed 17 May 2017 Nationality American External appointments • Non-executive director of AbbVie Inc. • President of Melody Meyer Energy LLC. • Director of the National Bureau of Asian Research. • Trustee of Trinity University. Significant past appointments • President of Chevron Asia Pacific E&P until 2016 after 37 years of service in key leadership roles in global exploration and production. • Executive sponsor of the Chevron Women’s Network until 2016. Key skills and experience • Deep understanding of the factors influencing safe, efficient and commercially high-performing projects in a global organization. • Expertise in the execution of major capital projects, technology, R&D, creation of businesses in new countries, strategic business planning, merger integration, leading change, and safe and reliable operations. Appointed 1 September 2022 Nationality British External appointments • CEO of Aviva plc. • Co-chair of the UK Transition Taskforce. • HM Treasury’s Women in Finance Champion. • Principal member of Glasgow Financial Alliance for Net Zero (GFANZ). • Member of the Association of British Insurers Board. Significant past appointments • Began career as a graduate at Commercial Union, one of Aviva’s ancestor companies, and held several senior executive roles across the insurance industry. • Group CEO at AXA UK, PPP & Ireland. • CEO of Europe, Middle East, Africa & Global Banking at Zurich Insurance Group. • Leadership positions at Groupama Insurance Company and Commercial Union. • Member of the Prime Minister’s Business Council. Key skills and experience • Experience leading insurance businesses in the UK and across Europe and developing the standard for private sector climate transition plans. • Wide-ranging board, industry and regulatory experience. Hina Nagarajan Independent non-executive director Appointed 1 March 2023 Nationality Indian External appointments • Managing director and CEO of United Spirits Limited (Diageo India). • Member of the global executive committee of Diageo plc. • Board member of The Advertising Standards Council of India. • Director and co-chair of International Spirits and Wines Association of India. Significant past appointments • Leadership positions at Reckitt, Mary Kay India and Nestlé India with over 30 years in the fast-moving consumer goods (FMCG) industry. • Non-executive director at two companies which were publicly quoted at the time: Guinness Ghana Breweries Plc and Seychelles Breweries Limited. Key skills and experience • Deep and wide-ranging experience in customer- focused FMCG businesses in complex emerging markets. • Extensive experience in assessing climate-related risks and opportunities from oversight of sustainability initiatives. Appointed Board: 14 May 2015; senior independent director: 27 May 2020 Nationality American External appointments • Director and chair of National Grid plc. • Non-executive director of General Electric Company. • Non-executive director of Linde plc. Significant past appointments • Began career at Pacific Gas & Electric Corp in 1979 and spent over 25 years in the energy industry. • CEO Duke Energy Power Services. • Chair, president and CEO of AGL Resources. • Chair and CEO of Safeco Corporation. • Vice-chair and chief restructuring officer of AIG. • Non-executive director of TransCanada Corporation; CBRE Group, Inc; BAE Systems PLC; Anadarko Petroleum; Delta Air Lines; and Coca Cola Enterprises. • Chair of the Seattle Cancer Care Alliance. Key skills and experience • Long career leading international and US companies in energy and financial sectors. • Deep strategic and regulatory experience and broad business expertise, including leading through multiple restructuring processes and mergers. Paula Rosput Reynolds Senior independent director

85bp Annual Report and Form 20-F 2023 Corporate governance See glossary on page 373 Sir John Sawers Independent non-executive director Ben J S Mathews Company secretary Satish Pai Independent non-executive director Appointed 14 May 2015 Nationality British External appointments • Visiting professor at King’s College London. • Senior advisor at Chatham House. • Senior fellow at the Royal United Services Institute. • Global advisor at the Council on Foreign Relations. • Governor of the Ditchley Foundation. • Director of the Bilderberg Association, UK. • Executive chair of Newbridge Advisory Limited. Significant past appointments • 36 years in UK public services, working on foreign policy, international security and intelligence. • Chief of the Secret Intelligence Service, MI6, 2009 to 2014. • Part of the Diplomatic Service; represented the British government around the world and led negotiations at the United Nations, European Union and G8. • Chair and general partner of Macro Advisory Partners February 2015 to May 2019. • Set up own firm, Newbridge Advisory. Key skills and experience • Deep experience of international political and commercial matters. • Expertise in assisting the board to navigate geopolitical issues. Appointed 7 May 2019 Role and career summary Ben joined bp as company secretary in May 2019. He is the co-chair of the Corporate Governance Council of the Conference Board and is a Fellow of the Chartered Governance Institute. Ben serves on the executive committee of the Association of General Counsel and Company Secretaries of the FTSE 100 (GC100), having previously served as its chair for four years. Ben’s global company secretary team is responsible for providing independent advice and support to the plc board and the boards of all other legal entities in the bp group. The team’s vision is to enhance stakeholder value through dynamic corporate governance. Former appointments include Group Company Secretary of HSBC Holdings plc and Rio Tinto. Appointed 1 March 2023 Nationality Indian External appointments • Managing director of Hindalco Industries Limited. • Director of Novelis Inc. • Non-executive director, Aditya Birla Management Corporation Ltd. • Director, Indian Institute of Metals. Significant past appointments • Executive vice president, worldwide operations and other engineering and management roles at Schlumberger across 28 years of service. Key skills and experience • Accomplished and transformative executive with operations and technology experience in the resources and energy industries. • Strong digital capability and experience. Board attendance in 2023 Eight scheduled meetings Five ad hoc meetings Non-executive directors Helge Lunda 7/8 5/5 Dame Amanda Blancb 8/8 4/5 Pamela Daleyb 8/8 4/5 Melody Meyer 8/8 5/5 Tushar Morzariab 8/8 4/5 Hina Nagarajanbc 7/7 3/4 Satish Paibc 7/7 3/4 Paula Rosput Reynolds 8/8 5/5 Karen Richardsonb 8/8 3/5 Sir John Sawers 8/8 5/5 Dr Johannes Teyssend 7/8 5/5 Executive directors Murray Auchinclossb 8/8 4/5 Bernard Looneye 5/5 3/3 Dr Johannes Teyssen Independent non-executive director Karen Richardson Independent non-executive director Appointed 1 January 2021 Nationality German External appointments • Senior advisor to Kohlberg Kravis Roberts. • President of Alpiq Holding Ltd. • Senior advisor to Viridor Limited. Significant past appointments • Several leadership positions at VEBA AG (merged with VIAG AG in 2000 and renamed to E.ON AG and later to E.ON SE). • Member of the board of management of the E.ON Group’s central management company in Munich in 2001 and E.ON SE in 2004. • Vice-chair of E.ON SE, 2008 and CEO, 2010. • President of Eurelectric 2013 to 2015. • Vice-chair of the World Energy Council, responsible for Europe, 2006 to 2012. • Member of the supervisory board of Salzgitter AG 2006 to 2016 and Deutsche Bank AG 2008 to 2018. Key skills and experience • Extensive experience and deep knowledge of the energy sector and its continuing transformation. • Considerable knowledge and experience of climate-related risk oversight. Appointed 1 January 2021 Nationality American External appointments • Partner at Artius Capital Partners. • Non-executive director (lead independent director) of Exponent, Inc. Significant past appointments • Senior operating roles in the public and private technology sector. • Vice president of sales at Netscape Communications Corporation 1995 to 1998. • Senior executive roles at E.piphany from 1998, including CEO 2003 to 2006. • Non-executive director of BT plc 2011 to 2018. • Director of Worldpay Inc. (Worldpay Group plc) 2016 to 2019. • Chair of Origin Materials Inc. 2021 to 2024. Key skills and experience • Extensive knowledge of digital, technology, cyber and IT security matters. • 30 years’ technology industry experience including working with innovative Silicon Valley companies. a Helge was unable to attend the scheduled meeting in May due to an important commitment for and on behalf of bp. He received accompanying material and had the opportunity to provide comments to the board. b In respect of the five ad hoc meetings which took place outside the scheduled board calendar, which is agreed far in advance: Dame Amanda, Pamela and Karen were unable to attend the meeting in December, and Tushar was unable to attend the meeting in June, due to prior commitments which the board was notified of. Karen was unable to attend the meeting in June due to an important commitment for and on behalf of bp. They received accompanying material and had the opportunity to provide comments to the board. Murray was recused from attending the meeting in September that considered the appointment of the interim CEO, while Hina and Satish were unable to make this meeting due to the short notice at which it was convened. c Hina and Satish each joined the board effective 1 March 2023 and attended all scheduled meetings held after their appointments. d Johannes was unable to attend the scheduled meeting in October due to a prior commitment which the board was notified of. He received accompanying material and had the opportunity to provide comments to the board. e Bernard ceased to be a member of the board effective 12 September 2023 and had attended all meetings prior to this date. Of the 13 board meetings held in 2023, eight were scheduled as part of the routine board calendar and five were scheduled on an ad hoc basis. Four scheduled meetings covered a full agenda across strategy, performance, people and governance. Two scheduled board meetings were focused on the quarterly results and two meetings reviewed a full agenda and the quarterly results.

86 bp Annual Report and Form 20-F 2023 Leadership team As at 8 March 2024 Integrators From left to right William Lin EVP regions, corporates & solutions Leadership team tenure Appointed on 1 July 2020 Nationality American Other board memberships William is a non-executive director of Pan American Energy Group, the largest independent energy company in Argentina. In addition, he is a member of the supervisory board for Corbion, a Dutch-listed global food ingredients and biochemicals company. He also chairs Corbion’s Sustainability & Safety Committee and is a member of the Audit Committee. Career summary William served as chief operating officer, upstream regions before joining the leadership team. He has worked in bp for 28 years, and has spent most of his career working abroad in different countries. His previous senior roles include vice president – gas development and operations for Egypt, regional president for Asia Pacific and head of the group chief executive’s office. William managed the successful completion, start-up and operation of the Tangguh LNG facility during his time in Indonesia. Carol Howle EVP trading & shipping Leadership team tenure Appointed on 1 July 2020 Nationality British Other board memberships None Career summary Before taking on her current role, Carol ran bp shipping and was the chief operating officer for integrated supply and trading, oil. She has more than 20 years’ experience in the energy industry, many in integrated supply and trading. Her previous roles include chief operating officer for natural gas liquids, regional leader of global oil Europe and finance. Carol also served as the head of the group chief executive’s office. Leigh-Ann Russell EVP innovation & engineering Leadership team tenure Appointed on 1 March 2022 Nationality British Other board memberships Leigh-Ann is a non-executive director of Hill & Smith Holdings. Career summary Leigh-Ann was previously bp’s SVP procurement, accountable for a supply chain of around $30 billion of global spend. Prior to this, she was global head of upstream supply chain and VP of technical functions and performance in the global wells organization. Leigh-Ann holds a degree in mechanical engineering and is a Chartered Petroleum Engineer. She is a Fellow of the Royal Academy of Engineering, a Fellow of the Energy Institute and a Fellow of the Royal Society of Edinburgh. In 2022, Leigh-Ann was conferred the honorary title of Professor of Practice of Queen’s University Belfast. Giulia Chierchia EVP strategy, sustainability & ventures Leadership team tenure Appointed on 1 July 2020 Nationality Belgian and Italian Other board memberships Giulia is a non-executive director of Schneider Electric. Career summary Giulia joined bp in April 2020 as EVP strategy, sustainability & ventures. In her role, Giulia drives bp’s strategy and sustainability agenda and embeds the group’s ethics and compliance within the organization. She oversees bp’s venturing investments business, which supports opportunities to enable bp’s transition and net zero ambition. Giulia also serves as a Non- Executive Director of the Board for Schneider Electric. Prior to bp, she worked for McKinsey, where she was a senior partner. She led the global downstream oil and gas practice and was a key member of the chemicals and electricity, power and natural gas practices. She has more than 10 years’ experience in the energy sector, including helping companies shape their strategies for the energy transition.

87bp Annual Report and Form 20-F 2023 Corporate governance See glossary on page 373 Business groups From left to right Enablers From left to right Gordon Birrell EVP production & operations Leadership team tenure Appointed on 1 July 2020 Gordon previously served on bp’s executive team starting on 12 February 2020. Nationality British Other board memberships Gordon is a non-executive director of Azule Energy Holdings Ltd. Career summary Before being appointed to his new role, Gordon was chief operating officer for production, transformation and carbon. In his bp career, Gordon has spent time in various leadership, technical, safety and operational risk roles, including four years as bp president Azerbaijan, Georgia and Türkiye. Gordon is a Fellow of the Royal Academy of Engineering. Kerry Dryburgh EVP people & culture Leadership team tenure Appointed on 1 July 2020 Nationality British Other board memberships None Career summary Kerry leads people & culture at bp. Mike Sosso EVP legal Leadership team tenure Appointed on 1 January 2024 Nationality American Other board memberships None Career summary Mike took on the role of EVP legal in January 2024. In his role, Mike is accountable for leading the legal function and executing the legal strategy for the group. Mike joined bp in 2011 and has held a number of leadership positions across legal. He also previously held the role of VP ethics and compliance. Prior to joining bp, Mike practised law in the Washington, DC office of Skadden, Arps, Slate, Meagher & Flom. Anja Dotzenrath EVP gas & low carbon energy Leadership team tenure Appointed on 1 March 2022 Nationality German Other board memberships None Career summary Anja has more than 30 years of experience in the global energy industry. Prior to her appointment, Anja was chief executive officer of RWE Renewables, one of the world’s leading renewables businesses. She previously held a broad range of leadership roles in E.ON, including chief executive officer of E.ON Climate & Renewables. Anja held a number of senior roles in management consultancy over 15 years before joining E.ON, with a focus on energy and the industrial sector. Emma Delaney EVP customers & products Leadership team tenure Appointed on 1 July 2020 Emma previously served on bp’s executive team starting on 1 April 2020 Nationality Irish Other board memberships None Career summary Emma has spent 28 years working in bp, both in the upstream and the downstream. Prior to joining bp’s executive team on 1 April 2020, she was regional president for West Africa. She has held a variety of senior roles including upstream chief financial officer for Asia Pacific and head of business development for gas value chains. In downstream she held roles in retail and commercial fuels and planning. Kerry previously headed HR for bp’s upstream business while also serving as group chief talent officer. She has held a series of senior HR positions across the company, including running HR for bp’s shipping, integrated supply and trading, and corporate functions. She brings vast experience from other sectors in Europe and Asia, having worked at both BT and Honeywell.
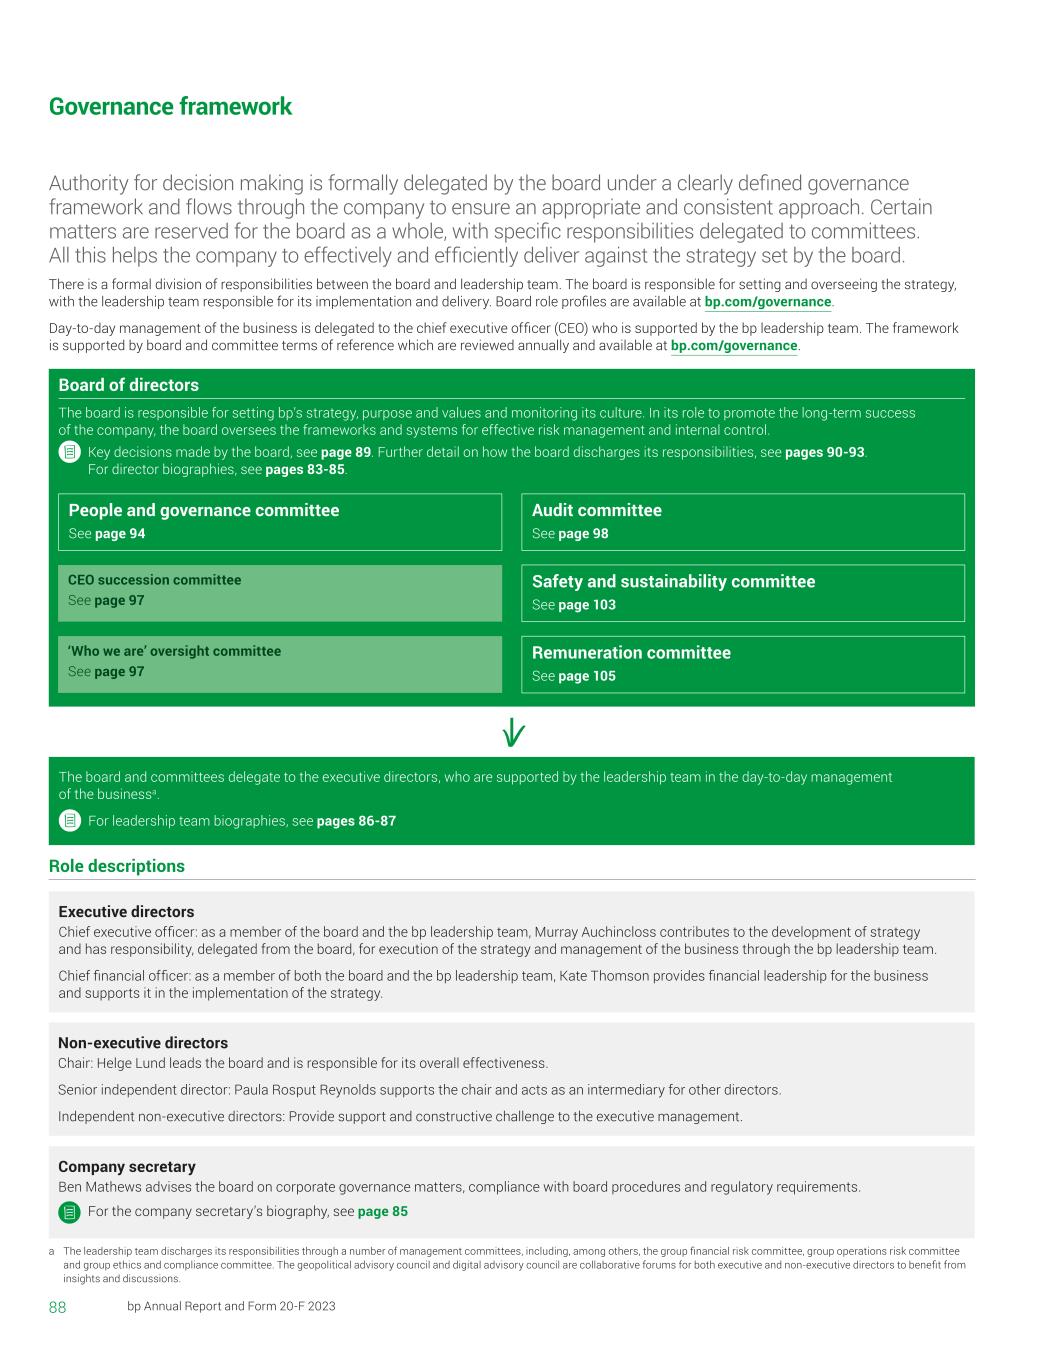
88 bp Annual Report and Form 20-F 2023 Governance framework a The leadership team discharges its responsibilities through a number of management committees, including, among others, the group financial risk committee, group operations risk committee and group ethics and compliance committee. The geopolitical advisory council and digital advisory council are collaborative forums for both executive and non-executive directors to benefit from insights and discussions. Non-executive directors Chair: Helge Lund leads the board and is responsible for its overall effectiveness. Senior independent director: Paula Rosput Reynolds supports the chair and acts as an intermediary for other directors. Independent non-executive directors: Provide support and constructive challenge to the executive management. Executive directors Chief executive officer: as a member of the board and the bp leadership team, Murray Auchincloss contributes to the development of strategy and has responsibility, delegated from the board, for execution of the strategy and management of the business through the bp leadership team. Chief financial officer: as a member of both the board and the bp leadership team, Kate Thomson provides financial leadership for the business and supports it in the implementation of the strategy. The board and committees delegate to the executive directors, who are supported by the leadership team in the day-to-day management of the businessa.  For leadership team biographies, see pages 86-87 Company secretary Ben Mathews advises the board on corporate governance matters, compliance with board procedures and regulatory requirements. For the company secretary’s biography, see page 85 Board of directors The board is responsible for setting bp’s strategy, purpose and values and monitoring its culture. In its role to promote the long-term success of the company, the board oversees the frameworks and systems for effective risk management and internal control.   Key decisions made by the board, see page 89. Further detail on how the board discharges its responsibilities, see pages 90-93. For director biographies, see pages 83-85. People and governance committee See page 94 Audit committee See page 98 Safety and sustainability committee See page 103 Remuneration committee See page 105 CEO succession committee See page 97 ‘Who we are’ oversight committee See page 97 Authority for decision making is formally delegated by the board under a clearly defined governance framework and flows through the company to ensure an appropriate and consistent approach. Certain matters are reserved for the board as a whole, with specific responsibilities delegated to committees. All this helps the company to effectively and efficiently deliver against the strategy set by the board. There is a formal division of responsibilities between the board and leadership team. The board is responsible for setting and overseeing the strategy, with the leadership team responsible for its implementation and delivery. Board role profiles are available at bp.com/governance. Day-to-day management of the business is delegated to the chief executive officer (CEO) who is supported by the bp leadership team. The framework is supported by board and committee terms of reference which are reviewed annually and available at bp.com/governance. Role descriptions
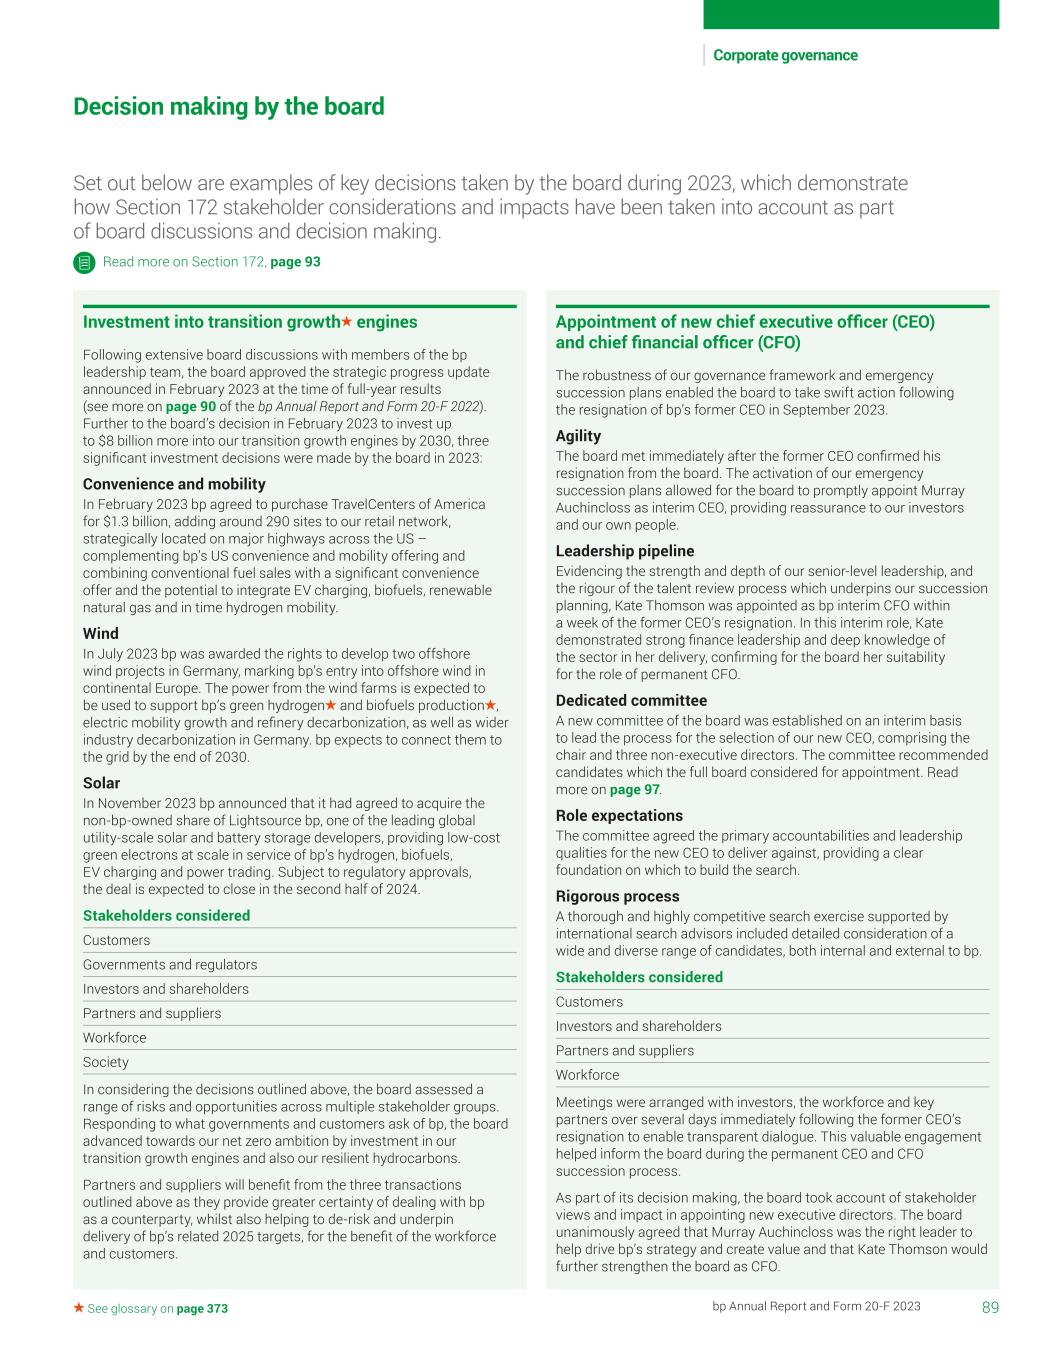
89bp Annual Report and Form 20-F 2023 Corporate governance See glossary on page 373 Decision making by the board Set out below are examples of key decisions taken by the board during 2023, which demonstrate how Section 172 stakeholder considerations and impacts have been taken into account as part of board discussions and decision making. Investment into transition growth engines Following extensive board discussions with members of the bp leadership team, the board approved the strategic progress update announced in February 2023 at the time of full-year results (see more on page 90 of the bp Annual Report and Form 20-F 2022). Further to the board’s decision in February 2023 to invest up to $8 billion more into our transition growth engines by 2030, three significant investment decisions were made by the board in 2023: Convenience and mobility In February 2023 bp agreed to purchase TravelCenters of America for $1.3 billion, adding around 290 sites to our retail network, strategically located on major highways across the US – complementing bp’s US convenience and mobility offering and combining conventional fuel sales with a significant convenience offer and the potential to integrate EV charging, biofuels, renewable natural gas and in time hydrogen mobility. Wind In July 2023 bp was awarded the rights to develop two offshore wind projects in Germany, marking bp’s entry into offshore wind in continental Europe. The power from the wind farms is expected to be used to support bp’s green hydrogen and biofuels production , electric mobility growth and refinery decarbonization, as well as wider industry decarbonization in Germany. bp expects to connect them to the grid by the end of 2030. Solar In November 2023 bp announced that it had agreed to acquire the non-bp-owned share of Lightsource bp, one of the leading global utility-scale solar and battery storage developers, providing low-cost green electrons at scale in service of bp’s hydrogen, biofuels, EV charging and power trading. Subject to regulatory approvals, the deal is expected to close in the second half of 2024. Stakeholders considered Customers Governments and regulators Investors and shareholders Partners and suppliers Workforce Society In considering the decisions outlined above, the board assessed a range of risks and opportunities across multiple stakeholder groups. Responding to what governments and customers ask of bp, the board advanced towards our net zero ambition by investment in our transition growth engines and also our resilient hydrocarbons. Partners and suppliers will benefit from the three transactions outlined above as they provide greater certainty of dealing with bp as a counterparty, whilst also helping to de-risk and underpin delivery of bp’s related 2025 targets, for the benefit of the workforce and customers. Appointment of new chief executive officer (CEO) and chief financial officer (CFO) The robustness of our governance framework and emergency succession plans enabled the board to take swift action following the resignation of bp’s former CEO in September 2023. Agility The board met immediately after the former CEO confirmed his resignation from the board. The activation of our emergency succession plans allowed for the board to promptly appoint Murray Auchincloss as interim CEO, providing reassurance to our investors and our own people. Leadership pipeline Evidencing the strength and depth of our senior-level leadership, and the rigour of the talent review process which underpins our succession planning, Kate Thomson was appointed as bp interim CFO within a week of the former CEO’s resignation. In this interim role, Kate demonstrated strong finance leadership and deep knowledge of the sector in her delivery, confirming for the board her suitability for the role of permanent CFO. Dedicated committee A new committee of the board was established on an interim basis to lead the process for the selection of our new CEO, comprising the chair and three non-executive directors. The committee recommended candidates which the full board considered for appointment. Read more on page 97. Role expectations The committee agreed the primary accountabilities and leadership qualities for the new CEO to deliver against, providing a clear foundation on which to build the search. Rigorous process A thorough and highly competitive search exercise supported by international search advisors included detailed consideration of a wide and diverse range of candidates, both internal and external to bp. Stakeholders considered Customers Investors and shareholders Partners and suppliers Workforce Meetings were arranged with investors, the workforce and key partners over several days immediately following the former CEO’s resignation to enable transparent dialogue. This valuable engagement helped inform the board during the permanent CEO and CFO succession process. As part of its decision making, the board took account of stakeholder views and impact in appointing new executive directors. The board unanimously agreed that Murray Auchincloss was the right leader to help drive bp’s strategy and create value and that Kate Thomson would further strengthen the board as CFO. Read more on Section 172, page 93

90 bp Annual Report and Form 20-F 2023 Board activities During 2023, the board and its committees had regular scheduled meetings and held additional meetings on an ad hoc basis, as required by business needs. Board meeting agendas are typically agreed in advance by the chair, chief executive officer (CEO) and company secretary, framed around four pillars – strategy, performance, people and governance. The information provided below sets out some of the board’s activities across each of these pillars during 2023. These activities were supported by the committees of the board where appropriate, with committee chairs providing update reports at board meetings. Strategy Strategic direction • Discussed strategic progress at each board meeting, including business development updates and deep-dives into our five transition growth engines to help embed a shared understanding of the business, market context, capital allocation and profitability over time. • Approved the strategic progress update announced in February 2023 that included an update on how we expect to achieve our short- to medium-term pathway to deliver our net zero production aim (aim 2) (see page 49). Macroeconomics • Received regular updates on the effect of the evolving macroeconomic environment on our strategy throughout the year. Mergers and acquisitions pipeline • Approved the purchase of TravelCenters of America in February 2023, which brings growth opportunities for four of our five transition growth engines: convenience, EV charging, biofuels/renewable natural gas (bioenergy) and, later, hydrogen (see page 20). • Approved the acquisition of the non-bp- owned share of Lightsource bp in November 2023, which is expected to help underpin and de-risk delivery of bp’s targets for its transition growth engines – in hydrogen, EV charging and biofuels as well as in power trading (see page 23). Investor update • Reviewed materials for the October 2023 investor presentations on the company’s plans and expectations for our oil and gas and biogas businesses (see page 93). Safety and sustainability • Reviewed ongoing safety, sustainability, project and operational performance throughout the year. Meeting colleagues at bp’s Canary Wharf office in London, UK St James’ Square Town hall, London, UK Performance Annual plan • Reviewed and approved the 2023 plan, which focused on capital allocation investments into oil and gas assets, and our transition growth engines, while continuing to strengthen the balance sheet. • Reviewed full-year delivery against the 2022 plan and monitored delivery against the 2023 plan. Financial frame and distributions • Reviewed options for enhancing and simplifying the financial frame. • Considered transition risks and opportunities as part of the review of the financial frame. • Reviewed distributions to shareholders each quarter, consistent with the financial frame. • Approved share buyback proposals together with 10% increases to our dividend per ordinary share for 4Q 2022 and 2Q 2023. Capital expenditure • Received a business update from the CEO at every board meeting. Updates covered projects across all of bp’s businesses and, where appropriate, specific climate-related considerations. • The CEO’s updates included any inorganic or divestment opportunities of more than $100 million, or which would represent a new strategic business. • Approved entering the German offshore wind market with a 4GW auction win in July 2023, where the renewable power generated is expected to help enable us to leverage integration opportunities with green hydrogen , EV mobility and power trading as we build the business. • Reviews and reserves for its approval all resilient hydrocarbon investment opportunities above $3 billion and all other transition and low carbon investment opportunities above $1 billion. Key Information that supports TCFD Recommendations and Recommended Disclosures in relation to Governance (see page 55)

91bp Annual Report and Form 20-F 2023 Corporate governance See glossary on page 373 Acquisition reviews • Assessed the integration of Archaea Energy. • Reviewed development pipelines and broader business priorities. Principal risks • Reviewed trends and themes arising from risk management reports. • Reviewed bp’s principal and emerging risks twice in 2023, including those related to climate and the impact of geopolitical and macroeconomic developments on the pace of the energy transition (see page 74). Internal controls • Assessed the effectiveness of the group’s system of internal control and risk management as part of the review and approval of the bp Annual Report and Form 20-F. No specific areas of concern were identified in this assessment and the board concluded that the group’s system of internal control and risk management continued to be resilient and fit for purpose, and that the system generally meets external expectations of components to be included in internal control frameworks. In arriving at these conclusions, the board took into account reports from group risk and internal audit, as well as deep-dive presentations and business reviews undertaken by the board and its committees during the year (see how we manage risk on page 73. People Engagement • Participated in the workforce engagement programme (WFEP), providing for board decisions to be better informed by the feedback received (see page 92). • Through WFEP, met high-potential employees to help improve their visibility with directors. • Held town halls in a number of countries during 2023 and undertook site visits to increase directors’ direct interaction with the workforce (see page 92). Succession • Supported by the people and governance committee, the board received updates and considered the composition, skills, experience and diversity of the board, as well as that of the bp leadership team. • Appointed the interim committee of the board that led the search process for bp’s new CEO (see page 97). Culture • Reviewed feedback from the ‘Pulse annual’ employee surveys, agreeing actions and initiatives in response. • The WFEP involved a number of sessions on bp’s ‘Who we are’ culture frame, to receive employees’ perspectives on bp’s culture. • Reviewed the annual ethics and compliance report, the function’s priorities and objectives, including reviewing changes to the code of conduct and the associated proposed roll-out programme. • Established a new interim board committee to gain insights into the implementation of the ‘Who we are’ culture frame (see page 97). Diversity • Approved an updated board diversity, equity and inclusion policy referencing the requirements of the UK Listing Rules (see page 96). Governance Board composition • Approved the appointment of Satish Pai and Hina Nagarajan as independent non-executive directors with effect from 1 March 2023. • Activated emergency succession process for the role of CEO and CFO, with a decision to approve Murray Auchincloss as interim CEO on 12 September 2023. Approval of the appointment of Kate Thomson as interim CFO followed on 19 September 2023. • Approved the appointments of Murray Auchincloss as CEO on 17 January 2024 and Kate Thomson as CFO and board member on 2 February 2024. Director training • Completed online training on matters including ethics and compliance and digital security. • Attended deep-dive knowledge sessions during 2023, including a teach-in on liquefied natural gas. • Individual non-executive directors attended one-to-one training sessions with senior members of the bp management team. Board effectiveness review • Conducted an internally facilitated evaluation of the board under the leadership of the chair and the people and governance committee (see page 95). Investor engagement • Undertook extensive investor engagement throughout the year (see page 92). Corporate governance framework • Operated in accordance with the governance framework established in 2020 (see page 88). • Considered the FRC’s proposed reforms as part of their 2023 consultation on the UK Corporate Governance Code. Site visit to our Bingo facility in the Permian Basin, US Douglas House Town hall, London, UK
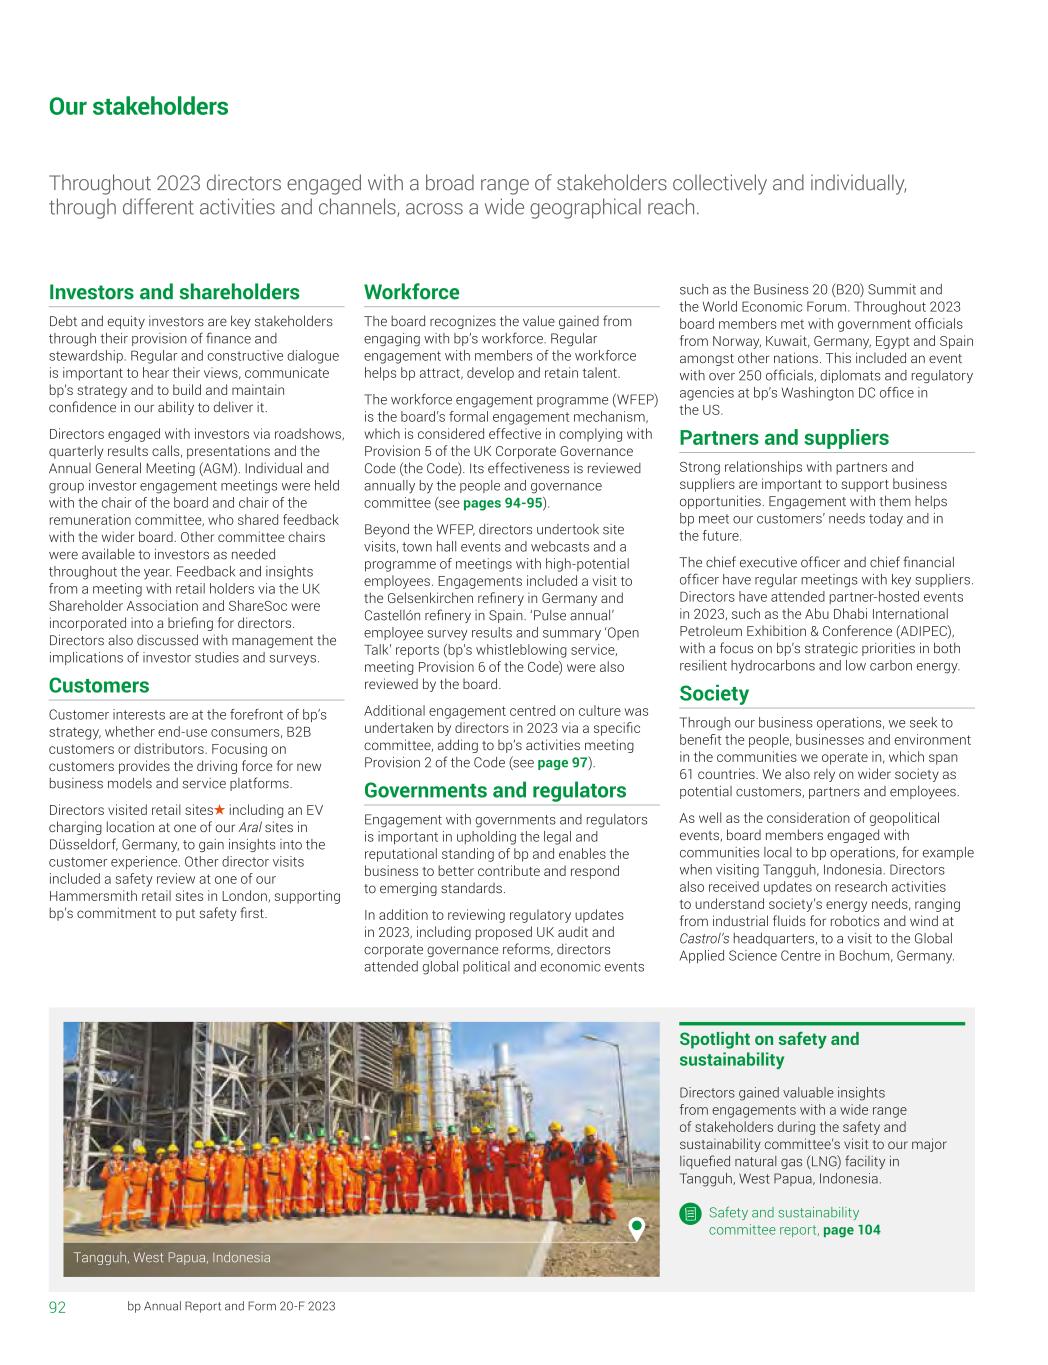
92 bp Annual Report and Form 20-F 2023 Our stakeholders Investors and shareholders Debt and equity investors are key stakeholders through their provision of finance and stewardship. Regular and constructive dialogue is important to hear their views, communicate bp’s strategy and to build and maintain confidence in our ability to deliver it. Directors engaged with investors via roadshows, quarterly results calls, presentations and the Annual General Meeting (AGM). Individual and group investor engagement meetings were held with the chair of the board and chair of the remuneration committee, who shared feedback with the wider board. Other committee chairs were available to investors as needed throughout the year. Feedback and insights from a meeting with retail holders via the UK Shareholder Association and ShareSoc were incorporated into a briefing for directors. Directors also discussed with management the implications of investor studies and surveys. Customers Customer interests are at the forefront of bp’s strategy, whether end-use consumers, B2B customers or distributors. Focusing on customers provides the driving force for new business models and service platforms. Directors visited retail sites including an EV charging location at one of our Aral sites in Düsseldorf, Germany, to gain insights into the customer experience. Other director visits included a safety review at one of our Hammersmith retail sites in London, supporting bp’s commitment to put safety first. Workforce The board recognizes the value gained from engaging with bp’s workforce. Regular engagement with members of the workforce helps bp attract, develop and retain talent. The workforce engagement programme (WFEP) is the board’s formal engagement mechanism, which is considered effective in complying with Provision 5 of the UK Corporate Governance Code (the Code). Its effectiveness is reviewed annually by the people and governance committee (see pages 94-95). Beyond the WFEP, directors undertook site visits, town hall events and webcasts and a programme of meetings with high-potential employees. Engagements included a visit to the Gelsenkirchen refinery in Germany and Castellón refinery in Spain. ‘Pulse annual’ employee survey results and summary ‘Open Talk’ reports (bp’s whistleblowing service, meeting Provision 6 of the Code) were also reviewed by the board. Additional engagement centred on culture was undertaken by directors in 2023 via a specific committee, adding to bp’s activities meeting Provision 2 of the Code (see page 97). Governments and regulators Engagement with governments and regulators is important in upholding the legal and reputational standing of bp and enables the business to better contribute and respond to emerging standards. In addition to reviewing regulatory updates in 2023, including proposed UK audit and corporate governance reforms, directors attended global political and economic events such as the Business 20 (B20) Summit and the World Economic Forum. Throughout 2023 board members met with government officials from Norway, Kuwait, Germany, Egypt and Spain amongst other nations. This included an event with over 250 officials, diplomats and regulatory agencies at bp’s Washington DC office in the US. Partners and suppliers Strong relationships with partners and suppliers are important to support business opportunities. Engagement with them helps bp meet our customers’ needs today and in the future. The chief executive officer and chief financial officer have regular meetings with key suppliers. Directors have attended partner-hosted events in 2023, such as the Abu Dhabi International Petroleum Exhibition & Conference (ADIPEC), with a focus on bp’s strategic priorities in both resilient hydrocarbons and low carbon energy. Society Through our business operations, we seek to benefit the people, businesses and environment in the communities we operate in, which span 61 countries. We also rely on wider society as potential customers, partners and employees. As well as the consideration of geopolitical events, board members engaged with communities local to bp operations, for example when visiting Tangguh, Indonesia. Directors also received updates on research activities to understand society’s energy needs, ranging from industrial fluids for robotics and wind at Castrol’s headquarters, to a visit to the Global Applied Science Centre in Bochum, Germany. Throughout 2023 directors engaged with a broad range of stakeholders collectively and individually, through different activities and channels, across a wide geographical reach. Spotlight on safety and sustainability Directors gained valuable insights from engagements with a wide range of stakeholders during the safety and sustainability committee’s visit to our major liquefied natural gas (LNG) facility in Tangguh, West Papua, Indonesia. Safety and sustainability committee report, page 104 Tangguh, West Papua, Indonesia
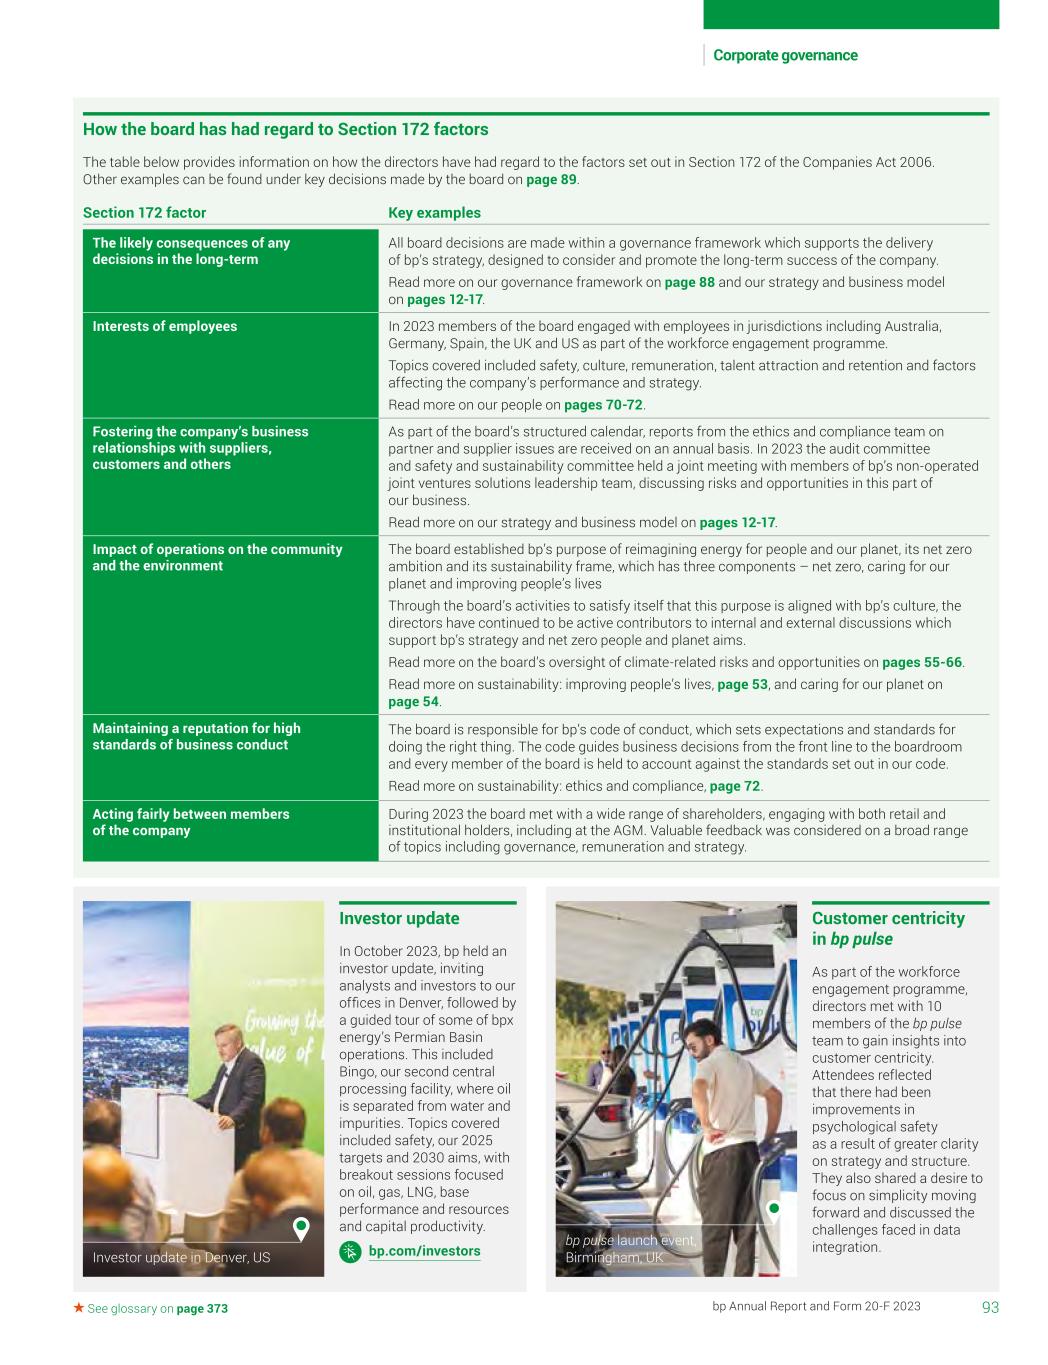
93bp Annual Report and Form 20-F 2023 Corporate governance See glossary on page 373 How the board has had regard to Section 172 factors The table below provides information on how the directors have had regard to the factors set out in Section 172 of the Companies Act 2006. Other examples can be found under key decisions made by the board on page 89. Section 172 factor Key examples The likely consequences of any decisions in the long-term All board decisions are made within a governance framework which supports the delivery of bp’s strategy, designed to consider and promote the long-term success of the company. Read more on our governance framework on page 88 and our strategy and business model on pages 12-17. Interests of employees In 2023 members of the board engaged with employees in jurisdictions including Australia, Germany, Spain, the UK and US as part of the workforce engagement programme. Topics covered included safety, culture, remuneration, talent attraction and retention and factors affecting the company’s performance and strategy. Read more on our people on pages 70-72. Fostering the company’s business relationships with suppliers, customers and others As part of the board’s structured calendar, reports from the ethics and compliance team on partner and supplier issues are received on an annual basis. In 2023 the audit committee and safety and sustainability committee held a joint meeting with members of bp’s non-operated joint ventures solutions leadership team, discussing risks and opportunities in this part of our business. Read more on our strategy and business model on pages 12-17. Impact of operations on the community and the environment The board established bp’s purpose of reimagining energy for people and our planet, its net zero ambition and its sustainability frame, which has three components – net zero, caring for our planet and improving people’s lives Through the board’s activities to satisfy itself that this purpose is aligned with bp’s culture, the directors have continued to be active contributors to internal and external discussions which support bp’s strategy and net zero people and planet aims. Read more on the board’s oversight of climate-related risks and opportunities on pages 55-66. Read more on sustainability: improving people’s lives, page 53, and caring for our planet on page 54. Maintaining a reputation for high standards of business conduct The board is responsible for bp’s code of conduct, which sets expectations and standards for doing the right thing. The code guides business decisions from the front line to the boardroom and every member of the board is held to account against the standards set out in our code. Read more on sustainability: ethics and compliance, page 72. Acting fairly between members of the company During 2023 the board met with a wide range of shareholders, engaging with both retail and institutional holders, including at the AGM. Valuable feedback was considered on a broad range of topics including governance, remuneration and strategy. Investor update In October 2023, bp held an investor update, inviting analysts and investors to our offices in Denver, followed by a guided tour of some of bpx energy’s Permian Basin operations. This included Bingo, our second central processing facility, where oil is separated from water and impurities. Topics covered included safety, our 2025 targets and 2030 aims, with breakout sessions focused on oil, gas, LNG, base performance and resources and capital productivity. bp.com/investors Customer centricity in bp pulse As part of the workforce engagement programme, directors met with 10 members of the bp pulse team to gain insights into customer centricity. Attendees reflected that there had been improvements in psychological safety as a result of greater clarity on strategy and structure. They also shared a desire to focus on simplicity moving forward and discussed the challenges faced in data integration. Investor update in Denver, US bp pulse launch event, Birmingham, UK
94 bp Annual Report and Form 20-F 2023 People and governance committee Workforce engagement programme Under the board’s workforce engagement programme (WFEP), every non-executive director attends at least one session each year where they hear directly from 10-12 individuals from a section of the workforce. To better inform the board’s discussions and decision making, the themes of the WFEP sessions were directly aligned with the board’s agenda for 2023. During the year, directors met with colleagues from our offshore wind team, the gas & low carbon energy business group, the US retail operating organization, Archaea Energy, bp pulse and our hydrogen businesses in the UK, Australia and Germany. Participants shared insights on customers, competitors and the energy transition, and views on bp’s strategy, technology, market challenges, ways of working and culture. An anonymized summary of each session was reviewed by the committee, and key themes shared with the board. In 2023 the committee also reviewed the workforce engagement mechanism and deemed the WFEP appropriate for the activities and structure of bp. Meetings and attendance The committee met five times in 2023. The EVP people & culture regularly attended the meetings. Non-executive directors Five scheduled meetings Helge Lund: member (July 2018), chair of the committee (September 2018) 5/5 Dame Amanda Blanc: membera 4/5 Paula Rosput Reynolds: member 5/5 Sir John Sawers: member 5/5 a Dame Amanda was unable to attend the meeting in November due to a pre-existing commitment which the committee was notified of upon her appointment. She received accompanying material and had the opportunity to provide comments to the committee. Chair’s introduction The committee’s major areas of focus in 2023 were succession planning, executive and non-executive, as well as overseeing management’s embedding of our ‘Who we are’ culture frame. Dear fellow shareholders, 2023 was a particularly active year for the committee. The committee’s major areas of focus in 2023 were succession planning, executive and non-executive, as well as overseeing management’s embedding of our ‘Who we are’ culture frame, which encompasses bp’s values and behaviours. Executive succession plans were reviewed during the year, covering not only succession options and development plans for the bp leadership team, but also emerging talent throughout the organization. Given the importance the board attaches to ensuring a strong pipeline of future leaders, the committee oversaw the launch of a new leadership development programme. This programme provides structured development opportunities for all employees, but focuses in particular on those with high executive potential, while also helping to advance our diversity, equity and inclusion (DE&I) ambitions. The committee reviewed bp’s people-related priorities for 2023, which included the roll-out of the company’s ‘Who we are’ culture frame, and further enhancing workforce engagement to better inform board-level debate and decisions. Read more on page 95. Looking ahead to 2024, the committee’s focus will remain on executive succession, the gradual refreshing of the board as non-executives reach the end of their tenure, and initiatives to develop and enhance bp’s culture. The committee’s review of the effectiveness and further embedding of the ‘Who we are’ culture frame will provide valuable qualitative data about the company’s culture and areas where further focus is required. Role of the committee The committee seeks to ensure that the composition and structure of the board remains effective and also monitors the balance of skills, knowledge, experience and diversity required. The process for the nomination, induction and orderly succession of candidates for the board, the leadership team and the company secretary role are led by the committee, as is the annual review of the board’s performance. Key responsibilities The committee’s full terms of reference can be viewed at bp.com/governance. Helge Lund Committee chair 8 March 2024
95bp Annual Report and Form 20-F 2023 Corporate governance See glossary on page 373 Activities during the year Succession planning Board succession planning • Reviewed during the year the tenure, skills, experience and diversity of the existing board members and the succession plans for non-executive directors, including succession for the roles of senior independent director and chair of the remuneration committee. • Following these reviews, the committee agreed the criteria for two roles to bolster the experience and interests of the board, covering industry, operational, manufacturing and remuneration experience, with a focus on representation from our key markets. • Engaged MWM Consulting and Spencer Stuart in support of search activity for new board candidates, while the chief executive officer (CEO) succession committee engaged Egon Zehnder in support of the company’s search for a CEOa. Read more about the CEO succession committee on page 97. Executive succession planning • Reviewed the leadership team succession planning scenarios over the short, medium and long-term, mapping the key skills and experience required to fulfil these positions for the continued implementation of bp’s strategy and net zero ambition. The robustness and effectiveness of the committee’s emergency succession plans were evidenced by the swift appointments of Murray Auchincloss as interim CEO and Kate Thomson as interim chief financial officer (CFO) following the resignation of the former CEO in September 2023. Read more on Murray’s appointment as CEO on page 97. • Leadership team succession planning is underpinned by a comprehensive talent review process. In being recognized as a succession candidate for the role of CFO, Kate Thomson underwent a rigorous evaluation, including an external third-party assessment, to identify the skills and qualities she could bring to an executive role. Following her appointment as interim CFO in September 2023, Kate demonstrated strong finance leadership confirming her suitability for the role of CFO and executive director of the board. • Reviewed the launch of new bp-wide leadership development initiatives, including a new programme with INSEAD aimed at supporting the progression of leaders with high-potential. The programme included specific pathways to promote diverse talent. • Oversaw the development of high- performing individuals to accelerate the development of the skills needed to drive forward bp’s transition. Culture ‘Who we are’ • Received updates on how initiatives were contributing to embedding the ‘Who we are’ culture frame. • Reviewed feedback received through the employee ‘Pulse annual’ employee survey. • For information on the committee set up on an interim basis in 2023 to focus on culture oversight, see page 97. Workforce engagement • Received reports on workforce engagement sessions and reviewed the effectiveness of the engagement mechanism. Read more on page 94. • Reviewed the results of the company’s employee ‘Pulse annual’ employee survey and monitored progress against a defined set of ‘Who we are’ measures. These measures, underpinned by insights from the ‘Pulse annual’ employee survey, provided the committee with measurable insight into the adoption of bp’s ‘Who we are’ culture frame and assisted the committee in understanding the sentiment of bp’s workforce. Board performance Looking back on 2022 • Reviewed progress on previously agreed actions, including to improve the board’s effectiveness and efficiency by reviewing pre-read templates to support prioritization of the board’s focus areas and a refresh of forward calendar planning to optimise board members’ time commitment. • The actions identified by the board in concluding the prior year’s performance were reviewed during 2023. Good progress has been made against these actions as evidenced by 2023’s board review. • In light of the three-year evaluation cycle, the committee decided that the 2023 evaluation be facilitated internally, with the next external review anticipated in 2024. 2023 board performance review • The chair and company secretary led the internal evaluation of the board and its committees. This was supported by the use of a digital platform to better capture and organize feedback and to define and track identified actions. The chair and company secretary also held one-to-one meetings with each non-executive director which covered their individual performance. • A review of Murray’s performance as interim CEO was led by the chair, with input from the senior independent director. • The chair’s performance review was led by the senior independent director. • Feedback was consolidated and presented to the board in early 2024. The 2023 performance review concluded that the board and its committees continue to operate effectively. Alongside the ongoing renewal of the board to ensure it has the right balance of skills, experience and diversity to oversee the company’s strategy and its execution, the review highlighted some actions to further enhance its effectiveness during 2024. With the appointment of Murray Auchincloss as the new permanent CEO in January 2024, the board will support his development and effectiveness, driving shareholder value and a further commitment to its oversight of bp’s purpose and culture frame. Among the actions identified by the review, a detailed programme of strategy discussions to be held during 2024 is planned to help optimise capital investment proposals in an evolving macro environment. Learning, development and induction Induction • On appointment, all directors receive a formal induction, tailored to their individual needs, skills and experience and which takes account of any committees they join. • In March 2023 Hina Nagarajan and Satish Pai were appointed as independent non- executive directors to the board, as well as to the audit committee and safety and sustainability committee respectively, with induction programmes provided in advance of and following their appointments. • These inductions included one-to-one meetings with members of the board and leadership team and with select members of senior management. • Feedback is sought from directors undertaking their induction programmes to ensure they are continually updated and improved. Training and development • Beyond directors’ initial induction, ongoing training and development is provided during the routine programme of meetings and board visits (e.g. the audit committee’s visit to the security operations centre, where members learned first-hand about the operations of our digital security team). a None of the search agents have any connection with the company or individual directors, save that Egon Zehnder provides advice and support on bp’s executive development programme and Spencer Stuart supports on executive recruitment. Key Information that supports TCFD Recommendations and Recommended Disclosures in relation to Governance (see page 55)
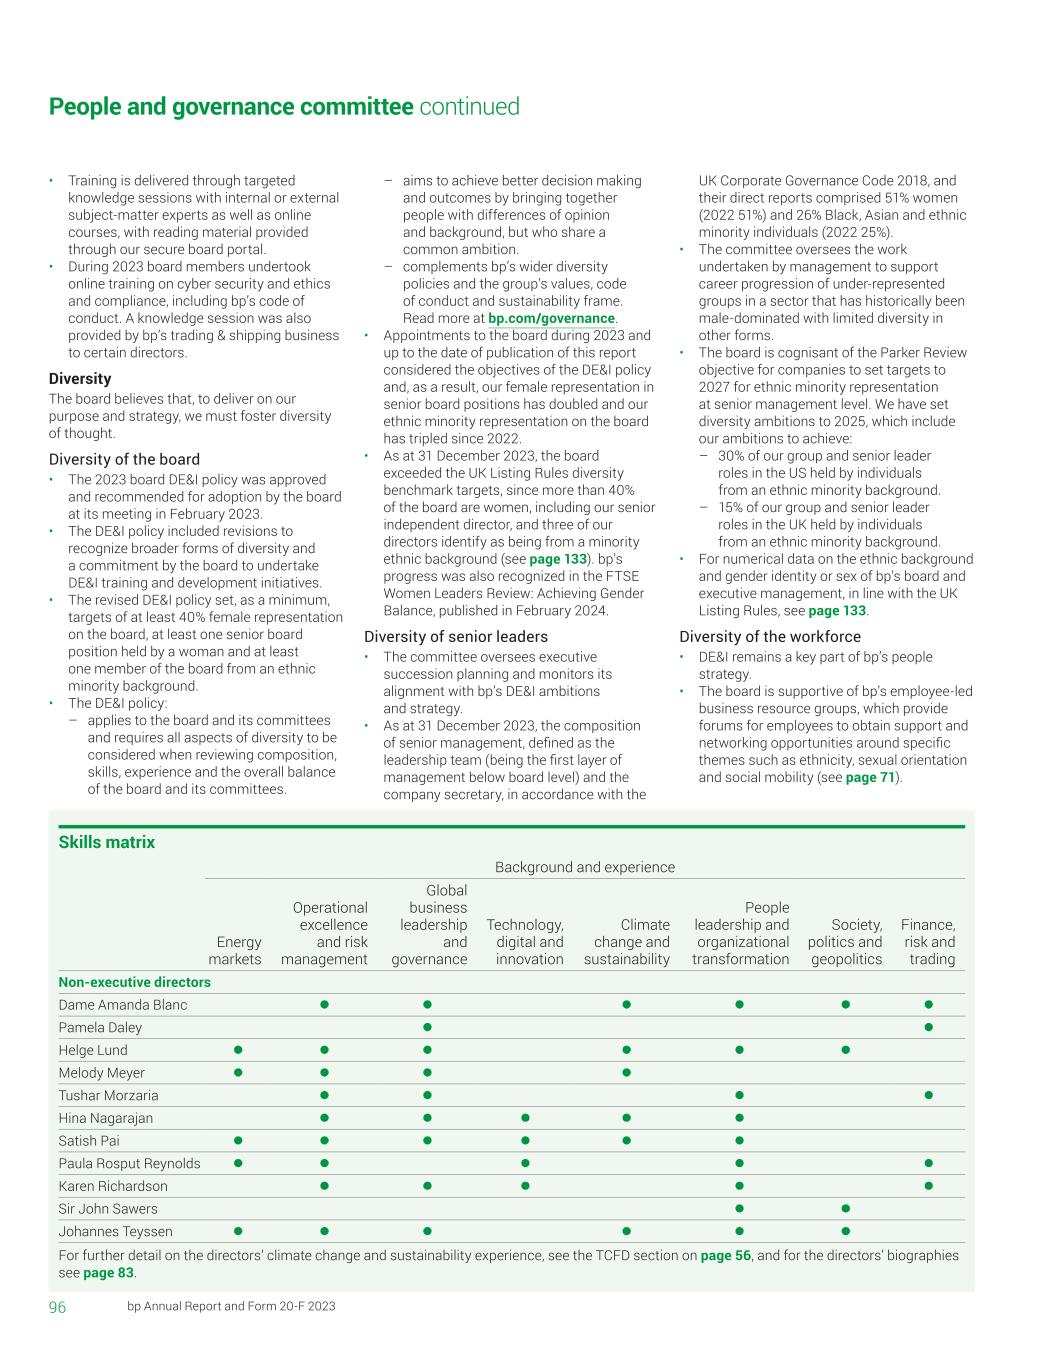
96 bp Annual Report and Form 20-F 2023 People and governance committee continued • Training is delivered through targeted knowledge sessions with internal or external subject-matter experts as well as online courses, with reading material provided through our secure board portal. • During 2023 board members undertook online training on cyber security and ethics and compliance, including bp’s code of conduct. A knowledge session was also provided by bp’s trading & shipping business to certain directors. Diversity The board believes that, to deliver on our purpose and strategy, we must foster diversity of thought. Diversity of the board • The 2023 board DE&I policy was approved and recommended for adoption by the board at its meeting in February 2023. • The DE&I policy included revisions to recognize broader forms of diversity and a commitment by the board to undertake DE&I training and development initiatives. • The revised DE&I policy set, as a minimum, targets of at least 40% female representation on the board, at least one senior board position held by a woman and at least one member of the board from an ethnic minority background. • The DE&I policy: – applies to the board and its committees and requires all aspects of diversity to be considered when reviewing composition, skills, experience and the overall balance of the board and its committees. – aims to achieve better decision making and outcomes by bringing together people with differences of opinion and background, but who share a common ambition. – complements bp’s wider diversity policies and the group’s values, code of conduct and sustainability frame. Read more at bp.com/governance. • Appointments to the board during 2023 and up to the date of publication of this report considered the objectives of the DE&I policy and, as a result, our female representation in senior board positions has doubled and our ethnic minority representation on the board has tripled since 2022. • As at 31 December 2023, the board exceeded the UK Listing Rules diversity benchmark targets, since more than 40% of the board are women, including our senior independent director, and three of our directors identify as being from a minority ethnic background (see page 133). bp’s progress was also recognized in the FTSE Women Leaders Review: Achieving Gender Balance, published in February 2024. Diversity of senior leaders • The committee oversees executive succession planning and monitors its alignment with bp’s DE&I ambitions and strategy. • As at 31 December 2023, the composition of senior management, defined as the leadership team (being the first layer of management below board level) and the company secretary, in accordance with the Skills matrix Background and experience Energy markets Operational excellence and risk management Global business leadership and governance Technology, digital and innovation Climate change and sustainability People leadership and organizational transformation Society, politics and geopolitics Finance, risk and trading Non-executive directors Dame Amanda Blanc Pamela Daley Helge Lund Melody Meyer Tushar Morzaria Hina Nagarajan Satish Pai Paula Rosput Reynolds Karen Richardson Sir John Sawers Johannes Teyssen For further detail on the directors’ climate change and sustainability experience, see the TCFD section on page 56, and for the directors’ biographies see page 83. UK Corporate Governance Code 2018, and their direct reports comprised 51% women (2022 51%) and 26% Black, Asian and ethnic minority individuals (2022 25%). • The committee oversees the work undertaken by management to support career progression of under-represented groups in a sector that has historically been male-dominated with limited diversity in other forms. • The board is cognisant of the Parker Review objective for companies to set targets to 2027 for ethnic minority representation at senior management level. We have set diversity ambitions to 2025, which include our ambitions to achieve: – 30% of our group and senior leader roles in the US held by individuals from an ethnic minority background. – 15% of our group and senior leader roles in the UK held by individuals from an ethnic minority background. • For numerical data on the ethnic background and gender identity or sex of bp’s board and executive management, in line with the UK Listing Rules, see page 133. Diversity of the workforce • DE&I remains a key part of bp’s people strategy. • The board is supportive of bp’s employee-led business resource groups, which provide forums for employees to obtain support and networking opportunities around specific themes such as ethnicity, sexual orientation and social mobility (see page 71).
97bp Annual Report and Form 20-F 2023 Corporate governance See glossary on page 373 In 2023 two additional interim committees were established. More detail on their roles and key responsibilities can be found below. CEO succession committee The board met immediately after the former CEO resigned in September 2023. Our existing succession plans were activated and the board appointed Murray Auchincloss as interim CEO within a few hours. Demonstrating the strength of our senior-level leadership and the rigour of our emergency succession plans, Kate Thomson was appointed as interim CFO one week later. Following this, a new board committee was formed on an interim basis, focused on the selection of the next CEO. The committee led a thorough and highly competitive process for the identification, selection and appointment to the board of bp’s next CEO. Helge Lund was committee chair, with Amanda Blanc, Tushar Morzaria and Johannes Teyssen committee members. The committee had a clear remit including the workstreams leading to the appointment of the CEO. A project plan was agreed and the timeframe and delivery of key workstreams were monitored. With inputs from the board, the committee agreed the role profile and the proposed hiring approach, which included, but was not limited to, psychometric testing, interview and candidate submission content. This approach was then confirmed with the chosen search firm, Egon Zehnder. Over a period of four months, the committee met regularly and interviewed a range of high-calibre internal and external candidates. Following robust due diligence on each candidate, the committee recommended a shortlist to be interviewed by the full board. The process resulted in the board’s unanimous agreement that Murray Auchincloss was the best candidate and the right leader for bp. Read more in the chair’s letter on page 4. ‘Who we are’ oversight committee The ‘Who we are’ oversight committee was established on an interim basis by the board in 2023, to gain insight into management’s progress towards embedding bp’s ‘Who we are’ culture frame, with a specific emphasis on psychological safety and speaking up. The committee reviewed management’s approach to measuring bp’s culture, including the analysis of ‘Pulse live’ and ‘Pulse annual’ employee surveys of cross-sections of bp’s workforce and comparative benchmark data, as well as external best practice. Additionally, the committee considered the effectiveness of the company’s code of conduct and associated policies and guidelines and the operation of the company’s confidential speak-up programme. bp’s people & culture and ethics and compliance management supported the committee’s work and attended meetings. The work of the committee was supplemented by individual engagement sessions with different parts of the workforce to hear directly about issues of relevance to the measurement of bp’s culture. Our existing workforce engagement programme described on page 94 provided the ideal framework for this, with engagement sessions focused on culture which have supported the committee’s work. The committee’s activities have informed the board’s assessment and monitoring of culture. Its work will additionally help to facilitate how the views of the workforce are considered in board discussions and decision-making. It is expected that the responsibilities of the ‘Who we are’ oversight committee will be absorbed by the people and governance committee. Chaired by Helge Lund, the committee met twice in 2023. The other committee members were Amanda Blanc, Melody Meyer and Paula Rosput Reynolds.

98 bp Annual Report and Form 20-F 2023 Dear fellow shareholders, I am pleased to present the committee’s report for the year ended 31 December 2023. The challenging macro environment and energy market volatility have been areas of focus for the committee this year, with close attention paid to energy price assumptions and the ongoing suitability of discount rates for impairment testing. The committee has regularly scrutinized key accounting issues and judgements made by management to monitor and assess the continued integrity of the group’s financial reporting. Read more on page 99. The committee has monitored the approach and scope of the group’s non-financial reporting framework, taking into account evolving environmental, social and governance (ESG) reporting. It also receives regular updates from management on the wider control environment, such as the controls in place for financial reporting, and examines the progress of remediating any deficiencies with input from bp’s internal audit team and our external auditor, Deloitte. The committee reviewed and monitored the principal risks allocated to it by the board for 2023, through a combination of business reviews and focused engagements, as well as regular updates from management, internal audit and Deloitte. Read more on page 102. Engaging with bp’s workforce is important to us, and we were pleased to spend time with the accounting, reporting and control and internal audit teams in our technology and business centre in bp’s Sunbury, UK office. Read more on page 101. The committee continues to engage with other stakeholders where appropriate, including regulatory inspections when they occur. Role of the committee The committee monitors the effectiveness of the group’s financial reporting, including ESG and climate-related financial disclosures, systems of internal control and risk management. It also monitors the integrity of the group’s external and internal audit processes. Key responsibilities A summary of the committee’s terms of reference is on page 359 and the full terms of reference can be viewed at bp.com/governance. This report describes how bp has approached compliance with the provisions of the FRC’s Audit Committees and the External Audit: Minimum Standard. Tushar Morzaria Committee chair 8 March 2024 Audit committee Meetings and attendance The committee met nine times in 2023. Regular attendees included the chief financial officer (CFO), SVP accounting, reporting and control, SVP internal audit, EVP legal, and the external auditor. Non-executive directors Eight scheduled meetings One ad hoc meeting Tushar Morzaria: member (September 2020), chair of the committee (May 2021) 8/8 1/1 Pamela Daleya: member 8/8 0/1 Paula Rosput Reynolds: member 8/8 1/1 Karen Richardson: member 8/8 1/1 Hina Nagarajan: member (March 2023) 7/7 1/1 a One ad hoc meeting was arranged during December. As it took place outside of the scheduled committee calendar, which is agreed far in advance, Pamela was unable to attend due to a prior commitment. She received accompanying material and had the opportunity to provide comments to the committee. Financial expertise The board is satisfied that: • Tushar Morzaria, the chair of the committee, has recent and relevant financial experience as required by the UK Corporate Governance Code 2018 and that he is competent in accounting and auditing in accordance with the FCA’s Disclosure Guidance and Transparency Rules. • The committee has an appropriate and experienced blend of commercial, financial and audit expertise to assess the issues it is required to address, as well as competence in the oil and gas sector. • As a US foreign private issuer, the committee meets the independence criteria provisions of Rule 10A-3 of the US Securities Exchange Act of 1934, and Tushar Morzaria can be regarded as an audit committee financial expert as defined in Item 16A of Form 20-F. Chair’s introduction The committee has regularly scrutinized key accounting issues and judgements made by management to monitor and assess the continued integrity of the group’s financial reporting.
99bp Annual Report and Form 20-F 2023 Corporate governance See glossary on page 373 Activities during the year Financial reporting and assurance • Monitored the integrity of and reviewed the quarterly, half-year and annual financial statements and supporting materials, including key accounting judgements, and discussed these with management and the external auditor. • Reviewed and challenged the application and appropriateness of significant accounting policies and financial reporting judgements, concluding that the financial statements appropriately addressed the key accounting judgements and estimates in respect of both the amounts reported and disclosures made. Examples are set out in the table below. • Reviewed the affordability of proposed distributions (dividends and share buybacks) under bp’s financial frame as part of the quarterly results process and reported to the board on the outcome of that review. • Reviewed the company’s going concern assumption and longer-term viability statement. Determined and recommended to the board that it was appropriate to adopt the going concern basis of accounting and the longer-term viability of the company in accordance with Provision 31 of the UK Corporate Governance Code. • Discussed and challenged financial reporting and internal controls processes and reviewed any control gaps identified and mitigating actions. Read more under the internal controls section on page 102. • Received a report from management on the verification process undertaken in respect of the bp Annual Report and Form 20-F, including non-financial disclosures such as the Task Force on Climate-related Financial Disclosures (TCFD). Examples of how key accounting judgements and estimates were considered and addressed, and how relevant accounting policies have been applied Audit committee activity Conclusions/outcomes Impact of climate change and the energy transition Climate change and the transition to a lower carbon economy may have significant impacts on the currently reported amounts of the group’s assets and liabilities, and on similar assets and liabilities that may be recognized in the future. • Reviewed management’s assumptions relating to impairment testing, recoverability of exploration assets and decommissioning provisions. Read more below. • Reviewed how management’s revised best estimate of oil and natural gas prices are in line with a range of transition paths consistent with the goals of the Paris climate change agreement. • Management’s revised best estimate of oil and natural gas prices are in line with a range of transition paths consistent with the goals of the Paris climate change agreement. • Read more in Note 1 regarding how bp applies carbon pricing in its impairment testing, sensitivity analyses estimating effects of changes in net revenue and changes in the expected timing of decommissioning. Provisions The group holds provisions primarily for decommissioning, environmental remediation and litigation. The most significant provision is for the future decommissioning of oil and natural gas production facilities and pipelines. Estimation uncertainty exists as most of these events are many years in the future. Assumptions are made by bp in relation to cost estimation, settlement dates, technology, legal requirements and discount rates. There is also a risk that decommissioning obligations from previously divested assets revert to bp. • Received briefings on decommissioning (including the process for managing the risk of decommissioning reversion), environmental, asbestos and litigation provisions. These included the requirements, governance and controls for the development and approval of cost estimates and provisions in the financial statements. • Reviewed and challenged the group’s discount rates for calculating provisions. • Decommissioning provisions of $12.4 billion were recognized on the balance sheet at 31 December 2023. • The discount rate used by bp to determine the balance sheet obligation at the end of 2023 was a nominal rate of 4%, based on long-dated US government bonds; an increase of 0.5% from 2022. Recoverability of asset carrying values Determination as to whether and how much an asset, cash generating unit (CGU) or group of CGUs containing goodwill is impaired involves management judgement and estimates on uncertain matters such as future commodity prices, discount rates, production profiles, reserves and the impact of inflation on operating expenses. Judgement is also required to determine whether it is appropriate to continue to carry intangible assets related to exploration costs on the balance sheet. • Reviewed policy and guidelines for compliance with oil and gas reserves disclosure regulation, including the group’s reserves governance framework and controls. • Reviewed and challenged the group’s oil and gas price assumptions. • Reviewed and challenged the group’s discount rates for impairment testing purposes. • Impairment charges, reversals and ‘watch-list’ items were reviewed as part of the quarterly due diligence process. • The group’s price assumption for Brent oil and for Henry Hub gas were updated as set out on page 30 and in Note 1. • Sensitivity analyses estimating the effect of changes in net revenue and discount rate assumptions have been disclosed in Note 1. • Net impairment charges of $5.7 billion have been disclosed in Note 4. • Exploration intangibles totalled $4.3 billion at 31 December 2023. • Challenged management on the underlying assumptions used in the TCFD assessment. • Recommended to the board that the bp Annual Report and Form 20-F was fair, balanced and understandable. • Considered the FRC’s proposed reforms as part of the FRC’s 2023 consultation on the UK Corporate Governance Code. Key Information that supports TCFD Recommendations and Recommended Disclosures in relation to Governance (see page 55)
100 bp Annual Report and Form 20-F 2023 Examples of how key accounting judgements and estimates were considered and addressed, and how relevant accounting policies have been applied Audit committee activity Conclusions/outcomes Pensions Accounting for pensions and other post- retirement benefits involves making estimates when measuring the group’s pension plan surpluses and deficits. These estimates require assumptions to be made about uncertain events, including discount rates, inflation and life expectancy. • Reviewed and challenged the group’s assumptions used to determine the projected benefit obligation at the year end, including the discount rate, rate of inflation and salary growth and mortality levels. • At 31 December 2023, surpluses of $7.9 billion and deficits of $5.5 billion were recognized on the balance sheet in relation to pensions and other post- retirement benefits. • The method for determining the group’s assumptions remained largely unchanged from 2022. The values of these assumptions and a sensitivity analysis of the impact of possible changes on the benefit expense and obligation are provided in Note 24. Investment in Aker BP Judgement is required in assessing the level of control or influence over another entity in which the group holds an interest. bp uses the equity method of accounting for its investment in Aker BP and bp’s share of Aker BP’s oil and natural gas reserves is included in the group’s estimated net proved reserves of equity- accounted entities. The equity-accounting treatment of bp’s 15.9% interest in Aker BP in 2023 was dependent on the judgement that bp had significant influence over Aker BP. • Considered whether bp continued to retain significant influence over Aker BP throughout 2023. • bp retained significant influence, as defined by IFRS, over Aker BP throughout 2023. Investment in Rosneft bp’s interest in Rosneft is measured at a fair value of nil. • Reviewed the accounting considerations relating to bp’s shareholding in Rosneft and other businesses with Rosneft in Russia, including the valuation of these investments. • bp continues to determine that it does not have significant influence over Rosneft. • bp considers that it is not currently possible to estimate any carrying value of the interest in Rosneft other than zero and that the accounting criteria for recognizing any dividend income have not been met. Derivatives For level 3 derivative financial instruments, bp estimates their fair values using internal models due to the absence of quoted market pricing or other observable, market- corroborated data. Judgement may be required to determine whether contracts to buy or sell commodities meet the definition of a derivative, in particular liquefied natural gas (LNG) contracts. • Received a briefing on the group’s trading risks and reviewed the system of risk management and controls in place. • Reviewed the control process and risks relating to the trading business. • Received updates on accounting judgements on LNG and derivatives associated with hybrid bonds. • bp has assets and liabilities of $9.2 billion and $7.1 billion, respectively, recognized on the balance sheet for level 3 derivative financial instruments at 31 December 2023, mainly relating to the activities of the trading & shipping function. bp’s use of internal models to value certain of these contracts has been disclosed in Note 1. • bp considers that contracts to buy or sell LNG do not meet the definition of a derivative under IFRS. Audit committee continued

101bp Annual Report and Form 20-F 2023 Corporate governance See glossary on page 373 Sunbury, UK visit 2023 In November 2023 Tushar Morzaria and members of the committee visited the accounting, reporting and control (ARC) team at bp’s offices in Sunbury, UK for a showcase of their work on controls and reporting, including a simplified close approach to quarterly financial reporting. They engaged with members of the broader finance team during a floor walk, hearing their views and thoughts on a number of key topics. The committee members also met with the internal audit senior leadership team to discuss in depth the proposed internal audit programme for 2024, as well as plans to further harness the use of data analytics. The visit was a great opportunity to build connections with the ARC and internal audit teams, and gain insight into key areas of focus planned for 2024. Finally, they visited the security operations centre, where they learned first-hand about the operations of our digital security team. External audit Auditor reappointment and independence • Considered and agreed to recommend the reappointment of the external auditor to the board. • Assessed the independence of the external auditor on an ongoing basis, taking account of the information and assurances provided by the external auditor, the level of non-audit fees, the timeline for rotation of the lead audit partner and the timeline for the re-tender of audit services. Read more under the oversight of audit fees and non-audit services section. • The external auditor is required to rotate the lead audit partner every five years and other senior staff every five to seven years. No partners or senior staff associated with the bp audit may transfer to the group. • External audit services were last tendered in 2016 and the external auditor has been in role for six years (since 2018). It is anticipated that a re-tender will be completed by 2026 or sooner, in line with relevant guidelines that require a tender at 10 years. This will allow sufficient time for potential tendering firms and the company to assess non-audit services that could impair independence. The committee believes that the anticipated timeline for the re-tender of audit services is in the best interests of shareholders as it provides an appropriate balance between factors such as knowledge of controls and risks, maintaining audit quality, independence and objectivity and value for money. • The company complies with the requirements of the Statutory Audit Services for Large Companies Market Investigation (Mandatory Use of Competitive Tender Processes and Audit Committee Responsibilities) Order 2014. Assessment of quality and effectiveness • Assessed audit quality and effectiveness through reports from the external auditor and management, and private meetings with the external auditor. The committee was satisfied that the audit team was providing the required quality of services, demonstrated the necessary commitment and ability and had provided constructive challenge to management. The committee received the following audit quality reports as part of its assessment: – External auditor insights report – summary of areas of opportunity for improvements to processes related to financial reporting or internal controls, management’s response to the recommendations identified, progress made against any prior year items and areas of focus for the year ahead. – Management survey – the survey sought views from key internal stakeholders on the external auditor’s performance, for which the main measurement criteria were: planning and scope, robustness of audit, independence and objectivity, quality of delivery, quality of people and service, and value-added advice. The survey also sought feedback on bp’s commitment to the audit. The overall score from the survey increased compared to the previous year with areas of strength noted including audit team judgement, integrity and attitude, as well as communication. • Discussed improvement opportunities, including the benefits of further information on how the external auditor used technology in their audit. Audit plan • Reviewed the external audit plan, in particular the materiality level versus prior years and key audit risks relating to: impairment of oil and gas property plant and equipment assets; accounting for complex transactions; valuation of financial instruments with significant unobservable inputs; and management override of controls. As part of the external audit plan, received a report on audit quality, including actions taken to address the FRC’s annual report on the external auditor, as well as the inspection results of the external auditor’s quality control procedures. • Approved the external audit plan, noting key scoping changes, resourcing, and received updates on delivery against the plan, as well as an update prior to year end on key audit risks. Oversight of audit fees and non-audit services • Reviewed the fee structure, resourcing and terms of engagement for the external auditor. • Retained oversight of bp’s policy on non-audit services and the review and approval of non-audit services. The policy safeguards audit objectivity and independence through the prohibition of non-audit tax services being provided by the external auditor, the limitation of audit-related work which falls within defined categories, and by stating that the auditor may not perform non-audit services that are prohibited by the SEC, Public Company Accounting Oversight Board (PCAOB),
102 bp Annual Report and Form 20-F 2023 International Auditing and Assurance Standards Board (IAASB) or the FRC. • Approves the terms of all audit services as well as permitted audit-related and non-audit services in advance. The external auditor is considered for permitted non-audit services only when its expertise and experience of bp are important. Approvals for individual engagements of pre-approved permitted services below certain thresholds are delegated to the SVP accounting, reporting and control or the CFO. Any proposed service not included in the permitted services categories must be approved in advance by either the committee chair or the committee prior to engagement. • The committee, CFO and SVP accounting, reporting and control monitor overall compliance with bp’s policy on audit-related and non-audit services, including whether the necessary pre-approvals have been obtained. The categories of permitted and pre-approved services are outlined in the principal accountant’s fees and services on page 360. • The total non-audit fees paid to Deloitte for 2023 was $3 million. The majority of these fees related to work of an assurance nature. See Note 36 for further information. • Fees paid to the auditor for the year are set out in Note 36. The committee is satisfied that this level of fee is appropriate in respect of the audit services provided and that an effective audit can be conducted for this fee. Non-audit or non-audit-related services consisted of other assurance services. Internal audit and internal controls Internal audit • Appraised the performance of the SVP internal audit and agreed their objectives. • Recommended the SVP internal audit’s remuneration to the remuneration committee. • Met privately with the SVP internal audit. The committee chair also met with the SVP internal audit on a regular basis. • Continued to monitor and review the effectiveness and capabilities of internal audit during the year and concluded that the function had unrestricted scope, together with access to information and sufficient resources to fulfil its mandate. • Reviewed the internal audit plan and alignment to risk factor coverage. Received updates on audits undertaken and adjustments made to the plan. Undertook a deep-dive on the internal audit planning process for 2024. • Received regular updates on findings during the year and challenged management’s response and progress made on the closure of findings. • Monitored progress against the internal audit plan and adjustments made during the year through updates from internal audit. Areas of focus included cyber security, digital product delivery and resilience, trading activities, aspects of the energy transition such as bp pulse and ethics and compliance controls. • Oversaw the appointment in October 2023 and onboarding of the new SVP internal audit. • Reviewed and approved the internal audit charter. • Reviewed the implementation of recommendations from the 2022 external effectiveness review of the internal audit function, including the enhancement of data analytics. Internal controls • Discussed with management and the external auditor financial reporting and internal controls processes, reviewed any control gaps identified and monitored mitigating actions. • Undertook a deep-dive on significant deficiencies and control environment, with a focus on IT user access and journal controls. The committee focused on mitigating measures, ongoing remediation work and challenged management on the timeline for the development of more enduring controls. • Received a report from internal audit on its annual review of internal control and risk management, together with an assessment from management on the system of internal control. • Reviewed the control and assurance framework for non-financial reporting (NFR), including ESG reporting and climate- related metrics, under the NFR framework, and challenged management as to whether bp had the most appropriate suite of NFR metrics for disclosures against bp’s strategy, aims and ambition. • Reviewed the effectiveness of, and challenged management on, bp’s system of internal control and risk management and concluded that these were effective. Risk • Routinely reviewed and monitored principal risks allocated to it through a combination of business reviews and focused engagements, as well as updates from management, internal audit and the external auditor. The principal risks allocated to the committee for monitoring in 2023 were: – Prices and markets. – Liquidity, financial capacity and financial, including credit, exposure. – Insurance. – Regulation. – Trading and treasury trading activities. – Reporting. • The committee also shared responsibility for oversight of the following principal risks with the safety and sustainability committee and board: – Joint arrangements and contractors (shared with the safety and sustainability committee). – Ethical misconduct and non-compliance (shared with the board and safety and sustainability committee). • Examples of committee principal risk activities, in addition to risks associated with reporting which are referenced above, included: – Reviewed cash flow forecasts, business affordability of distributions and the financial frame. – Reviewed and challenged the longer-term outlook for energy prices in line with bp’s price assumptions for investment, including their consistency with the goals of the Paris Agreement compared with a broad range of external Paris-consistent scenarios. – Reviewed off-balance-sheet commitments and reviewed the longer- term viability statement at year end, together with the going concern basis of accounting at the full- and half-year ends. – Undertook a jointly held review of non-operated joint ventures (NOJVs) risk with the safety and sustainability committee. – Undertook a review of insurance risk. – Received updates on the systems in place to assess fraud risk, the controls in place to manage and mitigate the identified risk and progress on the roll-out of additional controls. – Received an update on compliance with regulation together with additional briefings during the year on technical accounting updates and developing ESG reporting disclosures. – Undertook two business reviews of the trading & shipping business and a deep-dive session on LNG. • For more information on how we manage risk, see risk factors on page 77, liquidity and capital resources on page 340, and Note 29 Financial instruments and financial risk factors. Audit committee continued

103bp Annual Report and Form 20-F 2023 Corporate governance See glossary on page 373 Dear fellow shareholders, I am pleased to present the safety and sustainability committee report for the year ended 31 December 2023. The committee continued to monitor the bp leadership team’s drive to improve safety and environmental performance, with a particular focus in 2023 on the reduction of tier 1 and 2 process safety events . This included deep-dives on specific areas of the business where safety risk is considered to have the potential to be significant or material. As part of this work, two site visits were completed during 2023: one to the Permian Basin and Thunder Horse platform in the Gulf of Mexico in February, and the second to the Tangguh liquefied natural gas (LNG) site in West Papua, Indonesia in November. Site visits provide a valuable opportunity for committee members to experience the safety and sustainability culture within bp’s operations first-hand. Read more on both visits on page 104. Tragically, three people lost their lives during 2023. A contractor was fatally injured at a bp wellsite in the Permian Basin in May 2023 after the forklift he was driving came into contact with an overhead powerline. Two additional fatalities occurred in our TravelCenters of America business, which we acquired in May 2023. One was in September 2023 as a result of employee violence, and the other in November 2023 when an employee was hit by a truck. Our sincere condolences go out to the families and friends of those who have been lost. We continue to focus on learnings from safety events and to cascade these learnings through the business. Role of the committee The committee oversees the management of safety and sustainability matters, including relevant systems and processes, focusing on those which it considers to be most potentially material from time to time. Key responsibilities The committee’s full terms of reference can be viewed at bp.com/governance. Melody Meyer Committee chair 8 March 2024 Safety and sustainability committee Meetings and attendance The committee met six times in 2023. Regular attendees included SVP internal audit, EVP production & operations, EVP strategy, sustainability and ventures, SVP HSE and carbon, SVP safety and operational risk assurance, SVP sustainability and VP internal audit – safety and sustainability. Non-executive directors Six scheduled meetings Melody Meyer: member (May 2017), chair of the committee (November 2019) 6/6 Satish Pai: member (March 2023) 5/5 Sir John Sawers: member 6/6 Johannes Teyssen: member 6/6 Site visits provide a valuable opportunity for committee members to experience the safety and sustainability culture within bp’s operations first-hand. Chair’s introduction Activities during the year Safety performance and assurance • Received updates at every meeting from the EVP production & operations on key safety performance metrics from across all parts of the business, including process, personal and operational safety and non-operated as well as operated joint ventures . • Received reports at every meeting on major operational, security (including crisis management and business continuity) and cyber security incidents. Sustainability • Received routine updates from the SVP, sustainability, including on: – Progress on implementation of bp’s sustainability aims. – Sustainability reporting. – The sustainability frame, including deep-dives on advancing our net zero, people and planet aims. – The process and findings of the external auditor’s limited assurance exercise over selected sustainability metrics. – Internal climate policy. Internal audit • Received regular updates on internal audit activity, and an annual report on systems of internal control and updates on the internal audit programme. Risk • Routinely reviewed and monitored principal risks allocated to it through a combination of business reviews and focused engagements, as well as updates from management. • The principal risks allocated to the committee for monitoring in 2023 were: – Crisis management and business continuity. – Process safety, personal safety, and environmental risks. – Drilling and production. – Security. – Product quality.

104 bp Annual Report and Form 20-F 2023 • The committee also shared responsibility for oversight of the following principal risks with the audit committee and board: – Joint arrangements and contractors (shared with the audit committee). – Digital infrastructure, cyber security and data protection (shared with the board). – Ethical misconduct and non-compliance (shared with the board and audit committee). Principal risk deep-dives • Reviewed and monitored the principal risks allocated to it through several deep-dive updates tabled throughout the year, for example covering risks related to wells, product quality, ethical misconduct and non-compliance, and non-operated joint ventures (NOJVs). • Received deep-dive updates in relation to specific risk areas within the business. For example, a deep-dive was held on the bpx energy business, covering current risks, well control risk management, the Operating Management System (OMS) and progress against process and personal safety performance and improvement plans. • Received further deep-dive updates regarding other significant or material events, including detail on actions being taken, for example in relation to: – Fatalities following a fire at a bp oil refinery in Toledo, US during 2022 (which was subsequently sold in 2023). – Progress made by the site operator in the reduction of flaring activity at an NOJV in Rumaila, Iraq. – The contractor fatality in the Permian Basin. – The employee fatalities at TravelCenters of America sites in 2023. – Regulatory compliance issues. • Reviewed reports on significant risk events, probing management on investigations, remediating actions and the proactive cascading of learnings throughout the business. • Received ethics and compliance reports on a quarterly basis. Other matters • Reviewed annual cash bonus (ACB) target adjustments. • Reviewed and recommended to the remuneration committee, changes to the ACB framework relating to emissions reductions targets (see page 50) and a structured framework for consideration of fatalities and how they should influence remuneration outcomes. Tangguh visit November 2023 The committee visited our major LNG site on the Indonesian island of Papua to meet the team and understand first-hand the safety and sustainability aspects of their operations. The committee toured all three LNG trains and heard how safety learnings from Trains 1 and 2 had been implemented in Train 3. The visit also provided a valuable opportunity to engage with a broad variety of local stakeholders of the site. The committee: • Met with Papuan colleagues who recently graduated from bp’s technician training programme (70% of Tangguh LNG’s workforce are from the local Papuan community). • Met with the Tangguh Women’s International Network (women make up 50% of the overall technician workforce that have graduated from bp’s technician training programme). • Visited the local village of Tanah Merah Baru to speak with community leaders, tour the school and get a first-hand view of Tangguh’s community and sustainability initiatives. • Visited Tangguh’s mangrove plantation, where over 2,000 mangrove trees have been planted on site using recycled fertile soil from dredging activity, in addition to over one million trees planted in the local community. Permian Basin and Gulf of Mexico visit February 2023 Melody Meyer, chair of the committee, and Pamela Daley, member of the bp board, visited the Permian Basin and Thunder Horse platform in the Gulf of Mexico. The trip to the Permian provided an opportunity to see how bp is seeking to reduce operational greenhouse gas emissions through its electrification strategy in the basin. The directors also heard about initiatives to eliminate routine flaring and to reduce tier 1 process safety events . This provided both directors with an insight into the deep commitment to safety on-site. The directors also visited the Thunder Horse production drilling quarters semi-submersible oil platform in the Gulf of Mexico, where directors engaged with the site team on the approach to safe and reliable operations within this joint venture with ExxonMobil. Safety and sustainability committee continued Key Information that supports TCFD Recommendations and Recommended Disclosures in relation to Governance (see pages 55 to 58)
105bp Annual Report and Form 20-F 2023 Corporate governance See glossary on page 373 Directors’ remuneration report During the year, bp’s performance was robust – both operationally and financially… and there has been continued progress in bp’s transformation to an integrated energy company. Role of the committee The role of the committee is to determine and recommend to the board the remuneration policy and to set chair, executive director and leadership team remuneration. In determining the policy, the committee takes into account various factors, including wider workforce remuneration, structures and alignment of reward to performance, thus promoting the long-term success of the company. The committee also reviews workforce remuneration and monitors related policies, satisfying itself that incentives and rewards are aligned with bp’s goals and culture. Key responsibilities A summary of the committee’s terms of reference is on page 359 and the full terms can be reviewed at bp.com/governance. Key areas of focus in 2023 • Change in leadership – set the terms of appointment for the interim CEO for the period from 12 September 2023 to 17 January 2024 and interim CFO for the period from 19 September 2023 to 2 February 2024. Determined the departure terms for the former CEO. • Workforce engagement – engaged with the wider workforce on reward and wellbeing – for example, met with new hires to discuss their initial views on bp’s reward structures. • Remuneration outcomes – monitored in-flight progress of equity and bonus awards, and evaluated salary and benefits against peer group comparators, considering adjustments where appropriate. • Reporting – reviewed the directors’ remuneration report and the UK gender and ethnicity pay gap report. • Sustainability measures – discussed and agreed to the sustainability measures in annual and long-term performance scorecards. For example, after consulting with the safety and sustainability committee and taking into account feedback from shareholders, the remuneration committee set an alternative measure related to operational emissions for the 2024 annual bonus and 2024-26 long-term incentive plan award. Meetings and attendance The chair and the chief executive officer (CEO) attend meetings of the committee except for matters relating to their own remuneration. The CEO is consulted on remuneration of the chief financial officer (CFO), the leadership team and receives input from the committee on remuneration across the wider workforce. Both the CEO and CFO are consulted on matters relating to group’s performance and the metrics adopted for each performance cycle. bp’s EVP people & culture, SVP reward, external advisors and other executives may attend where necessary. The committee consults other board committees on the group’s performance and on issues relating to the exercise of judgement or discretion as necessary. The committee met eight times during the year. All directors attended each meeting they were eligible to attend, except one previous apology for a planned meeting. Non-executive directors Six scheduled meetings Two ad-hoc meetings Paula Rosput Reynolds: member (September 2017), chair of the committee (May 2018) 6/6 2/2 Dame Amanda Blanca: member (January 2023) 5/6 2/2 Pamela Daley: member 6/6 2/2 Melody Meyer: member 6/6 2/2 Tushar Morzaria: member 6/6 2/2 a Dame Amanda Blanc was unable to attend one planned meeting during 2023 due to a prior commitment. She received accompanying material and had the opportunity to provide comments to the committee. Contents Remuneration at a glance 109 Engaging with our workforce 111 Executive directors’ pay for 2023 113 2023 annual bonus outcome 114 2021-23 performance share plan outcome 116 Policy implementation for 2024 119 Stewardship and executive directors’ interests 125 Payments to past directors and for loss of office 127 Chair and non-executive directors’ outcomes and interests 128
106 bp Annual Report and Form 20-F 2023 Directors’ remuneration report continued Dear fellow shareholders, On behalf of the board, I am pleased to present our 2023 directors’ remuneration report. This report provides details of the remuneration decisions we have reached regarding current and former executive directors. These decisions comply with the remuneration policy that was overwhelmingly approved at the 2023 Annual General Meeting (AGM) by 94% of the voting shares. The report also covers various matters pertaining to the wider workforce. Performance and reward for 2023 Business performance During the year, bp’s performance was robust – both operationally and financially. Among other metrics, the company achieved an underlying replacement cost profit of $13.8 billion and sustained high levels of reliability and availability of our operations. Operating cash flow was $32.0 billion and net debt was reduced to $20.9 billion. There has been continued progress in bp’s transformation to an integrated energy company, with momentum across our resilient hydrocarbons, convenience and mobility and low carbon businesses. 2023 annual bonus The 2023 annual bonus was based on a scorecard of performance measures across three categories: safety and sustainability (30%), operations (20%) and financials (50%). Safety and sustainability Safety comes first for all employees at bp; avoiding incidents or injuries that irreversibly change lives is of paramount importance. Tier 1 and tier 2 process safety events performance improved, with the number of events in each category lower than in 2022 and below our targets for 2023. This outcome reflects a relentless focus on process and personal safety. Nevertheless, the positive process safety performance was sadly overshadowed by three workforce fatalities – one within bpx energy and two at our recently acquired TravelCenters of America facilities. Details of these fatalities, including the actions taken by management in response, are set out on page 69 in the sustainability section of the strategic report. The committee decided to apply downward discretion to the formulaic outcome for the entire bonus score reflecting the fatality in our bpx energy business; we reduced the bonus by 5 points for all participants in the 2023 annual cash bonus plan (ACB) to reinforce all employees’ individual and collective responsibility for delivering safe operations. The TravelCenters of America incidents were not reflected in the adjustment, which is in line with our new framework for assessing newly acquired assets (see page 122). Further detail on the impact of safety on pay outcomes is provided on page 115. Sustainability is measured in the annual bonus scorecard by the degree to which the company reduces Scope 1 and 2 emissions. We track sustainable emissions reductions (SER) and performance in 2023 was slightly ahead of target, delivering 0.908mte of reductions in 2023 and 7.973mte cumulatively since 2017. Operations bp delivered strong performance against this category, driven by both high hydrocarbon plant reliability and refining availability , and achieved an outcome of 95.7% for this combined measure. In addition to reliability and availability of our hydrocarbons operations, we adopted another operational measure for 2023 intended to give focus to our newer businesses. Namely, we measured convenience & EV gross margin growth (%) which accounts for 10% of the award. The organization demonstrated robust year-on-year growth under this metric (10.6% vs. our target of 10%). Financials Our financial performance has two measures: annual adjusted EBITDA and adjusted free cash flow . Adjusted EBITDA delivery was strong at $43.7 billion, resulting in a near maximum outcome for this measure. This outcome reflected both higher production and strong trading results. Adjusted free cash flow was $15.1 billion, which exceeded the maximum target we set for 2023. As a reminder, in line with policy, the targets for both financial measures are adjusted for the actual price environment to reflect underlying performance. Chair’s introduction Overall result The formulaic outcome of the annual bonus considering safety, operational and financial performance was 1.64 out of 2.00. As described above, the committee decided to exercise its discretion on the mechanical outcome on account of the fatality within bpx energy and reduced the outcome by 5 points to 1.59 out of 2.00 for all participants of the plan (which translates to 79.5% of the maximum opportunity). 2021-23 performance shares bp started its transition to an integrated energy company in 2020. As a result, this is the second cycle of equity (2021-23) in which we have evaluated performance over a three-year period since the strategy was set in place. The 2021-23 performance shares were measured against relative TSR (20% weighting), return on average capital employed (ROACE) (20% weighting) , adjusted EBIDA per share CAGR (20% weighting) and strategic progress (40% weighting). The relative weighting of these measures for this award reflected the need, we perceived at the time, to create a significant incentive for strategic progress in the period immediately following the strategy change announced in 2020, ensuring a continued focus on ambitious financial goals and the delivery of shareholder value. bp’s relative TSR performance recovered in the 2021-23 period compared to the prior 2020-22 period. bp achieved median returns relative to peers – placing bp fourth out of eight in the comparator group. This performance resulted in 25% vesting. Underlying financial performance was resilient over the performance period and both performance measures achieved full vesting; the 2021-23 average ROACE performance was 20.6%, which materially exceeded the ambitious target we set in 2021. Similarly, adjusted EBIDA per share CAGR outperformed target and achieved an outcome of 15.8%. Unlike the three measures described above, strategic progress was not a quantitative assessment. By design, this measure is assessed in the round – and in two successive policy votes, shareholders have affirmed their willingness to have this committee make these judgements on progress.
107bp Annual Report and Form 20-F 2023 Corporate governance See glossary on page 373 When assessing outcomes under the strategic progress measure for the 2021-23 performance shares, the committee considered how management have delivered on bp’s transition plans, including its financial resilience, and how they relate to our communicated 2025 targets. Overall, bp’s hydrocarbons business has performed well with all underlying measures on track towards our 2025 targets. In low carbon energy we have seen growth in our pipeline against the backdrop of tough economic conditions, and our convenience and mobility businesses have shown resilient performance in tough trading conditions. When considering strategic progress in the round, the committee determined that an outcome of 75% of maximum was appropriate. Looking forward, the committee has decided to evaluate strategic progress based on value generation potential rather than volume goals. The committee will be looking for evidence that the transition growth engines are generating sustainable, and growing, earnings. Simultaneously, we will continue to assess progress in the resilience of our hydrocarbon portfolio. Furthermore, for the next performance share cycle – 2024-26 – the committee has decided to lower the weighting of strategic progress in the scorecard to 20% of the total. We will also raise the relative TSR weighting to 25%. These changes are permitted under the current remuneration policy. The committee has come to these conclusions with the benefit of shareholder feedback we have received. Namely, shareholders have supported our strategy, but they have noted that vesting of performance shares must reflect the broader shareholder experience over the cycle. They are particularly keen to see the financial resilience of the transition growth engines. We hope you will agree that using value-driven criteria for the outstanding awards and de-rating of strategic progress for future awards is an appropriate response to shareholder feedback received. Overall, the sum of the several components that go into performance share vesting for the 2021-23 cycle was 75% of maximum. The committee believes that this outcome is reflective of performance during the period and therefore has not applied any further discretion. Looking ahead to 2024 For 2024, we have reviewed the operation of the bonus and performance shares against our strategy and are proposing only modest changes, all consistent with our shareholder- approved remuneration policy. Alignment with strategy Sustainability performance In 2023, we consulted with shareholders about changing the measurement of our progress in reducing greenhouse gas emissions to provide a direct link to bp’s aim 1, to achieve net zero operations by 2050 or sooner. In our annual bonus scorecard, instead of SER we will use a measure of operated carbon emissions. Unlike SER, operated carbon emissions is a measure recognized by stakeholders and thus allows comparability of our results with those of others in our industry. This measure covers the Scope 1 and 2 emissions reported under aim 1 (net zero operations) and will have the same weighting as SER previously did (15% of award). It is our intent to measure and reward progressive improvements in operated carbon emissions performance both over the short and long term. We are therefore introducing this operated carbon emissions metric to our 2024-26 executive directors’ incentive plan (EDIP) scorecard to better align with our strategic ambition of net zero by 2050 or sooner. This measure will be weighted at 15% and for reference, we will use 2019 as the baseline year (which is consistent with the baseline year for bp’s aim 1). Recognizing the transition growth engines bp has aims to accelerate the growth in earnings from transition growth engines. Rather than picking business unit specific operating metrics (e.g. convenience margin, EV sales growth), we will measure and report on earnings growth overall in our transition growth engines. This measure should provide better visibility to shareholders as to the financial quality of our transition growth investment and focus our teams on ensuring that these new businesses can generate meaningful earnings over time. We will weight this metric at 10% in the annual bonus. Focus on safety A number of shareholders provided feedback in 2023 that we were not giving a meaningful enough message through bonus adjustments when fatalities occurred. We have carefully considered the comments and agree that we should modify our approach. Namely, if any workforce fatality occurs during the year, the committee will make it normal practice to adjust the overall bonus outcome downwards. The downward adjustment will vary based on the specific circumstances and will apply broadly across the organization. Notwithstanding this change, safety is an underpin to all of our plans and so we retain absolute discretion to reflect lapses in safety in remuneration outcomes. Further details have been set out on page 122. Alignment with stakeholders Wider workforce When reflecting on pay decisions in relation to the executive directors, the committee is mindful of the pay arrangements of the wider workforce. For 2024, the wider workforce will receive an average salary increase of 4.5% in the UK. Adjustments in other jurisdictions vary by local conditions. All bp employees in the UK earn at least the UK Living Wage. We are aware that a number of bp’s UK pensioners have asked bp management to consent to a trustee request to provide an additional discretionary increase that is over and above the 5% increase they have received under the scheme rules, to their pensions. Discretionary pension increases under bp’s many pension schemes around the world are a matter for management. We do note that management made additional funding to the bp Helios Fund and the Retail Trust, which has enabled the trustees of those bodies to support pensioners who are most in need through a one-off grant.
108 bp Annual Report and Form 20-F 2023 Directors’ remuneration report continued Shareholder engagement In 2023, during the development of our directors’ remuneration policy, we engaged extensively with our shareholders and the main proxy agencies. We discussed the company’s strategy, their expectations in relation to executive pay, and in some cases, our approach to remuneration upon the departure of our former CEO. By letter and in individual conversations, we have engaged with our largest shareholders and proxy agencies on the proposed outcomes for 2023 and the implementation of our policy going forward. Executive director changes As announced on 12 September 2023, Bernard Looney resigned as CEO with immediate effect. The board triggered its emergency succession plan to ensure continuity in leadership, resulting in Murray Auchincloss’s appointment as interim CEO with immediate effect. As you will have read in our disclosures elsewhere, the board undertook a robust and competitive executive succession process, ultimately resulting in the decision to appoint Murray Auchincloss as the permanent CEO on 17 January 2024. On 2 February 2024, Kate Thomson, who had been acting as interim CFO, was appointed as permanent CFO and became an executive director of the board. CEO arrangements Upon appointment as interim CEO, the committee agreed that Murray Auchincloss should receive base pay equal to that of his predecessor for 2023, but that his bonus would be based on a pro-rated salary rather than his new higher salary and that no additional equity grants would be made in the interim. His annual salary was therefore set at £1.45 million, reflecting his increased responsibility, and the competitive landscape. Upon appointment as permanent CEO, Murray’s salary remained unchanged at £1.45 million and he will not receive a salary increase for 2024. All elements of his remuneration will be in line with the shareholder-approved remuneration policy The details have been set out in full on pages 119 to 120. CFO arrangements Having acted as interim CFO since September 2023, Kate Thomson was appointed to the board and as permanent CFO on 2 February 2024. Upon appointment, her base pay has been set at £800,000 and will not be reviewed until 1 April 2025. The committee believes it is appropriate that Kate’s salary be set at a lower level than that of her predecessor, reflecting her limited experience in a board role. However, the committee will keep the CFO salary under review each year, with regard to performance in the role and market conditions. As such, it is possible that any future adjustments may exceed the percentage for the wider workforce for a period, subject to performance. All elements of Kate’s new package are consistent with our remuneration policy. Former CEO departure terms In December 2023, the board determined that serious misconduct had occurred in relation to the former CEO. At that time, we disclosed the provisions of his separation. Full details of which are provided on page 127. All remuneration decisions have been made in accordance with our shareholder-approved policy. Concluding remarks At the close of this year’s AGM, I will depart the board of bp as my nine-year tenure concludes. As I depart, I want to express my appreciation to my colleagues on this committee, the advisors and executives who support us in our deliberations – and to you, our shareholders, for your constructive feedback and candour. I am gratified that we have always come to agreement on the way forward, after what has often been vigorous and challenging discussion. I trust that 2024 will be no exception. The committee has remained true to the policy you approved and where we have used discretion, it has been thoughtfully undertaken. As always, we welcome your comments on the materials covered herein. One final time, I respectfully ask for your vote in favour of the resolution to approve the 2023 directors’ remuneration report at the upcoming AGM. Paula Rosput Reynolds Committee chair 8 March 2024
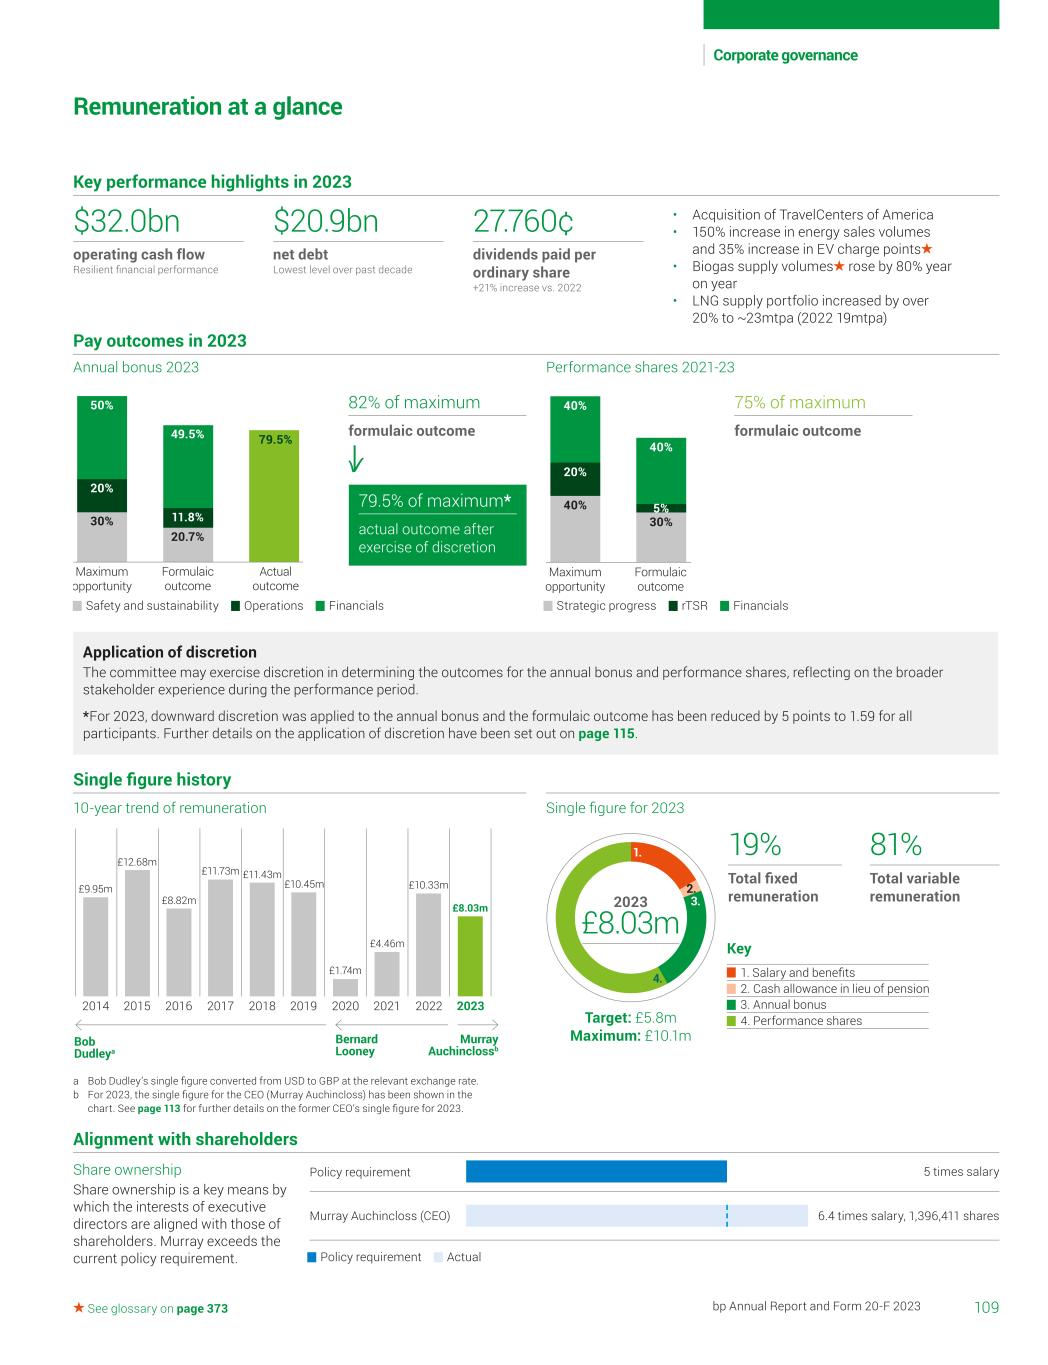
40% 20% 40% 40% 5% 30% Maximum opportunity Formulaic outcome 50% 20% 30% 49.5% 11.8% 20.7% Maximum opportunity Formulaic outcome 79.5% Actual outcome Bernard Looney Murray Auchinclossb 2014 2015 2016 2017 2018 2019 2020 2021 2022 2023 £9.95m £12.68m £8.82m £11.73m £11.43m £10.45m £1.74m £4.46m £10.33m £8.03m Bob Dudleya 1. 2. 3. 4. 3. Annual bonus 4. Performance shares 1. Salary and benefits 2. Cash allowance in lieu of pension Key 109bp Annual Report and Form 20-F 2023 Corporate governance See glossary on page 373 Remuneration at a glance Key performance highlights in 2023 Pay outcomes in 2023 $32.0bn operating cash flow Resilient financial performance $20.9bn net debt Lowest level over past decade 27.760¢ dividends paid per ordinary share +21% increase vs. 2022 • Acquisition of TravelCenters of America • 150% increase in energy sales volumes and 35% increase in EV charge points • Biogas supply volumes rose by 80% year on year • LNG supply portfolio increased by over 20% to ~23mtpa (2022 19mtpa) Annual bonus 2023 Performance shares 2021-23 75% of maximum formulaic outcome 82% of maximum formulaic outcome 79.5% of maximum* actual outcome after exercise of discretion  Safety and sustainability   Operations   Financials  Policy requirement   Actual  Strategic progress   rTSR   Financials Application of discretion The committee may exercise discretion in determining the outcomes for the annual bonus and performance shares, reflecting on the broader stakeholder experience during the performance period. *For 2023, downward discretion was applied to the annual bonus and the formulaic outcome has been reduced by 5 points to 1.59 for all participants. Further details on the application of discretion have been set out on page 115. Single figure history 10-year trend of remuneration Single figure for 2023 19% Total fixed remuneration 81% Total variable remuneration Target: £5.8m Maximum: £10.1m a Bob Dudley’s single figure converted from USD to GBP at the relevant exchange rate. b For 2023, the single figure for the CEO (Murray Auchincloss) has been shown in the chart. See page 113 for further details on the former CEO’s single figure for 2023. Alignment with shareholders Share ownership Share ownership is a key means by which the interests of executive directors are aligned with those of shareholders. Murray exceeds the current policy requirement. 5 times salaryPolicy requirement 6.4 times salary, 1,396,411 shares Murray Auchincloss (CEO) £8.03m 2023
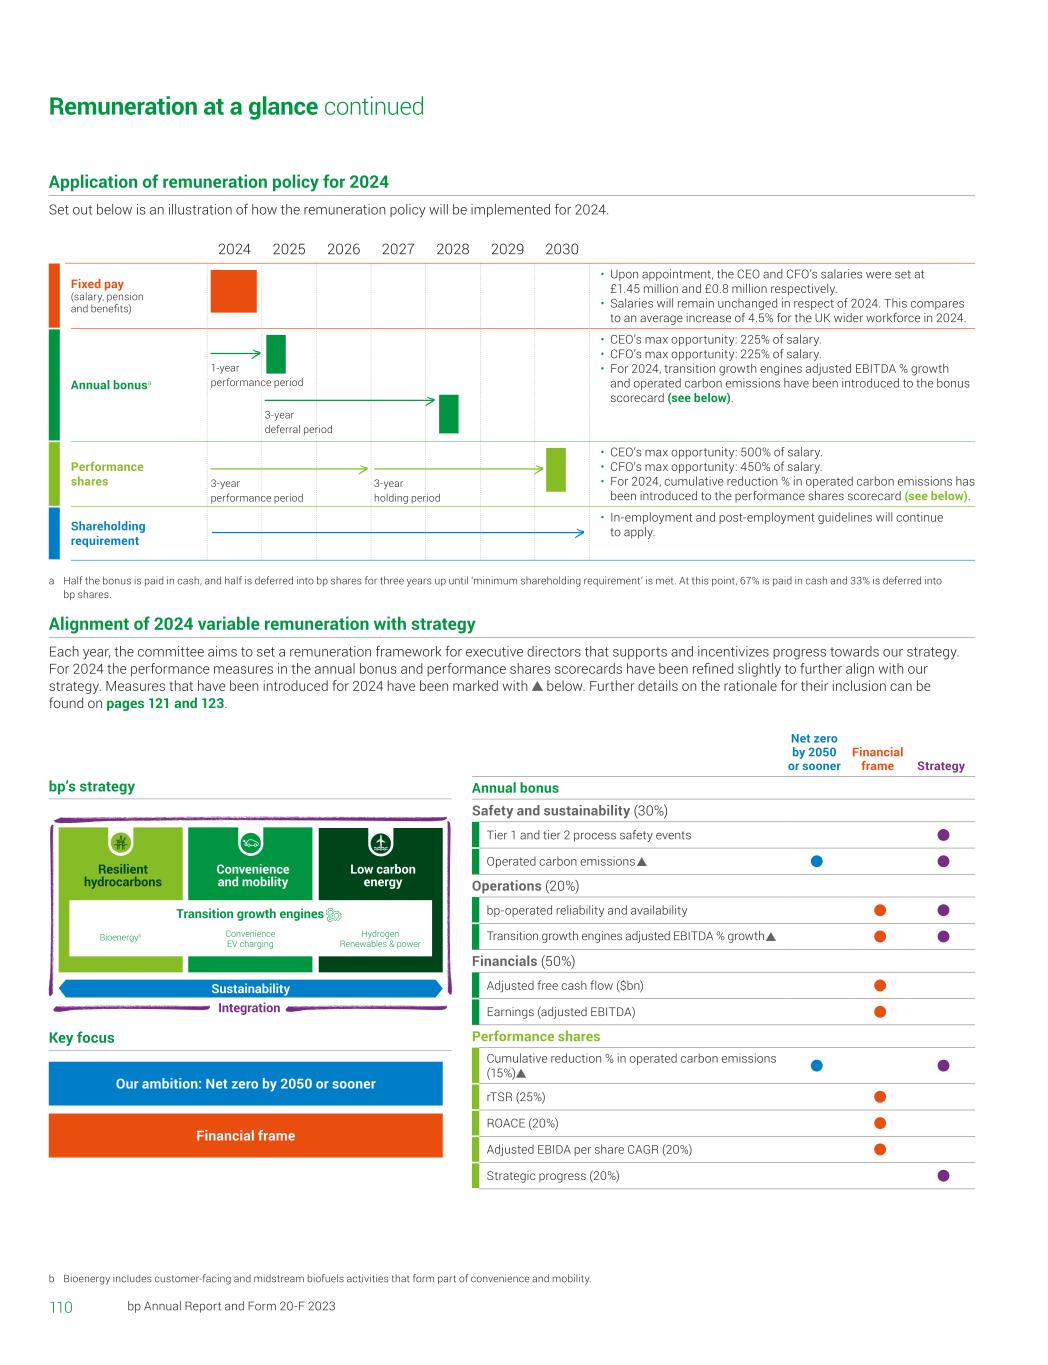
Sustainability Integration Transition growth engines Convenience and mobility Bioenergyb Hydrogen Renewables & power Convenience EV charging Low carbon energy Resilient hydrocarbons 110 bp Annual Report and Form 20-F 2023 Application of remuneration policy for 2024 Set out below is an illustration of how the remuneration policy will be implemented for 2024. bp’s strategy Key focus Alignment of 2024 variable remuneration with strategy Each year, the committee aims to set a remuneration framework for executive directors that supports and incentivizes progress towards our strategy. For 2024 the performance measures in the annual bonus and performance shares scorecards have been refined slightly to further align with our strategy. Measures that have been introduced for 2024 have been marked with below. Further details on the rationale for their inclusion can be found on pages 121 and 123. 2024 2025 2026 2027 2028 2029 2030 Fixed pay (salary, pension and benefits) • Upon appointment, the CEO and CFO’s salaries were set at £1.45 million and £0.8 million respectively. • Salaries will remain unchanged in respect of 2024. This compares to an average increase of 4.5% for the UK wider workforce in 2024. Annual bonusa • CEO’s max opportunity: 225% of salary. • CFO’s max opportunity: 225% of salary. • For 2024, transition growth engines adjusted EBITDA % growth and operated carbon emissions have been introduced to the bonus scorecard (see below). Performance shares • CEO’s max opportunity: 500% of salary. • CFO’s max opportunity: 450% of salary. • For 2024, cumulative reduction % in operated carbon emissions has been introduced to the performance shares scorecard (see below). Shareholding requirement • In-employment and post-employment guidelines will continue to apply. a Half the bonus is paid in cash, and half is deferred into bp shares for three years up until ‘minimum shareholding requirement’ is met. At this point, 67% is paid in cash and 33% is deferred into bp shares. 1-year performance period 3-year deferral period 3-year performance period 3-year holding period Our ambition: Net zero by 2050 or sooner Financial frame Net zero by 2050 or sooner Financial frame Strategy Annual bonus Safety and sustainability (30%) Tier 1 and tier 2 process safety events Operated carbon emissions  Operations (20%) bp-operated reliability and availability Transition growth engines adjusted EBITDA % growth  Financials (50%) Adjusted free cash flow ($bn) Earnings (adjusted EBITDA) Performance shares Cumulative reduction % in operated carbon emissions (15%) rTSR (25%) ROACE (20%) Adjusted EBIDA per share CAGR (20%) Strategic progress (20%) b Bioenergy includes customer-facing and midstream biofuels activities that form part of convenience and mobility. Remuneration at a glance continued
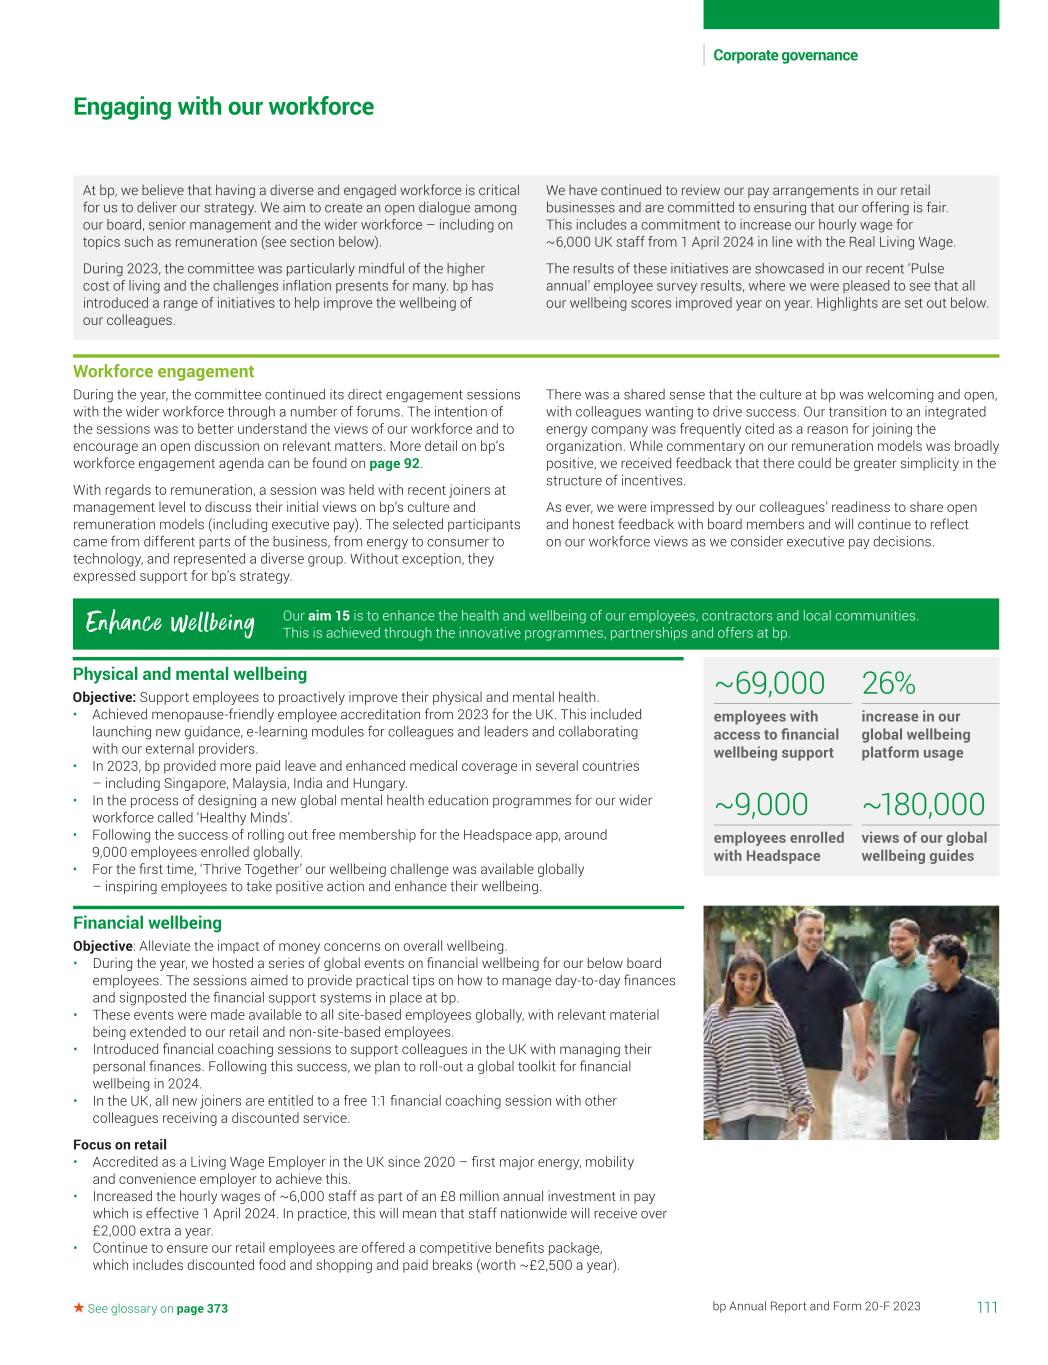
111bp Annual Report and Form 20-F 2023 Corporate governance See glossary on page 373 Financial wellbeing Objective: Alleviate the impact of money concerns on overall wellbeing. • During the year, we hosted a series of global events on financial wellbeing for our below board employees. The sessions aimed to provide practical tips on how to manage day-to-day finances and signposted the financial support systems in place at bp. • These events were made available to all site-based employees globally, with relevant material being extended to our retail and non-site-based employees. • Introduced financial coaching sessions to support colleagues in the UK with managing their personal finances. Following this success, we plan to roll-out a global toolkit for financial wellbeing in 2024. • In the UK, all new joiners are entitled to a free 1:1 financial coaching session with other colleagues receiving a discounted service. Focus on retail • Accredited as a Living Wage Employer in the UK since 2020 – first major energy, mobility and convenience employer to achieve this. • Increased the hourly wages of ~6,000 staff as part of an £8 million annual investment in pay which is effective 1 April 2024. In practice, this will mean that staff nationwide will receive over £2,000 extra a year. • Continue to ensure our retail employees are offered a competitive benefits package, which includes discounted food and shopping and paid breaks (worth ~£2,500 a year). Workforce engagement During the year, the committee continued its direct engagement sessions with the wider workforce through a number of forums. The intention of the sessions was to better understand the views of our workforce and to encourage an open discussion on relevant matters. More detail on bp’s workforce engagement agenda can be found on page 92. With regards to remuneration, a session was held with recent joiners at management level to discuss their initial views on bp’s culture and remuneration models (including executive pay). The selected participants came from different parts of the business, from energy to consumer to technology, and represented a diverse group. Without exception, they expressed support for bp’s strategy. There was a shared sense that the culture at bp was welcoming and open, with colleagues wanting to drive success. Our transition to an integrated energy company was frequently cited as a reason for joining the organization. While commentary on our remuneration models was broadly positive, we received feedback that there could be greater simplicity in the structure of incentives. As ever, we were impressed by our colleagues’ readiness to share open and honest feedback with board members and will continue to reflect on our workforce views as we consider executive pay decisions. Physical and mental wellbeing Objective: Support employees to proactively improve their physical and mental health. • Achieved menopause-friendly employee accreditation from 2023 for the UK. This included launching new guidance, e-learning modules for colleagues and leaders and collaborating with our external providers. • In 2023, bp provided more paid leave and enhanced medical coverage in several countries – including Singapore, Malaysia, India and Hungary. • In the process of designing a new global mental health education programmes for our wider workforce called ‘Healthy Minds’. • Following the success of rolling out free membership for the Headspace app, around 9,000 employees enrolled globally. • For the first time, ‘Thrive Together’ our wellbeing challenge was available globally – inspiring employees to take positive action and enhance their wellbeing. Engaging with our workforce At bp, we believe that having a diverse and engaged workforce is critical for us to deliver our strategy. We aim to create an open dialogue among our board, senior management and the wider workforce – including on topics such as remuneration (see section below). During 2023, the committee was particularly mindful of the higher cost of living and the challenges inflation presents for many. bp has introduced a range of initiatives to help improve the wellbeing of our colleagues. We have continued to review our pay arrangements in our retail businesses and are committed to ensuring that our offering is fair. This includes a commitment to increase our hourly wage for ~6,000 UK staff from 1 April 2024 in line with the Real Living Wage. The results of these initiatives are showcased in our recent ‘Pulse annual’ employee survey results, where we were pleased to see that all our wellbeing scores improved year on year. Highlights are set out below. Our aim 15 is to enhance the health and wellbeing of our employees, contractors and local communities. This is achieved through the innovative programmes, partnerships and offers at bp.Enhance wellbeing ~69,000 employees with access to financial wellbeing support 26% increase in our global wellbeing platform usage ~9,000 employees enrolled with Headspace ~180,000 views of our global wellbeing guides
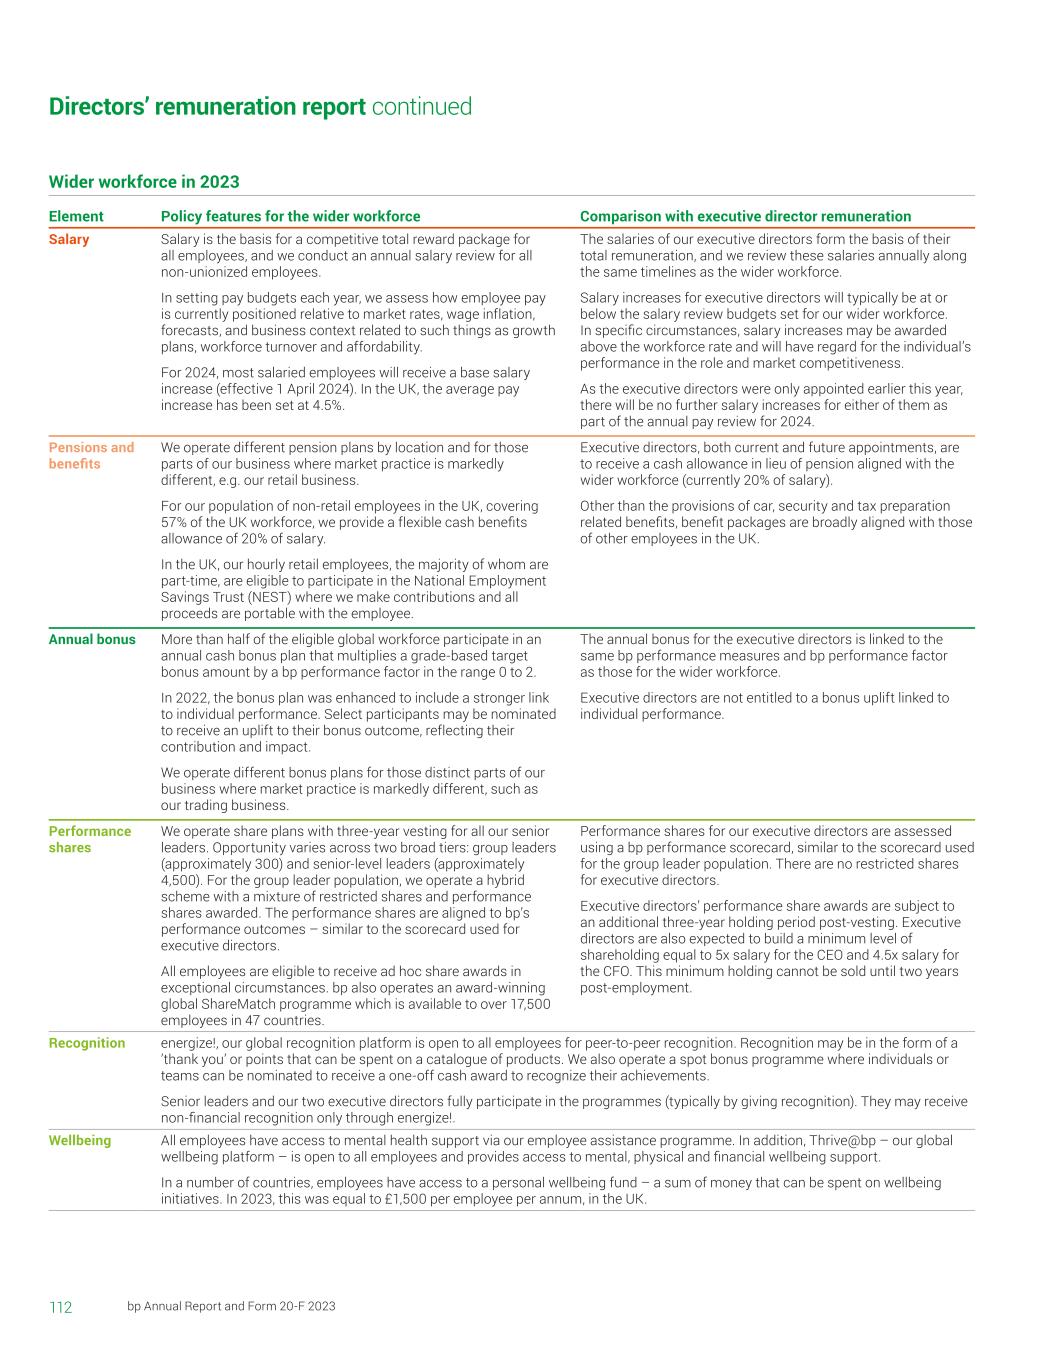
112 bp Annual Report and Form 20-F 2023 Wider workforce in 2023 Element Policy features for the wider workforce Comparison with executive director remuneration Salary Salary is the basis for a competitive total reward package for all employees, and we conduct an annual salary review for all non-unionized employees. In setting pay budgets each year, we assess how employee pay is currently positioned relative to market rates, wage inflation, forecasts, and business context related to such things as growth plans, workforce turnover and affordability. For 2024, most salaried employees will receive a base salary increase (effective 1 April 2024). In the UK, the average pay increase has been set at 4.5%. The salaries of our executive directors form the basis of their total remuneration, and we review these salaries annually along the same timelines as the wider workforce. Salary increases for executive directors will typically be at or below the salary review budgets set for our wider workforce. In specific circumstances, salary increases may be awarded above the workforce rate and will have regard for the individual’s performance in the role and market competitiveness. As the executive directors were only appointed earlier this year, there will be no further salary increases for either of them as part of the annual pay review for 2024. Pensions and benefits We operate different pension plans by location and for those parts of our business where market practice is markedly different, e.g. our retail business. For our population of non-retail employees in the UK, covering 57% of the UK workforce, we provide a flexible cash benefits allowance of 20% of salary. In the UK, our hourly retail employees, the majority of whom are part-time, are eligible to participate in the National Employment Savings Trust (NEST) where we make contributions and all proceeds are portable with the employee. Executive directors, both current and future appointments, are to receive a cash allowance in lieu of pension aligned with the wider workforce (currently 20% of salary). Other than the provisions of car, security and tax preparation related benefits, benefit packages are broadly aligned with those of other employees in the UK. Annual bonus More than half of the eligible global workforce participate in an annual cash bonus plan that multiplies a grade-based target bonus amount by a bp performance factor in the range 0 to 2. In 2022, the bonus plan was enhanced to include a stronger link to individual performance. Select participants may be nominated to receive an uplift to their bonus outcome, reflecting their contribution and impact. We operate different bonus plans for those distinct parts of our business where market practice is markedly different, such as our trading business. The annual bonus for the executive directors is linked to the same bp performance measures and bp performance factor as those for the wider workforce. Executive directors are not entitled to a bonus uplift linked to individual performance. Performance shares We operate share plans with three-year vesting for all our senior leaders. Opportunity varies across two broad tiers: group leaders (approximately 300) and senior-level leaders (approximately 4,500). For the group leader population, we operate a hybrid scheme with a mixture of restricted shares and performance shares awarded. The performance shares are aligned to bp’s performance outcomes – similar to the scorecard used for executive directors. All employees are eligible to receive ad hoc share awards in exceptional circumstances. bp also operates an award-winning global ShareMatch programme which is available to over 17,500 employees in 47 countries. Performance shares for our executive directors are assessed using a bp performance scorecard, similar to the scorecard used for the group leader population. There are no restricted shares for executive directors. Executive directors’ performance share awards are subject to an additional three-year holding period post-vesting. Executive directors are also expected to build a minimum level of shareholding equal to 5x salary for the CEO and 4.5x salary for the CFO. This minimum holding cannot be sold until two years post-employment. Recognition energize!, our global recognition platform is open to all employees for peer-to-peer recognition. Recognition may be in the form of a ’thank you’ or points that can be spent on a catalogue of products. We also operate a spot bonus programme where individuals or teams can be nominated to receive a one-off cash award to recognize their achievements. Senior leaders and our two executive directors fully participate in the programmes (typically by giving recognition). They may receive non-financial recognition only through energize!. Wellbeing All employees have access to mental health support via our employee assistance programme. In addition, Thrive@bp – our global wellbeing platform – is open to all employees and provides access to mental, physical and financial wellbeing support. In a number of countries, employees have access to a personal wellbeing fund – a sum of money that can be spent on wellbeing initiatives. In 2023, this was equal to £1,500 per employee per annum, in the UK. Directors’ remuneration report continued
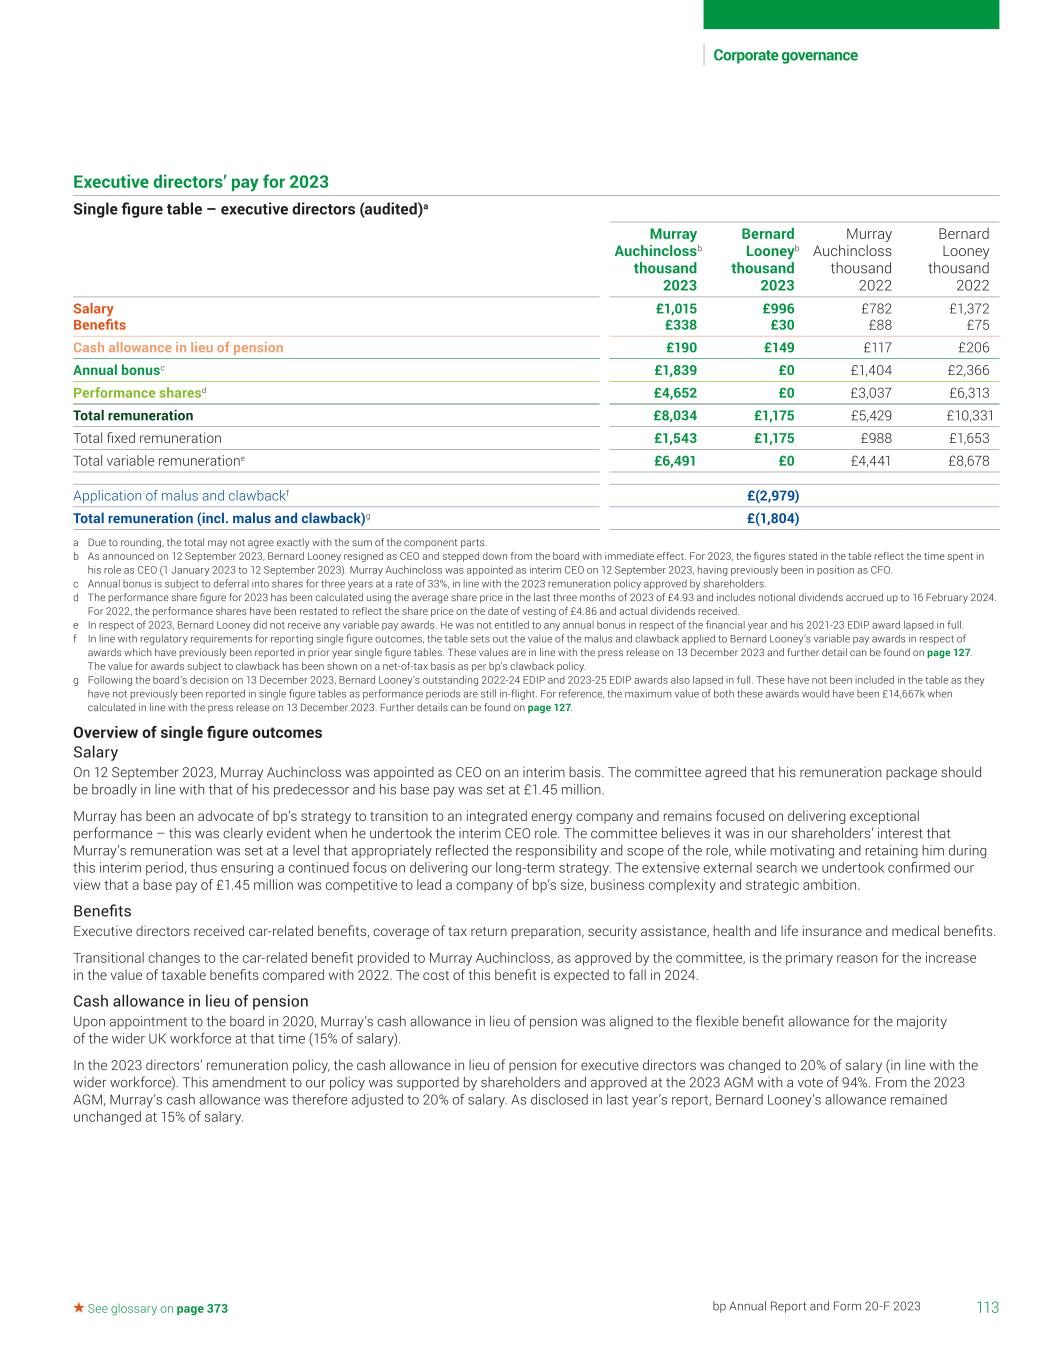
113bp Annual Report and Form 20-F 2023 Corporate governance See glossary on page 373 Executive directors’ pay for 2023 Single figure table – executive directors (audited)a Murray Auchinclossb thousand 2023 Bernard Looneyb thousand 2023 Murray Auchincloss thousand 2022 Bernard Looney thousand 2022 Salary £1,015 £996 £782 £1,372 Benefits £338 £30 £88 £75 Cash allowance in lieu of pension £190 £149 £117 £206 Annual bonusc £1,839 £0 £1,404 £2,366 Performance sharesd £4,652 £0 £3,037 £6,313 Total remuneration £8,034 £1,175 £5,429 £10,331 Total fixed remuneration £1,543 £1,175 £988 £1,653 Total variable remuneratione £6,491 £0 £4,441 £8,678 Application of malus and clawbackf £(2,979) Total remuneration (incl. malus and clawback)g £(1,804) a Due to rounding, the total may not agree exactly with the sum of the component parts. b As announced on 12 September 2023, Bernard Looney resigned as CEO and stepped down from the board with immediate effect. For 2023, the figures stated in the table reflect the time spent in his role as CEO (1 January 2023 to 12 September 2023). Murray Auchincloss was appointed as interim CEO on 12 September 2023, having previously been in position as CFO. c Annual bonus is subject to deferral into shares for three years at a rate of 33%, in line with the 2023 remuneration policy approved by shareholders. d The performance share figure for 2023 has been calculated using the average share price in the last three months of 2023 of £4.93 and includes notional dividends accrued up to 16 February 2024. For 2022, the performance shares have been restated to reflect the share price on the date of vesting of £4.86 and actual dividends received. e In respect of 2023, Bernard Looney did not receive any variable pay awards. He was not entitled to any annual bonus in respect of the financial year and his 2021-23 EDIP award lapsed in full. f In line with regulatory requirements for reporting single figure outcomes, the table sets out the value of the malus and clawback applied to Bernard Looney’s variable pay awards in respect of awards which have previously been reported in prior year single figure tables. These values are in line with the press release on 13 December 2023 and further detail can be found on page 127. The value for awards subject to clawback has been shown on a net-of-tax basis as per bp’s clawback policy. g Following the board’s decision on 13 December 2023, Bernard Looney’s outstanding 2022-24 EDIP and 2023-25 EDIP awards also lapsed in full. These have not been included in the table as they have not previously been reported in single figure tables as performance periods are still in-flight. For reference, the maximum value of both these awards would have been £14,667k when calculated in line with the press release on 13 December 2023. Further details can be found on page 127. Overview of single figure outcomes Salary On 12 September 2023, Murray Auchincloss was appointed as CEO on an interim basis. The committee agreed that his remuneration package should be broadly in line with that of his predecessor and his base pay was set at £1.45 million. Murray has been an advocate of bp’s strategy to transition to an integrated energy company and remains focused on delivering exceptional performance – this was clearly evident when he undertook the interim CEO role. The committee believes it was in our shareholders’ interest that Murray’s remuneration was set at a level that appropriately reflected the responsibility and scope of the role, while motivating and retaining him during this interim period, thus ensuring a continued focus on delivering our long-term strategy. The extensive external search we undertook confirmed our view that a base pay of £1.45 million was competitive to lead a company of bp’s size, business complexity and strategic ambition. Benefits Executive directors received car-related benefits, coverage of tax return preparation, security assistance, health and life insurance and medical benefits. Transitional changes to the car-related benefit provided to Murray Auchincloss, as approved by the committee, is the primary reason for the increase in the value of taxable benefits compared with 2022. The cost of this benefit is expected to fall in 2024. Cash allowance in lieu of pension Upon appointment to the board in 2020, Murray’s cash allowance in lieu of pension was aligned to the flexible benefit allowance for the majority of the wider UK workforce at that time (15% of salary). In the 2023 directors’ remuneration policy, the cash allowance in lieu of pension for executive directors was changed to 20% of salary (in line with the wider workforce). This amendment to our policy was supported by shareholders and approved at the 2023 AGM with a vote of 94%. From the 2023 AGM, Murray’s cash allowance was therefore adjusted to 20% of salary. As disclosed in last year’s report, Bernard Looney’s allowance remained unchanged at 15% of salary.
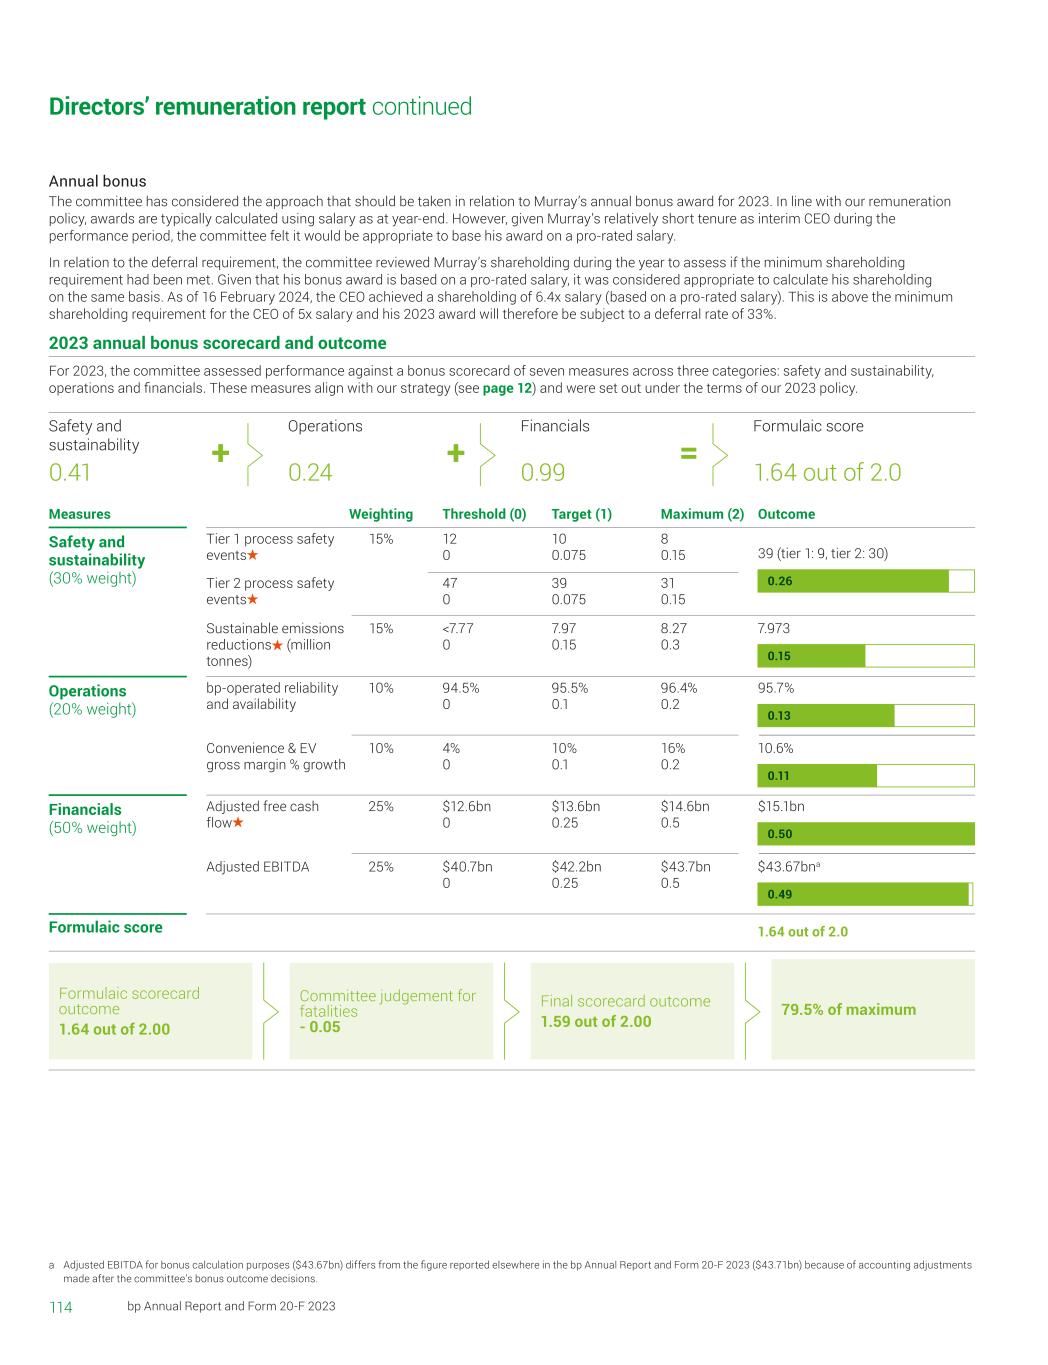
114 bp Annual Report and Form 20-F 2023 Directors’ remuneration report continued Committee judgement for fatalities - 0.05 79.5% of maximum Formulaic scorecard outcome 1.64 out of 2.00 Final scorecard outcome 1.59 out of 2.00 Formulaic score 1.64 out of 2.0 Safety and sustainability 0.41 Operations 0.24 Financials 0.99 Formulaic score 1.64 out of 2.0 Safety and sustainability (30% weight) Operations (20% weight) Financials (50% weight) Measures OutcomeWeighting Threshold (0) Target (1) Maximum (2) + =+ Sustainable emissions reductions (million tonnes) Convenience & EV gross margin % growth Adjusted EBITDA Tier 1 process safety events Tier 2 process safety events bp-operated reliability and availability Adjusted free cash flow 12 0 47 0 94.5% 0 $12.6bn 0 <7.77 0 4% 0 $40.7bn 0 15% 10% 25% 15% 10% 25% 10 0.075 39 0.075 95.5% 0.1 $13.6bn 0.25 8 0.15 31 0.15 96.4% 0.2 $14.6bn 0.5 7.97 0.15 10% 0.1 $42.2bn 0.25 8.27 0.3 16% 0.2 $43.7bn 0.5 39 (tier 1: 9, tier 2: 30) 95.7% $15.1bn 7.973 10.6% $43.67bna 0.13 0.26 0.15 0.11 0.50 0.49 Annual bonus The committee has considered the approach that should be taken in relation to Murray’s annual bonus award for 2023. In line with our remuneration policy, awards are typically calculated using salary as at year-end. However, given Murray’s relatively short tenure as interim CEO during the performance period, the committee felt it would be appropriate to base his award on a pro-rated salary. In relation to the deferral requirement, the committee reviewed Murray’s shareholding during the year to assess if the minimum shareholding requirement had been met. Given that his bonus award is based on a pro-rated salary, it was considered appropriate to calculate his shareholding on the same basis. As of 16 February 2024, the CEO achieved a shareholding of 6.4x salary (based on a pro-rated salary). This is above the minimum shareholding requirement for the CEO of 5x salary and his 2023 award will therefore be subject to a deferral rate of 33%. 2023 annual bonus scorecard and outcome For 2023, the committee assessed performance against a bonus scorecard of seven measures across three categories: safety and sustainability, operations and financials. These measures align with our strategy (see page 12) and were set out under the terms of our 2023 policy. a Adjusted EBITDA for bonus calculation purposes ($43.67bn) differs from the figure reported elsewhere in the bp Annual Report and Form 20-F 2023 ($43.71bn) because of accounting adjustments made after the committee’s bonus outcome decisions.
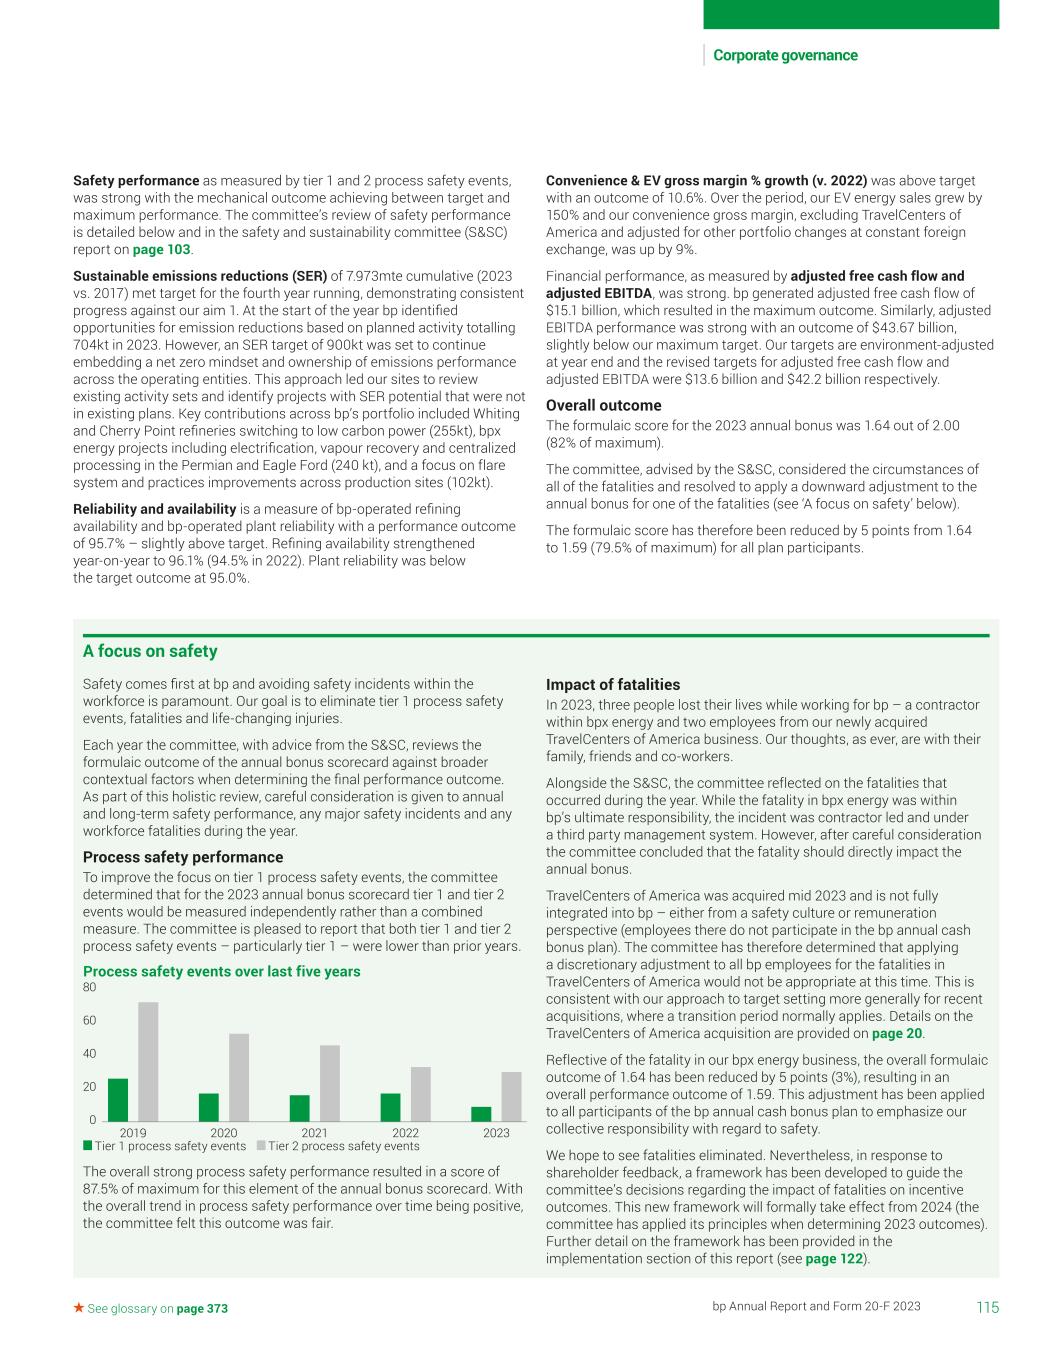
0 20 40 60 80 2019 2020 2021 2022 2023 Tier 1 process safety events Tier 2 process safety events Process safety events over last five years 115bp Annual Report and Form 20-F 2023 Corporate governance See glossary on page 373 Safety performance as measured by tier 1 and 2 process safety events, was strong with the mechanical outcome achieving between target and maximum performance. The committee’s review of safety performance is detailed below and in the safety and sustainability committee (S&SC) report on page 103. Sustainable emissions reductions (SER) of 7.973mte cumulative (2023 vs. 2017) met target for the fourth year running, demonstrating consistent progress against our aim 1. At the start of the year bp identified opportunities for emission reductions based on planned activity totalling 704kt in 2023. However, an SER target of 900kt was set to continue embedding a net zero mindset and ownership of emissions performance across the operating entities. This approach led our sites to review existing activity sets and identify projects with SER potential that were not in existing plans. Key contributions across bp’s portfolio included Whiting and Cherry Point refineries switching to low carbon power (255kt), bpx energy projects including electrification, vapour recovery and centralized processing in the Permian and Eagle Ford (240 kt), and a focus on flare system and practices improvements across production sites (102kt). Reliability and availability is a measure of bp-operated refining availability and bp-operated plant reliability with a performance outcome of 95.7% – slightly above target. Refining availability strengthened year-on-year to 96.1% (94.5% in 2022). Plant reliability was below the target outcome at 95.0%. Convenience & EV gross margin % growth (v. 2022) was above target with an outcome of 10.6%. Over the period, our EV energy sales grew by 150% and our convenience gross margin, excluding TravelCenters of America and adjusted for other portfolio changes at constant foreign exchange, was up by 9%. Financial performance, as measured by adjusted free cash flow and adjusted EBITDA, was strong. bp generated adjusted free cash flow of $15.1 billion, which resulted in the maximum outcome. Similarly, adjusted EBITDA performance was strong with an outcome of $43.67 billion, slightly below our maximum target. Our targets are environment-adjusted at year end and the revised targets for adjusted free cash flow and adjusted EBITDA were $13.6 billion and $42.2 billion respectively. Overall outcome The formulaic score for the 2023 annual bonus was 1.64 out of 2.00 (82% of maximum). The committee, advised by the S&SC, considered the circumstances of all of the fatalities and resolved to apply a downward adjustment to the annual bonus for one of the fatalities (see ‘A focus on safety’ below). The formulaic score has therefore been reduced by 5 points from 1.64 to 1.59 (79.5% of maximum) for all plan participants. A focus on safety Safety comes first at bp and avoiding safety incidents within the workforce is paramount. Our goal is to eliminate tier 1 process safety events, fatalities and life-changing injuries. Each year the committee, with advice from the S&SC, reviews the formulaic outcome of the annual bonus scorecard against broader contextual factors when determining the final performance outcome. As part of this holistic review, careful consideration is given to annual and long-term safety performance, any major safety incidents and any workforce fatalities during the year. Process safety performance To improve the focus on tier 1 process safety events, the committee determined that for the 2023 annual bonus scorecard tier 1 and tier 2 events would be measured independently rather than a combined measure. The committee is pleased to report that both tier 1 and tier 2 process safety events – particularly tier 1 – were lower than prior years. The overall strong process safety performance resulted in a score of 87.5% of maximum for this element of the annual bonus scorecard. With the overall trend in process safety performance over time being positive, the committee felt this outcome was fair. Impact of fatalities In 2023, three people lost their lives while working for bp – a contractor within bpx energy and two employees from our newly acquired TravelCenters of America business. Our thoughts, as ever, are with their family, friends and co-workers. Alongside the S&SC, the committee reflected on the fatalities that occurred during the year. While the fatality in bpx energy was within bp’s ultimate responsibility, the incident was contractor led and under a third party management system. However, after careful consideration the committee concluded that the fatality should directly impact the annual bonus. TravelCenters of America was acquired mid 2023 and is not fully integrated into bp – either from a safety culture or remuneration perspective (employees there do not participate in the bp annual cash bonus plan). The committee has therefore determined that applying a discretionary adjustment to all bp employees for the fatalities in TravelCenters of America would not be appropriate at this time. This is consistent with our approach to target setting more generally for recent acquisitions, where a transition period normally applies. Details on the TravelCenters of America acquisition are provided on page 20. Reflective of the fatality in our bpx energy business, the overall formulaic outcome of 1.64 has been reduced by 5 points (3%), resulting in an overall performance outcome of 1.59. This adjustment has been applied to all participants of the bp annual cash bonus plan to emphasize our collective responsibility with regard to safety. We hope to see fatalities eliminated. Nevertheless, in response to shareholder feedback, a framework has been developed to guide the committee’s decisions regarding the impact of fatalities on incentive outcomes. This new framework will formally take effect from 2024 (the committee has applied its principles when determining 2023 outcomes). Further detail on the framework has been provided in the implementation section of this report (see page 122).
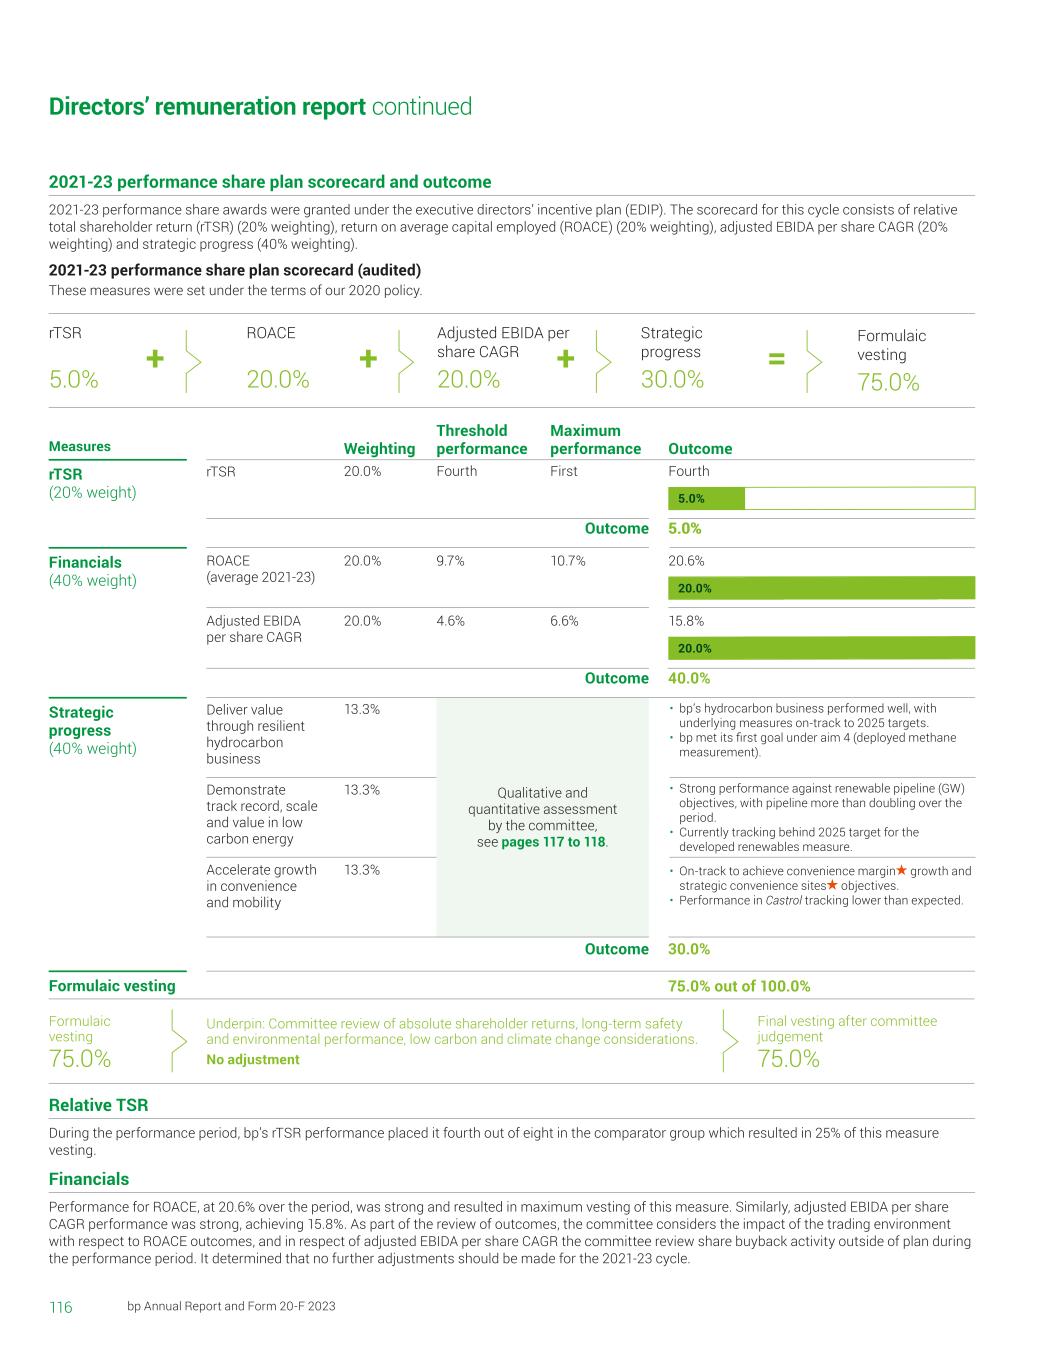
116 bp Annual Report and Form 20-F 2023 Directors’ remuneration report continued 2021-23 performance share plan scorecard and outcome 2021-23 performance share awards were granted under the executive directors’ incentive plan (EDIP). The scorecard for this cycle consists of relative total shareholder return (rTSR) (20% weighting), return on average capital employed (ROACE) (20% weighting), adjusted EBIDA per share CAGR (20% weighting) and strategic progress (40% weighting). 2021-23 performance share plan scorecard (audited) These measures were set under the terms of our 2020 policy. Formulaic vesting 75.0% Underpin: Committee review of absolute shareholder returns, long-term safety and environmental performance, low carbon and climate change considerations. No adjustment Final vesting after committee judgement 75.0% rTSR 5.0% ROACE 20.0% Adjusted EBIDA per share CAGR 20.0% Strategic progress 30.0% Formulaic vesting 75.0% + + =+ Relative TSR During the performance period, bp’s rTSR performance placed it fourth out of eight in the comparator group which resulted in 25% of this measure vesting. Financials Performance for ROACE, at 20.6% over the period, was strong and resulted in maximum vesting of this measure. Similarly, adjusted EBIDA per share CAGR performance was strong, achieving 15.8%. As part of the review of outcomes, the committee considers the impact of the trading environment with respect to ROACE outcomes, and in respect of adjusted EBIDA per share CAGR the committee review share buyback activity outside of plan during the performance period. It determined that no further adjustments should be made for the 2021-23 cycle. rTSR (20% weight) Financials (40% weight) Measures OutcomeWeighting Threshold performance Maximum performance Adjusted EBIDA per share CAGR Demonstrate track record, scale and value in low carbon energy Accelerate growth in convenience and mobility rTSR Fourth 4.6% 20.0% • bp’s hydrocarbon business performed well, with underlying measures on-track to 2025 targets. • bp met its first goal under aim 4 (deployed methane measurement). • Strong performance against renewable pipeline (GW) objectives, with pipeline more than doubling over the period. • Currently tracking behind 2025 target for the developed renewables measure. • On-track to achieve convenience margin growth and strategic convenience sites objectives. • Performance in Castrol tracking lower than expected. 20.0% 13.3% 13.3% First 6.6% Outcome Outcome Outcome 40.0% 5.0% 30.0% Formulaic vesting Strategic progress (40% weight) Deliver value through resilient hydrocarbon business 13.3% Qualitative and quantitative assessment by the committee, see pages 117 to 118. 75.0% out of 100.0% ROACE (average 2021-23) 9.7%20.0% 10.7% Fourth 15.8% 20.0% 20.6% 5.0% 20.0%
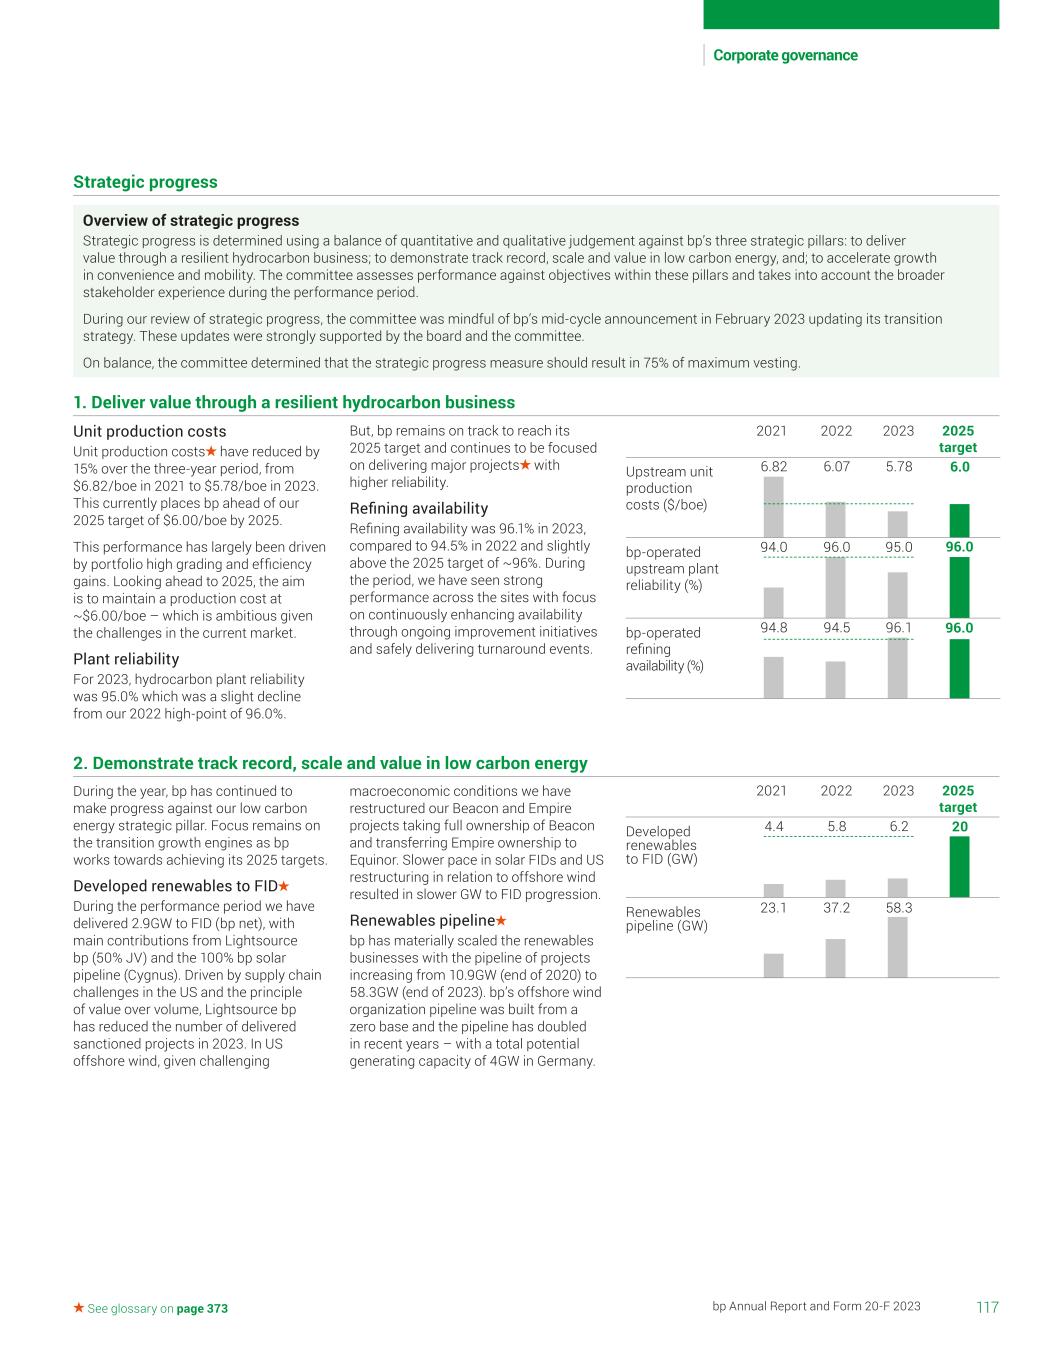
2025 target 2021 2022 2023 6.82 6.07 5.78 6.0Upstream unit production costs ($/boe) bp-operated upstream plant reliability (%) 94.0 96.0 95.0 96.0 bp-operated refining availability (%) 94.8 94.5 96.1 96.0 2025 target 2021 2022 2023 4.4 5.8 6.2 20Developed renewables to FID (GW) Renewables pipeline (GW) 23.1 37.2 58.3 117bp Annual Report and Form 20-F 2023 Corporate governance See glossary on page 373 1. Deliver value through a resilient hydrocarbon business Unit production costs Unit production costs have reduced by 15% over the three-year period, from $6.82/boe in 2021 to $5.78/boe in 2023. This currently places bp ahead of our 2025 target of $6.00/boe by 2025. This performance has largely been driven by portfolio high grading and efficiency gains. Looking ahead to 2025, the aim is to maintain a production cost at ~$6.00/boe – which is ambitious given the challenges in the current market. Plant reliability For 2023, hydrocarbon plant reliability was 95.0% which was a slight decline from our 2022 high-point of 96.0%. 2. Demonstrate track record, scale and value in low carbon energy During the year, bp has continued to make progress against our low carbon energy strategic pillar. Focus remains on the transition growth engines as bp works towards achieving its 2025 targets. Developed renewables to FID During the performance period we have delivered 2.9GW to FID (bp net), with main contributions from Lightsource bp (50% JV) and the 100% bp solar pipeline (Cygnus). Driven by supply chain challenges in the US and the principle of value over volume, Lightsource bp has reduced the number of delivered sanctioned projects in 2023. In US offshore wind, given challenging Overview of strategic progress Strategic progress is determined using a balance of quantitative and qualitative judgement against bp’s three strategic pillars: to deliver value through a resilient hydrocarbon business; to demonstrate track record, scale and value in low carbon energy, and; to accelerate growth in convenience and mobility. The committee assesses performance against objectives within these pillars and takes into account the broader stakeholder experience during the performance period. During our review of strategic progress, the committee was mindful of bp’s mid-cycle announcement in February 2023 updating its transition strategy. These updates were strongly supported by the board and the committee. On balance, the committee determined that the strategic progress measure should result in 75% of maximum vesting. Strategic progress But, bp remains on track to reach its 2025 target and continues to be focused on delivering major projects with higher reliability. Refining availability Refining availability was 96.1% in 2023, compared to 94.5% in 2022 and slightly above the 2025 target of ~96%. During the period, we have seen strong performance across the sites with focus on continuously enhancing availability through ongoing improvement initiatives and safely delivering turnaround events. macroeconomic conditions we have restructured our Beacon and Empire projects taking full ownership of Beacon and transferring Empire ownership to Equinor. Slower pace in solar FIDs and US restructuring in relation to offshore wind resulted in slower GW to FID progression. Renewables pipeline bp has materially scaled the renewables businesses with the pipeline of projects increasing from 10.9GW (end of 2020) to 58.3GW (end of 2023). bp’s offshore wind organization pipeline was built from a zero base and the pipeline has doubled in recent years – with a total potential generating capacity of 4GW in Germany.
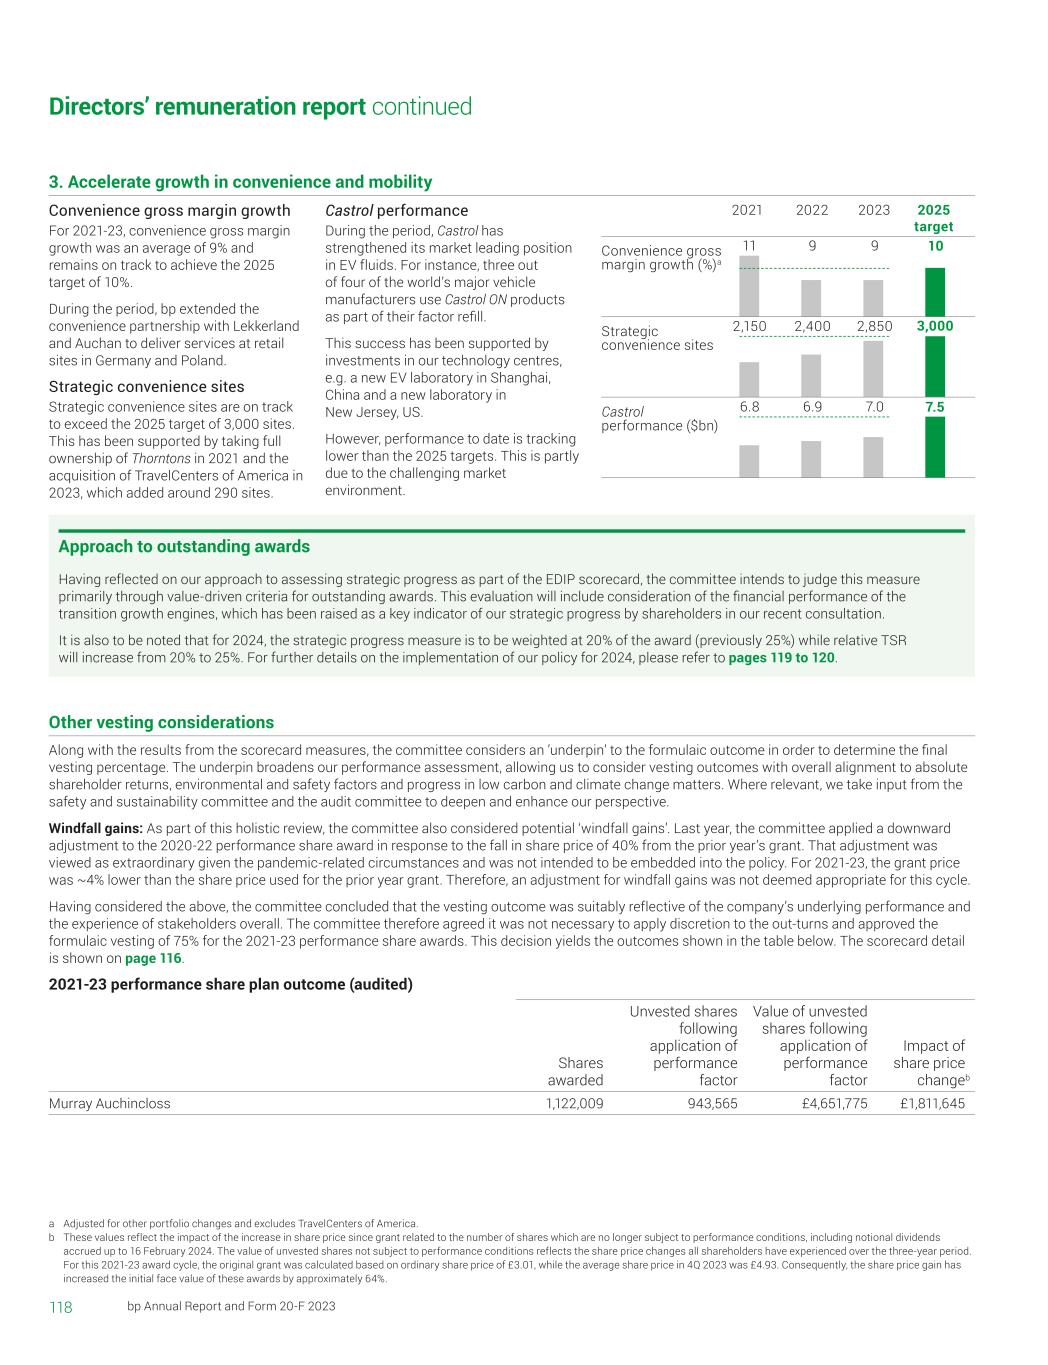
2025 target 2021 2022 2023 11 9 9 10Convenience gross margin growth (%)a Strategic convenience sites 2,150 2,400 2,850 3,000 Castrol performance ($bn) 6.8 6.9 7.0 7.5 118 bp Annual Report and Form 20-F 2023 Directors’ remuneration report continued Other vesting considerations Along with the results from the scorecard measures, the committee considers an ’underpin’ to the formulaic outcome in order to determine the final vesting percentage. The underpin broadens our performance assessment, allowing us to consider vesting outcomes with overall alignment to absolute shareholder returns, environmental and safety factors and progress in low carbon and climate change matters. Where relevant, we take input from the safety and sustainability committee and the audit committee to deepen and enhance our perspective. Windfall gains: As part of this holistic review, the committee also considered potential ‘windfall gains’. Last year, the committee applied a downward adjustment to the 2020-22 performance share award in response to the fall in share price of 40% from the prior year’s grant. That adjustment was viewed as extraordinary given the pandemic-related circumstances and was not intended to be embedded into the policy. For 2021-23, the grant price was ~4% lower than the share price used for the prior year grant. Therefore, an adjustment for windfall gains was not deemed appropriate for this cycle. Having considered the above, the committee concluded that the vesting outcome was suitably reflective of the company’s underlying performance and the experience of stakeholders overall. The committee therefore agreed it was not necessary to apply discretion to the out-turns and approved the formulaic vesting of 75% for the 2021-23 performance share awards. This decision yields the outcomes shown in the table below. The scorecard detail is shown on page 116. 2021-23 performance share plan outcome (audited) Shares awarded Unvested shares following application of performance factor Value of unvested shares following application of performance factor Impact of share price changeb Murray Auchincloss 1,122,009 943,565 £4,651,775 £1,811,645 3. Accelerate growth in convenience and mobility Convenience gross margin growth For 2021-23, convenience gross margin growth was an average of 9% and remains on track to achieve the 2025 target of 10%. During the period, bp extended the convenience partnership with Lekkerland and Auchan to deliver services at retail sites in Germany and Poland. Strategic convenience sites Strategic convenience sites are on track to exceed the 2025 target of 3,000 sites. This has been supported by taking full ownership of Thorntons in 2021 and the acquisition of TravelCenters of America in 2023, which added around 290 sites. Castrol performance During the period, Castrol has strengthened its market leading position in EV fluids. For instance, three out of four of the world’s major vehicle manufacturers use Castrol ON products as part of their factor refill. This success has been supported by investments in our technology centres, e.g. a new EV laboratory in Shanghai, China and a new laboratory in New Jersey, US. However, performance to date is tracking lower than the 2025 targets. This is partly due to the challenging market environment. Approach to outstanding awards Having reflected on our approach to assessing strategic progress as part of the EDIP scorecard, the committee intends to judge this measure primarily through value-driven criteria for outstanding awards. This evaluation will include consideration of the financial performance of the transition growth engines, which has been raised as a key indicator of our strategic progress by shareholders in our recent consultation. It is also to be noted that for 2024, the strategic progress measure is to be weighted at 20% of the award (previously 25%) while relative TSR will increase from 20% to 25%. For further details on the implementation of our policy for 2024, please refer to pages 119 to 120. a Adjusted for other portfolio changes and excludes TravelCenters of America. b These values reflect the impact of the increase in share price since grant related to the number of shares which are no longer subject to performance conditions, including notional dividends accrued up to 16 February 2024. The value of unvested shares not subject to performance conditions reflects the share price changes all shareholders have experienced over the three-year period. For this 2021-23 award cycle, the original grant was calculated based on ordinary share price of £3.01, while the average share price in 4Q 2023 was £4.93. Consequently, the share price gain has increased the initial face value of these awards by approximately 64%.
119bp Annual Report and Form 20-F 2023 Corporate governance See glossary on page 373 Policy implementation for 2024 The current remuneration policy was approved by shareholders at the 2023 annual general meeting on 27 April 2023. The full policy is displayed on the company’s website at bp.com/remuneration. The table below shows how the remuneration policy will be implemented in 2024, alongside a summary of key features. Element Policy feature 2024 implementation Salary To provide fixed remuneration to reflect the scale and complexity of both the business and the role, and to be competitive with the external market. When setting salaries, the committee considers practice in other oil and gas majors as well as European and US companies of a similar size, geographic spread and business dynamic to bp. Percentage increases for executive directors will not exceed that for the wider workforce, other than in specific circumstances identified by the committee (e.g. in response to a substantial change in responsibilities). Salaries are normally set in the home currency of the executive director and are reviewed annually. They may be reviewed at other times where appropriate. • Upon appointment to their respective roles, the CEO and CFO’s salaries were set as follows: – Murray Auchincloss (CEO): £1,450,000 – Kate Thomson (CFO): £800,000 • Given their recent appointments, executive directors will not receive an increase in respect of 2024 as part of our annual salary review. • The average increase to our UK salaried staff effective from 1 April 2024, our annual salary review date, will be 4.5%. Pensions and benefits Executive directors normally participate in the company retirement plans that operate in their home country. New appointees from within the bp group retain previously accrued benefits related to service prior to appointment as executive director. For their service as a director, cash allowance in lieu of pension will be up to 20% of base salary. For future appointments, the committee will carefully review any retirement benefits to be granted to a new director, taking account of retirement policies across the wider group and any arrangements currently in place. • Murray and Kate’s cash allowance in lieu of pension is 20% of base pay (in line with the wider workforce). • Prior to their appointment as executive directors, Murray received a US deferred pension and Kate received a UK deferred pension. No further value is accrued under either plan. • Benefits will remain unchanged for 2024 and include car- related provisions, security assistance, insurance and medical cover. Annual bonus Bonus is measured against an annual scorecard. The committee holds discretion to choose the specific measures and the relative weightings adopted in the annual scorecard, to reflect the annual plan as agreed with the board. Numeric scales are set for each measure, to score outcomes relative to targets. A scorecard outcome of 1.0 reflects the target outcome and 2.0 is the maximum outcome. Target bonus is 112.5% of salary, and maximum bonus is 225% of salary. Half the bonus is paid in cash, and half is deferred into bp shares for three years up until the ’minimum shareholding requirement’ is met. At this point, 67% is paid in cash and 33% is paid in bp shares. Dividends (or equivalents, including the value of any reinvestment) may accrue in respect of any deferred shares. Awards are subject to operationally robust and effective malus and clawback provisions as described below. • For 2024, our scorecard categories will remain unchanged and will be assessed against the following: safety and sustainability (30%), operations (20%), and financials (50%). • We intend to make two changes to performance measures for 2024: – Introduce a more holistic measure focused on growth in our transition growth engines financial delivery (transition growth engines adjusted EBITDA % growth), in place of the convenience & EV margin growth measure. – Replace our sustainable emissions reductions measure with operated carbon emissions to directly align with our net zero ambition. • See page 121 for further details on measures for the 2024 annual bonus. • From 2024, we are introducing a framework to help guide decisions on adjustments to the bonus outcome in relation to fatalities. Further detail has been provided on page 122.
120 bp Annual Report and Form 20-F 2023 Directors’ remuneration report continued Element Policy feature 2024 implementation Performance shares Performance shares are granted with a three-year performance period, measured against a scorecard. The committee holds discretion to choose the specific measures and the relative weightings adopted in the scorecard, to ensure they are focused on the near-term priorities for delivering the bp strategy in the interests of shareholders. Annual grants are 500% of salary for the CEO, and 450% of salary for any other executive director. Awards will vest in proportion to the outcomes measured through the performance scorecard, subject to any adjustment by the committee. • For our 2024-26 cycle, the scorecard categories will remain unchanged from the 2023-25 cycle, although we have amended the weightings. Performance will be assessed against rTSR (25%), ROACE (20%), adjusted EBIDA per share CAGR (20%), ESG (15%) and strategic progress (20%). The award will continue to be subject to an underpin that takes into consideration in-year safety outcomes and long-term trends in safety outcomes over the performance period. • The weighting of strategic progress has been decreased from 25% to 20%, reflecting feedback from shareholders, and relative TSR will be increased from 20% to 25% of the overall award. • Under the ESG measure, we are proposing a cumulative reduction % in operated carbon emissions to better align with our strategic ambitions (e.g. aim 1 – net zero by 2050 or sooner). • The 2024-26 awards will be granted based on the average closing share price of each calendar day in the 90-day period ending on the date of bp’s 2024 annual general meeting. • Any shares that vest will be subject to a three-year post- vesting holding period. • Awards are subject to operationally robust and effective malus and clawback provisions as described below. Shareholding requirement CEO to build a shareholding of at least five times salary, and other executive directors four and a half times salary, within five years of appointment. Executive directors are required to maintain that level for at least two years post-employment. • Murray’s shareholding has reached 6.4 times pro-rated salary, above his minimum shareholding requirement. See page 125 for further details. • Kate’s shareholding has reached 2.1 times salary. Over the next five years, to 2029, Kate will work towards reaching her minimum shareholding requirement of 4.5 times of salary. Malus and clawback Operationally robust and effective malus and clawback provisions apply to our incentive awards. Malus provisions may be applied where there is: a material safety or environmental failure; an incorrect award outcome due to miscalculation or incorrect information; a restatement due to financial reporting failure or misstatement of audited results; material misconduct; or other exceptional circumstances that the committee considers similar in nature. Clawback provisions may apply where there is: an incorrect outcome due to miscalculation or incorrect information; a restatement due to financial reporting failure or misstatement of audited results; or material misconduct. Committee flexibility The committee has discretion to adjust performance measures and weightings, and to revise the peer group for the rTSR measure. This discretion allows appropriate re-alignment, throughout the policy term, for changes in the annual plan and for the anticipated evolution of the low carbon business environment. The committee also holds discretion in determining the outcomes for annual bonus and performance shares, allowing them to take broad views on alignment with shareholder experience, environmental, societal and other relevant considerations e.g. portfolio changes.
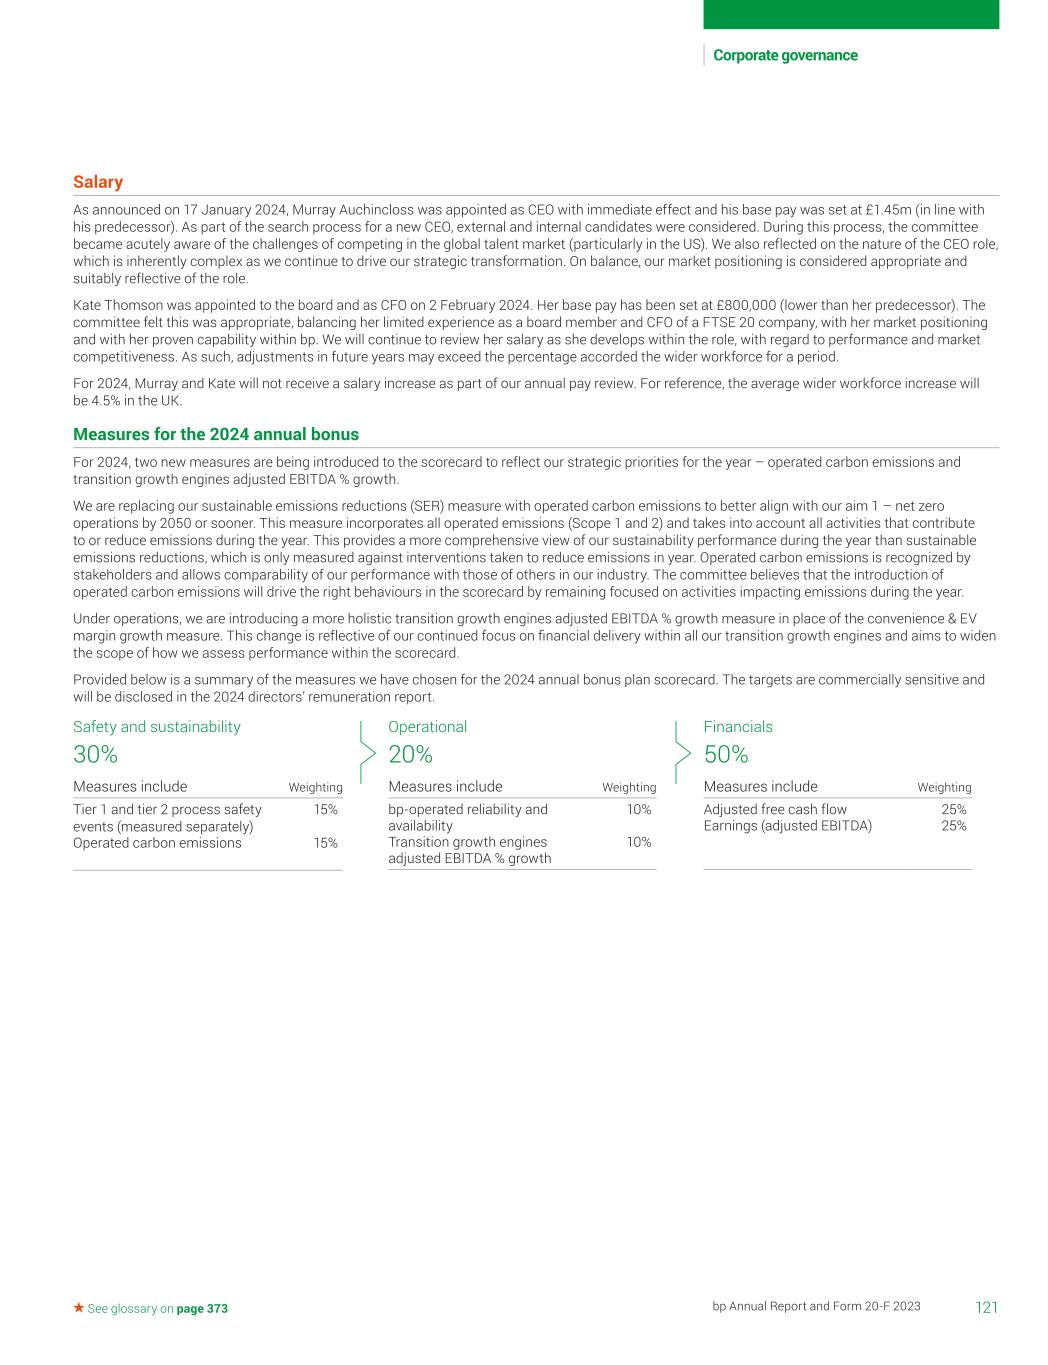
121bp Annual Report and Form 20-F 2023 Corporate governance See glossary on page 373 Salary As announced on 17 January 2024, Murray Auchincloss was appointed as CEO with immediate effect and his base pay was set at £1.45m (in line with his predecessor). As part of the search process for a new CEO, external and internal candidates were considered. During this process, the committee became acutely aware of the challenges of competing in the global talent market (particularly in the US). We also reflected on the nature of the CEO role, which is inherently complex as we continue to drive our strategic transformation. On balance, our market positioning is considered appropriate and suitably reflective of the role. Kate Thomson was appointed to the board and as CFO on 2 February 2024. Her base pay has been set at £800,000 (lower than her predecessor). The committee felt this was appropriate, balancing her limited experience as a board member and CFO of a FTSE 20 company, with her market positioning and with her proven capability within bp. We will continue to review her salary as she develops within the role, with regard to performance and market competitiveness. As such, adjustments in future years may exceed the percentage accorded the wider workforce for a period. For 2024, Murray and Kate will not receive a salary increase as part of our annual pay review. For reference, the average wider workforce increase will be 4.5% in the UK. Measures for the 2024 annual bonus For 2024, two new measures are being introduced to the scorecard to reflect our strategic priorities for the year – operated carbon emissions and transition growth engines adjusted EBITDA % growth. We are replacing our sustainable emissions reductions (SER) measure with operated carbon emissions to better align with our aim 1 – net zero operations by 2050 or sooner. This measure incorporates all operated emissions (Scope 1 and 2) and takes into account all activities that contribute to or reduce emissions during the year. This provides a more comprehensive view of our sustainability performance during the year than sustainable emissions reductions, which is only measured against interventions taken to reduce emissions in year. Operated carbon emissions is recognized by stakeholders and allows comparability of our performance with those of others in our industry. The committee believes that the introduction of operated carbon emissions will drive the right behaviours in the scorecard by remaining focused on activities impacting emissions during the year. Under operations, we are introducing a more holistic transition growth engines adjusted EBITDA % growth measure in place of the convenience & EV margin growth measure. This change is reflective of our continued focus on financial delivery within all our transition growth engines and aims to widen the scope of how we assess performance within the scorecard. Provided below is a summary of the measures we have chosen for the 2024 annual bonus plan scorecard. The targets are commercially sensitive and will be disclosed in the 2024 directors’ remuneration report. Safety and sustainability 30% Measures include Weighting Tier 1 and tier 2 process safety events (measured separately) 15% Operated carbon emissions 15% Operational 20% Measures include Weighting bp-operated reliability and availability 10% Transition growth engines adjusted EBITDA % growth 10% Financials 50% Measures include Weighting Adjusted free cash flow 25% Earnings (adjusted EBITDA) 25%
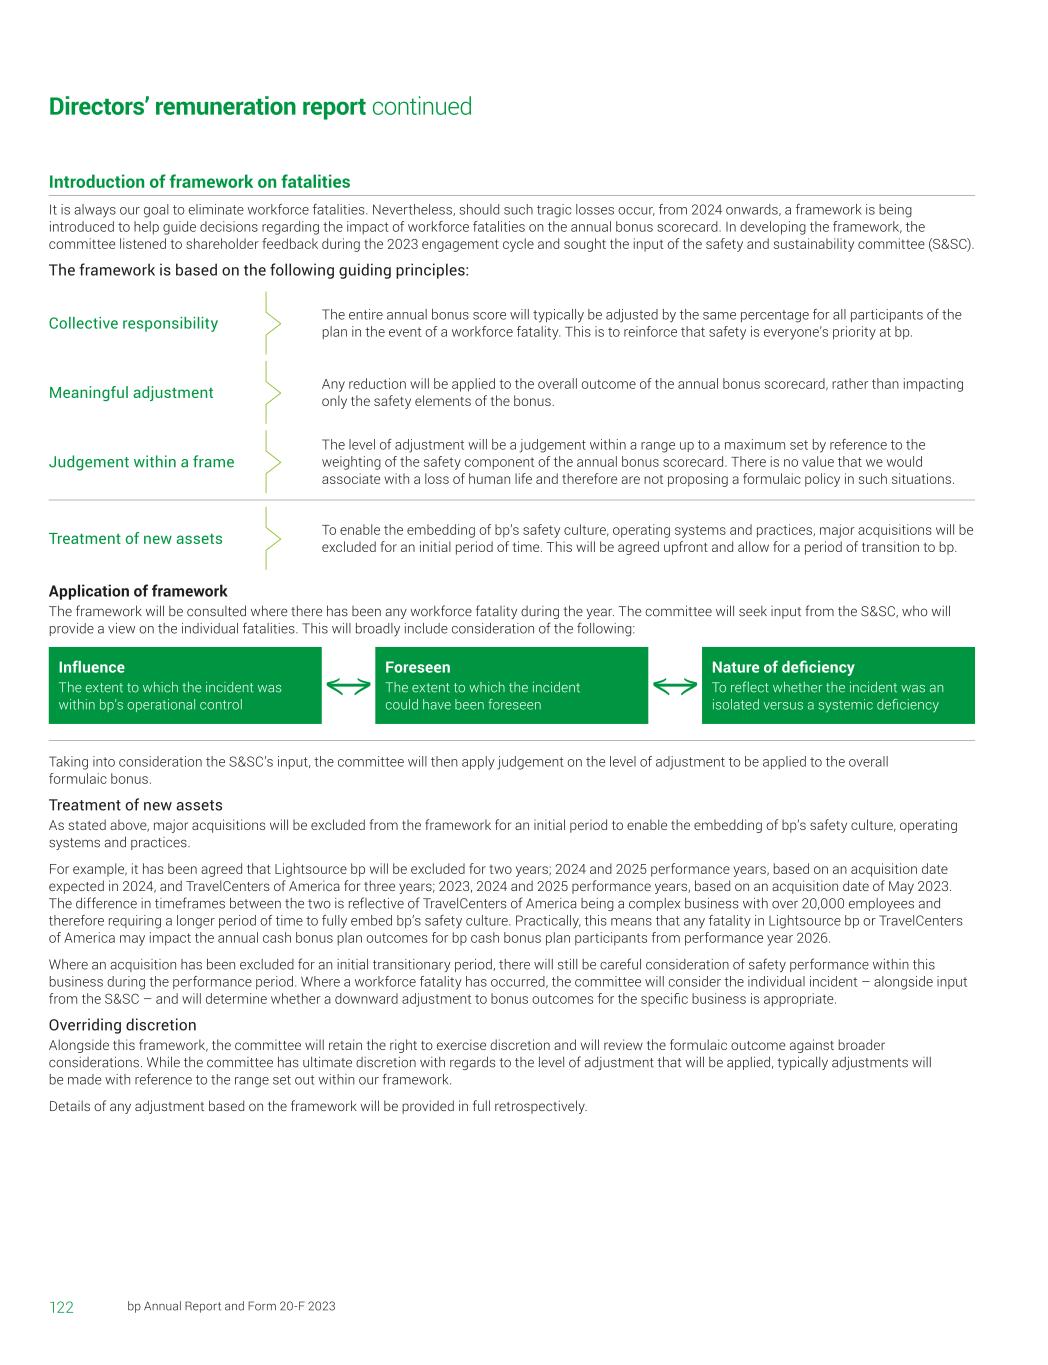
122 bp Annual Report and Form 20-F 2023 Directors’ remuneration report continued Taking into consideration the S&SC’s input, the committee will then apply judgement on the level of adjustment to be applied to the overall formulaic bonus. Treatment of new assets As stated above, major acquisitions will be excluded from the framework for an initial period to enable the embedding of bp’s safety culture, operating systems and practices. For example, it has been agreed that Lightsource bp will be excluded for two years; 2024 and 2025 performance years, based on an acquisition date expected in 2024, and TravelCenters of America for three years; 2023, 2024 and 2025 performance years, based on an acquisition date of May 2023. The difference in timeframes between the two is reflective of TravelCenters of America being a complex business with over 20,000 employees and therefore requiring a longer period of time to fully embed bp’s safety culture. Practically, this means that any fatality in Lightsource bp or TravelCenters of America may impact the annual cash bonus plan outcomes for bp cash bonus plan participants from performance year 2026. Where an acquisition has been excluded for an initial transitionary period, there will still be careful consideration of safety performance within this business during the performance period. Where a workforce fatality has occurred, the committee will consider the individual incident – alongside input from the S&SC – and will determine whether a downward adjustment to bonus outcomes for the specific business is appropriate. Overriding discretion Alongside this framework, the committee will retain the right to exercise discretion and will review the formulaic outcome against broader considerations. While the committee has ultimate discretion with regards to the level of adjustment that will be applied, typically adjustments will be made with reference to the range set out within our framework. Details of any adjustment based on the framework will be provided in full retrospectively. Influence The extent to which the incident was within bp’s operational control Foreseen The extent to which the incident could have been foreseen Nature of deficiency To reflect whether the incident was an isolated versus a systemic deficiency Introduction of framework on fatalities It is always our goal to eliminate workforce fatalities. Nevertheless, should such tragic losses occur, from 2024 onwards, a framework is being introduced to help guide decisions regarding the impact of workforce fatalities on the annual bonus scorecard. In developing the framework, the committee listened to shareholder feedback during the 2023 engagement cycle and sought the input of the safety and sustainability committee (S&SC). The framework is based on the following guiding principles: Collective responsibility The entire annual bonus score will typically be adjusted by the same percentage for all participants of the plan in the event of a workforce fatality. This is to reinforce that safety is everyone’s priority at bp. Meaningful adjustment Any reduction will be applied to the overall outcome of the annual bonus scorecard, rather than impacting only the safety elements of the bonus. Judgement within a frame The level of adjustment will be a judgement within a range up to a maximum set by reference to the weighting of the safety component of the annual bonus scorecard. There is no value that we would associate with a loss of human life and therefore are not proposing a formulaic policy in such situations. Treatment of new assets To enable the embedding of bp’s safety culture, operating systems and practices, major acquisitions will be excluded for an initial period of time. This will be agreed upfront and allow for a period of transition to bp. Application of framework The framework will be consulted where there has been any workforce fatality during the year. The committee will seek input from the S&SC, who will provide a view on the individual fatalities. This will broadly include consideration of the following:
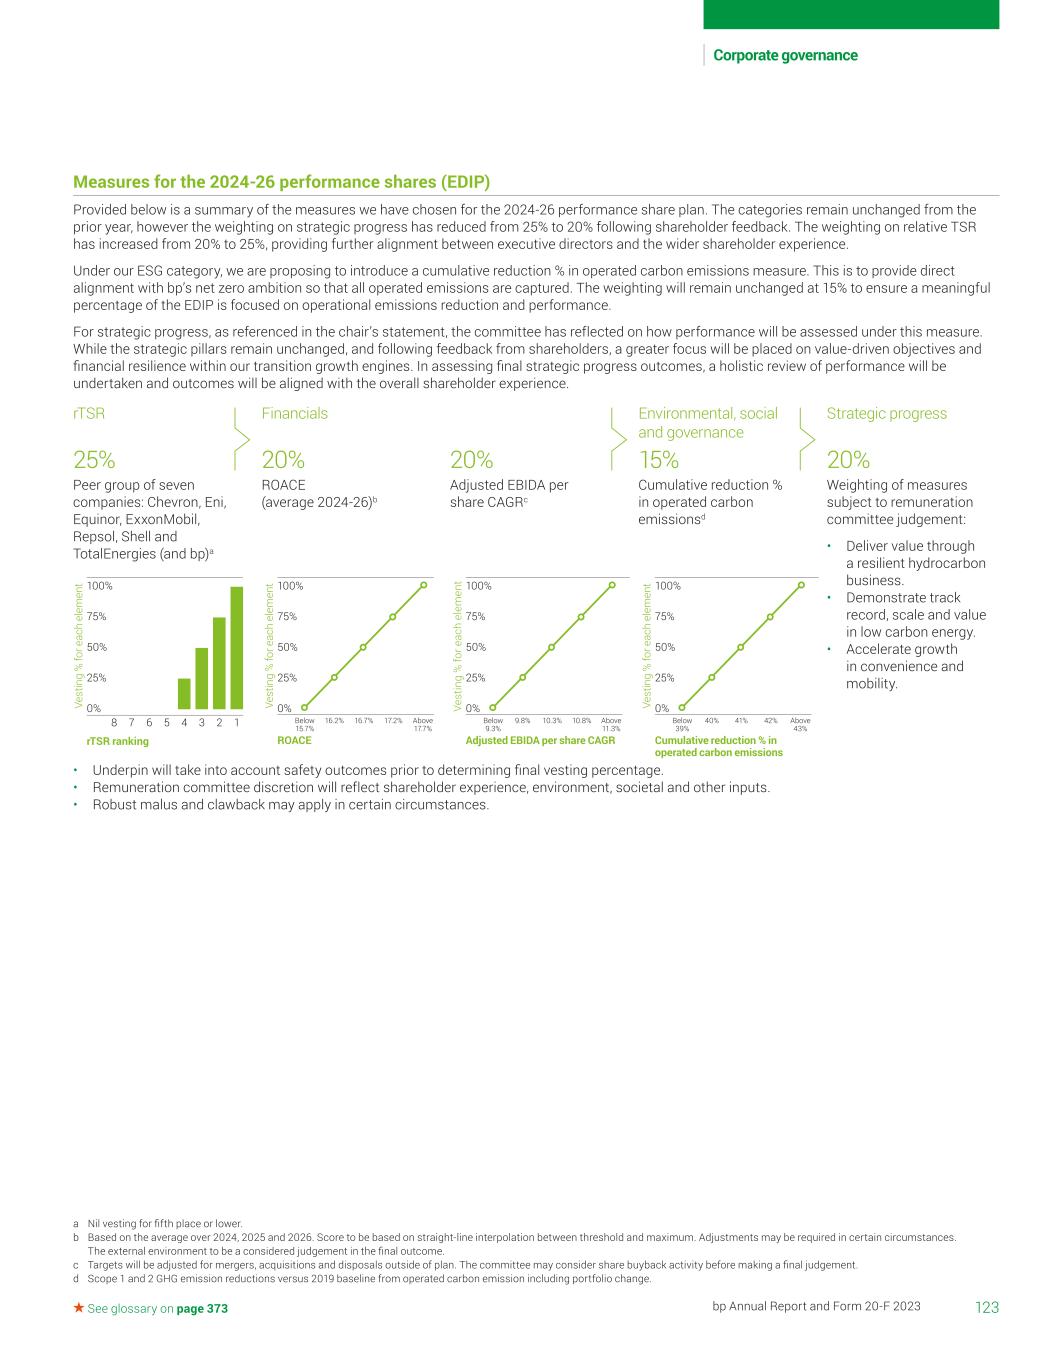
123bp Annual Report and Form 20-F 2023 Corporate governance See glossary on page 373 a Nil vesting for fifth place or lower. b Based on the average over 2024, 2025 and 2026. Score to be based on straight-line interpolation between threshold and maximum. Adjustments may be required in certain circumstances. The external environment to be a considered judgement in the final outcome. c Targets will be adjusted for mergers, acquisitions and disposals outside of plan. The committee may consider share buyback activity before making a final judgement. d Scope 1 and 2 GHG emission reductions versus 2019 baseline from operated carbon emission including portfolio change. rTSR 25% Financials 20% 20% Environmental, social and governance 15% Strategic progress 20% Measures for the 2024-26 performance shares (EDIP) Provided below is a summary of the measures we have chosen for the 2024-26 performance share plan. The categories remain unchanged from the prior year, however the weighting on strategic progress has reduced from 25% to 20% following shareholder feedback. The weighting on relative TSR has increased from 20% to 25%, providing further alignment between executive directors and the wider shareholder experience. Under our ESG category, we are proposing to introduce a cumulative reduction % in operated carbon emissions measure. This is to provide direct alignment with bp’s net zero ambition so that all operated emissions are captured. The weighting will remain unchanged at 15% to ensure a meaningful percentage of the EDIP is focused on operational emissions reduction and performance. For strategic progress, as referenced in the chair’s statement, the committee has reflected on how performance will be assessed under this measure. While the strategic pillars remain unchanged, and following feedback from shareholders, a greater focus will be placed on value-driven objectives and financial resilience within our transition growth engines. In assessing final strategic progress outcomes, a holistic review of performance will be undertaken and outcomes will be aligned with the overall shareholder experience. Peer group of seven companies: Chevron, Eni, Equinor, ExxonMobil, Repsol, Shell and TotalEnergies (and bp)a ROACE (average 2024-26)b Adjusted EBIDA per share CAGRc Cumulative reduction % in operated carbon emissionsd Weighting of measures subject to remuneration committee judgement: • Deliver value through a resilient hydrocarbon business. • Demonstrate track record, scale and value in low carbon energy. • Accelerate growth in convenience and mobility. 8 7 6 5 4 3 2 1 0% 25% 50% 75% 100% rTSR ranking Ve st in g % fo r e ac h el em en t Below 15.7% 16.2% 16.7% 17.2% Above 17.7% 0% 25% 50% 75% 100% ROACE Ve st in g % fo r e ac h el em en t Adjusted EBIDA per share CAGR Below 9.3% 9.8% 10.3% 10.8% Above 11.3% 0% 25% 50% 75% 100% Ve st in g % fo r e ac h el em en t Cumulative reduction % in operated carbon emissions Below 39% 40% 41% 42% Above 43% 0% 25% 50% 75% 100% Ve st in g % fo r e ac h el em en t • Underpin will take into account safety outcomes prior to determining final vesting percentage. • Remuneration committee discretion will reflect shareholder experience, environment, societal and other inputs. • Robust malus and clawback may apply in certain circumstances.
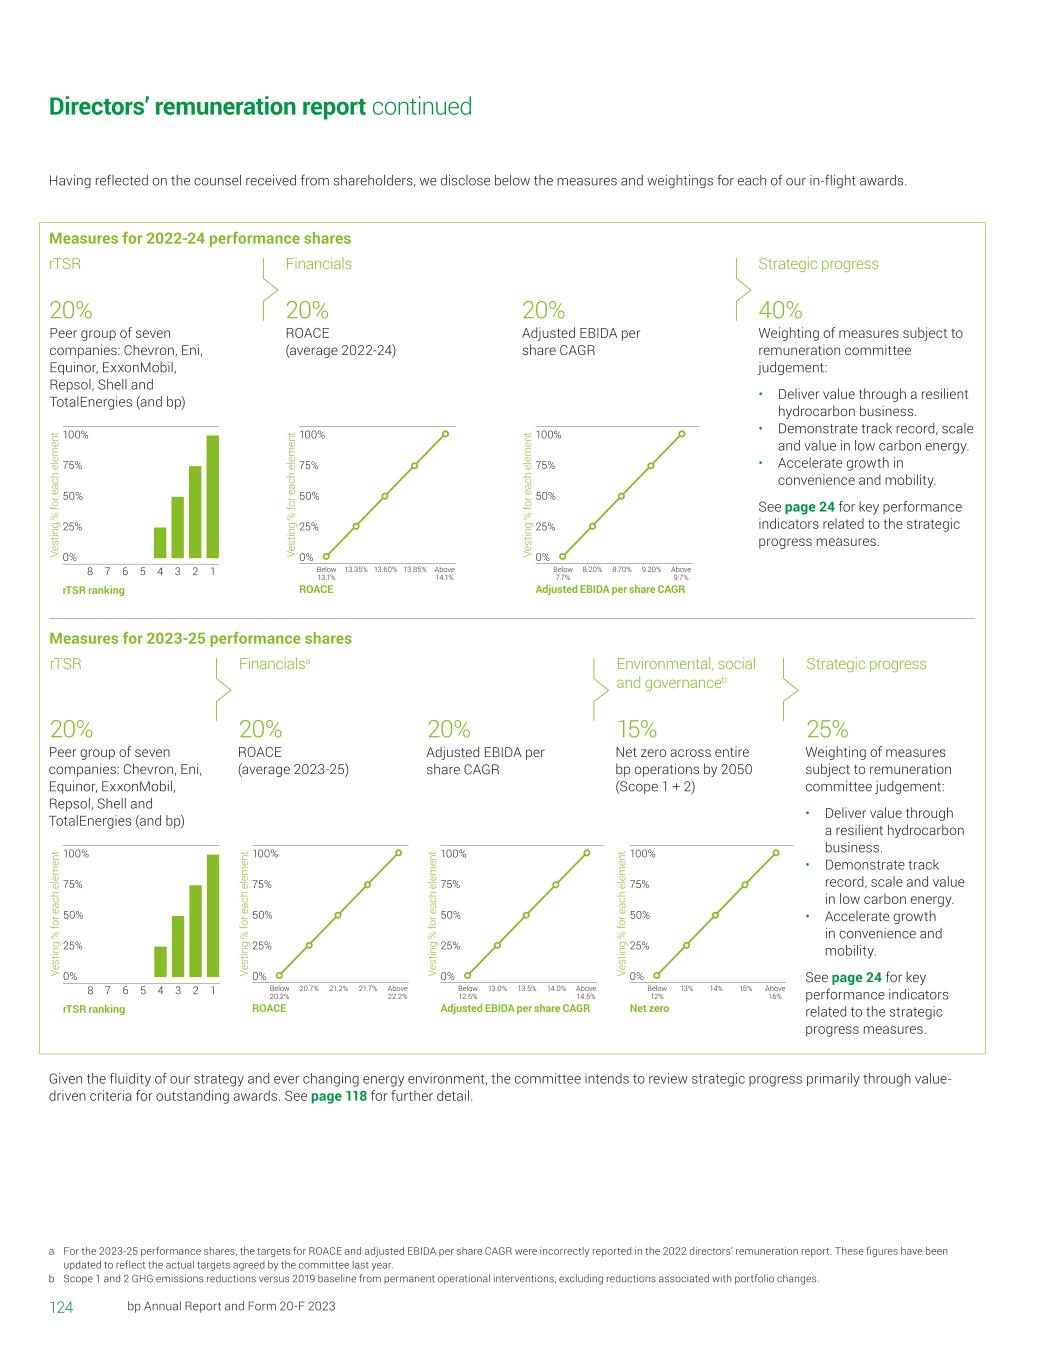
8 7 6 5 4 3 2 1 0% 25% 50% 75% 100% rTSR ranking Ve st in g % fo r e ac h el em en t Below 13.1% 13.35% 13.60% 13.85% Above 14.1% 0% 25% 50% 75% 100% ROACE Ve st in g % fo r e ac h el em en t Adjusted EBIDA per share CAGR Below 7.7% 8.20% 8.70% 9.20% Above 9.7% 0% 25% 50% 75% 100% Ve st in g % fo r e ac h el em en t 8 7 6 5 4 3 2 1 0% 25% 50% 75% 100% rTSR ranking Ve st in g % fo r e ac h el em en t Below 20.2% 20.7% 21.2% 21.7% Above 22.2% 0% 25% 50% 75% 100% ROACE Ve st in g % fo r e ac h el em en t Adjusted EBIDA per share CAGR Below 12.5% 13.0% 13.5% 14.0% Above 14.5% 0% 25% 50% 75% 100% Ve st in g % fo r e ac h el em en t Net zero Below 12% 13% 14% 15% Above 16% 0% 25% 50% 75% 100% Ve st in g % fo r e ac h el em en t 124 bp Annual Report and Form 20-F 2023 Having reflected on the counsel received from shareholders, we disclose below the measures and weightings for each of our in-flight awards. rTSR 20% Financials 20% 20% Strategic progress 40% Measures for 2022-24 performance shares Peer group of seven companies: Chevron, Eni, Equinor, ExxonMobil, Repsol, Shell and TotalEnergies (and bp) rTSR 20% ROACE (average 2023-25) Financialsa 20% Adjusted EBIDA per share CAGR 20% Net zero across entire bp operations by 2050 (Scope 1 + 2) Environmental, social and governanceb 15% Weighting of measures subject to remuneration committee judgement: • Deliver value through a resilient hydrocarbon business. • Demonstrate track record, scale and value in low carbon energy. • Accelerate growth in convenience and mobility. See page 24 for key performance indicators related to the strategic progress measures. Strategic progress 25% Measures for 2023-25 performance shares Directors’ remuneration report continued a For the 2023-25 performance shares, the targets for ROACE and adjusted EBIDA per share CAGR were incorrectly reported in the 2022 directors’ remuneration report. These figures have been updated to reflect the actual targets agreed by the committee last year. b Scope 1 and 2 GHG emissions reductions versus 2019 baseline from permanent operational interventions, excluding reductions associated with portfolio changes. Peer group of seven companies: Chevron, Eni, Equinor, ExxonMobil, Repsol, Shell and TotalEnergies (and bp) ROACE (average 2022-24) Adjusted EBIDA per share CAGR Weighting of measures subject to remuneration committee judgement: • Deliver value through a resilient hydrocarbon business. • Demonstrate track record, scale and value in low carbon energy. • Accelerate growth in convenience and mobility. See page 24 for key performance indicators related to the strategic progress measures. Given the fluidity of our strategy and ever changing energy environment, the committee intends to review strategic progress primarily through value- driven criteria for outstanding awards. See page 118 for further detail.
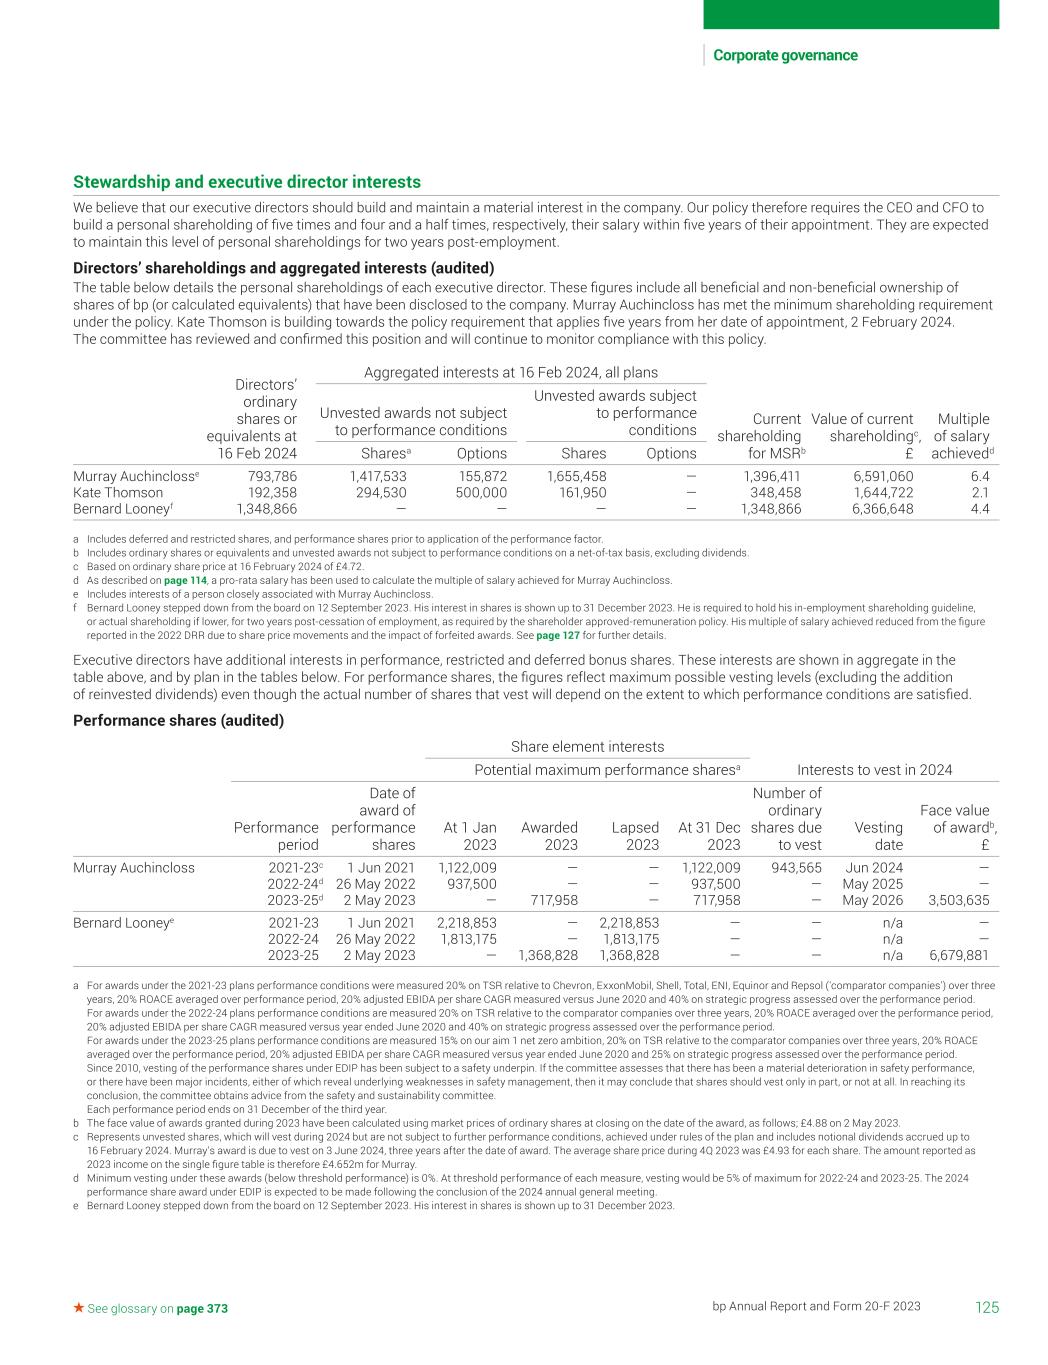
125bp Annual Report and Form 20-F 2023 Corporate governance See glossary on page 373 Stewardship and executive director interests We believe that our executive directors should build and maintain a material interest in the company. Our policy therefore requires the CEO and CFO to build a personal shareholding of five times and four and a half times, respectively, their salary within five years of their appointment. They are expected to maintain this level of personal shareholdings for two years post-employment. Directors’ shareholdings and aggregated interests (audited) The table below details the personal shareholdings of each executive director. These figures include all beneficial and non-beneficial ownership of shares of bp (or calculated equivalents) that have been disclosed to the company. Murray Auchincloss has met the minimum shareholding requirement under the policy. Kate Thomson is building towards the policy requirement that applies five years from her date of appointment, 2 February 2024. The committee has reviewed and confirmed this position and will continue to monitor compliance with this policy. Directors’ ordinary shares or equivalents at 16 Feb 2024 Aggregated interests at 16 Feb 2024, all plans Current shareholding for MSRb Value of current shareholdingc, £ Multiple of salary achievedd Unvested awards not subject to performance conditions Unvested awards subject to performance conditions Sharesa Options Shares Options Murray Auchinclosse 793,786 1,417,533 155,872 1,655,458 — 1,396,411 6,591,060 6.4 Kate Thomson 192,358 294,530 500,000 161,950 — 348,458 1,644,722 2.1 Bernard Looneyf 1,348,866 — — — — 1,348,866 6,366,648 4.4 a Includes deferred and restricted shares, and performance shares prior to application of the performance factor. b Includes ordinary shares or equivalents and unvested awards not subject to performance conditions on a net-of-tax basis, excluding dividends. c Based on ordinary share price at 16 February 2024 of £4.72. d As described on page 114, a pro-rata salary has been used to calculate the multiple of salary achieved for Murray Auchincloss. e Includes interests of a person closely associated with Murray Auchincloss. f Bernard Looney stepped down from the board on 12 September 2023. His interest in shares is shown up to 31 December 2023. He is required to hold his in-employment shareholding guideline, or actual shareholding if lower, for two years post-cessation of employment, as required by the shareholder approved-remuneration policy. His multiple of salary achieved reduced from the figure reported in the 2022 DRR due to share price movements and the impact of forfeited awards. See page 127 for further details. Executive directors have additional interests in performance, restricted and deferred bonus shares. These interests are shown in aggregate in the table above, and by plan in the tables below. For performance shares, the figures reflect maximum possible vesting levels (excluding the addition of reinvested dividends) even though the actual number of shares that vest will depend on the extent to which performance conditions are satisfied. Performance shares (audited) Share element interests Potential maximum performance sharesa Interests to vest in 2024 Performance period Date of award of performance shares At 1 Jan 2023 Awarded 2023 Lapsed 2023 At 31 Dec 2023 Number of ordinary shares due to vest Vesting date Face value of awardb, £ Murray Auchincloss 2021-23c 1 Jun 2021 1,122,009 — — 1,122,009 943,565 Jun 2024 — 2022-24d 26 May 2022 937,500 — — 937,500 — May 2025 — 2023-25d 2 May 2023 — 717,958 — 717,958 — May 2026 3,503,635 Bernard Looneye 2021-23 1 Jun 2021 2,218,853 — 2,218,853 — — n/a — 2022-24 26 May 2022 1,813,175 — 1,813,175 — — n/a — 2023-25 2 May 2023 — 1,368,828 1,368,828 — — n/a 6,679,881 a For awards under the 2021-23 plans performance conditions were measured 20% on TSR relative to Chevron, ExxonMobil, Shell, Total, ENI, Equinor and Repsol ('comparator companies') over three years, 20% ROACE averaged over performance period, 20% adjusted EBIDA per share CAGR measured versus June 2020 and 40% on strategic progress assessed over the performance period. For awards under the 2022-24 plans performance conditions are measured 20% on TSR relative to the comparator companies over three years, 20% ROACE averaged over the performance period, 20% adjusted EBIDA per share CAGR measured versus year ended June 2020 and 40% on strategic progress assessed over the performance period. For awards under the 2023-25 plans performance conditions are measured 15% on our aim 1 net zero ambition, 20% on TSR relative to the comparator companies over three years, 20% ROACE averaged over the performance period, 20% adjusted EBIDA per share CAGR measured versus year ended June 2020 and 25% on strategic progress assessed over the performance period. Since 2010, vesting of the performance shares under EDIP has been subject to a safety underpin. If the committee assesses that there has been a material deterioration in safety performance, or there have been major incidents, either of which reveal underlying weaknesses in safety management, then it may conclude that shares should vest only in part, or not at all. In reaching its conclusion, the committee obtains advice from the safety and sustainability committee. Each performance period ends on 31 December of the third year. b The face value of awards granted during 2023 have been calculated using market prices of ordinary shares at closing on the date of the award, as follows; £4.88 on 2 May 2023. c Represents unvested shares, which will vest during 2024 but are not subject to further performance conditions, achieved under rules of the plan and includes notional dividends accrued up to 16 February 2024. Murray's award is due to vest on 3 June 2024, three years after the date of award. The average share price during 4Q 2023 was £4.93 for each share. The amount reported as 2023 income on the single figure table is therefore £4.652m for Murray. d Minimum vesting under these awards (below threshold performance) is 0%. At threshold performance of each measure, vesting would be 5% of maximum for 2022-24 and 2023-25. The 2024 performance share award under EDIP is expected to be made following the conclusion of the 2024 annual general meeting. e Bernard Looney stepped down from the board on 12 September 2023. His interest in shares is shown up to 31 December 2023.
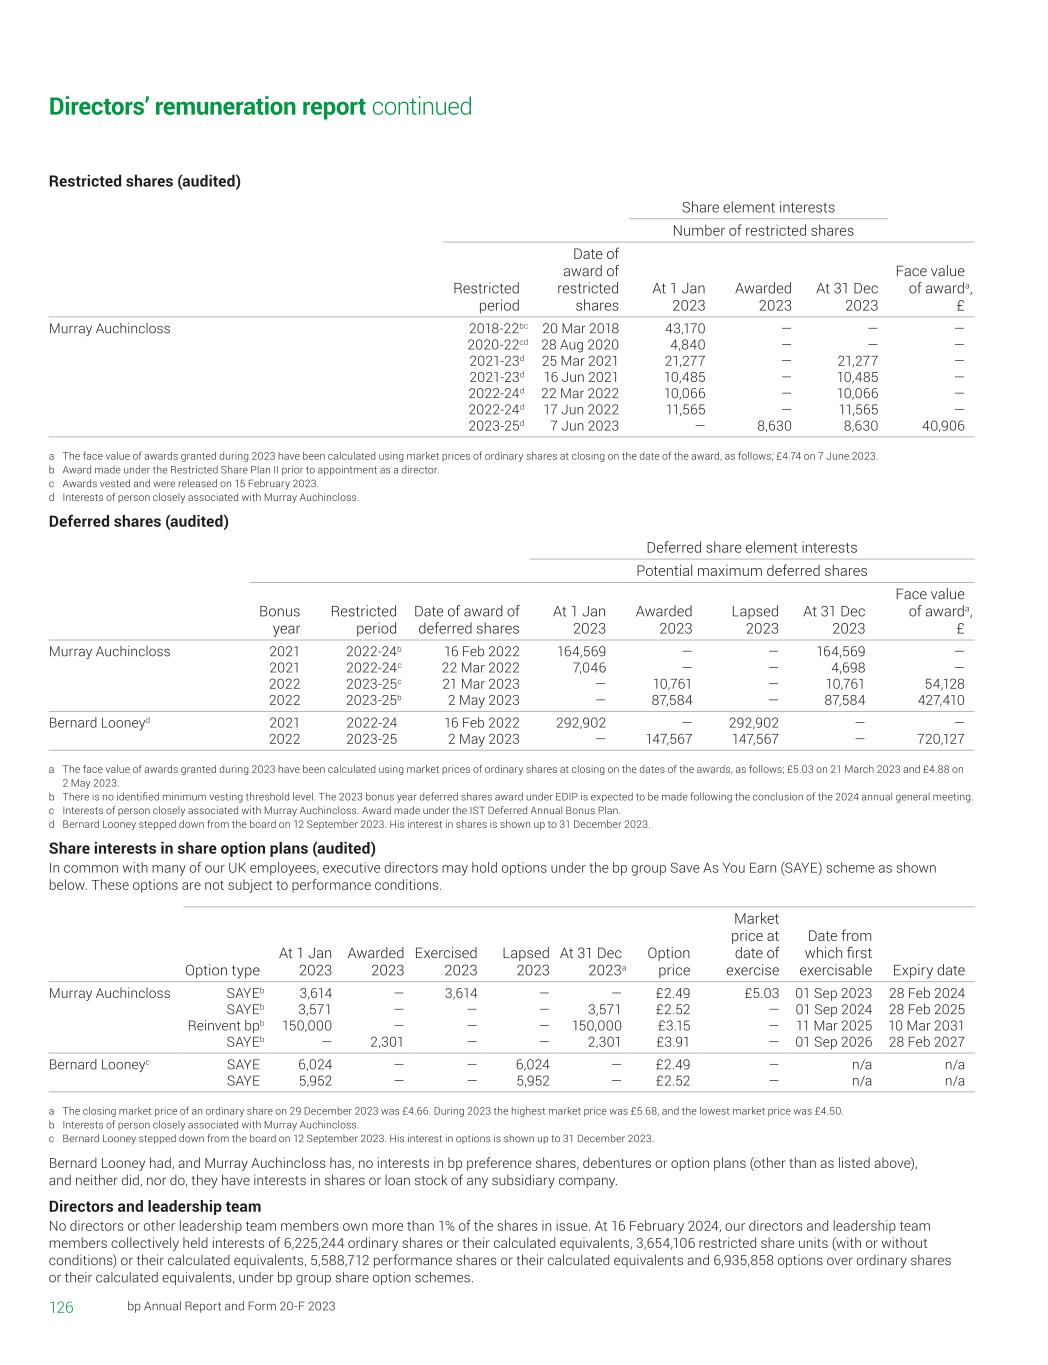
126 bp Annual Report and Form 20-F 2023 Directors’ remuneration report continued Restricted shares (audited) Share element interests Number of restricted shares Restricted period Date of award of restricted shares At 1 Jan 2023 Awarded 2023 At 31 Dec 2023 Face value of awarda, £ Murray Auchincloss 2018-22bc 20 Mar 2018 43,170 — — — 2020-22cd 28 Aug 2020 4,840 — — — 2021-23d 25 Mar 2021 21,277 — 21,277 — 2021-23d 16 Jun 2021 10,485 — 10,485 — 2022-24d 22 Mar 2022 10,066 — 10,066 — 2022-24d 17 Jun 2022 11,565 — 11,565 — 2023-25d 7 Jun 2023 — 8,630 8,630 40,906 a The face value of awards granted during 2023 have been calculated using market prices of ordinary shares at closing on the date of the award, as follows; £4.74 on 7 June 2023. b Award made under the Restricted Share Plan II prior to appointment as a director. c Awards vested and were released on 15 February 2023. d Interests of person closely associated with Murray Auchincloss. Deferred shares (audited) Deferred share element interests Potential maximum deferred shares Bonus year Restricted period Date of award of deferred shares At 1 Jan 2023 Awarded 2023 Lapsed 2023 At 31 Dec 2023 Face value of awarda, £ Murray Auchincloss 2021 2022-24b 16 Feb 2022 164,569 — — 164,569 — 2021 2022-24c 22 Mar 2022 7,046 — — 4,698 — 2022 2023-25c 21 Mar 2023 — 10,761 — 10,761 54,128 2022 2023-25b 2 May 2023 — 87,584 — 87,584 427,410 Bernard Looneyd 2021 2022-24 16 Feb 2022 292,902 — 292,902 — — 2022 2023-25 2 May 2023 — 147,567 147,567 — 720,127 a The face value of awards granted during 2023 have been calculated using market prices of ordinary shares at closing on the dates of the awards, as follows; £5.03 on 21 March 2023 and £4.88 on 2 May 2023. b There is no identified minimum vesting threshold level. The 2023 bonus year deferred shares award under EDIP is expected to be made following the conclusion of the 2024 annual general meeting. c Interests of person closely associated with Murray Auchincloss. Award made under the IST Deferred Annual Bonus Plan. d Bernard Looney stepped down from the board on 12 September 2023. His interest in shares is shown up to 31 December 2023. Share interests in share option plans (audited) In common with many of our UK employees, executive directors may hold options under the bp group Save As You Earn (SAYE) scheme as shown below. These options are not subject to performance conditions. Option type At 1 Jan 2023 Awarded 2023 Exercised 2023 Lapsed 2023 At 31 Dec 2023a Option price Market price at date of exercise Date from which first exercisable Expiry date Murray Auchincloss SAYEb 3,614 — 3,614 — — £2.49 £5.03 01 Sep 2023 28 Feb 2024 SAYEb 3,571 — — — 3,571 £2.52 — 01 Sep 2024 28 Feb 2025 Reinvent bpb 150,000 — — — 150,000 £3.15 — 11 Mar 2025 10 Mar 2031 SAYEb — 2,301 — — 2,301 £3.91 — 01 Sep 2026 28 Feb 2027 Bernard Looneyc SAYE 6,024 — — 6,024 — £2.49 — n/a n/a SAYE 5,952 — — 5,952 — £2.52 — n/a n/a a The closing market price of an ordinary share on 29 December 2023 was £4.66. During 2023 the highest market price was £5.68, and the lowest market price was £4.50. b Interests of person closely associated with Murray Auchincloss. c Bernard Looney stepped down from the board on 12 September 2023. His interest in options is shown up to 31 December 2023. Bernard Looney had, and Murray Auchincloss has, no interests in bp preference shares, debentures or option plans (other than as listed above), and neither did, nor do, they have interests in shares or loan stock of any subsidiary company. Directors and leadership team No directors or other leadership team members own more than 1% of the shares in issue. At 16 February 2024, our directors and leadership team members collectively held interests of 6,225,244 ordinary shares or their calculated equivalents, 3,654,106 restricted share units (with or without conditions) or their calculated equivalents, 5,588,712 performance shares or their calculated equivalents and 6,935,858 options over ordinary shares or their calculated equivalents, under bp group share option schemes.
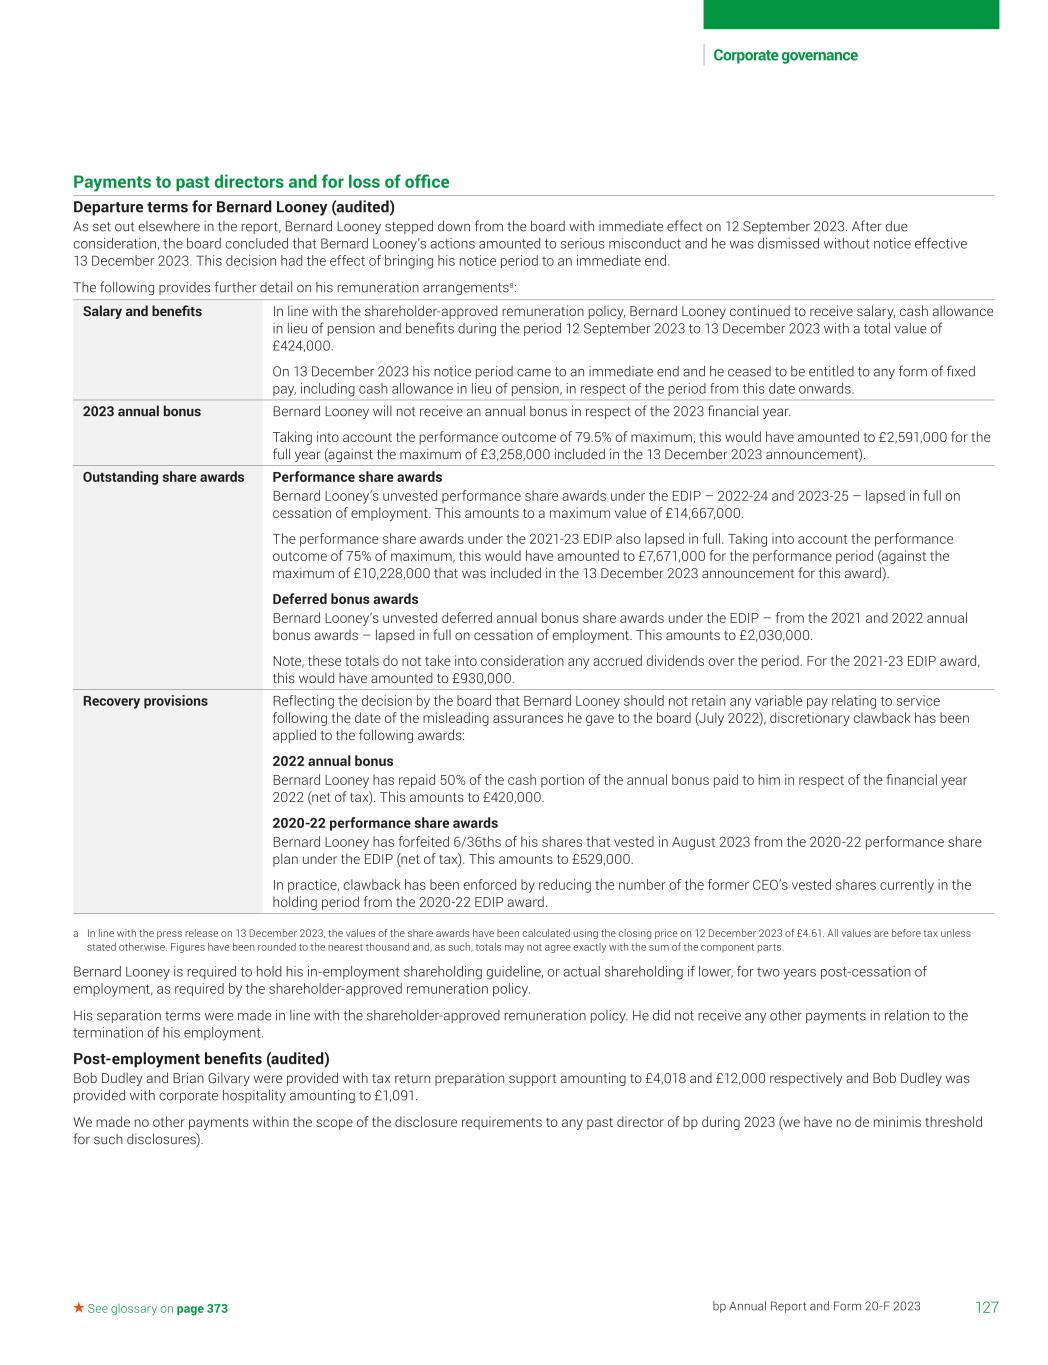
127bp Annual Report and Form 20-F 2023 Corporate governance See glossary on page 373 Payments to past directors and for loss of office Departure terms for Bernard Looney (audited) As set out elsewhere in the report, Bernard Looney stepped down from the board with immediate effect on 12 September 2023. After due consideration, the board concluded that Bernard Looney’s actions amounted to serious misconduct and he was dismissed without notice effective 13 December 2023. This decision had the effect of bringing his notice period to an immediate end. The following provides further detail on his remuneration arrangementsa: Salary and benefits In line with the shareholder-approved remuneration policy, Bernard Looney continued to receive salary, cash allowance in lieu of pension and benefits during the period 12 September 2023 to 13 December 2023 with a total value of £424,000. On 13 December 2023 his notice period came to an immediate end and he ceased to be entitled to any form of fixed pay, including cash allowance in lieu of pension, in respect of the period from this date onwards. 2023 annual bonus Bernard Looney will not receive an annual bonus in respect of the 2023 financial year. Taking into account the performance outcome of 79.5% of maximum, this would have amounted to £2,591,000 for the full year (against the maximum of £3,258,000 included in the 13 December 2023 announcement). Outstanding share awards Performance share awards Bernard Looney’s unvested performance share awards under the EDIP – 2022-24 and 2023-25 – lapsed in full on cessation of employment. This amounts to a maximum value of £14,667,000. The performance share awards under the 2021-23 EDIP also lapsed in full. Taking into account the performance outcome of 75% of maximum, this would have amounted to £7,671,000 for the performance period (against the maximum of £10,228,000 that was included in the 13 December 2023 announcement for this award). Deferred bonus awards Bernard Looney’s unvested deferred annual bonus share awards under the EDIP – from the 2021 and 2022 annual bonus awards – lapsed in full on cessation of employment. This amounts to £2,030,000. Note, these totals do not take into consideration any accrued dividends over the period. For the 2021-23 EDIP award, this would have amounted to £930,000. Recovery provisions Reflecting the decision by the board that Bernard Looney should not retain any variable pay relating to service following the date of the misleading assurances he gave to the board (July 2022), discretionary clawback has been applied to the following awards: 2022 annual bonus Bernard Looney has repaid 50% of the cash portion of the annual bonus paid to him in respect of the financial year 2022 (net of tax). This amounts to £420,000. 2020-22 performance share awards Bernard Looney has forfeited 6/36ths of his shares that vested in August 2023 from the 2020-22 performance share plan under the EDIP (net of tax). This amounts to £529,000. In practice, clawback has been enforced by reducing the number of the former CEO’s vested shares currently in the holding period from the 2020-22 EDIP award. a In line with the press release on 13 December 2023, the values of the share awards have been calculated using the closing price on 12 December 2023 of £4.61. All values are before tax unless stated otherwise. Figures have been rounded to the nearest thousand and, as such, totals may not agree exactly with the sum of the component parts. Bernard Looney is required to hold his in-employment shareholding guideline, or actual shareholding if lower, for two years post-cessation of employment, as required by the shareholder-approved remuneration policy. His separation terms were made in line with the shareholder-approved remuneration policy. He did not receive any other payments in relation to the termination of his employment. Post-employment benefits (audited) Bob Dudley and Brian Gilvary were provided with tax return preparation support amounting to £4,018 and £12,000 respectively and Bob Dudley was provided with corporate hospitality amounting to £1,091. We made no other payments within the scope of the disclosure requirements to any past director of bp during 2023 (we have no de minimis threshold for such disclosures).
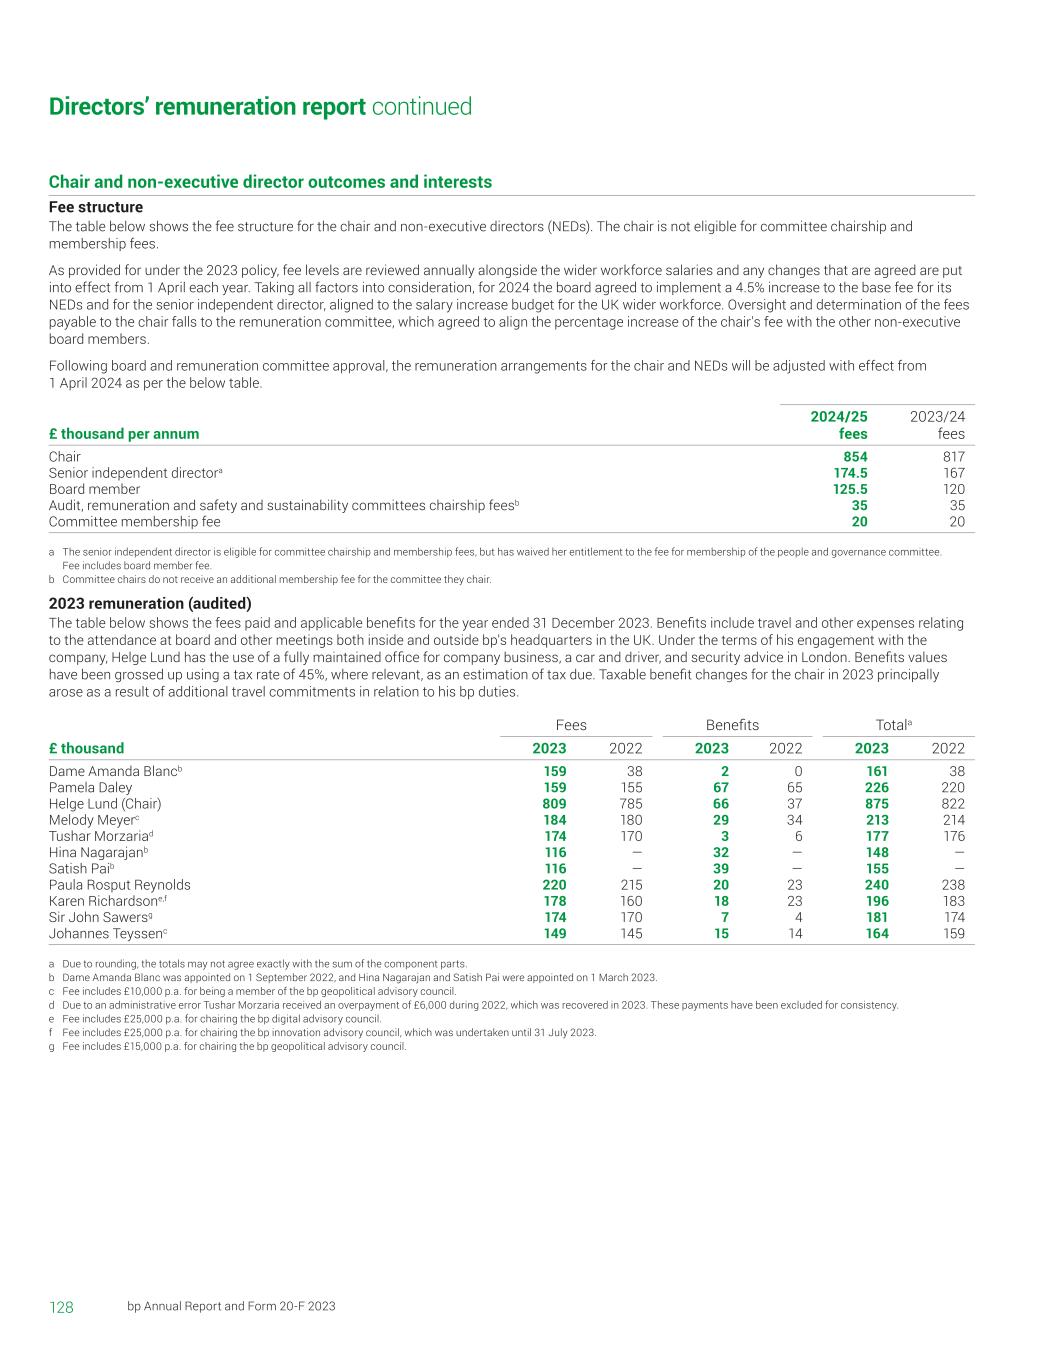
128 bp Annual Report and Form 20-F 2023 Directors’ remuneration report continued Chair and non-executive director outcomes and interests Fee structure The table below shows the fee structure for the chair and non-executive directors (NEDs). The chair is not eligible for committee chairship and membership fees. As provided for under the 2023 policy, fee levels are reviewed annually alongside the wider workforce salaries and any changes that are agreed are put into effect from 1 April each year. Taking all factors into consideration, for 2024 the board agreed to implement a 4.5% increase to the base fee for its NEDs and for the senior independent director, aligned to the salary increase budget for the UK wider workforce. Oversight and determination of the fees payable to the chair falls to the remuneration committee, which agreed to align the percentage increase of the chair's fee with the other non-executive board members. Following board and remuneration committee approval, the remuneration arrangements for the chair and NEDs will be adjusted with effect from 1 April 2024 as per the below table. £ thousand per annum 2024/25 fees 2023/24 fees Chair 854 817 Senior independent directora 174.5 167 Board member 125.5 120 Audit, remuneration and safety and sustainability committees chairship feesb 35 35 Committee membership fee 20 20 a The senior independent director is eligible for committee chairship and membership fees, but has waived her entitlement to the fee for membership of the people and governance committee. Fee includes board member fee. b Committee chairs do not receive an additional membership fee for the committee they chair. 2023 remuneration (audited) The table below shows the fees paid and applicable benefits for the year ended 31 December 2023. Benefits include travel and other expenses relating to the attendance at board and other meetings both inside and outside bp's headquarters in the UK. Under the terms of his engagement with the company, Helge Lund has the use of a fully maintained office for company business, a car and driver, and security advice in London. Benefits values have been grossed up using a tax rate of 45%, where relevant, as an estimation of tax due. Taxable benefit changes for the chair in 2023 principally arose as a result of additional travel commitments in relation to his bp duties. Fees Benefits Totala £ thousand 2023 2022 2023 2022 2023 2022 Dame Amanda Blancb 159 38 2 0 161 38 Pamela Daley 159 155 67 65 226 220 Helge Lund (Chair) 809 785 66 37 875 822 Melody Meyerc 184 180 29 34 213 214 Tushar Morzariad 174 170 3 6 177 176 Hina Nagarajanb 116 — 32 — 148 — Satish Paib 116 — 39 — 155 — Paula Rosput Reynolds 220 215 20 23 240 238 Karen Richardsone,f 178 160 18 23 196 183 Sir John Sawersg 174 170 7 4 181 174 Johannes Teyssenc 149 145 15 14 164 159 a Due to rounding, the totals may not agree exactly with the sum of the component parts. b Dame Amanda Blanc was appointed on 1 September 2022, and Hina Nagarajan and Satish Pai were appointed on 1 March 2023. c Fee includes £10,000 p.a. for being a member of the bp geopolitical advisory council. d Due to an administrative error Tushar Morzaria received an overpayment of £6,000 during 2022, which was recovered in 2023. These payments have been excluded for consistency. e Fee includes £25,000 p.a. for chairing the bp digital advisory council. f Fee includes £25,000 p.a. for chairing the bp innovation advisory council, which was undertaken until 31 July 2023. g Fee includes £15,000 p.a. for chairing the bp geopolitical advisory council.
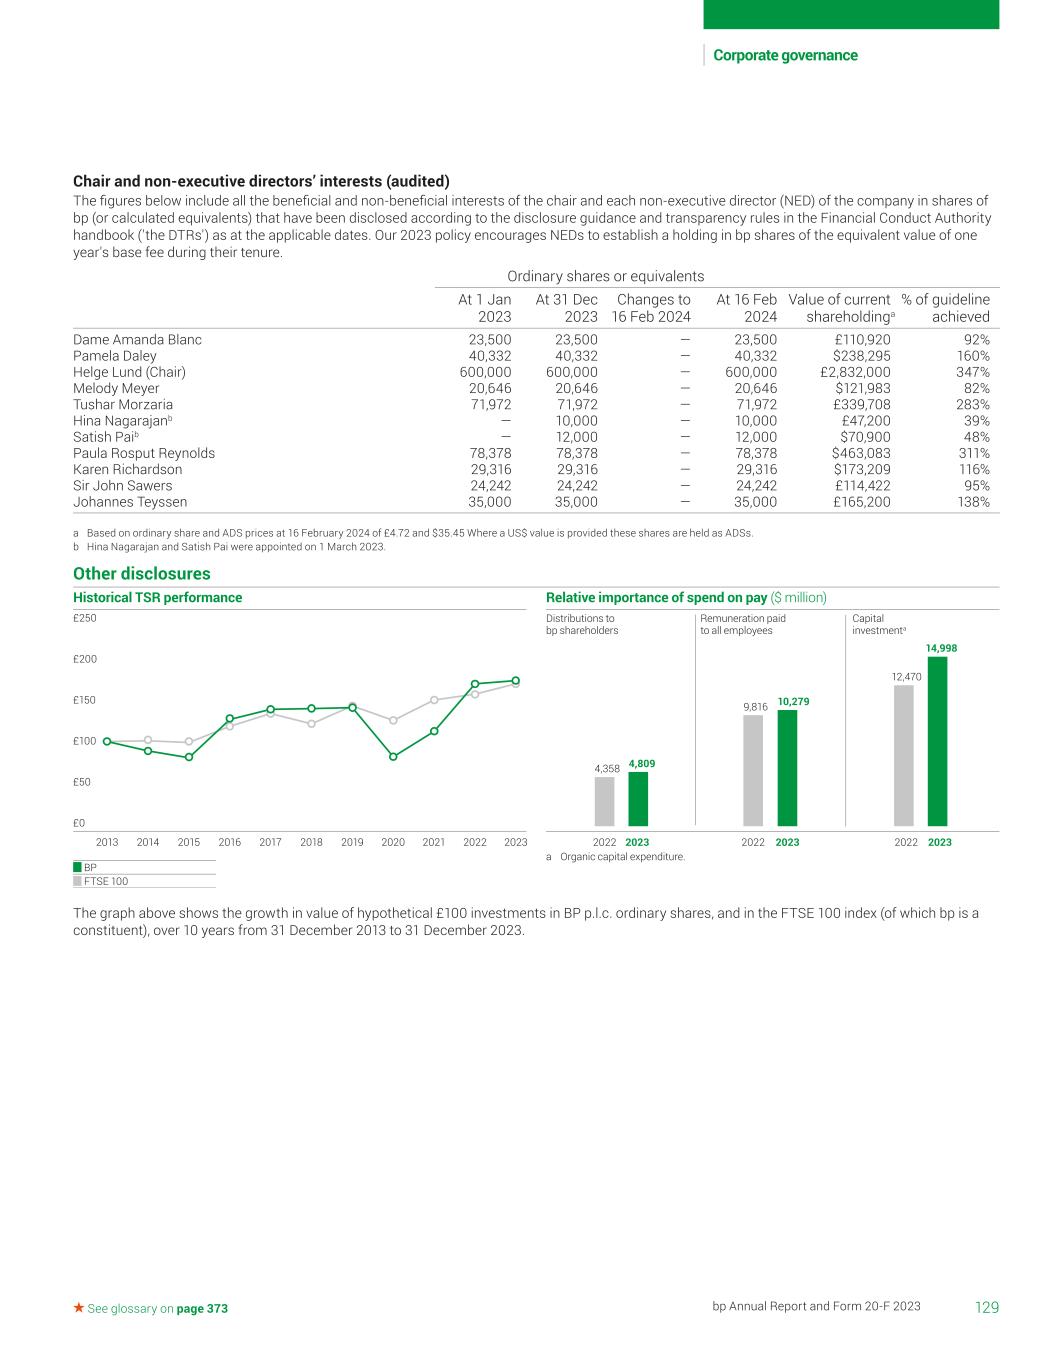
129bp Annual Report and Form 20-F 2023 Corporate governance See glossary on page 373 Chair and non-executive directors’ interests (audited) The figures below include all the beneficial and non-beneficial interests of the chair and each non-executive director (NED) of the company in shares of bp (or calculated equivalents) that have been disclosed according to the disclosure guidance and transparency rules in the Financial Conduct Authority handbook ('the DTRs') as at the applicable dates. Our 2023 policy encourages NEDs to establish a holding in bp shares of the equivalent value of one year's base fee during their tenure. Ordinary shares or equivalents At 1 Jan 2023 At 31 Dec 2023 Changes to 16 Feb 2024 At 16 Feb 2024 Value of current shareholdinga % of guideline achieved Dame Amanda Blanc 23,500 23,500 — 23,500 £110,920 92% Pamela Daley 40,332 40,332 — 40,332 $238,295 160% Helge Lund (Chair) 600,000 600,000 — 600,000 £2,832,000 347% Melody Meyer 20,646 20,646 — 20,646 $121,983 82% Tushar Morzaria 71,972 71,972 — 71,972 £339,708 283% Hina Nagarajanb — 10,000 — 10,000 £47,200 39% Satish Paib — 12,000 — 12,000 $70,900 48% Paula Rosput Reynolds 78,378 78,378 — 78,378 $463,083 311% Karen Richardson 29,316 29,316 — 29,316 $173,209 116% Sir John Sawers 24,242 24,242 — 24,242 £114,422 95% Johannes Teyssen 35,000 35,000 — 35,000 £165,200 138% a Based on ordinary share and ADS prices at 16 February 2024 of £4.72 and $35.45 Where a US$ value is provided these shares are held as ADSs. b Hina Nagarajan and Satish Pai were appointed on 1 March 2023. Other disclosures Historical TSR performance 2022 2023202120202019201820172016201520142013 £0 £50 £100 £150 £200 £250 BP FTSE 100 Relative importance of spend on pay ($ million) 20232022 4,809 Distributions to bp shareholders 20232022 10,279 Remuneration paid to all employees 20232022 14,998 4,358 9,816 12,470 Capital investmenta a Organic capital expenditure. The graph above shows the growth in value of hypothetical £100 investments in BP p.l.c. ordinary shares, and in the FTSE 100 index (of which bp is a constituent), over 10 years from 31 December 2013 to 31 December 2023.
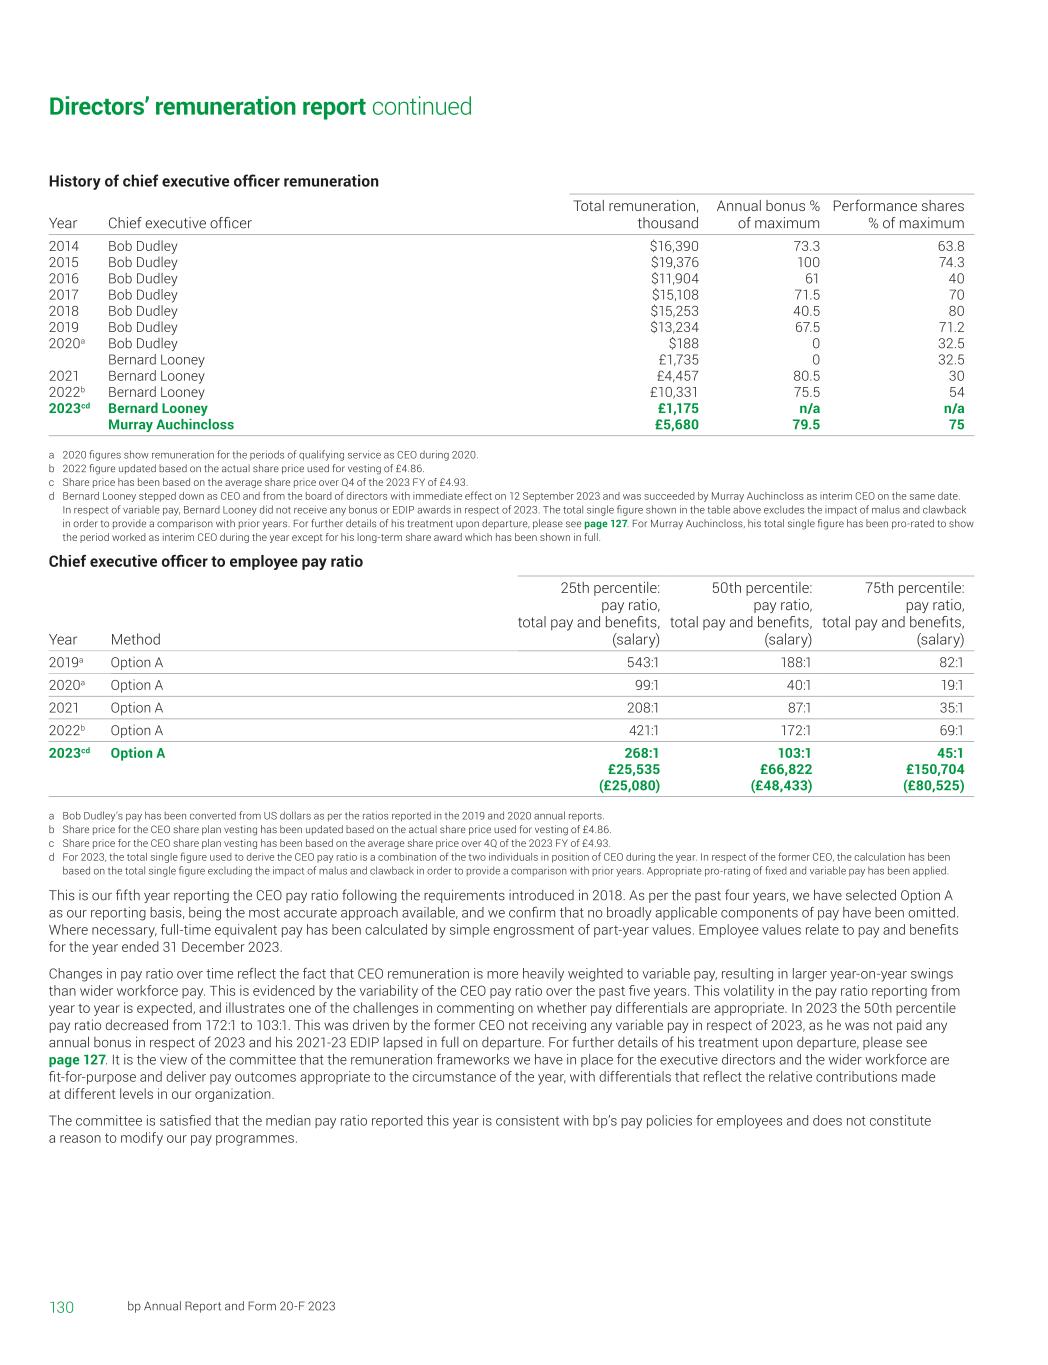
130 bp Annual Report and Form 20-F 2023 Directors’ remuneration report continued History of chief executive officer remuneration Year Chief executive officer Total remuneration, thousand Annual bonus % of maximum Performance shares % of maximum 2014 Bob Dudley $16,390 73.3 63.8 2015 Bob Dudley $19,376 100 74.3 2016 Bob Dudley $11,904 61 40 2017 Bob Dudley $15,108 71.5 70 2018 Bob Dudley $15,253 40.5 80 2019 Bob Dudley $13,234 67.5 71.2 2020a Bob Dudley $188 0 32.5 Bernard Looney £1,735 0 32.5 2021 Bernard Looney £4,457 80.5 30 2022b Bernard Looney £10,331 75.5 54 2023cd Bernard Looney £1,175 n/a n/a Murray Auchincloss £5,680 79.5 75 a 2020 figures show remuneration for the periods of qualifying service as CEO during 2020. b 2022 figure updated based on the actual share price used for vesting of £4.86. c Share price has been based on the average share price over Q4 of the 2023 FY of £4.93. d Bernard Looney stepped down as CEO and from the board of directors with immediate effect on 12 September 2023 and was succeeded by Murray Auchincloss as interim CEO on the same date. In respect of variable pay, Bernard Looney did not receive any bonus or EDIP awards in respect of 2023. The total single figure shown in the table above excludes the impact of malus and clawback in order to provide a comparison with prior years. For further details of his treatment upon departure, please see page 127. For Murray Auchincloss, his total single figure has been pro-rated to show the period worked as interim CEO during the year except for his long-term share award which has been shown in full. Chief executive officer to employee pay ratio Year Method 25th percentile: pay ratio, total pay and benefits, (salary) 50th percentile: pay ratio, total pay and benefits, (salary) 75th percentile: pay ratio, total pay and benefits, (salary) 2019a Option A 543:1 188:1 82:1 2020a Option A 99:1 40:1 19:1 2021 Option A 208:1 87:1 35:1 2022b Option A 421:1 172:1 69:1 2023cd Option A 268:1 103:1 45:1 £25,535 £66,822 £150,704 (£25,080) (£48,433) (£80,525) a Bob Dudley’s pay has been converted from US dollars as per the ratios reported in the 2019 and 2020 annual reports. b Share price for the CEO share plan vesting has been updated based on the actual share price used for vesting of £4.86. c Share price for the CEO share plan vesting has been based on the average share price over 4Q of the 2023 FY of £4.93. d For 2023, the total single figure used to derive the CEO pay ratio is a combination of the two individuals in position of CEO during the year. In respect of the former CEO, the calculation has been based on the total single figure excluding the impact of malus and clawback in order to provide a comparison with prior years. Appropriate pro-rating of fixed and variable pay has been applied. This is our fifth year reporting the CEO pay ratio following the requirements introduced in 2018. As per the past four years, we have selected Option A as our reporting basis, being the most accurate approach available, and we confirm that no broadly applicable components of pay have been omitted. Where necessary, full-time equivalent pay has been calculated by simple engrossment of part-year values. Employee values relate to pay and benefits for the year ended 31 December 2023. Changes in pay ratio over time reflect the fact that CEO remuneration is more heavily weighted to variable pay, resulting in larger year-on-year swings than wider workforce pay. This is evidenced by the variability of the CEO pay ratio over the past five years. This volatility in the pay ratio reporting from year to year is expected, and illustrates one of the challenges in commenting on whether pay differentials are appropriate. In 2023 the 50th percentile pay ratio decreased from 172:1 to 103:1. This was driven by the former CEO not receiving any variable pay in respect of 2023, as he was not paid any annual bonus in respect of 2023 and his 2021-23 EDIP lapsed in full on departure. For further details of his treatment upon departure, please see page 127. It is the view of the committee that the remuneration frameworks we have in place for the executive directors and the wider workforce are fit-for-purpose and deliver pay outcomes appropriate to the circumstance of the year, with differentials that reflect the relative contributions made at different levels in our organization. The committee is satisfied that the median pay ratio reported this year is consistent with bp’s pay policies for employees and does not constitute a reason to modify our pay programmes.
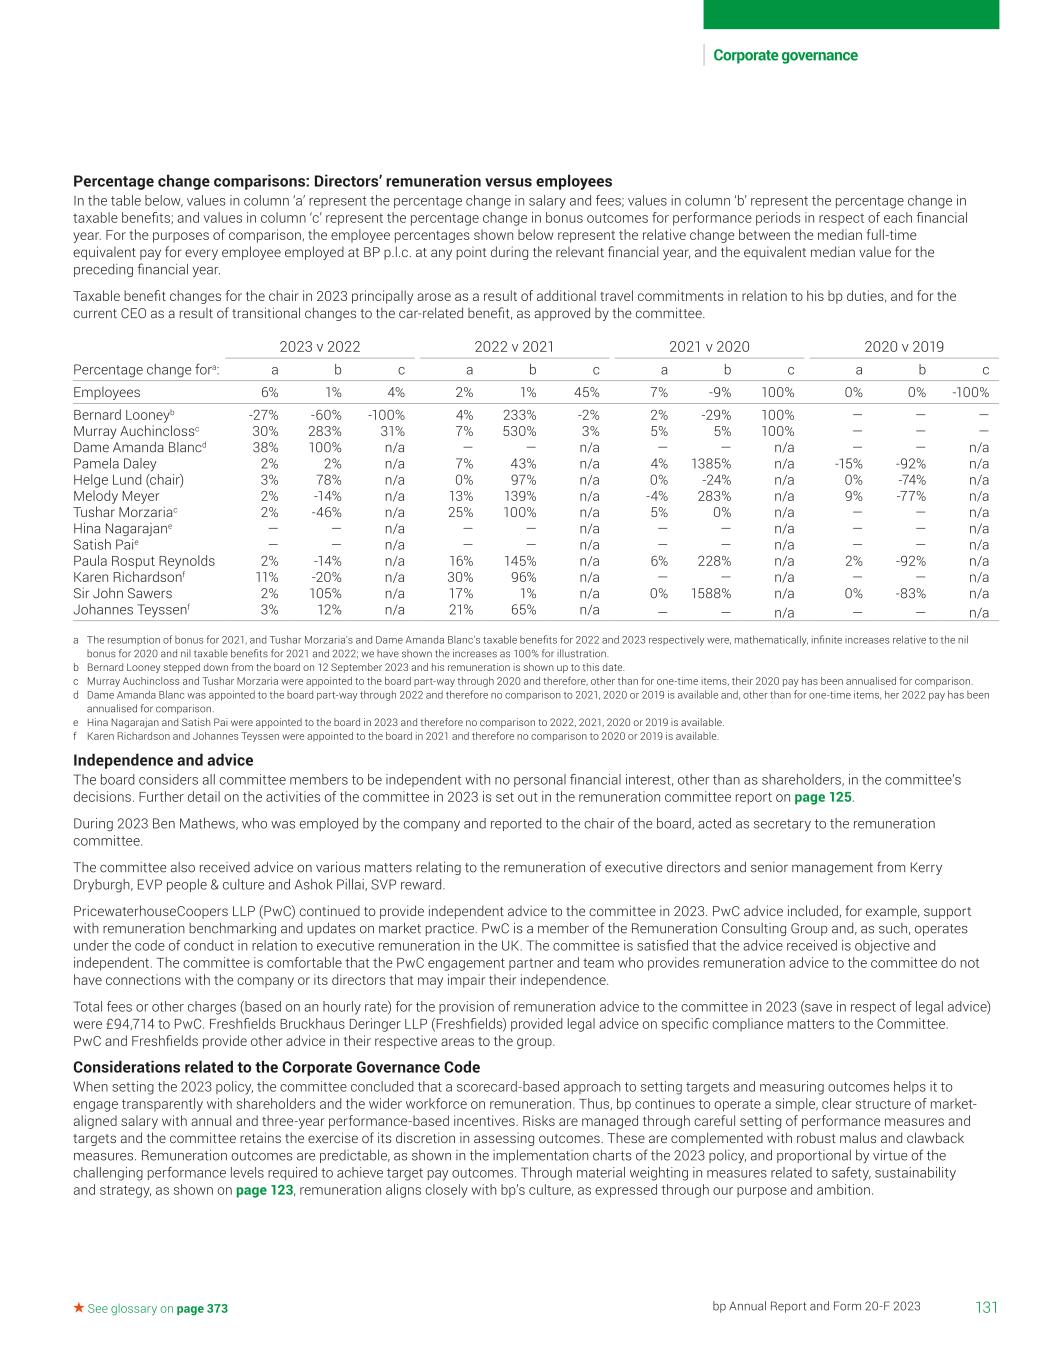
131bp Annual Report and Form 20-F 2023 Corporate governance See glossary on page 373 Percentage change comparisons: Directors’ remuneration versus employees In the table below, values in column ‘a’ represent the percentage change in salary and fees; values in column ‘b’ represent the percentage change in taxable benefits; and values in column ‘c’ represent the percentage change in bonus outcomes for performance periods in respect of each financial year. For the purposes of comparison, the employee percentages shown below represent the relative change between the median full-time equivalent pay for every employee employed at BP p.l.c. at any point during the relevant financial year, and the equivalent median value for the preceding financial year. Taxable benefit changes for the chair in 2023 principally arose as a result of additional travel commitments in relation to his bp duties, and for the current CEO as a result of transitional changes to the car-related benefit, as approved by the committee. 2023 v 2022 2022 v 2021 2021 v 2020 2020 v 2019 Percentage change fora: a b c a b c a b c a b c Employees 6% 1% 4% 2% 1% 45% 7% -9% 100% 0% 0% -100% Bernard Looneyb -27% -60% -100% 4% 233% -2% 2% -29% 100% — — — Murray Auchinclossc 30% 283% 31% 7% 530% 3% 5% 5% 100% — — — Dame Amanda Blancd 38% 100% n/a — — n/a — — n/a — — n/a Pamela Daley 2% 2% n/a 7% 43% n/a 4% 1385% n/a -15% -92% n/a Helge Lund (chair) 3% 78% n/a 0% 97% n/a 0% -24% n/a 0% -74% n/a Melody Meyer 2% -14% n/a 13% 139% n/a -4% 283% n/a 9% -77% n/a Tushar Morzariac 2% -46% n/a 25% 100% n/a 5% 0% n/a — — n/a Hina Nagarajane — — n/a — — n/a — — n/a — — n/a Satish Paie — — n/a — — n/a — — n/a — — n/a Paula Rosput Reynolds 2% -14% n/a 16% 145% n/a 6% 228% n/a 2% -92% n/a Karen Richardsonf 11% -20% n/a 30% 96% n/a — — n/a — — n/a Sir John Sawers 2% 105% n/a 17% 1% n/a 0% 1588% n/a 0% -83% n/a Johannes Teyssenf 3% 12% n/a 21% 65% n/a — — n/a — — n/a a The resumption of bonus for 2021, and Tushar Morzaria's and Dame Amanda Blanc's taxable benefits for 2022 and 2023 respectively were, mathematically, infinite increases relative to the nil bonus for 2020 and nil taxable benefits for 2021 and 2022; we have shown the increases as 100% for illustration. b Bernard Looney stepped down from the board on 12 September 2023 and his remuneration is shown up to this date. c Murray Auchincloss and Tushar Morzaria were appointed to the board part-way through 2020 and therefore, other than for one-time items, their 2020 pay has been annualised for comparison. d Dame Amanda Blanc was appointed to the board part-way through 2022 and therefore no comparison to 2021, 2020 or 2019 is available and, other than for one-time items, her 2022 pay has been annualised for comparison. e Hina Nagarajan and Satish Pai were appointed to the board in 2023 and therefore no comparison to 2022, 2021, 2020 or 2019 is available. f Karen Richardson and Johannes Teyssen were appointed to the board in 2021 and therefore no comparison to 2020 or 2019 is available. Independence and advice The board considers all committee members to be independent with no personal financial interest, other than as shareholders, in the committee’s decisions. Further detail on the activities of the committee in 2023 is set out in the remuneration committee report on page 125. During 2023 Ben Mathews, who was employed by the company and reported to the chair of the board, acted as secretary to the remuneration committee. The committee also received advice on various matters relating to the remuneration of executive directors and senior management from Kerry Dryburgh, EVP people & culture and Ashok Pillai, SVP reward. PricewaterhouseCoopers LLP (PwC) continued to provide independent advice to the committee in 2023. PwC advice included, for example, support with remuneration benchmarking and updates on market practice. PwC is a member of the Remuneration Consulting Group and, as such, operates under the code of conduct in relation to executive remuneration in the UK. The committee is satisfied that the advice received is objective and independent. The committee is comfortable that the PwC engagement partner and team who provides remuneration advice to the committee do not have connections with the company or its directors that may impair their independence. Total fees or other charges (based on an hourly rate) for the provision of remuneration advice to the committee in 2023 (save in respect of legal advice) were £94,714 to PwC. Freshfields Bruckhaus Deringer LLP (Freshfields) provided legal advice on specific compliance matters to the Committee. PwC and Freshfields provide other advice in their respective areas to the group. Considerations related to the Corporate Governance Code When setting the 2023 policy, the committee concluded that a scorecard-based approach to setting targets and measuring outcomes helps it to engage transparently with shareholders and the wider workforce on remuneration. Thus, bp continues to operate a simple, clear structure of market- aligned salary with annual and three-year performance-based incentives. Risks are managed through careful setting of performance measures and targets and the committee retains the exercise of its discretion in assessing outcomes. These are complemented with robust malus and clawback measures. Remuneration outcomes are predictable, as shown in the implementation charts of the 2023 policy, and proportional by virtue of the challenging performance levels required to achieve target pay outcomes. Through material weighting in measures related to safety, sustainability and strategy, as shown on page 123, remuneration aligns closely with bp’s culture, as expressed through our purpose and ambition.
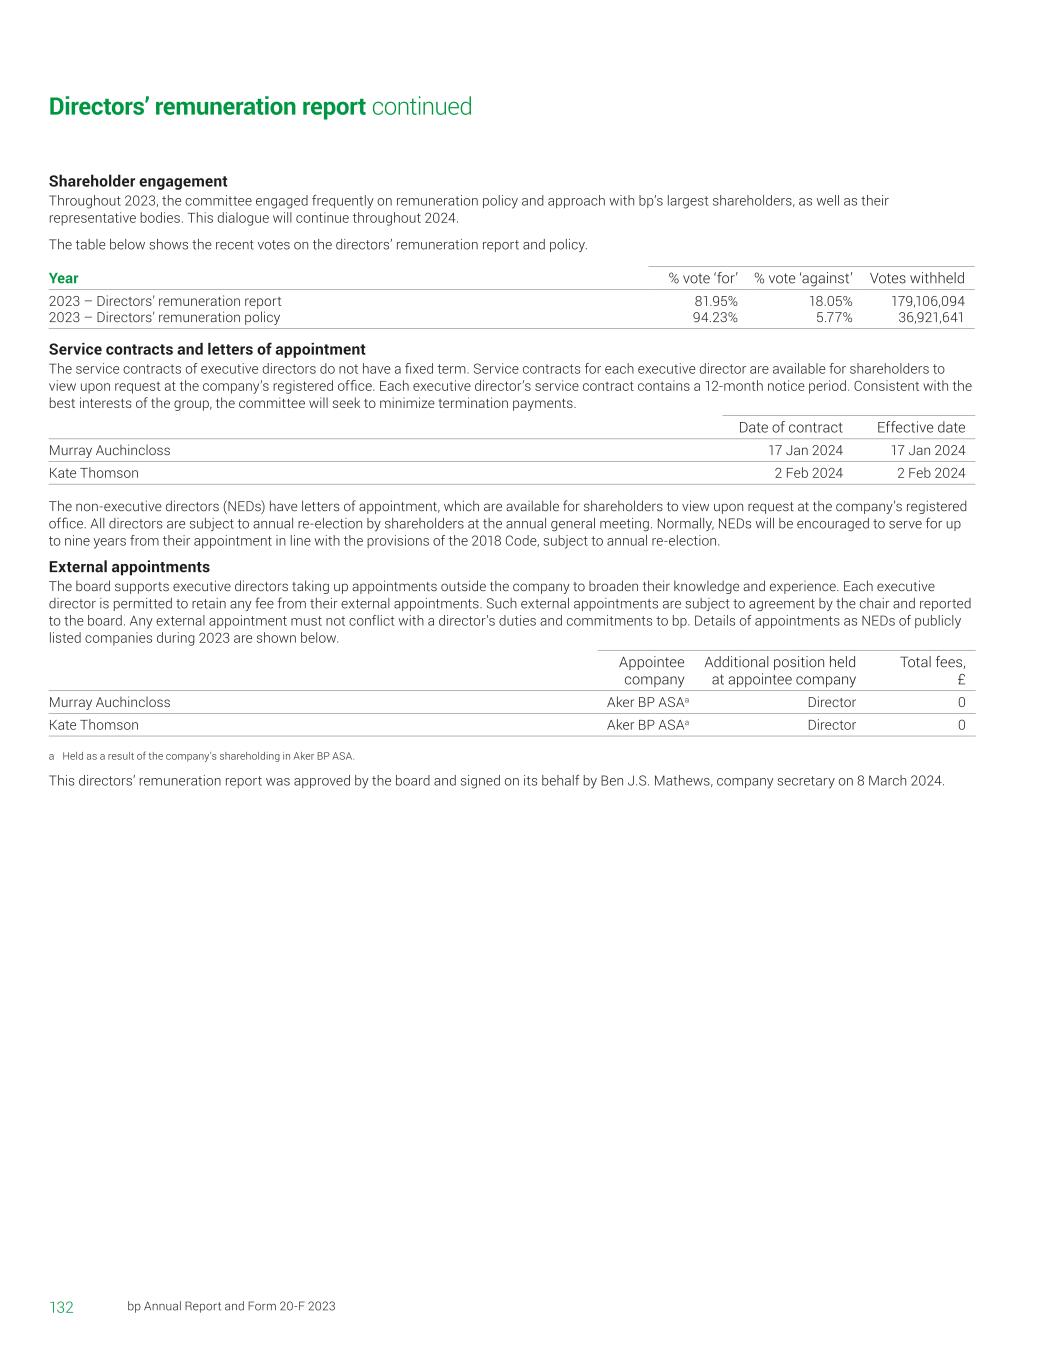
132 bp Annual Report and Form 20-F 2023 Shareholder engagement Throughout 2023, the committee engaged frequently on remuneration policy and approach with bp’s largest shareholders, as well as their representative bodies. This dialogue will continue throughout 2024. The table below shows the recent votes on the directors’ remuneration report and policy. Year % vote ‘for’ % vote ‘against’ Votes withheld 2023 – Directors’ remuneration report 81.95% 18.05% 179,106,094 2023 – Directors’ remuneration policy 94.23% 5.77% 36,921,641 Service contracts and letters of appointment The service contracts of executive directors do not have a fixed term. Service contracts for each executive director are available for shareholders to view upon request at the company’s registered office. Each executive director’s service contract contains a 12-month notice period. Consistent with the best interests of the group, the committee will seek to minimize termination payments. Date of contract Effective date Murray Auchincloss 17 Jan 2024 17 Jan 2024 Kate Thomson 2 Feb 2024 2 Feb 2024 The non-executive directors (NEDs) have letters of appointment, which are available for shareholders to view upon request at the company’s registered office. All directors are subject to annual re-election by shareholders at the annual general meeting. Normally, NEDs will be encouraged to serve for up to nine years from their appointment in line with the provisions of the 2018 Code, subject to annual re-election. External appointments The board supports executive directors taking up appointments outside the company to broaden their knowledge and experience. Each executive director is permitted to retain any fee from their external appointments. Such external appointments are subject to agreement by the chair and reported to the board. Any external appointment must not conflict with a director’s duties and commitments to bp. Details of appointments as NEDs of publicly listed companies during 2023 are shown below. Appointee company Additional position held at appointee company Total fees, £ Murray Auchincloss Aker BP ASAa Director 0 Kate Thomson Aker BP ASAa Director 0 a Held as a result of the company’s shareholding in Aker BP ASA. This directors’ remuneration report was approved by the board and signed on its behalf by Ben J.S. Mathews, company secretary on 8 March 2024. Directors’ remuneration report continued
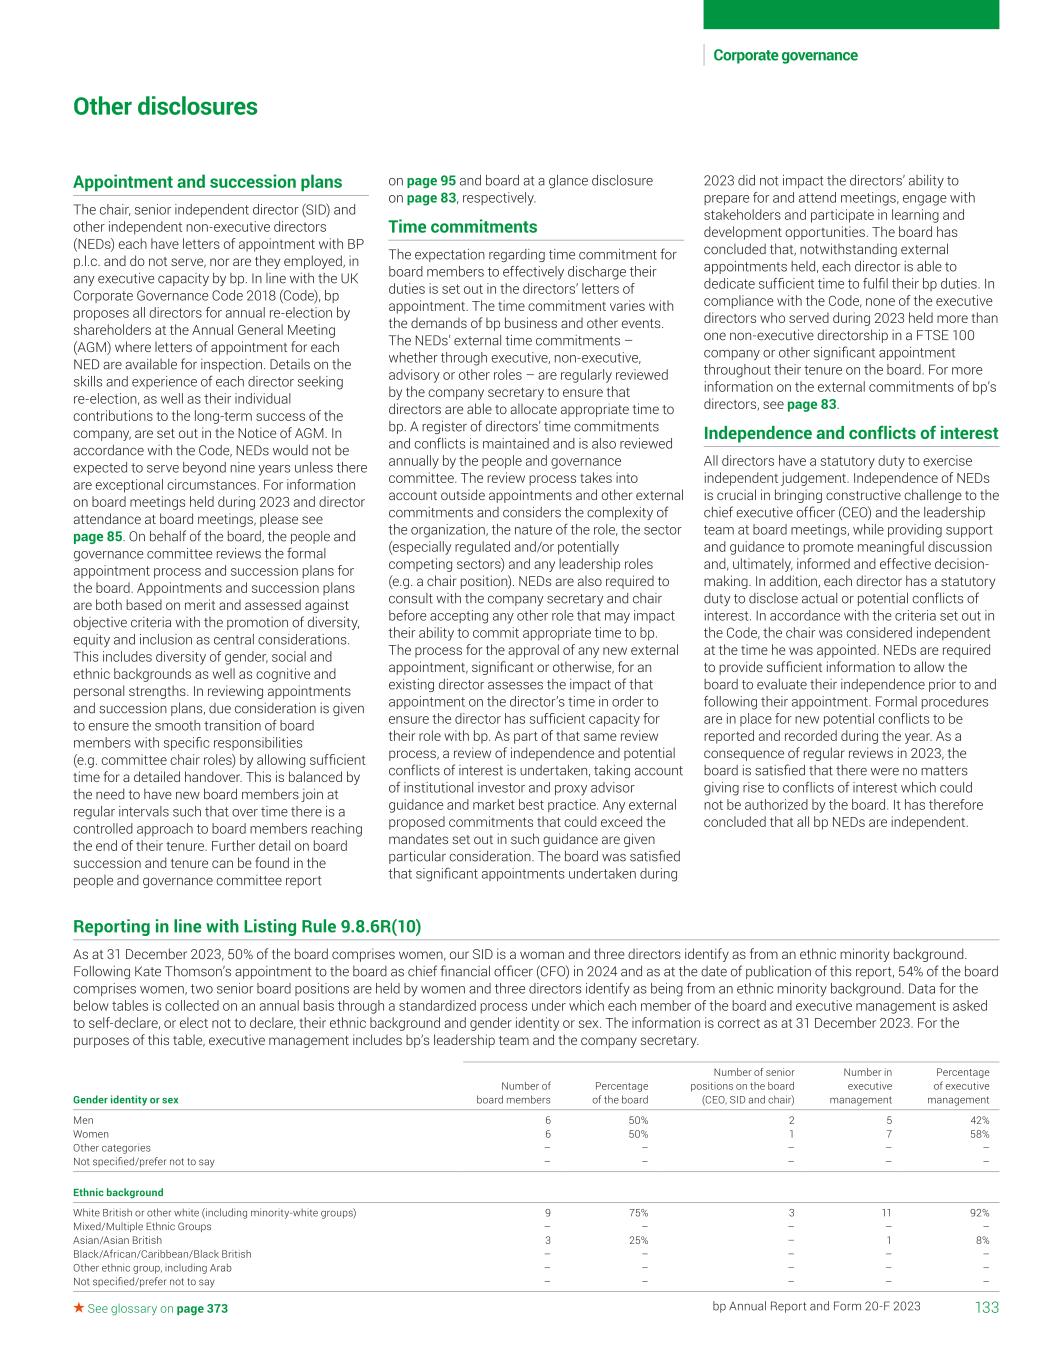
133bp Annual Report and Form 20-F 2023 Corporate governance See glossary on page 373 Other disclosures Appointment and succession plans The chair, senior independent director (SID) and other independent non-executive directors (NEDs) each have letters of appointment with BP p.l.c. and do not serve, nor are they employed, in any executive capacity by bp. In line with the UK Corporate Governance Code 2018 (Code), bp proposes all directors for annual re-election by shareholders at the Annual General Meeting (AGM) where letters of appointment for each NED are available for inspection. Details on the skills and experience of each director seeking re-election, as well as their individual contributions to the long-term success of the company, are set out in the Notice of AGM. In accordance with the Code, NEDs would not be expected to serve beyond nine years unless there are exceptional circumstances. For information on board meetings held during 2023 and director attendance at board meetings, please see page 85. On behalf of the board, the people and governance committee reviews the formal appointment process and succession plans for the board. Appointments and succession plans are both based on merit and assessed against objective criteria with the promotion of diversity, equity and inclusion as central considerations. This includes diversity of gender, social and ethnic backgrounds as well as cognitive and personal strengths. In reviewing appointments and succession plans, due consideration is given to ensure the smooth transition of board members with specific responsibilities (e.g. committee chair roles) by allowing sufficient time for a detailed handover. This is balanced by the need to have new board members join at regular intervals such that over time there is a controlled approach to board members reaching the end of their tenure. Further detail on board succession and tenure can be found in the people and governance committee report on page 95 and board at a glance disclosure on page 83, respectively. Time commitments The expectation regarding time commitment for board members to effectively discharge their duties is set out in the directors’ letters of appointment. The time commitment varies with the demands of bp business and other events. The NEDs’ external time commitments – whether through executive, non-executive, advisory or other roles – are regularly reviewed by the company secretary to ensure that directors are able to allocate appropriate time to bp. A register of directors’ time commitments and conflicts is maintained and is also reviewed annually by the people and governance committee. The review process takes into account outside appointments and other external commitments and considers the complexity of the organization, the nature of the role, the sector (especially regulated and/or potentially competing sectors) and any leadership roles (e.g. a chair position). NEDs are also required to consult with the company secretary and chair before accepting any other role that may impact their ability to commit appropriate time to bp. The process for the approval of any new external appointment, significant or otherwise, for an existing director assesses the impact of that appointment on the director’s time in order to ensure the director has sufficient capacity for their role with bp. As part of that same review process, a review of independence and potential conflicts of interest is undertaken, taking account of institutional investor and proxy advisor guidance and market best practice. Any external proposed commitments that could exceed the mandates set out in such guidance are given particular consideration. The board was satisfied that significant appointments undertaken during 2023 did not impact the directors’ ability to prepare for and attend meetings, engage with stakeholders and participate in learning and development opportunities. The board has concluded that, notwithstanding external appointments held, each director is able to dedicate sufficient time to fulfil their bp duties. In compliance with the Code, none of the executive directors who served during 2023 held more than one non-executive directorship in a FTSE 100 company or other significant appointment throughout their tenure on the board. For more information on the external commitments of bp’s directors, see page 83. Independence and conflicts of interest All directors have a statutory duty to exercise independent judgement. Independence of NEDs is crucial in bringing constructive challenge to the chief executive officer (CEO) and the leadership team at board meetings, while providing support and guidance to promote meaningful discussion and, ultimately, informed and effective decision- making. In addition, each director has a statutory duty to disclose actual or potential conflicts of interest. In accordance with the criteria set out in the Code, the chair was considered independent at the time he was appointed. NEDs are required to provide sufficient information to allow the board to evaluate their independence prior to and following their appointment. Formal procedures are in place for new potential conflicts to be reported and recorded during the year. As a consequence of regular reviews in 2023, the board is satisfied that there were no matters giving rise to conflicts of interest which could not be authorized by the board. It has therefore concluded that all bp NEDs are independent. Reporting in line with Listing Rule 9.8.6R(10) As at 31 December 2023, 50% of the board comprises women, our SID is a woman and three directors identify as from an ethnic minority background. Following Kate Thomson’s appointment to the board as chief financial officer (CFO) in 2024 and as at the date of publication of this report, 54% of the board comprises women, two senior board positions are held by women and three directors identify as being from an ethnic minority background. Data for the below tables is collected on an annual basis through a standardized process under which each member of the board and executive management is asked to self-declare, or elect not to declare, their ethnic background and gender identity or sex. The information is correct as at 31 December 2023. For the purposes of this table, executive management includes bp’s leadership team and the company secretary. Gender identity or sex Number of board members Percentage of the board Number of senior positions on the board (CEO, SID and chair) Number in executive management Percentage of executive management Men 6 50% 2 5 42% Women 6 50% 1 7 58% Other categories – – – – – Not specified/prefer not to say – – – – – Ethnic background White British or other white (including minority-white groups) 9 75% 3 11 92% Mixed/Multiple Ethnic Groups – – – – – Asian/Asian British 3 25% – 1 8% Black/African/Caribbean/Black British – – – – – Other ethnic group, including Arab – – – – – Not specified/prefer not to say – – – – –

134 bp Annual Report and Form 20-F 2023 PAGES 134-135 HAVE BEEN REMOVED AS THEY DO NOT FORM PART OF BP’S ANNUAL REPORT ON FORM 20-F AS FILED WITH THE SEC

135bp Annual Report and Form 20-F 2023 Corporate governance See glossary on page 373 PAGES 134-135 HAVE BEEN REMOVED AS THEY DO NOT FORM PART OF BP’S ANNUAL REPORT ON FORM 20-F AS FILED WITH THE SEC

136 bp Annual Report and Form 20-F 2023 THIS PAGE IS LEFT BLANK INTENTIONALLY
| Financial statements | |||||
| Consolidated financial statements of the bp group | ||||||||||||||||||||||||||||||||||||||
Independent auditor's reports (PCAOB ID | 157 | Group statement of changes in equity | ||||||||||||||||||||||||||||||||||||
| Group income statement | Group balance sheet | |||||||||||||||||||||||||||||||||||||
| Group statement of comprehensive income | Group cash flow statement | |||||||||||||||||||||||||||||||||||||
| Notes on financial statements | ||||||||||||||||||||||||||||||||||||||
| 1. | Significant accounting policies | 22. | Trade and other payables | |||||||||||||||||||||||||||||||||||
| 2. | Non-current assets held for sale | 23. | Provisions | |||||||||||||||||||||||||||||||||||
| 3. | Business combinations | 24. | Pensions and other post-retirement benefits | |||||||||||||||||||||||||||||||||||
| 4. | Disposals and impairment | |||||||||||||||||||||||||||||||||||||
| 5. | Segmental analysis | 25. | Cash and cash equivalents | |||||||||||||||||||||||||||||||||||
| 6. | Sales and other operating revenues | 26. | Finance debt | |||||||||||||||||||||||||||||||||||
| 7. | Income statement analysis | 27. | Capital disclosures and net debt | |||||||||||||||||||||||||||||||||||
| 8. | Exploration for and evaluation of oil and natural gas resources | 28. | Leases | |||||||||||||||||||||||||||||||||||
| 29. | Financial instruments and financial risk factors | |||||||||||||||||||||||||||||||||||||
| 9. | Taxation | |||||||||||||||||||||||||||||||||||||
| 10. | Dividends | 30. | Derivative financial instruments | |||||||||||||||||||||||||||||||||||
| 11. | Earnings per share | 31. | Called-up share capital | |||||||||||||||||||||||||||||||||||
| 12. | Property, plant and equipment | 32. | Capital and reserves | |||||||||||||||||||||||||||||||||||
| 13. | Capital commitments | 33. | Contingent liabilities and legal proceedings | |||||||||||||||||||||||||||||||||||
| 14. | Goodwill | 34. | Remuneration of senior management and non-executive directors | |||||||||||||||||||||||||||||||||||
| 15. | Intangible assets | |||||||||||||||||||||||||||||||||||||
| 16. | Investments in joint ventures | 35. | Employee costs and numbers | |||||||||||||||||||||||||||||||||||
| 17. | Investments in associates | 36. | Auditor's remuneration | |||||||||||||||||||||||||||||||||||
| 18. | Other investments | 37. | Subsidiaries, joint arrangements and associates | |||||||||||||||||||||||||||||||||||
| 19. | Inventories | |||||||||||||||||||||||||||||||||||||
| 20. | Trade and other receivables | 38. | Events after the reporting period | |||||||||||||||||||||||||||||||||||
| 21. | Valuation and qualifying accounts | |||||||||||||||||||||||||||||||||||||
| Supplementary information on oil and natural gas (unaudited) | ||||||||||||||||||||||||||||||||||||||
| Oil and natural gas exploration and production activities | Standardized measure of discounted future net cash flows and changes therein relating to proved oil and gas reserves | |||||||||||||||||||||||||||||||||||||
| Movements in estimated net proved reserves | ||||||||||||||||||||||||||||||||||||||
| Operational and statistical information | ||||||||||||||||||||||||||||||||||||||
| bp Annual Report and Form 20-F 2023 | 137 | |||||||||||||
Consolidated financial statements of the bp group
Pages 138-156 have been removed as they do not form part of bp's Annual Report on Form 20-F as filed with the SEC.
This page does not form part of bp's Annual Report on Form 20-F as filed with the SEC.
138 | bp Annual Report and Form 20-F 2023 | |||||||||||||
| Financial statements | |||||
Report of Independent Registered Public Accounting Firm
To the shareholders and board of directors of BP p.l.c.
Opinion on the financial statements
We have audited the accompanying consolidated group balance sheets of BP p.l.c. and subsidiaries (together ‘bp’ or ‘the group’) as at 31 December 2023 and 2022, the related consolidated group income statements, group statements of comprehensive income, group statements of changes in equity and group cash flow statements, for each of the three years in the period ended 31 December 2023, and the related notes (collectively referred to as the ‘financial statements’). In our opinion, the financial statements present fairly, in all material respects, the financial position of the group as at 31 December 2023 and 2022, and the results of its operations and its cash flows for each of the three years in the period ended 31 December 2023, in accordance with United Kingdom adopted international accounting standards and International Financial Reporting Standards (IFRSs) as issued by the International Accounting Standards Board (IASB) and as adopted by the European Union (EU).
We have also audited, in accordance with the standards of the Public Company Accounting Oversight Board (United States) (PCAOB), bp's internal control over financial reporting as of 31 December 2023, based on criteria established in the UK Financial Reporting Council’s Guidance on Risk Management, Internal Control and Related Financial and Business reporting relating to internal control over financial reporting and our report dated 8 March 2024 expressed an unqualified opinion on bp's internal control over financial reporting.
Basis for opinion
These financial statements are the responsibility of bp’s management. Our responsibility is to express an opinion on bp’s financial statements based on our audits. We are a public accounting firm registered with the PCAOB and are required to be independent with respect to bp in accordance with the U.S. federal securities laws and the applicable rules and regulations of the Securities and Exchange Commission and the PCAOB.
We conducted our audits in accordance with the standards of the PCAOB. Those standards require that we plan and perform the audit to obtain reasonable assurance about whether the financial statements are free of material misstatement, whether due to error or fraud. Our audits included performing procedures to assess the risks of material misstatement of the financial statements, whether due to error or fraud, and performing procedures that respond to those risks. Such procedures included examining, on a test basis, evidence regarding the amounts and disclosures in the financial statements. Our audits also included evaluating the accounting principles used and significant estimates made by management, as well as evaluating the overall presentation of the financial statements. We believe that our audits provide a reasonable basis for our opinion.
Critical Audit Matters
The critical audit matters communicated below are matters arising from the current-period audit of the financial statements that were communicated or required to be communicated to the audit committee and that (1) relate to accounts or disclosures that are material to the financial statements and (2) involved our especially challenging, subjective, or complex judgments. The communication of critical audit matters does not alter in any way our opinion on the financial statements, taken as a whole, and we are not, by communicating the critical audit matters below, providing separate opinions on the critical audit matters or on the accounts or disclosures to which they relate.
1.Impairment of upstream oil and gas property, plant and equipment (PP&E) assets – Notes 1, 4 and 12 to the financial statements
Critical Audit Matter Description
The group balance sheet as at 31 December 2023 includes PP&E, of which $62 billion is oil and gas properties.
Management’s best estimate of oil and gas price assumptions for value-in-use impairment tests were revised in 2023 as set out in Note 1 on page 177. Brent oil price and Henry Hub assumption revisions during 2023 were not significant. Management has also revised bp’s ‘best estimate’ discount rate assumptions for value-in-use impairment tests in 2023, as set out in Note 1 on page 177. bp’s post-tax nominal weighted average cost of capital, being the starting point for setting discount rates used for impairment testing for oil and gas assets, has increased to 8%, reflecting the impact of observable increases in risk free rates on bp’s weighted average cost of capital.
Given the significance of the discount rate assumption revisions during 2023, alongside certain CGU specific new indicators, management has tested all oil and gas CGUs for impairment and/or impairment reversal during the year. Management recorded $3.6 billion of pre-tax oil and gas CGU impairment charges, principally due to the discount rate revisions detailed above, price revisions, increase in certain capital expenditure forecasts, operating expenditure forecasts and certain reserves write downs. Further information has been provided in Note 1 on page 177 and Note 4 on page 191.
We identified three key management estimates in management’s determination of the level of impairment charge and/or impairment reversal. These are:
Oil and gas prices - bp’s oil and gas price assumptions have a significant impact on many CGU impairment assessments performed across the OP&O and G&LCE segments and are inherently uncertain. The estimation of future prices is subject to increased uncertainty given climate change, the global energy transition, macro-economic factors and disruption in global supply due to ongoing geo-political conflicts. There is a risk that management do not forecast reasonable ‘best estimate’ oil and gas price forecasts when assessing CGUs for impairment charge and/or impairment reversal, leading to material misstatements. These price assumptions are highly judgmental and are pervasive inputs to bp’s oil and gas CGU valuations. There is also a risk that management’s oil and gas price related disclosures are not reasonable.
Discount rates - Given the long timeframes involved, certain CGU impairment assessments are sensitive to the discount rate applied. Discount rates should reflect the return required by the market and the risks inherent in the cash flows being discounted. There is a risk that management does not assume reasonable discount rates, adjusted as applicable for country risks and relevant tax rates, leading to material misstatements. Determining a reasonable discount rate is highly judgmental and, consistent with price assumptions above, the discount rate assumption is also a pervasive input across bp’s oil and gas CGU valuations, before adjustments for asset specific risks and tax rates.
| bp Annual Report and Form 20-F 2023 | 157 | |||||||||||||
Reserves and resources estimates - A key input to certain CGU impairment assessments is the oil and gas production forecast, which is based on underlying reserves estimates and field specific development assumptions. Certain CGU production forecasts include specific risk adjusted resource volumes, in addition to proven and/or probable reserves estimates, that are inherently less certain than reserves; and assumptions related to these volumes can be particularly judgemental. There is a risk that material misstatements could arise from unreasonable production forecasts for individually material CGUs and/or from the aggregation of systematic flaws in bp’s reserves and resources estimation policies across the OP&O and G&LCE segments.
We identified certain individual CGUs which we determined would be most at risk of material impairment charges as a result of a reasonably possible change in the oil and gas price assumptions. This population includes previously impaired assets which are also at risk of material impairment reversal resulting from potential oil and gas price assumption changes. We identified that a subset of these CGUs was also individually materially sensitive to the discount rate assumption.
We also identified CGUs which were less sensitive as they would be potentially at risk, in aggregate, to a material impairment by a reasonably possible change in some or all of the key assumptions. No impairment reversals are available for these CGUs. Further information regarding these sensitivities is given in Note 1 on page 178.
Impairment charge and/or impairment reversal assessments of upstream oil and gas PP&E assets remain a critical audit matter because recoverable values are reliant on forecasts that are inherently judgemental and complex for management to estimate, and the magnitude of the potential misstatement risk is material to the group.
How the Critical Audit Matter was addressed in the Audit
We tested relevant internal controls over the estimation of oil and gas prices, discount rates, and reserve and resources estimates, as well as key internal controls over the performance of the impairment charge and/or impairment reversal assessments where we identified audit risks. In addition, we conducted the following substantive procedures.
Oil and gas prices
•We independently developed a reasonable range of forecasts based on external data obtained, against which we compared management’s oil and gas price assumptions in order to challenge whether they are reasonable.
•In developing this range, we obtained a variety of reputable and reliable third party forecasts, peer information and other relevant market data.
•In challenging management’s price assumptions, we considered the extent to which they and each of the forecast pricing scenarios obtained from third parties reflect the impact of lower oil and gas demand due to climate change and the energy transition.
•The 2015 Conference of the Parties (CoP) 21 Paris Agreement goals of ‘holding the increase in the global average temperature to well below 2°C above pre-industrial levels and pursuing efforts to limit the temperature increase to 1.5°C above pre-industrial levels’ was reaffirmed at CoP 28 in Dubai during December 2023. We specifically analysed third party forecasts stated, or interpreted by us, as being consistent with scenarios achieving the Paris ‘well below 2°C goal’ and/or ‘1.5°C ambition’ and evaluated whether they presented contradictory audit evidence.
•We assessed management’s disclosures in Notes 1, including the sensitivity of forecast revenue cash inflows to lower oil and gas prices and how climate change and the energy transition, potential future emissions costs and/or reduced demand scenarios may impact bp to a greater extent than currently anticipated in bp’s value-in-use estimates for oil and gas CGUs.
Discount rates
•We independently evaluated bp’s discount rates used in impairment tests with input from our valuation specialists, against relevant third party market and peer data.
•When performing procedures over specific assets, we assessed whether specific country risks and tax adjustments were reasonably reflected in bp’s discount rates.
•We challenged and evaluated management’s disclosures in Notes 1, including in relation to the sensitivity of discount rate assumptions.
Reserves and resources estimates
With the assistance of our oil and gas reserves specialists we:
•assessed bp’s reserves and resources estimation methods and policies for reasonableness
•assessed how these policies had been applied to a sample of bp’s reserves and resources estimates
•read and evaluated a sample of reports provided by management’s external reserves experts and assessed the scope of work and findings of these third parties
•assessed the competence, capabilities and objectivity of bp’s internal and external reserve experts, through understanding their relevant professional qualifications and experience
•assessed whether management’s production forecasts are consistent overall with bp’s strategy, including the group’s expectation to reduce its hydrocarbon production (by around 25% by 2030 relative to 2019 - see page 171)
•compared the production forecasts used in the impairment tests with management’s approved reserves and resources estimates and
•performed a retrospective assessment in order to assess management's ability to accurately estimate reserves and resources and to check for indications of estimation bias over time.
2.Decommissioning provisions – Notes 1 and 23
Critical Audit Matter Description
A decommissioning provision of $12.4 billion is recorded in the financial statements as at 31 December 2023. The estimation of decommissioning provisions is a highly judgemental area as it involves a number of key estimates related to the cost and timing of decommissioning, in particular inflation and discount rate assumptions. Given management expects upstream hydrocarbon production to be around 25% lower by 2030 relative to 2019 as stated on page 171, consistency of that expectation with the timing of decommissioning expenditure and underlying cost assumptions remains a key consideration.
Consistent with prior years, management estimates that the average rate of forecast inflation applicable to the substantial majority of bp’s decommissioning cost estimates is 1.5%, which is 0.5% lower than its estimated long term general inflation rate of 2%.
158 | bp Annual Report and Form 20-F 2023 | |||||||||||||
| Financial statements | |||||
The estimated undiscounted cost of the obligations and the timing of future payment are set out in Note 1 on page 184. Economic factors, future activities and the legislative environments that bp operates in are used to inform cost estimates, whereas the timing of decommissioning activities is dependent on cessation of production (CoP) dates, which are sensitive to changes in bp’s price forecasts as price estimates determine economic cut off of oil and gas reserve estimates.
bp increased its discount rate used in calculating its decommissioning provisions from 3.5% as at 31 December 2022 to 4.0% as at 31 December 2023. The increase was primarily driven by the increased US treasury bond rates.
Provisions for decommissioning refining assets, not generally recognised on the basis that the potential obligations cannot be measured given their indeterminate settlement dates, might need to be recognised if reductions in demand due to climate change curtail their operational lives. As disclosed in Note 1 on page 184 management concluded that, although obligations may arise if refineries cease manufacturing operations, they would only be recognised at the point when sufficient information became available to determine potential settlement dates. Accordingly, other than where a decision has been made to cease refining operations, no triggers for assessing the need to record a decommissioning provision have been identified.
How the Critical Audit Matter was addressed in the Audit
Long term Inflation rate
•We tested the control related to the determination of the decommissioning specific inflation rate assumption.
•We tested how management derived the decommissioning specific inflation rate assumption of 1.5%, and the evidence on which it is based, by gaining an understanding of the process used by management, testing management’s calculations of the assumption, and evaluating the evidence relevant to management’s assumption, both supporting and contradictory.
•As the 1.5% decommissioning specific inflation rate assumption is determined by making an adjustment to management’s 2.0% general long term inflation rate assumption, we evaluated the general long term inflation rate assumption used of 2.0%, comparing it against latest external market data.
•We made inquiries and evaluated the competence, capabilities and objectivity, of management’s decommissioning experts who derived the decommissioning specific inflation rate.
•We inspected analyst forecasts and reports in respect of the future decommissioning market and related costs for evidence of supporting and contradictory evidence, with particular focus on the future rig market.
•We particularly considered the expectation that demand for oil and gas products and related activities will decrease, primarily in response to climate change and energy transition effects pivoting future energy industry investment and development activity towards renewable sources. We challenged and evaluated management’s assessment of the impact this will have on the decommissioning market and related inflation assumption.
•We analysed historical trends of rig market rates against oil prices and historical inflation to challenge management’s assumption that the decommissioning inflation assumption does not inflate at the same rate as general inflation.
Cost and timing estimates
•We tested the controls over the year end decommissioning cost and timing assumptions used within management’s decommissioning provision estimate.
•We assessed the completeness and accuracy of the assets subject to decommissioning, including understanding the process to establish whether a legal or constructive obligation existed.
•We evaluated changes in key cost assumptions including rig rates, vessel rates, well plug and abandonment duration and non-productive time assumptions.
•We challenged whether the impact of inflation experienced in 2023 was appropriately considered and reflected where relevant within bp’s cost assumptions.
•We assessed the reasonableness of key cost assumptions with reference to internal and appropriate third party data.
•We assessed changes in assumptions for the estimated date of decommissioning and evaluated whether CoP dates used for decommissioning estimation are aligned with CoP assumptions in other areas, including PP&E impairment testing and oil and gas reserve estimation.
•We assessed the accuracy of bp’s disclosure of the estimated undiscounted cost of its obligations and the timing of future decommissioning payments.
Discount rates
•We tested the control related to the determination of the discount rate assumption.
•We assessed the reasonableness of management’s methodology for determining the discount rate and recalculated the discount rate with reference to independent third party data, most notably US treasury bond yields.
Potential decommissioning of refinery assets
•We challenged and evaluated management’s analysis which supported the judgement that no decommissioning provisions should be recognised in respect of refineries where there is ongoing activity and management has no current intention to cease these activities.
•We have reviewed analysis undertaken by management, as well as third party studies, of forecast demand for refined products in regions served by bp’s refineries. Furthermore, we read external profitability benchmarking which supported a conclusion that the group’s remaining refineries would likely remain operational for longer than many of their regional competitors, in the event of refining capacity reductions.
•We also met with refinery management to understand the potential plans under consideration for refineries in the future and obtained evidence that management is developing plans for the existing refinery sites remaining in the portfolio which would be compatible with net zero emissions, for instance through the production of alternative low carbon and sustainable fuels.
| bp Annual Report and Form 20-F 2023 | 159 | |||||||||||||
3. Accounting for complex transactions executed to deliver against the wider group strategy - Notes 1, 20, 22, 29 and 30 to the financial statements
Critical Audit Matter Description
To support the overall group strategy, which includes achieving bp's 'net zero' target, bp is increasingly entering into long term arrangements that include gas and renewable power offtake/supply contracts in existing and new markets whilst providing solutions to bp’s customers through offering lower carbon hydrocarbons. Given the nature of these transactions, we direct significant audit effort towards challenging management’s adopted accounting treatment and/or valuation estimates.
In previous years, such activity was primarily carried out within the trading and shipping (T&S) function. However, such activity can also originate outside of T&S, across segments, functions and/or geographies but in close collaboration with T&S.
These transactions may be complex and have sustainability, legal, tax or financial reporting outcomes which are new for the group and may be executed in reference to, or in conjunction with, existing arrangements. Determining the appropriate accounting treatment for these transactions can require a high degree of management judgement.
Determining the appropriate accounting treatment for these complex transactions:
Based on our risk assessment and understanding of the underlying business rationale of such transactions, we generally consider that complexity arises where the arrangements exhibit one or more of the following indicators:
•Offtake/sale-purchase agreements where the group is the only key customer/supplier;
•The counterparty or the arrangement depends on the group to provide a significant level of financing;
•The group controls exclusive rights, licenses, technology, know-how etc. without which the counterparty cannot conduct its operations or the arrangement cannot be fulfilled;
•The arrangement exposes the group to returns/losses which are disproportionate to those which its economic interest would suggest;
•Contractual arrangements entered into in contemplation of each other; or
•The transaction or arrangement directly impacts key performance indicators, in particular, finance debt.
The presence of any one or a combination of these indicators does not make a transaction or arrangement inherently complex but are factors we consider in our assessment of the risk arising from the transaction.
Accounting for such transactions can be complex and can involve significant judgement, as a feature of these transactions is that they often include multiple elements that will have a material impact on the presentation and disclosure in the financial statements, including in particular the classification of liabilities as finance debt.
How the Critical Audit Matter was addressed in the Audit
For complex accounting transactions identified during the year, we:
•Tested controls related to the accounting for complex transactions.
•Developed an understanding of the commercial rationale of the transactions through discussions with management and reading transaction documents and executed agreements.
•For transactions exhibiting certain of the above indicators, performed a detailed accounting analysis leveraging the expertise of technical accounting specialists with experience in commodities markets.
160 | bp Annual Report and Form 20-F 2023 | |||||||||||||
| Financial statements | |||||
4. Valuation of commodity financial derivatives, where fraud risks may arise in revenue recognition - Notes 1, 29 and 30 to the financial statements
Critical Audit Matter Description
bp’s trading and shipping (T&S) function is responsible for globally trading and risk managing the group’s owned as well as third party production. To discharge this responsibility, T&S regularly executes commodity contracts, physically settled or otherwise, which are accounted for as a derivative and fair valued under IFRS 9. These contracts, therefore, result in unrealised gains/losses that are recognised on account of fair value movements in the associated derivative assets and liabilities.
Determining the fair value of derivative assets and liabilities can be complex and subjective, particularly where the valuation is dependent on significant inputs which are not observable and are classified as level 3 in the fair value hierarchy set out in IFRS 13. This degree of subjectivity also makes such fair value estimates prone to potential fraud by management incorporating bias in the inputs used in determining fair values. Given the significant judgements, sensitivity to management assumptions, and the absolute value associated with these positions, we have identified a risk in respect of certain financial instruments where the valuation is dependent on significant unobservable inputs.
Fair value measurements associated with unrealised commodity contracts are also impacted by the macroeconomic sentiment and outlook. In 2023, commodity markets remained relatively volatile due to continuing uncertainty resulting from the planned energy transition, macro-economic factors such as inflation and interest rates, and disruptions in global supply due to geopolitical conflicts. In response to the volatility observed, we focused our audit efforts on the valuation of all commodity derivatives and designed procedures specifically to test for management bias.
As at 31 December 2023, the group’s total level 3 derivative financial assets were $9.2 billion and level 3 derivative financial liabilities were $7.1 billion.
How the Critical Audit Matter was addressed in the Audit
In response to the above, we analysed the population of these instruments to assess the level of unobservability of the inputs used in their valuation and then further disaggregated the population into different risk populations which in turn drove the nature, timing and extent of our audit procedures.
To address the complexities associated with auditing the valuation of instruments dependent on significant unobservable inputs, we included valuation specialists with significant quantitative and modelling expertise to assist in performing our audit procedures. Our valuation audit included the following control and substantive procedures:
•We tested the group’s valuation controls including:
–the model certification control, which is designed to review a model’s theoretical soundness and the appropriateness of its valuation methodology; and
–the independent price verification control, which is designed to review the appropriateness of valuation inputs that are not observable and are significant to the financial instrument’s valuation.
•We performed valuation testing procedures at interim and year-end balance sheet dates, including:
–comparing management’s input assumptions against the expected assumptions of other market participants and observable market data;
–evaluating management’s valuation methodologies against standard valuation practice and analysing whether a consistent framework is applied across the business period over period; and
–engaging our valuation specialists to challenge models, develop fair value estimates and evaluate consistency in management’s modelling and input assumptions throughout the year.
| bp Annual Report and Form 20-F 2023 | 161 | |||||||||||||
5. Impairment of E&A assets, investments in joint ventures and refinery PP&E as a consequence, among other things, of climate change and the energy transition – Notes 1, 4, 15 and 16
Critical Audit Matter Description
Intangible Assets
The recoverability of certain of the group’s $4.3 billion total exploration and appraisal (E&A) assets capitalised as at 31 December 2023 is potentially exposed to climate change and the global energy transition risk factors (see Note 15). This is because a greater number of E&A projects may not proceed as a consequence of the energy transition leading to lower forecast future oil and gas prices, and bp’s intention to reduce its hydrocarbon production (by around 25% by 2030 relative to 2019 – see page 171). The determination of whether and when E&A costs should be written off, impaired, or retained on the balance sheet as E&A assets, remains complex and continues to require significant management judgement.
PP&E and Investment in joint ventures
The carrying value of bp’s refining assets within PP&E may no longer be recoverable, due to changes in supply and demand which arise as a consequence of climate change and the energy transition. Management identified impairment indicators in respect of the Gelsenkirchen refinery during the year and as a result, an impairment test was performed to assess the recoverability of the refinery carrying value. As disclosed in Note 4 to the accounts on page 192, management has recorded an impairment charge of $1.3 billion in respect of the Gelsenkirchen refinery in Germany, primarily driven by changes in economic assumptions.
There is also a risk that the carrying value of the group’s investments in low carbon energy assets may no longer be recoverable due to an increase in the low carbon energy discount rate (the renewable power assets discount rate) as well as increased project development costs, which have been impacted by higher inflation and activity levels within the sector (as a result of the energy transition). These factors are adversely impacting the value of low carbon energy projects, impacting investment decisions. As a result, impairment tests(which include judgements in relation to the fair value of land and sea bed leases, capital and operating cost assumptions and forecast yield and power price assumptions) were performed to assess the recoverability of the group’s low carbon energy assets, resulting in an impairment recognised by equity accounted entities of $1.3 billion, as disclosed in Note 16 to the accounts on page 208.
How the Critical Audit Matter Was Addressed in the Audit
A climate change steering committee comprising a group of senior partners and specialists with specific climate change and technical audit and accounting expertise within Deloitte was utilised to provide an independent challenge to our key decisions and conclusions with respect to this area.
Intangible Assets
In respect of the recoverability of E&A assets capitalised as at 31 December 2023:
•We tested the relevant controls within the group’s E&A write-off and impairment assessment processes.
•We challenged and evaluated management’s key E&A judgements with regards to the impairment criteria of IFRS 6. Where impairment indicators were identified we corroborated key judgements with internal and external evidence for assets that remained on the balance sheet. This included analysing evidence of future E&A plans, budgets and capital allocation decisions, assessing management’s key accounting judgement papers, reading meeting minutes and assessing licence documentation and evidence of active dialogue with partners and regulators including negotiations to renew licences or modify key terms.
PP&E and Investment in joint ventures
We considered the impact of potential changes in supply and demand on the group’s refining portfolio and assessed internal and external market studies of future supply and demand. In relation to the Gelsenkirchen refinery impairment test, we assessed the valuation methodology, tested the integrity and mechanical accuracy of the impairment model and assessed the appropriateness of key assumptions and inputs, notably forecast refining margins and energy input costs, challenging and evaluating management’s assumptions by reference to third party data where available. We also evaluated management’s ability to forecast future cash flows and margins by comparing actual results to historical forecasts and tested management’s internal controls over the impairment test and related inputs.
In respect of the impairment tests performed on certain offshore wind asset low carbon energy investments, we tested the result by:
•Testing the relevant controls over these low carbon energy impairment tests including controls over key assumptions and the discount rate
•Assessing the low carbon energy discount rate with input from our valuation specialists
•Challenging and evaluating the key assumptions within the impairment tests. This included the fair value of land and sea bed leases, capital and operating cost assumptions and forecast yield and power price assumptions impacting the fair value of the development project, and
•Testing the mechanical accuracy of the impairment models.
/s/ Deloitte LLP
London
United Kingdom
8 March 2024
We have served as bp’s auditor since 2018.
162 | bp Annual Report and Form 20-F 2023 | |||||||||||||
| Financial statements | |||||
Report of Independent Registered Public Accounting Firm
To the shareholders and board of directors of BP p.l.c.
Opinion on internal control over financial reporting
We have audited the internal control over financial reporting of BP p.l.c. and its subsidiaries (the group) as of 31 December 2023, based on the criteria established in the UK Financial Reporting Council’s Guidance on Risk Management, Internal Control and Related Financial and Business Reporting relating to internal control over financial reporting (UK FRC Guidance). In our opinion, the group maintained, in all material respects, effective internal control over financial reporting as of 31 December 2023, based on the criteria established in the UK FRC Guidance.
We have also audited, in accordance with the standards of the Public Company Accounting Oversight Board (United States) (PCAOB), the consolidated financial statements as at and for the year ended 31 December 2023, of the group and our report dated 8 March 2024 expressed an unqualified opinion on those financial statements.
As described in management’s report on internal control over financial reporting, management excluded from its assessment the internal control over financial reporting at ‘TravelCenters of America Inc.’ (TCA) which was acquired on 15 May 2023. TCA’s financial statements constitute 2.1% and 1.5% of net and total assets, respectively, 2.8% of ’Sales and other operating revenues’, and 4% of ‘profit (loss) for the year’ of the consolidated financial statement amounts as of and for the year ended 31 December 2023. Accordingly, our audit did not include the internal control over financial reporting at TCA.
Basis for opinion
The Group’s management is responsible for maintaining effective internal control over financial reporting and for its assessment of the effectiveness of internal control over financial reporting, included in the accompanying Management’s report on internal control over financial reporting. Our responsibility is to express an opinion on the group’s internal control over financial reporting based on our audit. We are a public accounting firm registered with the PCAOB and are required to be independent with respect to the group in accordance with the U.S. federal securities laws and the applicable rules and regulations of the Securities and Exchange Commission and the PCAOB.
We conducted our audit in accordance with the standards of the PCAOB. Those standards require that we plan and perform the audit to obtain reasonable assurance about whether effective internal control over financial reporting was maintained in all material respects. Our audit included obtaining an understanding of internal control over financial reporting, assessing the risk that a material weakness exists, testing and evaluating the design and operating effectiveness of internal control based on the assessed risk, and performing such other procedures as we considered necessary in the circumstances. We believe that our audit provides a reasonable basis for our opinion.
Definition and limitations of internal control over financial reporting
A company’s internal control over financial reporting is a process designed to provide reasonable assurance regarding the reliability of financial reporting and the preparation of financial statements for external purposes in accordance with generally accepted accounting principles. A company’s internal control over financial reporting includes those policies and procedures that (1) pertain to the maintenance of records that, in reasonable detail, accurately and fairly reflect the transactions and dispositions of the assets of the company; (2) provide reasonable assurance that transactions are recorded as necessary to permit preparation of financial statements in accordance with generally accepted accounting principles, and that receipts and expenditures of the company are being made only in accordance with authorizations of management and directors of the company; and (3) provide reasonable assurance regarding prevention or timely detection of unauthorized acquisition, use, or disposition of the company’s assets that could have a material effect on the financial statements.
Because of its inherent limitations, internal control over financial reporting may not prevent or detect misstatements. Also, projections of any evaluation of effectiveness to future periods are subject to the risk that controls may become inadequate because of changes in conditions, or that the degree of compliance with the policies or procedures may deteriorate.
/s/ Deloitte LLP
8 March 2024
| bp Annual Report and Form 20-F 2023 | 163 | |||||||||||||
Group income statement
| For the year ended 31 December | $ million | ||||||||||||||||
| Note | 2023 | 2022 | 2021 | ||||||||||||||
| Sales and other operating revenues | 6 | ||||||||||||||||
| Earnings from joint ventures – after interest and tax | 16 | ||||||||||||||||
| Earnings from associates – after interest and tax | 17 | ||||||||||||||||
| Interest and other income | 7 | ||||||||||||||||
| Gains on sale of businesses and fixed assets | 4 | ||||||||||||||||
| Total revenues and other income | |||||||||||||||||
| Purchases | 19 | ||||||||||||||||
| Production and manufacturing expenses | |||||||||||||||||
| Production and similar taxes | 5 | ||||||||||||||||
| Depreciation, depletion and amortization | 5 | ||||||||||||||||
| Net impairment and losses on sale of businesses and fixed assets | 4 | ( | |||||||||||||||
| Exploration expense | 8 | ||||||||||||||||
| Distribution and administration expenses | |||||||||||||||||
| Profit (loss) before interest and taxation | |||||||||||||||||
| Finance costs | 7 | ||||||||||||||||
| Net finance (income) expense relating to pensions and other post-retirement benefits | 24 | ( | ( | ( | |||||||||||||
| Profit (loss) before taxation | |||||||||||||||||
| Taxation | 9 | ||||||||||||||||
| Profit (loss) for the year | ( | ||||||||||||||||
| Attributable to | |||||||||||||||||
| bp shareholders | ( | ||||||||||||||||
| Non-controlling interests | |||||||||||||||||
| ( | |||||||||||||||||
| Earnings per share | |||||||||||||||||
| Profit (loss) for the year attributable to bp shareholders | |||||||||||||||||
| Per ordinary share (cents) | |||||||||||||||||
| Basic | 11 | ( | |||||||||||||||
| Diluted | 11 | ( | |||||||||||||||
| Per ADS (dollars) | |||||||||||||||||
| Basic | 11 | ( | |||||||||||||||
| Diluted | 11 | ( | |||||||||||||||
164 | bp Annual Report and Form 20-F 2023 | |||||||||||||
| Financial statements | |||||
Group statement of comprehensive incomea
| For the year ended 31 December | $ million | ||||||||||||||||
| Note | 2023 | 2022 | 2021 | ||||||||||||||
| Profit (loss) for the year | ( | ||||||||||||||||
| Other comprehensive income | |||||||||||||||||
| Items that may be reclassified subsequently to profit or loss | |||||||||||||||||
| Currency translation differences | ( | ( | |||||||||||||||
Exchange (gains) losses on translation of foreign operations reclassified to gain or loss on sale of businesses and fixed assets | ( | ||||||||||||||||
| Cash flow hedges marked to market | 30 | ( | ( | ||||||||||||||
| Cash flow hedges reclassified to the income statement | 30 | ( | |||||||||||||||
| Costs of hedging marked to market | 30 | ( | ( | ||||||||||||||
| Costs of hedging reclassified to the income statement | 30 | ( | |||||||||||||||
| Share of items relating to equity-accounted entities, net of tax | 16, 17 | ( | |||||||||||||||
| Income tax relating to items that may be reclassified | 9 | ( | ( | ||||||||||||||
| ( | |||||||||||||||||
| Items that will not be reclassified to profit or loss | |||||||||||||||||
Remeasurements of the net pension and other post-retirement benefit liability or asset | 24 | ( | |||||||||||||||
| Remeasurements of equity investments | |||||||||||||||||
| Cash flow hedges that will subsequently be transferred to the balance sheet | 30 | ( | |||||||||||||||
| Income tax relating to items that will not be reclassified | 9 | ( | |||||||||||||||
| ( | |||||||||||||||||
| Other comprehensive income | ( | ||||||||||||||||
| Total comprehensive income | |||||||||||||||||
| Attributable to | |||||||||||||||||
| bp shareholders | |||||||||||||||||
| Non-controlling interests | |||||||||||||||||
aSee Note 32 for further information.
| bp Annual Report and Form 20-F 2023 | 165 | |||||||||||||
Group statement of changes in equitya
| $ million | ||||||||||||||||||||||||||||||||
| Share capital and capital reserves | Treasury shares | Foreign currency translation reserve | Fair value reserves | Profit and loss account | bp shareholders' equity | Non-controlling interests | Total equity | |||||||||||||||||||||||||
| Hybrid bonds | Other interest | |||||||||||||||||||||||||||||||
| At 1 January 2023 | ( | ( | ( | |||||||||||||||||||||||||||||
| Profit for the year | — | — | — | — | ||||||||||||||||||||||||||||
| Other comprehensive income | — | — | ( | ( | — | ( | ||||||||||||||||||||||||||
| Total comprehensive income | — | — | ||||||||||||||||||||||||||||||
Dividendsb | — | — | — | — | ( | ( | — | ( | ( | |||||||||||||||||||||||
Cash flow hedges transferred to the balance sheet, net of tax | — | — | — | ( | — | ( | — | — | ( | |||||||||||||||||||||||
| Repurchase of ordinary share capital | — | — | — | — | ( | ( | — | — | ( | |||||||||||||||||||||||
Share-based payments, net of tax | — | — | ( | — | — | |||||||||||||||||||||||||||
Share of equity-accounted entities’ changes in equity, net of tax | — | — | — | — | — | — | ||||||||||||||||||||||||||
| Issue of perpetual hybrid bonds | — | — | — | — | ( | ( | — | |||||||||||||||||||||||||
| Payments on perpetual hybrid bonds | — | — | ( | — | — | ( | ( | — | ( | |||||||||||||||||||||||
Transactions involving non-controlling interests, net of tax | — | — | — | — | — | ( | ||||||||||||||||||||||||||
| At 31 December 2023 | ( | ( | ||||||||||||||||||||||||||||||
| At 1 January 2022 | ( | ( | ( | |||||||||||||||||||||||||||||
| Profit for the year | — | — | — | — | ( | ( | ( | |||||||||||||||||||||||||
| Other comprehensive income | — | — | — | ( | ||||||||||||||||||||||||||||
| Total comprehensive income | — | — | ( | |||||||||||||||||||||||||||||
Dividendsb | — | — | — | — | ( | ( | — | ( | ( | |||||||||||||||||||||||
Cash flow hedges transferred to the balance sheet, net of tax | — | — | — | — | — | — | ||||||||||||||||||||||||||
| Issue of ordinary share capital | — | — | — | — | — | — | ||||||||||||||||||||||||||
| Repurchase of ordinary share capital | — | — | — | — | ( | ( | — | — | ( | |||||||||||||||||||||||
Share-based payments, net of tax | — | — | — | — | ||||||||||||||||||||||||||||
| Issue of perpetual hybrid bonds | — | — | — | — | ( | ( | — | |||||||||||||||||||||||||
| Payments on perpetual hybrid bonds | — | — | — | — | ( | — | ( | |||||||||||||||||||||||||
Transactions involving non-controlling interests, net of tax | — | — | — | — | ( | ( | — | ( | ( | |||||||||||||||||||||||
| At 31 December 2022 | ( | ( | ( | |||||||||||||||||||||||||||||
| At 1 January 2021 | ( | ( | ( | |||||||||||||||||||||||||||||
| Profit for the year | — | — | — | — | ||||||||||||||||||||||||||||
| Other comprehensive income | — | — | ( | ( | — | ( | ||||||||||||||||||||||||||
| Total comprehensive income | — | — | ( | ( | ||||||||||||||||||||||||||||
Dividendsb | — | — | — | — | ( | ( | — | ( | ( | |||||||||||||||||||||||
| Cash flow hedges transferred to the balance sheet, net of tax | — | — | — | ( | — | ( | — | — | ( | |||||||||||||||||||||||
| Repurchase of ordinary share capital | — | — | — | — | ( | ( | — | — | ( | |||||||||||||||||||||||
Share-based payments, net of tax | — | — | ( | — | — | |||||||||||||||||||||||||||
Share of equity-accounted entities’ changes in equity, net of tax | — | — | — | — | — | — | ||||||||||||||||||||||||||
| Issue of perpetual hybrid bonds | — | — | — | — | ( | ( | — | |||||||||||||||||||||||||
| Payments on perpetual hybrid bonds | — | — | ( | — | — | ( | ( | — | ( | |||||||||||||||||||||||
Transactions involving non-controlling interests, net of tax | — | — | — | — | — | ( | ||||||||||||||||||||||||||
| At 31 December 2021 | ( | ( | ( | |||||||||||||||||||||||||||||
aSee Note 32 for further information.
bSee Note 10 for further information.
166 | bp Annual Report and Form 20-F 2023 | |||||||||||||
| Financial statements | |||||
Group balance sheet
| At 31 December | $ million | |||||||||||||
| Note | 2023 | 2022 | ||||||||||||
| Non-current assets | ||||||||||||||
| Property, plant and equipment | 12 | |||||||||||||
| Goodwill | 14 | |||||||||||||
| Intangible assets | 15 | |||||||||||||
| Investments in joint ventures | 16 | |||||||||||||
| Investments in associates | 17 | |||||||||||||
| Other investments | 18 | |||||||||||||
| Fixed assets | ||||||||||||||
| Loans | ||||||||||||||
| Trade and other receivables | 20 | |||||||||||||
| Derivative financial instruments | 30 | |||||||||||||
| Prepayments | ||||||||||||||
| Deferred tax assets | 9 | |||||||||||||
| Defined benefit pension plan surpluses | 24 | |||||||||||||
| Current assets | ||||||||||||||
| Loans | ||||||||||||||
| Inventories | 19 | |||||||||||||
| Trade and other receivables | 20 | |||||||||||||
| Derivative financial instruments | 30 | |||||||||||||
| Prepayments | ||||||||||||||
| Current tax receivable | ||||||||||||||
| Other investments | 18 | |||||||||||||
| Cash and cash equivalents | 25 | |||||||||||||
| Assets classified as held for sale | 2 | |||||||||||||
| Total assets | ||||||||||||||
| Current liabilities | ||||||||||||||
| Trade and other payables | 22 | |||||||||||||
| Derivative financial instruments | 30 | |||||||||||||
| Accruals | ||||||||||||||
| Lease liabilities | 28 | |||||||||||||
| Finance debt | 26 | |||||||||||||
| Current tax payable | ||||||||||||||
| Provisions | 23 | |||||||||||||
| Liabilities directly associated with assets classified as held for sale | 2 | |||||||||||||
| Non-current liabilities | ||||||||||||||
| Other payables | 22 | |||||||||||||
| Derivative financial instruments | 30 | |||||||||||||
| Accruals | ||||||||||||||
| Lease liabilities | 28 | |||||||||||||
| Finance debt | 26 | |||||||||||||
| Deferred tax liabilities | 9 | |||||||||||||
| Provisions | 23 | |||||||||||||
| Defined benefit pension plan and other post-retirement benefit plan deficits | 24 | |||||||||||||
| Total liabilities | ||||||||||||||
| Net assets | ||||||||||||||
| Equity | ||||||||||||||
| bp shareholders’ equity | 32 | |||||||||||||
| Non-controlling interests | 32 | |||||||||||||
| Total equity | 32 | |||||||||||||
Helge Lund Chair
Murray Auchincloss Chief executive officer
8 March 2024
| bp Annual Report and Form 20-F 2023 | 167 | |||||||||||||
Group cash flow statement
| For the year ended 31 December | $ million | ||||||||||||||||
| Note | 2023 | 2022 | 2021 | ||||||||||||||
| Operating activities | |||||||||||||||||
| Profit (loss) before taxation | |||||||||||||||||
Adjustments to reconcile profit before taxation to net cash provided by operating activities | |||||||||||||||||
| Exploration expenditure written off | 8 | ||||||||||||||||
| Depreciation, depletion and amortization | 5 | ||||||||||||||||
| Impairment and (gain) loss on sale of businesses and fixed assets | 4 | ( | |||||||||||||||
| Earnings from joint ventures and associates | ( | ( | ( | ||||||||||||||
Dividends received from joint ventures and associates | |||||||||||||||||
| Interest receivable | ( | ( | ( | ||||||||||||||
| Interest received | |||||||||||||||||
| Finance costs | 7 | ||||||||||||||||
| Interest paid | ( | ( | ( | ||||||||||||||
Net finance expense relating to pensions and other post-retirement benefits | 24 | ( | ( | ( | |||||||||||||
Share-based payments | |||||||||||||||||
Net operating charge for pensions and other post-retirement benefits, less contributions and benefit payments for unfunded plans | 24 | ( | ( | ( | |||||||||||||
Net charge for provisions, less payments | ( | ||||||||||||||||
(Increase) decrease in inventories | ( | ( | |||||||||||||||
(Increase) decrease in other current and non-current assets | ( | ( | |||||||||||||||
Increase (decrease) in other current and non-current liabilities | ( | ||||||||||||||||
| Income taxes paid | ( | ( | ( | ||||||||||||||
| Net cash provided by operating activities | |||||||||||||||||
| Investing activities | |||||||||||||||||
| Expenditure on property, plant and equipment, intangible and other assets | ( | ( | ( | ||||||||||||||
| Acquisitions, net of cash acquired | 3 | ( | ( | ( | |||||||||||||
| Investment in joint ventures | ( | ( | ( | ||||||||||||||
| Investment in associates | ( | ( | ( | ||||||||||||||
| Total cash capital expenditure | ( | ( | ( | ||||||||||||||
| Proceeds from disposals of fixed assets | 4 | ||||||||||||||||
Proceeds from disposals of businesses, net of cash disposed | 4 | ||||||||||||||||
| Proceeds from loan repayments | |||||||||||||||||
| Net cash used in investing activities | ( | ( | ( | ||||||||||||||
| Financing activities | |||||||||||||||||
| Repurchase of shares | ( | ( | ( | ||||||||||||||
| Lease liability payments | ( | ( | ( | ||||||||||||||
| Proceeds from long-term financing | |||||||||||||||||
| Repayments of long-term financing | ( | ( | ( | ||||||||||||||
| Net increase (decrease) in short-term debt | ( | ( | |||||||||||||||
| Issue of perpetual hybrid bonds | |||||||||||||||||
| Payments relating to perpetual hybrid bonds | ( | ( | ( | ||||||||||||||
| Payments relating to transactions involving non-controlling interests (other) | ( | ( | ( | ||||||||||||||
| Receipts relating to transactions involving non-controlling interests (other) | |||||||||||||||||
| Dividends paid | |||||||||||||||||
| bp shareholders | 10 | ( | ( | ( | |||||||||||||
| Non-controlling interests | ( | ( | ( | ||||||||||||||
| Net cash provided by (used in) financing activities | ( | ( | ( | ||||||||||||||
Currency translation differences relating to cash and cash equivalents | ( | ( | |||||||||||||||
| Increase (decrease) in cash and cash equivalents | ( | ( | |||||||||||||||
| Cash and cash equivalents at beginning of year | |||||||||||||||||
| Cash and cash equivalents at end of year | |||||||||||||||||
168 | bp Annual Report and Form 20-F 2023 | |||||||||||||
| Financial statements | |||||
Notes on financial statements
1. Material accounting policy information, significant judgements, estimates and assumptions
Authorization of financial statements and statement of compliance with International Financial Reporting Standards
The consolidated financial statements of BP p.l.c and its subsidiaries (collectively referred to as bp or the group) were approved and signed by the chief executive officer and chairman on 8 March 2024 having been duly authorized to do so by the board of directors. BP p.l.c. is a public limited company incorporated and domiciled in England and Wales. The consolidated financial statements have been prepared in accordance with United Kingdom adopted international accounting standards and International Financial Reporting Standards (IFRSs) as issued by the International Accounting Standards Board (IASB) and as adopted by the European Union (EU) and in accordance with the provisions of the UK Companies Act 2006 as applicable to companies reporting under international accounting standards. IFRS as adopted by the UK does not differ from IFRS as adopted by the EU. IFRS as adopted by the UK and EU differs in certain respects from IFRS as issued by the IASB. The differences have no impact on the group’s consolidated financial statements for the years presented. The material accounting policy information and accounting judgements, estimates and assumptions of the group are set out below.
Basis of preparation
The consolidated financial statements have been prepared on a going concern basis and in accordance with IFRS and IFRS Interpretations Committee (IFRIC) interpretations issued and effective for the year ended 31 December 2023. The accounting policies that follow have been consistently applied to all years presented, except where otherwise indicated.
The consolidated financial statements are presented in US dollars and all values are rounded to the nearest million dollars ($ million), except where otherwise indicated.
Material accounting policy information: use of judgements, estimates and assumptions
Inherent in the application of many of the accounting policies used in preparing the consolidated financial statements is the need for bp management to make judgements, estimates and assumptions that affect the reported amounts of assets and liabilities, the disclosure of contingent assets and liabilities, and the reported amounts of revenues and expenses. Actual outcomes could differ from the estimates and assumptions used. The accounting judgements and estimates that have a significant impact on the results of the group are set out in boxed text below, and should be read in conjunction with the information provided in the Notes on financial statements.
The areas requiring the most significant judgement and estimation in the preparation of the consolidated financial statements are: accounting for the investments in Rosneft and Aker BP; exploration and appraisal intangible assets; the recoverability of asset carrying values, including the estimation of reserves; supplier financing arrangements; derivative financial instruments; provisions and contingencies; pensions and other post-retirement benefits; and taxation. Judgements and estimates, not all of which are significant, made in assessing the impact of the current economic and geopolitical environment, and climate change and the transition to a lower carbon economy on the consolidated financial statements are also set out in boxed text below. Where an estimate has a significant risk of resulting in a material adjustment to the carrying amounts of assets and liabilities within the next financial year this is specifically noted within the boxed text.
| bp Annual Report and Form 20-F 2023 | 169 | |||||||||||||
1. Material accounting policy information, significant judgements, estimates and assumptions – continued
| Judgements and estimates made in assessing the impact of climate change and the transition to a lower carbon economy | ||
Climate change and the transition to a lower carbon economy were considered in preparing the consolidated financial statements. These may have significant impacts on the currently reported amounts of the group’s assets and liabilities discussed below and on similar assets and liabilities that may be recognized in the future. The group’s assumptions for investment appraisal (see page 30) form part of an investment decision-making framework for currently unsanctioned future capital expenditure on property, plant and equipment, and intangibles including exploration and appraisal assets, that is designed to support the effective and resilient implementation of bp’s strategy. The price assumptions used for investment appraisal include oil and gas price assumptions, which are producer prices and are therefore net of any future carbon prices that the purchaser may be required to pay, and an assumption of a single carbon emissions cost imposed on the producer in respect of operational greenhouse gas (GHG) emissions (carbon dioxide and methane) in order to incentivize engineering solutions to mitigate GHG emissions on projects. The group's oil and gas price assumptions for value-in-use impairment testing are aligned with those investment appraisal assumptions. The assumptions for future carbon emissions costs in value-in-use impairment testing differ from the investment appraisal assumptions and are described below. Management has also not identified any off-balance sheet commodity purchase obligations to be onerous contracts as result of the transition to a lower carbon economy at 31 December 2023. | ||
| Impairment of property, plant and equipment and goodwill | ||
The energy transition is likely to impact the future prices of commodities such as oil and natural gas which in turn may affect the recoverable amount of property, plant and equipment and goodwill in the oil and gas industry. Management’s best estimate of oil and natural gas price assumptions for value-in-use impairment testing were revised during 2023. Prices are disclosed in real 2022 terms. The near term Brent oil assumption was held constant at $ As noted above, the group’s investment appraisal process includes a carbon emissions price series for the investment economics which is applied to bp's anticipated share of bp's forecast of the investment assets' scope 1 and 2 GHG emissions where they exceed defined thresholds, and is assumed to apply whether or not bp is the asset operator. However, for value-in-use impairment testing on bp's existing cash generating units (CGUs), consistent with all other relevant cash flows estimated, bp is required to reflect management's best estimate of any expected applicable carbon emission costs payable by bp, including where bp is not the operator, in the future for each jurisdiction in which the group has interests. This requires management’s best estimate of how future changes to relevant carbon emission cost policies and/or legislation are likely to affect the future cash flows of the group’s applicable CGUs, whether currently enacted or not. Future potential carbon pricing and/or costs of carbon emissions allowances are included in the value-in-use calculations to the extent management has sufficient information to make such an estimate. Currently this results in limited application of carbon price assumptions in value-in-use impairment tests given that carbon pricing legislation in most impacted jurisdictions where the group has interests is not in place and there is not sufficient information available as to the relevant policy makers' future intentions regarding carbon pricing to support an estimate. A key input into the determination of impairment is the assumption, aligned with bp’s aim to reach net zero greenhouse gas emissions by 2050 or sooner, that the current recognized portfolio of oil and gas properties and refining assets will have an immaterial carrying value by 2050. | ||
170 | bp Annual Report and Form 20-F 2023 | |||||||||||||
| Financial statements | |||||
1. Material accounting policy information, significant judgements, estimates and assumptions – continued
Where we consider that the outcome of a value-in-use impairment test could be significantly affected by a carbon price in place in any jurisdiction, this is incorporated into the value-in use impairment testing cash flows. The most significant instances where a carbon price has been incorporated in the 2023 value-in-use impairment tests is for the UK North Sea and the Gelsenkirchen refinery. The assumptions for UK North Sea were £ However, as bp’s forecast future prices are producer prices, the group considers it reasonable to assume that if, in addition to the costs already in place, further scope 1 and 2 emission costs were partially to be borne directly by oil and gas producers including bp in future and the prevalence of such costs were to become widespread, the gross oil and gas prices realized by producers would be correspondingly higher over the long term, resulting in no expected overall materially negative impacts on the group’s net cash flows. See significant judgements and estimates: recoverability of asset carrying values for further information including sensitivity analysis in relation to reasonably possible changes in the price assumptions and carbon costs. Production assumptions within upstream property, plant and equipment and goodwill value-in-use impairment tests reflect management’s current best estimate of future production of the existing upstream portfolio. The group sees the expected reduction in upstream hydrocarbon production by around 25% by 2030 from its 2019 baseline (see page 13) being achieved through future active management, including divestments, and high-grading of the portfolio. Changes in upstream production since 2019 will be included in the best estimate to the extent the divestments have been announced or completed however, as the specific future changes to the remainder of the portfolio are not yet known, the current best estimate used for accounting purposes does not include the full extent of the expected upstream production reduction. See significant judgements and estimates: recoverability of asset carrying values and Note 14 for sensitivity analyses in relation to reasonably possible changes in production for upstream oil and gas properties and goodwill respectively. Impairment charges were recognized on certain upstream oil and gas properties partly as a result of price and discount rate changes. See Note 4 for further information. For the customers & products segment, though the energy transition may impact demand for certain refined products in the future, management anticipates sufficiently robust demand for the remainder of each refinery’s useful life. Management will continue to review price assumptions as the energy transition progresses and this may result in impairment charges or reversals in the future. | ||
| Exploration and appraisal intangible assets | ||
The energy transition may affect the future development or viability of exploration prospects. The recoverability of the group's exploration and appraisal intangible assets was considered during 2023. No significant write-offs were identified. These assets will continue to be assessed as the energy transition progresses. See significant judgement: exploration and appraisal intangible assets and Note 8 for further information. | ||
| Property, plant and equipment – depreciation and expected useful lives | ||
The energy transition may curtail the expected useful lives of oil and gas industry assets thereby accelerating depreciation charges. However, a significant majority of bp’s existing upstream oil and natural gas properties are likely to have immaterial carrying values within the next 12 years and, as outlined in bp's strategy, oil and natural gas production will remain an important part of bp’s business activities over that period. The significant majority of refining assets, recognized on the group’s balance sheet at 31 December 2023 that are subject to depreciation, will be depreciated within the next 12 years; demand for refined products is expected to remain sufficient to support the remaining useful lives of existing assets. Therefore, management does not expect the useful lives of bp’s reported property, plant and equipment to change and do not consider this to be a significant accounting judgement or estimate. Significant capital expenditure is still required for ongoing projects as well as renewal and/or replacement of aged assets and therefore the useful lives of future capital expenditure may be different. See material accounting policy: property, plant and equipment for more information. | ||
Provisions: decommissioning | ||
The energy transition may bring forward the decommissioning of oil and gas industry assets thereby increasing the present value of associated decommissioning provisions. The majority of bp’s existing upstream oil and gas properties are expected to start decommissioning within the next two decades. The group’s expectation to reduce its upstream hydrocarbon production by around 25% by 2030 from its 2019 baseline (see page 13) is expected to be achieved through future active management, including divestments, and high-grading of the portfolio. Any resulting increases or decreases to the weighted average timing of decommissioning will be driven by the profile of assets held in the revised portfolio. Currently, the expected timing of decommissioning expenditures for the upstream oil and gas assets in the group’s portfolio has not materially been brought forward. Management does not expect a reasonably possible change of two years in the expected timing of all decommissioning to have a material effect on the upstream decommissioning provisions, assuming cost assumptions remain unchanged. Decommissioning cost estimates are based on the known regulatory and external environment. These cost estimates may change in the future, including as a result of the transition to a lower carbon economy. For refineries, decommissioning provisions are generally not recognized as the associated obligations have indeterminate settlement dates, typically driven by the cessation of manufacturing. Management does not expect manufacturing to cease at refineries within a determinate period of time, as existing property, plant and equipment is expected to be renewed or replaced. Management will continue to review facts and circumstances to assess if decommissioning provisions need to be recognized. Decommissioning provisions relating to refineries at 31 December 2023 are not material. See significant judgements and estimates: provisions for further information. | ||
| bp Annual Report and Form 20-F 2023 | 171 | |||||||||||||
1. Material accounting policy information, significant judgements, estimates and assumptions – continued
| Judgements and estimates made in assessing the impact of the geopolitical and economic environment | ||
| In preparing the consolidated financial statements, the following areas involving judgement and estimates were identified as most relevant with regards to the impact of the current geopolitical and economic environment. | ||
| Oil and gas price assumptions | ||
Oil and gas price assumptions applied in value-in-use impairment testing have been updated to reflect the current outlook on Brent oil supply constraints and an assumption that declining domestic natural gas demand in the US is offset by higher LNG exports. See significant judgements and estimates: recoverability of asset carrying values for further information. | ||
| Discount rate assumptions | ||
The discount rates used for impairment testing and provisions were reassessed during the year in light of changing economic and geopolitical outlooks. The nominal discount rate applied to provisions was increased during the year to reflect higher US Treasury yields. The principal impact of this rate increase was a $ | ||
| Pensions and other post-retirement benefits | ||
| The volatility in the financial markets during 2023 impacted the assumptions used for determining the fair value of plan assets and the present value of defined benefit obligations in the group’s defined benefit pension plans. See significant estimate: pensions and other post-retirement benefits and Note 24 for further information. | ||
Basis of consolidation
The group financial statements consolidate the financial statements of BP p.l.c. and its subsidiaries drawn up to 31 December each year. Subsidiaries are consolidated from the date of their acquisition, being the date on which the group obtains control, including when control is obtained via potential voting rights, and continue to be consolidated until the date that control ceases.
The financial statements of subsidiaries are prepared for the same reporting year as the parent company, using consistent accounting policies. Intra-group balances and transactions, including unrealized profits arising from intra-group transactions, have been eliminated. Unrealized losses are eliminated unless the transaction provides evidence of an impairment of the asset transferred.
Interests in other entities
Business combinations and goodwill
Business combinations are accounted for using the acquisition method. The identifiable assets acquired and liabilities assumed are recognized at their fair values at the acquisition date.
Goodwill is initially measured as the excess of the aggregate of the consideration transferred, the amount recognized for any non-controlling interest and the acquisition-date fair values of any previously held interest in the acquiree over the fair value of the identifiable assets acquired and liabilities assumed at the acquisition date. The amount recognized for any non-controlling interest is measured at the present ownership's proportionate share in the recognized amounts of the acquiree’s identifiable net assets. At the acquisition date, any goodwill acquired is allocated to each of the cash-generating units, or groups of cash-generating units, expected to benefit from the combination’s synergies. Following initial recognition, goodwill is measured at cost less any accumulated impairment losses. Goodwill arising on business combinations prior to 1 January 2003 is stated at the previous carrying amount under UK generally accepted accounting practice, less subsequent impairments.
Goodwill may arise upon investments in joint ventures and associates, being the surplus of the cost of investment over the group’s share of the net fair value of the identifiable assets and liabilities. Any such goodwill is recorded within the corresponding investment in joint ventures and associates.
Interests in joint arrangements
The results, assets and liabilities of joint ventures are incorporated in these consolidated financial statements using the equity method of accounting as described below.
Certain of the group’s activities, particularly in the oil production & operations and gas & low carbon energy segments, are conducted through joint operations. bp recognizes, on a line-by-line basis in the consolidated financial statements, its share of the assets, liabilities and expenses of these joint operations incurred jointly with the other partners, along with the group’s revenue from the sale of its share of the output and any liabilities and expenses that the group has incurred in relation to the joint operation.
For joint arrangements in a separate entity, judgement may be required as to whether the arrangement should be classified as a joint venture or if the legal form, contractual arrangements or other facts and circumstances indicate that the group has rights to the assets and obligations for the liabilities of the arrangement, rather than rights to the net assets, and therefore should be classified as a joint operation. No such judgement made by the group is considered significant.
Interests in associates
The results, assets and liabilities of associates are incorporated in these consolidated financial statements using the equity method of accounting as described below.
172 | bp Annual Report and Form 20-F 2023 | |||||||||||||
| Financial statements | |||||
1. Material accounting policy information, significant judgements, estimates and assumptions – continued
| Significant judgement: investment in Aker BP | ||
Judgement is required in assessing the level of control or influence over another entity in which the group holds an interest. For bp, the judgement that the group has significant influence over Aker BP, a Norwegian oil and gas company, is significant. As a consequence of this judgement, bp uses the equity method of accounting for its investment and bp's share of Aker BP's oil and natural gas reserves is included in the group's estimated net proved reserves of equity-accounted entities. If significant influence was not present, the investment would be accounted for as an investment in an equity instrument measured at fair value as described under 'Financial assets' below and no share of Aker BP's oil and natural gas reserves would be reported. Significant influence is defined in IFRS as the power to participate in the financial and operating policy decisions of the investee but is not control or joint control of those decisions. Significant influence is presumed when an entity owns 20% or more of the voting power of the investee. Significant influence is presumed not to be present when an entity owns less than 20% of the voting power of the investee. bp owned | ||
| Significant judgements and estimate: investment in Rosneft | ||
Since the first quarter 2022, bp accounts for its interest in Rosneft and its other businesses with Rosneft within Russia, as financial assets measured at fair value within ‘Other investments’. bp is not able to sell its Rosneft shares on the Moscow Stock Exchange and is unable to ascribe probabilities to possible outcomes of any exit process. It is considered by management that any measure of fair value, other than nil, would be subject to such high measurement uncertainty, considering the sanctions and restrictions implemented by Russia on Russian assets held by foreign investors, that no estimate would provide useful information even if it were accompanied by a description of the estimate made in producing it and an explanation of the uncertainties that affect the estimate. Accordingly, it is not currently possible to estimate any carrying value other than Russia has imposed restrictions on the payments of dividends to certain foreign shareholders, including those based in the UK, requiring such dividends to be paid in roubles into restricted bank accounts and a requirement for approval of the Russian government for transfers from any such bank accounts out of Russia. Given the restrictions applicable to such accounts, management has made the significant judgement that the criteria for recognizing any dividend income from Rosneft and its other businesses with Rosneft within Russia, for the years to 31 December 2022 and 31 December 2023 have not been met. | ||
The equity method of accounting
Under the equity method, an investment is carried on the balance sheet at cost plus post-acquisition changes in the group’s share of net assets of the entity, less distributions received and less any impairment in value of the investment. Loans advanced to equity-accounted entities that have the characteristics of equity financing are also included in the investment on the group balance sheet. The group income statement reflects the group’s share of the results after tax of the equity-accounted entity, adjusted to account for depreciation, amortization and any impairment of the equity-accounted entity’s assets based on their fair values at the date of acquisition. The group statement of comprehensive income includes the group’s share of the equity-accounted entity’s other comprehensive income. The group’s share of amounts recognized directly in equity by an equity-accounted entity is recognized in the group’s statement of changes in equity.
Segmental reporting
The group’s operating segments are established on the basis of those components of the group that are evaluated regularly by the chief executive officer, bp’s chief operating decision maker, in deciding how to allocate resources and in assessing performance.
The accounting policies of the operating segments are the same as the group’s accounting policies described in this note, except that IFRS requires that the measure of profit or loss disclosed for each operating segment is the measure that is provided regularly to the chief operating decision maker. For bp, this measure of profit or loss is replacement cost profit before interest and tax which reflects the replacement cost of inventories sold in the period and is arrived at by excluding inventory holding gains and losses from profit before interest and tax. Replacement cost profit for the group is not a recognized measure under IFRS.
For further information see Note 5.
Foreign currency translation
In individual subsidiaries, joint ventures and associates, transactions in foreign currencies are initially recorded in the functional currency of those entities at the spot exchange rate on the date of the transaction. Monetary assets and liabilities denominated in foreign currencies are retranslated into the functional currency at the spot exchange rate on the balance sheet date. Any resulting exchange differences are included in the income statement, unless hedge accounting is applied. Non-monetary items, other than those measured at fair value, are not retranslated subsequent to initial recognition.
| bp Annual Report and Form 20-F 2023 | 173 | |||||||||||||
1. Material accounting policy information, significant judgements, estimates and assumptions – continued
In the consolidated financial statements, the assets and liabilities of non-US dollar functional currency subsidiaries, joint ventures, associates, and related goodwill, are translated into US dollars at the spot exchange rate on the balance sheet date. The results and cash flows of non-US dollar functional currency subsidiaries, joint ventures and associates are translated into US dollars using average rates of exchange. In the consolidated financial statements, exchange adjustments arising when the opening net assets and the profits for the year retained by non-US dollar functional currency subsidiaries, joint ventures and associates are translated into US dollars are recognized in a separate component of equity and reported in other comprehensive income. Exchange gains and losses arising on long-term intra-group foreign currency borrowings used to finance the group’s non-US dollar investments are also reported in other comprehensive income if the borrowings form part of the net investment in the subsidiary, joint venture or associate. On disposal or for certain partial disposals of a non-US dollar functional currency subsidiary, joint venture or associate, the related accumulated exchange gains and losses recognized in equity are reclassified from equity to the income statement.
Non-current assets held for sale
Non-current assets and disposal groups classified as held for sale are measured at the lower of carrying amount and fair value less costs to sell.
Significant non-current assets and disposal groups are classified as held for sale if their carrying amounts will be recovered through a sale transaction rather than through continuing use. This condition is regarded as met only when the sale is highly probable and the asset or disposal group is available for immediate sale in its present condition subject only to terms that are usual and customary for sales of such assets. Management must be committed to the sale, which should be expected to qualify for recognition as a completed sale within one year from the date of classification as held for sale, and actions required to complete the plan of sale should indicate that it is unlikely that significant changes to the plan will be made or that the plan will be withdrawn.
Property, plant and equipment and intangible assets are not depreciated or amortized, and equity accounting of associates and joint ventures is ceased once classified as held for sale.
Intangible assets
Intangible assets, other than goodwill, include expenditure on the exploration for and evaluation of oil and natural gas resources, biogas rights agreements, digital assets, patents, licences and trademarks and are stated at the amount initially recognized, less accumulated amortization and accumulated impairment losses.
Intangible assets are carried initially at cost unless acquired as part of a business combination. Any such asset is measured at fair value at the date of the business combination and is recognized separately from goodwill if the asset is separable or arises from contractual or other legal rights.
Intangible assets with a finite life, other than capitalized exploration and appraisal costs as described below, are amortized on a straight-line basis over their expected useful lives. For patents, licences and trademarks, expected useful life is the shorter of the duration of the legal agreement and economic useful life, and can range from to fifteen years . The expected useful life of biogas rights agreements is the shorter of the duration of the legal agreement and economic useful life and can be up to 50 years. Digital asset costs generally have a useful life of to five years .
The expected useful lives of assets and the amortization method are reviewed on an annual basis and, if necessary, changes in useful lives or the amortization method are accounted for prospectively.
Oil and natural gas exploration and appraisal expenditure
Oil and natural gas exploration and appraisal expenditure is accounted for using the principles of the successful efforts method of accounting as described below.
Licence and property acquisition costs
Exploration licence and leasehold property acquisition costs are capitalized within intangible assets and are reviewed at each reporting date to confirm that there is no indication that the carrying amount exceeds the recoverable amount. This review includes confirming that exploration drilling is still under way or planned or that it has been determined, or work is under way to determine, that the discovery is economically viable based on a range of technical and commercial considerations, and sufficient progress is being made on establishing development plans and timing. If no future activity is planned, the remaining balance of the licence and property acquisition costs is written off. Lower value licences are pooled and amortized on a straight-line basis over the estimated period of exploration. Upon internal approval for development and recognition of proved or sanctioned probable reserves of oil and natural gas, the relevant expenditure is transferred to property, plant and equipment.
Exploration and appraisal expenditure
Geological and geophysical exploration costs are recognized as an expense as incurred. Costs directly associated with an exploration well are initially capitalized as an intangible asset until the drilling of the well is complete and the results have been evaluated. These costs include employee remuneration, materials and fuel used, rig costs and payments made to contractors. If potentially commercial quantities of hydrocarbons are not found, the exploration well costs are written off. If hydrocarbons are found and, subject to further appraisal activity, are likely to be capable of commercial development, the costs continue to be carried as an asset. If it is determined that development will not occur, that is, the efforts are not successful, then the costs are expensed.
Costs directly associated with appraisal activity undertaken to determine the size, characteristics and commercial potential of a reservoir following the initial discovery of hydrocarbons, including the costs of appraisal wells where hydrocarbons were not found, are initially capitalized as an intangible asset. Upon internal approval for development and recognition of proved or sanctioned probable reserves, the relevant expenditure is transferred to property, plant and equipment. If development is not approved and no further activity is expected to occur, then the costs are expensed.
The determination of whether potentially economic oil and natural gas reserves have been discovered by an exploration well is usually made within one year of well completion, but can take longer, depending on the complexity of the geological structure. Exploration wells that discover potentially economic quantities of oil and natural gas and are in areas where major capital expenditure (e.g. an offshore platform or a pipeline) would be required before production could begin, and where the economic viability of that major capital expenditure depends on the successful completion of further exploration or appraisal work in the area, remain capitalized on the balance sheet as long as such work is under way or firmly planned.
174 | bp Annual Report and Form 20-F 2023 | |||||||||||||
| Financial statements | |||||
1. Material accounting policy information, significant judgements, estimates and assumptions – continued
Significant judgement: exploration and appraisal intangible assets | ||
Judgement is required to determine whether it is appropriate to continue to carry costs associated with exploration wells and exploratory-type stratigraphic test wells on the balance sheet. This includes costs relating to exploration licences or leasehold property acquisitions. It is not unusual to have such costs remaining suspended on the balance sheet for several years while additional appraisal drilling and seismic work on the potential oil and natural gas field is performed or while the optimum development plans and timing are established. The costs are carried based on the current regulatory and political environment or any known changes to that environment. All such carried costs are subject to regular technical, commercial and management review on at least an annual basis to confirm the continued intent to develop, or otherwise extract value from, the discovery. Where this is no longer the case, the costs are immediately expensed. The carrying amount of capitalized costs are included in Note 8. | ||
Property, plant and equipment
Property, plant and equipment owned by the group is stated at cost, less accumulated depreciation and accumulated impairment losses. The initial cost of an asset comprises its purchase price or construction cost, any costs directly attributable to bringing the asset into the location and condition necessary for it to be capable of operating in the manner intended by management, the initial estimate of any decommissioning obligation, if applicable, and, for assets that necessarily take a substantial period of time to get ready for their intended use, directly attributable general or specific finance costs. The purchase price or construction cost is the aggregate amount paid and the fair value of any other consideration given to acquire the asset.
Expenditure on major maintenance refits or repairs comprises the cost of replacement assets or parts of assets, inspection costs and overhaul costs. Where an asset or part of an asset that was separately depreciated is replaced and it is probable that future economic benefits associated with the item will flow to the group, the expenditure is capitalized and the carrying amount of the replaced asset is derecognized. Inspection costs associated with major maintenance programmes are capitalized and amortized over the period to the next inspection. Overhaul costs for major maintenance programmes, and all other maintenance costs are expensed as incurred.
Expenditure on the construction, installation and completion of infrastructure facilities such as platforms, pipelines and the drilling of development wells, including service and unsuccessful development or delineation wells, is capitalized within property, plant and equipment and is depreciated from the commencement of production.
Oil and natural gas properties, including certain related pipelines, are depreciated using a unit-of-production method. The cost of producing wells is amortized over proved developed reserves. Licence acquisition, common facilities and future decommissioning costs are amortized over total proved reserves. The unit-of-production rate for the depreciation of common facilities takes into account expenditures incurred to date, together with estimated future capital expenditure expected to be incurred relating to as yet undeveloped reserves expected to be processed through these common facilities. Information on the carrying amounts of the group’s oil and natural gas properties, together with the amounts recognized in the income statement as depreciation, depletion and amortization is contained in Note 12 and Note 5 respectively.
Estimates of oil and natural gas reserves determined in accordance with US Securities and Exchange Commission (SEC) regulations, including the application of prices using 12-month historical price data in assessing the commerciality of technical volumes, are typically used to calculate depreciation, depletion and amortization charges for the group’s oil and gas properties. Therefore, where this approach is adopted, charges are not dependent on management forecasts of future oil and gas prices.
However, for certain oil and natural gas assets, the use of reserves determined in accordance with SEC regulations would result in a charge that is not reflective of the pattern in which the future economic benefits are expected to be consumed. In these limited instances other approaches are applied to determine the reserves base used to calculate depreciation, depletion and amortization, including the use of management’s best estimate of price assumptions as disclosed in Significant judgements and estimates: recoverability of asset carrying values, to determine the commerciality of technical proved reserves.
The impact of changes in estimated proved reserves is dealt with prospectively by amortizing the remaining carrying value of the asset over the expected future production.
The estimation of oil and natural gas reserves and bp’s process to manage reserves bookings is described in Supplementary information on oil and natural gas on page 247, which is unaudited. Details on bp’s proved reserves and production compliance and governance processes are provided on page 346. The 2023 movements in proved reserves are reflected in the tables showing movements in oil and natural gas reserves by region in Supplementary information on oil and natural gas (unaudited) on page 247.
Other property, plant and equipment is depreciated on a straight-line basis over its expected useful life. The typical useful lives of the group’s other property, plant and equipment on initial recognition are as follows:
| Land improvements | |||||
| Buildings | |||||
| Refineries | |||||
| Pipelines | |||||
| Service stations | |||||
| Office equipment | |||||
| Fixtures and fittings | |||||
The expected useful lives and depreciation method of property, plant and equipment are reviewed on an annual basis and, if necessary, changes in useful lives or the depreciation method are accounted for prospectively. An item of property, plant and equipment is derecognized upon disposal or when no future economic benefits are expected to arise from the continued use of the asset. Any gain or loss arising on derecognition of the asset (calculated as the difference between the net disposal proceeds and the carrying amount of the item) is included in the income statement in the period in which the item is derecognized.
| bp Annual Report and Form 20-F 2023 | 175 | |||||||||||||
1. Material accounting policy information, significant judgements, estimates and assumptions – continued
Impairment of property, plant and equipment, intangible assets, goodwill, and equity-accounted entities
The group assesses assets or groups of assets, called cash-generating units (CGUs), for impairment whenever events or changes in circumstances indicate that the carrying amount of an asset or CGU may not be recoverable; for example, changes in the group’s business plans, plans to dispose rather than retain assets, changes in the group’s assumptions about discount rates, commodity prices, low plant utilization, evidence of physical damage or, for oil and gas assets, significant downward revisions of estimated reserves or increases in estimated future development expenditure or decommissioning costs. If any such indication of impairment exists, the group makes an estimate of the asset’s or CGU’s recoverable amount. Individual assets are grouped into CGUs for impairment assessment purposes at the lowest level at which there are identifiable cash inflows that are largely independent of the cash inflows of other groups of assets. A CGU’s recoverable amount is the higher of its fair value less costs of disposal and its value in use. If it is probable that the value of the CGU will be primarily recovered through a disposal transaction, the expected disposal proceeds are considered in determining the recoverable amount. Where the carrying amount of a CGU exceeds its recoverable amount, the CGU is considered impaired and is written down to its recoverable amount.
The business segment plans, which are approved on an annual basis by senior management, are the primary source of information for the determination of value in use. They contain forecasts for oil and natural gas production, power generation, refinery throughputs, sales volumes for various types of refined products (e.g. gasoline and lubricants), revenues, costs and capital expenditure. Carbon taxes and costs of emissions allowances are included in estimates of future cash flows, where applicable, based on the regulatory environment in each jurisdiction in which the group operates. As an initial step in the preparation of these plans, various assumptions regarding market conditions, such as oil prices, natural gas prices, power prices, refining margins, refined product margins and cost inflation rates are set by senior management. These assumptions take account of existing prices, global supply-demand equilibrium for oil and natural gas, other macroeconomic factors and historical trends and variability. In assessing value in use, the estimated future cash flows are adjusted for the risks specific to the asset group to the extent that they are not already reflected in the discount rate and are discounted to their present value typically using a pre-tax discount rate that reflects current market assessments of the time value of money.
Fair value less costs of disposal is the price that would be received to sell the asset in an orderly transaction between market participants and does not reflect the effects of factors that may be specific to the group and not applicable to entities in general. Fair value may be determined by reference to agreed or expected sales proceeds, recent market transactions for similar assets or using discounted cash flow analyses. Where discounted cash flow analyses are used to calculate fair value less costs of disposal, estimates are made about the assumptions market participants would use when pricing the asset, CGU or group of CGUs containing goodwill and the test is performed on a post-tax basis.
An assessment is made at each reporting date as to whether there is any indication that previously recognized impairment losses may no longer exist or may have decreased. If such an indication exists, the recoverable amount is estimated. A previously recognized impairment loss is reversed only if there has been a change in the estimates used to determine the asset’s or CGU's recoverable amount since the last impairment loss was recognized. If that is the case, the carrying amount of the asset or CGU is increased to the lower of its recoverable amount and the carrying amount that would have been determined, net of depreciation, had no impairment loss been recognized for the asset or CGU in prior years. Impairment reversals are recognized in profit or loss. After a reversal, the depreciation charge is adjusted in future periods to allocate the asset’s or CGU's revised carrying amount, less any residual value, on a systematic basis over its remaining useful life.
Goodwill is reviewed for impairment annually or more frequently if events or changes in circumstances indicate the recoverable amount of the group of CGUs to which the goodwill relates should be assessed. In assessing whether goodwill has been impaired, the carrying amount of the group of CGUs to which goodwill has been allocated is compared with its recoverable amount. Where the recoverable amount of the group of CGUs is less than the carrying amount (including goodwill), an impairment loss is recognized. An impairment loss recognized for goodwill is not reversed in a subsequent period.
The group assesses investments in equity-accounted entities for impairment whenever there is objective evidence that the investment is impaired, after recognizing its share of any losses of the equity-accounted entity itself. If any such objective evidence of impairment exists, the carrying amount of the investment is compared with its recoverable amount, being the higher of its fair value less costs of disposal and value in use. If the carrying amount exceeds the recoverable amount, the investment is written down to its recoverable amount.
176 | bp Annual Report and Form 20-F 2023 | |||||||||||||
| Financial statements | |||||
1. Material accounting policy information, significant judgements, estimates and assumptions – continued
| Significant judgements and estimates: recoverability of asset carrying values | ||
| Determination as to whether, and by how much, an asset, CGU, or group of CGUs containing goodwill is impaired involves management estimates on highly uncertain matters such as the effects of inflation and deflation on operating expenses, discount rates, capital expenditure, carbon pricing (where applicable), production profiles, reserves and resources, and future commodity prices, including the outlook for global or regional market supply-and-demand conditions for crude oil, natural gas, power and refined products. Judgement is required when determining the appropriate grouping of assets into a CGU or the appropriate grouping of CGUs for impairment testing purposes. For example, individual oil and gas properties may form separate CGUs whilst certain oil and gas properties with shared infrastructure may be grouped together to form a single CGU. Alternative groupings of assets or CGUs may result in a different outcome from impairment testing. See Note 14 for details on how these groupings have been determined in relation to the impairment testing of goodwill. As described above, the recoverable amount of an asset is the higher of its value in use and its fair value less costs of disposal. Fair value less costs of disposal may be determined based on expected sales proceeds or similar recent market transaction data. Details of impairment charges and reversals recognized in the income statement are provided in Note 4 and details on the carrying amounts of assets are shown in Note 12, Note 14 and Note 15. The estimates for assumptions made in impairment tests in 2023 relating to discount rates and oil and gas properties are discussed below. Changes in the economic environment including as a result of the energy transition or other facts and circumstances may necessitate revisions to these assumptions and could result in a material change to the carrying values of the group's assets within the next financial year. | ||
| Discount rates | ||
For discounted cash flow calculations, future cash flows are adjusted for risks specific to the CGU. Value-in-use calculations are typically discounted using a pre-tax discount rate based upon the cost of funding the group derived from an established model, adjusted to a pre-tax basis and incorporating a market participant capital structure and country risk premiums. Fair value less costs of disposal discounted cash flow calculations use a post-tax discount rate. The discount rates applied in impairment tests are reassessed each year and, in 2023, the post-tax discount rate was | ||
| Oil and natural gas properties | ||
For oil and natural gas properties in the oil production & operations and gas & low carbon energy segments, expected future cash flows are estimated using management’s best estimate of future oil and natural gas prices, production and reserves and certain resources volumes. Forecast cash flows include the impact of all approved emission reduction projects. The estimated future level of production in all impairment tests is based on assumptions about future commodity prices, production and development costs, field decline rates, current fiscal regimes and other factors. In 2023, the group identified oil and gas properties in these segments with carrying amounts totalling $ The recoverability of intangible exploration and appraisal expenditure is covered under Oil and natural gas exploration, appraisal and development expenditure above. | ||
| Oil and natural gas prices | ||
The price assumptions used for value-in-use impairment testing are based on those used for investment appraisal. bp’s carbon emissions cost assumptions and their interrelationship with oil and gas prices are described in 'Judgements and estimates made in assessing the impact of climate change and the transition to a lower carbon economy' on page 170. The investment appraisal price assumptions are recommended by the senior vice president economic & energy insights after considering a range of external price sets, and supply and demand profiles associated with various energy transition scenarios. They are reviewed and approved by management. As a result of the current uncertainty over the pace of transition to lower-carbon supply and demand and the social, political and environmental actions that will be taken to meet the goals of the Paris climate change agreement, the scenarios considered include those where those goals are met as well as those where they are not met. During the year, bp's price assumptions applied in value-in-use impairment testing (in real 2022 terms) for the near term Brent oil assumption was held constant at $ The majority of bp’s reserves and resources that support the carrying value of the group’s existing oil and gas properties are expected to be produced over the next 12 years. The recoverability of deferred tax assets is also affected by the group’s oil and natural gas price assumptions as these could impact the estimate of future taxable profits. See Note 9 for further information. | ||
| bp Annual Report and Form 20-F 2023 | 177 | |||||||||||||
1. Material accounting policy information, significant judgements, estimates and assumptions – continued
| 2023 price assumptions | 2024 | 2025 | 2030 | 2040 | 2050 | |||||||||||||||
| Brent oil ($/bbl) | ||||||||||||||||||||
| Henry Hub gas ($/mmBtu) | ||||||||||||||||||||
| 2022 price assumptions | 2023 | 2025 | 2030 | 2040 | 2050 | |||||||||||||||
| Brent oil ($/bbl) | ||||||||||||||||||||
| Henry Hub gas ($/mmBtu) | ||||||||||||||||||||
Global oil production increased by 2.2% in 2023. Strong US tight oil supply and non-OPEC+ supply more than offset OPEC+ pledged additional output reductions. Global oil demand continued its recovery, increasing by 2.4% in 2023. Chinese demand growth was unexpectedly strong making up 75% of total oil demand growth, with the rest coming from other non-OECD countries. Brent dropped by nearly $20 per barrel in 2023 as oil markets recovered from the shocks in 2022 and supply/demand was balanced. bp’s long term view is for a more stable market in 2024 as the price responsiveness of shale activity, OPEC+ discipline and ample spare capacity limits the scope for large movements, even with the political tensions in the Middle East. bp's long-term assumption for oil prices is lower than the 2023 price average, based on the judgement that, in the long term, oil demand is likely to fall so that the price levels needed to encourage sufficient investment to meet declining global oil demand is also lower. US gas prices in 2023 decreased around 60% compared to 2022, to $2.5 per mmbtu. Prices fell as gas production growth outpaced demand. Milder than normal winter weather and an extended outage at Freeport LNG left US gas storage stocks well above historic average levels at the end of winter 2022/2023. Henry Hub prices fell during the summer which incentivized coal-to-gas switching in the power sector, and hot weather in the third-quarter helped the market avoid storage containment issues. Meanwhile gas production continued to grow, reaching record levels by the end of 2023 despite a 20% decrease in gas rigs over the first half of the year. Growth was supported by strong associated gas production as well as pipeline de-bottlenecking. Finally, mild weather in the fourth-quarter further loosened balances and storage stocks exited the year 13% above five-year average levels. The level of US gas prices in 2023 is below bp’s long term price assumption based on the judgment of the price level required to incentivize new production. | ||
| Oil and natural gas reserves | ||
In addition to oil and natural gas prices, significant technical and commercial assessments are required to determine the group’s estimated oil and natural gas reserves. Reserves estimates are regularly reviewed and updated. Factors such as the availability of geological and engineering data, reservoir performance data, acquisition and divestment activity and drilling of new wells all impact on the determination of the group’s estimates of its oil and natural gas reserves. bp bases its reserves estimates on the requirement of reasonable certainty with rigorous technical and commercial assessments based on conventional industry practice and regulatory requirements. Reserves assumptions for value-in-use tests reflect the reserves and resources that management currently intend to develop. The recoverable amount of oil and gas properties is determined using a combination of inputs including reserves, resources and production volumes. Risk factors may be applied to reserves and resources which do not meet the criteria to be treated as proved or probable. | ||
| Sensitivity analyses | ||
Management considers discount rates, oil and natural gas prices and production to be the key sources of estimation uncertainty in determining the recoverable amount of upstream oil and gas assets. The sensitivity analyses below, in addition to covering the key sources of estimation uncertainty, also indicate how the energy transition, potential future carbon emissions costs for operational GHG emissions and/or reduced demand for oil and gas may further impact forecast revenue cash inflows to a greater extent than currently anticipated in the group’s value-in-use estimates for oil and gas CGUs, if carbon emissions costs were to be implemented as a deduction against revenue cash flows. The analyses therefore represent a net revenue sensitivity. A change in net revenue from upstream oil and gas properties can arise either due to changes in oil and natural gas prices, carbon emissions costs/carbon prices, changes in oil and natural gas production, or a combination of these. Management tested the impact of changes in net revenue cash flows in value-in-use impairment testing under the following sensitivity analyses: an increase in net revenues of 8% in all years up to 2040, and 25% in all remaining years to 2050; and a decrease in net revenues of 20% in all years up to 2030, 35% in all subsequent years to 2040 and 50% in all remaining years to 2050. Net revenue reductions of this magnitude in isolation could indicatively lead to a reduction in the carrying amount of bp’s currently held upstream oil and gas properties in the range of $ Net revenue increases of this magnitude in isolation could indicatively lead to an increase in the carrying amount of bp’s currently held upstream oil and gas properties in the range of $ | ||
178 | bp Annual Report and Form 20-F 2023 | |||||||||||||
| Financial statements | |||||
1. Material accounting policy information, significant judgements, estimates and assumptions – continued
These sensitivity analyses do not, however, represent management’s best estimate of any impairment charges or reversals that might be recognized as they do not fully incorporate consequential changes that may arise, such as changes in costs and business plans and phasing of development. For example, costs across the industry are more likely to decrease as oil and natural gas prices fall. The analyses also assume the impact of increases in carbon price on operational GHG emissions are fully absorbed as a decrease in net revenue (and vice versa) rather than reflecting how carbon prices or other carbon emissions costs may ultimately be incorporated by the market. The above sensitivity analyses therefore do not reflect a linear relationship between net revenue and value that can be extrapolated. The interdependency of these inputs and factors plus the diverse characteristics of the group's upstream oil and gas properties limits the practicability of estimating the probability or extent to which the overall recoverable amount is impacted by changes to the price assumptions or production volumes. Management also tested the impact of a one percentage point change in the discount rate used for value-in-use impairment testing of upstream oil and gas properties. This level of change reflects past experience of a reasonable change in rate that could arise within the next financial year. If the discount rate was one percentage point higher across all tests performed, the net impairment loss recognized in 2023 would have been approximately $ | ||
| Goodwill | ||
Irrespective of whether there is any indication of impairment, bp is required to test annually for impairment of goodwill acquired in business combinations. The group carries goodwill of $ | ||
Inventories
Inventories, other than inventories held for short-term trading purposes, are stated at the lower of cost and net realizable value. Cost is typically determined by the first-in first-out method and comprises direct purchase costs, cost of production, transportation and manufacturing expenses. Net realizable value is determined by reference to prices existing at the balance sheet date, adjusted where the sale of inventories after the reporting period gives evidence about their net realizable value at the end of the period.
Inventories held for short-term trading purposes are stated at fair value less costs to sell and any changes in fair value are recognized in the income statement.
Supplies are valued at the lower of cost on a weighted-average basis and net realizable value.
Leases
Agreements that convey the right to control the use of an identified asset for a period of time in exchange for consideration are accounted for as leases. The right to control is conveyed if bp has both the right to obtain substantially all of the economic benefits from, and the right to direct the use of, the identified asset throughout the period of use. An asset is identified if it is explicitly or implicitly specified by the agreement and any substitution rights held by the lessor over the asset are not considered substantive.
Agreements that convey the right to control the use of an intangible asset including rights to explore for or use hydrocarbons are not accounted for as leases. See material accounting policy information: intangible assets.
A lease liability is recognized on the balance sheet on the lease commencement date at the present value of future lease payments over the lease term. The discount rate applied is the rate implicit in the lease if readily determinable, otherwise an incremental borrowing rate is used. For the majority of the leases in the group, there is not sufficient information available to readily determine the rate implicit in the lease, and therefore the incremental borrowing rate is used. The incremental borrowing rate is determined based on factors such as the group’s cost of borrowing, lessee legal entity credit risk, currency and lease term. The lease term is the non-cancellable period of a lease together with any periods covered by an extension option that bp is reasonably certain to exercise, or periods covered by a termination option that bp is reasonably certain not to exercise. The future lease payments included in the present value calculation are any fixed payments, payments that vary depending on an index or rate, payments due for the reasonably certain exercise of options and expected residual value guarantee payments. Repayments of principal are presented as financing cash flows and payments of interest are presented as operating cash flows.
Payments that vary based on factors other than an index or a rate such as usage, sales volumes or revenues are not included in the present value calculation and are recognized in the income statement and presented as operating cash flows. The lease liability is recognized on an amortized cost basis with interest expense recognized in the income statement over the lease term, except for where capitalized as exploration, appraisal or development expenditure.
The right-of-use asset is recognized on the balance sheet as property, plant and equipment at a value equivalent to the initial measurement of the lease liability adjusted for lease prepayments, lease incentives, initial direct costs and any restoration obligations. The right-of-use asset is depreciated typically on a straight-line basis over the lease term. The depreciation charge is recognized in the income statement except for where capitalized as exploration, appraisal or development expenditure. Right-of-use assets are assessed for impairment in line with the accounting policy for impairment of property, plant and equipment, intangible assets and goodwill.
Agreements may include both lease and non-lease components. Payments for lease and non-lease components are allocated on a relative stand-alone selling price basis except for leases of retail service stations where the group has elected not to separate non-lease payments from the calculation of the lease liability and right-of-use asset.
If the lease term at commencement of the agreement is less than 12 months, a lease liability and right-of-use asset are not recognized, and a lease expense is recognized in the income statement on a straight-line basis.
| bp Annual Report and Form 20-F 2023 | 179 | |||||||||||||
1. Material accounting policy information, significant judgements, estimates and assumptions – continued
If a significant event or change in circumstances, within the control of bp, arises that affects the reasonably certain lease term or there are changes to the lease payments, the present value of the lease liability is remeasured using the revised term and payments, with the right-of-use asset adjusted by an equivalent amount.
Modifications to a lease agreement beyond the original terms and conditions are accounted for as a re-measurement of the lease liability with a corresponding adjustment to the right-of-use asset. Any gain or loss on modification is recognized in the income statement. Modifications that increase the scope of the lease at a price commensurate with the stand-alone selling price are accounted for as a separate new lease.
The group recognizes the full lease liability, rather than its working interest share, for leases entered into on behalf of a joint operation if the group has the primary responsibility for making the lease payments. This may be the case if for example bp, as operator of the joint operation, is the sole signatory to the lease agreement. In such cases, bp’s working interest share of the right-of-use asset is recognized if it is jointly controlled by the group and the other joint operators, and a receivable is recognized for the share of the asset transferred to the other joint operators. If bp is a non-operator, a payable to the operator is recognized if they have the primary responsibility for making the lease payments and bp has joint control over the right-of-use asset, otherwise no balances are recognized.
Financial assets
Financial assets are recognized initially at fair value, normally being the transaction price. In the case of financial assets not measured at fair value through profit or loss, directly attributable transaction costs are also included. The subsequent measurement of financial assets depends on their classification, as set out below. The group derecognizes financial assets when the contractual rights to the cash flows expire or the rights to receive cash flows have been transferred to a third party and either substantially all of the risks and rewards of the asset have been transferred, or substantially all the risks and rewards of the asset have neither been retained nor transferred but control of the asset has been transferred. This includes the derecognition of receivables for which discounting arrangements are entered into.
The group classifies its financial asset debt instruments as measured at amortized cost, fair value through other comprehensive income or fair value through profit or loss. The classification depends on the business model for managing the financial assets and the contractual cash flow characteristics of the financial asset.
Financial assets measured at amortized cost
Financial assets are classified as measured at amortized cost when they are held in a business model the objective of which is to collect contractual cash flows and the contractual cash flows represent solely payments of principal and interest. Such assets are carried at amortized cost using the effective interest method if the time value of money is significant. Gains and losses are recognized in profit or loss when the assets are derecognized or impaired and when interest income is recognized using the effective interest method. This category of financial assets includes trade and other receivables.
Financial assets measured at fair value through other comprehensive income
Financial assets are classified as measured at fair value through other comprehensive income when they are held in a business model the objective of which is both to collect contractual cash flows and sell the financial assets, and the contractual cash flows represent solely payments of principal and interest.
Financial assets measured at fair value through profit or loss
Financial assets are classified as measured at fair value through profit or loss when the asset does not meet the criteria to be measured at amortized cost or fair value through other comprehensive income. Such assets are carried on the balance sheet at fair value with gains or losses recognized in the income statement. Derivatives, other than those designated as effective hedging instruments, are included in this category.
Investments in equity instruments
Investments in equity instruments are subsequently measured at fair value through profit or loss unless an election is made on an instrument-by-instrument basis to recognize fair value gains and losses in other comprehensive income.
Derivatives designated as hedging instruments in an effective hedge
Derivatives designated as hedging instruments in an effective hedge are carried on the balance sheet at fair value. The treatment of gains and losses arising from revaluation is described below in the accounting policy for derivative financial instruments and hedging activities.
Cash equivalents
Cash equivalents are held for the purpose of meeting short-term cash commitments and are short-term highly liquid investments that are readily convertible to known amounts of cash, are subject to insignificant risk of changes in value and generally have a maturity of three months or less from the date of acquisition. Cash equivalents are classified as financial assets measured at amortized cost or, in the case of certain money market funds, fair value through profit or loss.
Impairment of financial assets measured at amortized cost
The group assesses on a forward-looking basis the expected credit losses associated with financial assets measured at amortized cost at each balance sheet date. Expected credit losses are measured based on the maximum contractual period over which the group is exposed to credit risk. As lifetime expected credit losses are recognized for trade receivables and the tenor of substantially all other in-scope financial assets is less than 12 months there is no significant difference between the measurement of 12-month and lifetime expected credit losses for the group. The measurement of expected credit losses is a function of the probability of default, loss given default and exposure at default. The expected credit loss is estimated as the difference between the asset’s carrying amount and the present value of the future cash flows the group expects to receive discounted at the financial asset’s original effective interest rate. The carrying amount of the asset is adjusted, with the amount of the impairment gain or loss recognized in the income statement.
A financial asset or group of financial assets classified as measured at amortized cost is considered to be credit-impaired if there is reasonable and supportable evidence that one or more events that have a detrimental impact on the estimated future cash flows of the financial asset (or group of financial assets) have occurred. Financial assets are written off where the group has no reasonable expectation of recovering amounts due.
Equity instruments
Instruments are classified as either financial liabilities or as equity in accordance with the substance of the contractual arrangements. Instruments that cannot be settled in the group’s own equity instruments and that include no contractual obligation to deliver cash or another financial asset or to exchange financial assets or financial liabilities with another entity that are potentially unfavourable are classified as equity. Equity instruments issued by the group are recognized at the proceeds received, net of directly attributable issue costs.
180 | bp Annual Report and Form 20-F 2023 | |||||||||||||
| Financial statements | |||||
1. Material accounting policy information, significant judgements, estimates and assumptions – continued
Financial liabilities
Financial liabilities are recognized when the group becomes party to the contractual provisions of the instrument. The group derecognizes financial liabilities when the obligation specified in the contract is discharged, cancelled or expired. The measurement of financial liabilities depends on their classification, as follows:
Financial liabilities measured at fair value through profit or loss
Financial liabilities that meet the definition of held for trading are classified as measured at fair value through profit or loss. Such liabilities are carried on the balance sheet at fair value with gains or losses recognized in the income statement. Derivatives, other than those designated as effective hedging instruments, are included in this category.
Derivatives designated as hedging instruments in an effective hedge
Derivatives designated as hedging instruments in an effective hedge are carried on the balance sheet at fair value. The treatment of gains and losses arising from revaluation is described below in the accounting policy for derivative financial instruments and hedging activities.
Financial liabilities measured at amortized cost
All other financial liabilities are initially recognized at fair value, net of directly attributable transaction costs. For interest-bearing loans and borrowings this is typically equivalent to the fair value of the proceeds received, net of issue costs associated with the borrowing.
After initial recognition, other financial liabilities are subsequently measured at amortized cost using the effective interest method. Amortized cost is calculated by taking into account any issue costs and any discount or premium on settlement. Gains and losses arising on the repurchase, settlement or cancellation of liabilities are recognized in interest and other income and finance costs respectively.
This category of financial liabilities includes trade and other payables and finance debt.
| Significant judgement: supplier financing arrangements | ||
The group’s trade payables include some supplier arrangements that utilize letter of credit facilities. Judgement is required to assess the payables subject to these arrangements to determine whether they should continue to be classified as trade payables and give rise to operating cash flows or finance debt and financing cash flows. The criteria used in making this assessment include the payment terms for the amount due relative to terms commonly seen in the markets in which bp operates and whether the arrangements significantly change the nature of the liability. Liabilities subject to these arrangements with payment terms of up to approximately 60 days are generally considered to be trade payables and give rise to operating cash flows. At 31 December 2023, trade payables subject to these arrangements and this significant judgement included $ | ||
Financial guarantees
The group issues financial guarantee contracts to make specified payments to reimburse holders for losses incurred if certain associates, joint ventures or third-party entities fail to make payments when due in accordance with the original or modified terms of a debt instrument such as a loan. The liability for a financial guarantee contract is initially measured at fair value and subsequently measured at the higher of the contract’s estimated expected credit loss and the amount initially recognized less, where appropriate, cumulative amortization.
Derivative financial instruments and hedging activities
The group uses derivative financial instruments to manage certain exposures to fluctuations in foreign currency exchange rates, interest rates and commodity prices, as well as for trading purposes. These derivative financial instruments are recognized initially at fair value on the date on which a derivative contract is entered into and subsequently remeasured at fair value. Derivatives are carried as assets when the fair value is positive and as liabilities when the fair value is negative.
Contracts to buy or sell a non-financial item (for example, oil, oil products, gas or power) that can be settled net in cash, with the exception of contracts that were entered into and continue to be held for the purpose of the receipt or delivery of a non-financial item in accordance with the group’s expected purchase, sale or usage requirements, are accounted for as financial instruments. Gains or losses arising from changes in the fair value of derivatives that are not designated as effective hedging instruments are recognized in the income statement.
If, at inception of a contract, the valuation cannot be supported by observable market data, any gain or loss determined by the valuation methodology is not recognized in the income statement but is deferred on the balance sheet and is commonly known as a ‘day-one gain or loss’. This deferred gain or loss is recognized in the income statement over the life of the contract until substantially all the remaining contractual cash flows can be valued using observable market data at which point any remaining deferred gain or loss is recognized in the income statement. Changes in valuation subsequent to the initial valuation at inception of a contract are recognized immediately in the income statement.
For the purpose of hedge accounting, hedges are classified as:
•Fair value hedges when hedging exposure to changes in the fair value of a recognized asset or liability.
•Cash flow hedges when hedging exposure to variability in cash flows that is attributable to either a particular risk associated with a recognized asset or liability or a highly probable forecast transaction.
Hedge relationships are formally designated and documented at inception, together with the risk management objective and strategy for undertaking the hedge. The documentation includes identification of the hedging instrument, the hedged item or transaction, the nature of the risk being hedged, the existence at inception of an economic relationship and subsequent measurement of the hedging instrument's effectiveness in offsetting the exposure to changes in the hedged item’s fair value or cash flows attributable to the hedged risk, the hedge ratio and sources of hedge ineffectiveness. Hedges meeting the criteria for hedge accounting are accounted for as follows:
| bp Annual Report and Form 20-F 2023 | 181 | |||||||||||||
1. Material accounting policy information, significant judgements, estimates and assumptions – continued
Fair value hedges
The change in fair value of a hedging derivative is recognized in profit or loss. The change in the fair value of the hedged item attributable to the risk being hedged is recorded as part of the carrying value of the hedged item and is also recognized in profit or loss, where it offsets. The group applies fair value hedge accounting when hedging interest rate risk and certain currency risks on fixed rate finance debt.
Fair value hedge accounting is discontinued only when the hedging relationship or a part thereof ceases to meet the qualifying criteria. This includes when the risk management objective changes or when the hedging instrument is sold, terminated or exercised. The accumulated adjustment to the carrying amount of a hedged item at such time is then amortized prospectively to profit or loss as finance interest expense over the hedged item's remaining period to maturity.
Cash flow hedges
The effective portion of the gain or loss on a cash flow hedging instrument is reported in other comprehensive income, while the ineffective portion is recognized in profit or loss. Amounts reported in other comprehensive income are reclassified to the income statement when the hedged transaction affects profit or loss.
Where the hedged item is a highly probable forecast transaction that results in the recognition of a non-financial asset or liability, such as a forecast foreign currency transaction for the purchase of property, plant and equipment, the amounts recognized within other comprehensive income are transferred to the initial carrying amount of the non-financial asset or liability. Where the hedged item is an equity investment, the amounts recognized in other comprehensive income remain in the separate component of equity until the hedged cash flows affect profit or loss or when accounting under the equity method is discontinued. Where the hedged item is recognized directly in profit or loss, the amounts recognized in other comprehensive income are reclassified to production and manufacturing expenses or sales and other operating revenues as appropriate.
Cash flow hedge accounting is discontinued only when the hedging relationship or a part thereof ceases to meet the qualifying criteria. This includes when the designated hedged forecast transaction or part thereof is no longer considered to be highly probable to occur, or when the hedging instrument is sold, terminated or exercised without replacement or rollover. When cash flow hedge accounting is discontinued amounts previously recognized within other comprehensive income remain in equity until the forecast transaction occurs and are reclassified to profit or loss or transferred to the initial carrying amount of a non-financial asset or liability as above. If the forecast transaction is no longer expected to occur, amounts previously recognized within other comprehensive income will be immediately reclassified to profit or loss.
Costs of hedging
The foreign currency basis spread of cross-currency interest rate swaps are excluded from hedge designations and accounted for as costs of hedging. Changes in fair value of the foreign currency basis spread are recognized in other comprehensive income to the extent that they relate to the hedged item.
Fair value measurement
Fair value is the price that would be received to sell an asset or paid to transfer a liability in an orderly transaction between market participants. The group categorizes assets and liabilities measured at fair value into one of three levels depending on the ability to observe inputs employed in their measurement. Level 1 inputs are quoted prices in active markets for identical assets or liabilities. Level 2 inputs are inputs that are observable, either directly or indirectly, other than quoted prices included within level 1 for the asset or liability. Level 3 inputs are unobservable inputs for the asset or liability reflecting significant modifications to observable related market data or bp’s assumptions about pricing by market participants.
Significant estimate and judgement: derivative financial instruments | ||
In some cases the fair values of derivatives are estimated using internal models due to the absence of quoted prices or other observable, market-corroborated data. This primarily applies to the group’s longer-term derivative contracts. The majority of these contracts are valued using models with inputs that include price curves for each of the different products that are built up from available active market pricing data (including volatility and correlation) and modelled using the maximum available external information. Additionally, where limited data exists for certain products, prices are determined using historical and long-term pricing relationships. The use of alternative assumptions or valuation methodologies may result in significantly different values for these derivatives. A reasonably possible change in the price assumptions used in the models relating to index price would not have a material impact on net assets and the Group income statement primarily as a result of offsetting movements between derivative assets and liabilities. In some cases, judgement is required to determine whether contracts to buy or sell commodities meet the definition of a derivative or to determine appropriate presentation and classification of transactions in certain cases. In particular, contracts to buy and sell LNG are not considered to meet the definition as they are not considered capable of being net settled due to a lack of liquidity in the LNG market and the inability or lack of history of net settlement and are accounted for on an accruals basis, rather than as a derivative. Under IFRS, bp fair values the derivative financial instruments used to risk-manage the LNG contracts themselves, resulting in a measurement mismatch. For more information, including the carrying amounts of level 3 derivatives, see Note 30. | ||
Offsetting of financial assets and liabilities
Financial assets and liabilities are presented gross in the balance sheet unless both of the following criteria are met: the group currently has a legally enforceable right to set off the recognized amounts; and the group intends to either settle on a net basis or realize the asset and settle the liability simultaneously. A right of set off is the group’s legal right to settle an amount payable to a creditor by applying against it an amount receivable from the same counterparty. The relevant legal jurisdiction and laws applicable to the relationships between the parties are considered when assessing whether a current legally enforceable right to set off exists.
182 | bp Annual Report and Form 20-F 2023 | |||||||||||||
| Financial statements | |||||
1. Material accounting policy information, significant judgements, estimates and assumptions – continued
Provisions and contingencies
Provisions are recognized when the group has a present legal or constructive obligation as a result of a past event, it is probable that an outflow of resources embodying economic benefits will be required to settle the obligation and a reliable estimate can be made of the amount of the obligation. Where appropriate, the future cash flow estimates are adjusted to reflect risks specific to the liability.
If the effect of the time value of money is material, provisions are determined by discounting the expected future cash flows at a pre-tax risk-free rate that reflects current market assessments of the time value of money. Where discounting is used, the increase in the provision due to the passage of time is recognized within finance costs. Provisions are discounted using a nominal discount rate of 4% (2022 3.5% ) .
Provisions are split between amounts expected to be settled within 12 months of the balance sheet date (current) and amounts expected to be settled later (non-current).
Contingent liabilities are possible obligations whose existence will only be confirmed by future events not wholly within the control of the group, or present obligations where it is not probable that an outflow of resources will be required or the amount of the obligation cannot be measured with sufficient reliability. Contingent liabilities are not recognized in the consolidated financial statements but are disclosed, if material, unless the possibility of an outflow of economic resources is considered remote.
Decommissioning
Liabilities for decommissioning costs are recognized when the group has an obligation to plug and abandon a well, dismantle and remove a facility or an item of plant and to restore the site on which it is located, and when a reliable estimate of that liability can be made. Where an obligation exists for a new facility or item of plant, such as oil and natural gas production or transportation facilities, this liability will be recognized on construction or installation. Similarly, where an obligation exists for a well, this liability is recognized when it is drilled. An obligation for decommissioning may also crystallize during the period of operation of a well, facility or item of plant through a change in legislation or through a decision to terminate operations; an obligation may also arise in cases where an asset has been sold but the subsequent owner is no longer able to fulfil its decommissioning obligations, for example due to bankruptcy. The amount recognized is the present value of the estimated future expenditure determined in accordance with local conditions and requirements. The provision for the costs of decommissioning wells, production facilities and pipelines at the end of their economic lives is estimated using existing technology, at future prices, depending on the expected timing of the activity, and discounted using a nominal discount rate.
An amount equivalent to the decommissioning provision is recognized as part of the corresponding intangible asset (in the case of an exploration or appraisal well) or property, plant and equipment. The decommissioning portion of the property, plant and equipment is subsequently depreciated at the same rate as the rest of the asset. Other than the unwinding of discount on or utilization of the provision, any change in the present value of the estimated expenditure is reflected as an adjustment to the provision and the corresponding asset where that asset is generating or is expected to generate future economic benefits.
Environmental expenditures and liabilities
Environmental expenditures that are required in order for the group to obtain future economic benefits from its assets are capitalized as part of those assets. Expenditures that relate to an existing condition caused by past operations that do not contribute to future earnings are expensed.
Liabilities for environmental costs are recognized when a clean-up is probable and the associated costs can be reliably estimated. Generally, the timing of recognition of these provisions coincides with the commitment to a formal plan of action or, if earlier, on divestment or on closure of inactive sites.
The amount recognized is the best estimate of the expenditure required to settle the obligation. Provisions for environmental liabilities have been estimated using existing technology, at future prices and discounted using a nominal discount rate.
Emissions
Liabilities for emissions are recognized when the cumulative volumes of gases emitted by the group at the end of the reporting period exceed the allowances granted free of charge held for own use or a set baseline for emissions. The provision is measured at the best estimate of the expenditure required to settle the present obligation at the balance sheet date. It is based on the excess of actual emissions over the free allowances held or set baseline in tonnes (or other appropriate quantity) and is valued at the actual cost of any allowances that have been purchased and held for own use on a first-in-first-out (FIFO) basis, and, if insufficient allowances are held, for the remaining requirement on the basis of the spot market price of allowances at the balance sheet date. The majority of these provisions are typically settled within 12 months of the balance sheet date however certain schemes may have longer compliance periods. The cost of allowances purchased to cover a shortfall is recognized separately on the balance sheet as an intangible asset unless the emission allowances acquired or generated by the group are risk-managed by the trading and shipping function, then they are recognized on the balance sheet as inventory.
Restructuring provisions
Restructuring provisions are recognized where a detailed formal plan exists, and a valid expectation of risk of redundancy has been made to those affected but where the specific outcomes remain uncertain. Where formal redundancy offers have been made, the obligations for those amounts are reported as payables and, if not, as provisions if unpaid at the year-end.
| bp Annual Report and Form 20-F 2023 | 183 | |||||||||||||
1. Material accounting policy information, significant judgements, estimates and assumptions – continued
| Significant judgements and estimates: provisions | ||
The group holds provisions for the future decommissioning of oil and natural gas production facilities and pipelines at the end of their economic lives. The largest decommissioning obligations facing bp relate to the plugging and abandonment of wells and the removal and disposal of oil and natural gas platforms and pipelines around the world. Most of these decommissioning events are many years in the future and the precise requirements that will have to be met when the removal event occurs are uncertain. Decommissioning technologies and costs are constantly changing, as are political, environmental, safety and public expectations. The timing and amounts of future cash flows are subject to significant uncertainty and estimation is required in determining the amounts of provisions to be recognized. Any changes in the expected future costs are reflected in both the provision and, where still recognized, the asset. If oil and natural gas production facilities and pipelines are sold to third parties, judgement is required to assess whether the new owner will be unable to meet their decommissioning obligations, whether bp would then be responsible for decommissioning, and if so the extent of that responsibility. This typically requires assessment of the local legal requirements and the financial standing of the owner. If the standing deteriorates significantly, for example, bankruptcy of the owner, a provision may be required. The group has assessed that $ Decommissioning provisions associated with downstream refineries are generally not recognized, as the potential obligations cannot be measured, given their indeterminate settlement dates. Obligations may arise if refineries cease manufacturing operations and any such obligations would be recognized in the period when sufficient information becomes available to determine potential settlement dates. See Note 33 for further information. The group performs periodic reviews of its downstream refineries for any changes in facts and circumstances including those relating to the energy transition, that might require the recognition of a decommissioning provision. Portfolio strength and flexibility are such that the point of cessation of manufacturing at the group’s operating refineries is not yet expected within a determinate time period, as existing property plant and equipment is expected to be renewed or replaced. The provision for environmental liabilities is estimated based on current legal and constructive requirements, technology, price levels and expected plans for remediation. Actual costs and cash outflows can differ from current estimates because of changes in laws and regulations, public expectations, prices, discovery and analysis of site conditions and changes in clean-up technology. The timing and amount of future expenditures relating to decommissioning and environmental liabilities are reviewed annually. The interest rate used in discounting the cash flows is reviewed quarterly. The nominal interest rate used to determine the balance sheet obligations at the end of 2023 was The estimated phasing of undiscounted cash flows in real terms for upstream decommissioning is approximately $ Further information about the group’s provisions is provided in Note 23. Changes in assumptions in relation to the group's provisions could result in a material change in their carrying amounts within the next financial year. A The discounting impact on the group's decommissioning provisions for oil and gas properties in the oil productions & operations and gas & low carbon energy segments of a two-year change in the timing of expected future decommissioning expenditures is approximately $ If all expected future decommissioning expenditures were 10% higher, then these decommissioning provisions would increase by approximately $ As described in Note 33, the group is subject to claims and actions for which no provisions have been recognized. The facts and circumstances relating to particular cases are evaluated regularly in determining whether a provision relating to a specific litigation should be recognized or revised. Accordingly, significant management judgement relating to provisions and contingent liabilities is required, since the outcome of litigation is difficult to predict. | ||
Employee benefits
Wages, salaries, bonuses, social security contributions, paid annual leave and sick leave are accrued in the period in which the associated services are rendered by employees of the group. Deferred bonus arrangements that have a vesting date more than 12 months after the balance sheet date are valued on an actuarial basis using the projected unit credit method and amortized on a straight-line basis over the service period until the award vests. The material accounting policy information for pensions and other post-retirement benefits are described below.
184 | bp Annual Report and Form 20-F 2023 | |||||||||||||
| Financial statements | |||||
1. Material accounting policy information, significant judgements, estimates and assumptions – continued
Pensions and other post-retirement benefits
The cost of providing benefits under the group’s defined benefit plans is determined separately for each plan using the projected unit credit method, which attributes entitlement to benefits to the current period to determine current service cost and to the current and prior periods to determine the present value of the defined benefit obligation. Past service costs, resulting from either a plan amendment or a curtailment (a reduction in future obligations as a result of a material reduction in the plan membership), are recognized immediately when the company becomes committed to a change.
Net interest expense relating to pensions and other post-retirement benefits, which is recognized in the income statement, represents the net change in present value of plan obligations and the value of plan assets resulting from the passage of time, and is determined by applying the discount rate to the present value of the benefit obligation at the start of the year, and to the fair value of plan assets at the start of the year, taking into account expected changes in the obligation or plan assets during the year.
Remeasurements of the defined benefit liability and asset, comprising actuarial gains and losses, and the return on plan assets (excluding amounts included in net interest described above) are recognized within other comprehensive income in the period in which they occur and are not subsequently reclassified to profit and loss.
The defined benefit pension plan surplus or deficit recognized on the balance sheet for each plan comprises the difference between the present value of the defined benefit obligation (using a discount rate based on high quality corporate bonds) and the fair value of plan assets out of which the obligations are to be settled directly. Fair value is based on market price information and, in the case of quoted securities, is the published bid price. Defined benefit pension plan surpluses are only recognized to the extent they are recoverable, either by way of a refund from the plan or reductions in future contributions to the plan.
Contributions to defined contribution plans are recognized in the income statement in the period in which they become payable.
Significant estimate: pensions and other post-retirement benefits | ||
Accounting for defined benefit pensions and other post-retirement benefits involves making significant estimates when measuring the group's pension plan surpluses and deficits. These estimates require assumptions to be made about many uncertainties. Pensions and other post-retirement benefit assumptions are reviewed by management at the end of each year. These assumptions are used to determine the projected benefit obligation at the year end and hence the surpluses and deficits recorded on the group's balance sheet and pension and other post-retirement benefit expense for the following year. The assumptions that are the most significant to the amounts reported are the discount rate, inflation rate and mortality levels. Assumptions about these variables are based on the environment in each country. The assumptions used vary from year to year, with resultant effects on future net income and net assets. Changes to some of these assumptions, in particular the discount rate and inflation rate, could result in material changes to the carrying amounts of the group's pension and other post-retirement benefit obligations within the next financial year, in particular for the UK, US and Eurozone plans. Any differences between these assumptions and the actual outcome will also affect future net income and net assets. The values ascribed to these assumptions and a sensitivity analysis of the impact of changes in the assumptions on the benefit expense and obligation used are provided in Note 24. | ||
Income taxes
Income tax expense represents the sum of current tax and deferred tax.
Income tax is recognized in the income statement, except to the extent that it relates to items recognized in other comprehensive income or directly in equity, in which case the related tax is recognized in other comprehensive income or directly in equity.
Current tax is based on the taxable profit for the period. Taxable profit differs from net profit as reported in the income statement because it is determined in accordance with the rules established by the applicable taxation authorities. It therefore excludes items of income or expense that are taxable or deductible in other periods as well as items that are never taxable or deductible. The group’s liability for current tax is calculated using tax rates and laws that have been enacted or substantively enacted by the balance sheet date.
Deferred tax is provided, using the liability method, on temporary differences at the balance sheet date between the tax bases of assets and liabilities and their carrying amounts for financial reporting purposes. Deferred tax liabilities are recognized for all taxable temporary differences except:
•Where the deferred tax liability arises on the initial recognition of goodwill.
•Where the deferred tax liability arises on the initial recognition of an asset or liability in a transaction that is not a business combination, at the time of the transaction, affects neither accounting profit nor taxable profit or loss and, at the time of the transaction, does not give rise to equal taxable and deductible temporary differences.
•In respect of taxable temporary differences associated with investments in subsidiaries and associates and interests in joint arrangements, where the group is able to control the timing of the reversal of the temporary differences and it is probable that the temporary differences will not reverse in the foreseeable future.
| bp Annual Report and Form 20-F 2023 | 185 | |||||||||||||
1. Material accounting policy information, significant judgements, estimates and assumptions – continued
Deferred tax assets are recognized for deductible temporary differences, carry-forward of unused tax credits and unused tax losses, to the extent that it is probable that taxable profit will be available against which the deductible temporary differences and the carry-forward of unused tax credits and unused tax losses can be utilized, except where the deferred tax asset relating to the deductible temporary difference arises from the initial recognition of an asset or liability in a transaction that is not a business combination, at the time of the transaction, affects neither accounting profit nor taxable profit or loss and, at the time of the transaction, does not give rise to equal taxable and deductive temporary differences.
In respect of deductible temporary differences associated with investments in subsidiaries and associates and interests in joint arrangements, deferred tax assets are recognized only to the extent that it is probable that the temporary differences will reverse in the foreseeable future and taxable profit will be available against which the temporary differences can be utilized.
The carrying amount of deferred tax assets is reviewed at each balance sheet date and reduced to the extent that it is no longer probable or increased to the extent that it is probable that sufficient taxable profit will be available to allow all or part of the deferred tax asset to be utilized.
Deferred tax assets and liabilities are measured at the tax rates that are expected to apply in the period when the asset is realized or the liability is settled, based on tax rates (and tax laws) that have been enacted or substantively enacted at the balance sheet date. Deferred tax assets and liabilities are not discounted.
Deferred tax assets and liabilities are offset only when there is a legally enforceable right to set off current tax assets against current tax liabilities and when the deferred tax assets and liabilities relate to income taxes levied by the same taxation authority on either the same taxable entity or different taxable entities where there is an intention to settle the current tax assets and liabilities on a net basis or to realize the assets and settle the liabilities simultaneously.
Where tax treatments are uncertain, if it is considered probable that a taxation authority will accept the group's proposed tax treatment, income taxes are recognized consistent with the group's income tax filings. If it is not considered probable, the uncertainty is reflected within the carrying amount of the applicable tax asset or liability using either the most likely amount or an expected value, depending on which method better predicts the resolution of the uncertainty.
The computation of the group’s income tax expense and liability involves the interpretation of applicable tax laws and regulations in many jurisdictions throughout the world. The resolution of tax positions taken by the group, through negotiations with relevant tax authorities or through litigation, can take several years to complete and in some cases it is difficult to predict the ultimate outcome. Therefore, judgement is required to determine whether provisions for income taxes are required and, if so, estimation is required of the amounts that could be payable.
In addition, the group has carry-forward tax losses and tax credits in certain taxing jurisdictions that are available to offset against future taxable profit. However, deferred tax assets are recognized only to the extent that it is probable that taxable profit will be available against which the unused tax losses or tax credits can be utilized. Management judgement is exercised in assessing whether this is the case and estimates are required to be made of the amount of future taxable profits that will be available. Such judgements are inherently impacted by estimates affecting future taxable profits such as oil and natural gas prices and decommissioning expenditure, see 'Significant judgements and estimates: recoverability of asset carrying values and provisions'.
In May 2023, the IASB issued International Tax Reform – Pillar Two Model Rules - Amendments to IAS 12 Income Taxes to clarify the application of IAS 12 to tax legislation enacted or substantively enacted to implement Pillar Two of the Organisation for Economic Co-operation and Development’s Base Erosion and Profit Shifting project, which aims to address the tax challenges arising from the digitalisation of the economy. The amendments include a mandatory temporary exception from accounting for deferred tax on such tax law. In July 2023, the UK government enacted legislation to implement the Pillar Two rules. The legislation is effective for bp from 1 January 2024 and includes an income inclusion rule and a domestic minimum tax, which together are designed to ensure a minimum effective tax rate of 15% in each country in which the group operates. Similar legislation is being enacted by other governments around the world. In line with the amendments to IAS 12, the exception from accounting for deferred tax for the Pillar Two rules has been applied and there are no impacts on the consolidated financial statements for 2023. Based on an assessment of historic data and forecasts for the year ending 31 December 2024, the Group does not expect a material exposure to Pillar Two income taxes for the year ending 31 December 2024.
| Significant judgement and estimate: taxation | ||
The value of deferred tax assets and liabilities is an area involving inherent uncertainty and estimation and balances are therefore subject to risk of material change as a result of underlying assumptions and judgements used, in particular the forecast of future profitability used to determine the recoverability of deferred tax, for example future oil and gas prices, see ‘Significant judgement and estimates - Recoverability of asset carrying values’. It is impracticable to disclose the extent of the possible effects of profitability assumptions on the group’s deferred tax assets. It is reasonably possible that to the extent that actual outcomes differ from management’s estimates, material income tax charges or credits, and material changes in current and deferred tax assets or liabilities, may arise within the next financial year and in future periods. Judgement is required when determining whether a particular tax is an income tax or another type of tax (for example, a production tax). The attributes of the tax, including whether it is calculated on profits or another measure such as production or revenues, the extent of deductibility of costs and the interaction with existing income taxes, are considered in determining the classification of the tax. Accounting for deferred tax is applied to income taxes as described above but is not applied to other types of taxes; rather such taxes are recognized in the income statement in accordance with the applicable accounting policy such as Provisions and contingencies. This judgement is considered significant only in relation to the group’s taxes payable under the fiscal terms of bp’s onshore concession in Abu Dhabi. These are principally reported as income taxes rather than as production taxes. For more information see Note 9 and Note 33. | ||
Customs duties and sales taxes
Customs duties and sales taxes that are passed on or charged to customers are excluded from revenues and expenses. Assets and liabilities are recognized net of the amount of customs duties or sales tax except:
•Customs duties or sales taxes incurred on the purchase of goods and services which are not recoverable from the taxation authority are recognized as part of the cost of acquisition of the asset.
•Receivables and payables are stated with the amount of customs duty or sales tax included.
The net amount of sales tax recoverable from, or payable to, the taxation authority is included within receivables or payables in the balance sheet.
186 | bp Annual Report and Form 20-F 2023 | |||||||||||||
| Financial statements | |||||
1. Material accounting policy information, significant judgements, estimates and assumptions – continued
Own equity instruments – treasury shares
The group’s holdings in its own equity instruments are shown as deductions from shareholders’ equity. Treasury shares represent bp shares repurchased and available for specific and limited purposes. For accounting purposes, shares held in Employee Share Ownership Plans (ESOPs) to meet the future requirements of the employee share-based payment plans are treated in the same manner as treasury shares and are, therefore, included in the consolidated financial statements as treasury shares. The cost of treasury shares subsequently sold or reissued is calculated on a weighted-average basis. Consideration, if any, received for the sale of such shares is also recognized in equity. No gain or loss is recognized in the income statement on the purchase, sale, issue or cancellation of equity shares. Shares repurchased under the share buy-back programme which are immediately cancelled are not shown as treasury shares, but are shown as a deduction from the profit and loss account reserve in the group statement of changes in equity.
Revenue and other income
Revenue from contracts with customers is recognized when or as the group satisfies a performance obligation by transferring control of a promised good or service to a customer. The transfer of control of oil, natural gas, natural gas liquids, LNG, petroleum and chemical products, and other items usually coincides with title passing to the customer and the customer taking physical possession. The group principally satisfies its performance obligations at a point in time; the amounts of revenue recognized relating to performance obligations satisfied over time are not significant.
When, or as, a performance obligation is satisfied, the group recognizes as revenue the amount of the transaction price that is allocated to that performance obligation. The transaction price is the amount of consideration to which the group expects to be entitled. The transaction price is allocated to the performance obligations in the contract based on standalone selling prices of the goods or services promised.
Contracts for the sale of commodities are typically priced by reference to quoted prices. Revenue from term commodity contracts is recognized based on the contractual pricing provisions for each delivery. Certain of these contracts have pricing terms based on prices at a point in time after delivery has been made. Revenue from such contracts is initially recognized based on relevant prices at the time of delivery and subsequently adjusted as appropriate. All revenue from these contracts, both that recognized at the time of delivery and that from post-delivery price adjustments, is disclosed as revenue from contracts with customers.
Sales and purchase of commodities accounted for under IFRS 15 are presented on a gross basis in Revenue from contracts with customers and Purchases respectively. Physically settled derivatives which represent trading or optimization activities are presented net alongside financially settled derivative contracts in Other operating revenues within Sales and other operating income. Certain physically settled sale and purchase derivative contracts which are not part of trading and optimization activities are presented gross within Other operating revenues and Purchases respectively. Changes in the fair value of derivative assets and liabilities prior to physical delivery are also classified as other operating revenues.
Physical exchanges with counterparties in the same line of business in order to facilitate sales to customers are reported net, as are sales and purchases made with a common counterparty, as part of an arrangement similar to a physical exchange.
Where the group acts as agent on behalf of a third party to procure or market energy commodities, any associated fee income is recognized but no purchase or sale is recorded.
Interest income is recognized as the interest accrues (using the effective interest rate, that is, the rate that exactly discounts estimated future cash receipts through the expected life of the financial instrument to the net carrying amount of the financial asset).
Dividend income from investments is recognized when the shareholders’ right to receive the payment is established.
Contract asset and contract liability balances are included within amounts presented for trade receivables and other payables respectively.
Finance costs
Finance costs directly attributable to the acquisition, construction or production of qualifying assets, which are assets that necessarily take a substantial period of time to get ready for their intended use, are added to the cost of those assets until such time as the assets are substantially ready for their intended use. All other finance costs are recognized in the income statement in the period in which they are incurred.
Updates to material accounting policy information
Impact of new International Financial Reporting Standards
| bp Annual Report and Form 20-F 2023 | 187 | |||||||||||||
2. Non-current assets held for sale
The carrying amount of assets classified as held for sale at 31 December 2023 is $151 million (2022 $1,242 million), with associated liabilities of $62 million (2022 $321 million).
customers & products
On 16 November 2023, bp entered into an agreement to sell its Türkiye ground fuels business to Petrol Ofisi. This includes the group's interest in three joint venture terminals in Türkiye. Completion of the sale is subject to regulatory approvals. The carrying amount of assets classified as held for sale at 31 December 2023 is $151 million, with associated liabilities of $62 million. Cumulative foreign exchange losses within reserves of approximately $850 million are expected to be recycled to the group income statement at completion.
Transactions that have been classified as held for sale during 2023, but were completed by 31 December 2023, are described below.
gas & low carbon energy
The assets held for sale balance at 31 December 2022 included assets of $511 million and associated liabilities of $48 million relating to the agreement to sell bp's upstream business in Algeria to Eni. The transaction closed on 28 February 2023.
customers & products
In addition, at 31 December 2022 assets of $731 million and associated liabilities of $273 million were classified as held for sale relating to the sale of bp's 50 % interest in the bp-Husky Toledo refinery in Ohio US, to Cenovus Energy, its partner in the facility. The sale completed on 28 February 2023.
The total assets and liabilities held for sale at 31 December 2023 and 2022, which for 2023 are all in the customers & products segments and for 2022 in the gas & low carbon energy and customers & products segments, are set out in the table below.
| $ million | |||||||||||
| 2023 | 2022 | ||||||||||
| Property, plant and equipment | |||||||||||
| Goodwill | |||||||||||
| Intangible assets | |||||||||||
| Loans | |||||||||||
| Inventories | |||||||||||
| Cash | |||||||||||
| Trade and other receivables | |||||||||||
| Assets classified as held for sale | |||||||||||
| Trade and other payables | ( | ( | |||||||||
| Lease liabilities | ( | ( | |||||||||
| Provisions | ( | ( | |||||||||
| Deferred tax liabilities | ( | ||||||||||
| Defined benefit pension plan and other post-retirement benefit plan deficits | ( | ||||||||||
| Liabilities directly associated with assets classified as held for sale | ( | ( | |||||||||
188 | bp Annual Report and Form 20-F 2023 | |||||||||||||
| Financial statements | |||||
3. Business combinations and other significant transactions
Business combinations
2023
The group undertook a number of business combinations during 2023. Total consideration paid in cash amounted to $1,282 million (2022 $3,671 million), offset by cash acquired of $484 million (2022 $141 million).
The fair value of the net assets (including goodwill) recognized from business combinations in the full year, inclusive of measurement period adjustments for business combinations in previous periods, was $1,228 million (2022 $4,121 million). This principally related to the acquisition of TravelCenters of America.
2022
Archaea Energy
On 28 December 2022, bp acquired 100% of the issued common stock of Archaea Energy Inc. a leading producer of renewable natural gas (RNG) in the US, that was listed on the New York Stock Exchange.
The total cash consideration for the transaction, all paid at completion, was $3,137 million.
The transaction was accounted for as a business combination using the acquisition method. As the transaction completed shortly prior to the end of the reporting period, the acquisition-date fair values of the assets and liabilities acquired reported in 2022 were provisional. The final and provisional fair values of the identifiable assets and liabilities acquired, as at the date of acquisition are shown in the table below. The measurement period adjustments between the provisional and final values were recognized in 2023 as the impact on the comparative period was not material. The intangible assets recognized are primarily the biogas rights agreements Archaea Energy has with landfill owners. The goodwill recognized reflects the part of the project development pipeline that did not qualify for separate recognition at the acquisition date and goodwill arising from recognition of deferred tax liabilities on fair value uplifts. The goodwill balance is not expected to be deductible for tax purposes.
The transaction included a step acquisition of the Mavrix LLC joint venture, which bp and Archaea Energy each held a 50 % interest in prior to this transaction. The final fair value of bp’s interest in Mavrix LLC immediately before the acquisition date was $303 million and the gain recognized in ‘Interest and other income’, initially in 2022 and revised in 2023, as a result of remeasuring this interest to fair value was $196 million.
| $ million | |||||||||||
| Provisional | Final | ||||||||||
| Assets | |||||||||||
| Property plant and equipment | |||||||||||
| Goodwill | |||||||||||
| Intangible assets | |||||||||||
| Investments in equity-accounted entities | |||||||||||
| Inventory | |||||||||||
| Trade and other receivables | |||||||||||
| Cash and cash equivalents | |||||||||||
| Liabilities | |||||||||||
| Trade and other payables | ( | ( | |||||||||
| Finance debt | ( | ( | |||||||||
| Deferred tax liabilities | ( | ( | |||||||||
| Provisions | ( | ( | |||||||||
| Non-controlling interest | ( | ( | |||||||||
| Total consideration | |||||||||||
| Of which: | |||||||||||
| Cash | |||||||||||
| Fair value of previously held interest in Mavrix LLC | |||||||||||
| bp Annual Report and Form 20-F 2023 | 189 | |||||||||||||
4. Disposals and impairment
The following amounts were recognized in the income statement in respect of disposals and impairments.
| $ million | ||||||||||||||
| 2023 | 2022 | 2021 | ||||||||||||
| Gains on sale of businesses and fixed assets | ||||||||||||||
| gas & low carbon energy | ||||||||||||||
| oil production & operations | ||||||||||||||
| customers & products | ( | |||||||||||||
| other businesses & corporate | ||||||||||||||
| $ million | ||||||||||||||
| 2023 | 2022 | 2021 | ||||||||||||
| Losses on sale of businesses and fixed assets, and closures | ||||||||||||||
| gas & low carbon energy | ||||||||||||||
| oil production & operations | ||||||||||||||
| customers & products | ||||||||||||||
| other businesses & corporate | ( | |||||||||||||
| Impairment losses | ||||||||||||||
| gas & low carbon energy | ||||||||||||||
| oil production & operations | ||||||||||||||
| customers & products | ||||||||||||||
| other businesses & corporate | ||||||||||||||
| Impairment reversals | ||||||||||||||
| gas & low carbon energy | ( | ( | ( | |||||||||||
| oil production & operations | ( | ( | ( | |||||||||||
| customers & products | ( | ( | ||||||||||||
| other businesses & corporate | ( | ( | ||||||||||||
| ( | ( | ( | ||||||||||||
| Impairment and losses on sale of businesses and fixed assets, and closures | ( | |||||||||||||
Disposals
Disposal proceeds and principal gains and losses on disposals by segment are described below.
| $ million | ||||||||||||||
| 2023 | 2022 | 2021 | ||||||||||||
| Proceeds from disposals of fixed assets | ||||||||||||||
| Proceeds from disposals of businesses, net of cash disposed | ||||||||||||||
| By business | ||||||||||||||
| gas & low carbon energy | ||||||||||||||
| oil production & operations | ||||||||||||||
| customers & products | ||||||||||||||
| other businesses & corporate | ||||||||||||||
Proceeds from disposals of businesses in 2023 includes $477 million relating to the sale of the upstream business in Algeria to Eni and $351 million relating to the disposal of the bp-Husky Toledo refinery to Cenovus Energy. At 31 December 2023, deferred consideration relating to disposals amounted to $141 million receivable within one year (2022 $191 million and 2021 $205 million) and $217 million receivable after one year (2022 $194 million and 2021 $823 million). The amounts of deferred consideration are reported within Trade and other receivables in Other receivables in the group balance sheet. In addition, contingent consideration receivable relating to disposals amounted to $1,694 million at 31 December 2023 (2022 $1,896 million and 2021 $1,917 million). The contingent consideration at 31 December 2023 relates to the prior period disposals of our Alaskan business and certain assets in the North Sea and the disposal of our 50 % interest in the Sunrise oil sands project in Canada. These amounts of contingent consideration are reported within Other investments on the group balance sheet - see Note 18 for further information.
Gains and losses on sale of businesses and fixed assets, and closures
gas & low carbon energy
In 2021 gains on disposal of businesses and fixed assets were principally related to a $1,031 million gain on disposal of a 20 % participating interest in Block 61 in Oman.
190 | bp Annual Report and Form 20-F 2023 | |||||||||||||
| Financial statements | |||||
4. Disposals and impairment – continued
oil production & operations
In 2023 gains principally related to prior period disposals in the US and Canada.
In 2022 gains principally related to a gain of $1,932 million arising from the contribution of bp's Angolan business to Azule Energy, a gain of $904 million related to the deemed disposal of 12 % of the group's interest in Aker BP, an associate of bp, following completion of Aker BP's acquisition of Lundin Energy, and $349 million in relation to the disposal of the group's interest in the Rumaila field in Iraq to Basra Energy Company, an associate of bp.
Losses included $479 million of accumulated exchange losses previously charged to equity and taken to the income statement as a result of the decision to exit bp's other businesses with Rosneft within Russia.
In 2021 gains principally resulted from adjustments to disposals in prior periods. Gains include $171 million from the disposal of a 2.1 % interest in Aker BP in the North Sea, $100 million from the disposal of certain exploration assets in Brazil, and $502 million fair value movements in relation to deferred and contingent consideration in relation to prior disposals in Alaska and the North Sea.
customers & products
In 2022, gains principally relate to a gain of $268 million arising from the divestment of our Swiss retail assets.
other businesses and corporate
In 2022 the losses on disposal of businesses and fixed assets was $11,082 million in respect of the decision to exit our holding in Rosneft which resulted in the reclassification to the income statement of $10,372 million of accumulated exchange losses, a cash flow hedge reserve of $651 million relating to the original acquisition of Rosneft shares and bp's cumulative share of Rosneft's other comprehensive income of $59 million which were all previously charged to equity.
Summarized financial information relating to the sale of businesses is shown in the table below.
The principal transactions categorized as a business disposal in 2023 were the sale of the upstream business in Algeria to Eni and the disposal of the bp-Husky Toledo refinery to Cenovus Energy.
The principal transactions categorized as a business disposal in 2022 were the formation of Azule Energy, the formation of Basra Energy Company and the sale of our 50 % interest in the Sunrise oil sands project in Canada.
The principal transaction categorized as a business disposal in 2021 was the sale of a 20 % participating interest from bp’s 60 % participating interest in Block 61 in Oman.
| $ million | ||||||||||||||
| 2023 | 2022 | 2021 | ||||||||||||
| Non-current assets | ||||||||||||||
| Current assets | ||||||||||||||
| Non-current liabilities | ( | ( | ( | |||||||||||
| Current liabilities | ( | ( | ( | |||||||||||
| Total carrying amount of net assets disposed | ||||||||||||||
| Recycling of foreign exchange on disposal | ( | |||||||||||||
| Costs on disposal | ( | |||||||||||||
| Gains (losses) on sale of businesses | ||||||||||||||
| Total consideration | ||||||||||||||
| Non-cash consideration | ( | ( | ( | |||||||||||
| Consideration received (receivable) | ( | |||||||||||||
Proceeds from the sale of businesses, net of cash disposeda | ||||||||||||||
aProceeds are stated net of cash and cash equivalents disposed of $33 million (2022 $318 million and 2021 $2 million).
Impairments
Impairment losses and impairment reversals in each segment are described below. For information on significant estimates and judgements made in relation to impairments see Impairment of property, plant and equipment, intangibles, goodwill and equity-accounted entities within Note 1. See also Note 12, and Note 15 for further information on impairments by asset category.
gas & low carbon energy
The 2023 impairment loss of $2,213 million primarily relates to losses incurred in respect of certain assets in Mauritania & Senegal ($1,434 million) and principally arose as a result of increased forecast future expenditure. A further $565 million relates to producing assets in Trinidad and arose as a result of changes to the group's oil and gas price and discount rate assumptions and activity phasing. The recoverable amount of all CGUs for which impairment charges or reversals were recognized in 2023 in total, based on their value in use, is $4,811 million.
The 2022 impairment loss of $745 million primarily relates to losses incurred in respect of certain assets in Mauritania & Senegal ($729 million) and principally arose as a result of increased forecast future expenditure. The 2022 impairment reversal of $1,333 million primarily relates to the Trinidad CGU ($1,331 million) and principally arose as a result of changes to the group's oil and gas price assumptions. The recoverable amount of all CGUs for which impairment charges or reversals were recognized in 2022 in total, based on their value in use, is $9,609 million.
| bp Annual Report and Form 20-F 2023 | 191 | |||||||||||||
4. Disposals and impairment – continued
The 2021 impairment loss of $834 million primarily relates to losses incurred in respect of certain assets in Mauritania & Senegal ($819 million) and principally arose as a result of increased forecast future expenditure. The 2021 impairment reversal of $2,338 million primarily relates to reversals in respect of producing assets in the KGD6 CGU in India ($1,229 million) and the Trinidad CGU ($600 million) and principally arose as a result of changes to the group's oil and gas price assumptions and re-assessment of reserves. The recoverable amount of all CGUs for which impairment charges or reversals were recognized in 2021 in total, based on their value in use, is $17,330 million.
oil production & operations
Impairment losses and reversals in all years relate primarily to producing assets and, in 2022, equity accounted investments.
The 2023 impairment loss of $1,840 million primarily arose as a result of changes to the group's oil and gas price and discount rate assumptions, activity phasing and disposal decisions in relation to certain assets in North Sea ($852 million) and in bpx energy ($802 million). The recoverable amount of all CGUs for which impairment charges or reversals were recognized in 2023 in total, based on their value in use, is $14,072 million.
The 2022 impairment loss of $4,480 million primarily relates to impairment of the Pan American Energy Group S.L. joint venture as a result of expected portfolio changes ($2,900 million) and the decision to exit bp's other businesses with Rosneft within Russia ($1,043 million). The 2022 impairment reversal of $893 million principally relates to changes in price and reserves assumptions in the North Sea ($643 million). The recoverable amount of all CGUs for which impairment charges or reversals were recognized in 2022 in total, based on their value in use, is $7,831 million.
The 2021 impairment loss of $1,617 million principally relates to the decision to exit the Sunrise oil sands project in Canada ($1,109 million). The 2021 impairment reversals of $2,479 million principally arose as a result of changes to the group’s oil and gas price assumptions and re-assessment of reserves. They include amounts in BPX Energy ($1,356 million) and the North Sea ($950 million). The principal CGU on which a significant impairment reversal was recognized was $982 million for Hawkville in BPX Energy. The recoverable amount of all CGUs for which impairment charges or reversals were recognized in 2021, based on their value in use, is $16,586 million.
customers & products
The 2023 impairment loss of $1,614 million primarily relates to strategy implementation and changes to economic assumptions in the products business including an impairment of the Gelsenkirchen refinery in Germany ($1,336 million). The recoverable amounts of the CGUs were based on value-in-use calculations. The recoverable amount of all CGUs for which impairment charges or reversals were recognized in 2023 in total, based on their value in use, is $327 million.
The 2022 impairment loss of $1,874 million primarily relates to changes in economic assumptions in the products business including an impairment of the Gelsenkirchen refinery in Germany ($1,366 million), and announced portfolio changes. The recoverable amounts of the CGUs were based on value-in-use calculations. The recoverable amount of all CGUs for which impairment charges or reversals were recognized in 2022 in total, based on their value in use, is $1,648 million.
2021 impairment loss of $962 million principally relates to announced portfolio changes in the products business ($595 million).
Other businesses and corporate
The 2022 impairment loss of $13,536 million arises primarily a result of bp's decision to exit its shareholding in Rosneft ($13,479 million, including $528 million which relates to estimated earnings in the first two months of the year prior to the loss of significant influence). The recoverable amount of the CGU which comprises Rosneft is estimated to be $nil .
Impairment losses totalling $63 million were recognized in 2021.
192 | bp Annual Report and Form 20-F 2023 | |||||||||||||
| Financial statements | |||||
5. Segmental analysis
The group’s organizational structure reflects the various activities in which bp is engaged as well as how performance and resource allocation is evaluated by the chief operating decision maker. At 31 December 2023, bp has three reportable segments: Gas & low carbon energy, Oil production & operations, and Customers & products. Each are managed separately, with decisions taken for the segment as a whole, and represent a single operating segment that does not result from aggregating two or more segments.
Gas & low carbon energy comprises regions with upstream businesses that predominantly produce natural gas, gas marketing and trading activities and the group's solar, wind and hydrogen businesses.
Oil production & operations comprises regions with upstream activities that predominantly produce crude oil.
Customers & products comprises the group’s customer-focused businesses, which includes convenience and retail fuels, EV charging, as well as Castrol, aviation and B2B and midstream. It also includes our products businesses, refining & oil trading, as well as our bioenergy businesses.
Other businesses and corporate also comprises the group’s shipping and treasury functions, and corporate activities worldwide.
The accounting policies of the operating segments are the same as the group’s accounting policies described in Note 1. However, IFRS requires that the measure of profit or loss disclosed for each operating segment is the measure that is provided regularly to the chief operating decision maker for the purposes of performance assessment and resource allocation. For bp, this measure of profit or loss is replacement cost profit or loss before interest and tax which reflects the replacement cost of supplies by excluding from profit or loss before interest and tax inventory holding gains and lossesa. Replacement cost profit or loss before interest and tax for the group is not a recognized measure under IFRS.
Sales between segments are made at prices that approximate market prices, taking into account the volumes involved. Segment revenues and segment results include transactions between business segments. These transactions and any unrealized profits and losses are eliminated on consolidation, unless unrealized losses provide evidence of an impairment of the asset transferred. Sales to external customers by region are based on the location of the group subsidiary which made the sale. The UK region includes the UK-based international activities of customers & products.
All surpluses and deficits recognized on the group balance sheet in respect of pension and other post-retirement benefit plans are allocated to Other businesses and corporate. However, the periodic expense relating to these plans is allocated to the operating segments based upon the business in which the employees work.
Certain financial information is provided separately for the US as this is an individually material country for bp, and for the UK as this is bp’s country of domicile.
aInventory holding gains and losses represent:
•the difference between the cost of sales calculated using the replacement cost of inventory and the cost of sales calculated on the first-in first-out (FIFO) method after adjusting for any changes in provisions where the net realizable value of the inventory is lower than its cost. Under the FIFO method, which we use for IFRS reporting of inventories other than for trading inventories, the cost of inventory charged to the income statement is based on its historical cost of purchase or manufacture, rather than its replacement cost. In volatile energy markets, this can have a significant distorting effect on reported income. The amounts disclosed as inventory holding gains and losses represent the difference between the charge to the income statement for inventory on a FIFO basis (after adjusting for any related movements in net realizable value provisions) and the charge that would have arisen based on the replacement cost of inventory. For this purpose, the replacement cost of inventory is calculated using data from each operation’s production and manufacturing system, either on a monthly basis, or separately for each transaction where the system allows this approach.
•an adjustment relating to certain trading inventories that are not price risk managed which relate to a minimum inventory volume that is required to be held to maintain underlying business activities. This adjustment represents the movement in fair value of the inventories due to prices, on a grade-by-grade basis, during the period. This is calculated from each operation’s inventory management system on a monthly basis using the discrete monthly movement in market prices for these inventories.
The amounts disclosed are not separately reflected in the financial statements as a gain or loss. No adjustment is made in respect of the cost of inventories held as part of a trading position and certain other temporary inventory positions that are price risk-managed.
| bp Annual Report and Form 20-F 2023 | 193 | |||||||||||||
5. Segmental analysis – continued
| $ million | |||||||||||||||||||||||
| 2023 | |||||||||||||||||||||||
| By business | gas & low carbon energy | oil production & operations | customers & products | other businesses & corporate | Consolidation adjustment and eliminations | Total group | |||||||||||||||||
| Segment revenues | |||||||||||||||||||||||
| Sales and other operating revenues | ( | ||||||||||||||||||||||
| Less: sales and other operating revenues between segments | ( | ( | ( | ( | |||||||||||||||||||
| Third party sales and other operating revenues | |||||||||||||||||||||||
| Earnings from joint ventures and associates – after interest and tax | ( | ( | |||||||||||||||||||||
| Segment results | |||||||||||||||||||||||
| Replacement cost profit (loss) before interest and taxation | ( | ( | |||||||||||||||||||||
Inventory holding gains (losses)a | ( | ( | |||||||||||||||||||||
| Profit (loss) before interest and taxation | ( | ( | |||||||||||||||||||||
| Finance costs | ( | ||||||||||||||||||||||
| Net finance income relating to pensions and other post-retirement benefits | |||||||||||||||||||||||
| Profit before taxation | |||||||||||||||||||||||
| Other income statement items | |||||||||||||||||||||||
| Depreciation, depletion and amortization | |||||||||||||||||||||||
| US | |||||||||||||||||||||||
| Non-US | |||||||||||||||||||||||
| Charges for provisions, net of write-back of unused provisions, including change in discount rate | |||||||||||||||||||||||
| Segment assets | |||||||||||||||||||||||
| Investments in joint ventures and associates | |||||||||||||||||||||||
Additions to non-current assetsb | |||||||||||||||||||||||
aSee explanation of inventory holding gains and losses on page 193.
bIncludes additions to property, plant and equipment; goodwill; intangible assets; investments in joint ventures; and investments in associates.
194 | bp Annual Report and Form 20-F 2023 | |||||||||||||
| Financial statements | |||||
5. Segmental analysis – continued
| $ million | |||||||||||||||||||||||
| 2022 | |||||||||||||||||||||||
| By business | gas & low carbon energy | oil production & operations | customers & products | other businesses & corporate | Consolidation adjustment and eliminations | Total group | |||||||||||||||||
| Segment revenues | |||||||||||||||||||||||
| Sales and other operating revenues | ( | ||||||||||||||||||||||
Less: sales and other operating revenues between segments | ( | ( | ( | ( | |||||||||||||||||||
| Third party sales and other operating revenues | |||||||||||||||||||||||
Earnings from joint ventures and associates – after interest and tax | |||||||||||||||||||||||
| Segment results | |||||||||||||||||||||||
Replacement cost profit (loss) before interest and taxation | ( | ||||||||||||||||||||||
Inventory holding gains (losses)a | ( | ( | |||||||||||||||||||||
| Profit (loss) before interest and taxation | ( | ||||||||||||||||||||||
| Finance costs | ( | ||||||||||||||||||||||
| Net finance income relating to pensions and other post-retirement benefits | |||||||||||||||||||||||
| Profit before taxation | |||||||||||||||||||||||
| Other income statement items | |||||||||||||||||||||||
| Depreciation, depletion and amortization | |||||||||||||||||||||||
| US | |||||||||||||||||||||||
| Non-US | |||||||||||||||||||||||
Charges for provisions, net of write-back of unused provisions, including change in discount rate | ( | ||||||||||||||||||||||
| Segment assets | |||||||||||||||||||||||
Investments in joint ventures and associates | |||||||||||||||||||||||
Additions to non-current assetsb | |||||||||||||||||||||||
aSee explanation of inventory holding gains and losses on page 193.
bIncludes additions to property, plant and equipment; goodwill; intangible assets; investments in joint ventures; and investments in associates.
| bp Annual Report and Form 20-F 2023 | 195 | |||||||||||||
5. Segmental analysis – continued
| $ million | |||||||||||||||||||||||
| 2021 | |||||||||||||||||||||||
| By business | gas & low carbon energy | oil production & operations | customers & products | other businesses & corporate | Consolidation adjustment and eliminations | Total group | |||||||||||||||||
| Segment revenues | |||||||||||||||||||||||
| Sales and other operating revenues | ( | ||||||||||||||||||||||
Less: sales and other operating revenues between segments | ( | ( | ( | ( | |||||||||||||||||||
| Third party sales and other operating revenues | |||||||||||||||||||||||
Earnings from joint ventures and associates – after interest and tax | |||||||||||||||||||||||
| Segment results | |||||||||||||||||||||||
Replacement cost profit (loss) before interest and taxation | ( | ( | |||||||||||||||||||||
Inventory holding gains (losses)a | |||||||||||||||||||||||
| Profit (loss) before interest and taxation | ( | ( | |||||||||||||||||||||
| Finance costs | ( | ||||||||||||||||||||||
| Net finance income relating to pensions and other post-retirement benefits | |||||||||||||||||||||||
| Profit before taxation | |||||||||||||||||||||||
| Other income statement items | |||||||||||||||||||||||
| Depreciation, depletion and amortization | |||||||||||||||||||||||
| US | |||||||||||||||||||||||
| Non-US | |||||||||||||||||||||||
Charges for provisions, net of write-back of unused provisions, including change in discount rate | |||||||||||||||||||||||
| Segment assets | |||||||||||||||||||||||
Investments in joint ventures and associates | |||||||||||||||||||||||
Additions to non-current assetsb | |||||||||||||||||||||||
aSee explanation of inventory holding gains and losses on page 193.
bIncludes additions to property, plant and equipment; goodwill; intangible assets; investments in joint ventures; and investments in associates.
| $ million | ||||||||||||||
| 2023 | ||||||||||||||
| By geographical area | US | Non-US | Total | |||||||||||
| Revenues | ||||||||||||||
Third party sales and other operating revenuesa | ||||||||||||||
| Other income statement items | ||||||||||||||
| Production and similar taxes | ||||||||||||||
| Non-current assets | ||||||||||||||
Non-current assetsb c | ||||||||||||||
aNon-US region includes UK $39,975 million
bNon-US region includes UK $23,949 million
cIncludes property, plant and equipment; goodwill; intangible assets; investments in joint ventures; investments in associates; and non-current prepayments.
| $ million | ||||||||||||||
| 2022 | ||||||||||||||
| By geographical area | US | Non-US | Total | |||||||||||
| Revenues | ||||||||||||||
Third party sales and other operating revenuesa | ||||||||||||||
| Other income statement items | ||||||||||||||
| Production and similar taxes | ||||||||||||||
| Non-current assets | ||||||||||||||
Non-current assetsb c | ||||||||||||||
aNon-US region includes UK $36,541 million.
bNon-US region includes UK $24,813 million.
cIncludes property, plant and equipment; goodwill; intangible assets; investments in joint ventures; investments in associates; and non-current prepayments.
196 | bp Annual Report and Form 20-F 2023 | |||||||||||||
| Financial statements | |||||
5. Segmental analysis – continued
| $ million | ||||||||||||||
| 2021 | ||||||||||||||
| By geographical area | US | Non-US | Total | |||||||||||
| Revenues | ||||||||||||||
Third party sales and other operating revenuesa | ||||||||||||||
| Other income statement items | ||||||||||||||
| Production and similar taxes | ||||||||||||||
| Non-current assets | ||||||||||||||
Non-current assetsb c | ||||||||||||||
aNon-US region includes UK $11,248 million.
bNon-US region includes UK $19,530 million.
cIncludes property, plant and equipment; goodwill; intangible assets; investments in joint ventures; investments in associates; and non-current prepayments.
6. Sales and other operating revenues
| $ million | ||||||||||||||
| 2023 | 2022 | 2021 | ||||||||||||
| Crude oil | ||||||||||||||
| Oil products | ||||||||||||||
| Natural gas, LNG and NGLs | ||||||||||||||
| Non-oil products and other revenues from contracts with customers | ||||||||||||||
| Revenue from contracts with customers | ||||||||||||||
Other operating revenuesa | ||||||||||||||
| Total sales and other operating revenues | ||||||||||||||
aPrincipally relates to commodity derivative transactions including sales of bp own production in trading books.
.
An analysis of third-party sales and other operating revenues by segment and region is provided in Note 5.
The group’s sales to customers of crude oil and oil products were substantially all made by the customers & products segment. The group’s sales to customers of natural gas, LNG and NGLs were made by the gas & low carbon energy segment. A significant majority of the group’s sales of non-oil products and other revenues from contracts with customers were made by the customers & products segment.
7. Income statement analysis
| $ million | ||||||||||||||
| 2023 | 2022 | 2021 | ||||||||||||
| Interest and other income | ||||||||||||||
| Interest income from | ||||||||||||||
| Financial assets measured at amortized cost | ||||||||||||||
| Financial assets measured at fair value through profit or loss | ||||||||||||||
| Other income | ||||||||||||||
Currency exchange losses charged to the income statementa | ||||||||||||||
| Expenditure on research and development | ||||||||||||||
Costs relating to the Gulf of Mexico oil spill (pre-interest and tax)b | ||||||||||||||
| Finance costs | ||||||||||||||
| Interest expense on lease liabilities | ||||||||||||||
Interest expense on other liabilities measured at amortized costc | ||||||||||||||
Capitalized at | ( | ( | ( | |||||||||||
Finance debt risk management activitiese | ( | |||||||||||||
| Unwinding of discount on provisions | ||||||||||||||
| Unwinding of discount on other payables measured at amortized cost | ||||||||||||||
aExcludes exchange gains and losses arising on financial instruments measured at fair value through profit or loss.
bIncluded within production and manufacturing expenses.
c2023 includes a loss of $49 million (2022 gain of $37 million and 2021 loss of $195 million) associated with the buyback of finance debt.
dTax relief on capitalized interest is approximately $130 million (2022 $108 million and 2021 $66 million).
eRelates to temporary valuation differences associated with the group’s interest rate and foreign currency exchange risk management of finance debt.
| bp Annual Report and Form 20-F 2023 | 197 | |||||||||||||
8. Exploration for and evaluation of oil and natural gas resources
The following financial information represents the amounts included within the group totals relating to activity associated with the exploration for and evaluation of oil and natural gas resources. All such activity is recorded within the gas & low carbon energy and oil production & operations segments.
For information on significant judgements made in relation to oil and natural gas accounting see Intangible assets in Note 1.
| $ million | ||||||||||||||
| 2023 | 2022 | 2021 | ||||||||||||
| Exploration and evaluation costs | ||||||||||||||
| Exploration expenditure written off | ||||||||||||||
Other exploration costs | ||||||||||||||
| Exploration expense for the year | ||||||||||||||
| Impairment losses | ||||||||||||||
Intangible assets – exploration and appraisal expenditurea | ||||||||||||||
| Liabilities | ||||||||||||||
| Net assets | ||||||||||||||
| Cash used in operating activities | ||||||||||||||
| Cash used in investing activities | ||||||||||||||
aAmount capitalized at 31 December 2023, 2022 and 2021 relates to assets in various regions. The largest of these is approximately $600 million capitalized in the Middle East region (2022 approximately $600 million and 2021 approximately $700 million and capitalized in the Middle East region).
9. Taxation
Tax on profit
| $ million | ||||||||||||||
| 2023 | 2022 | 2021 | ||||||||||||
| Current tax | ||||||||||||||
| Charge for the year | ||||||||||||||
| Adjustment in respect of prior years | ( | |||||||||||||
| Deferred tax | ||||||||||||||
Origination and reversal of temporary differences in the current yeara | ( | |||||||||||||
Adjustment in respect of prior yearsb | ( | ( | ( | |||||||||||
| ( | ||||||||||||||
| Tax charge on profit | ||||||||||||||
a2022 includes a charge of $1,834 million in respect of the impact of the UK Energy Profits Levy on existing temporary differences unwinding over the period 1 January 2023 to 31 March 2028.
bThe adjustment in respect of prior years reflects the reassessment of the deferred tax balances for prior periods in light of changes in facts and circumstances during the year, including changes to price assumptions and profit forecasts. 2023 also includes a credit of $232 million in respect of a revision to the deferred tax impact of the UK Energy Profits Levy.
In 2023, the total tax credit recognized within other comprehensive income was $735 million (2022 $266 million charge and 2021 $1,252 million charge). In 2023 and 2021 this primarily comprises the deferred tax impact of the remeasurements of the net pension and other post-retirement benefit liability or asset. In 2022 this primarily comprises a release of deferred withholding tax on other comprehensive income movements relating to Rosneft. See Note 32 for further information.
The total tax charge recognized directly in equity was $56 million (2022 $214 million credit and 2021 $170 million charge). This mainly relates to transactions involving non-controlling interests.
198 | bp Annual Report and Form 20-F 2023 | |||||||||||||
| Financial statements | |||||
9. Taxation – continued
Reconciliation of the effective tax rate
The following table provides a reconciliation of the group weighted average statutory corporate income tax rate to the effective tax rate of the group on profit or loss before taxation. For 2022 the items presented in the reconciliation are affected by the impacts of Rosneft. In order to provide a more meaningful analysis of the effective tax rate for 2022, the table also presents a separate reconciliation for the group excluding the impacts of Rosneft, and for the impacts of Rosneft in isolation.
| $ million | ||||||||||||||||||||
| 2023 | 2022 excluding impact of Rosneft | 2022 impact of Rosnefta | 2022 | 2021 | ||||||||||||||||
| Profit (loss) before taxation | ( | |||||||||||||||||||
Tax charge (credit) on profit or lossb | ( | |||||||||||||||||||
| Effective tax rate | ||||||||||||||||||||
| % | ||||||||||||||||||||
Tax rate computed at the weighted average statutory ratec | ||||||||||||||||||||
Increase (decrease) resulting from | ||||||||||||||||||||
Tax reported in equity-accounted entitiesd | ( | ( | ( | ( | ||||||||||||||||
Adjustments in respect of prior years | ( | ( | ( | ( | ||||||||||||||||
| Deferred tax not recognized | ( | ( | ||||||||||||||||||
Tax incentives for investment | ( | ( | ||||||||||||||||||
Disposal impactse | ( | ( | ( | |||||||||||||||||
Foreign exchange | ||||||||||||||||||||
Items not deductible for tax purposes | ||||||||||||||||||||
| Impact of bp's decision to exit its shareholding in Rosneft | ( | |||||||||||||||||||
Tax rate change effect of UK Energy Profits Levyf | ||||||||||||||||||||
| Other | ( | |||||||||||||||||||
| Effective tax rate | ||||||||||||||||||||
aIncludes the impact of bp's decision to exit its shareholding in Rosneft and its other businesses with Rosneft in Russia.
bThe tax credit regarding the impact of Rosneft relates to the release of deferred withholding tax on unremitted earnings.
cCalculated based on the statutory corporate income tax rate applicable in the countries in which the group operates, weighted by the profits and losses before tax in the respective countries. 2023 and 2022 include the impact of the UK Energy Profits Levy.
dIncludes withholding tax in respect of distributions from equity-accounted entities.
e2022 primarily relates to the contribution of bp's Angolan business to Azule Energy and 2021 primarily relates to the divestment of a 20 % stake in Oman Block 61.
f2022 comprises the deferred tax impact of the UK Energy Profits Levy on existing temporary differences.
Deferred tax
| $ million | |||||||||||
| Analysis of movements during the year in the net deferred tax liability | 2023 | 2022 | |||||||||
| At 1 January | |||||||||||
Exchange adjustmentsa | ( | ||||||||||
| Charge (credit) for the year in the income statement | ( | ||||||||||
| Charge (credit) for the year in other comprehensive income | ( | ||||||||||
| Charge (credit) for the year in equity | ( | ||||||||||
Acquisitions and disposalsb | |||||||||||
| At 31 December | |||||||||||
aPrimarily relates to the foreign currency retranslation effect on the deferred tax liability on pension plan surpluses in the UK.
b2022 primarily relates to the Archaea Energy acquisition and the contribution of bp's Angolan business to Azule Energy.
| bp Annual Report and Form 20-F 2023 | 199 | |||||||||||||
9. Taxation – continued
The following table provides an analysis of deferred tax in the income statement and the balance sheet by category of temporary difference:
| $ million | ||||||||||||||||||||
| Income statement | Balance sheet | |||||||||||||||||||
| 2023 | 2022 | 2021 | 2023 | 2022 | ||||||||||||||||
| Deferred tax liability | ||||||||||||||||||||
| Depreciation | ( | |||||||||||||||||||
Pension plan surplusesa | ||||||||||||||||||||
| Derivative financial instruments | ( | ( | ||||||||||||||||||
Other taxable temporary differencesb | ( | |||||||||||||||||||
| ( | ||||||||||||||||||||
| Deferred tax asset | ||||||||||||||||||||
| Depreciation | ( | ( | ( | ( | ( | |||||||||||||||
| Lease liabilities | ( | ( | ( | ( | ( | |||||||||||||||
| Pension plan and other post-retirement benefit plan deficits | ( | ( | ( | |||||||||||||||||
| Decommissioning, environmental and other provisions | ( | ( | ( | |||||||||||||||||
| Derivative financial instruments | ( | ( | ( | ( | ( | |||||||||||||||
| Tax credits | ( | ( | ( | |||||||||||||||||
| Loss carry forward | ( | ( | ||||||||||||||||||
Other deductible temporary differencesc | ( | ( | ( | ( | ||||||||||||||||
| ( | ( | |||||||||||||||||||
| Net deferred tax charge (credit) and net deferred tax liability | ( | |||||||||||||||||||
| Of which – deferred tax liabilities | ||||||||||||||||||||
| – deferred tax assets | ||||||||||||||||||||
aIn November 2023 the UK Government announced a reduction in the authorised surplus payments charge applicable to defined benefit pension schemes from 35% to 25%. The legislation has not yet been enacted or substantively enacted, but is expected to be effective from 6 April 2024. The change is expected to reduce the deferred tax liability on pension plan surpluses by around $0.7 billion with the related gain recognised in other comprehensive income when the legislation is substantively enacted.
bThe 2022 income statement includes amounts relating to deferred withholding tax on unremitted earnings of Rosneft. The 2023 and 2022 balance sheet amounts do not include any temporary differences that are individually significant in their nature.
cThe 2023 and 2022 balance sheet amounts do not include any temporary differences that are individually significant in their nature.
Of the $4,268 million of deferred tax assets recognized on the group balance sheet at 31 December 2023 (2022 $3,908 million), $2,336 million (2022 $2,779 million) relates to entities that have suffered a loss in either the current or preceding period. For 2023, this mainly includes $1,003 million in Germany, $672 million in Mauritania and $500 million in Senegal (2022 mainly included $1,333 million in the UK, $505 million in Mauritania and $370 million in Senegal). For 2023 these amounts are supported by forecasts consistent with bp's future oil and gas price assumptions (see Note 1 for further information) and for Germany, forecast profits associated with the customers & products businesses, that indicate sufficient future taxable profits will be available to utilize such assets within any applicable expiry period.
A summary of temporary differences, unused tax credits and unused tax losses for which deferred tax has not been recognized is shown in the table below.
| $ billion | |||||||||||
| At 31 December | 2023 | 2022 | |||||||||
Unused US state tax lossesa | |||||||||||
Unused tax losses – other jurisdictionsb | |||||||||||
| Unused tax credits | |||||||||||
of which – arising in the UKc | |||||||||||
– arising in the USd | |||||||||||
Deductible temporary differencese | |||||||||||
| Taxable temporary differences associated with investments in subsidiaries and equity-accounted entities | |||||||||||
aFor 2023 the majority of these losses expire in the period 2024-2043 with applicable tax rates ranging from 3 % to 9 %.
b2023 and 2022 mainly relate to the UK, Brazil and Canada. The majority of the unused tax losses have no fixed expiry date.
cThe UK unused tax credits arise predominantly in overseas branches of UK entities based in jurisdictions with higher statutory corporate income tax rates than the UK. No deferred tax asset has been recognized on these tax credits as they are unlikely to have value in the future; UK taxes on these overseas branches are largely mitigated by double tax relief in respect of overseas tax. These tax credits have no fixed expiry date.
dThe US unused tax credits predominantly comprise foreign tax credits. No deferred tax asset has been recognized on these tax credits as they are unlikely to have value in the future. For 2023 these tax credits expire in the period 2025-2033.
e2023 and 2022 mainly comprise fixed asset temporary differences in overseas branches of UK entities. Substantially all of the temporary differences have no expiry date.
| $ million | ||||||||||||||
| Impact of previously unrecognized deferred tax or write-down of deferred tax assets on tax charge | 2023 | 2022 | 2021 | |||||||||||
| Current tax benefit relating to the utilization of previously unrecognized deferred tax assets | ||||||||||||||
| Deferred tax benefit arising from the reversal of a previous write-down of deferred tax assets | ||||||||||||||
| Deferred tax benefit relating to the recognition of previously unrecognized deferred tax assets | ||||||||||||||
| Deferred tax expense arising from the write-down of a previously recognized deferred tax asset | ||||||||||||||
200 | bp Annual Report and Form 20-F 2023 | |||||||||||||
| Financial statements | |||||
10. Dividends
The quarterly dividend which is expected to be paid on 28 March 2024 in respect of the fourth quarter 2023 is 7.270 cents per ordinary share ($0.43620 per American Depositary Share (ADS)). The corresponding amount in sterling will be announced on 12 March 2024.
| Pence per share | Cents per share | $ million | ||||||||||||||||||||||||||||||
| 2023 | 2022 | 2021 | 2023 | 2022 | 2021 | 2023 | 2022 | 2021 | ||||||||||||||||||||||||
| Dividends announced and paid in cash | ||||||||||||||||||||||||||||||||
| Preference shares | ||||||||||||||||||||||||||||||||
| Ordinary shares | ||||||||||||||||||||||||||||||||
| March | ||||||||||||||||||||||||||||||||
| June | ||||||||||||||||||||||||||||||||
| September | ||||||||||||||||||||||||||||||||
| December | ||||||||||||||||||||||||||||||||
| Dividend announced, paid in March 2024 | ||||||||||||||||||||||||||||||||
The amount of unclaimed dividends recognized as a liability in other payables at 31 December 2023 is $91 million (2022 $69 million).
The board decided not to offer a scrip dividend alternative in respect of any dividends announced since the third quarter 2019, including the fourth quarter 2023 dividend expected to be paid on 28 March 2024.
The financial statements for the year ended 31 December 2023 do not reflect the dividend announced on 6 February 2024 and which is expected to be paid on 28 March 2024; this will be treated as an appropriation of profit in the year ending 31 December 2024.
11. Earnings per share
| Cents per share | ||||||||||||||
| Per ordinary share | 2023 | 2022 | 2021 | |||||||||||
| Basic earnings per share | ( | |||||||||||||
| Diluted earnings per share | ( | |||||||||||||
| Dollars per share | ||||||||||||||
Per American Depositary Share (ADS)a | 2023 | 2022 | 2021 | |||||||||||
| Basic earnings per share | ( | |||||||||||||
| Diluted earnings per share | ( | |||||||||||||
aOne ADS is equivalent to six ordinary shares.
Basic earnings per ordinary share amounts are calculated by dividing the profit for the year attributable to bp ordinary shareholders by the weighted average number of ordinary shares outstanding during the year.
The weighted average number of shares outstanding includes certain shares that will be issuable in the future under employee share-based payment plans and excludes treasury shares, which includes shares held by the Employee Share Ownership Plan trusts (ESOPs).
For the diluted earnings per share calculation, the weighted average number of shares outstanding during the year is adjusted for the average number of shares that are potentially issuable in connection with employee share-based payment plans. If the inclusion of potentially issuable shares would decrease loss per share, the potentially issuable shares are excluded from the weighted average number of shares outstanding used to calculate diluted earnings per share.
| $ million | ||||||||||||||
| 2023 | 2022 | 2021 | ||||||||||||
| Profit (loss) attributable to bp shareholders | ( | |||||||||||||
| Less: dividend requirements on preference shares | ||||||||||||||
| Profit (loss) for the year attributable to bp ordinary shareholders | ( | |||||||||||||
| Shares thousand | ||||||||||||||
| 2023 | 2022 | 2021 | ||||||||||||
Basic weighted average number of ordinary sharesa | ||||||||||||||
Potential dilutive effect of ordinary shares issuable under employee share-based payment plans | ||||||||||||||
| Weighted average number of ordinary shares outstanding used to calculate diluted earnings per share | ||||||||||||||
| Shares thousand | ||||||||||||||
| 2023 | 2022 | 2021 | ||||||||||||
| Basic weighted average number of ordinary shares – ADS equivalent | ||||||||||||||
Potential dilutive effect of ordinary shares (ADS equivalent) issuable under employee share-based payment plans | ||||||||||||||
| Weighted average number of ordinary shares (ADS equivalent) outstanding used to calculate diluted earnings per share | ||||||||||||||
aExcludes treasury shares. See Note 31 for further information.
| bp Annual Report and Form 20-F 2023 | 201 | |||||||||||||
11. Earnings per share – continued
The number of ordinary shares outstanding at 31 December 2023, excluding treasury shares, and including certain shares that will be issuable in the future under employee share-based payment plans was 16,824,651,796 (2022 17,974,112,648 ). Between 31 December 2023 and 16 February 2024, the latest practicable date before the completion of these financial statements, there was a net decrease of 21,406,501 of ordinary shares primarily as a result of share issues in relation to employee share-based payment plans partially offset by share buy backs. For additional information on share buy backs see Note 31.
Employee share-based payment plans
The group operates share and share option plans for directors and certain employees to obtain ordinary shares and ADSs in the company. Information on these plans for directors is shown in the Directors remuneration report on pages 105-132.
The following table shows the number of shares potentially issuable under equity-settled employee share option plans, including the number of options outstanding, the number of options exercisable at the end of each year, and the corresponding weighted average exercise prices. The dilutive effect of these plans at 31 December is also shown.
| Share options | 2023 | 2022 | |||||||||||||||
Number of optionsa b thousand | Weighted average exercise price $ | Number of optionsa b thousand | Weighted average exercise price $ | ||||||||||||||
| Outstanding | |||||||||||||||||
| Exercisable | |||||||||||||||||
| Dilutive effect | n/a | n/a | |||||||||||||||
aNumbers of options shown are ordinary share equivalents (one ADS is equivalent to six ordinary shares).
bAt 31 December 2023 the quoted market price of one bp ordinary share was £4.66 (2022 £4.75 ).
In addition, the group operates a number of equity-settled employee share plans under which share units are granted to the group’s senior leaders and certain other employees. These plans typically have a -year performance or restricted period during which the units accrue net notional dividends which are treated as having been reinvested. Leaving employment will normally preclude the conversion of units into shares, but special arrangements apply for participants that leave for qualifying reasons. The number of shares that are expected to vest each year under employee share plans are shown in the table below. The dilutive effect of the employee share plans at 31 December is also shown.
| Share plans | 2023 | 2022 | |||||||||
Number of sharesa | Number of sharesa | ||||||||||
| Vesting | thousand | thousand | |||||||||
| Within one year | |||||||||||
| 1 to 2 years | |||||||||||
| 2 to 3 years | |||||||||||
| 3 to 4 years | |||||||||||
| Over 4 years | |||||||||||
| Dilutive effect | |||||||||||
aNumbers of shares shown are ordinary share equivalents (one ADS is equivalent to six ordinary shares).
There has been a net decrease of 109,230,677 in the number of potential ordinary shares relating to employee share-based payment plans between 31 December 2023 and 16 February 2024.
202 | bp Annual Report and Form 20-F 2023 | |||||||||||||
| Financial statements | |||||
12. Property, plant and equipment (PP&E)
| $ million | |||||||||||||||||||||||||||||
| Land and land improvements | Buildings | Oil and gas propertiesa c | Plant, machinery and equipment | Fittings, fixtures and office equipmentc | Transportation | Oil depots, storage tanks and service stations | Total | ||||||||||||||||||||||
| Cost - owned PP&E | |||||||||||||||||||||||||||||
At 1 January 2023 | |||||||||||||||||||||||||||||
| Exchange adjustments | |||||||||||||||||||||||||||||
| Additions | |||||||||||||||||||||||||||||
| Acquisitions | |||||||||||||||||||||||||||||
| Transfers from intangible assets | |||||||||||||||||||||||||||||
| Reclassified as assets held for sale | ( | ( | ( | ( | ( | ( | |||||||||||||||||||||||
| Deletions and disposals | ( | ( | ( | ( | ( | ( | ( | ( | |||||||||||||||||||||
| At 31 December 2023 | |||||||||||||||||||||||||||||
| Depreciation - owned PP&E | |||||||||||||||||||||||||||||
At 1 January 2023 | |||||||||||||||||||||||||||||
| Exchange adjustments | |||||||||||||||||||||||||||||
| Charge for the year | |||||||||||||||||||||||||||||
| Impairment losses | |||||||||||||||||||||||||||||
| Impairment reversals | ( | ( | ( | ||||||||||||||||||||||||||
| Reclassified as assets held for sale | ( | ( | ( | ( | ( | ( | |||||||||||||||||||||||
| Deletions and disposals | ( | ( | ( | ( | ( | ( | ( | ( | |||||||||||||||||||||
| At 31 December 2023 | |||||||||||||||||||||||||||||
| Owned PP&E - net book amount at 31 December 2023 | |||||||||||||||||||||||||||||
Right-of-use assets - net book amount at 31 December 2023b | |||||||||||||||||||||||||||||
| Total PP&E - net book amount at 31 December 2023 | |||||||||||||||||||||||||||||
| Cost - owned PP&E | |||||||||||||||||||||||||||||
At 1 January 2022c | |||||||||||||||||||||||||||||
| Exchange adjustments | ( | ( | ( | ( | ( | ( | ( | ||||||||||||||||||||||
| Additions | |||||||||||||||||||||||||||||
| Acquisitions | |||||||||||||||||||||||||||||
| Transfers from intangible assets | |||||||||||||||||||||||||||||
| Reclassified as assets held for sale | ( | ( | ( | ( | |||||||||||||||||||||||||
| Deletions and disposals | ( | ( | ( | ( | ( | ( | ( | ( | |||||||||||||||||||||
| At 31 December 2022 | |||||||||||||||||||||||||||||
| Depreciation - owned PP&E | |||||||||||||||||||||||||||||
At 1 January 2022c | |||||||||||||||||||||||||||||
| Exchange adjustments | ( | ( | ( | ( | ( | ( | ( | ||||||||||||||||||||||
| Charge for the year | |||||||||||||||||||||||||||||
| Impairment losses | |||||||||||||||||||||||||||||
| Impairment reversals | ( | ( | ( | ( | |||||||||||||||||||||||||
| Reclassified as assets held for sale | ( | ( | ( | ( | |||||||||||||||||||||||||
| Deletions and disposals | ( | ( | ( | ( | ( | ( | ( | ( | |||||||||||||||||||||
| At 31 December 2022 | |||||||||||||||||||||||||||||
| Owned PP&E - net book amount at 31 December 2022 | |||||||||||||||||||||||||||||
Right-of-use assets - net book amount at 31 December 2022b | |||||||||||||||||||||||||||||
| Total PP&E - net book amount at 31 December 2022 | |||||||||||||||||||||||||||||
| Assets under construction included above | |||||||||||||||||||||||||||||
| At 31 December 2023 | |||||||||||||||||||||||||||||
| At 31 December 2022 | |||||||||||||||||||||||||||||
| Depreciation charge for the year on right-of-use assets | |||||||||||||||||||||||||||||
| 2023 | |||||||||||||||||||||||||||||
| 2022 | |||||||||||||||||||||||||||||
aFor information on significant estimates and judgements made in relation to the estimation of oil and natural reserves see Property, plant and equipment within Note 1.
b$661 million (2022 $560 million) of drilling rig right-of-use assets and $2,337 million (2022 $2,208 million) of shipping vessel right-of-use assets are included in Plant, machinery and equipment and Transportation respectively.
cAn amendment has been made to prior year balances to correctly present offsetting movements in oil and gas properties (an increase of $744 18
| bp Annual Report and Form 20-F 2023 | 203 | |||||||||||||
13. Capital commitments
14. Goodwill and impairment review of goodwill
| $ million | |||||||||||
| 2023 | 2022 | ||||||||||
| Cost | |||||||||||
| At 1 January | |||||||||||
| Exchange adjustments | ( | ||||||||||
| Acquisitions and other additions | |||||||||||
| Reclassified as assets held for sale | ( | ||||||||||
| Deletions and disposals | ( | ||||||||||
| At 31 December | |||||||||||
| Impairment losses | |||||||||||
| At 1 January | |||||||||||
| Exchange adjustments | ( | ||||||||||
| Impairment losses for the year | |||||||||||
| At 31 December | |||||||||||
| Net book amount at 31 December | |||||||||||
| Net book amount at 1 January | |||||||||||
Impairment review of goodwill
| $ million | |||||||||||
| Goodwill at 31 December | 2023 | 2022 | |||||||||
| gas & low carbon energy | |||||||||||
| oil production & operations | |||||||||||
| customers & products | |||||||||||
| other businesses & corporate | |||||||||||
Goodwill acquired through business combinations has been allocated to groups of cash-generating units (CGUs) that are expected to benefit from the synergies of the acquisition. For oil production & operations goodwill is allocated to CGUs in aggregate at the segment level, for gas & low carbon energy goodwill is allocated to the hydrocarbon CGUs within the segment. For customers and products, goodwill has been allocated to Castrol, US Fuels, European Fuels, Archaea and Other.
For information on significant estimates and judgements made in relation to impairments see Impairment of property, plant and equipment, intangible assets and goodwill in Note 1.
gas & low carbon energy and oil production & operations
| $ million | $ million | |||||||||||||||||||
| gas & low carbon energy | oil production & operations | |||||||||||||||||||
| 2023 | 2022 | 2023 | 2022 | |||||||||||||||||
Goodwill | ||||||||||||||||||||
Excess of recoverable amount over carrying amount | ||||||||||||||||||||
The table above shows the carrying amount of goodwill for the segments at the period end and the excess of the recoverable amount, based on a pre-tax value-in-use calculation, over the carrying amount (headroom) at the date of the most recent test. The decrease in headroom for both segments relates to movements due to the impacts of updates to price and discount rate assumptions.
204 | bp Annual Report and Form 20-F 2023 | |||||||||||||
| Financial statements | |||||
14. Goodwill and impairment review of goodwill – continued
The value in use for relevant CGUs in both gas & low carbon energy and oil production & operations is based on the cash flows expected to be generated by the projected production profiles up to the expected dates of cessation of production of each field, based on appropriately risked estimates of reserves and resources. Midstream and supply and trading activities and equity-accounted entities are generally not included in the impairment reviews of goodwill, as they do not represent part of the grouping of CGUs to which the goodwill balances relate and which are used to monitor the goodwill balances for internal management purposes. Where such activities form part of wider CGUs to which goodwill relates they are reflected in the test. As the production profile and related cash flows can be estimated from bp’s past experience, management believes that the cash flows generated over the estimated life of field is the appropriate basis upon which to assess goodwill and individual assets for impairment in both gas & low carbon energy and oil & production operations. The estimated date of cessation of production depends on the interaction of a number of variables, such as the recoverable quantities of hydrocarbons, the production profile of the hydrocarbons, the cost of the development of the infrastructure necessary to recover the hydrocarbons, production costs, the contractual duration of the production concession and the selling price of the hydrocarbons produced. As each field has specific reservoir characteristics and economic circumstances, the cash flows of each field are computed using appropriate individual economic models and key assumptions agreed by bp management.
Estimated production volumes and cash flows up to the date of cessation of production on a field-by-field basis, including operating and capital expenditure, are derived from the business segment plans. The production profiles used are consistent with the reserve and resource volumes approved as part of bp’s centrally controlled process for the estimation of proved and probable reserves and total resources.
The average production for the purposes of goodwill impairment testing in the gas & low carbon energy segment over the next 15 years is 185 mmboe per year (2022 191 mmboe per year) and in the oil production and operations segment is 402 mmboe per year (2022 346 mmboe per year). Production assumptions used for the goodwill impairment tests in both gas & low carbon energy and oil production & operations reflect management’s best estimate of future production of the existing portfolio at the time of the calculation. The group’s expectation to reduce upstream hydrocarbon production by around 25% by 2030 from its 2019 baseline is expected to be achieved through future active management, including divestments, and high-grading of the portfolio. Changes in upstream production since 2019 will be included in the best estimates however as the specific future changes to the portfolio are not yet known, these best estimates do not include the full extent of the expected upstream production reductions.
The weighted average pre-tax discount rate used in the review for the oil production & operations segment is 17 %, and 11 % for the gas & low carbon energy segment (2022 16 % for the oil production & operations segment and 10 % for the gas & low carbon energy segment).
The most recent reviews for impairment for the oil production & operations and gas & low carbon energy segments were carried out in the fourth quarter. The key assumptions used in the value-in-use calculations are oil and natural gas prices, production volumes and the discount rate. The value-in-use calculations have been prepared for the purposes of determining whether the goodwill balances were impaired. Estimated future cash flows were prepared on the basis of certain assumptions prevailing at the time of the tests. The actual outcomes may differ from the assumptions made. For example, reserves and resources estimates and production forecasts are subject to revision as further technical information becomes available and economic conditions change. Due to economic developments, regulatory change and emissions reduction activity arising from climate concern and other factors, future commodity prices and other assumptions may differ from the forecasts used in the calculations.
Sensitivities to different variables have been estimated using certain simplifying assumptions. For example, lower oil and gas price or production sensitivities do not fully reflect the specific impacts for each contractual arrangement and will not capture all favourable impacts that may arise from cost deflation or savings. A detailed calculation in either segment at any given price or production profile may, therefore, produce a different result.
It is estimated that a 22 % (2022 27 %) reduction in revenue throughout each year of the remaining life of those assets, either as a result of adverse price or production conditions or a combination of each, would cause the recoverable amount to be equal to the carrying amount of goodwill and related net non-current assets of the oil production and operations segment. For gas & low carbon energy an 15 % (2022 18 %) reduction would have the same result.
It is estimated that no reasonably possible change in the discount rate would cause the recoverable amount to be equal to the carrying amount of goodwill and related net non-current assets of either segment.
customers & products
| $ million | |||||||||||||||||||||||||||||||||||||||||
| 2023 | 2022 | ||||||||||||||||||||||||||||||||||||||||
| Castrol | US Fuels | European Fuels | Archaea | Other | Total | Castrol | US Fuels | European Fuels | Archaea | Other | Total | ||||||||||||||||||||||||||||||
| Goodwill | |||||||||||||||||||||||||||||||||||||||||
Cash flows for each CGU are derived from the business segment plans, which cover a period of up to five years , except for Archaea where a business plan to 2035 is in place following the recent acquisition. To determine the value in use for each of the cash-generating units, cash flows for a period of 10 years (12 years for Archaea), are discounted and aggregated with a terminal value. It is estimated that no reasonably possible change in the key assumptions used in the US Fuels, European Fuels and Archaea goodwill impairment assessments would cause the recoverable amount to be equal to the carrying amount of goodwill and related net non-current assets.
Castrol
The key assumptions to which the calculation of value in use for the Castrol unit is most sensitive are operating unit margins, sales volumes, and discount rate. Operating margin and sales volumes assumptions used in the detailed impairment review of goodwill calculation are consistent with the assumptions used in the Castrol unit’s business plan. A pre-tax discount rate of 9 % (2022 8 %) is applied in the test. No reasonably possible change in any of these key assumptions would cause the unit’s recoverable amount to be equal to the carrying amount of goodwill and related net non-current assets. Cash flows beyond the plan period are extrapolated using a nominal 3.4 % (2022 3.4 %) growth rate.
| bp Annual Report and Form 20-F 2023 | 205 | |||||||||||||
15. Intangible assets
| $ million | |||||||||||||||||||||||||||||
| 2023 | 2022 | ||||||||||||||||||||||||||||
Exploration and appraisal expenditurea | Biogas rights agreements | Other intangibles | Total | Exploration and appraisal expenditurea | Biogas rights agreements | Other intangibles | Total | ||||||||||||||||||||||
| Cost | |||||||||||||||||||||||||||||
| At 1 January | |||||||||||||||||||||||||||||
| Exchange adjustments | ( | ( | |||||||||||||||||||||||||||
Acquisitionsb | |||||||||||||||||||||||||||||
Remeasurements of acquisition accountingb | ( | ( | |||||||||||||||||||||||||||
| Additions | |||||||||||||||||||||||||||||
| Transfers to property, plant and equipment | ( | ( | ( | ( | |||||||||||||||||||||||||
| Reclassified as assets held for sale | ( | ( | ( | ( | ( | ||||||||||||||||||||||||
| Deletions and disposals | ( | ( | ( | ( | ( | ( | ( | ||||||||||||||||||||||
| At 31 December | |||||||||||||||||||||||||||||
| Amortization | |||||||||||||||||||||||||||||
| At 1 January | |||||||||||||||||||||||||||||
| Exchange adjustments | ( | ( | |||||||||||||||||||||||||||
| Exploration expenditure written off | |||||||||||||||||||||||||||||
| Charge for the year | |||||||||||||||||||||||||||||
| Impairment losses | |||||||||||||||||||||||||||||
| Impairment reversals | ( | ( | |||||||||||||||||||||||||||
| Reclassified as assets held for sale | ( | ( | ( | ( | ( | ||||||||||||||||||||||||
| Deletions and disposals | ( | ( | ( | ( | ( | ( | ( | ||||||||||||||||||||||
| At 31 December | |||||||||||||||||||||||||||||
| Net book amount at 31 December | |||||||||||||||||||||||||||||
| Net book amount at 1 January | |||||||||||||||||||||||||||||
aFor further information see Intangible assets within Note 1 and Note 8.
b Primarily relates to the acquisition of Archaea Energy Inc. See Note 3 for further information.
16. Investments in joint ventures
The following table provides aggregated summarized financial information for the group's joint ventures as it relates to the amounts recognized in the group income statement and on the group balance sheet.
| $ million | ||||||||||||||||||||
| Income statement | Balance sheet | |||||||||||||||||||
| Earnings from joint ventures - after interest and tax | Investments in joint ventures | |||||||||||||||||||
| 2023 | 2022 | 2021 | 2023 | 2022 | ||||||||||||||||
| Azule Energy | ||||||||||||||||||||
| Pan American Energy Group | ( | |||||||||||||||||||
Other joint venturesa | ( | |||||||||||||||||||
a 2023 includes Pan American Energy Group as no longer considered material to the group post 2022 impairment.
The joint venture that is material to the group at 31 December 2023 is Azule Energy, which was formed during 2022 and in which bp owns a 50 % stake.
bp classifies its investment in Azule Energy Holdings Limited as a joint venture because, per the terms of the shareholders' agreements, bp has joint control over Azule Energy. Azule Energy Holdings Limited is based in Angola and its functional currency is USD.
Following the 2022 impairment of bp's investment in PAEG, this is no longer considered material to the group for 2023 and is now included with Other joint ventures.
The following table provides summarized financial information relating to Azule Energy for 2023 and 2022 and Pan American Energy Group for 2022 and 2021. This information is presented on a 100% basis and reflects adjustments made by bp to Azule Energy and Pan American Energy Group’s own results in applying the equity method of accounting. bp adjusts Azule Energy Holdings Limited and Pan American Energy Group’s results for the accounting required under IFRS relating to bp’s purchase of its interests in Azule Energy Holdings Limited and Pan American Energy Group S.L..
The operational and financial information is based on preliminary operational and financial results of Azule Energy Holdings Limited for 2023 and 2022 and Pan American Energy Group S.L. for 2022 and 2021. Actual results may differ from these amounts - immaterial adjustments to the 2022 numbers for Azule Energy Holdings Limited have been included in the 2023 numbers and adjustments to the 2021 numbers for Pan America Energy Group S.L. have been included in the 2022 numbers.
206 | bp Annual Report and Form 20-F 2023 | |||||||||||||
| Financial statements | |||||
16. Investments in joint ventures – continued
| $ million | |||||||||||||||||
| Gross amount | |||||||||||||||||
| 2023 | 2022 | 2021 | |||||||||||||||
| Azule Energy | Azule Energy | PAEG | PAEG | ||||||||||||||
| Sales and other operating revenues | |||||||||||||||||
| Profit (loss) before interest and taxation | |||||||||||||||||
| Finance costs | |||||||||||||||||
Profit (loss) before taxationa | |||||||||||||||||
Taxationb | |||||||||||||||||
| Profit (loss) for the year | ( | ||||||||||||||||
| Other comprehensive income | |||||||||||||||||
| Total comprehensive income | ( | ||||||||||||||||
| Non-current assets | |||||||||||||||||
Current assetsc | |||||||||||||||||
| Total assets | |||||||||||||||||
Current liabilitiesd | |||||||||||||||||
Non-current liabilitiese | |||||||||||||||||
| Total liabilities | |||||||||||||||||
| Net assets | |||||||||||||||||
| Less: non-controlling interests | |||||||||||||||||
aAzule Energy includes depreciation and amortisation of $2,768 million (2022 $1,145 million), interest income of $nil (2022 $11 million) and interest expense of $407 million (2022 $218 million). For 2022 and 2021 PAEG includes depreciation and amortisation of $1,039 million and $930 million respectively, interest income of $29 million and $19 million respectively and interest expense of $375 million and $262 million respectively.
bPAEG 2021 net income expense includes a deferred tax charge of $415 million related to a change in the income tax rate.
cAzule Energy includes cash and cash equivalents of $603 million (2022 $1,031 million). PAEG includes cash and cash equivalents of $1,012 million for 2022.
dAzule Energy includes current financial liabilities of $2,409 million (2022 $2,077 million). PAEG includes current financial liabilities of $751 million for 2022.
eAzule Energy includes non-current financial liabilities of $4,735 million (2022 $4,700 million). PAEG includes non-current financial liabilities of $2,151 million for 2022.
The group received dividends of $708 million from Azule Energy Holdings Limited in 2023 (2022 $500 million).
The group received dividends of $35 million and $nil from Pan American Energy Group S.L in 2022 and 2021 respectively.
The following table provides aggregated summarized financial information relating to the group’s share of joint ventures.
| $ million | |||||||||||||||||||||||||||||||||||
| bp share | |||||||||||||||||||||||||||||||||||
| 2023 | 2022 | 2021 | |||||||||||||||||||||||||||||||||
| Azule Energy | Other | Total | Azule Energy | PAEG | Other | Total | PAEG | Other | Total | ||||||||||||||||||||||||||
| Sales and other operating revenues | |||||||||||||||||||||||||||||||||||
| Profit (loss) before interest and taxation | |||||||||||||||||||||||||||||||||||
| Finance costs | |||||||||||||||||||||||||||||||||||
| Profit (loss) before taxation | ( | ||||||||||||||||||||||||||||||||||
| Taxation | |||||||||||||||||||||||||||||||||||
| Non-controlling interest | |||||||||||||||||||||||||||||||||||
| Profit (loss) for the year | ( | ( | |||||||||||||||||||||||||||||||||
| Other comprehensive income | |||||||||||||||||||||||||||||||||||
| Total comprehensive income | ( | ( | |||||||||||||||||||||||||||||||||
| Non-current assets | |||||||||||||||||||||||||||||||||||
| Current assets | |||||||||||||||||||||||||||||||||||
| Total assets | |||||||||||||||||||||||||||||||||||
| Current liabilities | |||||||||||||||||||||||||||||||||||
| Non-current liabilities | |||||||||||||||||||||||||||||||||||
| Total liabilities | |||||||||||||||||||||||||||||||||||
| Net assets | |||||||||||||||||||||||||||||||||||
| Less: non-controlling interests | ( | ( | ( | ( | |||||||||||||||||||||||||||||||
| Group investment in joint ventures | |||||||||||||||||||||||||||||||||||
| Group share of net assets (as above) | |||||||||||||||||||||||||||||||||||
| Cumulative impairment charge | ( | ( | ( | ( | |||||||||||||||||||||||||||||||
| Loans made by group companies to joint ventures | ( | ( | ( | ( | |||||||||||||||||||||||||||||||
| bp Annual Report and Form 20-F 2023 | 207 | |||||||||||||
16. Investments in joint ventures – continued
Transactions between the group and its joint ventures are summarized below.
| $ million | |||||||||||||||||||||||
| Sales to joint ventures | 2023 | 2022 | 2021 | ||||||||||||||||||||
| Product | Sales | Amount receivable at 31 December | Sales | Amount receivable at 31 December | Sales | Amount receivable at 31 December | |||||||||||||||||
| LNG, crude oil and oil products, natural gas | |||||||||||||||||||||||
| Purchases from joint ventures | 2023 | 2022 | 2021 | ||||||||||||||||||||
| Product | Purchases | Amount payable at 31 December | Purchases | Amount payable at 31 December | Purchases | Amount payable at 31 December | |||||||||||||||||
LNG, crude oil and oil products, natural gas, refinery operating costs, plant processing fees | |||||||||||||||||||||||
In the normal course of business, bp enters into various arm’s length transactions with joint ventures including fixed price commitments to sell and to purchase commodities, forward sale and purchase contracts and agency agreements.
The terms of the outstanding balances receivable from joint ventures are typically 30 to 45 days. The balances are unsecured and will be settled in cash. There are no significant provisions for doubtful debts relating to these balances and no significant expense recognized in the income statement in respect of bad or doubtful debts. Dividends receivable are not included in the table above.
The majority of sales to joint ventures in 2023 relate to heating oil, gasoline, diesel and lubricant product transactions with Mobene and Ocwen Energy. The majority of purchases from joint ventures in 2023 relate to crude oil and oil products transactions with Azule Energy.
The bp investment in Pan American Energy Group S.L. joint venture had an impairment charge in 2022 of $2,900 million as a result of expected portfolio changes.
17. Investments in associates
The following table provides aggregated summarized financial information for the group’s associates as it relates to the amounts recognized in the group income statement and on the group balance sheet. There were no individually material associates to the Group at 31 December 2023. The associate which was material to the Group at 31 December 2021 was Rosneft. At 31 December 2021 bp classified its investment in Rosneft as an associate because, in management's judgement, bp had significant influence over Rosneft. On 27 February 2022, bp announced it would exit its shareholding in Rosneft and bp's two nominated Rosneft directors both stepped down from Rosneft's board. As a result, the significant judgement on significant influence over Rosneft was reassessed. Since the first quarter 2022, bp accounts for its interest in Rosneft and its other businesses with Rosneft within Russia, as financial assets measured at fair value within ‘Other investments’. For further information see Note 1 Significant judgements and estimate: investment in Rosneft.
| $ million | ||||||||||||||||||||
| Income statement | Balance sheet | |||||||||||||||||||
| Earnings from associates - after interest and tax | Investments in associates | |||||||||||||||||||
| 2023 | 2022 | 2021 | 2023 | 2022 | ||||||||||||||||
| Rosneft | ||||||||||||||||||||
| Other associates | ||||||||||||||||||||
The group recognized dividends, net of withholding tax, of $nil from Rosneft in 2023 (2022 $nil and 2021 $640 million).
208 | bp Annual Report and Form 20-F 2023 | |||||||||||||
| Financial statements | |||||
17. Investments in associates – continued
The following table provides summarized financial information relating to Rosneft for 2021. This information is presented on a 100% basis and reflects adjustments made by bp to Rosneft’s own results in applying the equity method of accounting. bp adjusted Rosneft’s results for the accounting required under IFRS relating to bp’s purchase of its interest in Rosneft and the amortization of the deferred gain relating to the disposal of bp’s interest in TNK-BP.
| $ million | ||||||||
| Gross amount | ||||||||
| 2021 | ||||||||
| Sales and other operating revenues | ||||||||
| Profit before interest and taxation | ||||||||
| Finance costs | ||||||||
| Profit (loss) before taxation | ||||||||
| Taxation | ||||||||
| Non-controlling interests | ||||||||
| Profit (loss) for the year | ||||||||
| Other comprehensive income | ||||||||
| Total comprehensive income | ||||||||
Summarized financial information for the group’s share of associates is shown below.
| $ million | ||||||||||||||||||||
| bp share | ||||||||||||||||||||
| 2023 | 2022 | 2021 | ||||||||||||||||||
| Total | Total | Rosneft | Other | Total | ||||||||||||||||
| Sales and other operating revenues | ||||||||||||||||||||
| Profit before interest and taxation | ||||||||||||||||||||
| Finance costs | ||||||||||||||||||||
| Profit (loss) before taxation | ||||||||||||||||||||
| Taxation | ||||||||||||||||||||
| Non-controlling interests | ||||||||||||||||||||
| Profit (loss) for the year | ||||||||||||||||||||
| Other comprehensive income | ( | |||||||||||||||||||
| Total comprehensive income | ||||||||||||||||||||
| Non-current assets | ||||||||||||||||||||
| Current assets | ||||||||||||||||||||
| Total assets | ||||||||||||||||||||
| Current liabilities | ||||||||||||||||||||
| Non-current liabilities | ||||||||||||||||||||
| Total liabilities | ||||||||||||||||||||
| Net assets | ||||||||||||||||||||
| Less: non-controlling interests | ||||||||||||||||||||
| Group investment in associates | ||||||||||||||||||||
| Group share of net assets (as above) | ||||||||||||||||||||
| Loans made by group companies to associates | ||||||||||||||||||||
| bp Annual Report and Form 20-F 2023 | 209 | |||||||||||||
17. Investments in associates – continued
Transactions between the group and its associates are summarized below.
| $ million | |||||||||||||||||||||||
| Sales to associates | 2023 | 2022 | 2021 | ||||||||||||||||||||
| Product | Sales | Amount receivable at 31 December | Sales | Amount receivable at 31 December | Sales | Amount receivable at 31 December | |||||||||||||||||
LNG, crude oil and oil products, natural gas | |||||||||||||||||||||||
| $ million | |||||||||||||||||||||||
| Purchases from associates | 2023 | 2022 | 2021 | ||||||||||||||||||||
| Product | Purchases | Amount payable at 31 December | Purchases | Amount payable at 31 December | Purchases | Amount payable at 31 December | |||||||||||||||||
Crude oil and oil products, natural gas, transportation tariff | |||||||||||||||||||||||
In the normal course of business, bp enters into various arm’s length transactions with associates including fixed price commitments to sell and to purchase commodities, forward sale and purchase contracts and agency agreements.
The terms of the outstanding balances receivable from associates are typically 30 to 45 days. The balances are unsecured and will be settled in cash. There are no significant provisions for doubtful debts relating to these balances and no significant expense recognized in the income statement in respect of bad or doubtful debts. Dividends receivable are not included in the table above.
The majority of purchases from associates in 2023 and 2022 relate to crude oil and oil products transactions with Aker BP. The majority of purchases from associates in 2021 relate to crude oil and oil products transactions with Rosneft. Sales to associates are related to various entities.
bp has commitments amounting to $8,615 million (2022 $8,488 million), primarily in relation to contracts with its associates for the purchase of transportation capacity. For information on capital commitments in relation to associates see Note 13.
bp's share of impairment charges taken by associates in 2023 was $nil (2022 $nil ).
18. Other investments
| $ million | |||||||||||||||||
| 2023 | 2022 | ||||||||||||||||
| Current | Non-current | Current | Non-current | ||||||||||||||
Equity investmentsa | |||||||||||||||||
| Contingent consideration | |||||||||||||||||
| Other | |||||||||||||||||
aThe majority of equity investments are unlisted.
Contingent consideration relates to amounts arising on disposals which are financial assets classified as measured at fair value through profit or loss. The fair value is determined using an estimate of discounted future cash flows that are expected to be received and is considered a level 3 valuation under the fair value hierarchy. Future cash flows are estimated based on inputs including oil and natural gas prices, production volumes and operating costs related to the disposed operations. The discount rate used is based on a risk-free rate adjusted for asset-specific risks. The contingent consideration principally relates to the disposal of our Alaskan business.
19. Inventories
| $ million | |||||||||||
| 2023 | 2022 | ||||||||||
| Crude oil | |||||||||||
| Natural gas | |||||||||||
| Emissions allowances | |||||||||||
| Refined petroleum and petrochemical products | |||||||||||
| Trading inventories | |||||||||||
| Supplies | |||||||||||
| Cost of inventories expensed in the income statement | |||||||||||
The inventory valuation at 31 December 2023 is stated net of a provision of $497 million (2022 $483 million) to write down inventories to their net realizable value, of which $310 million (2022 $195 million) relates to hydrocarbon inventories. The net charge to the income statement in the year in respect of inventory net realizable value provisions was $87 million (2022 $199 million charge), of which $112 million charge (2022 $137 million charge) related to hydrocarbon inventories.
Trading inventories are valued using quoted benchmark prices adjusted as appropriate for location and quality differentials. They are predominantly categorized within level 2 of the fair value hierarchy.
210 | bp Annual Report and Form 20-F 2023 | |||||||||||||
| Financial statements | |||||
20. Trade and other receivables
| $ million | |||||||||||||||||
| 2023 | 2022 | ||||||||||||||||
| Current | Non-current | Current | Non-current | ||||||||||||||
| Financial assets | |||||||||||||||||
Trade receivables | |||||||||||||||||
| Amounts receivable from joint ventures and associates | |||||||||||||||||
Other receivables | |||||||||||||||||
| Non-financial assets | |||||||||||||||||
Sales taxes and production taxes | |||||||||||||||||
| Other receivables | |||||||||||||||||
In both 2023 and 2022 the group entered into non-recourse arrangements to discount certain receivables in support of supply and trading activities and the management of credit risk.
Trade and other receivables are predominantly non-interest bearing.
See Note 29 for further information.
21. Valuation and qualifying accounts
| $ million | |||||||||||||||||||||||
| 2023 | 2022 | 2021 | |||||||||||||||||||||
| Trade and other receivables | Fixed asset investments | Trade and other receivables | Fixed asset investments | Trade and other receivables | Fixed asset investments | ||||||||||||||||||
| At 1 January | |||||||||||||||||||||||
| Charged to costs and expenses | |||||||||||||||||||||||
Charged to other accountsa | ( | ( | ( | ( | |||||||||||||||||||
| Deductions | ( | ( | ( | ( | ( | ( | |||||||||||||||||
| Reclassifications | ( | ||||||||||||||||||||||
| At 31 December | |||||||||||||||||||||||
a Principally exchange adjustments.
Valuation and qualifying accounts relating to trade and other receivables comprise expected credit loss allowances. The expected credit loss allowance comprises $1,301 million (2022 $513 million, 2021 $456 million) relating to receivables that were credit-impaired at the end of the year and $123 million (2022 $123 million, 2021 $128 million) relating to receivables that were not credit-impaired at the end of the year.
Valuation and qualifying accounts relating to fixed asset investments comprise impairment provisions for investments in equity-accounted entities. The amount charged to costs and expenses in 2022 principally relates to bp’s investments in Rosneft and Pan American Energy Group S.L.. Amounts related to bp’s investments in Rosneft and other businesses with Rosneft within Russia were reclassified in 2022 following bp’s loss of significant influence.
Valuation and qualifying accounts are deducted in the balance sheet from the assets to which they apply. For further information on the group's credit risk management policies and how the group recognizes and measures expected losses see Note 29.
| bp Annual Report and Form 20-F 2023 | 211 | |||||||||||||
22. Trade and other payables
| $ million | |||||||||||||||||
| 2023 | 2022 | ||||||||||||||||
| Current | Non-current | Current | Non-current | ||||||||||||||
| Financial liabilities | |||||||||||||||||
| Trade payables | |||||||||||||||||
| Amounts payable to joint ventures and associates | |||||||||||||||||
| Payables for capital expenditure and acquisitions | |||||||||||||||||
| Payables related to the Gulf of Mexico oil spill | |||||||||||||||||
| Other payables | |||||||||||||||||
| Non-financial liabilities | |||||||||||||||||
| Sales taxes, customs duties, production taxes and social security | |||||||||||||||||
| Other payables | |||||||||||||||||
Materially all of bp's trade payables have payment terms of less than 60 days and give rise to operating cash flows.
Trade and other payables, other than those relating to the Gulf of Mexico oil spill, are predominantly interest free. See Note 29 (c) for further information.
Payables related to the Gulf of Mexico oil spill include amounts payable under the 2016 consent decree and settlement agreement with the United States and five Gulf coast states, including amounts payable for natural resource damages, state claims and Clean Water Act penalties. On a discounted basis the amounts included in payables related to the Gulf of Mexico oil spill for these elements of the agreements are $3,782 million payable over 9 years, $2,098 million payable over 10 years and $2,812 million payable over 9 years respectively at 31 December 2023. Reported within net cash provided by operating activities in the group cash flow statement is a net cash outflow of $1,280 million (2022 outflow of $1,370 million, 2021 outflow of $1,484 million) related to the Gulf of Mexico oil spill, which includes payments made in relation to these agreements. For full details of these agreements, see bp Annual Report and Form 20-F 2015 - Legal Proceedings.
Payables related to the Gulf of Mexico oil spill at 31 December 2023 also include amounts payable for settled economic loss and property damage claims which are payable over a period of up to four years.
23. Provisions
| $ million | |||||||||||||||||||||||
| Decommissioning | Environmental | Litigation and claims | Emissions | Other | Total | ||||||||||||||||||
| At 1 January 2023 | |||||||||||||||||||||||
| Exchange adjustments | |||||||||||||||||||||||
| Acquisitions | |||||||||||||||||||||||
New and increase in existing provisionsa | |||||||||||||||||||||||
Write-back of unused provisionsa | ( | ( | ( | ( | ( | ( | |||||||||||||||||
Unwinding of discountb | |||||||||||||||||||||||
| Change in discount rate | ( | ( | ( | ( | ( | ||||||||||||||||||
| Utilization | ( | ( | ( | ( | ( | ( | |||||||||||||||||
| Reclassified to other payables | ( | ( | ( | ||||||||||||||||||||
| Reclassified as liabilities directly associated with assets held for sale | ( | ( | ( | ||||||||||||||||||||
| Deletions | ( | ( | |||||||||||||||||||||
| At 31 December 2023 | |||||||||||||||||||||||
| Of which – current | |||||||||||||||||||||||
| – non-current | |||||||||||||||||||||||
aRecognized in the Group income statement, other than changes in decommissioning provisions related to owned assets.
bRecognized in the Group income statement.
The decommissioning provision primarily comprises the future cost of decommissioning oil and natural gas wells, facilities and related pipelines. The environmental provision includes provisions for costs related to the control, abatement, clean-up or elimination of environmental pollution relating to soil, groundwater, surface water and sediment contamination. The litigation and claims category includes provisions for matters related to, for example, commercial disputes, product liability, and allegations of exposures of third parties to toxic substances. Emissions provisions primarily relate to obligations under the U.S. Environmental Protection Agency Renewable Fuel Standard Program and are driven by the amount of the obligations outstanding and current price of the related credits. The provision will principally be settled through allowances already held as inventory in the group balance sheet.
For information on significant estimates and judgements made in relation to provisions, see Provisions and contingencies within Note 1.
Gulf of Mexico oil spill
The group has recognized certain assets, payables and provisions and incurs certain residual costs relating to the Gulf of Mexico oil spill that occurred in 2010. For further information see Notes 7, 22, 29, 33. The litigation and claims provision presented in the table above includes the latest estimate for the remaining costs associated with the Gulf of Mexico oil spill. The amounts payable may differ from the amount provided and the timing of payments is uncertain.
212 | bp Annual Report and Form 20-F 2023 | |||||||||||||
| Financial statements | |||||
24. Pensions and other post-retirement benefits
Most group companies have pension plans, the forms and benefits of which vary with conditions and practices in the countries concerned. Pension benefits may be provided through defined contribution plans (money purchase schemes) or defined benefit plans (final salary and other types of schemes with committed pension benefit payments). For defined contribution plans, retirement benefits are determined by the value of funds arising from contributions paid in respect of each employee. For defined benefit plans, retirement benefits are based on such factors as an employee’s pensionable salary and length of service. Defined benefit plans may be funded or unfunded. The assets of funded plans are generally held in separately administered trusts.
For information on significant estimates and judgements made in relation to accounting for these plans see Pensions and other post-retirement benefits in Note 1.
The pension obligation in the UK consists primarily of a funded final salary pension plan under which retired employees draw the majority of their benefit as an annuity. This pension plan is governed by a corporate trustee whose board is composed of four member-nominated directors, four company-nominated directors, one independent director and one independent chair nominated by the company. The trustee board is required by law to act in the best interests of the plan participants and is responsible for setting certain policies, such as investment policies of the plan. This plan was closed to new joiners in 2010 and was closed to future accrual on 30 June 2021.
Employees in the UK are eligible for membership of a defined contribution plan.
In the US, all pension benefits now accrue under a cash balance formula. Benefits previously accrued under final salary formulas are legally protected. Retiring US employees typically take their pension benefit in the form of a lump sum payment upon retirement. The plan is funded and its assets are overseen by a fiduciary Investment Committee. During 2023 the committee was composed of six bp employees appointed by the president of bp Corporation North America Inc. (the appointing officer). The Investment Committee is required by law to act in the best interests of the plan participants and is responsible for setting certain policies, such as the investment policies of the plan. US employees are also eligible to participate in a defined contribution (401k) plan in which employee contributions are matched with company contributions.
In the US, group companies also provide post-retirement healthcare to eligible retired employees and their dependants (and, in certain legacy cases, life insurance coverage); the entitlement to these benefits is based on the date of hire, the employee remaining in service until a specified age and completion of a minimum period of service.
In the Eurozone, there are defined benefit pension plans in Germany, France, the Netherlands and other countries. In Germany and France, the majority of the pensions are unfunded. In Germany, the group’s largest Eurozone plan, employees receive a pension and also have a choice to supplement their core pension through salary sacrifice. For employees who joined since 2002, the core pension benefit is a career average plan with retirement benefits based on such factors as an employee’s pensionable salary and length of service. The returns on the notional contributions made by both the company and employees are based on the interest rate which is set out in German tax law. Retired German employees take their pension benefit typically in the form of an annuity. The German plans are governed by legal agreements between bp and the works council or between bp and the trade union.
The level of contributions to funded defined benefit plans is the amount needed to provide adequate funds to meet pension obligations as they fall due. During 2023 the aggregate level of contributions was $42 million (2022 $74 million and 2021 $274 million). The aggregate level of contributions in 2024 is expected to be approximately $150 million and includes contributions in all countries that we expect to be required to make contributions by law or under contractual agreements, as well as an allowance for discretionary funding.
For the primary UK plan there is a funding agreement between the group and the trustee. On a three year cycle a schedule of contributions is agreed covering the next five years . The schedule of contributions is next scheduled to be updated after the 31 December 2023 formal actuarial valuation. No contractually committed funding was due at 31 December 2023. The closure of the defined benefit plan to future accrual reduces the need for funding and the plan's expected future funding volatility.
The surplus relating to the primary UK pension plan is recognized on the balance sheet on the basis that the company is entitled to a refund of any remaining assets once all members have left the plan.
Minimum pension funding in the US is determined by legislation and is supplemented by discretionary contributions. No contributions were made into the US pension plan in 2023 and no statutory funding requirement is expected in the next 12 months.
The surplus relating to the US pension fund is recognized on the balance sheet on the basis that economic benefit can be gained from the surplus through a reduction in future contributions.
There was no minimum funding requirement for the US plan, and no significant minimum funding requirements in other countries at 31 December 2023.
The obligation and cost of providing pensions and other post-retirement benefits is assessed annually using the projected unit credit method. The date of the most recent actuarial review was 31 December 2023. The UK plans are subject to a formal actuarial valuation every three years; valuations are required more frequently in many other countries. The most recent formal actuarial valuation of the primary UK pension plan was as at 31 December 2020; the 31 December 2023 valuation is currently underway. A valuation of the US plan and largest Eurozone plans are carried out annually.
| bp Annual Report and Form 20-F 2023 | 213 | |||||||||||||
24. Pensions and other post-retirement benefits – continued
The material financial assumptions used to estimate the benefit obligations of the various plans are set out below. The assumptions are reviewed by management at the end of each year and are used to evaluate the accrued benefit obligation at 31 December and pension expense for the following year.
| % | ||||||||||||||||||||||||||||||||
Financial assumptions used to determine benefit obligationa | UK | US | Eurozone | |||||||||||||||||||||||||||||
| 2023 | 2022 | 2021 | 2023 | 2022 | 2021 | 2023 | 2022 | 2021 | ||||||||||||||||||||||||
| Discount rate for plan liabilities | ||||||||||||||||||||||||||||||||
Rate of increase for pensions in payment | ||||||||||||||||||||||||||||||||
| Rate of increase in deferred pensions | ||||||||||||||||||||||||||||||||
| Inflation for plan liabilities | ||||||||||||||||||||||||||||||||
| % | ||||||||||||||||||||||||||||||||
| Financial assumptions used to determine benefit expense | UK | US | Eurozone | |||||||||||||||||||||||||||||
| 2023 | 2022 | 2021 | 2023 | 2022 | 2021 | 2023 | 2022 | 2021 | ||||||||||||||||||||||||
Discount rate for plan service costb | N/A | N/A | ||||||||||||||||||||||||||||||
Discount rate for plan other finance expensec | ||||||||||||||||||||||||||||||||
Inflation for plan service costb | N/A | N/A | ||||||||||||||||||||||||||||||
aSalary growth has not been a material financial assumption for the Group following the closure of the primary pension plan to future accrual in 2021.
bUK discount rate and inflation rate assumptions are not significant in determining the benefit expense following the closure of the primary UK plan to future accrual in 2021. Rates for the remaining small worldwide plan administered/reported through the UK are 5.0 % (2022 2.5 %) and 1.9 % (2022 2.2 %) respectively.
cThe discount rate for plan other finance expense in 2021 was 1.4 % for the primary UK plan for the period before the plan closed to future accrual on 30th June 2021 and 1.9 % thereafter.
The discount rate assumptions are based on third-party AA corporate bond indices and for our largest plans in the UK, US and the Eurozone we use yields that reflect the maturity profile of the expected benefit payments. The inflation rate assumptions for our UK and US plans are based on the difference between the yields on index-linked and fixed-interest long-term government bonds. In other countries, including the Eurozone, we use this approach, or advice from the local actuary depending on the information available. The inflation assumptions are used to determine the rate of increase for pensions in payment and the rate of increase in deferred pensions where there is such an increase.
In addition to the financial assumptions, we regularly review the demographic and mortality assumptions. The mortality assumptions reflect best practice in the countries in which we provide pensions and have been chosen with regard to applicable published tables adjusted where appropriate to reflect the experience of the group and an extrapolation of past longevity improvements into the future. bp’s most substantial pension liabilities are in the UK, the US and the Eurozone where our mortality assumptions are as follows:
| Years | ||||||||||||||||||||||||||||||||
| Mortality assumptions | UK | US | Eurozone | |||||||||||||||||||||||||||||
| 2023 | 2022 | 2021 | 2023 | 2022 | 2021 | 2023 | 2022 | 2021 | ||||||||||||||||||||||||
Life expectancy at age 60 for a male currently aged 60 | ||||||||||||||||||||||||||||||||
Life expectancy at age 60 for a male currently aged 40 | ||||||||||||||||||||||||||||||||
Life expectancy at age 60 for a female currently aged 60 | ||||||||||||||||||||||||||||||||
Life expectancy at age 60 for a female currently aged 40 | ||||||||||||||||||||||||||||||||
Pension plan assets are generally held in trusts, the primary objective of which is to accumulate assets sufficient to meet the obligations of the plans. The assets of the trusts are invested in a manner consistent with fiduciary obligations and principles that reflect current practices in portfolio management.
A proportion of the assets are held in equities, which are expected to generate a higher level of return over the long term, with an acceptable level of risk. In order to provide reasonable assurance that no single security or type of security has an unwarranted impact on the total portfolio, the investment portfolios are highly diversified.
The trustee’s long-term investment objective for the primary UK plan as it matures is to invest in assets whose value changes in the same way as the plan liabilities, in order to reduce the level of funding risk. To move towards this objective, the UK plan uses a liability driven investment (LDI) approach for part of the portfolio, investing primarily in government bonds to achieve this matching effect for the most significant plan liability assumptions of interest rate and inflation rate. This is partly funded by short-term sale and repurchase agreements, whereby the plan borrows money using existing bonds as security and which will be bought back at a specified price at an agreed future date. The funds raised are used to invest in further bonds to increase the proportion of assets which match the plan liabilities. The borrowings are shown separately in the analysis of pension plan assets in the table below.
For the primary UK pension plan there is an agreement with the trustee to increase the proportion of assets with liability matching characteristics over time primarily by reducing the proportion of plan assets held as equities and increasing the proportion held as bonds. There is a similar agreement in place for the primary US plan. During 2023, the asset allocation policy of the UK plan switched 2 % of plan assets from equities to bonds (2022 2 %). The US asset allocation policy remained consistent.
The current asset allocation policy for the major plans at 31 December 2023 was as follows:
| UK | US | ||||||||||
| Asset category | % | % | |||||||||
| Total equity (including private equity) | |||||||||||
| Bonds/cash (including LDI) | |||||||||||
| Property/real estate | |||||||||||
214 | bp Annual Report and Form 20-F 2023 | |||||||||||||
| Financial statements | |||||
24. Pensions and other post-retirement benefits – continued
The amounts invested under the LDI programme by the primary UK pension plan as at 31 December 2023 were $6,215 million (2022 $3,981 million) of government-issued nominal bonds and $13,177 million (2022 $11,945 million) of index-linked bonds.
Some of the group’s pension plans in the Eurozone and other countries use derivative financial instruments as part of their asset mix to manage the level of risk. The fair value of these instruments is included in other assets in the table below.
The group’s main pension plans do not invest directly in either securities or property/real estate of the company or of any subsidiary.
The fair values of the various categories of assets held by the defined benefit plans at 31 December are presented in the table below, including the effects of derivative financial instruments. Movements in the fair value of plan assets during the year are shown in detail in the table on page 216.
| $ million | ||||||||||||||||||||
UKa | USb | Eurozone | Other | Total | ||||||||||||||||
| Fair value of pension plan assets | ||||||||||||||||||||
| At 31 December 2023 | ||||||||||||||||||||
Listed equities – developed markets | ||||||||||||||||||||
– emerging markets | ||||||||||||||||||||
Private equityc | ||||||||||||||||||||
Government issued nominal bondsd | ||||||||||||||||||||
Government issued index-linked bondsd | ||||||||||||||||||||
Corporate bondsd | ||||||||||||||||||||
Propertye | ||||||||||||||||||||
| Cash | ||||||||||||||||||||
Otherf | ||||||||||||||||||||
Debt (repurchase agreements) used to fund liability driven investments | ( | ( | ||||||||||||||||||
| At 31 December 2022 | ||||||||||||||||||||
| Listed equities – developed markets | ||||||||||||||||||||
– emerging markets | ||||||||||||||||||||
Private equityc | ||||||||||||||||||||
Government issued nominal bondsd | ||||||||||||||||||||
Government issued index-linked bondsd | ||||||||||||||||||||
Corporate bondsd | ||||||||||||||||||||
Propertye | ||||||||||||||||||||
| Cash | ||||||||||||||||||||
Otherf | ||||||||||||||||||||
Debt (repurchase agreements) used to fund liability driven investments | ( | ( | ||||||||||||||||||
| At 31 December 2021 | ||||||||||||||||||||
| Listed equities – developed markets | ||||||||||||||||||||
– emerging markets | ||||||||||||||||||||
Private equityc | ||||||||||||||||||||
Government issued nominal bondsd | ||||||||||||||||||||
Government issued index-linked bondsd | ||||||||||||||||||||
Corporate bondsd | ||||||||||||||||||||
Propertye | ||||||||||||||||||||
| Cash | ||||||||||||||||||||
| Other | ||||||||||||||||||||
| Debt (repurchase agreements) used to fund liability driven investments | ( | ( | ||||||||||||||||||
aBonds held by the UK pension plans are denominated in sterling or hedged back to sterling to minimize foreign currency exposure. Property held by the UK pension plans is in the United Kingdom.
bBonds held by the US pension plans are denominated in US dollars or hedged back to USD to minimize foreign currency exposure.
cPrivate equity is valued at fair value based on the most recent transaction price or third-party net asset, revenue or earnings based valuations that generally result in the use of significant unobservable inputs.
dBonds held by pension plans are predominantly valued using observable market data based inputs other than quoted market prices in active markets.
eProperties are valued based on an analysis of recent market transactions supported by market knowledge derived from third-party professional valuers that generally result in the use of significant unobservable inputs.
fOther includes insurance policies arising from annuity buy-in in Canada amounting to $374 million.
| bp Annual Report and Form 20-F 2023 | 215 | |||||||||||||
24. Pensions and other post-retirement benefits – continued
| $ million | ||||||||||||||||||||
| 2023 | ||||||||||||||||||||
| UK | US | Eurozone | Other | Total | ||||||||||||||||
Analysis of the amount charged to profit or loss | ||||||||||||||||||||
Current service costa | ||||||||||||||||||||
Past service costb | ( | |||||||||||||||||||
Settlementb | ||||||||||||||||||||
| Operating charge (credit) relating to defined benefit plans | ||||||||||||||||||||
| Payments to defined contribution plans | ||||||||||||||||||||
| Total operating charge (credit) | ||||||||||||||||||||
Interest income on plan assetsa | ( | ( | ( | ( | ( | |||||||||||||||
| Interest on plan liabilities | ||||||||||||||||||||
| Other finance (income) expense | ( | ( | ||||||||||||||||||
Analysis of the amount recognized in other comprehensive income | ||||||||||||||||||||
| Actual asset return less interest income on plan assets | ( | ( | ||||||||||||||||||
Change in financial assumptions underlying the present value of the plan liabilities | ( | ( | ( | ( | ||||||||||||||||
Change in demographic assumptions underlying the present value of the plan liabilities | ( | ( | ( | |||||||||||||||||
| Experience gains and losses arising on the plan liabilities | ( | ( | ( | ( | ||||||||||||||||
| Remeasurements recognized in other comprehensive income | ( | ( | ( | |||||||||||||||||
| Movements in benefit obligation during the year | ||||||||||||||||||||
| Benefit obligation at 1 January | ||||||||||||||||||||
| Exchange adjustments | ||||||||||||||||||||
| Operating charge relating to defined benefit plans | ||||||||||||||||||||
| Interest cost | ||||||||||||||||||||
| Contributions by plan participants | ||||||||||||||||||||
Benefit payments (funded plans)c | ( | ( | ( | ( | ( | |||||||||||||||
Benefit payments (unfunded plans)c | ( | ( | ( | ( | ( | |||||||||||||||
| Reclassified as assets held for sale | ( | ( | ||||||||||||||||||
| Remeasurements | ( | |||||||||||||||||||
Benefit obligation at 31 Decembera d | ||||||||||||||||||||
| Movements in fair value of plan assets during the year | ||||||||||||||||||||
| Fair value of plan assets at 1 January | ||||||||||||||||||||
| Exchange adjustments | ||||||||||||||||||||
Interest income on plan assetsa e | ||||||||||||||||||||
| Contributions by plan participants | ||||||||||||||||||||
| Contributions by employers (funded plans) | ||||||||||||||||||||
Benefit payments (funded plans)c | ( | ( | ( | ( | ( | |||||||||||||||
Remeasurementse | ( | ( | ||||||||||||||||||
Fair value of plan assets at 31 Decemberf | ||||||||||||||||||||
| Surplus (deficit) at 31 December | ( | ( | ( | |||||||||||||||||
| Represented by | ||||||||||||||||||||
| Asset recognized | ||||||||||||||||||||
| Liability recognized | ( | ( | ( | ( | ( | |||||||||||||||
| ( | ( | ( | ||||||||||||||||||
| The surplus (deficit) may be analysed between funded and unfunded plans as follows | ||||||||||||||||||||
| Funded | ||||||||||||||||||||
| Unfunded | ( | ( | ( | ( | ( | |||||||||||||||
| ( | ( | ( | ||||||||||||||||||
| The defined benefit obligation may be analysed between funded and unfunded plans as follows | ||||||||||||||||||||
| Funded | ( | ( | ( | ( | ( | |||||||||||||||
| Unfunded | ( | ( | ( | ( | ( | |||||||||||||||
| ( | ( | ( | ( | ( | ||||||||||||||||
aThe costs of managing plan investments are offset against the investment return, the costs of administering pension plan benefits are generally included in current service cost and the costs of administering other post-retirement benefit plans are included in the benefit obligation. Following the closure of the primary UK pension plan to future accrual, current service cost in the UK consists of $34 million of costs of administering that plan and $10 million of current service cost from the remaining small worldwide plans administered and reported through the UK.
bPast service costs predominantly represent largely offsetting income and costs due to the removal of some benefits for members in Turkish plans and their replacement with new arrangements administered and reported through the UK. There was also a $5 million past service cost in France relating to statutory retirement age changes. Settlements represent charges for special termination benefits arising as a result of early retirements.
cThe benefit payments amount shown above comprises $1,858 million benefits and $10 million settlements, plus $54 million of plan expenses incurred in the administration of the benefit.
dThe benefit obligation for the US is made up of $4,527 million for pension liabilities and $1,310 million for other post-retirement benefit liabilities (which are unfunded and are primarily retiree medical liabilities). The benefit obligation for the Eurozone includes $3,393 million for pension liabilities in Germany which is largely unfunded.
eThe actual return on plan assets is made up of the sum of the interest income on plan assets and the remeasurement of plan assets as disclosed above.
fThe fair value of plan assets includes borrowings related to the LDI programme as described on page 214.
216 | bp Annual Report and Form 20-F 2023 | |||||||||||||
| Financial statements | |||||
24. Pensions and other post-retirement benefits – continued
| $ million | ||||||||||||||||||||
| 2022 | ||||||||||||||||||||
| UK | US | Eurozone | Other | Total | ||||||||||||||||
| Analysis of the amount charged to profit or loss | ||||||||||||||||||||
Current service costa | ||||||||||||||||||||
Past service costb | ( | ( | ||||||||||||||||||
Settlementb | ( | ( | ( | |||||||||||||||||
| Operating charge (credit) relating to defined benefit plans | ||||||||||||||||||||
| Payments to defined contribution plans | ||||||||||||||||||||
| Total operating charge (credit) | ||||||||||||||||||||
Interest income on plan assetsa | ( | ( | ( | ( | ( | |||||||||||||||
| Interest on plan liabilities | ||||||||||||||||||||
| Other finance (income) expense | ( | ( | ||||||||||||||||||
| Analysis of the amount recognized in other comprehensive income | ||||||||||||||||||||
| Actual asset return less interest income on plan assets | ( | ( | ( | ( | ( | |||||||||||||||
| Change in financial assumptions underlying the present value of the plan liabilities | ||||||||||||||||||||
| Change in demographic assumptions underlying the present value of the plan liabilities | ( | ( | ||||||||||||||||||
| Experience gains and losses arising on the plan liabilities | ( | ( | ( | ( | ( | |||||||||||||||
| Remeasurements recognized in other comprehensive income | ( | |||||||||||||||||||
| Movements in benefit obligation during the year | ||||||||||||||||||||
| Benefit obligation at 1 January | ||||||||||||||||||||
| Exchange adjustments | ( | ( | ( | ( | ||||||||||||||||
| Operating charge relating to defined benefit plans | ||||||||||||||||||||
| Interest cost | ||||||||||||||||||||
| Contributions by plan participants | ||||||||||||||||||||
Benefit payments (funded plans)c | ( | ( | ( | ( | ( | |||||||||||||||
Benefit payments (unfunded plans)c | ( | ( | ( | ( | ( | |||||||||||||||
| Reclassified as assets held for sale | ( | ( | ||||||||||||||||||
| Disposals | ( | ( | ( | |||||||||||||||||
| Remeasurements | ( | ( | ( | ( | ( | |||||||||||||||
Benefit obligation at 31 Decembera d | ||||||||||||||||||||
| Movements in fair value of plan assets during the year | ||||||||||||||||||||
| Fair value of plan assets at 1 January | ||||||||||||||||||||
| Exchange adjustments | ( | ( | ( | ( | ||||||||||||||||
Interest income on plan assetsa e | ||||||||||||||||||||
| Contributions by plan participants | ||||||||||||||||||||
| Contributions by employers (funded plans) | ||||||||||||||||||||
Benefit payments (funded plans)c | ( | ( | ( | ( | ( | |||||||||||||||
| Reclassified as assets held for sale | ( | ( | ||||||||||||||||||
| Disposals | ( | ( | ||||||||||||||||||
Remeasurementse | ( | ( | ( | ( | ( | |||||||||||||||
Fair value of plan assets at 31 Decemberf | ||||||||||||||||||||
| Surplus (deficit) at 31 December | ( | ( | ( | |||||||||||||||||
| Represented by | ||||||||||||||||||||
| Asset recognized | ||||||||||||||||||||
| Liability recognized | ( | ( | ( | ( | ( | |||||||||||||||
| ( | ( | ( | ||||||||||||||||||
| The surplus (deficit) may be analysed between funded and unfunded plans as follows | ||||||||||||||||||||
| Funded | ||||||||||||||||||||
| Unfunded | ( | ( | ( | ( | ( | |||||||||||||||
| ( | ( | ( | ||||||||||||||||||
| The defined benefit obligation may be analysed between funded and unfunded plans as follows | ||||||||||||||||||||
| Funded | ( | ( | ( | ( | ( | |||||||||||||||
| Unfunded | ( | ( | ( | ( | ( | |||||||||||||||
| ( | ( | ( | ( | ( | ||||||||||||||||
aThe costs of managing plan investments are offset against the investment return, the costs of administering pension plan benefits are generally included in current service cost and the costs of administering other post-retirement benefit plans are included in the benefit obligation. Following the closure of the primary UK pension plan to future accrual, current service cost in the UK consists of $30 million of costs of administering that plan and $11 million of current service cost from the remaining small worldwide plans administered and reported through the UK.
bPast service costs predominantly represent largely offsetting income and costs due to the removal of some benefits for members in Turkish plans and their replacement with new arrangements administered and reported through the UK. Settlements reflect costs associated with buyouts in Canada and in certain other small worldwide plans administered and reported through the UK.
cThe benefit payments amount shown above comprises $2,217 million benefits and $8 million settlements, plus $51 million of plan expenses incurred in the administration of the benefit.
dThe benefit obligation for the US is made up of $4,411 million for pension liabilities and $1,469 million for other post-retirement benefit liabilities (which are unfunded and are primarily retiree medical liabilities). The benefit obligation for the Eurozone includes $2,992 million for pension liabilities in Germany which is largely unfunded.
eThe actual return on plan assets is made up of the sum of the interest income on plan assets and the remeasurement of plan assets as disclosed above.
fThe fair value of plan assets includes borrowings related to the LDI programme as described on page 214.
| bp Annual Report and Form 20-F 2023 | 217 | |||||||||||||
24. Pensions and other post-retirement benefits – continued
| $ million | ||||||||||||||||||||
| 2021 | ||||||||||||||||||||
| UK | US | Eurozone | Other | Total | ||||||||||||||||
Analysis of the amount charged to profit or loss | ||||||||||||||||||||
Current service costa | ||||||||||||||||||||
Past service costb | ( | ( | ( | |||||||||||||||||
Settlementb | ( | ( | ( | |||||||||||||||||
| Operating charge (credit) relating to defined benefit plans | ( | |||||||||||||||||||
| Payments to defined contribution plans | ||||||||||||||||||||
| Total operating charge (credit) | ( | |||||||||||||||||||
Interest income on plan assetsa | ( | ( | ( | ( | ( | |||||||||||||||
| Interest on plan liabilities | ||||||||||||||||||||
| Other finance (income) expense | ( | ( | ||||||||||||||||||
| Analysis of the amount recognized in other comprehensive income | ||||||||||||||||||||
| Actual asset return less interest income on plan assets | ||||||||||||||||||||
Change in financial assumptions underlying the present value of the plan liabilities | ( | |||||||||||||||||||
Change in demographic assumptions underlying the present value of the plan liabilities | ( | ( | ||||||||||||||||||
| Experience gains and losses arising on the plan liabilities | ( | |||||||||||||||||||
| Remeasurements recognized in other comprehensive income | ||||||||||||||||||||
aThe costs of managing plan investments are offset against the investment return, the costs of administering pension plan benefits are generally included in current service cost and the costs of administering other post-retirement benefit plans are included in the benefit obligation.
Sensitivity analysis
The discount rate, inflation and the mortality assumptions all have a significant effect on the amounts reported. A one-percentage point change, in isolation, in certain assumptions as at 31 December 2023 for the group’s pensions and other post-retirement benefit expense would have had the effects shown in the tables below. The effects shown for the expense in 2024 comprise the total of current service cost and net finance income or expense.
| $ million | |||||||||||||||||||||||
| One percentage point | |||||||||||||||||||||||
| UK | US | Eurozone | |||||||||||||||||||||
| Increase | Decrease | Increase | Decrease | Increase | Decrease | ||||||||||||||||||
Discount ratea | |||||||||||||||||||||||
| Effect on expense in 2024 | ( | ( | ( | ||||||||||||||||||||
| Effect on obligation at 31 December 2023 | ( | ( | ( | ||||||||||||||||||||
Inflation rateb | |||||||||||||||||||||||
| Effect on expense in 2024 | ( | ( | ( | ||||||||||||||||||||
| Effect on obligation at 31 December 2023 | ( | ( | ( | ||||||||||||||||||||
aThe amounts presented reflect that the discount rate is used to determine the asset interest income as well as the interest cost on the obligation.
bThe amounts presented reflect the total impact of an inflation rate change on the assumptions for rate of increase in salaries, pensions in payment and deferred pensions.
| $ million | ||||||||||||||
| One year increase | ||||||||||||||
| UK | US | Eurozone | ||||||||||||
| Longevity | ||||||||||||||
| Effect on expense in 2024 | ||||||||||||||
| Effect on obligation at 31 December 2023 | ||||||||||||||
Estimated future benefit payments and the weighted average duration of defined benefit obligations
The expected benefit payments, which reflect expected future service, as appropriate, but exclude plan expenses, and the weighted average duration of the defined benefit obligations at 31 December 2023 are as follows:
| $ million | ||||||||||||||||||||
| Estimated future benefit payments | UK | US | Eurozone | Other | Total | |||||||||||||||
| 2024 | ||||||||||||||||||||
| 2025 | ||||||||||||||||||||
| 2026 | ||||||||||||||||||||
| 2027 | ||||||||||||||||||||
| 2028 | ||||||||||||||||||||
| 2029 - 2033 | ||||||||||||||||||||
| Years | ||||||||||||||||||||
| Weighted average duration | ||||||||||||||||||||
218 | bp Annual Report and Form 20-F 2023 | |||||||||||||
| Financial statements | |||||
25. Cash and cash equivalents
| $ million | |||||||||||
| 2023 | 2022 | ||||||||||
| Cash | |||||||||||
| Triparty repos and term bank deposits | |||||||||||
| Other cash equivalents | |||||||||||
Cash and cash equivalents comprise cash in hand; current balances with banks and similar institutions; deposits and triparty repos of three months or less with banks and similar institutions; money market funds and treasury bills. The carrying amounts of cash, triparty repos, term bank deposits and treasury bills approximate their fair values. Substantially all of the other cash equivalents are categorized within level 1 of the fair value hierarchy.
Cash and cash equivalents at 31 December 2023 includes $5,282 million (2022 $5,866 million) that is restricted. The restricted cash balances include amounts required to cover initial margin on trading exchanges and certain cash balances which are subject to exchange controls.
The group holds $7,174 million (2022 $5,822 million) of cash and cash equivalents outside the UK and it is not expected that any significant tax will arise on repatriation.
26. Finance debt
| $ million | |||||||||||||||||||||||
| 2023 | 2022 | ||||||||||||||||||||||
| Current | Non-current | Total | Current | Non-current | Total | ||||||||||||||||||
| Borrowings | |||||||||||||||||||||||
The main elements of current borrowings are the current portion of long-term borrowings that is due to be repaid in the next 12 months of $2,688 million (2022 $2,297 million) and issued commercial paper of $456 million (2022 $725 million). Finance debt does not include accrued interest of $495 million (2022 $409 million), which is reported within other payables. As part of actively managing its debt portfolio, during the year the group bought back $1.7 billion equivalent of finance debt consisting entirely of euro bonds (2022 $7.4 billion US dollar bonds). Derivatives associated with non-US dollar debt bought back were also terminated. These transactions have no significant impact on net debt or gearing.
The following table shows the weighted-average interest rates achieved through a combination of borrowings and derivative financial instruments entered into to manage interest rate and currency exposures.
| Fixed rate debt | Floating rate debt | Total | |||||||||||||||||||||
| Weighted average interest rate % | Weighted average time for which rate is fixed Years | Amount $ million | Weighted average interest rate % | Amount $ million | Amount $ million | ||||||||||||||||||
| 2023 | |||||||||||||||||||||||
| US dollar | |||||||||||||||||||||||
| Other currencies | |||||||||||||||||||||||
| 2022 | |||||||||||||||||||||||
| US dollar | |||||||||||||||||||||||
| Other currencies | |||||||||||||||||||||||
Fair values
The estimated fair value of finance debt is shown in the table below together with the carrying amount as reflected in the balance sheet.
Long-term borrowings in the table below include the portion of debt that matures in the 12 months from 31 December 2023, whereas in the group balance sheet the amount is reported within current finance debt.
The carrying amount of the group’s short-term borrowings, comprising mainly of commercial paper, approximates their fair value. The fair values of the significant majority of the group’s long-term borrowings are determined using quoted prices in active markets, and so fall within level 1 of the fair value hierarchy. Where quoted prices are not available, quoted prices for similar instruments in active markets are used and such measurements are therefore categorized in level 2 of the fair value hierarchy.
| $ million | |||||||||||||||||
| 2023 | 2022 | ||||||||||||||||
| Fair value | Carrying amount | Fair value | Carrying amount | ||||||||||||||
| Short-term borrowings | |||||||||||||||||
| Long-term borrowings | |||||||||||||||||
| Total finance debt | |||||||||||||||||
| bp Annual Report and Form 20-F 2023 | 219 | |||||||||||||
27. Capital disclosures and net debt
The group defines capital as total equity plus net debt. Our financial framework seeks to support the pursuit of value growth for shareholders while maintaining a secure financial base.
The group monitors capital on the basis of gearing, that is, the ratio of net debt to the total of net debt plus total equity. Net debt is calculated as finance debt, as shown in the balance sheet, plus the fair value of associated derivative financial instruments that are used to hedge foreign exchange and interest rate risks relating to finance debt for which hedge accounting is applied, less cash and cash equivalents. Net debt and gearing are non-IFRS measures. bp believes these measures provide useful information to investors. Net debt enables investors to see the economic effect of finance debt, related hedges and cash and cash equivalents in total. Gearing enables investors to see how significant net debt is relative to total equity. The derivatives are reported on the balance sheet within the headings ‘Derivative financial instruments’. All components of equity are included in the denominator of the calculation.
At 31 December 2023, gearing was 19.7 % (2022 20.5 %).
| $ million | |||||||||||
| At 31 December | 2023 | 2022 | |||||||||
| Finance debt | |||||||||||
Less: fair value asset (liability) of hedges related to finance debta | ( | ( | |||||||||
| Less: cash and cash equivalents | |||||||||||
| Net debt | |||||||||||
| Total equity | |||||||||||
| Gearing | |||||||||||
Certain subsidiaries in the group have externally imposed capital requirements and have been in compliance with these requirements throughout the year.
An analysis of changes in liabilities arising from financing activities is provided below.
| $ million | ||||||||||||||||||||
| Finance debt | Currency swapsa | Lease liabilities | Net partner payable for leases entered into on behalf of joint operations | Total liabilities arising from financing activities | ||||||||||||||||
| At 1 January 2023 | ||||||||||||||||||||
| Exchange adjustments | ||||||||||||||||||||
| Net financing cash flow | ( | ( | ( | |||||||||||||||||
| Fair value (gains) losses | ( | ( | ||||||||||||||||||
| New and remeasured leases/joint operations payables | ||||||||||||||||||||
Other movementsb | ( | ( | ||||||||||||||||||
| At 31 December 2023 | ||||||||||||||||||||
| At 1 January 2022 | ||||||||||||||||||||
| Exchange adjustments | ( | ( | ( | |||||||||||||||||
| Net financing cash flow | ( | ( | ( | ( | ( | |||||||||||||||
| Fair value (gains) losses | ( | |||||||||||||||||||
| New and remeasured leases/joint operations payables | ||||||||||||||||||||
Other movementsc | ( | ( | ||||||||||||||||||
| At 31 December 2022 | ||||||||||||||||||||
aCurrency swaps include cross currency interest rate swaps.
b2023 other movements in finance debt include $545 million acquired with TravelCenters of America.
c2022 other movements in finance debt include $1,044 million acquired with Archaea Energy Inc. and a non-cash reduction in balances related to the Alaska divestment. Other movements in the net partner payable for leases entered into on behalf of joint operations primarily represent transfers to amounts held for sale.
The finance debt and currency swap balances above do not include accrued interest, which is reported within other receivables and other payables on the balance sheet and for which the associated cash flows are presented as operating cash flows in the group cash flow statement. The currency swaps are reported on the balance sheet within the headings 'Derivative financial instruments' and are subsets of both derivatives held for trading and derivatives designated in fair value hedge relationships as detailed in Note 30. When hedge accounting is applied to these derivatives they are included in the calculation of net debt shown above.
In addition to the liabilities included in the table above the group has accrued $746 million (2022 $497 million) at the balance sheet date for shares repurchased between the end of the reporting period and 6 February 2024. $7,918 million (2022 $9,996 million) is included in financing activities in the group cash flow statement for the cash used to repurchase shares during the year.
220 | bp Annual Report and Form 20-F 2023 | |||||||||||||
| Financial statements | |||||
28. Leases
The group leases a number of assets as part of its activities. This primarily includes drilling rigs in the oil production & operations and gas & low carbon energy segments and retail service stations, oil depots and storage tanks in the customer & products segment as well as office accommodation and vessel charters across the group. The weighted-average remaining lease term for the total lease portfolio is around 7 years (2022 7 years). Some leases have payments that vary with market interest or inflation rates. Certain leases contain residual value guarantees, which may be triggered in certain circumstances such as if market values have significantly declined at the conclusion of the lease.
The table below shows the timing of the undiscounted cash outflows for the lease liabilities included on the balance sheet.
| $ million | |||||||||||
| 2023 | 2022 | ||||||||||
| Undiscounted lease liability cash flows due: | |||||||||||
| Within 1 year | |||||||||||
| 1 to 2 years | |||||||||||
| 2 to 3 years | |||||||||||
| 3 to 4 years | |||||||||||
| 4 to 5 years | |||||||||||
| 5 to 10 years | |||||||||||
| Over 10 years | |||||||||||
| Impact of discounting | ( | ( | |||||||||
| Lease liabilities at 31 December | |||||||||||
| Of which – current | |||||||||||
– non-current | |||||||||||
The group may enter into lease arrangements a number of years before taking control of the underlying asset due to construction lead times or to secure future operational requirements. The total undiscounted amount for future commitments for leases not yet commenced as at 31 December 2023 is $5,507 million (2022 $5,360 million). The majority of this future commitment relates to the floating LNG vessel to service the Greater Tortue Ahmeyim project from 2025.
| $ million | |||||||||||
| 2023 | 2022 | ||||||||||
Total cash outflow for amounts included in lease liabilitiesa | |||||||||||
Expense for variable payments not included in the lease liabilitya | |||||||||||
Short-term lease expensea | |||||||||||
| Additions to right-of-use assets in the period | |||||||||||
29. Financial instruments and financial risk factors
The accounting classification of each category of financial instruments and their carrying amounts are set out below.
| $ million | |||||||||||||||||||||||
| At 31 December 2023 | Note | Measured at amortized cost | Mandatorily measured at fair value through profit or loss | Derivative hedging instruments | Total carrying amount | ||||||||||||||||||
| Financial assets | |||||||||||||||||||||||
| Other investments | 18 | — | |||||||||||||||||||||
| Loans | — | ||||||||||||||||||||||
| Trade and other receivables | 20 | — | — | ||||||||||||||||||||
| Derivative financial instruments | 30 | — | |||||||||||||||||||||
| Cash and cash equivalents | 25 | — | |||||||||||||||||||||
| Financial liabilities | |||||||||||||||||||||||
| Trade and other payables | 22 | ( | — | — | ( | ||||||||||||||||||
| Derivative financial instruments | 30 | — | ( | ( | ( | ||||||||||||||||||
| Accruals | ( | — | — | ( | |||||||||||||||||||
| Lease liabilities | 28 | ( | — | — | ( | ||||||||||||||||||
| Finance debt | 26 | ( | — | — | ( | ||||||||||||||||||
| ( | ( | ( | |||||||||||||||||||||
| bp Annual Report and Form 20-F 2023 | 221 | |||||||||||||
29. Financial instruments and financial risk factors – continued
| $ million | |||||||||||||||||||||||
| At 31 December 2022 | Note | Measured at amortized cost | Mandatorily measured at fair value through profit or loss | Derivative hedging instruments | Total carrying amount | ||||||||||||||||||
| Financial assets | |||||||||||||||||||||||
| Other investments | 18 | — | |||||||||||||||||||||
| Loans | — | ||||||||||||||||||||||
| Trade and other receivables | 20 | — | — | ||||||||||||||||||||
| Derivative financial instruments | 30 | — | |||||||||||||||||||||
| Cash and cash equivalents | 25 | — | |||||||||||||||||||||
| Financial liabilities | |||||||||||||||||||||||
| Trade and other payables | 22 | ( | — | — | ( | ||||||||||||||||||
| Derivative financial instruments | 30 | — | ( | ( | ( | ||||||||||||||||||
| Accruals | ( | — | — | ( | |||||||||||||||||||
| Lease liabilities | 28 | ( | — | — | ( | ||||||||||||||||||
| Finance debt | 26 | ( | — | — | ( | ||||||||||||||||||
| ( | ( | ( | |||||||||||||||||||||
The fair value of finance debt is shown in Note 26. For all other financial instruments within the scope of IFRS 9, the carrying amount is either the fair value, or approximates the fair value.
Information on gains and losses on derivative financial assets and financial liabilities classified as measured at fair value through profit or loss is provided in the derivative gains and losses section of Note 30. Fair value gains and losses related to other assets and liabilities classified as measured at fair value through profit or loss totalled a net loss of $11 million (2022 net loss of $238 million and 2021 net gain of $627 million). Dividend income of $18 million (2022 $14 million and 2021 $11 million) from investments in equity instruments classified as measured at fair value through profit or loss is presented within other income.
Interest income and expenses arising on financial instruments are disclosed in Note 7.
Financial risk factors
The group is exposed to a number of different financial risks arising from ordinary business exposures as well as its use of financial instruments including market risks relating to commodity prices; foreign currency exchange rates and interest rates; credit risk; and liquidity risk.
The group financial risk committee (GFRC) advises the chief financial officer (CFO) who oversees the management of these risks. The GFRC is chaired by the CFO and consists of a group of senior managers including the EVP trading and shipping and SVPs treasury, tax, accounting reporting control and planning & performance management. The purpose of the committee is to advise on financial risks and the appropriate financial risk governance framework for the group. The committee provides assurance to the CFO and the chief executive officer (CEO), and via the CEO to the board, that the group’s financial risk-taking activity is governed by appropriate policies and procedures and that financial risks are identified, measured and managed in accordance with group policies and group risk appetite.
The group’s trading activities in the oil, natural gas, LNG and power markets are managed within the trading and shipping business. Treasury holds foreign exchange and interest-rate products in the financial markets to hedge group exposures related to debt and hybrid bond issuance; the compliance, control and risk management processes for these activities are managed within the treasury business. All other foreign exchange and interest rate activities within financial markets are performed within the trading and shipping business and are also underpinned by the compliance, control and risk management infrastructure common to the activities of bp’s trading and shipping business. All derivative activity is carried out by specialist teams that have the appropriate skills, experience and supervision. These teams are subject to close financial and management control.
The trading and shipping business maintains formal governance processes that provide oversight of market risk, credit risk and operational risk associated with trading activity. A policy and risk committee approves value-at-risk delegations, reviews incidents and validates risk-related policies, methodologies and procedures. A commitments committee approves the trading of new products, instruments and strategies and material commitments.
In addition, the trading and shipping business undertakes derivative activity for risk management purposes under a control framework as described more fully below.
(a) Market risk
Market risk is the risk or uncertainty arising from possible market price movements and their impact on the future performance of a business. The primary commodity price risks that the group is exposed to include oil, natural gas and power prices that could adversely affect the value of the group’s financial assets, liabilities or expected future cash flows. The group has developed a control framework aimed at managing the volatility inherent in certain of its ordinary business exposures. In accordance with the control framework the group enters into various transactions using derivatives for risk management purposes.
The major components of market risk are commodity price risk, foreign currency exchange risk and interest rate risk, each of which is discussed below.
(i) Commodity price risk
The group’s trading and shipping business is responsible for delivering value across the overall crude, oil products, gas, LNG and power supply chains. As such, it routinely enters into spot and term physical commodity contracts in addition to optimising physical storage, pipeline and transportation capacity. These activities expose the group to commodity price risk which is managed by entering into oil, natural gas and power swaps, options and futures.
The group measures market risk exposure arising from its trading positions in liquid periods using value-at-risk techniques based on Monte Carlo simulation models. These techniques make a statistical assessment of the market risk arising from possible future changes in market prices over a one-day holding period within a 95% confidence level. Trading activity occurring in liquid periods is subject to value-at-risk and other limits for each trading
222 | bp Annual Report and Form 20-F 2023 | |||||||||||||
| Financial statements | |||||
29. Financial instruments and financial risk factors – continued
activity and the aggregate of all trading activity. The calculation of potential changes in value within the liquid period considers positions, historical price movements and the correlation of these price movements. Models are regularly reviewed against actual fair value movements to ensure integrity is maintained. The value-at-risk measure is supplemented by stress testing and scenario analysis through simulating the financial impact of certain physical, economic and geo-political scenarios. The value-at-risk measure in respect of the aggregated trading positions in liquid periods at 31 December 2023 was $26 million (2022 $63 million) whereas the average value-at-risk measure for the period was $49 million (2022 $89 million). This measure incorporates the effect of diversification reflecting the offsetting risks across the trading portfolio. Alternative measures are used to monitor exposures which are outside of liquid periods and for which value-at-risk techniques are not appropriate.
(ii) Foreign currency exchange risk
Since bp has global operations, fluctuations in foreign currency exchange rates can have a significant effect on the group’s reported results and future expenditure commitments. The effects of most exchange rate fluctuations are absorbed in business operating results through changing cost competitiveness, lags in market adjustment to movements in rates and translation differences accounted for on specific transactions. For this reason, the total effect of exchange rate fluctuations is not identifiable separately in the group’s reported results. The main underlying economic currency of the group’s cash flows is the US dollar. This is because bp’s major product, oil, is priced internationally in US dollars. bp’s foreign currency exchange management policy is to limit economic and material transactional exposures arising from currency movements against the US dollar. The group co-ordinates the handling of foreign currency exchange risks centrally, by netting off naturally-occurring opposite exposures wherever possible and then managing any material residual foreign currency exchange risks.
Most of the group’s borrowings are in US dollars or are hedged with respect to the US dollar. At 31 December 2023, the total foreign currency borrowings not swapped into US dollars amounted to $309 million (2022 $188 million). The group also has in issue perpetual subordinated hybrid bonds in euro, sterling and US dollars. Whilst the contractual terms of these instruments allow the group to defer coupon payments and the repayment of principal indefinitely, the group has chosen to manage the foreign currency exposure relating to the non-US dollar hybrid bonds to their respective first call periods.
The group manages the net residual foreign currency exposures by constantly reviewing the foreign currency economic value at risk and aims to manage such risk to keep the 12-month foreign currency value at risk below $400 million. At no point over the past three years did the value at risk exceed the maximum risk limit. A continuous assessment is made in respect of the group’s foreign currency exposures to capture hedging requirements.
During the year, hedge accounting was applied to foreign currency exposure to highly probable forecast capital expenditure commitments. The group fixes the US dollar cost of non-US dollar supplies by using currency forwards for the highly probable forecast capital expenditure. At 31 December 2023 the most significant open contracts in place were for USD equivalent amounts of $296 million sterling and $22 million Euro (2022 $5 million sterling).
Where the group enters into foreign currency exchange contracts for entrepreneurial trading purposes the activity is controlled using trading value-at-risk techniques as explained in (i) commodity price risk above.
(iii) Interest rate risk
bp is also exposed to interest rate risk from the possibility that changes in interest rates will affect future cash flows or the fair values of its financial instruments, principally finance debt. While the group issues debt and hybrid bonds in a variety of currencies based on market opportunities, it uses derivatives to swap the economic exposure to a floating rate basis, mainly to US dollar floating, but in certain defined circumstances maintains a US dollar fixed rate exposure for a proportion of debt. The proportion of floating rate debt net of interest rate swaps at 31 December 2023 was 35 % of total finance debt outstanding (2022 39 %). The weighted average interest rate on finance debt at 31 December 2023 was 5 % (2022 4 %) and the weighted average maturity of fixed rate debt was thirteen years (2022 fourteen years ).
The group’s earnings are sensitive to changes in interest rates on the element of the group’s finance debt that is contractually floating rate or has been swapped to floating rates (see Note 26). If the interest rates applicable to these floating rate instruments were to have changed by one percentage point on 1 January 2024, it is estimated that the group’s finance costs for 2024 would change by approximately $182 million (2022 $181 million).
Prior to June 2023, the main benchmark interest rate to which bp was exposed was 3 month USD LIBOR, primarily in relation to finance debt and derivative contracts. During 2023, bp's internal working group for IBOR reform continued to monitor market developments and managed the transition to alternative benchmark rates. Publication of USD LIBOR tenors, including 3 month USD LIBOR, ceased from 30 June 2023.
Finance debt exposed to IBOR benchmark rates was renegotiated with relevant counterparties and transitioned to reference alternative risk free benchmarks. Amendments to finance debt terms arising were limited only to changes necessary to ensure economic equivalence with the former interest benchmarks, for example credit spread adjustments to the contractual interest rates.
Derivatives that previously referenced USD LIBOR also transitioned to referencing the Secured Overnight Financing Rate (SOFR) via the International Swaps and Derivatives Association (ISDA) fallback protocol. The derivatives comprise relevant derivative contracts hedging finance debt and hybrid bonds. In October 2020 the ISDA published its fallback protocol containing clauses to amend derivative contracts on the cessation of LIBOR should an entity and its counterparties adhere to the protocol. The protocol’s pricing mechanism is at fair market value and bp has signed up to the protocol as this removes transition uncertainty for any interest rate and cross-currency interest rate swap contracts of the group. New contracts are being executed based on the new risk free rates. As at 31 December 2023, bp has no remaining contractual exposure to interest rate benchmark reform.
(b) Credit risk
Credit risk is the risk that a customer or counterparty to a financial instrument will fail to perform or fail to pay amounts due causing financial loss to the group and arises from cash and cash equivalents, derivative financial instruments and deposits with financial institutions and principally from credit exposures to customers relating to outstanding receivables. Credit exposure also exists in relation to guarantees issued by group companies under which the outstanding exposure incremental to that recognized on the balance sheet at 31 December 2023 was $1,655 million (2022 $1,704 million) in respect of liabilities of joint ventures and associates and $598 million (2022 $680 million) in respect of liabilities of other third parties. An amount of $201 million (2022 $267 million) is recorded as a liability at 31 December 2023 in relation to these guarantees. For all guarantees, maturity dates vary, and the guarantees will terminate on payment and/or cancellation of the obligation. In general, a payment under the guarantee contract would be triggered by failure of the guaranteed party to fulfil its obligation covered by the guarantee.
| bp Annual Report and Form 20-F 2023 | 223 | |||||||||||||
29. Financial instruments and financial risk factors – continued
The group has a credit policy, approved by the CFO, that is designed to ensure that consistent processes are in place throughout the group to measure and control credit risk. Credit risk is considered as part of the risk-reward balance of doing business. On entering into any business contract the extent to which the arrangement exposes the group to credit risk is considered. Key requirements of the policy include segregation of credit approval authorities from any sales, marketing or trading teams authorized to incur credit risk; the establishment of credit systems and processes to ensure that all counterparty exposure is rated and that all counterparty exposure and limits can be monitored and reported; and the timely identification and reporting of any non-approved credit exposures and credit losses. While each segment is responsible for its own credit risk management and reporting consistent with group policy, treasury holds group-wide credit risk authority and oversight responsibility for exposure to banks and financial institutions.
For the purposes of financial reporting the group calculates expected loss allowances based on the maximum contractual period over which the group is exposed to credit risk. Lifetime expected credit losses are recognized for trade receivables and the credit risk associated with the significant majority of financial assets measured at amortized cost is considered to be low. Since the tenor of substantially all of the group's in-scope financial assets is less than 12 months there is no significant difference between the measurement of 12-month and lifetime expected credit losses. Expected loss allowances for financial guarantee contracts are typically lower than their initial fair value less, where appropriate, amortization. Financial assets are considered to be credit-impaired when there is reasonable and supportable evidence that one or more events that have a detrimental impact on the estimated future cash flows of the financial asset have occurred. This includes observable data concerning significant financial difficulty of the counterparty; a breach of contract; concession being granted to the counterparty for economic or contractual reasons relating to the counterparty’s financial difficulty, that would not otherwise be considered; it becoming probable that the counterparty will enter bankruptcy or other financial re-organization or an active market for the financial asset disappearing because of financial difficulties. The group also applies a rebuttable presumption that an asset is credit-impaired when contractual payments are more than 30 days past due. Where the group has no reasonable expectation of recovering a financial asset in its entirety or a portion thereof, for example where all legal avenues for collection of amounts due have been exhausted, the financial asset (or relevant portion) is written off.
The measurement of expected credit losses is a function of the probability of default, loss given default (i.e. the magnitude of the loss after recovery if there is a default) and the exposure at default (i.e. the asset's carrying amount). The group allocates a credit risk rating to exposures based on data that is determined to be predictive of the risk of loss, including but not limited to external ratings. Probabilities of default derived from historical, current and future-looking market data are assigned by credit risk rating with a loss given default based on historical experience and relevant market and academic research applied by exposure type. Experienced credit judgement is applied to ensure probabilities of default are reflective of the credit risk associated with the group's exposures. Credit enhancements that would reduce the group's credit losses in the event of default are reflected in the calculation when they are considered integral to the related asset.
The maximum credit exposure associated with financial assets is equal to the carrying amount. The group does not aim to remove credit risk entirely but expects to experience a certain level of credit losses. As at 31 December 2023, the group had in place credit enhancements designed to mitigate approximately $12.0 billion (2022 $12.6 billion) of credit risk of which approximately $10.7 billion (2022 $10.3 billion) related to assets in the scope of IFRS 9's impairment requirements. Credit enhancements include standby and documentary letters of credit, bank guarantees, insurance and liens which are typically taken out with financial institutions who have investment grade credit ratings, or are liens over assets held by the counterparty of the related receivables. Reports are regularly prepared and presented to the GFRC that cover the group’s overall credit exposure and expected loss trends, exposure by segment, and overall quality of the portfolio.
Management information used to monitor credit risk, which reflects the impact of credit enhancements, indicates that the risk profile of financial assets which are subject to review for impairment under IFRS 9 is as set out in the table below.
| % | |||||||||||
| As at 31 December | 2023 | 2022 | |||||||||
| AAA to AA- | % | % | |||||||||
| A+ to A- | % | % | |||||||||
| BBB+ to BBB- | % | % | |||||||||
| BB+ to BB- | % | % | |||||||||
| B+ to B- | % | % | |||||||||
| CCC+ and below | % | % | |||||||||
Movements in the impairment provision for trade and other receivables are shown in Note 21.
224 | bp Annual Report and Form 20-F 2023 | |||||||||||||
| Financial statements | |||||
29. Financial instruments and financial risk factors – continued
Financial instruments subject to offsetting, enforceable master netting arrangements and similar agreements
The following table shows the amounts recognized for financial assets and liabilities which are subject to offsetting arrangements on a gross basis, and the amounts offset in the balance sheet.
Amounts which cannot be offset under IFRS, but which could be settled net under the terms of master netting agreements if certain conditions arise, and collateral received or pledged, are also presented in the table to show the total net exposure of the group.
| $ million | |||||||||||||||||||||||
| Gross amounts of recognized financial assets (liabilities) | Amounts set off | Net amounts presented on the balance sheet | Related amounts not set off in the balance sheet | Net amount | |||||||||||||||||||
| At 31 December 2023 | Master netting arrangements | Cash collateral (received) pledged | |||||||||||||||||||||
| Derivative assets | ( | ( | ( | ||||||||||||||||||||
| Derivative liabilities | ( | ( | ( | ||||||||||||||||||||
| Trade and other receivables | ( | ( | ( | ||||||||||||||||||||
| Trade and other payables | ( | ( | ( | ||||||||||||||||||||
| At 31 December 2022 | |||||||||||||||||||||||
| Derivative assets | ( | ( | ( | ||||||||||||||||||||
| Derivative liabilities | ( | ( | ( | ||||||||||||||||||||
| Trade and other receivables | ( | ( | ( | ||||||||||||||||||||
| Trade and other payables | ( | ( | ( | ||||||||||||||||||||
(c) Liquidity risk
Liquidity risk is the risk that suitable sources of funding for the group’s business activities may not be available. The group’s liquidity is managed centrally with operating units forecasting their cash and currency requirements to the central treasury function. Unless restricted by local regulations, generally subsidiaries pool their cash surpluses to the treasury function, which will then arrange to fund other subsidiaries’ requirements, or invest any net surplus in the market or arrange for necessary external borrowings, while managing the group’s overall net currency positions. While there is the potential for concerns about the energy transition to impact banks’ or debt investors’ appetite to finance hydrocarbon activity, we do not anticipate any material change to the group's funding or liquidity in the short to medium term as a result of such concerns.
The group benefits from open credit provided by suppliers who generally sell on five to 60-day payment terms in accordance with industry norms. bp utilizes various arrangements in order to manage its working capital and reduce volatility in cash flow. This includes discounting of receivables and, in the supply and trading businesses, managing inventory, collateral and supplier payment terms within a maximum of 60 days.
It is normal practice in the oil and gas supply and trading business for customers and suppliers to utilize letter of credit (LC) facilities to mitigate credit and non-performance risk. Consequently, LCs facilitate active trading in a global market where credit and performance risk can be significant. In common with the industry, bp routinely provides LCs to some of its suppliers.
The group has committed LC facilities totalling $13,180 million (2022 $12,730 million), allowing LCs to be issued for a maximum 24 -month duration. There were also uncommitted secured LC facilities in place at 31 December 2023 for $3,515 million (2022 $3,800 million), which are secured against inventories or receivables when utilized. The facilities are held with over 28 international banks. The uncommitted LC facilities can only be terminated by either party giving a stipulated termination notice to the other.
In certain circumstances, the supplier has the option to request accelerated payment from the LC provider in order to further reduce their exposure. bp’s payments are made to the provider of the LC rather than the supplier according to the original contractual payment terms. At 31 December 2023, $9,955 million (2022 $9,520 million) of the group’s trade payables subject to these arrangements were payable to LC providers, with no material exposure to any individual provider. If these facilities were not available, this could result in renegotiation of payment terms with suppliers such that settlement periods were shorter.
Standard & Poor’s Ratings long-term credit rating for bp is A- (positive) and Moody’s Investors Service rating is A2 (positive) and the Fitch Ratings' long-term credit rating is A+ (stable).
During 2023, $6 billion (2022 $2 billion) of long-term taxable bonds were issued with terms ranging from to 15 years. In addition the group drew down on perpetual hybrid capital instruments with a US dollar equivalent value of $0.2 billion (2022 $0.4 billion). Commercial paper is issued at competitive rates to meet short-term borrowing requirements as and when needed.
As a further liquidity measure, the group continues to maintain suitable levels of cash and cash equivalents, amounting to $33.0 billion at 31 December 2023 (2022 $29.2 billion), primarily invested with highly rated banks or money market funds and readily accessible at immediate and short notice. At 31 December 2023, the group had substantial amounts of undrawn borrowing facilities available, consisting of an undrawn committed $8.0 billion (2022 $8.0 billion) credit facility and $4.0 billion (2022 $4.0 billion) of standby facilities. As at 31 December 2023 $0.2 billion of the credit facility was available for one year and $7.8 billion was available for 2 years. As at 31 December 2023 $0.1 billion of the standby facilities were available for three years and $3.9 billion were available for four years. The facilities are with 27 international banks and borrowings under them would be at pre-agreed rates.
For further information on the group's sources and uses of cash see Liquidity and capital resources on page 340.
The group manages liquidity risk associated with derivative contracts, other than derivative hedging instruments, based on the expected maturities of both derivative assets and liabilities as indicated in Note 30. Management does not currently anticipate any cash flows, other than noted below, that could be of a significantly different amount or could occur earlier than the expected maturity analysis provided.
| bp Annual Report and Form 20-F 2023 | 225 | |||||||||||||
29. Financial instruments and financial risk factors – continued
The table below shows the timing of undiscounted cash outflows relating to finance debt, trade and other payables and accruals. As part of actively managing the group’s debt portfolio it is possible that cash flows in relation to finance debt could be accelerated from the profile provided.
| $ million | |||||||||||||||||||||||||||||
| 2023 | 2022 | ||||||||||||||||||||||||||||
Trade and other payablesa | Accruals | Finance debt | Interest on finance debt | Trade and other payablesa | Accruals | Finance debt | Interest on finance debtb | ||||||||||||||||||||||
| Within one year | |||||||||||||||||||||||||||||
| 1 to 2 years | |||||||||||||||||||||||||||||
| 2 to 3 years | |||||||||||||||||||||||||||||
| 3 to 4 years | |||||||||||||||||||||||||||||
| 4 to 5 years | |||||||||||||||||||||||||||||
| 5 to 10 years | |||||||||||||||||||||||||||||
| Over 10 years | |||||||||||||||||||||||||||||
a2023 includes $10,662 million (2022 $11,884 million) in relation to the Gulf of Mexico oil spill, of which $9,520 million (2022 $10,660 million) matures in greater than one year.
bComparative amounts for interest on finance debt have been amended to align with current year presentation. The amendment has increased cash outflows by $3,022 million.
The table below shows the timing of cash outflows for derivative financial instruments entered into for the purpose of managing interest rate and foreign currency exchange risk, whether or not hedge accounting is applied, based upon contractual payment dates. As part of actively managing the group’s debt portfolio it is possible that cash flows in relation to associated derivatives could be accelerated from the profile provided. The amounts reflect the gross settlement amount where the pay leg of a derivative will be settled separately from the receive leg, as in the case of cross-currency swaps hedging non-US dollar finance debt or hybrid bonds. The swaps are with high investment-grade counterparties and therefore the settlement-day risk exposure is considered to be negligible. Not shown in the table are the gross settlement amounts (inflows) for the receive leg of derivatives that are settled separately from the pay leg, which amount to $24,120 million at 31 December 2023 (2022 $23,970 million) to be received on the same day as the related cash outflows.
| $ million | |||||||||||
| Cash outflows for derivative financial instruments at 31 December | 2023 | 2022 | |||||||||
| Within one year | |||||||||||
| 1 to 2 years | |||||||||||
| 2 to 3 years | |||||||||||
| 3 to 4 years | |||||||||||
| 4 to 5 years | |||||||||||
| 5 to 10 years | |||||||||||
| Over 10 years | |||||||||||
For further information on our derivative financial instruments, see Note 30.
30. Derivative financial instruments
In the normal course of business the group enters into derivative financial instruments (derivatives) to manage its normal business exposures in relation to commodity prices, foreign currency exchange rates and interest rates, including management of the balance between floating rate and fixed rate debt, consistent with risk management policies and objectives. An outline of the group’s financial risks and the objectives and policies pursued in relation to those risks is set out in Note 29. Additionally, the group has a well-established entrepreneurial trading operation that is undertaken in conjunction with these activities using a similar range of contracts.
For information on significant estimates and judgements made in relation to the valuation of derivatives see Derivative financial instruments within Note 1.
The fair values of derivative financial instruments at 31 December are set out below.
Exchange traded derivatives are valued using closing prices provided by the exchange as at the balance sheet date. These derivatives are categorized within level 1 of the fair value hierarchy. Exchange traded derivatives are typically considered settled through the (normally daily) payment or receipt of variation margin.
Over-the-counter (OTC) financial swaps, forwards and physical commodity sale and purchase contracts are generally valued using readily available information in the public markets and quotations provided by brokers and price index developers. These quotes are corroborated with market data and are categorized within level 2 of the fair value hierarchy.
In certain less liquid markets, or for longer-term contracts, forward prices are not as readily available. In these circumstances, OTC financial swaps and physical commodity sale and purchase contracts are valued using internally developed methodologies that consider historical relationships between various commodities, and that result in management’s best estimate of fair value. These contracts are categorized within level 3 of the fair value hierarchy.
226 | bp Annual Report and Form 20-F 2023 | |||||||||||||
| Financial statements | |||||
30. Derivative financial instruments – continued
Financial OTC and physical commodity options are valued using industry standard models that consider various assumptions, including quoted forward prices for commodities, time value, volatility factors, and contractual prices for the underlying instruments, as well as other relevant economic factors. The degree to which these inputs are observable in the forward markets determines whether the option is categorized within level 2 or level 3 of the fair value hierarchy.
| $ million | |||||||||||||||||
| 2023 | 2022 | ||||||||||||||||
| Fair value asset | Fair value liability | Fair value asset | Fair value liability | ||||||||||||||
Derivatives held for tradinga | |||||||||||||||||
| Currency derivatives | ( | ( | |||||||||||||||
| Oil price derivatives | ( | ( | |||||||||||||||
| Natural gas price derivatives | ( | ( | |||||||||||||||
| Power price derivatives | ( | ( | |||||||||||||||
| Other derivatives | |||||||||||||||||
| ( | ( | ||||||||||||||||
| Embedded derivatives | |||||||||||||||||
| Other embedded derivatives | ( | ||||||||||||||||
| ( | |||||||||||||||||
| Cash flow hedges | |||||||||||||||||
| Currency forwards | ( | ||||||||||||||||
| ( | |||||||||||||||||
| Fair value hedges | |||||||||||||||||
| Currency swaps | ( | ( | |||||||||||||||
| Interest rate swaps | ( | ( | |||||||||||||||
| ( | ( | ||||||||||||||||
| ( | ( | ||||||||||||||||
| Of which – current | ( | ( | |||||||||||||||
– non-current | ( | ( | |||||||||||||||
aIncludes embedded derivatives for which the critical terms are matched by standalone derivatives that are also classified as held for trading.
Derivatives held for trading
The group maintains active trading positions in a variety of derivatives. The contracts may be entered into for risk management purposes, to satisfy supply requirements or for entrepreneurial trading. Certain contracts are classified as held for trading, regardless of their original business objective, and are recognized at fair value with changes in fair value recognized in the income statement. Trading activities are undertaken by using a range of contract types in combination to create incremental gains by arbitraging prices between markets, locations and time periods. The net of these exposures is monitored using market value-at-risk techniques as described in Note 29.
The following tables show further information on the fair value of derivatives and other financial instruments held for trading purposes.
Derivative assets held for trading have the following fair values and maturities.
| $ million | ||||||||||||||||||||||||||
| 2023 | ||||||||||||||||||||||||||
| Less than 1 year | 1-2 years | 2-3 years | 3-4 years | 4-5 years | Over 5 years | Total | ||||||||||||||||||||
| Currency derivatives | ||||||||||||||||||||||||||
| Oil price derivatives | ||||||||||||||||||||||||||
| Natural gas price derivatives | ||||||||||||||||||||||||||
| Power price derivatives | ||||||||||||||||||||||||||
| Other derivatives | ||||||||||||||||||||||||||
| $ million | ||||||||||||||||||||||||||
| 2022 | ||||||||||||||||||||||||||
| Less than 1 year | 1-2 years | 2-3 years | 3-4 years | 4-5 years | Over 5 years | Total | ||||||||||||||||||||
| Currency derivatives | ||||||||||||||||||||||||||
| Oil price derivatives | ||||||||||||||||||||||||||
| Natural gas price derivatives | ||||||||||||||||||||||||||
| Power price derivatives | ||||||||||||||||||||||||||
| Other derivatives | ||||||||||||||||||||||||||
| bp Annual Report and Form 20-F 2023 | 227 | |||||||||||||
30. Derivative financial instruments – continued
Derivative liabilities held for trading have the following fair values and maturities.
| $ million | ||||||||||||||||||||||||||
| 2023 | ||||||||||||||||||||||||||
| Less than 1 year | 1-2 years | 2-3 years | 3-4 years | 4-5 years | Over 5 years | Total | ||||||||||||||||||||
| Currency derivatives | ( | ( | ( | ( | ( | ( | ( | |||||||||||||||||||
| Oil price derivatives | ( | ( | ( | ( | ( | ( | ( | |||||||||||||||||||
| Natural gas price derivatives | ( | ( | ( | ( | ( | ( | ( | |||||||||||||||||||
| Power price derivatives | ( | ( | ( | ( | ( | ( | ( | |||||||||||||||||||
| ( | ( | ( | ( | ( | ( | ( | ||||||||||||||||||||
| $ million | ||||||||||||||||||||||||||
| 2022 | ||||||||||||||||||||||||||
| Less than 1 year | 1-2 years | 2-3 years | 3-4 years | 4-5 years | Over 5 years | Total | ||||||||||||||||||||
| Currency derivatives | ( | ( | ( | ( | ( | ( | ( | |||||||||||||||||||
| Oil price derivatives | ( | ( | ( | ( | ( | ( | ||||||||||||||||||||
| Natural gas price derivatives | ( | ( | ( | ( | ( | ( | ( | |||||||||||||||||||
| Power price derivatives | ( | ( | ( | ( | ( | ( | ( | |||||||||||||||||||
| ( | ( | ( | ( | ( | ( | ( | ||||||||||||||||||||
The following table shows the fair value of derivative assets and derivative liabilities held for trading, analysed by maturity period and by methodology of fair value estimation. This information is presented on a gross basis, that is, before netting by counterparty.
| $ million | ||||||||||||||||||||||||||
| 2023 | ||||||||||||||||||||||||||
| Less than 1 year | 1-2 years | 2-3 years | 3-4 years | 4-5 years | Over 5 years | Total | ||||||||||||||||||||
| Fair value of derivative assets | ||||||||||||||||||||||||||
| Level 1 | ||||||||||||||||||||||||||
| Level 2 | ||||||||||||||||||||||||||
| Level 3 | ||||||||||||||||||||||||||
| Less: netting by counterparty | ( | ( | ( | ( | ( | ( | ( | |||||||||||||||||||
| Fair value of derivative liabilities | ||||||||||||||||||||||||||
| Level 1 | ( | ( | ( | ( | ( | |||||||||||||||||||||
| Level 2 | ( | ( | ( | ( | ( | ( | ( | |||||||||||||||||||
| Level 3 | ( | ( | ( | ( | ( | ( | ( | |||||||||||||||||||
| ( | ( | ( | ( | ( | ( | ( | ||||||||||||||||||||
| Less: netting by counterparty | ||||||||||||||||||||||||||
| ( | ( | ( | ( | ( | ( | ( | ||||||||||||||||||||
| Net fair value | ( | |||||||||||||||||||||||||
| $ million | ||||||||||||||||||||||||||
| 2022 | ||||||||||||||||||||||||||
| Less than 1 year | 1-2 years | 2-3 years | 3-4 years | 4-5 years | Over 5 years | Total | ||||||||||||||||||||
| Fair value of derivative assets | ||||||||||||||||||||||||||
| Level 1 | ||||||||||||||||||||||||||
| Level 2 | ||||||||||||||||||||||||||
| Level 3 | ||||||||||||||||||||||||||
| Less: netting by counterparty | ( | ( | ( | ( | ( | ( | ( | |||||||||||||||||||
| Fair value of derivative liabilities | ||||||||||||||||||||||||||
| Level 1 | ( | ( | ( | ( | ( | |||||||||||||||||||||
| Level 2 | ( | ( | ( | ( | ( | ( | ( | |||||||||||||||||||
| Level 3 | ( | ( | ( | ( | ( | ( | ( | |||||||||||||||||||
| ( | ( | ( | ( | ( | ( | ( | ||||||||||||||||||||
| Less: netting by counterparty | ||||||||||||||||||||||||||
| ( | ( | ( | ( | ( | ( | ( | ||||||||||||||||||||
| Net fair value | ( | ( | ( | ( | ||||||||||||||||||||||
228 | bp Annual Report and Form 20-F 2023 | |||||||||||||
| Financial statements | |||||
30. Derivative financial instruments – continued
Level 3 derivatives
The following table shows the changes during the year in the net fair value of derivatives held for trading purposes within level 3 of the fair value hierarchy.
| $ million | |||||||||||||||||||||||
| Oil price | Natural gas price | Power price | Currency | Other | Total | ||||||||||||||||||
| Fair value contracts at 1 January 2023 | ( | ||||||||||||||||||||||
| Gains (losses) recognized in the income statement | |||||||||||||||||||||||
| Settlements | ( | ( | ( | ( | |||||||||||||||||||
| Transfers out of level 3 | ( | ( | ( | ( | |||||||||||||||||||
| Net fair value of contracts at 31 December 2023 | ( | ||||||||||||||||||||||
| Deferred day-one gains (losses) | |||||||||||||||||||||||
| Derivative asset (liability) | |||||||||||||||||||||||
| $ million | |||||||||||||||||||||||
| Oil price | Natural gas price | Power price | Currency | Other | Total | ||||||||||||||||||
| Fair value contracts at 1 January 2022 | ( | ||||||||||||||||||||||
| Gains (losses) recognized in the income statement | |||||||||||||||||||||||
Purchasesa | ( | ( | ( | ||||||||||||||||||||
| Settlements | ( | ( | ( | ( | |||||||||||||||||||
| Transfers out of level 3 | ( | ( | |||||||||||||||||||||
| Net fair value of contracts at 31 December 2022 | ( | ||||||||||||||||||||||
| Deferred day-one gains (losses) | |||||||||||||||||||||||
| Derivative asset (liability) | |||||||||||||||||||||||
a Primarily relates to the acquisition of EDF Energy Services.
The amount recognized in the income statement for the year relating to level 3 held-for-trading derivatives still held at 31 December 2023 was a $631 million gain (2022 $1,223 million gain related to derivatives still held at 31 December 2022).
Derivative gains and losses
The group enters into derivative contracts including futures, options, swaps and certain forward sales and forward purchases contracts, relating to both currency and commodity trading activities. Gains or losses arise on contracts entered into for risk management purposes, optimization activity and entrepreneurial trading. They also arise on certain contracts that are for normal procurement or sales activity for the group but that are required to be fair valued under accounting standards. These gains and losses are included within sales and other operating revenues in the income statement. Also included within this line item are gains and losses on inventory held for trading purposes. The total amount relating to all these items was a net gain of $19,786 million (2022 $7,829 million net gain). This number does not include gains and losses on the change in value of contracts which are not recognized under IFRS such as transportation and storage contracts, but does include the associated financially settled contracts. The net amounts for actual gains and losses relating to these derivative contracts and all related items therefore differ significantly from the amounts disclosed above.
As outlined in Note 1 - Significant estimate and judgement: derivative financial instruments, LNG contracts are only recognised in the financial statements when associated cargoes are lifted. The embedded value in these contracts is not recognised and is subject to underlying commodity price volatility, as observed during 2022 and 2023. bp realised significant profits in 2023 as LNG cargoes were delivered. bp generally price risk manages the exposure to LNG cargoes due for delivery in the near term where there is a liquid market. It does so on a portfolio basis using derivative instruments amongst other price risk management strategies. Under IFRS, these derivative instruments, which are subject to similar price volatility, are recorded at fair value through profit and loss at each reporting period, which creates an accounting mismatch in the financial statements between the accounting for LNG contracts and the derivatives used for risk management. For the year ended 31 December 2023, there were material gains recognized on the associated derivative positions due to the movement in the underlying commodity prices. For the year ended 31 December 2022, there were no material gains or losses recorded on the associated derivative positions. For additional information, details of management’s internal measure of performance are given in the Group Performance Report on page 35 and on page 338.
The group also enters into derivative contracts relating to foreign currency risk management activities including contracts that the group has entered into to manage the foreign currency exposure relating to the non-US dollar hybrid bonds to their respective first call periods. The change in the unrealized value of these contracts was a net gain of $632 million (2022 $1,280 million net loss and 2021 $775 million net loss). Where the derivative is economically hedging finance debt, gains and losses on such derivative contracts are included within finance costs. Where the derivative is managing non-US hybrid bond exposure gains and loss are included within production and manufacturing expenses. Where these gains and losses arise on derivatives hedging finance debt they are largely offset by opposing net foreign exchange differences on retranslation of the associated non-US dollar debt. The net amounts for actual gains and losses relating to these derivative contracts and all related items therefore differ significantly from the amounts disclosed above.
Cash flow hedges
(i) Foreign currency risk of highly probable forecast capital expenditure
At 31 December 2023, the group held currency forwards designated as hedging instruments in cash flow hedge relationships of highly probable forecast non-US dollar capital expenditure. Note 29 outlines the group’s approach to foreign currency exchange risk management. When the highly probable forecast capital expenditure designated as a hedged item occurs, a non-financial asset is recognized and is presented within the fixed asset section of the balance sheet.
The group claims hedge accounting only for the spot value of the currency exposure in line with the strategy to fix the volatility in the spot exchange rate element. The fair value on the instrument attributable to forward points and foreign currency basis spreads is taken immediately to the income statement.
| bp Annual Report and Form 20-F 2023 | 229 | |||||||||||||
30. Derivative financial instruments – continued
The group applies hedge accounting where there is an economic relationship between the hedged item and hedging instrument. The existence of an economic relationship is determined at inception and prospectively by comparing the critical terms of the hedging instrument and those of the hedged item. The group enters into hedging derivatives that match the currency and notional of the hedged items on a 1:1 hedge ratio basis. The hedge ratio is determined by comparing the notional amount of the derivative with the notional designated on the forecast transaction. The group determines the extent to which it hedges highly probable forecast capital expenditures on a project by project basis.
The group has identified the following sources of ineffectiveness, which are not expected to be material:
•counterparty's credit risk, the group mitigates counterparty credit risk by entering into derivative transactions with high credit quality counterparties; and
•differences in settlement timing between the derivative and hedged items. The latter impacts the discount factor used in the calculation of the hedge ineffectiveness. The group mitigates differences in timing between the derivatives and hedged items by applying a rolling strategy and by hedging currency pairs from stable economies. The group's cash flow hedge designations are highly effective as the sources of ineffectiveness identified are expected to result in minimal hedge ineffectiveness.
The group has not designated any net positions as hedged items in cash flow hedges of foreign currency risk.
(ii) Commodity price risk of highly probable forecast sales
During the period the group held Henry Hub NYMEX futures designated as hedging instruments in cash flow hedge relationships of certain highly probable forecast future sales. Henry Hub NYMEX futures are subject to daily settlement, where their fair value at the end of each day is required to be cash settled, such that the carrying amount of these hedging instruments within continuing hedge relationships is always zero at the end of each day.
The group is exposed to the variability in the gas price, but only applied hedge accounting to the risk of Henry Hub price movements for a percentage of future gas sales from its BPX Energy business.
The group applied hedge accounting in relation to these highly probable future sales where there was an economic relationship between the hedged item and hedging instrument. The existence of an economic relationship was determined at inception and prospectively by comparing the critical terms of the hedging instrument and those of the hedged item. The group entered into hedging derivatives that matched the notional amounts of the hedged items on a 1:1 hedge ratio basis. The hedge ratio was determined by comparing the notional amount of the derivative with the notional amount designated on the forecast transaction.
The hedge was highly effective due to the price index of the hedging instruments matching the price index of the hedged item. The group did not designate any net positions as hedged items in cash flow hedges of commodity price risk.
The tables below summarize the change in the fair value of hedging instruments and the hedged item used to calculate ineffectiveness in the period.
| $ million | ||||||||||||||
| Change in fair value of hedging instrument used to calculate ineffectiveness | Change in fair value of hedged item used to calculate ineffectiveness | Hedge ineffectiveness recognized in profit or (loss) | ||||||||||||
| At 31 December 2023 | ||||||||||||||
| Cash flow hedges | ||||||||||||||
| Foreign exchange risk | ||||||||||||||
| Highly probable forecast capital expenditure | ( | |||||||||||||
| Commodity price risk | ||||||||||||||
| Highly probable forecast sales | ( | |||||||||||||
| At 31 December 2022 | ||||||||||||||
| Cash flow hedges | ||||||||||||||
| Foreign exchange risk | ||||||||||||||
| Highly probable forecast capital expenditure | ||||||||||||||
| Commodity price risk | ||||||||||||||
| Highly probable forecast sales | ( | |||||||||||||
230 | bp Annual Report and Form 20-F 2023 | |||||||||||||
| Financial statements | |||||
30. Derivative financial instruments – continued
The tables below summarize the carrying amount and nominal amount of the derivatives designated as hedging instruments in cash flow hedge relationships.
| Carrying amount of hedging instrument | Nominal amounts of hedging instruments | ||||||||||||||||
| Assets | Liabilities | ||||||||||||||||
| At 31 December 2023 | $ million | $ million | $ million | mmBtu | |||||||||||||
| Cash flow hedges | |||||||||||||||||
| Foreign exchange risk | |||||||||||||||||
| Highly probable forecast capital expenditure | ( | ||||||||||||||||
| Commodity price risk | |||||||||||||||||
| Highly probable forecast sales | ( | ||||||||||||||||
| At 31 December 2022 | |||||||||||||||||
| Cash flow hedges | |||||||||||||||||
| Foreign exchange risk | |||||||||||||||||
| Highly probable forecast capital expenditure | |||||||||||||||||
| Commodity price risk | |||||||||||||||||
| Highly probable forecast sales | ( | ||||||||||||||||
All hedging instruments are presented within derivative financial instruments on the group balance sheet.
All of the nominal amount of hedging instruments at 31 December 2023 and 2022 relating to highly probable forecast capital expenditure matures within 12 months of the relevant balance sheet date. All of the nominal amount of hedging instruments at 31 December 2023 relating to highly probable forecast sales matures within 12 months (2022 349 mmBtu within 12 months and 120 mmBtu within one to two years) of the relevant balance sheet date.
The table below summarizes the weighted average exchange rates and the weighted average sales price in relation to the derivatives designated as hedging instruments in cash flow hedge relationships at 31 December.
| Weighted average price/rate | |||||||||||||||||
| 2023 | 2022 | ||||||||||||||||
| At 31 December | Forecast capital expenditure | Forecast sales | Forecast capital expenditure | Forecast sales | |||||||||||||
| Sterling/US dollar | |||||||||||||||||
| Euro/US dollar | |||||||||||||||||
| Henry Hub $/mmBtu | |||||||||||||||||
Fair value hedges
At 31 December 2023, the group held interest rate and cross-currency interest rate swap contracts as fair value hedges of the interest rate risk and foreign currency risk arising from group fixed rate debt issuances. Note 29 outlines the group’s approach to interest rate and foreign currency exchange risk management. The interest rate swaps are used to convert US dollar denominated fixed rate borrowings into floating rate debt. The cross-currency interest rate swaps are used to convert sterling, euro, Swiss franc, Canadian dollar and Norwegian krone denominated fixed rate borrowings into US dollar floating rate debt. The group manages all risks derived from debt issuance, such as credit risk, however, the group applies hedge accounting only to certain components of interest rate and foreign currency risk in order to minimize hedge ineffectiveness. The interest rate and foreign currency exposures are identified and hedged on an instrument-by-instrument basis. For interest rate exposures, the group designates as a fair value hedge the benchmark interest rate component only. This is an observable and reliably measurable component of interest rate risk.
bp's fair value hedge accounting relationships have been directly affected by interest rate benchmark reform. Prior to 2023, the group's swaps which reference interest rates were primarily exposed to 3 month USD LIBOR. During 2023, all the swaps that previously referenced USD LIBOR transitioned to referencing SOFR through activation of the ISDA fallback clauses. The transition was enacted on an 'economically equivalent' basis. No other changes were made to the terms of swap contracts upon transition to SOFR. The hedge relationships were not discontinued and SOFR is now assessed as the hedged interest rate benchmark risk. The interest rate benchmark reform did not change the risk management strategy for fair value hedges. New derivative hedging instruments are being executed based on the new risk free rates.
For foreign currency exposures, the group excludes from the designation the foreign currency basis spread component implicit in the cross-currency interest rate swaps. This is separately calculated at hedge designation, is recognized in other comprehensive income over the life of the hedge and amortized to the income statement on a straight-line basis, in accordance with the group’s policy on costs of hedging.
| bp Annual Report and Form 20-F 2023 | 231 | |||||||||||||
30. Derivative financial instruments – continued
The group applies hedge accounting where there is an economic relationship between the hedged item and the hedging instrument. The existence of an economic relationship is determined initially by comparing the critical terms of the hedging instrument and those of the hedged item and it is prospectively assessed using linear regression analysis. The group issues fixed rate debt and enters into interest rate and cross-currency interest rate swaps with critical terms that match those of the debt and on a 1:1 hedge ratio basis. The hedge ratio is determined by comparing the notional amount of the derivative with the notional amount of the debt. The hedge relationship is designated for the full term and notional value of the debt. Both the hedging instrument and the hedged item are expected to be held to maturity.
The group has identified the following sources of ineffectiveness, which are not expected to be material:
•derivative counterparty’s credit risk which is not offset by the hedged item. This risk is mitigated by entering into derivative transactions only with high credit quality counterparties; and
•sensitivity to interest rate between the hedged item and the derivatives. This is driven by differences in payment frequencies between the instrument and the bond.
The tables below summarize the change in the fair value of hedging instruments and the hedged item used to calculate ineffectiveness in the period. The signage convention for changes in fair value presented in this table is consistent with that presented in Note 27.
| $ million | ||||||||||||||
| Change in fair value of hedging instrument used to calculate ineffectiveness | Change in fair value of hedged item used to calculate ineffectiveness | Hedge ineffectiveness recognized in profit or (loss) | ||||||||||||
| At 31 December 2023 | ||||||||||||||
| Fair value hedges | ||||||||||||||
| Interest rate risk on finance debt | ||||||||||||||
| Interest rate and foreign currency risk on finance debt | ( | |||||||||||||
| At 31 December 2022 | ||||||||||||||
| Fair value hedges | ||||||||||||||
| Interest rate risk on finance debt | ( | |||||||||||||
| Interest rate and foreign currency risk on finance debt | ( | ( | ||||||||||||
The tables below summarize the carrying amount of the derivatives designated as hedging instruments in fair value hedge relationships at 31 December.
| $ million | ||||||||||||||
| Carrying amount of hedging instrument | Nominal amounts of hedging instruments | |||||||||||||
| At 31 December 2023 | Assets | Liabilities | ||||||||||||
| Fair value hedges | ||||||||||||||
| Interest rate risk on finance debt | ( | |||||||||||||
| Interest rate and foreign currency risk on finance debt | ( | |||||||||||||
| At 31 December 2022 | ||||||||||||||
| Fair value hedges | ||||||||||||||
| Interest rate risk on finance debt | ( | |||||||||||||
| Interest rate and foreign currency risk on finance debt | ( | |||||||||||||
All hedging instruments are presented within derivative financial instruments on the group balance sheet and are categorized within level 2 of the fair value hierarchy. Ineffectiveness arising on fair value hedges is included within finance costs in the income statement.
232 | bp Annual Report and Form 20-F 2023 | |||||||||||||
| Financial statements | |||||
30. Derivative financial instruments – continued
The tables below summarize the profile by tenor of the nominal amount of the derivatives designated as hedging instruments in fair value hedge relationships at 31 December.
| $ million | |||||||||||||||||||||||||||||
| At 31 December 2023 | Less than 1 year | 1-2 years | 2-3 years | 3-4 years | 4-5 years | 5-10 years | Over 10 years | Total | |||||||||||||||||||||
| Fair value hedges | |||||||||||||||||||||||||||||
| Interest rate risk on finance debt | |||||||||||||||||||||||||||||
| Interest rate and foreign currency risk on finance debt | |||||||||||||||||||||||||||||
| At 31 December 2022 | |||||||||||||||||||||||||||||
| Fair value hedges | |||||||||||||||||||||||||||||
| Interest rate risk on finance debt | |||||||||||||||||||||||||||||
| Interest rate and foreign currency risk on finance debt | |||||||||||||||||||||||||||||
The table below summarizes the weighted average floating interest rate and the weighted average exchange rates in relation to the derivatives designated as hedging instruments in fair value hedge relationships at 31 December.
| At 31 December | 2023 | 2022 | |||||||||||||||
| Interest rate swaps | Cross-currency interest rate swaps | Interest rate swaps | Cross-currency interest rate swaps | ||||||||||||||
| Interest rate | % | % | % | % | |||||||||||||
| Sterling/US dollar | |||||||||||||||||
| Euro/US dollar | |||||||||||||||||
| Canadian dollar/US dollar | |||||||||||||||||
The tables below summarize the carrying amount, and the accumulated fair value adjustments included within the carrying amount, of the hedged items designated in fair value hedge relationships at 31 December.
| $ million | |||||||||||||||||
| Carrying amount of hedged item | Accumulated fair value adjustment included in the carrying amount of hedged items | ||||||||||||||||
| At 31 December 2023 | Liabilities | Assets | Liabilities | Discontinued hedges | |||||||||||||
| Fair value hedges | |||||||||||||||||
| Interest rate risk on finance debt | ( | ( | |||||||||||||||
| Interest rate and foreign currency risk on finance debt | ( | ||||||||||||||||
| At 31 December 2022 | |||||||||||||||||
| Fair value hedges | |||||||||||||||||
| Interest rate risk on finance debt | ( | ( | |||||||||||||||
| Interest rate and foreign currency risk on finance debt | ( | ||||||||||||||||
The hedged item for all fair value hedges is presented within finance debt on the group balance sheet.
| bp Annual Report and Form 20-F 2023 | 233 | |||||||||||||
30. Derivative financial instruments – continued
Movement in reserves related to hedge accounting
The table below provides a reconciliation of the cash flow hedge and costs of hedging reserves on a pre-tax basis by risk category. The signage convention of this table is consistent with that presented in Note 32.
| $ million | ||||||||||||||||||||
| Cash flow hedge reserve | Costs of hedging reserve | |||||||||||||||||||
| Highly probable forecast capital expenditure | Highly probable forecast sales | Purchase of equity | Interest rate and foreign currency risk on finance debt | Total | ||||||||||||||||
| At 1 January 2023 | ( | ( | ( | |||||||||||||||||
Recognized in other comprehensive income | ||||||||||||||||||||
Cash flow hedges marked to market | — | |||||||||||||||||||
Cash flow hedges reclassified to the income statement - hedged item affected profit or loss | ( | — | ( | |||||||||||||||||
| Costs of hedging marked to market | — | — | — | ( | ( | |||||||||||||||
| Costs of hedging reclassified to the income statement | — | — | — | ( | ( | |||||||||||||||
| ( | ||||||||||||||||||||
Cash flow hedges transferred to the balance sheet | ( | — | ( | |||||||||||||||||
| At 31 December 2023 | ( | |||||||||||||||||||
| $ million | ||||||||||||||||||||
| Cash flow hedge reserve | Costs of hedging reserve | |||||||||||||||||||
| Highly probable forecast capital expenditure | Highly probable forecast sales | Purchase of equitya | Interest rate and foreign currency risk on finance debt | Total | ||||||||||||||||
| At 1 January 2022 | ( | ( | ( | ( | ||||||||||||||||
Recognized in other comprehensive income | ||||||||||||||||||||
Cash flow hedges marked to market | ( | ( | — | ( | ||||||||||||||||
Cash flow hedges reclassified to the income statement - hedged item affected profit or loss | — | |||||||||||||||||||
| Costs of hedging marked to market | — | — | — | |||||||||||||||||
| Costs of hedging reclassified to the income statement | — | — | — | |||||||||||||||||
| ( | ||||||||||||||||||||
Cash flow hedges transferred to the balance sheet | — | |||||||||||||||||||
| At 31 December 2022 | ( | ( | ( | |||||||||||||||||
Substantially all of the cash flow hedge reserve balances at 31 December 2023 and amounts reclassified from these cash flow hedge reserves into profit or loss during the year relate to continuing hedge relationships. The amounts reclassified are presented in sales and other operating revenues in the income statement.
In 2022 all of the cash flow hedge reserve related to the purchase of equity was reclassified to the income statement following bp’s decision to exit its shareholding in Rosneft. The amount reclassified is presented in net impairment and losses on sale of businesses and fixed assets in the 2022 income statement.
Costs of hedging relates to the foreign currency basis spreads of hedging instruments used to hedge the group's interest rate and foreign currency risk on debt which is a time-period related item.
234 | bp Annual Report and Form 20-F 2023 | |||||||||||||
| Financial statements | |||||
31. Called-up share capital
The allotted, called up and fully paid share capital at 31 December was as follows:
| 2023 | 2022 | 2021 | |||||||||||||||||||||
| Issued | Shares thousand | $ million | Shares thousand | $ million | Shares thousand | $ million | |||||||||||||||||
Ordinary shares of | |||||||||||||||||||||||
| At 1 January | |||||||||||||||||||||||
Issue of new shares for employee share-based payment plans | |||||||||||||||||||||||
Issue of new shares – otherb | |||||||||||||||||||||||
| Repurchase of ordinary share capital | ( | ( | ( | ( | ( | ( | |||||||||||||||||
| At 31 December | |||||||||||||||||||||||
aThe nominal amount of 8 % cumulative first preference shares and 9 % cumulative second preference shares that can be in issue at any time shall not exceed £10,000,000 for each class of preference shares.
b165 million new ordinary shares were issued in April 2022 as non-cash consideration for the acquisition of the public units of BP Midstream Partners LP.
Voting on substantive resolutions tabled at a general meeting is on a poll. On a poll, shareholders present in person or by proxy have two votes for every £5 in nominal amount of the first and second preference shares held and one vote for every ordinary share held. On a show-of-hands vote on other resolutions (procedural matters) at a general meeting, shareholders present in person or by proxy have one vote each.
In the event of the winding up of the company, preference shareholders would be entitled to a sum equal to the capital paid up on the preference shares, plus an amount in respect of accrued and unpaid dividends and a premium equal to the higher of (i) 10 % of the capital paid up on the preference shares and (ii) the excess of the average market price of such shares on the London Stock Exchange during the previous six months over par value.
During 2023 the company repurchased 1,263 million ordinary shares for a total consideration of $7,918 million, including transaction costs of $43 million. All shares purchased were for cancellation. The repurchased shares represented 7.1 % of ordinary share capital. A further 156 million ordinary shares were repurchased between the end of the reporting period and 16 February 2024, the latest practicable date before the completion of these financial statements, for a total cost of $922 million of which $746 million has been accrued at 31 December 2023. The number of shares in issue is reduced when shares are repurchased.
Treasury sharesa
| 2023 | 2022 | 2021 | |||||||||||||||||||||
| Shares thousand | Nominal value $ million | Shares thousand | Nominal value $ million | Shares thousand | Nominal value $ million | ||||||||||||||||||
| At 1 January | |||||||||||||||||||||||
Purchases for settlement of employee share plans | |||||||||||||||||||||||
Issue of new shares for employee share-based payment plans | |||||||||||||||||||||||
Shares re-issued for employee share-based payment plans | ( | ( | ( | ( | ( | ( | |||||||||||||||||
| At 31 December | |||||||||||||||||||||||
| Of which – shares held in treasury by bp | |||||||||||||||||||||||
– shares held in ESOP trusts | |||||||||||||||||||||||
– shares held by bp’s US share plan administratorb | |||||||||||||||||||||||
aSee Note 32 for definition of treasury shares.
bHeld in the form of ADSs to meet the requirements of employee share-based payment plans in the US.
For each year presented, the balance of shares held in treasury by bp at 1 January represents 4.9 % (2022 5.0 % and 2021 5.2 %) of the called-up ordinary share capital of the company.
During 2023, the movement in shares held in treasury by bp represented 1.1 % (2022 less than 0.5 % and 2021 less than 0.3 %) of the ordinary share capital of the company.
| bp Annual Report and Form 20-F 2023 | 235 | |||||||||||||
32. Capital and reserves
| Share capital | Share premium account | Capital redemption reserve | Merger reserve | Total share capital and capital reserves | ||||||||||||||||
| At 1 January 2023 | ||||||||||||||||||||
| Profit (loss) for the year | ||||||||||||||||||||
| Items that may be reclassified subsequently to profit or loss | ||||||||||||||||||||
| Currency translation differences (including reclassifications) | — | — | — | — | — | |||||||||||||||
| Cash flow hedges and costs of hedging (including reclassifications) | — | — | — | — | — | |||||||||||||||
| Share of items relating to equity-accounted entities, net of tax | — | — | — | — | — | |||||||||||||||
| Items that will not be reclassified to profit or loss | ||||||||||||||||||||
| Remeasurements of the net pension and other post-retirement benefit liability or asset | — | — | — | — | — | |||||||||||||||
| Remeasurements of equity investments | — | — | — | — | — | |||||||||||||||
| Cash flow hedges that will subsequently be transferred to the balance sheet | — | — | — | — | — | |||||||||||||||
| Total comprehensive income | — | — | — | — | — | |||||||||||||||
| Dividends | — | — | — | — | — | |||||||||||||||
| Cash flow hedges transferred to the balance sheet, net of tax | — | — | — | — | — | |||||||||||||||
| Repurchases of ordinary share capital | ( | — | — | |||||||||||||||||
Share-based payments, net of taxa | — | — | ||||||||||||||||||
| Share of equity-accounted entities’ changes in equity, net of tax | — | — | — | — | — | |||||||||||||||
| Issue of perpetual hybrid bonds | — | — | — | — | — | |||||||||||||||
| Payments on perpetual hybrid bonds | — | — | — | — | — | |||||||||||||||
| Transactions involving non-controlling interests, net of tax | — | — | — | — | — | |||||||||||||||
| At 31 December 2023 | ||||||||||||||||||||
| At 1 January 2022 | ||||||||||||||||||||
| Profit (loss) for the year | ||||||||||||||||||||
| Items that may be reclassified subsequently to profit or loss | ||||||||||||||||||||
Currency translation differences (including reclassifications)b | — | — | — | — | — | |||||||||||||||
Cash flow hedges and costs of hedging (including reclassifications)c | — | — | — | — | — | |||||||||||||||
| Share of items relating to equity-accounted entities, net of tax | — | — | — | — | — | |||||||||||||||
| Other | — | — | — | — | — | |||||||||||||||
| Items that will not be reclassified to profit or loss | ||||||||||||||||||||
| Remeasurements of the net pension and other post-retirement benefit liability or asset | — | — | — | — | — | |||||||||||||||
| Cash flow hedges that will subsequently be transferred to the balance sheet | — | — | — | — | — | |||||||||||||||
| Total comprehensive income | — | — | — | — | — | |||||||||||||||
| Dividends | — | — | — | — | — | |||||||||||||||
| Cash flow hedges transferred to the balance sheet, net of tax | — | — | — | — | — | |||||||||||||||
| Issue of ordinary share capital | ||||||||||||||||||||
| Repurchases of ordinary share capital | ( | |||||||||||||||||||
Share-based payments, net of taxa | ||||||||||||||||||||
| Issue of perpetual hybrid bonds | — | — | — | — | — | |||||||||||||||
| Payments on perpetual hybrid bonds | — | — | — | — | — | |||||||||||||||
| Transactions involving non-controlling interests, net of tax | — | — | — | — | — | |||||||||||||||
| At 31 December 2022 | ||||||||||||||||||||
a Movements in treasury shares relate to employee share-based payment plans.
b Following bp’s decision to exit its shareholding in Rosneft on 27 February 2022, $10,372 million was reclassified to the income statement.
c Following bp’s decision to exit its shareholding in Rosneft on 27 February 2022 $651 million was reclassified to the income statement.
236 | bp Annual Report and Form 20-F 2023 | |||||||||||||
| Financial statements | |||||
32. Capital and reserves – continued
| $ million | ||||||||||||||||||||||||||||||||
| Treasury shares | Foreign currency translation reserve | Investments in equity instruments | Cash flow hedges | Costs of hedging | Total fair value reserves | Profit and loss account | bp shareholders’ equity | Non-controlling interests | Total equity | |||||||||||||||||||||||
| Hybrid bonds | Other interest | |||||||||||||||||||||||||||||||
| ( | ( | ( | ( | ( | ||||||||||||||||||||||||||||
| — | — | — | — | — | — | |||||||||||||||||||||||||||
| — | — | — | — | — | — | — | ||||||||||||||||||||||||||
| — | — | — | ( | — | — | — | ||||||||||||||||||||||||||
| — | — | — | — | — | — | ( | ( | — | — | ( | ||||||||||||||||||||||
| — | — | — | — | — | — | ( | ( | — | — | ( | ||||||||||||||||||||||
| — | — | — | — | — | — | — | ||||||||||||||||||||||||||
| — | — | — | — | — | — | — | ||||||||||||||||||||||||||
| — | ( | |||||||||||||||||||||||||||||||
| — | — | — | — | — | — | ( | ( | — | ( | ( | ||||||||||||||||||||||
| — | — | — | ( | — | ( | — | ( | — | — | ( | ||||||||||||||||||||||
| — | — | — | — | — | — | ( | ( | — | — | ( | ||||||||||||||||||||||
| — | — | — | — | — | ( | — | — | |||||||||||||||||||||||||
| — | — | — | — | — | — | — | — | |||||||||||||||||||||||||
| — | — | — | — | — | — | ( | ( | — | ||||||||||||||||||||||||
| — | ( | — | — | — | — | — | ( | ( | — | ( | ||||||||||||||||||||||
| — | — | — | — | — | — | — | ( | |||||||||||||||||||||||||
| ( | ( | ( | ||||||||||||||||||||||||||||||
| ( | ( | ( | ( | ( | ||||||||||||||||||||||||||||
| — | — | — | — | — | — | ( | ( | ( | ||||||||||||||||||||||||
| — | — | — | — | — | — | — | ( | |||||||||||||||||||||||||
| — | — | — | — | — | — | |||||||||||||||||||||||||||
| — | — | — | — | — | — | — | — | |||||||||||||||||||||||||
| — | — | — | — | — | — | ( | ( | — | — | ( | ||||||||||||||||||||||
| — | — | — | — | — | — | — | — | |||||||||||||||||||||||||
| — | — | — | ( | — | ( | — | ( | — | — | ( | ||||||||||||||||||||||
| — | — | ( | ||||||||||||||||||||||||||||||
| — | — | — | — | — | — | ( | ( | — | ( | ( | ||||||||||||||||||||||
| — | — | — | — | — | — | — | ||||||||||||||||||||||||||
| — | — | — | — | — | — | — | — | — | ||||||||||||||||||||||||
| — | — | — | — | — | — | ( | ( | — | — | ( | ||||||||||||||||||||||
| — | — | — | — | — | — | — | ||||||||||||||||||||||||||
| — | — | — | — | — | — | ( | ( | — | ||||||||||||||||||||||||
| — | — | — | — | — | — | ( | — | ( | ||||||||||||||||||||||||
| — | — | — | — | — | — | ( | ( | — | ( | ( | ||||||||||||||||||||||
| ( | ( | ( | ( | ( | ||||||||||||||||||||||||||||
| bp Annual Report and Form 20-F 2023 | 237 | |||||||||||||
32. Capital and reserves – continued
| Share capital | Share premium account | Capital redemption reserve | Merger reserve | Total share capital and capital reserves | ||||||||||||||||
| At 1 January 2021 | ||||||||||||||||||||
| Profit (loss) for the year | — | — | — | — | — | |||||||||||||||
| Items that may be reclassified subsequently to profit or loss | ||||||||||||||||||||
| Currency translation differences (including reclassifications) | — | — | — | — | — | |||||||||||||||
| Cash flow hedges and costs of hedging (including reclassifications) | — | — | — | — | — | |||||||||||||||
| Share of items relating to equity-accounted entities, net of tax | — | — | — | — | — | |||||||||||||||
| Other | — | — | — | — | — | |||||||||||||||
| Items that will not be reclassified to profit or loss | ||||||||||||||||||||
| Remeasurements of the net pension and other post-retirement benefit liability or asset | — | — | — | — | — | |||||||||||||||
| Cash flow hedges that will subsequently be transferred to the balance sheet | — | — | — | — | — | |||||||||||||||
| Total comprehensive income | — | — | — | — | — | |||||||||||||||
| Dividends | — | — | — | — | — | |||||||||||||||
| Cash flow hedges transferred to the balance sheet, net of tax | — | — | — | — | — | |||||||||||||||
| Repurchases of ordinary share capital | ( | — | — | |||||||||||||||||
Share-based payments, net of taxa | — | — | ||||||||||||||||||
| Share of equity-accounted entities’ changes in equity, net of tax | — | — | — | — | — | |||||||||||||||
| Issue of perpetual hybrid bonds | — | — | — | — | — | |||||||||||||||
| Payments on perpetual hybrid bonds | — | — | — | — | — | |||||||||||||||
Transactions involving non-controlling interests, net of taxb | — | — | — | — | — | |||||||||||||||
| At 31 December 2021 | ||||||||||||||||||||
aMovements in treasury shares relate to employee share-based payment plans.
bPrincipally relates to the sale of 49% interest in a controlled affiliate holding certain refined product and crude logistics assets onshore US and the buy-out of the non-controlling interest in the Thorntons fuels and convenience retail business. .
238 | bp Annual Report and Form 20-F 2023 | |||||||||||||
| Financial statements | |||||
32. Capital and reserves – continued
| $ million | |||||||||||||||||||||||||||||
| Treasury shares | Foreign currency translation reserve | Cash flow hedges | Costs of hedging | Total fair value reserves | Profit and loss account | bp shareholders’ equity | Non-controlling interests | Total equity | |||||||||||||||||||||
| Hybrid bonds | Other interest | ||||||||||||||||||||||||||||
| ( | ( | ( | ( | ( | |||||||||||||||||||||||||
| — | — | — | — | — | |||||||||||||||||||||||||
| — | ( | — | — | — | — | ( | — | ( | ( | ||||||||||||||||||||
| — | — | ( | ( | ( | — | ( | — | — | ( | ||||||||||||||||||||
| — | — | — | — | — | — | — | |||||||||||||||||||||||
| — | — | — | — | — | — | — | |||||||||||||||||||||||
| — | — | — | — | — | — | — | |||||||||||||||||||||||
| — | — | — | — | — | — | ||||||||||||||||||||||||
| — | ( | ( | ( | ( | |||||||||||||||||||||||||
| — | — | — | — | — | ( | ( | — | ( | ( | ||||||||||||||||||||
| — | — | ( | — | ( | — | ( | — | — | ( | ||||||||||||||||||||
| — | — | — | — | — | ( | ( | — | — | ( | ||||||||||||||||||||
| — | — | — | — | ( | — | — | |||||||||||||||||||||||
| — | — | — | — | — | — | — | |||||||||||||||||||||||
| — | — | — | — | — | ( | ( | — | ||||||||||||||||||||||
| — | ( | — | — | — | — | ( | ( | — | ( | ||||||||||||||||||||
| — | — | — | — | — | — | ( | |||||||||||||||||||||||
| ( | ( | ( | ( | ( | |||||||||||||||||||||||||
| bp Annual Report and Form 20-F 2023 | 239 | |||||||||||||
32. Capital and reserves – continued
Share capital
The balance on the share capital account represents the aggregate nominal value of all ordinary and preference shares in issue, including treasury shares.
Share premium account
The balance on the share premium account represents the amounts received in excess of the nominal value of the ordinary and preference shares.
Capital redemption reserve
The balance on the capital redemption reserve represents the aggregate nominal value of all the ordinary shares repurchased and cancelled.
Merger reserve
The balance on the merger reserve represents the fair value of the consideration given in excess of the nominal value of the ordinary shares issued in an acquisition made by the issue of shares.
Treasury shares
Treasury shares represent bp shares repurchased and available for specific and limited purposes. For accounting purposes shares held in Employee Share Ownership Plans (ESOPs) and bp’s US share plan administrator to meet the future requirements of the employee share-based payment plans are treated in the same manner as treasury shares and are, therefore, included in the financial statements as treasury shares. The ESOPs are funded by the group and have waived their rights to dividends in respect of such shares held for future awards. Until such time as the shares held by the ESOPs vest unconditionally to employees, the amount paid for those shares is shown as a reduction in shareholders’ equity. Assets and liabilities of the ESOPs are recognized as assets and liabilities of the group.
Investments in equity instruments
This reserve records the change in fair value of investments in equity instruments for which the group has elected to recognize fair value gains and losses in other comprehensive income.
Foreign currency translation reserve
The foreign currency translation reserve records exchange differences arising from the translation of the financial statements of foreign operations. Upon disposal of foreign operations, the related accumulated exchange differences are reclassified to the income statement.
Cash flow hedges
This reserve records the portion of the gain or loss on a hedging instrument in a cash flow hedge that is determined to be an effective hedge. For further information on the accounting for cash flow hedges see Note 1 - Derivative financial instruments and hedging activities.
Costs of hedging
This reserve records the change in fair value of the foreign currency basis spread of financial instruments to which cost of hedge accounting has been applied. The accumulated amount relates to time-period related hedged items and is amortized to profit or loss over the term of the hedging relationship. For further information on the accounting for costs of hedging see Note 1 - Derivative financial instruments and hedging activities.
Profit and loss account
The balance held on this reserve is the accumulated retained profits of the group.
Non-controlling interests
Non-controlling interests represent the equity in subsidiaries that is not attributable, directly or indirectly, to bp shareholders. Included within non-controlling interests are perpetual subordinated hybrid bonds issued by BP Capital Markets p.l.c., a group subsidiary, on 17 June 2020 in euro, sterling and US dollars for a US dollar equivalent amount of $11.9 billion. The hybrid bonds include redemption options exercisable at the group’s discretion from June 2025 to March 2030 (the first ‘call date’), on specified dates thereafter, or in the event of specific circumstances (such as a change in IFRS or tax regime) as set out in the individual terms of each issue. Coupons are fixed for an initial period up to dates from September 2025 to June 2030 at rates of 3.25 % to 4.875 % and reset to rates determined by the contractual terms of each instrument on certain dates thereafter. The contractual terms of the hybrid bonds allow the group to defer coupon payments and the repayment of principal indefinitely, however their terms and conditions stipulate that any deferred payments must be made in the event of an announcement of an ordinary share or parity equity dividend distribution or certain share repurchases or redemptions. Payments made to and profit attributed to these hybrid bond holders in the year totalled $477 million (2022 $468 million and 2021 $499 million) and $473 million (2022 $468 million and 2021 $497 million) respectively. The accumulated non-controlling interest at the end of the year was $12,066 million (2022 $12,066 million). On 26 February BP Capital Markets p.l.c. issued a further $1.3 billion of US dollar perpetual subordinated hybrid bonds with a coupon fixed for an initial period up to 2034 of 6.45 %. On 26 February BP Capital Markets p.l.c. announced its intent to voluntarily buy back up to $1.3 billion of the non-call 2025 4.375 % US dollar hybrid bonds issued in 2020. Taken together these transactions are not expected to have a significant impact on net debt or gearing.
Non-controlling interests also includes perpetual subordinated hybrid securities issued during 2023, 2022 and 2021 by a group subsidiary. The proceeds from these issuances were specifically earmarked to fund the forward purchase and leaseback of an under-construction floating, production, storage, and offloading vessel (FPSO) to be used on one of the group’s major projects. The contractual terms of these instruments allow the group to defer interest payments and repayment of principal indefinitely however their terms and conditions stipulate that the group must purchase them on the occurrence of certain events, all within the group’s control, including the declaration or payment of a BP p.l.c. distribution after mid-May 2026. Payments made to and profit attributed to these hybrid security holders in the year totalled $114 million (2022 $61 million) and $113 million (2022 $51 million) respectively. The accumulated non-controlling interest at the end of the year was $1,500 million (2022 $1,324 million).
As the group has the unconditional right to avoid transferring cash or another financial asset in relation to these hybrid bonds and securities, they are classified as equity instruments and reported within non-controlling interests in the consolidated financial statements.
240 | bp Annual Report and Form 20-F 2023 | |||||||||||||
| Financial statements | |||||
32. Capital and reserves – continued
The pre-tax amounts of each component of other comprehensive income, and the related amounts of tax, are shown in the table below.
| $ million | ||||||||||||||
| 2023 | ||||||||||||||
| Pre-tax | Tax | Net of tax | ||||||||||||
| Items that may be reclassified subsequently to profit or loss | ||||||||||||||
| Currency translation differences (including reclassifications) | ||||||||||||||
| Cash flow hedges (including reclassifications) | ( | |||||||||||||
| Costs of hedging (including reclassifications) | ( | ( | ( | |||||||||||
| Share of items relating to equity-accounted entities, net of tax | ( | ( | ||||||||||||
| Items that will not be reclassified to profit or loss | ||||||||||||||
| Remeasurements of the net pension and other post-retirement benefit liability or asset | ( | ( | ||||||||||||
| Remeasurements of equity investments | ( | |||||||||||||
| Cash flow hedges that will subsequently be transferred to the balance sheet | ||||||||||||||
| Other comprehensive income | ( | ( | ||||||||||||
| $ million | ||||||||||||||
| 2022 | ||||||||||||||
| Pre-tax | Tax | Net of tax | ||||||||||||
| Items that may be reclassified subsequently to profit or loss | ||||||||||||||
| Currency translation differences (including reclassifications) | ( | |||||||||||||
| Cash flow hedges (including reclassifications) | ( | |||||||||||||
| Costs of hedging (including reclassifications) | ||||||||||||||
| Share of items relating to equity-accounted entities, net of tax | ||||||||||||||
| Other | ( | ( | ||||||||||||
| Items that will not be reclassified to profit or loss | ||||||||||||||
| Remeasurements of the net pension and other post-retirement benefit liability or asset | ||||||||||||||
| Cash flow hedges that will subsequently be transferred to the balance sheet | ( | ( | ||||||||||||
| Other comprehensive income | ( | |||||||||||||
| $ million | ||||||||||||||
| 2021 | ||||||||||||||
| Pre-tax | Tax | Net of tax | ||||||||||||
| Items that may be reclassified subsequently to profit or loss | ||||||||||||||
| Currency translation differences (including reclassifications) | ( | ( | ||||||||||||
| Cash flow hedges (including reclassifications) | ( | ( | ||||||||||||
| Costs of hedging (including reclassifications) | ( | ( | ||||||||||||
| Share of items relating to equity-accounted entities, net of tax | ||||||||||||||
| Other | ||||||||||||||
| Items that will not be reclassified to profit or loss | ||||||||||||||
| Remeasurements of the net pension and other post-retirement benefit liability or asset | ( | |||||||||||||
| Cash flow hedges that will subsequently be transferred to the balance sheet | ||||||||||||||
| Other comprehensive income | ( | |||||||||||||
33. Contingent liabilities and legal proceedings
Contingent liabilities
There were contingent liabilities at 31 December 2023 in respect of guarantees and indemnities entered into as part of the ordinary course of the group’s business. No material losses are likely to arise from such contingent liabilities. Further information on financial guarantees is included in Note 29.
In the normal course of the group’s business, bp group entities are subject to legal and regulatory proceedings arising out of current and past operations, including matters related to commercial disputes, product liability, antitrust, commodities trading, premises-liability claims, consumer protection, general health, safety, climate change and environmental claims and allegations of exposures of third parties to toxic substances, such as lead pigment in paint, asbestos and other chemicals. The amounts claimed could be significant and could be material to the group’s results of operations, financial position or liquidity. While it is difficult to predict the ultimate outcome in some cases, bp expects that the impact of current legal and regulatory proceedings on the group‘s results of operations, liquidity or financial position will not be material.
The group files tax returns in many jurisdictions across the world. Various tax authorities are currently examining these returns, which contain matters that could be subject to differing interpretations of applicable tax laws and regulations. The resolution of tax positions through negotiations with relevant tax authorities, or through litigation, can take several years to complete and the amounts could be significant and could, in aggregate, be material to the group’s results of operations, financial position or liquidity. While it is difficult to predict the ultimate outcome in some cases, bp does not expect there to be any material impact upon the group‘s results of operations, financial position or liquidity.
| bp Annual Report and Form 20-F 2023 | 241 | |||||||||||||
33. Contingent liabilities and legal proceedings – continued
The group is subject to numerous national and local health, safety and environmental laws and regulations concerning its products, operations and other activities. These laws and regulations may require the group to take future action to remediate the effects on the environment of prior disposal or release of chemicals or petroleum substances by the group or other parties. Such contingencies may exist for various sites including refineries, chemical plants, oil fields, commodities extraction sites, service stations, terminals and waste disposal sites. In addition, the group may have obligations relating to prior asset sales or closed facilities. The ultimate requirement for remediation and its costs are inherently difficult to estimate. However, the estimated cost of environmental obligations has been provided in these accounts in accordance with the group‘s accounting policies. While the amounts of future possible costs that are not provided for could be significant and material to the group‘s results of operations in the period in which they are recognized, it is not possible to estimate the amounts involved. bp does not expect these costs to have a material impact on the group’s results of operations, financial position or liquidity.
If production and manufacturing facilities and pipelines are sold to third parties and the subsequent owner is unable to meet their decommissioning obligations it is possible that, in certain circumstances, bp could be partially or wholly responsible for decommissioning. The group estimates that for production facilities, approximately $16 billion (2022 $16 billion) of associated decommissioning obligations were previously transferred to third parties. While the amounts associated with decommissioning provisions reverting to the group could be material, bp is not currently aware of any such material cases that have a greater than remote chance of reverting to the group. Furthermore, as described in Provisions and contingencies within Note 1, decommissioning provisions associated with customers & products facilities are not generally recognized as the potential obligations cannot be measured given their indeterminate settlement dates.
By their nature, it is not practicable to estimate the potential financial impact or possible timing of the above contingencies as there are significant uncertainties that are dependent on various factors that are not within the group’s control.
Contingent liabilities related to the Gulf of Mexico oil spill
For information on legal proceedings relating to the Deepwater Horizon oil spill, see Legal proceedings below. Any outstanding Deepwater Horizon related claims are not expected to have a material impact on the group's financial performance.
Legal proceedings
Proceedings relating to the Deepwater Horizon oil spill
Introduction
BP Exploration & Production Inc. (BPXP) was lease operator of Mississippi Canyon, Block 252 in the Gulf of Mexico, where the semi-submersible rig Deepwater Horizon was deployed at the time of the 20 April 2010 explosion and fire and resulting oil spill (the Incident). Lawsuits and claims arising from the Incident were brought principally in US federal and state courts. The remaining proceedings arising from the Incident are discussed below.
Medical Benefits Class Action Settlement
In 2012 the Medical Benefits Class Action Settlement (Medical Settlement) was entered into with the plaintiffs steering committee. It includes an exclusive remedy provision regarding class members pursuing exposure-based personal injury claims for later-manifested physical conditions (LMPCs). As of 31 December 2023, there were 60 pending lawsuits brought by class members claiming LMPCs.
Other civil complaints – personal injury
The vast majority of post-explosion clean-up, medical monitoring and personal injury claims from individuals that either opted out of the Medical Settlement and/or were excluded from that settlement have been dismissed (including more than 600 cases in which the courts granted BPXP’s motions for summary judgment). As of 31 December 2023, 88 cases remained pending in the district courts and around 100 appeals filed to the Fifth Circuit in cases where the district courts have granted summary judgment in favour of bp also remain pending.
Non-US government lawsuits
bp has answered the complaints in both actions by seeking dismissal on various grounds including that no oil reached Mexican waters or land and there was no economic or environmental harm in Mexico.
These legal actions remain at a relatively early stage and while it is not possible to predict the outcome, bp believes that it has valid defences, and it intends to defend such actions vigorously.
242 | bp Annual Report and Form 20-F 2023 | |||||||||||||
| Financial statements | |||||
33. Contingent liabilities and legal proceedings – continued
Other legal proceedings
FERC and CFTC matters
Following an investigation by the US Federal Energy Regulatory Commission (FERC) and the US Commodity Futures Trading Commission (CFTC) of several bp entities, the Administrative Law Judge of the FERC ruled on 13 August 2015 that bp manipulated the market by selling next-day, fixed price natural gas at Houston Ship Channel in 2008 in order to suppress the Gas Daily index and benefit its financial position. In 2016, the FERC issued an Order affirming that decision and directing bp to pay a civil penalty of $20.16 million and to disgorge $207,169 in unjust profits. Following an appeal by bp to the US Court of Appeals, the Fifth Circuit issued an opinion upholding the FERC’s manipulation finding on a few trades. The Fifth Circuit also found that the FERC did not have jurisdiction over most of the transactions identified as being violations. In July 2023, bp and FERC reached a settlement agreement that reduced the civil penalty to $10.75 million and fully resolved all claims by the FERC related to the matter.
Climate change
BP p.l.c., BP America Inc. and BP Products North America Inc. are co-defendants with other oil and gas companies in over 20 lawsuits brought in various state and federal courts on behalf of various governmental and private parties. The lawsuits generally assert claims under a variety of legal theories seeking to hold the defendant companies responsible for impacts allegedly caused by and/or relating to climate change. Underlying many of the legal theories are allegations regarding deceptive communication and disinformation to the public. The lawsuits seek remedies including payment of money and other forms of equitable relief. If such suits were successful, the cost of the remedies sought in the various cases could be substantial. Over the last several years, defendants removed each lawsuit to federal court and the removals were contested by plaintiffs, eventually resulting in multiple decisions by several Circuit Court of Appeals rejecting defendants’ attempts to have the cases moved to federal court. In 2023, the US Supreme Court declined to review the various Circuit Court of Appeals decisions. Accordingly, the cases will proceed in the various state courts. Due to these jurisdictional challenges, the lawsuits all remain at relatively early stages. While it is not possible to predict the outcome of these legal actions, bp believes that it has valid defences, and it intends to defend such actions vigorously.
Louisiana Coastal restoration
Defendants removed all of these lawsuits to federal court and the removals were contested by plaintiffs, eventually resulting in a decision from the US Fifth Circuit Court of Appeals rejecting defendants’ “federal officer” jurisdiction removal grounds in one of two lead cases – Plaquemines Parish v. Riverwood, et al. Defendants’ petition for writ of certiorari to the US Supreme Court seeking review of the US Fifth Circuit’s Riverwood decision was denied in early 2023. There is a small subset of the removed cases in which the defendants continue to contest jurisdiction and await a final ruling from the Fifth Circuit on a related “federal officer” removal jurisdiction theory.
Following remand, the state court in the other lead case of Cameron Parish v. Auster et al., in which bp was the principal defendant, had established a November 2023 trial date. Before trial commenced during the fourth quarter 2023, bp entered into a settlement agreement and release with the plaintiffs in respect of all claims arising within Cameron Parish. The terms of the settlement agreement and release are confidential and bp does not expect those terms to have a significant effect on the company’s financial position or profitability.
In addition, four private landowners have filed separate claims in the state courts in Jefferson and Plaquemines Parishes of Louisiana for restoration damages related to alleged impacts to their marshlands associated with historic oil field operations. bp entities are defendants in two of these private landowner cases.
All of the other remanded cases remain at early stages in the litigation. While it is not possible to predict the outcomes of these novel legal actions, bp believes that it has valid defences, and it intends to defend such actions vigorously.
| bp Annual Report and Form 20-F 2023 | 243 | |||||||||||||
34. Remuneration of senior management and non-executive directors
Remuneration of directors
| $ million | ||||||||||||||
| 2023 | 2022 | 2021 | ||||||||||||
| Total for all directors | ||||||||||||||
| Emoluments | ||||||||||||||
Amounts received under incentive schemesa | ||||||||||||||
| Total | ||||||||||||||
aExcludes amounts relating to past directors.
Emoluments
These amounts comprise fees paid to the non-executive chair and the non-executive directors and, for executive directors, salary and benefits earned during the relevant financial year, plus cash bonuses awarded for the year.
Further information
Full details of individual directors’ remuneration are given in the Directors’ remuneration report on page 105.
Remuneration of directors and senior management
| $ million | ||||||||||||||
| 2023 | 2022 | 2021 | ||||||||||||
| Total for all senior management and non-executive directors | ||||||||||||||
| Short-term employee benefits | ||||||||||||||
| Pensions and other post-retirement benefits | ||||||||||||||
Share-based paymentsa | ||||||||||||||
| Termination benefits | ||||||||||||||
| Total | ||||||||||||||
aIncludes a reversal of $14 million relating to the lapse of Bernard Looney's outstanding share awards in prior years.
Senior management comprises members of the leadership team, see pages 86-87 for further information.
Short-term employee benefits
These amounts comprise fees and benefits paid to the non-executive chair and non-executive directors, as well as salary, benefits and cash bonuses for senior management. Deferred annual bonus awards, to be settled in shares, are included in share-based payments.
Pensions and other post-retirement benefits
The amounts represent the estimated cost to the group of providing pensions and other post-retirement benefits to senior management in respect of the current year of service measured in accordance with IAS 19 ‘Employee Benefits’.
Share-based payments
This is the cost to the group of senior management’s participation in share-based payment plans, as measured by the fair value of options and shares granted, accounted for in accordance with IFRS 2 ‘Share-based Payments’.
Termination benefits
Termination benefits include compensation to senior management for loss of office.
Related party transactions
Transactions between the group and its significant joint ventures and associates are summarized in Financial statements – Note 16 and Note 17. In the ordinary course of its business, the group enters into transactions with various organizations with which some of its directors or executive officers are associated. Except as described in this report, the group did not have any material transactions or transactions of an unusual nature with, and did not make loans to, related parties in the period commencing 1 January 2023 to 16 February 2024.
244 | bp Annual Report and Form 20-F 2023 | |||||||||||||
| Financial statements | |||||
35. Employee costs and numbers
| $ million | ||||||||||||||
| Employee costs | 2023 | 2022 | 2021 | |||||||||||
Wages and salariesa | ||||||||||||||
| Social security costs | ||||||||||||||
Share-based paymentsb | ||||||||||||||
| Pension and other post-retirement benefit costs | ||||||||||||||
| 2023 | 2022 | 2021 | ||||||||||||||||||||||||||||||
Average number of employeesc | US | Non-US | Total | US | Non-US | Total | US | Non-US | Total | |||||||||||||||||||||||
| gas & low carbon energy | ||||||||||||||||||||||||||||||||
| oil production & operations | ||||||||||||||||||||||||||||||||
customers & productsd | ||||||||||||||||||||||||||||||||
| other businesses and corporate | ||||||||||||||||||||||||||||||||
aIncludes termination costs of $96 million (2022 $27 million and 2021 $74 million).
bThe group provides certain employees with shares and share options as part of their remuneration packages. The majority of these share-based payment arrangements are equity-settled.
cReported to the nearest 100.
dIncludes 33,800 (2022 23,300 and 2021 21,300 ) service station staff.
36. Auditor’s remuneration
| $ million | ||||||||||||||
| Fees | 2023 | 2022 | 2021 | |||||||||||
The audit of the company annual accountsa | ||||||||||||||
| The audit of accounts of subsidiaries of the company | ||||||||||||||
| Total audit | ||||||||||||||
Audit-related assurance servicesb | ||||||||||||||
| Total audit and audit-related assurance services | ||||||||||||||
| Non-audit and other assurance services | ||||||||||||||
| Services relating to bp pension plans | ||||||||||||||
aFees in respect of the audit of the accounts of BP p.l.c. including the group’s consolidated financial statements.
bIncludes interim reviews and audit of internal control over financial reporting and non-statutory audit services.
2023 includes $0.2 million of additional fees for 2022. 2022 includes $0.3 million of additional fees for 2021. 2021 includes $1.0 million of additional fees for 2020. Auditor's remuneration is included in the income statement within distribution and administration expenses.
Tax services (in relation to income tax, indirect tax compliance, employee tax services and tax advisory services) were $nil in all periods presented.
The audit committee has established pre-approval policies and procedures for the engagement of Deloitte to render audit and certain assurance and other services. The audit fees payable to Deloitte were considered as part of the audit tender process in 2016 and challenged by the audit committee through comparison with the audit pricing proposals of the other bidding firms. Changes in audit fees subsequent to the audit tender, including matters relevant to the 2023 audit, have been reviewed and challenged by the Audit Committee, before being approved. Deloitte performed further assurance services that were not prohibited by regulatory or other professional requirements and were pre-approved by the Committee. Deloitte is engaged for these services when its expertise and experience of bp are important. Most of this work is of an audit-related or assurance nature.
Under SEC regulations, the remuneration of the auditor of $61 million (2022 $56 million and 2021 $58 million) is required to be presented as follows: audit $53 million (2022 $51 million and 2021 $52 million); other audit-related $4 million (2022 $4 million and 2021 $5 million); tax $nil (2022 $nil and 2021 $nil ); and all other fees $4 million (2022 $1 million and 2021 $1 million).
| bp Annual Report and Form 20-F 2023 | 245 | |||||||||||||
37. Subsidiaries, joint arrangements and associates a
The more important subsidiaries, joint arrangements and associates of the group at 31 December 2023 and the group percentage of ordinary share capital (to nearest whole number) are set out below. The group's share of the assets and liabilities of the more important unincorporated joint arrangements are held by subsidiaries listed in the table below. Those subsidiaries held directly by the parent company are marked with an asterisk (*), the percentage owned being that of the group unless otherwise indicated. A complete list of undertakings of the group is included in Note 14 in the parent company financial statements of BP p.l.c. which are filed with the Registrar of Companies in the UK, along with the group’s annual report.
| Subsidiaries | % | Country of incorporation | Principal activities | ||||||||||||||
| International | |||||||||||||||||
| BP Corporate Holdings Limited | England & Wales | Investment holding | |||||||||||||||
| BP Exploration Operating Company Limited | England & Wales | Exploration and production | |||||||||||||||
| *BP Gamma Holdings Limited | England & Wales | Investment holding | |||||||||||||||
| *BP Global Investments Limited | England & Wales | Investment holding | |||||||||||||||
| *BP International Limited | England & Wales | Integrated oil operations | |||||||||||||||
| BP Oil International Limited | England & Wales | Integrated oil operations | |||||||||||||||
| *Burmah Castrol PLC | Scotland | Investment holding | |||||||||||||||
| Azerbaijan | |||||||||||||||||
| BP Exploration (Caspian Sea) Limited | England & Wales | Exploration and production | |||||||||||||||
| BP Exploration (Azerbaijan) Limited | England & Wales | Exploration and production | |||||||||||||||
| Egypt | |||||||||||||||||
| BP Exploration (Delta) Limited | England & Wales | Exploration and production | |||||||||||||||
| Germany | |||||||||||||||||
| BP Europa SE | Germany | Refining and marketing | |||||||||||||||
Trinidad and Tobago | |||||||||||||||||
| BP Trinidad and Tobago LLC | US | Exploration and production | |||||||||||||||
| UK | |||||||||||||||||
| BP Capital Markets p.l.c. | England & Wales | Finance | |||||||||||||||
| US | |||||||||||||||||
| *BP Holdings North America Limited | England & Wales | Investment holding | |||||||||||||||
| Atlantic Richfield Company | US | Exploration and production, refining and marketing | |||||||||||||||
| BP America Inc. | US | ||||||||||||||||
| BP America Production Company | US | ||||||||||||||||
| BP Company North America Inc. | US | ||||||||||||||||
| BP Corporation North America Inc. | US | ||||||||||||||||
| BP Products North America Inc. | US | ||||||||||||||||
| The Standard Oil Company | US | ||||||||||||||||
| Archaea Energy Inc. | US | Bioenergy | |||||||||||||||
| BP Capital Markets America Inc. | US | Finance | |||||||||||||||
| Joint arrangements | % | Country of incorporation | Principal activities | ||||||||||||||
| Angola | |||||||||||||||||
| Azule Energy Holdings Limited | England & Wales | Exploration and production | |||||||||||||||
aThere were no important associates in the group at 31 December 2023.
38. Events after the reporting period
On 14 February 2024 bp announced that it had agreed to form a new joint venture in Egypt with ADNOC (bp 51 %, ADNOC 49%). As part of the agreement bp will contribute its interests in three non-operated development concessions as well as exploration agreements in Egypt, and ADNOC will make a proportionate cash contribution. Formation of the joint venture and completion of these transactions is subject to regulatory approval. From 14 February 2024 the associated carrying values of these interests have been determined to meet the criteria to be classified as assets held for sale under IFRS 5 Non-current Assets Held for Sale and Discontinued Operations. The carrying value of fixed assets associated with these interests at 31 December 2023 was $1.4 billion. The impacts are expected to be reflected in the group’s first quarter 2024 interim financial statements.
246 | bp Annual Report and Form 20-F 2023 | |||||||||||||
| Financial statements | |||||
Supplementary information on oil and natural gas (unaudited)
The regional analysis presented below is on a continent basis, with separate disclosure for countries that contain 15% or more of the total proved reserves (for subsidiaries plus equity-accounted entitiesa), in accordance with SEC and FASB requirements.
Oil and gas reserves – certain definitions
Unless the context indicates otherwise, the following terms have the meanings shown below:
Proved oil and gas reserves
Proved oil and gas reserves are those quantities of oil and gas, which, by analysis of geoscience and engineering data, can be estimated with reasonable certainty to be economically producible – from a given date forward, from known reservoirs, and under existing economic conditions, operating methods, and government regulations – prior to the time at which contracts providing the right to operate expire, unless evidence indicates that renewal is reasonably certain, regardless of whether deterministic or probabilistic methods are used for the estimation. The project to extract the hydrocarbons must have commenced or the operator must be reasonably certain that it will commence the project within a reasonable time.
(i)The area of the reservoir considered as proved includes:
(A) The area identified by drilling and limited by fluid contacts, if any; and
(B) Adjacent undrilled portions of the reservoir that can, with reasonable certainty, be judged to be continuous with it and to contain economically producible oil or gas on the basis of available geoscience and engineering data.
(ii)In the absence of data on fluid contacts, proved quantities in a reservoir are limited by the lowest known hydrocarbons as seen in a well penetration unless geoscience, engineering, or performance data and reliable technology establishes a lower contact with reasonable certainty.
(iii)Where direct observation from well penetrations has defined a highest known oil elevation and the potential exists for an associated gas cap, proved oil reserves may be assigned in the structurally higher portions of the reservoir only if geoscience, engineering, or performance data and reliable technology establish the higher contact with reasonable certainty.
(iv)Reserves which can be produced economically through application of improved recovery techniques (including, but not limited to, fluid injection) are included in the proved classification when:
(A) Successful testing by a pilot project in an area of the reservoir with properties no more favourable than in the reservoir as a whole, the operation of an installed programme in the reservoir or an analogous reservoir, or other evidence using reliable technology establishes the reasonable certainty of the engineering analysis on which the project or programme was based; and
(B) The project has been approved for development by all necessary parties and entities, including governmental entities.
(v)Existing economic conditions include prices and costs at which economic producibility from a reservoir is to be determined. The price shall be the average price during the 12-month period prior to the ending date of the period covered by the report, determined as an unweighted arithmetic average of the first-day-of-the-month price for each month within such period, unless prices are defined by contractual arrangements, excluding escalations based upon future conditions.
Undeveloped oil and gas reserves
Undeveloped oil and gas reserves are reserves of any category that are expected to be recovered from new wells on undrilled acreage, or from existing wells where a relatively major expenditure is required for recompletion.
(i)Reserves on undrilled acreage shall be limited to those directly offsetting development spacing areas that are reasonably certain of production when drilled, unless evidence using reliable technology exists that establishes reasonable certainty of economic producibility at greater distances.
(ii)Undrilled locations can be classified as having undeveloped reserves only if a development plan has been adopted indicating that they are scheduled to be drilled within five years, unless the specific circumstances, justify a longer time.
(iii)Under no circumstances shall estimates for undeveloped reserves be attributable to any acreage for which an application of fluid injection or other improved recovery technique is contemplated, unless such techniques have been proved effective by actual projects in the same reservoir or an analogous reservoir, or by other evidence using reliable technology establishing reasonable certainty.
Developed oil and gas reserves
Developed oil and gas reserves are reserves of any category that can be expected to be recovered:
(i)Through existing wells with existing equipment and operating methods or in which the cost of the required equipment is relatively minor compared to the cost of a new well; and
(ii)Through installed extraction equipment and infrastructure operational at the time of the reserves estimate if the extraction is by means not involving a well.
For details on bp’s proved reserves and production compliance and governance processes, see pages 342-350.
aSee Note 1 - Investment in Rosneft.
| bp Annual Report and Form 20-F 2023 | 247 | |||||||||||||
Oil and natural gas exploration and production activities
| $ million | ||||||||||||||||||||||||||||||||
| 2023 | ||||||||||||||||||||||||||||||||
| Europe | North America | South America | Africa | Asia | Australasia | Total | ||||||||||||||||||||||||||
| UK | Rest of Europe | US | Rest of North America | |||||||||||||||||||||||||||||
| Subsidiaries | ||||||||||||||||||||||||||||||||
Capitalized costs at 31 Decembera b | ||||||||||||||||||||||||||||||||
| Gross capitalized costs | ||||||||||||||||||||||||||||||||
| Proved properties | 29,127 | — | 70,404 | 6 | 17,475 | 20,763 | 41,351 | 6,331 | 185,457 | |||||||||||||||||||||||
| Unproved properties | 369 | — | 3,057 | 1,917 | 2,565 | 2,739 | 1,691 | 737 | 13,075 | |||||||||||||||||||||||
| 29,496 | — | 73,461 | 1,923 | 20,040 | 23,502 | 43,042 | 7,068 | 198,532 | ||||||||||||||||||||||||
| Accumulated depreciation | 22,018 | — | 42,364 | 1,592 | 15,712 | 21,132 | 24,431 | 4,998 | 132,247 | |||||||||||||||||||||||
| Net capitalized costs | 7,478 | — | 31,097 | 331 | 4,328 | 2,370 | 18,611 | 2,070 | 66,285 | |||||||||||||||||||||||
Costs incurred for the year ended 31 Decembera b | ||||||||||||||||||||||||||||||||
| Acquisition of properties | ||||||||||||||||||||||||||||||||
| Proved | — | — | 13 | — | — | — | — | — | 13 | |||||||||||||||||||||||
| Unproved | — | — | 51 | — | 2 | 6 | — | — | 59 | |||||||||||||||||||||||
| — | — | 64 | — | 2 | 6 | — | — | 72 | ||||||||||||||||||||||||
Exploration and appraisal costsc | 123 | — | 356 | 123 | 114 | 270 | 145 | 100 | 1,231 | |||||||||||||||||||||||
| Development | 484 | — | 4,690 | — | 713 | 863 | 1,424 | 32 | 8,206 | |||||||||||||||||||||||
| Total costs | 607 | — | 5,110 | 123 | 829 | 1,139 | 1,569 | 132 | 9,509 | |||||||||||||||||||||||
Results of operations for the year ended 31 Decembera | ||||||||||||||||||||||||||||||||
Sales and other operating revenuesd | ||||||||||||||||||||||||||||||||
| Third parties | 206 | — | 665 | — | 1,348 | 3,227 | 4,801 | 1,765 | 12,012 | |||||||||||||||||||||||
| Sales between businesses | 3,483 | — | 12,705 | — | 20 | 22 | 7,731 | 412 | 24,373 | |||||||||||||||||||||||
| 3,689 | — | 13,370 | — | 1,368 | 3,249 | 12,532 | 2,177 | 36,385 | ||||||||||||||||||||||||
| Exploration expenditure | 46 | — | 348 | 93 | 54 | 413 | 25 | 18 | 997 | |||||||||||||||||||||||
| Production costs | 477 | — | 2,382 | 2 | 360 | 232 | 588 | 111 | 4,152 | |||||||||||||||||||||||
| Production taxes | 13 | — | 136 | — | 229 | — | 1,357 | 44 | 1,779 | |||||||||||||||||||||||
Other costs (income)e | (171) | — | 2,144 | 13 | 115 | 304 | (35) | 145 | 2,515 | |||||||||||||||||||||||
Depreciation, depletion and amortization | 1,063 | — | 3,532 | — | 1,351 | 1,546 | 2,844 | 412 | 10,748 | |||||||||||||||||||||||
| Net impairments and (gains) losses on sale of businesses and fixed assets | 819 | (18) | 701 | (100) | 671 | 1,430 | (1) | (4) | 3,498 | |||||||||||||||||||||||
| 2,247 | (18) | 9,243 | 8 | 2,780 | 3,925 | 4,778 | 726 | 23,689 | ||||||||||||||||||||||||
Profit (loss) before taxationf | 1,442 | 18 | 4,127 | (8) | (1,412) | (676) | 7,754 | 1,451 | 12,696 | |||||||||||||||||||||||
| Allocable taxes | 365 | 19 | 889 | (3) | (565) | 439 | 5,317 | 451 | 6,912 | |||||||||||||||||||||||
| Results of operations | 1,077 | (1) | 3,238 | (5) | (847) | (1,115) | 2,437 | 1,000 | 5,784 | |||||||||||||||||||||||
aThese tables contain information relating to oil and natural gas exploration and production activities of subsidiaries, which includes bp's share of oil and natural gas exploration and production activities of joint operations. They do not include any costs relating to the Gulf of Mexico oil spill. Amounts relating to the management and ownership of crude oil and natural gas pipelines, LNG liquefaction and transportation operations are excluded. In addition, bp's midstream activities of marketing and trading of natural gas, power and NGLs in the US, Canada, UK, Asia and Europe are excluded. The most significant midstream pipeline interests include the South Caucasus Pipeline, the Baku-Tbilisi-Ceyhan pipeline, the Trans Adriatic Pipeline and the Trans Anatolian Pipeline. Major LNG activities are located in Trinidad, Indonesia and Australia.
bCosts of decommissioning are included in capitalized costs at 31 December but are excluded from costs incurred for the year.
cIncludes exploration and appraisal drilling expenditures, which are capitalized within intangible assets, and geological and geophysical exploration costs, which are charged to income as incurred.
dPresented net of transportation costs, purchases and sales taxes.
eIncludes property taxes and other government take. The UK region includes a $287-million gain which is offset by corresponding charges primarily in the US region, relating to the group self-insurance programme.
fExcludes the unwinding of the discount on provisions and payables amounting to $390 million which is included in finance costs in the group income statement.
248 | bp Annual Report and Form 20-F 2023 | |||||||||||||
| Financial statements | |||||
Oil and natural gas exploration and production activities – continued
| $ million | ||||||||||||||||||||||||||||||||
| 2023 | ||||||||||||||||||||||||||||||||
| Europe | North America | South America | Africa | Asia | Australasia | Total | ||||||||||||||||||||||||||
| UK | Rest of Europe | US | Rest of North America | |||||||||||||||||||||||||||||
| Equity-accounted entities (bp share) | ||||||||||||||||||||||||||||||||
Capitalized costs at 31 Decembera b | ||||||||||||||||||||||||||||||||
| Gross capitalized costs | ||||||||||||||||||||||||||||||||
| Proved properties | — | 4,432 | — | — | 12,530 | 8,590 | 9,947 | — | 35,499 | |||||||||||||||||||||||
| Unproved properties | — | 652 | — | — | 125 | 372 | — | — | 1,149 | |||||||||||||||||||||||
| — | 5,084 | — | — | 12,655 | 8,962 | 9,947 | — | 36,648 | ||||||||||||||||||||||||
| Accumulated depreciation | — | 2,420 | — | — | 6,807 | 1,812 | 1,696 | — | 12,735 | |||||||||||||||||||||||
| Net capitalized costs | — | 2,664 | — | — | 5,848 | 7,150 | 8,251 | — | 23,913 | |||||||||||||||||||||||
Costs incurred for the year ended 31 Decembera c d | ||||||||||||||||||||||||||||||||
Acquisition of propertiesb | ||||||||||||||||||||||||||||||||
| Proved | — | — | — | — | — | — | — | — | — | |||||||||||||||||||||||
| Unproved | — | — | — | — | — | — | — | — | — | |||||||||||||||||||||||
| — | — | — | — | — | — | — | — | — | ||||||||||||||||||||||||
Exploration and appraisal costsc | — | 42 | — | — | 7 | 44 | — | — | 93 | |||||||||||||||||||||||
| Development | — | 584 | — | — | 687 | 844 | 942 | — | 3,057 | |||||||||||||||||||||||
| Total costs | — | 626 | — | — | 694 | 888 | 942 | — | 3,150 | |||||||||||||||||||||||
Results of operations for the year ended 31 Decembera | ||||||||||||||||||||||||||||||||
Sales and other operating revenuese | ||||||||||||||||||||||||||||||||
| Third parties | — | 2,159 | — | — | 2,070 | 2,550 | 1,716 | — | 8,495 | |||||||||||||||||||||||
| Sales between businesses | — | — | — | — | — | — | — | — | — | |||||||||||||||||||||||
| — | 2,159 | — | — | 2,070 | 2,550 | 1,716 | — | 8,495 | ||||||||||||||||||||||||
| Exploration expenditure | — | 41 | — | — | — | 44 | — | — | 85 | |||||||||||||||||||||||
| Production costs | — | 169 | — | — | 715 | 427 | 374 | — | 1,685 | |||||||||||||||||||||||
| Production taxes | — | — | — | — | 332 | 52 | — | — | 384 | |||||||||||||||||||||||
| Other costs (income) | — | 21 | — | — | 257 | 239 | 8 | — | 525 | |||||||||||||||||||||||
| Depreciation, depletion and amortization | — | 455 | — | — | 451 | 1,344 | 1,144 | — | 3,394 | |||||||||||||||||||||||
Net impairments and losses on sale of businesses and fixed assets | — | 141 | — | — | — | 15 | — | — | 156 | |||||||||||||||||||||||
| — | 827 | — | — | 1,755 | 2,121 | 1,526 | — | 6,229 | ||||||||||||||||||||||||
| Profit (loss) before taxation | — | 1,332 | — | — | 315 | 429 | 190 | — | 2,266 | |||||||||||||||||||||||
| Allocable taxes | — | 1,124 | — | — | 127 | 173 | 117 | — | 1,541 | |||||||||||||||||||||||
| Results of operations | — | 208 | — | — | 188 | 256 | 73 | — | 725 | |||||||||||||||||||||||
aThese tables contain information relating to oil and natural gas exploration and production activities of equity-accounted entities. Amounts relating to the management and ownership of crude oil and natural gas pipelines, LNG liquefaction, transportation operations as well as downstream and other activities are excluded.
bCosts of decommissioning are included in capitalized costs at 31 December but are excluded from costs incurred for the year.
cIncludes exploration and appraisal drilling expenditures, which are capitalized within intangible assets, and geological and geophysical exploration costs, which are charged to income as incurred.
dThe amounts shown reflect bp’s share of equity-accounted entities’ costs incurred, and not the costs incurred by bp in acquiring an interest in equity-accounted entities.
ePresented net of sales tax.
| bp Annual Report and Form 20-F 2023 | 249 | |||||||||||||
Oil and natural gas exploration and production activities – continued
| $ million | |||||||||||||||||||||||||||||||||||
| 2022 | |||||||||||||||||||||||||||||||||||
| Europe | North America | South America | Africa | Asia | Australasia | Total | |||||||||||||||||||||||||||||
| UK | Rest of Europe | USh | Rest of North America | Russia | Rest of Asia | ||||||||||||||||||||||||||||||
| Subsidiaries | |||||||||||||||||||||||||||||||||||
Capitalized costs at 31 Decembera b | |||||||||||||||||||||||||||||||||||
| Gross capitalized costs | |||||||||||||||||||||||||||||||||||
| Proved properties | 30,010 | — | 65,870 | 6 | 16,720 | 20,257 | — | 39,899 | 6,324 | 179,086 | |||||||||||||||||||||||||
| Unproved properties | 397 | — | 2,976 | 1,875 | 2,507 | 2,535 | — | 1,622 | 659 | 12,571 | |||||||||||||||||||||||||
| 30,407 | — | 68,846 | 1,881 | 19,227 | 22,792 | — | 41,521 | 6,983 | 191,657 | ||||||||||||||||||||||||||
| Accumulated depreciation | 21,757 | — | 38,205 | 1,586 | 13,849 | 18,207 | — | 21,642 | 4,588 | 119,834 | |||||||||||||||||||||||||
| Net capitalized costs | 8,650 | — | 30,641 | 295 | 5,378 | 4,585 | — | 19,879 | 2,395 | 71,823 | |||||||||||||||||||||||||
Costs incurred for the year ended 31 Decembera b | |||||||||||||||||||||||||||||||||||
| Acquisition of properties | |||||||||||||||||||||||||||||||||||
| Proved | 12 | — | 183 | — | — | — | — | 245 | — | 440 | |||||||||||||||||||||||||
| Unproved | — | — | 37 | 164 | 2 | 14 | — | — | — | 217 | |||||||||||||||||||||||||
| 12 | — | 220 | 164 | 2 | 14 | — | 245 | — | 657 | ||||||||||||||||||||||||||
Exploration and appraisal costsc | 39 | — | 288 | 137 | 235 | 103 | — | 73 | 17 | 892 | |||||||||||||||||||||||||
| Development | 318 | — | 3,825 | 15 | 483 | 1,378 | — | 1,555 | 176 | 7,750 | |||||||||||||||||||||||||
| Total costs | 369 | — | 4,333 | 316 | 720 | 1,495 | — | 1,873 | 193 | 9,299 | |||||||||||||||||||||||||
Results of operations for the year ended 31 Decembera | |||||||||||||||||||||||||||||||||||
Sales and other operating revenuesd | |||||||||||||||||||||||||||||||||||
| Third parties | 549 | — | 2,101 | 420 | 2,977 | 3,836 | — | 6,551 | 1,588 | 18,022 | |||||||||||||||||||||||||
| Sales between businesses | 5,747 | — | 12,746 | — | 538 | 2,146 | — | 9,932 | 1,472 | 32,581 | |||||||||||||||||||||||||
| 6,296 | — | 14,847 | 420 | 3,515 | 5,982 | — | 16,483 | 3,060 | 50,603 | ||||||||||||||||||||||||||
| Exploration expenditure | 11 | — | 144 | 109 | 172 | 57 | — | 94 | (2) | 585 | |||||||||||||||||||||||||
| Production costs | 498 | — | 2,102 | 83 | 327 | 592 | — | 723 | 107 | 4,432 | |||||||||||||||||||||||||
| Production taxes | 1 | — | 194 | — | 513 | — | — | 1,544 | 73 | 2,325 | |||||||||||||||||||||||||
Other costs (income)e | (210) | (47) | 2,926 | 63 | 96 | 206 | 32 | (44) | 300 | 3,322 | |||||||||||||||||||||||||
Depreciation, depletion and amortization | 1,242 | — | 3,122 | 18 | 680 | 2,075 | 1 | 2,495 | 384 | 10,017 | |||||||||||||||||||||||||
Net impairments and (gains) losses on sale of businesses and fixed assetsf | (433) | (901) | 217 | (3) | 1,570 | (1,189) | 1,523 | (341) | (43) | 400 | |||||||||||||||||||||||||
| 1,109 | (948) | 8,705 | 270 | 3,358 | 1,741 | 1,556 | 4,471 | 819 | 21,081 | ||||||||||||||||||||||||||
Profit (loss) before taxationg | 5,187 | 948 | 6,142 | 150 | 157 | 4,241 | (1,556) | 12,012 | 2,241 | 29,522 | |||||||||||||||||||||||||
| Allocable taxes | 4,443 | — | 1,409 | 50 | 1,814 | 886 | (5) | 6,651 | 842 | 16,090 | |||||||||||||||||||||||||
| Results of operations | 744 | 948 | 4,733 | 100 | (1,657) | 3,355 | (1,551) | 5,361 | 1,399 | 13,432 | |||||||||||||||||||||||||
aThese tables contain information relating to oil and natural gas exploration and production activities of subsidiaries, which includes bp's share of oil and natural gas exploration and production activities of joint operations. They do not include any costs relating to the Gulf of Mexico oil spill. Amounts relating to the management and ownership of crude oil and natural gas pipelines, LNG liquefaction and transportation operations are excluded. In addition, bp's midstream activities of marketing and trading of natural gas, power and NGLs in the US, Canada, UK, Asia and Europe are excluded. The most significant midstream pipeline interests include the South Caucasus Pipeline, the Baku-Tbilisi-Ceyhan pipeline, the Trans Adriatic Pipeline and the Trans Anatolian Pipeline. Major LNG activities are located in Trinidad, Indonesia and Australia.
bCosts of decommissioning are included in capitalized costs at 31 December but are excluded from costs incurred for the year.
cIncludes exploration and appraisal drilling expenditures, which are capitalized within intangible assets, and geological and geophysical exploration costs, which are charged to income as incurred.
dPresented net of transportation costs, purchases and sales taxes.
eIncludes property taxes and other government take. The UK region includes a $256-million gain which is offset by corresponding charges primarily in the US region, relating to the group self-insurance programme.
fRussia impairments include other businesses with Rosneft, which were reported in the oil production and operation segment. The Rosneft impairment is reported in the other businesses and corporate segment.
g Excludes the unwinding of the discount on provisions and payables amounting to $294 million which is included in finance costs in the group income statement.
h An amendment has been made to correctly present offsetting movements in proved properties cost and depreciation, The amendment has no impact on reported profit or net book amounts of total proved properties.
250 | bp Annual Report and Form 20-F 2023 | |||||||||||||
| Financial statements | |||||
Oil and natural gas exploration and production activities – continued
| $ million | |||||||||||||||||||||||||||||||||||
| 2022 | |||||||||||||||||||||||||||||||||||
| Europe | North America | South America | Africa | Asia | Australasia | Total | |||||||||||||||||||||||||||||
| UK | Rest of Europe | US | Rest of North America | Russiaa | Rest of Asia | ||||||||||||||||||||||||||||||
| Equity-accounted entities (bp share) | |||||||||||||||||||||||||||||||||||
Capitalized costs at 31 Decemberb c | |||||||||||||||||||||||||||||||||||
| Gross capitalized costs | |||||||||||||||||||||||||||||||||||
| Proved properties | — | 3,739 | — | — | 12,000 | 7,927 | — | 8,381 | — | 32,047 | |||||||||||||||||||||||||
| Unproved properties | — | 611 | — | — | 120 | 371 | — | — | — | 1,102 | |||||||||||||||||||||||||
| — | 4,350 | — | — | 12,120 | 8,298 | — | 8,381 | — | 33,149 | ||||||||||||||||||||||||||
| Accumulated depreciation | — | 1,800 | — | — | 6,356 | 572 | — | 553 | — | 9,281 | |||||||||||||||||||||||||
| Net capitalized costs | — | 2,550 | — | — | 5,764 | 7,726 | — | 7,828 | — | 23,868 | |||||||||||||||||||||||||
Costs incurred for the year ended 31 Decemberb d e | |||||||||||||||||||||||||||||||||||
Acquisition of propertiesc | |||||||||||||||||||||||||||||||||||
| Proved | — | 1,224 | — | — | — | — | — | — | — | 1,224 | |||||||||||||||||||||||||
| Unproved | — | 204 | — | — | — | — | — | — | — | 204 | |||||||||||||||||||||||||
| — | 1,428 | — | — | — | — | — | — | — | 1,428 | ||||||||||||||||||||||||||
Exploration and appraisal costsd | — | 46 | — | — | 22 | 60 | 28 | — | — | 156 | |||||||||||||||||||||||||
Developmentf | — | (24) | — | — | 673 | 292 | 428 | 625 | — | 1,994 | |||||||||||||||||||||||||
| Total costs | — | 1,450 | — | — | 695 | 352 | 456 | 625 | — | 3,578 | |||||||||||||||||||||||||
Results of operations for the year ended 31 Decemberb | |||||||||||||||||||||||||||||||||||
Sales and other operating revenuesg | |||||||||||||||||||||||||||||||||||
| Third parties | — | 2,050 | — | — | 2,171 | 1,137 | — | 829 | — | 6,187 | |||||||||||||||||||||||||
| Sales between businesses | — | — | — | — | — | — | 6,052 | — | — | 6,052 | |||||||||||||||||||||||||
| — | 2,050 | — | — | 2,171 | 1,137 | 6,052 | 829 | — | 12,239 | ||||||||||||||||||||||||||
| Exploration expenditure | — | 39 | — | — | — | 7 | 13 | — | — | 59 | |||||||||||||||||||||||||
| Production costs | — | 148 | — | — | 628 | 246 | 411 | 191 | — | 1,624 | |||||||||||||||||||||||||
| Production taxes | — | — | — | — | 397 | 15 | 4,435 | — | — | 4,847 | |||||||||||||||||||||||||
| Other costs (income) | — | (6) | — | — | 16 | 152 | 97 | 20 | — | 279 | |||||||||||||||||||||||||
Depreciation, depletion and amortization | — | 348 | — | — | 462 | 572 | 535 | 553 | — | 2,470 | |||||||||||||||||||||||||
Net impairments and losses on sale of businesses and fixed assets | — | 164 | — | — | — | — | — | — | — | 164 | |||||||||||||||||||||||||
| — | 693 | — | — | 1,503 | 992 | 5,491 | 764 | — | 9,443 | ||||||||||||||||||||||||||
| Profit (loss) before taxation | — | 1,357 | — | — | 668 | 145 | 561 | 65 | — | 2,796 | |||||||||||||||||||||||||
| Allocable taxes | — | 1,098 | — | — | 77 | 81 | 109 | 66 | — | 1,431 | |||||||||||||||||||||||||
| Results of operations | — | 259 | — | — | 591 | 64 | 452 | (1) | — | 1,365 | |||||||||||||||||||||||||
aAmounts reported for Russia in this table are bp’s estimated share of the equity-accounted entities, including Rosneft’s worldwide activities (of which insignificant amounts relate to outside Russia).
bThese tables contain information relating to oil and natural gas exploration and production activities of equity-accounted entities. Amounts relating to the management and ownership of crude oil and natural gas pipelines, LNG liquefaction, transportation operations as well as downstream and other activities are excluded.
cCosts of decommissioning are included in capitalized costs at 31 December but are excluded from costs incurred for the year.
dIncludes exploration and appraisal drilling expenditures, which are capitalized within intangible assets, and geological and geophysical exploration costs, which are charged to income as incurred.
eThe amounts shown reflect bp’s share of equity-accounted entities’ costs incurred, and not the costs incurred by bp in acquiring an interest in equity-accounted entities.
fRest of Europe development costs are negative due to a true-up of prior period spend.
g Presented net of sales tax.
| bp Annual Report and Form 20-F 2023 | 251 | |||||||||||||
Oil and natural gas exploration and production activities – continued
| $ million | |||||||||||||||||||||||||||||||||||
| 2021 | |||||||||||||||||||||||||||||||||||
| Europe | North America | South America | Africa | Asia | Australasia | Total | |||||||||||||||||||||||||||||
| UK | Rest of Europe | USh | Rest of North America | Russia | Rest of Asia | ||||||||||||||||||||||||||||||
| Subsidiaries | |||||||||||||||||||||||||||||||||||
Capitalized costs at 31 Decembera b | |||||||||||||||||||||||||||||||||||
| Gross capitalized costs | |||||||||||||||||||||||||||||||||||
| Proved properties | 30,285 | — | 62,901 | 3,385 | 16,351 | 51,157 | — | 45,767 | 6,641 | 216,487 | |||||||||||||||||||||||||
| Unproved properties | 363 | — | 2,888 | 2,650 | 2,517 | 3,553 | — | 1,690 | 650 | 14,311 | |||||||||||||||||||||||||
| 30,648 | — | 65,789 | 6,035 | 18,868 | 54,710 | — | 47,457 | 7,291 | 230,798 | ||||||||||||||||||||||||||
| Accumulated depreciation | 21,293 | — | 34,895 | 5,008 | 14,393 | 46,187 | — | 26,607 | 4,617 | 153,000 | |||||||||||||||||||||||||
| Net capitalized costs | 9,355 | — | 30,894 | 1,027 | 4,475 | 8,523 | — | 20,850 | 2,674 | 77,798 | |||||||||||||||||||||||||
Costs incurred for the year ended 31 Decembera b | |||||||||||||||||||||||||||||||||||
| Acquisition of properties | |||||||||||||||||||||||||||||||||||
| Proved | — | — | 81 | — | — | — | — | — | — | 81 | |||||||||||||||||||||||||
| Unproved | — | — | 18 | — | — | — | — | — | — | 18 | |||||||||||||||||||||||||
| — | — | 99 | — | — | — | — | — | — | 99 | ||||||||||||||||||||||||||
Exploration and appraisal costsc | 28 | — | 138 | 88 | 90 | 85 | — | 159 | 18 | 606 | |||||||||||||||||||||||||
Developmentd | 262 | — | 2,541 | (50) | 586 | 1,246 | — | 1,849 | 162 | 6,596 | |||||||||||||||||||||||||
| Total costs | 290 | — | 2,778 | 38 | 676 | 1,331 | — | 2,008 | 180 | 7,301 | |||||||||||||||||||||||||
Results of operations for the year ended 31 Decembera | |||||||||||||||||||||||||||||||||||
Sales and other operating revenuese | |||||||||||||||||||||||||||||||||||
| Third parties | 182 | — | 1,700 | 384 | 1,330 | 2,934 | 2 | 2,469 | 994 | 9,995 | |||||||||||||||||||||||||
| Sales between businesses | 3,204 | — | 9,034 | 1 | 321 | 2,172 | — | 7,064 | 743 | 22,539 | |||||||||||||||||||||||||
| 3,386 | — | 10,734 | 385 | 1,651 | 5,106 | 2 | 9,533 | 1,737 | 32,534 | ||||||||||||||||||||||||||
| Exploration expenditure | 76 | — | 78 | 90 | 29 | 84 | — | 52 | 15 | 424 | |||||||||||||||||||||||||
| Production costs | 653 | — | 1,953 | 121 | 371 | 781 | — | 967 | 121 | 4,967 | |||||||||||||||||||||||||
| Production taxes | (35) | — | 108 | — | 266 | — | — | 918 | 51 | 1,308 | |||||||||||||||||||||||||
Other costs (income)f | 170 | (2) | 2,506 | 35 | 50 | 121 | 37 | (12) | 139 | 3,044 | |||||||||||||||||||||||||
Depreciation, depletion and amortization | 1,260 | — | 3,153 | 83 | 524 | 2,897 | 2 | 2,190 | 332 | 10,441 | |||||||||||||||||||||||||
Net impairments and (gains) losses on sale of businesses and fixed assets | (755) | (124) | (1,599) | 1,075 | (693) | 750 | — | (2,762) | (1) | (4,109) | |||||||||||||||||||||||||
| 1,369 | (126) | 6,199 | 1,404 | 547 | 4,633 | 39 | 1,353 | 657 | 16,075 | ||||||||||||||||||||||||||
Profit (loss) before taxationg | 2,017 | 126 | 4,535 | (1,019) | 1,104 | 473 | (37) | 8,180 | 1,080 | 16,459 | |||||||||||||||||||||||||
| Allocable taxes | 302 | 1 | 1,127 | 171 | 696 | 363 | — | 3,055 | 404 | 6,119 | |||||||||||||||||||||||||
| Results of operations | 1,715 | 125 | 3,408 | (1,190) | 408 | 110 | (37) | 5,125 | 676 | 10,340 | |||||||||||||||||||||||||
aThese tables contain information relating to oil and natural gas exploration and production activities of subsidiaries, which includes bp's share of oil and natural gas exploration and production activities of joint operations. They do not include any costs relating to the Gulf of Mexico oil spill. Amounts relating to the management and ownership of crude oil and natural gas pipelines, LNG liquefaction and transportation operations are excluded. In addition, bp's midstream activities of marketing and trading of natural gas, power and NGLs in the US, Canada, UK, Asia and Europe are excluded. The most significant midstream pipeline interests include the South Caucasus Pipeline, the Baku-Tbilisi-Ceyhan pipeline, the Trans Adriatic Pipeline and the Trans Anatolian Pipeline. Major LNG activities are located in Trinidad, Indonesia and Australia.
bCosts of decommissioning are included in capitalized costs at 31 December but are excluded from costs incurred for the year.
cIncludes exploration and appraisal drilling expenditures, which are capitalized within intangible assets, and geological and geophysical exploration costs, which are charged to income as incurred.
dDevelopment costs in Rest of North America are negative due to a true-up of prior period spend.
ePresented net of transportation costs, purchases and sales taxes.
fIncludes property taxes and other government take. The UK region includes a $213-million gain which is offset by corresponding charges primarily in the US region, relating to the group self-insurance programme.
gExcludes the unwinding of the discount on provisions and payables amounting to $325 million which is included in finance costs in the group income statement.
hAn amendment has been made to correctly present offsetting movements in proved properties cost and depreciation, The amendment has no impact on reported profit or net book amounts of total proved properties.
252 | bp Annual Report and Form 20-F 2023 | |||||||||||||
| Financial statements | |||||
Oil and natural gas exploration and production activities – continued
| $ million | |||||||||||||||||||||||||||||||||||
| 2021 | |||||||||||||||||||||||||||||||||||
| Europe | North America | South America | Africa | Asia | Australasia | Total | |||||||||||||||||||||||||||||
| UK | Rest of Europe | US | Rest of North America | Russiaa | Rest of Asia | ||||||||||||||||||||||||||||||
| Equity-accounted entities (bp share) | |||||||||||||||||||||||||||||||||||
Capitalized costs at 31 Decemberb c | |||||||||||||||||||||||||||||||||||
| Gross capitalized costs | |||||||||||||||||||||||||||||||||||
| Proved properties | — | 2,507 | — | — | 11,287 | — | 24,172 | — | — | 37,966 | |||||||||||||||||||||||||
| Unproved properties | — | 383 | — | — | 98 | — | 4,362 | — | — | 4,843 | |||||||||||||||||||||||||
| — | 2,890 | — | — | 11,385 | — | 28,534 | — | — | 42,809 | ||||||||||||||||||||||||||
| Accumulated depreciation | — | 1,267 | — | — | 5,894 | — | 7,389 | — | — | 14,550 | |||||||||||||||||||||||||
| Net capitalized costs | — | 1,623 | — | — | 5,491 | — | 21,145 | — | — | 28,259 | |||||||||||||||||||||||||
Costs incurred for the year ended 31 Decemberb d e | |||||||||||||||||||||||||||||||||||
Acquisition of propertiesc | |||||||||||||||||||||||||||||||||||
| Proved | — | — | — | — | — | — | — | — | — | — | |||||||||||||||||||||||||
| Unproved | — | — | — | — | — | — | 75 | — | — | 75 | |||||||||||||||||||||||||
| — | — | — | — | — | — | 75 | — | — | 75 | ||||||||||||||||||||||||||
Exploration and appraisal costsd | — | 60 | — | — | 8 | — | 196 | — | — | 264 | |||||||||||||||||||||||||
| Development | — | 430 | — | — | 539 | — | 2,677 | — | — | 3,646 | |||||||||||||||||||||||||
| Total costs | — | 490 | — | — | 547 | — | 2,948 | — | — | 3,985 | |||||||||||||||||||||||||
Results of operations for the year ended 31 Decemberb | |||||||||||||||||||||||||||||||||||
Sales and other operating revenuesf | |||||||||||||||||||||||||||||||||||
| Third parties | — | 1,677 | — | — | 1,637 | — | — | — | — | 3,314 | |||||||||||||||||||||||||
| Sales between businesses | — | — | — | — | — | — | 17,120 | — | — | 17,120 | |||||||||||||||||||||||||
| — | 1,677 | — | — | 1,637 | — | 17,120 | — | — | 20,434 | ||||||||||||||||||||||||||
| Exploration expenditure | — | 105 | — | — | 3 | — | 50 | — | — | 158 | |||||||||||||||||||||||||
| Production costs | — | 222 | — | — | 487 | — | 1,335 | — | — | 2,044 | |||||||||||||||||||||||||
| Production taxes | — | — | — | — | 308 | — | 9,291 | — | — | 9,599 | |||||||||||||||||||||||||
| Other costs (income) | — | 26 | — | — | 34 | — | 293 | — | — | 353 | |||||||||||||||||||||||||
Depreciation, depletion and amortization | — | 347 | — | — | 404 | — | 1,633 | — | — | 2,384 | |||||||||||||||||||||||||
Net impairments and losses on sale of businesses and fixed assets | — | 108 | — | — | (32) | — | 191 | — | — | 267 | |||||||||||||||||||||||||
| — | 808 | — | — | 1,204 | — | 12,793 | — | — | 14,805 | ||||||||||||||||||||||||||
| Profit (loss) before taxation | — | 869 | — | — | 433 | — | 4,327 | — | — | 5,629 | |||||||||||||||||||||||||
| Allocable taxes | — | 599 | — | — | 684 | — | 852 | — | — | 2,135 | |||||||||||||||||||||||||
| Results of operations | — | 270 | — | — | (251) | — | 3,475 | — | — | 3,494 | |||||||||||||||||||||||||
aAmounts reported for Russia in this table include bp’s share of Rosneft’s worldwide activities, including insignificant amounts outside Russia.
bThese tables contain information relating to oil and natural gas exploration and production activities of equity-accounted entities. Amounts relating to the management and ownership of crude oil and natural gas pipelines, LNG liquefaction, transportation operations as well as downstream and other activities are excluded.
cCosts of decommissioning are included in capitalized costs at 31 December but are excluded from costs incurred for the year.
dIncludes exploration and appraisal drilling expenditures, which are capitalized within intangible assets, and geological and geophysical exploration costs, which are charged to income as incurred.
eThe amounts shown reflect bp’s share of equity-accounted entities’ costs incurred, and not the costs incurred by bp in acquiring an interest in equity-accounted entities.
fPresented net of sales tax.
| bp Annual Report and Form 20-F 2023 | 253 | |||||||||||||
Movements in estimated net proved reserves
| million barrels | ||||||||||||||||||||||||||||||||
Crude oila b | 2023 | |||||||||||||||||||||||||||||||
| Europe | North America | South America | Africa | Asia | Australasia | Total | ||||||||||||||||||||||||||
| UK | Rest of Europe | US | Rest of North America | |||||||||||||||||||||||||||||
| Subsidiaries | ||||||||||||||||||||||||||||||||
| At 1 January | ||||||||||||||||||||||||||||||||
| Developed | 153 | — | 679 | — | 4 | 24 | 717 | 20 | 1,596 | |||||||||||||||||||||||
| Undeveloped | 109 | — | 527 | — | 5 | 2 | 356 | 1 | 1,000 | |||||||||||||||||||||||
| 261 | — | 1,206 | — | 9 | 26 | 1,073 | 21 | 2,596 | ||||||||||||||||||||||||
| Changes attributable to | ||||||||||||||||||||||||||||||||
| Revisions of previous estimates | (32) | — | (60) | — | (1) | (3) | 85 | (6) | (15) | |||||||||||||||||||||||
| Improved recovery | — | — | 14 | — | — | — | — | — | 14 | |||||||||||||||||||||||
| Purchases of reserves-in-place | — | — | 14 | — | — | — | — | — | 14 | |||||||||||||||||||||||
| Discoveries and extensions | — | — | 17 | — | — | — | 1 | — | 18 | |||||||||||||||||||||||
| Production | (27) | — | (123) | — | (1) | (11) | (107) | (4) | (274) | |||||||||||||||||||||||
| Sales of reserves-in-place | — | — | (1) | — | — | (6) | — | — | (7) | |||||||||||||||||||||||
| (58) | — | (141) | — | (2) | (20) | (21) | (9) | (252) | ||||||||||||||||||||||||
At 31 Decemberc | ||||||||||||||||||||||||||||||||
| Developed | 129 | — | 713 | — | 3 | 5 | 729 | 11 | 1,590 | |||||||||||||||||||||||
| Undeveloped | 74 | — | 352 | — | 5 | — | 323 | 1 | 755 | |||||||||||||||||||||||
| 203 | — | 1,065 | — | 7 | 6 | 1,052 | 12 | 2,345 | ||||||||||||||||||||||||
Equity-accounted entities (bp share)d | ||||||||||||||||||||||||||||||||
| At 1 January | ||||||||||||||||||||||||||||||||
| Developed | — | 90 | — | 5 | 276 | 127 | 95 | — | 592 | |||||||||||||||||||||||
| Undeveloped | — | 16 | — | 7 | 244 | 74 | 1 | — | 342 | |||||||||||||||||||||||
| — | 106 | — | 12 | 520 | 201 | 96 | — | 935 | ||||||||||||||||||||||||
| Changes attributable to | ||||||||||||||||||||||||||||||||
| Revisions of previous estimates | — | 6 | — | — | 7 | 15 | 43 | — | 71 | |||||||||||||||||||||||
| Improved recovery | — | 21 | — | — | 4 | — | — | — | 24 | |||||||||||||||||||||||
| Purchases of reserves-in-place | — | — | — | — | — | — | — | — | — | |||||||||||||||||||||||
| Discoveries and extensions | — | 22 | — | — | 19 | — | — | — | 41 | |||||||||||||||||||||||
| Production | — | (22) | — | (1) | (20) | (30) | (23) | — | (95) | |||||||||||||||||||||||
| Sales of reserves-in-place | — | — | — | — | — | — | — | — | — | |||||||||||||||||||||||
| — | 27 | — | (1) | 9 | (14) | 20 | — | 41 | ||||||||||||||||||||||||
| At 31 December | ||||||||||||||||||||||||||||||||
| Developed | — | 89 | — | 11 | 275 | 99 | 115 | — | 588 | |||||||||||||||||||||||
| Undeveloped | — | 45 | — | — | 253 | 88 | 2 | — | 387 | |||||||||||||||||||||||
| — | 133 | — | 11 | 528 | 187 | 117 | — | 976 | ||||||||||||||||||||||||
| Total subsidiaries and equity-accounted entities (bp share) | ||||||||||||||||||||||||||||||||
| At 1 January | ||||||||||||||||||||||||||||||||
| Developed | 153 | 90 | 679 | 5 | 279 | 151 | 812 | 20 | 2,188 | |||||||||||||||||||||||
| Undeveloped | 109 | 16 | 527 | 7 | 249 | 76 | 358 | 1 | 1,343 | |||||||||||||||||||||||
| 261 | 106 | 1,206 | 12 | 529 | 227 | 1,169 | 21 | 3,531 | ||||||||||||||||||||||||
| At 31 December | ||||||||||||||||||||||||||||||||
| Developed | 129 | 89 | 713 | 11 | 278 | 104 | 844 | 11 | 2,179 | |||||||||||||||||||||||
| Undeveloped | 74 | 45 | 352 | — | 258 | 88 | 324 | 1 | 1,142 | |||||||||||||||||||||||
| 203 | 133 | 1,065 | 11 | 536 | 192 | 1,168 | 12 | 3,321 | ||||||||||||||||||||||||
aCrude oil includes condensate and bitumen. Proved reserves exclude royalties due to others, whether payable in cash or in kind, where the royalty owner has a direct interest in the underlying production and the option and ability to make lifting and sales arrangements independently.
bBecause of rounding, some totals may not exactly agree with the sum of their component parts.
cIncludes 2.2 million barrels of crude oil in respect of the 30% non-controlling interest in BP Trinidad and Tobago LLC.
dVolumes of equity-accounted entities include volumes of equity-accounted investments of those entities.
254 | bp Annual Report and Form 20-F 2023 | |||||||||||||
| Financial statements | |||||
Movements in estimated net proved reserves – continued
| million barrels | ||||||||||||||||||||||||||||||||
Natural gas liquidsa b | 2023 | |||||||||||||||||||||||||||||||
| Europe | North America | South America | Africa | Asia | Australasia | Total | ||||||||||||||||||||||||||
| UK | Rest of Europe | USc | Rest of North America | |||||||||||||||||||||||||||||
| Subsidiaries | ||||||||||||||||||||||||||||||||
| At 1 January | ||||||||||||||||||||||||||||||||
| Developed | 6 | — | 181 | — | 1 | 6 | — | 1 | 196 | |||||||||||||||||||||||
| Undeveloped | — | — | 236 | — | — | 1 | — | — | 237 | |||||||||||||||||||||||
| 6 | — | 417 | — | 1 | 7 | — | 1 | 432 | ||||||||||||||||||||||||
| Changes attributable to | ||||||||||||||||||||||||||||||||
| Revisions of previous estimates | (1) | — | (14) | — | — | — | — | 1 | (14) | |||||||||||||||||||||||
| Improved recovery | — | — | 15 | — | — | — | — | — | 16 | |||||||||||||||||||||||
| Purchases of reserves-in-place | — | — | 12 | — | — | — | — | — | 12 | |||||||||||||||||||||||
| Discoveries and extensions | — | — | — | — | — | — | — | — | — | |||||||||||||||||||||||
Productionc | (2) | — | (31) | — | (1) | (1) | — | (1) | (35) | |||||||||||||||||||||||
| Sales of reserves-in-place | — | — | (3) | — | — | (6) | — | — | (9) | |||||||||||||||||||||||
| (3) | — | (20) | — | (1) | (7) | — | — | (31) | ||||||||||||||||||||||||
At 31 Decemberd | ||||||||||||||||||||||||||||||||
| Developed | 3 | — | 180 | — | — | — | — | 1 | 184 | |||||||||||||||||||||||
| Undeveloped | — | — | 217 | — | — | — | — | — | 217 | |||||||||||||||||||||||
| 3 | — | 397 | — | — | — | — | 1 | 401 | ||||||||||||||||||||||||
Equity-accounted entities (bp share)e | ||||||||||||||||||||||||||||||||
| At 1 January | ||||||||||||||||||||||||||||||||
| Developed | — | 4 | — | — | 3 | 17 | — | — | 23 | |||||||||||||||||||||||
| Undeveloped | — | — | — | — | 1 | 9 | — | — | 10 | |||||||||||||||||||||||
| — | 4 | — | — | 4 | 26 | — | — | 34 | ||||||||||||||||||||||||
| Changes attributable to | ||||||||||||||||||||||||||||||||
| Revisions of previous estimates | — | — | — | — | 1 | (11) | — | — | (10) | |||||||||||||||||||||||
| Improved recovery | — | 1 | — | — | — | — | — | — | 1 | |||||||||||||||||||||||
| Purchases of reserves-in-place | — | — | — | — | — | — | — | — | — | |||||||||||||||||||||||
| Discoveries and extensions | — | 4 | — | — | — | — | — | — | 4 | |||||||||||||||||||||||
| Production | — | (1) | — | — | — | (1) | — | — | (3) | |||||||||||||||||||||||
| Sales of reserves-in-place | — | — | — | — | — | — | — | — | — | |||||||||||||||||||||||
| — | 4 | — | — | — | (12) | — | — | (8) | ||||||||||||||||||||||||
| At 31 December | ||||||||||||||||||||||||||||||||
| Developed | — | 3 | — | — | 3 | 14 | — | — | 19 | |||||||||||||||||||||||
| Undeveloped | — | 5 | — | — | 1 | — | — | — | 6 | |||||||||||||||||||||||
| — | 8 | — | — | 4 | 14 | — | — | 25 | ||||||||||||||||||||||||
| Total subsidiaries and equity-accounted entities (bp share) | ||||||||||||||||||||||||||||||||
| At 1 January | ||||||||||||||||||||||||||||||||
| Developed | 6 | 4 | 181 | — | 4 | 23 | — | 1 | 219 | |||||||||||||||||||||||
| Undeveloped | — | — | 236 | — | 1 | 10 | — | — | 247 | |||||||||||||||||||||||
| 6 | 4 | 417 | — | 5 | 33 | — | 1 | 466 | ||||||||||||||||||||||||
| At 31 December | ||||||||||||||||||||||||||||||||
| Developed | 3 | 3 | 180 | — | 3 | 14 | — | 1 | 204 | |||||||||||||||||||||||
| Undeveloped | — | 5 | 217 | — | 1 | — | — | — | 223 | |||||||||||||||||||||||
| 3 | 8 | 397 | — | 4 | 14 | — | 1 | 427 | ||||||||||||||||||||||||
aProved reserves exclude royalties due to others, whether payable in cash or in kind, where the royalty owner has a direct interest in the underlying production and the option and ability to make lifting and sales arrangements independently.
bBecause of rounding, some totals may not exactly agree with the sum of their component parts.
cExcludes NGLs from processing plants in which an interest is held of 2 thousand barrels per day for equity-accounted entities.
dIncludes 0 million barrels of NGL in respect of the 30% non-controlling interest in BP Trinidad and Tobago LLC.
eVolumes of equity-accounted entities include volumes of equity-accounted investments of those entities.
| bp Annual Report and Form 20-F 2023 | 255 | |||||||||||||
Movements in estimated net proved reserves – continued
| million barrels | ||||||||||||||||||||||||||||||||
Total liquidsa b | 2023 | |||||||||||||||||||||||||||||||
| Europe | North America | South America | Africa | Asia | Australasia | Total | ||||||||||||||||||||||||||
| UK | Rest of Europe | USc | Rest of North America | |||||||||||||||||||||||||||||
| Subsidiaries | ||||||||||||||||||||||||||||||||
| At 1 January | ||||||||||||||||||||||||||||||||
| Developed | 159 | — | 860 | — | 5 | 30 | 717 | 20 | 1,791 | |||||||||||||||||||||||
| Undeveloped | 109 | — | 763 | — | 5 | 3 | 356 | 1 | 1,237 | |||||||||||||||||||||||
| 267 | — | 1,623 | — | 11 | 33 | 1,073 | 22 | 3,029 | ||||||||||||||||||||||||
| Changes attributable to | ||||||||||||||||||||||||||||||||
| Revisions of previous estimates | (33) | — | (74) | — | (1) | (3) | 85 | (5) | (30) | |||||||||||||||||||||||
| Improved recovery | — | — | 29 | — | — | — | — | — | 29 | |||||||||||||||||||||||
| Purchases of reserves-in-place | — | — | 25 | — | — | — | — | — | 25 | |||||||||||||||||||||||
| Discoveries and extensions | — | — | 17 | — | — | — | 1 | — | 18 | |||||||||||||||||||||||
Productionc | (29) | — | (154) | — | (3) | (12) | (107) | (4) | (309) | |||||||||||||||||||||||
| Sales of reserves-in-place | — | — | (4) | — | — | (12) | — | — | (17) | |||||||||||||||||||||||
| (61) | — | (161) | — | (3) | (27) | (21) | (9) | (283) | ||||||||||||||||||||||||
At 31 Decemberd | ||||||||||||||||||||||||||||||||
| Developed | 132 | — | 893 | — | 3 | 6 | 729 | 11 | 1,775 | |||||||||||||||||||||||
| Undeveloped | 75 | — | 568 | — | 5 | — | 323 | 1 | 971 | |||||||||||||||||||||||
| 207 | — | 1,462 | — | 7 | 6 | 1,052 | 13 | 2,746 | ||||||||||||||||||||||||
Equity-accounted entities (bp share)e | ||||||||||||||||||||||||||||||||
| At 1 January | ||||||||||||||||||||||||||||||||
| Developed | — | 94 | — | 5 | 278 | 144 | 95 | — | 616 | |||||||||||||||||||||||
| Undeveloped | — | 16 | — | 7 | 245 | 83 | 1 | — | 352 | |||||||||||||||||||||||
| — | 110 | — | 12 | 523 | 227 | 96 | — | 968 | ||||||||||||||||||||||||
| Changes attributable to | ||||||||||||||||||||||||||||||||
| Revisions of previous estimates | — | 6 | — | — | 7 | 4 | 43 | — | 61 | |||||||||||||||||||||||
| Improved recovery | — | 22 | — | — | 4 | — | — | — | 26 | |||||||||||||||||||||||
| Purchases of reserves-in-place | — | — | — | — | — | — | — | — | — | |||||||||||||||||||||||
| Discoveries and extensions | — | 26 | — | — | 19 | — | — | — | 45 | |||||||||||||||||||||||
| Production | — | (23) | — | (1) | (20) | (31) | (23) | — | (98) | |||||||||||||||||||||||
| Sales of reserves-in-place | — | — | — | — | — | — | — | — | — | |||||||||||||||||||||||
| — | 31 | — | (1) | 9 | (27) | 20 | — | 33 | ||||||||||||||||||||||||
| At 31 December | ||||||||||||||||||||||||||||||||
| Developed | — | 92 | — | 11 | 278 | 113 | 115 | — | 608 | |||||||||||||||||||||||
| Undeveloped | — | 49 | — | — | 254 | 88 | 2 | — | 393 | |||||||||||||||||||||||
| — | 141 | — | 11 | 532 | 200 | 117 | — | 1,001 | ||||||||||||||||||||||||
| Total subsidiaries and equity-accounted entities (bp share) | ||||||||||||||||||||||||||||||||
| At 1 January | ||||||||||||||||||||||||||||||||
| Developed | 159 | 94 | 860 | 5 | 283 | 174 | 812 | 20 | 2,407 | |||||||||||||||||||||||
| Undeveloped | 109 | 16 | 763 | 7 | 250 | 86 | 358 | 1 | 1,590 | |||||||||||||||||||||||
| 267 | 110 | 1,623 | 12 | 534 | 260 | 1,169 | 22 | 3,997 | ||||||||||||||||||||||||
| At 31 December | ||||||||||||||||||||||||||||||||
| Developed | 132 | 92 | 893 | 11 | 281 | 118 | 844 | 11 | 2,382 | |||||||||||||||||||||||
| Undeveloped | 75 | 49 | 568 | — | 259 | 88 | 324 | 1 | 1,365 | |||||||||||||||||||||||
| 207 | 141 | 1,462 | 11 | 540 | 206 | 1,168 | 13 | 3,747 | ||||||||||||||||||||||||
aProved reserves exclude royalties due to others, whether payable in cash or in kind, where the royalty owner has a direct interest in the underlying production and the option and ability to make lifting and sales arrangements independently.
bBecause of rounding, some totals may not exactly agree with the sum of their component parts.
cExcludes NGLs from processing plants in which an interest is held of 2 thousand barrels per day for equity-accounted entities.
dAlso includes 2.2 million barrels in respect of the 30% non-controlling interest in BP Trinidad and Tobago LLC.
eVolumes of equity-accounted entities include volumes of equity-accounted investments of those entities.
256 | bp Annual Report and Form 20-F 2023 | |||||||||||||
| Financial statements | |||||
Movements in estimated net proved reserves – continued
| billion cubic feet | ||||||||||||||||||||||||||||||||
Natural gasa b | 2023 | |||||||||||||||||||||||||||||||
| Europe | North America | South America | Africa | Asia | Australasia | Total | ||||||||||||||||||||||||||
| UK | Rest of Europe | US | Rest of North America | |||||||||||||||||||||||||||||
| Subsidiaries | ||||||||||||||||||||||||||||||||
| At 1 January | ||||||||||||||||||||||||||||||||
| Developed | 360 | — | 2,655 | — | 1,077 | 1,021 | 2,594 | 1,684 | 9,392 | |||||||||||||||||||||||
| Undeveloped | 41 | — | 3,154 | — | 748 | 221 | 2,125 | 407 | 6,696 | |||||||||||||||||||||||
| 401 | — | 5,809 | — | 1,825 | 1,242 | 4,719 | 2,091 | 16,087 | ||||||||||||||||||||||||
| Changes attributable to | ||||||||||||||||||||||||||||||||
| Revisions of previous estimates | (54) | — | 212 | — | 34 | 42 | 563 | 100 | 897 | |||||||||||||||||||||||
| Improved recovery | 9 | — | 254 | — | — | — | — | — | 263 | |||||||||||||||||||||||
| Purchases of reserves-in-place | — | — | 206 | — | — | — | — | — | 206 | |||||||||||||||||||||||
| Discoveries and extensions | — | — | 5 | — | 14 | — | 34 | — | 53 | |||||||||||||||||||||||
Productionc | (100) | — | (560) | — | (439) | (462) | (594) | (284) | (2,439) | |||||||||||||||||||||||
| Sales of reserves-in-place | — | — | (25) | — | — | (97) | — | — | (123) | |||||||||||||||||||||||
| (146) | — | 92 | — | (391) | (518) | 3 | (184) | (1,143) | ||||||||||||||||||||||||
At 31 Decemberd | ||||||||||||||||||||||||||||||||
| Developed | 221 | — | 2,672 | — | 931 | 518 | 3,051 | 1,550 | 8,942 | |||||||||||||||||||||||
| Undeveloped | 34 | — | 3,229 | — | 503 | 207 | 1,672 | 358 | 6,003 | |||||||||||||||||||||||
| 255 | — | 5,901 | — | 1,434 | 724 | 4,722 | 1,907 | 14,944 | ||||||||||||||||||||||||
Equity-accounted entities (bp share)e | ||||||||||||||||||||||||||||||||
| At 1 January | ||||||||||||||||||||||||||||||||
| Developed | — | 72 | — | 3 | 974 | 534 | 43 | — | 1,627 | |||||||||||||||||||||||
| Undeveloped | — | 5 | — | 2 | 606 | 154 | — | — | 767 | |||||||||||||||||||||||
| — | 77 | — | 5 | 1,580 | 689 | 43 | — | 2,394 | ||||||||||||||||||||||||
| Changes attributable to | ||||||||||||||||||||||||||||||||
| Revisions of previous estimates | — | 12 | — | — | 8 | 4 | 5 | — | 29 | |||||||||||||||||||||||
| Improved recovery | — | 25 | — | — | 22 | — | — | — | 47 | |||||||||||||||||||||||
| Purchases of reserves-in-place | — | — | — | — | 132 | — | — | — | 132 | |||||||||||||||||||||||
| Discoveries and extensions | — | 85 | — | — | 118 | — | — | — | 203 | |||||||||||||||||||||||
Productionc | — | (22) | — | — | (128) | (41) | (2) | — | (194) | |||||||||||||||||||||||
| Sales of reserves-in-place | — | — | — | — | (84) | — | — | — | (84) | |||||||||||||||||||||||
| — | 101 | — | (1) | 68 | (38) | 3 | — | 133 | ||||||||||||||||||||||||
| At 31 December | ||||||||||||||||||||||||||||||||
| Developed | — | 67 | — | 4 | 1,027 | 463 | 46 | — | 1,608 | |||||||||||||||||||||||
| Undeveloped | — | 110 | — | — | 621 | 188 | — | — | 919 | |||||||||||||||||||||||
| — | 177 | — | 4 | 1,648 | 651 | 46 | — | 2,527 | ||||||||||||||||||||||||
| Total subsidiaries and equity-accounted entities (bp share) | ||||||||||||||||||||||||||||||||
| At 1 January | ||||||||||||||||||||||||||||||||
| Developed | 360 | 72 | 2,655 | 3 | 2,051 | 1,556 | 2,637 | 1,684 | 11,018 | |||||||||||||||||||||||
| Undeveloped | 41 | 5 | 3,154 | 2 | 1,355 | 375 | 2,125 | 407 | 7,463 | |||||||||||||||||||||||
| 401 | 77 | 5,809 | 5 | 3,405 | 1,931 | 4,762 | 2,091 | 18,481 | ||||||||||||||||||||||||
| At 31 December | ||||||||||||||||||||||||||||||||
| Developed | 221 | 67 | 2,672 | 4 | 1,958 | 981 | 3,096 | 1,550 | 10,549 | |||||||||||||||||||||||
| Undeveloped | 34 | 110 | 3,229 | — | 1,125 | 394 | 1,672 | 358 | 6,922 | |||||||||||||||||||||||
| 255 | 177 | 5,901 | 4 | 3,082 | 1,375 | 4,768 | 1,907 | 17,471 | ||||||||||||||||||||||||
aProved reserves exclude royalties due to others, whether payable in cash or in kind, where the royalty owner has a direct interest in the underlying production and the option and ability to make lifting and sales arrangements independently.
bBecause of rounding, some totals may not exactly agree with the sum of their component parts.
cIncludes 99 billion cubic feet of natural gas consumed in operations, 62 billion cubic feet in subsidiaries, 36 billion cubic feet in equity-accounted entities.
dIncludes 430 billion cubic feet of natural gas in respect of the 30% non-controlling interest in BP Trinidad and Tobago LLC.
eVolumes of equity-accounted entities include volumes of equity-accounted investments of those entities.
| bp Annual Report and Form 20-F 2023 | 257 | |||||||||||||
Movements in estimated net proved reserves – continued
million barrels of oil equivalentc | ||||||||||||||||||||||||||||||||
Total hydrocarbonsa b | 2023 | |||||||||||||||||||||||||||||||
| Europe | North America | South America | Africa | Asia | Australasia | Total | ||||||||||||||||||||||||||
| UK | Rest of Europe | USf | Rest of North America | |||||||||||||||||||||||||||||
| Subsidiaries | ||||||||||||||||||||||||||||||||
| At 1 January | ||||||||||||||||||||||||||||||||
| Developed | 221 | — | 1,318 | — | 191 | 206 | 1,164 | 311 | 3,411 | |||||||||||||||||||||||
| Undeveloped | 116 | — | 1,306 | — | 134 | 41 | 723 | 72 | 2,392 | |||||||||||||||||||||||
| 337 | — | 2,624 | — | 325 | 247 | 1,887 | 382 | 5,802 | ||||||||||||||||||||||||
| Changes attributable to | ||||||||||||||||||||||||||||||||
| Revisions of previous estimates | (42) | — | (37) | — | 5 | 5 | 182 | 12 | 125 | |||||||||||||||||||||||
| Improved recovery | 2 | — | 73 | — | — | — | — | — | 75 | |||||||||||||||||||||||
| Purchases of reserves-in-place | — | — | 61 | — | — | — | — | — | 61 | |||||||||||||||||||||||
| Discoveries and extensions | — | — | 18 | — | 2 | — | 7 | — | 27 | |||||||||||||||||||||||
Productiond e | (46) | — | (251) | — | (78) | (92) | (210) | (53) | (730) | |||||||||||||||||||||||
| Sales of reserves-in-place | — | — | (9) | — | — | (29) | — | — | (38) | |||||||||||||||||||||||
| (86) | — | (145) | — | (71) | (116) | (21) | (41) | (480) | ||||||||||||||||||||||||
At 31 Decemberf | ||||||||||||||||||||||||||||||||
| Developed | 170 | — | 1,354 | — | 163 | 95 | 1,255 | 279 | 3,316 | |||||||||||||||||||||||
| Undeveloped | 81 | — | 1,125 | — | 91 | 36 | 611 | 63 | 2,006 | |||||||||||||||||||||||
| 251 | — | 2,479 | — | 255 | 131 | 1,866 | 341 | 5,323 | ||||||||||||||||||||||||
Equity-accounted entities (bp share)g | ||||||||||||||||||||||||||||||||
| At 1 January | ||||||||||||||||||||||||||||||||
| Developed | — | 106 | — | 6 | 446 | 236 | 102 | — | 896 | |||||||||||||||||||||||
| Undeveloped | — | 17 | — | 7 | 349 | 110 | 1 | — | 485 | |||||||||||||||||||||||
| — | 123 | — | 13 | 796 | 346 | 103 | — | 1,381 | ||||||||||||||||||||||||
| Changes attributable to | ||||||||||||||||||||||||||||||||
| Revisions of previous estimates | — | 8 | — | — | 9 | 5 | 44 | — | 66 | |||||||||||||||||||||||
| Improved recovery | — | 26 | — | — | 7 | — | — | — | 34 | |||||||||||||||||||||||
| Purchases of reserves-in-place | — | — | — | — | — | 23 | — | — | 23 | |||||||||||||||||||||||
| Discoveries and extensions | — | 41 | — | — | 39 | — | — | — | 80 | |||||||||||||||||||||||
Productione | — | (27) | — | (1) | (42) | (38) | (23) | — | (131) | |||||||||||||||||||||||
| Sales of reserves-in-place | — | — | — | — | (15) | — | — | — | (15) | |||||||||||||||||||||||
| — | 48 | — | (1) | (2) | (11) | 21 | — | 56 | ||||||||||||||||||||||||
| At 31 December | ||||||||||||||||||||||||||||||||
| Developed | — | 103 | — | 12 | 455 | 192 | 123 | — | 885 | |||||||||||||||||||||||
| Undeveloped | — | 68 | — | — | 361 | 120 | 2 | — | 552 | |||||||||||||||||||||||
| — | 172 | — | 12 | 816 | 313 | 124 | — | 1,437 | ||||||||||||||||||||||||
| Total subsidiaries and equity-accounted entities (bp share) | ||||||||||||||||||||||||||||||||
| At 1 January | ||||||||||||||||||||||||||||||||
| Developed | 221 | 106 | 1,318 | 6 | 637 | 442 | 1,266 | 311 | 4,307 | |||||||||||||||||||||||
| Undeveloped | 116 | 17 | 1,306 | 7 | 484 | 151 | 724 | 72 | 2,877 | |||||||||||||||||||||||
| 337 | 123 | 2,624 | 13 | 1,121 | 593 | 1,990 | 382 | 7,183 | ||||||||||||||||||||||||
| At 31 December | ||||||||||||||||||||||||||||||||
| Developed | 170 | 103 | 1,354 | 12 | 618 | 287 | 1,378 | 279 | 4,201 | |||||||||||||||||||||||
| Undeveloped | 81 | 68 | 1,125 | — | 453 | 156 | 613 | 63 | 2,558 | |||||||||||||||||||||||
| 251 | 172 | 2,479 | 12 | 1,071 | 444 | 1,991 | 341 | 6,759 | ||||||||||||||||||||||||
aProved reserves exclude royalties due to others, whether payable in cash or in kind, where the royalty owner has a direct interest in the underlying production and the option and ability to make lifting and sales arrangements independently.
bBecause of rounding, some totals may not exactly agree with the sum of their component parts.
c5.8 billion cubic feet of natural gas = 1 million barrels of oil equivalent.
dExcludes NGLs from processing plants in which an interest is held of 2 thousand barrels per day for equity-accounted entities.
eIncludes 17 million barrels of oil equivalent of natural gas consumed in operations, 11 million barrels of oil equivalent in subsidiaries, 6 million barrels of oil equivalent in equity-accounted entities.
fIncludes 76 million barrels of oil equivalent in respect of the 30% non-controlling interest in BP Trinidad and Tobago LLC.
gVolumes of equity-accounted entities include volumes of equity-accounted investments of those entities.
258 | bp Annual Report and Form 20-F 2023 | |||||||||||||
| Financial statements | |||||
Movements in estimated net proved reserves – continued
| million barrels | |||||||||||||||||||||||||||||||||||
Crude oila b | 2022 | ||||||||||||||||||||||||||||||||||
| Europe | North America | South America | Africac | Asia | Australasia | Total | |||||||||||||||||||||||||||||
| UK | Rest of Europe | US | Rest of North America | Russia | Rest of Asia | ||||||||||||||||||||||||||||||
| Subsidiaries | |||||||||||||||||||||||||||||||||||
| At 1 January | |||||||||||||||||||||||||||||||||||
| Developed | 178 | — | 705 | 24 | 5 | 117 | — | 930 | 28 | 1,987 | |||||||||||||||||||||||||
| Undeveloped | 101 | — | 601 | 167 | 7 | 14 | — | 449 | 4 | 1,343 | |||||||||||||||||||||||||
| 279 | — | 1,306 | 191 | 12 | 131 | — | 1,379 | 33 | 3,330 | ||||||||||||||||||||||||||
| Changes attributable to | |||||||||||||||||||||||||||||||||||
| Revisions of previous estimates | 9 | — | (11) | — | (1) | 1 | — | (40) | (4) | (47) | |||||||||||||||||||||||||
| Improved recovery | 2 | — | (2) | — | — | 4 | — | — | — | 5 | |||||||||||||||||||||||||
| Purchases of reserves-in-place | — | — | — | — | — | — | — | 3 | — | 3 | |||||||||||||||||||||||||
| Discoveries and extensions | — | — | 22 | — | — | 1 | — | — | — | 23 | |||||||||||||||||||||||||
| Production | (29) | — | (108) | (5) | (2) | (31) | — | (112) | (5) | (292) | |||||||||||||||||||||||||
| Sales of reserves-in-place | — | — | (1) | (185) | — | (80) | — | (157) | (3) | (426) | |||||||||||||||||||||||||
| (18) | — | (100) | (191) | (3) | (105) | — | (306) | (11) | (734) | ||||||||||||||||||||||||||
At 31 Decemberc | |||||||||||||||||||||||||||||||||||
| Developed | 153 | — | 679 | — | 4 | 24 | — | 717 | 20 | 1,596 | |||||||||||||||||||||||||
| Undeveloped | 109 | — | 527 | — | 5 | 2 | — | 356 | 1 | 1,000 | |||||||||||||||||||||||||
| 261 | — | 1,206 | — | 9 | 26 | — | 1,073 | 21 | 2,596 | ||||||||||||||||||||||||||
Equity-accounted entities (bp share)d | |||||||||||||||||||||||||||||||||||
| At 1 January | |||||||||||||||||||||||||||||||||||
| Developed | — | 100 | — | 10 | 275 | 3 | 3,045 | 1 | — | 3,434 | |||||||||||||||||||||||||
| Undeveloped | — | 21 | — | 12 | 253 | — | 2,540 | 1 | — | 2,826 | |||||||||||||||||||||||||
| — | 121 | — | 22 | 527 | 3 | 5,585 | 1 | — | 6,260 | ||||||||||||||||||||||||||
| Changes attributable to | |||||||||||||||||||||||||||||||||||
| Revisions of previous estimates | — | (17) | — | 1 | (1) | 23 | 4 | (46) | — | (37) | |||||||||||||||||||||||||
| Improved recovery | — | 1 | — | — | 14 | 25 | — | — | — | 40 | |||||||||||||||||||||||||
| Purchases of reserves-in-place | — | 42 | — | — | — | 165 | — | 152 | — | 359 | |||||||||||||||||||||||||
| Discoveries and extensions | — | 2 | — | — | — | — | — | — | — | 2 | |||||||||||||||||||||||||
| Production | — | (17) | — | (1) | (21) | (12) | (55) | (9) | — | (115) | |||||||||||||||||||||||||
Sales of reserves-in-placef | — | (25) | — | (10) | — | (3) | (5,535) | (1) | — | (5,574) | |||||||||||||||||||||||||
| — | (15) | — | (10) | (8) | 198 | (5,585) | 95 | — | (5,325) | ||||||||||||||||||||||||||
| At 31 December | |||||||||||||||||||||||||||||||||||
| Developed | — | 90 | — | 5 | 276 | 127 | — | 95 | — | 592 | |||||||||||||||||||||||||
| Undeveloped | — | 16 | — | 7 | 244 | 74 | — | 1 | — | 342 | |||||||||||||||||||||||||
| — | 106 | — | 12 | 520 | 201 | — | 96 | — | 935 | ||||||||||||||||||||||||||
| Total subsidiaries and equity-accounted entities (bp share) | |||||||||||||||||||||||||||||||||||
| At 1 January | |||||||||||||||||||||||||||||||||||
| Developed | 178 | 100 | 705 | 34 | 280 | 119 | 3,045 | 931 | 28 | 5,421 | |||||||||||||||||||||||||
| Undeveloped | 101 | 21 | 601 | 179 | 259 | 14 | 2,540 | 450 | 4 | 4,169 | |||||||||||||||||||||||||
| 279 | 121 | 1,306 | 213 | 539 | 134 | 5,585 | 1,381 | 33 | 9,590 | ||||||||||||||||||||||||||
| At 31 December | |||||||||||||||||||||||||||||||||||
| Developed | 153 | 90 | 679 | 5 | 279 | 151 | — | 812 | 20 | 2,188 | |||||||||||||||||||||||||
| Undeveloped | 109 | 16 | 527 | 7 | 249 | 76 | — | 358 | 1 | 1,343 | |||||||||||||||||||||||||
| 261 | 106 | 1,206 | 12 | 529 | 227 | — | 1,169 | 21 | 3,531 | ||||||||||||||||||||||||||
aCrude oil includes condensate and bitumen. Proved reserves exclude royalties due to others, whether payable in cash or in kind, where the royalty owner has a direct interest in the underlying production and the option and ability to make lifting and sales arrangements independently.
bBecause of rounding, some totals may not exactly agree with the sum of their component parts.
cIncludes 3 million barrels of crude oil in respect of the 30% non-controlling interest in BP Trinidad and Tobago LLC.
dVolumes of equity-accounted entities include volumes of equity-accounted investments of those entities.
eIncludes assets held for sale in Algeria
fbp's decision to exit its Russia business, including its shareholding in Rosneft, is treated as sales of reserves in place.
| bp Annual Report and Form 20-F 2023 | 259 | |||||||||||||
Movements in estimated net proved reserves – continued
| million barrels | |||||||||||||||||||||||||||||||||||
Natural gas liquidsa b | 2022 | ||||||||||||||||||||||||||||||||||
| Europe | North America | South America | Africac | Asia | Australasia | Total | |||||||||||||||||||||||||||||
| UK | Rest of Europe | USd | Rest of North America | Russia | Rest of Asia | ||||||||||||||||||||||||||||||
| Subsidiaries | |||||||||||||||||||||||||||||||||||
| At 1 January | |||||||||||||||||||||||||||||||||||
| Developed | 8 | — | 132 | — | 2 | 9 | — | — | 2 | 153 | |||||||||||||||||||||||||
| Undeveloped | — | — | 195 | — | 19 | 1 | — | — | — | 215 | |||||||||||||||||||||||||
| 9 | — | 328 | — | 21 | 10 | — | — | 2 | 368 | ||||||||||||||||||||||||||
| Changes attributable to | |||||||||||||||||||||||||||||||||||
| Revisions of previous estimates | (1) | — | 101 | — | (18) | (1) | — | — | — | 81 | |||||||||||||||||||||||||
| Improved recovery | — | — | 16 | — | — | 1 | — | — | — | 17 | |||||||||||||||||||||||||
| Purchases of reserves-in-place | — | — | — | — | — | — | — | — | — | — | |||||||||||||||||||||||||
| Discoveries and extensions | — | — | 1 | — | — | 1 | — | — | — | 2 | |||||||||||||||||||||||||
Productiond | (2) | — | (28) | — | (2) | (2) | — | — | (1) | (34) | |||||||||||||||||||||||||
| Sales of reserves-in-place | — | — | (1) | — | — | (1) | — | — | — | (1) | |||||||||||||||||||||||||
| (2) | — | 90 | — | (19) | (2) | — | — | (1) | 64 | ||||||||||||||||||||||||||
At 31 Decembere | |||||||||||||||||||||||||||||||||||
| Developed | 6 | — | 181 | — | 1 | 6 | — | — | 1 | 196 | |||||||||||||||||||||||||
| Undeveloped | — | — | 236 | — | — | 1 | — | — | — | 237 | |||||||||||||||||||||||||
| 6 | — | 417 | — | 1 | 7 | — | — | 1 | 432 | ||||||||||||||||||||||||||
Equity-accounted entities (bp share)f | |||||||||||||||||||||||||||||||||||
| At 1 January | |||||||||||||||||||||||||||||||||||
| Developed | — | 6 | — | — | 2 | 17 | 100 | — | — | 125 | |||||||||||||||||||||||||
| Undeveloped | — | — | — | — | — | — | 41 | — | — | 41 | |||||||||||||||||||||||||
| — | 6 | — | — | 2 | 17 | 140 | — | — | 166 | ||||||||||||||||||||||||||
| Changes attributable to | |||||||||||||||||||||||||||||||||||
| Revisions of previous estimates | — | (1) | — | — | 2 | 7 | — | — | — | 8 | |||||||||||||||||||||||||
| Improved recovery | — | — | — | — | — | — | — | — | — | — | |||||||||||||||||||||||||
| Purchases of reserves-in-place | — | 2 | — | — | — | 20 | — | — | — | 21 | |||||||||||||||||||||||||
| Discoveries and extensions | — | — | — | — | — | — | — | — | — | — | |||||||||||||||||||||||||
| Production | — | (1) | — | — | — | (1) | — | — | — | (2) | |||||||||||||||||||||||||
Sales of reserves-in-placeg | — | (2) | — | — | — | (17) | (140) | — | — | (159) | |||||||||||||||||||||||||
| — | (2) | — | — | 2 | 9 | (140) | — | — | (132) | ||||||||||||||||||||||||||
| At 31 December | |||||||||||||||||||||||||||||||||||
| Developed | — | 4 | — | — | 3 | 17 | — | — | — | 23 | |||||||||||||||||||||||||
| Undeveloped | — | — | — | — | 1 | 9 | — | — | — | 10 | |||||||||||||||||||||||||
| — | 4 | — | — | 4 | 26 | — | — | — | 34 | ||||||||||||||||||||||||||
| Total subsidiaries and equity-accounted entities (bp share) | |||||||||||||||||||||||||||||||||||
| At 1 January | |||||||||||||||||||||||||||||||||||
| Developed | 8 | 6 | 132 | — | 4 | 26 | 100 | — | 2 | 278 | |||||||||||||||||||||||||
| Undeveloped | — | — | 195 | — | 19 | 1 | 41 | — | — | 256 | |||||||||||||||||||||||||
| 9 | 6 | 328 | — | 22 | 27 | 140 | — | 2 | 534 | ||||||||||||||||||||||||||
| At 31 December | |||||||||||||||||||||||||||||||||||
| Developed | 6 | 4 | 181 | — | 4 | 23 | — | — | 1 | 219 | |||||||||||||||||||||||||
| Undeveloped | — | — | 236 | — | 1 | 10 | — | — | — | 247 | |||||||||||||||||||||||||
| 6 | 4 | 417 | — | 5 | 33 | — | — | 1 | 466 | ||||||||||||||||||||||||||
aProved reserves exclude royalties due to others, whether payable in cash or in kind, where the royalty owner has a direct interest in the underlying production and the option and ability to make lifting and sales arrangements independently.
bBecause of rounding, some totals may not exactly agree with the sum of their component parts.
cIncludes assets held for sale in Algeria.
dExcludes NGLs from processing plants in which an interest is held of 2 thousand barrels per day for equity-accounted entities.
eIncludes 0.4 million barrels of NGL in respect of the 30% non-controlling interest in BP Trinidad and Tobago LLC.
fVolumes of equity-accounted entities include volumes of equity-accounted investments of those entities.
gbp's decision to exit its Russia business, including its shareholding in Rosneft, is treated as sales of reserves in place.
260 | bp Annual Report and Form 20-F 2023 | |||||||||||||
| Financial statements | |||||
Movements in estimated net proved reserves – continued
| million barrels | |||||||||||||||||||||||||||||||||||
Total liquidsa b | 2022 | ||||||||||||||||||||||||||||||||||
| Europe | North America | South America | Africac | Asia | Australasia | Total | |||||||||||||||||||||||||||||
| UK | Rest of Europe | USd | Rest of North America | Russia | Rest of Asia | ||||||||||||||||||||||||||||||
| Subsidiaries | |||||||||||||||||||||||||||||||||||
| At 1 January | |||||||||||||||||||||||||||||||||||
| Developed | 187 | — | 837 | 24 | 7 | 125 | — | 930 | 30 | 2,141 | |||||||||||||||||||||||||
| Undeveloped | 101 | — | 796 | 167 | 25 | 15 | — | 449 | 4 | 1,558 | |||||||||||||||||||||||||
| 288 | — | 1,634 | 191 | 32 | 140 | — | 1,379 | 34 | 3,699 | ||||||||||||||||||||||||||
| Changes attributable to | |||||||||||||||||||||||||||||||||||
| Revisions of previous estimates | 8 | — | 89 | — | (19) | — | — | (40) | (4) | 34 | |||||||||||||||||||||||||
| Improved recovery | 2 | — | 14 | — | — | 5 | — | — | — | 22 | |||||||||||||||||||||||||
| Purchases of reserves-in-place | 1 | — | — | — | — | — | — | 3 | — | 3 | |||||||||||||||||||||||||
| Discoveries and extensions | — | — | 23 | — | — | 1 | — | — | — | 25 | |||||||||||||||||||||||||
Productiond | (31) | — | (136) | (5) | (3) | (34) | — | (112) | (5) | (326) | |||||||||||||||||||||||||
| Sales of reserves-in-place | — | — | (2) | (185) | (80) | — | (157) | (4) | (428) | ||||||||||||||||||||||||||
| (20) | — | (11) | (191) | (22) | (107) | — | (306) | (13) | (670) | ||||||||||||||||||||||||||
At 31 Decembere | |||||||||||||||||||||||||||||||||||
| Developed | 159 | — | 860 | — | 5 | 30 | — | 717 | 20 | 1,791 | |||||||||||||||||||||||||
| Undeveloped | 109 | — | 763 | — | 5 | 3 | — | 356 | 1 | 1,237 | |||||||||||||||||||||||||
| 267 | — | 1,623 | — | 11 | 33 | — | 1,073 | 22 | 3,029 | ||||||||||||||||||||||||||
Equity-accounted entities (bp share)f | |||||||||||||||||||||||||||||||||||
| At 1 January | |||||||||||||||||||||||||||||||||||
| Developed | — | 106 | — | 10 | 276 | 20 | 3,145 | 1 | — | 3,558 | |||||||||||||||||||||||||
| Undeveloped | — | 21 | — | 12 | 253 | — | 2,581 | 1 | — | 2,867 | |||||||||||||||||||||||||
| — | 127 | — | 22 | 529 | 20 | 5,726 | 1 | — | 6,425 | ||||||||||||||||||||||||||
| Changes attributable to | |||||||||||||||||||||||||||||||||||
| Revisions of previous estimates | — | (18) | — | 1 | 1 | 30 | 4 | (46) | — | (29) | |||||||||||||||||||||||||
| Improved recovery | — | 1 | — | — | 14 | 25 | — | — | — | 40 | |||||||||||||||||||||||||
| Purchases of reserves-in-place | — | 44 | — | — | — | 185 | — | 152 | — | 380 | |||||||||||||||||||||||||
| Discoveries and extensions | — | 2 | — | — | — | — | — | — | — | 2 | |||||||||||||||||||||||||
| Production | — | (18) | — | (1) | (21) | (13) | (55) | (9) | — | (117) | |||||||||||||||||||||||||
| Sales of reserves-in-place | — | (27) | — | (10) | — | (19) | (5,675) | (1) | — | (5,733) | |||||||||||||||||||||||||
| — | (17) | — | (10) | (6) | 207 | (5,726) | 95 | — | (5,457) | ||||||||||||||||||||||||||
| At 31 December | |||||||||||||||||||||||||||||||||||
| Developed | — | 94 | — | 5 | 278 | 144 | — | 95 | — | 616 | |||||||||||||||||||||||||
| Undeveloped | — | 16 | — | 7 | 245 | 83 | — | 1 | — | 352 | |||||||||||||||||||||||||
| — | 110 | — | 12 | 523 | 227 | — | 96 | — | 968 | ||||||||||||||||||||||||||
| Total subsidiaries and equity-accounted entities (bp share) | |||||||||||||||||||||||||||||||||||
| At 1 January | |||||||||||||||||||||||||||||||||||
| Developed | 187 | 106 | 837 | 34 | 284 | 146 | 3,145 | 931 | 30 | 5,699 | |||||||||||||||||||||||||
| Undeveloped | 101 | 21 | 796 | 179 | 278 | 15 | 2,581 | 450 | 4 | 4,425 | |||||||||||||||||||||||||
| 288 | 127 | 1,634 | 213 | 561 | 161 | 5,726 | 1,381 | 34 | 10,124 | ||||||||||||||||||||||||||
| At 31 December | |||||||||||||||||||||||||||||||||||
| Developed | 159 | 94 | 860 | 5 | 283 | 174 | — | 812 | 20 | 2,407 | |||||||||||||||||||||||||
| Undeveloped | 109 | 16 | 763 | 7 | 250 | 86 | — | 358 | 1 | 1,590 | |||||||||||||||||||||||||
| 267 | 110 | 1,623 | 12 | 534 | 260 | — | 1,169 | 22 | 3,997 | ||||||||||||||||||||||||||
aProved reserves exclude royalties due to others, whether payable in cash or in kind, where the royalty owner has a direct interest in the underlying production and the option and ability to make lifting and sales arrangements independently.
bBecause of rounding, some totals may not exactly agree with the sum of their component parts.
cIncludes assets held for sale in Algeria.
dExcludes NGLs from processing plants in which an interest is held of 2 thousand barrels per day for equity-accounted entities.
eAlso includes 3 million barrels in respect of the 30% non-controlling interest in BP Trinidad and Tobago LLC.
fVolumes of equity-accounted entities include volumes of equity-accounted investments of those entities.
gbp's decision to exit its Russia business, including its shareholding in Rosneft, is treated as sales of reserves in place.
| bp Annual Report and Form 20-F 2023 | 261 | |||||||||||||
Movements in estimated net proved reserves – continued
| billion cubic feet | |||||||||||||||||||||||||||||||||||
Natural gasa b | 2022 | ||||||||||||||||||||||||||||||||||
| Europe | North America | South America | Africac | Asia | Australasia | Total | |||||||||||||||||||||||||||||
| UK | Rest of Europe | US | Rest of North America | Russia | Rest of Asia | ||||||||||||||||||||||||||||||
| Subsidiaries | |||||||||||||||||||||||||||||||||||
| At 1 January | |||||||||||||||||||||||||||||||||||
| Developed | 455 | — | 2,401 | — | 1,152 | 1,433 | — | 3,266 | 1,584 | 10,291 | |||||||||||||||||||||||||
| Undeveloped | 45 | — | 3,404 | — | 1,147 | 154 | — | 2,522 | 939 | 8,211 | |||||||||||||||||||||||||
| 501 | — | 5,805 | — | 2,299 | 1,587 | — | 5,788 | 2,523 | 18,502 | ||||||||||||||||||||||||||
| Changes attributable to | |||||||||||||||||||||||||||||||||||
| Revisions of previous estimates | 6 | — | 449 | — | 2 | 180 | — | (575) | (165) | (102) | |||||||||||||||||||||||||
| Improved recovery | 1 | — | 46 | — | — | — | — | — | — | 47 | |||||||||||||||||||||||||
| Purchases of reserves-in-place | 2 | — | — | — | — | — | — | 92 | — | 94 | |||||||||||||||||||||||||
| Discoveries and extensions | — | — | 10 | — | — | 87 | — | 21 | 10 | 128 | |||||||||||||||||||||||||
Productiond | (109) | — | (493) | — | (476) | (517) | — | (561) | (276) | (2,432) | |||||||||||||||||||||||||
| Sales of reserves-in-place | — | — | (9) | — | — | (93) | — | (47) | — | (149) | |||||||||||||||||||||||||
| (100) | — | 4 | — | (474) | (344) | — | (1,069) | (431) | (2,414) | ||||||||||||||||||||||||||
At 31 Decembere | |||||||||||||||||||||||||||||||||||
| Developed | 360 | — | 2,655 | — | 1,077 | 1,021 | — | 2,594 | 1,684 | 9,392 | |||||||||||||||||||||||||
| Undeveloped | 41 | — | 3,154 | — | 748 | 221 | — | 2,125 | 407 | 6,696 | |||||||||||||||||||||||||
| 401 | — | 5,809 | — | 1,825 | 1,242 | — | 4,719 | 2,091 | 16,087 | ||||||||||||||||||||||||||
Equity-accounted entities (bp share)f | |||||||||||||||||||||||||||||||||||
| At 1 January | |||||||||||||||||||||||||||||||||||
| Developed | — | 130 | — | 4 | 929 | 689 | 11,399 | — | — | 13,149 | |||||||||||||||||||||||||
| Undeveloped | — | 11 | — | 4 | 536 | 133 | 7,279 | — | — | 7,964 | |||||||||||||||||||||||||
| — | 140 | — | 8 | 1,465 | 822 | 18,678 | — | — | 21,113 | ||||||||||||||||||||||||||
| Changes attributable to | |||||||||||||||||||||||||||||||||||
| Revisions of previous estimates | — | (7) | — | 1 | 162 | 131 | 53 | — | — | 340 | |||||||||||||||||||||||||
| Improved recovery | — | — | — | — | 82 | — | — | — | — | 82 | |||||||||||||||||||||||||
| Purchases of reserves-in-place | — | 14 | — | — | — | 575 | — | 45 | — | 634 | |||||||||||||||||||||||||
| Discoveries and extensions | — | 4 | — | — | — | — | — | — | — | 4 | |||||||||||||||||||||||||
Productiond | — | (25) | — | — | (128) | (36) | (86) | (2) | — | (277) | |||||||||||||||||||||||||
Sales of reserves-in-placeg | — | (49) | — | (4) | — | (803) | (18,645) | — | — | (19,501) | |||||||||||||||||||||||||
| — | (64) | — | (3) | 115 | (133) | (18,678) | 43 | — | (18,719) | ||||||||||||||||||||||||||
| At 31 December | |||||||||||||||||||||||||||||||||||
| Developed | — | 72 | — | 3 | 974 | 534 | — | 43 | — | 1,627 | |||||||||||||||||||||||||
| Undeveloped | — | 5 | — | 2 | 606 | 154 | — | — | — | 767 | |||||||||||||||||||||||||
| — | 77 | — | 5 | 1,580 | 689 | — | 43 | — | 2,394 | ||||||||||||||||||||||||||
| Total subsidiaries and equity-accounted entities (bp share) | |||||||||||||||||||||||||||||||||||
| At 1 January | |||||||||||||||||||||||||||||||||||
| Developed | 455 | 130 | 2,401 | 4 | 2,081 | 2,121 | 11,399 | 3,266 | 1,584 | 23,440 | |||||||||||||||||||||||||
| Undeveloped | 45 | 11 | 3,404 | 4 | 1,683 | 287 | 7,279 | 2,522 | 939 | 16,174 | |||||||||||||||||||||||||
| 501 | 140 | 5,805 | 8 | 3,764 | 2,408 | 18,678 | 5,788 | 2,523 | 39,615 | ||||||||||||||||||||||||||
| At 31 December | |||||||||||||||||||||||||||||||||||
| Developed | 360 | 72 | 2,655 | 3 | 2,051 | 1,556 | — | 2,637 | 1,684 | 11,018 | |||||||||||||||||||||||||
| Undeveloped | 41 | 5 | 3,154 | 2 | 1,355 | 375 | — | 2,125 | 407 | 7,463 | |||||||||||||||||||||||||
| 401 | 77 | 5,809 | 5 | 3,405 | 1,931 | — | 4,762 | 2,091 | 18,481 | ||||||||||||||||||||||||||
aProved reserves exclude royalties due to others, whether payable in cash or in kind, where the royalty owner has a direct interest in the underlying production and the option and ability to make lifting and sales arrangements independently.
bBecause of rounding, some totals may not exactly agree with the sum of their component parts.
cIncludes assets held for sale in Algeria.
dIncludes 122 billion cubic feet of natural gas consumed in operations, 86 billion cubic feet in subsidiaries, 36 billion cubic feet in equity-accounted entities.
eIncludes 547 billion cubic feet of natural gas in respect of the 30% non-controlling interest in BP Trinidad and Tobago LLC.
fVolumes of equity-accounted entities include volumes of equity-accounted investments of those entities.
gbp's decision to exit our Russia business, including our shareholding in Rosneft, is treated as sales of reserves in place.
262 | bp Annual Report and Form 20-F 2023 | |||||||||||||
| Financial statements | |||||
Movements in estimated net proved reserves – continued
million barrels of oil equivalentc | |||||||||||||||||||||||||||||||||||
Total hydrocarbonsa b | 2022 | ||||||||||||||||||||||||||||||||||
| Europe | North America | South America | Africad | Asia | Australasia | Total | |||||||||||||||||||||||||||||
| UK | Rest of Europe | USe | Rest of North America | Russia | Rest of Asia | ||||||||||||||||||||||||||||||
| Subsidiaries | |||||||||||||||||||||||||||||||||||
| At 1 January | |||||||||||||||||||||||||||||||||||
| Developed | 265 | — | 1,251 | 24 | 206 | 372 | — | 1,494 | 303 | 3,915 | |||||||||||||||||||||||||
| Undeveloped | 109 | — | 1,383 | 167 | 223 | 41 | — | 884 | 166 | 2,973 | |||||||||||||||||||||||||
| 374 | — | 2,634 | 191 | 429 | 414 | — | 2,377 | 469 | 6,889 | ||||||||||||||||||||||||||
| Changes attributable to | |||||||||||||||||||||||||||||||||||
| Revisions of previous estimates | 9 | — | 167 | — | (18) | 31 | — | (139) | (33) | 17 | |||||||||||||||||||||||||
| Improved recovery | 2 | — | 22 | — | — | 5 | — | — | — | 30 | |||||||||||||||||||||||||
| Purchases of reserves-in-place | 1 | — | — | — | — | — | — | 18 | — | 19 | |||||||||||||||||||||||||
| Discoveries and extensions | — | — | 25 | — | — | 16 | — | 4 | 2 | 47 | |||||||||||||||||||||||||
Productionf g | (50) | — | (221) | (5) | (85) | (123) | — | (209) | (53) | (746) | |||||||||||||||||||||||||
| Sales of reserves-in-place | — | — | (3) | (185) | — | (96) | — | (165) | (4) | (453) | |||||||||||||||||||||||||
| (37) | — | (10) | (191) | (103) | (167) | — | (491) | (87) | (1,086) | ||||||||||||||||||||||||||
At 31 Decembere | |||||||||||||||||||||||||||||||||||
| Developed | 221 | — | 1,318 | — | 191 | 206 | — | 1,164 | 311 | 3,411 | |||||||||||||||||||||||||
| Undeveloped | 116 | — | 1,306 | — | 134 | 41 | — | 723 | 72 | 2,392 | |||||||||||||||||||||||||
| 337 | — | 2,624 | — | 325 | 247 | — | 1,887 | 382 | 5,802 | ||||||||||||||||||||||||||
Equity-accounted entities (bp share)h | |||||||||||||||||||||||||||||||||||
| At 1 January | |||||||||||||||||||||||||||||||||||
| Developed | — | 128 | — | 11 | 437 | 139 | 5,110 | 1 | — | 5,825 | |||||||||||||||||||||||||
| Undeveloped | — | 23 | — | 12 | 345 | 23 | 3,836 | 1 | — | 4,240 | |||||||||||||||||||||||||
| — | 151 | — | 23 | 782 | 162 | 8,946 | 1 | — | 10,065 | ||||||||||||||||||||||||||
| Changes attributable to | |||||||||||||||||||||||||||||||||||
| Revisions of previous estimates | — | (19) | — | 1 | 29 | 53 | 13 | (46) | — | 30 | |||||||||||||||||||||||||
| Improved recovery | — | 1 | — | — | 28 | 25 | — | — | — | 54 | |||||||||||||||||||||||||
| Purchases of reserves-in-place | — | 46 | — | — | — | 284 | — | 159 | — | 489 | |||||||||||||||||||||||||
| Discoveries and extensions | — | 2 | — | — | — | — | — | — | — | 2 | |||||||||||||||||||||||||
Productiong | — | (22) | — | (1) | (43) | (19) | (70) | (10) | — | (165) | |||||||||||||||||||||||||
Sales of reserves-in-placei | — | (36) | — | (10) | — | (158) | (8,890) | (1) | — | (9,095) | |||||||||||||||||||||||||
| — | (28) | — | (11) | 14 | 184 | (8,946) | 102 | — | (8,685) | ||||||||||||||||||||||||||
| At 31 December | |||||||||||||||||||||||||||||||||||
| Developed | — | 106 | — | 6 | 446 | 236 | — | 102 | — | 896 | |||||||||||||||||||||||||
| Undeveloped | — | 17 | — | 7 | 349 | 110 | — | 1 | — | 485 | |||||||||||||||||||||||||
| — | 123 | — | 13 | 796 | 346 | — | 103 | — | 1,381 | ||||||||||||||||||||||||||
| Total subsidiaries and equity-accounted entities (bp share) | |||||||||||||||||||||||||||||||||||
| At 1 January | |||||||||||||||||||||||||||||||||||
| Developed | 265 | 128 | 1,251 | 35 | 642 | 511 | 5,110 | 1,494 | 303 | 9,740 | |||||||||||||||||||||||||
| Undeveloped | 109 | 23 | 1,383 | 179 | 568 | 65 | 3,836 | 884 | 166 | 7,214 | |||||||||||||||||||||||||
| 374 | 151 | 2,634 | 214 | 1,210 | 576 | 8,946 | 2,379 | 469 | 16,954 | ||||||||||||||||||||||||||
| At 31 December | |||||||||||||||||||||||||||||||||||
| Developed | 221 | 106 | 1,318 | 6 | 637 | 442 | — | 1,266 | 311 | 4,307 | |||||||||||||||||||||||||
| Undeveloped | 116 | 17 | 1,306 | 7 | 484 | 151 | — | 724 | 72 | 2,877 | |||||||||||||||||||||||||
| 337 | 123 | 2,624 | 13 | 1,121 | 593 | — | 1,990 | 382 | 7,183 | ||||||||||||||||||||||||||
aProved reserves exclude royalties due to others, whether payable in cash or in kind, where the royalty owner has a direct interest in the underlying production and the option and ability to make lifting and sales arrangements independently.
bBecause of rounding, some totals may not exactly agree with the sum of their component parts.
c5.8 billion cubic feet of natural gas = 1 million barrels of oil equivalent.
dIncludes assets held for sale in Algeria.
eIncludes 76 million barrels of oil equivalent in respect of the 30% non-controlling interest in BP Trinidad and Tobago LLC.
fExcludes NGLs from processing plants in which an interest is held of 2 thousand barrels per day for equity-accounted entities.
gIncludes 21 million barrels of oil equivalent of natural gas consumed in operations, 15 million barrels of oil equivalent in subsidiaries, 6 million barrels of oil equivalent in equity-accounted entities.
hVolumes of equity-accounted entities include volumes of equity-accounted investments of those entities.
ibp's decision to exit our Russia business, including our shareholding in Rosneft, is treated as sales of reserves in place.
| bp Annual Report and Form 20-F 2023 | 263 | |||||||||||||
Movements in estimated net proved reserves – continued
| million barrels | |||||||||||||||||||||||||||||||||||
Crude oila b | 2021 | ||||||||||||||||||||||||||||||||||
| Europe | North America | South America | Africa | Asia | Australasia | Total | |||||||||||||||||||||||||||||
| UK | Rest of Europe | USc | Rest of North America | Russia | Rest of Asia | ||||||||||||||||||||||||||||||
| Subsidiaries | |||||||||||||||||||||||||||||||||||
| At 1 January | |||||||||||||||||||||||||||||||||||
| Developed | 162 | — | 697 | 37 | 8 | 116 | — | 1,100 | 34 | 2,154 | |||||||||||||||||||||||||
| Undeveloped | 148 | — | 742 | 195 | 9 | 21 | — | 547 | 5 | 1,666 | |||||||||||||||||||||||||
| 309 | — | 1,438 | 232 | 16 | 137 | — | 1,647 | 38 | 3,819 | ||||||||||||||||||||||||||
| Changes attributable to | |||||||||||||||||||||||||||||||||||
| Revisions of previous estimates | — | — | (46) | (32) | (3) | 32 | — | (121) | (1) | (171) | |||||||||||||||||||||||||
| Improved recovery | — | — | 29 | — | — | 2 | — | — | — | 32 | |||||||||||||||||||||||||
| Purchases of reserves-in-place | — | — | — | — | — | — | — | — | — | — | |||||||||||||||||||||||||
| Discoveries and extensions | — | — | 2 | — | — | — | — | 5 | — | 7 | |||||||||||||||||||||||||
| Production | (30) | — | (113) | (9) | (2) | (41) | — | (116) | (5) | (315) | |||||||||||||||||||||||||
| Sales of reserves-in-place | (1) | — | (5) | — | (36) | — | (41) | ||||||||||||||||||||||||||||
| (30) | — | (132) | (41) | (5) | (7) | — | (268) | (6) | (489) | ||||||||||||||||||||||||||
At 31 Decemberc | |||||||||||||||||||||||||||||||||||
| Developed | 178 | — | 705 | 24 | 5 | 117 | — | 930 | 28 | 1,987 | |||||||||||||||||||||||||
| Undeveloped | 101 | — | 601 | 167 | 7 | 14 | — | 449 | 4 | 1,343 | |||||||||||||||||||||||||
| 279 | — | 1,306 | 191 | 12 | 131 | — | 1,379 | 33 | 3,330 | ||||||||||||||||||||||||||
Equity-accounted entities (bp share)d | |||||||||||||||||||||||||||||||||||
| At 1 January | |||||||||||||||||||||||||||||||||||
| Developed | — | 112 | — | 5 | 275 | 2 | 3,123 | — | — | 3,517 | |||||||||||||||||||||||||
| Undeveloped | — | 24 | — | 21 | 237 | — | 2,493 | — | — | 2,776 | |||||||||||||||||||||||||
| — | 136 | — | 26 | 512 | 3 | 5,615 | 1 | — | 6,293 | ||||||||||||||||||||||||||
| Changes attributable to | |||||||||||||||||||||||||||||||||||
| Revisions of previous estimates | — | 9 | — | (5) | (4) | 1 | 166 | 1 | — | 168 | |||||||||||||||||||||||||
| Improved recovery | — | 1 | — | — | — | — | — | — | — | 1 | |||||||||||||||||||||||||
| Purchases of reserves-in-place | — | — | — | — | 13 | — | — | — | — | 13 | |||||||||||||||||||||||||
| Discoveries and extensions | — | 1 | — | 2 | 25 | — | 238 | — | — | 266 | |||||||||||||||||||||||||
| Production | — | (18) | — | (1) | (19) | — | (323) | — | — | (361) | |||||||||||||||||||||||||
| Sales of reserves-in-place | — | (9) | — | — | — | — | (111) | — | — | (119) | |||||||||||||||||||||||||
| — | (15) | — | (4) | 15 | — | (30) | 1 | — | (33) | ||||||||||||||||||||||||||
At 31 Decembere f | |||||||||||||||||||||||||||||||||||
| Developed | — | 100 | — | 10 | 275 | 3 | 3,045 | 1 | — | 3,434 | |||||||||||||||||||||||||
| Undeveloped | — | 21 | — | 12 | 253 | — | 2,540 | 1 | — | 2,826 | |||||||||||||||||||||||||
| — | 121 | — | 22 | 527 | 3 | 5,585 | 1 | — | 6,260 | ||||||||||||||||||||||||||
| Total subsidiaries and equity-accounted entities (bp share) | |||||||||||||||||||||||||||||||||||
| At 1 January | |||||||||||||||||||||||||||||||||||
| Developed | 162 | 112 | 697 | 42 | 283 | 119 | 3,123 | 1,100 | 34 | 5,671 | |||||||||||||||||||||||||
| Undeveloped | 148 | 24 | 742 | 215 | 246 | 22 | 2,493 | 548 | 5 | 4,441 | |||||||||||||||||||||||||
| 309 | 136 | 1,438 | 258 | 529 | 140 | 5,615 | 1,648 | 38 | 10,112 | ||||||||||||||||||||||||||
| At 31 December | |||||||||||||||||||||||||||||||||||
| Developed | 178 | 100 | 705 | 34 | 280 | 119 | 3,045 | 931 | 28 | 5,421 | |||||||||||||||||||||||||
| Undeveloped | 101 | 21 | 601 | 179 | 259 | 14 | 2,540 | 450 | 4 | 4,169 | |||||||||||||||||||||||||
| 279 | 121 | 1,306 | 213 | 539 | 134 | 5,585 | 1,381 | 33 | 9,590 | ||||||||||||||||||||||||||
aCrude oil includes condensate and bitumen. Proved reserves exclude royalties due to others, whether payable in cash or in kind, where the royalty owner has a direct interest in the underlying production and the option and ability to make lifting and sales arrangements independently.
bBecause of rounding, some totals may not exactly agree with the sum of their component parts.
cIncludes 4 million barrels of crude oil in respect of the 30% non-controlling interest in BP Trinidad and Tobago LLC.
dVolumes of equity-accounted entities include volumes of equity-accounted investments of those entities.
eIncludes 393 million barrels of crude oil in respect of the 7.16% non-controlling interest in Rosneft, including 22 mmbbl held through bp's interests in Russia other than Rosneft.
fTotal proved crude oil reserves held as part of our equity interest in Rosneft is 5,490 million barrels, comprising 1 million barrels in Iraq and less than 1 million barrels each in Egypt, Vietnam and Canada, and 5,487 million barrels in Russia.
264 | bp Annual Report and Form 20-F 2023 | |||||||||||||
| Financial statements | |||||
Movements in estimated net proved reserves – continued
| million barrels | |||||||||||||||||||||||||||||||||||
Natural gas liquidsa b | 2021 | ||||||||||||||||||||||||||||||||||
| Europe | North America | South America | Africa | Asia | Australasia | Total | |||||||||||||||||||||||||||||
| UK | Rest of Europe | US | Rest of North America | Russia | Rest of Asia | ||||||||||||||||||||||||||||||
| Subsidiaries | |||||||||||||||||||||||||||||||||||
| At 1 January | |||||||||||||||||||||||||||||||||||
| Developed | 7 | — | 115 | — | 2 | 13 | — | — | 2 | 139 | |||||||||||||||||||||||||
| Undeveloped | — | — | 218 | — | 19 | 1 | — | — | — | 237 | |||||||||||||||||||||||||
| 7 | — | 333 | — | 21 | 14 | — | — | 2 | 376 | ||||||||||||||||||||||||||
| Changes attributable to | |||||||||||||||||||||||||||||||||||
| Revisions of previous estimates | 5 | — | (1) | — | 1 | (1) | — | — | — | 4 | |||||||||||||||||||||||||
| Improved recovery | — | — | 25 | — | — | — | — | — | — | 25 | |||||||||||||||||||||||||
| Purchases of reserves-in-place | — | — | — | — | — | — | — | — | — | — | |||||||||||||||||||||||||
| Discoveries and extensions | — | — | — | — | — | — | — | — | — | — | |||||||||||||||||||||||||
Productionc | (2) | — | (25) | — | (1) | (3) | — | — | (1) | (32) | |||||||||||||||||||||||||
| Sales of reserves-in-place | (1) | — | (4) | — | — | — | — | — | — | (5) | |||||||||||||||||||||||||
| 2 | — | (5) | — | — | (4) | — | — | — | (8) | ||||||||||||||||||||||||||
At 31 Decemberd | |||||||||||||||||||||||||||||||||||
| Developed | 8 | — | 132 | — | 2 | 9 | — | — | 2 | 153 | |||||||||||||||||||||||||
| Undeveloped | — | — | 195 | — | 19 | 1 | — | — | — | 215 | |||||||||||||||||||||||||
| 9 | — | 328 | — | 21 | 10 | — | — | 2 | 368 | ||||||||||||||||||||||||||
Equity-accounted entities (bp share)e | |||||||||||||||||||||||||||||||||||
| At 1 January | |||||||||||||||||||||||||||||||||||
| Developed | — | 6 | — | — | 2 | 12 | 108 | — | — | 129 | |||||||||||||||||||||||||
| Undeveloped | — | 1 | — | — | — | — | 43 | — | — | 44 | |||||||||||||||||||||||||
| — | 7 | — | — | 2 | 12 | 151 | — | — | 172 | ||||||||||||||||||||||||||
| Changes attributable to | |||||||||||||||||||||||||||||||||||
| Revisions of previous estimates | — | — | — | — | — | 6 | (9) | — | — | (2) | |||||||||||||||||||||||||
| Improved recovery | — | — | — | — | — | — | — | — | — | — | |||||||||||||||||||||||||
| Purchases of reserves-in-place | — | — | — | — | — | — | — | — | — | — | |||||||||||||||||||||||||
| Discoveries and extensions | — | — | — | — | — | — | — | — | — | — | |||||||||||||||||||||||||
Productiond | — | (1) | — | — | — | (1) | (1) | — | — | (4) | |||||||||||||||||||||||||
| Sales of reserves-in-place | — | — | — | — | — | — | — | — | — | — | |||||||||||||||||||||||||
| — | (1) | — | — | — | 5 | (10) | — | — | (7) | ||||||||||||||||||||||||||
At 31 Decemberf g | |||||||||||||||||||||||||||||||||||
| Developed | — | 6 | — | — | 2 | 17 | 100 | — | — | 125 | |||||||||||||||||||||||||
| Undeveloped | — | — | — | — | — | — | 41 | — | — | 41 | |||||||||||||||||||||||||
| — | 6 | — | — | 2 | 17 | 140 | — | — | 166 | ||||||||||||||||||||||||||
| Total subsidiaries and equity-accounted entities (bp share) | |||||||||||||||||||||||||||||||||||
| At 1 January | |||||||||||||||||||||||||||||||||||
| Developed | 7 | 6 | 115 | — | 4 | 25 | 108 | — | 2 | 268 | |||||||||||||||||||||||||
| Undeveloped | — | 1 | 218 | — | 19 | 1 | 43 | — | — | 281 | |||||||||||||||||||||||||
| 7 | 7 | 333 | — | 23 | 26 | 151 | — | 2 | 549 | ||||||||||||||||||||||||||
| At 31 December | |||||||||||||||||||||||||||||||||||
| Developed | 8 | 6 | 132 | — | 4 | 26 | 100 | — | 2 | 278 | |||||||||||||||||||||||||
| Undeveloped | — | — | 195 | — | 19 | 1 | 41 | — | — | 256 | |||||||||||||||||||||||||
| 9 | 6 | 328 | — | 22 | 27 | 140 | — | 2 | 534 | ||||||||||||||||||||||||||
aProved reserves exclude royalties due to others, whether payable in cash or in kind, where the royalty owner has a direct interest in the underlying production and the option and ability to make lifting and sales arrangements independently.
bBecause of rounding, some totals may not exactly agree with the sum of their component parts.
cExcludes NGLs from processing plants in which an interest is held of 3 thousand barrels per day for equity-accounted entities.
dIncludes 6 million barrels of NGL in respect of the 30% non-controlling interest in BP Trinidad and Tobago LLC.
e Volumes of equity-accounted entities include volumes of equity-accounted investments of those entities.
fIncludes 3 million barrels of NGLs in respect of the 2.3% non-controlling interest in Rosneft.
gTotal proved NGL reserves held as part of our equity interest in Rosneft is 140 million barrels, comprising less than 1 million barrels in Canada, and 140 million barrels in Russia.
| bp Annual Report and Form 20-F 2023 | 265 | |||||||||||||
Movements in estimated net proved reserves – continued
| million barrels | |||||||||||||||||||||||||||||||||||
Total liquidsa b | 2021 | ||||||||||||||||||||||||||||||||||
| Europe | North America | South America | Africa | Asia | Australasia | Total | |||||||||||||||||||||||||||||
| UK | Rest of Europe | USc | Rest of North America | Russia | Rest of Asia | ||||||||||||||||||||||||||||||
| Subsidiaries | |||||||||||||||||||||||||||||||||||
| At 1 January | |||||||||||||||||||||||||||||||||||
| Developed | 168 | — | 812 | 37 | 10 | 129 | — | 1,100 | 36 | 2,293 | |||||||||||||||||||||||||
| Undeveloped | 148 | — | 959 | 195 | 27 | 22 | — | 547 | 5 | 1,903 | |||||||||||||||||||||||||
| 316 | — | 1,771 | 232 | 37 | 151 | — | 1,647 | 41 | 4,196 | ||||||||||||||||||||||||||
| Changes attributable to | |||||||||||||||||||||||||||||||||||
| Revisions of previous estimates | 5 | — | (47) | (32) | (2) | 31 | — | (121) | (1) | (167) | |||||||||||||||||||||||||
| Improved recovery | — | — | 54 | — | — | 2 | — | — | — | 57 | |||||||||||||||||||||||||
| Purchases of reserves-in-place | — | — | — | — | — | — | — | — | — | — | |||||||||||||||||||||||||
| Discoveries and extensions | — | — | 2 | — | — | — | — | 5 | — | 7 | |||||||||||||||||||||||||
Productionc | (32) | — | (138) | (9) | (3) | (44) | — | (116) | (5) | (348) | |||||||||||||||||||||||||
| Sales of reserves-in-place | (1) | — | (9) | — | — | — | — | (36) | — | (46) | |||||||||||||||||||||||||
| (29) | — | (137) | (41) | (5) | (11) | — | (268) | (6) | (497) | ||||||||||||||||||||||||||
At 31 Decemberd | |||||||||||||||||||||||||||||||||||
| Developed | 187 | — | 837 | 24 | 7 | 125 | — | 930 | 30 | 2,141 | |||||||||||||||||||||||||
| Undeveloped | 101 | — | 796 | 167 | 25 | 15 | — | 449 | 4 | 1,558 | |||||||||||||||||||||||||
| 288 | — | 1,634 | 191 | 32 | 140 | — | 1,379 | 34 | 3,699 | ||||||||||||||||||||||||||
Equity-accounted entities (bp share)e | |||||||||||||||||||||||||||||||||||
| At 1 January | |||||||||||||||||||||||||||||||||||
| Developed | — | 118 | — | 5 | 277 | 15 | 3,231 | — | — | 3,645 | |||||||||||||||||||||||||
| Undeveloped | — | 25 | — | 21 | 237 | — | 2,535 | — | — | 2,819 | |||||||||||||||||||||||||
| — | 143 | — | 26 | 514 | 15 | 5,766 | 1 | — | 6,465 | ||||||||||||||||||||||||||
| Changes attributable to | |||||||||||||||||||||||||||||||||||
| Revisions of previous estimates | — | 10 | — | (5) | (4) | 7 | 157 | 1 | — | 166 | |||||||||||||||||||||||||
| Improved recovery | — | 1 | — | — | — | — | — | — | — | 1 | |||||||||||||||||||||||||
| Purchases of reserves-in-place | — | — | — | — | 13 | — | — | — | — | 13 | |||||||||||||||||||||||||
| Discoveries and extensions | — | 1 | — | 2 | 25 | — | 238 | — | — | 266 | |||||||||||||||||||||||||
Productiond | — | (19) | — | (1) | (19) | (1) | (325) | — | — | (365) | |||||||||||||||||||||||||
| Sales of reserves-in-place | — | (9) | — | — | — | — | (111) | — | — | (120) | |||||||||||||||||||||||||
| — | (16) | — | (4) | 15 | 5 | (40) | 1 | — | (39) | ||||||||||||||||||||||||||
At 31 Decemberf g | |||||||||||||||||||||||||||||||||||
| Developed | — | 106 | — | 10 | 276 | 20 | 3,145 | 1 | — | 3,558 | |||||||||||||||||||||||||
| Undeveloped | — | 21 | — | 12 | 253 | — | 2,581 | 1 | — | 2,867 | |||||||||||||||||||||||||
| — | 127 | — | 22 | 529 | 20 | 5,726 | 1 | — | 6,425 | ||||||||||||||||||||||||||
| Total subsidiaries and equity-accounted entities (bp share) | |||||||||||||||||||||||||||||||||||
| At 1 January | |||||||||||||||||||||||||||||||||||
| Developed | 168 | 118 | 812 | 42 | 287 | 144 | 3,231 | 1,100 | 36 | 5,938 | |||||||||||||||||||||||||
| Undeveloped | 148 | 25 | 959 | 215 | 265 | 23 | 2,535 | 548 | 5 | 4,722 | |||||||||||||||||||||||||
| 316 | 143 | 1,771 | 258 | 552 | 166 | 5,766 | 1,648 | 41 | 10,661 | ||||||||||||||||||||||||||
| At 31 December | |||||||||||||||||||||||||||||||||||
| Developed | 187 | 106 | 837 | 34 | 284 | 146 | 3,145 | 931 | 30 | 5,699 | |||||||||||||||||||||||||
| Undeveloped | 101 | 21 | 796 | 179 | 278 | 15 | 2,581 | 450 | 4 | 4,425 | |||||||||||||||||||||||||
| 288 | 127 | 1,634 | 213 | 561 | 161 | 5,726 | 1,381 | 34 | 10,124 | ||||||||||||||||||||||||||
aProved reserves exclude royalties due to others, whether payable in cash or in kind, where the royalty owner has a direct interest in the underlying production and the option and ability to make lifting and sales arrangements independently.
bBecause of rounding, some totals may not exactly agree with the sum of their component parts.
cExcludes NGLs from processing plants in which an interest is held of 3 thousand barrels per day for equity-accounted entities.
dAlso includes 10 million barrels in respect of the 30% non-controlling interest in BP Trinidad and Tobago LLC.
eVolumes of equity-accounted entities include volumes of equity-accounted investments of those entities.
fIncludes 396 million barrels of liquids in respect of the non-controlling interest in Rosneft, including 22 mmboe held through bp’s interests in Russia other than Rosneft.
gTotal proved liquid reserves held as part of our equity interest in Rosneft is 5,630 million barrels, comprising 1 million barrels in Iraq, less than 1 million barrels each in Canada, Egypt and Vietnam and 5,628 million barrels in Russia.
266 | bp Annual Report and Form 20-F 2023 | |||||||||||||
| Financial statements | |||||
Movements in estimated net proved reserves – continued
| billion cubic feet | |||||||||||||||||||||||||||||||||||
Natural gasa b | 2021 | ||||||||||||||||||||||||||||||||||
| Europe | North America | South America | Africa | Asia | Australasia | Total | |||||||||||||||||||||||||||||
| UK | Rest of Europe | US | Rest of North America | Russia | Rest of Asia | ||||||||||||||||||||||||||||||
| Subsidiaries | |||||||||||||||||||||||||||||||||||
| At 1 January | |||||||||||||||||||||||||||||||||||
| Developed | 306 | — | 1,921 | — | 1,567 | 1,382 | — | 3,883 | 2,058 | 11,118 | |||||||||||||||||||||||||
| Undeveloped | 51 | — | 3,423 | — | 1,964 | 158 | — | 3,641 | 1,029 | 10,267 | |||||||||||||||||||||||||
| 358 | — | 5,344 | — | 3,531 | 1,541 | — | 7,524 | 3,087 | 21,385 | ||||||||||||||||||||||||||
| Changes attributable to | |||||||||||||||||||||||||||||||||||
| Revisions of previous estimates | 254 | — | 717 | 1 | (767) | 537 | — | (66) | (285) | 390 | |||||||||||||||||||||||||
| Improved recovery | — | — | 247 | — | — | — | — | — | — | 247 | |||||||||||||||||||||||||
| Purchases of reserves-in-place | — | — | — | — | — | — | — | — | — | — | |||||||||||||||||||||||||
| Discoveries and extensions | — | — | 1 | — | — | 25 | — | 116 | — | 142 | |||||||||||||||||||||||||
Productionc | (103) | — | (445) | (1) | (465) | (516) | — | (489) | (279) | (2,297) | |||||||||||||||||||||||||
| Sales of reserves-in-place | (7) | — | (60) | — | — | — | — | (1,298) | — | (1,365) | |||||||||||||||||||||||||
| 143 | — | 461 | — | (1,232) | 46 | — | (1,736) | (564) | (2,883) | ||||||||||||||||||||||||||
At 31 Decemberd | |||||||||||||||||||||||||||||||||||
| Developed | 455 | — | 2,401 | — | 1,152 | 1,433 | — | 3,266 | 1,584 | 10,291 | |||||||||||||||||||||||||
| Undeveloped | 45 | — | 3,404 | — | 1,147 | 154 | — | 2,522 | 939 | 8,211 | |||||||||||||||||||||||||
| 501 | — | 5,805 | — | 2,299 | 1,587 | — | 5,788 | 2,523 | 18,502 | ||||||||||||||||||||||||||
Equity-accounted entities (bp share)e | |||||||||||||||||||||||||||||||||||
| At 1 January | |||||||||||||||||||||||||||||||||||
| Developed | — | 141 | — | 2 | 965 | 600 | 11,373 | 7 | — | 13,088 | |||||||||||||||||||||||||
| Undeveloped | — | 21 | — | 6 | 513 | 142 | 7,312 | — | — | 7,994 | |||||||||||||||||||||||||
| — | 162 | — | 8 | 1,478 | 741 | 18,685 | 7 | — | 21,082 | ||||||||||||||||||||||||||
| Changes attributable to | |||||||||||||||||||||||||||||||||||
| Revisions of previous estimates | — | 8 | — | (2) | (115) | 152 | 422 | — | — | 467 | |||||||||||||||||||||||||
| Improved recovery | — | 4 | — | — | — | — | — | — | — | 4 | |||||||||||||||||||||||||
| Purchases of reserves-in-place | — | — | — | — | 3 | — | — | — | — | 3 | |||||||||||||||||||||||||
| Discoveries and extensions | — | 1 | — | 1 | 222 | — | 151 | — | — | 375 | |||||||||||||||||||||||||
Productionc | — | (25) | — | — | (124) | (72) | (478) | (3) | — | (702) | |||||||||||||||||||||||||
| Sales of reserves-in-place | — | (9) | — | — | — | — | (102) | (4) | — | (115) | |||||||||||||||||||||||||
| — | (22) | — | (1) | (13) | 80 | (7) | (7) | — | 31 | ||||||||||||||||||||||||||
At 31 Decemberf g | |||||||||||||||||||||||||||||||||||
| Developed | — | 130 | — | 4 | 929 | 689 | 11,399 | — | — | 13,149 | |||||||||||||||||||||||||
| Undeveloped | — | 11 | — | 4 | 536 | 133 | 7,279 | — | — | 7,964 | |||||||||||||||||||||||||
| — | 140 | — | 8 | 1,465 | 822 | 18,678 | — | — | 21,113 | ||||||||||||||||||||||||||
| Total subsidiaries and equity-accounted entities (bp share) | |||||||||||||||||||||||||||||||||||
| At 1 January | |||||||||||||||||||||||||||||||||||
| Developed | 306 | 141 | 1,921 | 2 | 2,532 | 1,982 | 11,373 | 3,890 | 2,058 | 24,206 | |||||||||||||||||||||||||
| Undeveloped | 51 | 21 | 3,423 | 6 | 2,477 | 300 | 7,312 | 3,641 | 1,029 | 18,260 | |||||||||||||||||||||||||
| 358 | 162 | 5,344 | 8 | 5,009 | 2,282 | 18,685 | 7,531 | 3,087 | 42,467 | ||||||||||||||||||||||||||
| At 31 December | |||||||||||||||||||||||||||||||||||
| Developed | 455 | 130 | 2,401 | 4 | 2,081 | 2,121 | 11,399 | 3,266 | 1,584 | 23,440 | |||||||||||||||||||||||||
| Undeveloped | 45 | 11 | 3,404 | 4 | 1,683 | 287 | 7,279 | 2,522 | 939 | 16,174 | |||||||||||||||||||||||||
| 501 | 140 | 5,805 | 8 | 3,764 | 2,408 | 18,678 | 5,788 | 2,523 | 39,615 | ||||||||||||||||||||||||||
aProved reserves exclude royalties due to others, whether payable in cash or in kind, where the royalty owner has a direct interest in the underlying production and the option and ability to make lifting and sales arrangements independently.
bBecause of rounding, some totals may not exactly agree with the sum of their component parts.
cIncludes 135 billion cubic feet of natural gas consumed in operations, 83 billion cubic feet in subsidiaries, 52 billion cubic feet in equity-accounted entities.
dIncludes 690 billion cubic feet of natural gas in respect of the 30% non-controlling interest in BP Trinidad and Tobago LLC.
eVolumes of equity-accounted entities include volumes of equity-accounted investments of those entities.
fIncludes 1,656 billion cubic feet of natural gas in respect of the 10.20% non-controlling interest in Rosneft including 621 billion cubic feet held through bp’s interests in Russia other than Rosneft.
gTotal proved gas reserves held as part of our equity interest in Rosneft is 16,233 billion cubic feet, comprising less than 1 billion cubic feet in Vietnam and Canada, 376 billion cubic feet in Egypt and 15,857 billion cubic feet in Russia.
| bp Annual Report and Form 20-F 2023 | 267 | |||||||||||||
Movements in estimated net proved reserves – continued
million barrels of oil equivalentc | |||||||||||||||||||||||||||||||||||
Total hydrocarbonsa b | 2021 | ||||||||||||||||||||||||||||||||||
| Europe | North America | South America | Africa | Asia | Australasia | Total | |||||||||||||||||||||||||||||
| UK | Rest of Europe | USd | Rest of North America | Russia | Rest of Asia | ||||||||||||||||||||||||||||||
| Subsidiaries | |||||||||||||||||||||||||||||||||||
| At 1 January | |||||||||||||||||||||||||||||||||||
| Developed | 221 | — | 1,143 | 37 | 280 | 367 | — | 1,770 | 391 | 4,210 | |||||||||||||||||||||||||
| Undeveloped | 157 | — | 1,549 | 195 | 366 | 50 | — | 1,175 | 182 | 3,673 | |||||||||||||||||||||||||
| 378 | — | 2,692 | 232 | 646 | 417 | — | 2,945 | 573 | 7,883 | ||||||||||||||||||||||||||
| Changes attributable to | |||||||||||||||||||||||||||||||||||
| Revisions of previous estimates | 49 | — | 77 | (32) | (134) | 123 | — | (132) | (50) | (100) | |||||||||||||||||||||||||
| Improved recovery | — | — | 97 | — | — | 2 | — | — | — | 99 | |||||||||||||||||||||||||
| Purchases of reserves-in-place | — | — | — | — | — | — | — | — | — | — | |||||||||||||||||||||||||
| Discoveries and extensions | — | — | 2 | — | — | 4 | — | 25 | — | 31 | |||||||||||||||||||||||||
Productione f | (50) | — | (214) | (9) | (83) | (133) | — | (200) | (54) | (744) | |||||||||||||||||||||||||
| Sales of reserves-in-place | (3) | — | (19) | — | — | — | — | (260) | — | (282) | |||||||||||||||||||||||||
| (4) | — | (58) | (41) | (217) | (3) | — | (567) | (104) | (994) | ||||||||||||||||||||||||||
At 31 Decemberd | |||||||||||||||||||||||||||||||||||
| Developed | 265 | — | 1,251 | 24 | 206 | 372 | — | 1,494 | 303 | 3,915 | |||||||||||||||||||||||||
| Undeveloped | 109 | — | 1,383 | 167 | 223 | 41 | — | 884 | 166 | 2,973 | |||||||||||||||||||||||||
| 374 | — | 2,634 | 191 | 429 | 414 | — | 2,377 | 469 | 6,889 | ||||||||||||||||||||||||||
Equity-accounted entities (bp share)g | |||||||||||||||||||||||||||||||||||
| At 1 January | |||||||||||||||||||||||||||||||||||
| Developed | — | 142 | — | 5 | 443 | 118 | 5,192 | 1 | — | 5,902 | |||||||||||||||||||||||||
| Undeveloped | — | 29 | — | 22 | 326 | 25 | 3,796 | — | — | 4,198 | |||||||||||||||||||||||||
| — | 171 | — | 27 | 769 | 143 | 8,988 | 2 | — | 10,100 | ||||||||||||||||||||||||||
| Changes attributable to | |||||||||||||||||||||||||||||||||||
| Revisions of previous estimates | — | 11 | — | (5) | (24) | 33 | 230 | 1 | — | 246 | |||||||||||||||||||||||||
| Improved recovery | — | 1 | — | — | — | — | — | — | — | 1 | |||||||||||||||||||||||||
| Purchases of reserves-in-place | — | — | — | — | 14 | — | — | — | — | 14 | |||||||||||||||||||||||||
| Discoveries and extensions | — | 1 | — | 2 | 63 | — | 264 | — | — | 330 | |||||||||||||||||||||||||
Productionf | — | (23) | — | (1) | (41) | (14) | (407) | — | — | (486) | |||||||||||||||||||||||||
| Sales of reserves-in-place | — | (11) | — | — | — | — | (128) | (1) | — | (139) | |||||||||||||||||||||||||
| — | (20) | — | (4) | 12 | 19 | (42) | — | — | (34) | ||||||||||||||||||||||||||
At 31 Decemberh i | |||||||||||||||||||||||||||||||||||
| Developed | — | 128 | — | 11 | 437 | 139 | 5,110 | 1 | — | 5,825 | |||||||||||||||||||||||||
| Undeveloped | — | 23 | — | 12 | 345 | 23 | 3,836 | 1 | — | 4,240 | |||||||||||||||||||||||||
| — | 151 | — | 23 | 782 | 162 | 8,946 | 1 | — | 10,065 | ||||||||||||||||||||||||||
| Total subsidiaries and equity-accounted entities (bp share) | |||||||||||||||||||||||||||||||||||
| At 1 January | |||||||||||||||||||||||||||||||||||
| Developed | 221 | 142 | 1,143 | 43 | 724 | 485 | 5,192 | 1,771 | 391 | 10,112 | |||||||||||||||||||||||||
| Undeveloped | 157 | 29 | 1,549 | 217 | 692 | 74 | 3,796 | 1,175 | 182 | 7,871 | |||||||||||||||||||||||||
| 378 | 171 | 2,692 | 259 | 1,415 | 560 | 8,988 | 2,946 | 573 | 17,982 | ||||||||||||||||||||||||||
| At 31 December | |||||||||||||||||||||||||||||||||||
| Developed | 265 | 128 | 1,251 | 35 | 642 | 511 | 5,110 | 1,494 | 303 | 9,740 | |||||||||||||||||||||||||
| Undeveloped | 109 | 23 | 1,383 | 179 | 568 | 65 | 3,836 | 884 | 166 | 7,214 | |||||||||||||||||||||||||
| 374 | 151 | 2,634 | 214 | 1,210 | 576 | 8,946 | 2,379 | 469 | 16,954 | ||||||||||||||||||||||||||
aProved reserves exclude royalties due to others, whether payable in cash or in kind, where the royalty owner has a direct interest in the underlying production and the option and ability to make lifting and sales arrangements independently.
bBecause of rounding, some totals may not exactly agree with the sum of their component parts.
c5.8 billion cubic feet of natural gas = 1 million barrels of oil equivalent.
dIncludes 76 million barrels of oil equivalent in respect of the 30% non-controlling interest in BP Trinidad and Tobago LLC.
eExcludes NGLs from processing plants in which an interest is held of 3 thousand barrels per day for equity-accounted entities.
fIncludes 23 million barrels of oil equivalent of natural gas consumed in operations, 14 million barrels of oil equivalent in subsidiaries, 9 million barrels of oil equivalent in equity-accounted entities.
gVolumes of equity-accounted entities include volumes of equity-accounted investments of those entities.
hIncludes 682 million barrels of oil equivalent in respect of the 8.09% non-controlling interest in Rosneft, including 129mmboe held through bp’s interests in Russia other than Rosneft.
iTotal proved reserves held as part of our equity interest in Rosneft is 8,429 million barrels of oil equivalent, comprising less than 1 million barrels of oil equivalent in Canada and Vietnam, 1 million barrels of oil equivalent in Iraq, 65 million barrels of oil equivalent in Egypt and 8,362 million barrels of oil equivalent in Russia.
268 | bp Annual Report and Form 20-F 2023 | |||||||||||||
| Financial statements | |||||
Standardized measure of discounted future net cash flows and changes therein relating to proved oil and gas reserves
The following tables set out the standardized measure of discounted future net cash flows, and changes therein, relating to crude oil and natural gas production from the group’s estimated proved reserves. This information is prepared in compliance with FASB Oil and Gas Disclosures requirements.
Future net cash flows have been prepared on the basis of certain assumptions which may or may not be realized. These include the timing of future production, the estimation of crude oil and natural gas reserves and the application of average crude oil and natural gas prices and exchange rates from the previous 12 months. Furthermore, both proved reserves estimates and production forecasts are subject to revision as further technical information becomes available and economic conditions change. bp cautions against relying on the information presented because of the highly arbitrary nature of the assumptions on which it is based and its lack of comparability with the historical cost information presented in the financial statements.
| $ million | ||||||||||||||||||||||||||||||||
| 2023 | ||||||||||||||||||||||||||||||||
| Europe | North America | South America | Africa | Asia | Australasia | Total | ||||||||||||||||||||||||||
| UK | Rest of Europe | US | Rest of North America | |||||||||||||||||||||||||||||
| At 31 December | ||||||||||||||||||||||||||||||||
| Subsidiaries | ||||||||||||||||||||||||||||||||
Future cash inflowsa | 19,400 | — | 100,200 | — | 6,800 | 4,400 | 118,300 | 18,000 | 267,100 | |||||||||||||||||||||||
Future production costb | 11,900 | — | 37,500 | — | 4,300 | 600 | 39,600 | 4,500 | 98,400 | |||||||||||||||||||||||
Future development costb | 1,200 | — | 12,100 | — | 1,000 | 500 | 8,500 | 1,400 | 24,700 | |||||||||||||||||||||||
Future taxationc | 4,100 | — | 8,400 | — | 500 | 1,100 | 49,900 | 3,800 | 67,800 | |||||||||||||||||||||||
| Future net cash flows | 2,200 | — | 42,200 | — | 1,000 | 2,200 | 20,300 | 8,300 | 76,200 | |||||||||||||||||||||||
10% annual discountd | 900 | — | 16,300 | — | (300) | 400 | 6,300 | 2,600 | 26,200 | |||||||||||||||||||||||
Standardized measure of discounted future net cash flowse | 1,300 | — | 25,900 | — | 1,300 | 1,800 | 14,000 | 5,700 | 50,000 | |||||||||||||||||||||||
Equity-accounted entities (bp share)f | ||||||||||||||||||||||||||||||||
Future cash inflowsa | — | 13,700 | — | — | 44,600 | 15,200 | 9,000 | — | 82,500 | |||||||||||||||||||||||
Future production costb | — | 3,700 | — | — | 20,700 | 5,500 | 4,700 | — | 34,600 | |||||||||||||||||||||||
Future development costb | — | 2,100 | — | — | 5,200 | 2,300 | 3,100 | — | 12,700 | |||||||||||||||||||||||
Future taxationc | — | 6,000 | — | — | 5,900 | 2,100 | 400 | — | 14,400 | |||||||||||||||||||||||
| Future net cash flows | — | 1,900 | — | — | 12,800 | 5,300 | 800 | — | 20,800 | |||||||||||||||||||||||
10% annual discountd | — | 500 | — | — | 7,600 | 1,700 | 200 | — | 10,000 | |||||||||||||||||||||||
| Standardized measure of discounted future net cash flows | — | 1,400 | — | — | 5,200 | 3,600 | 600 | — | 10,800 | |||||||||||||||||||||||
| Total subsidiaries and equity-accounted entities | ||||||||||||||||||||||||||||||||
Standardized measure of discounted future net cash flows | 1,300 | 1,400 | 25,900 | — | 6,500 | 5,400 | 14,600 | 5,700 | 60,800 | |||||||||||||||||||||||
The following are the principal sources of change in the standardized measure of discounted future net cash flows:
| $ million | ||||||||||||||
| Subsidiaries | Equity-accounted entities (bp share) | Total subsidiaries and equity-accounted entities | ||||||||||||
| Sales and transfers of oil and gas produced, net of production costs | (36,500) | (6,500) | (43,000) | |||||||||||
| Development costs for the current year as estimated in previous year | 6,000 | 2,200 | 8,200 | |||||||||||
| Extensions, discoveries and improved recovery, less related costs | 500 | 800 | 1,300 | |||||||||||
| Net changes in prices and production cost | (50,800) | (7,100) | (57,900) | |||||||||||
| Revisions of previous reserves estimates | 2,500 | 1,300 | 3,800 | |||||||||||
| Net change in taxation | 30,000 | 5,100 | 35,100 | |||||||||||
| Future development costs | (1,000) | (300) | (1,300) | |||||||||||
| Net change in purchase and sales of reserves-in-place | (800) | — | (800) | |||||||||||
| Addition of 10% annual discount | 9,100 | 1,400 | 10,500 | |||||||||||
Total change in the standardized measure during the yearg | (41,000) | (3,100) | (44,100) | |||||||||||
aThe marker prices used were Brent $83.27/bbl, Henry Hub $2.58/mmBtu.
bProduction costs, which include production taxes, and development costs relating to future production of proved reserves are based on the continuation of existing economic conditions. Future decommissioning costs are included.
cTaxation is computed with reference to appropriate year-end statutory corporate income tax rates.
dFuture net cash flows from oil and natural gas production are discounted at 10% regardless of the group assessment of the risk associated with its producing activities.
eNon-controlling interests in BP Trinidad and Tobago LLC amounted to $392 million.
fThe standardized measure of discounted future net cash flows of equity-accounted entities includes standardized measure of discounted future net cash flows of equity-accounted investments of those entities.
gTotal change in the standardized measure during the year includes the effect of exchange rate movements.
| bp Annual Report and Form 20-F 2023 | 269 | |||||||||||||
Standardized measure of discounted future net cash flows and changes therein relating to proved oil and gas reserves – continued
| $ million | |||||||||||||||||||||||||||||||||||
| 2022 | |||||||||||||||||||||||||||||||||||
| Europe | North America | South America | Africa | Asia | Australasia | Total | |||||||||||||||||||||||||||||
| UK | Rest of Europe | US | Rest of North America | Russia | Rest of Asia | ||||||||||||||||||||||||||||||
| At 31 December | |||||||||||||||||||||||||||||||||||
| Subsidiaries | |||||||||||||||||||||||||||||||||||
Future cash inflowsa | 34,900 | — | 154,500 | — | 16,400 | 9,400 | — | 151,500 | 23,600 | 390,300 | |||||||||||||||||||||||||
Future production costb | 13,600 | — | 36,000 | — | 5,300 | 1,300 | — | 42,700 | 5,200 | 104,100 | |||||||||||||||||||||||||
Future development costb | 1,100 | — | 12,200 | — | 1,400 | 700 | — | 8,800 | 1,900 | 26,100 | |||||||||||||||||||||||||
Future taxationc | 12,600 | — | 19,800 | — | 5,000 | 1,900 | — | 65,200 | 5,500 | 110,000 | |||||||||||||||||||||||||
| Future net cash flows | 7,600 | — | 86,500 | — | 4,700 | 5,500 | — | 34,800 | 11,000 | 150,100 | |||||||||||||||||||||||||
10% annual discountd | 3,400 | — | 38,200 | — | 700 | 1,000 | — | 11,800 | 4,000 | 59,100 | |||||||||||||||||||||||||
Standardized measure of discounted future net cash flowse | 4,200 | — | 48,300 | — | 4,000 | 4,500 | — | 23,000 | 7,000 | 91,000 | |||||||||||||||||||||||||
Equity-accounted entities (bp share)f | |||||||||||||||||||||||||||||||||||
Future cash inflowsa | — | 12,800 | — | — | 49,800 | 20,500 | — | 9,200 | — | 92,300 | |||||||||||||||||||||||||
Future production costb | — | 2,100 | — | — | 22,000 | 6,300 | — | 4,900 | — | 35,300 | |||||||||||||||||||||||||
Future development costb | — | 400 | — | — | 4,900 | 2,800 | — | 3,000 | — | 11,100 | |||||||||||||||||||||||||
Future taxationc | — | 8,100 | — | — | 7,100 | 4,300 | — | 400 | — | 19,900 | |||||||||||||||||||||||||
| Future net cash flows | — | 2,200 | — | — | 15,800 | 7,100 | — | 900 | — | 26,000 | |||||||||||||||||||||||||
10% annual discountd | — | 400 | — | — | 9,300 | 2,200 | — | 200 | — | 12,100 | |||||||||||||||||||||||||
Standardized measure of discounted future net cash flowsg | — | 1,800 | — | — | 6,500 | 4,900 | — | 700 | — | 13,900 | |||||||||||||||||||||||||
| Total subsidiaries and equity-accounted entities | |||||||||||||||||||||||||||||||||||
Standardized measure of discounted future net cash flowsh | 4,200 | 1,800 | 48,300 | — | 10,500 | 9,400 | — | 23,700 | 7,000 | 104,900 | |||||||||||||||||||||||||
The following are the principal sources of change in the standardized measure of discounted future net cash flows:
| $ million | ||||||||||||||
| Subsidiaries | Equity-accounted entities (bp share) | Total subsidiaries and equity-accounted entities | ||||||||||||
| Sales and transfers of oil and gas produced, net of production costs | (22,800) | (4,600) | (27,400) | |||||||||||
| Development costs for the current year as estimated in previous year | 5,500 | 1,800 | 7,300 | |||||||||||
| Extensions, discoveries and improved recovery, less related costs | 1,600 | 900 | 2,500 | |||||||||||
| Net changes in prices and production cost | 80,800 | 11,100 | 91,900 | |||||||||||
| Revisions of previous reserves estimates | (18,300) | (2,700) | (21,000) | |||||||||||
| Net change in taxation | (23,000) | 1,400 | (21,600) | |||||||||||
| Future development costs | (2,100) | (800) | (2,900) | |||||||||||
| Net change in purchase and sales of reserves-in-place | (4,300) | (34,800) | (39,100) | |||||||||||
| Addition of 10% annual discount | 6,700 | 3,800 | 10,500 | |||||||||||
Total change in the standardized measure during the yeari | 24,100 | (23,900) | 200 | |||||||||||
aThe marker prices used were Brent $101.24/bbl, Henry Hub $6.19/mmBtu.
bProduction costs, which include production taxes, and development costs relating to future production of proved reserves are based on the continuation of existing economic conditions. Future decommissioning costs are included.
cTaxation is computed with reference to appropriate year-end statutory corporate income tax rates.
dFuture net cash flows from oil and natural gas production are discounted at 10% regardless of the group assessment of the risk associated with its producing activities.
eNon-controlling interests in BP Trinidad and Tobago LLC amounted to $1,216 million.
fThe standardized measure of discounted future net cash flows of equity-accounted entities includes standardized measure of discounted future net cash flows of equity-accounted investments of those entities.
gNo reserves are reported for Russia following bp's announcement that it will exit the country. The impact of this change is primarily included within sales of reserves-in-place.
hIncludes future net cash flows for assets held for sale at 31 December 2022.
iTotal change in the standardized measure during the year includes the effect of exchange rate movements.
270 | bp Annual Report and Form 20-F 2023 | |||||||||||||
| Financial statements | |||||
Standardized measure of discounted future net cash flows and changes therein relating to proved oil and gas reserves – continued
| $ million | |||||||||||||||||||||||||||||||||||
| 2021 | |||||||||||||||||||||||||||||||||||
| Europe | North America | South America | Africa | Asia | Australasia | Total | |||||||||||||||||||||||||||||
| UK | Rest of Europe | US | Rest of North America | Russia | Rest of Asia | ||||||||||||||||||||||||||||||
| At 31 December | |||||||||||||||||||||||||||||||||||
| Subsidiaries | |||||||||||||||||||||||||||||||||||
Future cash inflowsa | 25,600 | — | 108,600 | 8,400 | 10,300 | 17,100 | — | 126,800 | 20,400 | 317,200 | |||||||||||||||||||||||||
Future production costb | 13,400 | — | 33,900 | 3,700 | 4,300 | 4,800 | — | 46,100 | 6,400 | 112,600 | |||||||||||||||||||||||||
Future development costb | 1,100 | — | 12,600 | 1,100 | 1,300 | 1,100 | — | 12,400 | 2,100 | 31,700 | |||||||||||||||||||||||||
Future taxationc | 4,300 | — | 10,100 | 500 | 1,400 | 2,900 | — | 44,100 | 4,100 | 67,400 | |||||||||||||||||||||||||
| Future net cash flows | 6,800 | — | 52,000 | 3,100 | 3,300 | 8,300 | — | 24,200 | 7,800 | 105,500 | |||||||||||||||||||||||||
10% annual discountd | 2,100 | — | 21,600 | 1,700 | 600 | 1,400 | — | 8,300 | 2,900 | 38,600 | |||||||||||||||||||||||||
Standardized measure of discounted future net cash flowse | 4,700 | — | 30,400 | 1,400 | 2,700 | 6,900 | — | 15,900 | 4,900 | 66,900 | |||||||||||||||||||||||||
Equity-accounted entities (bp share)f | |||||||||||||||||||||||||||||||||||
Future cash inflowsa | — | 10,500 | — | — | 40,100 | — | 370,000 | — | — | 420,600 | |||||||||||||||||||||||||
Future production costb | — | 3,400 | — | — | 16,600 | — | 254,000 | — | — | 274,000 | |||||||||||||||||||||||||
Future development costb | — | 400 | — | — | 3,900 | — | 24,300 | — | — | 28,600 | |||||||||||||||||||||||||
Future taxationc | — | 5,100 | — | — | 6,100 | — | 15,600 | — | — | 26,800 | |||||||||||||||||||||||||
| Future net cash flows | — | 1,600 | — | — | 13,500 | — | 76,100 | — | — | 91,200 | |||||||||||||||||||||||||
10% annual discountd | — | 400 | — | — | 7,800 | — | 45,200 | — | — | 53,400 | |||||||||||||||||||||||||
Standardized measure of discounted future net cash flowsg h | — | 1,200 | — | — | 5,700 | — | 30,900 | — | — | 37,800 | |||||||||||||||||||||||||
| Total subsidiaries and equity-accounted entities | |||||||||||||||||||||||||||||||||||
Standardized measure of discounted future net cash flowsi | 4,700 | 1,200 | 30,400 | 1,400 | 8,400 | 6,900 | 30,900 | 15,900 | 4,900 | 104,700 | |||||||||||||||||||||||||
The following are the principal sources of change in the standardized measure of discounted future net cash flows:
| $ million | ||||||||||||||
| Subsidiaries | Equity-accounted entities (bp share) | Total subsidiaries and equity-accounted entities | ||||||||||||
| Sales and transfers of oil and gas produced, net of production costs | (12,200) | (7,700) | (19,900) | |||||||||||
| Development costs for the current year as estimated in previous year | 5,800 | 3,600 | 9,400 | |||||||||||
| Extensions, discoveries and improved recovery, less related costs | 1,700 | 2,400 | 4,100 | |||||||||||
| Net changes in prices and production cost | 71,900 | 29,700 | 101,600 | |||||||||||
| Revisions of previous reserves estimates | (8,800) | 1,000 | (7,800) | |||||||||||
| Net change in taxation | (17,900) | (7,200) | (25,100) | |||||||||||
| Future development costs | (3,200) | (5,300) | (8,500) | |||||||||||
| Net change in purchase and sales of reserves-in-place | (3,100) | (600) | (3,700) | |||||||||||
| Addition of 10% annual discount | 3,000 | 2,000 | 5,000 | |||||||||||
Total change in the standardized measure during the yearj | 37,200 | 17,900 | 55,100 | |||||||||||
aThe marker prices used were Brent $69.23/bbl, Henry Hub $3.61/mmBtu.
bProduction costs, which include production taxes, and development costs relating to future production of proved reserves are based on the continuation of existing economic conditions. Future decommissioning costs are included.
cTaxation is computed with reference to appropriate year-end statutory corporate income tax rates.
dFuture net cash flows from oil and natural gas production are discounted at 10% regardless of the group assessment of the risk associated with its producing activities.
eNon-controlling interests in BP Trinidad and Tobago LLC amounted to $820 million.
fThe standardized measure of discounted future net cash flows of equity-accounted entities includes standardized measure of discounted future net cash flows of equity-accounted investments of those entities.
gNon-controlling interests in Rosneft amounted to $2,422 million in Russia.
hNo equity-accounted future cash flows in Africa because proved reserves are received as a result of contractual arrangements, with no associated costs.
iIncludes future net cash flows for assets held for sale at 31 December 2021.
jTotal change in the standardized measure during the year includes the effect of exchange rate movements. Exchange rate effects arising from the translation of our share of Rosneft changes to US dollars are included within ‘Net changes in prices and production cost’.
| bp Annual Report and Form 20-F 2023 | 271 | |||||||||||||
Operational and statistical information
The following tables present operational and statistical information related to production, drilling, productive wells and acreage. Figures include amounts attributable to assets held for sale.
Crude oil and natural gas production
The following table shows crude oil, natural gas liquids and natural gas production for the years ended 31 December 2023, 2022 and 2021.
Production for the yeara b
| Europe | North America | South America | Africa | Asia | Australasia | Total | |||||||||||||||||||||||||||||
| UK | Rest of Europe | US | Rest of North America | Russiac | Rest of Asia | ||||||||||||||||||||||||||||||
Subsidiariesd | |||||||||||||||||||||||||||||||||||
Crude oile | thousand barrels per day | ||||||||||||||||||||||||||||||||||
| 2023 | 74 | — | 335 | — | 4 | 29 | — | 289 | 10 | 741 | |||||||||||||||||||||||||
| 2022 | 80 | — | 296 | 15 | 5 | 83 | — | 307 | 12 | 797 | |||||||||||||||||||||||||
| 2021 | 82 | — | 308 | 25 | 5 | 110 | — | 318 | 13 | 860 | |||||||||||||||||||||||||
| Natural gas liquids | thousand barrels per day | ||||||||||||||||||||||||||||||||||
| 2023 | 5 | — | 88 | — | 4 | 2 | — | 4 | 2 | 104 | |||||||||||||||||||||||||
| 2022 | 5 | — | 76 | — | 4 | 6 | — | — | 2 | 93 | |||||||||||||||||||||||||
| 2021 | 5 | — | 70 | — | 4 | 7 | — | — | 2 | 88 | |||||||||||||||||||||||||
Natural gasf | million cubic feet per day | ||||||||||||||||||||||||||||||||||
| 2023 | 247 | — | 1,486 | — | 1,191 | 1,236 | — | 1,578 | 774 | 6,512 | |||||||||||||||||||||||||
| 2022 | 271 | — | 1,291 | — | 1,276 | 1,353 | — | 1,485 | 752 | 6,428 | |||||||||||||||||||||||||
| 2021 | 236 | — | 1,197 | 2 | 1,260 | 1,332 | — | 1,279 | 760 | 6,067 | |||||||||||||||||||||||||
| Equity-accounted entities (bp share) | |||||||||||||||||||||||||||||||||||
Crude oile | thousand barrels per day | ||||||||||||||||||||||||||||||||||
| 2023 | — | — | — | — | 57 | 82 | — | 62 | — | 261 | |||||||||||||||||||||||||
| 2022 | — | 47 | — | — | 59 | 33 | 150 | 25 | — | 314 | |||||||||||||||||||||||||
| 2021 | — | 48 | — | — | 55 | 1 | 887 | — | — | 991 | |||||||||||||||||||||||||
| Natural gas liquids | thousand barrels per day | ||||||||||||||||||||||||||||||||||
| 2023 | — | 3 | — | — | 1 | 6 | — | — | — | 9 | |||||||||||||||||||||||||
| 2022 | — | 2 | — | — | 1 | 5 | — | — | — | 9 | |||||||||||||||||||||||||
| 2021 | — | 3 | — | — | 1 | 6 | 3 | — | — | 12 | |||||||||||||||||||||||||
Natural gasf | million cubic feet per day | ||||||||||||||||||||||||||||||||||
| 2023 | — | 58 | — | — | 299 | 74 | — | — | — | 432 | |||||||||||||||||||||||||
| 2022 | — | 66 | — | — | 296 | 64 | 248 | — | — | 674 | |||||||||||||||||||||||||
| 2021 | — | 66 | — | — | 284 | 77 | 1,423 | — | — | 1,849 | |||||||||||||||||||||||||
aProduction excludes royalties due to others, whether payable in cash or in kind, where the royalty owner has a direct interest in the underlying production and the option and ability to make lifting and sales arrangements independently.
bBecause of rounding, some totals may not exactly agree with the sum of their component parts.
cAmounts reported for Russia include bp’s share of Rosneft worldwide activities, including insignificant amounts outside Russia.
dAll of the oil and liquid production from Canada is bitumen.
eCrude oil includes condensate.
fNatural gas production excludes gas consumed in operations.
272 | bp Annual Report and Form 20-F 2023 | |||||||||||||
| Financial statements | |||||
Operational and statistical information – continued
Productive oil and gas wells and acreage
The following tables show the number of gross and net productive oil and natural gas wells and total gross and net developed and undeveloped oil and natural gas acreage in which the group and its equity-accounted entities had interests as at 31 December 2023. A ‘gross’ well or acre is one in which a whole or fractional working interest is owned, while the number of ‘net’ wells or acres is the sum of the whole or fractional working interests in gross wells or acres. Productive wells are producing wells and wells capable of production. Developed acreage is the acreage within the boundary of a field, on which development wells have been drilled, which could produce the reserves; while undeveloped acres are those on which wells have not been drilled or completed to a point that would permit the production of commercial quantities, whether or not such acres contain proved reserves.
| Europe | North America | South America | Africa | Asia | Australasia | Totala | |||||||||||||||||||||||||||||
| UK | Rest of Europe | US | Rest of North America | ||||||||||||||||||||||||||||||||
| Number of productive wells at 31 December 2023 | |||||||||||||||||||||||||||||||||||
Oil wellsb | – gross | 114 | 123 | 1,390 | 8 | 5,367 | 864 | 2,979 | — | 10,845 | |||||||||||||||||||||||||
| – net | 65 | 20 | 736 | 2 | 2,644 | 79 | 619 | — | 4,166 | ||||||||||||||||||||||||||
Gas wellsc | – gross | 36 | 10 | 4,681 | — | 1,184 | 91 | 172 | 100 | 6,274 | |||||||||||||||||||||||||
| – net | 8 | 2 | 2,520 | — | 413 | 42 | 65 | 23 | 3,073 | ||||||||||||||||||||||||||
| Oil and natural gas acreage at 31 December 2023 | thousands of acres | ||||||||||||||||||||||||||||||||||
| Developed | – gross | 71 | 82 | 1,903 | 8 | 1,330 | 690 | 1,334 | 838 | 6,255 | |||||||||||||||||||||||||
| – net | 41 | 13 | 1,024 | 1 | 381 | 120 | 277 | 157 | 2,014 | ||||||||||||||||||||||||||
Undevelopedd | – gross | 561 | 333 | 3,900 | 11,011 | 9,402 | 18,538 | 5,604 | 9,660 | 59,010 | |||||||||||||||||||||||||
| – net | 410 | 53 | 3,320 | 6,966 | 4,193 | 8,631 | 1,743 | 6,676 | 31,991 | ||||||||||||||||||||||||||
aBecause of rounding, some totals may not exactly agree with the sum of their component parts.
bIncludes approximately 166 gross (32 net) multiple completion wells (more than one formation producing into the same well bore).
cIncludes approximately 116 gross (94 net) multiple completion wells. If one of the multiple completions in a well is an oil completion, the well is classified as an oil well.
dUndeveloped acreage includes leases and concessions.
Net oil and gas wells completed or abandoned
The following table shows the number of net productive and dry exploratory and development oil and natural gas wells completed or abandoned in the years indicated by the group and its equity-accounted entities. Productive wells include wells in which hydrocarbons were encountered and the drilling or completion of which, in the case of exploratory wells, has been suspended pending further drilling or evaluation. A dry well is one found to be incapable of producing hydrocarbons in sufficient quantities to justify completion.
| Europe | North America | South America | Africa | Asia | Australasia | Totala | |||||||||||||||||||||||||||||
| UK | Rest of Europe | US | Rest of North America | Russia | Rest of Asia | ||||||||||||||||||||||||||||||
| 2023 | |||||||||||||||||||||||||||||||||||
| Exploratory | |||||||||||||||||||||||||||||||||||
Productive | — | — | 2.0 | — | — | — | — | 0.8 | 0.4 | 3.2 | |||||||||||||||||||||||||
Dry | 0.5 | — | 0.8 | 0.5 | — | — | — | 0.2 | — | 2.0 | |||||||||||||||||||||||||
| Development | |||||||||||||||||||||||||||||||||||
Productive | 2.6 | 0.6 | 141.9 | 0.1 | 6.2 | 4.2 | — | 39.7 | 0.4 | 195.6 | |||||||||||||||||||||||||
Dry | — | — | — | — | — | — | — | 0.4 | — | 0.4 | |||||||||||||||||||||||||
| 2022 | |||||||||||||||||||||||||||||||||||
| Exploratory | |||||||||||||||||||||||||||||||||||
Productive | — | — | 0.5 | 1.0 | 1.0 | 0.6 | — | 0.5 | 0.3 | 4.0 | |||||||||||||||||||||||||
Dry | — | — | — | 1.2 | 0.3 | 0.1 | — | 0.8 | — | 2.3 | |||||||||||||||||||||||||
| Development | |||||||||||||||||||||||||||||||||||
Productive | 0.9 | 1.5 | 137.2 | 0.3 | 71.4 | 2.8 | — | 39.0 | 1.4 | 254.5 | |||||||||||||||||||||||||
Dry | — | — | 1.1 | — | 0.5 | 0.1 | — | 1.1 | — | 2.8 | |||||||||||||||||||||||||
| 2021 | |||||||||||||||||||||||||||||||||||
| Exploratory | |||||||||||||||||||||||||||||||||||
Productive | — | — | 0.2 | — | 1.1 | 1.4 | 16.3 | 1.2 | — | 20.2 | |||||||||||||||||||||||||
Dry | — | — | 0.6 | — | — | 1.4 | — | 0.3 | 0.4 | 2.7 | |||||||||||||||||||||||||
| Development | |||||||||||||||||||||||||||||||||||
Productive | 2.4 | 0.6 | 107.2 | 0.8 | 69.4 | 2.5 | 285.2 | 27.3 | 1.3 | 496.6 | |||||||||||||||||||||||||
Dry | — | 0.1 | 7.3 | — | 0.7 | — | — | 0.1 | — | 8.2 | |||||||||||||||||||||||||
aBecause of rounding, some totals may not exactly agree with the sum of their component parts.
| bp Annual Report and Form 20-F 2023 | 273 | |||||||||||||
Operational and statistical information – continued
Drilling and production activities in progress
The following table shows the number of exploratory and development oil and natural gas wells in the process of being drilled by the group and its equity-accounted entities as of 31 December 2023. Suspended development wells and long-term suspended exploratory wells are also included in the table.
| Europe | North America | South America | Africa | Asia | Australasia | Totala | ||||||||||||||||||||||||||
| UK | Rest of Europe | US | Rest of North America | |||||||||||||||||||||||||||||
| At 31 December 2023 | ||||||||||||||||||||||||||||||||
| Exploratory | ||||||||||||||||||||||||||||||||
Gross | — | — | — | — | — | 1.0 | 10.0 | — | 11.0 | |||||||||||||||||||||||
Net | — | — | — | — | — | 0.1 | 1.9 | — | 2.0 | |||||||||||||||||||||||
| Development | ||||||||||||||||||||||||||||||||
Gross | 5.0 | 3.1 | 161.0 | — | 25.0 | 9.0 | 97.0 | 1.0 | 301.1 | |||||||||||||||||||||||
Net | 3.1 | 0.5 | 118.7 | — | 4.6 | 3.1 | 18.9 | 0.4 | 149.3 | |||||||||||||||||||||||
a Because of rounding, some totals may not exactly agree with the sum of their component parts.
274 | bp Annual Report and Form 20-F 2023 | |||||||||||||
| Financial statements | |||||
Pages 275-334 have been removed as they do not form part of bp's Annual Report on Form 20-F as filed with the SEC.
| bp Annual Report and Form 20-F 2023 | 275 | |||||||||||||
THIS PAGE HAS BEEN LEFT BLANK INTENTIONALLY
276 | bp Annual Report and Form 20-F 2023 | |||||||||||||
| Additional disclosures | ||
| Additional disclosures | ||||||||||||||
| Additional information | ||||||||||||||
| Liquidity and capital resources | ||||||||||||||
| Oil and gas disclosures for the group | ||||||||||||||
| Additional information for customers & products | ||||||||||||||
| Environmental expenditure | ||||||||||||||
| Regulation of the group’s business | ||||||||||||||
| International trade sanctions | ||||||||||||||
| Material contracts | ||||||||||||||
| Property, plant and equipment | ||||||||||||||
| Related party transactions | ||||||||||||||
| Corporate governance practices | ||||||||||||||
| Code of ethics | ||||||||||||||
| Controls and procedures | ||||||||||||||
| Cyber security | ||||||||||||||
| Principal accountant’s fees and services | ||||||||||||||
| Additional Directors’ report disclosures | ||||||||||||||
| Disclosures required under Listing Rule 9.8.4R | ||||||||||||||
| Cautionary statement | ||||||||||||||
« See glossary on page 373 | bp Annual Report and Form 20-F 2023 | 335 | ||||||||||||
Additional information
Capital expenditure«
| $ million | ||||||||||||||
| 2023 | 2022 | 2021 | ||||||||||||
| Capital expenditure | ||||||||||||||
Organic capital expenditure« | 14,998 | 12,470 | 11,779 | |||||||||||
Inorganic capital expenditureabc« | 1,255 | 3,860 | 1,069 | |||||||||||
| 16,253 | 16,330 | 12,848 | ||||||||||||
| Capital expenditure by segment | ||||||||||||||
gas & low carbon energyc | 4,281 | 4,251 | 4,741 | |||||||||||
| oil production & operations | 6,278 | 5,278 | 4,838 | |||||||||||
customers & productsab | 5,253 | 6,252 | 2,872 | |||||||||||
| other businesses & corporate | 441 | 549 | 397 | |||||||||||
| 16,253 | 16,330 | 12,848 | ||||||||||||
| Capital expenditure by geographical area | ||||||||||||||
| US | 8,105 | 8,656 | 4,858 | |||||||||||
| Non-US | 8,148 | 7,674 | 7,990 | |||||||||||
| 16,253 | 16,330 | 12,848 | ||||||||||||
a2023 includes $1.1 billion in respect of the TravelCenters of America acquisition.
b2022 includes $3,030 million in respect of the Archaea Energy acquisition.
c2021 includes the final payment of $712 million in respect of the strategic partnership with Equinor.
336 | bp Annual Report and Form 20-F 2023 | |||||||||||||
| Additional disclosures | ||
Adjusting items
Adjusting items are items that bp discloses separately because it considers such disclosures to be meaningful and relevant to investors. They are items that management considers to be important to period-on-period analysis of the group's results and are disclosed in order to enable investors to better understand and evaluate the group’s reported financial performance. An analysis of adjusting items is shown in the table below.
| $ million | ||||||||||||||
| 2023 | 2022 | 2021 | ||||||||||||
| gas & low carbon energy | ||||||||||||||
Gain on sale of businesses and fixed assetsa | 19 | 45 | 1,034 | |||||||||||
Net impairment and losses on sale of businesses and fixed assetsa | (2,221) | 588 | 1,503 | |||||||||||
| Environmental and other provisions | — | — | — | |||||||||||
Restructuring, integration and rationalization costsb | — | 8 | (33) | |||||||||||
Fair value accounting effectscd« | 8,859 | (1,811) | (7,662) | |||||||||||
Othere | (1,299) | (197) | (237) | |||||||||||
| 5,358 | (1,367) | (5,395) | ||||||||||||
| oil production & operations | ||||||||||||||
Gain on sale of businesses and fixed assetsa | 297 | 3,446 | 869 | |||||||||||
Net impairment and losses on sale of businesses and fixed assetsa | (1,819) | (4,508) | 776 | |||||||||||
Environmental and other provisionsf | 54 | 518 | (1,144) | |||||||||||
Restructuring, integration and rationalization costsb | (1) | (11) | (92) | |||||||||||
| Fair value accounting effects | — | — | — | |||||||||||
Otherg | (121) | 52 | (200) | |||||||||||
| (1,590) | (503) | 209 | ||||||||||||
| customers & products | ||||||||||||||
Gain on sale of businesses and fixed assetsa | 44 | 374 | (52) | |||||||||||
Net impairment and losses on sale of businesses and fixed assetsa | (1,757) | (1,983) | (1,097) | |||||||||||
| Environmental and other provisions | (97) | (101) | (111) | |||||||||||
Restructuring, integration and rationalization costsb | — | 18 | (11) | |||||||||||
Fair value accounting effectsd | (86) | (309) | 436 | |||||||||||
Otherh | (287) | 81 | (209) | |||||||||||
| (2,183) | (1,920) | (1,044) | ||||||||||||
| other businesses & corporate | ||||||||||||||
Gain on sale of businesses and fixed assetsa | 1 | 1 | — | |||||||||||
Net impairment and losses on sale of businesses and fixed assetsa | (41) | (17) | (59) | |||||||||||
Environmental and other provisionsi | (604) | (92) | (281) | |||||||||||
Restructuring, integration and rationalization costsb | 38 | 19 | (113) | |||||||||||
Fair value accounting effectsd | 630 | (1,381) | (849) | |||||||||||
Rosneftj | — | (24,033) | (291) | |||||||||||
| Gulf of Mexico oil spill | (57) | (84) | (70) | |||||||||||
| Other | (4) | 21 | (22) | |||||||||||
| (37) | (25,566) | (1,685) | ||||||||||||
| Total before interest and taxation | 1,548 | (29,356) | (7,915) | |||||||||||
Finance costsk | (405) | (425) | (782) | |||||||||||
| Total before taxation | 1,143 | (29,781) | (8,697) | |||||||||||
Taxation on adjusting itemsl | 972 | 456 | 621 | |||||||||||
Taxation - tax rate change effect of UK energy profits levym | 232 | (1,834) | — | |||||||||||
Total after taxationn | 2,347 | (31,159) | (8,076) | |||||||||||
aSee Financial statements – Note 4 for further information.
bRestructuring charges are classified as adjusting items where they relate to an announced major group restructuring. A major group restructuring is a restructuring programme affecting more than one of the group’s operating segments that is expected to result in charges of more than $1 billion over a defined period. 2022 includes release of provisions for the reinvent bp restructuring costs. 2021 includes recognized provisions for the reinvent bp restructuring costs that were formalized in 2020.
cUnder IFRS bp marks-to-market the value of the hedges used to risk-manage LNG contracts, but not the contracts themselves, resulting in a mismatch in accounting treatment. The fair value accounting effect includes the change in value of LNG contracts that are being risk managed, and the underlying result reflects how bp risk-manages its LNG contracts.
dFor further information, including the nature of fair value accounting effects reported in each segment, see page 377.
e2023 includes $1,140 million of impairment charges recognized through equity-accounted earnings relating to our US offshore wind projects.
f2022 includes a provision reversal relating to the change in discount rate on retained decommissioning provisions. 2021 includes adjustments relating to the change in discount rate on retained decommissioning provisions and the recognition of a decommissioning provision in relation to certain assets previously sold to a third party where the decommissioning obligation transferred may revert to bp due to the financial condition of the current owner.
g2021 includes a $415 million charge relating to a remeasurement of deferred tax balances in our equity-accounted entity in Argentina following income tax rate changes partially offset by impairment reversals in equity-accounted entities.
h2021 includes amounts arising in relation to the amendment of the timing of recognition of certain customer incentives in our customers business.
i2023 primarily relates to charges related to the control, abatement, clean-up or elimination of environmental pollution and legal settlements. 2022 and 2021 primarily reflect charges due to the annual update of environmental provisions, including asbestos-related provisions for past operations, together with updates of non-Gulf of Mexico oil spill related legal provisions.
jFor more information see Financial statements – Note 1 Significant accounting policies, judgements, estimates and assumptions – Investment in Rosneft and Note 17 – Investments in associates.
kIncludes the unwinding of discounting effects relating to Gulf of Mexico oil spill payables, the income statement impact associated with the buyback of finance debt (see Financial statements – Note 26 for further information) and temporary valuation differences associated with the group's interest rate and foreign currency exchange risk management of finance debt.
lIncludes certain foreign exchange effects on tax as adjusting items. These amounts represent the impact of: (i) foreign exchange on deferred tax balances arising from the conversion of local currency tax base amounts into functional currency; and (ii) taxable gains and losses from the retranslation of US dollar-denominated intra-group loans to local currency.
m2023 includes a revision to the deferred tax impact of the introduction of the UK Energy Profits Levy (EPL) on temporary differences existing at 31 December 2022 that are expected to unwind over the period 1 January 2023 to 31 March 2028. 2022 includes the deferred tax impact of the introduction of the EPL. The EPL increases the headline rate of tax to 75% and applies to taxable profits from bp’s North Sea business made from 1 January 2023 until 31 March 2028. On 6 March 2024 the UK government announced an extension of the EPL to 31 March 2029. This has not yet been substantively enacted.
n2023 and 2022 include a $146-million charge and a $505-million charge respectively for the EU Solidarity Contribution.
« See glossary on page 373 | bp Annual Report and Form 20-F 2023 | 337 | ||||||||||||
Non-IFRS information on fair value accounting effects
The impacts of fair value accounting effects, relative to management’s internal measure of performance, are set out below. Further information on fair value accounting effects is provided on page 377.
| $ million | ||||||||||||||
| 2023 | 2022 | 2021 | ||||||||||||
| gas & low carbon energy | ||||||||||||||
| Unrecognized (gains) losses brought forward from previous period | (9,960) | (8,149) | (485) | |||||||||||
| Favourable (adverse) impact relative to management’s measure of performance | 8,859 | (1,811) | (7,662) | |||||||||||
| Exchange translation gains (losses) on fair value accounting effects | (24) | — | (2) | |||||||||||
| Unrecognized (gains) losses carried forward | (1,125) | (9,960) | (8,149) | |||||||||||
| customers & products | ||||||||||||||
| Unrecognized (gains) losses brought forward from previous period | 79 | 391 | (45) | |||||||||||
| Favourable (adverse) impact relative to management’s measure of performance | (86) | (309) | 436 | |||||||||||
Exchange translation gains (losses) on fair value accounting effects | (10) | (3) | — | |||||||||||
| Unrecognized (gains) losses carried forward | (17) | 79 | 391 | |||||||||||
| other businesses & corporate | ||||||||||||||
| Unrecognized (gains) losses brought forward from previous period | (1,555) | (174) | 675 | |||||||||||
Favourable (adverse) impact relative to management’s measure of performancea | 630 | (1,381) | (849) | |||||||||||
| Unrecognized (gains) losses carried forward | (925) | (1,555) | (174) | |||||||||||
| Group | ||||||||||||||
| Unrecognized (gains) losses brought forward from previous period | (11,436) | (7,932) | 145 | |||||||||||
| Favourable (adverse) impact relative to management’s measure of performance | 9,403 | (3,501) | (8,075) | |||||||||||
| Exchange translation gains (losses) on fair value accounting effects | (34) | (3) | (2) | |||||||||||
| Unrecognized (gains) losses carried forward | (2,067) | (11,436) | (7,932) | |||||||||||
| Favourable (adverse) impact relative to management’s measure of performance – by region | ||||||||||||||
| gas & low carbon energy | ||||||||||||||
| US | 900 | (1,140) | (92) | |||||||||||
| Non-US | 7,959 | (671) | (7,570) | |||||||||||
| 8,859 | (1,811) | (7,662) | ||||||||||||
| customers & products | ||||||||||||||
| US | (18) | 3 | 105 | |||||||||||
| Non-US | (68) | (312) | 331 | |||||||||||
| (86) | (309) | 436 | ||||||||||||
| other businesses & corporate | ||||||||||||||
| US | — | — | — | |||||||||||
| Non-US | 630 | (1,381) | (849) | |||||||||||
| 630 | (1,381) | (849) | ||||||||||||
| 9,403 | (3,501) | (8,075) | ||||||||||||
| Taxation credit (charge) | (915) | 434 | 862 | |||||||||||
| 8,488 | (3,067) | (7,213) | ||||||||||||
a Includes changes in the fair value of derivatives entered into by the group to manage currency exposure and interest rate risks relating to hybrid bonds to their respective first call periods. For further information see page 377.
338 | bp Annual Report and Form 20-F 2023 | |||||||||||||
| Additional disclosures | ||
Net debt including leases
Net debt including leases« is shown in the table below.
| $ million | |||||||||||
| At 31 December | 2023 | 2022 | |||||||||
Net debta« | 20,912 | 21,422 | |||||||||
| Lease liabilities | 11,121 | 8,549 | |||||||||
Net partner (receivable) payable for leases entered into on behalf of joint operations« | (131) | 19 | |||||||||
| Net debt including leases | 31,902 | 29,990 | |||||||||
| Total equity | 85,493 | 82,990 | |||||||||
Gearing including leases« | 27.2% | 26.5% | |||||||||
a See Financial statements – Note 27 for a reconciliation of net debt to finance debt, which is the nearest equivalent measure to net debt on an IFRS basis.
Surplus cash flow« components
| $ million | ||||||||||||||
| 2023 | 2022 | 2021 | ||||||||||||
| Sources: | ||||||||||||||
| Net cash provided by operating activities | 32,039 | 40,932 | 23,612 | |||||||||||
| Cash provided from investing activities | 1,381 | 2,617 | 7,154 | |||||||||||
Othera | 324 | 360 | 589 | |||||||||||
| 33,744 | 43,909 | 31,355 | ||||||||||||
| Uses: | ||||||||||||||
| Lease liability payments | (2,560) | (1,961) | (2,082) | |||||||||||
| Payments on perpetual hybrid bonds | (1,008) | (708) | (538) | |||||||||||
Dividends paid – bp shareholders | (4,809) | (4,358) | (4,304) | |||||||||||
– non-controlling interests | (403) | (294) | (311) | |||||||||||
Total capital expenditure« | (16,253) | (16,330) | (12,848) | |||||||||||
| Net repurchase of shares relating to employee share schemes | (675) | (500) | (500) | |||||||||||
| Payments relating to transactions involving non-controlling interests | (187) | (9) | (560) | |||||||||||
| Currency translation differences relating to cash and cash equivalents | 27 | (684) | (269) | |||||||||||
| (25,868) | (24,844) | (21,412) | ||||||||||||
a Other includes adjustments for net operating cash received or paid which is held on behalf of third parties for medium-term deferred payment and prior periods have been adjusted accordingly. 2023 includes $517 million of proceeds from the sale of a 49% interest in a controlled affiliate holding certain midstream assets onshore US. Other proceeds for 2022 include $573 million of proceeds from the disposal of a loan note related to the Alaska divestment. The cash was received in the fourth quarter 2021, was reported as a financing cash flow and was not included in other proceeds at the time due to potential recourse from the counterparty. The proceeds were recognized as the potential recourse reduces and by end second quarter 2022 all were recognized.
« See glossary on page 373 | bp Annual Report and Form 20-F 2023 | 339 | ||||||||||||
Liquidity and capital resources
Financial framework
bp has a resilient financial framework that, taken together with our strategy, creates a compelling investor proposition offering committed distributions, profitable growth and sustainable value. The framework comprises a coherent approach to capital allocation, a resilient balance sheet, a disciplined approach to investment allocation and a relentless focus on executing bp’s business plan.
bp’s approach to capital allocation leads to a clear set of priorities – funding our resilient dividend as the first priority, maintaining a strong investment grade credit rating, disciplined investment in our transition growth« engines to advance our energy transition strategy and investment in oil, gas, refining and other businesses, and then returning surplus cash flow« as share buybacks. In a period of low prices, the group has the flexibility to reduce cash costs and to reduce or defer capital investment, as appropriate.
Our shareholder distribution policy reflects these priorities for the uses of cash alongside an ongoing consideration of factors, including changes in the environment, the underlying performance of the business, the outlook for the group financial framework, and other market factors which may vary quarter to quarter.
Net debt« at 31 December 2023 was $20.9 billion and is expected to reduce in line with the growth in operating cash flow«. As at 31 December 2023 our target of $25 billion of divestment and other proceeds between the second half of 2020 and 2025 was underpinned by agreed or completed transactions of around $18.5 billion with $17.8 billion of proceeds received.
We expect operating cash flow to cover capital expenditure« and the dividend. Capital expenditure in 2023 was $16.3 billion, including $1.3 billion of inorganic capital expenditure«. bp expects capital expenditure of around $16 billion through 2024 and 2025 and expects a range of $14-18 billion per annum through 2030 including inorganic expenditure. bp's cash balancing point is expected to average around $40 per barrel Brent (assuming an average refining marker margin of around $11 per barrel and Henry Hub gas price at $3 per mmBtu) in 2021 real terms.
In 2023, the return on average capital employed« was 18.1%a at an average of $83 per barrel. The return on average capital employed is targeted to be over 18% by 2025 at $70 per barrel in 2021 real terms, and assuming bp planning assumptions, as we continue to execute our strategy. This is supported by an expected growth on adjusted EBIDA per share compound annual growth rate« from the second half 2019/first half 2020b to 2025 and subject to the same price and planning assumptions.
aNearest equivalent IFRS measures of numerator and denominator are profit for the year attributable to bp shareholders and total equity respectively: Profit for the year attributable to bp shareholders divided by total equity at the end of 2023 17.8%.
bAdjusted to exclude Rosneft.
Dividends and other distributions to shareholders
The dividend is determined in US dollars, the economic currency of bp, and the dividend level is reviewed by the board each quarter. The quarterly dividend was increased from 6.610 to 7.270 cents per ordinary share per quarter in the second quarter of 2023.
The total dividend distributed to bp shareholders in 2023 was $4.8 billion (2022 $4.4 billion). This dividend was all paid in cash as shareholders no longer have the option to receive a scrip dividend in place of receiving cash.
Included in the distribution policy is a commitment that, subject to maintaining a strong investment grade credit rating, at least 80% of surplus cash flow on a point forward basis will be distributed to shareholders through share buybacks. In 2023 bp executed $7.9 billion of share buybacks (2022 $10.0 billion), including fees and stamp duty. Since 1 January 2024 an additional $0.9 billion shares have been repurchased up to 16 February 2024, including fees and stamp duty. Based on bp’s current forecasts, at around $60 per barrel Brent and subject to the board’s discretion each quarter, bp expects to have capacity for an annual increase in the dividend per ordinary share of around 4%. Based on current market conditions bp plans share buybacks of at least $14 billion through 2025. In setting the dividend and share buybacks each quarter, the board will continue to take into account factors including the cumulative level of and
outlook for surplus cash flow, the cash balance point« and the maintenance of a strong investment grade credit rating.
Financing the group’s activities
The group’s principal commodities, oil and gas, are priced internationally in US dollars. Group policy has generally been to minimize economic exposure to currency movements by financing operations with US dollar debt. Where debt and hybrid bonds are issued in other currencies, they are generally swapped back to US dollars using derivative contracts, or else hedged by maintaining offsetting cash positions in the same currency. Cash balances of the group are mainly held in US dollars or swapped to US dollars and holdings are well diversified to reduce concentration risk. The group is not, therefore, exposed to significant currency risk regarding its cash or borrowings. Also see Risk factors on page 77 for further information on risks associated with prices and markets and Financial statements – Note 29.
The group’s finance debt at 31 December 2023 amounted to $52.0 billion (2022 $46.9 billion). Of the total finance debt, $3.3 billion is classified as short term at the end of 2023 (2022 $3.2 billion). See Financial statements – Note 26 for more information on the short-term balance. Net debt« was $20.9 billion at the end of 2023, a decrease of $0.5 billion from the 2022 year-end position of $21.4 billion. BP p.l.c. fully and unconditionally guarantees securities issued by BP Capital Markets p.l.c. and BP Capital Markets America Inc. which are 100%-owned finance subsidiaries of BP p.l.c.
At 31 December 2023 the group held a balance of $13.6 billion (2022 $13.4 billion) issued perpetual subordinated hybrid bonds, of which $1.5 billion (2022 $1.3 billion) were issued to fund one of the group's major projects. As the group has the unconditional right to avoid transfer of cash or another financial asset in relation to these hybrid bonds, which were issued by group subsidiaries, they are classified as equity instruments and reported within non-controlling interest.
The ratio of finance debt to finance debt plus total equity at 31 December 2023 was 37.8% (2022 36.1%). Gearing was 19.7% at the end of 2023 (2022 20.5%). See Financial statements – Note 27 for finance debt, which is the nearest equivalent measure on an IFRS basis, and for further information on net debt.
Cash and cash equivalents of $33.0 billion at 31 December 2023 (2022 $29.2 billion) are included in net debt. We manage our cash position so that the group has adequate cover to respond to potential short-term market liquidity, short-term price environment volatility and expect to maintain a robust cash position.
The group also has an undrawn committed $8 billion credit facility and undrawn committed bank facilities of $4 billion (see Financial statements – Note 29 for more information).
We believe that the group's resilient balance sheet and strong investment grade credit rating will allow the group to meet its known contractual and other obligations in both the short and long term with the group having sufficient working capital, taking into account the amounts of undrawn borrowings facilities, access to capital markets, levels of cash and cash equivalents and its ongoing ability to generate cash through operations. This belief is subject to a degree of uncertainty that can be expected to increase looking out over time and, accordingly, that future outcomes cannot be guaranteed or predicted with certainty.
bp utilizes various arrangements in order to manage its working capital including discounting of receivables and, in the supply and trading business, the active management of supplier payment terms, inventory and collateral.
Standard & Poor’s Ratings’ long-term credit rating for BP p.l.c. is A- (positive), the Moody’s Investors Service rating is A2 (positive) and the Fitch Ratings’ long-term credit rating is A+ (stable).
The group’s sources of funding, its access to capital markets and maintaining a strong cash position are described in Financial statements – Note 25 and Note 29. Further information on the management of liquidity risk and credit risk, and the maturity profile and fixed/floating rate characteristics of the group’s debt are also provided in Financial statements – Note 26 and Note 29.
The information above contains forward-looking statements, which by their nature involve risk and uncertainty because they relate to events and depend on circumstances that will or may occur in the future and are outside the control of bp.
340 | bp Annual Report and Form 20-F 2023 | |||||||||||||
| Additional disclosures | ||
You are urged to read the Cautionary statement on page 361 and Risk factors on page 77, which describe the risks and uncertainties that may cause actual results and developments to differ materially from those expressed or implied by these forward-looking statements.
Off-balance sheet arrangements
At 31 December 2023, the group’s share of third-party finance debt of equity-accounted entities was $9.9 billion (2022 $8.8 billion). These amounts are not reflected in the group’s debt on the balance sheet. The group has issued third-party guarantees under which amounts outstanding, incremental to amounts recognized on the balance sheet, at 31 December 2023 were $1,655 million (2022 $1,704 million) in respect of liabilities of joint ventures« and associates« and $598 million (2022 $680 million) in respect of liabilities of other third parties. Of these amounts, $1,609 million (2022 $1,701 million) of the joint ventures and associates guarantees relate to borrowings and, for other third-party guarantees, $527 million (2022 $557 million) relate to guarantees of borrowings.
Contractual obligations
The following table summarizes the group’s capital expenditure commitments for property, plant and equipment at 31 December 2023 and the proportion of that expenditure for which contracts have been placed.
| $ million | ||||||||||||||
| Payments due by period | ||||||||||||||
| Capital expenditure | Less than 1 year | More than 1 year | Total | |||||||||||
| Committed | 12,890 | 9,648 | 22,538 | |||||||||||
| of which is contracted | 6,962 | 3,392 | 10,354 | |||||||||||
Capital expenditure is considered to be committed when the project has received the appropriate level of internal management approval. For joint operations«, the net bp share is included in the amounts above.
In addition, at 31 December 2023, the group had committed to capital expenditure relating to investments in equity-accounted entities amounting to $3,120 million. Contracts were in place for $1,685 million of this total.
The following table summarizes the group’s principal contractual obligations at 31 December 2023, distinguishing between those for which a liability is recognized on the balance sheet and those for which no liability is recognized. See Financial framework above for bp’s approach to capital allocation and Financing the group’s activities above for bp’s plan and ability to generate and obtain cash in the short and long term. Also see Financial statements – Note 23 for more information on provisions, Note 24 on pensions and other post-retirement benefits, Note 26 on borrowings, Note 28 on leases, Note 29 and Note 30 on derivatives and financial instruments.
| $ million | ||||||||||||||
| Payments due by period | ||||||||||||||
| Expected payments by period under contractual obligations | Less than 1 year | More than 1 year | Total | |||||||||||
| Balance sheet obligations | ||||||||||||||
Borrowingsa | 5,448 | 66,161 | 71,609 | |||||||||||
Lease liabilitiesb | 3,038 | 10,042 | 13,080 | |||||||||||
Decommissioning liabilitiesc | 674 | 23,332 | 24,006 | |||||||||||
Environmental liabilitiesc | 352 | 1,626 | 1,978 | |||||||||||
Gulf of Mexico oil spill liabilitiesd | 1,142 | 9,520 | 10,662 | |||||||||||
Pensions and other post-retirement benefitse | 577 | 12,686 | 13,263 | |||||||||||
| 11,231 | 123,367 | 134,598 | ||||||||||||
| Off-balance sheet obligations | ||||||||||||||
Unconditional purchase obligationsf | ||||||||||||||
| Crude oil and oil products | 49,754 | 8,953 | 58,707 | |||||||||||
| Natural gas and LNG | 13,394 | 52,974 | 66,368 | |||||||||||
| Chemicals and other refinery feedstocks | 540 | 78 | 618 | |||||||||||
| Power | 5,075 | 13,514 | 18,589 | |||||||||||
| Utilities | 58 | 417 | 475 | |||||||||||
| Transportation | 2,153 | 14,764 | 16,917 | |||||||||||
| Use of facilities and services | 2,816 | 20,894 | 23,710 | |||||||||||
| 73,790 | 111,594 | 185,384 | ||||||||||||
| Total | 85,021 | 234,961 | 319,982 | |||||||||||
aExpected payments include interest totalling $21,298 million (less than 1 year $2,394 million, more than 1 year $18,904 million).
bExpected payments include interest totalling $1,961 million (less than 1 year $380 million, more than 1 year $1,581 million).
cThe amounts presented are undiscounted.
dThe amounts presented are undiscounted. Gulf of Mexico oil spill liabilities are included in the group balance sheet, on a discounted basis, within other payables. See Financial statements – Note 22 for further information.
eRepresents the expected future contributions to funded pension plans and payments by the group for unfunded pension plans and the expected future payments for other post-retirement benefits.
fRepresents any agreement to purchase goods or services that is enforceable and legally binding and that specifies all significant terms (such as fixed or minimum purchase volumes, timing of purchase and pricing provisions). Agreements that do not specify all significant terms, or that are not enforceable, are excluded. The amounts shown include arrangements to secure long-term access to supplies of crude oil, natural gas, feedstocks and pipeline systems. In addition, the amounts shown for 2024 include purchase commitments existing at 31 December 2023 entered into principally to meet the group’s short-term manufacturing and marketing requirements. The price risk associated with these crude oil, natural gas and power contracts is discussed in Financial statements – Note 29.
Commitments for the delivery of oil and gas
We sell crude oil, natural gas and liquefied natural gas under a variety of contractual obligations. Some of these contracts specify the delivery of fixed and determinable quantities. For the period from 2024 to 2026 worldwide, we are contractually committed to deliver approximately 291 million barrels of oil, 7,586 billion cubic feet of natural gas, and 73 million tonnes of liquefied natural gas. The commitments principally relate to group subsidiaries« based in Egypt, Singapore, Trinidad and Tobago, the UK and the US. We expect to fulfil these delivery commitments with production from our proved developed reserves and supplies from existing contracts, supplemented by market purchases as necessary.
« See glossary on page 373 | bp Annual Report and Form 20-F 2023 | 341 | ||||||||||||
Oil and gas disclosures for the group
Analysis by region
Our oil and gas operations are set out below by geographical area, with associated significant events for 2023. bp’s percentage working interest in oil and gas assets is shown in brackets. Working interest is the cost-bearing ownership share of an oil or gas lease. Consequently, the percentages disclosed for certain agreements do not necessarily reflect the percentage interests in proved reserves, production or revenue.
In addition to exploration, development and production activities, our oil production & operations (OP&O) and gas businesses also include certain midstream and liquefied natural gas (LNG) supply activities. Midstream activities involve the management of crude oil and natural gas pipelines, processing facilities and export terminals, LNG processing facilities and transportation, and our natural gas liquids (NGLs) processing business.
Our upstream LNG activities are located in Abu Dhabi, Angola, Australia, Indonesia, and Trinidad. In 2023 our production was 8.5 million tonnes of LNG from these assets, of which 2 million tonnes were marketed through trading and shipping (T&S), which supplements equity production with merchant third party volumes leading to a global long-term strategic LNG portfolio of 23mtpa. In addition to the long-term equity and merchant supply portfolio, bp has delivered 10mtpa in 2023 of incremental merchant volumes through short and mid-term cargos managed through the T&S LNG business. These supplement the long-term portfolio and allow generation of short-term value when opportunities exist.
The LNG is marketed through contractual rights to access import terminal capacity into the liquid gas markets of Europe, and the UK, and relationships to market directly to end-user customers or trading entities. LNG is supplied to all major LNG demand centres, for example Argentina, Brazil, the Caribbean, China, Croatia, Mediterranean, Iberia and North West Europe, India, Japan, Singapore, South Korea, Taiwan, Thailand, Türkiye and the UK.
Europe
bp is active in offshore oil and gas in the UK and Norway. In 2023 bp’s UK production came from two key areas: the Shetland area comprising the Clair and Schiehallion fields; and the central area comprising the Andrew area, Culzean, Vorlich and ETAP fields. In Norway, production was through our equity-accounted 15.9% interest in Aker BP.
•On 28 June the Norwegian Ministry of Petroleum and Energy approved a total of nine plans for development and operation to Aker BP (bp 15.9%), with estimated recoverable reserves to be above 700 million barrels of oil equivalent (mmboe). As per the public announcement the Norwegian government’s approval of two of the developments remain subject to legal challenge in Norway.
•In September bp and its co-venturers in the Clair joint venture made the final investment decision to proceed with the construction and operation of the Shetland Crossover Pipeline, reinforcing the gas export network and supporting UK security of supply (bp 45% operator).
•In October the first of two wells for the Murlach oil and gas field in the UK North Sea were spudded, following regulatory approval of the field development plan in September (bp 80% operator).
•In October bp successfully started production from the Seagull oil and gas field in the UK North Sea. This is the first tieback to the ETAP hub in 20 years. The new field is expected to produce around 50 thousand barrels of oil equivalent (mboe) gross per day at peak production.
•During the year an impairment charge of $0.9 billion was recognized in respect of certain assets in the North Sea as a result of changes to the group's oil and gas price and discount rate assumptions and activity phasing.
North America
Our oil and gas activities in North America are located in four areas: deepwater Gulf of Mexico, the Lower 48 states, Canada and Mexico.
bp has around 280 lease blocks in the Gulf of Mexico and operates four production hubs.
•During the year bp has been awarded 36 lease blocks in the Gulf of Mexico lease sale 259, which includes 22 leases that may provide options to further enhance our resource positions at Kaskida and Tiber. bp also moved forward with progression of the Kaskida project, bp's first
20K development in the Paleogene, and progresses on concept selection for bp-operated Tiber development project in the Gulf of Mexico.
•In April bp announced start-up of the Mad Dog Phase 2 Argos platform (bp 60.5% operator). With a gross production capacity of up to 140mboe/d, Argos is bp’s fifth platform in the Gulf of Mexico.
•Following a successful appraisal well in the southwest part of the Mad Dog field, bp sanctioned the Argos Southwest Expansion project to tie back into the Argos facility.
•bp was the apparent high bidder on 24 leases in the Gulf of Mexico Lease Sale 261 that took place on 20 December 2023.
•In December partners approved the expansion of the Shell-operated Great White development in the Gulf of Mexico through a phased three-well campaign (bp 33.33%).
bpx energy, bp's onshore oil and gas business in the Lower 48 states, has significant operated and non-operated activities across Louisiana and Texas producing natural gas, oil, NGLs and condensate, with primary focus on developing unconventional resources. It had a 1.6 billion boe proved reserve base at 31 December 2023, predominantly in unconventional reservoirs (tight gas«, shale gas and shale oil). bpx energy's core assets span 0.9 million net developed acres with nearly 2,000 operated gross wells at 31 December 2023. Daily net production averaged 366mboe/d in 2023.
bpx energy continues to operate as a separate business while remaining part of the OP&O segment. With its own governance, systems, and processes, it is structured to increase competitive performance through swift decision making and innovation, while maintaining bp’s commitment to safe, reliable and compliant operations.
•MiQ, the non-profit global leader in methane certification, announced that it has independently audited and certified bp as the first energy major in the US to verify the methane intensity of its entire US onshore portfolio of natural gas.
•In August bpx energy successfully brought online 'Bingo', its second central processing facility in the Permian Basin. It is a low-emission, electrified facility that will enable further production growth for bpx energy in the basin (bp 100% operator).
•During the year an impairment charge of $0.8 billion was recognized as a result of changes to the group's oil and gas price and discount rate assumptions and disposal decisions.
bp’s onshore US crude oil and product pipelines and related transportation assets were included in the customers & products segment in 2023.
In Canada, bp is focused on pursuing offshore exploration and development opportunities and conducts trading and marketing activities across various energy commodities. We hold exploration and significant discovery licences offshore Newfoundland and Labrador, including an interest in the Equinor-operated Bay du Nord project. bp also holds offshore exploration licences in the Arctic where the moratorium has been extended until 31 December 2028.
In Mexico, bp held interests in two exploration blocks in the Salina Basin with Equinor and Total, Block 1 (bp 33% operator) and Block 3 (bp 33%), and one exploration block in the Sureste Basin, Block 34 (bp 42.5% operator), with Total, QPI Mexico and Hokchi Energy. Hokchi Energy is a subsidiary of Pan American Energy Group (PAEG, see below) in which bp owns 50%. Separate to the above holdings in Mexico, Hokchi Energy also holds an interest in two other blocks.
•Contract termination for Block 3 was executed in April 2023.
•Formal relinquishment of Block 1 and Block 34 licences are still pending regulatory approval.
South America
bp has oil and gas activities in Argentina, Brazil and Trinidad and Tobago and, through PAEG, in Argentina and Bolivia.
In Argentina, bp and Total (operator) are partners on a 50:50 basis in two offshore exploration concessions. Total as the operator issued a relinquishment note to the regulator, which is still pending approval.
In Brazil bp has interests in seven exploration areas across three basins.
•During 2023 bp and Petrobras received an approval from the regulatory authorities for relinquishments submitted for Dois Irmãos, C-M-755, C-M-793, BC-2, BM-POT-16, S-M-1500, and Peroba blocks.
342 | bp Annual Report and Form 20-F 2023 | |||||||||||||
| Additional disclosures | ||
•In May the regulatory authorities approved the final relinquishment of Xerelete (BC-2) operated by Total.
•In June the contract was executed for the Bumerangue block (bp 100%), in the Santos Basin.
•In September the appraisal plan (PAD) for Alto de Cabo Frio Central block (bp 50%), in the southern portion of the Campos Basin, was filed with the regulator and is pending approval.
•In Brazil´s second Permanent Production Sharing Offer bid round in December 2023, bp successfully bid on the Tupinambá block, an area of 3,056km2 located in the Santos Pre-Salt Basin. bp will hold 100% participation interest on the block when the contract is executed later in 2024.
PAEG, a joint venture that is owned by bp (50%) and BC E&P Uruguay S.A. (50%), has activities mainly in Argentina and as noted above Mexico, and is also present in Bolivia.
In Trinidad and Tobago bp holds interests in exploration and production licences and production-sharing contracts (PSCs)« covering 2.5 million acres offshore of the east and north-east coast. Facilities include 16 offshore platforms and two onshore processing facilities. Production comprises gas and associated liquids.
bp also holds interests in the Atlantic LNG facility. The total gross capacity of the four LNG trains making up the facility is approximately 12 million tonnes per annum. bp’s shareholding averages 40% across the three companies which own the LNG trains comprising the LNG facility. During 2023 bp sold gas to trains 2 and 3 and processed gas in train 4. Most of the LNG produced from bp gas supplied to Trains 2, 3 and 4 is sold under long-term contracts.
•Cypre, bp’s third subsea gas development in Trinidad and Tobago, is expected to start drilling in 2024 with first gas expected in 2025. The project is expected to have seven wells and be tied back to the Juniper platform.
•The Joe Douglas rig continued drilling in 2023 with Mango and is progressing to Savonette and Angelin. This development will leverage existing infrastructure and contribute to sustained delivery.
•Trinidad Offshore Pipeline Replacement (TOPR) project for a 12-inch liquids pipeline that connects Mahogany B to terminal was safely integrated into the production system in 2023. Additionally, construction of the Ocelot project, which is a 6-inch liquids pipeline connecting Beachfield to terminal, is under way.
•bp was awarded three deepwater blocks off Trinidad’s east coast in a bp/Shell partnership (50:50). bp is the operator of Blocks 25a & 25b and Shell is the operator of Block 27. Activity in the coming years will include seismic acquisition and interpretation and exploration wells.
•bp is operator of the Manakin block which was discovered in 1998 and is a cross-border reservoir field with the Venezuelan reservoir, Cocuina. Manakin declared commerciality in January 2018, however cross-border discussions have not progressed due to the impact of US sanctions. In October 2023 the US government eased sanctions on Venezuela’s oil sector for six months.
•Since the conclusion of short-term gas supply agreements, the Atlantic Train 1 plant has not been operational. The Atlantic shareholders, bp, Shell and the National Gas Company of Trinidad & Tobago (NGC), agreed to decouple the Train from the rest of the Atlantic facility with a view to decommissioning it. The Train has been made safe and decoupling and decommissioning work scopes are being planned. On 5 December 2023 bp, Shell and NGC agreed and executed the agreements for the restructuring of the ownership and commercial framework of the Atlantic LNG.
•During the year an impairment charge of $0.6 billion was recognized as a result of changes to the group's oil and gas price and discount rate assumptions and activity phasing.
Africa
bp’s oil and gas activities in Africa are located in Angola, Egypt, Libya, Mauritania and Senegal.
In Angola, bp and Eni each own 50% interest in the Azule Energy joint venture. Azule Energy is Angola’s largest independent equity producer of oil and gas, holding stakes in 20 licences, as well as an interest in the Angola LNG plant.
•During the year, Azule Energy has taken the final investment decision for the Agogo Integrated West Hub Development oil project.
•In August Azule Energy signed a production-sharing agreement (PSA)« for Block 31/21. The agreement results from the 2021/2022 Limited Offshore Licensing Round and is a significant stride towards advancing exploration in the Lower Congo Basin.
•In December Azule Energy made progress on sustaining resilient hydrocarbon production with four new exploration agreements in blocks adjacent to existing operations (46, 47, 14/23 and 18/15).
In Egypt, bp's investments in the country include West Nile Delta, Atoll and Zohr. Through its joint ventures with Egyptian Natural Gas Holding Company (EGAS), Egyptian General Petroleum Corporation (EGPC), International Egyptian Oil Company (IEOC), Eni, the Pharaonic Petroleum Company (PhPC) and through collaboration with Belayim Petroleum Company (Petrobel), bp and its partners now produce more than 70% of Egypt's total gas supply. In addition, bp owns interest in other exploration projects.
•In October bp secured an exploration block located offshore Egypt as part of the EGAS 2022 International Bid Round. The EGY-MED-E8 (East Port Said) block (bp 33%) is located in the Mediterranean Sea, approximately 50-90km from Post Said city and covering an area of approximately 2,620km2. In addition to farming into the existing North East Hap’y Offshore Concession the block is currently in the second exploration phase with an exploration well spudded in October 2023.
•On 14 February 2024 bp announced the formation of a new joint venture in Egypt (bp 51%, ADNOC 49%) under which, subject to regulatory approvals, bp will contribute its interests in three non-operated development concessions as well as exploration agreements in Egypt, and ADNOC will make a proportionate cash contribution.
In Libya, bp partners with the Libyan Investment Authority (LIA) and Eni in an exploration and production-sharing agreement (EPSA) to explore acreage in the onshore Ghadames and offshore Sirt basins (bp 42.5%). bp wrote off all balances associated with the Libya EPSA in 2015.
•Eni’s acquisition of a 42.5% interest in the bp-operated EPSA in Libya has been ratified by the Libyan authorities effective November 2022, upon which Eni became exploration operator under the EPSA. bp, LIA and Eni continue to work with the Libyan NOC towards finalizing the transfer of operatorship from bp to Eni, recommencement of petroleum operations and completion of the programme of exploration and drilling activities included in the EPSA.
In Mauritania and Senegal, bp retains the exploitation licences in the respective C8 and Saint Louis Offshore Profond blocks pertinent to the Greater Tortue Ahmeyim (GTA) Unit cross-border development. In addition, bp holds a 62% participating interest in the BirAllah gas resource exploration licence.
•The GTA project (bp 56%) continues to progress with phase 1 critical milestones including the completion of the offshore hub terminal construction and sailaway of the gas processing FPSO from China in January 2023. The floating LNG vessel reached its destination in February 2024.
•In February 2023 bp and its partners on the GTA project announced their agreement to evaluate viability of a gravity-based structure (GBS) as the basis for the GTA Phase 2 expansion project.
•In Senegal, we have exited the Cayar Offshore Profond PSA and transferred operatorship of Yakaar-Teranga gas resource to Kosmos Energy. As a result of the exit, an exploration write-off of $0.3 billion was recognized.
•In 2023 an impairment charge of $1.4 billion was recognized in respect of certain assets in the region due to increased future forecast expenditure.
Asia
bp has activities in Abu Dhabi, Azerbaijan, China, India, Indonesia, Iraq, Kuwait and Oman.
In China, we have a 30% equity stake in the Guangdong LNG regasification terminal and trunkline project (GDLNG) with a total storage capacity of 640,000 cubic metres. bp also has 0.6 million tons per annum of regasification capacity at GDLNG for up to 12 years starting from the beginning of 2021. bp imports LNG from our global portfolio and delivers
« See glossary on page 373 | bp Annual Report and Form 20-F 2023 | 343 | ||||||||||||
regasified natural gas via the terminal to power plant and city gas customers in Guangdong province under long-term sales contracts.
In Azerbaijan, bp operates two PSAs, Azeri-Chirag-Gunashli (ACG) (bp 30.37%) and Shah Deniz (bp 29.99%) and also holds a number of other exploration leases.
•bp and SOCAR signed a protocol to extend the Shafag-Asiman exploration period until the end of June 2024 to allow bp and SOCAR to agree on the terms of any potential follow-on exploration activity.
•Following dry hole results in each of the three prospective areas of the Shallow Water Absheron Peninsula (SWAP) PSA, the contract area was relinquished in December 2022. The joint operating agreement was terminated on 27 December 2023.
Naftiran Intertrade Co Ltd (NICO), a subsidiary of the National Iranian Oil Company, holds a 10% interest in the Shah Deniz joint venture. For information on the exclusion of this project from EU and US trade sanctions, see International trade sanctions on page 357.
bp holds a 30.1% interest in and operates the Baku-Tbilisi-Ceyhan (BTC) oil pipeline. The 1,768-kilometre pipeline transports oil from the ACG oilfield and condensate from the Shah Deniz gas and condensate field in the Caspian Sea, along with other third-party oil, to the eastern Mediterranean port of Ceyhan. The pipeline has a capacity of 1mmboe/d, with an average throughput in 2023 of 626mboe/d.
bp (as operator of Azerbaijan International Operating Company and the Georgian Pipeline Company for the Georgian section) also operates the Western Route Export Pipeline (WREP) that transports ACG oil to Supsa on the Black Sea coast of Georgia, with an average throughput of 3mboe/d in 2023. Exports through the pipeline have been suspended since May 2022 due to a lack of nominations from the shipper group. In current market conditions WREP serves as a contingency export route for ACG crude product. In February 2023 WREP was restarted for two weeks following a temporary suspension of liftings from BTC in the wake of the Turkish earthquake on 6 February 2023.
•The Azeri Central East (ACE) project is the next stage of development of the giant ACG field in the Azerbaijan sector of the Caspian Sea. During the third quarter the ACE platform topsides unit was safely installed in the field and the first pre-drill well was spudded. This is the seventh and most automated platform installed in the giant ACG field with approximately 100mboe/d installed capacity.
bp holds a 29.99% interest in and operates certain parts of the 693-kilometre South Caucasus Pipeline. The pipeline takes gas from the Shah Deniz field in Azerbaijan through Georgia to the Turkish border and has a capacity of 440mboe/d (including expansion), with average throughput in 2023 of 370mboe/d.
bp also holds a 12% interest in the Trans Anatolian Natural Gas Pipeline (TANAP). The pipeline takes Shah Deniz gas from the Turkish border and transports it to Eskisehir in Türkiye and to the Greek border where it connects with the Trans Adriatic Pipeline (TAP). The current capacity of TANAP is 275mboe/d and the average throughput in 2023 was 285mboe/d. bp has a 20% interest in TAP, which takes gas through Greece and Albania into Italy. The current capacity of TAP is 167mboe/d and the total average throughout in 2023 was 191mboe/d. TAP and TANAP throughputs exceeded capacity during 2023 due to high flow tests taking place during the year.
•In 2023 bp and our co-venturers in the Shah Deniz Consortium have secured additional capacity in the SNAM RETE GAS, and TANAP pipelines for 2026-2028 period, which will allow the export of more Shah Deniz gas to Europe.
In Oman, bp operates Block 61, the largest tight gas development in the Middle East (bp 40%). bp also has a 50% interest in Block 77 with Eni (operator) in which an exploration well was spudded in October 2023, scheduled for completion in 2024.
In Abu Dhabi, bp holds a 10% interest in the ADNOC Onshore concession. We also have a 10% equity shareholding in ADNOC LNG and a 10% shareholding in the shipping company NGSCO. ADNOC LNG supplied approximately 5.09 million tonnes of LNG (0.7bcfe/d regasified) in 2023. Our interest in the ADNOC Onshore concession expires at the end of 2054.
•On 28 March bp, together with ADNOC, made a non-binding offer to take NewMed Energy private through an acquisition of the free float and a partial acquisition of Delek’s stake, which would result in bp and ADNOC holding 50% of NewMed Energy.
A consortium of Azerbaijan's national oil company SOCAR along with bp and Israel's NewMed was awarded two licence blocks.
In 2016 bp signed an enhanced technical service agreement for south and east Kuwait conventional oilfields, which includes the Burgan field, with Kuwait Oil Company.
In India, we have a participating interest in two oil and gas PSAs (KG D6 33.33% and NEC25 33.33%), and two oil and gas blocks under a revenue sharing contract (KG-UDWHP-2018/1 40% and KG-UDWHP-2022/1 40%), all operated by Reliance Industries Limited (RIL). We also have a 50% stake in India Gas Solutions Private Limited, a joint venture with RIL, for the sourcing and marketing of gas in India.
•On 30 June bp and RIL (operator) announced commencement of production from MJ, the last of three new deepwater developments in the KG D6 block off the east coast of India. With this development, production from the three fields in KG D6 block is expected to account for around one third of India’s current domestic gas production and meet approximately 15% of India’s gas demand.
•In December 2023 bp and RIL were awarded the ultra deepwater block KG-UDWHP-2022/1 (RIL operator 60%, bp 40%), adjacent to block KG-UDWHP-2018/1, in India’s Open Acreage Licensing Policy bid round VIII and both RIL and bp have entered into a revenue sharing contract with the government of India.
In Indonesia, bp holds an interest in the Andaman II PSC exploration block (operated by Harbour Energy), located offshore North Sumatra and in Agung I and Agung II exploration blocks offshore Indonesia. Agung I covers over 6,000km2 off the coast of Bali and East Java and Agung II spans almost 8,000km2 offshore South Sulawesi, West Nusa Tenggara and East Java.
In Iraq, bp holds a 49% participating interest in Basra Energy Company Limited (BECL). BECL is an incorporated joint venture (IJV) company owned by bp (49%) and PetroChina (51%) and acts as Rumaila lead contractor since 2022.
Australasia
bp has activities in Australia and Eastern Indonesia.
In Australia bp is one of seven participants in the North West Shelf (NWS) venture, which has been producing LNG, pipeline gas, condensate, LPG and oil since the 1980s. Six partners (including bp) hold an equal 16.67% interest in the gas infrastructure and an equal 15.78% interest in the gas and condensate reserves, with a seventh partner owning the remaining 5.32% of these reserves. The NWS venture is one of the largest LNG export projects in the region, with five LNG trains in operation, and supplies domestic gas into the Western Australia market. bp’s net share of the capacity of NWS LNG trains 1-5 is 2.67 million tonnes (15.78% of 16.9mtpa gross) of LNG per year. This will be reduced as the first LNG train is taken offline in 2024. bp is also one of five participants in the Browse LNG venture.
•bp completed the acquisition of Shell’s interest in the Browse joint venture in October 2023, which increased bp’s interest from 17.33% to 44.33%. Browse is an LNG project operated by Woodside. The Browse joint venture participants continue to work to optimize the current development scheme for Browse which consists of two new built offshore FPSOs connecting back to the NWS Venture's Karratha Gas Plant via a 917km 42-inch pipeline.
bp also has a 50% interest in the WA-541 exploration title in Western Australia's offshore Northern Carnarvon basin. The joint venture, operated by Santos, is working towards the drilling of two commitment wells.
In Papua Barat, Eastern Indonesia, bp operates the Tangguh LNG plant (bp 40.22%). The Tangguh Expansion Project has been completed, adding a third LNG processing train, which has been producing LNG since September 2023, with 3.8 million tonnes of LNG per annum production capacity additional to the existing facility totalling up to 11.4 million tonnes per annum. The Tangguh asset comprises 30 production wells, four offshore platforms, three LNG processing trains, and two LNG loading
344 | bp Annual Report and Form 20-F 2023 | |||||||||||||
| Additional disclosures | ||
facilities. Tangguh supplies LNG to customers in Indonesia, Mexico, China, South Korea, Taiwan and Japan through a combination of long, medium and spot contracts.
Oil and natural gas
Resource progression
bp manages its hydrocarbon resources in three major categories: prospect inventory, contingent resources and reserves. When a discovery is made, volumes usually transfer from the prospect inventory to the contingent resources category. The contingent resources move through various sub-categories as their technical and commercial maturity increases through appraisal activity.
At the point of final investment decision, most proved reserves will be categorized as proved undeveloped (PUD). Volumes will subsequently be recategorized from PUD to proved developed (PD) as a consequence of development activity. When part of a well’s proved reserves depends on a later phase of activity, only that portion of proved reserves associated with existing, available facilities and infrastructure moves to PD. The first PD bookings will typically occur at the point of first oil or gas production. Major development projects typically take one to five years from the time of initial booking of PUD to the start of production. Changes to proved reserves bookings may be made due to analysis of new or existing data concerning production, reservoir performance, commercial factors and additional reservoir development activity.
Volumes can also be added or removed from our portfolio through acquisition or divestment of properties and projects. When we dispose of an interest in a property or project, the volumes associated with our adopted plan of development for which we have a final investment decision will be removed from our proved reserves upon completion of the transaction. When we acquire an interest in a property or project, the volumes associated with the existing development and any committed projects will be added to our proved reserves if bp has made a final investment decision and they satisfy the SEC’s criteria for attribution of proved status. Following the acquisition, additional volumes may be progressed to proved reserves from non-proved reserves or contingent resources.
Non-proved reserves and contingent resources in a field will only be recategorized as proved reserves when all the criteria for attribution of proved status have been met and the volumes are included in the business plan and scheduled for development, typically within five years. bp will only book proved reserves where development is scheduled to commence after more than five years, if these proved reserves satisfy the SEC’s criteria for attribution of proved status and bp management has reasonable certainty that these proved reserves will be produced.
At the end of 2023 bp had material volumes of proved undeveloped reserves held for more than five years in Azerbaijan. These are part of ongoing infrastructure-led development activities for which bp has a historical track record of completing comparable projects. We have no proved undeveloped reserves held for more than five years in our onshore US developments.
Over the past five years, bp has annually progressed a weighted average 17% (18% for 2022 five-year average) of our group proved undeveloped reserves (including the impact of disposals and price acceleration effects in PSAs) to proved developed reserves. This equates to a turnover time of six years.
Proved reserves as estimated at the end of 2023 meet bp’s criteria for project sanctioning and SEC tests for proved reserves. We have not halted or changed our commitment to proceed with any material project to which proved undeveloped reserves have been attributed.
In 2023 we progressed 624mmboe of proved undeveloped reserves (542mmboe for our subsidiaries« alone) to proved developed reserves through ongoing investment in our subsidiaries’ and equity-accounted entities’ development activities. Total development expenditure, excluding midstream activities, was $11,263 million in 2023 ($8,206 million for subsidiaries and $3,057 million for equity-accounted entities). Of the $8,206 million of total development expenditure for our subsidiaries, approximately $2,800 million was used for development activity to progress proved undeveloped reserves to proved developed. Of the $3,057 million development expenditure for our equity-accounted entities, approximately
$1,200 million was used for development activity to progress proved undeveloped reserves to proved developed. The major areas with progressed volumes in 2023 were the US, Asia Pacific, Trinidad and Tobago and the Middle East.
Revisions of previous estimates for proved undeveloped reserves are due to changes relating to field performance, well results, revisions to future activity plans (including alignment with our investment criteria and changes to the macroeconomic climate) or changes in commercial conditions including price impacts. The net revisions to previous estimates across both our subsidiaries and our equity-accounted entities include net positive revisions driven by price and revisions to activity plans, and net negative revisions driven by field performance and well results. The net revisions to previous estimates across only our subsidiaries include net positive revisions driven by price and revisions to activity plans and net negative revisions driven by field performance and well results. In each case, none of these factors resulted in revisions that were material to the group as a whole. The following tables describe the changes to our proved undeveloped reserves position through the year for our subsidiaries and equity-accounted entities and for our subsidiaries alone.
volumes in mmboea | |||||
| Subsidiaries and equity-accounted entities | Group | ||||
| Proved undeveloped reserves at 1 January 2023 | 2,877 | ||||
| Revisions of previous estimates | (12) | ||||
| Price | 24 | ||||
| Revision of future activity plans | 69 | ||||
| Field performance | (88) | ||||
| Well results | (17) | ||||
| Improved recovery | 108 | ||||
| Discoveries and extensions | 107 | ||||
| Purchases | 74 | ||||
| Sales | (10) | ||||
| Total in year proved undeveloped reserves changes | 267 | ||||
| Proved developed reserves reclassified as undeveloped | 39 | ||||
| Progressed to proved developed reserves by development activities (e.g. drilling/completion) | (624) | ||||
| Proved undeveloped reserves at 31 December 2023 | 2,558 | ||||
| Subsidiaries only | volumes in mmboea | ||||
| Proved undeveloped reserves at 1 January 2023 | 2,392 | ||||
| Revisions of previous estimates | (22) | ||||
| Price | 16 | ||||
| Revision of future activity plans | 51 | ||||
| Field performance | (87) | ||||
| Well results | — | ||||
| Improved recovery | 75 | ||||
| Discoveries and extensions | 27 | ||||
| Purchases | 61 | ||||
| Sales | (2) | ||||
| Total in year proved undeveloped reserves changes | 139 | ||||
| Proved developed reserves reclassified as undeveloped | 17 | ||||
| Progressed to proved developed reserves by development activities (e.g. drilling/completion) | (542) | ||||
| Proved undeveloped reserves at 31 December 2023 | 2,006 | ||||
aBecause of rounding, some totals may not agree exactly with the sum of their component parts.
bp bases its proved reserves estimates on the requirement of reasonable certainty with rigorous technical and commercial assessments based on conventional industry practice and regulatory requirements. bp only applies technologies that have been field tested and have been demonstrated to provide reasonably certain results with consistency and repeatability in the formation being evaluated or in an analogous formation. bp applies high-resolution seismic data for the identification of reservoir extent and fluid contacts only where there is an overwhelming track record of success in its local application. In certain cases bp uses numerical simulation as part of a holistic assessment of recovery factor for its fields, where these simulations have been field tested and have been demonstrated to provide reasonably certain results with consistency and repeatability in the
« See glossary on page 373 | bp Annual Report and Form 20-F 2023 | 345 | ||||||||||||
formation being evaluated or in an analogous formation. In certain deepwater fields bp has booked proved reserves before production flow tests are conducted, in part because of the significant safety, cost and environmental implications of conducting these tests. The industry has made substantial technological improvements in understanding, measuring and delineating reservoir properties without the need for flow tests. To determine reasonable certainty of commercial recovery, bp employs a general method of reserves assessment that relies on the integration of three types of data:
•Well data used to assess the local characteristics and conditions of reservoirs and fluids.
•Field scale seismic data to allow the interpolation and extrapolation of these characteristics outside the immediate area of the local well control.
•Data from relevant analogous fields.
Well data includes appraisal wells or sidetrack holes, full logging suites, core data and fluid samples. bp considers the integration of this data in certain cases to be superior to a flow test in providing understanding of overall reservoir performance. The collection of data from logs, cores, wireline formation testers, pressures and fluid samples calibrated to each other and to the seismic data can allow reservoir properties to be determined over a greater volume than the localized volume of investigation associated with a short-term flow test. There is a strong track record of proved reserves recorded using these methods, validated by actual production levels.
Governance
bp’s centrally controlled process for proved reserves estimation approval forms part of a holistic and integrated system of internal control. It consists of the following elements:
•Accountabilities of certain officers of the group to ensure that there is review and approval of proved reserves bookings independent of the operating business and that there are effective controls in the approval process and verification that the proved reserves estimates and the related financial impacts are reported in a timely manner.
•Capital allocation processes, whereby delegated authority is exercised to commit to capital projects that are consistent with the delivery of the group’s business plan. A formal review process exists to ensure that both technical and commercial criteria are met prior to the commitment of capital to projects.
•Internal audit, whose role is to consider whether the group’s system of internal control is adequately designed and operating effectively to respond appropriately to the risks that are significant to bp.
•Approval hierarchy, whereby proved reserves changes above certain threshold volumes require immediate review and all proved reserves require annual central authorization and have scheduled periodic reviews. The frequency of periodic review ensures that 100% of the bp proved reserves base undergoes central review every three years.
bp’s vice president of reserves is the individual primarily responsible for overseeing the preparation of the reserves estimate. He has more than 30 years of diversified industry experience in reserves estimation with the past four years managing the governance and compliance. He is a past Chairman of the Society of Petroleum Engineers (Russia & Caspian) and a member of the United Nations Economic Commission for Europe Expert Group on Resource Management.
No specific portion of compensation bonuses for senior management is directly related to proved reserves targets. Additions to proved reserves is one of several indicators by which the performance of the gas & low carbon and oil production & operations segments is assessed by the remuneration committee for the purposes of determining compensation bonuses for the executive directors. Other indicators include a number of financial and operational measures.
bp’s variable pay programme for the other senior managers in the gas & low carbon and oil production & operations segments is based on individual performance contracts. Individual performance contracts are based on agreed items from the business performance plan, one of which, if chosen, could relate to proved reserves.
Compliance
International Financial Reporting Standards (IFRS) do not provide specific guidance on reserves disclosures. bp estimates proved reserves in
accordance with SEC Rule 4-10 (a) of Regulation S-X and relevant Compliance and Disclosure Interpretations (C&DI) and Staff Accounting Bulletins as issued by the SEC staff.
By their nature, there is always risk involved in the ultimate development and production of proved reserves including, but not limited to: final regulatory approval; the installation of new or additional infrastructure, as well as changes in oil and gas prices; changes in operating and development costs; and the continued availability of additional development capital. All the group’s proved reserves held in subsidiaries and equity-accounted entities are estimated by the group’s petroleum engineers or by independent petroleum engineering consulting firms and then assured by the group’s petroleum engineers.
Netherland, Sewell & Associates (NSAI), an independent petroleum engineering consulting firm, has estimated the net proved crude oil, condensate, natural gas liquids (NGLs) and natural gas reserves, as of 31 December 2023, of certain properties owned by bp in the US Lower 48. The properties evaluated by NSAI account for 100% of bp’s net proved reserves in the US Lower 48 as of 31 December 2023. The net proved reserves estimates prepared by NSAI were prepared in accordance with the reserves definitions of Rule 4-10(a)(1)-(32) of Regulation S-X. All reserves estimates involve some degree of uncertainty. bp has filed NSAI’s independent report on its reserves estimates as an exhibit to this Annual Report on Form 20-F filed with the SEC.
Our proved reserves are associated with both concessions (tax and royalty arrangements) and agreements where the group is exposed to the upstream risks and rewards of ownership, but where our entitlement to the hydrocarbons is calculated using a more complex formula, such as with PSAs. In a concession, the consortium of which we are a part is entitled to the proved reserves that can be produced over the licence period, which may be the life of the field. In a PSA, we are entitled to recover volumes that equate to costs incurred to develop and produce the proved reserves and an agreed share of the remaining volumes or the economic equivalent. As part of our entitlement is driven by the monetary amount of costs to be recovered, price fluctuations will have an impact on both production volumes and reserves.
We disclose our share of proved reserves held in equity-accounted entities (joint ventures« and associates«), although we do not control these entities or the assets held by such entities.
bp’s estimated net proved reserves and proved reserves replacement
94% of our total proved reserves of subsidiaries at 31 December 2023 were held through joint operations« (94% in 2022), and 31% of the proved reserves were held through such joint operations where we were not the operator (34% in 2022).
Estimated net proved reserves of crude oil at 31 December 2023abc
| million barrels | |||||||||||
| Developed | Undeveloped | Total | |||||||||
| UK | 129 | 74 | 203 | ||||||||
| US | 713 | 352 | 1,065 | ||||||||
| Rest of North America | — | — | — | ||||||||
South Americad | 3 | 5 | 7 | ||||||||
| Africa | 5 | — | 6 | ||||||||
| Rest of Asia | 729 | 323 | 1,052 | ||||||||
| Australasia | 11 | 1 | 12 | ||||||||
| Subsidiaries | 1,590 | 755 | 2,345 | ||||||||
| Equity-accounted entities | 588 | 387 | 976 | ||||||||
| Total | 2,179 | 1,142 | 3,321 | ||||||||
346 | bp Annual Report and Form 20-F 2023 | |||||||||||||
| Additional disclosures | ||
Estimated net proved reserves of natural gas liquids at 31 December 2023a b
| million barrels | |||||||||||
| Developed | Undeveloped | Total | |||||||||
| UK | 3 | — | 3 | ||||||||
| US | 180 | 217 | 397 | ||||||||
| Rest of North America | — | — | — | ||||||||
| South America | — | — | — | ||||||||
| Africa | — | — | — | ||||||||
| Rest of Asia | — | — | — | ||||||||
| Australasia | 1 | — | 1 | ||||||||
| Subsidiaries | 184 | 217 | 401 | ||||||||
| Equity-accounted entities | 19 | 6 | 25 | ||||||||
| Total | 204 | 223 | 427 | ||||||||
Estimated net proved reserves of liquids«
| million barrels | |||||||||||
| Developed | Undeveloped | Total | |||||||||
| Subsidiaries | 1,775 | 971 | 2,746 | ||||||||
| Equity-accounted entities | 608 | 393 | 1,001 | ||||||||
| Total | 2,382 | 1,365 | 3,747 | ||||||||
Estimated net proved reserves of natural gas at 31 December 2023a b
| billion cubic feet | |||||||||||
| Developed | Undeveloped | Total | |||||||||
| UK | 221 | 34 | 255 | ||||||||
| US | 2,672 | 3,229 | 5,901 | ||||||||
| Rest of North America | — | — | — | ||||||||
South Americae | 931 | 503 | 1,434 | ||||||||
| Africa | 518 | 207 | 724 | ||||||||
| Rest of Asia | 3,051 | 1,672 | 4,722 | ||||||||
| Australasia | 1,550 | 358 | 1,907 | ||||||||
| Subsidiaries | 8,942 | 6,003 | 14,944 | ||||||||
| Equity-accounted entities | 1,608 | 919 | 2,527 | ||||||||
| Total | 10,549 | 6,922 | 17,471 | ||||||||
Estimated net proved reserves on an oil equivalent basis
| million barrels of oil equivalent | |||||||||||
| Developed | Undeveloped | Total | |||||||||
| Subsidiaries | 3,316 | 2,006 | 5,323 | ||||||||
| Equity-accounted entities | 885 | 552 | 1,437 | ||||||||
| Total | 4,201 | 2,558 | 6,759 | ||||||||
aProved reserves exclude royalties due to others, whether payable in cash or in kind, where the royalty owner has a direct interest in the underlying production and the option and ability to make lifting and sales arrangements independently, and include non-controlling interests in consolidated operations. We disclose our share of reserves held in joint ventures and associates that are accounted for by the equity method although we do not control these entities or the assets held by such entities.
bThe 2023 marker prices used were Brent $83.27/bbl (2022 $101.24/bbl and 2021 $69.23/bbl) and Henry Hub $2.58/mmBtu (2022 $6.19/mmBtu and 2021 $3.61/mmBtu).
cIncludes condensate.
dIncludes 2.2 million barrels of liquids in respect of the 30% non-controlling interest in BP Trinidad and Tobago LLC.
eIncludes 430 billion cubic feet of natural gas in respect of the 30% non-controlling interest in BP Trinidad and Tobago LLC.
Because of rounding, some totals may not agree exactly with the sum of their component parts.
Proved reserves replacement
Total hydrocarbon proved reserves at 31 December 2023, on an oil equivalent basis including equity-accounted entities, decreased by 6% compared with 31 December 2022 (8% decrease for subsidiaries and 4% increase for equity-accounted entities). Natural gas decreased by 5% (7% decrease for subsidiaries and 6% increase for equity-accounted entities).
There was a net increase from acquisitions and disposals of 31mmboe within our US and North Africa subsidiaries.
The proved reserves replacement ratio« is the extent to which production is replaced by proved reserves additions. This ratio is expressed in oil equivalent terms and includes changes resulting from revisions to previous estimates, improved recovery, and extensions and discoveries. For 2023, the proved reserves replacement ratio excluding acquisitions and disposals was 47% (20% in 2022 and 50% in 2021) for subsidiaries and equity-accounted entities, 31% for subsidiaries alone and 136% for equity-accounted entities alone. There was a net increase (80mmboe) of reserves in some of our PSAs in Azerbaijan and the Middle East due to lower gas and oil prices, partially offset by a decrease in the US due to price.
In 2023 net additions to the group’s proved reserves (excluding production, sales and purchases of reserves-in-place) amounted to 406mmboe (227mmboe for subsidiaries and 179mmboe for equity-accounted entities), through revisions to previous estimates including price, improved recovery from, and extensions to, existing fields and discoveries of new fields. The majority of subsidiary additions were through improved recovery from, and extensions to, existing fields and discoveries of new fields where they represented a mixture of proved developed and proved undeveloped reserves. The principal proved reserves additions in our subsidiaries by region were in the US and the Middle East. The principal reserves additions in our equity-accounted entities were in Aker BP and PAEG.
In January 2024 it was reported that the Oslo District Court had determined that certain development permits granted by the Norwegian government during 2023 were invalid. This includes development permits for two fields in which Aker bp has an interest. The court’s decision is not final and could be appealed. If bp’s equity-accounted share of the reserves attributable to these two fields is removed from the calculation of bp’s 2023 proved reserves ratio, that ratio would decrease from 47% to 44%. Removal of the same reserves from bp’s 2023 reporting would also impact proved hydrocarbon reserves for the group, proved undeveloped reserves and estimated net proved reserves on an oil equivalent basis amongst other reported measures both for equity-accounted entities and group.
26% of our proved reserves are associated with PSAs. The countries in which we produced under PSAs in 2023 were Algeria, Angola, Azerbaijan, Egypt, India, Indonesia, Mexico and Oman. In addition, the technical service contract (TSC)« governing our investment in the Rumaila field in Iraq functions as a PSA.
The group holds no licences in our PSAs or TSCs due to expire within the next three years that would have a significant impact on bp’s reserves or production, including undeveloped acreage.
For further information on our reserves see page 254.
« See glossary on page 373 | bp Annual Report and Form 20-F 2023 | 347 | ||||||||||||
bp’s net production by country – crude oila and natural gas liquids
| thousand barrels per day | |||||||||||||||||||||||
bp net share of productionb | |||||||||||||||||||||||
| Crude oil | Natural gas liquids | ||||||||||||||||||||||
| 2023 | 2022 | 2021 | 2023 | 2022 | 2021 | ||||||||||||||||||
| Subsidiaries | |||||||||||||||||||||||
UKc | 74 | 80 | 82 | 5 | 5 | 5 | |||||||||||||||||
| Total Europe | 74 | 80 | 82 | 5 | 5 | 5 | |||||||||||||||||
Lower 48 onshorec | 69 | 71 | 69 | 66 | 56 | 48 | |||||||||||||||||
| Gulf of Mexico deepwater | 266 | 225 | 239 | 22 | 19 | 22 | |||||||||||||||||
| Total US | 335 | 296 | 308 | 88 | 76 | 70 | |||||||||||||||||
Canadacd | — | 15 | 25 | — | — | — | |||||||||||||||||
| Total Rest of North America | — | 15 | 25 | — | — | — | |||||||||||||||||
| Total North America | 335 | 311 | 333 | 88 | 76 | 70 | |||||||||||||||||
Trinidad and Tobago | 4 | 5 | 5 | 4 | 4 | 4 | |||||||||||||||||
| Total South America | 4 | 5 | 5 | 4 | 4 | 4 | |||||||||||||||||
Angolac | — | 49 | 80 | — | — | — | |||||||||||||||||
| Egypt | 28 | 28 | 23 | 1 | — | — | |||||||||||||||||
Algeriac | 1 | 5 | 6 | 1 | 6 | 7 | |||||||||||||||||
| Total Africa | 29 | 83 | 110 | 2 | 6 | 7 | |||||||||||||||||
| Abu Dhabi | 197 | 195 | 171 | — | — | — | |||||||||||||||||
| Azerbaijan | 70 | 73 | 77 | — | — | — | |||||||||||||||||
Iraqc | — | 15 | 43 | — | — | — | |||||||||||||||||
| India | — | — | — | 4 | — | — | |||||||||||||||||
Omanc | 22 | 24 | 26 | — | — | — | |||||||||||||||||
| Total Rest of Asia | 289 | 307 | 318 | 4 | — | — | |||||||||||||||||
| Total Asia | 289 | 307 | 318 | 4 | — | — | |||||||||||||||||
Australiac | 8 | 11 | 11 | 2 | 2 | 2 | |||||||||||||||||
| Eastern Indonesia | 2 | 1 | 2 | — | — | — | |||||||||||||||||
| Total Australasia | 10 | 12 | 13 | 2 | 2 | 2 | |||||||||||||||||
| Total subsidiaries | 741 | 797 | 860 | 104 | 93 | 88 | |||||||||||||||||
| Equity-accounted entities (bp share) | |||||||||||||||||||||||
Rosnefte (Russia, Egypt) | — | 144 | 857 | — | — | 3 | |||||||||||||||||
| Argentina | 51 | 51 | 50 | 1 | 1 | 1 | |||||||||||||||||
| Mexico | 5 | 6 | 3 | — | — | — | |||||||||||||||||
| Bolivia | 1 | 2 | 2 | — | — | — | |||||||||||||||||
| Egypt | — | — | — | 2 | 3 | 3 | |||||||||||||||||
| Norway | 60 | 47 | 48 | 3 | 2 | 3 | |||||||||||||||||
| Russia | — | 7 | 30 | — | — | — | |||||||||||||||||
| Iraq | 62 | 25 | — | ||||||||||||||||||||
| Angola | 82 | 33 | 1 | 4 | 2 | 3 | |||||||||||||||||
| Total equity-accounted entities | 261 | 314 | 991 | 9 | 9 | 12 | |||||||||||||||||
Total subsidiaries and equity-accounted entitiesf | 1,002 | 1,111 | 1,851 | 113 | 102 | 100 | |||||||||||||||||
aIncludes condensate.
bProduction excludes royalties due to others whether payable in cash or in kind where the royalty owner has a direct interest in the underlying production and the option and ability to make lifting and sales arrangements independently.
cIn 2023, bp disposed of its interests in Algeria. In 2022, bp disposed of its interests in Angola, its interest in Sunrise Oil Sands in Canada, its interest in Rumaila in Iraq, and certain Lower 48 onshore interests in the US and certain offshore interests in Australia. In 2021, bp disposed of 20% of its interest in Block 61 in Oman, its interest in Shearwater in the UK North Sea, and certain Lower 48 onshore interests in the US.
dAll of the production from Canada in Subsidiaries is bitumen.
e2022 reflects bp's estimated share of Rosneft production for the period 1 January to 27 February, averaged over the year (see Financial statements – Note 1). Includes production in respect of the non-controlling interest in Rosneft, including production held through bp’s interests in Russia other than Rosneft.
fIncludes 2 net mboe/d of NGLs from processing plants in which bp has an interest (2022 2mboe/d and 2021 3mboe/d).
Because of rounding, some totals may not agree exactly with the sum of their component parts.
348 | bp Annual Report and Form 20-F 2023 | |||||||||||||
| Additional disclosures | ||
bp’s net production by country – natural gas
| million cubic feet per day | |||||||||||
bp net share of productiona | |||||||||||
| 2023 | 2022 | 2021 | |||||||||
| Subsidiaries | |||||||||||
UKb | 247 | 271 | 236 | ||||||||
| Total Europe | 247 | 271 | 236 | ||||||||
Lower 48 onshoreb | 1,338 | 1,148 | 1,043 | ||||||||
| Gulf of Mexico deepwater | 149 | 143 | 154 | ||||||||
| Total US | 1,486 | 1,291 | 1,197 | ||||||||
| Canada | — | — | 2 | ||||||||
| Total Rest of North America | — | — | 2 | ||||||||
| Total North America | 1,486 | 1,291 | 1,199 | ||||||||
Trinidad and Tobago | 1,191 | 1,276 | 1,260 | ||||||||
| Total South America | 1,191 | 1,276 | 1,260 | ||||||||
| Egypt | 1,220 | 1,272 | 1,206 | ||||||||
Algeriab | 16 | 81 | 126 | ||||||||
| Total Africa | 1,236 | 1,353 | 1,332 | ||||||||
| Azerbaijan | 714 | 670 | 539 | ||||||||
| India | 283 | 216 | 169 | ||||||||
Omanb | 582 | 599 | 571 | ||||||||
| Total Rest of Asia | 1,578 | 1,485 | 1,279 | ||||||||
| Total Asia | 1,578 | 1,485 | 1,279 | ||||||||
| Australia | 301 | 331 | 332 | ||||||||
| Eastern Indonesia | 473 | 421 | 429 | ||||||||
| Total Australasia | 774 | 752 | 760 | ||||||||
Total subsidiariesc | 6,512 | 6,428 | 6,067 | ||||||||
| Equity-accounted entities (bp share) | |||||||||||
Rosneftd (Russia, Canada, Egypt, Vietnam) | — | 238 | 1,380 | ||||||||
| Argentina | 247 | 238 | 223 | ||||||||
| Bolivia | 50 | 56 | 60 | ||||||||
| Mexico | 2 | 2 | 1 | ||||||||
| Norway | 58 | 66 | 66 | ||||||||
| Russia | — | 10 | 42 | ||||||||
| Angola | 74 | 64 | 77 | ||||||||
Total equity-accounted entitiesc | 432 | 674 | 1,849 | ||||||||
| Total subsidiaries and equity-accounted entities | 6,944 | 7,101 | 7,915 | ||||||||
aProduction excludes royalties due to others whether payable in cash or in kind where the royalty owner has a direct interest in the underlying production and the option and ability to make lifting and sales arrangements independently.
bIn 2023, bp disposed of its interests in Algeria and certain Lower 48 onshore interests in the US. In 2022, bp disposed of certain Lower 48 onshore interests in the US. In 2021, bp disposed 20% of its interest in Block 61 in Oman, its interest in Shearwater in the UK North Sea, and certain Lower 48 onshore interests in the US.
cNatural gas production volumes exclude gas consumed in operations within the lease boundaries of the producing field, but the related reserves are included in the group’s reserves.
d2022 reflects bp's estimated share of Rosneft production for the period 1 January to 27 February, averaged over the year (see Financial statements – Note 1). Includes production in respect of the non-controlling interest in Rosneft, including production held through bp’s interests in Russia other than Rosneft.
Because of rounding, some totals may not agree exactly with the sum of their component parts.
« See glossary on page 373 | bp Annual Report and Form 20-F 2023 | 349 | ||||||||||||
The following tables provide additional data and disclosures in relation to our oil and gas operations.
Average sales price per unit of production (realizations«)a
| $ per unit of production | |||||||||||||||||||||||||||||||||||
| Europe | North America | South America | Africa | Asia | Australasia | Total group average | |||||||||||||||||||||||||||||
| UK | Rest of Europe | US | Rest of North America | Russia | Rest of Asia | ||||||||||||||||||||||||||||||
| Subsidiaries | |||||||||||||||||||||||||||||||||||
| 2023 | |||||||||||||||||||||||||||||||||||
Crude oilb | 82.99 | — | 75.28 | — | 84.36 | 76.30 | — | 83.86 | 68.27 | 79.37 | |||||||||||||||||||||||||
| Natural gas liquids | 46.52 | — | 19.26 | — | 30.76 | 44.41 | — | — | 33.47 | 23.79 | |||||||||||||||||||||||||
| Gas | 16.71 | — | 2.08 | — | 3.58 | 4.82 | — | 7.72 | 8.89 | 5.60 | |||||||||||||||||||||||||
| 2022 | |||||||||||||||||||||||||||||||||||
Crude oilb | 102.54 | — | 90.05 | 84.88 | 99.09 | 102.00 | — | 98.74 | 86.11 | 95.70 | |||||||||||||||||||||||||
| Natural gas liquids | 60.41 | — | 31.72 | — | 60.55 | 54.78 | — | — | 54.20 | 37.00 | |||||||||||||||||||||||||
| Gas | 33.45 | — | 5.61 | 3.68 | 7.65 | 5.21 | — | 11.81 | 12.33 | 9.29 | |||||||||||||||||||||||||
| 2021 | |||||||||||||||||||||||||||||||||||
Crude oilb | 71.99 | — | 62.58 | 52.49 | 67.62 | 68.98 | — | 67.94 | 61.46 | 65.81 | |||||||||||||||||||||||||
| Natural gas liquids | 52.07 | — | 26.85 | — | 32.81 | 51.01 | — | — | 40.98 | 30.89 | |||||||||||||||||||||||||
| Gas | 14.59 | — | 3.68 | 2.63 | 4.06 | 4.36 | — | 5.66 | 7.25 | 5.20 | |||||||||||||||||||||||||
Equity-accounted entitiesc | |||||||||||||||||||||||||||||||||||
| 2023 | |||||||||||||||||||||||||||||||||||
Crude oilb | — | 81.61 | — | — | 75.49 | 80.21 | — | 75.21 | — | 78.33 | |||||||||||||||||||||||||
| Natural gas liquids | — | — | — | — | 30.95 | 42.89 | N/A | — | — | 36.70 | |||||||||||||||||||||||||
| Gas | — | 12.80 | — | — | 3.66 | — | — | — | — | 5.15 | |||||||||||||||||||||||||
| 2022 | |||||||||||||||||||||||||||||||||||
Crude oilb | — | 71.14 | — | — | 78.05 | 86.73 | 102.84 | 90.16 | — | 90.18 | |||||||||||||||||||||||||
Natural gas liquidsd | — | — | — | — | 46.64 | — | N/A | — | — | 46.64 | |||||||||||||||||||||||||
| Gas | — | 24.23 | — | — | 4.75 | — | 4.35 | — | — | 6.91 | |||||||||||||||||||||||||
| 2021 | |||||||||||||||||||||||||||||||||||
Crude oilb | — | 69.23 | — | — | 62.62 | — | 61.98 | — | — | 62.60 | |||||||||||||||||||||||||
Natural gas liquidsd | — | — | — | — | 42.47 | — | N/A | — | — | 42.47 | |||||||||||||||||||||||||
| Gas | — | 15.26 | — | — | 3.44 | — | 1.69 | — | — | 2.49 | |||||||||||||||||||||||||
Average production cost per unit of productione
| $ per unit of production | |||||||||||||||||||||||||||||||||||
| Europe | North America | South America | Africa | Asia | Australasia | Total group average | |||||||||||||||||||||||||||||
| UK | Rest of Europe | US | Rest of North America | Russia | Rest of Asia | ||||||||||||||||||||||||||||||
| Subsidiaries | |||||||||||||||||||||||||||||||||||
| 2023 | 10.69 | — | 9.61 | — | 4.53 | 2.52 | — | 2.81 | 2.09 | 5.78 | |||||||||||||||||||||||||
| 2022 | 10.36 | — | 9.70 | 15.36 | 3.92 | 5.02 | — | 3.52 | 2.04 | 6.07 | |||||||||||||||||||||||||
| 2021 | 13.97 | — | 9.17 | 13.18 | 4.49 | 6.17 | — | 4.92 | 2.27 | 6.82 | |||||||||||||||||||||||||
| Equity-accounted entities | |||||||||||||||||||||||||||||||||||
| 2023 | — | 6.22 | — | — | 17.87 | 15.46 | — | 16.41 | — | 14.38 | |||||||||||||||||||||||||
| 2022 | — | 6.01 | — | — | 15.55 | 21.01 | 7.39 | 20.81 | — | 11.47 | |||||||||||||||||||||||||
| 2021 | — | 9.75 | — | — | 11.21 | — | 2.76 | — | — | 3.82 | |||||||||||||||||||||||||
aUnits of production are barrels for liquids and thousands of cubic feet for gas. Realizations include transfers between businesses, except in the case of Russia.
bIncludes condensate.
cIn certain countries it is common for equity-accounted entities’ agreements to include pricing clauses that require selling a significant portion of the entitled production to local governments or markets at discounted prices.
dNatural gas liquids for Russia are included in crude oil.
eUnits of production are barrels for liquids and thousands of cubic feet for gas. Amounts do not include ad valorem and severance taxes.
350 | bp Annual Report and Form 20-F 2023 | |||||||||||||
| Additional disclosures | ||
Additional information for customers & products
Reconciliation of customers & products RC profit before interest and tax to underlying RC profit before interest and tax to adjusted EBITDA« by business
| $ million | ||||||||||||||
| 2023 | 2022 | 2021 | ||||||||||||
| RC profit before interest and tax for customers & products | 4,230 | 8,869 | 2,208 | |||||||||||
Less: Adjusting items gains (charges) | (2,183) | (1,920) | (1,044) | |||||||||||
| Underlying RC profit before interest and tax for customers & products | 6,413 | 10,789 | 3,252 | |||||||||||
| By business: | ||||||||||||||
| customers – convenience & mobility | 2,644 | 2,966 | 3,052 | |||||||||||
| Castrol – included in customers | 730 | 700 | 1,037 | |||||||||||
| products – refining & trading | 3,769 | 7,823 | 200 | |||||||||||
| Add back: Depreciation, depletion and amortization | 3,548 | 2,870 | 3,000 | |||||||||||
| By business: | ||||||||||||||
| customers – convenience & mobility | 1,736 | 1,286 | 1,306 | |||||||||||
| Castrol – included in customers | 167 | 153 | 150 | |||||||||||
| products – refining & trading | 1,812 | 1,584 | 1,694 | |||||||||||
| Adjusted EBITDA for customers & products | 9,961 | 13,659 | 6,252 | |||||||||||
| By business: | ||||||||||||||
| customers – convenience & mobility | 4,380 | 4,252 | 4,358 | |||||||||||
| Castrol – included in customers | 897 | 853 | 1,187 | |||||||||||
| products – refining & trading | 5,581 | 9,407 | 1,894 | |||||||||||
Sales volume
| thousand barrels per day | ||||||||||||||
| 2023 | 2022 | 2021 | ||||||||||||
Marketing salesa | 2,718 | 2,613 | 2,439 | |||||||||||
Trading/supply salesb | 358 | 350 | 393 | |||||||||||
| Total refined product sales | 3,076 | 2,963 | 2,832 | |||||||||||
Crude oilc | 102 | 184 | 249 | |||||||||||
| Total | 3,178 | 3,147 | 3,081 | |||||||||||
aMarketing sales include branded and unbranded sales of refined fuel products and lubricants to business-to-business and business-to-consumer customers, including service station dealers, jobbers, airlines, small and large resellers such as hypermarkets, and the military.
bTrading/supply sales are fuel sales to large unbranded resellers and other oil companies.
cCrude oil sales relate to third-party transactions executed primarily by trading and shipping. In addition, reported crude oil sales in 2023 includes 68 thousand barrels per day (2022 67 thousand barrels per day and 2021 50 thousand barrels per day) relating to volumes sold directly by the gas & low carbon energy and oil production & operations segments.
In the table above, volumes of crude oil and refined product trading/supply sales are presented on a basis consistent with income statement presentation. These figures do not correspond to actual volumes of physically traded energy products and are not intended for use in assessing emissions volumes or carbon intensity. Marketing volumes shown represent physically delivered transactions regardless of income statement presentation of such transactions.
Reconciliation of customers & products RC profit before interest and tax to convenience gross margin
| $ million | ||||||||||||||
| 2023 | 2022 | 2021 | ||||||||||||
| RC profit before interest and tax for customers & products | 4,230 | 8,869 | 2,208 | |||||||||||
| Subtract RC profit (loss) before interest and tax for refining & trading | 1,943 | 6,008 | (468) | |||||||||||
| 2,287 | 2,861 | 2,676 | ||||||||||||
| Net (favourable) adverse impact of adjusting items for convenience & mobility | 357 | 105 | 376 | |||||||||||
| Underlying RC profit before interest and tax for convenience & mobility | 2,644 | 2,966 | 3,052 | |||||||||||
Subtract underlying RC profit before interest and tax for Castrol | 730 | 700 | 1,037 | |||||||||||
| Add back convenience & mobility (excluding Castrol) depreciation, depletion and amortization | 1,569 | 1,133 | 1,156 | |||||||||||
Subtract convenience & mobility (excluding Castrol) production and manufacturing, distribution and administration expenses and adjusted for fuels, EV charging, aviation, B2B and midstream gross margina | 1,363 | 1,655 | 1,335 | |||||||||||
| Subtract earnings from equity-accounted entities in convenience & mobility (excluding Castrol) | 457 | 225 | 330 | |||||||||||
Convenience gross marginb | 1,663 | 1,519 | 1,506 | |||||||||||
| Foreign exchange effects | — | 7 | (122) | |||||||||||
| At constant foreign exchange | 1,663 | 1,526 | 1,384 | |||||||||||
Convenience gross margin growthc | 9% | |||||||||||||
aAdjusted for portfolio changes.
bExcluding TravelCenters of America and adjusted for other portfolio changes.
cValues are at end 2023 foreign exchange rates. This requires a calculation of the comparative convenience gross margin ($ million) at current period foreign exchange rates (constant foreign exchange) to compare the current period value with the restated comparative period value.
« See glossary on page 373 | bp Annual Report and Form 20-F 2023 | 351 | ||||||||||||
Retail sitesa
| Number of bp-branded retail sites | ||||||||||||||
| 2023 | 2022 | 2021 | ||||||||||||
| US | 8,200 | 7,750 | 7,450 | |||||||||||
| Europe | 8,050 | 8,150 | 8,250 | |||||||||||
| Rest of world | 4,850 | 4,750 | 4,800 | |||||||||||
| Total | 21,100 | 20,650 | 20,500 | |||||||||||
aReported to the nearest 50. Includes sites operated by dealers, jobbers, franchisees, brand licensees or joint venture (JV) partners, under the bp brand. These may move to and from the bp brand as their fuel supply agreement or brand licence agreement expires and are renegotiated in the normal course of business. Retail sites are primarily branded bp, ARCO, Amoco, Aral, Thorntons and TravelCenters of America and also include sites in India through our Jio-bp JV.
Refinery throughputsa b c
| thousand barrels per day | ||||||||||||||
| 2023 | 2022 | 2021 | ||||||||||||
| US | 662 | 678 | 719 | |||||||||||
| Europe | 749 | 804 | 787 | |||||||||||
| Rest of world | — | 22 | 88 | |||||||||||
| Total | 1,411 | 1,504 | 1,594 | |||||||||||
| % | ||||||||||||||
Refining availability« | 96.1 | 94.5 | 94.8 | |||||||||||
aThis does not include bp’s interest in Pan American Energy Group.
bRefinery throughputs reflect crude oil and other feedstock volumes.
cOn 28 February 2023, bp completed the sale of its 50% interest in the bp-Husky Toledo refinery in Ohio, US, to Cenovus Energy, its partner in the facility.
Refinery capacity
The following tablea b summarizes bp's average daily crude distillation capacities as at 31 December 2023.
Crude distillation capacitiesc | ||||||||||||||
| Country | Refinery | thousand barrels per day | ||||||||||||
| US | ||||||||||||||
| US North West | US | Cherry Point | 251 | |||||||||||
| US Mid West | Whiting | 440 | ||||||||||||
| 691 | ||||||||||||||
| Europe | ||||||||||||||
| North West Europe | Germany | Gelsenkirchen | 265 | |||||||||||
| Lingen | 97 | |||||||||||||
| Netherlands | Rotterdam | 394 | ||||||||||||
| Mediterranean | Spain | Castellón | 110 | |||||||||||
| 866 | ||||||||||||||
Total capacity at 31 December 2023 | 1,557 | |||||||||||||
aThis does not include bp’s interest in Pan American Energy Group.
bOn 28 February 2023, bp completed the sale of its 50% interest in the bp-Husky Toledo refinery in Ohio, US, to Cenovus Energy, its partner in the facility.
cCrude distillation capacity is gross rated capacity, which is defined as the highest average sustained unit rate for a consecutive 30-day period under normal operational conditions.
352 | bp Annual Report and Form 20-F 2023 | |||||||||||||
| Additional disclosures | ||
Environmental expenditure
| $ million | ||||||||||||||
| 2023 | 2022 | 2021 | ||||||||||||
| Operating expenditure | 524 | 416 | 362 | |||||||||||
| Capital expenditure | 329 | 224 | 222 | |||||||||||
| Clean-ups | 23 | 16 | 17 | |||||||||||
| Additions to environmental remediation provision | 228 | 502 | 363 | |||||||||||
| Increase (decrease) in decommissioning provision | 920 | 1,248 | 1,231 | |||||||||||
Operating and capital expenditure on the prevention, control, treatment or elimination of air and water emissions and solid waste is often not incurred as a separately identifiable transaction. Instead, it forms part of a larger transaction that includes, for example, normal operations and maintenance expenditure. The figures for environmental operating and capital expenditure in the table are therefore estimates, based on the definitions and guidelines of the American Petroleum Institute.
Environmental operating expenditure of $524 million in 2023 (2022 $416 million) showed an overall increase of 26%, largely due to increased expenditure in BP Rotterdam and BP North America Gas.
Environmental capital expenditure of $329 million in 2023 (2022 $224 million) showed an overall increase of 47% largely due to increased expenditure for BP Products North America and BP North America Gas.
Clean-up costs were $23 million in 2023 (2022 $16 million), representing oil spill clean-up costs and other associated remediation and disposal costs.
In addition to operating and capital expenditure, we also establish provisions for future environmental remediation work. Expenditure against such provisions normally occurs in subsequent periods and is not included in environmental operating expenditure reported for such periods.
Provisions for environmental remediation are made when a clean-up is probable and the amount of the obligation can be reliably estimated. Generally, this coincides with the commitment to a formal plan of action or, if earlier, on divestment or on closure of inactive sites.
The extent and cost of future environmental restoration, remediation and abatement programmes are inherently difficult to estimate. They often depend on the extent of contamination, and the associated impact and timing of the corrective actions required, technological feasibility and bp’s share of liability. Though the costs of future programmes could be significant and may be material to the results of operations in the period in which they are recognized, it is not expected that such costs will be material to the group’s overall results of operations or financial position.
Additions to our environmental remediation provision reflect new liabilities and scope/cost reassessments of the remediation plans of a number of our sites, primarily in the US. The charge for environmental remediation provisions in 2023 arising from new and acquired sites was $37 million (2022 $67 million and 2021 $33 million).
In addition, we make provisions on installation of our oil and gas producing assets and related pipelines to meet the cost of eventual decommissioning. On installation of an oil or natural gas production facility, a provision is established that represents the discounted value of the expected future cost of decommissioning the asset.
In 2023, the net increase in the decommissioning provision was primarily due to recognition of additional provisions and changes in cost estimate assumptions.
We undertake periodic reviews of existing provisions. These reviews take account of revised cost assumptions, changes in decommissioning requirements and any technological developments.
Provisions for environmental remediation and decommissioning are usually established on a discounted basis, as required by IAS 37 ‘Provisions, Contingent Liabilities and Contingent Assets’.
Further details of decommissioning and environmental provisions appear in Financial statements – Note 23.
Regulation of the group’s business
Our businesses and operations are subject to the laws and regulations applicable in each country, state or other regional or local area in which they occur. These cover virtually all aspects of bp’s activities and include matters such as the acquisition of rights to develop and operate projects, production rates, royalties, environmental, health and safety protection, fuel specifications and transportation, trading, pricing, anti-trust, export, taxes, and foreign exchange.
Oil and gas contractual and regulatory framework
The terms and conditions of the leases, licences and contracts under which our upstream oil and gas interests are held vary from country to country. These leases, licences and contracts are generally granted by or entered into with a government entity or state-owned or controlled company and are sometimes entered into with private property owners. Arrangements with governmental or state entities usually take the form of licences or production-sharing agreements« (PSAs), although arrangements with private entities and the US government entities are usually by lease.
Licences (or concessions) give the holder the right to explore for, develop and produce a commercial discovery. Under a licence, the holder bears the risk of exploration, development and production activities and provides the financing for these operations. In principle, the licence holder is entitled to all production, minus any royalties that are payable in kind. A licence holder is generally required to pay production taxes or royalties, which may be in cash or in kind.
In certain countries, separate licences are required for exploration and production activities, and in some cases production licences are limited to only a portion of the area covered by the original exploration licence.
PSAs entered into with a government entity or state-owned or state-controlled company generally require bp (alone or with other contracting companies) to provide all the financing and bear the risk of exploration and production activities in exchange for a share of the production remaining after royalties, if any. Less typically, bp may explore for, develop and produce hydrocarbons under a service agreement with the host entity in exchange for reimbursement of costs and/or a fee paid in cash rather than production.
bp frequently conducts its exploration and production activities in joint arrangements or co-ownership arrangements with other international oil companies, state-owned or -controlled companies and/or private companies. Conventionally, all costs, benefits, rights, obligations, liabilities and risks incurred in carrying out joint arrangement or co-ownership operations under a lease, licence or PSA are shared among the joint arrangement or co-owning parties according to agreed ownership interests which are set out in a joint operating agreement. To the extent that any liabilities arise, whether to governments or third parties, or as between the joint arrangement parties or co-owners themselves, each joint arrangement party or co-owner will generally be liable under the terms of a joint operating agreement to meet these in proportion to its ownership interest. Any agreed allocation of liability amongst the joint arrangement parties is, however, often different to the position under the relevant licence, lease or PSA which may provide for joint and several liability of the joint arrangement parties including for decommissioning obligations. In many upstream operations, a party (known as the operator) will be appointed (pursuant to a joint operating agreement) to carry out day to-day operations on behalf of the joint arrangement or co-ownership. The operator is typically one of the joint arrangement parties or a co-owner and will carry out its duties either through its own staff, or by contracting out various elements to third-party contractors or service providers. bp acts as operator on behalf of joint arrangements and co-ownerships in a number of countries.
Frequently, work (including drilling and related activities) will be contracted out to third-party service providers. The relevant contract will specify the work, the remuneration, and typically the risk allocation between the parties. Depending on the service to be provided, the contract may also contain provisions allocating risks and liabilities associated with pollution and environmental damage, damage to a well or hydrocarbon reservoirs and for claims from third parties or other losses. The allocation of those risks
« See glossary on page 373 | bp Annual Report and Form 20-F 2023 | 353 | ||||||||||||
varies among contracts and is determined through negotiation between the parties.
In general, bp incurs income tax on income generated from production activities (whether under a licence or PSA). In addition, depending on the area, bp’s production activities may be subject to a range of other taxes, levies and assessments, including special petroleum taxes and revenue taxes. The taxes imposed on oil and gas production profits and activities may be substantially higher than those imposed on other activities, for example in Egypt, the UK, the US and the United Arab Emirates.
Low carbon energy – renewables contractual and regulatory framework
The majority of our renewable assets are held indirectly through interests in incorporated joint ventures or special purpose entities (in either case, a Project Company). The renewables contractual and regulatory framework and the rights granted in relation to a renewable asset significantly vary from country to country. In some countries, the regulatory framework is still under development or subject to significant change as the renewables industry evolves.
In general terms the rights to a renewable asset are usually held by a Project Company through a package of assets that together form the renewable project owned by such Project Company, including:
•one or more leases, easements, or licences over land or seabed granted by a public or private individual or entity that grant the Project Company rights to develop, build and operate the renewable asset in such areas of land or seabed;
•one or more generation licences that grant the Project Company the right to produce and sell the electricity to the market;
•an interconnection agreement that grants the Project Company the right to connect the power project into the grid;
•an offtake agreement which, depending on the country’s electricity market, is entered into with a utility company, a corporate buyer or a public entity; and
•potentially, a subsidy mechanism in the form of a feed in tariff, contract for difference, hedging mechanism or renewable energy certificate to support the development of the project.
The risk allocation between the developer/generator and the host government or private entity has not been standardized in the industry. However, in general terms the Project Company bears the risk of the development, construction and operation of the renewable energy project and secures the financing for these operations and receives any profit from the revenue generated through the offtake agreement and/or subsidy mechanism (if available).
US Inflation Reduction Act
The US Inflation Reduction Act (IRA), which was signed into law in August 2022, includes a significant package of largely supply-side measures supporting low carbon energy sources and decarbonization technologies in the US. The impact of the IRA both on bp’s businesses and more widely on the US economy is likely to depend on various factors which are currently uncertain, including the implementation of the incentive programmes by the US authorities through the Department of Energy (DOE) and other agencies, as well as regulatory initiatives at the local and federal level.
In 2023, bp participated in applications for and was subsequently notified that it will be awarded various DOE grants related to certain of bp’s low carbon energy and decarbonization projects. bp and its co-applicants are currently negotiating the applicable award agreements with the DOE and we anticipate finalizing these agreements in 2024.
Greenhouse gas regulation
In December 2015, nearly 200 nations at the United Nations climate change conference in Paris (COP21) agreed to the Paris Agreement which aims to hold the increase in the global average temperature to well below 2°C above pre-industrial levels and to pursue efforts to limit the temperature increase to 1.5°C above pre-industrial levels. Signatories aim to reach global peaking of greenhouse gas (GHG) emissions as soon as possible and to undertake rapid reductions thereafter, so as to achieve a balance between human caused emissions and removals by sinks of GHGs in the second half of this century. The Paris Agreement commits all signatories to submit Nationally Determined Contributions (NDCs) (i.e. pledges or plans of
climate action) and pursue domestic measures aimed at achieving the objectives of their NDCs. Signatories are required to submit revised NDCs every five years, and the revised NDCs are expected to be more ambitious with each revision. The first global stocktake of progress was published by the United Nations in September 2023 and further assessments will occur every five years. The UAE conference (COP28) in Dubai, which took place in November and December 2023, marked the conclusion and outcome of this first stocktake and reached a ‘consensus’ which includes calls for an acceleration of efforts towards the phase-down of unabated coal power and to transition away from fossil fuels in energy systems.
More stringent national and regional measures relating to the transition to a lower carbon economy, such as the UK's 2050 net zero carbon emissions commitment, can be expected in the future. These measures could increase bp’s production costs for certain products, increase compliance and litigation costs, increase demand for competing energy alternatives or products with lower-carbon intensity, and affect the sales and specifications of many of bp’s products. Further, such measures could lead to constraints on production and supply and access to new reserves, particularly due to the long-term nature of many of bp’s projects.
Certain current and announced GHG measures and developments potentially affecting bp’s businesses in various markets in which bp operates are summarized below. For information on steps that bp is taking in relation to climate change issues and for details of bp’s GHG reporting, see Sustainability – Net zero aims on page 48.
United States
In the US, bp's operations are affected by GHG regulation in a number of ways. The federal Clean Air Act (CAA) regulates air emissions, permitting, fuel specifications and other aspects of our production, refining, distribution and marketing activities.
In November, 2023, the Environmental Protection Agency (EPA) promulgated the “Standards of Performance for New, Reconstructed, and Modified Sources and Emissions Guidelines for Existing Sources: Oil and Natural Gas Sector Climate Review.” These regulations are focused on methane emissions from oil and gas production at new and existing facilities and include significant requirements in the areas of fugitive emissions monitoring and repair, flaring, emission event reporting, process controller and pump emissions, and storage vessels.
The IRA requires EPA to collect an annual Waste Emissions Charge (WEC) on methane emissions from oil and natural gas facilities that exceed specific levels of emissions and methane intensity. The WEC is $900/metric ton of methane emissions occurring in 2024, $1,200/metric ton for emissions occurring in 2025, and $1,500/metric ton for emissions occurring in 2026 and years thereafter. In January 2024, EPA proposed regulations to implement the WEC provisions of the IRA. The date and details of those final regulations to be issued are uncertain.
Other EPA GHG and environmental regulations affect electricity generation practices and prices and have an impact on the market for fuels used to generate electricity and on renewable energy installations. These regulations are in flux due to changes in approach between presidential administrations, as well as lawsuits challenging those regulations.
In June 2022, the Supreme Court decision in West Virginia v. EPA limited EPA’s regulatory authority to require electricity 'generation shifting' (e.g., from coal to natural gas or renewable sources). In May 2023, EPA proposed new carbon pollution standards for coal and gas-fired power plants. The proposed regulations would tighten emissions limits for those plants and require some plants to install carbon capture technology. The date and requirements of any final regulations issued are uncertain.
In April 2023, EPA proposed regulations to significantly tighten emissions standards for light- and medium-duty vehicles for model year (MY) 2027 and beyond. The proposed regulations are intended to spur emissions reductions technology on hydrocarbon-powered vehicles and to encourage the transition to electric vehicles. The date and requirements of any final regulations issued are uncertain.
The Energy Policy Act of 2005 and the Energy Independence and Security Act of 2007 impose the Renewable Fuel Standard (RFS), requiring transportation fuel sold in the United States to contain a minimum volume of renewable fuels. On June 21, 2023, EPA announced a final rule establishing biofuel volume requirements and associated percentage
354 | bp Annual Report and Form 20-F 2023 | |||||||||||||
| Additional disclosures | ||
standards for cellulosic biofuel, biomass-based diesel (BBD), advanced biofuel, and total renewable fuel for 2023-25. Lawsuits have been filed challenging this final rule. In addition, certain state initiatives impose carbon-intensity reduction requirements on transportation fuels sold in those states (e.g. in California, Oregon and Washington).
The federal GHG Mandatory Reporting Rule requires operators of certain facilities and producers and importers/exporters of petroleum products to file annual GHG emissions reports with EPA quantifying direct emissions from affected facilities, as well as the emissions that would result from the release or combustion of the petroleum products imported, exported or produced.
A number of states, municipalities and regional organizations continue to advance climate initiatives that affect our US operations. For example, certain state initiatives impose carbon-intensity reduction requirements on transportation fuels sold in those states (e.g. in California, Oregon, and Washington). Recently, California proposed to increase the stringency of its Low Carbon Fuel Standard (LCFS) to achieve a 30% reduction in carbon intensity required by 2030 (up from 20%). The State of Washington enacted state-wide carbon cap and invest legislation and a Clean Fuel Program (similar to California’s LCFS) in 2021. In 2022, the State of Washington finalized rules implementing both of those programmes.
Our US businesses are subject to increased GHG and other environmental requirements and regulatory uncertainty, including that the current or any future US administration could revise or revoke current or prior administration programmes, as well as the possibility of increased expenditures in having to comply with numerous diverse and non-uniform regulatory initiatives at the state and local level.
US fuel markets are affected by EPA and National Highway Traffic Safety Administration (NHTSA) regulation of light, medium and heavy-duty vehicle emissions (both fuel economy and tailpipe standards) as well as for non-road engines and vehicles and certain large GHG stationary emission sources. California also imposes Low Emission Vehicle (LEV) and Zero Emission Vehicle (ZEV) standards on vehicle manufacturers, and a number of other states, as allowed by CAA authority, have adopted California’s standards. In August 2022, California finalized the next generation of its GHG and ZEV standards (referred to as 'ACC II'). California filed a waiver application with EPA in December 2023. Fifteen other states have adopted ACC II although EPA has not yet acted upon the application. These regulations may impact bp’s product mix and demand for particular products in those states. In August 2020, California also entered into agreements with several carmakers to meet more demanding emissions standards in California. In March 2023, EPA granted California’s request for a waiver of pre-emption covering, in part, its Advanced Clean Trucks Program, which mandates increasing quantities of ZEV sales for medium- and heavy-duty vehicles in the state. A legal challenge to that decision is pending in the U.S. Court of Appeals for the D.C. Circuit.
In 2021 and 2022, the Biden administration revised the fuel economy and tailpipe carbon dioxide emissions standards for passenger cars and light trucks covering model years (MY) 2023 through 2026. The revised standards are more stringent through MY 2026 than the August 2020 agreements California reached with several carmakers. EPA’s new tailpipe carbon dioxide emissions standards were challenged in the U.S. Court of Appeals with a decision still pending. EPA has also restored California’s Clean Air Act waiver allowing it to set its own GHG automotive tailpipe standards and for other states to adopt those standards. That decision has also been challenged in the U.S. Court of Appeals.
In December 2022, EPA promulgated regulations establishing new emission standards for oxides of nitrogen (NOx) and other pollutants for highway heavy-duty engines. California has also adopted a 'Heavy-Duty Low NOx Omnibus Regulation' which will require manufacturers to comply with stricter emissions standards and a number of other states have opted or are planning to opt into those California standards. The rule is being phased in, with the first phase effective in 2024. bp continues to monitor these rules for implications for fuels. These and other EPA initiatives to reduce GHG emissions may have a significant effect on the production, sale and profitability of many of bp’s products in the US.
European Union
The EU has adopted a goal of achieving climate neutrality by 2050 as part of the European Green Deal and, subsequently, a 55% GHG reduction target
by 2030 compared to 1990 levels. To achieve this target, EU member states and Parliament adopted most measures proposed as part of the so-called ‘Fit for 55’ package. These include revisions of the EU Emissions Trading Scheme (EU ETS) and a newly created Carbon Border Adjustment Mechanism (CBAM); the Renewable Energy Directive (RED) – including an obligation on transport fuel suppliers to increase the share of renewables of their fuel supply; a sustainable aviation fuel (SAF) blending mandate from 2025; and CO2 targets for the sales of new vehicles which are expected to accelerate the decarbonisation of the transport sector and impact fuel demand.
Once fully adopted and implemented, this would inter alia lead to higher shares of renewables across all sectors (including transport), a reduced number of GHG emission allowances under the EU ETS, and a target of zero gramme of CO2 per km for new passenger cars by 2035. The EU also adopted measures to reduce methane emissions.
Some EU member states have adopted national targets above and beyond current EU climate goals, such as Germany, with a climate neutrality target by 2045.
United Kingdom
In April 2021, the UK government announced a target of a 78% reduction in emissions by 2035 compared to 1990 levels.
The UK Emissions Trading System (UK ETS) launched on 1 January 2021 following the end of the Brexit transition period and the UK’s participation in the EU ETS. It seeks to provide a carbon pricing mechanism as a tool for helping achieve the UK's net zero target and covers the same GHGs and sectors as the EU ETS. bp’s North Sea operations are subject to the UK ETS.
In July 2023, the UK government published a response to a 2022 consultation on proposed changes to the UK ETS rules. That response included decisions to expand the scope of the scheme to include domestic maritime transport from 2026, waste incineration and energy from waste from 2028 and process emissions from carbon dioxide venting from the upstream oil and gas sector from 2025.
In December 2023, the UK ETS Authority published two consultations. One covers a review of the UK ETS markets policy and the other relates to a review of free allocation methodology for the stationary sectors under the UK ETS to better target those most at risk of carbon leakage.
Other countries and regions
China is operating emission trading pilot programmes in a number of cities and provinces. One of bp's subsidiaries in China is participating in these programmes. In February 2021 China introduced a national emissions trading market (National ETS). The National ETS is intended to be an essential tool for China to fulfil its commitment to reach peak emissions by 2030 and carbon neutrality by 2060. For now, the National ETS participants are limited to the key emission entities identified by each provincial-level government authority and approved by Ministry for Ecology and Environment of China. bp is not participating in the National ETS.
In October 2021, as part of its ‘1+N’ climate policy framework, China issued working guidance setting out specific targets and measures for achieving peak carbon emissions and carbon neutrality, and an action plan which sets out the main objectives for the next decade to achieve peak carbon emissions by 2030. The working guidance is the '1' (i.e., a long-term approach to combating climate change), while 'N' are various policies starting with the action plan. In June 2022, 17 government authorities jointly released the National Climate Change Adaptation Strategy 2035 making overall plans to prepare the country to adapt to climate change from the present to 2035.
China's domestic voluntary carbon mechanism called the China Certified Emission Reduction (CCER) programme has been suspended since 2017. In 2023, significant progress toward relaunching the CCER has been made by relevant authorities, including the promulgation of a regulation on CCER trading for trial implementation and the publication of methodologies that will be used to quantify net emission reductions or removals for four types of projects (forestation, solar thermal power, offshore wind power generation and mangrove revegetation).
On 5 January 2024, China’s State Council approved an interim regulation for the national emissions trading scheme. The final version was issued on 4 February 2024 which has provisions on defining the scale of the national
« See glossary on page 373 | bp Annual Report and Form 20-F 2023 | 355 | ||||||||||||
carbon market, determining allocation of emissions allowances and data quality supervision.
Other environmental regulation
In addition to the GHG regulations referred to above, climate change programmes and regulation of unconventional oil and gas extraction under a number of environmental laws may have a significant effect on the production, sale and profitability of many of bp’s products.
Environmental laws also require bp to remediate and restore areas affected by the release of hazardous substances or hydrocarbons associated with our operations or properties. These laws may apply to sites that bp currently owns or operates, sites that it previously owned or operated, or sites used for the disposal of its and other parties’ waste. See Financial statements – Note 23 for information on provisions for environmental restoration and remediation.
A number of pending or anticipated governmental proceedings against certain bp group companies under environmental laws could result in monetary or other sanctions. Group companies are also subject to environmental claims for personal injury and property damage alleging the release of, or exposure to, hazardous substances. The costs associated with future environmental remediation obligations, governmental proceedings and claims could be significant and may be material to the results of operations in the period in which they are recognized. We cannot accurately predict the effects of future developments, such as stricter environmental laws and regulations or enforcement policies, or future events at our facilities on the group, and there can be no assurance that material liabilities and costs will not be incurred in the future. For a discussion of the group’s environmental expenditure, see page 353 and for a discussion of legal proceedings, see page 242.
Significant health, safety and environmental legislation and regulation affecting our businesses and profitability, in addition to those referred to above, include the following:
United States
•The Clean Water Act regulates wastewater and other effluent discharges from bp’s facilities, and bp is required to obtain discharge permits, install control equipment and implement operational controls and preventative measures.
•The Resource Conservation and Recovery Act (RCRA) regulates the generation, storage, transportation and disposal of wastes associated with our operations and can require corrective action at locations where such wastes have been disposed of or released. bp has incurred, or is likely to incur, liability under RCRA or similar state laws in connection with sites bp operates or previously operated.
•The Comprehensive Environmental Response, Compensation, and Liability Act (CERCLA) can, in certain circumstances, impose the entire cost of investigation and remediation on a party who owned or operated a site contaminated with a hazardous substance, or who arranged for disposal of a hazardous substance at a site. bp has incurred, or is likely to incur, liability under CERCLA or similar state laws, including costs attributed to insolvent or unidentified parties. bp is also subject to claims for remediation costs and natural resource damages under CERCLA and other federal and state laws. CERCLA also requires the reporting on the releases of certain quantities of listed hazardous substances to designated government agencies.
•The Emergency Planning and Community Right-to-Know Act requires reporting on the storage, use and releases of certain quantities of listed extremely hazardous substances to designated government agencies.
•The Toxic Substances Control Act (TSCA) regulates bp’s manufacture, import, export, sale and use of chemical substances and products. In addition, EPA has revised processes and procedures for prioritisation of existing chemicals for risk evaluation, assessment and management. Agency actions and announcements are monitored regularly to identify developments with potential impacts on chemical substances important to bp products and operations.
•The Occupational Safety and Health Act imposes workplace safety and health requirements on bp operations along with significant process safety management obligations, requiring continuous evaluation and improvement of operational practices to enhance safety and reduce
workplace emissions at gas processing, refining and other regulated facilities.
•The Oil Pollution Act 1990 (OPA) imposes operational requirements, liability standards and other obligations governing the transportation of petroleum products in US waters. States may impose additional obligations. Alaska, West Coast and certain East Coast states impose additional requirements and stricter liability standards.
•The Outer Continental Shelf Land Act, the Mineral Leasing Act and other statutes give the Department of Interior (DOI) and the BLM authority to regulate operations and air emissions, including equipment and testing, on offshore and onshore operations on federal lands subject to DOI authority.
•The Endangered Species Act (ESA) and Marine Mammal Protection Act protect certain species’ habitats from adverse human impacts by restricting operations or development at certain times and in certain places. In 2020, the US Fish and Wildlife Service published regulatory definitions impacting habitat designations under the ESA, but in June 2022, the Biden administration rescinded those definitions. The Biden administration rescission of those definitions could expand the geographic areas subject to habitat protections.
European Union
•The Industrial Emissions Directive (IED) 2010 provides the framework for granting permits for major industrial sites. A recently agreed revision of the IED could, once formally adopted and implemented, potentially set more stringent permitting requirements, and lead to a further tightening of emission limit values.
•The EU Registration, Evaluation Authorization and Restriction of Chemicals (REACH) Regulation 2006 requires registration of chemical substances manufactured in or imported into the EU, together with the submission of relevant hazard and risk data. REACH affects our manufacturing or trading/import operations in the EU. bp maintains compliance by checking whether imports are covered by the registrations of non-EU suppliers’ representatives, preparing and submitting registration dossiers to cover new manufactured and imported substances, and updating previously submitted registrations as required.
•The Water Framework Directive (WFD) published in 2000 aims to protect the quantity and quality of ground and surface waters of the EU member states. The implementation in the EU member states is still ongoing, planned to be finalised by 2027. Future proceedings on the determination of pollutants/priority substances as well as environmental quality standards in line with the WFD may require additional compliance efforts and increased costs for managing freshwater withdrawals and discharges from bp’s EU operations.
•The Corporate Sustainability Reporting Directive (CSRD) entered into force on 5 January 2023 introducing new requirements for companies with securities listed on an EU regulated market or which exceed a threshold for turnover derived in the EU, to include disclosures related to climate, the environment and wider sustainability issues. The CSRD also expands to in-scope entities the requirements introduced by the EU Taxonomy Regulation, to identify environmentally sustainable activities and then disclose metrics related to capital and operating expenditure and turnover associated with those activities. Disclosure requirements will be phased in from 2025, in respect of the 2024 financial year.
United Kingdom
•Following the UK’s exit from the European Union, operative EU laws were retained in UK law by the European Union (Withdrawal) Act 2018 (EUWA). In June 2023, the Retained EU Law (Revocation and Reform) Act 2023 received Royal Assent. That Act allows for significant changes to the status, operation and content of retained EU law, including through amendments to the EUWA. However, the UK government has not issued a policy statement on how it intends to use these powers and therefore future amendments to and deviations from retained EU law including in respect of environmental matters are uncertain.
•Since the end of the transition period on 31 December 2020, there has been a parallel UK REACH regime which applies in Great Britain only, with EU REACH continuing to apply in Northern Ireland. UK REACH
356 | bp Annual Report and Form 20-F 2023 | |||||||||||||
| Additional disclosures | ||
contains equivalent requirements to EU REACH, although future developments and potential divergences are uncertain.
•The Environment Act 2021 comprises various key parts including governance, waste and resource efficiency, air quality and environmental recall, water, nature and biodiversity and conservation covenants. The governance parts include a comprehensive framework for legally binding environmental improvement targets; to establish a framework for future policy statements on environmental principles to protect the environment by making environmental considerations a key part of policy development process across government; and to establish the Office for Environmental Protection, an independent public body to have oversight of environmental matters. The UK government’s first suite of environmental targets became law in January 2023, but these are not expected to have a material impact on bp.
Other countries and regions
Regulations governing the discharge of treated water have also been developed in countries outside of the US and EU including in Trinidad where bp commissioned a new wastewater treatment plant in 2020 to meet consent levels agreed with the regulators to apply relevant water discharge rules.
The Abidjan Convention, along with the Additional Protocol published in 2012, sets environmental quality standards for the discharge of chemicals to the marine environment. Mauritania and Senegal are both signatories to the Abidjan Convention. bp is currently constructing the offshore facilities to include produced water management systems to meet the environmental quality standards for our future gas operations in Mauritania and Senegal.
Environmental maritime regulations
bp’s shipping operations are subject to extensive national and international regulations governing operations, training, pollution prevention, liability, and insurance. These include:
•Liability and spill prevention and planning requirements governing, among others, tankers, barges, and offshore facilities are imposed by OPA in US waters. OPA also mandates a levy on imported and domestically produced oil to fund oil spill responses. Some states, including Alaska, Washington, Oregon and California, impose additional liability for oil spills. Outside US territorial waters, bp shipping tankers are subject to international pollution prevention, liability, spill response and preparedness regulations developed through the UN’s International Maritime Organization (IMO), including the International Convention on Civil Liability for Oil Pollution Damage, the International Convention for the Prevention of Pollution from Ships (MARPOL), the International Convention on Oil Pollution, Preparedness, Response and Co-operation, and the International Convention on Civil Liability for Bunker Oil Pollution Damage. In April 2010, the Hazardous and Noxious Substance (HNS) Protocol 2010 was adopted to address issues that have inhibited ratification of the International Convention on Liability and Compensation for Damage in Connection with the Carriage of Hazardous and Noxious Substances by Sea 1996. As at 31 December 2023, the HNS Convention had not entered into force.
•A global sulphur cap of 0.5% applies to marine fuel under MARPOL with a stricter 0.1% cap in environmentally sensitive areas. In order to comply, ships either need to consume low sulphur marine fuels, operate on alternative low sulphur fuels such as LNG or implement approved abatement technology to enable them to meet the low sulphur emissions requirements while continuing to use higher sulphur fuel. This global cap does not alter the lower 0.1% limits that apply in the sulphur oxides Emissions Control Areas established by the IMO.
•From 2023 all vessels over 400 gross tonnage became subject to IMO requirements as to energy efficiency design (EEXI) and the carbon intensity of operations (CII).
•Under EU legislation, maritime transport will be gradually brought into the scope of the EU ETS from 2024, applicable to all vessels over 5000 gross tonnage calling at EU ports regardless of a vessel’s flag.
•Under the proposed Fuel EU Maritime Regulation, from 2025 ship owners will need to reduce the GHG intensity of their fuel use gradually over time, initially by 2% by 2030 and 80% by 2050.
•The Convention for the Protection of the Marine Environment of the North-East Atlantic (OSPAR), aims to protect the marine environment of the North-East Atlantic. The OSPAR 2012 recommendation and guideline for the implementation of a risk-based approach to the management of produced water discharges from offshore installations in the North Sea supports a key goal of working towards eliminating harmful discharges. In 2020 the International Association of Oil and Gas Producers issued a report 'Oil And Gas Risk Based Assessment of Offshore Produced Water Discharges' which presents industry good practice and aims to broaden the understanding and acceptance of Risk Based Assessment (RBA) techniques internationally and improve consistency in the application of assumptions, levels of conservatism, and selection of risk endpoints.
To meet its financial responsibility requirements, bp shipping maintains marine oil pollution liability insurance in respect of its operated ships to a maximum limit of $1 billion for each occurrence through mutual insurance associations (P&I Clubs), although there can be no assurance that a spill would necessarily be adequately covered by insurance or that liabilities would not exceed insurance recoveries.
International trade sanctions
During the period covered by this report, non-US subsidiaries, or other non-US entities of bp, conducted limited activities in, or with persons from, certain countries identified by the US Department of State as State Sponsors of Terrorism or otherwise subject to US, EU and UK sanctions (Sanctioned Countries). In 2023, sanctions restrictions were insignificant to the group’s financial condition and results of operations. bp monitors its activities with Sanctioned Countries, persons from Sanctioned Countries and individuals and companies subject to US, EU and UK sanctions and seeks to comply with applicable sanctions laws and regulations.
bp has a 29.99% interest in and operates the Shah Deniz field in Azerbaijan (Shah Deniz), has a 29.99% interest in and performs some operations for a related gas pipeline entity, South Caucasus Pipeline Company Limited (SCPC), and has a 23.99% non-operating interest in a related gas marketing entity, Azerbaijan Gas Supply Company Limited (AGSC). Naftiran Intertrade Co. Limited and NICO SPV Limited (collectively, NICO) have a 10% non-operating interest in each of Shah Deniz and SCPC and an 8% non-operating interest in AGSC. Shah Deniz, SCPC and AGSC continue in operation as they were excluded from the application of US sanctions and fall within the exception for certain natural gas projects under Section 603 of the Iran Threat Reduction and Syria Human Rights Act of 2012 (ITRA).
On 3 December 2018 bp entered into an agreement with, among others, SOCAR and NICO pursuant to which SOCAR pays to BP Exploration (Shah Deniz) Limited (BPXSD), as the Shah Deniz operator, compensation for NICO’s waiver of its right to lift its share of Shah Deniz condensate. Such amounts are used to cover cash calls to NICO in respect of operating costs due from NICO to BPXSD. On 12 February 2022, OFAC issued a renewed licence in relation to these arrangements which expires on 15 April 2024. An application for a further renewal has been submitted and is subject to OFAC’s approval.
Following the imposition in 2011 of further US and EU sanctions against Syria, bp terminated all sales of crude oil and petroleum products into Syria, though bp continues to supply aviation fuel to non-governmental Syrian resellers outside of Syria.
bp has a joint arrangement in Cuba which imports, manufactures, markets and sells lubricants.
During 2014, the US and the EU imposed sanctions on certain sectors of the Russian economy (energy, finance and defence/military) and on certain individuals and entities, including Rosneft. These sectoral sanctions include restrictions on the provision of financial assistance, technical assistance, and services in relation to exploration and production activity in deepwater, shale, and offshore Arctic.
Additional US sanctions have been imposed since 2014, broadening the scope of US sanctions on Russia-related activity to include certain international deepwater, shale, and offshore Arctic projects as well as the provision of goods and services for Russian energy export pipelines.
In response to Russia’s military action in Ukraine in 2022, the US, EU, UK and many other countries have imposed broad economic and trade
« See glossary on page 373 | bp Annual Report and Form 20-F 2023 | 357 | ||||||||||||
sanctions. The scope of these sanctions includes restrictions on dealing with designated individuals and entities; restrictions on the Russian financial sector; blocking economic activity in certain areas of Ukraine not controlled by the Ukrainian government; prohibitions in relation to investment in Russia; prohibitions and restrictions relating to Russian origin oil and oil products; prohibitions and restrictions relating to Russian origin iron and steel products, prohibitions and restrictions relating to Russian origin metals, prohibitions and restrictions on the provision of certain legal advisory services, prohibitions and restrictions in relation to transportation, including shipping and aircraft; trade controls limiting the purchase and import of a wide range of goods from Russia, and export controls limiting the export of a wide range of goods and technical assistance to Russia.
In response, Russia has implemented counter-sanctions including restrictions on the divestment from Russian assets by foreign investors and restrictions on the payments of dividends to certain foreign shareholders, including those based in the UK, requiring such dividends to be paid in roubles into restricted bank accounts and a requirement for approval of the Russian government for transfers from any such bank accounts out of Russia.
The bp group does not source any materials directly from Russia, except deliveries of LNG from Russian sources under a small number of contracts predating the Russia and Ukraine conflict in compliance with all applicable sanctions. bp has also discontinued sales of our products to customers in Russia. Such sales were not material to the bp group. As a result, outside of our shareholding in Rosneft and related businesses in Russia, direct impacts due to exposure to Russia have not been material and are not expected to be material in the future. bp continues to monitor Russia related sanctions and other international restrictions for any impacts on our businesses and the exit of our shareholding in Rosneft. See page 173 for further information in relation to bp’s shareholding in Rosneft.
bp maintains bank accounts and has registered and paid required fees to maintain registrations of patents and trademarks in certain Sanctioned Countries.
bp has equity interests in non-operated joint arrangements with air fuel sellers, resellers, and fuel delivery services around the world. From time to time, the joint arrangement operator or other partners may sell or deliver fuel to airlines from Sanctioned Countries or flights to Sanctioned Countries, without bp’s involvement.
bp has no control over the activities non-controlled associates may undertake in Sanctioned Countries or with persons from Sanctioned Countries.
Disclosure pursuant to ITRA Section 219
To our knowledge, none of bp’s activities, transactions or dealings are required to be disclosed pursuant to ITRA Section 219, with the following possible exceptions.
In 2023, payments in relation to tax with an aggregate US dollar equivalent value of approximately $27,000 were paid from a bp trust account held with Tadvin Co. to Iranian public entities on behalf of BP Iran. No gross revenues or net profits are attributable to BP Iran's activities.
In February 2023, we identified that our European Fleet Business had issued 10 fuel cards to the embassy and consulate of Iran in both Germany and Austria. Fuel cards enable holders to acquire goods and services at bp retail sites and at retail sites operated by acceptance partners in Europe without payment in cash. Goods and services purchased with fuel cards are invoiced on a monthly or bi-monthly basis. As disclosed in the bp Annual Report and Form 20-F 2022, in 2023 the total aggregate invoiced amount was approximately $2,700. bp has terminated the cards and related accounts.
Material contracts
On 4 April 2016 the district court approved the Consent Decree among BP Exploration & Production Inc., BP Corporation North America Inc., BP p.l.c., the United States and the states of Alabama, Florida, Louisiana, Mississippi and Texas (the Gulf states) which fully and finally resolved any and all natural resource damages (NRD) claims of the United States, the Gulf states, and their respective natural resource trustees and all Clean Water
Act (CWA) penalty claims, and certain other claims of the United States and the Gulf states.
Concurrently, the definitive Settlement Agreement that bp entered into with the Gulf states (Settlement Agreement) with respect to State claims for economic, property and other losses became effective.
bp has filed the Consent Decree and the Settlement Agreement as exhibits to its Annual Report and Form 20-F 2020 filed with the SEC. For further details of the Consent Decree and the Settlement Agreement, see Legal proceedings in bp Annual Report and Form 20-F 2015.
Property, plant and equipment
bp has freehold and leasehold interests in real estate and other tangible assets in numerous countries, but no individual property is significant to the group as a whole. For more on the significant subsidiaries« of the group at 31 December 2023 and the group percentage of ordinary share capital see Financial statements – Note 37. For information on significant joint ventures« and associates« of the group see Financial statements – Notes 16 and 17.
Related party transactions
Transactions between the group and its significant joint ventures and associates are summarized in Financial statements – Note 16 and Note 17. In the ordinary course of its business, the group enters into transactions with various organizations with which some of its directors or executive officers are associated. Except as described in this report, the group did not have any material transactions or transactions of an unusual nature with, and did not make loans to, related parties in the period commencing 1 January 2023 to 16 February 2024.
Corporate governance practices
In the US, bp ADSs are listed on the New York Stock Exchange (NYSE). The significant differences between bp’s corporate governance practices as a UK company and those required by NYSE listing standards for US companies are listed as follows:
Independence
As set out on page 88, bp has adopted separate terms of reference for the board and each of its committees as part of its corporate governance framework. The terms of reference for the board and each of its committees are reviewed annually and were last updated with effect from 1 December 2021, excluding the audit committee terms of reference which were updated on 22 July 2022. The terms of reference reflect the UK Corporate Governance Code 2018 approach to corporate governance. As such, the way in which bp makes determinations of directors' independence differs from the NYSE approach.
bp’s corporate governance framework requires that all non-executive directors be determined by the board to be ‘independent in character and judgement and free from any business or other relationship which could materially interfere with the exercise of their judgement’. The bp board has determined that, in its judgement, all of the non-executive directors are independent. In doing so, however, the board did not explicitly take into consideration the independence requirements outlined in the NYSE’s listing standards.
Committees
bp has a number of board committees that are broadly comparable in purpose and composition to those required by NYSE rules for domestic US companies. For instance, bp has a remuneration (rather than a compensation) committee. bp also has an audit committee, which NYSE rules require for both US companies and foreign private issuers. These committees are composed solely of non-executive directors whom the board has determined to be independent, in the manner described above.
Each committee operates under its own terms of reference together with a set of terms applicable to all the committees (see the board committee reports on pages 94-132and bp.com/governance).
Under US securities law and the listing standards of the NYSE, bp is required to have an audit committee that satisfies the requirements of Rule 10A-3 under the Exchange Act and Section 303A.06 of the NYSE Listed
358 | bp Annual Report and Form 20-F 2023 | |||||||||||||
| Additional disclosures | ||
Company Manual. bp’s audit committee complies with these requirements. The bp audit committee does not have direct responsibility for the appointment, reappointment or removal of the independent auditors. Instead, it follows the UK Companies Act 2006 and the UK Corporate Governance Code 2018 by making recommendations to the board on these matters for it to put forward for shareholder approval at the AGM.
One of the NYSE’s additional requirements for the audit committee states that at least one member of the audit committee is to have ‘accounting or related financial management expertise’. The board determined that Tushar Morzaria possesses such expertise and also possesses the financial and audit committee experiences set forth in both the UK Corporate Governance Code 2018 and SEC rules (see Audit committee report on page 98). Mr Morzaria is the audit committee financial expert as defined in Item 16A of Form 20-F.
Summary of terms of reference for audit committee and remuneration committee
The audit committee’s full terms of reference are available on our website at bp.com/governance. A summary of the committee’s key responsibilities is provided below:
•Monitor and critically assess bp’s financial statements and financial information, including the integrity of the financial reporting and related processes, context in which statements are made, compliance with relevant legal and regulatory requirements and financial reporting standards, including the Task Force on Climate-related Financial Disclosures (TCFD).
•Assess the going concern assumption and the longer-term viability statement as to bp’s ability to continue to operate and meet its liabilities.
•Review and challenge the application and appropriateness of significant accounting policies and financial reporting judgements.
•Evaluate the risk to quality and effectiveness of the financial reporting process and, where requested by the board, advise whether the annual report and accounts are fair, balanced and understandable.
•Review the affordability of distributions to shareholders.
•Oversee the appointment, remuneration, independence and performance of the external auditor and the integrity of the audit process as a whole, including the engagement of the external auditor to supply non-audit services to bp.
•Review the effectiveness of the internal audit function, bp’s internal financial controls and its systems of internal control and risk management.
•Monitor the principal risks allocated to the committee by the board and review the mitigations proposed by management in respect of risks associated with bp internal financial controls and reporting responsibilities and such emerging risks that may fall within scope.
•Review the systems in place to enable those who work for bp to raise concerns about improprieties in financial reporting or other issues, and for those matters to be investigated.
The remuneration committee’s full terms of reference are available on our website at bp.com/governance. A summary of the committee’s key responsibilities is provided below:
•Recommend to the board the remuneration principles and policies for the executive directors and leadership team while considering remuneration and related policies for the employees below the board and leadership team.
•Set and approve the terms of engagement, remuneration, benefits and termination of employment for the executive directors, leadership team, chief internal auditor and the company secretary in accordance with the policy.
•Prepare the annual remuneration report to shareholders to outline policy implementation.
•Approve the principles of any equity plan that requires shareholder approval.
•Ensure termination terms and payments to executive directors and the leadership team are appropriate and fair.
•Receive and consider regular updates on workforce views and engagement initiatives related to remuneration, insights and data from pay ratios and potential pay gaps as appropriate.
•Maintain appropriate dialogue with shareholders on remuneration matters.
Shareholder approval of equity compensation plans
The NYSE rules for US companies require that shareholders must be given the opportunity to vote on all equity-compensation plans and material revisions to those plans. bp complies with UK requirements that are similar to the NYSE rules. The board, however, does not explicitly take into consideration the NYSE’s detailed definition of what are considered ‘material revisions’.
Code of ethics
The company has adopted a code of ethics for its chief executive officer, chief financial officer, SVP accounting, reporting and control and SVP internal audit whose roles are equivalent to the SEC roles as required by the provisions of Section 406 of the Sarbanes-Oxley Act of 2002 and the rules issued by the SEC. There have been no waivers from the code of ethics relating to any officers. A copy of the code of ethics can be found at bp.com/codeofethics.
The NYSE rules require that US companies adopt and disclose a code of business conduct and ethics for directors, officers and employees. bp has adopted a code of conduct, which applies to all employees, officers and members of the board. This was updated and published in January 2023. In addition, bp has adopted a code of ethics as described above for the chief executive officer, chief financial officer, SVP accounting, reporting and control and SVP internal audit as required by the SEC. bp considers that these codes and policies address the matters specified in the NYSE rules for US companies. During 2021, the board adopted a diversity policy, which requires it to encourage a diverse and inclusive working environment in the boardroom, where everyone is accepted, valued and receives fair treatment according to their different needs and situations without discrimination or prejudice. The policy was reviewed by the board in 2022, and amendments were made to reflect regulatory changes and market practice. The updated policy was then approved and published in February 2023.
Controls and procedures
Evaluation of disclosure controls and procedures
The company maintains ‘disclosure controls and procedures’, as such term is defined in Exchange Act Rule 13a-15(e), that are designed to ensure that information required to be disclosed in reports the company files or submits under the Exchange Act is recorded, processed, summarized and reported within the time periods specified in the Securities and Exchange Commission rules and forms, and that such information is accumulated and communicated to management, including the company’s group chief executive and chief financial officer, as appropriate, to allow timely decisions regarding required disclosure.
In designing and evaluating our disclosure controls and procedures, our management, including the group chief executive and chief financial officer, recognize that any controls and procedures, no matter how well designed and operated, can provide only reasonable, not absolute, assurance that the objectives of the disclosure controls and procedures are met. Because of the inherent limitations in all control systems, no evaluation of controls can provide absolute assurance that all control issues and instances of fraud within the company, if any, have been detected. Further, in the design and evaluation of our disclosure controls and procedures our management necessarily was required to apply its judgement in evaluating the costs and benefits of possible control and procedure design options. Also, we have investments in unconsolidated entities. As we do not control these entities, our disclosure controls and procedures with respect to such entities are necessarily substantially more limited than those we maintain with respect to our consolidated subsidiaries«. Because of the inherent limitations in a cost-effective control system, misstatements due to error or fraud may occur and not be detected. The company’s disclosure controls and procedures have been designed to meet, and management believes that they meet, reasonable assurance standards.
The company’s management, with the participation of the company’s group chief executive and chief financial officer, has evaluated the effectiveness of the company’s disclosure controls and procedures pursuant to Exchange Act Rule 13a-15(b) as of the end of the period covered by this annual report. Based on that evaluation, the group chief executive and chief financial officer have concluded that the company’s disclosure controls and procedures were effective at a reasonable assurance level.
« See glossary on page 373 | bp Annual Report and Form 20-F 2023 | 359 | ||||||||||||
Management’s report on internal control over financial reporting
Management of bp is responsible for establishing and maintaining adequate internal control over financial reporting. bp’s internal control over financial reporting is a process designed under the supervision of the principal executive and financial officers to provide reasonable assurance regarding the reliability of financial reporting and the preparation of bp’s financial statements for external reporting purposes in accordance with IFRS.
As of the end of the 2023 fiscal year, management conducted an assessment of the effectiveness of internal control over financial reporting in accordance with the criteria in the UK Financial Reporting Council’s Guidance on Risk Management, Internal Control and Related Financial and Business Reporting relating to internal control over financial reporting. Based on this assessment, management has determined that bp’s internal control over financial reporting as of 31 December 2023 was effective.
Management’s assessment of the effectiveness of internal control over financial reporting excluded TravelCenters of America Inc. (TCA), which was acquired on 15 May 2023. TCA’s financial statements constitute 2.1% and 1.5% of net and total assets respectively, 2.8% of revenues, and 4% of net income of the consolidated financial statement amounts as of and for the year ended 31 December 2023. This exclusion is in accordance with the general guidance issued by the SEC that an assessment of a recent business combination may be omitted from management’s report on internal control over financial reporting in the first year of consolidation.
The company’s internal control over financial reporting includes policies and procedures that pertain to the maintenance of records that, in reasonable detail, accurately and fairly reflect transactions and dispositions of assets; provide reasonable assurances that transactions are recorded as necessary to permit preparation of financial statements in accordance with IFRS and that receipts and expenditures are being made only in accordance with authorizations of management and the directors of bp; and provide reasonable assurance regarding prevention or timely detection of unauthorized acquisition, use or disposition of bp’s assets that could have a material effect on our financial statements. bp’s internal control over financial reporting as of 31 December 2023 has been audited by Deloitte LLP, an independent registered public accounting firm, as stated in their report appearing on page 163 of bp Annual Report and Form 20-F 2023.
Changes in internal control over financial reporting
There were no changes in the group’s internal control over financial reporting that occurred during the period covered by the Form 20-F that have materially affected or are reasonably likely to materially affect our internal control over financial reporting.
Cyber security
Governance
The board oversees bp’s internal control and risk management framework. The board is supported by the safety and sustainability committee which oversees cyber security risk and received reports from bp’s chief information security officer (CISO) on cyber security incidents at every committee meeting in 2023, including information on bp’s response to incidents. This allows an ongoing assessment by the committee of the effectiveness of bp’s overall cyber security programme. A session is held once a year to review bp’s roadmap and progress for addressing cyber security risk. Read more in the safety and sustainability committee report on page 103.
At management level, assessment and management of material risks from cyber security threats is led by bp’s executive vice president of innovation & engineering (I&E), a member of bp’s leadership team with deep experience in bp’s engineering and operations functions, with support from bp’s CISO, who has over 20 years of experience in the information technology industry. bp’s digital safety operational risk committee brings together additional senior members of bp’s digital leadership team to assist in ensuring that cyber security risks across bp are identified, understood, accurately quantified and are managed in accordance with bp’s internal controls framework.
Risk management and strategy
bp has implemented a threat-focused strategy to assess cyber security risks and protect against, detect, respond to, and recover from cyber attacks. bp maintains internal teams focused on cyber security intelligence and emergency response to monitor the external threat landscape and the threats to bp’s IT and operational technology infrastructure. bp partners with third-party specialists to augment its in-house capabilities as necessary. bp has a defined protocol for cyber incident notification based on severity and bp’s internal cyber security teams brief the CISO, I&E EVP, other senior leadership and relevant board and management committees about incidents on an as needed basis.
Cyber security risk management is integrated into bp’s overall risk management process. bp’s entities are required to identify, assess and report key risks, including cyber security risks, to relevant members of senior leadership. bp maintains additional procedures to manage cyber security risks related to third-party service providers, including conducting information security assessments for certain providers, providing relevant trainings for bp employees, and maintaining information security requirements for suppliers.
Our business strategy, results of operations and financial condition have not been materially affected by risks from cyber security threats, including as a result of previously identified cyber security incidents. For more information on our cyber security related risks, see Risk Factors (pages 77-79).
Principal accountant's fees and services
The audit committee has established policies and procedures for the engagement of the independent registered public accounting firm, Deloitte LLP, to render audit and certain assurance services. The policy provides for pre-approval by the audit committee of specifically defined audit, audit related, non-audit and other services that are not prohibited by regulatory or other professional requirements. Deloitte is engaged for these services when its expertise and experience of bp are important. Most of this work is of an audit nature. The committee regularly reviews the policy, including in 2022, when it was updated to remove restrictions on EY following bp's announcement on 27 February 2022 of its intention to exit its interests in Rosneft and capture additional detail for the processes applicable to separately listed bp entities.
Under the policy, pre-approval is given for specific services within the following categories: i) audit-related services, such as those required by law or where the auditor is best placed to undertake such work on similar terms, ii) non-audit services required by law, such as reporting required by a regulatory authority, and iii) other services, such as additional assurance or updates on applicable law and accounting standards. bp operates a two-tier system for audit and non-audit services. For audit-related services, the audit committee has a pre-approved aggregate level, within which specific work may be approved by management. Non-audit services are pre-approved for management to authorize per individual engagement, but above a defined level must be approved by the chair of the audit committee or the full committee. The audit committee has delegated to the chair of the audit committee authority to approve permitted services provided that any decisions are reported to the committee at its next scheduled meeting. Any proposed service not included in the approved service list must be approved in advance of commencing the engagement by the audit committee chair or the full audit committee depending on the level of fee payable.
The audit committee evaluates the performance of the auditor each year. The audit fees payable to Deloitte are reviewed by the committee in the context of other global companies for cost effectiveness. The committee keeps under review the scope and results of audit work and the independence and objectivity of the auditor. External regulation and bp policy requires the auditor to rotate its lead audit partner every five years. See Financial statements – Note 36 and Audit committee report on page 98 for details of fees for services provided by the auditor.
360 | bp Annual Report and Form 20-F 2023 | |||||||||||||
| Additional disclosures | ||
Additional Directors’ report disclosures
This section of bp Annual Report and Form 20-F 2023 forms part of the Directors’ report. Certain information has been included in the Strategic report that would otherwise be required to be disclosed in the Directors' report, as noted below.
Indemnity provisions
In accordance with bp’s Articles of Association, on appointment each director is granted an indemnity from the company in respect of liabilities incurred as a result of their office, to the extent permitted by law. These indemnities were in force throughout the financial year and at the date of this report. In respect of those liabilities for which directors may not be indemnified, the company maintained a directors’ and officers’ liability insurance policy throughout 2023. During the year, a review of the terms and scope of the policy was undertaken as part of the annual renewal. Although their defence costs may be met, neither the company’s indemnity nor insurance provides cover in the event that the director is proved to have acted fraudulently or dishonestly. Certain subsidiaries« are trustees of the group’s pension schemes. Each director of these subsidiaries is granted an indemnity from the company in respect of liabilities incurred as a result of such a subsidiary’s activities as a trustee of the pension scheme, to the extent permitted by law. These indemnities were in force throughout the financial year and at the date of this report.
Financial risk management objectives and policies
The disclosures in relation to financial risk management objectives and policies, including the policy for hedging, are included in How we manage risk on pages 73-76, Liquidity and capital resources on page 340 and Financial statements – Notes 29 and 30.
Exposure to price risk, credit risk, liquidity risk and cash flow risk
The disclosures in relation to exposure to price risk, credit risk, liquidity risk and cash flow risk are included in Financial statements – Notes 29 and 30.
Important events since the end of the financial year
Disclosures of the particulars of the important events affecting bp which have occurred since the end of the financial year are included in the Strategic report as well as in other places in the Directors’ report.
Likely future developments in the business
An indication of the likely future developments in the business of the company is included in the Strategic report.
Research and development
Indications of our activities in the field of research and development are provided throughout the Strategic report and the Directors’ report. See also pages 16 and 197 for our expenditure on research and development.
Branches
As a global group our interests and activities are held or operated through subsidiaries, branches, joint arrangements« or associates« established in – and subject to the laws and regulations of – many different jurisdictions.
Employees
Disclosures in respect of how the directors have engaged with employees and had regard to their interests are included in Stakeholder engagement on pages 92-93.
The disclosures concerning policies in relation to the employment of disabled persons and employee involvement are included in Sustainability – our people on pages 70-72.
Employee share schemes
Certain shares held as a result of participation in some employee share plans carry voting rights. Voting rights in respect of such shares are exercisable via a nominee. Dividend waivers are in place in respect of unallocated shares held in employee share plan trusts.
Suppliers, customers and others
Disclosures in respect of how the directors have engaged with suppliers, customers and others in business relationships with the company are included in Stakeholder engagement on pages 92-93.
Change of control provisions
On 5 October 2015, the United States lodged with the district court in MDL 2179 a proposed Consent Decree between the United States, the Gulf states, BP Exploration & Production Inc., BP Corporation North America Inc. and BP p.l.c., to fully and finally resolve any and all natural resource damages claims of the United States, the Gulf states and their respective natural resource trustees and all Clean Water Act penalty claims, and certain other claims of the United States and the Gulf states. Concurrently, bp entered into a definitive Settlement Agreement with the five Gulf states (Settlement Agreement) with respect to state claims for economic, property and other losses. On 4 April 2016, the district court approved the Consent Decree, at which time the Consent Decree and Settlement Agreement became effective. The federal government and the Gulf states may jointly elect to accelerate the payments under the Consent Decree in the event of a change of control or insolvency of BP p.l.c., and the Gulf states individually have similar acceleration rights under the Settlement Agreement. For further details of the Consent Decree and the Settlement Agreement, see Legal proceedings in BP Annual Report and Form 20-F 2015.
Political donations, expenditure and contributions
Disclosures in relation to political donations, expenditure and contributions are included on page 72.
Greenhouse gas emissions, energy consumption and energy efficiency
Disclosures in relation to greenhouse gas emissions, energy consumption and energy efficiency are included in Sustainability on pages 51-52.
Disclosures required under Listing Rule 9.8.4R
The information required to be disclosed by Listing Rule 9.8.4R can be located as set out below:
| Information required | Page | ||||
| (1) Amount of interest capitalized | 197 | ||||
| (2) – (4) | Not applicable | ||||
| (5), (6) Waiver of director emoluments | 128 | ||||
| (7) – (11) | Not applicable | ||||
| (12), (13) Dividend waivers | 361 | ||||
| (14) | Not applicable | ||||
Cautionary statement
In order to utilize the ‘safe harbor’ provisions of the United States Private Securities Litigation Reform Act of 1995 (the ‘PSLRA’) and the general doctrine of cautionary statements, bp is providing the following cautionary statement.
This document contains certain forecasts, projections and forward-looking statements - that is, statements related to future, not past, events and circumstances - with respect to the financial condition, results of operations and businesses of bp and certain of the plans and objectives of bp with respect to these items. These statements may generally, but not always, be identified by the use of words such as ‘will’, ‘expects’, ‘is expected to’, ‘aims’, ‘should’, ‘may’, ‘objective’, ‘is likely to’, ‘intends’, ‘believes’, ‘anticipates’, ‘plans’, ‘we see’ or similar expressions. In particular, among other statements, (i) certain statements in the Chair’s letter (pages 4-5), Chief executive officer’s letter (pages 6-7),the Strategic report (inside cover and pages 1-80), Additional disclosures (pages 335-362) and Shareholder information (pages 363-372), including but not limited to statements under the headings ‘Energy Outlook’, ‘Our strategy in action’, ‘Consistency with the Paris goals’ ‘Our business model’, ‘Progress against our strategy’, ‘Our financial frame’, ‘2024 guidance’ and ‘Our investment process’ and including but not limited to statements regarding: plans and expectations relating to business, financial performance, results of operations, cash flow, capital expenditure, allocation of capital expenditure and bp’s ability to maintain a robust cash position; plans and expectations regarding bp’s financial frame, working capital, operating cash flow (and its ability to cover capital expenditure and shareholder distributions including the dividend and share buybacks), return on average capital employed, liquidity, capital discipline, credit rating, future shareholder distributions, amount or timing of payments related to divestment and other proceeds, net debt, future dividend payments and share buybacks; plans and expectations relating to bp’s investment process and capital investment, including future capital investment allocation, expected IRR, access to capital and the restructuring of certain investments; plans and expectations
« See glossary on page 373 | bp Annual Report and Form 20-F 2023 | 361 | ||||||||||||
relating to bp’s intra-group funding and liquidity arrangements; plans and expectations relating to bp’s ability to meet contractual obligations; expectations regarding inflation, oil and gas prices, price volatility, refining margins and price assumptions; plans and expectations relating to risk, including risk management processes and climate-related risks; plans and expectations regarding bp’s transition growth engines, including plans to increase capital investment in these growth engines; plans and expectations regarding bp’s oil and gas business, including related investment plans, oil and gas production targets, and divestment plans; plans and expectations regarding underlying replacement cost profit before interest, tax, depreciation and amortization, ROACE, adjusted EBITDA and adjusted EBIDA per share; plans, expectations and projections regarding bp’s oil and gas resources and reserves; plans and expectations regarding bp’s convenience and mobility business, including earnings, the development of EV charging, and the impact of the acquisition of TravelCenters of America; bp’s aims related to sustainable aviation fuel; bp’s plans and expectations regarding renewable power, including aims to expand renewable gas, wind and solar capacity, aims to develop hydrogen production and export, green and blue hydrogen, e-fuels, EV charging and power trading and expectations related to bp’s wind and solar projects; bp’s 2025 targets and 2030 aims relating to resilient hydrocarbons (including upstream unit production costs, upstream production, bp-operated upstream plant reliability, bp-operated refining availability, biofuels production, biogas supply volumes and LNG portfolio), convenience and mobility (including customer touchpoints per day, strategic convenience sites and electric vehicle charge points) and low carbon energy (including net hydrogen production, developed renewables to final investment decision and net installed renewables capacity); plans and expectations in relation to announced acquisitions and divestments including the outcome of any applicable third party approvals and timing of completion; bp’s plans and expectations related to the energy transition (including its scenario analysis), climate change, sustainability, greenhouse gas emissions, water use and the replenishment of fresh water, bp’s resilience across different climate scenarios, and bp’s decarbonization and net zero aims and targets, its targets related to methane and carbon intensity of bp’s products and the transition to a lower carbon economy and energy system; expectations relating to the effects of the Russia-Ukraine war including plans and expectations regarding impacts on bp; expectations regarding future legislative or regulatory action and its impact on bp, including regulatory action related to climate change and inflation and bp’s plans regarding compliance with such actions; plans and expectations regarding bp’s leadership team, board composition and workforce, including targets related to workforce recruitment, incentives and diversity; expectations regarding the costs of environmental restoration, remediation and abatement programmes; expectations regarding the future value of assets; plans and expectations regarding projects, joint ventures, partnerships, agreements and memoranda of understanding with governments, commercial entities and other third party partners; expectations regarding contingent liabilities, legal and trial proceedings, court decisions, potential investigations and civil actions by regulators, government entities and/or other entities or parties, and the timing and potential impact of such proceedings, settlement agreements relating to such proceedings and bp’s intentions in respect thereof; plans and expectations regarding relationships with governments, customers, partners, suppliers, communities and key stakeholders; expectations regarding upstream production, total capital expenditure, depreciation, depletion and amortization, divestments and other proceeds, Gulf of Mexico oil spill payments, other businesses & corporate underlying annual charge, and the effective tax rate and the underlying effective tax rate; expectations that the majority of bp’s existing upstream oil and gas properties will start decommissioning within the next two decades; expectations regarding fulfillment of existing delivery commitments for oil and gas; plans and expectations relating to major project start-ups; plans and expectations relating to launchpad; plans and expectations regarding bp ventures and its investments; plans and expectations relating to bp’s refineries, including Solomon refining availability and net cash margins; plans and expectations relating to bp’s research and development spend; plans and expectations regarding operations and safety; and (ii) certain statements in Corporate governance (pages 81-104) and the Directors’ remuneration report (pages 105-132) and ‘Other disclosures’ (page 133) with regard to: the anticipated future composition of the board of directors and the effects thereof; the board’s goals and areas of focus; plans and expectations regarding the expected impact of the mergers and acquisitions pipeline and capital expenditures (including the impact of bp’s entry in the German offshore wind market); plans and expectations relating to the induction and training of new directors; plans and expectations regarding the diversity of the board and senior management; plans and expectations regarding directors’ and senior management’s share ownership and remuneration; plans regarding the governance and remuneration processes, including base pay and base salary increases and adjustments, performance share plan, various policies, updates to certain targets, measures and metrics relevant to remuneration and determination of bonuses and share plans, pension allowances and contributions, the vesting of shares under employee share plans, benefits and
bonuses; plans relating to the societies in which bp operates and to maintain a strong reputation globally; and goals, activities and areas of focus of board committees, are all forward-looking in nature; plans and expectations regarding auditor reappointment and independence.
By their nature, forward-looking statements involve risk and uncertainty because they relate to events and depend on circumstances that will or may occur in the future and are outside the control of bp.
Actual results or outcomes, including the fair value of bp’s Rosneft shareholding, may differ materially from those expressed in such statements, depending on a variety of factors, including: the extent and duration of the impact of current market conditions including the volatility of oil prices, the effects of bp’s intention to exit its shareholding in Rosneft, overall global economic and business conditions impacting bp’s business and demand for bp’s products as well as the specific factors identified in the discussions accompanying such forward-looking statements; changes in consumer preferences and societal expectations; the pace of development and adoption of alternative energy solutions; developments in policy, law, regulation, technology and markets, including societal and investor sentiment related to the issue of climate change; the receipt of relevant third party and/or regulatory approvals; the timing and level of maintenance and/or turnaround activity; the timing and volume of refinery additions and outages; the timing of bringing new fields onstream; the timing, quantum and nature of certain acquisitions and divestments; future levels of industry product supply, demand and pricing, including supply growth in North America and continued base oil and additive supply shortages; OPEC+ quota restrictions; PSA and TSC effects; operational and safety problems; potential lapses in product quality; economic and financial market conditions generally or in various countries and regions; political stability and economic growth in relevant areas of the world; changes in laws and governmental regulations and policies, including related to climate change; changes in social attitudes and customer preferences; regulatory or legal actions including the types of enforcement action pursued and the nature of remedies sought or imposed; the actions of prosecutors, regulatory authorities and courts; delays in the processes for resolving claims; amounts ultimately payable and timing of payments relating to the Gulf of Mexico oil spill; exchange rate fluctuations; development and use of new technology; recruitment and retention of a skilled workforce; the success or otherwise of partnering; the actions of competitors, trading partners, contractors, subcontractors, creditors, rating agencies and others; bp’s access to future credit resources; business disruption and crisis management; the impact on bp’s reputation of ethical misconduct and non-compliance with regulatory obligations; trading losses; major uninsured losses; the possibility that international sanctions or other steps taken by competent authorities or any other relevant persons may impact bp’s ability to sell its interests in Rosneft, or the price for which it could sell such interests; the actions of contractors; natural disasters and adverse weather conditions; changes in public expectations and other changes to business conditions; wars and acts of terrorism; cyber-attacks or sabotage; and other factors discussed elsewhere in this report including under Risk factors (pages 77-79). In addition to factors set forth elsewhere in this report, those set out above are important factors, although not exhaustive, that may cause actual results and developments to differ materially from those expressed or implied by these forward-looking statements.
Statements regarding competitive position
Statements referring to bp’s competitive position are based on the company’s belief and, in some cases, rely on a range of sources, including investment analysts’ reports, independent market studies and bp’s internal assessments of the relevant market based on publicly available information about the financial results and performance of market participants.
362 | bp Annual Report and Form 20-F 2023 | |||||||||||||
| Shareholder information | ||
| Shareholder information | ||||||||||||||
| Share prices and listings | ||||||||||||||
| Dividends | ||||||||||||||
| Shareholder taxation information | ||||||||||||||
| Major shareholders | ||||||||||||||
| Annual general meeting | ||||||||||||||
| Memorandum and Articles of Association | ||||||||||||||
| Purchases of equity securities by the issuer and affiliated purchasers | ||||||||||||||
| Fees and charges payable by ADS holders | ||||||||||||||
| Fees and payments made by the Depositary to the issuer | ||||||||||||||
| Documents on display | ||||||||||||||
| Shareholding administration | ||||||||||||||
| 2024 shareholder calendar | ||||||||||||||
| bp Annual Report and Form 20-F 2023 | 363 | |||||||||||||
Share prices and listings
Markets and market prices
The primary market for the company’s ordinary shares (trading symbol ‘BP’), 8% cumulative first preference shares (trading symbol ‘BP.A’) and 9% cumulative second preference shares (trading symbol ‘BP.B’) is the London Stock Exchange (LSE). The company’s ordinary shares are a constituent element of the Financial Times Stock Exchange 100 Index.
In the US, the company’s securities are listed and traded on the New York Stock Exchange (NYSE) in the form of ADSs (trading symbol ‘BP’), for which JPMorgan Chase Bank, N.A. is the depositary (the Depositary) and transfer agent. The Depositary’s principal office is 383 Madison Avenue, Floor 11, New York, NY, 10179, US. Each ADS represents six ordinary shares. ADSs are evidenced by American depositary receipts (ADRs), which may be issued in either certificated or book entry form.
The company’s ordinary shares are also traded in the form of a global depositary certificate representing the company’s ordinary shares on the Frankfurt, Hamburg and Düsseldorf Stock Exchanges.
On 16 February 2024, 731,514,905 ADSs (equivalent to approximately 4,389,089,430 ordinary shares or some 25.79% of the total issued share capital, excluding shares held in treasury) were outstanding and were held by approximately 62,639 ADS holders. Of these, about 61,911 had registered addresses in the US at that date. One of the registered holders of ADSs represents approximately 1,369,679 underlying holders.
On 16 February 2024, there were approximately 200,279 ordinary shareholders. Of these shareholders, around 1,499 had registered addresses in the US and held a total of some 3,870,988 ordinary shares. On 16 February 2024, there were approximately 1,103 preference shareholders. Of these shareholders, around 14 had registered addresses in the US and held a total of some 2,773 preference shares.
Since a number of the ordinary shares and ADSs were held by brokers and other nominees, the number of holders in the US may not be representative of the number of beneficial holders or their respective country of residence.
Dividends
The company’s current policy is to pay interim dividends on a quarterly basis on its ordinary shares.
Our policy is also to announce dividends for ordinary shares in US dollars and state an equivalent sterling dividend. Dividends on the company's ordinary shares will be paid in sterling and on the company's ADSs in US dollars. The rate of exchange used to determine the sterling amount equivalent is the average of the market exchange rates in London over the three business days prior to the sterling equivalent announcement date. The directors may choose to declare dividends in any currency provided that a sterling equivalent is announced. It is not the company’s intention to change its current policy of announcing dividends on ordinary shares in US dollars.
Information regarding dividends announced and paid by the company on ordinary shares and preference shares is provided in the consolidated Financial statements – Note 10.
A Scrip Dividend Programme (Scrip Programme) was approved by shareholders in 2010 and was renewed for a further three years at the 2021 AGM. It enabled the company's ordinary shareholders and ADS holders to elect to receive dividends by way of new fully paid ordinary shares (or ADSs in the case of ADS holders) instead of cash. The operation of the Scrip Programme is always subject to the directors’ decision to make the Scrip Programme offer available in respect of any particular dividend.
The company announced on 29 October 2019 and as part of all subsequent quarterly results announcements made since, that the board had suspended the Scrip Programme in respect of those quarterly dividends. The company does not expect to offer a scrip election for the foreseeable future. Ordinary shareholders and ADS holders (subject to certain exceptions) may be able to participate in dividend reinvestment plans. Any decisions with respect to future dividends will be made by the board of BP p.l.c. following the end of each quarter.
Future dividends will be dependent on future earnings, the financial condition of the group, the Risk factors set out on page 77 and other matters that may affect the business of the group set out in Our strategy on page 12 and in Liquidity and capital resources on page 340.
The quarterly dividend which is expected to be paid on 28 March 2024 in respect of the fourth quarter 2023 is 7.270 cents per ordinary share ($0.43620 per American Depositary Share (ADS)). The corresponding amount in sterling will be announced on 12 March 2024.
The following table shows dividends announced and paid by the company per ADS for the past five years.
Dividends per ADSa | March | June | September | December | Total | |||||||||||||||
| 2019 | UK pence | 46.43 | 48.39 | 50.09 | 46.95 | 191.86 | ||||||||||||||
| US cents | 61.50 | 61.50 | 61.50 | 61.50 | 246.00 | |||||||||||||||
| 2020 | UK pence | 48.94 | 50.05 | 24.26 | 23.50 | 146.75 | ||||||||||||||
| US cents | 63.00 | 63.00 | 31.50 | 31.50 | 189.00 | |||||||||||||||
| 2021 | UK pence | 22.61 | 22.27 | 23.72 | 24.63 | 92.23 | ||||||||||||||
| US cents | 31.50 | 31.50 | 32.76 | 32.76 | 128.52 | |||||||||||||||
| 2022 | UK pence | 24.96 | 26.13 | 31.01 | 29.64 | 111.74 | ||||||||||||||
| US cents | 32.76 | 32.76 | 36.04 | 36.04 | 137.60 | |||||||||||||||
| 2023 | UK pence | 33.30 | 31.85 | 34.39 | 34.42 | 133.97 | ||||||||||||||
| US cents | 39.66 | 39.66 | 43.62 | 43.62 | 166.56 | |||||||||||||||
aDividends announced and paid by the company on ordinary and preference shares are provided in the consolidated Financial statements – Note 10.
There are no UK foreign exchange controls or other restrictions on the import or export of capital by, or on the payment of dividends to, non-resident holders of BP p.l.c. shares, or that materially affect the conduct of BP p.l.c’s operations, other than restrictions applicable to certain countries and persons subject to UN, US, UK, or EU economic sanctions, to the extent these restrictions can be complied with in law.
Shareholder taxation information
This section describes the material US federal income tax and UK taxation consequences of owning ordinary shares or ADSs to a US holder who holds the ordinary shares or ADSs as capital assets for tax purposes. This section does not discuss tax consequences arising under the Medicare contribution tax on net investment income or the alternative minimum tax. It also does not apply inter alia to members of special classes of holders some of which may be subject to other rules, including: tax-exempt entities, life insurance companies, dealers in securities, traders in securities that elect a mark-to-market method of accounting for securities holdings, holders that, actually or constructively, hold 10% or more of the company’s shares (as measured by voting power or value), holders that hold the shares or ADSs as part of a straddle or a hedging or conversion transaction, holders that purchase or sell the shares or ADSs as part of a wash sale for US federal income tax purposes, or holders whose functional currency is not the US dollar. In addition, if a partnership holds the shares or ADSs, the US federal income tax treatment of a partner will generally depend on the status of the partner and the tax treatment of the partnership and may not be described fully below.
A US holder is any beneficial owner of ordinary shares or ADSs that is for US federal income tax purposes (1) a citizen or resident of the US, (2) a US domestic corporation, (3) an estate whose income is subject to US federal income taxation regardless of its source, or (4) a trust if a US court can exercise primary supervision over the trust’s administration and one or more US persons are authorized to control all substantial decisions of the trust.
This section is based on the tax laws of the United States, including the Internal Revenue Code of 1986, as amended, its legislative history, existing and proposed US Treasury regulations thereunder, published rulings and court decisions, and the taxation laws of the UK, all as currently in effect, as well as the income tax convention between the US and the UK that entered into force on 31 March 2003 (the Treaty). These laws are subject to change, possibly on a retroactive basis. This section further assumes that each obligation under the terms of the deposit agreement relating to bp ADSs and any related agreement will be performed in accordance with its terms.
364 | bp Annual Report and Form 20-F 2023 | |||||||||||||
| Shareholder information | ||
For purposes of the Treaty and the estate and gift tax convention (the Estate Tax Convention) and for US federal income tax and UK taxation purposes, a holder of ADRs evidencing ADSs will be treated as the owner of the company’s ordinary shares represented by those ADRs. Exchanges of ordinary shares for ADRs and ADRs for ordinary shares generally will not be subject to US federal income tax or to UK taxation other than stamp duty or stamp duty reserve tax, as described below.
Investors should consult their own tax advisor regarding the US federal, state and local, UK and other tax consequences of owning and disposing of ordinary shares and ADSs in their particular circumstances, and in particular whether they are eligible for the benefits of the Treaty in respect of their investment in the shares or ADSs.
Taxation of dividends
UK taxation
Under current UK taxation law, no withholding tax will be deducted from dividends paid by the company, including dividends paid to US holders. A shareholder that is a company resident for tax purposes in the UK or trading in the UK through a permanent establishment generally will not be taxable in the UK on a dividend it receives from the company. A shareholder who is an individual resident for tax purposes in the UK is subject to UK tax on dividends received from the company, including dividends received under the dividend reinvestment plan (DRIP) for ordinary shareholders, that are in excess of the annual dividend allowance.
For 2023/24 the dividend allowance is £1,000 which means there is no UK tax due on the first £1,000 of dividends received. Dividends above this level are subject to tax at 8.75% for basic tax payers, 33.75% for higher rate tax payers and 39.35% for additional rate tax payers.
Although the first £1,000 of dividend income is not subject to UK income tax, it does not reduce the total income for tax purposes. Dividends within the dividend allowance still count towards basic or higher rate bands, and may therefore affect the rate of tax paid on dividends received in excess of the £1,000 allowance. For instance, if an individual has an annual gross salary of £50,000 and also receives a dividend of £12,000 they will be subject to the following scenario. The individual's personal allowance and the basic rate tax band will be used up by the gross salary. The remaining part of the salary and the whole of the dividend will be subject to tax at the higher rate, although the dividend allowance will reduce the amount of dividend subject to tax. The dividend of £12,000 will be reduced by the dividend allowance of £1,000 leaving taxable dividend income of £11,000. The dividend will be taxed at 33.75% so that the total tax payable on the dividends is £3,712.
How the shareholder pays the tax arising on the dividend income depends on the amount of dividend income and salary they receive in the tax year. If less than £1,000 they will not need to report anything or pay any tax. If between £1,000 and £10,000, the shareholder can pay what they owe by: contacting the HMRC helpline; asking HMRC to change their tax code – the tax will be taken from their wages or pension or through completion of the ‘Dividends’ section of their self-assessment tax return, where one is already being filed. If over £10,000 they will be required to file a self-assessment tax return and should complete the ‘Dividends’ section with details of the amounts received.
US federal income taxation
A US holder is subject to US federal income taxation on the gross amount of any dividend paid by the company (including dividends paid but reinvested under the Global Invest Direct (GID) Dividend Reinvestment Plan for ADS holders) out of its current or accumulated earnings and profits (as determined for US federal income tax purposes). Dividends paid to a non-corporate US holder that constitute qualified dividend income will be taxable to the holder at a preferential rate, provided that the holder has a holding period in the ordinary shares or ADSs of more than 60 days during the 121-day period beginning 60 days before the ex-dividend date and meets other holding period requirements. Dividends paid by the company with respect to the ordinary shares or ADSs will generally be qualified dividend income.
For US federal income tax purposes, a dividend must be included in income when the US holder, in the case of ordinary shares, or the Depositary, in the case of ADSs, actually or constructively receives the dividend and will not be eligible for the dividends-received deduction generally allowed to US corporations in respect of dividends received from other US corporations.
US ADS holders should consult their own tax advisor regarding the US tax treatment of the dividend fee in respect of dividends. Dividends will generally be income from sources outside the US and generally will be ‘passive category income’ for purposes of computing a US holder’s foreign tax credit limitation.
As noted above in UK taxation, a US holder will not be subject to UK withholding tax. Accordingly, the receipt of a dividend will not entitle the US holder to a foreign tax credit.
The amount of the dividend distribution on the ordinary shares that is paid in pounds sterling will be the US dollar value of the pounds sterling payments made, determined at the spot pounds sterling/US dollar rate on the date the dividend is distributed, regardless of whether the payment is, in fact, converted into US dollars. Generally, any gain or loss resulting from currency exchange fluctuations during the period from the date the pounds sterling dividend payment is distributed to the date the payment is converted into US dollars will be treated as ordinary income or loss and will not be eligible for the preferential tax rate on qualified dividend income. The gain or loss generally will be income or loss from sources within the US for foreign tax credit limitation purposes.
Distributions in excess of the company’s earnings and profits, as determined for US federal income tax purposes, will be treated as a return of capital to the extent of the US holder’s basis in the ordinary shares or ADSs and thereafter as capital gain, subject to taxation as described in 'Taxation of capital gains – US federal income taxation' section below.
In addition, the taxation of dividends may be subject to the rules for passive foreign investment companies (PFIC), described below under ‘Taxation of capital gains – US federal income taxation’. Distributions made by a PFIC do not constitute qualified dividend income and are not eligible for the preferential tax rate applicable to such income.
Taxation of capital gains
UK taxation
A US holder may be liable for both UK and US tax in respect of a gain on the disposal of ordinary shares or ADSs if the US holder is (1) resident for tax purposes in the UK at the date of disposal, (2) if he or she has left the UK for a period not exceeding five complete tax years between the year of departure from and the year of return to the UK and acquired the shares before leaving the UK and was resident in the UK in the previous four out of seven tax years before the year of departure, (3) a US domestic corporation resident in the UK by reason of its business being managed or controlled in the UK or (4) a citizen of the US that carries on a trade or profession or vocation in the UK through a branch or agency or a corporation that carries on a trade, profession or vocation in the UK, through a permanent establishment, and that has used, held, or acquired the ordinary shares or ADSs for the purposes of such trade, profession or vocation of such branch, agency or permanent establishment. However, such persons may be entitled to a tax credit against their US federal income tax liability for the amount of UK capital gains tax or UK corporation tax on chargeable gains (as the case may be) that is paid in respect of such gain.
Under the Treaty, capital gains on dispositions of ordinary shares or ADSs generally will be subject to tax only in the jurisdiction of residence of the relevant holder as determined under both the laws of the UK and the US and as required by the terms of the Treaty.
Under the Treaty, individuals who are residents of either the UK or the US and who have been residents of the other jurisdiction (the US or the UK, as the case may be) at any time during the six years immediately preceding the relevant disposal of ordinary shares or ADSs may be subject to tax with respect to capital gains arising from a disposition of ordinary shares or ADSs of the company not only in the jurisdiction of which the holder is resident at the time of the disposition but also in the other jurisdiction.
For gains on or after 23 June 2010, the UK Capital Gains Tax rate will be dependent on the level of an individual’s taxable income. Where total taxable income and gains after all allowable deductions are less than the upper limit of the basic rate income tax band of £37,700 (for 2023/24), the rate of Capital Gains Tax will be 10%. For gains (and any parts of gains) above that limit the rate will be 20%.
From 6 April 2008, entitlement to the annual exemption is based on an individual’s circumstances (taking into account domicile status, remittance basis of taxation and number of years in the UK). For individuals who are
« See glossary on page 373 | bp Annual Report and Form 20-F 2023 | 365 | ||||||||||||
entitled to the exemption for 2023/24, this has been set at £6,000. Corporation tax on chargeable gains is levied at 25% for companies from 1 April 2023.
US federal income taxation
A US holder who sells or otherwise disposes of ordinary shares or ADSs will recognize a capital gain or loss for US federal income tax purposes equal to the difference between the US dollar value of the amount realized on the disposition and the US holder’s tax basis, determined in US dollars, in the ordinary shares or ADSs. Any such capital gain or loss generally will be long-term gain or loss, subject to tax at a preferential rate for a non-corporate US holder, if the US holder’s holding period for such ordinary shares or ADSs exceeds one year. The tax basis of shares acquired through reinvested dividends under the GID Dividend Reinvestment Plan for ADS holders is equal to the fair market value of the stock on the investment date. The holding period for shares acquired under the plan begins the day after the applicable investment date.
Gain or loss from the sale or other disposition of ordinary shares or ADSs will generally be income or loss from sources within the US for foreign tax credit limitation purposes. The deductibility of capital losses is subject to limitations.
We do not believe that ordinary shares or ADSs will be treated as stock of a passive foreign investment company (PFIC) for US federal income tax purposes, but this conclusion is a factual determination that is made annually and thus is subject to change. If we are treated as a PFIC, unless a US holder elects to be taxed annually on a mark-to-market basis with respect to ordinary shares or ADSs, any gain realized on the sale or other disposition of ordinary shares or ADSs would in general not be treated as capital gain. Instead, a US holder would be treated as if he or she had realized such gain rateably over the holding period for ordinary shares or ADSs and would be taxed at the highest tax rate in effect for each such year to which the gain was allocated, in addition to which an interest charge in respect of the tax attributable to each such year would apply. Certain ‘excess distributions’ would be similarly treated if we were treated as a PFIC.
Additional tax considerations
Scrip Programme
Until the publication of the 2019 third quarter results, the company had an optional Scrip Programme, wherein holders of bp ordinary shares or ADSs could elect to receive any dividends in the form of new fully paid ordinary shares or ADSs of the company instead of cash. Please consult your tax advisor for the consequences to you.
UK inheritance tax
The Estate Tax Convention applies to inheritance tax. ADSs held by an individual who is domiciled for the purposes of the Estate Tax Convention in the US and is not for the purposes of the Estate Tax Convention a national of the UK will not be subject to UK inheritance tax on the individual’s death or on transfer during the individual’s lifetime unless, among other things, the ADSs are part of the business property of a permanent establishment situated in the UK used for the performance of independent personal services. In the exceptional case where ADSs are subject to both inheritance tax and US federal gift or estate tax, the Estate Tax Convention generally provides for tax payable in the US to be credited against tax payable in the UK or for tax paid in the UK to be credited against tax payable in the US, based on priority rules set forth in the Estate Tax Convention.
UK stamp duty and stamp duty reserve tax
The statements below relate to what is understood to be the current practice of HM Revenue & Customs in the UK under existing law.
Provided that any instrument of transfer is not executed in the UK and remains at all times outside the UK and the transfer does not relate to any matter or thing done or to be done in the UK, no UK stamp duty is payable on the acquisition or transfer of ADSs. Neither will an agreement to transfer ADSs in the form of ADRs give rise to a liability to stamp duty reserve tax.
Purchases of ordinary shares, as opposed to ADSs, through the CREST system of paperless share transfers will be subject to stamp duty reserve tax at 0.5%. The charge will arise as soon as there is an agreement for the transfer of the shares (or, in the case of a conditional agreement, when the condition is fulfilled). The stamp duty reserve tax will apply to agreements
to transfer ordinary shares even if the agreement is made outside the UK between two non-residents. Purchases of ordinary shares outside the CREST system are subject either to stamp duty at a rate of £5 per £1,000 (or part, unless the stamp duty is less than £5, when no stamp duty is charged), or stamp duty reserve tax at 0.5%. Stamp duty and stamp duty reserve tax are generally the liability of the purchaser.
A subsequent transfer of ordinary shares to the Depositary’s nominee will give rise to further stamp duty at the rate of £1.50 per £100 (or part) or stamp duty reserve tax at the rate of 1.5% of the value of the ordinary shares at the time of the transfer. For ADR holders electing to receive ADSs instead of cash, after the 2012 first quarter dividend payment, HM Revenue & Customs no longer seeks to impose 1.5% stamp duty reserve tax on issues of UK shares and securities to non-EU clearance services and depositary receipt systems.
Major shareholders
The disclosure of certain major and significant shareholdings in the share capital of the company is governed by the Companies Act 2006, the UK Financial Conduct Authority’s Disclosure Guidance and Transparency Rules (DTR) and the US Securities Exchange Act of 1934.
Register of members holding bp ordinary shares as at 31 December 2023
| Range of holdings | Number of ordinary shareholders | Percentage of total ordinary shareholders | Percentage of total ordinary share capital excluding shares held in treasury | ||||||||
1-200 | 51,421 | 25.55 | 0.01 | ||||||||
201-1,000 | 65,819 | 32.70 | 0.21 | ||||||||
1,001-10,000 | 73,508 | 36.52 | 1.35 | ||||||||
10,001-100,000 | 9,162 | 4.55 | 1.12 | ||||||||
100,001-1,000,000 | 767 | 0.38 | 1.61 | ||||||||
Over 1,000,000a | 598 | 0.30 | 95.70 | ||||||||
Totals | 201,275 | 100.00 | 100.00 | ||||||||
aIncludes JPMorgan Chase Bank, N.A. holding 25.93% of the total ordinary issued share capital (excluding shares held in treasury) as the approved depositary for ADSs, a breakdown of which is shown in the table below.
Register of holders of American depositary shares (ADSs) as at 31 December 2023a
| Range of holdings | Number of ADS holders | Percentage of total ADS holders | Percentage of total ADSs | ||||||||
| 1-200 | 38,097 | 59.62 | 0.27 | ||||||||
| 201-1,000 | 16,827 | 26.34 | 1.07 | ||||||||
| 1,001-10,000 | 8,640 | 13.52 | 2.95 | ||||||||
| 10,001-100,000 | 324 | 0.51 | 0.71 | ||||||||
| 100,001-1,000,000 | 5 | 0.01 | 0.11 | ||||||||
Over 1,000,000b | 2 | 0.00 | 94.88 | ||||||||
| Totals | 63,895 | 100.00 | 100.00 | ||||||||
aOne ADS represents six 25 cent ordinary shares.
bOne holder of ADSs represents 1,355,412 approx. underlying shareholders.
As at 31 December 2023 there were also 1,106 preference shareholders. Preference shareholders represented 0.49% and ordinary shareholders represented 99.51% of the total issued nominal share capital of the company (excluding shares held in treasury) as at that date.
As at 16 February 2024, the total preference shares in issue comprised only 0.50% of the company’s total issued nominal share capital (excluding shares held in treasury), the rest being ordinary shares.
Substantial shareholders
The following table shows holdings of 3% or more voting rights in ordinary shares of 25 cents in BP p.l.c. as per the most recent notification of each respective holder to bp under DTR 5. The percentage of voting rights detailed below was calculated as at the date of the relevant disclosures.
366 | bp Annual Report and Form 20-F 2023 | |||||||||||||
| Shareholder information | ||
| As at 31 December 2023 | As at 16 February 2024 | |||||||||||||
| Number of voting rights | Percentage of capital | Number of voting rights | Percentage of capital | |||||||||||
| BlackRock, Inc. | 1,504,412,502 | 7.37 | 1,504,412,502 | 7.37 | ||||||||||
| Norges Bank | 545,382,375 | 3.02 | 545,382,375 | 3.02 | ||||||||||
There are no current disclosable interests in holdings of 3% or more voting rights in 8% cumulative first preference shares of £1 each and 9% cumulative second preference shares of £1 each.
Largest registered shareholders
Under the US Securities Exchange Act of 1934 bp is aware of the following interests as at 16 February 2024.
Ordinary shares of $0.25 in BP p.l.c.:
| Holder | Holding of ordinary shares | Percentage of ordinary share capital excluding shares held in treasury | ||||||
| JPMorgan Chase Bank N.A., depositary for ADSs, through its nominee Guaranty Nominees Limited | 4,389,089,431 | 25.79 | ||||||
| BlackRock, Inc. | 1,584,721,078 | 9.31 | ||||||
| The Vanguard Group, Inc | 777,280,749 | 4.57 | ||||||
| Norges Bank | 584,175,750 | 3.43 | ||||||
8% cumulative first preference shares of £1 each in BP p.l.c.:
| Holder | Holding of 8% cumulative first preference shares | Percentage of class | ||||||
| Hargreaves Lansdown Asset Management Limited | 1,378,892 | 19.06 | ||||||
| Interactive Investor Share Dealing Services | 1,009,513 | 13.96 | ||||||
| Barclays, Plc. | 658,957 | 9.11 | ||||||
| Halifax Share Dealing Services | 547,821 | 7.57 | ||||||
| Canaccord Genuity Group Inc. | 544,494 | 7.53 | ||||||
AJ Bell Securities, Ltd. | 492,668 | 6.81 | ||||||
9% cumulative second preference shares of £1 each in BP p.l.c.:
| Holder | Holding of 9% cumulative second preference shares | Percentage of class | ||||||
| Hargreaves Lansdown Asset Management Limited | 884,655 | 16.16 | ||||||
Redmayne-Bentley LLP | 564,500 | 10.31 | ||||||
| Interactive Investor Share Dealing Services | 498,946 | 9.12 | ||||||
AJ Bell Securities, Ltd. | 460,885 | 8.42 | ||||||
| Canaccord Genuity Group Inc. | 351,605 | 6.42 | ||||||
| Safra Group | 347,500 | 6.35 | ||||||
Halifax Share Dealing Services | 292,161 | 5.34 | ||||||
The company’s major shareholders’ voting rights may differ to their total interest and can be found under the substantial shareholders heading above where voting rights are over 3%.
Annual general meeting (AGM)
The 2024 AGM is scheduled to be held on Thursday 25 April 2024 at 11:00am BST. A separate notice convening the meeting is distributed to shareholders, which includes an explanation of the items of business to be considered at the meeting.
All resolutions for which notice has been given will be decided on a poll. Deloitte LLP have expressed their willingness to continue in office as auditors and a resolution for their reappointment is included in the Notice of bp Annual General Meeting 2024.
Memorandum and Articles of Association
The following summarizes certain provisions of the company’s Memorandum and Articles of Association and applicable English law. This summary is qualified in its entirety by reference to the UK Companies Act 2006 (the Act) and the company’s Memorandum and Articles of Association. The Memorandum and Articles of Association are available online at bp.com/usefuldocs.
The company’s Articles of Association may be amended by a special resolution at a general meeting of the shareholders. At the AGM held on 21 May 2018 shareholders voted to adopt new Articles of Association to reflect developments in market practice and to provide clarification and additional flexibility where necessary or appropriate.
Objects and purposes
BP p.l.c. is a public company limited by shares and registered in England and Wales with the registered number 102498. The provisions regulating the operations of the company, known as its ‘objects’, were historically stated in a company’s memorandum. The Act abolished the need to have object provisions and so at the AGM held on 15 April 2010 shareholders approved the removal of its objects clause together with all other provisions of its Memorandum that, by virtue of the Act, are treated as forming part of the company’s Articles of Association.
Directors and secretary
The business and affairs of the company shall be managed by the directors. The company’s Articles of Association provide that any person may be appointed by the existing directors or by the shareholders in a general meeting either as a replacement for another director or as an additional director. Any person appointed by the directors will hold office only until the next general meeting, notice of which is first given after their appointment and will then be eligible for re-election by the shareholders. A director may be removed by the company as provided for by applicable law and shall vacate office in certain circumstances as set out in the Articles of Association. In addition, the company may, by special resolution, remove a director before the expiration of his/her period of office and, subject to the Articles of Association, may by ordinary resolution appoint another person to be a director instead. There is no requirement for a director to retire on reaching any age.
The Articles of Association place a general prohibition on a director voting in respect of any contract or arrangement in which the director has a material interest other than by virtue of such director’s interest in shares in the company. However, in the absence of some other material interest not indicated below, a director is entitled to vote and to be counted in a quorum for the purpose of any vote relating to a resolution concerning the following matters:
•The giving of security or indemnity with respect to any money lent or obligation taken by the director at the request or benefit of the company or any of its subsidiary undertakings.
•The giving of security or indemnity to a third party with respect to any debt or obligation of the company or any of its subsidiary undertakings for which the director has assumed responsibility.
•Any proposal in which the director is interested, concerning the underwriting of company securities or debentures or the giving of any security to a third party for a debt or obligation of the company or any of its subsidiary undertakings.
•Any proposal concerning any other company in which the director is interested, directly or indirectly (whether as an officer or shareholder or otherwise) provided that the director and persons connected with such director are not the holder or holders of 1% or more of the voting interest in the shares of such company.
•Any proposal concerning the purchase or maintenance of any insurance policy under which the director may benefit.
•Any proposal concerning the giving to the director of any other indemnity which is on substantially the same terms as indemnities given or to be given to all of the other directors or to the funding by the company of his expenditure on defending proceedings or the doing by the company of anything to enable the director to avoid incurring such expenditure where all other directors have been given or are to be given substantially the same arrangements.
•Any proposal concerning an arrangement for the benefit of the employees and directors or former employees and former directors of
« See glossary on page 373 | bp Annual Report and Form 20-F 2023 | 367 | ||||||||||||
the company or any of its subsidiary undertakings, including but without being limited to a retirement benefits scheme and an employees’ share scheme, which does not accord to any director any privilege or advantage not generally accorded to the employees or former employees to whom the arrangement relates.
The Act requires a director of a company who is in any way interested in a contract or proposed contract with the company to declare the nature of the director’s interest at a meeting of the directors of the company. The definition of ‘interest’ includes the interests of spouses, children, companies and trusts. The Act also requires that a director must avoid a situation where a director has, or could have, a direct or indirect interest that conflicts, or possibly may conflict, with the company’s interests. The Act allows directors of public companies to authorize such conflicts where appropriate, if a company’s Articles of Association so permit. The company’s Articles of Association permit the authorization of such conflicts. The directors may exercise all the powers of the company to borrow money, except that the amount remaining undischarged of all moneys borrowed by the company shall not, without approval of the shareholders, exceed two times the amount paid up on the share capital plus the aggregate of the amount of the capital and revenue reserves of the company and its subsidiary undertakings incorporated in the UK. Variation of the borrowing power of the board may only be affected by amending the Articles of Association.
Remuneration of non-executive directors shall be determined in the aggregate by resolution of the shareholders. Remuneration of executive directors is determined by the remuneration committee. This committee is made up of non-executive directors only. There is no requirement of share ownership for a director’s qualification.
The Articles of Association provide entitlement to the directors’ pensions and death and disability benefits to the directors’ relations and dependants respectively.
The circumstances in which a director’s office will automatically terminate include, amongst others: when a director ceases to hold an executive office of the company and the directors resolve that they should cease to be a director; if a medical practitioner provides an opinion that a director has become incapable of acting as a director and may remain so incapable for more than a further three months and the directors resolve that they should cease to be a director; and if all of the other directors vote in favour of a resolution stating that the person should cease to be a director.
The company secretary has express powers to delegate any of the powers or discretions conferred on him or her.
Dividend rights; other rights to share in company profits; capital calls
Shareholders of the company may, by resolution, declare dividends but no such dividend may be declared in excess of the amount recommended by the directors. The directors may also pay interim dividends without obtaining shareholder approval. No dividend may be paid other than out of profits available for distribution, as determined under IFRS and the Act. Dividends on ordinary shares are payable only after payment of dividends on bp preference shares. Any dividend unclaimed after a period of 10 years from the date of declaration of such dividend shall be forfeited and reverts to bp. If the company exercises its right to forfeit shares and sells shares belonging to an untraced shareholder then any entitlement to claim dividends or other monies unclaimed in respect of those shares will be for a period of 12 months after the sale. The company may take such steps as the directors decide are appropriate in the circumstances to trace the member entitled and the sale may be made at such time and on such terms as the directors may decide.
The directors have the power to declare and pay dividends in any currency provided that a sterling equivalent is announced. It is not the company’s intention to change its current policy of paying dividends in US dollars. At the company’s AGM held on 15 April 2010, shareholders approved the introduction of a Scrip Dividend Programme (Scrip Programme) and to include provisions in the Articles of Association to enable the company to operate the Scrip Programme. The Scrip Programme was renewed at the company’s AGM held on 12 May 2021 for a further three years. The Scrip Programme enables ordinary shareholders and bp ADS holders to elect to receive new fully paid ordinary shares (or bp ADSs in the case of bp ADS holders) instead of cash. The operation of the Scrip Programme is always
subject to the directors’ decision to make the scrip offer available in respect of any particular dividend. Should the directors decide not to offer the scrip in respect of any particular dividend, cash will automatically be paid instead. The directors may determine in relation to any scrip dividend plan or programme how the costs of the programme will be met, the minimum number of ordinary shares required in order to be able to participate in the programme and any arrangements to deal with legal and practical difficulties in any particular territory.
Apart from shareholders’ rights to share in bp’s profits by dividend (if any is declared or announced), the Articles of Association provide that the directors may set aside:
•A special reserve fund out of the balance of profits each year to make up any deficit of cumulative dividend on the bp preference shares.
•A general reserve out of the balance of profits each year, which shall be applicable for any purpose to which the profits of the company may properly be applied. This may include capitalization of such sum, pursuant to an ordinary shareholders’ resolution, and distribution to shareholders as if it were distributed by way of a dividend on the ordinary shares or in paying up in full unissued ordinary shares for allotment and distribution as bonus shares.
Any such sums so deposited may be distributed in accordance with the manner of distribution of dividends as described above.
Holders of shares are not subject to calls on capital by the company, provided that the amounts required to be paid on issue have been paid off. All shares are fully paid.
Share transfers and share certificates
The directors may permit transfers to be effected other than by an instrument in writing. Share certificates will not be required to be issued by the company if they are not required by law.
The company may charge an administrative fee in the event that a shareholder wishes to replace two or more certificates representing shares with a single certificate or wishes to surrender a single certificate and replace it with two or more certificates. All certificates are sent at the member’s risk.
Voting rights
The Articles of Association of the company provide that voting on resolutions at a shareholders’ meeting will be decided on a poll other than resolutions of a procedural nature, which may be decided on a show of hands. If voting is on a poll, every shareholder who is present in person or by proxy has one vote for every ordinary share held and two votes for every £5 in nominal amount of bp preference shares held. If voting is on a show of hands, each shareholder who is present at the meeting in person or whose duly appointed proxy is present in person will have one vote, regardless of the number of shares held, unless a poll is requested.
Shareholders do not have cumulative voting rights.
For the purposes of determining which persons are entitled to attend or vote at a shareholders’ meeting and how many votes such persons may cast, the company may specify in the notice of the meeting a time, not more than 48 hours before the time of the meeting, by which a person who holds shares in registered form must be entered on the company’s register of members in order to have the right to attend or vote at the meeting or to appoint a proxy to do so.
Holders on record of ordinary shares may appoint a proxy, including a beneficial owner of those shares, to attend, speak and vote on their behalf at any shareholders’ meeting, provided that a duly completed proxy form is received not less than 48 hours (or such shorter time as the directors may determine) before the time of the meeting or adjourned meeting or, where the poll is to be taken after the date of the meeting, not less than 24 hours (or such shorter time as the directors may determine) before the time of the poll.
Record holders of bp ADSs are also entitled to attend, speak and vote at any shareholders’ meeting of the company by the appointment by the approved depositary, JPMorgan Chase Bank N.A., of them as proxies in respect of the ordinary shares represented by their ADSs. Each such proxy may also appoint a proxy. Alternatively, holders of bp ADSs are entitled to vote by supplying their voting instructions to the Depositary, who will vote
368 | bp Annual Report and Form 20-F 2023 | |||||||||||||
| Shareholder information | ||
the ordinary shares represented by their ADSs in accordance with their instructions.
Proxies may be delivered electronically.
Corporations who are members of the company may appoint one or more persons to act as their representative or representatives at any shareholders’ meeting provided that the company may require a corporate representative to produce a certified copy of the resolution appointing them before they are permitted to exercise their powers.
Matters are transacted at shareholders’ meetings by the proposing and passing of resolutions, of which there are two types: ordinary or special.
An ordinary resolution requires the affirmative vote of a majority of the votes cast at a meeting at which there is a quorum. A special resolution requires the affirmative vote of not less than three quarters of the votes cast at a meeting at which there is a quorum. Any AGM requires 21 clear days’ notice. The notice period for any other general meeting is 14 clear days subject to the company obtaining annual shareholder approval, failing which, a 21 clear day notice period will apply.
Liquidation rights; redemption provisions
In the event of a liquidation of bp, after payment of all liabilities and applicable deductions under UK laws and subject to the payment of secured creditors, the holders of bp preference shares would be entitled to the sum of (1) the capital paid up on such shares plus, (2) accrued and unpaid dividends and (3) a premium equal to the higher of (a) 10% of the capital paid up on the bp preference shares and (b) the excess of the average market price over par value of such shares on the LSE during the previous six months. The remaining assets (if any) would be divided pro rata among the holders of ordinary shares.
Without prejudice to any special rights previously conferred on the holders of any class of shares, bp may issue any share with such preferred, deferred or other special rights, or subject to such restrictions as the shareholders by resolution determine (or, in the absence of any such resolutions, by determination of the directors), and may issue shares that are to be or may be redeemed.
Variation of rights
The rights attached to any class of shares may be varied with the consent in writing of holders of 75% of the shares of that class or on the adoption of a special resolution passed at a separate meeting of the holders of the shares of that class. At every such separate meeting, all of the provisions of the Articles of Association relating to proceedings at a general meeting apply, except that the quorum with respect to a meeting to change the rights attached to the preference shares is 10% or more of the shares of that class, and the quorum to change the rights attached to the ordinary shares is one third or more of the shares of that class.
Shareholders’ meetings and notices
Shareholders must provide bp with a postal or electronic address in the UK to be entitled to receive notice of shareholders’ meetings. Holders of bp ADSs are entitled to receive notices under the terms of the deposit agreement relating to bp ADSs. The substance and timing of notices are described above under the heading Voting rights.
Under the Act, the AGM of shareholders must be held once every year, within each six-month period beginning with the day following the company’s accounting reference date. All general meetings shall be held at a time and place determined by the directors. If any shareholders’ meeting is adjourned for lack of quorum, notice of the time and place of the adjourned meeting may be given in any lawful manner, including electronically. Powers exist for action to be taken either before or at the meeting by authorized officers to ensure its orderly conduct and safety of those attending.
The directors have power to convene a general meeting which is a hybrid meeting, that is to provide facilities for shareholders to attend a meeting which is being held at a physical place by electronic means as well (but not to convene a purely electronic meeting).
The provisions of the Articles of Association in relation to satellite meetings permit facilities being provided by electronic means to allow those persons at each place to participate in the meeting.
Limitations on voting and shareholding
There are no limitations, either under the laws of the UK or under the company’s Articles of Association, restricting the right of non-resident or foreign owners to hold or vote bp ordinary or preference shares in the company other than limitations that would generally apply to all of the shareholders and limitations applicable to certain countries and persons subject to EU economic sanctions or those sanctions adopted by the UK government which implement resolutions of the Security Council of the United Nations.
Disclosure of interests in shares
The Act permits a public company to give notice to any person whom the company believes to be or, at any time during the three years prior to the issue of the notice, to have been interested in its voting shares requiring them to disclose certain information with respect to those interests. Failure to supply the information required may lead to disenfranchisement of the relevant shares and a prohibition on their transfer and receipt of dividends and other payments in respect of those shares and any new shares in the company issued in respect of those shares. In this context the term ‘interest’ is widely defined and will generally include an interest of any kind whatsoever in voting shares, including any interest of a holder of bp ADSs.
Called-up share capital
Details of the allotted, called-up and fully-paid share capital at 31 December 2023 are set out in Financial statements – Note 31. In accordance with institutional investor guidelines, the company deems it appropriate to grant authority to the directors to allot shares and other securities and to disapply pre-emption rights by way of shareholders' resolutions at each AGM in place of authority granted by virtue of the company's Articles of Association. At the AGM on 27 April 2023, authorization was given to the directors to allot shares in the company and to grant rights to subscribe for, or to convert any security into, shares in the company up to an aggregate nominal amount as set out in the Notice of Annual General Meeting 2023. These authorities were given for the period until the next AGM in 2024 or 27 July 2024, whichever is the earlier. These authorities are renewed annually at the AGM.
Company records and service of notice
In relation to notices not covered by the Act, the reference to notice by advertisement in a national newspaper also includes advertisements via other means such as a public announcement.
« See glossary on page 373 | bp Annual Report and Form 20-F 2023 | 369 | ||||||||||||
Purchases of equity securities by the issuer and affiliated purchasers
During the 2023 financial year the company repurchased 1,262,982,632 ordinary shares with a nominal value of $0.25 each for a total consideration of $7,917,779,459 (including transaction costs), for the purpose of reducing the issued share capital of the company in order to return capital to shareholders and to offset the expected dilution from the vesting of awards under employee share schemes. The shares repurchased in 2023 represented 7.35% of the company’s issued share capital, excluding shares held in treasury, on 31 December 2023. Of the shares repurchased in 2023, shares purchased under the 2022 AGM authority represented 3.57%, and shares purchased under the 2023 AGM authority represented 3.78%, of bp’s issued share capital, excluding shares held in treasury, on 31 December 2023. A further 155,997,926 ordinary shares were repurchased between the end of the financial year and 16 February 2024 at a cost of $921,854,905 (including transaction costs) representing 0.91% of the company’s issued share capital, excluding shares held in treasury, on 31 December 2023. All ordinary shares repurchased in 2023 and in 2024 up to 16 February under the share buyback programmes were cancelled.
Authorization for the company to make market purchases (as defined in section 693(4) of the Companies Act 2006) of ordinary shares with a nominal value of $0.25 each in the company was renewed at the company’s 2023 AGM covering the period until the date of the company’s 2024 AGM or 27 July 2024, whichever is earlier. The maximum number of ordinary shares to be purchased under this authority will not exceed 1,805,104,334 ordinary shares. The shares purchased will be cancelled.
The following table provides details of ordinary share purchases made (1) under the share buyback programmes and (2) by the Employee Share Ownership Plans (ESOPs) and other purchases of ordinary shares and ADSs made to satisfy the requirements of certain employee share-based payment plans.
Total number of shares purchaseda | Average price paid per share $ | Number of shares purchased by ESOPs or for certain employee share-based plansb | Number of shares purchased under buyback programmesc | Maximum approximate dollar value of shares yet to be purchased under the programmes $ million | ||||||||||||||||
| 2023 | ||||||||||||||||||||
| January 05 - January 31 | 68,903,875 | 5.90 | 68,903,875 | N/A | ||||||||||||||||
| February 01 - February 28 | 102,718,280 | 6.59 | 102,718,280 | N/A | ||||||||||||||||
| March 01 - March 31 | 213,867,501 | 6.38 | 213,867,501 | N/A | ||||||||||||||||
| April 03 - April 28 | 141,850,648 | 6.66 | 141,850,648 | N/A | ||||||||||||||||
| May 02 - May 31 | 87,193,292 | 6.16 | 87,193,292 | N/A | ||||||||||||||||
| June 01 - June 30 | 100,436,661 | 5.88 | 100,436,661 | N/A | ||||||||||||||||
| July 03 - July 31 | 145,630,746 | 6.04 | 145,630,746 | N/A | ||||||||||||||||
| August 01 - August 31 | 83,873,967 | 6.13 | 83,873,967 | N/A | ||||||||||||||||
| September 01 - September 29 | 101,341,955 | 6.45 | 101,341,955 | N/A | ||||||||||||||||
| October 02 - October 31 | 91,937,237 | 6.51 | 91,937,237 | N/A | ||||||||||||||||
| November 02 - November 30 | 90,722,912 | 6.00 | 90,722,912 | N/A | ||||||||||||||||
| December 01 - December 29 | 59,193,301 | 5.97 | 24,687,743 | 34,505,558 | N/A | |||||||||||||||
| 2024 | ||||||||||||||||||||
| January 02 - January 31 | 113,923,673 | 5.87 | 7,312,257 | 106,611,416 | N/A | |||||||||||||||
| February 02 - February 16 | 49,386,510 | 6.02 | 49,386,510 | N/A | ||||||||||||||||
aAll share purchases were of ordinary shares of $0.25 each and/or ADSs (each representing six ordinary shares) and were on/open market transactions.
bTransactions represent the purchases of ordinary shares and ADSs made to satisfy requirements of certain employee share-based payment plans.
cShare repurchases from 1 January to 3 February 2023 were made under a share buyback programme announced on 1 November 2022 for a period up to and including 3 February 2023. The company announced two programmes in one announcement on 7 February 2023. One covered a period up to and including 28 April 2023 and the other, relating to employee share schemes, was for a period up to and including 30 September 2023. On 2 May 2023 the company announced a programme covering a period up to and including 28 July 2023. On 1 August 2023 the company announced a programme covering a period up to and including 27 October 2023. On 31 October 2023 the company announced a programme covering a period up to and including 2 February 2024. On 6 February 2024 the company announced a programme covering a period up to and including 3 May 2024.
370 | bp Annual Report and Form 20-F 2023 | |||||||||||||
| Shareholder information | ||
Fees and charges payable by ADS holders
The Depositary collects fees for delivery and surrender of ADSs directly from investors depositing shares or surrendering ADSs for the purpose of withdrawal or from intermediaries acting for them. The Depositary collects fees for making distributions to investors by deducting those fees from the amounts distributed or by selling a portion of the distributable property to pay the fees.
The charges of the Depositary payable by investors are as follows:
| Type of service | Depositary actions | Fee | ||||||
| Depositing or substituting the underlying shares | Issuance of ADSs against the deposit of shares, including deposits and issuances in respect of: •Share distributions, stock splits, rights, merger. •Exchange of securities or other transactions or event or other distribution affecting the ADSs or deposited securities. | $5.00 per 100 ADSs (or portion thereof) evidenced by the new ADSs delivered. | ||||||
| Selling or exercising rights | Distribution or sale of securities, the fee being an amount equal to the fee for the execution and delivery of ADSs that would have been charged as a result of the deposit of such securities. | $5.00 per 100 ADSs (or portion thereof). | ||||||
| Withdrawing an underlying share | Acceptance of ADSs surrendered for withdrawal of deposited securities. | $5.00 for each 100 ADSs (or portion thereof) evidenced by the ADSs surrendered. | ||||||
| Expenses of the Depositary | Expenses incurred on behalf of holders in connection with: •Stock transfer or other taxes and governmental charges. •Delivery by cable, telex, electronic and facsimile transmission. •Transfer or registration fees, if applicable, for the registration of transfers of underlying shares. •Expenses of the Depositary in connection with the conversion of foreign currency into US dollars (which are paid out of such foreign currency). | Expenses payable are subject to agreement between the company and the Depositary by billing holders or by deducting charges from one or more cash dividends or other cash distributions. | ||||||
| Dividend fees | ADS holders who receive a cash dividend are charged a fee which bp uses to offset the costs associated with administering the ADS programme. | The Deposit Agreement provides that a fee of $0.05 or less per ADS can be charged. The current fee is $0.02 per bp ADS per calendar year (equivalent to $0.005 per bp ADS per quarter per cash distribution). | ||||||
| Global Invest Direct (GID) Plan | New investors and existing ADS holders can buy, sell or reinvest dividends into further bp ADSs by enrolling in bp’s GID Plan, sponsored and administered by the Depositary. | Cost per transaction is $2.00 for recurring, $2.00 for one-time automatic investments, and $5.00 for investment made by check. Dividend reinvestment is 5% of the dividend amount up to a maximum of $5.00. Purchase trading commission is $0.12 per share. | ||||||
Fees and payments made by the Depositary to the issuer
The Depositary has agreed to reimburse certain company expenses related to the company’s ADS programme and incurred by the company in connection with the ADS programme arising during the year ended 31 December 2023. The Depositary reimbursed to the company, or paid amounts on the company’s behalf to third parties, or waived its fees and expenses, of $16,165,200.95 for the year ended 31 December 2023.
The table below sets out the types of expenses that the Depositary has agreed to reimburse and the fees it has agreed to waive for standard costs associated with the administration of the ADS programme relating to the year ended 31 December 2023.
| Category of expense reimbursed, waived or paid directly to third parties | Amount reimbursed, waived or paid directly to third parties for the year ended 31 December 2023 | ||||
| Fees for delivery and surrender of bp ADSs | 1,763,093.64 | ||||
Dividend feesa | 14,400,550.21 | ||||
| Waived fees | 1,557.10 | ||||
| Total | 16,165,200.95 | ||||
a Dividend fees are charged to ADS holders who receive a cash distribution, which bp uses to offset the costs associated with administering the ADS programme.
Under certain circumstances, including removal of the Depositary or termination of the ADS programme by the company, the company is required to repay the Depositary certain amounts reimbursed and/or expenses paid to or on behalf of the company during the 12-month period prior to notice of removal or termination.
Documents on display
The bp Annual Report and Form 20-F 2023 is available online at bp.com/annualreport. To obtain a hard copy of bp’s complete audited financial statements, free of charge, UK based shareholders should contact bp Distribution Services by calling +44 (0) 800 037 2172 or by emailing bpdistributionservices@bp.com. If based in the US or Canada shareholders should contact Issuer Direct by calling +1 888 301 2505 or by emailing bpreports@issuerdirect.com.
The company is subject to the information requirements of the US Securities Exchange Act of 1934 applicable to foreign private issuers. In accordance with these requirements, the company files its Annual Report and Form 20-F and other related documents with the SEC. The SEC maintains an internet site at sec.gov that contains reports and other information regarding issuers, including bp, that file electronically with the SEC. bp's SEC filings are also available at bp.com/sec. bp discloses in this report (see Corporate governance practices (Form 20-F Item 16G) on page 358) significant ways (if any) in which its corporate governance practices differ from those mandated for US companies under NYSE listing standards.
« See glossary on page 373 | bp Annual Report and Form 20-F 2023 | 371 | ||||||||||||
Shareholding administration
If you have any queries about the administration of shareholdings, such as change of address, change of ownership, dividend payment options or to change the way you receive your company documents (such as the bp Annual Report and Form 20-F and Notice of bp Annual General Meeting) please contact the bp Registrar or the bp ADS Depositary.
Holders of American Depositary Receipts may request to inspect the books of the Depositary and the listing of receipt holders by contacting the bp ADS Depositary.
Ordinary and preference shareholders
The bp Registrar, Link Group, Central Square,
29 Wellington Street,
Leeds, LS1 4DL
Freephone in the UK 0800 701107
From outside the UK +44 (0)371 277 1014
bp share centre mybpshares.com
ADS holders
bp Shareowner Services
PO Box 64504, St Paul, MN 55164-0504, US
Toll-free in the US +1 877 638 5672
From outside the US +1 651 306 4383
2024 shareholder calendara
| 28 Mar 2024 | Fourth quarter interim dividend payment for 2023 | ||||
25 Apr 2024 | Annual general meeting | ||||
07 May 2024 | First quarter results announced | ||||
17 May 2024 | Record date (to be eligible for the first quarter interim dividend) | ||||
28 Jun 2024 | First quarter interim dividend payment for 2024 | ||||
28 Jun 2024 | 8% and 9% preference shares record date | ||||
30 Jul 2024 | Second quarter results announced | ||||
31 Jul 2024 | 8% and 9% preference shares dividend payment | ||||
09 Aug 2024 | Record date (to be eligible for the second quarter interim dividend) | ||||
20 Sep 2024 | Second quarter interim dividend payment for 2024 | ||||
29 Oct 2024 | Third quarter results announced | ||||
08 Nov 2024 | Record date (to be eligible for the third quarter interim dividend) | ||||
20 Dec 2024 | Third quarter interim dividend payment for 2024 | ||||
aAll future dates are provisional and may be subject to change. For the full calendar see bp.com/financialcalendar.
372 | bp Annual Report and Form 20-F 2023 | |||||||||||||
Glossary
Abbreviations
ADR
American depositary receipt.
ADS
American depositary share. 1 ADS = 6 ordinary shares.
Barrel (bbl)
159 litres, 42 US gallons.
bcf
Billion cubic feet.
bcfe
Billion cubic feet equivalent.
boe
Barrels of oil equivalent.
EJ/yr
Exajoules per year.
EVP
Executive vice president.
FPSO
Floating production, storage and offloading.
GAAP
Generally accepted accounting practice.
Gas
Natural gas.
gCO2e/MJ
Grams of carbon dioxide equivalent per megajoule of energy.
GHG
Greenhouse gas.
GRI
Global Reporting Initiative.
GtCO2
Gigatonnes of carbon dioxide.
GW
Gigawatt.
GWh
Gigawatt hour.
HSSE
Health, safety, security and environment.
IFRS
International Financial Reporting Standards.
kb/d
Thousand barrels per day.
KPIs
Key performance indicators.
kt
Thousand tonnes.
LNG
Liquefied natural gas.
LPG
Liquefied petroleum gas.
mb/d
Thousand barrels per day.
Mbbl
Million barrels.
mboe/d
Thousand barrels of oil equivalent per day.
mmb/d
Million barrels per day.
mmboe/d
Million barrels of oil equivalent per day.
mmBtu
Million British thermal units.
mmcf/d
Million cubic feet per day.
Mt
Million tonnes.
MtCO2e
Million tonnes of CO2 equivalent.
Mtpa
Million tonnes per annum.
MW
Megawatt.
MWe
Megawatt electrical.
MWp
Megawatt peak.
NGLs
Natural gas liquids.
PSA
Production-sharing agreement.
PTA
Purified terephthalic acid.
RC
Replacement cost.
SEC
The United States Securities and Exchange Commission.
TWh
Terawatt hour.
SVP
Senior vice president.
scfm
Standard cubit feet per minute
Definitions
Unless the context indicates otherwise, the definitions for the following glossary terms are given below.
Non-IFRS measures are sometimes referred to as alternative performance measures.
CA100+ resolution glossary
CA100+ resolution
The CA100+ resolution means the special resolution requisitioned by Climate Action 100+ and passed at bp’s 2019 Annual General Meeting, the text of which is set out below.
« See glossary on page 373 | bp Annual Report and Form 20-F 2023 | 373 | ||||||||||||
Special resolution: Climate Action 100+ shareholder resolution on climate change disclosures
That in order to promote the long-term success of the company, given the recognized risks and opportunities associated with climate change, we as shareholders direct the company to include in its strategic report and/or other corporate reports, as appropriate, for the year ending 2019 onwards, a description of its strategy which the board considers, in good faith, to be consistent with the goals of Articles 2.1(a)(1) and 4.1(2) of the Paris Agreement (3) (the Paris goals), as well as:
(1)Capital expenditure: how the company evaluates the consistency of each new material capex investment, including in the exploration, acquisition or development of oil and gas resources and reserves and other energy sources and technologies, with (a) the Paris goals and separately (b) a range of other outcomes relevant to its strategy.
(2) Metrics and targets: the company’s principal metrics and relevant targets or goals over the short, medium and/or long term, consistent with the Paris goals, together with disclosure of:
a. The anticipated levels of investment in (i) oil and gas resources and reserves; and (ii) other energy sources and technologies.
b. The company’s targets to promote reductions in its operational greenhouse gas emissions, to be reviewed in line with changing protocols and other relevant factors.
c. The estimated carbon intensity of the company’s energy products and progress on carbon intensity over time.
d. Any linkage between the above targets and executive remuneration.
(3) Progress reporting: an annual review of progress against (1) and (2) above.
Such disclosure and reporting to include the criteria and summaries of the methodology and core assumptions used, and to omit commercially confidential or competitively sensitive information and be prepared at reasonable cost; and provided that nothing in this resolution shall limit the company’s powers to set and vary its strategy, or associated targets or metrics, or to take any action which it believes in good faith, would best promote the long-term success of the company.
The Paris goals
(1) Article 2.1(a) of the Paris Agreement states the goal of ‘Holding the increase in the global average temperature to well-below-2°C above pre-industrial levels and pursuing efforts to limit the temperature increase to 1.5°C above pre-industrial levels, recognizing that this would significantly reduce the risks and impacts of climate change’.
(2) Article 4.1 of the Paris Agreement: In order to achieve the long-term temperature goal set out in Article 2, parties aim to reach global peaking of greenhouse gas emissions as soon as possible, recognizing that peaking will take longer for developing country parties, and to undertake rapid reductions thereafter in accordance with best available science, so as to achieve a balance between anthropogenic emissions by sources and removals by sinks of greenhouse gases in the second half of this century, on the basis of equity, and in the context of sustainable development and efforts to eradicate poverty.
(3) U.N. Framework Convention on Climate Change Conference of Parties, Twenty-First Session, Adoption of the Paris Agreement, U.N. Doc. FCCC/CP/2015/L.9/Rev.1 (Dec. 12, 2015).
New material capex investment
For the purposes of the 2023 evaluation discussed on pages 30-34, ‘new material capex investment’ means a decision taken by the resource commitment meeting (RCM) in 2023 to incur inorganic or organic investments greater than $250 million that relate to a new project or asset, extending an existing project or asset, or acquiring or increasing a share in a project, asset or entity.
There were nine investments that met the above criteria in 2023.
Material capex evaluation: Paris-consistency quantitative tests.
For the purposes of evaluating material capex investments for consistency with the Paris goals, two quantitative tests were applied, see page 33.
Operational carbon intensity (CI)
The annual average operational GHG emissions (TeCO2e/unit), divided by the relevant unit of output:
•Per thousand barrels of oil equivalent in upstream.
•Per utilized equivalent distillation capacity in refining.
•per thousand tonnes of petrochemicals production.
Net zero aims and ambition glossary
Average carbon intensity of sold energy products
The rate of GHG emissions per unit of energy delivered (in grams CO2e/MJ) estimated in respect of sold energy products«. GHG emissions are estimated on a lifecycle basis covering use, production, and distribution of sold energy products.
Emissions from the carbon in our upstream oil and gas production
Estimated CO2 emissions from the combustion of upstream production of crude oil, natural gas and natural gas liquids (NGLs) based on bp’s net share of production, excluding bp’s share of Rosneft production and assuming that all produced volumes undergo full stoichiometric combustion to CO2.
Energy product
For the purposes of our 2023 disclosures relating to our aim 3, we consider an energy product to be one that is generally used to satisfy an energy demand. In the case of fuels, to burn them to release their calorific content, and in the case of electricity to provide work or heat. For further information on products included in bp’s 2023 aim 3 reporting see the basis of reporting bp.com/basisofreporting.
Methane intensity
Methane intensity refers to the amount of methane emissions from bp’s operated upstream oil and gas assets as a percentage of the total gas that goes to market from those operations. Our methodology is aligned with the Oil and Gas Climate Initiative’s (OGCI).
Net zero
References to global net zero in the phrase, 'to help the world get to net zero', means achieving '...a balance between anthropogenic emissions by sources and removals by sinks of greenhouse gases...on the basis of equity, and in the context of sustainable development and efforts to eradicate poverty', as set out in Article 4(1) of the Paris Agreement.
References to net zero for bp in the context of our ambition and aims 1, 2 and 3 mean achieving a balance between (a) the relevant Scope 1 and 2 emissions (for aim 1), Scope 3 emissions (for aim 2) or product lifecycle emissions (for aim 3) and (b) the aggregate of applicable deductions from qualifying activities such as sinks under our methodology at the applicable time.
Net zero« operations
bp’s aim to reach net zero operational greenhouse gas (CO2 and methane) emissions by 2050 or sooner, on a gross operational control basis, in accordance with bp’s aim 1 which relates to our reported Scope 1 and 2 emissions. Any interim target or aim in respect of bp’s aim 1 is defined in terms of absolute reductions relative to the baseline year of 2019.
Net zero« production
bp’s aim to reach net zero CO2 emissions, in accordance with bp’s aim 2, from the carbon in our upstream oil and gas production, in respect of the estimated CO2 emissions from the combustion of upstream production of crude oil, natural gas and natural gas liquids (based on bp’s net share of production, excluding bp’s share of Rosneft production and assuming that all produced volumes undergo full stoichiometric combustion to CO2). Aim 2 is bp’s Scope 3 aim and relates to Scope 3 category 11 emissions within the selected boundary of bp’s net share of upstream production of oil and gas. Any interim target or aim in respect of bp’s aim 2 is defined in terms of absolute reductions relative to the baseline year of 2019.
Net zero« sales
bp’s aim to reach net zero for the carbon intensity of sold energy products«, in accordance with bp’s aim 3. Any interim target or aim in respect of bp’s aim 3 is defined in terms of reductions in the carbon
374 | bp Annual Report and Form 20-F 2023 | |||||||||||||
intensity of the energy products we sell (in grams CO2e/MJ) relative to the baseline year of 2019.
Physically traded energy products
For the purposes of aim 3, this includes trades in energy products«which are physically settled, with the exception of, for example, financial trades and certain other transactions where the purpose or effect is that the volumes traded or supplied net off against each other.
Sold energy products
For the purposes of aim 3, these represent the energy products« we sell to third parties including both marketed sales and physically traded energy products«. For these purposes, intercompany sales (sales between two group subsidiaries) are not included and equity-accounted entities are treated as third parties.
Sustainable emissions reductions (SER)
SERs result from actions or interventions that have led to ongoing reductions in Scope 1 (direct) and/or Scope 2 (indirect) greenhouse gas (GHG) emissions (carbon dioxide and methane) such that GHG emissions would have been higher in the reporting year if the intervention had not taken place. SERs must meet three criteria: a specific intervention that has reduced GHG emissions, the reduction must be quantifiable and the reduction is expected to be ongoing. Reductions are reportable for a
12-month period from the start of the intervention/action.
12-month period from the start of the intervention/action.
Adjusted EBIDA
Adjusted EBIDA is a non-IFRS measure and is defined as profit or loss for the period, adjusting for finance costs and net finance (income) or expense relating to pensions and other post-retirement benefits and taxation, inventory holding gains or losses before tax, net adjusting items« before interest and tax, and taxation on an underlying RC basis, and adding back depreciation, depletion and amortization (pre-tax) and exploration expenditure written-off (net of adjusting items, pre-tax). bp believes that adjusted EBIDA is a useful measure for investors because it is a measure closely tracked by management to evaluate bp’s operating performance and to make financial, strategic and operating decisions and because it may help investors to understand and evaluate, in the same manner as management, the underlying trends in bp’s operational performance on a comparable basis, period on period. The nearest equivalent measure on an IFRS basis is profit or loss for the period. A reconciliation of profit or loss for the period to adjusted EBIDA is provided on page 383.
Adjusted EBIDA per share compound annual growth rate (CAGR)
Non-IFRS measure. Adjusted EBIDA per share is calculated based on the shares in issue at period end.
Adjusted EBITDA
Adjusted EBITDA is a non-IFRS measure presented for bp's operating segments and the group. Adjusted EBITDA for bp's operating segments is defined as replacement cost (RC) profit before interest and tax, excluding net adjusting items* before interest and tax, and adding back depreciation, depletion and amortization and exploration write-offs (net of adjusting items). Adjusted EBITDA by business is a further analysis of adjusted EBITDA for the customers & products businesses. bp believes it is helpful to disclose adjusted EBITDA by operating segment and by business because it reflects how the segments measure underlying business delivery. The nearest equivalent measure on an IFRS basis for the segment is RC profit or loss before interest and tax, which is bp's measure of profit or loss that is required to be disclosed for each operating segment under IFRS. A reconciliation to IFRS information is provided on pages 351 and 384.
Adjusted EBITDA for the group is defined as profit or loss for the period, adjusting for finance costs and net finance (income) or expense relating to pensions and other post-retirement benefits and taxation, inventory holding gains or losses before tax, net adjusting items before interest and tax, and adding back depreciation, depletion and amortization (pre-tax) and exploration expenditure written-off (net of adjusting items, pre-tax). The nearest equivalent measure on an IFRS basis for the group is profit or loss for the period. A reconciliation to IFRS information is provided on page 384.
We are unable to present reconciliations of forward-looking information for adjusted EBITDA for the group, strategic themes or transition growth engine, because without unreasonable efforts, we are unable to forecast
accurately certain adjusting items required to calculate a meaningful comparable IFRS forward-looking financial measure. These items include inventory holding gains or losses, adjusting items and exploration expenditure written off that are difficult to predict in advance in order to include in an IFRS estimate.
Adjusted free cash flow
Adjusted free cash flow, as applicable to the directors’ remuneration performance measure, is a non-IFRS measure and is defined as Operating cash flow less: (1) net cash used in investing activities as presented in the group cash flow statement; and (2) lease liability payments included in financing activities and adjusting for other proceeds reported within financing activities in the group cash flow statement and movements in lease creditor.
Adjusting items
Adjusting items are items that bp discloses separately because it considers such disclosures to be meaningful and relevant to investors. They are items that management considers to be important to period-on-period analysis of the group's results and are disclosed in order to enable investors to better understand and evaluate the group’s reported financial performance. Adjusting items include gains and losses on the sale of businesses and fixed assets, impairments, environmental and other provisions and charges, restructuring, integration and rationalization costs, fair value accounting effects, costs relating to the Gulf of Mexico oil spill and other items. Adjusting items within equity-accounted earnings are reported net of incremental income tax reported by the equity-accounted entity. Adjusting items are used as a reconciling adjustment to derive underlying RC profit or loss and related underlying measures which are non-IFRS measures. An analysis of adjusting items by segment and type is shown on page 337.
Associate
An entity over which the group has significant influence and that is neither a subsidiary nor a joint arrangement of the group. Significant influence is the power to participate in the financial and operating policy decisions of the investee but is not control or joint control over those policies.
Biofuels production
Biofuels production is average thousands of barrels of biofuel production per day during the period covered net to bp. This includes equivalent ethanol production, bp Bunge biopower for grid export, refining co-processing and standalone hydrogenated vegetable oil (HVO).
Biogas supply volumes
Biogas supply volumes is the average thousands of barrels of oil equivalent per day of production and offtakes during the period covered net to bp.
Bio-refinery
A facility that is dedicated to processing biological materials (including waste oil and crop waste) to produce biofuels such as biodiesel and sustainable aviation fuel, which may be blended to customer specifications with other components such as hydrocarbons at co-located or adjacent terminals and tanks.
Blue hydrogen
Hydrogen made from natural gas in combination with carbon captured and stored (CCS).
Capital employed
Non-IFRS measure. It is defined as total equity plus finance debt.
Capital expenditure
Total cash capital expenditure as stated in the group cash flow statement. Capital expenditure for the operating segments, gas & low carbon energy businesses and customers & products businesses is presented on the same basis.
Cash balance point
Cash balance point is defined as the implied Brent oil price 2021 real to balance bp’s sources and uses of cash assuming an average bp refining marker margin around $11/bbl and Henry Hub at $3/mmBtu in 2021 real terms.
Commodity trading contracts
bp participates in regional and global commodity trading markets in order to manage, transact and hedge the crude oil, refined products and natural
« See glossary on page 373 | bp Annual Report and Form 20-F 2023 | 375 | ||||||||||||
gas that the group either produces or consumes in its manufacturing operations. The range of contracts the group enters into in its commodity trading operations is described below. Using these contracts, in combination with rights to access storage and transportation capacity, allows the group to access advantageous pricing differences between locations, time periods and grades.
Exchange-traded commodity derivatives
Contracts that are typically in the form of futures and options traded on a recognized exchange, such as Nymex and ICE. Such contracts are traded in standard specifications for the main marker crude oils, such as Brent and West Texas Intermediate; the main product grades, such as gasoline and gasoil; and for natural gas and power. Gains and losses, otherwise referred to as variation margin, are generally settled on a daily basis with the relevant exchange. These contracts are used for the trading and risk management of crude oil, refined products, and natural gas and power. Realized and unrealized gains and losses on exchange-traded commodity derivatives are included in sales and other operating revenues for accounting purposes.
Over-the-counter (OTC) contracts
Contracts that are typically in the form of forwards, swaps and options. Some of these contracts are traded bilaterally between counterparties or through brokers, others may be cleared by a central clearing counterparty. These contracts can be used both for trading and risk management activities. Realized and unrealized gains and losses on OTC contracts are included in sales and other operating revenues for accounting purposes. Many grades of crude oil bought and sold use standard contracts including US domestic light sweet crude oil, commonly referred to as West Texas Intermediate, and a standard North Sea crude blend – Brent, Forties, Oseberg and Ekofisk (BFOE). Forward contracts are used in connection with the purchase of crude oil supplies for refineries and for marketing and sales of the group’s oil production and refined products. The contracts typically contain standard delivery and settlement terms. These transactions call for physical delivery of oil with consequent operational and price risk. However, various means exist and are used from time to time, to settle obligations under the contracts in cash rather than through physical delivery. Physically settled BFOE contracts delivered by cargo additionally specify a standard volume and tolerance.
Gas and power OTC markets are highly developed in North America and the UK, where commodities can be bought and sold for delivery in future periods. These contracts are negotiated between two parties to purchase and sell gas and power at a specified price, with delivery and settlement at a future date. Typically, the contracts specify delivery terms for the underlying commodity. Some of these transactions are not settled physically as they can be net settled by transacting offsetting sale or purchase contracts for the same location and delivery period. The contracts contain standard terms such as delivery point, pricing mechanism, settlement terms and specification of the commodity. Typically, volume, price and term (e.g. daily, monthly and balance of month) are the main variable contract terms.
Swaps are typically contractual obligations to exchange cash flows between two parties. A typical swap transaction usually references a floating price and a fixed price with the net difference of the cash flows being settled. Options give the holder the right, but not the obligation, to buy or sell crude, oil products, natural gas or power at a specified price on or before a specific future date. Amounts under these derivative financial instruments are settled at expiry. Typically, netting agreements are used to limit credit exposure and support liquidity.
Spot and term contracts
Spot contracts are contracts to purchase or sell a commodity at the market price prevailing on or around the delivery date when title to the inventory is taken. Term contracts are contracts to purchase or sell a commodity at regular intervals over an agreed term. Though spot and term contracts may have a standard form, there is no offsetting mechanism in place. As such, these transactions result in physical delivery with operational and price risk. Spot and term contracts typically relate to purchases of crude for a refinery, products for marketing, or third-party natural gas, or sales of the group’s oil production, oil products or gas production to third parties. For accounting purposes, spot and term sales are included in sales and other operating revenues when title passes. Similarly, spot and term purchases are included in purchases for accounting purposes.
Consolidation adjustment – UPII
Unrealized profit in inventory arising on inter-segment transactions.
Convenience gross margin
Non-IFRS measure. Convenience gross margin is calculated as RC profit before interest and tax for the customers & products segment, excluding RC profit before interest and tax for the refining & trading business (a non-IFRS measure), and adjusting items« (as defined above) for the convenience & mobility business to derive underlying RC profit before interest and tax for the convenience & mobility business; subtracting underlying RC profit before interest and tax for the Castrol business; adding back depreciation, depletion and amortization, production and manufacturing, distribution and administration expenses for convenience & mobility (excluding Castrol); subtracting earnings from equity-accounted entities in the convenience & mobility business (excluding Castrol) and gross margin for the retail fuels, EV charging, aviation, B2B and midstream businesses. bp believes it is helpful because this measure may help investors to understand and evaluate, in the same way as management, our progress against our strategic objectives of convenience growth. The nearest IFRS measure is RC profit before interest and tax for the customers & products segment. A reconciliation of RC profit before interest and tax for the customers & products segment to convenience gross margin is provided on page 351.
Convenience gross margin growth
Non-IFRS measure. See convenience gross margin definition above. Convenience gross margin growth at constant foreign exchange is a non-IFRS measure. This metric requires a calculation of the comparative convenience gross margin ($ million) at current period foreign exchange rates (constant foreign exchange) and compares the current period value with the restated comparative period value, which results in the growth % at constant foreign exchange rates. bp believes the convenience gross margin growth at constant foreign exchange are useful measures because these measures may help investors to understand and evaluate, in the same way as management, our progress against our strategic objectives of redefining convenience. The nearest IFRS measure to convenience gross margin is RC profit before interest and tax for the customer & products segment.
Convenience & EV gross margin growth (%)
Non-IFRS measure. See convenience gross margin and EV gross margin definitions. Convenience and EV gross margin growth at constant foreign exchange is a non-IFRS measure. This metric, as applicable to the directors’ remuneration performance measure, requires a calculation of the comparative convenience and EV gross margin ($ million) at current period foreign exchange rates (constant foreign exchange) and compares the current period value with the restated comparative period value, which results in the growth % at constant foreign exchange rates. The nearest IFRS measure to convenience gross margin and EV gross margin is RC profit before interest and tax for the customer & products segment.
Cumulative cash costs reductions
Non-IFRS measure. Cash costs is defined as production and manufacturing expenses plus distribution and administration expenses and excludes costs that are classified as adjusting items and costs that are variable, primarily with volumes (such as freight costs). It also includes exploration geological and geophysical costs, which are included in the exploration expenses line in the group income statement. Cumulative cash cost reductions by the end of 2022 compared to 2019 baseline, as applicable to the directors’ remuneration performance measure, are defined as reinvent headcount savings, restructuring, location, agile, operational and other savings, less agreed portfolio changes and costs in direct support of growth.
Customer touchpoints
Customer touchpoints are the number of retail customer transactions per day on bp forecourts globally. These include transactions involving fuel and/or convenience across all channels of trade.
Developed renewables to final investment decision (FID)
Total generating capacity for assets developed to FID by all entities where bp has an equity share (proportionate to equity share). If asset is subsequently sold bp will continue to record capacity as developed to FID. If bp equity share increases developed capacity to FID will increase proportionately to share increase for any assets where bp held equity at the point of FID.
376 | bp Annual Report and Form 20-F 2023 | |||||||||||||
Divestment proceeds
Disposal proceeds as per the group cash flow statement.
Dividend yield
Sum of the four quarterly dividends announced in respect of the year as a percentage of the year-end share price.
Dutch Title Transfer Facility
The TTF (Title Transfer Facility) is the virtual trading point for natural gas in the Netherlands. It is commonly used as a benchmark hub for gas prices in Europe.
Effective tax rate (ETR) on replacement cost (RC) profit or loss
Non-IFRS measure. The ETR on RC profit or loss is calculated by dividing taxation on a RC basis by RC profit or loss before tax. Taxation on a RC basis for the group is calculated as taxation as stated on the group income statement adjusted for taxation on inventory holding gains and losses. Information on RC profit or loss is provided below. bp believes it is helpful to disclose the ETR on RC profit or loss because this measure excludes the impact of price changes on the replacement of inventories and allows for more meaningful comparisons between reporting periods. Taxation on a RC basis and ETR on RC profit or loss are non-IFRS measures. The nearest equivalent measure on an IFRS basis is the ETR on profit or loss for the period. A reconciliation to IFRS information is provided on page 382.
Electric vehicle charge points / EV charge points
Defined as the number of connectors on a charging device, operated by either bp or a bp joint venture, as adjusted to be reflective of bp’s accounting share of joint arrangements.
EV gross margin
Non-IFRS measure. EV gross margin, as applicable to the directors’ remuneration performance measure, is calculated as RC profit before interest and tax for the customers & products segment, excluding RC profit before interest and tax for the refining & trading business (a non-IFRS measure), and adjusting items« (as defined above) for the convenience & mobility business to derive underlying RC profit before interest and tax for the convenience & mobility business; subtracting underlying RC profit before interest and tax for the Castrol business; adding back depreciation, depletion and amortization, production and manufacturing, distribution and administration expenses for convenience & mobility (excluding Castrol); subtracting earnings from equity-accounted entities in the convenience & mobility business (excluding Castrol) and gross margin for the convenience and retail fuels, aviation, B2B and midstream businesses. The nearest IFRS measure to EV gross margin is RC profit before interest and tax for the customer & products segment.
Fair value accounting effects
Non-IFRS adjustments to our IFRS profit (loss).They reflect the difference between the way bp manages the economic exposure and internally measures performance of certain activities and the way those activities are measured under IFRS. Fair value accounting effects are included within adjusting items. They relate to certain of the group's commodity, interest rate and currency risk exposures as detailed below. Other than as noted below, the fair value accounting effects described are reported in both the gas & low carbon energy and customer & products segments.
bp uses derivative instruments to manage the economic exposure relating to inventories above normal operating requirements of crude oil, natural gas and petroleum products. Under IFRS, these inventories are recorded at historical cost. The related derivative instruments, however, are required to be recorded at fair value with gains and losses recognized in the income statement. This is because hedge accounting is either not permitted or not followed, principally due to the impracticality of effectiveness-testing requirements. Therefore, measurement differences in relation to recognition of gains and losses occur. Gains and losses on these inventories, other than net realizable value provisions, are not recognized until the commodity is sold in a subsequent accounting period. Gains and losses on the related derivative commodity contracts are recognized in the income statement, from the time the derivative commodity contract is entered into, on a fair value basis using forward prices consistent with the contract maturity.
bp enters into physical commodity contracts to meet certain business requirements, such as the purchase of crude for a refinery or the sale of
bp’s gas production. Under IFRS these physical contracts are treated as derivatives and are required to be fair valued when they are managed as part of a larger portfolio of similar transactions. Gains and losses arising are recognized in the income statement from the time the derivative commodity contract is entered into.
IFRS require that inventory held for trading is recorded at its fair value using period-end spot prices, whereas any related derivative commodity instruments are required to be recorded at values based on forward prices consistent with the contract maturity. Depending on market conditions, these forward prices can be either higher or lower than spot prices, resulting in measurement differences.
bp enters into contracts for pipelines and other transportation, storage capacity, oil and gas processing, liquefied natural gas (LNG) and certain gas and power contracts that, under IFRS, are recorded on an accruals basis. These contracts are risk-managed using a variety of derivative instruments that are fair valued under IFRS. This results in measurement differences in relation to recognition of gains and losses.
The way that bp manages the economic exposures described above, and measures performance internally, differs from the way these activities are measured under IFRS. bp calculates this difference for consolidated entities by comparing the IFRS result with management’s internal measure of performance. We believe that disclosing management’s estimate of this difference provides useful information for investors because it enables investors to see the economic effect of these activities as a whole.
These include:
•Under management’s internal measure of performance the inventory, transportation and capacity contracts in question are valued based on fair value using relevant forward prices prevailing at the end of the period.
•Fair value accounting effects also include changes in the fair value of the near-term portions of LNG contracts that fall within bp’s risk management framework. LNG contracts are not considered derivatives, because there is insufficient market liquidity, and they are therefore accrual accounted under IFRS. However, oil and natural gas derivative financial instruments used to risk manage the near-term portions of the LNG contracts are fair valued under IFRS. The fair value accounting effect, which is reported in the gas and low carbon energy segment, represents the change in value of LNG contracts that are being risk managed and which is reflected in the underlying result, but not in reported earnings. Management believes that this gives a better representation of performance in each period.
Furthermore, the fair values of derivative instruments used to risk manage certain other oil, gas, power and other contracts, are deferred to match with the underlying exposure. The commodity contracts for business requirements are accounted for on an accruals basis.
In addition, fair value accounting effects include changes in the fair value of derivatives entered into by the group to manage currency exposure and interest rate risks relating to hybrid bonds to their respective first call periods. The hybrid bonds which were issued on 17 June 2020 are classified as equity instruments and were recorded in the balance sheet at that date at their USD equivalent issued value. Under IFRS these equity instruments are not remeasured from period to period, and do not qualify for application of hedge accounting. The derivative instruments relating to the hybrid bonds, however, are required to be recorded at fair value with mark to market gains and losses recognized in the income statement. Therefore, measurement differences in relation to the recognition of gains and losses occur. The fair value accounting effect, which is reported in the other businesses & corporate segment, eliminates the fair value gains and losses of these derivative financial instruments that are recognized in the income statement. We believe that this gives a better representation of performance, by more appropriately reflecting the economic effect of these risk management activities, in each period.
Fast / Fast charging
Fast charging comprises rapid charging« and ultra-fast charging«.
Finance debt ratio
Finance debt ratio is defined as the ratio of finance debt to the total of finance debt plus total equity.
« See glossary on page 373 | bp Annual Report and Form 20-F 2023 | 377 | ||||||||||||
Gearing and net debt
Non-IFRS measures. Net debt is calculated as finance debt, as shown in the balance sheet, plus the fair value of associated derivative financial instruments that are used to hedge foreign currency exchange and interest rate risks relating to finance debt, for which hedge accounting is applied, less cash and cash equivalents. Net debt does not include accrued interest, which is reported within other receivables and other payables on the balance sheet and for which the associated cash flows are presented as operating cash flows in the group cash flow statement. Gearing is defined as the ratio of net debt to the total of net debt plus total equity. bp believes these measures provide useful information to investors. Net debt enables investors to see the economic effect of finance debt, related hedges and cash and cash equivalents in total. Gearing enables investors to see how significant net debt is relative to total equity. The derivatives are reported on the balance sheet within the headings ‘Derivative financial instruments’. See Financial statements – Note 27 for information on finance debt, which is the nearest equivalent measure to net debt on an IFRS basis. The nearest equivalent IFRS measure to gearing on an IFRS basis is finance debt ratio.
We are unable to present reconciliations of forward-looking information for net debt or gearing to finance debt and total equity, because without unreasonable efforts, we are unable to forecast accurately certain adjusting items required to present a meaningful comparable IFRS forward-looking financial measure. These items include fair value asset (liability) of hedges related to finance debt and cash and cash equivalents, that are difficult to predict in advance in order to include in an IFRS estimate.
Gearing including leases and net debt including leases
Non-IFRS measures. Net debt including leases is calculated as net debt plus lease liabilities, less the net amount of partner receivables and payables relating to leases entered into on behalf of joint operations. Gearing including leases is defined as the ratio of net debt including leases to the total of net debt including leases plus total equity. bp believes these measures provide useful information to investors as they enable investors to understand the impact of the group’s lease portfolio on net debt and gearing. See Financial statements – Note 27 for information on finance debt, which is the nearest equivalent measure to net debt including leases on an IFRS basis. The nearest equivalent IFRS measure to gearing including leases on an IFRS basis is finance debt ratio. A reconciliation to IFRS information is provided on page 339.
Green hydrogen
Hydrogen produced by electrolysis of water using renewable power.
Grey hydrogen
Produced via natural gas or coal without CCUS.
Hydrocarbons
Liquids and natural gas. Natural gas is converted to oil equivalent at 5.8 billion cubic feet = 1 million barrels.
Hydrogen pipeline
Hydrogen projects which have not been developed to final investment decision (FID) but which have advanced to the concept development stage.
Inorganic capital expenditure
A subset of capital expenditure on a cash basis and a non-IFRS measure. Inorganic capital expenditure comprises consideration in business combinations and certain other significant investments made by the group. It is reported on a cash basis. bp believes that this measure provides useful information as it allows investors to understand how bp’s management invests funds in projects which expand the group’s activities through acquisition. The nearest equivalent measure on an IFRS basis is capital expenditure on a cash basis. Further information and a reconciliation to IFRS information is provided on page 336.
Installed renewables capacity
Installed renewables capacity is bp's share of capacity for operating assets owned by entities where bp has an equity share.
Inventory holding gains and losses
Inventory holding gains and losses are non-IFRS adjustments to our IFRS profit (loss) and represent:
•The difference between the cost of sales calculated using the replacement cost of inventory and the cost of sales calculated on the
first-in first-out (FIFO) method after adjusting for any changes in provisions where the net realizable value of the inventory is lower than its cost. Under the FIFO method, which we use for IFRS reporting of inventories other than for trading inventories, the cost of inventory charged to the income statement is based on its historical cost of purchase or manufacture, rather than its replacement cost. In volatile energy markets, this can have a significant distorting effect on reported income. The amounts disclosed as inventory holding gains and losses represent the difference between the charge to the income statement for inventory on a FIFO basis (after adjusting for any related movements in net realizable value provisions) and the charge that would have arisen based on the replacement cost of inventory. For this purpose, the replacement cost of inventory is calculated using data from each operation’s production and manufacturing system, either on a monthly basis, or separately for each transaction where the system allows this approach.
•An adjustment relating to certain trading inventories that are not price risk managed which relate to a minimum inventory volume that is required to be held to maintain underlying business activities. This adjustment represents the movement in fair value of the inventories due to prices, on a grade-by-grade basis, during the period. This is calculated from each operation’s inventory management system on a monthly basis using the discrete monthly movement in market prices for these inventories.
The amounts disclosed are not separately reflected in the financial statements as a gain or loss. No adjustment is made in respect of the cost of inventories held as part of a trading position and certain other temporary inventory positions that are price risk-managed. See Replacement cost (RC) profit or loss definition below.
Joint arrangement
An arrangement in which two or more parties have joint control.
Joint control
Contractually agreed sharing of control over an arrangement, which exists only when decisions about the relevant activities require the unanimous consent of the parties sharing control.
Joint operation
A joint arrangement whereby the parties that have joint control of the arrangement have rights to the assets, and obligations for the liabilities, relating to the arrangement.
Joint venture
A joint arrangement whereby the parties that have joint control of the arrangement have rights to the net assets of the arrangement.
Liquids
Comprises crude oil, condensate and natural gas liquids. For the oil production & operations segment, it also includes bitumen.
LNG portfolio
LNG portfolio refers to bp group’s LNG equity production plus additional long-term merchant LNG volumes.
LNG train
An LNG train is a processing facility used to liquefy and purify natural gas in the formation of LNG.
Low carbon activity
An activity relating to low carbon including: renewable electricity; bioenergy; electric vehicles and other future mobility solutions; trading and marketing low carbon products; blue or green hydrogen« and carbon capture, use and storage (CCUS).
Note that, while there is some overlap of activities, these terms do not mean the same as bp’s strategic focus area of low carbon energy or our low carbon energy sub-segment, reported within the gas & low carbon energy segment.
Low carbon activity investment
Capital investment in relation to low carbon activity«.
Major projects
Have a bp net investment of at least $250 million, or are considered to be of
378 | bp Annual Report and Form 20-F 2023 | |||||||||||||
strategic importance to bp or of a high degree of complexity.
Operating cash flow
Net cash provided by (used in) operating activities as stated in the group cash flow statement. When used in the context of a segment rather than the group, the terms refer to the segment’s share thereof.
Operating management system (OMS)
bp’s OMS helps us manage risks in our operating activities by setting out bp’s principles for good operating practice. It brings together bp requirements on health, safety, security, the environment, social responsibility and operational reliability, as well as related issues, such as maintenance, contractor relations and organizational learning, into a common management system.
Organic capital expenditure
Non-IFRS measure. Organic capital expenditure comprises capital expenditure on a cash basis less inorganic capital expenditure. bp believes that this measure provides useful information as it allows investors to understand how bp’s management invests funds in developing and maintaining the group’s assets. The nearest equivalent measure on an IFRS basis is capital expenditure on a cash basis. An analysis of organic capital expenditure by segment and region, and a reconciliation to IFRS information is provided on page 336.
We are unable to present reconciliations of forward-looking information for organic capital expenditure to total cash capital expenditure, because without unreasonable efforts, we are unable to forecast accurately the adjusting item, inorganic capital expenditure, that is difficult to predict in advance in order to derive the nearest IFRS estimate.
Production-sharing agreement / contract (PSA / PSC)
An arrangement through which an oil and gas company bears the risks and costs of exploration, development and production. In return, if exploration is successful, the oil company receives entitlement to variable physical volumes of hydrocarbons, representing recovery of the costs incurred and a stipulated share of the production remaining after such cost recovery.
Rapid / Rapid charging
Rapid charging includes electric vehicle charging of greater or equal to 50kW and less than 150kW.
Realizations
Realizations are the result of dividing revenue generated from hydrocarbon sales, excluding revenue generated from purchases made for resale and royalty volumes, by revenue generating hydrocarbon production volumes. Revenue generating hydrocarbon production reflects the bp share of production as adjusted for any production which does not generate revenue. Adjustments may include losses due to shrinkage, amounts consumed during processing, and contractual or regulatory host committed volumes such as royalties. For the gas & low carbon energy and oil production & operations segments, realizations include transfers between businesses.
Refining availability
Represents Solomon Associates’ operational availability for bp-operated refineries, which is defined as the percentage of the year that a unit is available for processing after subtracting the annualized time lost due to turnaround activity and all planned mechanical, process and regulatory downtime.
Refining marker margin (RMM)
The average of regional indicator margins weighted for bp’s crude refining capacity in each region. Each regional marker margin is based on product yields and a marker crude oil deemed appropriate for the region. The regional indicator margins may not be representative of the margins achieved by bp in any period because of bp’s particular refinery configurations and crude and product slate.
Replacement cost (RC) profit or loss / RC profit or loss attributable to bp shareholders
Reflects the replacement cost of inventories sold in the period and is calculated as profit or loss attributable to bp shareholders, adjusting for inventory holding gains and losses (net of tax). RC profit or loss for the group is not a recognized IFRS measure. bp believes this measure is useful to illustrate to investors the fact that crude oil and product prices can vary
significantly from period to period and that the impact on our reported result under IFRS can be significant. Inventory holding gains and losses vary from period to period due to changes in prices as well as changes in underlying inventory levels. In order for investors to understand the operating performance of the group excluding the impact of price changes on the replacement of inventories, and to make comparisons of operating performance between reporting periods, bp’s management believes it is helpful to disclose this measure. The nearest equivalent measure on an IFRS basis is profit or loss attributable to bp shareholders. See Financial statements – Note 5. A reconciliation to IFRS information is provided on page 382.
Reported recordable injury frequency
Reported recordable injury frequency measures the number of reported work-related employee and contractor incidents that result in a fatality or injury per 200,000 hours worked. This represents reported incidents occurring within bp’s operational HSSE reporting boundary. That boundary includes bp’s own operated facilities and certain other locations or situations.
Renewables pipeline
Renewable projects satisfying the criteria below until the point they can be considered developed to FID:
Site based projects that have obtained land exclusivity rights, or for power purchase agreement based projects an offer has been made to the counterparty, or for auction projects pre-qualification criteria has been met, or for acquisition projects post a binding offer has been accepted.
Reserves replacement ratio
The extent to which the year’s production has been replaced by proved reserves added to our reserve base. The ratio is expressed in oil-equivalent terms and includes changes resulting from discoveries, improved recovery and extensions and revisions to previous estimates, but excludes changes resulting from acquisitions and disposals.
Retail sites
Retail sites include sites operated by dealers, jobbers, franchisees or brand licensees or joint venture (JV) partners, under the bp brand. These may move to and from the bp brand as their fuel supply agreement or brand licence agreement expires and are renegotiated in the normal course of business. Retail sites are primarily branded bp, ARCO, Amoco, Aral, Thorntons, and TravelCenters of America and also includes sites in India through our Jio-bp JV.
Return on average capital employed
Non-IFRS measure. Return on average capital employed (ROACE) is defined as underlying replacement cost profit, which is defined as profit or loss attributable to bp shareholders adjusted for inventory holding gains and losses, adjusting items and related taxation on inventory holding gains and losses and adjusting items total taxation, after adding back non-controlling interest and interest expense net of tax, divided by the average of the beginning and ending balances of total equity plus finance debt, excluding cash and cash equivalents and goodwill as presented on the group balance sheet over the periods presented. Interest expense before tax is finance costs as presented on the group income statement, excluding lease interest, the unwinding of the discount on provisions and other payables and other adjusting items reported in finance costs. bp believes it is helpful to disclose the ROACE because this measure gives an indication of the company's capital efficiency. The nearest IFRS measures of the numerator and denominator are profit or loss for the period attributable to bp shareholders and total equity respectively. The reconciliation of the numerator and denominator is provided on page 383.
We are unable to present forward-looking information of the nearest IFRS measures of the numerator and denominator for ROACE, because without unreasonable efforts, we are unable to forecast accurately certain adjusting items required to calculate a meaningful comparable IFRS forward-looking financial measure. These items include inventory holding gains or losses and interest net of tax, that are difficult to predict in advance in order to include in an IFRS estimate.
Strategic convenience sites
Strategic convenience sites are retail sites, within the bp portfolio, which sell bp-supplied vehicle energy (e.g. bp, Aral, Arco, Amoco, Thorntons, bp pulse, TravelCenters of America and PETRO) and either carry one of the
« See glossary on page 373 | bp Annual Report and Form 20-F 2023 | 379 | ||||||||||||
strategic convenience brands (e.g. M&S, Rewe to Go) or a differentiated bp-controlled convenience offer. To be considered a strategic convenience site, the convenience offer should have a demonstrable level of differentiation in the market in which it operates. Strategic convenience site count includes sites under a pilot phase.
Subsidiary
An entity that is controlled by the bp group. Control of an investee exists when an investor is exposed, or has rights, to variable returns from its involvement with the investee and has the ability to affect those returns through its power over the investee.
Surplus cash flow
Surplus cash flow does not represent the residual cash flow available for discretionary expenditures. It is a non-IFRS financial measure that should be considered in addition to, not as a substitute for or superior to, net cash provided by operating activities, reported in accordance with IFRS. The surplus cash flow forms part of bp's financial frame.
Surplus cash flow refers to the net surplus of sources of cash over uses of cash, after reaching the $35 billion net debt target. Sources of cash include net cash provided by operating activities, cash provided from investing activities and cash receipts relating to transactions involving non-controlling interests. Uses of cash include lease liability payments, payments on perpetual hybrid bond, dividends paid, cash capital expenditure, the cash cost of share buybacks to offset the dilution from vesting of awards under employee share schemes, cash payments relating to transactions involving non-controlling interests and currency translation differences relating to cash and cash equivalents as presented on the condensed group cash flow statement.
For 2022, the sources of cash includes other proceeds related to the proceeds from the disposal of a loan note related to the Alaska divestment. The cash was received in the fourth quarter 2021, was reported as a financing cash flow and was not included in other proceeds at the time due to potential recourse from the counterparty. The proceeds are being recognized as the potential recourse reduces.
The components of our sources of cash and uses of cash are provided on page 339.
Technical service contract (TSC)
Technical service contract is an arrangement through which an oil and gas company bears the risks and costs of exploration, development and production. In return, the oil and gas company receives entitlement to variable physical volumes of hydrocarbons, representing recovery of the costs incurred and a profit margin which reflects incremental production added to the oilfield.
Tier 1 and tier 2 process safety events
Tier 1 events are losses of primary containment from a process of greatest consequence – causing harm to a member of the workforce, damage to equipment from a fire or explosion, a community impact or exceeding defined quantities. Tier 2 events are those of lesser consequence. These represent reported incidents occurring within bp’s operational HSSE reporting boundary. That boundary includes bp’s own operated facilities and certain other locations or situations.
Tight oil and gas
Natural oil and gas reservoirs locked in hard sandstone rocks with low permeability, making the underground formation extremely tight.
Transition growth
Activities, represented by a set of transition growth engines, that transition bp toward its objective to be an integrated energy company, and that comprise our low carbon activity« alongside other businesses that support transition, such as our power trading and marketing business and convenience.
Transition growth investment
Capital investment in relation to transition growth«, that is aligned to our aim 5 (to increase the proportion of investment we make into our non-oil and -gas businesses. For this purpose, we define 'oil and gas' activities as those primarily encompassing the production, refining and sale of fossil hydrocarbons and their products and those associated with the dedicated gas and oil trading businesses).
UK National Balancing Point
A virtual trading location for sale, purchase and exchange of UK natural gas. It is the pricing and delivery point for the Intercontinental Exchange natural gas futures contract.
Ultra fast / Ultra-fast charging
Electric vehicle charging of greater than or equal to 150kW.
Unconventionals
Resources found in geographic accumulations over a large area, that usually present additional challenges to development such as low permeability or high viscosity. Examples include shale gas and oil, coalbed methane, gas hydrates and natural bitumen deposits. These typically require specialized extraction technology such as hydraulic fracturing or steam injection.
Underlying effective tax rate (ETR)
Non-IFRS measure. The underlying ETR is calculated by dividing taxation on an underlying replacement cost (RC) basis by underlying RC profit or loss before tax. Taxation on an underlying RC basis for the group is calculated as taxation as stated on the group income statement adjusted for taxation on inventory holding gains and losses and adjusting items total taxation. Information on underlying RC profit or loss is provided below. Taxation on an underlying RC basis presented for the operating segments is calculated through an allocation of taxation on an underlying RC basis to each segment. bp believes it is helpful to disclose the underlying ETR because this measure may help investors to understand and evaluate, in the same manner as management, the underlying trends in bp’s operational performance on a comparable basis, period on period. Taxation on an underlying RC basis and underlying ETR are non-IFRS measures. The nearest equivalent measure on an IFRS basis is the ETR on profit or loss for the period.
We are unable to present reconciliations of forward-looking information for underlying ETR to ETR on profit or loss for the period, because without unreasonable efforts, we are unable to forecast accurately certain adjusting items required to present a meaningful comparable IFRS forward-looking financial measure. These items include the taxation on inventory holding gains and losses and adjusting items, that are difficult to predict in advance in order to include in an IFRS estimate. A reconciliation to IFRS information is provided on page 382.
Underlying production
Production after adjusting for acquisitions and divestments and entitlement impacts in our production-sharing agreements (PSAs). 2023 underlying production, when compared with 2022, is production after adjusting for acquisitions and divestments, curtailments, and entitlement impacts in our production-sharing agreements/contracts and technical service contract.
Underlying replacement cost (RC) profit or loss / underlying RC profit or loss attributable to bp shareholders
Non-IFRS measure. RC profit or loss« (as defined above) after excluding net adjusting items and related taxation. See page 337 for additional information on the adjusting items that are used to arrive at underlying RC profit or loss in order to enable a full understanding of the items and their financial impact. Underlying RC profit or loss before interest and tax for the operating segments or customers & products businesses is calculated as RC profit or loss (as defined above) including profit or loss attributable to non-controlling interests before interest and tax for the operating segments and excluding net adjusting items for the respective operating segment or business.
bp believes that underlying RC profit or loss is a useful measure for investors because it is a measure closely tracked by management to evaluate bp’s operating performance and to make financial, strategic and operating decisions and because it may help investors to understand and evaluate, in the same manner as management, the underlying trends in bp’s operational performance on a comparable basis, period on period, by adjusting for the effects of these adjusting items. The nearest equivalent measure on an IFRS basis for the group is profit or loss attributable to bp shareholders. The nearest equivalent measure on an IFRS basis for segments and businesses is RC profit or loss before interest and taxation. A reconciliation to IFRS information is provided on page 382 for the group and pages 39-47 for the segments.
380 | bp Annual Report and Form 20-F 2023 | |||||||||||||
Underlying RC profit or loss per share and underlying RC profit or loss per ADS
Non-IFRS measures. Earnings per share is defined in Note 11. Underlying RC profit or loss per ordinary share is calculated using the same denominator as earnings per share as defined in the consolidated financial statements. The numerator used is underlying RC profit or loss attributable to bp shareholders rather than profit or loss attributable to bp shareholders. Underlying RC profit or loss per ADS is calculated as outlined above for underlying RC profit or loss per share except the denominator is adjusted to reflect one ADS equivalent to six ordinary shares. bp believes it is helpful to disclose the underlying RC profit or loss per ordinary share and per ADS because these measures may help investors to understand and evaluate, in the same manner as management, the underlying trends in bp’s operational performance on a comparable basis, period on period. The nearest equivalent measure on an IFRS basis is basic earnings per share based on profit or loss for the period attributable to bp shareholders. A reconciliation to IFRS information is provided on page 382.
upstream
upstream includes oil and natural gas field development and production within the gas & low carbon energy and oil production & operations segments. References to upstream exclude Rosneft.
upstream / hydrocarbon plant reliability
bp-operated upstream plant reliability is calculated taking 100% less the ratio of total unplanned plant deferrals divided by installed production capacity, excluding non-operated assets and bpx energy. Unplanned plant deferrals are associated with the topside plant and where applicable the subsea equipment (excluding wells and reservoir). Unplanned plant deferrals include breakdowns, which does not include Gulf of Mexico weather-related downtime.
upstream unit production costs
upstream unit production costs are calculated as production costs divided by units of production. Production costs do not include ad valorem and severance taxes. Units of production are barrels for liquids and thousands of cubic feet for gas. Amounts disclosed are for bp subsidiaries only and do not include bp’s share of equity-accounted entities.
West Texas Intermediate (WTI)
A light sweet crude oil, priced at Cushing, Oklahoma, which serves as a benchmark price for purchases of oil in the US.
Working capital
Movements in inventories and other current and non-current assets and liabilities as stated in the group cash flow statement.
Trade marks
Trade marks of the bp group appear throughout this report. They include:
Aral, Aral pulse, BP, bp pulse, Castrol, Castrol ON, PETRO, Amoco, TA, Thorntons, Gigahub
Trade marks:
REWE to Go – a registered trade mark of REWE.
« See glossary on page 373 | bp Annual Report and Form 20-F 2023 | 381 | ||||||||||||
Non-IFRS measures reconciliations
Reconciliation of profit or loss for the period to underlying RC profit or loss«
| $ million | ||||||||||||||||||||
| 2023 | 2022 | 2021 | 2020 | 2019 | ||||||||||||||||
| Profit (loss) for the year attributable to bp shareholders | 15,239 | (2,487) | 7,565 | (20,305) | 4,026 | |||||||||||||||
Inventory holding (gains) losses«, before tax | 1,236 | (1,351) | (3,655) | 2,868 | (667) | |||||||||||||||
| Taxation charge (credit) on inventory holding gains and losses | (292) | 332 | 829 | (667) | 156 | |||||||||||||||
RC profit (loss)« for the year | 16,183 | (3,506) | 4,739 | (18,104) | 3,515 | |||||||||||||||
Net (favourable) adverse impact of adjusting items«, before tax | (1,143) | 29,781 | 8,697 | 16,649 | 8,263 | |||||||||||||||
| Adjusting items total taxation | (1,204) | 1,378 | (621) | (4,235) | (1,788) | |||||||||||||||
Underlying RC profit or loss for the year | 13,836 | 27,653 | 12,815 | (5,690) | 9,990 | |||||||||||||||
Reconciliation of basic earnings per ordinary share to underlying RC profit per ordinary share«
| Per ordinary share – cents | ||||||||||||||
| 2023 | 2022 | 2021 | ||||||||||||
| Profit (loss) for the year attributable to bp shareholders | 87.78 | (13.10) | 37.57 | |||||||||||
Inventory holding (gains) losses«, before tax | 7.12 | (7.12) | (18.16) | |||||||||||
| Taxation charge (credit) on inventory holding gains and losses | (1.69) | 1.75 | 4.12 | |||||||||||
| 93.21 | (18.47) | 23.53 | ||||||||||||
Net (favourable) adverse impact of adjusting items«, before tax | (6.58) | 156.84 | 43.21 | |||||||||||
| Taxation charge (credit) on adjusting items | (6.94) | 7.26 | (3.09) | |||||||||||
| Underlying RC profit for the year | 79.69 | 145.63 | 63.65 | |||||||||||
Reconciliation of basic earnings per ADS to underlying RC profit per ADS«
| Per ADS – dollars | ||||||||||||||
| 2023 | 2022 | 2021 | ||||||||||||
| Profit (loss) for the year attributable to bp shareholders | 5.27 | (0.79) | 2.25 | |||||||||||
Inventory holding (gains) losses«, before tax | 0.43 | (0.43) | (1.09) | |||||||||||
| Taxation charge (credit) on inventory holding gains and losses | (0.11) | 0.11 | 0.25 | |||||||||||
| 5.59 | (1.11) | 1.41 | ||||||||||||
Net (favourable) adverse impact of adjusting items«, before tax | (0.40) | 9.41 | 2.59 | |||||||||||
| Taxation charge (credit) on adjusting items | (0.41) | 0.44 | (0.19) | |||||||||||
| Underlying RC profit for the year | 4.78 | 8.74 | 3.82 | |||||||||||
Reconciliation of effective tax rate (ETR) to ETR on RC profit or loss and underlying ETR«
Taxation (charge) credit
| $ million | ||||||||||||||
| 2023 | 2022 | 2021 | ||||||||||||
| Taxation on profit or loss before taxation for the year | (7,869) | (16,762) | (6,740) | |||||||||||
| Adjusted for taxation on inventory holding gains and losses | 292 | (332) | (829) | |||||||||||
| Taxation on a RC profit or loss basis | (8,161) | (16,430) | (5,911) | |||||||||||
| Adjusted for adjusting items total taxation | 1,204 | (1,378) | 621 | |||||||||||
| Taxation on an underlying RC basis | (9,365) | (15,052) | (6,532) | |||||||||||
Effective tax rate
| % | ||||||||||||||
| 2023 | 2022 | 2021 | ||||||||||||
| ETR on profit or loss before taxation for the year | 33 | 109 | 44 | |||||||||||
| Adjusted for inventory holding gains and losses | — | 8 | 7 | |||||||||||
| ETR on RC profit or loss | 33 | 117 | 51 | |||||||||||
| Adjusted for adjusting items total taxation | 6 | (83) | (19) | |||||||||||
| Underlying ETR | 39 | 34 | 32 | |||||||||||
382 | bp Annual Report and Form 20-F 2023 | |||||||||||||
Return on average capital employed (ROACE)«
| $ million | ||||||||||||||||||||
| 2023 | 2022 | 2021 | 2020 | 2019 | ||||||||||||||||
| Profit (loss) for the year attributable to bp shareholders | 15,239 | (2,487) | 7,565 | (20,305) | 4,026 | |||||||||||||||
Inventory holding (gains) losses«, before tax | 1,236 | (1,351) | (3,655) | 2,868 | (667) | |||||||||||||||
| Taxation charge (credit) on inventory holding gains and losses | (292) | 332 | 829 | (667) | 156 | |||||||||||||||
Adjusting items«, before tax | (1,143) | 29,781 | 8,697 | 16,649 | 8,263 | |||||||||||||||
| Taxation charge (credit) on adjusting items | (1,204) | 1,378 | (621) | (4,235) | (1,788) | |||||||||||||||
| Underlying RC profit | 13,836 | 27,653 | 12,815 | (5,690) | 9,990 | |||||||||||||||
Interest expensea | 2,569 | 1,632 | 1,322 | 1,808 | 2,032 | |||||||||||||||
| Taxation on interest expense | (661) | (296) | (195) | (406) | (288) | |||||||||||||||
| Non-controlling interests (NCI) | 641 | 1,130 | 922 | (424) | 164 | |||||||||||||||
| 16,385 | 30,119 | 14,864 | (4,712) | 11,898 | ||||||||||||||||
| Total equity | 85,493 | 82,990 | 90,439 | 85,568 | 100,708 | |||||||||||||||
| Finance debt | 51,954 | 46,944 | 61,176 | 72,664 | 67,724 | |||||||||||||||
| Capital employed | 137,447 | 129,934 | 151,615 | 158,232 | 168,432 | |||||||||||||||
| Less: Goodwill | 12,472 | 11,960 | 12,373 | 12,480 | 11,868 | |||||||||||||||
| Cash and cash equivalents | 33,030 | 29,195 | 30,681 | 31,111 | 22,472 | |||||||||||||||
| 91,945 | 88,779 | 108,561 | 114,641 | 134,092 | ||||||||||||||||
| Average capital employed excluding goodwill and cash and cash equivalents | 90,362 | 98,670 | 111,601 | 124,367 | 133,050 | |||||||||||||||
| Profit (loss) for the year attributable to bp shareholders divided by total equity | 17.8% | (3.0)% | 8.4% | (23.7)% | 4.0% | |||||||||||||||
| ROACE | 18.1% | 30.5% | 13.3% | (3.8)% | 8.9% | |||||||||||||||
aFinance costs, as reported in the Group income statement, were $3,840 million (2022 $2,703 million, 2021 $2,857 million, 2020 $3,115 million, 2019 $3,489 million). Interest expense is finance costs excluding lease interest of $346 million (2022 $257 million, 2021 $306 million, 2020 $350 million), unwinding of discount on provisions and other payables of $912 million (2022 $808 million, 2021 $890 million, 2020 $957 million, 2019 $1,074 million) and other adjusting items related to finance costs of $13 million (2022 $6 million, 2021 $339 million).
Adjusted EBIDA«
| $ million | ||||||||||||||
| 2023 | 2022 | 2021 | ||||||||||||
| Profit (loss) for the period | 15,880 | (1,357) | 8,487 | |||||||||||
| Finance costs | 3,840 | 2,703 | 2,857 | |||||||||||
| Net finance (income) expense relating to pensions and other post-retirement benefits | (241) | (69) | (2) | |||||||||||
| Taxation | 7,869 | 16,762 | 6,740 | |||||||||||
| Profit before interest and tax | 27,348 | 18,039 | 18,082 | |||||||||||
| Inventory holding (gains) losses, before tax | 1,236 | (1,351) | (3,655) | |||||||||||
| 28,584 | 16,688 | 14,427 | ||||||||||||
| Net (favourable) adverse impact of adjusting items, before interest and tax | (1,548) | 29,356 | 7,915 | |||||||||||
| 27,036 | 46,044 | 22,342 | ||||||||||||
Taxation on an underlying RC basisa | (9,365) | (15,052) | (6,532) | |||||||||||
| 17,671 | 30,992 | 15,810 | ||||||||||||
| Add back: | ||||||||||||||
| Depreciation, depletion and amortization | 15,928 | 14,318 | 14,805 | |||||||||||
| Exploration expenditure written off | 746 | 385 | 168 | |||||||||||
| Adjusted EBIDA | 34,345 | 45,695 | 30,783 | |||||||||||
aA definition for taxation on an underlying RC basis is included under Underlying ETR in the glossary on page 380.
« See glossary on page 373 | bp Annual Report and Form 20-F 2023 | 383 | ||||||||||||
Adjusted EBITDA«
| $ million | ||||||||||||||
| 2023 | 2022 | 2021 | ||||||||||||
| Profit (loss) for the period | 15,880 | (1,357) | 8,487 | |||||||||||
| Finance costs | 3,840 | 2,703 | 2,857 | |||||||||||
| Net finance (income) expense relating to pensions and other post-retirement benefits | (241) | (69) | (2) | |||||||||||
| Taxation | 7,869 | 16,762 | 6,740 | |||||||||||
| Profit (loss) before interest and tax | 27,348 | 18,039 | 18,082 | |||||||||||
| Inventory holding (gains) losses, before tax | 1,236 | (1,351) | (3,655) | |||||||||||
| 28,584 | 16,688 | 14,427 | ||||||||||||
| Net (favourable) adverse impact of adjusting items, before interest and tax | (1,548) | 29,356 | 7,915 | |||||||||||
| Underlying RC profit (loss) before interest and tax | 27,036 | 46,044 | 22,342 | |||||||||||
| Add back: | ||||||||||||||
| Depreciation, depletion and amortization | 15,928 | 14,318 | 14,805 | |||||||||||
| Exploration expenditure written off | 746 | 385 | 168 | |||||||||||
| Adjusted EBITDA | 43,710 | 60,747 | 37,315 | |||||||||||
Reconciliation of RC profit before interest and tax for gas & low carbon energy and oil production & operations to adjusted EBITDA«
| $ million | ||||||||||||||
| 2023 | 2022 | 2021 | ||||||||||||
| gas & low carbon energy | ||||||||||||||
| RC profit before interest and tax | 14,080 | 14,696 | 2,133 | |||||||||||
Less: Net favourable (adverse) impact of adjusting items« | 5,358 | (1,367) | (5,395) | |||||||||||
Underlying RC profit before interest and tax« | 8,722 | 16,063 | 7,528 | |||||||||||
| Add back: Depreciation, depletion and amortization | 5,680 | 5,008 | 4,464 | |||||||||||
| Exploration expenditure written off | 362 | 2 | 43 | |||||||||||
| Adjusted EBITDA | 14,764 | 21,073 | 12,035 | |||||||||||
| oil production & operations | ||||||||||||||
| RC profit before interest and tax | 11,191 | 19,721 | 10,501 | |||||||||||
| Less: Net favourable (adverse) impact of adjusting items | (1,590) | (503) | 209 | |||||||||||
| Underlying RC profit before interest and tax | 12,781 | 20,224 | 10,292 | |||||||||||
| Add back: Depreciation, depletion and amortization | 5,692 | 5,564 | 6,528 | |||||||||||
| Exploration expenditure written off | 384 | 383 | 125 | |||||||||||
| Adjusted EBITDA | 18,857 | 26,171 | 16,945 | |||||||||||
The Directors’ report on pages 81-104, 105 (in respect of the remuneration committee), 133, 247-274 and 335-384 was approved by the board and signed on its behalf by Ben J. S. Mathews, company secretary on 8 March 2024.
BP p.l.c.
Registered in England and Wales No. 102498
384 | bp Annual Report and Form 20-F 2023 | |||||||||||||
Signatures
The registrant hereby certifies that it meets all of the requirements for filing on Form 20-F and that it has duly caused and authorized the undersigned to sign this annual report on its behalf.
BP p.l.c.
(Registrant)
/s/ Ben J. S. Mathews
Company secretary
8 March 2024
| bp Annual Report and Form 20-F 2023 | 385 | |||||||||||||
Cross reference to Form 20-F
| Item 1. | Identity of Directors, Senior Management and Advisers | n/a | ||||||||||||||||||
| Item 2. | Offer Statistics and Expected Timetable | n/a | ||||||||||||||||||
| Item 3. | Key Information | |||||||||||||||||||
| A. | [Reserved] | n/a | ||||||||||||||||||
| B. | Capitalization and indebtedness | n/a | ||||||||||||||||||
| C. | Reasons for the offer and use of proceeds | n/a | ||||||||||||||||||
| D. | Risk factors | 77-79 | ||||||||||||||||||
| Item 4. | Information on the Company | |||||||||||||||||||
| A. | History and development of the company | 34-38, 190-192, 198, 204, 206-210, 342-352, 367, 371 | ||||||||||||||||||
| B. | Business overview | 8-11, 35-38, 44-45, 193-197, 342-357, 362 | ||||||||||||||||||
| C. | Organizational structure | 246 | ||||||||||||||||||
| D. | Property, plants and equipment | 24, 44-45, 203-204, 272-274, 341-353, 358 | ||||||||||||||||||
| Item 4A. | Unresolved Staff Comments | None | ||||||||||||||||||
| Item 5. | Operating and Financial Review and Prospects | |||||||||||||||||||
| A. | Operating results | 8-13, 16-17, 28-38, 77-79, 208-210, 219, 221-235, 342-358 | ||||||||||||||||||
| B. | Liquidity and capital resources | 166, 204, 219-226, 340-341 | ||||||||||||||||||
| C. | Research and development, patent and licenses, etc. | 16, 197 | ||||||||||||||||||
| D. | Trend information | 8-13, 16-17, 28-38, 342-352 | ||||||||||||||||||
| E. | Critical Accounting Estimates | n/a | ||||||||||||||||||
| Item 6. | Directors, Senior Management and Employees | |||||||||||||||||||
| A. | Directors and senior management | 83-87 | ||||||||||||||||||
| B. | Compensation | 105-132, 213-218, 244-245 | ||||||||||||||||||
| C. | Board practices | 83-85, 98-102 | ||||||||||||||||||
| D. | Employees | 70-72, 245 | ||||||||||||||||||
| E. | Share ownership | 70-72, 105-132, 213-218, 244 | ||||||||||||||||||
| F. | Disclosure of a registrant’s action to recover erroneously awarded compensation | n/a | ||||||||||||||||||
| Item 7. | Major Shareholders and Related Party Transactions | |||||||||||||||||||
| A. | Major shareholders | 366-367 | ||||||||||||||||||
| B. | Related party transactions | 206-210, 358 | ||||||||||||||||||
| C. | Interests of experts and counsel | n/a | ||||||||||||||||||
| Item 8. | Financial Information | |||||||||||||||||||
| A. | Consolidated Statements and Other Financial Information | 164, 166-246, 275-277, 340, 364 | ||||||||||||||||||
| B. | Significant Changes | n/a | ||||||||||||||||||
| Item 9. | The Offer and Listing | |||||||||||||||||||
| A. | Offer and listing details | 364 | ||||||||||||||||||
| B. | Plan of distribution | n/a | ||||||||||||||||||
| C. | Markets | 364 | ||||||||||||||||||
| D. | Selling shareholders | n/a | ||||||||||||||||||
| E. | Dilution | n/a | ||||||||||||||||||
| F. | Expenses of the issue | n/a | ||||||||||||||||||
| Item 10. | Additional Information | |||||||||||||||||||
| A. | Share capital | n/a | ||||||||||||||||||
| B. | Memorandum and articles of association | 367-369 | ||||||||||||||||||
| C. | Material contracts | 358 | ||||||||||||||||||
| D. | Exchange controls | 364 | ||||||||||||||||||
| E. | Taxation | 364-366 | ||||||||||||||||||
| F. | Dividends and paying agents | n/a | ||||||||||||||||||
| G. | Statements by experts | n/a | ||||||||||||||||||
| H. | Documents on display | 371 | ||||||||||||||||||
| I. | Subsidiary information | n/a | ||||||||||||||||||
| J. | Annual Report to Security Holders | n/a | ||||||||||||||||||
| Item 11. | Quantitative and Qualitative Disclosures About Market Risk | 221-226 | ||||||||||||||||||
| Item 12. | Description of Securities Other than Equity Securities | |||||||||||||||||||
| A. | Debt Securities | n/a | ||||||||||||||||||
| B. | Warrants and Rights | n/a | ||||||||||||||||||
| C. | Other Securities | n/a | ||||||||||||||||||
| D. | American Depositary Shares | 371 | ||||||||||||||||||
| Item 13. | Defaults, Dividend Arrearages and Delinquencies | None | ||||||||||||||||||
| Item 14. | Material Modifications to the Rights of Security Holders and Use of Proceeds | None | ||||||||||||||||||
| Item 15. | Controls and Procedures | 163, 359-360 | ||||||||||||||||||
| Item 16. | [Reserved] | n/a | ||||||||||||||||||
| Item 16A. | Audit committee financial expert | 98-102 | ||||||||||||||||||
| Item 16B. | Code of Ethics | 359 | ||||||||||||||||||
| Item 16C. | Principal Accountant Fees and Services | 101-102, 245, 360 | ||||||||||||||||||
| Item 16D. | Exemptions from the Listing Standards for Audit Committees | n/a | ||||||||||||||||||
| Item 16E. | Purchases of Equity Securities by the Issuer and Affiliated Purchasers | 370 | ||||||||||||||||||
| Item 16F. | Change in Registrant’s Certifying Accountant | n/a | ||||||||||||||||||
| Item 16G. | Corporate Governance | 358-359 | ||||||||||||||||||
| Item 16H. | Mine Safety Disclosure | n/a | ||||||||||||||||||
| Item 16I. | Disclosure Regarding Foreign Jurisdictions that Prevent Inspections | n/a | ||||||||||||||||||
| Item 16J. | Insider Trading Policies. | n/a | ||||||||||||||||||
| Item 16K. | Cybersecurity | 360 | ||||||||||||||||||
| Item 17. | Financial Statements | n/a | ||||||||||||||||||
| Item 18. | Financial Statements | 164-168 | ||||||||||||||||||
| Item 19. | Exhibits | 387 | ||||||||||||||||||
386 | bp Annual Report and Form 20-F 2023 | |||||||||||||
Information about this report
This document constitutes the Annual Report and Accounts in accordance with UK requirements and the Annual Report on Form 20-F in accordance with the US Securities Exchange Act of 1934, for BP p.l.c. for the year ended 31 December 2023. A cross reference to Form 20-F requirements is included on page 386.
This document contains the Strategic report on the inside front cover and pages 1-80 and the Directors’ report on pages 81-104, 105 (in part only), 133, 247-274 and 335-384. The Strategic report and the Directors’ report together include the management report required by DTR 4.1 of the UK Financial Conduct Authority’s Disclosure Guidance and Transparency Rules. The Directors’ remuneration report is on pages 105-132. The consolidated financial statements of the group are on pages 137-246 and the corresponding reports of the auditor are on pages 157-163.
bp Annual Report and Form 20-F 2023 may be downloaded from bp.com/annualreport. No material on the bp website, other than the items identified as bp Annual Report and Form 20-F 2023, forms any part of this document. References in this document to other documents on the bp website, such as bp Energy Outlook, bp Net Zero Ambition Progress Update and bp Sustainability Report are included as an aid to their location and are not incorporated by reference into this document.
BP p.l.c. is the parent company of the bp group of companies. The company was incorporated in 1909 in England and Wales and changed its name to BP p.l.c. in 2001. Where we refer to the company, we mean BP p.l.c. The company and each of its subsidiaries« are separate legal entities. Unless otherwise stated or the context otherwise requires, the term “BP” or "bp" and terms such as “we”, “us” and “our” are used in this report for convenience to refer to one or more of the members of the bp group instead of identifying a particular entity or entities. Information in this document reflects 100% of the assets and operations of the company and its subsidiaries that were consolidated at the date or for the periods indicated, including non-controlling interests.
The company’s primary share listing is the London Stock Exchange. In the US, the company’s securities are traded on the New York Stock Exchange (NYSE) in the form of ADSs (see page 364 for more details) and in Germany in the form of a global depositary certificate representing bp ordinary shares traded on the Frankfurt, Hamburg and Düsseldorf Stock Exchanges.
The term ‘shareholder’ in this report means, unless the context otherwise requires, investors in the equity capital of BP p.l.c., both direct and indirect. As the company's shares, in the form of ADSs, are listed on the NYSE, an Annual Report on Form 20-F is filed with the SEC. Ordinary shares are ordinary fully paid shares in BP p.l.c. of 25 cents each. Preference shares are cumulative first preference shares and cumulative second preference shares in BP p.l.c. of £1 each.
Registered office and our worldwide headquarters: BP p.l.c. 1 St James’s Square London SW1Y 4PD UK Tel +44 (0)20 7496 4000 | Our agent in the US: BP America Inc. 501 Westlake Park Boulevard Houston, Texas 77079 US Tel +1 281 366 2000 | ||||
| Registered in England and Wales No. 102498. London Stock Exchange symbol ‘BP.’ | |||||
Exhibits
The following documents are filed in the Securities and Exchange Commission (SEC) EDGAR system, as part of this Annual Report on Form 20-F, and can be viewed on the SEC’s website.
| Memorandum and Articles of Association of BP p.l.c.***† | ||||||||
| Description of rights of each class of securities registered under Section 12 of the Securities Exchange Act of 1934† | ||||||||
| The BP Executive Directors’ Incentive Plan**† | ||||||||
Director’s Service Agreement for K Thomson† | ||||||||
Director’s Service Agreement for M Auchincloss† | ||||||||
| The BP Share Award Plan 2015***† | ||||||||
| Subsidiaries (included as Note 37 to the Financial Statements) | ||||||||
| Code of Ethics*† | ||||||||
| Rule 13a – 14(a) Certifications† | ||||||||
| Rule 13a – 14(b) Certifications#† | ||||||||
| Consent of Netherland, Sewell & Associates† | ||||||||
| Report of Netherland, Sewell & Associates† | ||||||||
| Consent Decree***† | ||||||||
| Gulf states Settlement Agreement***† | ||||||||
Consent of Deloitte LLP† | ||||||||
| Guaranteed Securities† | ||||||||
| Executive Compensation Clawback Policy | ||||||||
| Exhibit 101 | Inline XBRL data files | |||||||
| Exhibit 104 | Cover page interactive data file (formatted as Inline XBRL and contained in Exhibit 101) | |||||||
* | Incorporated by reference to the company’s Annual Report on Form 20-F for the year ended 31 December 2009. | |||||||
** | Incorporated by reference to the company’s Annual Report on Form 20-F for the year ended 31 December 2014. | |||||||
*** | Incorporated by reference to the company’s Annual Report on Form 20-F for the year ended 31 December 2015. | |||||||
**** | Incorporated by reference to the company’s Annual Report on Form 20-F for the year ended 31 December 2019. | |||||||
***** | Incorporated by reference to the company’s Annual Report on Form 20-F for the year ended 31 December 2020. | |||||||
# | Furnished only. | |||||||
† | Included only in the annual report filed in the Securities and Exchange Commission EDGAR system. | |||||||
The total amount of long-term securities of BP p.l.c. and its subsidiaries under any one instrument does not exceed 10% of their total assets on a consolidated basis.
The company agrees to furnish copies of any or all such instruments to the SEC on request.
« See glossary on page 373 | bp Annual Report and Form 20-F 2023 | 387 | ||||||||||||

388 bp Annual Report and Form 20-F 2023 Paper: Accent Recycled White, a Forest Stewardship Council ® (FSC®) certified paper from responsible sources made from 100% recycled fibre. The paper is carbon balanced at source. The manufacturing mill is ISO14001 registered and is FSC® chain-of-custody certified. Printed by Pureprint a CarbonNeutral® company with FSC® chain of custody and an ISO14001 certified environmental management system.

© BP p.l.c. 2024 bp’s corporate reporting suite includes information about our financial and operating performance, sustainability performance and global energy trends and projections. bp.com bp Annual Report and Form 20-F 2023 Details of our financial and operating performance in print and online. bp.com/annualreport bp Sustainability Report 2023 Details of our sustainability performance with additional information online. bp.com/sustainability bp Net Zero Ambition Progress Update 2023 Focuses on bp’s net zero ambition: why we believe it’s consistent with the Paris goals, our planned actions to deliver this decade and our progress to date. bp.com/netzeroreport bp Energy Outlook 2023 Provides our projections of future energy trends and factor that could affect them out to 2040. bp.com/energyoutlook Group databook 2019-2023 Five-year financial and operating data in PDF and Excel format. bp.com/financial-disclosure Copies You can order selected bp printed publications free of charge from bp.com/printedcopies US and Canada Issuer Direct Toll-free: +1 888 301 2505 bpreports@issuerdirect.com UK and rest of world bp Distribution Services Tel: +44 (0) 800 037 2172 bpdistributionservices@bp.com Feedback Your feedback is important to us. You can contact the corporate reporting team at corporatereporting@bp.com