


1
UNITED STATES
SECURITIES AND EXCHANGE COMMISSION
Washington, D.C. 20549
Form
ANNUAL REPORT PURSUANT TO SECTION 13 OR 15(d) OF THE SECURITIES EXCHANGE ACT OF 1934
For the Fiscal Year Ended
Or
Commission File Number:
Incorporated in the Commonwealth of
IRS Employer Identification No.
Principal Executive Offices
,
Telephone Number: (
)
Securities registered pursuant to Section 12(b) of the Act:
Title of each class
Trading Symbol(s)
Name of each exchange on which
registered
The
Nasdaq Global Select Stock Market
The
Nasdaq Global Select Stock Market
SECURITIES REGISTERED PURSUANT TO SECTION 12(g) OF THE ACT:
None
Indicate by check mark if the registrant is a well-known seasoned issuer, as defined in Rule 405 of the Securities Act.
Indicate by check mark if the registrant is not required to file reports pursuant to Section 13 or Section 15(d) of the Act. Yes
Indicate by check mark whether the registrant (1) has filed all reports required to be filed by Section 13 or 15(d) of the Securities
Exchange Act of 1934 during the preceding 12 months (or for such shorter period that the registrant was required to file such reports), and
(2) has been subject to such filing requirements for the past 90 days.
Indicate by check mark whether the registrant has submitted electronically every Interactive Data File required to be submitted pursuant to
Rule 405 of Regulation S-T (§232.405 of this chapter) during the preceding 12 months (or for such shorter period that the registrant was
required to submit such files).
Indicate by check mark whether the registrant is a large accelerated filer, an accelerated filer, a non-accelerated filer, a smaller reporting
company, or an emerging growth company. See the definitions of “large accelerated filer,” “accelerated filer”, “smaller reporting company”
and “emerging growth company” in Rule 12b-2 of the Exchange Act.
Large accelerated filer
Accelerated filer [ ]
Non-accelerated filer [ ]
Smaller reporting company
Emerging growth company
If an emerging growth company, indicate by check mark if the registrant has elected not to use the extended transition period for
complying with any new or revised financial accounting standards provided pursuant to Section 13(a) of the Exchange Act.
☐
Indicate by check mark whether the registrant has filed a report on and attestation to its management’s assessment of the effectiveness of
its internal control over financial reporting under Section 404(b) of the Sarbanes-Oxley Act (15 U.S.C. 7262(b)) by the registered public
accounting firm that prepared or issued its audit report. [
]
If securities are registered pursuant to Section 12(b) of the Act, indicate by check mark whether the financial statements of the registrant
included in the filing reflect the correction of an error to previously issued financial statements.
☐
Indicate by check mark whether any of those error corrections are restatements that required a recovery analysis of incentive-based
compensation received by any of the registrant’s executive officers during the relevant recovery period pursuant to §240.10D-1(b).
☐
Indicate by check mark whether the registrant is a shell company (as defined in Rule 12b-2 of the Act). Yes No
As of June 30, 2023, the aggregate market value of the Common Stock held by non-affiliates of Popular, Inc. was approximately $
billion based upon the reported closing price of $60.52 on the Nasdaq Global Select Market on that date.
As of February 27, 2024, there were
2
DOCUMENTS INCORPORATED BY REFERENCE
Portions of Popular, Inc.’s definitive proxy statement relating to the 2024 Annual Meeting of Stockholders of Popular, Inc. (the “Proxy
Statement”) are incorporated herein by reference in response to Items 10 through 14 of Part III. The Proxy Statement will be filed with
the Securities and Exchange Commission (the “SEC”) on or about March 27, 2024.
3
Forward-Looking Statements
This Form 10-K contains “forward-looking statements” within the meaning of the U.S. Private Securities Litigation Reform Act of
1995, including, without limitation, statements about Popular, Inc.’s (the “Corporation,” “Popular,” “we,” “us,” “our”) business,
financial condition, results of operations, plans, objectives and future performance. These statements are not guarantees of future
performance, are based on management’s current expectations and, by their nature, involve risks, uncertainties, estimates and
assumptions. Potential factors, some of which are beyond the Corporation’s control, could cause actual results to differ materially
from those expressed in, or implied by, such forward-looking statements. Risks and uncertainties include without limitation the effect
of competitive and economic factors, and our reaction to those factors, the adequacy of the allowance for loan losses, delinquency
trends, market risk and the impact of interest rate changes, capital markets conditions, capital adequacy and liquidity, and the effect
of legal and regulatory proceedings and new accounting standards on the Corporation’s financial condition and results of operations.
All statements contained herein that are not clearly historical in nature are forward-looking, and the words “anticipate,” “believe,”
“continues,” “expect,” “estimate,” “intend,” “project” and similar expressions and future or conditional verbs such as “will,” “would,”
“should,” “could,” “might,” “can,” “may” or similar expressions are generally intended to identify forward-looking statements.
Various factors, some of which are beyond Popular’s control, could cause actual results to differ materially from those expressed in,
or implied by, such forward-looking statements. Factors that might cause such a difference include, but are not limited to:
●
conditions in the geographic areas we serve and, in particular, in the Commonwealth of Puerto Rico (the
“Commonwealth” or “Puerto Rico”), where a significant portion of our business is concentrated;
●
consumer confidence and spending habits which may affect in turn, among other things, our level of non-performing
assets, charge-offs and provision expense;
●
originations, affect our ability to originate and distribute financial products in the primary and secondary markets and
impact the value of our investment portfolio and our ability to return capital to our shareholders;
●
banking industry in general on investor and depositor sentiment regarding the stability and liquidity of banks;
●
Puerto Rico Government and the Federally-appointed oversight board on the economy, our customers and our
business;
●
Economic Stability Act (“PROMESA”) and of other actions taken or to be taken to address Puerto Rico’s fiscal
challenges on the value of our portfolio of Puerto Rico government securities and loans to governmental entities and of
our commercial, mortgage and consumer loan portfolios where private borrowers could be directly affected by
governmental action;
●
difficult to predict and may be impacted by factors such as the amount of Federal funds received by the P.R.
Government and the rate of expenditure of such funds, as well as the financial condition, liquidity and cash
management practices of the Puerto Rico Government and its instrumentalities;
●
man-made disasters, acts of violence or war or pandemics, epidemics and other health-related crises, or the fear of any
such event occurring, any of which could cause adverse consequences for our business, including, but not limited to,
disruptions in our operations;
4
●
earnings, efficiencies and our targeted sustainable return on tangible common equity of 14% by the end of 2025;
●
to service certain of Banco Popular de Puerto Rico’s key channels, as well as the entry into amended and restated
commercial agreements (the “Evertec Business Acquisition Transaction”);
●
●
related requirements and the impact of other proposed capital standards on our capital ratios;
●
by the FDIC to recover the losses to the deposit insurance fund (“DIF”) resulting from the receiverships of Silicon Valley
Bank and Signature Bank;
●
as acquisitions and dispositions;
●
Puerto Rico and the other markets in which our borrowers are located;
●
●
●
●
●
core financial transaction processing and information technology services, or of third parties providing services to us,
including as a result of cyberattacks, e-fraud, denial-of-services and computer intrusion, that might result in, among
other things, loss or breach of customer data, disruption of services, reputational damage or additional costs to
Popular;
●
●
pending or future litigation and regulatory or government investigations or actions;
●
●
●
●
Moreover, the outcome of legal and regulatory proceedings, as discussed in “Part I, Item 3. Legal Proceedings,” is inherently
uncertain and depends on judicial interpretations of law and the findings of regulators, judges and/or juries. Investors should refer to
“Part I, Item 1A” of this Form 10-K for a discussion of certain risks and uncertainties to which the Corporation is subject.
5
All forward-looking statements included in this Form 10-K are based upon information available to Popular as of the date of this
Form 10- K, and other than as required by law, including the requirements of applicable securities laws, we assume no obligation to
update or revise any such forward-looking statements to reflect occurrences or unanticipated events or circumstances after the date
of such statements.
6
TABLE OF CONTENTS
PART I
Page
Item 1
Business
7
Item 1A
Risk Factors
24
Item 1B
Unresolved Staff Comments
38
Item 1C
Cybersecurity
38
Item 2
Properties
41
Item 3
Legal Proceedings
41
Item 4
Mine Safety Disclosures
41
PART II
Item 5
Market for Registrant’s Common Equity, Related Stockholder Matters and
Issuer Purchases of Equity Securities
41
Item 6
[Reserved]
44
Item 7
Management’s Discussion and Analysis of Financial Condition and Results of
Operations
44
Item 7A
Quantitative and Qualitative Disclosures About Market Risk
44
Item 8
Financial Statements and Supplementary Data
44
Item 9
Changes in and Disagreements with Accountants on Accounting and Financial
Disclosure
44
Item 9A
Controls and Procedures
45
Item 9B
Other Information
45
Item 9C
Disclosure Regarding Foreign Jurisdictions that Prevent Inspections
45
PART III
Item 10
Directors, Executive Officers and Corporate Governance
45
Item 11
Executive Compensation
46
Item 12
Security Ownership of Certain Beneficial Owners and Management and
Related Stockholder Matters
46
Item 13
Certain Relationships and Related Transactions, and Director Independence
46
Item 14
Principal Accountant Fees and Services
46
PART IV
Item 15
Exhibits and Financial Statement Schedules
46
Item 16
Form 10-K Summary
47
7
PART I POPULAR, INC.
ITEM 1. BUSINESS
General
Popular is a diversified, publicly-owned financial holding company, registered under the Bank Holding Company Act of 1956, as
amended (the “BHC Act”), and subject to supervision and regulation by the Board of Governors of the Federal Reserve System (the
“Federal Reserve Board”). Popular was incorporated in 1984 under the laws of the Commonwealth of Puerto Rico and is the largest
financial institution based in Puerto Rico, with consolidated assets of $70.8 billion, total deposits of $63.6 billion and stockholders’
equity of $5.1 billion at December 31, 2023. At December 31, 2023, we ranked among the 50 largest U.S. bank holding companies
based on total assets according to information gathered and disclosed by the Federal Reserve Board.
We operate in two principal markets:
●
Popular de Puerto Rico (“Banco Popular” or “BPPR”), as well as auto and equipment leasing and financing, investment
banking, broker-dealer and insurance services through specialized subsidiaries. BPPR’s deposits are insured under the
Deposit Insurance Fund (“DIF”) of the Federal Deposit Insurance Corporation (“FDIC”). The banking operations of BPPR are
primarily based in Puerto Rico, where BPPR has the largest retail banking franchise.
●
banking subsidiary, Popular Bank (“PB” or “Popular U.S.”), which has branches in New York, New Jersey and Florida; as well
as investment and insurance services, and commercial direct financing leases through specialized subsidiaries. PB’s deposits
are insured under the DIF of the FDIC.
●
BPPR’s commercial banking operations in New York that include direct loan origination and participating loans originated by
PB, BPPR offers or holds financial products on a National scale in the U.S. market, including personal loans previously
originated under the E-Loan brand, purchased personal loans originated by third parties, and gathering insured institutional
deposits via online deposit gathering platforms. In the U.S. and British Virgin Islands, BPPR offers a range of banking products,
including loans and deposits to both retail and commercial customers.
For further information about the Corporation’s results segregated by its reportable segments, see “Reportable Segment Results” in
the Management’s Discussion and Analysis of Financial Condition and Results of Operations section (“MD&A”) and Note 37 to the
Consolidated Financial Statements included in this Form 10-K.
Transformation Initiative:
The Corporation launched a significant, multi-year, broad-based technological and business process transformation during the
second half of 2022. The needs and expectations of our clients, as well as the competitive landscape, have evolved, compelling us
to make important investments in our technological infrastructure and adopt more agile practices. We believe these investments will
result in an enhanced digital experience for our clients, as well as better technology and more efficient processes for our employees,
and make us a more efficient and profitable company, allowing us to achieve a 14% return on tangible common equity target by the
end of 2025. Our technology and business transformation will be a significant priority for the Corporation over the next three years
and beyond. Refer to the Overview section of Management’s Discussion and Analysis included in this Form 10-K for information on
recent significant events that have impacted or will impact our current and future operations.
Lending Activities
8
We concentrate our lending activities in the following areas:
(1) Commercial. Commercial loans are comprised of (i) commercial and industrial (“C&I”) loans and leases to commercial customers
for use in normal business operations and to finance working capital needs, equipment purchases or other projects, and (ii)
commercial real estate (“CRE”) loans (excluding construction loans) for income-producing real estate properties as well as owner-
occupied properties. C&I loans are underwritten individually and usually secured with the assets of the company and the personal
guarantee of the business owners. CRE loans consist of loans for income-producing real estate properties and the financing of
owner-occupied facilities if there is real estate as collateral. Non-owner-occupied CRE loans are generally made to finance office
and industrial buildings, healthcare facilities, multifamily buildings and retail shopping centers and are repaid through cash flows
related to the operation, sale or refinancing of the property.
(2) Mortgage. Mortgage loans include residential mortgage loans to consumers for the purchase or refinancing of a residence and
also include residential construction loans made to individuals for the construction of refurbishment of their residence.
(3) Consumer. Consumer loans are mainly comprised of unsecured personal loans, credit cards, and automobile loans, and to a
lesser extent home equity lines of credit (“HELOCs”) and other loans made by banks to individual borrowers.
(4) Construction. Construction loans are CRE loans to companies, community or homeowners’ associations, or developers used for
the construction of a commercial or residential property for which repayment will be generated by the sale or permanent financing of
the property. Our construction loan portfolio primarily consists of retail, residential (land and condominiums), office and warehouse
product types.
(5) Lease Financings. Lease financings are offered by BPPR and are primarily comprised of automobile loans/leases made through
automotive dealerships.
Business Concentration
Since our business activities are currently concentrated primarily in Puerto Rico, our results of operations and financial
condition are dependent upon the general trends of the Puerto Rico economy and, in particular, the residential and commercial real
estate markets. The concentration of our operations in Puerto Rico exposes us to greater risk than other banking companies with a
wider geographic base. Our asset and revenue composition by geographical area is presented in “Financial Information about
Geographic Areas” below and in Note 37 to the Consolidated Financial Statements included in this Form 10-K.
Our loan portfolio is diversified by loan category. However, approximately 55% of our loan portfolio at December 31, 2023 consisted
of real estate-related loans, including residential mortgage loans, construction loans and commercial loans secured by commercial
real estate. The table below presents the distribution of our loan portfolio by loan category at December 31, 2023.
Loan category
(Dollars in millions)
BPPR
%
PB
%
POPULAR
%
C&I
$4,796
20
$2,330
22
$7,126
20
CRE
4,695
19
5,888
56
10,583
30
Construction
170
1
789
7
959
3
Leasing
1,732
7
-
-
1,732
5
Consumer
6,726
27
243
2
6,969
20
Mortgage
6,392
26
1,304
13
7,696
22
Total
$24,511
100
$10,554
100
$35,065
100
Except for the Corporation’s exposure to the Puerto Rico Government sector, no individual or single group of related accounts is
considered material in relation to our total assets or deposits, or in relation to our overall business. For a discussion of our loan
portfolio, our deposits portfolio and our exposure to the Government of Puerto Rico, see “Financial Condition – Loans”, “Financial
Condition – Deposits” and “Credit Risk – Geographical and Government Risk” in the MD&A and to Note 24 - Commitment and
Contingencies to the Consolidated Financial Statements included in this Form 10-K.
9
Credit Administration and Credit Policies
Interest from our loan portfolios is our principal source of revenue. Whenever we make loans, we expose ourselves to
credit risk. Credit risk is controlled and monitored through active asset quality management, including the use of lending
standards, thorough review of potential borrowers and through active asset quality administration.
Business activities that expose us to credit risk are managed within the Board of Director’s Risk Management policy,
and the Credit Risk Tolerance Limits policy, which establishes limits that consider factors such as maintainin g a prudent balance
of risk-taking across diversified risk types and business units, compliance with regulator y guidance, and controlling the exposure
to lower credit quality assets.
We maintain comprehensive credit policies for all lines of business in order to mitigate credit risk. Our credit policies are
approved by our Board of Directors. These policies set forth, among other things,
the objectives, scope and responsibilities of the
credit management cycle. Our internal written procedures establish
underwriting standards and procedures for monitoring and
evaluating loan portfolio quality and require prompt identificatio n and quantificatio n of asset quality deterioration or potential
loss to ensure the adequacy of the allowance for credit losses. These written procedures establish various approval and
lending limit levels, ranging from bank branch or department officers to managerial and senior management levels. Approval
levels are
primarily determined by the amount, type of loan and risk characteristics of the credit facility.
Our credit policies and procedures establish documentation requirements for each loan and related collateral type,
when applicable, during the underwriting, closing and monitoring phases. For commercial and construction loans, during the
initial loan underwriting process, the credit policies require, at a minimum, historical financial statements or tax returns of the
borrower, an analysis of financial information contained in a credit approval package, a risk rating determination and reports
from credit agencies and appraisal s for real estate-related loans when applicable . The credit policies also set forth the required
closing documentation depending on the loan and the collateral type.
Although we originat e most of our loans internally in both the Puerto Rico and mainlan d United States markets, we
occasionally purchase or participate in loans originated by other financial institutions. When we purchase or participate in
loans originated by others, we conduct the same underwriting analysis of the borrower s and apply the same criteria as we do
for loans originated by us. This also includes a review of the applicable legal documentation.
Refer to the Credit Risk section of the MD&A included in this Form 10-K for information related to management
committees and divisions with responsibilities for establishing policies and monitoring the Corporation’s credit risk.
Loan extensions , renewals and restructurings
Loans with satisfactory credit profiles can be extended, renewed or restructured . Some commercia l loan facilities are
structured as lines of credit, which are mainly one year in term and therefore are required to be renewed annually. Other facilities
may be restructure d or extended from time to time based upon changes in the borrower’s business needs, use of funds, timing
of completion of projects and other factors. If the borrower is not deemed to have financial difficulties , extensions, renewals
and restructurings are done in the normal course of busines s and the loans continue to be recorde d as performing.
We evaluate various factors to determine if a borrower is experiencing financial difficulties. Indicators that the
borrower is experiencing financial difficultie s include, for example: (i) the borrower is currently in default on any of its debt or it is
probable tha t the borrower would be in payment default on any of its debt in th e foreseeable future without the modification ; (ii)
the borrower has declare d or is in the process of declarin g bankruptcy; (iii) there is significan t doubt as to whether the borrower
will continue to be a going concern; (iv) the borrower has securities that have been delisted, are in the process of being
delisted, or are under threa t of bein g delisted from an exchange ; (v) based on estimates and projection s that only encompass
the current business capabilities , the borrower forecasts that its entity-specifi c cash flows will be insufficien t to service the
debt (both interest and principal) in accordance with the contractual terms of the existing agreement through maturity; and
(vi) absent the current modification, the borrower cannot obtain funds from sources other than the existing creditors at an
effective interest rate equal to the current market interest rate for similar debt for a non-troubled debtor.
10
We have specialized workout officers who handle the majority of commercial loans that are past due 90 days and
over, borrowers experiencing financial difficulties , and loans that are considere d problem loans based on their risk profile . As a
general policy, we do not advance additional money to borrowers who have loans that are 90 days past due or over. In
commercial and construction loans, certain exceptions may be approve d under certain circumstances, including (i) when past
due status is administrativ e in nature, such as expiration of a loan facility before the new documentatio n is executed, and not as
a result of paymen t or credit issues; (ii) to improve our collateral position or otherwise maximize recovery or mitigate potential
future losses; and (iii) with respect to certain entities that, although related through common ownership, are not cross
defaulted nor cross-collateralized and are performing satisfactorily under their respective loan facilities. Such advances are
underwritten and approved following our credit policy guidelines and limits, which are dependent on the borrower’s financial
condition, collateral and guarantee, among others.
In addition to the legal lending limit established under applicable state banking law, discusse d in detail below, business
activities that expose the Corporation to credit risk are managed within guidelines described in the Credit Risk Tolerance Limits
policy. Limits are defined for loss and credit performance metrics, portfolio composition and concentration, and industry and name-
level,
which
monitors lending concentration to a single borrower or a group of related borrowers, including specific lending
limits based on industr y or other criteria, such as a percentage of the banks’ capital.
Refer to Note 2 and Note 9 to the Consolidated Financial Statements included in this Form 10-K, for additional information
on loan modifications to borrowers with financial difficulties.
Competition
The financial services industry in which we operate is highly competitive. In Puerto Rico, our primary market, the
banking business is highly competitive with respect to originatin g loans, acquiring deposits and providing other banking
services. Most of our direct competitio n for our products and services comes from commercial banks and credit unions.
The principal competitors for BPPR include locally based commercial banks and a few large U.S. and foreign banks with
operations in Puerto Rico. While the number of banking competitors in Puerto Rico has been reduced in recent years as a
result of consolidations, these transactions have allowed some of our competitors to gain greater resources, such as a
broader range of products and services.
We also compete with specialized players in th e local financial industry that are not subjec t to the same regulatory
restrictions as domestic banks and bank holdin g companies. Those competitors include brokerage firms, mortgage companies,
insurance companies, automobile and equipment finance companies, local and federal credit unions (locally known as
“cooperativas”), credit car d companies, consumer finance companies, institutional lenders and other financial and non-financia l
institutions and entities. Credit unions generally provide basic consumer financial services. These competitors collectively
represent a significant portion of the market and have a lower cost structure and fewer regulatory constraints.
In the United States we continue to face substantial competitive pressure as our footprint resides in the two large,
metropolitan markets of New York City / Northern New Jersey and the greater Miami area. There is a large number of community
and regional banks along with national banking institutions present in both markets, many of which have a larger amount of
resources than us.
In both Puerto Rico and the United States, the primary factors in competing for business include pricing, convenience
of branch locations and other delivery methods, range of products offered, and the level of service delivered. We must compete
effectively along all these parameters to be successful. We experience pricing pressure as some of our competitors seek to
increase market share by reducing prices for services or the rates charged on loans, increasing the interest rates offered on
deposits or offering more flexible terms. Increased competition could require that we increase the rates offered on deposits and
lower the rates charged on loans, which could adversely affect our profitability.
Economic factors, along with legislative and technological changes, have an ongoing impact on the competitive
environment within the financia l services industry. We work to anticipat e and adap t to dynamic competitive conditions whether
through developing and marketing innovative products and services, adopting or developin g new technologie s that differentiat e
our products and services, cross-marketing, or providing personalized banking services. We strive to distinguish ourselves
from other banks and financial services providers in our marketplace by providin g a high level of service to enhance customer
11
loyalty and to attrac t and retain business. However, we can provide no assurance as to the effectiveness of these efforts on
our future business or results of operations, and as to our continued ability to anticipate and adapt to changing
conditions, and to sufficientl y improve our services and/or banking products, in order to successfully compete in our primary
service areas.
Human Capital Management
Popular seeks to embody our purpose of “putting people at the center of progress” throughout its human capital management.
Attracting, developing and retaining top talent in an environment that promotes wellness, diversity, inclusion, learning and
transparency are fundamental pillars of our long-term strategy. As of December 31, 2023, Popular has approximately 9,237
employees, none of whom are represented by a collective bargaining group.
Nurturing Well-Being: Employee Health & Financial Security
Popular believes that the health and financial wellness of Popular’s employees is essential to enable Popular to effectively serve
its customers and contribute positively to the communities where it operates. Our health and wellness program includes health,
pharmacy, vision and dental insurance, as well as other wellness initiatives. Our programs seek to ensure that healthcare being
both accessible and affordable for our employees, with Popular covering up to 90% of health insurance premiums, a figure that
surpasses regional benchmarks. In 2023, we launched a leadership guide on mental health to support leaders in promoting
emotional wellness within their teams and engaging with team members who may be facing mental health challenges.
Additionally, the Corporation promotes employee health and wellbeing by encouraging annual physical exams and maintaining a
health and wellness center at its Puerto Rico-based corporate offices staffed with healthcare providers, where employees can
complete their physical exam, receive acute care or visit a nutritionist or psychologist free of charge. Our health and wellness
center received over 15,680 visits from employees during 2023.
Popular also seeks to foster work-life balance by providing paid time off benefits to our employees, including community service
leave, paid parental leave and flexible work arrangements. Our hybrid work model, accessible to approximately half of our
workforce, underscores our commitment to flexible work environments. Moreover, we continuously offer activities and workshops
centered on physical fitness and personal financial management.
Popular further provides a 401(k) savings and investment plan, in which 98% of employees participate. Popular matches $0.50
for every dollar the employee contributes to the 401(k) plan, up to 8% of their salary. Moreover, Popular offers a profit -sharing
plan, contingent upon the achievement of pre-set financial goals, to further align employee compensation with its collective
success. The profit-sharing plan allows employees to receive up to 8% of their eligible compensation (capped at $70,000), of
which the first 4% is paid in cash and anything beyond such percent is paid to the employee’s Savings and Investment Plan
account. Popular regularly evaluates employees’ base compensation to better compete with the salaries paid in similar positions
in other companies. Our ongoing enhancements to our employees’ compensation includes market-aligned salary adjustments,
merit increases and raising our hourly pay rates to $15 per hour in Puerto Rico and $16 per hour in the Virgin Islands as of 2023,
and $17 per hour in Florida and $20 per hour in New York and New Jersey as of 2022. In 2023, we invested more than $22.5M
in enhancing our employees’ compensation.
Empowering Growth: Our Commitment to Talent Development
We are committed to fostering the continuous development and upskilling of our employees and believe it is fundamental to
maintaining our competitive edge. Towards that end, Popular provides development opportunities aimed at strengthening our
employees’ knowledge, abilities and skills to support their personal growth which, in turn, seeks to enhance Popular’s business
strategies and organizational competencies. Our 40,000 square foot Development Center in San Juan, Puerto Rico and our
satellite facilities in New York, South Florida, and the Virgin Islands offer year-round training sessions, activities and workshops.
In 2023, we transitioned back to in-person sessions, but also continued offering virtual training programs. Our seven corporate
academies had more than 8,000 registrations from our employees during 2023, approximately 1,600 more than in 2022. Our
commitment to continuous learning is further supported by offering our employees access to LinkedIn Learning, which provides
an extensive library of over 16,000 e-learning courses. In 2023, users totaled 61% of our employees, an increase of 24% from
2022, for a total of 17,006 hours logged during the year.
12
Our focus on training and development has provided internal growth opportunities to our workforce. As a result, the
Corporation’s internal mobility rate in 2023 was 36%. This included employees who applied or were selected for vacancies, were
promoted, or had lateral movements. Additionally, we invested in the education of over 100 practitioners through Accelerated
Development Programs focused on data science, analytics, process excellence, and program management. The Corporation
also offered its employees advanced training in software engineering, including, but not limited to, coding and software
development.
Leadership development remains a priority at Popular, as we believe it is vital for driving results, maintaining employee
engagement and achieving our strategic objectives. With this in mind, we launched a new leadership program in 2023 focused
on exploring the role Popular’s leaders play in creating the right environment for our culture to thrive. Our organizational
development strategy aims to enhance both organizational and leadership effectiveness by preparing us to meet future
challenges. In 2023, we facilitated organizational development interventions that focused on change management, team
alignment, and leader effectiveness.
Enhancing Leadership Continuity through Strategic Succession Planning
Popular’s business strategy further takes into account succession planning to ensure effective leadership transitions. Succession
plans for senior management are developed by the CEO and presented to the Board of Directors. Popular’s succession planning
also leverages our Executive Talent Management Program (the “Program”) that seeks to identify high-potential and high-
performing managers, which are provided with learning opportunities to enhance their skills and prepare them for senior
management positions.
Diversity, Equity and Inclusion
Popular is committed to fostering a diverse, equitable and inclusive workplace. As of December 31, 2023, 64.5% of the
Corporation’s employees were female, and 35.5% were male. Women accounted for 63% of first and mid-level management and
36.6% of executive-level management as of such date. We have recently enriched our talent pool with the inclusion of
professionals from Latin America, thereby enhancing multicultural diversity within our organization. Central to our diversity efforts
is our multidisciplinary Diversity, Equity and Inclusion (“DEI”) Council, which is overseen by our Corporate Diversity Officer. Our
DEI Policy is committed to attracting, retaining and developing a diverse employment population; fostering a work environment
where employees are treated equitably and with respect; and seeking, creating, and maintaining business relationships with
diverse suppliers.
We are committed to fair pay and conduct related pay analyses on an annual basis. The results for 2023 revealed a 1.8
percentage point improvement in Puerto Rico and the Virgin Islands and a 6.4 percentage point improvement in the United
States in our gender-related pay differences compared to the end of 2022. Our commitment to gender equality has been
recognized in the Bloomberg Gender Equality Index for two consecutive years (2021-2022 and 2022-2023).
Our Employee Resource Groups (“ERGs”) are key resources that support our DEI strategy. In 2023, our existing ERGs
witnessed substantial growth in membership. Popular Pride, our ERG focused on the LGBTQ+ community, seeks to enhance
organizational awareness and engagement of LGBTQ issues. Network of Women in Popular, focused on empowering women,
and Popular Embrace, focused on functional diversity, also achieved notable milestones, including partnering with our human
resources division to educate and promote specific wellness initiatives and efforts. Additionally, during 2023 we established a
Black/African American ERG in the US.
Popular also supports victims of gender-based violence and provides a special leave of 15 days eligible to employees located in
Puerto Rico in order to handle situations related to gender violence, domestic violence or stalking.
Employee Experience
Popular aims to provide an exceptional employee experience that inspires its employees to deliver outstanding service to
customers and communities. We recognize the dynamic nature of employee needs and expectations and have implemented a
more robust approach to measure and understand the employee’s journey. In 2023, we revised our comprehensive Employee
Engagement & Experience Survey program to (i) increase our assessments from biennial to quarterly and annually and (ii)
include additional surveys that measure the end-to-end employee journey from recruiting and onboarding to offboarding. We
13
believe that the insights received from these surveys have allowed us to introduce people initiatives that have helped us reduce
our turnover rate to 7.9% as of the end of 2023, a 2.9 percentage point improvement from 2022. Our voluntary turnover rate also
saw a notable decrease to 6.4%, down 2.4 percentage points from the previous year. Furthermore, the survey has enabled us to
monitor our employee loyalty score and identify initiatives to maintain or enhance our current score of 84%, which positions us
within the 75th percentile of the Qualtrics global benchmark and above the average benchmark of the financial industry.
Board Oversight in Human Capital
The Talent and Compensation Committee of the Corporation’s Board of Directors has oversight responsibility for the
Corporation’s human capital management. As part of its responsibilities, the Talent and Compensation Committee reviews and
advises management on the Corporation’s general compensation philosophy, programs and policies, and on the Corporation’s
talent acquisition and development, workforce engagement, succession planning, culture, diversity, equity (including pay equity)
and inclusion, among other human capital topics.
We encourage you to review our Corporate Sustainability Report published on www.popular.com for more detailed information
regarding the Corporation’s human capital management programs and initiatives. The information on the Corporation’s website,
including the Corporation’s Corporate Sustainability Report, is not, and will not be deemed to be, a part of this Form 10-K or
incorporated into any of the Corporation’s filings with the SEC.
Regulation and Supervision
Described below are the material elements of selected laws and regulations applicable to Popular, Popular North America
(“PNA”) and their respective subsidiaries. Such laws and regulations are continually under review by Congress and state
legislatures and federal and state regulatory agencies. Any change in the laws and regulations applicable to Popular and its
subsidiaries could have a material effect on the business of Popular and its subsidiaries. We will continue to assess our businesses
and risk management and compliance practices to conform to developments in the regulatory environment.
General
Popular and PNA are bank holding companies subject to consolidated supervision and regulation by the Federal Reserve
Board under the Bank Holding Company Act of 1956 (as amended, the “BHC Act”). BPPR and PB are subject to supervision and
examination by applicable federal and state banking agencies including, in the case of BPPR, the Federal Reserve Board and the
Office of the Commissioner of Financial Institutions of Puerto Rico (the “Office of the Commissioner”), and, in the case of PB, the
Federal Reserve Board and the New York State Department of Financial Services (the “NYSDFS”). Popular’s broker-dealer /
investment adviser subsidiary, Popular Securities, LLC (“PS”) and investment advisor subsidiary Popular Asset Management LLC
(“PAM”) are subject to regulation by the SEC, the Financial Industry Regulatory Authority (“FINRA”), and the Securities Investor
Protection Corporation, among others. Other of our non-bank subsidiaries conduct reinsurance and insurance producer and agency
activities, which are subject to other federal, state and Puerto Rico laws and regulations as well as licensing and regulation by the
Puerto Rico Office of the Commissioner of Insurance and, for one insurance agency subsidiary, the NYSDFS.
Enhanced Prudential Standards
Under the Dodd-Frank Wall Street Reform and Consumer Protection Act (the “Dodd-Frank Act”), as modified by the
Economic Growth, Regulatory Relief, and Consumer Protection Act and the federal banking regulators’ 2019 “Tailoring Rules,”
banking organizations are categorized based on status as a U.S. G-SIB, size and four other risk-based indicators. Among bank
holding companies with $100 billion or more in total consolidated assets, the most stringent standards apply to U.S. G-SIBs, which
are subject to Category I standards and the least stringent standards apply to Category IV organizations, which have between $100
billion and $250 billion in total consolidated assets and less than $75 billion in all four other risk-based indicators and which are also
not U.S. G-SIBs. Bank holding companies with total consolidated assets of $50 billion or more are subject to risk committee and risk
management requirements. As of December 31, 2023, Popular had total consolidated assets of $70.8 billion.
Transactions with Affiliates
BPPR and PB are subject to restrictions that limit the amount of extensions of credit and certain other “covered
transactions” (as defined in Section 23A of the Federal Reserve Act) between BPPR or PB, on the one hand, and Popular, PNA or
any of our other non-banking subsidiaries, on the other hand, and that impose collateralization requirements on such credit
14
extensions. A bank may not engage in any covered transaction if the aggregate amount of the bank’s covered transactions with that
affiliate would exceed 10% of the bank’s capital stock and surplus or the aggregate amount of the bank’s covered transactions with
all affiliates would exceed 20% of the bank’s capital stock and surplus. In addition, any transaction between BPPR or PB, on the one
hand, and Popular, PNA or any of our other non-banking subsidiaries, on the other, is required to be carried out on an arm’s length
basis.
Source of Financial Strength
The Dodd-Frank Act requires bank holding companies, such as Popular and PNA, to act as a source of financial and
managerial strength to their subsidiary banks. Popular and PNA are expected to commit resources to support their subsidiary banks,
including at times when Popular and PNA may not be in a financial position to provide such resources. Any capital loans by a bank
holding company to any of its subsidiary depository institutions are subordinated in right of payment to depositors and to certain
other indebtedness of such subsidiary depository institution. In the event of a bank holding company’s bankruptcy, any commitment
by the bank holding company to a federal banking agency to maintain the capital of a subsidiary depository institution will be
assumed by the bankruptcy trustee and entitled to a priority of payment. BPPR and PB are currently the only insured depository
institution subsidiaries of Popular and PNA.
Resolution Planning and Resolution-Related Requirements
A
bank holding company with $250 billion or more in total consolidated assets (or that is a Category III firm based on
certain risk-based indicators described in the Tailoring Rules) is required to report periodically to the FDIC and the Federal Reserve
Board such company’s plan for its rapid and orderly resolution in the event of material financial distress or failure. In addition,
insured depository institutions with total assets of $50 billion or more are required to submit to the FDIC periodic contingency plans
for resolution in the event of the institution’s failure. In 2018, the FDIC issued a moratorium on resolution plans for insured
depository institutions with more than $50 billion in assets. The moratorium is still in effect for insured depository institutions with
more than $50 billion but less than $100 billion in assets. On August 29, 2023, the FDIC proposed amendments to the resolution
planning requirements for insured depository institutions with $50 billion or more in total assets. The amendments would require
insured depository institutions with between $50 billion and $100 billion in assets to submit informational filings on a two-year cycle,
with an interim supplement updating key information submitted in the off years.
On August 29, 2023, the Federal Reserve Board, FDIC and Office of the Comptroller of the Currency (“OCC”) issued a
proposed rule that would require bank holding companies and insured depository institutions with $100 billion or more in
consolidated assets (as well as their insured depository institution affiliates) to maintain minimum amounts of eligible long-term debt
(generally, debt that is unsecured, has a maturity greater than one year from issuance and satisfies additional criteria), subject to a
three-year phase-in period. The proposal would also apply “clean holding company” requirements to Category II through IV bank
holding companies, which would, among other things, prohibit entering into derivatives and certain other financial contracts with third
parties.
As of December 31, 2023, Popular, PNA, BPPR and PB’s total assets were below the thresholds for applicability of these
rules, except that BPPR would be subject to the FDIC’s proposed amendments to its resolution planning requirements applicable to
insured depository institutions with more than $50 billion but less than $100 billion in assets (if those amendments are adopted as
proposed).
FDIC Insurance
Substantially all the deposits of BPPR and PB are insured up to applicable limits by the Deposit Insurance Fund (“DIF”) of
the FDIC, and BPPR and PB are subject to FDIC deposit insurance assessments to maintain the DIF. Deposit insurance
assessments are based on the average consolidated total assets of the insured depository institution minus the average tangible
equity of the institution during the assessment period. For larger depository institutions with over $10 billion in assets, such as BPPR
and PB, the FDIC uses a “scorecard” methodology, which considers CAMELS ratings, among other measures, that seeks to capture
both the probability that an individual large institution will fail and the magnitude of the impact on the DIF if such a failure occurs. The
FDIC has the ability to make discretionary adjustments to the total score based upon significant risk factors that are not adequately
captured in the calculations. The initial base deposit insurance assessment rate for larger depository institutions ranges from 3 to 30
basis points on an annualized basis. After the effect of potential base-rate adjustments, the total base assessment rate could range
from 1.5 to 40 basis points on an annualized basis.
In October 2022, the FDIC finalized a rule that increased initial base deposit insurance assessment rates by 2 basis
points, beginning with the first quarterly assessment period of 2023. The FDIC, as required under the Federal Deposit Insurance Act
15
(“FDIA”), established a plan in September 2020 to restore the DIF reserve ratio to meet or exceed the statutory minimum of 1.35
percent within eight years. The increased assessment is intended to improve the likelihood that the DIF reserve ratio would reach
the required minimum by the statutory deadline of September 30, 2028.
As of December 31, 2023, we had a DIF average total asset less average tangible equity assessment base of
approximately $66 billion.
On November 16, 2023, the FDIC finalized a rule that imposes a special assessment to recover the costs to the DIF
resulting from the FDIC’s use, in March 2023, of the systemic risk exception to the least-cost resolution test under the FDIA in
connection with the receiverships of Silicon Valley Bank and Signature Bank. The FDIC estimated in approving the rule that those
assessed losses total approximately $16.3 billion. The rule provides that this loss estimate will be periodically adjusted, which will
affect the amount of the special assessment. Under the rule, the assessment base is the estimated uninsured deposits that an
insured depository institution reported in its Consolidated Reports of Condition and Income (“Call Report”) at December 31, 2022,
excluding the first $5 billion in estimated uninsured deposits. For a holding company that has more than one insured depository
institution subsidiary, such as Popular, the $5 billion exclusion is allocated among the company’s insured depository institution
subsidiaries in proportion to each insured depository institution’s estimated uninsured deposits. The special assessments will be
collected at an annual rate of approximately 13.4 basis points per year (3.36 basis points per quarter) over eight quarters in 2024
and 2025, with the first assessment period beginning January 1, 2024. Because the estimated loss pursuant to the systemic risk
determination will be periodically adjusted, the FDIC retains the ability to cease collection early, extend the special assessment
collection period and impose a final shortfall special assessment on a one-time basis. Popular expects the special assessments to
be tax deductible. The total of the assessments for Popular is estimated at $71.4 million and such amount was recorded as an
expense in the quarter of adoption (the quarter ended December 31, 2023). As of December 31, 2023, the FDIC’s loss estimate
described in the final rule had increased by approximately $4.1 billion to $20.4 billion, or approximately 25%. If such increase in the
FDIC’s loss estimate remains unchanged and is assessed in the same manner, the Corporation estimates that the incremental
expense for the special assessments could be approximately $18 million.
Brokered Deposits
The FDIA and regulations adopted thereunder restrict the use of brokered deposits and the rate of interest payable on
deposits for institutions that are less than well capitalized. Popular does not believe the brokered deposits regulations have had or
will have a material effect on the funding or liquidity of BPPR and PB.
Capital Adequacy
Popular, PNA, BPPR and PB are each required to comply with applicable capital adequacy standards established by the
federal banking agencies (the “Capital Rules”), which implement the Basel III framework set forth by the Basel Committee on
Banking Supervision (the “Basel Committee”) as well as certain provisions of the Dodd-Frank Act.
Among other matters, the Capital Rules: (i) impose a capital measure called “Common Equity Tier 1” (“CET1”) and the
related regulatory capital ratio of CET1 to risk-weighted assets; (ii) specify that Tier 1 capital consists of CET1 and “Additional Tier 1
capital” instruments meeting certain revised requirements; and (iii) mandate that most deductions/adjustments to regulatory capital
measures be made to CET1 and not to the other components of capital. Under the Capital Rules, for most banking organizations,
including Popular, the most common form of Additional Tier 1 capital is non-cumulative perpetual preferred stock and the most
common form of Tier 2 capital is subordinated notes and a portion of the allocation for loan and lease losses, in each case, subject
to the Capital Rules’ specific requirements.
Pursuant to the Capital Rules, the minimum capital ratios are:
4.5% CET1 to risk-weighted assets;
6.0% Tier 1 capital (that is, CET1 plus Additional Tier 1 capital) to risk-weighted assets;
8.0% Total capital (that is, Tier 1 capital plus Tier 2 capital) to risk-weighted assets; and
4% Tier 1 capital to average consolidated assets as reported on consolidated financial statements (known as the
“leverage ratio”).
The Capital Rules also impose a “capital conservation buffer,” composed entirely of CET1, on top of these minimum risk-
weighted asset ratios. The capital conservation buffer is designed to absorb losses during periods of economic stress. Banking
institutions with a ratio of CET1 to risk-weighted assets above the minimum but below the capital conservation buffer will face
16
constraints on dividends, equity repurchases and compensation based on the amount of the shortfall and eligible retained income
(that is, four quarter trailing net income, net of distributions and tax effects not reflected in net income). Thus, Popular, BPPR and
PB are required to maintain such additional capital conservation buffer of 2.5% of CET1, effectively resulting in minimum ratios of (i)
CET1 to risk-weighted assets of at least 7%, (ii) Tier 1 capital to risk-weighted assets of at least 8.5%, and (iii) Total capital to risk-
weighted assets of at least 10.5%.
In addition, under prior risk-based capital rules, the effects of accumulated other comprehensive income or loss (“AOCI”)
items included in stockholders’ equity (for example, marks-to-market of securities held in the available for sale portfolio) under U.S.
GAAP were reversed for the purposes of determining regulatory capital ratios. Pursuant to the Capital Rules, the effects of certain
AOCI items are not excluded; however, banking organizations that are not subject to Categories I or II standards under the
framework for banking organizations with $100 billion or more in assets, including Popular, BPPR and PB, may make a one-time
permanent election to continue to exclude these items. Popular, BPPR and PB have made this election in order to avoid significant
variations in the level of capital depending upon the impact of interest rate fluctuations on the fair value of their available for sale
securities portfolios.
The Capital Rules preclude certain hybrid securities, such as trust preferred securities, from inclusion in bank holding
companies’ Tier 1 capital. Trust preferred securities no longer included in Popular’s Tier 1 capital may nonetheless be included as a
component of Tier 2 capital. Popular has not issued any trust preferred securities since May 19, 2010. As of December 31, 2023,
Popular has $193 million of trust preferred securities outstanding which no longer qualify for Tier 1 capital treatment, but instead
qualify for Tier 2 capital treatment.
The Capital Rules also provide for a number of deductions from and adjustments to CET1. Banking organizations that are
not subject to Category I or II standards are subject to rules that provide for simplified capital requirements relating to the threshold
deductions for certain mortgage servicing assets, deferred tax assets, investments in the capital of unconsolidated financial
institutions and inclusion of minority interests in regulatory capital.
Failure to meet capital guidelines could subject Popular and its depository institution subsidiaries to a variety of
enforcement remedies, including the termination of deposit insurance by the FDIC and to certain restrictions on our business. Refer
to “Prompt Corrective Action” below for further discussion.
In December 2017, the Basel Committee published standards that it described as the finalization of the Basel III post-
crisis regulatory reforms. Among other things, these standards revise the Basel Committee’s standardized approach for credit risk
(including by recalibrating risk weights and introducing new capital requirements for certain “unconditionally cancellable
commitments,” such as unused credit card lines of credit) and provide a new standardized approach for operational risk capital.
Under the current U.S. capital rules, operational risk capital requirements and a capital floor apply only to advanced approaches
institutions, and not to Popular, BPPR and PB.
On July 27, 2023, the federal banking regulators proposed revisions to the Capital Rules to implement the Basel
Committee’s 2017 standards and make other changes to the Capital Rules, including the ability of banking organizations in
Categories III and IV to elect not to recognize most elements of AOCI in regulatory capital. The proposal introduces revised credit
risk, equity risk, operational risk, credit valuation adjustment risk and market risk requirements, among other changes. However, the
revised capital requirements of the proposed rule would not apply to Popular, BPPR, or PB because they have less than $100 billion
in total consolidated assets and trading assets and liabilities below the threshold for market risk requirements.
In December 2018, the federal banking agencies approved a final rule modifying their regulatory capital rules and
providing an option to phase in over a period of three years the day-one regulatory capital effects of the Current Expected Credit
Loss (“CECL”) model of ASU 2016-13. The final rule also revised the agencies’ other rules to reflect the update to the accounting
standards. Popular has availed itself of the option to phase in over a period of three years the day one effects on regulatory capital
from the adoption of CECL. In 2020, federal bank regulators adopted a rule that allowed banking organizations to elect to delay
temporarily the estimated effects of adopting CECL on regulatory capital until January 2022 and subsequently to phase in the
effects through January 2025.
Refer to the Consolidated Financial Statements in this Form 10-K., Note 21 and Table 9 of Management’s Discussion and
Analysis for the capital ratios of Popular, BPPR and PB under Basel III. Refer to the Consolidated Financial Statements in this Form
10-K Note 2 for more information regarding CECL.
17
Prompt Corrective Action
The FDIA requires, among other things, the federal banking agencies to take prompt corrective action in respect of
insured depository institutions that do not meet minimum capital requirements. The FDIA establishes five capital tiers: “well
capitalized,” “adequately capitalized,” “undercapitalized,” “significantly undercapitalized,” and “critically undercapitalized”. A
depository institution’s capital tier will depend upon how its capital levels compare with various relevant capital measures and certain
other factors.
An insured depository institution will be deemed to be (i) “well capitalized” if the institution has a total risk-based capital
ratio of 10.0% or greater, a CET1 capital ratio of 6.5% or greater, a Tier 1 risk-based capital ratio of 8.0% or greater, and a leverage
ratio of 5.0% or greater, and is not subject to any order or written directive by any such regulatory authority to meet and maintain a
specific capital level for any capital measure; (ii) “adequately capitalized” if the institution has a total risk-based capital ratio of 8.0%
or greater, a CET1 capital ratio of 4.5% or greater, a Tier 1 risk-based capital ratio of 6.0% or greater, and a leverage ratio of 4.0%
or greater and is not “well capitalized”; (iii) “undercapitalized” if the institution has a total risk-based capital ratio that is less than
8.0%, a CET1 capital ratio less than 4.5%, a Tier 1 risk-based capital ratio of less than 6.0% or a leverage ratio of less than 4.0%;
(iv) “significantly undercapitalized” if the institution has a total risk-based capital ratio of less than 6.0%, a CET1 capital ratio less
than 3%, a Tier 1 risk-based capital ratio of less than 4.0% or a leverage ratio of less than 3.0%; and (v) “critically undercapitalized”
if the institution’s tangible equity is equal to or less than 2.0% of average quarterly tangible assets. An institution may be
downgraded to, or deemed to be in, a capital category that is lower than indicated by its capital ratios if it is determined to be in an
unsafe or unsound condition or if it receives an unsatisfactory examination rating with respect to certain matters. An insured
depository institution’s capital category is determined solely for the purpose of applying prompt corrective action regulations, and the
capital category may not constitute an accurate representation of the institution’s overall financial condition or prospects for other
purposes.
The FDIA generally prohibits an insured depository institution from making any capital distribution (including payment of a
dividend) or paying any management fee to its holding company, if the depository institution would thereafter be undercapitalized.
Undercapitalized depository institutions are subject to restrictions on borrowing from the Federal Reserve System. In addition,
undercapitalized depository institutions are subject to growth limitations and are required to submit capital restoration plans. A
depository institution’s holding company must guarantee the capital restoration plan, up to an amount equal to the lesser of 5% of
the depository institution’s assets at the time it becomes undercapitalized or the amount of the capital deficiency, when the
institution fails to comply with the plan. The federal banking agencies may not accept a capital restoration plan without determining,
among other things, that the plan is based on realistic assumptions and is likely to succeed in restoring the depository institution’s
capital. If a depository institution fails to submit an acceptable plan, it is treated as if it is significantly undercapitalized.
Significantly undercapitalized depository institutions may be subject to a number of requirements and restrictions,
including orders to sell sufficient voting stock to become adequately capitalized, requirements to reduce total assets and cessation
of receipt of deposits from correspondent banks. Critically undercapitalized depository institutions are subject to appointment of a
receiver or conservator.
The capital-based prompt corrective action provisions of the FDIA apply to the FDIC-insured depository institutions such
as BPPR and PB, but they are not directly applicable to holding companies such as Popular and PNA, which control such
institutions. As of December 31, 2023, both BPPR and PB met the quantitative requirements for ‘well capitalized’ status.
Restrictions on Dividends and Repurchases
The principal sources of funding for Popular and PNA have included dividends received from their banking and non-
banking subsidiaries, asset sales and proceeds from the issuance of debt and equity. Various statutory provisions limit the amount
of dividends an insured depository institution may pay to its holding company without regulatory approval. A member bank must
obtain the approval of the Federal Reserve Board for any dividend, if the total of all dividends declared by the member bank during
the calendar year would exceed the total of its net income for that year, combined with its retained net income for the preceding two
years, after considering those years’ dividend activity, less any required transfers to surplus or to a fund for the retirement of any
preferred stock. During the year ended December 31, 2023, BPPR declared cash dividends of $200 million, a portion of which was
used by Popular for the payments of the cash dividends on its outstanding common stock. At December 31, 2023, BPPR needed to
obtain prior approval of the Federal Reserve Board before declaring a dividend in excess of $387 million due to its retained income,
declared dividend activity and transfers to statutory reserves over the three year’s ended December 31, 2023. In addition, a member
18
bank may not declare or pay a dividend in an amount greater than its undivided profits as reported in its Report of Condition and
Income, unless the member bank has received the approval of the Federal Reserve Board. A member bank also may not permit any
portion of its permanent capital to be withdrawn unless the withdrawal has been approved by the Federal Reserve Board. Pursuant
to these requirements, PB may not declare or pay a dividend without the prior approval of the Federal Reserve Board and the
NYSDFS.
During the year ended December 31, 2023, PB declared cash dividends of $50 million, a portion of which was used by
Popular for the payments of the cash dividends on its outstanding common stock.
It is Federal Reserve Board policy that bank holding companies generally should pay dividends on common stock only out
of net income available to common shareholders over the past year and only if the prospective rate of earnings retention appears
consistent with the organization’s current and expected future capital needs, asset quality and overall financial condition. Moreover,
under Federal Reserve Board policy, a bank holding company should not maintain dividend levels that place undue pressure on the
capital of depository institution subsidiaries or that may undermine the bank holding company’s ability to be a source of strength to
its banking subsidiaries. Federal Reserve policy also provides that a bank holding company should inform the Federal Reserve
reasonably in advance of declaring or paying a dividend that exceeds earnings for the period for which the dividend is being paid or
that could result in a material adverse change to the bank holding company’s capital structure.
The Federal Reserve Board also restricts the ability of banking organizations to conduct stock repurchases. In certain
circumstances, a banking organization’s repurchases of its common stock may be subject to a prior approval or notice requirement
under other regulations or policies of the Federal Reserve. Any redemption or repurchase of preferred stock or subordinated debt is
subject to the prior approval of the Federal Reserve.
Subject to compliance with certain conditions, distributions of U.S. sourced dividends to a corporation organized under the
laws of the Commonwealth of Puerto Rico are subject to a withholding tax of 10% instead of the 30% applied to other “foreign”
corporations. Accordingly, dividends from current or accumulated earnings and profits paid by PNA to Popular, Inc. sourced from the
U.S. operations of PB are subject to a 10% tax withholding.
Refer to Part II, Item 5, “Market for Registrant’s Common Equity, Related Stockholder Matters and Issuer Purchases of
Equity Securities” for further information on Popular’s distribution of dividends and repurchases of equity securities.
See “Puerto Rico Regulation” below for a description of certain restrictions on BPPR’s ability to pay dividends under
Puerto Rico law.
Interstate Branching
The Dodd-Frank Act amended the Riegle-Neal Interstate Banking and Branching Efficiency Act of 1994 (the “Interstate
Banking Act”) to authorize national banks and state banks to branch interstate through
de novo
Interstate Banking Act, BPPR is treated as a state bank and is subject to the same restrictions on interstate branching as other state
banks.
Activities and Acquisitions
In general, the BHC Act limits the activities permissible for bank holding companies to the business of banking, managing
or controlling banks and such other activities as the Federal Reserve Board has determined to be so closely related to banking as to
be properly incidental thereto. A company who meets management and capital standards and whose subsidiary depository
institutions meet management, capital and Community Reinvestment Act (“CRA”) standards may elect to be treated as a financial
holding company and engage in a substantially broader range of nonbanking financial activities, including securities underwriting
and dealing, insurance underwriting and making merchant banking investments in nonfinancial companies.
In order for a bank holding company to elect to be treated as a financial holding company, (i) all of its depository institution
subsidiaries must be well capitalized (as described above) and well managed and (ii) it must file a declaration with the Federal
Reserve Board that it elects to be a “financial holding company.” As noted above, a bank holding company electing to be a financial
holding company must itself be and remain well capitalized and well managed. The Federal Reserve Board’s regulations applicable
to bank holding companies separately define “well capitalized” for bank holding companies, such as Popular, to require maintaining
a tier 1 capital ratio of at least 6% and a total capital ratio of at least 10%. Popular and PNA have elected to be treated as financial
holding companies. A depository institution is deemed to be “well managed” if, at its most recent inspection, examination or
subsequent review by the appropriate federal banking agency (or the appropriate state banking agency), the depository institution
received at least a “satisfactory” composite rating and at least a “satisfactory” rating for the management component of the
19
composite rating. If, after becoming a financial holding company, the company fails to continue to meet any of the capital or
management requirements for financial holding company status, the company must enter into a confidential agreement with the
Federal Reserve Board to comply with all applicable capital and management requirements. If the company does not return to
compliance within 180 days, the Federal Reserve Board may extend the agreement or may order the company to divest its
subsidiary banks or the company may discontinue, or divest investments in companies engaged in, activities permissible only for a
bank holding company that has elected to be treated as a financial holding company. In addition, if a depository institution subsidiary
controlled by a financial holding company does not maintain a CRA rating of at least “satisfactory,” the financial holding company will
be subject to restrictions on certain new activities and acquisitions.
The Federal Reserve Board may in certain circumstances limit our ability to conduct activities and make acquisitions that
would otherwise be permissible for a financial holding company. Furthermore, a financial holding company must obtain prior written
approval from the Federal Reserve Board before acquiring a nonbank company with $10 billion or more in total consolidated assets.
In addition, we are required to obtain prior Federal Reserve Board approval before engaging in certain banking and other financial
activities both in the United States and abroad.
The “Volcker Rule” adopted as part of the Dodd-Frank Act restricts the ability of Popular and its subsidiaries, including
BPPR and PB as well as non-banking subsidiaries, to sponsor or invest in “covered funds,” including private funds, or to engage in
certain types of proprietary trading. Popular and its subsidiaries generally do not engage in the businesses subject to the Volcker
Rule; therefore, the Volcker Rule does not have a material effect on our operations.
Anti-Money Laundering Initiative and the USA PATRIOT Act
A major focus of governmental policy relating to financial institutions in recent years has been aimed at combating money
laundering and terrorist financing. The USA PATRIOT Act of 2001 (the “USA PATRIOT Act”) strengthened the ability of the U.S.
government to help prevent, detect and prosecute international money laundering and the financing of terrorism. Title III of the USA
PATRIOT Act imposed significant compliance and due diligence obligations, created new crimes and penalties and expanded the
extra-territorial jurisdiction of the United States. Failure of a financial institution to comply with the USA PATRIOT Act’s requirements
could have serious legal and reputational consequences for the institution.
The Anti-Money Laundering Act of 2020 (“AMLA”), which amended the Bank Secrecy Act (the “BSA”), is intended to
comprehensively reform and modernize U.S. anti-money laundering laws. Among other things, the AMLA codifies a risk-based
approach to anti-money laundering compliance for financial institutions; requires the U.S. Department of the Treasury to promulgate
priorities for anti-money laundering and countering the financing of terrorism policy; requires the development of standards for
testing technology and internal processes for BSA compliance; expands enforcement- and investigation-related authority, including
a significant expansion in the available sanctions for certain BSA violations; and expands BSA whistleblower incentives and
protections. Many of the statutory provisions in the AMLA will require additional rulemakings, reports and other measures, and the
impact of the AMLA will depend on, among other things, rulemaking and implementation guidance. In June 2021, the Financial
Crimes Enforcement Network, a bureau of the U.S. Department of the Treasury, issued the priorities for anti-money laundering and
countering the financing of terrorism policy required under AMLA. The priorities include: corruption, cybercrime, terrorist financing,
fraud, transnational crime, drug trafficking, human trafficking and proliferation financing.
Federal regulators regularly examine BSA/Anti-Money Laundering and sanctions compliance to enhance their adequacy
and effectiveness, and the frequency and extent of such examinations and related remedial actions have been increasing.
Community Reinvestment Act
The CRA requires banks to help serve the credit needs of their communities, including extending credit to low- and
moderate-income individuals and geographies. Should Popular or our bank subsidiaries fail to serve adequately the community,
potential penalties may include regulatory denials of applications to expand branches, relocate offices or branches, add subsidiaries
and affiliates, expand into new financial activities and merge with or purchase other financial institutions. On October 24, 2023, the
OCC, the Federal Reserve Board, and the FDIC jointly issued a final rule to modernize the federal banking agencies’ CRA
regulations and respond to changes in the banking industry. Among other items, the final rule introduces new tests under which the
performance of banks will be assessed and includes data collection and reporting requirements, many of which are applicable only
to banks with over $10 billion in assets, such as BPPR and PB. The effective date of the final rule is April 1, 2024; however, banks
will not be required to begin complying with certain provisions of the final rule until January 1, 2026, with data reporting requirements
becoming applicable on January 1, 2027.
20
Interchange Fees Regulation
The Federal Reserve Board has established standards for debit card interchange fees and prohibited network exclusivity
arrangements and routing restrictions. The maximum permissible interchange fee that an issuer may receive for an electronic debit
transaction is the sum of 21 cents per transaction and 5 basis points multiplied by the value of the transaction. Additionally, the
Federal Reserve Board allows for an upward adjustment of no more than 1 cent to an issuer’s debit card interchange fee if the
issuer develops and implements policies and procedures reasonably designed to achieve certain fraud-prevention standards.
In October 2023, the Federal Reserve Board proposed amendments to its rules on interchange fees. The proposed
changes would establish a maximum permissible interchange fee of no more than 14.4 cents per transaction plus four basis points
multiplied by the value of the transaction. The fraud prevention adjustment would be increased to 1.3 cents per transaction. The
proposed rule would also establish an automatic update of the interchange fee cap every other year based on a survey of debit card
issuers.
Consumer Financial Protection Act of 2010
The Consumer Financial Protection Bureau (the “CFPB”) supervises “covered persons” (broadly defined to include any
person offering or providing a consumer financial product or service and any affiliated service provider) for compliance with federal
consumer financial laws. The CFPB also has the broad power to prescribe rules applicable to a covered person or service provider
identifying as unlawful, unfair, deceptive, or abusive acts or practices in connection with any transaction with a consumer for a
consumer financial product or service, or the offering of a consumer financial product or service. We are subject to examination and
regulation by the CFPB.
On October 19, 2023, the CFPB proposed a new rule to implement Section 1033 of the Consumer Financial Protection
Act that would require a provider of payment accounts or products, such as a bank, to make data available to consumers upon
request regarding the products or services they obtain from the provider. Any such data provider would also have to make such data
available to third parties, with the consumer’s express authorization and through an interface that satisfies formatting, performance
and security standards, for the purpose of such third parties providing the consumer with financial products or services requested by
the consumer. Data that would be required to be made available under the rule would include transaction information, account
balance, account and routing numbers, terms and conditions, upcoming bill information, and certain account verification data. The
proposed rule is intended to give consumers control over their financial data, including with whom it is shared, and encourage
competition in the provision of consumer financial products or services. For banks with at least $850 million and less than $50 billion
in total assets, compliance with the proposed rule’s requirements would be required approximately two and a half years after
adoption of the final rule. For banks with at least $50 billion and less than $500 billion in total assets, compliance with the proposed
rule’s requirements would be required approximately one year after adoption of the final rule.
On January 17, 2024, the CFPB proposed a rule that would significantly reform the regulatory framework governing
overdraft practices applicable to banks such as BPPR and PB that have more than $10 billion in assets. The proposed rule would
modify or eliminate several long-standing exclusions from requirements generally applicable to consumer credit that previously
exempted certain overdraft practices. The proposal would also generally require banks to restructure many overdraft fees, overdraft
lines of credit, and other overdraft practices as separate consumer credit accounts that would be subject to those requirements.
These changes to the regulatory framework could result in BPPR and PB, among other things, facing higher compliance costs in
charging overdraft fees, experiencing a decreased ability to recover amounts extended as overdraft protection, reducing the
availability of overdraft protection, and/or charging lower overdraft fees.
Office of Foreign Assets Control Regulation
The U.S. Treasury Department Office of Foreign Assets Control (“OFAC”) administers economic sanctions that affect
transactions with designated foreign countries, nationals and others. The OFAC-administered sanctions targeting countries take
many different forms. Generally, however, they contain one or more of the following elements: (i) restrictions on trade with or
investment in a sanctioned country; and (ii) a blocking of assets in which the government of the sanctioned country or other specially
designated nationals have an interest, by prohibiting transfers of property subject to U.S. jurisdiction (including property in the United
States or the possession or control of U.S. persons outside of the United States). Blocked assets (e.g., property and bank deposits)
cannot be paid out, withdrawn, set off or transferred in any manner without a license from OFAC. Failure to comply with these
sanctions could have serious legal and reputational consequences.
21
Protection of Customer Personal Information and Cybersecurity
The privacy provisions of the Gramm-Leach-Bliley Act of 1999 generally prohibit financial institutions, including us, from
disclosing nonpublic personal financial information of consumer customers to third parties for certain purposes (primarily marketing)
unless customers have the opportunity to opt out of the disclosure. The Fair Credit Reporting Act restricts information sharing
among affiliates for marketing purposes and governs the use and provision of information to consumer reporting agencies.
The federal banking regulators have also issued guidance and proposed rules regarding cybersecurity that are intended
to enhance cyber risk management standards among financial institutions. A financial institution is expected to establish lines of
defense and to maintain risk management processes that are designed to address the risk posed by compromised customer
credentials. A financial institution’s management is expected to maintain sufficient business continuity planning processes for the
rapid recovery, resumption and maintenance of the institution’s operations after a cyber-attack involving destructive malware. A
financial institution is also expected to develop appropriate processes to enable recovery of data and business operations and
address rebuilding network capabilities and restoring data if the institution or its critical service providers fall victim to this type of
cyber-attack. If we fail to observe the regulatory guidance, we could be subject to various regulatory sanctions, including financial
penalties. In November 2021, the U.S. federal bank regulatory agencies issued a final rule requiring banking organizations, including
Popular, PNA, BPPR and PB, to notify their primary federal banking regulator within 36 hours of determining that a “notification
incident” has occurred. A notification incident is a “computer-security incident” that has materially disrupted or degraded, or is
reasonably likely to materially disrupt or degrade, the banking organization’s ability to deliver services to a material portion of its
customer base, jeopardize the viability of key operations of the banking organization, or impact the stability of the financial sector.
The final rule also requires specific and immediate notifications by bank service providers that become aware of similar incidents.
State and foreign regulators have also been increasingly active in implementing privacy and cybersecurity standards and
regulations. Several states have adopted regulations requiring certain financial institutions to implement cybersecurity programs and
providing detailed requirements with respect to these programs, including data encryption requirements. In New York, the NYSDFS
requires financial institutions regulated by the NYSDFS, including PB, to, among other things, (i) establish and maintain a
cybersecurity program designed to enhance the confidentiality, integrity and availability of their information systems; (ii) implement
and maintain a written cyber security policy setting forth policies and procedures for the protection of their information systems and
nonpublic information; and (iii) designate a Chief Information Security Officer.
On November 1, 2023, the NYSDFS adopted
amendments to its cybersecurity regulations that represent a significant update to the regulation of cybersecurity practices. The
amendments generally fall within the following five categories: (i) increased mandatory controls associated with common attack
vectors, (ii) enhanced requirements for privileged accounts, (iii) enhanced notification obligations, (iv) expansion of cyber
governance practices and (v) additional cybersecurity requirements for larger companies. Most of the amendments will become
effective 180 days after adoption.
On July 6, 2023, the SEC adopted new rules that would require registrants, such as Popular, to (i) report material
cybersecurity incidents on Form 8-K and, (ii) disclose in Annual Report on Form 10-K cybersecurity policies and procedures and
governance practices, including at the board and management levels.
Many states and foreign governments have also recently implemented or modified their data breach notification and data
privacy requirements. The California Consumer Privacy Act (“CCPA”) imposes privacy compliance obligations with regard to the
collection, use and disclosure of personal information of California residents, and the November 2020 amendment to the CCPA
creates the California Privacy Protection Agency, a watchdog privacy agency, and further expands the scope of businesses covered
by the law and certain rights relating to personal information. The substantive obligations under the 2020 amendment to the CCPA
became effective on January 1, 2023. In European Union, the General Data Protection Regulation heightens privacy compliance
obligations and imposes strict standards for reporting data breaches. We expect this trend to continue and are continually
monitoring developments in the jurisdictions in which we operate.
See “Puerto Rico Regulation” below for a description of legislations and regulations on information privacy and
cybersecurity in Puerto Rico.
Climate-Related and ESG Developments
In recent years, federal, state and international lawmakers and regulators have increased their focus on financial
institutions’ and other companies’ risk oversight, disclosures and practices in connection with climate change and other
environmental, social and governance (“ESG”) matters. For example, on October 24, 2023, the Federal Reserve, FDIC, and OCC
finalized interagency guidance on principles for climate-related financial risk management applicable to regulated financial
22
institutions with more than $100 billion in total consolidated assets. The principles are intended to support efforts by large financial
institutions to focus on key aspects of climate-related financial risk management and cover six areas: (1) governance; (2) policies,
procedures, and limits; (3) strategic planning; (4) risk management; (5) data, risk measurement, and reporting; and (6) scenario
analysis. On December 21, 2022, the NYSDFS proposed guidance on climate-related financial risk management applicable to
NYSDFS-regulated banking and mortgage organizations, including PB. The proposed guidance would address material financial
risks related to climate change faced by these organizations in the context of risk assessment, risk management, and risk appetite
setting. On March 21, 2022, the SEC issued a proposed rule on the enhancement and standardization of climate-related disclosures
for investors. The proposed rule would require public issuers, including the Company, to significantly expand the scope of climate-
related disclosures in their SEC filings. The SEC also announced plans to propose rules to require enhanced disclosure regarding
human capital management and board diversity for public issuers.
Incentive Compensation
The Federal Reserve Board reviews, as part of its regular, risk-focused examination process, the incentive compensation
arrangements of banking organizations, such as Popular, that are not “large, complex banking organizations.” Deficiencies will be
incorporated into the organization’s supervisory ratings, which can affect the organization’s ability to make acquisitions and take
other actions. Enforcement actions may be taken against a banking organization if its incentive compensation arrangements, or
related risk-management control or governance processes, pose a risk to the organization’s safety and soundness and the
organization is not taking prompt and effective measures to correct the deficiencies.
The Federal Reserve Board, OCC and FDIC have issued comprehensive final guidance on incentive compensation
policies intended to discourage excessive risk-taking in the incentive compensation policies of banking organizations in order to not
undermine the safety and soundness of such organizations. The guidance, which covers all employees that have the ability to
materially affect the risk profile of an organization, either individually or as part of a group, is based upon the key principles that a
banking organization’s incentive compensation arrangements should (i) provide incentives that do not encourage risk-taking beyond
the organization’s ability to effectively identify and manage risks, (ii) be compatible with effective internal controls and risk
management, and (iii) be supported by strong corporate governance, including active and effective oversight by the organization’s
board of directors.
The Dodd-Frank Act requires the U.S. financial regulators, including the Federal Reserve Board, the other federal banking
agencies and the SEC, to adopt rules prohibiting incentive-based payment arrangements that encourage inappropriate risks by
providing excessive compensation or that could lead to a material financial loss at specified regulated entities having at least $1
billion in total assets (including Popular, PNA, BPPR and PB). The U.S. financial regulators proposed revised rules in 2016, which
have not been finalized.
In October 2022, the SEC adopted a final rule requiring securities exchanges to adopt rules mandating, in the case of a
restatement, the recovery or “clawback” of excess incentive-based compensation paid to current or former executive officers and
requiring listed issuers to disclose any recovery analysis where recovery is triggered by a restatement. The excess compensation
would be based on the amount the executive officer would have received had the incentive-based compensation been determined
using the restated financials. The Nasdaq Stock Market’s listing standards pursuant to the SEC’s rule became effective October 2,
2023. Popular’s clawback policy adopted in accordance with these listing standards is included as Exhibit 97.1.
Regulation of Broker-Dealers
Our subsidiary, PS, is a registered broker-dealer with the SEC and subject to regulation and examination by the SEC as
well as FINRA and other self-regulatory organizations. These regulations cover a broad range of issues, including capital
requirements; sales and trading practices; use of client funds and securities; the conduct of directors, officers and employees;
record-keeping and recording; supervisory procedures to prevent improper trading on material non-public information; qualification
and licensing of sales personnel; and limitations on the extension of credit in securities transactions. In addition to federal
registration, state securities commissions require the registration of certain broker-dealers. PS is registered with 35 U.S. state and
territory securities commissions.
Regulation of Reinsurers, Insurance Producers and Agents
Popular’s subsidiaries that are engaged in insurance agency and producer activities are subject to regulatory supervision
by the Puerto Rico Office of the Commissioner of Insurance and to insurance laws and regulations requiring licensing of insurance
producers and agents. Popular’s reinsurance subsidiaries are subject to licensure and regulatory supervision by the Puerto Rico
23
Office of the Commissioner of Insurance and to insurance laws and regulations requiring, among other things, minimum capital and
solvency standards, financial reporting, restrictions on the amount of dividends payable, record keeping and examinations.
Puerto Rico Regulation
As a commercial bank organized under the laws of Puerto Rico, BPPR is subject to supervision, examination and
regulation by the Office of the Commissioner of Financial Institutions, pursuant to the Puerto Rico Banking Act of 1933, as amended
(the “Banking Law”).
Section 27 of the Banking Law requires that at least ten percent (10%) of the yearly net income of BPPR be credited
annually to a reserve fund. The apportionment must be done every year until the reserve fund is equal to the total of paid-in capital
on common and preferred stock. During 2023, $44.5 million was transferred to the statutory reserve account.
Section 27 of the Banking Law also provides that when the expenditures of a bank are greater than its receipts, the
excess of the former over the latter must be charged against the undistributed profits of the bank, and the balance, if any, must be
charged against the reserve fund. If the reserve fund is not sufficient to cover such balance in whole or in part, the outstanding
amount must be charged against the capital account and no dividend may be declared until capital has been restored to its original
amount and the reserve fund to 20% of the original capital.
Section 16 of the Banking Law requires every bank to maintain a legal reserve that, except as otherwise provided by the
Office of the Commissioner, may not be less than 20% of its demand liabilities, excluding government deposits (federal, state and
municipal) that are secured by collateral. If a bank is authorized to establish one or more bank branches in a state of the United
States or in a foreign country, where such branches are subject to the reserve requirements of that state or country, the Office of the
Commissioner may exempt said branch or branches from the reserve requirements of Section 16. Pursuant to an order of the
Federal Reserve Board dated November 24, 1982, BPPR has been exempted from the reserve requirements of the Federal
Reserve System with respect to deposits payable in Puerto Rico. Accordingly, BPPR is subject to the reserve requirement
prescribed by the Banking Law. During 2023, BPPR was in compliance with the statutory reserve requirement.
Section 17 of the Banking Law permits a bank to make loans to any one person, firm, partnership or corporation, up to an
aggregate amount of fifteen percent (15%) of the paid-in capital and reserve fund of the bank. As of December 31, 2023, the legal
lending limit for BPPR under this provision was approximately $341 million. In the case of loans which are secured by collateral
worth at least 25% more than the amount of the loan, the maximum aggregate amount of such secured loans is increased to one
third of the paid-in capital of the bank, plus its reserve fund. In no event may the total of unsecured and secured loans to any one
person, firm, partnership or corporation exceed an aggregate amount of 33 1/3% of the paid-in capital and reserve fund of the bank.
If the institution is well capitalized and had been rated 1 in the last examination performed by the Office of the Commissioner or any
regulatory agency, its legal lending limit shall also include 15% of 50% of its undivided profits and for loans secured by collateral
worth at least 25% more than the amount of the loan, the capital of the bank shall also include 33 1/3% of 50% of its undivided
profits. Institutions rated 2 in their last regulatory examination may include this additional component in their legal lending limit only
with the previous authorization of the Office of the Commissioner. There are no restrictions under Section 17 on the amount of loans
that are wholly secured by bonds, securities and other evidence of indebtedness of the Government of the United States or Puerto
Rico, or by current debt bonds, not in default, of municipalities or instrumentalities of Puerto Rico. During 2023, BPPR was in
compliance with the lending limit requirements of Section 17 of the Banking Law.
Section 14 of the Banking Law authorizes a bank to conduct certain financial and related activities directly or through
subsidiaries, including finance leasing of personal property and originating and servicing mortgage loans. BPPR engages in finance
leasing through its wholly-owned subsidiary, Popular Auto, LLC, which is organized and operates in Puerto Rico. The origination
and servicing of mortgage loans is conducted by Popular Mortgage, a division of BPPR.
With respect to information privacy, Puerto Rico law requires businesses to implement information security controls to
protect consumers’ personal information from breaches, as well as to provide notice of any breach to affected customers. In
addition, as noted above in “Regulation of Reinsurers, Insurance Producers and Agents”, Popular’s reinsurance subsidiaries are
subject to licensure and regulatory supervision by the Puerto Rico Office of the Commissioner of Insurance and to insurance laws
and regulations.
24
Available Information
We maintain an Internet website at www.popular.com. Via the “Investor Relations” link at our website, our annual reports
on Form 10-K, quarterly reports on Form 10-Q, current reports on Form 8-K and amendments to such reports filed or furnished
pursuant to Section 13(a) or 15(d) of the Securities Exchange Act of 1934, as amended (the “Exchange Act”), are available, free of
charge, as soon as reasonably practicable after such forms are electronically filed with, or furnished to, the SEC. The SEC also
maintains an internet website at http://www.sec.gov that contains reports, proxy and information statements, and other information
regarding issuers that file electronically with the SEC. You may obtain copies of our filings on the SEC site.
We have adopted a written code of ethics that applies to all directors, officers and employees of Popular, including our
principal executive officer and senior financial officers, in accordance with Section 406 of the Sarbanes-Oxley Act of 2002 and the
rules of the SEC promulgated thereunder. Our Code of Ethics is available on our corporate website, www.popular.com, in the
section entitled “Corporate Governance.” In the event that we make changes to, or provide waivers from, the provisions of this Code
of Ethics that the SEC requires us to disclose, we intend to disclose these events on our corporate website in such section. In the
Corporate Governance section of our corporate website, we have also posted the charters for our Audit Committee, Talent and
Compensation Committee, Risk Management Committee, Corporate Governance and Nominating Committee and Technology
Committee, as well as our Corporate Governance Guidelines. In addition, information concerning purchases and sales of our equity
securities by our executive officers and directors is posted on our website.
All website addresses given in this document are for information only and are not intended to be active links or to
incorporate any website information into this Form 10-K.
ITEM 1A. RISK FACTORS
We, like other financial institutions, face risks inherent to our business, financial condition, liquidity, results of operations
and capital position. These risks could cause our actual results to differ materially from our historical results or the results
contemplated by the forward-looking statements contained in this report.
The risks described in this report are not the only risks we face. Additional risks and uncertainties not currently known by
us or that we currently deem to be immaterial, or that are generally applicable to all financial institutions, may also materially
adversely affect our business, financial condition, liquidity, results of operations or capital position.
ECONOMIC AND MARKET RISKS
Weakness in the economy, particularly in Puerto Rico, where a significant portion of our business is concentrated, has
adversely impacted us in the past and may adversely impact us in the future.
We have been, and will continue to be, impacted by global and local economic and market conditions, including weakness
in the economy, disruptions and volatility in the financial markets, inflation, monetary and fiscal policies, public policy, geopolitical
conflicts, business and consumer sentiment and unemployment. A significant portion of our business is concentrated in Puerto Rico,
which accounted for approximately 77% of our assets and 81% of our deposits as of December 31, 2023 and 78% of our revenues
for the year ended December 31, 2023. As a result, our financial condition and results of operations are highly dependent on the
general trends of the Puerto Rico economy and other conditions affecting Puerto Rico consumers and businesses. The
concentration of our operations in Puerto Rico exposes us to greater risks than other banking companies with a wider geographic
base.
Puerto Rico has faced significant economic and fiscal challenges in the past, including a severe recession that began in
2007 and persisted for over a decade and an acute fiscal crisis that led the Puerto Rico government to file for a form of federal
bankruptcy protection in 2017. Puerto Rico’s fiscal and economic challenges have in the past adversely affected our customers,
resulting in higher delinquencies, charge-offs and increased losses for us. While Puerto Rico’s economy has been gradually
recovering and the Puerto Rico government emerged from bankruptcy in 2022, Puerto Rico still faces economic and fiscal
challenges. Moreover, Puerto Rico has historically received a significant amount of federal funds through non-recurring
appropriations, particularly to cover costs associated with its health insurance program, and Puerto Rico’s recent economic recovery
has been partially driven by significant federal disaster relief and stimulus funding. Therefore, the Puerto Rico economy is highly
susceptible to changes in federal public policy towards Puerto Rico. Public policy changes that result in a reduction of federal
funding for Puerto Rico, or in delays in the receipt of such funding, could significantly impact Puerto Rico’s economy. A weakening
of the Puerto Rico economy or other adverse economic conditions affecting Puerto Rico consumers and businesses could result in
25
decreased demand for our products or services, deterioration in the credit quality of our customers, higher delinquencies, charge-
offs or increased losses, all of which could adversely affect our financial condition and results of operations.
We are also exposed to risks related to the state of the local economies of the other markets in which we do business,
such as New York and Florida, and to the state of the global and U.S. economy and financial markets. Global financial markets have
recently experienced periods of extraordinary disruption and volatility, exacerbated by geopolitical conflicts, the U.S. debt-ceiling
situation, high levels of inflation and rapid increases in interest rates. Inflationary pressures increased certain of our expenses
(including our personnel expenses) and adversely affected consumer sentiment. Central bank responses to inflationary pressures
led to higher market interest rates and, in turn, lower activity levels across U.S. and global financial markets. These circumstances
resulted in, and could continue to result in, reductions in the value of our investments. If these conditions persist or worsen, our
results of operations, financial position and liquidity could be materially and adversely affected.
Changes in interest rates and credit spreads can adversely impact our financial condition, including our investment
portfolio, since a significant portion of our business involves borrowing and lending money, and investing in financial
instruments.
Our business and financial performance are impacted by market interest rates and movements in those rates. Since a
high percentage of our assets and liabilities are interest bearing or otherwise sensitive in value to changes in interest rates, changes
in interest rates, in the shape of the yield curve or in spreads between different types of rates, have had and could in the future have
a material impact on our results of operations and the values of our assets and liabilities, including our investment portfolio. Interest
rates are highly sensitive to many factors over which we have no control and which we may not be able to anticipate adequately,
including general economic conditions and the monetary and tax policies of various governmental bodies, particularly the Federal
Reserve Board.
Increasing levels of inflation, driven by pent-up demand and supply-chain disruptions caused by the COVID-19 pandemic
and the war in Ukraine, led the Federal Market Committee of the Federal Reserve Board (the “FOMC”) to execute a series of sharp
benchmark interest rate increases beginning in the first quarter of 2022. While the FOMC has indicated that it may conclude its
interest rate hike cycle, the amount and pace of any reduction in interest rates remains uncertain. Higher interest rates could lead to
fewer originations of commercial and residential real estate loans, loss of deposits, a misalignment in the pricing of short-term and
long-term borrowings, less liquidity in the financial markets and higher funding costs. Furthermore, higher interest rates could
negatively affect the payment performance on loans linked to variable interest rates to the extent borrowers are unable to afford
higher interest payments, which could result in higher delinquencies. Inflationary pressure arising from increases in interest rates
may also affect borrowers’ financial condition and their ability to pay their debts when due. Additionally, if the interest rates we pay
on our deposits and other borrowings were to increase at a faster rate than the interest rates we receive on loans and other
investments, our net interest income, and, therefore, our earnings, could be adversely affected. All of these outcomes could
adversely affect our earnings, liquidity and capital levels.
The rapid rise in interest rates in 2022 resulted in approximately $2.5 billion in unrealized mark-to-market losses on
available-for-sale securities held in our investment securities portfolio. In October 2022, we transferred U.S. Treasury securities with
a fair value of approximately $6.5 billion (par value of $7.4 billion), and with accumulated unrealized losses of $873 million, from our
available-for-sale portfolio to our held-to-maturity portfolio. While the size of our unrealized mark-to-market losses on available-for-
sale securities had been reduced to $1.4 billion as of December 31, 2023, if interest rates were to again rise rapidly or for a
prolonged period, we may accumulate significant additional mark-to-market losses on investment securities in our available-for-sale
portfolio, which may adversely affect our tangible capital and impact our ability to return capital to our stockholders.
For a discussion of the Corporation’s interest rate sensitivity, please refer to the “Risk Management” section of the MD&A
in this Form 10-K.
BUSINESS RISKS
Negative changes in the financial condition of our clients have adversely impacted us in the past and may adversely
impact us in the future.
do not repay their loans, leases, credit cards or other credit obligations. The performance of these credit portfolios significantly
affects our financial condition and results of operations. We have in the past been adversely affected by negative changes in the
financial condition of our clients due to weakness in the Puerto Rico and U.S. economy. If the current economic environment were to
26
deteriorate, more customers may have difficulty in repaying their credit obligations, which may result in higher levels of credit losses
and reserves for credit losses.
We are exposed to increased credit risks and credit losses to the extent our clients are concentrated by industry segment
or type of client.
Our credit risk and credit losses can increase to the extent our loans are concentrated in borrowers engaged in the same
or similar activities or in borrowers who as a group may be uniquely or disproportionately affected by certain economic or market
conditions. We have significant exposure to borrowers in certain economic sectors, such as residential and commercial real estate,
hospitality and healthcare. Challenging economic or market conditions that affect the industries or types of clients to which we have
significant exposure could result in higher credit losses and adversely affect our financial condition and results of operations.
We also have direct lending and investment exposure to Puerto Rico government entities, which have faced significant
fiscal challenges. At December 31, 2023, our exposure to the Puerto Rico government consisted of $362 million in direct lending
exposure to Puerto Rico municipalities and $238 million in loans insured or securities issued by Puerto Rico governmental entities
but for which the principal source of repayment is non-governmental. We also have indirect lending exposure to the Puerto Rico
government in the form of loans to private borrowers who are service providers, lessors, suppliers or have other relationships with
the Puerto Rico government. While the overall fiscal situation of the Puerto Rico government has improved in recent years, including
as result of the government and certain of its instrumentalities having restructured their debt obligations, some Puerto Rico
government entities, including certain municipalities, still face significant fiscal challenges. A deterioration in the fiscal situation of the
Puerto Rico government and its instrumentalities, and in particular in the fiscal situation of the Puerto Rico municipalities to which
we have direct lending exposure, could result in higher credit losses and reserves for credit losses. For a discussion of risks related
to the Corporation’s credit exposure to the Puerto Rico and USVI governments, see the Geographic and Government Risk section in
the MD&A section of this Form 10-K.
Deterioration in the values of real properties securing our commercial, mortgage loan and construction portfolios have in
the past resulted, and may in the future result, in increased credit losses and harm our results of operations.
As of December 31, 2023, approximately 55% of our loan portfolio consisted of loans secured by real estate collateral
(comprised of 30% in commercial loans, 22% in residential mortgage loans and 3% in construction loans). The value of the collateral
securing such loans is dependent upon economic conditions in the area in which the collateral is located. Weakness in the economy
of some of the markets we serve has in the past resulted in significant declines in the value of the real properties securing our loan
portfolio, leading to increased credit losses. If the value of the real estate properties securing our loan portfolio declines again in the
future, we may be required to increase our provisions for loan losses and allowance for loan losses. Any such increase could have
an adverse effect on our financial condition and results of operations. For more information on the credit quality of our construction,
commercial and mortgage portfolio, see the Credit Risk section of the MD&A included in this Form 10-K.
We are exposed to credit risk from mortgage loans that have been sold or are being serviced subject to recourse
arrangements.
Popular is generally at risk for mortgage loan defaults from the time it funds a loan until the time the loan is sold or
securitized into a mortgage-backed security. However, we have retained part of the credit risk on sales of mortgage loans through
recourse arrangements, and we also service certain mortgage loan portfolios with recourse. At December 31, 2023, we were
exposed to credit risk with respect to $0.6 billion in residential mortgage loans sold or serviced subject to credit recourse provisions,
consisting principally of loans associated with the Fannie Mae and Freddie Mac programs. Pursuant to such recourse provisions, we
are required to repurchase the loan or reimburse the third-party investor for the incurred loss in the event of a customer default. The
maximum potential amount of future payments that we would be required to make under the recourse arrangements in the event of
nonperformance by the borrowers is equivalent to the total outstanding balance of the residential mortgage loans serviced with
recourse and interest, if applicable. In the event of nonperformance by the borrower, we have rights to the underlying collateral
securing the mortgage loan. During 2023, we repurchased approximately $2 million in mortgage loans subject to credit recourse
provisions. As of December 31, 2023, our liability established to cover the estimated credit loss exposure related to loans sold or
serviced with credit recourse amounted to $4 million. We may suffer losses on these loans if the proceeds from a foreclosure sale of
the property underlying a defaulted mortgage loan are less than the outstanding principal balance of the loan plus any uncollected
interest advanced and the costs of holding and disposing of the related property.
Defective and repurchased loans may harm our business and financial condition.
27
In connection with the sale and securitization of mortgage loans, we are required to make a variety of customary
representations and warranties regarding Popular and the loans being sold or securitized. Our obligations with respect to these
representations and warranties are generally outstanding for the life of the loan, and they relate to, among other things, compliance
with laws and regulations, underwriting standards, the accuracy of information in the loan documents and loan file and the
characteristics and enforceability of the loan. A loan that does not comply with the secondary market’s requirements may take
longer to sell, impact our ability to securitize the loans or pledge the loans as collateral for borrowings, or be unsalable or salable
only at a significant discount. Moreover, if any such loan is sold before we detect non-compliance, we may be obligated to
repurchase the loan and bear any associated loss directly, or we may be obligated to indemnify the purchaser against any loss. We
seek to minimize repurchases and losses from defective loans by correcting flaws, if possible, and selling or re-selling such loans.
However, if we were to suffer significant losses from defective and repurchased loans, our results of operations and financial
condition could be materially impacted.
If we are unable to maintain or grow our deposits, we may be subject to paying higher funding costs and our net interest
income may decrease.
of our business. Therefore, our funding costs are largely dependent on our ability to maintain and grow our deposits. As our
competitors have raised the interest rates they pay on deposits, our funding costs have increased, as we have needed to increase
the rates we pay to our depositors to avoid losing deposits and to procure new ones. Rising interest rates have also led customers
to move their funds to alternative investments that pay higher interest rates. Additionally, periods of market stress or lack of market
or customer confidence in financial institutions may result in a loss of customer deposits, especially to the extent those deposits are
in excess of the FDIC-insured limit of $250,000. As of December 31, 2023, we had $14.6 billion of deposits (other than collateralized
public funds, which represent public deposit balances from governmental entities in the U.S. and its territories, including Puerto Rico
and the United States Virgin Islands, that are collateralized based on such jurisdictions’ applicable collateral requirements) in excess
of the FDIC-insured limit. As deposits decrease, we may need to rely on more expensive sources of funding. Furthermore, we have
a significant amount of deposits from the Puerto Rico government, its instrumentalities and municipalities ($18.1 billion, or
approximately 28% of our total deposits, as of December 31, 2023), and the amount of these deposits may fluctuate depending on
the financial condition and liquidity of these entities, as well as on our ability to maintain these customer relationships. Under the
terms of BPPR’s deposit pricing agreement with Puerto Rico public sector, public fund deposit rates are market linked with a lag
minus a specified spread. Therefore, as market rates rise, we are required to sequentially increase the rates we pay our public
deposits. If we are unable to maintain or grow our deposits for any reason, we may be subject to paying higher funding costs and
our net interest income may decrease.
OPERATIONAL RISKS
We and our third-party providers have been, and expect in the future to continue to be, subject to cyber-attacks, which
could cause substantial harm and have an adverse effect on our business and results of operations.
Cybersecurity risks for large financial institutions such as Popular have increased significantly in recent years in part
because of the proliferation of new technologies, such as mobile banking, artificial intelligence and the ability to conduct instant
financial transactions anywhere globally, growing geo-political threats, such as the ongoing wars in Ukraine and in the Gaza Strip,
and the increased sophistication and activities of organized crime, hackers, terrorists, nation-states, hacktivists and other parties. In
the ordinary course of business, we rely on electronic communications and information systems to conduct our operations and to
transmit and store sensitive data. We employ a layered defensive approach that employs people, processes and technology to
manage and maintain cybersecurity controls through a variety of preventative and detective tools that monitor, block, and provide
alerts regarding suspicious activity and identify suspected advanced persistent threats. Notwithstanding our defensive measures
and the significant resources we devote to protect the security of our systems, there is no assurance that all of our security
measures will be effective at all times, especially as the threats from cyber-attacks are continuous and severe. The risk of a security
breach due to a cyber-attack could increase in the future as we continue to expand our mobile banking and other internet-based
product offerings, the use of the cloud for system development and hosting and internal use of internet-based products and
applications.
We continue to detect and identify attacks that are becoming more sophisticated and increasing in volume, as well as
attackers that respond rapidly to changes in defensive countermeasures. The most significant cyber-attack risks that we or our
critical service providers may face include, but are not limited to, e-fraud, denial-of-service (DDoS), ransomware, computer intrusion
and the exploitation of software zero-day vulnerabilities that might result in disruption of services and in the exposure or loss of
customer or proprietary data. Loss from e-fraud occurs when cybercriminals compromise our systems or the systems of our
28
customers and extract funds from customer’s credit cards or bank accounts, including through brute force, password spraying and
credential stuffing attacks directed at gaining unauthorized access to individual accounts. Denial-of-service attacks intentionally
disrupt the ability of legitimate users, including customers and employees, to access networks, websites and online resources.
Computer intrusion attempts either direct or through social engineering (pretext calls), supply chain compromise, email, text or voice
messages, including using brand impersonation (regularly referred to as phishing, vishing, smishing and quishing), have resulted in
and may continue to result in the compromise of sensitive customer data, such as account numbers, credit cards and social security
numbers, and could present significant reputational, legal and regulatory costs to Popular if successful. The emergence of new
technologies such as artificial intelligence and quantum computing are further expected to exacerbate the risk of cyber-attacks.
Our customer-facing platforms are also routinely attacked by threat actors aiming to gain unauthorized access to our
clients’ accounts. Popular has recently implemented certain defensive measures in response to brute force attacks on one of our
platforms which resulted in certain of our customers log-in credentials and information being exposed. As a result, Popular notified,
as required or otherwise deemed appropriate, customers identified as affected by the incident. We have to date not experienced
material losses in connection with these attacks. Cyber-security risks have also been recently exacerbated by the discovery of zero-
day vulnerabilities in widely distributed third party software, such as the vulnerability identified in the Apache log4j in December 2021
and in the MOVEit file transfer application in May 2023, which could affect Popular’s or any of its service provider’s systems.
The increased use of remote access and third-party video conferencing solutions to enable work-from-home
arrangements for employees and facilitate the use of digital channels by our customers, has also increased our exposure to cyber-
attacks. In addition, a third party could misappropriate confidential information obtained by intercepting signals or communications
from mobile devices used by Popular’s customers or employees. Recent events, including the wars in Ukraine and the Gaza Strip,
have also illustrated increased geo-political factors and the risks related to supply-chain compromises and de-stabilizing activities
linked to nation-state sponsored activity as an increasing trend to monitor actively. Risks and exposures related to cyber security
attacks are expected to remain high for the foreseeable future due to the rapidly evolving nature and sophistication of these threats,
including the rise in the use of cyber-attacks as geopolitical weapons. Although we are regularly targeted by unauthorized threat-
actor activity, including denial-of-service attacks, we have not, to date, experienced any material losses as a result of cyber-attacks.
A material compromise or circumvention of the security of our systems could have serious negative consequences for us,
including significant disruption of our operations and those of our clients, customers and counterparties, misappropriation of
confidential information of us or that of our clients, customers, counterparties or employees, or damage to computers or systems
used by us or by our clients, customers and counterparties, and could result in violations of applicable privacy and other laws,
financial loss to us or to our customers, loss of confidence in our security measures, customer dissatisfaction, significant litigation
exposure and harm to our reputation, all of which could have a material adverse effect on us. For example, if personal, non-public,
confidential or proprietary information in our possession were to be mishandled, misused or stolen, we could suffer significant
regulatory consequences, reputational damage and financial loss. Such mishandling, misuse or misappropriation could include, for
example, if such information were provided to parties who are not permitted to have the information, either by fault of our systems,
by our employees or counterparties, or where such information is intercepted or otherwise inappropriately taken by our employees
or third parties.
The extent of a particular cyber-attack and the steps that we may need to take to investigate the attack may not be
immediately clear, and it may take a significant amount of time before such an investigation can be completed. While such an
investigation is ongoing, Popular may not necessarily know the full extent of the harm caused by the cyber-attack, and that damage
may continue to spread. These factors may inhibit our ability to provide rapid, full and reliable information about the cyber-attack to
our clients, customers, counterparties and regulators, as well as the public. Moreover, new regulations may require us to disclose
information about a cybersecurity event before it has been resolved or fully investigated. Furthermore, it may not be clear how best
to contain and remediate the potential harm caused by the cyber-attack, and certain errors or actions could be repeated or
compounded before they are discovered and remediated. Cyber-attacks could cause interruptions in our operations and result in the
incurrence of significant costs, including those related to forensic analysis and legal counsel, each of which may be required to
ascertain the extent of any potential harm to our customers, or employees, or damage to our information systems and any legal or
regulatory obligations that may result therefrom. Any cyber incidents could also result in, among other things, increased regulatory
scrutiny and adverse regulatory or civil litigation consequences. For a discussion of the guidance and rules that federal banking
regulators have released or proposed regarding cybersecurity and cyber risk management standards, see “Regulation and
Supervision” in Part I, Item 1 — Business, included in the Form 10-K for the year ended December 31, 2023. Any or all of the
foregoing factors could further increase the impact of the incident and thereby the costs and consequences of a cyber-attack.
We also rely on third parties for the performance of a significant portion of our information technology functions and the
29
provision of information security, technology and business process services. As a result, a successful compromise or circumvention
of the security of the systems of these third-party service providers could have serious negative consequences for us, including
compromise of our systems, misappropriation of our confidential information or that of our clients, customers, counterparties or
employees, or other negative implications identified above with respect to a cyber-attack on our systems, which could have a
material adverse effect on us. Cyber-attacks at third-party service providers are also becoming increasingly common, and, as a
result, cybersecurity risks relating to our vendors have increased. The most important of these third-party service providers for us is
Evertec. Certain risks particular to Evertec and our dependence on third parties are discussed under “We rely on other companies to
provide key components of our business infrastructure, including certain of our core financial transaction processing and information
technology and security services, which exposes us to a number of operational risks that could have a material adverse effect on
us” in the Operational Risks section of Item 1A in this Form 10-K. During 2021, we determined that, as a result of the widely
reported breach of Accellion, Inc.’s File Transfer Appliance tool, which was being used at the time of such breach by a U.S.-based
third-party advisory services vendor of Popular, personal information of certain Popular customers was compromised. During 2023,
personal information of Popular customer data was compromised in a data breach incident that impacted MOVEit, the third-party file
transfer platform used by one of our services providers. In both instances, Popular notified, as required or otherwise deemed
appropriate, customers identified as affected by the incident. Although these incidents did not have a material effect on Popular or
its financial condition, our networks and systems were not impacted, and our third-party service providers agreed to cover external
remediation costs associated therewith, a compromise of the personal information of our customers maintained by third party
vendors could result in significant regulatory consequences, reputational damage and financial loss to us.The success of our
business depends in part on the continuing ability of these (and other) third parties to perform these functions and services in a
timely and satisfactory manner, which performance could be disrupted or otherwise adversely affected due to failures or other
information security events originating at the third parties or at the third parties’ suppliers or vendors (so-called “fourth party risk”).
We may not be able to effectively directly monitor or mitigate fourth-party risk, in particular as it relates to the use of common
suppliers or vendors by the third parties that perform functions and services for us.
As cyber threats continue to evolve, we expect to expend significant additional resources to continue to modify or
enhance our layers of defense or to investigate and remediate additional information security vulnerabilities or incidents. System
enhancements and updates also create risks associated with implementing new systems and integrating them with existing ones,
including risks associated with supply chain compromises and the software development lifecycle of the systems used by us and our
service providers. Due to the complexity and interconnectedness of information technology systems, the process of enhancing our
layers of defense can itself create a risk of systems disruptions and security issues. In addition, addressing certain information
security vulnerabilities, such as hardware-based vulnerabilities, may affect the performance of our information technology systems.
The ability of our hardware and software providers to deliver patches and updates to mitigate vulnerabilities in a timely manner can
introduce additional risks, particularly when a vulnerability is being actively exploited by threat actors. Moreover, our efforts to timely
mitigate vulnerabilities and manage such risks, given the rise in number and urgency of required patches and third-party software,
including “zero-day vulnerabilities”, as well as the obsolescence in some of our hardware and software, may impact our day-to-day
operations, the availability of our systems and delay the deployment of technology enhancements and innovation. The
obsolescence in any of our hardware or software may limit our ability to mitigate vulnerabilities.
If Popular’s operational systems, or those of external parties on which Popular’s businesses depend, are unable to meet
the requirements of our businesses and operations or bank regulatory standards, or if they fail, have other significant shortcomings
or are impacted by cyber-attacks, Popular could be materially and adversely affected.
Unforeseen or catastrophic events, including extreme weather events and other natural disasters, man-made disasters,
acts of violence or war, or the emergence of pandemics or epidemics, could cause a disruption in our operations or other
consequences that could have a material adverse effect on our financial condition and results of operations.
A
significant portion of our operations are located in the Caribbean and Florida, a region susceptible to hurricanes,
earthquakes and other similar events. In 2017, Puerto Rico, USVI and BVI were severely impacted by Hurricanes Irma and María,
which resulted in significant disruption to our operations and adversely affected our clients in these markets, and in 2022, Hurricane
Fiona impacted the southwest area of Puerto Rico, adversely affecting our customers in that region. Other types of unforeseen or
catastrophic events, including pandemics, epidemics, man-made disasters, or acts of violence or war, or the fear that such events
could occur, could also adversely impact our operations and financial results. For example, in 2020, the COVID-19 pandemic
severely impacted global health, financial markets, consumer spending and global economic conditions, and caused significant
disruption to businesses worldwide, including our business and those of our customers, service providers and suppliers. Future
unforeseen or catastrophic events, including new pandemic events, and actions taken by governmental authorities and other third
parties in response to such events, could again adversely affect our operations, cause economic and market disruption, adversely
30
impact the ability of borrowers to timely repay their loans, or affect the value of any collateral held by us, any of which could have a
material adverse effect on our business, financial condition or results of operations. The frequency, severity and impact of future
unforeseen or catastrophic events is difficult to predict. While we maintain insurance against natural disasters and other unforeseen
events, including coverage for business interruption, the insurance may not be sufficient to cover all of the damage from any such
event, and there is no insurance against the disruption that a catastrophic event could produce to the markets that we serve and the
potential negative impact to economic activity.
Climate change could have a material adverse impact on our business operations and that of our clients and customers.
Our business and the activities and operations of our clients and customers may be disrupted by global climate change.
Potential physical risks from climate change include the increase in the frequency and severity of weather events, such as storms
and hurricanes, and long-term shifts in climate patterns, such as sustained higher and lower temperatures, sea level rise, heat
waves and droughts, among others. Our geographic concentration in localities, including Puerto Rico, the U.S.V.I., B.V.I. and
Florida, particularly susceptible to risks arising from climate change, including severe hurricanes and sea level rise, heighten the
threat we face from climate change. Additionally, the impact of climate change in the markets that we operate and in other global
markets may have the effect of increasing the costs or reducing the availability of insurance needed for our business operations.
Climate change may also create transitional risks resulting from a shift to a low-carbon economy. These transition risks may include
changes in the legal and regulatory landscape, technology, consumer sentiment and preferences, and market demands that seek to
mitigate the effects of climate change. Changes in the legal and regulatory landscape may additionally increase our compliance
costs. These climate-driven changes could have a material adverse impact on asset values and on our business and financial
performance and those of our clients and customers.
We rely on other companies to provide key components of our business infrastructure, including certain of our core
financial transaction processing and information technology and security services, which exposes us to a number of
operational risks that could have a material adverse effect on us.
Third parties provide key components of our business operations, such as data processing, information security, recording
and monitoring transactions, online banking interfaces and services, Internet connections and network access. The most important
of these third-party service providers for us is Evertec. Although the Evertec Business Acquisition Transaction narrowed the scope
of services which we are dependent on Evertec to obtain and released us from exclusivity restrictions that limited our ability to
engage other third-party providers of financial technology services, we are still dependent on Evertec for the provision of essential
services to our business, including certain of our core financial transaction processing and information technology and security
services. As a result, we are particularly exposed to the operational risks of Evertec, including those relating to a breakdown or
failure of Evertec’s systems or internal controls environment. Over the course of our relationship with Evertec, we have experienced
interruptions and delays in key services provided by Evertec, as well as cyber events, as a result of system breakdowns,
misconfigurations, human error, application obsolescence and dependency on shared infrastructure components, which have in
certain cases also led to exposure of BPPR customer information. Our ability to cure legacy obsolescence in the hardware and
software we procure from Evertec, as well as to effect the segregation of our shared infrastructure, is expected to be lengthy and
complex, which exacerbates our exposure to resulting operational, including cybersecurity, risks. See “The transition to new
financial services technology providers, and the replacement of services currently provided to us by Evertec, will be lengthy and
complex” in the Operational Risks section of Item 1A in this Form 10-K below.
While we select third-party vendors carefully and have increased our oversight of these relationships, we do not control
the actions of our vendors. Any problems caused by these vendors, including those resulting from disruptions in the services
provided, vulnerabilities in or breaches of the vendor’s systems, failure of the vendor to handle current or higher volumes, failure of
the vendor to provide services for any reason or poor performance of services, or failure of the vendor to notify us of a reportable
event in a timely manner, could adversely affect our ability to deliver products and services to our customers and otherwise conduct
our business, result in potential liability to clients and customers, result in the imposition of fines, penalties or judgments by our
regulators, lead to exposure of BPPR customer information or harm to our reputation, any of which could materially and adversely
affect us. The inability of our third-party service providers to timely address evolving cybersecurity threats may further exacerbate
these risks. Financial or operational difficulties of a third-party vendor could also hurt our operations if those difficulties interfere with
the vendor’s ability to serve us. Replacing these third-party vendors, when possible, could also create significant delay and expense.
Accordingly, the use of third parties creates an unavoidable inherent risk to our business operations.
The transition to new financial services technology providers, and the replacement of services currently provided to us by
Evertec, will be lengthy and complex.
31
Switching from one vendor of core bank processing and related technology and security services to one or more new
vendors is a complex process that carries business and financial risks. The implementation cycle for such a transition can be
lengthy and require significant financial and management resources from us. Such a transition can also expose us, and our clients,
to increased costs (including conversion costs), business disruption, as well as operational and cybersecurity risks. Upon the
transition of all or a portion of existing services provided by Evertec to a new financial services technology provider, either (i) at the
end of the term of the Second Amended and Restated Master Services Agreement (the “MSA”) and related agreements or (ii) earlier
upon the termination of any service for convenience under the MSA, these transition risks could result in an adverse effect on our
business, financial condition and results of operations. Although Evertec has agreed to provide certain transition assistance to us in
connection with the termination of the MSA, we are ultimately dependent on their ability to provide those services in a responsive
and competent manner. Furthermore, we may require transition assistance from Evertec beyond the term of the MSA, delaying and
lengthening any transition process away from Evertec while increasing related costs.
during the term of the MSA the right to terminate certain services for convenience and to transition such services to other service
providers prior to the expiration of the MSA, subject to complying with the revenue minimums contemplated in the MSA and certain
other conditions. In practice, in order to switch to a new provider for a particular service, we will have to commence procuring and
working on a transition process for such service significantly in advance of its termination and, in any case, much earlier than the
automatic renewal notice date or the expiration date of the MSA, and such process may extend beyond the current term of the MSA.
Furthermore, if we are unsuccessful or decide not to complete the transition after expending significant funds and management
resources, it could also result in an adverse effect on our business, financial condition and results of operations.
LEGAL AND REGULATORY RISKS
Our businesses are highly regulated, and the laws and regulations that apply to us have a significant impact on our
business and operations.
We are subject to extensive and evolving regulation under U.S. federal, state and Puerto Rico laws that govern almost all
aspects of our operations and limit the businesses in which we may be engaged, including regulation, supervision and examination
by federal, state and foreign banking authorities. These laws and regulations have expanded significantly over an extended period
of time and are primarily intended for the protection of consumers, borrowers and depositors. Compliance with these laws and
regulations has resulted, and will continue to result, in significant costs.
Additional laws and regulations may be enacted or adopted in the future that could significantly affect our powers,
authority and operations and which could have a material adverse effect on our financial condition and results of operations. In
particular, we could be adversely impacted by changes in laws and regulations, or changes in the application, interpretation or
enforcement of laws and regulations, that proscribe or institute more stringent restrictions on certain financial services activities or
impose new requirements relating to the impact of business activities on ESG concerns, the management of risks associated with
those concerns and the offering of products intended to achieve ESG-related objectives. In addition, new laws or regulations could
require significant system and process changes that require systems upgrades and could limit our ability to meet adoption
timeframes or pursue our innovation roadmap. If we do not appropriately comply with current or future laws or regulations, we may
be subject to fines, penalties or judgements, or to material regulatory restrictions on our business, which could also materially and
adversely affect our financial condition and results of operations.
In 2023, the federal banking regulators proposed revisions to the U.S. capital rules and new long-term debt requirements
for banking organizations with $100 billion or more in assets. If finalized as proposed, the revisions to the capital rules and the new
long-term debt requirements are expected to generally increase capital requirements and expenses, including interest and
noninterest expense, for large banking organizations. In addition, during 2023, the federal banking regulators indicated that they are
considering revisions to liquidity requirements applicable to banking organizations with $100 billion or more in light of the failures of
three large banks in March and May 2023. Any such revisions could require large banks to change the size and composition of their
liquidity portfolios, which could have adverse effects on net interest income and net interest margin.
The pending and anticipated proposals reflect a trend of increasingly stringent regulatory requirements for banking
organizations with assets of $100 billion or more, relative to smaller banking organizations, as well as less differentiation in the
requirements applicable among banking organizations with $100 billion or more in assets. Although Popular currently has less than
$100 billion in assets, actual, anticipated or potential changes in regulatory requirements for banking organizations with at least
$100 billion in assets could result in Popular deciding not to pursue growth opportunities that would result in its assets approaching
or exceeding that threshold, or if Popular’s assets do exceed that threshold, a need for Popular to increase its regulatory capital,
32
issue substantial amounts of long-term debt or incur other significant expenses in order to satisfy applicable regulatory
requirements.
Our participation (or lack of participation) in certain governmental programs, such as the Paycheck Protection Program
(“PPP”) enacted in response to the COVID-19 pandemic, also exposes us to increased legal and regulatory risks. We have also
been and could continue to be exposed to adverse action for the violation of applicable legal requirements or the improper conduct
of our employees in connection with such loans. For example, on January 24, 2023, Popular Bank consented to the imposition of an
order from the Federal Reserve Board requiring it to pay a $2.3 million civil money penalty to settle certain findings arising from
Popular Bank’s approval of six Payment Protection Program loans.
We are from time to time subject to information requests, investigations and other regulatory enforcement proceedings
from departments and agencies of the U.S. and Puerto Rico governments, including those that investigate compliance with
U.S. sanctions and consumer protection laws and regulations, which may expose us to significant penalties and collateral
consequences, and could result in higher compliance costs or restrictions on our operations.
We from time-to-time self-report compliance matters to, or receive requests for information from, departments and
agencies of the U.S. and Puerto Rico governments, including with respect to compliance with consumer protection laws and
regulations. For example, BPPR has in the past received requests for information, such as subpoenas and civil investigative
demands from U.S. government regulators, including concerning add-ons on consumer products, real estate appraisals and
residential and construction loans in Puerto Rico. BPPR has also self-identified and reported to applicable regulators compliance
matters related to U.S. sanctions, as well as mortgage, credit reporting and other consumer lending practices.
Incidents of this nature and investigations or examinations by governmental authorities have resulted in the past, and may
in the future result, in judgments, settlements, fines, enforcement actions, penalties or other sanctions adverse to the Corporation,
which could materially and adversely affect the Corporation’s business, financial condition or results of operations, or cause serious
reputational harm. Any such settlements or orders that we enter into, or that regulatory authorities impose on us could require
enhancements to our procedures and controls and entail significant operational and compliance costs. Furthermore, issues or
delays in satisfying the requirements of a regulatory settlement or action on a timely basis could result in additional penalties and
enforcement actions, which could be significant. In connection with the resolution of regulatory proceedings, enforcement authorities
may seek admissions of wrongdoing and, in some cases, criminal pleas, which could lead to increased exposure to private litigation,
loss of clients or customers, and restrictions on offering certain products or services. In addition, responding to information-gathering
requests, investigations and other regulatory proceedings, regardless of the ultimate outcome of the matter, could be time-
consuming, expensive and divert management attention from our business.
Financial services institutions such as Popular have been subject to heightened expectations and regulatory scrutiny in
recent years. Our regulators’ oversight is not limited to banking and financial services laws but extends to other significant laws
such as those related to anti money laundering, anti-bribery and anti-corruption laws. Further, regulators in the performance of their
supervisory and enforcement duties, have significant discretion and power to prevent or remedy what they deem to be unsafe and
unsound practices or violations of laws by banks and bank holding companies. Therefore, the outcome of any investigative or
enforcement action, which may take years and be material to Popular, may be difficult to predict or estimate.
Complying with economic and trade sanctions programs and anti-money laundering laws and regulations can increase our
operational and compliance costs and risks. If we, and our subsidiaries, affiliates or third-party service providers, are
found to have failed to comply with applicable economic and trade sanctions programs and anti-money laundering laws
and regulations, we could be exposed to fines, sanctions and penalties, and other regulatory actions, as well as
governmental investigations.
As a federally regulated financial institution, we must comply with regulations and economic and trade sanctions and
embargo programs administered by the Office of Foreign Assets Control (“OFAC”) of the U.S. Treasury, as well as anti-money
laundering laws and regulations, including those under the Bank Secrecy Act.
Economic and trade sanctions regulations and programs administered by OFAC prohibit U.S.-based entities from entering
into or facilitating unlicensed transactions with, for the benefit of, or in some cases involving the property and property interests of,
persons, governments or countries designated by the U.S. government under one or more sanctions regimes, and also prohibit
transactions that provide a benefit that is received in a country designated under one or more sanctions regimes. We are also
subject to a variety of reporting and other requirements under the Bank Secrecy Act, including the requirement to file suspicious
activity and currency transaction reports, that are designed to assist in the detection and prevention of money laundering, terrorist
financing and other criminal activities. In addition, as a financial institution we are required to, among other things, identify our
33
customers, adopt formal and comprehensive anti-money laundering programs, scrutinize or altogether prohibit certain transactions
of special concern, and be prepared to respond to inquiries from U.S. law enforcement agencies concerning our customers and their
transactions. Failure by the Corporation, its subsidiaries, affiliates or third-party service providers to comply with these laws and
regulations could have serious legal and reputational consequences for the Corporation, including the possibility of regulatory
enforcement or other legal action, including significant civil and criminal penalties. We also incur higher costs and face greater
compliance risks in structuring and operating our businesses to comply with these requirements. The markets in which we operate
heighten these costs and risks.
We have established risk-based policies and procedures and employed software designed to assist us and our personnel
in complying with these applicable laws and regulations. Even if the appropriate controls are in place, there can be no assurance
that our policies and procedures will prevent us from blocking and rejecting all applicable transactions of our customers or our
customers’ customers that may involve a sanctioned person, government or country. Any failure to detect and prevent any such
transaction could result in a violation of applicable laws and regulations and adversely affect our reputation, business, financial
condition and results of operations.
From time to time we have identified and voluntarily self-disclosed to OFAC transactions that were not timely identified,
blocked or rejected by our policies, controls and procedures for screening transactions that might violate the regulations and
economic and trade sanctions programs administered by OFAC. For example, during the second quarter of 2022, BPPR entered
into a settlement agreement with OFAC with respect to certain transactions processed on behalf of two employees of the
Government of Venezuela, in apparent violation of U.S. sanctions against Venezuela. Popular agreed to pay approximately
$256,000 to settle the apparent violations, which had been self-disclosed to OFAC. There can be no assurances that any failure to
comply with U.S. sanctions and embargoes, or with anti-money laundering laws and regulations, will not result in material fines,
sanctions or other penalties being imposed on us.
Furthermore, if the policies, controls, and procedures of one of the Corporation’s third-party service providers, together
with our third-party oversight of such providers, do not prevent it from violating applicable laws and regulations in transactions in
which it engages, such violations could adversely affect its ability to provide services to us.
We are subject to regulatory capital adequacy requirements, and if we fail to meet these requirements our business and
financial condition will be adversely affected.
Under regulatory capital adequacy requirements, and other regulatory requirements, Popular and our banking subsidiaries
must meet requirements that include quantitative measures of assets, liabilities and certain off-balance sheet items, subject to
qualitative judgments by regulators regarding components, risk weightings and other factors. If we fail to meet these minimum
capital requirements and other regulatory requirements, our business and financial condition will be materially and adversely
affected. If a financial holding company fails to maintain well-capitalized status under the regulatory framework, or is deemed not
well managed under regulatory exam procedures, or if it experiences certain regulatory violations, its status as a financial holding
company and its related eligibility for a streamlined review process for acquisition proposals, and its ability to offer certain financial
products, may be compromised and its financial condition and results of operations could be adversely affected. The failure of any
depository institution subsidiary of a financial holding company to maintain well-capitalized or well-managed status could have
similar consequences.
In addition, federal regulators have proposed revisions to increase capital requirements for banking organizations with
$100 billion or more in assets. If adopted, such standards may in the future affect us. See “Our businesses are highly regulated, and
the laws and regulations that apply to us have a significant impact on our business and operations” in the Legal and Regulatory
Risks section of Item 1A in this Form 10-K.
Increases in FDIC insurance premiums may have a material adverse effect on our earnings.
Substantially all the deposits of BPPR and PB are subject to insurance up to applicable limits by the FDIC’s deposit
insurance fund (“DIF”) and, as a result, BPPR and PB are subject to FDIC deposit insurance assessments. On October 18, 2022,
the FDIC finalized a rule that increased initial base deposit insurance assessment rates by 2 basis points, beginning with the first
quarterly assessment period of 2023. In addition, in November 2023, the FDIC finalized a rule that imposes a special assessment to
recover the costs to the DIF resulting from the FDIC’s use, in March 2023, of the systemic risk exception to the least-cost resolution
test under the FDIA in connection with the receiverships of Silicon Valley Bank and Signature Bank. The exact amount of this
assessment will be determined when the FDIC terminates the related receiverships considered in the final rule. Accordingly, the final
special assessment amount and collection period may change as the estimated cost is periodically adjusted or if the total amount
collected varies.
34
We are generally unable to control the amount of premiums or additional assessments that we are required to pay for
FDIC insurance. If there are additional bank or financial institution failures, our level of non-performing assets increases, or our risk
profile changes or our capital position is impaired, we may be required to pay even higher FDIC premiums. Any future additional
increases in FDIC premiums, assessment rates or special assessments may materially adversely affect our results of operations.
See the “Supervision and Regulation—FDIC Insurance” discussion in Item 1. Business of this Form 10-K for additional information
related to the FDIC’s deposit insurance assessments applicable to BPPR and PB.
The resolution of pending litigation and regulatory proceedings, if unfavorable, could have material adverse financial
effects or cause significant reputational harm to us, which, in turn, could seriously harm our business prospects.
We face legal risks in our businesses, and the volume of claims and amount of damages and penalties claimed in
litigation and regulatory proceedings against financial institutions remains high. Substantial legal liability or significant regulatory
action against us could have material adverse financial effects or cause significant reputational harm to us, which in turn could
seriously harm our business prospects. For further information relating to our legal risk, see Note 24 - “Commitments &
Contingencies”, to the Consolidated Financial Statements in this Form 10-K.
LIQUIDITY RISKS
We are subject to liquidity risks arising from market events or disruptions and instances of low investor and depositor
confidence. Furthermore, actions by the rating agencies or decreases in our capital levels may have adverse effects on our
liquidity and business, including by raising the cost of our obligations or affecting our ability to borrow.
We must maintain adequate liquidity and funding sources to support our operations, fund customer deposit withdrawals,
repay borrowings and debt, comply with our financial obligations, fund planned capital distributions and meet regulatory
requirements. The Corporation’s most significant source of funds are bank deposits, including customer deposits and brokered
deposits. In addition to deposits, sources of liquidity include secured borrowing arrangements, such as those with the Federal
Reserve Bank of New York and the Federal Home Loan Bank of New York (“FHLBNY”), unpledged securities from our investment
portfolio, the capital markets and proceeds from loan sales or securitizations.
Popular’s liquidity and ability to fund and operate its business could be materially adversely affected by a variety of
conditions and factors, some of which are out of Popular’s control. For example, market events or disruptions, such as periods of
market stress and low investor confidence in financial institutions could result in deposit withdrawals, especially to the extent those
deposits are in excess of the FDIC-insured limit of $250,000. As of December 31, 2023, we had $14.6 billion of deposits (other than
collateralized public funds, which represent public deposit balances from governmental entities in the U.S. and its territories,
including Puerto Rico and the United States Virgin Islands, that are collateralized based on such jurisdictions’ applicable collateral
requirements) in excess of the FDIC-insured limit. We may also suffer outflows of customer deposits due to competition from other
banks or alternative investments. In addition, in periods of stress, we may not be able to access existing funding sources, access
the capital markets or to sell or securitize loans or other assets, or to access such sources or to sell or securitize assets on favorable
terms.
In addition, actions by the rating agencies could raise the cost of our borrowings, since lower rated securities are usually
required by the market to pay higher rates than obligations of higher credit quality. Our credit ratings were reduced substantially in
2009 and, although one of the three major rating agencies upgraded our senior unsecured rating back to “investment grade” during
2021, the remaining two rating agencies have not upgraded their current “non-investment grade” rating. The market for non-
investment grade securities is much smaller and less liquid than for investment grade securities. If we were to attempt to issue
preferred stock or debt securities into the capital markets, it is possible that there would not be sufficient demand to complete a
transaction or that the cost could be substantially higher than for more highly rated securities. If Popular is unable to access the
capital markets on favorable terms, our liquidity may be adversely affected.
Changes in our ratings and capital levels could affect our relationships with some creditors and limit our access to funding.
For example, having negative tangible capital may impact our ability to access some sources of wholesale funding. The Federal
Housing Finance Agency restricts the FHLBNY from lending to members of the FHLBNY with negative tangible capital unless the
member’s primary banking regulator makes a written request to the FHLBNY to maintain access to borrowings. Both BPPR and PB
have secured borrowing facilities with the FHLBNY and had outstanding exposures of $2.5 billion and $1.7 billion respectively as of
December 31, 2023. Losing access to the FHLBNY borrowing facilities could adversely impact liquidity at the banking subsidiaries.
Additionally, if BPPR or PB cease to be well-capitalized, the FDIA and regulations adopted thereunder would restrict their ability to
accept brokered deposits and limit the rate of interest payable on deposits.
35
Our banking subsidiaries also have recourse obligations under certain agreements with third parties, including servicing
and custodial agreements, that include ratings covenants. Upon failure to maintain the required credit ratings, the third parties could
have the right to require us to engage a substitute fund custodian and increase collateral levels securing recourse obligations.
Collateral pledged by us to secure recourse obligations approximated $27.1 million on December 31, 2023. While management
expects that we would be able to meet any additional collateral requirements if and when needed, the requirements to post collateral
under certain agreements or the loss of custodian funds could reduce our liquidity resources and impact our results of operations.
As a holding company, we depend on dividends and distributions from our subsidiaries for liquidity.
As a bank holding company, we depend primarily on dividends from our banking and other operating subsidiaries to fund
our cash needs, including to capitalize our subsidiaries. Our banking subsidiaries, BPPR and PB, are limited by law in their ability to
make dividend payments and other distributions to us based on their earnings, dividend history, and capital position. Based on its
current financial condition, PB may not declare or pay a dividend without the prior approval of the Federal Reserve Board and the
NYSDFS. A failure by our banking subsidiaries to generate sufficient income and free cash flow to make dividend payments to us
may affect our ability to fund our cash needs, which could have a negative impact on our financial condition, liquidity, results of
operation or capital position. Such failure could also affect our ability to pay dividends to our stockholders and to repurchase shares
of our common stock. We have in the past suspended dividend payments on our common stock and preferred stock during times of
economic uncertainty, and there can be no assurance that we will be able to continue to declare dividends to our stockholders in
any future periods.
An impact on the tangible capital levels of our operating subsidiaries, could also limit the amount of capital we may
upstream to the holding company. Tangible capital levels have in the past been, and may in the future be, adversely affected by the
impact of rapidly rising interest rates on investment securities in our available-for-sale portfolio. For a discussion of risks related to
changes in interest rates, see “Changes in interest rates and credit spreads can adversely impact our financial condition, including
our investment portfolio, since a significant portion of our business involves borrowing and lending money, and investing in financial
instruments” in Item 1A of this Form 10-K.
We also depend on dividends from our banking and other operating subsidiaries to pay debt service on outstanding debt
and to repay maturing debt. Our ability to declare such dividends would be subject to regulatory requirements and could require the
prior approval of the Federal Reserve Board.
STRATEGIC RISKS
Potential acquisitions of businesses or loan portfolios could increase some of the risks that we face, and may be delayed
or prohibited due to regulatory constraints.
To the extent permitted by our applicable regulators, we may pursue strategic acquisition opportunities. Acquiring other
businesses, however, involves various risks, including potential exposure to unknown or contingent liabilities of the target company,
exposure to potential asset quality issues of the target company, potential disruption to our business, the possible loss of key
employees and customers of the target company, and difficulty in estimating the value of the target company. If we pay a premium
over book or market value in connection with an acquisition, some dilution of our tangible book value and net income per common
share may occur in connection with any future transaction. Furthermore, failure to realize the expected revenue increases, cost
savings, increases in geographic or product presence, or other projected benefits from an acquisition could have a material adverse
effect on our business, financial condition and results of operations.
Similarly, acquiring loan portfolios involves various risks. When acquiring loan portfolios, management makes
assumptions and judgments about the collectability of the loans, including the creditworthiness of borrowers and the value of the
real estate and other assets serving as collateral for the repayment of secured loans. In estimating the extent of the losses, we
analyze the loan portfolio based on historical loss experience, volume and classification of loans, volume and trends in
delinquencies and nonaccruals, local economic conditions, and other pertinent information. If our assumptions are incorrect,
however, our actual losses could be higher than estimated and increased loss reserves may be required, which would negatively
affect our results of operations.
Finally, certain acquisitions by financial institutions, including us, are subject to approval by a variety of federal and state
regulatory agencies. Regulatory approvals could be delayed, impeded, restrictively conditioned or denied. We may fail to pursue,
evaluate or complete strategic and competitively significant acquisition opportunities as a result of our inability, or perceived or
anticipated inability, to obtain regulatory approvals in a timely manner, under reasonable conditions or at all. Difficulties associated
36
with potential acquisitions that may result from these factors could have a material adverse effect on our business, financial
condition and results of operations.
We have embarked on a broad-based multi-year, technological and business process transformation. The failure to
achieve the goals of the transformation project, the inability to maintain project expenses within current estimates or
delays in executing our plans to implement the transformation project, may materially and adversely affect our business,
financial condition, results of operations, or cause reputational harm.
The Corporation has embarked on a broad-based multi-year, technological and business process transformation. Our
technology and business transformation will be a significant priority for the Corporation over the next two years and beyond. We
expect the expenses tied to this transformation project, which will continue through at least 2025, to result in an enhanced digital
experience for our clients, as well as better technology and more efficient processes for our employees.
To execute the transformation project, we plan to expand our digital capabilities, modernize our technology foundation,
and implement agile and efficient business processes across the entire company. We may not succeed in executing the
transformation project, may fail to properly estimate cost of the same, or may experience delays in executing our plans, which may
in turn cause the Corporation to incur costs exceeding our current estimates or disrupt our operations, including our technological
services to our customers, or fall short of our projected earnings targets driven by these efforts. To the extent that these disruptions
persist over time and/or recur, this could negatively impact our competitive position, require additional expenditures, and/or harm our
relationships with our customers and thus may materially and adversely affect our business, financial condition, results of
operations, or cause reputational harm.
We face significant and increasing competition in the rapidly evolving financial services industry.
including customer service, quality and variety of products and services, price, interest rates on loans and deposits, innovation,
technology, ease of use, reputation, and transaction execution. While our main competition continues to come from other Puerto
Rico banks and financial institutions, we face increased competition from non-Puerto Rico institutions as emerging technologies and
the growth of e-commerce have significantly reduced geographic barriers. These technologies have also made it easier for non-
depositary institutions to offer products and services that traditionally were banking products and allowed non-traditional financial
service providers and technology companies to provide electronic and internet-based financial solutions and services. Increased
competition could create pressure to lower prices, fees, commissions or credit standards on our products and services, which could
adversely affect our financial condition and results of operations. Increased competition could also create pressure to raise interest
rates on deposits, which could also impact our financial condition and results of operations.
If we are unable to meet constant technological changes and react quickly to meet new industry standards, including as a
result of our continued dependence on Evertec, we may be unable to enhance our current services and introduce new
products and services in a timely and cost-effective manner, placing us at a competitive disadvantage and significantly
affecting our business, financial condition and results of operations.
To compete effectively, we need to constantly enhance and modify our products and services and introduce new products
and services to attract and retain clients or to match products and services offered by our competitors, including technology
companies and other nonbank firms that are engaged in providing similar products and services. Although the Evertec Business
Acquisition Transaction eliminated certain provisions of a previous Master Services Agreement with Evertec that required us to use
Evertec exclusively to develop and implement new or enhanced products and services, and is expected to improve Popular’s ability
to manage and control the development of the customer channels supported by the assets acquired as part of the Evertec Business
Acquisition Transaction (the “Acquired Assets”), Popular expects that it will continue to depend on Evertec’s technology services to
operate and control current products and services and to implement future products and services, making our success dependent
on Evertec’s ability to timely complete and introduce these enhancements and new products and services in a cost-effective
manner. Our ability to enhance our customer channels is also dependent on Evertec timely delivering the core application
programming interfaces (“Core APIs”) that meet BPPR’s requirements, which Evertec has committed to develop under the MSA.
The Core APIs are necessary for BPPR to connect future enhancements to the Acquired Assets to existing Evertec core
applications.
Some of our competitors rely on financial services technology and outsourcing companies that are much larger than
Evertec, serve a greater number of clients than Evertec, and may have better technological capabilities and product offerings than
Evertec. Furthermore, financial services technology companies typically make capital investments to develop and modify their
product and service offerings to facilitate their customers’ compliance with the extensive and evolving regulatory and industry
37
requirements, and in most cases such costs are borne by the technology provider. Because of our contractual relationship with
Evertec, and because Popular is the sole customer of certain of Evertec’s services and products, we have in the past borne the full
cost of such developments and modifications and may be required to do so in the future, subject to the terms of the MSA.
Moreover, the terms, speed, scalability, and functionality of certain of Evertec’s technology services are not competitive
when compared to offerings from its competitors. Evertec’s failure to sufficiently invest in and upscale its technology and services
infrastructure to meet the rapidly changing technology demands of our industry may result in us being unable to meet customer
expectations and attract or retain customers. Furthermore, Evertec’s strategy and investments may also be refocused away from
Popular towards other strategic initiatives as a result of the Evertec Business Acquisition Transaction. Any such impact could, in
turn, reduce Popular’s revenues, place us in a competitive disadvantage and significantly affect our business, financial condition and
results of operations. While the closing of the Evertec Business Acquisition Transaction narrowed the scope of services which we
are dependent on Evertec to obtain and released us from exclusivity restrictions that limited our ability to engage other third-party
providers of financial technology services, it also resulted in extensions of certain existing commercial agreements with Evertec and,
as a result, have prolonged the duration of our exposure to the risks presented by Evertec’s technological capabilities and its failures
to enhance its products and services and otherwise meet evolving demands. We may also be exposed to heightened business risks
in connection with our dependency on Evertec with respect to BPPR’s merchant acquiring business, which exclusivity was extended
until 2035, and with respect to the ATH Network, which commitment BPPR extended until 2030, in light of the pace of technology
changes and competition in the payments industry.
The ability to attract and retain qualified employees is critical to our success.
Our success depends, in large part, on our ability to attract and retain qualified employees. Competition for qualified
candidates is intense and has increased recently as a result of a tighter labor market. Increased competition may lead to difficulties
in attracting or retaining qualified employees, which may, in turn, lead to significant challenges in the execution of our business
strategies and have an adverse effect on the quality of the service we provide to the customers and communities we serve. Such
challenges could adversely affect our business, operations and financial condition. In addition, increased competition may lead to
higher compensation packages and more flexible work arrangements. We may also be required to hire employees outside of our
market areas for certain positions that require specific expertise, which could result in employment and tax compliance-related
expenses, challenges and risks. In addition, flexible work arrangements, such as remote or hybrid work models, have led to other
workplace challenges, including fewer opportunities for face-to-face interactions or to promote a cohesive corporate culture and
heightened cybersecurity, information security and other operational risks.
Our ability to attract and retain qualified employees is also impacted by regulatory limitations on our compensation
practices, such as clawback requirements of incentive compensation, which may not affect other institutions with which we compete
for talent. The scope and content of regulators’ policies on executive compensation continue to develop and are likely to continue
evolving. Such policies and limitations on our compensation practices could adversely affect our ability to attract, retain and motivate
talented senior leaders in support of our long-term strategy.
OTHER RISKS
An impairment of our goodwill, deferred tax assets or amortizable intangible assets could adversely affect our financial
condition and results of operations.
As of December 31, 2023, we had approximately $804 million, $1 billion and $102 million, respectively, of goodwill, net
deferred tax assets and amortizable intangible assets, including capitalized software costs, recorded on our balance sheet.
Under GAAP, goodwill is tested for impairment at least annually and amortizable intangible assets are tested for
impairment when events or changes in circumstances indicate the carrying value may not be recoverable. Factors that may be
considered a change in circumstances, indicating that the carrying value of the goodwill or amortizable intangible assets may not be
recoverable, include a decline in Popular’s stock price related to a deterioration in global or local economic conditions, declines in
our market capitalization, reduced future earnings estimates, and interest rate changes. The goodwill impairment evaluation process
requires us to make estimates and assumptions with regards to the fair value of our reporting units. Actual values may differ
significantly from these estimates. Such differences could result in future impairment of goodwill that would, in turn, negatively
impact our results of operations and the reporting unit where the goodwill is recorded.
The determination of whether a deferred tax asset is realizable is based on weighting all available evidence. The
realization of deferred tax assets, including carryforwards and deductible temporary differences, depends upon the existence of
sufficient taxable income of the same character during the carryback or carryforward period. The analysis considers all sources of
38
taxable income available to realize the deferred tax asset, including the future reversal of existing taxable temporary differences,
future taxable income exclusive of reversing temporary differences and carryforwards, taxable income in prior carryback years and
tax-planning strategies. Changes in these factors may affect the realizability of our deferred tax assets in our Puerto Rico and U.S.
operations.
If our goodwill, deferred tax assets or amortizable intangible assets become impaired, we may be required to record a
significant charge to earnings, which could adversely affect our financial condition and results of operations.
We could experience unexpected losses if the estimates or assumptions we use in preparing our financial statements are
incorrect or differ materially from actual results.
In preparing our financial statements pursuant to U.S. GAAP, we are required to make estimates and assumptions that
are often based on subjective and complex judgments about matters that are inherently uncertain. For example, we use estimates
and assumptions to determine our allowance for credit losses, our liability for contingent litigation losses, and the fair value of certain
of our assets and liabilities, such as debt securities, loans held for sale, MSRs, intangible assets and deferred tax assets. If such
estimates or assumptions are incorrect or differ materially from actual results, we could experience unexpected losses or other
adverse impacts, some of which could be significant.
For further information of other risks faced by Popular please refer to the MD&A section of this Form 10-K.
ITEM 1B. UNRESOLVED STAFF COMMENTS
None.
Item 1C. Cybersecurity
The Corporation assesses, identifies and manages cybersecurity risk as part of the Corporation’s overall risk management
framework, alongside associated information security, anti-money laundering and counterterrorism, operational, fraud, regulatory,
legal and reputational risks, among others.
The Corporation has established three management committees that oversee and monitor different aspects of cybersecurity risk.
●
monitors the risks included in the Risk Appetite Statement (the “RAS”) of the Corporation’s Risk Management Policy,
including cybersecurity risks.
●
Information and Digital Strategy Officer, oversees and monitors information technology (“IT”), privacy and cybersecurity
risks, mitigating actions and controls, applicable regulatory developments, key risks metrics, and IT and cyber incidents
that may result in operational, compliance and reputational risks.
●
management activities to ensure the development and consistent application of operational risk policies, processes and
procedures that measure, limit and manage the Corporation's operational risks while maintaining the effectiveness and
efficiency of the operating and business processes. As part of its responsibilities, ORCO oversees business continuity
matters.
The ITCRC and ORCO meet at least quarterly and report on cybersecurity and other matters to the ERM Committee.
The Board has also established a Board-level Risk Management Committee (“RMC”), which is responsible for the oversight of the
Corporation’s overall risk framework, and assists the Board in the monitoring, review and approval of the policies that measure, limit
and manage the Corporation’s risks, including cybersecurity risk. The RMC holds periodic meetings in which management provides
an overview of Popular’s cybersecurity threat risk management and strategy processes, which includes summaries of escalated
incidents and incident remediation status. Our Chief Security Officer, Chief Information and Digital Strategy Officer, Chief
Information Security Officer (“CISO”), Chief Risk Officer and the Financial and Operational Risk Management Division (the “FORM
Division”) Manager generally participate in such meetings. The RMC is also responsible for (i) overseeing the development,
implementation and maintenance of the Information Security Program; (ii) approving the Corporation’s risk management program
39
and any related policies and controls; (iii) overseeing the implementation by the Corporation’s management of the Corporation’s risk
management program and any related policies, procedures and controls; and (iv) reviewing reports regarding selected topics such
as cyber.
The Board in turn also receives briefings on cybersecurity matters and risks, including an annual presentation from the Chief
Security Officer and the CISO on the Corporation’s information security program (the “Information Security Program”). In addition, as
part of the Board’s director education plan, members of the Board take, on an annual basis, a cybersecurity training that provides
the Board with an overview of cybersecurity principles and regulations that are relevant to our institution and the Board’s oversight
function.
To identify, assess and manage risks from cybersecurity threats, the Corporation has established a three lines of defense
framework. The first line of defense is composed of business line management that identifies and manages the risks associated with
business activities, including cybersecurity risk. The second line of defense is made up of members of the Corporation’s Corporate
Risk Management Group and the Corporate Security Group (the “CSG”) who, among other things, measure and report on the
Corporation’s risk activities. In such line of defense, the FORM Division, within the Corporate Risk Management Group, is
responsible for (i) establishing baseline metrics that measure, monitor, limit and manage the framework that identifies and manages
multiple and cross-enterprise risks, including cybersecurity risks; and (ii) articulating the RAS and supporting metrics, including
those related to operational risk, business continuity, disaster recovery and third-party management oversight processes.
Meanwhile, Popular’s Cyber Security Division (the “CSD”), which is headed by the CISO and reports to the CSG, is responsible for
the development of strategies, policies and programs to assess and mitigate cybersecurity risks. Members of the CSD (including the
CISO) and FORM Division report on and escalate privacy, IT and cybersecurity risks to management committees, such as the
ITCRC, ORCO and ERM Committee, and, if appropriate, to the RMC and the Board of Directors, as required under relevant policies
and procedures. Lastly, the third line of defense consists of the Corporate Auditing Division, which independently provides
assurance regarding the effectiveness of the risk framework and reports directly to the Audit Committee of the Board.
Popular monitors various vectors of threats and utilizes open-source intelligence forums and communities such as the Financial
Services Information Sharing and Analysis Center and the Cybersecurity and Infrastructure Security Agency, among others, to
receive threat intelligence feeds which are reviewed by the CSD. As cybersecurity threats are identified, they are evaluated to
assess the level of exposure and the potential risk to Popular. The ITCRC and the ERM Committee discuss and track the threats
identified in internal assessments and scans or in third-party reports. Depending on the evolution and materiality of the threat, these
are escalated to the RMC as appropriate.
The CSD develops the Information Security Program, which considers and evaluates risks posed by cybersecurity threats, events
and activities impacting the industry and the Corporation. The Information Security Program outlines the Corporation’s overall
strategy and governance to protect the confidentiality, integrity and availability of information and prevent access by unauthorized
personnel. The Information Security Program is based on standards and controls set by the National Institute of Standards and
Technology (“NIST”), including the NIST’s Framework for Improving Critical Infrastructure Cybersecurity. Popular leverages the
Cyber Assessment Tool (the “CAT”), a tool based on NIST standards and controls developed by the Federal Financial Institutions
Examination Council, in order to measure the Corporation’s cybersecurity preparedness and maturity levels. The CAT assessment
results are integrated into the overall Information Security Program.
The CSD also manages the Incident Response Program (“IRP”) of the Corporation and is in charge of overseeing, assessing and
managing cyber incidents. The IRP outlines the measures Popular must take to prepare for, detect, respond to and recover from
cybersecurity incidents, which include processes to triage, assess severity for, escalate, contain, investigate and remediate
incidents, as well as to comply with potentially applicable legal obligations and mitigate brand and reputational damage.
The Corporation also undertakes the below listed additional activities in its effort to maintain regulatory compliance, identify, assess
and manage its material risks from cybersecurity threats, and to protect against, detect and respond to cybersecurity incidents:
●
measures;
●
threats impact the Corporation’s information security controls in order to determine if they require any additional resources,
technology or processes;
●
40
●
and use requirements;
●
●
awareness and responsiveness to such possible threats;
●
●
●
necessary.
Popular engages third parties to assist in certain cybersecurity matters. In particular, Popular uses the expertise of third parties to
perform specialized assessments to test its systems, such as periodic penetration testing, that provide insights into the effectiveness
of its controls. Popular also engages third parties to provide computer forensics and investigations services as needed to assess
and address actual or potential cybersecurity incidents. In addition, Popular hires third parties to provide the first level security
monitoring of Popular’s external and internal networks.
Popular’s Outsourced Risk Management Policy outlines the management of risks associated with the Corporation’s use of third-
party service providers, and the CSG assesses the impact and level of cybersecurity and privacy risk of such providers. Popular
performs due diligence on third parties and monitors third parties that have access to its systems, data or facilities that house such
systems or data on a periodic basis. Popular’s due diligence determines how often vendor assessments are performed on such third
party. Popular also conducts periodic application and vendor assessments for third-party providers and their products. Furthermore,
Popular requires third parties that have access to its systems, data or facilities that house such systems or data to take a training on
cybersecurity at least annually.
Under the heading “We and our third-party providers have been, and expect in the future to continue to be, subject to cyber-attacks,
which could cause substantial harm and have an adverse effect on our business and results of operations.” and “We rely on other
companies to provide key components of our business infrastructure, including certain of our core financial transaction processing
and information technology and security services, which exposes us to a number of operational risks that could have a material
adverse effect on us.” included as part of our risk factor disclosures in Item 1A in this Form 10-K, which disclosures are incorporated
by reference herein, we describe whether and how risks from identified cybersecurity threats, including as a result of any previous
cybersecurity incidents, could have materially affected or are reasonably likely to materially affect us, including our business
strategy, results of operations, or financial condition.
The CSG operates under the direction of the Chief Security Officer. The Chief Security Officer has over 35 years of experience. She
has over 10 years of experience in information technology and cybersecurity matters, including the oversight of the Information
Security Program and the design and execution of the information security audit plan of the Corporation. She is a Certified Public
Accountant that also holds a Juris Doctor degree and Series 7 and Series 27 certifications. She holds the title of Executive Vice
President and Chief Security Officer and has been in her role since 2018. Prior to that, she served as Senior Vice President and
General Auditor of the Corporation from November 2012 to April 2018. Before 2012, she served in various risk related functions of
the Corporation.
The CISO has over 25 years of prior work experience in various roles in major financial institutions involving leading top-level
cybersecurity governance strategy and initiatives, integrating security governance into the overall business strategy and advising
boards of directors on cyber risks and cybersecurity standards. He has been a certified information security professional since 2007.
He holds the title of CISO and Cybersecurity Division Manager and has been in his role since 2019.
The Corporate Risk Management Group operates under the direction of the Chief Risk Officer. The Chief Risk Officer has over 30
years of experience. He holds the title of Executive Vice President and Chief Risk Officer and has been in his role since 2011. Prior
to joining the Corporation, he served for 17 years as Chief Financial Officer, Head of Retail Bank and Mortgage Operations, Head of
Commercial and Construction Mortgage and Head of Interest Rate Risk, among other positions, for other banks. He holds a BS
with a major in Computer Engineering and an MBA with majors in Finance and Accounting.
The FORM Division Manager has over 28 years of experience. She holds the title of Senior Vice President and FORM Division
Manager and has been in her role since March 2022. Prior to that she held positions for 16 years as Operational and IT Risk
Director, Head of ERM and Operational Risk, and Chief Information Security Officer for other banks. She also held positions in
41
Internal Audit and IT Management for other industries throughout her career. She holds a BBA with majors in Accounting and
Information Systems, and a Master of Science in Information Technology Management.
ITEM 2. PROPERTIES
As of December 31, 2023, BPPR operated 162 branches, of which 68 were owned and 94 were leased premises, and PB
operated 40 branches of which 3 were owned and 37 were on leased premises. Also, the Corporation had 576 ATMs operating in
Puerto Rico, 23 in the Virgin Islands and 100 in the U.S. Mainland. The principal properties owned by Popular for banking
operations and other services are described below. Our management believes that each of our facilities is well maintained and
suitable for its purpose.
Puerto Rico
Popular Center, the twenty-story Popular and BPPR headquarters building, located at 209 Muñoz Rivera Avenue, Hato Rey, Puerto
Rico.
Popular Center North Building, a three-story building, on the same block as Popular Center.
Popular Street Building, a parking and office building located at Ponce de León Avenue and Popular Street, Hato Rey, Puerto Rico.
Cupey Center Complex, one building, three-stories high, two buildings, two-stories high each, and two buildings three-stories high
each located in Cupey, Río Piedras, Puerto Rico.
Old San Juan Building, a twelve-story structure located in Old San Juan, Puerto Rico.
Guaynabo Corporate Office Park Building, a two-story building located in Guaynabo, Puerto Rico.
Altamira Building, a nine-story office building located in Guaynabo, Puerto Rico.
El Señorial Center, a four-story office building and a two-story branch building located in Río Piedras, Puerto Rico.
Ponce de León 167 Building, a five-story office building located in Hato Rey, Puerto Rico.
U.S. & British Virgin Islands
BPPR Virgin Islands Center, a three-story building located in St. Thomas, U.S. Virgin Islands.
Popular Center -Tortola, a four-story building located in Tortola, British Virgin Islands.
ITEM 3. LEGAL PROCEEDINGS
For a discussion of Legal proceedings, see Note 24, “Commitments and Contingencies”, to the Consolidated Financial Statements
in this Form 10-K.
ITEM 4. MINE SAFETY DISCLOSURE
Not applicable.
PART II
ITEM 5. MARKET FOR REGISTRANT’S COMMON EQUITY, RELATED STOCKHOLDER MATTERS AND ISSUER
PURCHASES OF EQUITY SECURITIES
Common Stock
Popular’s Common Stock is traded on the Nasdaq Global Select Market under the symbol “BPOP”.
42
During 2023, the Corporation declared cash dividends in the total amount of $2.27 per common share outstanding, for an
aggregate amount of $163.7 million. The Common Stock ranks junior to all series of Preferred Stock as to dividend rights and rights
on liquidation, dissolution or winding up of Popular. Our ability to declare or pay dividends on, or purchase, redeem or otherwise
acquire, the Common Stock is subject to certain restrictions in the event that Popular fails to pay or set aside full dividends on the
Preferred Stock for the latest dividend period.
On July 12, 2022, the Corporation completed an accelerated share repurchase (“ASR”) program for the repurchase of an
aggregate $400 million of Popular’s common stock for which an initial delivery of 3,483,942 shares were delivered in March 2022
(the “March ASR Agreement”). Upon the final settlement of the March ASR Agreement, the Corporation received an additional
1,582,922 shares of common stock. The Corporation repurchased a total of 5,066,864 shares at an average purchase price of
$78.9443, which were recorded as treasury stock by $440 million under the March ASR Agreement.
On December 7, 2022 the Corporation completed the settlement of another ASR Agreement for the repurchase of an
aggregate $231 million of Popular’s common stock, for which an initial 2,339,241 shares were delivered on August 26, 2022 (the
“August ASR Agreement”). Upon the final settlement of the ASR Agreement, the Corporation received an additional 840,024 shares
of common stock. The Corporation repurchased a total of 3,179,265 shares at an average purchase price of $72.66, which were
recorded as treasury stock by $245 million under the August ASR Agreement.
Additional information concerning legal or regulatory restrictions on the payment of dividends by Popular, BPPR and PB
is contained under the caption “Regulation and Supervision” in Item 1 herein.
As of February 27, 2024, Popular had 6,564 stockholders of record of the Common Stock, not including beneficial
owners whose shares are held in record names of brokers or other nominees. The last sales price for the Common Stock on that
date was $84.07 per share.
Preferred Stock
Popular has 30,000,000 shares of authorized Preferred Stock that may be issued in one or more series, and the shares
of each series shall have such rights and preferences as shall be fixed by the Board of Directors when authorizing the issuance of
that particular series. Popular’s Preferred Stock issued and outstanding at December 31, 2023 consisted of:
●
value of $25 per share.
All series of Preferred Stock are pari passu. Dividends on each series of Preferred Stock are payable if declared by our
Board of Directors. Our ability to declare and pay dividends on the Preferred Stock is dependent on certain Federal regulatory
considerations, including the guidelines of the Federal Reserve Board regarding capital adequacy and dividends. The Board of
Directors is not obligated to declare dividends and dividends do not accumulate in the event they are not paid.
Monthly dividends on the Preferred Stock amounted to a total of $1.4 million for the year 2023. There can be no
assurance that any dividends will be declared on the Preferred Stock in any future periods.
Dividend Reinvestment and Stock Purchase Plan
Popular offers a dividend reinvestment and stock purchase plan for our stockholders that allows them to reinvest their
dividends in shares of the Common Stock at a 5% discount from the average market price at the time of the issuance, as well as
purchase shares of Common Stock directly from Popular by making optional cash payments at prevailing market prices.
Equity Based Plans
On May 12, 2020, the stockholders of the Corporation approved the Popular, Inc. 2020 Omnibus Incentive Plan, which
permits the Corporation to issue several types of stock-based compensation to employees and directors of the Corporation and/or
any of its subsidiaries (the “2020 Incentive Plan”). The 2020 Incentive Plan replaced the Popular, Inc. 2004 Omnibus Incentive Plan,
which was in effect prior to the adoption of the 2020 Incentive Plan. As of December 31, 2023, the maximum number of shares of
43
common stock remaining available for future issuance under this plan was 3,144,461. For information about the securities remaining
available for issuance under our equity-based plans, refer to Part III, Item 12.
Purchases of Equity Securities
The following table sets forth the details of purchases of Common Stock by the Corporation during the quarter ended December 31,
2023:
Issuer Purchases of Equity Securities
Not in thousands
Period
Total Number of
Shares Purchased [1]
Average Price Paid
per Share
Total Number of Shares
Purchased as Part of Publicly
Announced Plans or Programs
Maximum Number of
Shares that May Yet be
Purchased Under the
Plans or Programs
October 1 – October 31
174
$62.92
-
-
November 1 – November 30
-
-
-
-
December 1 – December 31
498
67.95
-
-
Total December 31, 2023
672
$66.65
-
-
[1] Includes 174 and 498 shares of the Corporation's common stock acquired by the Corporation during October and December 2023,
respectively, in connection with the satisfaction of tax withholding obligations on vested awards of restricted stock or restricted stock
units granted to directors and certain employees under the Corporation’s Omnibus Incentive Plan. The acquired shares of common
stock were added back to treasury stock.
Equity Compensation Plans
For information about our equity compensation plans, refer to Part III, Item 12.
Stock Performance Graph (1)
The graph below compares the cumulative total stockholder return during the measurement period with the cumulative
total return, assuming reinvestment of dividends, of the Nasdaq Bank Index and the Nasdaq Composite Index.
The cumulative total stockholder return was obtained by dividing (i) the cumulative amount of dividends per share,
assuming dividend reinvestment since the measurement point, December 31, 2018, plus (ii) the change in the per share price since
the measurement date, by the share price at the measurement date.
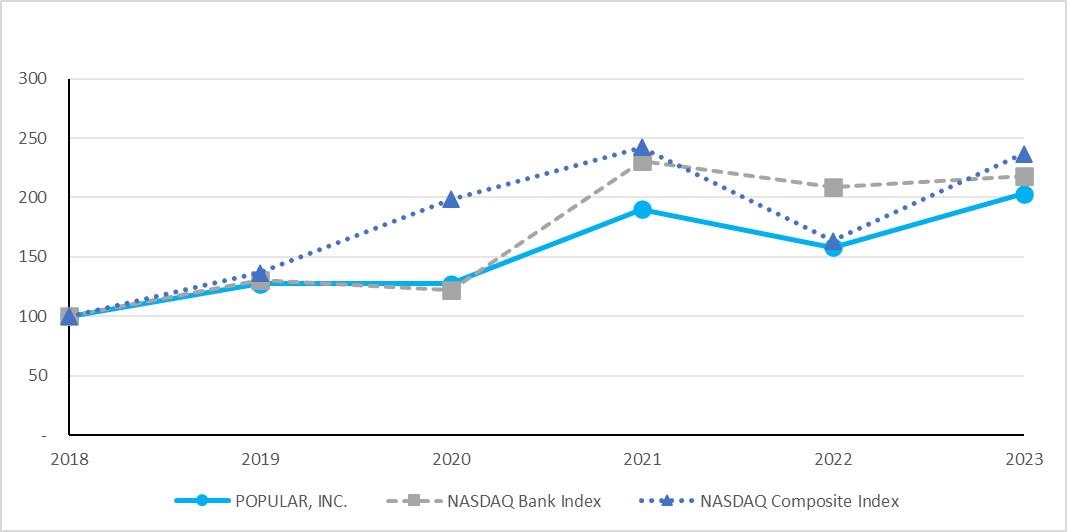
44
Comparison of Five-Year Cumulative Total Return (TSR)
Assumes all dividends were reinvested
Base Year: December 31, 2018 = $100
(1) Unless Popular specifically states otherwise, this Stock Performance Graph shall not be deemed to be incorporated by
reference and shall not constitute soliciting material or otherwise be considered filed under the Securities Act of 1933 or the
Securities Exchange Act of 1934.
ITEM 6. [RESERVED]
ITEM 7. MANAGEMENT’S DISCUSSION AND ANALYSIS OF FINANCIAL CONDITION AND RESULTS OF OPERATIONS
The information required by this item is included in this Form 10-K, commencing on page 54.
ITEM 7A. QUANTITATIVE AND QUALITATIVE DISCLOSURES ABOUT MARKET RISK
The information regarding the market risk of our investments appears under the caption “Risk Management”, on page 84
within Management’s Discussion and Analysis of Financial Condition and Results of Operations in this Form 10-K.
ITEM 8. FINANCIAL STATEMENTS AND SUPPLEMENTARY DATA
The information required by this item appears under the caption “Statistical Summaries” on pages 111 to 113 of this Form
10-K.
ITEM 9. CHANGES IN AND DISAGREEMENTS WITH ACCOUNTANTS ON ACCOUNTING AND FINANCIAL DISCLOSURE
45
Not Applicable.
ITEM 9A. CONTROLS AND PROCEDURES
Disclosure Controls and Procedures
Our management, with the participation of our Chief Executive Officer and Chief Financial Officer, has evaluated the
effectiveness of our disclosure controls and procedures (as such term is defined in Rules 13a-15(e) and 15d-15(e) under the
Exchange Act) as of the end of the period covered by this report. Based on such evaluation, our Chief Executive Officer and Chief
Financial Officer have concluded that, as of the end of such period, our disclosure controls and procedures are effective in
recording, processing, summarizing and reporting, on a timely basis, information required to be disclosed by Popular in the reports
that we file or submit under the Exchange Act and such information is accumulated and communicated to management, as
appropriate, to allow timely decisions regarding required disclosures.
Assessment on Internal Control over Financial Reporting
Information relating to our assessment on internal control over financial reporting is presented under the captions “Report
of Management on Internal Control Over Financial Reporting” and “Report of Independent Registered Public Accounting Firm”
located on pages 114 and 115 of this Form 10-K.
Changes in Internal Control over Financial Reporting
There have been no changes in our internal control over financial reporting (as such term is defined in Rules 13a-15(f)
and 15d-15(f) under the Exchange Act) that occurred during the quarter ended December 31, 2023, that have materially affected, or
are reasonably likely to materially affect, our internal control over financial reporting.
ITEM 9B. OTHER INFORMATION
Rule 10b5-1 Trading Plans or Other Preplanned Trading Arrangements
Certain of our officers or directors have made and may from time to time make elections to
participate in
, and are participating in,
our dividend reinvestment and purchase plan, the Company stock fund associated with our 401(k) plans and/or the Company stock
fund associated with our non-qualified deferred compensation plans and have shares withheld to cover withholding taxes upon the
vesting of equity awards, which may be designed to satisfy the affirmative defense conditions of Rule 10b5-1 under the Exchange
Act or may constitute non-Rule 10b5–1
trading arrangements
ITEM 9C. DISCLOSURE REGARDING FOREIGN JURISDICTIONS THAT PREVENT INSPECTIONS
Not applicable.
PART III
ITEM 10. DIRECTORS, EXECUTIVE OFFICERS AND CORPORATE GOVERNANCE
The information contained under the captions “Security Ownership of Certain Beneficial Owners and Management”,
“Delinquent Section 16(a) Reports”, “Corporate Governance”, “Nominees for Election as Directors” and “Executive Officers” in the
Proxy Statement are incorporated herein by reference. Information about our Code of Ethics, which applies to our senior financial
officers, is included in “Business — Available Information” in Part I of this Form 10-K.
46
ITEM 11. EXECUTIVE COMPENSATION
The information in the Proxy Statement under the caption “Executive and Director Compensation,” including the
“Compensation Discussion and Analysis,” the “2023 Executive Compensation Tables and Compensation Information” and the
“Compensation of Non-Employee Directors,” and under the caption “Committees of the Board – Talent and Compensation
Committee – Talent and Compensation Committee Interlocks and Insider Participation” is incorporated herein by reference.
ITEM 12. SECURITY OWNERSHIP OF CERTAIN BENEFICIAL OWNERS AND MANAGEMENT AND RELATED
STOCKHOLDERS MATTERS
The information under the captions “Principal Shareholders” and “Shares Beneficially Owned by Directors and Executive
Officers” in the Proxy Statement is incorporated herein by reference.
The following tables sets forth information as of December 31, 2023 regarding securities remaining available for issuance
to directors and eligible employees under our equity-based compensation plans.
Plan Category
Plan
Number of Securities
Remaining Available
for Future Issuance
Under Equity Compensation
Equity compensation plan approved by security holders
2020 Omnibus Incentive Plan
3,144,461
Total
3,144,461
ITEM 13. CERTAIN RELATIONSHIPS AND RELATED TRANSACTIONS, AND DIRECTOR INDEPENDENCE
The information under the caption “Board of Directors and Nominees’ Independence” and “Certain Relationships and
Transactions” in the Proxy Statement is incorporated herein by reference.
ITEM 14. PRINCIPAL ACCOUNTANT FEES AND SERVICES
Information regarding principal accountant fees and services is set forth under Proposal 3 – Ratification of Appointment of
Independent Registered Public Accounting Firm in the Proxy Statement, which is incorporated herein by reference.
PART IV
ITEM 15. EXHIBITS AND FINANCIAL STATEMENT SCHEDULES
(a). The following financial statements and reports are included on pages 115 through 268 in this Form10K.
(1)
Report of Independent Registered Public Accounting Firm (
PCAOB ID
)
Consolidated Statements of Financial Condition as of December 31, 2023 and 2022
Consolidated Statements of Operations for each of the years in the three-year period ended December 31, 2023
47
Consolidated Statements of Comprehensive Income (Loss) for each of the years in the three-year period ended
December 31, 2023
Consolidated Statements of Changes in Stockholders’ Equity for each of the years in the three-year period ended
December 31, 2023
Consolidated Statements of Cash Flows for each of the years in the three-year period ended December 31, 2023
Notes to Consolidated Financial Statements
(2) Financial Statement Schedules: No schedules are presented because the information is not applicable or is included in the
Consolidated Financial Statements described in (a) (1) above or in the notes thereto.
(3) Exhibits
ITEM 16. FORM 10-K SUMMARY
None.
The exhibits listed on the Exhibits Index below are filed herewith or are incorporated herein by reference.
48
Exhibit Index
3.1
3.2
4.1
4.2
4.3
4.4
4.5
4.6
4.7
4.8
4.9
4.10
49
10.1
10.2
10.3
10.4
10.5
10.6
10.7
10.8
10.9
10.10
10.11
10.12
10.13
10.14
50
10.15
10.16
10.17
10.18
10.19
10.20
10.21
10.22
10.23
10.24
51
10.25
10.26
10.27
10.28
10.29
21.1
22.1
23.1
31.1
31.2
32.1
32.2
97.1
101.INS
XBRL Instance Document - the instance document does not appear in the Interactive Data File because its XBRL
tags are embedded within the Inline Document. (1)
101.SCH
Inline XBRL Taxonomy Extension Schema Document (1)
101.CAL
Inline XBRL Taxonomy Extension Calculation Linkbase Document (1)
101.DEF
Inline XBRL Taxonomy Extension Definitions Linkbase Document (1)
101.LAB
Inline XBRL Taxonomy Extension Label Linkbase Document (1)
101.PRE
Inline XBRL Taxonomy Extension Presentation Linkbase Document (1)
104
The cover page of Popular, Inc. Annual Report on Form 10-K for the year ended December 31, 2023, formatted in
Inline XBRL (included within the Exhibit 101 attachments) (1)
(1)
Included herewith
(2)
Furnished herewith. This exhibit shall not be deemed “filed” for purposes of Section 18 of the Securities Exchange
Act of 1934, or otherwise subject to the liability of that Section, and shall not be deemed incorporated into any filing
under the Securities Act of 1933 or the Securities Exchange Act of 1934.
*
This exhibit is a management contract or compensatory plan or arrangement.
Popular, Inc. has not filed as exhibits certain instruments defining the rights of holders of debt of Popular, Inc. not
exceeding 10% of the total assets of Popular, Inc. and its consolidated subsidiaries. Popular, Inc. hereby agrees to
furnish upon request to the Commission a copy of each instrument defining the rights of holders of senior and
subordinated debt of Popular, Inc., or of any of its consolidated subsidiaries.
52
Financial Review and
Supplementary Information
Management’s Discussion and Analysis of
Financial Condition and Results of Operations
54
Statistical Summaries
111
Report of Management on Internal Control Over Financial
Reporting
114
Report of Independent Registered Public
Accounting Firm
115
Consolidated Statements of Financial Condition as of
December 31, 2023 and 2022
118
Consolidated Statements of Operations for the
years ended December 31, 2023, 2022 and 2021
119
Consolidated Statements of Comprehensive
Income (Loss) for the years ended December 31, 2023, 2022
and 2021
120
Consolidated Statements of Changes in Stockholders’
Equity for the years ended December 31, 2023, 2022 and
2021
121
Consolidated Statements of Cash Flows for the
years ended December 31, 2023, 2022 and 2021
122
Notes to Consolidated Financial Statements
124
Signatures
269
53
Management’s Discussion and
Analysis of Financial Condition
and Results of Operations
Forward-Looking Statements
54
Overview
55
Critical Accounting Policies / Estimates
60
Statement of Operations Analysis
66
Net Interest Income
66
Provision for Credit Losses
69
Non-Interest Income
69
Operating Expenses
70
Income Taxes
72
Fourth Quarter Results
72
Reportable Segment Results
73
Statement of Financial Condition Analysis
75
Assets
75
Liabilities
77
Stockholders’ Equity
79
Regulatory Capital
80
Risk Management
84
Market / Interest Rate Risk
84
Liquidity
88
Enterprise Risk Management
108
Adoption of New Accounting Standards and Issued but
Not Yet Effective Accounting Standards
110
Statistical Summaries
Statements of Financial Condition
111
Statements of Operations
112
Average Balance Sheet and Summary of Net Interest
Income
113
54
FORWARD-LOOKING STATEMENTS
This Form 10-K contains “forward-looking statements” within the meaning of the U.S. Private Securities Litigation Reform Act of
1995, including, without limitation, statements about Popular, Inc.’s (the “Corporation,” “Popular,” “we,” “us,” “our”) business,
financial condition, results of operations, plans, objectives and future performance. These statements are not guarantees of future
performance, are based on management’s current expectations and, by their nature, involve risks, uncertainties, estimates and
assumptions. Potential factors, some of which are beyond the Corporation’s control, could cause actual results to differ materially
from those expressed in, or implied by, such forward-looking statements. Risks and uncertainties include without limitation the effect
of competitive and economic factors, and our reaction to those factors, the adequacy of the allowance for loan losses, delinquency
trends, market risk and the impact of interest rate changes, capital markets conditions, capital adequacy and liquidity, and the effect
of legal and regulatory proceedings and new accounting standards on the Corporation’s financial condition and results of operations.
All statements contained herein that are not clearly historical in nature are forward-looking, and the words “anticipate,” “believe,”
“continues,” “expect,” “estimate,” “intend,” “project” and similar expressions and future or conditional verbs such as “will,” “would,”
“should,” “could,” “might,” “can,” “may” or similar expressions are generally intended to identify forward-looking statements.
Various factors, some of which are beyond Popular’s control, could cause actual results to differ materially from those expressed in,
or implied by, such forward-looking statements. Factors that might cause such a difference include, but are not limited to, the rate of
growth or decline in the economy and employment levels, as well as general business and economic conditions in the geographic
areas we serve and, in particular, in the Commonwealth of Puerto Rico (the “Commonwealth” or “Puerto Rico”), where a significant
portion of our business is concentrated; adverse economic conditions, including high levels of inflation, that adversely affect housing
prices, the job market, consumer confidence and spending habits which may affect in turn, among other things, our level of non-
performing assets, charge-offs and provision expense; changes in interest rates and market liquidity, which may reduce interest
margins, impact funding sources, reduce loan originations, affect our ability to originate and distribute financial products in the
primary and secondary markets and impact the value of our investment portfolio and our ability to return capital to our shareholders;
the impact of bank failures or adverse developments at other banks and related negative media coverage of the banking industry in
general on investor and depositor sentiment regarding the stability and liquidity of banks; the impact of the current fiscal and
economic challenges of Puerto Rico and the measures taken and to be taken by the Puerto Rico Government and the Federally-
appointed oversight board on the economy, our customers and our business; the impact of pending debt restructuring proceedings
under Title III of the Puerto Rico Oversight, Management and Economic Stability Act (“PROMESA”) and of other actions taken or to
be taken to address Puerto Rico’s fiscal challenges on the value of our portfolio of Puerto Rico government securities and loans to
governmental entities and of our commercial, mortgage and consumer loan portfolios where private borrowers could be directly
affected by governmental action; the amount of Puerto Rico public sector deposits held at the Corporation, whose future balances
are uncertain and difficult to predict and may be impacted by factors such as the amount of Federal funds received by the P.R.
Government and the rate of expenditure of such funds, as well as the financial condition, liquidity and cash management practices
of the Puerto Rico Government and its instrumentalities; unforeseen or catastrophic events, including extreme weather events,
including hurricanes, other natural disasters, man-made disasters, acts of violence or war or pandemics, epidemics and other
health-related crises, or the fear of any such event occurring, any of which could cause adverse consequences for our business,
including, but not limited to, disruptions in our operations; our ability to achieve the expected benefits from our transformation
initiative, including our ability to achieve projected earnings, efficiencies and our targeted sustainable return on tangible common
equity of 14% by the end of 2025; risks related to Popular’s acquisition of certain information technology and related assets formerly
used by Evertec, Inc. to service certain of Banco Popular de Puerto Rico’s key channels, as well as the entry into amended and
restated commercial agreements (the “Evertec Business Acquisition Transaction”); the fiscal and monetary policies of the federal
government and its agencies; changes in federal bank regulatory and supervisory policies, including required levels of capital,
liquidity, resolution-related requirements and the impact of other proposed capital standards on our capital ratios; additional Federal
Deposit Insurance Corporation (“FDIC”) assessments, such as the special assessment implemented by the FDIC to recover the
losses to the deposit insurance fund (“DIF”) resulting from the receiverships of Silicon Valley Bank and Signature Bank; regulatory
approvals that may be necessary to undertake certain actions or consummate strategic transactions, such as acquisitions and
dispositions; the relative strength or weakness of the consumer and commercial credit sectors and of the real estate markets in
Puerto Rico and the other markets in which our borrowers are located; a deterioration in the credit quality of our clients, customers
and counterparties; the performance of the stock and bond markets; competition in the financial services industry; possible
legislative, tax or regulatory changes; a failure in or breach of our operational or security systems or infrastructure or those of
Evertec, Inc., our provider of core financial transaction processing and information technology services, or of third parties providing
services to us, including as a result of cyberattacks, e-fraud, denial-of-services and computer intrusion, that might result in, among
other things, loss or breach of customer data, disruption of services, reputational damage or additional costs to Popular; changes in
market rates and prices which may adversely impact the value of financial assets and liabilities; potential judgments, claims,
55
damages, penalties, fines, enforcement actions and reputational damage resulting from pending or future litigation and regulatory or
government investigations or actions; changes in accounting standards, rules and interpretations; our ability to grow our core
businesses; decisions to downsize, sell or close branches or business units or otherwise change our business mix; and
management’s ability to identify and manage these and other risks.
Moreover, the outcome of legal and regulatory proceedings, as discussed in “Part I, Item 3. Legal Proceedings,” is inherently
uncertain and depends on judicial interpretations of law and the findings of regulators, judges and/or juries. Investors should refer to
“Part I, Item 1A” of this Form 10-K for a discussion of certain risks and uncertainties to which the Corporation is subject.
All forward-looking statements included in this Form 10-K are based upon information available to Popular as of the date of this
Form 10- K, and other than as required by law, including the requirements of applicable securities laws, we assume no obligation to
update or revise any such forward-looking statements to reflect occurrences or unanticipated events or circumstances after the date
of such statements.
OVERVIEW
The Corporation is a diversified, publicly-owned financial holding company subject to the supervision and regulation of the Board of
Governors of the Federal Reserve System. The Corporation has operations in Puerto Rico, the United States (“U.S.”) mainland, and
the U.S. and British Virgin Islands. In Puerto Rico, the Corporation provides retail, mortgage, and commercial banking services
through its principal banking subsidiary, Banco Popular de Puerto Rico (“BPPR”), as well as investment banking, broker-dealer, auto
and equipment leasing and financing, and insurance services through specialized subsidiaries. In the U.S. mainland, the
Corporation provides retail, mortgage, commercial banking services, as well as equipment leasing and financing, through its New
York-chartered banking subsidiary, Popular Bank (“PB” or “Popular U.S.”) which has branches located in New York, New Jersey and
Florida. Note 37 to the Consolidated Financial Statements presents information about the Corporation’s business segments.
YEAR 2023 SIGNIFICANT EVENTS
Issuance and Redemption of Senior Notes
On March 13, 2023, the Corporation issued $400 million aggregate principal amount of 7.25% Senior Notes due 2028 (the “2028
Notes”) in an underwritten public offering. The Corporation used a portion of the net proceeds of the 2028 Notes offering to redeem,
on August 14, 2023, the outstanding $300 million aggregate principal amount of its 6.125% Senior Notes due September 2023. The
redemption price was equal to 100% of the principal amount plus accrued and unpaid interest through the redemption date.
FDIC Special Assessment
On November 16, 2023, the Federal Deposit Insurance Corporation (“FDIC”) approved a final rule that imposes a special
assessment (the “FDIC Special Assessment”) to recover the losses to the deposit insurance fund (“DIF”) resulting from the FDIC’s
use, in March 2023, of the systemic risk exception to the least-cost resolution test under the Federal Deposit Insurance Act in
connection with the receiverships of several failed banks.
Under the final rule, the assessment base for the special assessment is equal to an insured depository institution’s (“IDI”) estimated
uninsured deposits, as reported in the IDI’s December 31, 2022 Call Report, excluding the first $5 billion in estimated uninsured
deposits. For a holding company that has more than one IDI subsidiary, such as Popular, the $5 billion exclusion is allocated among
the company’s IDI subsidiaries in proportion to each IDI’s estimated uninsured deposits. The special assessments will be collected
at an annual rate of approximately 13.4 basis points per year (3.35 basis points per quarter) over eight quarters in 2024 and 2025,
with the first assessment period beginning January 1, 2024. In their December 31, 2022 Call Reports, BPPR and PB reported
estimated uninsured deposits of approximately $28.1 billion, including $16.2 billion in fully collateralized public sector deposits, and
$3.5 billion, respectively. The Corporation recorded an expense of $71.4 million, $45.3 million net of tax, in the fourth quarter of
2023, representing the full amount of the assessment.
56
By statute, the FDIC is required to recover the loss arising from the use of a systemic risk determination through one or more special
assessments. As of December 31, 2023, the FDIC’s loss estimate described in the final rule had increased by approximately $4.1
billion to $20.4 billion, or approximately 25%. The exact amount of losses will be determined when the FDIC terminates the related
receiverships considered in the final rule. Accordingly, the special assessment amount and collection period may change as the
estimated loss is periodically adjusted or if the total amount collected varies. If the most recent increase in the FDIC’s
estimate remains unchanged and is assessed in the same manner, the Corporation estimates that the incremental expense for the
FDIC Special Assessment could be approximately $18 million.
Increase in quarterly common stock dividends
During the fourth quarter of 2023, the Corporation declared a quarterly common stock cash dividend of $0.62 per share, an increase
of $0.07, or 13%, compared to the $0.55 per share declared by the Corporation in the third quarter of 2023.
57
Table 1 - Selected Financial Data
Years ended December 31,
(Dollars in thousands, except per common share data)
2023
2022
2021
CONDENSED STATEMENTS OF OPERATIONS
Interest income
$
3,245,307
$
2,465,911
$
2,122,637
Interest expense
1,113,783
298,552
165,047
Net interest income
2,131,524
2,167,359
1,957,590
Provision for credit losses (benefit)
208,609
83,030
(193,464)
Non-interest income
650,724
897,062
642,128
Operating expenses
1,898,100
1,746,420
1,549,275
Income tax expense
134,197
132,330
309,018
Net income
$
541,342
$
1,102,641
$
934,889
Net income applicable to common stock
$
539,930
$
1,101,229
$
933,477
PER COMMON SHARE DATA
Net income per common share - basic
$
7.53
$
14.65
$
11.49
Net income per common share - diluted
7.52
14.63
11.46
Dividends declared
2.27
2.20
1.75
Common equity per share
71.03
56.66
74.48
Market value per common share
82.07
66.32
82.04
Outstanding shares:
Average - basic
71,710,265
75,147,263
81,263,027
Average - assuming dilution
71,791,692
75,274,003
81,420,154
End of period
72,153,621
71,853,720
79,851,169
AVERAGE BALANCES
Net loans
[1]
$
33,164,960
$
30,405,281
$
29,074,036
Earning assets
68,175,022
69,729,933
68,088,675
Total assets
71,234,236
72,808,604
71,168,650
Deposits
62,546,480
64,716,404
63,102,916
Borrowings
1,227,094
1,119,878
1,255,495
Total stockholders' equity
6,600,603
6,009,225
5,777,652
PERIOD END BALANCE
Net loans
[1]
$
35,069,272
$
32,083,150
$
29,299,725
Allowance for credit losses - loans portfolio
729,341
720,302
695,366
Earning assets
67,216,816
64,251,062
72,103,862
Total assets
70,758,155
67,637,917
75,097,899
Deposits
63,618,243
61,227,227
67,005,088
Borrowings
1,078,332
1,400,319
1,155,166
Total stockholders' equity
5,146,953
4,093,425
5,969,397
SELECTED RATIOS
Net interest margin (non-taxable equivalent basis)
3.13
%
3.11
%
2.88
%
Net interest margin (taxable equivalent basis) -Non-GAAP
3.31
3.46
3.19
Return on assets
0.76
1.51
1.31
Return on common equity
8.21
18.39
16.22
Tier I capital
16.36
16.45
17.49
Total capital
18.13
18.26
19.35
[1] Includes loans held-for-sale.
58
Non-GAAP financial measures
Net interest income on a taxable equivalent basis
Net interest income, on a taxable equivalent basis, is presented with its different components in Table 3 for the year ended
December 31, 2023 as compared with the same period in 2022, segregated by major categories of interest earning assets and
interest-bearing liabilities.
The interest earning assets include investment securities and loans that are exempt from income tax, principally in Puerto Rico. The
main sources of tax-exempt interest income are certain investments in obligations of the U.S. Government, its agencies and
sponsored entities, and certain obligations of the Commonwealth of Puerto Rico and its agencies and assets held by the
Corporation’s international banking entities. To facilitate the comparison of all interest related to these assets, the interest income
has been converted to a taxable equivalent basis, using the applicable statutory income tax rates for each period. The taxable
equivalent computation considers the interest expense and other related expense disallowances required by the Puerto Rico tax
law. Under Puerto Rico tax law, the exempt interest can be deducted up to the amount of taxable income. Net interest income, on a
taxable equivalent basis, is a non-GAAP financial measure. Management believes that this presentation provides meaningful
information since it facilitates the comparison of revenues arising from taxable and exempt sources.
Net interest income, on a taxable equivalent basis, as used by the Corporation may not be comparable to similarly named non-
GAAP financial measures used by other companies.
Financial highlights for the year ended December 31, 2023
The discussion that follows provides highlights of the Corporation’s results of operations for the year ended December 31, 2023
compared to the results of operations of 2022. It also provides some highlights with respect to the Corporation’s financial condition,
credit quality, capital and liquidity. Table 2 presents a three-year summary of the components of net income as a percentage of
average total assets. For a discussion of our 2022 results of operations compared with 2021, see “Management’s Discussion and
Analysis of Financial Condition and Results of Operations” in our Form 10-K for the year ended December 31, 2022.
59
Table 2 - Components of Net Income as a Percentage of Average Total Assets
2023
2022
2021
Net interest income
2.99
%
2.98
%
2.75
%
Provision for credit (losses) benefit
(0.29)
(0.11)
0.27
Mortgage banking activities
0.03
0.06
0.07
Net gain (loss) and valuation adjustments on investment securities
0.01
(0.01)
-
Other non-interest income
0.87
1.18
0.83
Total net interest income and non-interest income, net of provision for credit losses
3.61
4.10
3.92
Operating expenses
(2.66)
(2.40)
(2.18)
Income before income tax
0.95
1.70
1.74
Income tax expense
(0.19)
(0.19)
(0.43)
Net income
0.76
%
1.51
%
1.31
%
The Corporation’s net income for the year ended December 31, 2023 amounted to $541.3 million, compared to a net income of $1.1
billion for 2022.
Net interest income for the year ended December 31, 2023 was $2.1 billion, a decrease of $35.8 million when compared to 2022.
The decrease in net interest income was mainly driven by higher interest expense from deposits, mainly due to higher cost of the
Puerto Rico government deposits and the increase in cost of Popular U.S. deposits. The net interest margin for the year ended
December 31, 2023 was 3.13% compared to 3.11% for the same period in 2022, driven by a full year impact, on the cost of
deposits, of the increase, in 2022, of 400 basis points in the Federal Funds Rate and an additional 100 basis points in 2023. On a
taxable equivalent basis, net interest margin was 3.31% in 2023, compared to 3.46% in 2022. Refer to the Net Interest Income
section of this MD&A for additional information.
The Corporation’s total provision for credit losses of $208.6 million for the year ended December 31, 2023, compared to $83.0
million for 2022. The higher expense for the year 2023 was driven by higher reserves in our consumer and commercial portfolios
mostly due to changes in credit quality and higher loan volumes. The Corporation’s consumer loans portfolios continued to
experience credit quality normalization. While, non-performing loans (“NPLs”) and net charge offs (“NCOs”) continued below
historical pre-pandemic averages, consumer portfolios, however, reflected credit quality deterioration in certain areas, particularly
the unsecured personal loans and credit cards portfolios, with delinquencies and NCOs near or exceeding pre-pandemic levels. The
auto loans portfolio also showed credit normalization, however, metrics remained below pre-pandemic levels. The commercial and
mortgage portfolios continue to operate with historically low levels of NCOs and NPLs. Non-performing assets totaled $438.0 million
at December 31, 2023, reflecting a decrease of $90.5 million when compared to December 31, 2022. Refer to the Provision for
Credit Losses and Credit Risk sections of this MD&A for information on the allowance for credit losses, non-performing assets, loan
modifications to borrowers with financial difficulties, net charge-offs and credit quality metrics.
Non-interest income for the year ended December 31, 2023 amounted to $650.7 million, a decrease of $246.3 million, when
compared with 2022, mostly due to the $257.7 million gain related to the Evertec Transactions and related accounting adjustments
during 2022. Refer to the Non-Interest Income section of this MD&A for additional information on the major variances of the different
categories of non-interest income.
Total operating expenses amounted to $1.9 billion for the year 2023, reflecting an increase of $151.7 million, when compared to the
same period in 2022, mainly due to the FDIC Special Assessment of $71.4 million, higher personnel costs reflecting salary
increases and a higher headcount, a higher goodwill impairment charge in our U.S. based equipment leasing subsidiary, and higher
processing and transactional services expenses. Refer to the Operating Expenses section of this MD&A for additional information.
Income tax expense amounted to $134.2 million for the year ended December 31, 2023, compared with an income tax expense of
$132.3 million for the previous year. The income tax expense for the year was impacted by the composition and source of taxable
income, including lower tax exempt income and lower income subject to preferential tax rates. The income tax expense of year 2022
benefited from the partial reversal of $68.2 million of the deferred tax assets valuation allowance of the U. S. operations, the sale of
60
Evertec shares, taxable at a preferential rate, and a higher tax exempt income net of disallowance. Refer to the Income Taxes
section in this MD&A and Note 35 to the Consolidated Financial Statements for additional information on income taxes.
At December 31, 2023, the Corporation’s total assets were $70.8 billion, compared with $67.6 billion at December 31, 2022. The
increase of $3.1 billion is mainly driven by an increase in loans held-in-portfolio mainly in the commercial, consumer, and mortgage
portfolios. Refer to the Statement of Financial Condition Analysis section of this MD&A for additional information.
Deposits amounted to $63.6 billion at December 31, 2023, compared with $61.2 billion at December 31, 2022. Table 8 presents a
breakdown of deposits by major categories. The increase in deposits was mainly due to higher Puerto Rico public funds at BPPR
and time deposits at PB. The Corporation’s borrowings amounted to $1.1 billion at December 31, 2023, compared to $1.4 billion at
December 31, 2022. Refer to Note 17 to the Consolidated Financial Statements for detailed information on the Corporation’s
borrowings.
Refer to Table 7 in the Statement of Financial Condition Analysis section of this MD&A for the percentage allocation of the
composition of the Corporation’s financing to total assets.
Stockholders’ equity amounted to $5.1 billion at December 31, 2023, compared to $4.1 billion at December 31, 2022. The increase
was principally due to lower accumulated unrealized losses on debt securities available-for-sale, lower accumulated unrealized
losses on debt securities previously reclassified to held-to-maturity, and the net income for the year, partially offset by declared
dividends. The Corporation and its banking subsidiaries continue to be well-capitalized at December 31, 2023. The Common Equity
Tier 1 Capital ratio at December 31, 2023 was 16.30%, compared to 16.39% at December 31, 2022.
For further discussion of operating results, financial condition and business risks refer to the narrative and tables included herein.
The shares of the Corporation’s common stock are traded on the Nasdaq Global Select Market under the symbol BPOP.
CRITICAL ACCOUNTING POLICIES / ESTIMATES
The accounting and reporting policies followed by the Corporation and its subsidiaries conform with generally accepted accounting
principles in the United States of America (“GAAP”) and general practices within the financial services industry. The Corporation’s
significant accounting policies are described in detail in Note 2 to the Consolidated Financial Statements and should be read in
conjunction with this section.
Critical accounting policies require management to make estimates and assumptions, which involve significant judgment about the
effect of matters that are inherently uncertain and that involve a high degree of subjectivity. These estimates are made under facts
and circumstances at a point in time and changes in those facts and circumstances could produce actual results that differ from
those estimates. The following MD&A section is a summary of what management considers the Corporation’s critical accounting
policies and estimates.
Fair Value Measurement of Financial Instruments
The Corporation currently measures at fair value on a recurring basis its trading debt securities, debt securities available-for-sale,
certain equity securities, derivatives and mortgage servicing rights. Occasionally, the Corporation is required to record at fair value
other assets on a nonrecurring basis, such as loans held-for-sale, loans held-in-portfolio that are collateral dependent and certain
other assets. These nonrecurring fair value adjustments typically result from the application of lower of cost or fair value accounting
or write-downs of individual assets.
The Corporation categorizes its assets and liabilities measured at fair value under the three-level hierarchy. The level within the
hierarchy is based on whether the inputs to the valuation methodology used for fair value measurement are observable.
The Corporation requires the use of observable inputs when available, in order to minimize the use of unobservable inputs to
determine fair value. The inputs or methodologies used for valuing securities are not necessarily an indication of the risk associated
with investing in those securities. The amount of judgment involved in estimating the fair value of a financial instrument depends
61
upon the availability of quoted market prices or observable market parameters. In addition, it may be affected by other factors such
as the type of instrument, the liquidity of the market for the instrument, transparency around the inputs to the valuation, as well as
the contractual characteristics of the instrument. Broker quotes used for fair value measurements inherently reflect any lack of
liquidity in the market since they represent an exit price from the perspective of the market participants.
Trading Debt Securities and Debt Securities Available-for-Sale
The majority of the values for trading debt securities and debt securities available-for-sale are obtained from third-party pricing
services and are validated with alternate pricing sources when available. Securities not priced by a secondary pricing source are
documented and validated internally according to their significance to the Corporation’s financial statements. Management has
established materiality thresholds according to the investment class to monitor and investigate material deviations in prices obtained
from the primary pricing service provider and the secondary pricing source used as support for the valuation results.
Inputs are evaluated to ascertain that they consider current market conditions, including the relative liquidity of the market. When a
market quote for a specific security is not available, the pricing service provider generally uses observable data to derive an exit
price for the instrument, such as benchmark yield curves and trade data for similar products. To the extent trading data is not
available, the pricing service provider relies on specific information including dialogue with brokers, buy side clients, credit ratings,
spreads to established benchmarks and transactions on similar securities, to draw correlations based on the characteristics of the
evaluated instrument. If for any reason the pricing service provider cannot observe data required to feed its model, it discontinues
pricing the instrument.
Furthermore, management assesses the fair value of its portfolio of investment securities at least on a quarterly basis. Securities are
classified in the fair value hierarchy according to product type, characteristics and market liquidity. At the end of each period,
management assesses the valuation hierarchy for each asset or liability measured. The fair value measurement analysis performed
by the Corporation includes validation procedures and review of market changes, pricing methodology, assumption and level
hierarchy changes, and evaluation of distressed transactions.
Refer to Note 28 to the Consolidated Financial Statements for a description of the Corporation’s valuation methodologies used for
the assets and liabilities measured at fair value.
Loans and Allowance for Credit Losses
Interest on loans is accrued and recorded as interest income based upon the principal amount outstanding.
Non-accrual loans are those loans on which the accrual of interest is discontinued. When a loan is placed on non-accrual status, all
previously accrued and unpaid interest is charged against interest income and the loan is accounted for either on a cash-basis
method or on the cost-recovery method. Loans designated as non-accruing are returned to accrual status when the Corporation
expects repayment of the remaining contractual principal and interest. The determination as to the ultimate collectability of the loan’s
balance may involve management’s judgment in the evaluation of the borrower’s financial condition and prospects for repayment.
Refer to the MD&A section titled Credit Risk, particularly the Non-performing assets sub-section, for a detailed description of the
Corporation’s non-accruing and charge-off policies by major loan categories.
One of the most critical and complex accounting estimates is associated with the determination of the allowance for credit losses
(“ACL”). The Corporation establishes an ACL for its loan portfolio based on its estimate of credit losses over the remaining
contractual term of the loans, adjusted for expected prepayments, in accordance with Accounting Standards Codification (“ASC”)
Topic 326. An ACL is recognized for all loans including originated and purchased loans, since inception, with a corresponding
charge to the provision for credit losses, except for purchased credit deteriorated (“PCD”) loans as explained below. The
Corporation follows a methodology to establish the ACL which includes a reasonable and supportable forecast period for estimating
credit losses, considering quantitative and qualitative factors as well as the economic outlook. As part of this methodology,
management evaluates various macroeconomic scenarios provided by third parties. At December 31, 2023, management applied
probability weights to the outcome of the selected scenarios.
The Corporation has designated as collateral dependent loans secured by collateral when foreclosure is probable or when
foreclosure is not probable but the practical expedient is used. The practical expedient is used when repayment is expected to be
provided substantially by the sale or operation of the collateral and the borrower is experiencing financial difficulty. The ACL of
collateral dependent loans is measured based on the fair value of the collateral less costs to sell. The fair value of the collateral is
62
based on appraisals, which may be adjusted due to their age, and the type, location, and condition of the property or area or general
market conditions to reflect the expected change in value between the effective date of the appraisal and the measurement date. In
addition, refer to the Credit Risk section of this MD&A for detailed information on the Corporation’s collateral value estimation for
other real estate.
Loans Acquired with Deteriorated Credit Quality
PCD loans are defined as those with evidence of a more-than-insignificant deterioration in credit quality since origination. PCD loans
are initially recorded at its purchase price plus an estimated ACL. Upon the acquisition of a PCD loan, the Corporation recognizes
the estimate of the expected credit losses over the remaining contractual term of each individual loan as an ACL with a
corresponding addition to the loan purchase price. The amount of the purchased premium or discount which is not related to credit
risk is amortized over the life of the loan through net interest income using the effective interest method or a method that
approximates the effective interest method. Changes in expected credit losses are recorded as an increase or decrease to the ACL
with a corresponding charge (reverse) to the provision for credit losses in the Consolidated Statements of Operations. These loans
follow the same nonaccrual policies as non-PCD loans.
Income Taxes
Income taxes are accounted for using the asset and liability method. Under this method, deferred tax assets and liabilities are
recognized based on the future tax consequences attributable to temporary differences between the financial statement carrying
amounts of existing assets and liabilities and their respective tax basis, and attributable to operating loss and tax credit
carryforwards. Deferred tax assets and liabilities are measured using enacted tax rates expected to apply in the years in which the
temporary differences are expected to be recovered or paid. The effect on deferred tax assets and liabilities of a change in tax rates
is recognized in earnings in the period when the changes are enacted.
The calculation of periodic income taxes is complex and requires the use of estimates and judgments. The Corporation has
recorded two accruals for income taxes: (i) the net estimated amount currently due or to be received from taxing jurisdictions,
including any reserve for potential examination issues, and (ii) a deferred income tax that represents the estimated impact of
temporary differences between how the Corporation recognizes assets and liabilities under GAAP, and how such assets and
liabilities are recognized under the tax code. Differences in the actual outcome of these future tax consequences could impact the
Corporation’s financial position or its results of operations. In estimating taxes, management assesses the relative merits and risks
of the appropriate tax treatment of transactions taking into consideration statutory, judicial and regulatory guidance.
A deferred tax asset should be reduced by a valuation allowance if based on the weight of all available evidence, it is more likely
than not (a likelihood of more than 50%) that some portion or the entire deferred tax asset will not be realized. The valuation
allowance should be sufficient to reduce the deferred tax asset to the amount that is more likely than not to be realized. The
determination of whether a deferred tax asset is realizable is based on weighting all available evidence, including both positive and
negative evidence. The realization of deferred tax assets, including carryforwards and deductible temporary differences, depends
upon the existence of sufficient taxable income of the same character during the carryback or carryforward period. The realization of
deferred tax assets requires the consideration of all sources of taxable income available to realize the deferred tax asset, including
the future reversal of existing temporary differences, future taxable income exclusive of reversing temporary differences and
carryforwards, taxable income in carryback years and tax-planning strategies.
Management evaluates the realization of the deferred tax asset by taxing jurisdiction. The U.S. mainland operations are evaluated
as a whole since a consolidated income tax return is filed; on the other hand, the deferred tax asset related to the Puerto Rico
operations is evaluated on an entity by entity basis, since no consolidation is allowed in the income tax filing. Accordingly, this
evaluation is composed of three major components: U.S. mainland operations, Puerto Rico banking operations and Holding
Company.
For the evaluation of the realization of the deferred tax asset by taxing jurisdiction, refer to Note 35 to the Consolidated Financial
Statements.
63
Under the Puerto Rico Internal Revenue Code, the Corporation and its subsidiaries are treated as separate taxable entities and are
not entitled to file consolidated tax returns. The Code provides a dividends-received deduction of 100% on dividends received from
“controlled” subsidiaries subject to taxation in Puerto Rico and 85% on dividends received from other taxable domestic corporations.
Changes in the Corporation’s estimates can occur due to changes in tax rates, new business strategies, newly enacted guidance,
and resolution of issues with taxing authorities regarding previously taken tax positions. Such changes could affect the amount of
accrued taxes. The Corporation has made tax payments in accordance with estimated tax payments rules. Any remaining payment
will not have any significant impact on liquidity and capital resources.
The valuation of deferred tax assets requires judgment in assessing the likely future tax consequences of events that have been
recognized in the financial statements or tax returns and future profitability. The accounting for deferred tax consequences
represents management’s best estimate of those future events. Changes in management’s current estimates, due to unanticipated
events, could have a material impact on the Corporation’s financial condition and results of operations.
The Corporation establishes tax liabilities or reduces tax assets for uncertain tax positions when, despite its assessment that the tax
return positions are appropriate and supportable under local tax law, the Corporation believes it may not succeed in realizing the tax
benefit of certain positions if challenged. In evaluating a tax position, the Corporation determines whether it is more likely than not
that the position will be sustained upon examination, including resolution of any related appeals or litigation processes, based on the
technical merits of the position. The Corporation’s estimate of the ultimate tax liability contains assumptions based on past
experiences, and judgments about potential actions by taxing jurisdictions as well as judgments about the likely outcome of issues
that have been raised by taxing jurisdictions. The tax position is measured as the largest amount of benefit that is greater than 50%
likely of being realized upon ultimate settlement. The Corporation evaluates these uncertain tax positions each quarter and adjusts
the related tax liabilities or assets in light of changing facts and circumstances, such as the progress of a tax audit or the expiration
of a statute of limitations. The Corporation believes the estimates and assumptions used to support its evaluation of uncertain tax
positions are reasonable.
The amount of unrecognized tax benefits may increase or decrease in the future for various reasons including adding amounts for
current tax year positions, expiration of open income tax returns due to the statutes of limitation, changes in management’s
judgment about the level of uncertainty, status of examinations, litigation and legislative activity and the addition or elimination of
uncertain tax positions. Although the outcome of tax audits is uncertain, the Corporation believes that adequate amounts of tax,
interest and penalties have been provided for any adjustments that are expected to result from open years. From time to time, the
Corporation is audited by various federal, state and local authorities regarding income tax matters. Although management believes
its approach in determining the appropriate tax treatment is supportable and in accordance with the accounting standards, it is
possible that the final tax authority will take a tax position that is different than the tax position reflected in the Corporation’s income
tax provision and other tax reserves. As each audit is conducted, adjustments, if any, are appropriately recorded in the consolidated
financial statement in the period determined. Such differences could have an adverse effect on the Corporation’s income tax
provision or benefit, or other tax reserves, in the reporting period in which such determination is made and, consequently, on the
Corporation’s results of operations, financial position and / or cash flows for such period.
Goodwill and Other Intangible Assets
The Corporation’s goodwill and other identifiable intangible assets having an indefinite useful life are tested for impairment.
Intangibles with indefinite lives are evaluated for impairment at least annually, and on a more frequent basis, if events or
circumstances indicate impairment could have taken place. Such events could include, among others, a significant adverse change
in the business climate, an adverse action by a regulator, an unanticipated change in the competitive environment and a decision to
change the operations or dispose of a reporting unit. Other identifiable intangible assets with a finite useful life are evaluated
periodically for impairment when events or changes in circumstances indicate that the carrying amount may not be recoverable.
Goodwill impairment is recognized when the carrying amount of any of the reporting units exceeds its fair value up to the amount of
the goodwill. The Corporation estimates the fair value of each reporting unit, consistent with the requirements of the fair value
measurements accounting standard, generally using a combination of methods, including market price multiples of comparable
companies and transactions, as well as discounted cash flow analyses. Subsequent reversal of goodwill impairment losses is not
permitted under applicable accounting standards. For a detailed description of the annual goodwill impairment evaluation performed
by the Corporation during the third quarter of 2023, refer to Note 15 to the Consolidated Financial Statements.
64
Pension and Postretirement Benefit Obligations
The Corporation provides pension and restoration benefit plans for certain employees of various subsidiaries. The Corporation also
provides certain health care benefits for retired employees of BPPR. The non-contributory defined pension and benefit restoration
plans (“the Pension Plans”) are frozen with regards to all future benefit accruals.
The estimated benefit costs and obligations of the Pension Plans and Postretirement Health Care Benefit Plan (“OPEB Plan”) are
impacted by the use of subjective assumptions, which can materially affect recorded amounts, including expected returns on plan
assets, discount rates, termination rates, retirement rates and health care trend rates. Management applies judgment in the
determination of these factors, which normally undergo evaluation against current industry practice and the actual experience of the
Corporation. The Corporation uses an independent actuarial firm for assistance in the determination of the Pension Plans and
OPEB Plan costs and obligations. Detailed information on the Plans and related valuation assumptions are included in Note 30 to
the Consolidated Financial Statements.
The Corporation periodically reviews its assumption for the long-term expected return on Pension Plans assets. The Pension Plans’
assets fair value at December 31, 2023 was $652.4 million. The expected return on plan assets is determined by considering
various factors, including a total fund return estimate based on a weighted-average of estimated returns for each asset class in each
plan. Asset class returns are estimated using current and projected economic and market factors such as real rates of return,
inflation, credit spreads, equity risk premiums and excess return expectations.
As part of the review, the Corporation’s independent consulting actuaries performed an analysis of expected returns based on each
plan’s expected asset allocation for the year 2024 using the Willis Towers Watson US Expected Return Estimator. This analysis is
reviewed by the Corporation and used as a tool to develop expected rates of return, together with other data. This forecast reflects
the actuarial firm’s view of expected long-term rates of return for each significant asset class or economic indicator as of January 1,
2024; for example, 8.5% for large cap stocks, 8.8% for small cap stocks, 9.0% for international stocks, 6.0% for long corporate
bonds and 5.0% for long Treasury bonds. A range of expected investment returns is developed, and this range relies both on
forecasts and on broad-market historical benchmarks for expected returns, correlations, and volatilities for each asset class.
As a consequence of recent reviews, the Corporation updated its expected return on plan assets for year 2024 to 5.6% and 6.6% for
the Pension Plans. Expected rates of return of 5.9% and 6.5% had been used for 2023 and 4.3% and 5.4% had been used for 2022
for the Pension Plans. Since the expected return assumption is on a long-term basis, it is not materially impacted by the yearly
fluctuations (either positive or negative) in the actual return on assets. The expected return can be materially impacted by a change
in the plan’s asset allocation.
Net Periodic Benefit Cost (“pension expense”) for the Pension Plans amounted to $18.6 million in 2023. The total pension expense
included a benefit of $34.4 million for the expected return on assets.
Pension expense is sensitive to changes in the expected return on assets. For example, decreasing the expected rate of return for
2024 from 5.6% to 5.35% would increase the projected 2024 pension expense for the Banco Popular de Puerto Rico Retirement
Plan, the Corporation’s largest plan, by approximately $1.5 million.
If the projected benefit obligation exceeds the fair value of plan assets, the Corporation shall recognize a liability equal to the
unfunded projected benefit obligation and vice versa, if the fair value of plan assets exceeds the projected benefit obligation, the
Corporation recognizes an asset equal to the overfunded projected benefit obligation. This asset or liability may result in a taxable or
deductible temporary difference and its tax effect shall be recognized as an income tax expense or benefit which shall be allocated
to various components of the financial statements, including other comprehensive income (loss). The determination of the fair value
of pension plan obligations involves judgment, and any changes in those estimates could impact the Corporation’s Consolidated
Statements of Financial Condition. Management believes that the fair value estimates of the Pension Plans assets are reasonable
given the valuation methodologies used to measure the investments at fair value as described in Note 28 to the Consolidated
Financial Statements. Also, the compositions of the plan assets are primarily in equity and debt securities, which have readily
determinable quoted market prices. The Corporation had recorded a pension asset of $16.6 million at December 31, 2023.
The Corporation uses the spot rate yield curve from the Willis Towers Watson RATE: Link (10/90) Model to discount the expected
projected cash flows of the plans. The equivalent single weighted average discount rate ranged from 5.02% to 5.05% for the
Pension Plans and 5.10% for the OPEB Plan to determine the benefit obligations at December 31, 2023.
65
A 50 basis point decrease to each of the rates in the December 31, 2023 Willis Towers Watson RATE: Link (10/90) Model would
increase the projected 2024 expense for the Banco Popular de Puerto Rico Retirement Plan by approximately $2.2 million. The
change would not affect the minimum required contribution to the Pension Plans.
The OPEB Plan was unfunded (no assets were held by the plan) at December 31, 2023. The Corporation had recorded a liability for
the underfunded postretirement benefit obligation of $117.0 million at December 31, 2023.
66
STATEMENT OF OPERATIONS ANALYSIS
Net Interest Income
Net interest income is the interest earned from loans, debt securities and money market investments, including loan fees, minus the
interest cost of deposits and borrowed money. Various risk factors affect net interest income including the economic environment in
which we operate, market related events, the mix and size of the earning assets and related funding, changes in volumes, repricing
characteristics, loan fees collected, delay charges and interest collected on nonaccrual loans, as well as strategic decisions made
by the Corporation’s management.
Net interest income for the year ended December 31, 2023 was $2.1 billion or $35.8 million lower than in 2022. Net interest income,
on a taxable equivalent basis, for the year ended December 31, 2023 was $2.3 billion compared to $2.4 billion in 2022, a decrease
of $154.4 million.
The average key index rates for the years 2023 and 2022 were as follows:
2023
2022
Prime rate………………………………………………………………………………………………….
8.19%
4.86%
Fed funds rate…………………………………………………………………………………………….
5.20
1.86
3-month Treasury Bill…………………………………………………………………………………….
3.59
2.01
10-year Treasury………………………………………………………………………………………….
3.45
2.95
FNMA 30-year…………………………………………………………………………………………….
4.94
4.26
Average outstanding securities balances are based upon amortized cost excluding any unrealized gains or losses on securities.
Non-accrual loans have been included in the respective average loans and leases categories. Loan fees collected, and costs
incurred in the origination of loans are deferred and amortized over the term of the loan as an adjustment to interest yield.
Prepayment penalties, late fees collected and the amortization of premiums / discounts on purchased loans, including the discount
accretion on purchased credit deteriorated loans (“PCD”), are also included as part of the loan yield. Interest income for the period
ended December 31, 2023, included $21.0 million related to those items, compared to $44.6 million for the same period in 2022.
The year over year decrease is related to lower amortized fees resulting from the forgiveness of PPP loans by $16.6 million, lower
discount amortization on commercial loans by $5.4 million mainly driven by lower interest from cancellation of PCD loans and $3.7
million lower amortization of the fair value discount of the auto portfolios acquired in previous years.
Table 3 presents the different components of the Corporation’s net interest income, on a taxable equivalent basis, for the year
ended December 31, 2023, as compared with the same period in 2022, segregated by major categories of interest earning assets
and interest-bearing liabilities. Net interest margin was 3.13% in 2023 or 2 basis points higher than the 3.11 % reported in 2022. The
higher net interest margin for the year is driven by a full year impact, on deposit costs, of the increase, in 2022, of 425 basis points
in the Federal Funds Rate and an additional 100 basis points in 2023. On a taxable equivalent basis, net interest margin
was 3.31% in 2023, compared to 3.46% in 2022, a decrease of 15 basis points. The main drivers for the decrease in net interest
income on a taxable equivalent basis were:
Negative variances:
●
Lower interest income from investment securities by $48.5 million due to lower volume by $1.8 billion and lower yield by
three basis points;
●
Higher interest expense on deposits by $797.2 million due to an increase in interest cost by 170 basis points resulting
mainly from the higher cost of the Puerto Rico government deposits and the increase in cost of Popular U.S. deposits.
Under the terms of BPPR’s deposit pricing agreement with the Puerto Rico public sector, public funds rates are market
linked with a lag minus a specified spread. This source of funding still results in an attractive spread under market rates.
Partially offset by:
67
●
Higher interest income from money market investments by $248.5 million due to higher interest rates by 396 basis points,
driven by the higher interest rate environment, as explained above, partially offset by lower volume by $2.5 billion, due to
lower volume of deposits and loan growth funding;
●
Higher interest income from loans by $462.5 million due to:
●
Increase in commercial loan Interest income by $284.1 million, or 109 basis points as the origination of loans
occurs in a higher interest rate scenario and the positive impact on the repricing of adjustable-rate loans,
partially offset by lower amortized fees resulting from the forgiveness of PPP loans by $16.6 million and lower
discount amortization on commercial loans by $5.4 million mainly from cancellation of PCD loans,
●
Higher interest income from construction loans by $23.4 million, mainly at Popular Bank, driven by higher
yield by 257 basis points and a higher average volume of loans by $38 million,
●
Higher interest income from auto and lease financing portfolios by $40.2 million driven by higher volume by
$175 million in the leasing portfolio and higher yields by 37 basis points in auto loans, the later increase in yield
was negatively impacted by lower amortization of the fair value discount of the auto loan portfolios acquired in
previous years,
●
higher average volume by $160 million,
●
Higher interest income from consumer loans by $91.0 million resulting from a higher volume by $372 million
and higher yield by 153 basis points, driven by the increase, mainly in P.R. in personal loans year over year
and an increase in credit cards volume.
68
Table 3 – Analysis of Levels & Yields on a Taxable Equivalent Basis from Continuing Operations (Non-GAAP)
Year ended December 31,
Variance
Average Volume
Average Yields / Costs
Interest
Attributable to
2023
2022
Variance
2023
2022
Variance
2023
2022
Variance
Rate
Volume
(In millions)
(In thousands)
$
7,052
$
9,531
$
(2,479)
5.20
%
1.24
%
3.96
%
Money market investments
$
366,625
$
118,079
$
248,546
$
286,646
$
(38,100)
27,926
29,743
(1,817)
2.20
2.23
(0.03)
Investment securities [1]
615,758
664,278
(48,520)
(8,273)
(40,247)
32
51
(19)
4.32
5.94
(1.62)
Trading securities
1,376
3,049
(1,673)
(700)
(973)
Total money market,
investment and trading
35,010
39,325
(4,315)
2.81
2.00
0.81
securities
983,759
785,406
198,353
277,673
(79,320)
Loans:
16,469
14,562
1,907
6.55
5.46
1.09
Commercial
1,079,171
795,115
284,056
171,681
112,375
816
778
38
8.86
6.29
2.57
Construction
72,309
48,920
23,389
20,927
2,462
1,650
1,475
175
6.38
5.92
0.46
Leasing
105,309
87,274
18,035
7,203
10,832
7,482
7,322
160
5.55
5.34
0.21
Mortgage
414,992
391,133
23,859
15,212
8,647
3,115
2,743
372
13.19
11.66
1.53
Consumer
410,910
319,920
90,990
43,806
47,184
3,633
3,525
108
8.39
8.02
0.37
Auto
304,660
282,533
22,127
13,257
8,870
33,165
30,405
2,760
7.20
6.33
0.87
Total loans
2,387,351
1,924,895
462,456
272,086
190,370
$
68,175
$
69,730
$
(1,555)
4.94
%
3.89
%
1.05
%
Total earning assets
$
3,371,110
$
2,710,301
$
660,809
$
549,759
$
111,050
Interest bearing deposits:
$
24,563
$
25,884
$
(1,321)
3.10
%
0.61
%
2.49
%
NOW and money market [2]
$
761,647
$
158,664
$
602,983
$
612,470
$
(9,487)
14,900
15,886
(986)
0.68
0.20
0.48
Savings
101,334
32,400
68,934
74,110
(5,176)
7,776
6,853
923
2.41
0.90
1.51
Time deposits
187,043
61,781
125,262
100,043
25,219
47,239
48,623
(1,384)
2.22
0.52
1.70
Total interest bearing deposits
1,050,024
252,845
797,179
786,623
10,556
15,307
16,094
(787)
Non-interest bearing demand
deposits
62,546
64,717
(2,171)
1.68
0.39
1.29
Total deposits
1,050,024
252,845
797,179
786,623
10,556
143
206
(63)
5.12
2.78
2.34
Short-term borrowings
7,329
5,737
1,592
4,506
(2,914)
Other medium and
1,109
939
170
5.09
4.26
0.83
long-term debt
56,430
39,970
16,460
9,458
7,002
Total interest bearing
48,491
49,768
(1,277)
2.30
0.60
1.70
liabilities (excluding demand
deposits)
1,113,783
298,552
815,231
800,587
14,644
4,377
3,868
509
Other sources of funds
$
68,175
$
69,730
$
(1,555)
1.63
%
0.43
%
1.20
%
Total source of funds
1,113,783
298,552
815,231
800,587
14,644
3.31
%
3.46
%
(0.15)
%
Net interest margin/ income
on a taxable equivalent basis
(Non-GAAP)
2,257,327
2,411,749
(154,422)
$
(250,828)
$
96,406
2.64
%
3.29
%
(0.65)
%
Net interest spread
Taxable equivalent
adjustment
125,803
244,390
(118,587)
3.13
%
3.11
%
0.02
%
Net interest margin/ income
non-taxable equivalent basis
(GAAP)
$
2,131,524
$
2,167,359
$
(35,835)
Note: The changes that are not due solely to volume or rate are allocated to volume and rate based on the proportion of the change in each category.
[1] Average balances exclude unrealized gains or losses on debt securities available-for-sale and the unrealized loss related to certain securities transferred from
available-for-sale to held-to-maturity.
69
Provision for Credit Losses - Loans Held-in-Portfolio and Unfunded Commitments
For the year ended December 31, 2023, the Corporation recorded an expense of $209.7 million for its allowance for credit losses
(“ACL”) related to loans held-in-portfolio and unfunded commitments, compared with an expense of $84.2 million for the year ended
December 31, 2022. The provision expense related to the loans-held-in-portfolio for the year 2023 was $201.5 million, compared to
an expense of $83.3 million for the year 2022. The increase in provision expense was driven by higher reserves in our consumer
and commercial portfolios mostly due to changes in credit quality and higher loan volumes. The provision for unfunded commitments
for the year 2023 reflected an expense of $8.2 million, compared to an expense of $0.9 million for the same period of 2022.
The provision expense related to loans held-in-portfolio for the BPPR segment was $194.8 million for the year ended December 31,
2023, compared to an expense of $69.5 million for the year ended December 31, 2022, an unfavorable variance of $125.3 million.
The provision expense related to loans held-in-portfolio for the Popular U.S. segment was $6.7 million for the year 2023, a favorable
variance of $7.1 million, compared to an expense of $13.8 million for the year 2022. As part of the Corporation’s model governance
procedures, a new model was implemented for the U.S commercial real estate segment. The new model enhances techniques used
to capture default activity within the Corporation’s geographical footprint. As part of the implementation analysis, management
evaluated the credit metrics of the portfolio such as risk ratings, delinquency levels, and low exposure to the commercial office
sector. Qualitative reserves continue to be maintained to address risks within the U. S. commercial real estate segment. The new
model, including qualitative reserve, resulted in a $7.3 million reduction of PB’s ACL.
At December 31, 2023, the total allowance for credit losses for loans held-in-portfolio amounted to $729.3 million, compared to
$720.3 million as of December 31, 2022. The ratio of the allowance for credit losses to loans held-in-portfolio was 2.08% at
December 31, 2023, compared to 2.25% at December 31, 2022. Refer to Note 9 to the Consolidated Financial Statements, for
additional information on the Corporation’s methodology to estimate its ACL. As discussed therein, within the process to estimate its
ACL, the Corporation applies probability weights to the outcomes of simulations using Moody’s Analytics’ Baseline, S3 (pessimistic)
and S1 (optimistic) scenarios. The baseline scenario is assigned the highest probability, followed by the pessimistic scenario. In
addition, refer to the Credit Risk section of this MD&A for a detailed analysis of net charge-offs, non-performing assets, the
allowance for credit losses and selected loan losses statistics.
Provision for Credit Losses – Investment Securities
The Corporation’s provision for credit losses related to its investment securities held-to-maturity is related to the portfolio of
obligations from the Government of Puerto Rico, states and political subdivisions. For the year ended December 31, 2023, the
Corporation recorded a reserve release of $1.1 million, compared to a reserve release of $1.2 million for the year ended December
31, 2022. At December 31, 2023, the total allowance for credit losses for this portfolio amounted to $5.8 million, compared to $6.9
million as of December 31, 2022. Refer to Note 7 to the Consolidated Financial Statements for additional information on the ACL for
this portfolio.
Non-Interest Income
For the year ended December 31, 2023, non-interest income decreased by $246.3 million, when compared with the previous year.
Factors that contributed to the variance in non-interest income were:
●
to the Evertec Transactions and related accounting adjustments;
●
million in the fair value adjustments for mortgage servicing rights and mortgage servicing fees, respectively, driven by
serviced loan portfolio runoff due to the Corporation's determination in the third quarter of 2022 to retain certain
guaranteed loans as held for investment, and lower gains from closed derivative positions by $6.0 million; and
●
Corporation’s determination to eliminate insufficient funds fees and modifying overdraft fees effective in the third quarter of
2022;
70
partially offset by:
●
million, mainly due to higher customer purchase activity, higher other fees by $11.1 million, mainly due to higher fees from
the merchant network business by $8.3 million due to the revenue sharing agreement entered into in connection with the
Evertec Transactions, higher debit card fees by $4.1 million, mainly due to higher volume of transactions, and higher
insurance fees by $3.8 million; and
●
deferred benefit plans, which have an offsetting effect recorded as higher personnel costs.
Operating Expenses
As discussed in the significant events section of this MD&A, to facilitate the transparency of the progress with the transformation
initiative and to better portray the level of technology related expenses categorized by the nature of the expense, effective in the
fourth quarter of 2022, the Corporation has separated technology, professional fees and transactional activities as standalone
expense categories in the accompanying Consolidated Statements of Operations. There were no changes to the total operating
expenses presented. Prior periods amount in the financial statements and related disclosures have been reclassified to conform to
the current presentation.
Table provides the detail of the reclassifications for the year.
Table 4 - Operating Expenses Reclassification
Year ended December 31,
2021
Financial statement line item
As reported
Adjustments
Adjusted
Equipment expenses
$
92,097
$
(59,178)
$
32,919
Professional fees
410,865
(284,144)
126,721
Technology and software expenses
-
277,979
277,979
Processing and transactional services
-
121,367
121,367
Communications
25,234
(11,205)
14,029
Other operating expenses
136,988
(44,819)
92,169
Net effect on operating expenses
$
665,184
$
-
$
665,184
71
Table 5 provides a breakdown of operating expenses by major categories.
Table 5 - Operating Expenses
Years ended December 31,
(In thousands)
2023
2022
2021
Personnel costs:
Salaries
$
505,935
$
432,910
$
371,644
Commissions, incentives and other bonuses
112,657
155,889
142,212
Pension, postretirement and medical insurance
67,469
56,085
52,077
Other personnel costs, including payroll taxes
91,984
74,880
65,869
Total personnel costs
778,045
719,764
631,802
Net occupancy expenses
111,586
106,169
102,226
Equipment expenses
37,057
35,626
32,919
Other taxes
55,926
63,603
56,783
Professional fees
161,142
172,043
126,721
Technology and software expenses
290,615
291,902
277,979
Processing and transactional services:
Credit and debit cards
44,578
45,455
40,383
Other processing and transactional services
93,492
81,690
80,984
Total processing and transactional services
138,070
127,145
121,367
Communications
16,664
14,885
14,029
Business promotion:
Rewards and customer loyalty programs
59,092
51,832
38,919
Other business promotion
35,834
37,086
34,062
Total business promotion
94,926
88,918
72,981
FDIC deposit insurance
105,985
26,787
25,579
Other real estate owned (OREO) income
(15,375)
(22,143)
(14,414)
Other operating expenses:
Operational losses
23,505
32,049
38,391
All other
73,774
77,397
53,778
Total other operating expenses
97,279
109,446
92,169
Amortization of intangibles
3,180
3,275
9,134
Goodwill impairment charge
23,000
9,000
-
Total operating expenses
$
1,898,100
$
1,746,420
$
1,549,275
Personnel costs to average assets
1.09
%
0.99
%
0.89
%
Operating expenses to average assets
2.66
2.40
2.18
Employees (full-time equivalent)
9,088
8,813
8,351
Average assets per employee (in millions)
$7.84
$8.26
$8.52
Operating expenses for the year ended December 31, 2023 totaled $1.9 billion, which included $71.4 million related to the FDIC
Special Assessment, an increase of $151.7 million when compared with the previous year. Excluding the effect of the FDIC Special
Assessment, total expenses for 2023 were $1.8 billion, an increase of $80.2 million, when compared with the previous year. During
the year 2023, the Corporation incurred approximately $21.5 million in transformation related costs, compared to $24.6 million
incurred during the second half of the year 2022. The other variances in operating expenses for the year were driven primarily by:
●
adjustments, annual salary revisions and an increase in headcount, an increase in health insurance costs by $11.7
million, higher payroll taxes and other compensation expenses by $17.1 million; partially offset by a decrease in incentive
compensation and profit-sharing accrual by $45.3 million;
72
●
$23 million was recorded in 2023, due to lower forecasted cash flows and an increase in the rate used to discount cash
flows, compared to an impairment of $9 million recorded in 2022 as a result of a decrease in the projected earnings.
●
debit card replacement costs incurred during the second quarter of 2023, the impact of $3.5 million of incentives received
during July 2022 related to the ATH Network Participation Agreement entered into in connection with the Evertec
Business Acquisition and an increase by $2.6 million in service charges related to point of sale debit card transactions;
●
purchase activity;
●
expense related to the space occupied by Popular Bank; and
●
commercial properties;
These variances were partially offset by:
●
Transactions of $17.3 million, lower sundry losses by $8.5 million, mainly related to mortgage claim reserves, and $2.2
million of impairment of long-lived assets recognized during 2022; partially offset by higher pension plan cost by $19.2
million due to changes in actuarial assumption.
●
$6.8 million from various Corporate projects, including the Corporation’s transformation initiative, for which certain projects
are being managed with internal personnel; and
●
examination fees in BPPR.
Income Taxes
For the year ended December 31, 2023, the Corporation recorded an income tax expense of $134.2 million, compared to $132.3
million for the same period of 2022. The net increase of $1.9 million in income tax expense reflects the impact of the composition
and source of taxable income between both years. For the year 2023, the income before tax was lower than year 2022, which
would have resulted in a lower income tax expense; however, the income tax expense of year 2022 benefited from the reversal of a
portion of the deferred tax assets valuation allowance of the U. S. operations, which resulted in an income tax benefit of $68.2
million, the sale of Evertec shares, taxable at a preferential rate, and a higher tax exempt income net of disallowance.
At December 31, 2023, the Corporation had a net deferred tax asset amounting to $1 billion, net of a valuation allowance of $0.5
billion. The net deferred tax asset related to the U. S. operations was $0.3 billion, net of a valuation allowance of $0.4 billion.
Refer to Note 35 to the Consolidated Financial Statements for a reconciliation of the statutory income tax rate to the effective tax
rate and additional information on the income tax expense and deferred tax asset balances.
Fourth Quarter Results
The Corporation recognized net income of $94.6 million for the quarter ended December 31, 2023, compared with a net income of
$257.1 million for the same quarter of 2022.
Net interest income for the fourth quarter of 2023 amounted to $534.1 million, compared with $559.6 million for the fourth quarter of
2022, a decrease of $25.4 million. The decrease in net interest income was mainly due to higher cost on deposits partially offset by
an increase in interest income from loans, mainly due to growth at both BPPR and PB and higher rates, and higher income from
73
money market investments due to higher average balances and higher rates. The net interest margin decreased by 20 basis points
to 3.08% mainly due to an increase in deposit costs, particularly on Puerto Rico public funds and time deposits at PB. On a taxable
equivalent basis, the net interest margin for the fourth quarter of 2023 was 3.26%, compared to 3.64% for the fourth quarter of 2022.
The provision for credit losses was $78.7 million for the fourth quarter of 2023, compared to a provision expense of $49.5 million for
the fourth quarter of 2022. The increase in provision expense reflects portfolio growth and changes in credit quality.
Non-interest income amounted to $168.7 million for the quarter ended December 31, 2023, compared with $158.5 million for the
same quarter in 2022. The increase of $10.3 million was mainly due to higher other service fees by $7.7 million and higher service
charges on deposit accounts by $3.0 million mainly due to higher non-balance compensation.
Operating expenses totaled $531.1 million for the quarter ended December 31, 2023, compared with $461.7 million for the same
quarter in the previous year. The increase of $69.4 million is mainly related to the $71.4 million FDIC Special Assessment
recognized during the fourth quarter of 2023; partially offset by lower professional fees by $10.1 million mainly related to various
corporate projects, including the transformation initiative, for which certain areas are currently being managed by internal personnel.
For the quarter ended December 31, 2023, the Corporation recorded an income tax benefit of $1.5 million, compared with an
income tax benefit of $50.3 million for the same quarter of 2022. The unfavorable variance of $48.9 million in income tax benefit,
when compared to the fourth quarter of 2022, was mostly attributed to the reversal of a portion of the deferred tax assets valuation
allowance during the fourth quarter of 2022, for which we reported an income tax benefit of $68.2 million. During the fourth quarter
of 2023, we reported a lower income before tax, mainly due to the FDIC Special Assessment, which resulted in a lower income tax
expense by approximately $42.6 million. We also recorded lower exempt income and other lower tax benefits, both increasing the
income tax expense by $15.5 million and 7.2 million, respectively.
REPORTABLE SEGMENT RESULTS
The Corporation’s reportable segments for managerial reporting purposes consist of Banco Popular de Puerto Rico and Popular
U.S. A Corporate group has been defined to support the reportable segments.
For a description of the Corporation’s reportable segments, including additional financial information and the underlying
management accounting process, refer to Note 37 to the Consolidated Financial Statements.
The Corporate group reported a net income of $13.3 million for the year ended December 31, 2023, compared with a net income of
$150.1 million for the previous year. The decrease in net income was mainly attributed to the $128.8 million in after-tax gains
recognized by the Corporation as a result of the Evertec Stock Sale, as defined in Note 4 to the Consolidated Financial Statements,
and related accounting adjustments during the year ended September 30,2022.
Highlights on the earnings results for the reportable segments are discussed below:
Banco Popular de Puerto Rico
The Banco Popular de Puerto Rico reportable segment’s net income amounted to $472.0 million for the year ended December 31,
2023, compared with $782.0 million for the year ended December 31, 2022. The principal factors that contributed to the variance in
the financial results included the following:
●
higher costs on the market-indexed Puerto Rico government deposits, and the higher interest rate environment’s impact
on the cost of NOW accounts, time deposits and savings deposits; partially offset by higher interest income from money
market and investment securities by $287.5 million mainly due to higher yields driven by the increase in rates by the
Federal Reserve and higher average balances of U.S. Treasury securities; and higher interest income from loans by
$317.4 million, mainly due to higher average balances mainly in commercial and consumer loans and higher yields across
74
all the portfolios
. The BPPR segment’s net interest margin was 3.20% for 2023 compared with 3.06% for the same period
in 2022.
●
unfavorable variance of $124.0 million, due in part to loan growth;
●
●
Transactions and related accounting adjustments on 2022,
●
serving rights and mortgage servicing fees, driven by serviced loan portfolio runoff due to Corporation’s
determination in the third quarter of 2022 to retain certain guaranteed loans as held for investment, and lower gains
from closed derivative positions;
●
insufficient fund fees and modifying overdraft fees implemented in the third quarter of 2022.
●
●
increases, market and minimum salary adjustments and higher pension and health insurance costs; partially offset
by a decrease in profit sharing in incentive compensation;
●
transactional volumes;
●
●
expense as a result of higher transactional volumes,
●
compliance and cyber security efforts as well as the transformation initiative.
Partially offset by:
●
on 2022 and lower mortgage related sundry losses by $5.6 million mainly due to a reserve release adjustment
recorded in 2022 and lower charges allocated from the Corporate segment group by $9.1 million mainly from lower
personnel costs; partially offset by higher pension plan cost by $19.2 million due to charges in actuarial assumptions;
●
services from Evertec during 2022;
●
properties.
●
sources of taxable income in each year.
Popular U.S.
75
For the year ended December 31, 2023, the reportable segment of Popular U.S. reported net income of $56.3 million, compared
with a net income of $170.3 million for the year ended December 31, 2022. The principal factors that contributed to the variance in
the financial results included the following:
●
to higher rates and higher average balance of time deposit primarily gathered through its direct online channel, partially
offset by higher interest income from loans by $138.1 million, mainly from growth in the commercial portfolio as well as
higher yields due to increases in rates, and higher income from money market and investment securities by $47.4 million
due to higher yields and higher average balance. The Popular U.S. reportable segment’s net interest margin was 2.98%
for 2023 compared with 3.68% for the same period in 2022;
●
updated macroeconomics scenarios offset by the implementation of the new model for the U.S. commercial real estate
loans, which resulted in a reserve release of $14.6 million;
●
related to the acquisition of the commercial lease business at Popular Equipment Finance;
●
●
●
due to early termination of contracts;
●
2023;
●
million, mainly professional fees; and
●
due to lower forecast cash flows and increase in the rate to discount cash flows, compared to an impairment of
$9.0 million recorded in 2022, an unfavorable variance of $14.0 million.
●
allowance recorded during the fourth quarter of 2022 of $68.2 million.
STATEMENT OF FINANCIAL CONDITION ANALYSIS
Assets
The Corporation’s total assets were $70.8 billion at December 31, 2023, compared to $67.6 billion at December 31, 2022. Refer to
the Corporation’s Consolidated Statements of Financial Condition at December 31, 2023 and 2022 included in this Form 10-K. Also,
refer to the Statistical Summary 2023-2022 in this MD&A for Condensed Statements of Financial Condition.
Money market investments and debt securities
Money market investments increased by $1.4 billion at December 31, 2023, when compared to December 31, 2022. This was
impacted by the increase in deposits of $2.4 billion, mainly due to higher Puerto Rico public sector deposits at BPPR and time
deposit at PB. Debt securities available-for-sale decreased by $1.1 billion, mainly due repayments and maturities, while debt
securities held-to-maturity decreased by $329.9 million. Refer to Notes 6 and 7 to the Consolidated Financial Statements for
additional information with respect to the Corporation’s debt securities available-for-sale and held-to-maturity.
Loans
76
Refer to Table 6 for a breakdown of the Corporation’s loan portfolio. Also, refer to Note 8 to the Consolidated Financial Statements
for detailed information about the Corporation’s loan portfolio composition and loan purchases and sales.
Loans held-in-portfolio increased by $3.0 billion to $35.1 billion at December 31, 2023, mainly due to growth in the commercial
portfolio of $2.0 billion, reflected at both BPPR and PB by approximately $1.1 billion and $0.9 billion, respectively, and consumer
loans at BPPR. Consumer loans at BPPR increased by $445.0 million in the aggregate including credit cards, personal loans and
auto loans. The increase in BPPR’s consumer portfolio is aligned with the increase in retail sales and consumer spending in Puerto
Rico during 2023. The auto loans portfolio at BPPR benefited from the sustained level of auto sales activity on the island. In
addition, mortgage loans increased by $281.5 million from the previous year, as the Corporation continued to retain, in portfolio,
FHA-guaranteed mortgage loans originations.
A portion of the Corporation’s $3.0 billion year over year loan growth in 2023 was driven by its non-owner occupied commercial real
estate and commercial multi-family portfolios, as detailed in Table 6. Due to market pressures from shifts to hybrid work
environments since the pandemic, particularly in the New York Metro area where the Corporation operates, and the effect of the
current higher interest rate environment, there has been increased focus about the risks of these categories of loans.
The Corporation’s $5.1 billion non-owner occupied commercial real estate portfolio is comprised of $3.0 billion in Puerto Rico and
$2.1 billion in the U.S. and is well diversified across a number of tenants in different industries and segments with exposure to retail
(35% of non-owner occupied CRE), hotels (20%) and office space (12%) accounting for two thirds of the total exposure. The
approximate $639 million office space exposure represents only 1.8% of the total loan portfolio and is comprised mainly of mid-rise
properties with diversified tenants with average loan size of $2 million across both the U.S. and Puerto Rico.
Popular’s $2.4 billion commercial multi-family portfolio represents approximately 7% of total loans and is concentrated in New York
Metro ($1.4 billion), South Florida ($768 million) and Puerto Rico ($185 million). In the New York Metro region, the Corporation has
no exposure to rent controlled buildings. The majority of our multi-family loans, in that region, are collateralized by underlying
buildings that count on a mix of units subject to rent stabilized (subject to annual capped rent increases) and market-rate units. The
rent stabilized units represent less than 40% of the total units in the loan portfolio with the majority originated after 2019. The mix of
units within a building is common across the New York Metro region due to tax incentives awarded to developers based on rent
stabilized units. In 2024, there are approximately $237 million in multi-family loans in our New York Metro portfolio expected to
reprice.
Refer to Note 9 to the Consolidated Financial Statements for additional information on delinquency, asset quality and origination
vintage information of these loan segments.
The allowance for credit losses for the loan portfolio increased by $9.0 million, net of the impact of the adoption of ASU 2022-02 on
January 1, 2023 (Troubled Debt Restructuring by Creditors), mainly due to changes in credit quality metrics and portfolio growth.
Refer to the Credit Quality section of the MD&A for additional information on the Allowance for credit losses for the loan portfolio.
77
Table 6 - Loans Ending Balances
December 31,
(In thousands)
2023
2022
Loans held-in-portfolio:
Commercial
$
2,415,620
$
2,321,713
5,087,421
4,499,670
3,080,635
3,078,549
7,126,121
5,839,200
Total Commercial
17,709,797
15,739,132
Construction
959,280
757,984
Leasing
1,731,809
1,585,739
Mortgage
7,695,917
7,397,471
Consumer
1,135,747
1,041,870
65,953
71,916
1,945,247
1,823,579
3,660,780
3,512,530
160,441
147,548
Total Consumer
6,968,168
6,597,443
Total loans held-in -portfolio
$
35,064,971
$
32,077,769
Loans held-for-sale:
$
4,301
$
5,381
Total loans held-for-sale
$
4,301
$
5,381
Total loans
$
35,069,272
$
32,083,150
Other assets
Other assets amounted to $2.0 billion at December 31, 2023, an increase of $166.8 million compared to $1.8 billion at December
31, 2022. At December 31, 2023, this includes $176 million in cash receivable from the maturities of investment securities. Refer to
Note 14 to the Consolidated Financial Statements for a breakdown of the principal categories that comprise the caption of “Other
Assets” in the Consolidated Statements of Financial Condition at December 31, 2023 and 2022.
Liabilities
The Corporation’s total liabilities were $65.6 billion at December 31, 2023, an increase of $2.1 billion compared to $63.5 billion at
December 31, 2022, mainly due to an increase in deposits as discussed below. Refer to the Corporation’s Consolidated Statements
of Financial Condition included in this Form 10-K.
Deposits and Borrowings
The composition of the Corporation’s financing to total assets at December 31, 2023 and 2022 is included in Table 7.
78
Table 7 - Financing to Total Assets
December 31,
December 31,
% increase (decrease)
% of total assets
(In millions)
2023
2022
from 2022 to 2023
2023
2022
Non-interest bearing deposits
$
15,420
$
15,960
(3.4)
%
21.8
%
23.6
%
Interest-bearing core deposits
43,571
41,600
4.7
61.6
61.5
Other interest-bearing deposits
4,627
3,667
26.2
6.5
5.4
Repurchase agreements
91
149
(38.9)
0.1
0.2
Other short-term borrowings
-
365
N.M.
-
0.5
Notes payable
987
887
11.3
1.4
1.3
Other liabilities
915
917
(0.2)
1.3
1.4
Stockholders’ equity
5,147
4,093
25.8
7.3
6.1
Deposits
The Corporation’s deposits totaled $63.6 billion at December 31, 2023, compared to $61.2 billion at December 31, 2022.The
deposits increase of $2.4 billion was mainly in Puerto Rico public sector deposits at BPPR and time deposits at PB. Public sector
deposit balances amounted to $18.1 billion at December 31, 2023, compared to $15.2 billion at December 31, 2022. The receipt by
the Puerto Rico Government of additional federal assistance, and seasonal tax collections, could increase public deposit balances
at BPPR in the near term. However, the rate at which public deposit balances may decline is uncertain and difficult to predict. The
amount and timing of any such reduction is likely to be impacted by, for example, the speed at which federal assistance is
distributed, the financial condition, liquidity and cash management practices of the Puerto Rico Government and its instrumentalities
and the implementation of fiscal and debt adjustment plans approved pursuant to PROMESA or other actions mandated by the
Fiscal Oversight and Management Board for Puerto Rico (the “Oversight Board”).
Approximately 28% of the Corporation’s deposits are public fund deposits from the Government of Puerto Rico, municipalities and
government instrumentalities and corporations (“public funds’’). These public funds deposits are indexed to short-term market rates
and fluctuate in cost with changes in those rates with a one-quarter lag, in accordance with contractual terms. As a result, these
deposits’ costs have generally lagged variable asset repricing. Generally, these deposits require that the bank pledge high credit
quality securities as collateral; therefore, liquidity risks arising from public sector deposit outflows are lower. Refer to the Liquidity
section in this MD&A for additional information on the Corporation’s funding sources.
Refer to Table 8 for a breakdown of the Corporation’s deposits at December 31, 2023 and 2022.
Table 8 - Deposits Ending Balances
(In thousands)
2023
2022
Demand deposits
[1]
$
27,579,054
$
26,382,605
Savings, NOW and money market deposits (non-brokered)
26,817,844
27,265,156
Savings, NOW and money market deposits (brokered)
719,453
798,064
Time deposits (non-brokered)
7,546,138
6,442,886
Time deposits (brokered CDs)
955,754
338,516
Total deposits
$
63,618,243
$
61,227,227
[1] Includes interest and non-interest bearing demand deposits.
Borrowings
The Corporation’s borrowings amounted to $1.1 billion at December 31, 2023, compared to $1.4 billion at December 31, 2022.
Refer to Note 17 to the Consolidated Financial Statements for detailed information on the Corporation’s borrowings. Also, refer to
the Liquidity section in this MD&A for additional information on the Corporation’s funding sources.
79
Other liabilities
The Corporation’s other liabilities amounted to $0.9 billion at December 31, 2023, consistent with the December 31, 2022 balance.
Stockholders’ Equity
Stockholders’ equity totaled $5.1 billion at December 31, 2023, an increase of $1.1 billion when compared to December 31, 2022.
The increase was principally due to lower accumulated unrealized gain/losses on debt securities available-for-sale by $472.5 million
and net income for the year ended December 31, 2023 of $541.3 million, partially offset by declared dividends of $163.7 million and
$1.4 million on common stock and preferred stock, respectively. Refer to the Consolidated Statements of Financial Condition,
Comprehensive Income and of Changes in Stockholders’ Equity for information on the composition of stockholders’ equity. Also,
refer to Note 22 to the Consolidated Financial Statements for a detail of accumulated other comprehensive income (loss), an
integral component of stockholders’ equity.
80
REGULATORY CAPITAL
The Corporation and its bank subsidiaries are subject to capital adequacy standards established by the Federal Reserve Board. The
risk-based capital standards applicable to Popular, Inc. and the Banks, BPPR and PB, are based on the final capital framework of
Basel III. The capital rules of Basel III include a “Common Equity Tier 1” (“CET1”) capital measure and specifies that Tier 1 capital
consist of CET1 and “Additional Tier 1 Capital” instruments meeting specified requirements. Note 21 to the Consolidated Financial
Statements presents further information on the Corporation’s regulatory capital requirements, including the regulatory capital ratios
of its depository institutions, BPPR and PB.
An institution is considered “well-capitalized” if it maintains a total capital ratio of 10%, a Tier 1 capital ratio of 8%, a CET1 capital
ratio of 6.5% and a leverage ratio of 5%. The Corporation’s ratios presented in Table
9 show that the Corporation was “well
capitalized” for regulatory purposes, the highest classification, under Basel III for years 2023 and 2022. BPPR and PB were also
well-capitalized for all years presented.
The Basel III Capital Rules also require an additional 2.5% “capital conservation buffer”, composed entirely of CET1, on top of these
minimum risk-weighted asset ratios, which excludes the leverage ratio. The capital conservation buffer is designed to absorb losses
during periods of economic stress. Banking institutions with a ratio of CET1 to risk-weighted assets above the minimum but below
the capital conservation buffer will face constraints on dividends, equity repurchases, and compensation based on the amount of the
shortfall. Popular, BPPR and PB are required to maintain this additional capital conservation buffer of 2.5% of CET1, resulting in
minimum ratios of (i) CET1 to risk-weighted assets of at least 7%, (ii) Tier 1 capital to risk-weighted assets of at least 8.5%, and
(iii) Total capital to risk-weighted assets of at least 10.5%.
Table 9 presents the Corporation’s capital adequacy information for the years 2023 and 2022.
Table 9 - Capital Adequacy Data
At December 31,
(Dollars in thousands)
2023
2022
Risk-based capital:
Common Equity Tier 1 capital
$
6,053,315
$
5,639,686
Additional Tier 1 Capital
22,143
22,143
Tier 1 capital
$
6,075,458
$
5,661,829
Supplementary (Tier 2) capital
658,507
623,818
$
6,733,965
$
6,285,647
$
37,146,330
$
34,415,889
Adjusted average quarterly assets
$
71,353,184
$
70,287,610
Ratios:
Common Equity Tier 1 capital
16.30
%
16.39
%
Tier 1 capital
16.36
16.45
Total capital
18.13
18.26
Leverage ratio
8.51
8.06
Average equity to assets
[1]
9.27
8.25
Average tangible equity to assets
[1]
8.19
7.27
[1]
Average balances exclude unrealized gains or losses on debt securities available-for-sale and unrealized losses on debt securities transfer
to held-to-maturities
On April 1, 2020, the Corporation adopted the final rule issued by the federal banking regulatory agencies pursuant to the Economic
Growth and Regulatory Paperwork Reduction Act of 1996 that simplified several requirements in the agencies’ regulatory capital
rules. These rules simplified the regulatory capital requirement for mortgage servicing assets (MSAs), deferred tax assets arising
from temporary differences and investments in the capital of unconsolidated financial institutions by raising the CET1 deduction
threshold from 10% to 25%. The 15% CET1 deduction threshold which applies to the aggregate amount of such items was
eliminated. The rule also requires, among other changes, increasing from 100% to 250% the risk weight to MSAs and temporary
81
difference deferred tax asset not deducted from capital. For investments in the capital of unconsolidated financial institutions, the
risk weight would be based on the exposure category of the investment.
The decrease in the CET1 capital ratio, Tier 1 capital ratio and, total capital ratio as of December 31, 2023, compared to December
31, 2022,
was mostly due to an increase in risk weighted assets driven by the growth in the commercial and consumer loan
portfolios, partially offset by the annual earnings. The increase in the leverage capital ratio was mainly due to the increase in capital
driven by the annual earnings, partially offset by a slight increase in average total assets.
Pursuant to the adoption of CECL on January 1, 2020, the Corporation elected to use the five-year transition period option as
provided in the final interim regulatory capital rules effective March 31,2020. The five-year transition period provision delays for two
years the estimated impact of CECL on regulatory capital, followed by a three-year transition period to phase out the aggregate
amount of the capital benefits provided during the initial two-year delay. As of December 31, 2023, the Corporation had phased-in
50% of the cumulative CECL deferral with the remaining impact to be recognized over the remaining two years. In the first quarter of
2024, the Corporation will phase in a cumulative 75% of the deferral.
On August 26, 2020, federal banking regulators issued a final rule to modify the Basel III regulatory capital rules applicable to
banking organizations to allow those organizations participating in the Paycheck Protection Program (“PPP”) established under the
Coronavirus Aid, Relief and Economic Security Act (the “CARES Act”) to neutralize the regulatory capital effects of participating in
the program. Specifically, the agencies have clarified that banking organizations, including the Corporation and its Bank
subsidiaries, are permitted to assign a zero percent risk weight to PPP loans for purposes of determining risk-weighted assets and
risk-based capital ratios. Additionally, in order to facilitate use of the Paycheck Protection Program Liquidity Facility (the “PPPL
Facility”), which provides Federal Reserve Bank loans to eligible financial institutions such as the Corporation’s Bank subsidiaries to
fund PPP loans, the agencies further clarified that, for purposes of determining leverage ratios, a banking organization is permitted
to exclude from total average assets PPP loans that have been pledged as collateral for a PPPL Facility. As of December 31, 2023,
the Corporation has $9 million in PPP loans and no loans were pledged as collateral for PPPL Facilities.
Table 10 reconciles the Corporation’s total common stockholders’ equity to common equity Tier 1 capital.
Table 10 - Reconciliation Common Equity Tier 1 Capital
At December 31,
(In thousands)
2023
2022
Common stockholders’ equity
$
5,209,561
$
4,198,409
1,831,003
2,468,193
(666,538)
(691,560)
(9,764)
(12,944)
(310,947)
(322,412)
Common equity tier 1 capital
$
6,053,315
$
5,639,686
Common equity tier 1 capital to risk-weighted assets
16.30
%
16.39
%
Non-GAAP financial measures
The tangible common equity ratio and tangible book value per common share, which are presented in the table that follows, are
non-GAAP measures. Management and many stock analysts use the tangible common equity ratio and tangible book value per
common share in conjunction with more traditional bank capital ratios to compare the capital adequacy of banking organizations with
significant amounts of goodwill or other intangible assets, typically stemming from the use of the purchase accounting method of
accounting for mergers and acquisitions. Neither tangible common equity nor tangible assets or related measures should be
considered in isolation or as a substitute for stockholders’ equity, total assets or any other measure calculated in accordance with
generally accepted accounting principles in the United States of America (“GAAP”). Moreover, the manner in which the Corporation
calculates its tangible common equity, tangible assets and any other related measures may differ from that of other companies
reporting measures with similar names.
The decrease in the Tangible common equity to tangible assets ratio during 2022 was mainly related to the decrease in the fair
value of the Corporation’s fixed rate available for sale debt securities portfolio and its impact on the unrealized loss component of
82
accumulated other comprehensive income (loss) (‘’AOCI’’). Given its ability due to the Corporation’s liquidity position and its
intention to reduce the impact on AOCI and tangible capital of further increases in interest rates, management changed its intent to
hold certain securities to maturity. Therefore, in October 2022, the Corporation transferred U.S. Treasury securities with a fair value
of $6.5 billion (par value of $7.4 billion) from its available-for-sale portfolio to its held-to-maturity portfolio.
The securities were reclassified at fair value at the time of the transfer. At the date of the transfer, these securities had pre-tax
unrealized losses of $873.0 million recorded in AOCI. This fair value discount is being accreted to interest income and the
unrealized loss remaining in AOCI is being amortized, offsetting each other through the remaining life of the securities. There were
no realized gains or losses recorded as a result of this transfer.
While changes in the amount of unrealized gains and losses in AOCI have an impact on the Corporation’s and its wholly-owned
banking subsidiaries’ tangible capital ratios, they do not impact regulatory capital ratios, in accordance with the regulatory
framework. Refer to Note 7 to the Consolidated Financial Statements which presents information about the Corporation’s Debt
Securities Held-to-Maturity for additional details.
Table 11 provides a reconciliation of total stockholders’ equity to tangible common equity and total assets to tangible assets at
December 31, 2023 and 2022.
83
Table 11 - Reconciliation of Tangible Common Equity and Tangible Assets
At December 31,
(In thousands, except share or per share information)
2023
2022
Total stockholders’ equity
$
5,146,953
$
4,093,425
Less: Preferred stock
(22,143)
(22,143)
Less: Goodwill
(804,428)
(827,428)
Less: Other intangibles
(9,764)
(12,944)
Total tangible common equity
$
4,310,618
$
3,230,910
Total assets
$
70,758,155
$
67,637,917
Less: Goodwill
(804,428)
(827,428)
Less: Other intangibles
(9,764)
(12,944)
Total tangible assets
$
69,943,963
$
66,797,545
Tangible common equity to tangible assets
6.16
%
4.84
%
Common shares outstanding at end of period
72,153,621
71,853,720
Tangible book value per common share
$
59.74
$
44.97
Year-to-date average
Total stockholders’ equity [1]
$
5,853,276
$
5,798,407
Average unrealized (gains) losses on AFS securities transferred to HTM
747,327
210,818
Adjusted total stockholder's equity
6,600,603
6,009,225
Less: Preferred Stock
(22,143)
(22,143)
Less: Goodwill
(821,567)
(757,133)
Less: Other intangibles
(11,473)
(17,113)
Total tangible common equity
$
5,745,420
$
5,212,836
Average return on tangible common equity
9.40
%
21.13
%
[1] Average balances exclude unrealized gains or losses on debt securities available-for-sale.
84
RISK MANAGEMENT
Market / Interest Rate Risk
The financial results and capital levels of the Corporation are constantly exposed to market, interest rate and liquidity risks.
Market risk refers to the risk of a reduction in the Corporation’s capital due to changes in the market valuation of its assets and/or
liabilities.
Most of the assets subject to market valuation risk are debt securities classified as available-for-sale. Refer to Notes 6 and 7 to the
Consolidated Financial Statements for further information on the debt securities available-for-sale and held-to-maturity portfolios.
Debt securities classified as available-for-sale amounted to $16.7 billion as of December 31, 2023. Other assets subject to market
risk include loans held-for-sale, which amounted to $4 million, mortgage servicing rights (“MSRs”) which amounted to $118 million,
and securities classified as “trading”, which amounted to $32 million, as of December 31, 2023.
Interest Rate Risk (“IRR”)
The Corporation’s net interest income is subject to various categories of interest rate risk, including repricing, basis, yield curve and
option risks. In managing interest rate risk, management may alter the mix of floating and fixed rate assets and liabilities, change
pricing schedules, adjust maturities through sales and purchases of investment securities, and enter into derivative contracts,
among other alternatives.
Interest rate risk management is an active process that encompasses monitoring loan and deposit flows complemented by
investment and funding activities. Effective management of interest rate risk begins with understanding the dynamic characteristics
of assets and liabilities and determining the appropriate rate risk position given line of business forecasts, management objectives,
market expectations and policy constraints.
Management utilizes various tools to assess IRR, including Net Interest Income (“NII”) simulation modeling, static gap analysis, and
Economic Value of Equity (“EVE”). The three methodologies complement each other and are used jointly in the evaluation of the
Corporation’s IRR. NII simulation modeling is prepared for a five-year period, which in conjunction with the EVE analysis, provides
management a better view of long-term IRR.
Net interest income simulation analysis performed by legal entity and on a consolidated basis is a tool used by the Corporation in
estimating the potential change in net interest income resulting from hypothetical changes in interest rates. Sensitivity analysis is
calculated using a simulation model which incorporates actual balance sheet figures detailed by maturity and interest yields or costs.
Management assesses interest rate risk by comparing various NII simulations under different interest rate scenarios that differ in
direction of interest rate changes, the degree of change and the projected shape of the yield curve. For example, the types of rate
scenarios processed during the quarter include flat rates, implied forwards, and parallel and non-parallel rate shocks. Management
also performs analyses to isolate and measure basis and prepayment risk exposures.
The asset and liability management group performs validation procedures on various assumptions used as part of the simulation
analyses as well as validations of results on a monthly basis. In addition, the model and processes used to assess IRR are subject
to independent validations according to the guidelines established in the Model Governance and Validation policy.
The Corporation processes NII simulations under interest rate scenarios in which the yield curve is assumed to rise and decline by
the same magnitude (parallel shifts). The rate scenarios considered in these market risk simulations include instantaneous parallel
changes of -100, -200, +100, and +200 basis points during the succeeding twelve-month period. Simulation analyses are based on
many assumptions, including that the balance sheet remains flat, the relative levels of market interest rates across all yield curve
points and indexes, interest rate spreads, loan prepayments and deposit elasticity. Thus, they should not be relied upon as
indicative of actual results. Further, the estimates do not contemplate actions that management could take to respond to changes in
interest rates. Additionally, the Corporation is also subject to basis risk in the repricing of its assets and liabilities, including the basis
related to using different rate indexes for the repricing of assets and liabilities, as well as the effect of pricing lags which may be
contractual or due to historical differences in the timing of management responses to changes in the rate environment. By their
nature, these forward-looking computations are only estimates and may be different from what may actually occur in the future. The
following table presents the results of the simulations at December 31, 2023 and December 31, 2022, assuming a static balance
sheet and parallel changes over flat spot rates over a one-year time horizon:
85
Table 12 - Net Interest Income Sensitivity (One Year Projection)
December 31, 2023
December 31, 2022
(Dollars in thousands)
Amount Change
Percent Change
Amount Change
Percent Change
Change in interest rate
+200 basis points
20,822
0.92
(18,003)
(0.82)
+100 basis points
11,496
0.51
(7,748)
(0.35)
-100 basis points
19,589
0.87
8,778
0.40
-200 basis points
16,971
0.75
9,296
0.42
The results of the NII simulations at December 31, 2022 in the table above have been adjusted from those reported in the
Corporation’s 2022 Form 10-K to reflect the effect of changes in certain modeling assumptions in down rate scenario simulations for
certain variable rate loans. Specifically, the yield on certain variable rate loans that did not have contractual periodic floors, were not
repricing according to the terms of those variable rate loans in the down rate simulations.
Although the adjustment referred to in the preceding paragraph results in the magnitude of the Corporation’s sensitivity to decreases
in interest rates becoming lower, as of December 31, 2022, the adjusted NII simulations continued to show that the Corporation had
a neutral to slightly liability sensitive position driven by the rapid increase in short-term interest rates throughout 2022.
As of December 31, 2023, NII simulations show the Corporation has a neutral to slightly asset sensitive position as compared to a
slightly liability sensitive position as of December 31, 2022. The primary reasons for the variation in sensitivity are changes in
balance sheet composition driven by an increase in overnight Fed Funds, short-term U.S Treasury Bills (“T- Bills”) and loan portfolio
on the asset side partially offset by higher Puerto Rico public sector deposits which are indexed to market rates and an increase in
time deposits. These results suggest that changes in the Corporation’s net interest income sensitivity are driven by changes in the
composition of the investment portfolio as the term bond portfolio continues to run off and get reinvested in short-term investments
such as T-Bills, combined with the increase of approximately $3.0 billion in loans held in portfolio. Additionally, variation in liability
cost, primarily driven by Puerto Rico public sector deposits that represented $18.1 billion or 28% of deposits as of December 31,
2023, as well as an increase of approximately $1.7 billion in time deposits, also impact the sensitivity profile. In declining rate
scenarios net interest income would slightly increase as the decline in the cost of these deposit generates a greater benefit than the
changes in assets yields. In rising rate scenarios, Popular’s net interest income is also impacted by its large proportion of Puerto
Rico public sector deposit, however the repricing of assets as they either reset or mature lead to an increase in net interest income.
The Corporation’s loan and investment portfolios are subject to prepayment risk, which results from the ability of a third-party to
repay debt obligations prior to maturity. Prepayment risk also could have a significant impact on the duration of mortgage-backed
securities and collateralized mortgage obligations since prepayments could shorten (or lower prepayments could extend) the
weighted average life of these portfolios.
86
Table 13 - Interest Rate Sensitivity
At December 31, 2023
By repricing dates
(Dollars in thousands)
0-30 days
Within 31 -
90 days
After three
months but
within six
months
After six
months but
within nine
months
After nine
months but
within one
year
After one
year but
within two
years
After two
years
Non-
interest
bearing
funds
Total
Assets:
Money market investments
$
6,998,871
$
-
$
-
$
-
$
-
$
-
$
-
$
-
$
6,998,871
Investment and trading securities
1,849,238
3,329,068
1,173,287
1,149,164
1,096,708
4,383,968
12,478,938
(317,478)
25,142,893
Loans
5,872,869
3,321,776
1,491,687
1,497,123
1,434,984
5,044,236
16,487,918
(81,321)
35,069,272
Other assets
(2)
-
-
-
-
-
-
3,547,121
3,547,119
14,720,976
6,650,844
2,664,974
2,646,287
2,531,692
9,428,204
28,966,856
3,148,322
70,758,155
Liabilities and stockholders' equity:
Savings, NOW and money market and
other interest bearing demand
deposits
19,996,702
770,508
1,081,390
999,305
924,802
3,075,028
12,848,992
-
39,696,727
Certificates of deposit
2,145,493
891,341
941,722
620,282
859,114
1,197,851
1,846,089
-
8,501,892
Federal funds purchased and assets
sold under agreements to
repurchase
44,329
38,763
8,292
-
-
-
-
-
91,384
Notes payable
21,000
-
25,000
23,570
22,373
144,214
750,791
-
986,948
Non-interest bearing deposits
-
-
-
-
-
-
-
15,419,624
15,419,624
Other non-interest bearing liabilities
-
-
-
-
-
-
-
914,627
914,627
Stockholders' equity
-
-
-
-
-
-
-
5,146,953
5,146,953
$
22,207,524
$
1,700,612
$
2,056,404
$
1,643,157
$
1,806,289
$
4,417,093
$
15,445,872
$
21,481,204
$
70,758,155
Interest rate sensitive gap
(7,486,548)
4,950,232
608,570
1,003,130
725,403
5,011,111
13,520,984
(18,332,882)
-
Cumulative interest rate sensitive gap
(7,486,548)
(2,536,316)
(1,927,746)
(924,616)
(199,213)
4,811,898
18,332,882
-
-
Cumulative interest rate sensitive gap
to earning assets
(11.07)
%
(3.75)
%
(2.85)
%
(1.37)
%
(0.29)
%
7.12
%
27.12
%
-
-
Table 14, which presents the maturity distribution of earning assets, takes into consideration prepayment assumptions.
Table 14 - Maturity Distribution of Earning Assets
As of December 31, 2023
Maturities
After one year
through five years
through fifteen years
After fifteen years
One year
Fixed
Variable
Fixed
Variable
Fixed
Variable
(In thousands)
interest rates
interest rates
interest rates
interest rates
interest rates
interest rates
Total
Money market securities
$
6,998,871
$
-
$
-
$
-
-
-
-
$
6,998,871
Investment and trading
securities
8,533,897
14,294,589
9,289
2,145,920
3,431
-
-
24,987,126
Loans:
5,385,197
6,053,244
4,051,003
1,261,180
846,607
53,414
59,152
17,709,797
566,180
64,686
314,445
6,150
7,819
-
-
959,280
467,644
1,235,563
-
28,602
-
-
-
1,731,809
1,851,329
3,830,035
290,048
218,190
696,132
4,743
77,691
6,968,168
573,661
2,158,855
149,757
3,975,801
70,677
771,451
16
7,700,218
Subtotal loans
8,844,011
13,342,383
4,805,253
5,489,923
1,621,235
829,608
136,859
35,069,272
Total earning assets
$
24,376,779
$
27,636,972
$
4,814,542
$
7,635,843
$
1,624,666
$
829,608
$
136,859
$
67,055,269
Note: Equity securities available-for-sale and other investment securities, including Federal Reserve Bank stock and Federal Home Loan Bank stock
held by the Corporation, are not included in this table. Loans held-for-sale have been allocated according to the expected sale date.
87
Trading
The Corporation engages in trading activities in the ordinary course of business at its subsidiaries, BPPR and Popular Securities.
Popular Securities’ trading activities consist primarily of market-making activities to meet expected customers’ needs related to its
retail brokerage business, and purchases and sales of U.S. Government and government sponsored securities with the objective of
realizing gains from expected short-term price movements. BPPR’s trading activities consist primarily of holding U.S. Government
sponsored mortgage-backed securities classified as “trading” and hedging the related market risk with “TBA” (to-be-announced)
market transactions. The objective is to derive spread income from the portfolio and not to benefit from short-term market
movements. In addition, BPPR uses forward contracts or TBAs to hedge its securitization pipeline. Risks related to variations in
interest rates and market volatility are hedged with TBAs that have characteristics similar to that of the forecasted security and its
conversion timeline.
At December 31, 2023, the Corporation held trading securities with a fair value of $32 million, representing approximately 0.05% of
the Corporation’s total assets, compared with $28 million and 0.04%, respectively, at December 31, 2022. As shown in Table 15, the
trading portfolio consists principally of mortgage-backed securities and U.S. Treasuries, which at December 31, 2023 were
investment grade securities.
Table 15 - Trading Portfolio
December 31, 2023
December 31, 2022
(Dollars in thousands)
Amount
Weighted
Average Yield
[1]
Amount
Weighted
Average Yield
[1]
Mortgage-backed securities
$
14,373
5.69
%
$
14,223
5.79
%
U.S. Treasury securities
16,859
4.29
13,069
3.26
Collateralized mortgage obligations
98
5.21
160
5.51
Puerto Rico government obligations
71
0.91
64
0.45
Interest-only strips
167
12.00
207
12.00
Total
$
31,568
4.96
%
$
27,723
4.63
%
[1] Not on a taxable equivalent basis.
The Corporation’s trading activities are limited by internal policies. For each of the two subsidiaries, the market risk assumed under
trading activities is measured by the 5-day net value-at-risk (“VAR”), with a confidence level of 99%. The VAR measures the
maximum estimated loss that may occur over a 5-day holding period, given a 99% probability.
The Corporation’s trading portfolio had a 5-day VAR of approximately $0.3 million for the last week in December 31, 2023. There
are numerous assumptions and estimates associated with VAR modeling, and actual results could differ from these assumptions
and estimates. Backtesting is performed to compare actual results against maximum estimated losses, in order to evaluate model
and assumptions accuracy.
In the opinion of management, the size and composition of the trading portfolio does not represent a significant source of market risk
for the Corporation.
Derivatives
Derivatives may be used by the Corporation as part of its overall interest rate risk management strategy to minimize significant
unexpected fluctuations in earnings and cash flows that are caused by interest rate volatility. Derivative instruments that the
Corporation may use include, among others, interest rate caps, indexed options, and forward contracts. The Corporation does not
use highly leveraged derivative instruments in its interest rate risk management strategy. Credit risk embedded in these transactions
is reduced by requiring appropriate collateral from counterparties and entering into netting agreements whenever possible. All
outstanding derivatives are recognized in the Corporation’s Consolidated Statements of Condition at their fair value. Refer to Note
88
26 to the Consolidated Financial Statements for further information on the Corporation’s involvement in derivative instruments and
hedging activities.
Foreign Exchange
The Corporation holds an interest in BHD León in the Dominican Republic, which is an investment accounted for under the equity
method. The Corporation’s carrying value of the equity interest in BHD León approximated $ 225.9 million at December 31, 2023.
This business is conducted in the country’s foreign currency. The resulting foreign currency translation adjustment, from operations
for which the functional currency is other than the U.S. dollar, is reported in accumulated other comprehensive income (loss) in the
consolidated statements of condition, except for highly-inflationary environments in which the effects would be included in the
consolidated statements of operations. At December 31, 2023, the Corporation had approximately $ 65 million in an unfavorable
foreign currency translation adjustment as part of accumulated other comprehensive income (loss), compared with an unfavorable
adjustment of $ 57 million at December 31, 2022 and $ 67 million at December 31, 2021.
Liquidity
The objective of effective liquidity management is to ensure that the Corporation has sufficient liquidity to meet all of its financial
obligations, finance expected future growth, fund planned capital distributions and maintain a reasonable safety margin for cash
needs under both normal and stressed market conditions. The Board of Directors is responsible for establishing the Corporation’s
tolerance for liquidity risk, including approving relevant risk limits and policies. The Board of Directors has delegated the monitoring
of these risks to the Board’s Risk Management Committee and the Asset/Liability Management Committee. The management of
liquidity risk, on a long-term and day-to-day basis, is the responsibility of the Corporate Treasury Division. The Corporation’s
Corporate Treasurer is responsible for implementing the policies and procedures approved by the Board of Directors and for
monitoring the Corporation’s liquidity position on an ongoing basis. Also, the Corporate Treasury Division coordinates corporate
wide liquidity management strategies and activities with the reportable segments, oversees policy breaches and manages the
escalation process. The Financial and Operational Risk Management Division is responsible for the independent monitoring and
reporting of adherence with established policies.
An institution’s liquidity may be pressured if, for example, it experiences a sudden and unexpected substantial cash outflow due
deposit outflows, whether due to a loss of confidence by depositors, or other reasons, including exogenous events such as the
COVID-19 pandemic, a downgrading of its credit rating, or some other event that causes counterparties to avoid exposure to the
institution. Factors that the Corporation does not control, such as the economic outlook, adverse ratings of its principal markets,
perceptions of the financial services industry and regulatory changes, could also affect its ability to obtain funding.
The Corporation has adopted policies and limits to monitor the Corporation’s liquidity position and that of its banking subsidiaries.
Additionally, contingency funding plans are used to model various stress events of different magnitudes and affecting different time
horizons that assist management in evaluating the size of the liquidity buffers needed if those stress events occur. However, such
models may not predict accurately how the market and customers might react to every event, and are dependent on many
assumptions.
Deposits, including customer deposits, brokered deposits and public funds deposits, continue to be the most significant source of
funds for the Corporation, funding 90% of the Corporation’s total assets at December 31, 2023 and 91% at December 31, 2022.
The ratio of total ending loans to deposits was 55% at December 31, 2023 and 52% at December 31, 2022. In addition to
traditional deposits, the Corporation maintains borrowing arrangements, which amounted to approximately $1.1 billion in outstanding
balances at December 31, 2023 (December 31, 2022 - $1.4 billion). A detailed description of the Corporation’s borrowings, including
their terms, is included in Note 17 to the Consolidated Financial Statements. Also, the Consolidated Statements of Cash Flows in
the accompanying Consolidated Financial Statements provide information on the Corporation’s cash inflows and outflows.
The following sections provide further information on the Corporation’s major funding activities and needs, as well as the risks
involved in these activities.
Banking Subsidiaries
89
Primary sources of funding for the Corporation’s banking subsidiaries (BPPR and PB or, collectively, “the banking subsidiaries”)
include retail, commercial and public sector deposits, brokered deposits, unpledged investment securities, mortgage loan
securitization and, to a lesser extent, loan sales. In addition, the Corporation maintains borrowing facilities with the FHLB and at the
discount window of the Federal Reserve Bank of New York (the “FRB”) and has a considerable amount of collateral pledged that
can be used to raise funds under these facilities.
During the fourth quarter of 2023 the Corporation had no material incremental use of its available liquidity sources. At December
31,2023, the Corporation’s available liquidity increased to $19.5 billion from $17.0 billion on December 31, 2022. The liquidity
sources of the Corporation at December 31,2023 are presented in Table 16:
Table 16 - Liquidity Sources
December 31, 2023
December 31, 2022
(In thousands)
BPPR
Popular U.S.
Total
BPPR
Popular U.S.
Total
Unpledged securities and unused funding
sources:
Money market (excess funds at the
Federal Reserve Bank)
$
5,516,636
$
1,475,143
$
6,991,779
$
5,240,100
$
367,966
$
5,608,066
Unpledged securities
4,212,480
347,791
4,560,271
7,494,189
326,599
7,820,788
FHLB borrowing capacity
2,157,685
1,341,329
3,499,014
1,389,579
722,005
2,111,584
Discount window of the Federal Reserve
Bank borrowing capacity
2,605,674
1,818,946
4,424,620
1,090,308
329,385
1,419,693
Total available liquidity
$
14,492,475
$
4,983,209
$
19,475,684
$
15,214,176
$
1,745,955
$
16,960,131
Refer to Note 17 to the Consolidated Financial Statements for additional information of the Corporation’s borrowing facilities
available through its banking subsidiaries.
The principal uses of funds for the banking subsidiaries include loan originations, investment portfolio purchases, loan purchases
and repurchases, repayment of outstanding obligations (including deposits), advances on certain serviced portfolios and operational
expenses. Also, the banking subsidiaries assume liquidity risk related to collateral posting requirements for certain activities mainly
in connection with contractual commitments, recourse provisions, servicing advances, derivatives and credit card licensing
agreements.
The banking subsidiaries maintain sufficient funding capacity to address large increases in funding requirements such as deposit
outflows. The Corporation has established liquidity guidelines that require the banking subsidiaries to have sufficient liquidity to
cover all short-term borrowings and a portion of deposits.
The Corporation’s ability to compete successfully in the marketplace for deposits, excluding brokered deposits, depends on various
factors, including pricing, service, convenience and financial stability as reflected by operating results and financial condition, credit
ratings (by nationally recognized credit rating agencies), customer confidence, and importantly, FDIC deposit insurance coverage.
Deposits at all of the Corporation’s banking subsidiaries are federally insured (subject to FDIC limits) and this is expected to mitigate
the potential effect of the aforementioned risks.
Deposits are a key source of funding. Refer to Table 8 for a breakdown of deposits by major types. Core deposits are generated
from a large base of consumer, corporate and public sector customers. Core deposits include certificate of deposit under $250,000,
all interest-bearing transactional deposit accounts, non-interest bearing deposits, and savings deposits. Core deposits exclude
brokered deposits and certificates of deposit over $250,000. Core deposits, excluding P.R. public funds that are fully collateralized,
have historically provided the Corporation with a sizable source of relatively stable and low-cost funds. P.R. public funds, while
linked to market interest rates, provide a stable source of funding with an attractive earnings spread. Core deposits totaled $59.0
billion, or 93% of total deposits, at December 31, 2023, compared with $57.6 billion, or 94% of total deposits, at December 31,
2022. Core deposits financed 88% of the Corporation’s earning assets at December 31, 2023, compared with 90% at December 31,
2022.
The distribution by maturity of certificates of deposit with denominations of $250,000 and over at December 31, 2023 is presented in
the table that follows:
90
Table 17 - Distribution by Maturity of Certificates of Deposit of $250,000 and Over
(In thousands)
3 months or less
$
2,025,571
Over 3 to 12 months
630,145
Over 1 year to 3 years
225,165
Over 3 years
177,949
Total
$
3,058,830
For the years ended December 31, 2023 and 2022, average deposits, including brokered deposits, represented 92% of average
earning assets. Table 18 summarizes average deposits for the past three years.
Table 18 - Average Total Deposits
For the years ended December 31,
(In thousands)
2023
2022
Non-interest bearing demand deposits
$
15,307,152
$
16,093,704
Savings accounts
15,265,784
16,242,457
NOW, money market and other interest bearing demand accounts
24,208,570
25,539,909
Certificates of deposit
7,764,974
6,840,334
Total interest bearing deposits
47,239,328
48,622,700
Total average deposits
$
62,546,480
$
64,716,404
The Corporation had $1.7 billion in brokered deposits at December 31, 2023, which financed approximately 2% of its total assets
(December 31, 2022 - $1.1 billion and 2%, respectively). In the event that any of the Corporation’s banking subsidiaries’ regulatory
capital ratios fall below those required by a well-capitalized institution or are subject to capital restrictions by the regulators, that
banking subsidiary faces the risk of not being able to raise or maintain brokered deposits and faces limitations on the rate paid on
deposits, which may hinder the Corporation’s ability to effectively compete in its retail markets and could affect its deposit raising
efforts.
Deposits from the public sector represent an important source of funds for the Corporation. As of December 31, 2023, total public
sector deposits were $18.1 billion, compared to $15.8 billion at December 31, 2022. Generally, these deposits require that the bank
pledge high credit quality securities as collateral; therefore, liquidity risks arising from public sector deposit outflows are lower given
that the bank receives its collateral in return. This, now unpledged, collateral can either be financed via repurchase agreements or
sold for cash. However, there are some timing differences between the time the deposit outflow occurs and when the bank receives
its collateral. Additionally, the Corporation mainly utilizes fixed-rate U.S. Treasury debt securities as collateral. While these
securities have limited credit risk, they are subject to market value risk based on changes in the interest rate environment. When
interest rates increase, the value of this collateral decreases and could result in the Corporation having to provide additional
collateral to cover the same amount of deposit liabilities. This additional collateral could reduce unpledged securities otherwise
available as liquidity sources to the Corporation.
At December 31, 2023, management believes that the banking subsidiaries had sufficient current and projected liquidity sources to
meet their anticipated cash flow obligations, as well as special needs and off-balance sheet commitments, in the ordinary course of
business and have sufficient liquidity resources to address a stress event. Although the banking subsidiaries have historically been
able to replace maturing deposits and advances, no assurance can be given that they would be able to replace those funds in the
future if the Corporation’s financial condition or general market conditions were to deteriorate. The Corporation’s financial flexibility
will be severely constrained if the banking subsidiaries are unable to maintain access to funding or if adequate financing is not
available to accommodate future financing needs at acceptable interest rates. The banking subsidiaries also are required to deposit
cash or qualifying securities to meet margin requirements on repurchase agreements and other collateralized borrowing facilities. To
the extent that the value of securities previously pledged as collateral declines because of market changes, the Corporation will be
91
required to deposit additional cash or securities to meet its margin requirements, thereby adversely affecting its liquidity. Finally, if
management is required to rely more heavily on more expensive funding sources to meet its future growth, revenues may not
increase proportionately to cover costs. In this case, profitability would be adversely affected.
The Corporation monitors uninsured deposits under applicable FDIC regulations. Additionally, the Corporation monitors accounts
with balances over $250,000. While the Corporation has a diverse deposit base from retail, commercial, corporate and government
clients, as well as wholesale funding sources such as brokered deposits, it considers balance in excess of $250,000 to have a
higher potential liquidity risk. Table 19 reflects the aggregate balance in deposit accounts in excess of $250,000, including
collateralized public funds and deposits outside of the U.S. and its territories. Collateralized public funds, as presented in Table 19,
represent public deposit balances from governmental entities in the U.S. and its territories, including Puerto Rico and the United
States Virgin Islands, that are collateralized based on such jurisdictions’ applicable collateral requirements. On December 31,2023,
deposits with balances in excess of $250,000, excluding foreign deposits (mainly deposits in the British Virgin Islands) intercompany
deposits and collateralized public funds, were $ 10.6 billion or 20% at BPPR and $ 2.6 billion or 23% at Popular U.S., compared to
available liquidity sources of $ 14.5 billion at BPPR and $ 5.0 billion at Popular U.S.
Table 19 - Deposits
31-Dec-23
Popular, Inc.
(Dollars in thousands)
BPPR
% of Total
Popular U.S.
% of Total
(Consolidated)
% of Total
Deposits:
Deposits balances under $250,000 [1]
$
23,683,475
45
%
$
7,760,363
69
%
$
31,443,838
49
%
Transactional deposits balances over
$250,000
8,632,491
16
%
2,230,978
20
%
10,863,469
17
%
Time deposits balances over $250,000
1,926,005
4
%
361,315
3
%
2,287,320
4
%
Uninsured foreign deposits
418,334
1
%
-
-
%
418,334
1
%
Collateralized public funds
18,313,612
34
%
291,670
3
%
18,605,282
29
%
Intercompany deposits
159,163
-
%
626,312
5
%
-
-
%
Total deposits
$
53,133,080
100
%
$
11,270,638
100
%
$
63,618,243
100
%
[1] Includes the first $250,000 in balances of transactional and time deposit accounts with balances in excess of $250,000.
31-Dec-22
Popular, Inc.
(Dollars in thousands)
BPPR
% of Total
Popular U.S.
% of Total
(Consolidated)
% of Total
Deposits
Deposits balances under $250,000 [1]
$
24,505,697
46
%
$
5,231,417
60
%
$
29,737,114
49
%
Transactional deposits balances over
$250,000
9,957,877
19
%
2,674,841
31
%
12,632,718
21
%
Time deposits balances over $250,000
1,920,455
4
%
167,067
2
%
2,087,522
3
%
Uninsured foreign deposits
425,855
1
%
-
-
%
425,855
1
%
Collateralized public funds
16,233,342
31
%
110,676
1
%
16,344,018
27
%
Intercompany deposits
135,172
-
%
482,167
6
%
-
-
%
Total deposits
$
53,178,398
100
%
$
8,666,168
100
%
$
61,227,227
100
%
[1] Includes the first $250,000 in balances of transactional and time deposit accounts with balances in excess of $250,000.
Bank Holding Companies
The principal sources of funding for the BHCs, which are Popular, Inc. (holding company only) and PNA, include cash on hand,
investment securities, dividends received from banking and non-banking subsidiaries, asset sales, credit facilities available from
affiliate banking subsidiaries and proceeds from potential securities offerings. Dividends from banking and non-banking subsidiaries
92
are subject to various regulatory limits and authorization requirements that are further described below and that may limit the ability
of those subsidiaries to act as a source of funding to the BHCs.
The principal use of these funds includes the repayment of debt, and interest payments to holders of senior debt and junior
subordinated deferrable interest (related to trust preferred securities), the payment of dividends to common stockholders,
repurchases of the Corporation’s securities and capitalizing its banking subsidiaries.
The outstanding balance of notes payable at the BHCs amounted to $592 million at December 31, 2023 and $497 million at
December 31, 2022.
The contractual maturities of the BHCs notes payable at December 31, 2023 are presented in Table 20.
Table 20 - Distribution of BHC's Notes Payable by Contractual Maturity
Year
(In thousands)
2028
$
393,937
Later years
198,346
Total
$
592,283
As of December 31, 2023, the BHCs had cash and money markets investments totaling $388 million and borrowing potential of
$222 million from its secured facility with BPPR. The BHCs’ liquidity position continues to be adequate with sufficient cash on hand,
investments and other sources of liquidity which are expected to be enough to meet all interest payments and dividend obligations
during the foreseeable future. On March 13, 2023, the Corporation issued $400 million aggregate principal amount of 7.25% Senior
Notes due 2028 (the “Notes”) in an underwritten public offering. The Corporation used a portion of the net proceeds of the 2028
Notes to redeem, on August 14, 2023, the outstanding $300 million aggregate principal amount of its outstanding 6.125% Senior
Notes which were due on September 2023. Additionally, the Corporation’s latest quarterly dividend was $0.62 per share or
approximately $45 million per quarter.
The BHCs have in the past borrowed in the corporate debt market primarily to finance their non-banking subsidiaries and refinance
debt obligations. These sources of funding are more costly due to the fact that two out of the three principal credit rating agencies
rate the Corporation below “investment grade”, which affects the Corporation’s cost and ability to raise funds in the capital markets.
Factors that the Corporation does not control, such as the economic outlook, interest rate volatility, inflation, disruptions in the debt
market, among others, could also affect its ability to obtain funding. The Corporation has an automatic shelf registration statement
filed and effective with the Securities and Exchange Commission, which permits the Corporation to issue an unspecified amount of
debt or equity securities.
Non-Banking Subsidiaries
The principal sources of funding for the non-banking subsidiaries include internally generated cash flows from operations, loan
sales, repurchase agreements, capital injections and borrowed funds from their direct parent companies or the holding companies.
The principal uses of funds for the non-banking subsidiaries include repayment of maturing debt, operational expenses and payment
of dividends to the BHCs. The liquidity needs of the non-banking subsidiaries are minimal since most of them are funded internally
from operating cash flows or from intercompany borrowings or capital contributions from their holding companies.
Dividends
During the year ended December 31, 2023, the Corporation declared cash dividends of $2.27 per common share outstanding
($163.7 million in the aggregate). The dividends for the Corporation’s Series A preferred stock amounted to $1.4 million. During the
year ended December 31, 2023, the BHCs received dividends amounting to $200 million from BPPR, $50 million from PNA, $14
million from PIBI and $8 million from its non-banking subsidiaries. In addition, during the year ended December 31, 2023, Popular
International Bank Inc., wholly owned subsidiary of Popular, Inc., received $14.1 million in cash dividends and $2.1 million in stock
dividends from its investment in BHD. Dividends from BPPR constitute Popular, Inc.’s primary source of liquidity.
Other Funding Sources and Capital
In addition to cash reserves held at the FRB that totaled $7.0 billion at December 31,2023, the debt securities portfolio provides an
additional source of liquidity, which may be realized through either securities sales, collateralized borrowings or repurchase
agreements. The Corporation’s debt securities portfolio consists primarily of liquid U.S. government debt securities, U.S.
93
government sponsored agency debt securities, U.S. government sponsored agency mortgage-backed securities, and U.S.
government sponsored agency collateralized mortgage obligations that can be used to raise funds in the repo markets. The
availability of the repurchase agreement would be subject to having sufficient unpledged collateral available at the time the
transactions are to be consummated, in addition to overall liquidity and risk appetite of the various counterparties. In 2023, BPPR
became an approved counterparty in the Federal Reserve’s Standing Repo Facility. This allows approved counterparties to
participate in daily auctions with the Standing Repo Facility for up to $500 billion in aggregate of overnight financing using U.S.
Treasuries and Agency MBS as collateral. The Corporation’s unpledged debt securities amounted to $ 4.6 billion at December 31,
2023 and $ 7.8 billion at December 31, 2022. A substantial portion of these debt securities could be used to raise financing in the
U.S. money markets or from secured lending sources, subject to changes in their fair market value and customary adjustments
(haircuts).
Additional liquidity may be provided through loan maturities, prepayments and sales. The loan portfolio can also be used to obtain
funding in the capital markets. In particular, mortgage loans and some types of consumer loans, have secondary markets which the
Corporation could use.
Off-Balance Sheet arrangements and other commitments
In the ordinary course of business, the Corporation engages in financial transactions that are not recorded on the balance sheet or
may be recorded on the balance sheet in amounts that are different than the full contract or notional amount of the transaction. As a
provider of financial services, the Corporation routinely enters into commitments with off-balance sheet risk to meet the financial
needs of its customers. These commitments may include loan commitments and standby letters of credit. These commitments are
subject to the same credit policies and approval process used for on-balance sheet instruments. These instruments involve, to
varying degrees, elements of credit and interest rate risk in excess of the amount recognized in the statement of financial position.
Refer to Note 24 to the Consolidated Financial Statements for information on the Corporation’s commitments to extent credit and
other non-credit commitments.
Other types of off-balance sheet arrangements that the Corporation enters in the ordinary course of business include derivatives,
operating leases and provision of guarantees, indemnifications, and representation and warranties. Refer to Note 33 to the
Consolidated Financial Statements for information on operating leases and to Note 23 to the Consolidated Financial Statements for
a detailed discussion related to the Corporation’s obligations under credit recourse and representation and warranties
arrangements.
The Corporation monitors its cash requirements, including its contractual obligations and debt commitments.
FDIC Special Assessments
On November 16, 2023, the Federal Deposit Insurance Corporation (“FDIC”) approved a final rule that imposes a special
assessment (the “FDIC Special Assessment”) to recover the losses to the deposit insurance fund (“DIF”) resulting from the FDIC’s
use, in March 2023, of the systemic risk exception to the least-cost resolution test under the Federal Deposit Insurance Act in
connection with the receiverships of several failed banks.
Under the final rule, the assessment base for the special assessment is equal to an insured depository institution’s (“IDI”) estimated
uninsured deposits, as reported in the IDI’s December 31, 2022 Call Report, excluding the first $5 billion in estimated uninsured
deposits. For a holding company that has more than one IDI subsidiary, such as Popular, the $5 billion exclusion is allocated among
the company’s IDI subsidiaries in proportion to each IDI’s estimated uninsured deposits. The special assessments will be collected
at an annual rate of approximately 13.4 basis points per year (3.35 basis points per quarter) over eight quarters in 2024 and 2025,
with the first assessment period beginning January 1, 2024. In their December 31, 2022 Call Reports, BPPR and PB reported
estimated uninsured deposits of approximately $28.1 billion, including $16.2 billion in fully collateralized public sector deposits, and
$3.5 billion, respectively. The Corporation recorded an expense of $71.4 million, $45.3 million net of tax, in the fourth quarter of
2023, representing the full amount of the assessment.
By statute, the FDIC is required to recover the loss arising from the use of a systemic risk determination through one or more special
assessments. As of December 31, 2023, the FDIC’s loss estimate described in the final rule had increased by approximately $4.1
billion to $20.4 billion, or approximately 25%. The exact amount of losses will be determined when the FDIC terminates the related
receiverships considered in the final rule. Accordingly, the special assessment amount and collection period may change as the
estimated loss is periodically adjusted or if the total amount collected varies. If the most recent increase in the FDIC’s estimate
94
remains unchanged and is assessed in the same manner, the Corporation estimates that the incremental expense for the FDIC
Special Assessment could be approximately $18 million.
Financial information of guarantor and issuers of registered guaranteed securities
The Corporation (not including any of its subsidiaries, “PIHC”) is the parent holding company of Popular North America “PNA” and
has other subsidiaries through which it conducts its financial services operations. PNA is an operating, 100% subsidiary of Popular,
Inc. Holding Company (“PIHC”) and is the holding company of its wholly-owned subsidiaries: Equity One, Inc. and PB, including
PB’s wholly-owned subsidiaries Popular Equipment Finance, LLC, Popular Insurance Agency, U.S.A., and E-LOAN, Inc.
PNA has issued junior subordinated debentures guaranteed by PIHC (together with PNA, the “obligor group”) purchased by
statutory trusts established by the Corporation. These debentures were purchased by the statutory trust using the proceeds from
trust preferred securities issued to the public (referred to as “capital securities”), together with the proceeds of the related issuances
of common securities of the trusts.
PIHC fully and unconditionally guarantees the junior subordinated debentures issued by PNA. PIHC’s obligation to make a
guarantee payment may be satisfied by direct payment of the required amounts to the holders of the applicable capital securities or
by causing the applicable trust to pay such amounts to such holders. Each guarantee does not apply to any payment of distributions
by the applicable trust except to the extent such trust has funds available for such payments. If PIHC does not make interest
payments on the debentures held by such trust, such trust will not pay distributions on the applicable capital securities and will not
have funds available for such payments. PIHC’s guarantee of PNA’s junior subordinated debentures is unsecured and ranks
subordinate and junior in right of payment to all the PIHC’s other liabilities in the same manner as the applicable debentures as set
forth in the applicable indentures; and equally with all other guarantees that the PIHC issues. The guarantee constitutes a guarantee
of payment and not of collection, which means that the guaranteed party may sue the guarantor to enforce its rights under the
respective guarantee without suing any other person or entity.
The principal sources of funding for PIHC and PNA have included dividends received from their banking and non-banking
subsidiaries, asset sales and proceeds from the issuance of debt and equity. As further described below, in the Risk to Liquidity
section, various statutory provisions limit the amount of dividends an insured depository institution may pay to its holding company
without regulatory approval.
The following summarized financial information presents the financial position of the obligor group, on a combined basis at
December 31, 2023 and December 31, 2022, and the results of their operations for the years ended December 31, 2023 and
December 31, 2022. Investments in and equity in the earnings from the other subsidiaries and affiliates that are not members of the
obligor group have been excluded.
The summarized financial information of the obligor group is presented on a combined basis with intercompany balances and
transactions between entities in the obligor group eliminated. The obligor group's amounts due from, amounts due to and
transactions with subsidiaries and affiliates have been presented in separate line items, if they are material. In addition, related
parties transactions are presented separately.
95
Table 21 - Summarized Statement of Condition
(In thousands)
December 31, 2023
December 31, 2022
Assets
Cash and money market investments
$
388,025
$
203,083
Investment securities
29,973
24,815
Accounts receivables from non-obligor subsidiaries
14,469
16,853
Other loans (net of allowance for credit losses of $51 (2022 - $370))
26,906
27,826
Investment in equity method investees
5,265
5,350
Other assets
51,315
45,278
Total assets
$
515,953
$
323,205
Liabilities and Stockholders' deficit
Accounts payable to non-obligor subsidiaries
$
7,023
$
3,709
Notes payable
592,283
497,428
Other liabilities
114,660
112,847
Stockholders' deficit
(198,013)
(290,779)
Total liabilities and stockholders' deficit
$
515,953
$
323,205
Table 22 - Summarized Statement of Operations
For the years ended
(In thousands)
December 31, 2023
December 31, 2022
Income:
Dividends from non-obligor subsidiaries
$
208,000
$
458,000
Interest income from non-obligor subsidiaries and affiliates
15,579
705
(Losses) earnings from investments in equity method investees
(84)
15,688
Other operating income
4,664
145,295
Total income
$
228,159
$
619,688
Expenses:
Services provided by non-obligor subsidiaries and affiliates (net of
reimbursement by subsidiaries for services provided by parent of
$215,479 (2022 - $222,935))
$
13,513
$
18,467
Other operating expenses
34,978
23,607
Total expenses
$
48,491
$
42,074
Net income
$
179,668
$
577,614
During the year ended December 31, 2023, the obligor group recorded in aggregate $64.0 million of dividend distributions
from non-obligor subsidiaries which were recorded as a reduction to the investment (2022 - $72.0 million). During the year
ended December 31, 2022, the Obligor group recorded $1.5 million of distributions from its direct equity method investees.
In addition, during the year ended December 31, 2022, the Obligor group recorded $228.1 million in proceeds from the sale
of two of its direct equity method investees.
96
Risks to Liquidity
Total lines of credit outstanding, or available borrowing capacity under lines of credit are not necessarily a measure of the total credit
available on a continuing basis. Some of these lines could be subject to collateral requirements, changes to the value of the
collateral, standards of creditworthiness, leverage ratios and other regulatory requirements, among other factors. Derivatives, such
as those embedded in long-term repurchase transactions or interest rate swaps, and off-balance sheet exposures, such as
recourse, performance bonds or credit card arrangements, are subject to collateral requirements. As their fair value increases, the
collateral requirements may increase, thereby reducing the balance of unpledged securities.
The importance of the Puerto Rico market for the Corporation is an additional risk factor that could affect its financing activities. In
the case of a deterioration in economic and fiscal conditions in Puerto Rico, the credit quality of the Corporation could be affected
and result in higher credit costs. Refer to the Geographic and Government Risk section of this MD&A for some highlights on the
current status of the Puerto Rico economy and the ongoing fiscal crisis.
Factors that the Corporation does not control, such as the economic outlook and credit ratings of its principal markets and regulatory
changes, could also affect its ability to obtain funding. In order to prepare for the possibility of such scenario, management has
adopted contingency plans for raising financing under stress scenarios when important sources of funds that are usually fully
available are temporarily unavailable. These plans call for using alternate funding mechanisms, such as the pledging of certain
asset classes and accessing secured credit lines and loan facilities put in place with the FHLB and the FRB. The Corporation is
subject to positive tangible capital requirements to utilize secured loan facilities with the FHLB that could result in a limitation of
borrowing amounts or maturity terms, even if the Corporation exceeds well-capitalized regulatory capital levels.
The credit ratings of Popular’s debt obligations are a relevant factor for liquidity because they impact the Corporation’s ability to
borrow in the capital markets, its cost and access to funding sources. Credit ratings are based on the financial strength, credit
quality and concentrations in the loan portfolio, the level and volatility of earnings, capital adequacy, the quality of management,
geographic concentration in Puerto Rico, the liquidity of the balance sheet, the availability of a significant base of core retail and
commercial deposits, and the Corporation’s ability to access a broad array of wholesale funding sources, among other factors.
Furthermore, various statutory provisions limit the amount of dividends an insured depository institution may pay to its holding
company without regulatory approval. A member bank must obtain the approval of the Federal Reserve Board for any dividend, if
the total of all dividends declared by the member bank during the calendar year would exceed the total of its net income for that
year, combined with its retained net income for the preceding two years, after considering those years’ dividend activity, less any
required transfers to surplus or to a fund for the retirement of any preferred stock. During the year ended December 31, 2023, BPPR
declared cash dividends of $200 million. At December 31, 2023, BPPR can declare a dividend of approximately $387 million without
prior approval of the Federal Reserve Board due to its retained income, declared dividend activity and transfers to statutory reserves
over the measurement period. In addition, a member bank may not declare or pay a dividend in an amount greater than its
undivided profits as reported in its Report of Condition and Income, unless the member bank has received the approval of the
Federal Reserve Board. A member bank also may not permit any portion of its permanent capital to be withdrawn unless the
withdrawal has been approved by the Federal Reserve Board. Pursuant to these requirements, PB may not declare or pay a
dividend without the prior approval of the Federal Reserve Board and the NYSDFS. The ability of a bank subsidiary to up-stream
dividends to its BHC could thus be impacted by its financial performance and capital, including tangible and regulatory capital, thus
potentially limiting the amount of cash moving up to the BHCs from the banking subsidiaries. This could, in turn, affect the BHCs
ability to declare dividends on its outstanding common and preferred stock, repurchase its securities or meet its debt obligations, for
example.
The Corporation’s banking subsidiaries have historically not used unsecured capital market borrowings to finance its operations, and
therefore are less sensitive to the level and changes in the Corporation’s overall credit ratings.
Obligations Subject to Rating Triggers or Collateral Requirements
The Corporation’s banking subsidiaries currently do not issue unsecured senior debt, as these banking subsidiaries are funded
primarily with deposits and secured borrowings. The banking subsidiaries had $7.8 million in deposits at December 31, 2023 that
are subject to rating triggers.
In addition, certain mortgage servicing and custodial agreements that BPPR has with third parties include rating covenants. In the
event of a credit rating downgrade, the third parties have the right to require the institution to engage a substitute cash custodian for
escrow deposits and/or increase collateral levels securing the recourse obligations. Also, as discussed in Note 23 to the
Consolidated Financial Statements, the Corporation services residential mortgage loans subject to credit recourse provisions.
97
Certain contractual agreements require the Corporation to post collateral to secure such recourse obligations if the institution’s
required credit ratings are not maintained. Collateral pledged by the Corporation to secure recourse obligations amounted to
approximately $27.1 million at December 31, 2023. The Corporation could be required to post additional collateral under the
agreements. Management expects that it would be able to meet additional collateral requirements if and when needed. The
requirements to post collateral under certain agreements or the loss of escrow deposits could reduce the Corporation’s liquidity
resources and impact its operating results.
Credit Risk
Geographic and Government Risk
The Corporation is exposed to geographic and government risk. The Corporation’s assets and revenue composition by geographical
area and by business segment reporting are presented in Note 37 to the Consolidated Financial Statements.
Commonwealth of Puerto Rico
A significant portion of our financial activities and credit exposure is concentrated in the Commonwealth of Puerto Rico (“Puerto
Rico”), which has faced severe economic and fiscal challenges in the past and may face additional challenges in the future.
Economic Performance.
Puerto Rico’s economy suffered a severe and prolonged recession from 2007 to 2017, with real gross national product (“GNP”)
contracting approximately 15% during this period. In 2017, Hurricane María caused significant damage and destruction across the
island, resulting in further economic contraction. Puerto Rico’s economy has been gradually recovering since 2018, in part aided by
the large amount of federal disaster relief and recovery assistance funds injected into the Puerto Rico economy in connection with
Hurricane María and other recent natural disasters. This growth was interrupted by the economic shock caused by the COVID-19
pandemic in 2020, but has since resumed, in part aided by additional federal assistance from pandemic-related stimulus measures.
The latest Puerto Rico Economic Activity Index, published by the Economic Development Bank for Puerto Rico (the “Economic
Activity Index”), reflected a 5.9% year-over-year increase and a 0.2% month-over-month decrease in November 2023. The
Economic Activity Index is a coincident indicator of ongoing economic activity but not a direct measurement of real GNP. The Puerto
Rico Planning Board estimates that Puerto Rico’s real GNP grew 0.8% during fiscal year 2023 (July 2022-June 2023) and projects
1.8% real GNP growth for fiscal year 2024 (July 2023-June-2024).
While the Puerto Rico economy has not directly tracked the United States economy in recent years, many of the external factors
that impact the Puerto Rico economy are affected by the policies and performance of the United States economy. These external
factors include the level of interest rates and the rate of inflation. Inflation in the United States, as measured by the United States
Consumer Price Index (published by the U.S. Bureau of Labor Statistics), increased 3.4% during the 12-month period ended
December 2023. Inflation in Puerto Rico, as measured by the Puerto Rico Consumer Price Index (published by the Department of
Labor and Human Resources of Puerto Rico), increased 2.0% during the 12-month period ended December 2023. The rate of
inflation gradually decreased from a mid-2022 peak, as the Federal Reserve implemented a series of benchmark interest rate
increases.
Fiscal Challenges.
As the Puerto Rico economy contracted, the government’s public debt rose rapidly, in part from borrowing to cover deficits to pay
debt service, pension benefits and other government expenditures. By 2016, the Puerto Rico government had over $120 billion in
combined debt and unfunded pension liabilities, had lost access to the capital markets, and was in the midst of a fiscal crisis.
Puerto Rico’s escalating fiscal and economic challenges and imminent widespread defaults in its public debt prompted the U.S.
Congress to enact the Puerto Rico Oversight, Management, and Economic Stability Act (“PROMESA”) in June 2016. PROMESA
created the “Oversight Board” with ample powers over Puerto Rico’s fiscal and economic affairs and those of its public corporations,
instrumentalities and municipalities (collectively, “PR Government Entities”). Pursuant to PROMESA, the Oversight Board will be in
98
place until market access is restored and balanced budgets are produced for at least four consecutive years. PROMESA also
established two mechanisms for the restructuring of the obligations of PR Government Entities: (a) Title III, which provides an in-
court process that incorporates many of the powers and provisions of the U.S. Bankruptcy Code and permits adjustment of a broad
range of obligations, and (b) Title VI, which provides for a largely out-of-court process through which modifications to financial debt
can be accepted by a supermajority of creditors and bind holdouts.
Since 2017, Puerto Rico and several of its instrumentalities have availed themselves of the debt restructuring mechanisms of Titles
III and VI of PROMESA. The Puerto Rico government emerged from Title III of PROMESA in March 2022. Several instrumentalities,
including Government Development Bank for Puerto Rico, the Puerto Rico Sales Tax Financing Corporation, the Puerto Rico
Highways and Transportation Authority, and the Puerto Rico Industrial Development Company, have also completed debt
restructurings under Titles III or VI of PROMESA. While the majority of the debt has already been restructured, some PR
Government Entities still face significant fiscal challenges. For example, the Puerto Rico Electric Power Authority is still in the
process of restructuring its debts under Title III of PROMESA.
Municipalities.
Puerto Rico’s fiscal and economic challenges have also adversely impacted its municipalities. Budgetary subsidies to municipalities
have gradually declined in recent years and were scheduled to be ultimately eliminated by fiscal year 2025 as part of the fiscal
measures required by the Oversight Board. However, over the past years, the Oversight Board has authorized and funded new
appropriations and investments to offset the decline in intergovernmental transfers to municipalities. Beyond those sources of
alternate funding, municipalities have also received significant federal disaster and COVID-relief funding in recent years. According
to the latest Puerto Rico fiscal plan certified by the Oversight Board, taken together, the funding available to municipalities in the
near-term is substantial. The fiscal plan notes, however, that the desired progress to achieve fiscal discipline and implement critical
reforms has not been achieved, and that municipalities must work with the Executive branch to analyze the financial needs of each
individual municipality and focus on the necessary enhancements in municipal shared services and other municipal and government
initiatives. Pursuant to the fiscal plan, once the transformational measures and milestones related to these initiatives are achieved,
additional funding from the central government may be made available to municipalities to improve fiscal sustainability.
Municipalities are subject to PROMESA and, at the Oversight Board’s request, are required to submit fiscal plans and annual
budgets to the Oversight Board for its review and approval. They are also required to seek Oversight Board approval to issue,
guarantee or modify their debts and to enter into contracts with an aggregate value of $10 million or more. With the Oversight
Board’s approval, municipalities are also eligible to avail themselves of the debt restructuring processes provided by PROMESA. To
date, however, no municipality has been subject to any such debt restructuring process.
Exposure of the Corporation
The credit quality of BPPR’s loan portfolio reflects, among other things, the general economic conditions in Puerto Rico and other
adverse conditions affecting Puerto Rico consumers and businesses. Deterioration in the Puerto Rico economy has resulted in the
past, and could result in the future, in higher delinquencies, greater charge-offs and increased losses, which could materially affect
our financial condition and results of operations.
At December 31, 2023, the Corporation’s direct exposure to PR Government Entities totaled $362 million, of which $333 million
were outstanding, compared to $374 million at December 31, 2022, of which $327 million were outstanding. A deterioration in
Puerto Rico’s fiscal and economic situation could adversely affect the value of our Puerto Rico government obligations, resulting in
losses to us. Of the amount outstanding, $314 million consists of loans and $19 million are securities ($302 million and $25 million,
respectively, at December 31, 2022). All of the Corporation’s direct exposure outstanding at December 31, 2023 were obligations
from various Puerto Rico municipalities. In most cases, these were “general obligations” of a municipality, to which the applicable
municipality has pledged its good faith, credit and unlimited taxing power, or “special obligations” of a municipality, to which the
applicable municipality has pledged basic property tax or sales tax revenues. At December 31, 2023, 76% of the Corporation’s
exposure to municipal loans and securities was concentrated in the municipalities of San Juan, Guaynabo, Carolina and Caguas.
For additional discussion of the Corporation’s direct exposure to the Puerto Rico government and its instrumentalities and
municipalities, refer to Note 24 – Commitments and Contingencies to the Consolidated Financial Statements.
In addition, at December 31, 2023, the Corporation had $238 million in loans insured or securities issued by Puerto Rico
governmental entities, but for which the principal source of repayment is non-governmental ($251 million at December 31, 2022).
These included $191 million in residential mortgage loans insured by the Puerto Rico Housing Finance Authority (“HFA”), a PR
99
Government Entity (December 31, 2022 - $209 million). These mortgage loans are secured by first mortgages on Puerto Rico
residential properties and the HFA insurance covers losses in the event of a borrower default and upon the satisfaction of certain
other conditions. The Corporation also had at December 31, 2023, $40 million in bonds issued by HFA which are secured by second
mortgage loans on Puerto Rico residential properties, and for which HFA also provides insurance to cover losses in the event of a
borrower default, and upon the satisfaction of certain other conditions (December 31, 2022 - $42 million). In the event that the
mortgage loans insured by HFA and held by the Corporation directly or those serving as collateral for the HFA bonds default and the
collateral is insufficient to satisfy the outstanding balance of these loans, HFA’s ability to honor its insurance will depend, among
other factors, on the financial condition of HFA at the time such obligations become due and payable. The Corporation does not
consider the government guarantee when estimating the credit losses associated with this portfolio.
BPPR’s commercial loan portfolio also includes loans to private borrowers who are service providers, lessors, suppliers or have
other relationships with the government. These borrowers could be negatively affected by a deterioration in the fiscal and economic
situation of PR Government Entities. Similarly, BPPR’s mortgage and consumer loan portfolios include loans to government
employees and retirees, which could also be negatively affected by fiscal measures, such as employee layoffs or furloughs or
reductions in pension benefits, if the fiscal and economic situation deteriorates.
As of December 31, 2023, BPPR had $18.1 billion in deposits from the Puerto Rico government, its instrumentalities, and
municipalities. The rate at which public deposit balances may decline is uncertain and difficult to predict. The amount and timing of
any such reduction is likely to be impacted by, for example, the speed at which federal assistance is distributed and the financial
condition, liquidity and cash management practices of such entities, as well as on the ability of BPPR to maintain these customer
relationships.
The Corporation may also have direct exposure with regards to avoidance and other causes of action initiated by the Oversight
Board on behalf of the Commonwealth or other Title III debtors. For additional information regarding such exposure, refer to Note 24
to the Consolidated Financial Statements.
United States Virgin Islands
The Corporation has operations in the United States Virgin Islands (the “USVI”) and has credit exposure to USVI government
entities.
The USVI has been experiencing a number of fiscal and economic challenges, which could adversely affect the ability of its public
corporations and instrumentalities to service their outstanding debt obligations. PROMESA does not apply to the USVI and, as such,
there is currently no federal legislation permitting the restructuring of the debts of the USVI and its public corporations and
instrumentalities.
To the extent that the fiscal condition of the USVI continues to deteriorate, the U.S. Congress or the Government of the USVI may
enact legislation allowing for the restructuring of the financial obligations of USVI government entities or imposing a stay on creditor
remedies, including by making PROMESA applicable to the USVI.
At December 31, 2023, the Corporation had approximately $28 million in direct exposure to USVI government entities (December
31, 2022 - $28 million).
British Virgin Islands
The Corporation has operations in the British Virgin Islands (“BVI”), which was negatively affected by the COVID-19 pandemic,
particularly as a reduction in the tourism activity which accounts for a significant portion of its economy. Although the Corporation
has no significant exposure to a single borrower in the BVI, at December 31, 2023, it has a loan portfolio amounting to
approximately $205 million comprised of various retail and commercial clients, compared to a loan portfolio of $214 million at
December 31, 2022.
U.S. Government
As further detailed in Notes 6 and 7 to the Consolidated Financial Statements, a substantial portion of the Corporation’s investment
securities represented exposure to the U.S. Government in the form of U.S. Government sponsored entities, as well as agency
mortgage-backed and U.S. Treasury securities. In addition, $1.9 billion of residential mortgages, $9.2 million of SBA loans under the
Paycheck Protection Program (“PPP”) and $80 million commercial loans were insured or guaranteed by the U.S. Government or its
agencies at December 31, 2023 (compared to $1.6 billion, $38 million and $72 million, respectively, at December 31, 2022).
100
Non-Performing Assets
Non-performing assets (“NPAs”) include primarily past-due loans that are no longer accruing interest, renegotiated loans, and real
estate property acquired through foreclosure. A summary, including certain credit quality metrics, is presented in Table 23.
During 2023, the Corporation continued to reflect credit quality normalization. Non-performing loans (“NPLs”) and net charge offs
(“NCOs”) continued below historical pre-pandemic averages. Consumer portfolios, however, reflected certain credit quality
deterioration, particularly the personal loans and credit cards portfolios, with delinquencies and NCOs near or exceeding pre-
pandemic levels. The auto loans portfolio also showed credit normalization, however, metrics remained below pre-pandemic levels.
The commercial and mortgage portfolios continue to operate with historically low levels of NCOs and NPLs. We continue to closely
monitor changes in the macroeconomic environment and on borrower performance given higher interest rates and inflationary
pressures. However, management believes that the improvements over recent years in risk management practices and the risk
profile of the Corporation’s loan portfolios position Popular to continue to operate successfully under the current environment.
Total NPAs decreased by $91 million when compared with December 31, 2022. Total non-performing loans held-in-portfolio
(“NPLs”) decreased by $82 million from December 31, 2022. BPPR’s NPLs decreased by $73 million, mainly driven by lower
mortgage NPLs by $67 million. Popular U.S. NPLs decreased by $9 million from December 31, 2022, mainly driven by lower
mortgage NPLs. At December 31, 2023, the ratio of NPLs to total loans held-in-portfolio was 1.0% compared to 1.4%, at December
31, 2022. Other real estate owned loans (“OREOs”) decreased by $9 million. At December 31, 2023, NPLs secured by real estate
amounted to $231 million in the Puerto Rico operations and $24 million in Popular U.S. These figures were $303 million and $33
million, respectively, at December 31, 2022.
The Corporation’s commercial loan portfolio secured by real estate (“CRE”) amounted to $10.6 billion at December 31, 2023, of
which $3.1 billion was secured with owner occupied properties, compared with $9.9 billion and $3.1 billion, respectively, at
December 31, 2022. CRE NPLs amounted to $48 million at December 31, 2023, compared with $54 million at December 31, 2022.
The CRE NPL ratios for the BPPR and Popular U.S. segments were 0.86% and 0.13%, respectively, at December 31, 2023,
compared with 1.04% and 0.12%, respectively, at December 31, 2022.
In addition to the NPLs included in Table 23, at December 31, 2023, there were $510 million of performing loans, mostly commercial
loans, which in management’s opinion, are currently subject to potential future classification as non-performing (December 31, 2022
- $374 million).
For the year ended December 31, 2023, total inflows of NPLs held-in-portfolio, excluding consumer loans, remained flat at $213
million, when compared to the inflows for the same period in 2022. Inflows of NPLs held-in-portfolio at the BPPR segment increased
by $22 million compared to the same period in 2022, driven by higher commercial and construction inflows by $25 million and $9
million, respectively, in part offset by lower mortgage inflows by $12 million. Commercial increase incudes an $18 million inflow
during the fourth quarter of 2023. Inflows of NPLs held-in-portfolio at the Popular U.S. segment decreased by $21 million from the
same period in 2022, mainly driven by lower commercial inflows.
101
Table 23 - Non-Performing Assets
December 31, 2023
December 31, 2022
(Dollars in thousands)
BPPR
Popular U.S.
Popular, Inc.
BPPR
Popular U.S.
Popular, Inc.
Non-accrual loans:
Commercial
Commercial multi-family
$
1,991
$
-
$
1,991
$
242
$
-
$
242
Commercial real estate non-owner
occupied
8,745
1,117
9,862
23,662
1,454
25,116
Commercial real estate owner occupied
29,430
6,274
35,704
23,990
5,095
29,085
Commercial and industrial
32,826
3,772
36,598
34,277
4,319
38,596
Total Commercial
72,992
11,163
84,155
82,171
10,868
93,039
Construction
6,378
-
6,378
-
-
-
Leasing
8,632
-
8,632
5,941
-
5,941
Mortgage
175,106
11,191
186,297
242,391
20,488
262,879
Consumer
-
3,733
3,733
-
4,110
4,110
19,031
2,805
21,836
18,082
1,958
20,040
45,615
-
45,615
40,978
-
40,978
964
1
965
12,446
8
12,454
Total Consumer
65,610
6,539
72,149
71,506
6,076
77,582
Total non-performing loans held-in-portfolio
328,718
28,893
357,611
402,009
37,432
439,441
Other real estate owned (“OREO”)
80,176
240
80,416
88,773
353
89,126
Total non-performing assets
[1]
$
408,894
$
29,133
$
438,027
$
490,782
$
37,785
$
528,567
Accruing loans past due 90 days or more
[2]
$
268,362
$
109
$
268,471
$
351,248
$
366
$
351,614
Non-performing loans to loans held-in-
portfolio
1.02
%
%
1.37
Interest Lost
18,697
27,920
[1] There were no non-performing loans held-for-sale as of December 31, 2023 and December 31, 2022.
[2] It is the Corporation’s policy to report delinquent residential mortgage loans insured by FHA or guaranteed by the VA as accruing loans past due 90
days or more as opposed to non-performing since the principal repayment is insured. These balances include $106 million of residential mortgage
loans insured by FHA or guaranteed by the VA that are no longer accruing interest as of December 31, 2023 (December 31, 2022 - $190 million).
Furthermore, at December 31,2023 the Corporation had approximately $38 million in reverse mortgage loans which are guaranteed by FHA, but
which are currently not accruing interest. Due to the guaranteed nature of the loans, it is the Corporation’s policy to exclude these balances from non-
performing assets (December 31, 2022 - $42 million).
102
Table 24 - Activity in Non -Performing Loans Held-in-Portfolio (Excluding Consumer Loans)
For the year ended December 31, 2023
(In thousands)
BPPR
Popular U.S.
Popular, Inc.
Beginning balance - NPLs
$
324,562
$
31,356
$
355,918
Plus:
New non-performing loans
180,426
31,484
211,910
Advances on existing non-performing loans
-
681
681
Less:
Non-performing loans transferred to OREO
(36,684)
(58)
(36,742)
Non-performing loans charged-off
(10,128)
(4,837)
(14,965)
Loans returned to accrual status / loan collections
(203,700)
(36,272)
(239,972)
Ending balance - NPLs
$
254,476
$
22,354
$
276,830
Table 25 - Activity in Non -Performing Loans Held-in-Portfolio (Excluding Consumer Loans)
For the year ended December 31, 2022
(In thousands)
BPPR
Popular U.S.
Popular, Inc.
Beginning balance - NPLs
$
454,419
$
27,501
$
481,920
Plus:
New non-performing loans
158,128
50,754
208,882
Advances on existing non-performing loans
-
2,825
2,825
Less:
Non-performing loans transferred to OREO
(38,580)
(85)
(38,665)
Non-performing loans charged-off
(7,413)
(9,062)
(16,475)
Loans returned to accrual status / loan collections
(241,992)
(40,577)
(282,569)
Ending balance - NPLs
$
324,562
$
31,356
$
355,918
103
Table 26 - Activity in Non -Performing Commercial Loans Held-In-Portfolio
For the year ended December 31, 2023
(In thousands)
BPPR
Popular U.S.
Popular, Inc.
Beginning balance - NPLs
$82,171
$10,868
$93,039
Plus:
New non-performing loans
44,542
15,533
60,075
Advances on existing non-performing loans
-
550
550
Less:
Non-performing loans transferred to OREO
(5,930)
-
(5,930)
Non-performing loans charged-off
(7,664)
(4,837)
(12,501)
Loans returned to accrual status / loan collections
(40,127)
(10,951)
(51,078)
Ending balance - NPLs
$72,992
$11,163
$84,155
Table 27 - Activity in Non -Performing Commercial Loans Held-in-Portfolio
For the year ended December 31, 2022
(In thousands)
BPPR
Popular U.S.
Popular, Inc.
Beginning balance - NPLs
$120,047
5,532
$125,579
Plus:
New non-performing loans
19,476
33,861
53,337
Advances on existing non-performing loans
-
2,525
2,525
Less:
Non-performing loans transferred to OREO
(4,763)
-
(4,763)
Non-performing loans charged-off
(5,872)
(8,935)
(14,807)
Loans returned to accrual status / loan collections
(46,717)
(22,115)
(68,832)
Ending balance - NPLs
$82,171
$10,868
$93,039
Table 28 - Activity in Non-Performing Construction Loans Held-In -Portfolio
For the year ended December 31, 2023
(In thousands)
BPPR
Popular U.S.
Popular, Inc.
Beginning balance - NPLs
$-
$-
$-
New non-performing loans
9,284
-
9,284
Less:
Non-performing loans charged-off
(2,537)
-
(2,537)
Loans returned to accrual status / loan collections
(369)
-
(369)
Ending balance - NPLs
$6,378
$-
$6,378
104
Table 29 - Activity in Non-Performing Construction Loans Held-in -Portfolio
For the year ended December 31, 2022
(In thousands)
BPPR
Popular U.S.
Popular, Inc.
Beginning balance - NPLs
$485
$-
$485
Less:
Loans returned to accrual status / loan collections
(485)
-
(485)
Ending balance - NPLs
$-
$-
$-
Table 30 - Activity in Non -Performing Mortgage Loans Held-in-Portfolio
For the year ended December 31, 2023
(In thousands)
BPPR
Popular U.S.
Popular, Inc.
Beginning balance - NPLs
$242,391
$20,488
$262,879
Plus:
New non-performing loans
126,600
15,951
142,551
Advances on existing non-performing loans
-
131
131
Less:
Non-performing loans transferred to OREO
(30,754)
(58)
(30,812)
Non-performing loans charged-off
73
-
73
Loans returned to accrual status / loan collections
(163,204)
(25,321)
(188,525)
Ending balance - NPLs
$175,106
$11,191
$186,297
Table 31 - Activity in Non -Performing Mortgage Loans Held-in-Portfolio
For the year ended December 31, 2022
(In thousands)
BPPR
Popular U.S.
Popular, Inc.
Beginning balance - NPLs
$333,887
$21,969
$355,856
Plus:
New non-performing loans
138,652
16,893
155,545
Advances on existing non-performing loans
-
300
300
Less:
Non-performing loans transferred to OREO
(33,817)
(85)
(33,902)
Non-performing loans charged-off
(1,541)
(127)
(1,668)
Loans returned to accrual status / loan collections
(194,790)
(18,462)
(213,252)
Ending balance - NPLs
$242,391
$20,488
$262,879
105
Loan Delinquencies
Another key measure used to evaluate and monitor the Corporation’s asset quality is loan delinquencies. Loans delinquent 30 days
or more and delinquencies, as a percentage of their related portfolio category at December 31, 2023 and 2022, are presented
below.
Table 32 - Loan Delinquencies
(Dollars in thousands)
2023
2022
Loans delinquent
30 days or more
Total loans
Total delinquencies
as a percentage
Loans delinquent
30 days or more
Total loans
Total delinquencies
as a percentage
Commercial
Commercial multi-family
$
13,657
$
2,415,620
0.57
%
$
2,844
$
2,321,713
0.12
%
Commercial real estate
non-owner occupied
17,051
5,087,421
0.34
26,969
4,499,670
0.60
Commercial real estate
owner occupied
69,239
3,080,635
2.25
30,059
3,078,549
0.98
Commercial and industrial
58,953
7,126,121
0.83
59,604
5,839,200
1.02
Total Commercial
158,900
17,709,797
0.90
119,476
15,739,132
0.76
Construction
6,378
959,280
0.66
-
757,984
-
Leasing
35,491
1,731,809
2.05
21,487
1,585,739
1.36
Mortgage
[1]
859,537
7,695,917
11.17
937,253
7,397,471
12.67
Consumer
Credit cards
46,436
1,135,747
4.09
24,065
1,041,870
2.31
Home equity lines of credit
5,465
65,953
8.29
4,684
71,916
6.51
Personal
59,682
1,945,247
3.07
45,299
1,823,579
2.48
Auto
173,119
3,660,780
4.73
129,089
3,512,530
3.68
Other
3,063
160,441
1.91
13,264
147,548
8.99
Total Consumer
287,765
6,968,168
4.13
216,401
6,597,443
3.28
Loans held-for-sale
-
4,301
-
-
5,381
-
Total
$
1,348,071
$
35,069,272
3.84
%
$
1,294,617
$
32,083,150
4.04
%
[1] Loans delinquent 30 days or more includes $0.5 billion of residential mortgage loans insured by FHA or guaranteed by the VA as of December
31, 2023 (December 31, 2022 - $0.5 billion). Refer to Note 8 to the Consolidated Financial Statements for additional information of guaranteed loans.
Allowance for Credit Losses (“ACL”)
The allowance for credit losses (“ACL”), represents management’s estimate of expected credit losses through the remaining
contractual life of the different loan segments, impacted by expected prepayments. The ACL is maintained at a sufficient level to
provide for estimated credit losses on collateral dependent loans as well as loans modified for borrowers with financial difficulties
separately from the remainder of the loan portfolio. The Corporation’s management evaluates the adequacy of the ACL on a
quarterly basis. In this evaluation, management considers current conditions, macroeconomic economic expectations through a
reasonable and supportable period, historical loss experience, portfolio composition by loan type and risk characteristics, results of
periodic credit reviews of individual loans, and regulatory requirements, amongst other factors.
The Corporation must rely on estimates and exercise judgment regarding matters where the ultimate outcome is unknown, such as
economic developments affecting specific customers, industries, or markets. Other factors that can affect management’s estimates
are recalibration of statistical models used to calculate lifetime expected losses, changes in underwriting standards, financial
accounting standards and loan impairment measurements, among others. Changes in the financial condition of individual borrowers,
in economic conditions, and in the condition of the various markets in which collateral may be sold, may also affect the required
level of the allowance for credit losses. Consequently, the business financial condition, liquidity, capital, and results of operations
could also be affected.
106
At December 31, 2023, the allowance for credit losses amounted to $729 million, an increase of $9 million, when compared with
December 31, 2022. The ACL for BPPR increased by $24 million to $640 million, when compared to December 31, 2022, mostly
driven by changes in the economic scenario, higher loan volumes and changes in credit quality. The ACL for Popular U.S.
decreased by $15 million to $89 million, when compared to December 31, 2022, due to the implementation of a new model for the
U.S. commercial real estate portfolio. The new model is based on more granular regional information for the Corporation’s portfolio
and accounted for $15 million of PB’s reduction in ACL.
Given that any one economic outlook is inherently uncertain, the Corporation leverages multiple scenarios to estimate its ACL. The
baseline scenario continues to be assigned the highest probability, followed by the pessimistic scenario. The Corporation evaluates,
at least on an annual basis, the assumptions tied to the CECL accounting framework. These include the reasonable and
supportable period as well as the reversion window.
GDP growth is expected to slow during 2024 for both regions, when compared to 2023, as a result of the Fed’s monetary policy. The
2024 GDP growth is expected to be 1.2% for Puerto Rico and 1.7% for the United States. The average 2024 unemployment rate is
expected to increase to 6.79% in Puerto Rico and 3.95% in the United States.
The provision for credit losses for the year ended December 31, 2023, amounted to $201.5 million, compared to an expense of
$83.3 million for the year ended December 31, 2022, mostly related to higher NCOs. Refer to Note 9 – Allowance for credit losses –
loans held-in-portfolio to the Consolidated Financial Statements, and to the Provision for Credit Losses section of this MD&A for
additional information.
The following table presents net charge-offs to average loans held-in-portfolio (“HIP”) ratios by loan category for the years ended
December 31, 2023 and 2022:
Table 33 - Net Charge-Offs (Recoveries) to Average Loans HIP
December 31, 2023
December 31, 2022
BPPR
Popular U.S.
Popular Inc.
BPPR
Popular U.S.
Popular Inc.
Commercial
(0.10)
%
0.02
%
(0.05)
%
(0.14)
%
0.11
%
(0.02)
%
Construction
1.59
-
0.32
(0.48)
(0.19)
(0.25)
Mortgage
(0.22)
(0.02)
(0.19)
(0.26)
-
(0.22)
Leasing
0.43
-
0.43
0.26
-
0.26
Consumer
2.18
6.20
2.35
1.22
1.33
1.22
Total
0.55
%
0.19
%
0.44
%
0.23
%
0.12
%
0.20
%
NCOs for the year ended December 31, 2023 amounted to $146.4 million, increasing by $87.1 million when compared to the same
period in 2022. The BPPR segment increased by $78.6 million mainly driven by higher consumer NCOs by $68.3 million, reflective
of certain credit quality deterioration, particularly the personal loans and credit cards portfolios, with delinquencies and NCOs near
or exceeding pre-pandemic levels. The auto loans portfolio also showed credit normalization, however, metrics remained below pre-
pandemic levels. The PB segment NCOs increased by $8.5 million, mainly driven by higher consumer NCOs by $13.5 million.
107
Table 34 - Allowance for Credit Losses - Loan Portfolios
December 31, 2023
(Dollars in thousands)
Total ACL
Total loans held-
in-portfolio
ACL to loans held-
in-portfolio
Total non-
performing loans
held-in-portfolio
ACL to non-
performing loans
held-in-portfolio
Commercial
$
13,740
$
2,415,620
0.57
%
1,991
690.11
%
65,453
5,087,421
1.29
%
9,862
663.69
%
56,864
3,080,635
1.85
%
35,704
159.27
%
122,356
7,126,121
1.72
%
36,598
334.32
%
Total Commercial
$
258,413
$
17,709,797
1.46
%
84,155
307.07
%
Construction
12,686
959,280
1.32
%
6,378
198.90
%
Leasing
9,708
1,731,809
0.56
%
8,632
112.47
%
Mortgage
83,214
7,695,917
1.08
%
186,297
44.67
%
Consumer
80,487
1,135,747
7.09
%
-
N.M.
1,978
65,953
3.00
%
3,733
52.99
%
117,790
1,945,247
6.06
%
21,836
539.43
%
157,931
3,660,780
4.31
%
45,615
346.23
%
7,134
160,441
4.45
%
965
739.27
%
Total Consumer
$
365,320
$
6,968,168
5.24
%
72,149
506.34
%
Total
$
729,341
$
35,064,971
2.08
%
357,611
203.95
%
N.M - Not meaningful.
Table 35 - Allowance for Credit Losses - Loan Portfolios
December 31, 2022
(Dollars in thousands)
Total ACL
Total loans held-
in-portfolio
ACL to loans held-
in-portfolio
Total non-
performing loans
held-in-portfolio
ACL to non-
performing loans
held-in-portfolio
Commercial
$
26,311
$
2,321,713
1.13
%
242
N.M.
71,540
4,499,670
1.59
%
25,116
284.84
%
57,081
3,078,549
1.85
%
29,085
196.26
%
80,444
5,839,200
1.38
%
38,596
208.43
%
Total Commercial
$
235,376
$
15,739,132
1.50
%
93,039
252.99
%
Construction
4,246
757,984
0.56
%
-
N.M.
Leasing
20,618
1,585,739
1.30
%
5,941
347.05
%
Mortgage
135,254
7,397,471
1.83
%
262,879
51.45
%
Consumer
58,670
1,041,870
5.63
%
-
N.M.
2,542
71,916
3.53
%
4,110
61.85
%
118,426
1,823,579
6.49
%
20,040
590.95
%
129,735
3,512,530
3.69
%
40,978
316.60
%
15,435
147,548
10.46
%
12,454
123.94
%
Total Consumer
$
324,808
$
6,597,443
4.92
%
77,582
418.66
%
Total
$
720,302
$
32,077,769
2.25
%
439,441
163.91
%
N.M - Not meaningful.
Table 36 details the breakdown of the allowance for credit losses by loan categories. The breakdown is made for analytical
purposes, and it is not necessarily indicative of the categories in which future loan losses may occur.
108
Table 36 - Allocation of the Allowance for Credit Losses - Loans
At December 31,
2023
2022
% of loans
% of loans
in each
in each
category to
category to
(Dollars in millions)
ACL
total loans
ACL
total loans
Commercial
$13.7
6.9
%
$26.3
7.2
%
65.4
14.5
71.5
14.0
56.9
8.8
57.1
9.6
122.4
20.3
80.5
18.3
Total Commercial
$258.4
50.5
%
$235.4
49.1
%
Construction
12.7
2.7
4.2
2.4
Leasing
9.7
5.0
20.6
4.9
Mortgage
83.2
21.9
135.3
23.1
Consumer
80.5
3.2
58.7
3.2
2.0
0.2
2.5
0.2
117.8
5.5
118.4
5.7
157.9
10.4
129.7
11.0
7.1
0.6
15.5
0.4
Total Consumer
$365.3
19.9
%
$324.8
20.5
%
Total
[1]
$729.3
100.0
%
$720.3
100.0
%
[1] Note: For purposes of this table the term loans refers to loans held-in-portfolio excluding loans held-for-sale.
Loan Modifications
For the twelve months ended December 31, 2023, modified loans to borrowers with financial difficulty amounted to $466 million, of
which $424 million were in accruing status. The BPPR segment’s modifications to borrowers with financial difficulty amounted to
$379 million, mainly comprised of commercial and mortgage loans of $283 million and $91 million, respectively. A total of $60 million
of the mortgage modifications were related to government guaranteed loans. The Popular U.S. segment’s modifications to
borrowers with financial difficulty amounted to $87 million, of which $75 million were commercial loans.
Refer to Note 9 to the Consolidated Financial Statements for additional information on modifications made to borrowers
experiencing financial difficulties.
Enterprise Risk Management
The Corporation’s Board of Directors has established a Risk Management Committee (“RMC”) to, among other things, assist the
Board in its (i) oversight of the Corporation’s overall risk framework and (ii) to monitor, review, and approve policies to measure, limit
and manage the Corporation’s risks.
The Corporation has established a three lines of defense framework: (a) business line management constitutes the first line of
defense by identifying and managing the risks associated with business activities, (b) components of the Risk Management Group
and the Corporate Security Group, among others, act as the second line of defense by, among other things, measuring and
reporting on the Corporation’s risk activities, and (c) the Corporate Auditing Division
,
the Audit Committee of the Board, by independently providing assurance regarding the effectiveness of the risk framework.
109
The Enterprise Risk Management Committee (the “ERM Committee”) is a management committee whose purpose is to oversee and
monitor Market, Interest, Liquidity, Regulatory and Financial Compliance, BSA/AML & Sanctions, Regulatory, Strategic, Operational
(including Fraud and Third Party Risk, among others), Information Technology and Cyber Security, Legal, Credit, Climate and
Reputational risks, as defined in the Risk Appetite Statement of the Risk Management Policy and within the Corporation’s Enterprise
Risk Management (“ERM”) framework. The ERM Committee and the Enterprise Risk Management Department in the Financial and
Operational Risk Management Division (the “FORM Division”), in coordination with the Chief Risk Officer, create the framework to
identify and manage multiple and cross-enterprise risks, and to articulate the RAS and supporting metrics.
The Enterprise Risk Management Department has established a process to ensure that an appropriate standard readiness
assessment is performed before we launch a new product or service. Similar procedures are followed with the Treasury Division for
transactions involving the purchase and sale of assets, and by the Mergers and Acquisitions Division for acquisition transactions.
The Asset/Liability Committee (“ALCO”), composed of senior management representatives from the business lines and corporate
functions, and the Corporate Finance Group, are responsible for planning and executing the Corporation’s market, interest rate risk,
funding activities and strategy, as well as for implementing approved policies and procedures. The ALCO also reviews the
Corporation’s capital policy and the attainment of the capital management objectives. In addition, the Financial Risk, Corporate
Insurance & Advisory Department independently measures, monitors and reports compliance with liquidity and market risk policies,
and oversees controls surrounding interest risk measurements.
The Corporate Compliance Committee, comprised of senior management team members and representatives from the Regulatory
and Financial Compliance Division and the Financial Crimes Compliance Division, among others, are responsible for overseeing
and assessing the adequacy of the risk management processes that underlie Popular’s compliance program for identifying,
assessing, measuring, monitoring, testing, mitigating, and reporting compliance risks. They also supervise Popular’s reporting
obligations under the compliance program to ensure the adequacy, consistency and timeliness of the reporting of compliance-
related risks across the Corporation.
The Regulatory Affairs team is responsible for maintaining an open dialog with the banking regulatory agencies to ensure regulatory
risks are properly identified, measured, monitored, as well as communicated to the appropriate regulatory agency as necessary to
keep them apprised of material matters within the purview of these agencies.
The Credit Strategy Committee, composed of senior level management representatives from the business lines and corporate
functions, and the Corporate Credit Risk Management Division, are responsible for monitoring credit risk management activities both
at the corporate level and across all Popular subsidiaries to ensure the development and consistent application of credit risk
policies, processes and procedures that measure, limit and manage credit risks, while seeking to maintain the effectiveness and
efficiency of the operating and businesses processes.
The Corporation’s Operational Risk Committee (“ORCO”) composed of senior level management representatives from the business
lines and corporate functions, provide executive oversight of the operational risk management activities of Popular and its
subsidiaries to ensure the development and consistent application of operational risk policies, processes, and procedures that
measure, limit, and manage operational risks while maintaining the effectiveness and efficiency of the operating and business
processes. The FORM Division, within the Risk Management Group, serves as ORCO’s operating arm and is responsible for
establishing baseline processes to measure, monitor, limit and manage operational risk.
The Corporate Security Group (“CSG”), under the direction of the Chief Security Officer, leads all efforts pertaining to cybersecurity,
enterprise fraud and data privacy, including developing strategies and oversight processes with policies and programs that mitigate
compliance, operational, strategic, financial and reputational risks associated with the Corporation’s and our customers’ data and
assets.
The Information Technology and Cyber Risk Committee, composed of senior management representatives from the business lines
and corporate functions, the Information Technology Division and the CSG, are responsible for the oversight and monitoring of
information technology and cybersecurity risks, mitigation strategies, actions and controls, key risk metrics, and information
technology and cyber incidents that may result in operational, compliance and reputational risks.
The Chief Security Officer also co-
chairs the Information Technology & Cyber Security Risk Committee along with the Chief Information & Digital Strategy Officer.
The Corporate Legal Division, in this context, has the responsibility of assessing, monitoring, managing and reporting with respect to
legal risks, including those related to litigation, investigations and other material legal matters.
The Corporation has also established an ESG Committee whose purpose and responsibility is to oversee the Corporation’s ESG
strategies and support the development and consistent application of policies, processes and procedures that measure, limit and
110
manage ESG matters and risks. The ESG Committee also assesses ESG-related considerations in the credit approval process of
commercial credit applications.
The processes of strategic risk planning and the evaluation of reputational risk are on-going processes through which continuous
data gathering and analysis are performed. In order to ensure strategic risks are properly identified and monitored, the Corporate
Strategy and Transformation Division, which reports to the Corporation’s Chief Operations Officer, performs periodic assessments
regarding corporate strategic priority initiatives, such as the Corporation’s transformation initiative and other emerging issues. The
Acquisitions and Corporate Investments Division continuously assesses potential strategic transactions. The Corporate
Communications Division is responsible for the monitoring, management and implementation of action plans with respect to
reputational risk issues.
Popular’s capital planning process integrates the Corporation’s risk profile as well as its strategic focus, operating environment, and
other factors that could materially affect capital adequacy in hypothetical highly-stressed business scenarios. Capital ratio targets
and triggers take into consideration the different risks evaluated under Popular’s risk management framework.
In addition to establishing a formal process to manage risk, our corporate culture is also critical to an effective risk management
function. Through our Code of Ethics, the Corporation provides a framework for all our employees to conduct themselves with the
highest integrity.
ADOPTION OF NEW ACCOUNTING STANDARDS AND ISSUED BUT NOT YET EFFECTIVE ACCOUNTING STANDARDS
Refer to Note 3, “New Accounting Pronouncements” to the Consolidated Financial Statements.
111
Statistical Summary 2023-2022
Statements of Financial Condition
At December 31,
(In thousands)
2023
2022
Assets:
Cash and due from banks
$
420,462
$
469,501
Money market investments:
Time deposits with other banks
6,998,871
5,614,595
Total money market investments
6,998,871
5,614,595
Trading account debt securities, at fair value
31,568
27,723
Debt securities available-for-sale, at fair value
16,729,044
17,804,374
Debt securities held-to-maturity, at amortized cost
8,194,335
8,525,366
Less – Allowance for credit losses
5,780
6,911
Debt securities held-to-maturity, net
8,188,555
8,518,455
Equity securities
193,726
195,854
Loans held-for-sale, at fair value
4,301
5,381
Loans held-in-portfolio:
Loans held-in-portfolio
35,420,879
32,372,925
Less – Unearned income
355,908
295,156
729,341
720,302
Total loans held-in-portfolio, net
34,335,630
31,357,467
Premises and equipment, net
565,284
498,711
Other real estate
80,416
89,126
Accrued income receivable
263,433
240,195
Mortgage servicing rights, at fair value
118,109
128,350
Other assets
2,014,564
1,847,813
Goodwill
804,428
827,428
Other intangible assets
9,764
12,944
Total assets
$
70,758,155
$
67,637,917
Liabilities and Stockholders’ Equity
Liabilities:
Deposits:
Non-interest bearing
$
15,419,624
$
15,960,557
Interest bearing
48,198,619
45,266,670
Total deposits
63,618,243
61,227,227
Assets sold under agreements to repurchase
91,384
148,609
Other short-term borrowings
-
365,000
Notes payable
986,948
886,710
Other liabilities
914,627
916,946
Total liabilities
65,611,202
63,544,492
Stockholders’ equity:
Preferred stock
22,143
22,143
Common stock
1,048
1,047
Surplus
4,843,399
4,790,993
Retained earnings
4,194,851
3,834,348
Treasury stock – at cost
(2,018,957)
(2,030,178)
Accumulated other comprehensive loss, net of tax
(1,895,531)
(2,524,928)
Total stockholders’ equity
5,146,953
4,093,425
Total liabilities and stockholders’ equity
$
70,758,155
$
67,637,917
112
Statistical Summary 2021-2023
Statements of Operations
For the years ended December 31,
(In thousands)
2023
2022
2021
Interest income:
Loans
$
2,331,654
$
1,876,166
$
1,747,827
Money market investments
366,625
118,080
21,147
Investment securities
547,028
471,665
353,663
Total interest income
3,245,307
2,465,911
2,122,637
Less - Interest expense
1,113,783
298,552
165,047
Net interest income
2,131,524
2,167,359
1,957,590
Provision for credit losses (benefit)
208,609
83,030
(193,464)
Net interest income after provision for credit losses (benefit)
1,922,915
2,084,329
2,151,054
Mortgage banking activities
21,497
42,450
50,133
Net gain on sale of debt securities
-
-
23
Net gain (loss), including impairment, on equity securities
3,482
(7,334)
131
Net gain (loss) on trading account debt securities
1,382
(784)
(389)
Net loss on sale of loans, including valuation adjustments on loans held-for-sale
(115)
-
(73)
Adjustment to indemnity reserves on loans sold
2,319
919
4,406
Other non-interest income
622,159
861,811
587,897
Total non-interest income
650,724
897,062
642,128
Operating expenses:
Personnel costs
778,045
719,764
631,802
All other operating expenses
1,120,055
1,026,656
917,473
Total operating expenses
1,898,100
1,746,420
1,549,275
Income before income tax
675,539
1,234,971
1,243,907
Income tax expense
134,197
132,330
309,018
Net Income
$
541,342
$
1,102,641
$
934,889
Net Income Applicable to Common Stock
$
539,930
$
1,101,229
$
933,477
113
Statistical Summary 2020-2022
Average Balance Sheet and Summary of Net Interest Income
On a Taxable Equivalent Basis*
2023
2022
2021
(Dollars in thousands)
Average
Balance
Interest
Average
Rate
Average
Balance
Interest
Average
Rate
Average
Balance
Interest
Average
Rate
Assets
Interest earning assets:
Money market investments
$
7,051,718
$
366,625
5.20
%
$
9,530,698
$
118,079
1.24
%
$
15,999,741
$
21,147
0.13
%
U.S. Treasury securities
20,305,488
441,179
2.17
21,141,431
448,961
2.12
12,396,773
266,670
2.16
Obligations of U.S. Government
sponsored entities
-
-
-
41
2
5.66
7,972
120
1.50
Obligations of Puerto Rico, States
and political subdivisions
64,682
5,863
9.06
67,965
7,824
11.51
75,607
7,608
10.06
Collateralized mortgage obligations and
7,360,071
157,196
2.14
8,342,672
198,566
2.38
10,255,525
224,706
2.19
Other
196,226
11,519
5.87
190,489
8,925
4.68
194,640
9,027
4.64
Total investment securities
27,926,467
615,757
2.20
29,742,598
664,278
2.23
22,930,517
508,131
2.22
Trading account securities
31,876
1,377
4.32
51,357
3,049
5.94
84,380
4,339
5.16
Loans (net of unearned income)
33,164,961
2,387,351
7.20
30,405,280
1,924,895
6.33
29,074,036
1,794,789
6.19
Total interest earning assets/Interest
income
$
68,175,022
$
3,371,110
4.94
%
$
69,729,933
$
2,710,301
3.89
%
$
68,088,674
$
2,328,406
3.43
%
Total non-interest earning assets
3,059,214
3,078,671
3,079,976
Total assets
$
71,234,236
$
72,808,604
$
71,168,650
Liabilities and Stockholders' Equity
Interest bearing liabilities:
Savings, NOW, money market and
other
$
39,463,481
$
862,981
2.19
%
$
41,769,576
$
191,064
0.46
%
$
41,387,504
$
59,034
0.15
%
Time deposits
7,775,846
187,043
2.41
6,853,127
61,781
0.90
7,028,334
52,587
0.75
Federal funds purchased
6
-
5.25
7
-
3.92
1
-
0.25
Securities purchased under agreement
to resell
115,808
6,019
5.20
107,305
2,309
2.15
91,394
317
0.35
Other short-term borrowings
27,302
1,310
4.80
99,083
3,428
3.46
343
1
0.35
Notes payable
1,109,163
56,430
5.09
938,778
39,970
4.26
1,184,737
53,107
4.49
Total interest bearing liabilities/Interest
expense
48,491,606
1,113,783
2.30
49,767,876
298,552
0.60
49,692,313
165,046
0.33
Total non-interest bearing liabilities
16,142,027
17,031,503
15,698,685
Total liabilities
64,633,633
66,799,379
65,390,998
Stockholders' equity
6,600,603
6,009,225
5,777,652
Total liabilities and stockholders' equity
$
71,234,236
$
72,808,604
$
71,168,650
Net interest income on a taxable
equivalent basis
$
2,257,327
$
2,411,749
$
2,163,360
Cost of funding earning assets
1.63
%
0.43
%
0.24
%
Net interest margin
3.31
%
3.46
%
3.19
%
Effect of the taxable equivalent
adjustment
125,803
244,390
205,770
Net interest income per books
$
2,131,524
$
2,167,359
$
1,957,590
* Shows the effect of the tax exempt status of some loans and investments on their yield, using the applicable statutory income tax rates. The
computation considers the interest expense disallowance required by the Puerto Rico Internal Revenue Code. This adjustment is shown in order to
compare the yields of the tax exempt and taxable assets on a taxable basis.
Note: Average loan balances include the average balance of non-accruing loans. No interest income is recognized for these loans in accordance with
the Corporation’s policy. Average balances exclude unrealized gains or losses on debt securities available-for-sale and unrealized losses on debt
securities transfer to held-to-maturities.


114
Report of Management on Internal Control Over Financial Reporting
The management of Popular, Inc. (the “Corporation”) is responsible for establishing and maintaining adequate internal control over
financial reporting as defined in Rules 13a - 15(f) and 15d - 15(f) under the Securities Exchange Act of 1934 and for our assessment
of internal control over financial reporting. The Corporation’s internal control over financial reporting is a process designed to provide
reasonable assurance regarding the reliability of financial reporting and the preparation of financial statements for external purposes
in accordance with accounting principles generally accepted in the United States of America, and includes controls over the
preparation of financial statements in accordance with the instructions to the Consolidated Financial Statements for Bank Holding
Companies (Form FR Y-9C) to comply with the reporting requirements of Section 112 of the Federal Deposit Insurance Corporation
Improvement Act (FDICIA). The Corporation’s internal control over financial reporting includes those policies and procedures that:
(i) pertain to the maintenance of records that, in reasonable detail, accurately and fairly reflect the transactions and
dispositions of the assets of the Corporation;
(ii) provide reasonable assurance that transactions are recorded as necessary to permit preparation of financial
statements in accordance with accounting principles generally accepted in the United States of America, and that receipts
and expenditures of the Corporation are being made only in accordance with authorizations of management and directors
of the Corporation; and
(iii) provide reasonable assurance regarding prevention or timely detection of unauthorized acquisition, use or disposition
of the Corporation’s assets that could have a material effect on the financial statements.
Because of its inherent limitations, internal control over financial reporting may not prevent or detect misstatements. Also,
projections of any evaluation of effectiveness to future periods are subject to the risk that controls may become inadequate because
of changes in conditions, or that the degree of compliance with the policies or procedures may deteriorate.
The management of Popular, Inc. has assessed the effectiveness of the Corporation’s internal control over financial reporting as of
December 31, 2023. In making this assessment, management used the criteria set forth in the Internal Control-Integrated
Framework (2013) issued by the Committee of Sponsoring Organizations of the Treadway Commission (COSO).
Based on our assessment, management concluded that the Corporation maintained effective internal control over financial reporting
as of December 31, 2023 based on the criteria referred to above.
The Corporation’s independent registered public accounting firm,
, has audited the effectiveness of
the Corporation’s internal control over financial reporting as of December 31, 2023, as stated in their report dated February 29, 2024
which appears herein.
Ignacio Alvarez
Carlos J. Vázquez
President and
Executive Vice President
Chief Executive Officer
and Chief Financial Officer

115
Report of Independent Registered Public Accounting Firm
To
the
Board of Directors and Stockholders of Popular, Inc.
Opinions on the Financial Statements and Internal Control over Financial Reporting
We have audited the accompanying consolidated statements of financial condition of Popular, Inc. and its
subsidiaries (the “Corporation”) as of December 31, 2023 and 2022, and the related consolidated statements of
operations, comprehensive income (loss), changes in stockholders’ equity and cash flows for each of the three years
in the period ended December 31, 2023, including the related notes (collectively referred to as the “consolidated
financial statements”). We also have audited the Corporation's internal control over financial reporting as of
December 31, 2023, based on criteria established in Internal Control - Integrated Framework (2013) issued by the
Committee of Sponsoring Organizations of the Treadway Commission (COSO).
In our opinion, the consolidated financial statements referred to above present fairly, in all material respects, the
financial position of the Corporation as of December 31, 2023 and 2022, and the results of its operations and its cash
flows for each of the three years in the period ended December 31, 2023 in conformity with accounting principles
generally accepted in the United States of America. Also in our opinion, the Corporation maintained, in all material
respects, effective internal control over financial reporting as of December 31, 2023, based on criteria established in
Internal Control - Integrated Framework (2013) issued by the COSO.
Basis for Opinions
The Corporation's management is responsible for these consolidated financial statements, for maintaining effective
internal control over financial reporting, and for its assessment of the effectiveness of internal control over financial
reporting, included in the accompanying Report of Management on Internal Control over Financial Reporting. Our
responsibility is to express opinions on the Corporation’s consolidated financial statements and on the Corporation’s
internal control over financial reporting based on our audits. We are a public accounting firm registered with the
Public Company Accounting Oversight Board (United States) (PCAOB) and are required to be independent with
respect to the Corporation in accordance with the U.S. federal securities laws and the applicable rules and
regulations of the Securities and Exchange Commission and the PCAOB.
We conducted our audits in accordance with the standards of the PCAOB. Those standards require that we plan and
perform the audits to obtain reasonable assurance about whether the consolidated financial statements are free of
material misstatement, whether due to error or fraud, and whether effective internal control over financial reporting
was maintained in all material respects.
Our audits of the consolidated financial statements included performing procedures to assess the risks of material
misstatement of the consolidated financial statements, whether due to error or fraud, and performing procedures that
respond to those risks. Such procedures included examining, on a test basis, evidence regarding the amounts and
disclosures in the consolidated financial statements. Our audits also included evaluating the accounting principles
used and significant estimates made by management, as well as evaluating the overall presentation of the
consolidated financial statements. Our audit of internal control over financial reporting included obtaining an
understanding of internal control over financial reporting, assessing the risk that a material weakness exists, and
testing and evaluating the design and operating effectiveness of internal control based on the assessed risk. Our
audits also included performing such other procedures as we considered necessary in the circumstances. We believe
that our audits provide a reasonable basis for our opinions.
116
Definition and Limitations of Internal Control over Financial Reporting
A company’s internal control over financial reporting is a process designed to provide reasonable assurance
regarding the reliability of financial reporting and the preparation of financial statements for external purposes in
accordance with generally accepted accounting principles. Management's assessment and our audit of Popular,
Inc.'s internal control over financial reporting also included controls over the preparation of financial statements in
accordance with the instructions to the Consolidated Financial Statements for Bank Holding Companies (Form FR Y-
9C) to comply with the reporting requirements of Section 112 of the Federal Deposit Insurance Corporation
Improvement Act (FDICIA). A company’s internal control over financial reporting includes those policies and
procedures that (i) pertain to the maintenance of records that, in reasonable detail, accurately and fairly reflect the
transactions and dispositions of the assets of the company; (ii) provide reasonable assurance that transactions are
recorded as necessary to permit preparation of financial statements in accordance with generally accepted
accounting principles, and that receipts and expenditures of the company are being made only in accordance with
authorizations of management and directors of the company; and (iii) provide reasonable assurance regarding
prevention or timely detection of unauthorized acquisition, use, or disposition of the company’s assets that could have
a material effect on the financial statements.
Because of its inherent limitations, internal control over financial reporting may not prevent or detect misstatements.
Also, projections of any evaluation of effectiveness to future periods are subject to the risk that controls may become
inadequate because of changes in conditions, or that the degree of compliance with the policies or procedures may
deteriorate.
Critical Audit Matters
The critical audit matter communicated below is a matter arising from the current period audit of the consolidated
financial statements that was communicated or required to be communicated to the audit committee and that (i)
relates to accounts or disclosures that are material to the consolidated financial statements and (ii) involved our
especially challenging, subjective, or complex judgments. The communication of critical audit matters does not alter
in any way our opinion on the consolidated financial statements, taken as a whole, and we are not, by communicating
the critical audit matter below, providing a separate opinion on the critical audit matter or on the accounts or
disclosures to which it relates.
Allowance for Credit Losses on Loans Held-in-Portfolio - Quantitative Models, and Qualitative Adjustments to the
Puerto Rico Commercial Portfolios
As described in Notes 2 and 9 to the consolidated financial statements, the Corporation follows the current expected
credit loss (“CECL”) model, to establish and evaluate the adequacy of the allowance for credit losses (“ACL”) to
provide for expected losses in the loan portfolio. As of December 31, 2023, the allowance for credit losses was $729
million on total loans of $34 billion. This CECL model establishes a forward-looking methodology that reflects the
expected credit losses over the lives of financial assets. The quantitative modeling framework includes competing
risk models to generate lifetime defaults and prepayments, and other loan level modeling techniques to estimate loss
severity. As part of this methodology, management evaluates various macroeconomic scenarios, and may apply
probability weights to the outcome of the selected scenarios. The ACL also includes a qualitative framework that
addresses losses that are expected but not captured within the quantitative modeling framework. In order to identify
potential losses that are not captured through the models, management evaluated model limitations as well as the
different risks covered by the variables used in each quantitative model. To complement the analysis, management
also evaluated sectors that have low levels of historical defaults, but current conditions show the potential for future
losses.
The principal considerations for our determination that performing procedures relating to the allowance for credit
losses on loans held-in-portfolio quantitative models, and qualitative adjustments to the Puerto Rico commercial
portfolios is a critical audit matter are (i) the significant judgment by management in determining the allowance for
credit losses, including qualitative adjustments to the Puerto Rico commercial portfolios, which in turn led to a high
degree of auditor effort, judgment, and subjectivity in performing procedures and evaluating audit evidence relating

117
to the allowance for credit losses, including management’s selection of macroeconomic scenarios and probability
weights applied; and (ii) the audit effort involved the use of professionals with specialized skill and knowledge.
Addressing the matter involved performing procedures and evaluating audit evidence in connection with forming our
overall opinion on the consolidated financial statements. These procedures included testing the effectiveness of
controls relating to the allowance for credit losses for loans held-in-portfolio, including qualitative adjustments to the
Puerto Rico commercial portfolios. These procedures also included, among others, testing management’s process for
estimating the allowance for credit losses by (i) evaluating the appropriateness of the methodology, including models
used for estimating the ACL; (ii) evaluating the reasonableness of management’s selection of various
macroeconomic scenarios including probability weights applied to the expected loss outcome of the selected
macroeconomic scenarios; (iii) evaluating the reasonableness of the qualitative adjustments to Puerto Rico
commercial portfolios allowance for credit losses; and (iv) testing the data used in the allowance for credit losses.
Professionals with specialized skill and knowledge were used to assist in evaluating the appropriateness of the
methodology and models, the reasonableness of management’s selection and weighting of macroeconomic
scenarios used to estimate current expected credit losses and reasonableness of the qualitative adjustments to
Puerto Rico commercial portfolios allowance for credit losses.
February 29, 2024
We have served as the Corporation’s auditor since 1971, which includes periods before the Corporation became
subject to SEC reporting requirements.
CERTIFIED PUBLIC ACCOUNTANTS
(OF PUERTO RICO)
License No. LLP-216 Expires Dec. 1, 2025
Stamp E548240 of the P.R. Society of
Certified Public Accountants has been
affixed to the file copy of this report
118
POPULAR, INC.
CONSOLIDATED STATEMENTS OF FINANCIAL CONDITION
[UNAUDITED]
December 31,
December 31,
(In thousands, except share information)
2023
2022
Assets:
Cash and due from banks
$
$
Money market investments:
Time deposits with other banks
Total money market investments
Trading account debt securities, at fair value:
Other trading account debt securities
Debt securities available-for-sale, at fair value:
Pledged securities with creditors’ right to repledge
Other debt securities available-for-sale
Debt securities held-to-maturity, at amortized cost:
Pledged securities with creditors’ right to repledge
Other debt securities held-to-maturity
Debt securities held-to-maturity (fair value 2023 - $
; 2022 - $
)
Less – Allowance for credit losses
Debt securities held-to-maturity, net
Equity securities (realizable value 2023 - $
; 2022 - $
)
Loans held-for-sale, at fair value
Loans held-in-portfolio
Less – Unearned income
Total loans held-in-portfolio, net
Premises and equipment, net
Other real estate
Accrued income receivable
Mortgage servicing rights, at fair value
Other assets
Goodwill
Other intangible assets
Total assets
$
$
Liabilities and Stockholders’ Equity
Liabilities:
Deposits:
Non-interest bearing
$
$
Interest bearing
Total deposits
Assets sold under agreements to repurchase
Other short-term borrowings
Notes payable
Other liabilities
Total liabilities
Commitments and contingencies (Refer to Note 24)
Stockholders’ equity:
Preferred stock,
-
)
Common stock, $
) and
)
Surplus
Retained earnings
Treasury stock - at cost,
)
(2,018,957 )
(2,030,178 )
Accumulated other comprehensive loss, net of tax
(1,895,531 )
(2,524,928 )
Total stockholders’ equity
Total liabilities and stockholders’ equity
$
$
The accompanying notes are an integral part of these Consolidated Financial Statements.
119
POPULAR, INC.
CONSOLIDATED STATEMENTS OF OPERATIONS
Years ended December 31,
(In thousands, except per share information)
2023
2022
2021
Interest income:
Loans
$
$
$
Money market investments
Investment securities
Total interest income
Interest expense:
Deposits
Short-term borrowings
Long-term debt
Total interest expense
Net interest income
Provision for credit losses (benefit)
(193,464 )
Net interest income after provision for credit losses (benefit)
Service charges on deposit accounts
Other service fees
Mortgage banking activities (Refer to Note 10)
Net gain on sale of debt securities
Net gain (loss), including impairment on equity securities
(7,334 )
Net profit (loss) on trading account debt securities
(784 )
(389 )
Net loss on sale of loans, including valuation adjustments on loans held-for-
sale
(115 )
(73 )
Adjustments to indemnity reserves on loans sold
Other operating income
Total non-interest income
Operating expenses:
Personnel costs
Net occupancy expenses
Equipment expenses
Other taxes
Professional fees
Technology and software expenses
Processing and transactional services
Communications
Business promotion
FDIC deposit insurance
Other real estate owned (OREO) income
(15,375 )
(22,143 )
(14,414 )
Other operating expenses
Amortization of intangibles
Goodwill impairment charge
Total operating expenses
Income before income tax
Income tax expense
Net Income
$
$
$
Net Income Applicable to Common Stock
$
$
$
Net Income per Common Share – Basic
$
$
$
Net Income per Common Share – Diluted
$
$
$
The accompanying notes are an integral part of these consolidated financial statements.
120
POPULAR, INC.
CONSOLIDATED STATEMENTS OF COMPREHENSIVE INCOME (LOSS)
(UNAUDITED)
Years ended December 31,
(In thousands)
2023
2022
2021
Net income
$
$
$
Other comprehensive income (loss) before tax:
Foreign currency translation adjustment
(7,793 )
Adjustment of pension and postretirement benefit plans
Amortization of net losses
Unrealized net holding gains (losses) on debt securities arising during the period
(2,539,421 )
(619,470 )
Reclassification adjustment for gains included in net income
(23 )
Amortization of unrealized losses of debt securities transfer from available-for-sale to
held-to-maturity [1]
Unrealized net gains (losses) on cash flow hedges
(30 )
Reclassification adjustment for net (gains) losses included in net income
(41 )
(960 )
Other comprehensive income (loss) before tax
(2,460,993 )
(555,461 )
Income tax benefit
Total other comprehensive income (loss), net of tax
(2,199,859 )
(515,060 )
Comprehensive income (loss), net of tax
$
$
(1,097,218 )
$
Tax effect allocated to each component of other comprehensive income (loss):
Years ended December 31,
(In thousands)
2023
2022
2021
Adjustment of pension and postretirement benefit plans
$
(8,644 )
$
(2,929 )
$
(13,856 )
Amortization of net losses
(7,219 )
(5,867 )
(7,781 )
Unrealized net holding gains (losses) on debt securities arising during the period
Reclassification adjustment for gains included in net income
Amortization of unrealized losses of debt securities transferred from available-for-sale to
held-to-maturity [1]
(34,577 )
(8,328 )
Unrealized net gains (losses) on cash flow hedges
(612 )
(172 )
Reclassification adjustment for net (gains) losses included in net income
(263 )
Income tax benefit
$
$
$
[1] In October 2022, the Corporation transferred U.S. Treasury securities with a fair value of $
for-sale portfolio to its held-to-maturity portfolio. Refer to Note 7 to the Consolidated Financial Statements for additional information.
The accompanying notes are an integral part of these consolidated financial statements.
121
POPULAR, INC.
CONSOLIDATED STATEMENTS OF CHANGES IN STOCKHOLDERS’ EQUITY
Accumulated
Common
Preferred
Retained
Treasury
comprehensive
(In thousands)
stock
stock
Surplus
earnings
stock
income (loss)
Total
Balance at December 31, 2020
$
$
$
$
$
(1,016,954 )
$
$
Net income
Issuance of stock
Dividends declared:
Common stock
[1]
(142,290 )
(142,290 )
Preferred stock
(1,412 )
(1,412 )
Common stock purchases
[2]
(8,557 )
(347,093 )
(355,650 )
Stock based compensation
Other comprehensive loss, net of tax
(515,060 )
(515,060 )
Transfer to statutory reserve
(78,370 )
Balance at December 31, 2021
$
$
$
$
$
(1,352,650 )
$
(325,069 )
$
Net income
Issuance of stock
Dividends declared:
Common stock
[1]
(163,693 )
(163,693 )
Preferred stock
(1,412 )
(1,412 )
Common stock purchases
[3]
(691,256 )
(637,664 )
Stock based compensation
Other comprehensive loss, net of tax
(2,199,859 )
(2,199,859 )
Transfer to statutory reserve
(76,933 )
Balance at December 31, 2022
$
$
$
$
$
(2,030,178 )
$
(2,524,928 )
$
Cumulative effect of accounting change
Net income
Issuance of stock
Dividends declared:
Common stock
[1]
(163,664 )
(163,664 )
Preferred stock
(1,412 )
(1,412 )
Common stock purchases
(4,550 )
(4,550 )
Stock based compensation
Other comprehensive income, net of tax
Transfer to statutory reserve
(44,515 )
Balance at December 31, 2023
$
$
$
$
$
(2,018,957 )
$
(1,895,531 )
$
[1]
Dividends declared per common share during the year ended December 31, 2023 - $
; 2021 - $
).
[2]
During the year ended December 31, 2021, the Corporation completed a $
common stock, which was accounted for as a treasury stock transaction. Refer to Note 20 for additional information.
[3]
During the year ended December 31, 2022, the Corporation completed two accelerated share repurchase transactions with respect to its common
stock, which were accounted for as a treasury stock transactions. The aggregate amount of both transactions was $
for additional information.
Years ended December 31,
Disclosure of changes in number of shares:
2023
2022
2021
Preferred Stock:
Balance at beginning and end of year
Common Stock:
Balance at beginning of year
Issuance of stock
Balance at end of year
Treasury stock
(32,613,727 )
(32,803,802 )
(24,728,165 )
Common Stock – Outstanding
The accompanying notes are an integral part of these consolidated financial statements.
122
POPULAR, INC.
CONSOLIDATED STATEMENTS OF CASH FLOWS
Years ended December 31,
(In thousands)
2023
2022
2021
Cash flows from operating activities:
Net income
$
$
$
Adjustments to reconcile net income to net cash provided by operating activities:
Provision for credit losses (benefit)
(193,464 )
Goodwill impairment losses
Amortization of intangibles
Depreciation and amortization of premises and equipment
Net accretion of discounts and amortization of premiums and deferred fees
(45,249 )
(21,962 )
Interest capitalized on loans subject to the temporary payment moratorium or loss mitigation
alternatives
(9,868 )
(11,521 )
(15,567 )
Share-based compensation
Impairment losses on right-of-use and long-lived assets
Fair value adjustments on mortgage servicing rights
(166 )
Fair value adjustment for contingent consideration
(9,241 )
Adjustments to indemnity reserves on loans sold
(2,319 )
(919 )
(4,406 )
Earnings from investments under the equity method, net of dividends or distributions
(27,450 )
(29,522 )
(50,942 )
Deferred income tax (benefit) expense
(43,139 )
(33,129 )
(Gain) loss on:
Disposition of premises and equipment and other productive assets
(12,756 )
(9,453 )
(18,393 )
Proceeds from insurance claims
(145 )
Sale of debt securities
(23 )
Sale of loans, including valuation adjustments on loans held-for-sale and mortgage banking
activities
(21,611 )
Sale of equity method investment
(152 )
(8,198 )
Disposition of stock as part of the Evertec Transactions
(240,412 )
Sale of foreclosed assets, including write-downs
(22,665 )
(33,008 )
(30,098 )
Acquisitions of loans held-for-sale
(7,639 )
(122,363 )
(251,336 )
Proceeds from sale of loans held-for-sale
Net originations on loans held-for-sale
(68,310 )
(202,913 )
(527,585 )
Net decrease (increase) in:
Trading debt securities
Equity securities
(11,341 )
(2,336 )
Accrued income receivable
(23,238 )
(62,932 )
Other assets
Net increase (decrease) in:
Interest payable
(5,395 )
Pension and other postretirement benefits obligation
(2,893 )
(4,104 )
Other liabilities
(41,410 )
(20,724 )
Total adjustments
(88,103 )
Net cash provided by operating activities
Cash flows from investing activities:
Net (increase) decrease in money market investments
(1,383,821 )
(5,895,789 )
Purchases of investment securities:
Available-for-sale
(16,707,264 )
(22,232,278 )
(14,672,856 )
Held-to-maturity
(8,615 )
(1,879,443 )
Equity
(18,477 )
(48,921 )
(16,196 )
Proceeds from calls, paydowns, maturities and redemptions of investment securities:
Available-for-sale
Held-to-maturity
Proceeds from sale of investment securities:
Available-for-sale
Equity
Net (disbursements) repayments on loans
(2,475,837 )
(2,237,084 )
Proceeds from sale of loans
Acquisition of loan portfolios
(770,493 )
(753,684 )
(348,179 )
Payments to acquire other intangible
(905 )
Payments to acquire businesses, net of cash acquired
(155,828 )
Return of capital from equity method investments
Payments to acquire equity method investments
(1,500 )
(1,625 )
(375 )
Proceeds from sale of equity method investment
Proceeds from disposition of stock as part of the Evertec Transactions
123
Acquisition of premises and equipment
(208,044 )
(103,789 )
(72,781 )
Proceeds from insurance claims
Proceeds from sale of:
Premises and equipment and other productive assets
Foreclosed assets
Net cash (used in) provided by investing activities
(2,613,407 )
(10,518,650 )
Cash flows from financing activities:
Net increase (decrease) in:
Deposits
(5,770,261 )
Assets sold under agreements to repurchase
(57,225 )
(29,700 )
Other short-term borrowings
(365,000 )
Payments of notes payable
(343,261 )
(103,147 )
(237,713 )
Principal payments of finance leases
(5,360 )
(3,346 )
(2,852 )
Proceeds from issuance of notes payable
Proceeds from issuance of common stock
Dividends paid
(159,860 )
(161,516 )
(141,466 )
Net payments for repurchase of common stock
(461 )
(631,893 )
(350,535 )
Payments related to tax withholding for share-based compensation
(4,089 )
(5,771 )
(5,115 )
Net cash provided by (used in) financing activities
(6,323,091 )
Net (decrease) increase in cash and due from banks, and restricted cash
(48,584 )
(62,582 )
Cash and due from banks, and restricted cash at beginning of period
Cash and due from banks, and restricted cash at end of period
$
$
$
The accompanying notes are an integral part of these consolidated financial statements.
124
Notes to Consolidated Financial Statements
Note 1 -
Nature of Operations and Basis of Presentation
125
Note 2 -
Summary of Significant Accounting Policies
126
Note 3 -
New Accounting Pronouncements
137
Note 4 -
Business Combinations
143
Note 5 -
Restrictions on Cash and Due from Banks and Certain Securities
145
Note 6 -
Debt Securities Available-For-Sale
146
Note 7 -
Debt Securities Held-to-Maturity
149
Note 8 -
Loans
153
Note 9 -
Allowance for Credit Losses – Loans Held-In-Portfolio
163
Note 10 -
Mortgage Banking Activities
192
Note 11 -
Transfers of Financial Assets and Mortgage Servicing Assets
193
Note 12 -
Premises and Equipment
196
Note 13 -
Other Real Estate Owned
197
Note 14 -
Other Assets
198
Note 15 -
Goodwill and Other Intangible Assets
199
Note 16 -
Deposits
203
Note 17 -
Borrowings
204
Note 18 -
Trust Preferred Securities
207
Note 19 -
Other Liabilities
208
Note 20 -
Stockholders’ Equity
209
Note 21 -
Regulatory Capital Requirements
211
Note 22 -
Other Comprehensive Income (Loss)
214
Note 23 -
Guarantees
216
Note 24 -
Commitments and Contingencies
218
Note 25-
Non-consolidated Variable Interest Entities
223
Note 26 -
Derivative Instruments and Hedging Activities
225
Note 27 -
Related Party Transactions
228
Note 28 -
Fair Value Measurement
231
Note 29 -
Fair Value of Financial Instruments
239
Note 30 -
Employee Benefits
Note 31 -
Net Income per Common Share
250
Note 32 -
Revenue from Contracts with Customers
251
Note 33 -
Leases
253
Note 34 -
Stock-Based Compensation
255
Note 35 -
Income Taxes
258
Note 36 -
Supplemental Disclosure on the Consolidated Statements of Cash Flows
262
Note 37 -
Segment Reporting
263
Note 38 -
Popular, Inc. (Holding company only) Financial Information
266
125
Note 1 – Nature of Operations and basis of Presentation
Nature of Operations
Popular, Inc. (the “Corporation” or “Popular”) is a diversified, publicly-owned financial holding company subject to the supervision
and regulation of the Board of Governors of the Federal Reserve System. The Corporation has operations in Puerto Rico, the
mainland United States (“U.S.”) and the U.S. and British Virgin Islands. In Puerto Rico, the Corporation provides retail, mortgage,
and commercial banking services, through its principal banking subsidiary, Banco Popular de Puerto Rico (“BPPR”), as well as
investment banking, broker-dealer, auto and equipment leasing and financing, and insurance services through specialized
subsidiaries. In the mainland U.S., the Corporation provides retail, mortgage and commercial banking services through its New
York-chartered banking subsidiary, Popular Bank (“PB” or “Popular U.S.”), which has branches located in New York, New Jersey
and Florida, investment and insurance services and equipment leasing and financing services through specialized subsidiaries.
Basis of Presentation
Leveraging the completion of the Evertec Transactions, as defined in Note 4 to the Consolidated Financial Statements, the
Corporation embarked on a broad-based multi-year, technological and business process transformation during the second half of
2022. The needs and expectations of our clients, as well as the competitive landscape, have evolved, requiring us to make
important investments in our technological infrastructure and adopt more agile practices. Our technology and business
transformation will be a significant priority for the Corporation over the next three years and beyond.
As part of this transformation, we aim to expand our digital capabilities, modernize our technology platform, and implement agile and
efficient business processes across the entire Corporation. To facilitate the transparency of the progress with the transformation
initiative and to better portray the level of technology related expenses categorized by the nature of the expense, effective in the
fourth quarter of 2022, the Corporation has separated technology, professional fees and transactional and items processing related
expenses as standalone expense categories in the accompanying Consolidated statement of operations. There were no changes to
the total operating expenses presented. Prior periods amount in the financial statements and related disclosures have been
reclassified to conform to the current presentation.
The following table provides the detail of the reclassifications for the year.
Year ended December 31,
2021
Financial statement line item
As reported
Adjustments
Adjusted
Equipment expenses
$
$
(59,178 )
$
Professional fees
(284,144 )
Technology and software expenses
Processing and transactional services
Communications
(11,205 )
Other operating expenses
(44,819 )
Net effect on operating expenses
$
$
$
126
Note 2 – Summary of significant accounting policies
The accounting and financial reporting policies of Popular, Inc. and its subsidiaries (the “Corporation”) conform with accounting
principles generally accepted in the United States of America and with prevailing practices within the financial services industry.
The following is a description of the most significant of these policies:
Principles of consolidation
The consolidated financial statements include the accounts of Popular, Inc. and its subsidiaries. Intercompany accounts and
transactions have been eliminated in consolidation. In accordance with the consolidation guidance for variable interest entities, the
Corporation would also consolidate any variable interest entities (“VIEs”) for which it has a controlling financial interest; and
therefore, it is the primary beneficiary. Assets held in a fiduciary capacity are not assets of the Corporation and, accordingly, are not
included in the Consolidated Statements of Financial Condition.
Unconsolidated investments, in which there is at least 20% ownership and / or the Corporation exercises significant influence, are
generally accounted for by the equity method with earnings recorded in other operating income. Limited partnerships are also
accounted for by the equity method unless the investor’s interest is so “minor” that the limited partner may have virtually no influence
over partnership operating and financial policies. These investments are included in other assets and the Corporation’s
proportionate share of income or loss is included in other operating income.
Statutory business trusts that are wholly-owned by the Corporation and are issuers of trust preferred securities are not consolidated
in the Corporation’s Consolidated Financial Statements.
Business combinations
Business combinations are accounted for under the acquisition method. Under this method, assets acquired, liabilities assumed and
any noncontrolling interest in the acquiree at the acquisition date are measured at their fair values as of the acquisition date. The
acquisition date is the date the acquirer obtains control. Transaction costs are expensed as incurred. Contingent consideration
classified as an asset or a liability is remeasured to fair value at each reporting date until the contingency is resolved. The changes
in fair value of the contingent consideration are recognized in earnings unless the arrangement is a hedging instrument for which
changes are initially recognized in other comprehensive income (loss). Refer to Note 4 for information of business combinations
completed by the Corporation for the years presented.
Use of estimates in the preparation of financial statements
The preparation of financial statements in conformity with accounting principles generally accepted in the United States of America
requires management to make estimates and assumptions that affect the reported amounts of assets and liabilities and contingent
assets and liabilities at the date of the financial statements, and the reported amounts of revenues and expenses during the
reporting period. Actual results could differ from those estimates.
Fair value measurements
The Corporation determines the fair values of its financial instruments based on the fair value framework established in the guidance
for Fair Value Measurements in Accounting Standards Codification (“ASC”) Subtopic 820-10, which requires an entity to maximize
the use of observable inputs and minimize the use of unobservable inputs when measuring fair value. Fair value is defined as the
exchange price that would be received for an asset or paid to transfer a liability (an exit price) in the principal or most advantageous
market for the asset or liability in an orderly transaction between market participants on the measurement date. The standard
describes three levels of inputs that may be used to measure fair value which are (1) quoted market prices for identical assets or
liabilities in active markets, (2) observable market-based inputs or unobservable inputs that are corroborated by market data, and (3)
unobservable inputs that are not corroborated by market data. The fair value hierarchy ranks the quality and reliability of the
information used to determine fair values.
The guidance in ASC Subtopic 820-10 also addresses measuring fair value in situations where markets are inactive and
transactions are not orderly. Transactions or quoted prices for assets and liabilities may not be determinative of fair value when
transactions are not orderly, and thus, may require adjustments to estimate fair value. Price quotes based on transactions that are
not orderly should be given little, if any, weight in measuring fair value. Price quotes based on transactions that are orderly shall be
considered in determining fair value, and the weight given is based on facts and circumstances. If sufficient information is not
available to determine if price quotes are based on orderly transactions, less weight should be given to the price quote relative to
other transactions that are known to be orderly.
127
Investment securities
Investment securities are classified in four categories and accounted for as follows:
●
maturity and reported at amortized cost. An ACL is established for the expected credit losses over the remaining term of
debt securities held-to-maturity. The Corporation has established a methodology to estimate credit losses which considers
qualitative factors, including internal credit ratings and the underlying source of repayment in determining the amount of
expected credit losses. Debt securities held-to-maturity are written-off through the ACL when a portion or the entire
amount is deemed uncollectible, based on the information considered to develop expected credit losses through the life of
the asset. The ACL is estimated by leveraging the expected loss framework for mortgages in the case of securities
collateralized by 2
nd
factors are stressed, as a qualitative adjustment, to reflect current conditions that are not necessarily captured within the
historical loss experience. The modeling framework includes a 2-year reasonable and supportable period gradually
reverting, over a 3-years horizon, to historical information at the model input level. The Corporation’s portfolio of held-to-
maturity securities includes U.S. Treasury notes and obligations from the U.S. Government. These securities have an
explicit or implicit guarantee from the U.S. government, are highly rated by major rating agencies, and have a long history
of no credit losses. Accordingly, the Corporation applies a zero-credit loss assumption and no ACL for these securities
has been established. The Corporation may not sell or transfer held-to-maturity securities without calling into question its
intent to hold other debt securities to maturity, unless a nonrecurring or unusual event that could not have been
reasonably anticipated has occurred.
●
included in non-interest income.
●
amortized cost which are not related to estimated credit losses are recorded through other comprehensive income or loss,
net of taxes. If the Corporation intends to sell or believes it is more likely than not that it will be required to sell the debt
security, it is written down to fair value through earnings. Credit losses relating to available-for-sale debt securities are
recorded through an ACL, which are limited to the difference between the amortized cost and the fair value of the asset.
The ACL is established for the expected credit losses over the remaining term of debt security. The Corporation’s portfolio
of available-for-sale securities is comprised mainly of U.S. Treasury notes and obligations from the U.S. Government.
These securities have an explicit or implicit guarantee from the U.S. government, are highly rated by major rating
agencies, and have a long history of no credit losses. Accordingly, the Corporation applies a zero-credit loss assumption
and no ACL for these securities has been established. The Corporation monitors its securities portfolio composition and
credit performance on a quarterly basis to determine if any allowance is considered necessary. Debt securities available-
for-sale are written-off when a portion or the entire amount is deemed uncollectible, based on the information considered
to develop expected credit losses through the life of the asset. The specific identification method is used to determine
realized gains and losses on debt securities available-for-sale, which are included in net (loss) gain on sale of debt
securities in the Consolidated Statements of Operations.
●
available fair values are measured at cost, less any impairment, plus or minus changes resulting from observable price
changes in orderly transactions for the identical or a similar investment of the same issuer. Stock that is owned by the
Corporation to comply with regulatory requirements, such as Federal Reserve Bank and Federal Home Loan Bank
(“FHLB”) stock, is included in this category, and their realizable value equals their cost. Unrealized and realized gains and
losses and any impairment on equity securities are included in net gain (loss), including impairment on equity securities in
the Consolidated Statements of Operations. Dividend income from investments in equity securities is included in interest
income.
The amortization of premiums is deducted and the accretion of discounts is added to net interest income based on the interest
method over the outstanding period of the related securities. Purchases and sales of securities are recognized on a trade date
basis.
Derivative financial instruments
All derivatives are recognized on the Statements of Financial Condition at fair value. The Corporation’s policy is not to offset the fair
value amounts recognized for multiple derivative instruments executed with the same counterparty under a master netting
128
arrangement nor to offset the fair value amounts recognized for the right to reclaim cash collateral (a receivable) or the obligation to
return cash collateral (a payable) arising from the same master netting arrangement as the derivative instruments.
For a cash flow hedge, changes in the fair value of the derivative instrument are recorded net of taxes in accumulated other
comprehensive income (loss) and subsequently reclassified to net income in the same period(s) that the hedged transaction impacts
earnings. For free-standing derivative instruments, changes in fair values are reported in current period earnings.
Prior to entering a hedge transaction, the Corporation formally documents the relationship between hedging instruments and
hedged items, as well as the risk management objective and strategy for undertaking various hedge transactions. This process
includes linking all derivative instruments to specific assets and liabilities on the Statements of Financial Condition or to specific
forecasted transactions or firm commitments along with a formal assessment, at both inception of the hedge and on an ongoing
basis, as to the effectiveness of the derivative instrument in offsetting changes in fair values or cash flows of the hedged item.
Hedge accounting is discontinued when the derivative instrument is not highly effective as a hedge, a derivative expires, is sold,
terminated, when it is unlikely that a forecasted transaction will occur or when it is determined that it is no longer appropriate. When
hedge accounting is discontinued the derivative continues to be carried at fair value with changes in fair value included in earnings.
Effective on January 1, 2023, the Corporation discontinued the hedge accounting treatment of certain forward contracts for which
the changes in fair value were recorded, net of taxes, in accumulated other comprehensive income (loss) and subsequently
reclassified to net income in the same period that the hedged transaction impacted earnings. As a result of this change, the changes
in the fair value of these forward contracts are being recorded through net income. The Corporation utilizes forward contracts to
hedge the sale of mortgage-backed securities with duration terms over one month. Interest rate forwards are contracts for the
delayed delivery of securities, which the seller agrees to deliver on a specified future date at a specified price or yield. These
forward contracts are hedging a forecasted transaction and thus qualify for cash flow hedge accounting.
Based on the election to apply fair value accounting for its mortgage loans held for sale, effective on January 1, 2023, the
Corporation discontinued the hedge accounting since the changes in the fair value of the loans are expected to be offset by the
changes in the fair value of the forward contract, both of which are now recorded through net income.
For non-exchange traded contracts, fair value is based on dealer quotes, pricing models, discounted cash flow methodologies or
similar techniques for which the determination of fair value may require significant management judgment or estimation.
The fair value of derivative instruments considers the risk of non-performance by the counterparty or the Corporation, as applicable.
The Corporation obtains or pledges collateral in connection with its derivative activities when applicable under the agreement
.
Loans
Loans are classified as loans held-in-portfolio when management has the intent and ability to hold the loan for the foreseeable
future, or until maturity or payoff. The foreseeable future is a management judgment which is determined based upon the type of
loan, business strategies, current market conditions, balance sheet management and liquidity needs. Management’s view of the
foreseeable future may change based on changes in these conditions. When a decision is made to sell or securitize a loan that was
not originated or initially acquired with the intent to sell or securitize, the loan is reclassified from held-in-portfolio into held-for-sale.
Due to changing market conditions or other strategic initiatives, management’s intent with respect to the disposition of the loan may
change, and accordingly, loans previously classified as held-for-sale may be reclassified into held-in-portfolio. Loans transferred
between loans held-for-sale and held-in-portfolio classifications are recorded at the lower of cost or fair value at the date of transfer.
Purchased loans with no evidence of credit deterioration since origination are recorded at fair value upon acquisition. Credit
discounts are included in the determination of fair value.
Loans held-in-portfolio are reported at their outstanding principal balances net of any unearned income, charge-offs, unamortized
deferred fees and costs on originated loans, and premiums or discounts on purchased loans. Fees collected and costs incurred in
the origination of new loans are deferred and amortized using the interest method or a method which approximates the interest
method over the term of the loan as an adjustment to interest yield.
Loans held-for-sale, except for mortgage loans originated as held-for-sale, are stated at the lower of cost or fair value, cost being
determined based on the outstanding loan balance less unearned income, and fair value determined, generally in the aggregate.
Fair value is measured based on current market prices for similar loans, outstanding investor commitments, prices of recent sales or
discounted cash flow analyses which utilize inputs and assumptions which are believed to be consistent with market participants’
views. The cost basis also includes consideration of deferred origination fees and costs, which are recognized in earnings at the
time of sale. Upon reclassification to held-for-sale, credit related fair value adjustments are recorded as a reduction in the ACL. To
129
the extent that the loan's reduction in value has not already been provided for in the ACL, an additional provision for credit losses is
recorded. Subsequent to reclassification to held-for-sale, the amount, by which cost exceeds fair value, if any, is accounted for as a
valuation allowance with changes therein included in the determination of net income for the period in which the change occurs.
Effective on January 1, 2023, newly originated mortgage loans held-for-sale are reported at fair value, with changes recorded
through earnings.
The past due status of a loan is determined in accordance with its contractual repayment terms. Furthermore, loans are reported as
past due when either interest or principal remains unpaid for 30 days or more in accordance with its contractual repayment terms.
Non-accrual loans are those loans on which the accrual of interest is discontinued. When a loan is placed on non-accrual status, all
previously accrued and unpaid interest is charged against interest income and the loan is accounted for either on a cash-basis
method or on the cost-recovery method. Loans designated as non-accruing are returned to accrual status when the Corporation
expects repayment of the remaining contractual principal and interest.
Recognition of interest income on commercial and construction loans is discontinued when the loans are 90 days or more in arrears
on payments of principal or interest or when other factors indicate that the collection of principal and interest is doubtful. The portion
of a secured loan deemed uncollectible is charged-off no later than 365 days past due. However, in the case of a collateral
dependent loan, the excess of the recorded investment over the fair value of the collateral (portion deemed uncollectible) is
generally promptly charged-off, but in any event, not later than the quarter following the quarter in which such excess was first
recognized. Commercial unsecured loans are charged-off no later than 180 days past due. Recognition of interest income on
mortgage loans is generally discontinued when loans are 90 days or more in arrears on payments of principal or interest. The
portion of a mortgage loan deemed uncollectible is charged-off when the loan is 180 days past due. The Corporation discontinues
the recognition of interest on residential mortgage loans insured by the Federal Housing Administration (“FHA”) or guaranteed by
the U.S. Department of Veterans Affairs (“VA”) when 15-months delinquent as to principal or interest. The principal repayment on
these loans is insured. Recognition of interest income on closed-end consumer loans and home equity lines of credit is discontinued
when the loans are 90 days or more in arrears on payments of principal or interest. Income is generally recognized on open-end
consumer loans, except for home equity lines of credit, until the loans are charged-off. Recognition of interest income for lease
financing is ceased when loans are 90 days or more in arrears. Closed-end consumer loans and leases are charged-off when they
are 120 days in arrears. Open-end (revolving credit) consumer loans are charged-off when 180 days in arrears. Commercial and
consumer overdrafts are generally charged-off no later than 60 days past their due date.
A loan modified with financial difficulties is typically in non-accrual status at the time of the modification. These loans continue in
non-accrual status until the borrower has demonstrated a willingness and ability to make the restructured loan payments (at least six
months of sustained performance after the modification (or one year for loans providing for quarterly or semi-annual payments)) and
management has concluded that it is probable that the borrower would not be in payment default in the foreseeable future.
Loan modifications
In connection with the implementation of the Accounting Standards Update (“ASU”) 2022-02, the Corporation modified its policy
related to loan modifications. As discussed in Note 3, the new accounting guidance eliminates the recognition and measurement
principle of troubled debt restructurings (TDRs).
A modification is subject to disclosure under the new ASU when the Corporation separately concludes that both of the following
conditions exist: 1) the debtor is experiencing financial difficulties and 2) the modification constitutes a reduction in the interest rate
on the loan, a payment extension, a forgiveness of principal, or a more-than-insignificant payment delay. Determination that a
borrower is experiencing financial difficulties involves a degree of judgment.
The identification of loan modifications to debtors with financial difficulties is critical in the determination of the adequacy of the ACL.
The ASU 2022-02 eliminates the requirement to use a discounted cash flow (“DCF”) approach to estimated credit losses for
modified loans with borrowers experiencing financial difficulties. The entity can apply a methodology similar to the one used for
loans that were not modified. The Corporation applied a modified retrospective transition method for the implementation of ASU
2022-02 which resulted in a reduction of approximately $
adjustment to the beginning balance of retained earnings.
Refer to Note 9 to the Consolidated Financial Statements for additional qualitative information on loan modifications and the
Corporation’s determination of the ACL.
Lease financing
130
The Corporation leases passenger and commercial vehicles and equipment to individual and corporate customers. The finance
method of accounting is used to recognize revenue on lease contracts that meet the criteria specified in the guidance for leases in
ASC Topic 842. Aggregate rentals due over the term of the leases less unearned income are included in finance lease contracts
receivable. Unearned income is amortized using a method which results in approximate level rates of return on the principal
amounts outstanding. Finance lease origination fees and costs are deferred and amortized over the average life of the lease as an
adjustment to the interest yield.
Revenue for other leases is recognized as it becomes due under the terms of the agreement.
Loans acquired with deteriorated credit quality
Purchased credit deteriorated (“PCD”) loans are defined as those with evidence of a more-than-insignificant deterioration in credit
quality since origination. PCD loans are initially recorded at its purchase price plus an estimated allowance for credit losses (“ACL”).
Upon the acquisition of a PCD loan, the Corporation makes an estimate of the expected credit losses over the remaining contractual
term of each individual loan. The estimated credit losses over the life of the loan are recorded as an ACL with a corresponding
addition to the loan purchase price. The amount of the purchased premium or discount which is not related to credit risk is amortized
over the life of the loan through net interest income using the effective interest method or a method that approximates the effective
interest method. Changes in expected credit losses are recorded as an increase or decrease to the ACL with a corresponding
charge (reverse) to the provision for credit losses in the Consolidated Statement of Operations. These loans follow the same
nonaccrual policies as non-PCD loans.
Refer to Note 8
to the Consolidated Financial Statements for additional information with respect to loans acquired with deteriorated
credit quality.
Accrued interest receivable
The amortized basis for loans and investments in debt securities is presented exclusive of accrued interest receivable. The
Corporation has elected not to establish an ACL for accrued interest receivable for loans and investments in debt securities, given
the Corporation’s non-accrual policies, in which accrual of interest is discontinued and reversed based on the asset’s delinquency
status.
Allowance for credit losses – loans portfolio
The Corporation establishes an ACL for its loan portfolio based on its estimate of credit losses over the remaining contractual term
of the loans, adjusted for expected prepayments. An ACL is recognized for all loans including originated and purchased loans, since
inception, with a corresponding charge to the provision for credit losses, except for PCD loans for which the ACL at acquisition is
recorded as an addition to the purchase price with subsequent changes recorded in earnings. Loan losses are charged and
recoveries are credited to the ACL.
The Corporation follows a methodology to estimate the ACL which includes a reasonable and supportable forecast period for
estimating credit losses, considering quantitative and qualitative factors as well as the economic outlook. As part of this
methodology, management evaluates various macroeconomic scenarios provided by third parties. At December 31, 2023,
management applied probability weights to the outcome of the selected scenarios. This evaluation includes benchmarking
procedures as well as careful analysis of the underlying assumptions used to build the scenarios. The application of probability
weights include baseline, optimistic and pessimistic scenarios. The weights applied are subject to evaluation on a quarterly basis as
part of the ACL’s governance process. The Corporation considers additional macroeconomic scenarios as part of its qualitative
adjustment framework.
The macroeconomic variables chosen to estimate credit losses were selected by combining quantitative procedures with expert
judgment. These variables were determined to be the best predictors of expected credit losses within the Corporation’s loan
portfolios and include drivers such as unemployment rate, different measures of employment levels, house prices, gross domestic
product and measures of disposable income, amongst others. The loss estimation framework includes a reasonable and
supportable period of 2 years for PR portfolios, gradually reverting, over a 3-years horizon, to historical macroeconomic variables at
the model input level. For the US portfolio the reasonable and supportable period considers the contractual life of the asset,
impacted by prepayments, except for the US CRE portfolio. The US CRE portfolio utilizes a 2-year reasonable and supportable
period gradually reverting, over a 3-years horizon, to historical information at the output level.
The Corporation developed loan level quantitative models distributed by geography and loan type. This segmentation was
determined by evaluating their risk characteristics, which include default patterns, source of repayment, type of collateral, and
131
lending channels, amongst others. The modeling framework includes competing risk models to generate lifetime defaults and
prepayments, and other loan level modeling techniques to estimate loss severity. Recoveries on future losses are contemplated as
part of the loss severity modeling. These parameters are estimated by combining internal risk factors with macroeconomic
expectations. In order to generate the expected credit losses, the output of these models is combined with loan level repayment
information. The internal risk factors contemplated within the models may include borrowers’ credit scores, loan-to-value,
delinquency status, risk ratings, interest rate, loan term, loan age and type of collateral, amongst others.
The ACL also includes a qualitative framework that addresses two main components: losses that are expected but not captured
within the quantitative modeling framework, and model imprecision. In order to identify potential losses that are not captured through
the models, management evaluates model limitations as well as the different risks covered by the variables used in each
quantitative model. The Corporation considers additional macroeconomic scenarios to address these risks. This assessment takes
into consideration factors listed as part of ASC 326-20-55-4. To complement the analysis, management also evaluates whether
there are sectors that have low levels of historical defaults, but current conditions show the potential for future losses. This type of
qualitative adjustment is more prevalent in the commercial portfolios. The model imprecision component of the qualitative
adjustments is determined after evaluating model performance for these portfolios through different time periods. This type of
qualitative adjustment mainly impacts consumer portfolios.
The Corporation has designated as collateral dependent loans secured by collateral when foreclosure is probable or when
foreclosure is not probable but the practical expedient is used. The practical expedient is used when repayment is expected to be
provided substantially by the sale or operation of the collateral and the borrower is experiencing financial difficulty. The ACL of
collateral dependent loans is measured based on the fair value of the collateral less costs to sell. The fair value of the collateral is
based on appraisals, which may be adjusted due to their age, and the type, location, and condition of the property or area or general
market conditions to reflect the expected change in value between the effective date of the appraisal and the measurement date.
The Credit Cards portfolio, due to its revolving nature, does not have a specified maturity date. To estimate the average remaining
term of this segment, management evaluated the portfolios payment behavior based on internal historical data. These payment
behaviors were further classified into sub-categories that accounted for delinquency history and differences between transactors,
revolvers and customers that have exhibited mixed transactor/revolver behavior. Transactors are defined as active accounts without
any finance charge in the last 6 months. The paydown curves generated for each sub-category are applied to the outstanding
exposure at the measurement date using the first-in first-out (FIFO) methodology. These amortization patterns are combined with
loan level default and loss severity modeling to arrive at the ACL.
Reserve for unfunded commitments
The Corporation establishes a reserve for unfunded commitments, based on the estimated losses over the remaining term of the
facility. An allowance is not established for commitments that are unconditionally cancellable by the Corporation. Accordingly, no
reserve is established for unfunded commitments related to its credit cards portfolio. Reserve for the unfunded portion of credit
commitments is presented within other liabilities in the Consolidated Statements of Financial Condition. Net adjustments to the
reserve for unfunded commitments are reflected in the Consolidated Statements of Operations as provision for credit losses for the
years ended December 31, 2023 and 2022.
Transfers and servicing of financial assets
The transfer of an entire financial asset, a group of entire financial assets, or a participating interest in an entire financial asset in
which the Corporation surrenders control over the assets is accounted for as a sale if all of the following conditions set forth in ASC
Topic 860 are met: (1) the assets must be isolated from creditors of the transferor, (2) the transferee must obtain the right (free of
conditions that constrain it from taking advantage of that right) to pledge or exchange the transferred assets, and (3) the transferor
cannot maintain effective control over the transferred assets through an agreement to repurchase them before their maturity. When
the Corporation transfers financial assets and the transfer fails any one of these criteria, the Corporation is prevented from
derecognizing the transferred financial assets and the transaction is accounted for as a secured borrowing. For federal and Puerto
Rico income tax purposes, the Corporation treats the transfers of loans which do not qualify as “true sales” under the applicable
accounting guidance, as sales, recognizing a deferred tax asset or liability on the transaction.
For transfers of financial assets that satisfy the conditions to be accounted for as sales, the Corporation derecognizes all assets
sold; recognizes all assets obtained and liabilities incurred in consideration as proceeds of the sale, including servicing assets and
servicing liabilities, if applicable; initially measures at fair value assets obtained and liabilities incurred in a sale; and recognizes in
earnings any gain or loss on the sale.
132
The guidance on transfer of financial assets requires a true sale analysis of the treatment of the transfer under state law as if the
Corporation was a debtor under the bankruptcy code. A true sale legal analysis includes several legally relevant factors, such as the
nature and level of recourse to the transferor, and the nature of retained interests in the loans sold. The analytical conclusion as to a
true sale is never absolute and unconditional, but contains qualifications based on the inherent equitable powers of a bankruptcy
court, as well as the unsettled state of the common law. Once the legal isolation test has been met, other factors concerning the
nature and extent of the transferor’s control over the transferred assets are taken into account in order to determine whether
derecognition of assets is warranted.
The Corporation sells mortgage loans to the Government National Mortgage Association (“GNMA”) in the normal course of business
and retains the servicing rights. The GNMA programs under which the loans are sold allow the Corporation to repurchase individual
delinquent loans that meet certain criteria. At the Corporation’s option, and without GNMA’s prior authorization, the Corporation may
repurchase the delinquent loan for an amount equal to 100% of the remaining principal balance of the loan. Once the Corporation
has the unconditional ability to repurchase the delinquent loan, the Corporation is deemed to have regained effective control over
the loan and recognizes the loan on its balance sheet as well as an offsetting liability, regardless of the Corporation’s intent to
repurchase the loan.
Servicing assets
The Corporation periodically sells or securitizes loans while retaining the obligation to perform the servicing of such loans. In
addition, the Corporation may purchase or assume the right to service loans originated by others. Whenever the Corporation
undertakes an obligation to service a loan, management assesses whether a servicing asset or liability should be recognized. A
servicing asset is recognized whenever the compensation for servicing is expected to more than adequately compensate the
servicer for performing the servicing. Likewise, a servicing liability would be recognized in the event that servicing fees to be
received are not expected to adequately compensate the Corporation for its expected cost. Mortgage servicing assets recorded at
fair value are separately presented on the Consolidated Statements of Financial Condition.
All separately recognized servicing assets are initially recognized at fair value. For subsequent measurement of servicing rights, the
Corporation has elected the fair value method for mortgage loans servicing rights (“MSRs”). Under the fair value measurement
method, MSRs are recorded at fair value each reporting period, and changes in fair value are reported in mortgage banking
activities in the Consolidated Statement of Operations. Contractual servicing fees including ancillary income and late fees, as well as
fair value adjustments, are reported in mortgage banking activities in the Consolidated Statement of Operations. Loan servicing
fees, which are based on a percentage of the principal balances of the loans serviced, are credited to income as loan payments are
collected.
The fair value of servicing rights is estimated by using a cash flow valuation model which calculates the present value of estimated
future net servicing cash flows, taking into consideration actual and expected loan prepayment rates, discount rates, servicing costs,
and other economic factors, which are determined based on current market conditions.
Premises and equipment
Premises and equipment are stated at cost less accumulated depreciation and amortization. Depreciation is computed on a straight-
line basis over the estimated useful life of each type of asset. Amortization of leasehold improvements is computed over the terms of
the respective leases or the estimated useful lives of the improvements, whichever is shorter. Costs of maintenance and repairs
which do not improve or extend the life of the respective assets are expensed as incurred. Costs of renewals and betterments are
capitalized. When assets are disposed of, their cost and related accumulated depreciation are removed from the accounts and any
gain or loss is reflected in earnings as realized or incurred, respectively.
The Corporation capitalizes interest cost incurred in the construction of significant real estate projects, which consist primarily of
facilities for its own use or intended for lease. The amount of interest cost capitalized is to be an allocation of the interest cost
incurred during the period required to substantially complete the asset. The interest rate for capitalization purposes is to be based
on a weighted average rate on the Corporation’s outstanding borrowings, unless there is a specific new borrowing associated with
the asset. Interest cost capitalized for the years ended December 31, 2023, 2022 and 2021 was not significant.
The Corporation recognizes right-of-use assets (“ROU assets”) and lease liabilities relating to operating and finance lease
arrangements in its Consolidated Statements of Financial Condition within other assets and other liabilities, respectively. For finance
leases, interest is recognized on the lease liability separately from the amortization of the ROU asset, whereas for operating leases
a single lease cost is recognized so that the cost of the lease is allocated over the lease term on a straight-line basis. Impairments
on ROU assets are evaluated under the guidance for impairment or disposal of long-lived assets. The Corporation recognizes gains
133
on sale and leaseback transactions in earnings when the transfer constitutes a sale, and the transaction was at fair value. Refer to
Note 33 to the Consolidated Financial Statements for additional information on operating and finance lease arrangements.
Impairment of long-lived assets
The Corporation evaluates for impairment its long-lived assets to be held and used, and long-lived assets to be disposed of,
whenever events or changes in circumstances indicate that the carrying amount of an asset may not be recoverable and records a
write down for the difference between the carrying amount and the fair value less costs to sell.
Other real estate
Other real estate, received in satisfaction of a loan, is recorded at fair value less estimated costs of disposal. The difference
between the carrying amount of the loan and the fair value less cost to sell is recorded as an adjustment to the ACL. Subsequent to
foreclosure, any losses in the carrying value arising from periodic re-evaluations of the properties, and any gains or losses on the
sale of these properties are credited or charged to expense in the period incurred and are included as OREO expenses. The cost of
maintaining and operating such properties is expensed as incurred.
Updated appraisals are obtained to adjust the value of the other real estate assets. The frequency depends on the loan type and
total credit exposure. The appraisal for a commercial or construction other real estate property with a book value equal to or greater
than $1 million is updated annually and if lower than $1 million it is updated every two years. For residential mortgage properties, the
Corporation requests appraisals annually.
Appraisals may be adjusted due to age, collateral inspections, property profiles, or general market conditions. The adjustments
applied are based upon internal information such as other appraisals for the type of properties and/or loss severity information that
can provide historical trends in the real estate market and may change from time to time based on market conditions.
Goodwill and other intangible assets
Goodwill is recognized when the purchase price is higher than the fair value of net assets acquired in business combinations under
the purchase method of accounting. Goodwill is not amortized but is tested for impairment at least annually or more frequently if
events or circumstances indicate possible impairment. If the carrying amount of any of the reporting units exceeds its fair value, the
Corporation would be required to record an impairment charge for the difference up to the amount of the goodwill. In determining the
fair value of each reporting unit, the Corporation generally uses a combination of methods, including market price multiples of
comparable companies and transactions, as well as discounted cash flow analysis. Goodwill impairment losses are recorded as part
of operating expenses in the Consolidated Statements of Operations.
Other intangible assets deemed to have an indefinite life are not amortized but are tested for impairment using a one-step process
which compares the fair value with the carrying amount of the asset. In determining that an intangible asset has an indefinite life, the
Corporation considers expected cash inflows and legal, regulatory, contractual, competitive, economic and other factors, which
could limit the intangible asset’s useful life.
Other identifiable intangible assets with a finite useful life, mainly core deposits, are amortized using various methods over the
periods benefited, which range from 5 to 10 years. These intangibles are evaluated periodically for impairment when events or
changes in circumstances indicate that the carrying amount may not be recoverable. Impairments on intangible assets with a finite
useful life are evaluated under the guidance for impairment or disposal of long-lived assets.
Assets sold / purchased under agreements to repurchase / resell
Repurchase and resell agreements are treated as collateralized financing transactions and are carried at the amounts at which the
assets will be subsequently reacquired or resold as specified in the respective agreements.
It is the Corporation’s policy to take possession of securities purchased under agreements to resell. However, the counterparties to
such agreements maintain effective control over such securities, and accordingly those securities are not reflected in the
Corporation’s Consolidated Statements of Financial Condition. The Corporation monitors the fair value of the underlying securities
as compared to the related receivable, including accrued interest.
It is the Corporation’s policy to maintain effective control over assets sold under agreements to repurchase; accordingly, such
securities continue to be carried on the Consolidated Statements of Financial Condition.
The Corporation may require counterparties to deposit additional collateral or return collateral pledged, when appropriate.
Software
134
Capitalized software is stated at cost, less accumulated amortization. Capitalized software includes purchased software and
capitalizable application development costs associated with internally-developed software. Amortization, computed on a straight-line
method, is charged to operations over the estimated useful life of the software. Capitalized software is included in “Other assets” in
the Consolidated Statement of Financial Condition.
Guarantees, including indirect guarantees of indebtedness to others
The estimated losses to be absorbed under the credit recourse arrangements are recorded as a liability when the loans are sold and
are updated by accruing or reversing expense (categorized in the line item “Adjustments (expense) to indemnity reserves on loans
sold” in the Consolidated Statements of Operations) throughout the life of the loan, as necessary, when additional relevant
information becomes available. The methodology used to estimate the recourse liability considers current conditions,
macroeconomic expectations through a 2-years reasonable and supportable period, gradually reverting to historical macroeconomic
variables at the model input level over a 3-years, portfolio composition by risk characteristics, amongst other factors. Statistical
methods are used to estimate the recourse liability. Expected loss rates are applied to different loan segmentations. The expected
loss, which represents the amount expected to be lost on a given loan, considers the probability of default and loss severity. The
reserve for the estimated losses under the credit recourse arrangements is presented separately within other liabilities in the
Consolidated Statements of Financial Condition. Refer to Note 23 to the Consolidated Financial Statements for further disclosures
on guarantees.
Treasury stock
Treasury stock is recorded at cost and is carried as a reduction of stockholders’ equity in the Consolidated Statements of Financial
Condition. At the date of retirement or subsequent reissue, the treasury stock account is reduced by the cost of such stock. At
retirement, the excess of the cost of the treasury stock over its par value is recorded entirely to surplus. At reissuance, the difference
between the consideration received upon issuance and the specific cost is charged or credited to surplus.
Revenues from contract with customers
Refer to Note 32 for a detailed description of the Corporation’s policies on the recognition and presentation of revenues from
contract with customers.
Foreign exchange
Assets and liabilities denominated in foreign currencies are translated to U.S. dollars using prevailing rates of exchange at the end
of the period. Revenues, expenses, gains and losses are translated using weighted average rates for the period. The resulting
foreign currency translation adjustment from operations for which the functional currency is other than the U.S. dollar is reported in
accumulated other comprehensive income (loss), except for highly inflationary environments in which the effects are included in
other operating expenses.
The Corporation holds interests in Centro Financiero BHD León, S.A. (“BHD León”) in the Dominican Republic. The business of
BHD León is mainly conducted in their country’s foreign currency. The resulting foreign currency translation adjustment from these
operations is reported in accumulated other comprehensive (loss) income (loss).
Refer to the disclosure of accumulated other comprehensive income (loss) included in Note 22.
Income taxes
The Corporation recognizes deferred tax assets and liabilities for the expected future tax consequences of events that have been
recognized in the Corporation’s financial statements or tax returns. Deferred income tax assets and liabilities are determined for
differences between financial statement and tax bases of assets and liabilities that will result in taxable or deductible amounts in the
future. The computation is based on enacted tax laws and rates applicable to periods in which the temporary differences are
expected to be recovered or settled.
The guidance for income taxes requires a reduction of the carrying amounts of deferred tax assets by a valuation allowance if,
based on the available evidence, it is more likely than not (defined as a likelihood of more than 50 percent) that such assets will not
be realized. Accordingly, the need to establish valuation allowances for deferred tax assets is assessed periodically by the
Corporation based on the more likely than not realization threshold criterion. In the assessment for a valuation allowance,
appropriate consideration is given to all positive and negative evidence related to the realization of the deferred tax assets. This
assessment considers, among others, all sources of taxable income available to realize the deferred tax asset, including the future
reversal of existing temporary differences, the future taxable income exclusive of reversing temporary differences and carryforwards,
135
taxable income in carryback years and tax-planning strategies. In making such assessments, significant weight is given to evidence
that can be objectively verified.
The valuation of deferred tax assets requires judgment in assessing the likely future tax consequences of events that have been
recognized in the Corporation’s financial statements or tax returns and future profitability. The Corporation’s accounting for deferred
tax consequences represents management’s best estimate of those future events.
Positions taken in the Corporation’s tax returns may be subject to challenge by the taxing authorities upon examination. Uncertain
tax positions are initially recognized in the financial statements when it is more likely than not (greater than 50%) that the position
will be sustained upon examination by the tax authorities, assuming full knowledge of the position and all relevant facts. The amount
of unrecognized tax benefit may increase or decrease in the future for various reasons including adding amounts for current tax year
positions,
expiration of open income tax returns due to the statute of limitations, changes in management’s judgment about the level
of uncertainty, including addition or elimination of uncertain tax positions, status of examinations, litigation, settlements with tax
authorities and legislative activity.
The Corporation accounts for the taxes collected from customers and remitted to governmental authorities on a net basis (excluded
from revenues).
Income tax expense or benefit for the year is allocated among continuing operations, discontinued operations, and other
comprehensive income (loss), as applicable. The amount allocated to continuing operations is the tax effect of the pre-tax income or
loss from continuing operations that occurred during the year, plus or minus income tax effects of (a) changes in circumstances that
cause a change in judgment about the realization of deferred tax assets in future years, (b) changes in tax laws or rates, (c)
changes in tax status, and (d) tax-deductible dividends paid to stockholders, subject to certain exceptions.
Employees’ retirement and other postretirement benefit plans
Pension costs are computed on the basis of accepted actuarial methods and are charged to current operations. Net pension costs
are based on various actuarial assumptions regarding future experience under the plan, which include costs for services rendered
during the period, interest costs and return on plan assets, as well as deferral and amortization of certain items such as actuarial
gains or losses.
The funding policy is to contribute to the plan, as necessary, to provide for services to date and for those expected to be earned in
the future. To the extent that these requirements are fully covered by assets in the plan, a contribution may not be made in a
particular year.
The cost of postretirement benefits, which is determined based on actuarial assumptions and estimates of the costs of providing
these benefits in the future, is accrued during the years that the employee renders the required service.
The guidance for compensation retirement benefits of ASC Topic 715 requires the recognition of the funded status of each defined
pension benefit plan, retiree health care and other postretirement benefit plans on the Consolidated Statements of Financial
Condition.
Stock-based compensation
The Corporation opted to use the fair value method of recording stock-based compensation as described in the guidance for
employee share plans in ASC Subtopic 718-50.
Comprehensive income
Comprehensive income (loss) is defined as the change in equity of a business enterprise during a period from transactions and
other events and circumstances, except those resulting from investments by owners and distributions to owners. Comprehensive
income (loss) is separately presented in the Consolidated Statements of Comprehensive Income.
Net income per common share
Basic income per common share is computed by dividing net income adjusted for preferred stock dividends, including undeclared or
unpaid dividends if cumulative, and charges or credits related to the extinguishment of preferred stock or induced conversions of
preferred stock, by the weighted average number of common shares outstanding during the year. Diluted income per common share
takes into consideration the weighted average common shares adjusted for the effect of stock options, restricted stock, performance
shares and warrants, if any, using the treasury stock method.
Statement of cash flows
136
For purposes of reporting cash flows, cash includes cash on hand and amounts due from banks, including restricted cash.
137
Note 3 - New accounting pronouncements
Recently Adopted Accounting Standards Updates
Standard
Description
Date of adoption
Effect on the financial statements
FASB ASU 2023-04,
Liabilities (Topic 405) -
Amendments to SEC
Paragraphs Pursuant to
SEC Staff Accounting
Bulletin No. 121
The Financial Accounting Standards Board
("FASB") issued Accounting Standards
Update (“ASU”) 2023-04 in August 2023
which amends paragraphs within ASC
Topic 405 to clarify the accounting and
disclosure for obligations to safeguard
Crypto-Assets held by an entity for its
platform users.
August 2023
The Corporation was not impacted by
the adoption of this ASU since it does
not hold crypto-assets for its platform
users.
FASB ASU 2023-03,
Presentation of Financial
Statements (Topic 205),
Income Statement—
Reporting Comprehensive
Income (Topic 220),
Distinguishing Liabilities
from Equity (Topic 480),
Equity (Topic 505), and
Compensation—Stock
Compensation (Topic 718)
- Amendments to SEC
Paragraphs Pursuant to
SEC Staff Accounting
Bulletin No. 120, SEC
Staff Announcement at the
March 24, 2022 EITF
Meeting, and Staff
Accounting Bulletin Topic
6.B, Accounting Series
Release 280—General
Revision of Regulation S-
X: Income or Loss
Applicable to Common
Stock
The FASB issued ASU 2023-03 in July
2023 which amends or supersedes various
SEC paragraphs within the Codification to
conform to past SEC announcements and
guidance which updated SAB Topics 5.T,
14, and 6. B.
July 1, 2023
The Corporation was not impacted by
the adoption of this ASU since it
codifies previous guidance.
FASB ASU 2022-05,
Financial Services -
Insurance (Topic 944) -
Transition for Sold
Contracts
The FASB issued ASU 2022-05 in
December 2022, which allows an insurance
entity to make an accounting policy election
of applying the Long-Duration Contracts
(LDTI) transition guidance on a transaction-
by-transaction basis if the contracts have
been derecognized because of a sale or
disposal and the insurance entity has no
significant continuing involvement with the
derecognized contract.
January 1, 2023
The Corporation was not impacted by
the adoption of ASU 2022-05 during
the first quarter of 2023 since it does
not hold Long-Duration Contracts
(LDTI).
138
FASB ASU 2022-04,
Liabilities—Supplier
Finance Programs
(Subtopic 405-50) -
Disclosure of Supplier
Finance Program
Obligations
The FASB issued ASU 2022-04 in
September 2022, which requires to disclose
information about the use of supplier
finance programs in connection with the
purchase of goods and services.
January 1, 2023
The Corporation was not impacted by
the adoption of ASU 2022-04 since it
does not use supplier finance
programs.
139
Recently Adopted Accounting Standards Updates
Standard
Description
Date of adoption
Effect on the financial statements
FASB ASU 2022-02,
Financial Instruments—
Credit Losses (Topic 326)
- Troubled Debt
Restructurings and
Vintage Disclosures
The FASB issued ASU 2022-02 in March
2022, which eliminates the accounting
guidance for troubled debt restructurings
(“TDRs”) in ASC Subtopic 310-40
Receivables—Troubled Debt Restructurings
by Creditors and requires creditors to apply
the loan refinancing and restructuring
guidance to determine whether a
modification results in a new loan or a
continuation of an existing loan. In addition,
the ASU enhances the disclosure
requirements for certain loan refinancing
and restructurings by creditors when a
borrower is experiencing financial difficulty
and enhances the vintage disclosure by
requiring the disclosure of current-period
gross write-offs by year of origination for
financing receivables and net investments
in leases.
January 1, 2023
The Corporation adopted ASU 2022-02
during the first quarter of 2023. The
adoption of this standard resulted in
enhanced disclosure for loans modified
to borrowers with financial difficulties
and the disclosure of period gross
charge offs by vintage year. The
Corporation anticipates that there will
be loans subject to disclosure under the
new standard that did not qualify under
the prior guidance given the removal of
the concession requirement for such
disclosures. The amended guidance
eliminated the requirement to measure
the effect of the concession from a loan
modification, for which the Corporation
used a discounted cash flow (“DCF”)
model. The impact of discontinuing the
use of the DCF model to measure the
concession resulted in a release of the
allowance for credit losses ("ACL") of
$
loans for which modifications mostly
included a reduction in contractual
interest rates and given the extended
maturity term of these loans, this
resulted in an increase in the ACL in
the period of modification. For the
transition method related to the
recognition and measurement of TDRs,
the Corporation has elected to apply
the modified retrospective approach for
the adoption of this standard.
Accordingly, this presented an
adjustment increase of $
of tax effect, to the beginning balance
of retained earnings on January 1,
2023.
FASB ASU 2022-01,
Derivatives and Hedging
(Topic 815) – Fair Value
Hedging—Portfolio Layer
Method
The FASB issued ASU 2022-01 in March
2022, which amends ASC Topic 815 by
allowing non prepayable financial assets
also to be included in a closed portfolio
hedged using the portfolio layer method.
This amendment permits an entity to apply
fair value hedging to a stated amount of a
closed portfolio of prepayable and non-
prepayable financial assets without
considering prepayment risk or credit risk
when measuring those assets.
January 1, 2023
The Corporation was not impacted by
the adoption of ASU 2022-01 since it
does not hold derivatives designated as
fair value hedges.
FASB ASU 2021-08,
Business Combinations
(Topic 805) – Accounting
for Contract Assets and
Contract Liabilities from
Contracts with Customers
The FASB issued ASU 2021-08 in October
2021, which amends ASC Topic 805 by
requiring contract assets and contract
liabilities arising from revenue contract with
customers to be recognized in accordance
with ASC Topic 606 on the acquisition date
instead of fair value.
January 1, 2023
The Corporation was not impacted by
the adoption of ASU 2021-08, however,
it will consider this guidance for
revenue contracts with customers
recognized as part of business
combinations entered into on or after
the effective date.
140
Accounting Standards Updates Not Yet Adopted
Standard
Description
Date of adoption
Effect on the financial statements
FASB ASU 2023-09,
Income Tax ( Topic 740) -
Improvements to Income
Tax Disclosures
The FASB issued ASU 2023-09 in
December 2023, which amends ASC topic
740 by enhancing disclosures regarding
rate reconciliation and requiring the
disclosure of income taxes paid, income (or
loss) from continuing operations before
income tax expense and income tax
expense disaggregated by national, state
and foreign level. Disclosures that no longer
were considered cost beneficial or relevant
were removed from ASC topic 740
January 1, 2025
The Corporation is currently evaluating
the impact that the adoption of this
guidance will have on its financial
statements and presentation and
disclosures.
FASB ASU 2023-08,
Intangibles - Goodwill and
Other - Crypto Assets
(Subtopic 350-60) -
Accounting for and
Disclosure of Crypto
Assets
The FASB issued ASU 2023-08 in
December 2023, which amends ASC
subtopic 350-60 by requiring that crypto
assets are measured at fair value in the
statement of financial position each
reporting period with changes from
remeasurement being recognized in net
income. The ASU also requires enhanced
disclosures for both annual and interim
reporting periods to provide investors with
relevant information to analyze and assess
the exposure and risk of significant
individual crypto asset holdings.
January 1, 2025
The Corporation does not expect to be
impacted by the adoption of this ASU
since it does not hold crypto-assets for
its platform users.
FASB ASU 2023-07,
Segment Reporting (Topic
280) - Improvements to
Reportable Segment
Disclosures
The FASB issued ASU 2023-07 in
November 2023, which amends ASC topic
280 by requiring additional disclosures
about significant segment expenses.
For fiscal years
beginning on
January 1, 2024
For interim periods
within fiscal years
beginning after
January 1, 2025
The Corporation is currently evaluating
the impact that the adoption of this
guidance will have on its financial
statements and presentation and
disclosures.
141
FASB ASU 2023-06,
Disclosure Improvements -
Codification Amendments
in Response to the SEC’s
Disclosure Update and
Simplification Initiative
The FASB issued ASU 2023-06 in October
2023 which modifies the disclosure or
presentation requirements of various
subtopics in the Codification with the
purpose of aligning U.S. GAAP requirement
with those of the SEC under Regulation S-X
and S-K.
The date on which
the SEC removes
related disclosure
requirements from
Regulation S-X or
Regulation S-K. If by
June 30, 2027, the
SEC has not
removed the
applicable
requirement from
Regulation S-X or
Regulation S-K, the
pending content of
the related
amendment will be
removed from the
Codification and will
not become
effective for any
entity.
The Corporation does not expect to be
impacted by the adoption of this ASU
since it is currently subject to SEC's
current disclosure and presentation
requirements under Regulation S-X and
S-K.
FASB ASU 2023-05,
Business Combinations -
Joint Venture Formations
(Subtopic 805-60) -
Recognition and initial
measurement
The FASB issued ASU 2023-05 in August
2023, which amends ASC subtopic 805-60
to include specific guidance about how joint
ventures should recognize and initially
measure assets contributed and liabilities
assumed. The amendments require that a
joint venture, upon formation, recognize and
initially measure its assets and liabilities at
fair value.
January 1, 2025
Upon adoption of this ASU, the
Corporation will consider this guidance
for the initial measure of assets and
liabilities of newly created joint
ventures.
FASB ASU 2023-02,
Investments—Equity
Method and Joint
Ventures (Topic 323) -
Accounting for
Investments in Tax Credit
Structures Using the
Proportional Amortization
Method
The FASB issued ASU 2023-02 in March
2023, which amend ASC topic 323 by
permitting the election to apply the
proportional amortization method to account
for tax equity investments that generate
income tax credits through investment in
low-income-housing tax credit (LIHTC)
structures and other tax credit programs if
certain conditions are met. The ASU also
eliminates the application of the ASC
subtopic 323-740 to LIHTC investment not
accounted for using the proportional
amortization method and instead requires
the use of other guidance.
January 1, 2024
The Corporation does not expect to be
impacted by the adoption of this ASU
since it does not hold investments in
tax equity investments.
142
Accounting Standards Updates Not Yet Adopted
Standard
Description
Date of adoption
Effect on the financial statements
FASB ASU 2023-01,
Leases (Topic 842) -
Common Control
Arrangements
The FASB issued ASU 2023-01 in March
2023, which amends ASC Topic 842 and
requires the amortization leasehold
improvements associated with common
control leases over the useful life of the
leasehold improvements to the common
control group as long as the lessee controls
the use of the underlying assets through a
lease. In addition, the ASU requires
companies to account for leasehold
improvements associated with common
control leases as a transfer between entities
under common control through an
adjustments to equity if, and when, the
lessee no longer controls the use of the
underlying asset.
January 1, 2024
The Corporation does not expect to be
impacted by the adoption of this ASU
since it does not hold common control
leasehold improvements, however, it
will consider this guidance to determine
the amortization period for and
accounting treatment of leasehold
improvements associated with common
control leases acquired on or after the
effective date.
FASB ASU 2022-03, Fair
Value Measurement
(Topic 820) - Fair Value
Measurement of Equity
Securities Subject to
Contractual Sale
Restriction
The FASB issued ASU 2022-03 in June
2022, which clarifies that a contractual
restriction that prohibits the sale of an equity
security is not considered part of the unit of
account of the equity security, therefore, is
not considered in measuring its fair value.
The ASU also provides enhanced
disclosures for equity securities subject to a
contractual sale restriction.
January 1, 2024
The Corporation does not anticipate
that the adoption of this accounting
pronouncement will have a material
effect in its consolidated statement of
financial condition and results of
operations.
143
Note 4
–
Acquisition of key customer channels and business from Evertec
On July 1, 2022, BPPR completed its previously announced acquisition of certain assets used by Evertec Group, LLC (“Evertec
Group”), a wholly owned subsidiary of Evertec, Inc. (“Evertec”), to service certain BPPR channels (“Business Acquisition
Transaction”).
As a result of the closing of the Business Acquisition Transaction, BPPR acquired from Evertec Group certain critical channels,
including BPPR’s retail and business digital banking and commercial cash management applications. In connection with the
Business Acquisition Transaction, BPPR also entered into amended and restated service agreements with Evertec Group pursuant
to which Evertec Group will continue to provide various information technology and transaction processing services to Popular,
BPPR and their respective subsidiaries.
Under the amended service agreements, Evertec Group no longer has exclusive rights to provide certain of Popular’s technology
services. The amended service agreements include discounted pricing and lowered caps on contractual pricing escalators tied to
the Consumer Price Index. As part of the transaction, BPPR and Evertec also entered into a revenue sharing structure for BPPR in
connection with its merchant acquiring relationship with Evertec. Under the terms of the amended and restated Master Service
Agreement (“MSA”), Evertec will be entitled to receive monthly payments from the Corporation to the extent that Evertec’s revenues,
covered under the MSA, fall below certain agreed annualized minimum amounts.
As consideration for the Business Acquisition Transaction, BPPR delivered to Evertec Group
stock valued at closing at $
). A total of $
consideration for the transaction was attributed to the acquisition of the critical channels of which $
Software Intangible Assets and $
combination. The remaining $
expense. The Corporation also recorded a credit of $
a result of the Business Acquisition Transaction, resulting in a net expense charge of $
On August 15, 2022, the Corporation completed the sale of its remaining
“Evertec Stock Sale”, and collectively with the Business Acquisition Transaction, the “Evertec Transactions”). Following the Evertec
Stock Sale, Popular no longer owns any Evertec common stock. The impact of the gain on the sale of Evertec shares used as
consideration for the Business Acquisition Transaction in exchange for the acquired applications on July 1, 2022 and the net
expense associated with the renegotiation of the MSA, together with the Evertec Stock Sale and the related accounting adjustments
of the Evertec Transactions, resulted in an aggregate after-tax gain of $
The following table presents the fair values of the consideration and major classes of identifiable assets acquired by BPPR as of
July 1, 2022.
(In thousands)
Fair Value
Stock consideration
$
Total consideration
$
Assets:
Developed technology - Software intangible assets
$
Total assets
$
Net assets acquired
$
Goodwill on acquisition
$
The following is a description of the methods used to determine the fair values of significant assets acquired in the Business
Acquisition Transaction:
144
Developed technology – Software intangible assets
In order to determine the fair value of the developed technology acquired, the Corporation considered the guidance in ASC Topic
820, Fair Value Measurements. The Corporation used the cost replacement methodology and estimated the cost that would be
incurred in developing the acquired technology as the assets’ fair value. In developing this estimate, the Corporation considered the
historical direct costs as well as indirect costs and applied an inflation factor to arrive at what would be the current replacement cost.
To this estimated cost, the Corporation applied an obsolescence factor to arrive at the estimated fair value of the acquired
technology. The obsolescence factor considered the estimated remaining useful life of the acquired software, considering existing
and upcoming technology changes, as well as the scalability of the system architecture for further developments. This software
acquired for internal use is recorded within Other Assets in the accompanying Consolidated Financial Statements and will be
amortized over its current estimated remaining useful life of
Goodwill
The goodwill is the residual difference between the consideration transferred to Evertec and the fair value of the assets acquired,
net of the liabilities assumed, if any. The entire amount of goodwill is deductible for income tax purposes pursuant to P.R. Internal
Revenue Code (“IRC”) section 1033.07 over a
-year period.
The Corporation believes that given the amount of assets acquired and the size of the operations acquired in relation to Popular’s
operations, the historical results of Evertec are not material to Popular’s results, and thus no pro forma information is presented.
145
Note 5 - Restrictions on cash and due from banks and certain securities
BPPR is required by regulatory agencies to maintain average reserve balances with the Federal Reserve Bank of New York (the
“Fed”) or other banks. Those required average reserve balances amounted to $
2022 - $
reserve balances.
At December 31, 2023, the Corporation held $
accounts, debt securities available for sale and equity securities (December 31, 2022 - $
debt securities available for sale and equity securities consist primarily of assets held for the Corporation’s non-qualified retirement
plans and fund deposits guaranteeing possible liens or encumbrances over the title of insured properties.
146
Note 6 – Debt securities available-for-sale
The following tables present the amortized cost, gross unrealized gains and losses, approximate fair value, weighted average yield
and contractual maturities of debt securities available-for-sale at December 31, 2023 and December 31, 2022.
At December 31, 2023
Gross
Gross
Weighted
Amortized
unrealized
unrealized
Fair
average
(In thousands)
cost
gains
losses
value
yield
U.S. Treasury securities
Within 1 year
$
$
$
$
%
After 1 to 5 years
After 5 to 10 years
Total U.S. Treasury securities
Collateralized mortgage obligations - federal agencies
After 1 to 5 years
After 5 to 10 years
After 10 years
Total collateralized mortgage obligations - federal agencies
Mortgage-backed securities
Within 1 year
After 1 to 5 years
After 5 to 10 years
After 10 years
Total mortgage-backed securities
Other
Within 1 year
After 1 to 5 years
Total other
Total debt securities available-for-sale
[1]
$
$
$
$
%
[1]
servicing agreements that the secured parties are not permitted to sell or repledge the collateral, of which $
public funds. The Corporation had unpledged Available for Sale securities with a fair value of $
borrowing facilities.
147
At December 31, 2022
Gross
Gross
Weighted
Amortized
unrealized
unrealized
Fair
average
(In thousands)
cost
gains
losses
value
yield
U.S. Treasury securities
Within 1 year
$
$
$
$
%
After 1 to 5 years
After 5 to 10 years
Total U.S. Treasury securities
Collateralized mortgage obligations - federal agencies
After 1 to 5 years
After 5 to 10 years
After 10 years
Total collateralized mortgage obligations - federal agencies
Mortgage-backed securities
After 1 to 5 years
After 5 to 10 years
After 10 years
Total mortgage-backed securities
Other
After 1 to 5 years
Total other
Total debt securities available-for-sale
[1]
$
$
$
$
%
[1]
Includes $
servicing agreements that the secured parties are not permitted to sell or repledge the collateral, of which $
public funds. The Corporation had unpledged Available for Sale securities with a fair value of $
borrowing facilities.
The weighted average yield on debt securities available-for-sale is based on amortized cost; therefore, it does not give effect to
changes in fair value.
Securities not due on a single contractual maturity date, such as mortgage-backed securities and collateralized mortgage
obligations, are classified in the period of final contractual maturity. The expected maturities of collateralized mortgage obligations,
mortgage-backed securities and certain other securities may differ from their contractual maturities because they may be subject to
prepayments or may be called by the issuer.
The following table presents the aggregate amortized cost and fair value of debt securities available-for-sale at December 31, 2023
by contractual maturity.
(In thousands)
Amortized cost
Fair value
Within 1 year
$
$
After 1 to 5 years
After 5 to 10 years
After 10 years
Total debt securities available-for-sale
$
$
At December 31, 2023, the Corporation did not intend to sell or believed it was more likely than not that it would be required to sell
debt securities classified as available-for-sale. There were
December 31, 2023 and December 31, 2022. During the year ended December 31, 2021, the Corporation sold U.S Treasury Notes.
The proceeds from these sales were $
for the years ended December 31, 2023, 2022 and 2021 were as follows:
148
(In thousands)
2023
2022
2021
Gross realized gains
$
$
$
Gross realized losses
(672 )
Net realized gains (losses) on sale of debt securities available -for-sale
$
$
$
The following tables present the Corporation’s fair value and gross unrealized losses of debt securities available-for-sale,
aggregated by investment category and length of time that individual securities have been in a continuous unrealized loss position,
at December 31, 2023 and 2022.
At December 31, 2023
Less than 12 months
12 months or more
Total
Gross
Gross
Gross
Fair
Fair
Fair
(In thousands)
value
losses
value
losses
value
losses
U.S. Treasury securities
$
$
$
$
$
$
Collateralized mortgage obligations - federal agencies
Mortgage-backed securities
Total debt securities available-for-sale in an unrealized loss position
$
$
$
$
$
$
At December 31, 2022
Less than 12 months
12 months or more
Total
Gross
Gross
Gross
Fair
Fair
Fair
(In thousands)
value
losses
value
losses
value
losses
U.S. Treasury securities
$
$
$
$
$
$
Collateralized mortgage obligations - federal agencies
Mortgage-backed securities
Other
Total debt securities available-for-sale in an unrealized loss position
$
$
$
$
$
$
As of December 31, 2023, the portfolio of available-for-sale debt securities reflects gross unrealized losses of $
mainly by fixed-rate U.S. Treasury Securities and mortgage-backed securities, which have been impacted by a decline in fair value
as a result of the rising interest rate environment. The portfolio of available-for-sale debt securities is comprised mainly of U.S
Treasuries and obligations from the U.S. Government, its agencies or government sponsored entities, including FNMA, FHMLC and
GNMA. As discussed in Note 2 to the Consolidated Financial Statements, these securities carry an explicit or implicit guarantee
from the U.S. Government, are highly rated by major rating agencies, and have a long history of no credit losses. Accordingly, the
Corporation applies a zero-credit loss assumption and no ACL for these securities has been established.
In October 2022, the Corporation transferred U.S. Treasury securities with a fair value of $
its available-for-sale portfolio to its held-to-maturity portfolio. Management changed its intent, given its ability to hold these securities
to maturity due to the Corporation’s liquidity position and its intention to reduce the impact on accumulated other comprehensive
income (loss) (“AOCI”) and tangible capital of further increases in interest rates. The securities were reclassified at fair value at the
time of the transfer. At the date of the transfer, these securities had pre-tax unrealized losses of $
fair value discount is being accreted to interest income and the unrealized loss remaining in AOCI is being amortized, offsetting
each other through the remaining life of the securities. There were no realized gains or losses recorded as a result of this transfer.
149
Note 7 –Debt securities held-to-maturity
The following tables present the amortized cost, allowance for credit losses, gross unrealized gains and losses, approximate fair
value, weighted average yield and contractual maturities of debt securities held-to-maturity at December 31, 2023 and 2022.
At December 31, 2023
Allowance
Carrying
Value
Gross
Gross
Weighted
Amortized
Book
[1]
for Credit
Net of
unrealized
unrealized
Fair
average
(In thousands)
cost
Value
Losses
Allowance
gains
losses
value
yield
U.S. Treasury securities
Within 1 year
$
$
$
$
$
$
$
%
After 1 to 5 years
After 5 to 10 years
Total U.S. Treasury securities
Obligations of Puerto Rico, States and
political subdivisions
Within 1 year
After 1 to 5 years
After 5 to 10 years
After 10 years
Total obligations of Puerto Rico, States and
political subdivisions
Collateralized mortgage obligations - federal
agencies
Within 1 year
After 10 years
Total collateralized mortgage obligations -
federal agencies
Securities in wholly owned statutory business
trusts
After 10 years
Total securities in wholly owned statutory
business trusts
Total debt securities held-to-maturity [2]
$
$
$
$
$
$
$
%
[1]
Book value includes $
certain securities transferred from available-for-sale securities portfolio to the held-to-maturity securities portfolio as discussed in Note 6.
[2]
Includes $
Corporation had unpledged held-to-maturities securities with a fair value of $
150
At December 31, 2022
Allowance
Carrying
Value
Gross
Gross
Weighted
Amortized
Book
[1]
for Credit
Net of
unrealized
unrealized
Fair
average
(In thousands)
cost
Value
Losses
Allowance
gains
losses
value
yield
U.S. Treasury securities
Within 1 year
$
$
$
$
$
$
$
%
After 1 to 5 years
After 5 to 10 years
Total U.S. Treasury securities
Obligations of Puerto Rico, States and
political subdivisions
`
Within 1 year
%
After 1 to 5 years
After 5 to 10 years
After 10 years
Total obligations of Puerto Rico, States and
political subdivisions
Collateralized mortgage obligations - federal
agencies
After 1 to 5 years
Total collateralized mortgage obligations -
federal agencies
Securities in wholly owned statutory business
trusts
After 10 years
Total securities in wholly owned statutory
business trusts
Total debt securities held-to-maturity [2]
$
$
$
$
$
$
$
%
[1]
Book value includes $
certain securities transferred from available-for-sale securities portfolio to the held-to-maturity securities portfolio as discussed in Note 6.
[2]
Includes $
Corporation had unpledged held-to-maturities securities with a fair value of $
Securities not due on a single contractual maturity date, such as collateralized mortgage obligations, are classified in the period of
final contractual maturity. The expected maturities of collateralized mortgage obligations and certain other securities may differ from
their contractual maturities because they may be subject to prepayments or may be called by the issuer.
The following table presents the aggregate amortized cost and fair value of debt securities held-to-maturity at December 31, 2023
by contractual maturity.
(In thousands)
Amortized cost
Book Value
Fair value
Within 1 year
$
$
$
After 1 to 5 years
After 5 to 10 years
After 10 years
Total debt securities held-to-maturity
$
$
$
Credit Quality Indicators
The following describes the credit quality indicators by major security type that the Corporation considers in its’ estimate to develop
the allowance for credit losses for investment securities held-to-maturity.
As discussed in Note 2 to the Consolidated Financial Statements, U.S. Treasury securities carry an explicit guarantee from the U.S.
Government are highly rated by major rating agencies, and have a long history of no credit losses. Accordingly, the Corporation
applies a zero-credit loss assumption and no ACL for these securities has been established.
151
At December 31, 2023 and December 31, 2022, the “Obligations of Puerto Rico, States and political subdivisions” classified as held-
to-maturity, includes securities issued by municipalities of Puerto Rico that are generally not rated by a credit rating agency. This
includes $
from certain property taxes imposed by the issuing municipality (December 31, 2022 - $
obligations, they also benefit from a pledge of the full faith, credit and unlimited taxing power of the issuing municipality, which is
required by law to levy property taxes in an amount sufficient for the payment of debt service on such general obligation bonds. The
Corporation performs periodic credit quality reviews of these securities and internally assigns standardized credit risk ratings based
on its evaluation. The Corporation considers these ratings in its estimate to develop the allowance for credit losses associated with
these securities. For the definitions of the obligor risk ratings, refer to the Credit Quality section of Note 9 to the Consolidated
Financial Statements.
The following presents the amortized cost basis of securities held by the Corporation issued by municipalities of Puerto Rico
aggregated by the internally assigned standardized credit risk rating:
At December 31, 2023
At December 31, 2022
(In thousands)
Securities issued by Puerto Rico municipalities
Watch
$
$
Pass
Total
$
$
At December 31, 2023, the portfolio of “Obligations of Puerto Rico, States and political subdivisions” also includes $
securities issued by the Puerto Rico Housing Finance Authority (“HFA”), a government instrumentality, for which the underlying
source of payment is second mortgage loans in Puerto Rico residential properties (not the government), but for which HFA, provides
a guarantee in the event of default and upon the satisfaction of certain other conditions (December 31, 2022 - $
securities are not rated by a credit rating agency. The Corporation assesses the credit risk associated with these securities by
evaluating the refreshed FICO scores of a representative sample of the underlying borrowers. At December 31, 2023, the average
refreshed FICO score for the representative sample, comprised of
% of the nominal value of the securities, used for the loss
estimate was of
% and
, respectively, at December 31, 2022). The loss estimates for this portfolio was
based on the methodology established under CECL for similar loan obligations. The Corporation does not consider the government
guarantee when estimating the credit losses associated with this portfolio.
A further deterioration of the Puerto Rico economy or of the fiscal health of the Government of Puerto Rico and/or its
instrumentalities (including if any of the issuing municipalities become subject to a debt restructuring proceeding under PROMESA)
could further affect the value of these securities, resulting in losses to the Corporation.
Refer to Note 24
to the Consolidated Financial Statements
for additional information on the Corporation’s exposure to the Puerto
Rico Government.
At December 31, 2023, the portfolio of “Obligations of Puerto Rico, States and political subdivisions” also includes $
securities issued by the HFA for which the underlying source of payment is U.S. Treasury securities. The Corporation applies a
-credit loss assumption for these securities, and no ACL has been established for these securities given that U.S. Treasury
securities carry an explicit guarantee from the U.S. Government, are highly rated by major rating agencies, and have a long history
of no credit losses. Refer to Note 2 to the Consolidated Financial Statements for further details.
Delinquency status
At December 31, 2023 and December 31, 2022, there were
Allowance for credit losses on debt securities held-to-maturity
The following table provides the activity in the allowance for credit losses related to debt securities held-to-maturity by security type
at December 31, 2023 and December 31, 2022:
152
For the year ended December 31,
2023
2022
(In thousands)
Obligations of Puerto Rico, States and political subdivisions
Allowance for credit losses:
Beginning balance
$
$
Provision for credit losses (benefit)
(1,131 )
(1,185 )
Securities charged-off
Recoveries
Ending balance
$
$
The allowance for credit losses for the Obligations of Puerto Rico, States and political subdivisions includes $
securities issued by municipalities of Puerto Rico, and $
second mortgage loans on Puerto Rico residential properties (compared to $
31, 2022).
153
Note 8 – Loans
For a summary of the accounting policies related to loans, interest recognition and allowance for credit losses refer to Note 2 to the
Consolidated Financial Statement .
During the year ended December 31, 2023, the Corporation recorded purchases (including repurchases) of mortgage loans of $
million, which include $
loans of $
PCD loans, consumer loans of $
The Corporation performed whole-loan sales involving approximately $
consumer loans, and $
2022 - $
ended December 31, 2023, the Corporation securitized approximately $
Mortgage Association (“GNMA”) mortgage-backed securities and $
Association (“FNMA”) mortgage-backed securities, compared to $
December 31, 2022. Also, the Corporation securitized approximately $
Mortgage Corporation (“FHLMC”) mortgage-backed securities during the year ended December 31, 2022.
Delinquency status
The following tables present the amortized cost basis of loans held-in-portfolio (“HIP”), net of unearned income, by past due status,
and by loan class including those that are in non-performing status or that are accruing interest but are past due 90 days or more at
December 31, 2023 and December 31, 2022.
154
December 31, 2023
BPPR
Past due
Past due 90 days or more
30-59
60-89
90 days
Total
Non-accrual
Accruing
(In thousands)
days
days
or more
past due
Current
Loans HIP
loans
loans
Commercial multi-family
$
$
$
$
$
$
$
$
Commercial real estate:
Non-owner occupied
Owner occupied
Commercial and industrial
Construction
Mortgage
Leasing
Consumer:
Credit cards
Home equity lines of credit
Personal
Auto
Other
Total
$
$
$
$
$
$
$
$
December 31, 2023
Popular U.S.
Past due
Past due 90 days or more
30-59
60-89
90 days
Total
Non-accrual
Accruing
(In thousands)
days
days
or more
past due
Current
Loans HIP
loans
loans
Commercial multi-family
$
$
$
$
$
$
$
$
Commercial real estate:
Non-owner occupied
Owner occupied
Commercial and industrial
Construction
Mortgage
Consumer:
Credit cards
Home equity lines of
credit
Personal
Other
Total
$
$
$
$
$
$
$
$
155
December 31, 2023
Popular, Inc.
Past due
Past due 90 days or more
30-59
60-89
90 days
Total
Non-accrual
Accruing
(In thousands)
days
days
or more
past due
Current
Loans HIP
[2] [3]
loans
loans
Commercial multi-family
$
$
$
$
$
$
$
$
Commercial real estate:
Non-owner occupied
Owner occupied
Commercial and industrial
Construction
Mortgage
[1]
Leasing
Consumer:
Credit cards
Home equity lines of credit
Personal
Auto
Other
Total
$
$
$
$
$
$
$
$
[1]
It is the Corporation’s policy to report delinquent residential mortgage loans insured by Federal Housing Administration (“FHA”) or guaranteed by
the U.S. Department of Veterans Affairs (“VA”) as accruing loans past due 90 days or more as opposed to non-performing since the principal
repayment is insured. These balances include $
longer accruing interest as of December 31, 2023. Furthermore, as of December 31, 2023, the Corporation had approximately $
reverse mortgage loans which are guaranteed by FHA, but which are currently not accruing interest. Due to the guaranteed nature of the loans, it
is the Corporation’s policy to exclude these balances from non-performing assets.
[2]
Loans held-in-portfolio are net of $
[3]
Includes $
of which $
Bank ("FRB") for discount window borrowings. As of December 31, 2023, the Corporation had an available borrowing facility with the FHLB and
the discount window of Federal Reserve Bank of New York of $
156
December 31, 2022
BPPR
Past due
Past due 90 days or more
30-59
60-89
90 days
Total
Non-accrual
Accruing
(In thousands)
or more
past due
Current
Loans HIP
loans
loans
Commercial multi-family
$
$
$
$
$
$
$
$
Commercial real estate:
Non-owner occupied
Owner occupied
Commercial and industrial
Construction
Mortgage
Leasing
Consumer:
Credit cards
Home equity lines of credit
Personal
Auto
Other
Total
$
$
$
$
$
$
$
$
December 31, 2022
Popular U.S.
Past due
Past due 90 days or more
30-59
60-89
90 days
Total
Non-accrual
Accruing
(In thousands)
or more
past due
Current
Loans HIP
loans
loans
Commercial multi-family
$
$
$
$
$
$
$
$
Commercial real estate:
Non-owner occupied
Owner occupied
Commercial and industrial
Construction
Mortgage
Consumer:
Credit cards
Home equity lines of credit
Personal
Other
Total
$
$
$
$
$
$
$
$
157
December 31, 2022
Popular, Inc.
Past due
Past due 90 days or more
30-59
60-89
90 days
Total
Non-accrual
Accruing
(In thousands)
or more
past due
Current
Loans HIP
[2]
[3]
loans
loans
Commercial multi-family
$
$
$
$
$
$
$
$
Commercial real estate:
Non-owner occupied
Owner occupied
Commercial and industrial
Construction
Mortgage
[1]
Leasing
Consumer:
Credit cards
Home equity lines of credit
Personal
Auto
Other
Total
$
$
$
$
$
$
$
$
[1]
It is the Corporation’s policy to report delinquent residential mortgage loans insured by FHA or guaranteed by the VA as accruing loans past due
90 days or more as opposed to non-performing since the principal repayment is insured. These balances also include $
mortgage loans insured by FHA or guaranteed by the VA that are no longer accruing interest as of December 31, 2022. Furthermore, as of
December 31,2022, the Corporation had approximately $
currently not accruing interest. Due to the guaranteed nature of the loans, it is the Corporation’s policy to exclude these balances from non-
performing assets.
[2]
Loans held-in-portfolio are net of $
[3]
Includes $
of which $
Bank (FRB) for discount window borrowings. As of December 31, 2022, the Corporation had an available borrowing facility with the FHLB and the
discount window of Federal Reserve Bank of New York of $
Recognition of interest income on mortgage loans is generally discontinued when loans are 90 days or more in arrears on payments
of principal or interest. The Corporation discontinues the recognition of interest income on residential mortgage loans insured by the
FHA or guaranteed by VA when 15 months delinquent as to principal or interest, since the principal repayment on these loans is
insured.
At December 31, 2023, mortgage loans held-in-portfolio include $
the FHA, or guaranteed by the VA of which $
portfolio of guaranteed loans includes $
as of December 31, 2023 (December 31, 2022 - $
loans in Puerto Rico which are guaranteed by FHA, but which are currently not accruing interest at December 31, 2023 (December
31, 2022 - $
Loans with a delinquency status of 90 days past due as of December 31, 2023 include $
GNMA securities (December 31, 2022 - $
obligation to repurchase loans that are 90 days or more past due. For accounting purposes, these loans subject to the repurchase
option are required to be reflected on the financial statements of BPPR with an offsetting liability. Loans in our serviced GNMA
portfolio benefit from payment forbearance programs but continue to reflect the contractual delinquency until the borrower repays
deferred payments or completes a payment deferral modification or other borrower assistance alternative.
The components of the net financing leases, including finance leases within the C&I category, receivable at December 31, 2023 and
2022 were as follows:
158
(In thousands)
2023
2022
Total minimum lease payments
$
$
Estimated residual value of leased property
Deferred origination costs, net of fees
Less - Unearned financing income
Net minimum lease payments
Less - Allowance for credit losses
Net minimum lease payments, net of allowance for credit losses
$
$
At December 31, 2023, future minimum lease payments are expected to be received as follows:
(In thousands)
2024
$
2025
2026
2027
2028
2029 and thereafter
Total
$
The following tables present the amortized cost basis of non-accrual loans as of December 31, 2023 and December 31, 2022 by
class of loans:
159
December 31, 2023
BPPR
Popular U.S.
Popular, Inc.
(In thousands)
Non-accrual
with no
allowance
Non-accrual
with
allowance
Non-accrual
with no
allowance
Non-accrual
with
allowance
Non-accrual
with no
allowance
Non-accrual
with
allowance
Commercial multi-family
$
$
$
$
$
$
Commercial real estate non-owner occupied
Commercial real estate owner occupied
Commercial and industrial
Construction
Mortgage
Leasing
Consumer:
Total
$
$
$
$
$
$
December 31, 2022
BPPR
Popular U.S.
Popular, Inc.
(In thousands)
Non-accrual
with no
allowance
Non-accrual
with
allowance
Non-accrual
with no
allowance
Non-accrual
with
allowance
Non-accrual
with no
allowance
Non-accrual
with
allowance
Commercial multi-family
$
$
$
$
$
$
Commercial real estate non-owner occupied
Commercial real estate owner occupied
Commercial and industrial
Mortgage
Leasing
Consumer:
Total
$
$
$
$
$
$
Loans in non-accrual status with no allowance at December 31, 2023 include $
31, 2022 - $
December 31, 2023 (December 31, 2022 - $
The Corporation has designated loans classified as collateral dependent for which the ACL is measured based on the fair value of
the collateral less cost to sell, when foreclosure is probable or when the repayment is expected to be provided substantially by the
sale or operation of the collateral and the borrower is experiencing financial difficulty. The fair value of the collateral is based on
appraisals, which may be adjusted due to their age, and the type, location, and condition of the property or area or general market
conditions to reflect the expected change in value between the effective date of the appraisal and the measurement date. Appraisals
are updated every one to two years depending on the type of loan and the total exposure of the borrower.
The following tables present the amortized cost basis of collateral-dependent loans, for which the ACL was measured based on the
fair value of the collateral less cost to sell, by class of loans and type of collateral as of December 31, 2023 and December 31, 2022:
160
December 31, 2023
(In thousands)
Real Estate
Auto
Equipment
Other
Total
BPPR
Commercial multi-family
$
$
$
$
$
Commercial real estate:
Non-owner occupied
Owner occupied
Commercial and industrial
Construction
Mortgage
Leasing
Consumer:
Personal
Auto
Other
Total BPPR
$
$
$
$
$
Popular U.S.
Commercial real estate:
Owner occupied
$
$
$
$
$
Commercial and industrial
Construction
Mortgage
Total Popular U.S.
$
$
$
$
$
Popular, Inc.
Commercial multi-family
$
$
$
$
$
Commercial real estate:
Non-owner occupied
Owner occupied
Commercial and industrial
Construction
Mortgage
Leasing
Consumer:
Personal
Auto
Other
Total Popular, Inc.
$
$
$
$
$
161
December 31, 2022
(In thousands)
Real Estate
Auto
Equipment
Accounts
Receivables
Other
Total
BPPR
Commercial multi-family
$
$
$
$
$
$
Commercial real estate:
Non-owner occupied
Owner occupied
Commercial and industrial
Mortgage
Leasing
Consumer:
Personal
Auto
Other
Total BPPR
$
$
$
$
$
$
Popular U.S.
Commercial real estate:
Non-owner occupied
$
$
$
$
$
$
Owner occupied
Commercial and industrial
Mortgage
Total Popular U.S.
$
$
$
$
$
$
Popular, Inc.
Commercial multi-family
$
$
$
$
$
$
Commercial real estate:
Non-owner occupied
Owner occupied
Commercial and industrial
Mortgage
Leasing
Consumer:
Personal
Auto
Other
Total Popular, Inc.
$
$
$
$
$
$
162
Purchased Credit Deteriorated (PCD) Loans
The Corporation has purchased loans during the year for which there was, at acquisition, evidence of more than insignificant
deterioration of credit quality since origination. The carrying amount of those loans is as follows:
(In thousands)
December 31, 2023
December 31, 2022
Purchase price of loans at acquisition
$
$
Allowance for credit losses at acquisition
Non-credit discount / (premium) at acquisition
Par value of acquired loans at acquisition
$
$
163
Note 9 – Allowance for credit losses – loans held-in-portfolio
The
Corporation follows the current expected credit loss (“CECL”) model, to establish and evaluate the adequacy of the ACL to
provide for expected losses in the loan portfolio. This model establishes a forward-looking methodology that reflects the expected
credit losses over the lives of financial assets, starting when such assets are first acquired or originated. In addition, CECL provides
that the initial ACL on PCD financial assets be recorded as an increase to the purchase price, with subsequent changes to the
allowance recorded as a credit loss expense. The provision for credit losses recorded in current operations is based on this
methodology. Loan losses are charged, and recoveries are credited to the ACL. The Corporation’s modeling framework includes
competing risk models that generate lifetime default and prepayment estimates as well as other loan level techniques to estimate
loss severity. These models combine credit risk factors, which include the impact of loan modifications, with macroeconomic
expectations to derive the lifetime expected loss.
As part of the Corporation’s model governance procedures, a new model was implemented during the third quarter of 2023 for the
U.S commercial real estate segment. The new model enhances techniques used to capture default activity within the Corporation’s
geographical footprint. As part of the implementation analysis management evaluated the credit metrics of the portfolio such as risk
ratings, delinquency levels, and low exposure to the commercial office sector. Qualitative reserves continue to be maintained to
address risks within the U. S. commercial real estate segment. The new model including qualitative reserve accounted for $
million of PB’s reduction in ACL during the third quarter of 2023.
At December 31,2023, the Corporation estimated the ACL by weighting the outputs of optimistic, baseline, and pessimistic
scenarios. Among the three scenarios used to estimate the ACL, the baseline is assigned the highest probability, followed by the
pessimistic scenario given the uncertainties in the economic outlook and downside risk. The weightings applied are subject to
evaluation on a quarterly basis as part of the ACL’s governance process. The Corporation evaluates, at least on an annual basis,
the assumptions tied to the CECL accounting framework. These include the reasonable and supportable period as well as the
reversion window. During the third quarter of 2022, as part of its evaluation procedures, the Corporation decided to extend the
reversion window from 1 year to 3 years. The extension in the reversion window results in a better representation of historical
movements for key macroeconomic variables that impact the ACL. The reasonable and supportable period assumptions remained
unchanged at 2 years.
The baseline scenario assumes a 2024 annualized GDP growth for Puerto Rico and the United States of 1.21% and 1.65%. For
2023, annualized expected growth was 2.0% and 2.4% for Puerto Rico and United States, respectively. The reduction in 2024 is
due to the Fed’s monetary policy.
The 2024 average unemployment rate is forecasted at 6.79% and 3.95% for Puerto Rico and United States, respectively, compared
to 2023 average level 6.1% for Puerto Rico and 3.7% for the United States.
The following tables present the changes in the ACL of loans held-in-portfolio and unfunded commitments for the years ended
December 31, 2023 and 2022.
164
For the year ended December 31, 2023
BPPR
Impact of
Provision for
Allowance for
Net write
down
Beginning
Adopting
credit losses
credit losses -
Ending
(In thousands)
Balance
ASU 2022-02
(benefit)
PCD Loans
Charge-off
Recoveries
Balance
Allowance for credit losses - loans:
Commercial
Commercial multi-family
$
$
$
(1,597 )
$
$
$
$
$
Commercial real estate non-owner occupied
(1,130 )
Commercial real estate owner occupied
(1,161 )
(5,495 )
(4,437 )
Commercial and industrial
(552 )
(7,739 )
Total Commercial
(1,713 )
(13,306 )
Construction
(2,611 )
Mortgage
(33,556 )
(25,295 )
(1,638 )
Leasing
(35 )
(3,836 )
(10,879 )
Consumer
(41,007 )
(601 )
(155 )
(213 )
(7,020 )
(71,977 )
(21 )
(55,306 )
(12,454 )
Total Consumer
(7,041 )
(180,957 )
(601 )
Total - Loans
$
$
(42,345 )
$
$
$
(209,391 )
$
$
(601 )
$
Allowance for credit losses - unfunded commitments:
Commercial
$
$
$
$
$
$
$
$
Construction
(404 )
Ending balance - unfunded commitments [1]
$
$
$
$
$
$
$
$
[1]
Allowance for credit losses of unfunded commitments is presented as part of Other Liabilities in the Consolidated Statements of Financial Condition.
165
For the year ended December 31, 2023
Popular U.S.
Impact of
Provision for
Beginning
Adopting
credit losses -
Ending
(In thousands)
Balance
ASU 2022-02
(benefit)
Charge-offs
Recoveries
Balance
Allowance for credit losses - loans:
Commercial
Commercial multi-family
$
$
$
(10,980 )
$
$
$
Commercial real estate non-owner occupied
(9,222 )
(193 )
Commercial real estate owner occupied
(1,395 )
Commercial and industrial
(3,875 )
Total Commercial
(6,794 )
(5,463 )
Construction
Mortgage
(2,098 )
(5,248 )
Consumer
(1 )
(1,058 )
(471 )
(1,140 )
(19,971 )
(171 )
Total Consumer
(1,140 )
(20,614 )
Total - Loans
$
$
(3,238 )
$
$
(26,077 )
$
$
Allowance for credit losses - unfunded commitments:
Commercial
$
$
$
$
$
$
Construction
Consumer
(59 )
Ending balance - unfunded commitments [1]
$
$
$
$
$
$
[1]
Allowance for credit losses of unfunded commitments is presented as part of Other Liabilities in the Consolidated Statements of Financial Condition.
166
For the year ended December 31, 2023
Popular Inc.
Impact
Provision for
Allowance
for
Net write
down
Beginning
of adopting
credit losses
credit losses -
Ending
(In thousands)
Balance
ASU 2022-02
(benefit)
PCD Loans
Charge-offs
Recoveries
Balance
Allowance for credit losses - loans:
Commercial
Commercial multi-family
$
$
$
(12,577 )
$
$
$
$
$
Commercial real estate non-owner occupied
(8,242 )
(1,323 )
Commercial real estate owner occupied
(1,161 )
(5,832 )
Commercial and industrial
(552 )
(11,614 )
Total Commercial
(1,713 )
(18,769 )
Construction
(2,611 )
Mortgage
(35,654 )
(30,543 )
(1,638 )
Leasing
(35 )
(3,836 )
(10,879 )
Consumer
(41,008 )
(601 )
(1,213 )
(684 )
(8,160 )
(91,948 )
(21 )
(55,306 )
(12,625 )
Total Consumer
(8,181 )
(201,571 )
(601 )
Total - Loans
$
$
(45,583 )
$
$
$
(235,468 )
$
$
(601 )
$
Allowance for credit losses - unfunded commitments:
Commercial
$
$
$
$
$
$
$
$
Construction
Consumer
(59 )
Ending balance - unfunded commitments [1]
$
$
$
$
$
$
$
$
[1]
Allowance for credit losses of unfunded commitments is presented as part of Other Liabilities in the Consolidated Statements of Financial Condition.
167
For the year ended December 31, 2022
BPPR
Provision for
Allowance for
Beginning
credit losses
credit losses -
Ending
(In thousands)
Balance
(benefit)
PCD Loans
Charge-offs
Recoveries
Balance
Allowance for credit losses - loans:
Commercial
Commercial multi-family
$
$
$
$
$
$
Commercial real estate non-owner occupied
(34 )
Commercial real estate owner occupied
(12,405 )
(1,063 )
Commercial and industrial
(6,141 )
Total Commercial
(7,238 )
Construction
Mortgage
(37,600 )
(5,105 )
Leasing
(7,107 )
Consumer
(26,210 )
(273 )
(191 )
(36,179 )
(42,143 )
(2,029 )
Total Consumer
(106,752 )
Total - Loans
$
$
$
$
(126,202 )
$
$
Allowance for credit losses - unfunded commitments:
Commercial
$
$
$
$
$
$
Construction
(366 )
Ending balance - unfunded commitments [1]
$
$
$
$
$
$
[1]
Allowance for credit losses of unfunded commitments is presented as part of Other Liabilities in the Consolidated Statements of Financial Condition.
168
For the year ended December 31, 2022
Popular U.S.
Provision for
Beginning
credit losses
Ending
(In thousands)
Balance
(benefit)
Charge-offs
Recoveries
Balance
Allowance for credit losses - loans:
Commercial
Commercial multi-family
$
$
(4,338 )
$
$
$
Commercial real estate non-owner occupied
(8,671 )
Commercial real estate owner occupied
(6 )
Commercial and industrial
(1,335 )
Total Commercial
(10,012 )
Construction
(4,586 )
Mortgage
(68 )
Consumer
(13 )
(3,713 )
(430 )
(7,404 )
(202 )
Total Consumer
(8,036 )
Total - Loans
$
$
$
(18,116 )
$
$
Allowance for credit losses - unfunded commitments:
Commercial
$
$
(209 )
$
$
$
Construction
(1,153 )
Consumer
Ending balance - unfunded commitments [1]
$
$
(1,311 )
$
$
$
[1]
Allowance for credit losses of unfunded commitments is presented as part of Other Liabilities in the Consolidated Statements of Financial Condition.
169
For the year ended December 31, 2022
Popular Inc.
Provision for
Allowance for
Beginning
credit losses
credit losses -
Ending
(In thousands)
Balance
(benefit)
PCD Loans
Charge-offs
Recoveries
Balance
Allowance for credit losses - loans:
Commercial
Commercial multi-family
$
$
(2,178 )
$
$
$
$
Commercial real estate non-owner occupied
(8,705 )
Commercial real estate owner occupied
(10,129 )
(1,069 )
Commercial and industrial
(7,476 )
Total Commercial
(17,250 )
Construction
(4,060 )
Mortgage
(35,894 )
(5,173 )
Leasing
(7,107 )
Consumer
(26,210 )
(3,986 )
(621 )
(43,583 )
(42,143 )
(2,231 )
Total Consumer
(114,788 )
Total - Loans
$
$
$
$
(144,318 )
$
$
Allowance for credit losses - unfunded commitments:
Commercial
$
$
$
$
$
$
Construction
(1,519 )
Consumer
Ending balance - unfunded commitments [1]
$
$
$
$
$
$
[1]
Allowance for credit losses of unfunded commitments is presented as part of Other Liabilities in the Consolidated Statements of Financial Condition.
Modifications
A modification constitutes a change in loan terms in the form of principal forgiveness, an interest rate reduction, other than-
insignificant payment delay, term extension or combination of the above made to a borrower experiencing financial difficulty.
The amount of outstanding commitments to lend additional funds to debtors with financial difficulties owing receivables whose terms
have been modified during the year ended December 31, 2023 amounted to $
loan portfolios.
The following tables show the amortized cost basis of the loans modified to borrowers experiencing financial difficulties at the end of
the reporting period disaggregated by class of financing receivable and type of concession granted for the year ended December
31,2023. Loans modified to borrowers under financial difficulties that were fully paid down, charged-off or foreclosed upon by period
end are not reported.
170
Loan Modifications Made to Borrowers Experiencing Financial Difficulty for the year ended December 31,2023
Interest Rate Reduction
BPPR
Popular U.S.
Popular, Inc.
(Dollars in thousands)
Amortized Cost
Basis at
December
31,2023
% of total class of
Financing
Receivable
Amortized Cost
Basis at
December
31,2023
% of total class of
Financing
Receivable
Amortized Cost
Basis at
December
31,2023
% of total class of
Financing
Receivable
CRE owner occupied
$
%
$
%
$
%
Commercial and industrial
%
%
%
Mortgage
%
%
%
Consumer:
%
%
%
%
%
%
%
%
%
Total
$
%
$
%
$
%
Term Extension
BPPR
Popular U.S.
Popular, Inc.
(Dollars in thousands)
Amortized Cost
Basis at
December
31,2023
% of total class of
Financing
Receivable
Amortized Cost
Basis at
December
31,2023
% of total class of
Financing
Receivable
Amortized Cost
Basis at
December
31,2023
% of total class of
Financing
Receivable
CRE non-owner occupied
$
%
$
%
$
%
CRE owner occupied
%
%
%
Commercial and industrial
%
%
%
Construction
%
%
%
Mortgage
%
%
%
Consumer:
%
%
%
%
%
%
Total
$
%
$
%
$
%
Other-Than-Insignificant Payment Delays
BPPR
Popular U.S.
Popular, Inc.
(Dollars in thousands)
Amortized Cost
Basis at
December
31,2023
% of total class of
Financing
Receivable
Amortized Cost
Basis at
December
31,2023
% of total class of
Financing
Receivable
Amortized Cost
Basis at
December
31,2023
% of total class of
Financing
Receivable
CRE non-owner occupied
$
%
$
%
$
%
CRE owner occupied
%
%
%
Commercial and industrial
%
%
%
Mortgage
%
%
%
Total
$
%
$
%
$
%
Combination - Term extension and Interest Rate Reduction
BPPR
Popular U.S.
Popular, Inc.
(Dollars in thousands)
Amortized Cost
Basis at
December
31,2023
% of total class of
Financing
Receivable
Amortized Cost
Basis at
December
31,2023
% of total class of
Financing
Receivable
Amortized Cost
Basis at
December
31,2023
% of total class of
Financing
Receivable
Commercial multi-family
$
%
$
%
$
%
CRE non-owner occupied
%
$
%
%
CRE owner occupied
%
%
%
Commercial and industrial
%
%
%
Mortgage
%
%
%
Consumer:
%
%
%
%
%
%
Total
$
%
$
%
$
%
171
Combination - Other-Than-Insignificant Payment Delays and Interest Rate Reduction
Puerto Rico
Popular U.S.
Popular, Inc.
(Dollars in thousands)
Amortized Cost
Basis at
December
31,2023
% of total class of
Financing
Receivable
Amortized Cost
Basis at
December
31,2023
% of total class of
Financing
Receivable
Amortized Cost
Basis at
December
31,2023
% of total class of
Financing
Receivable
CRE non-owner occupied
$
%
$
%
$
%
Commercial and industrial
%
%
%
Consumer:
%
%
%
Total
$
%
$
%
$
%
Combination - Other-Than-Insignificant Payment Delays and Principal Forgiveness
Puerto Rico
Popular U.S.
Popular, Inc.
(Dollars in thousands)
Amortized Cost
Basis at
December
31,2023
% of total class of
Financing
Receivable
Amortized Cost
Basis at
December
31,2023
% of total class of
Financing
Receivable
Amortized Cost
Basis at
December
31,2023
% of total class of
Financing
Receivable
CRE owner occupied
$
%
$
%
$
%
Total
$
%
$
%
$
%
172
The following table describes the financial effect of the modifications made to borrowers experiencing financial difficulties:
For the year ended December 31, 2023
Interest rate reduction
Loan Type
Financial Effect
Commercial multi-family
Reduced weighted-average contractual interest rate from
% to
%.
CRE non-owner occupied
Reduced weighted-average contractual interest rate from
% to
%.
CRE owner occupied
Reduced weighted-average contractual interest rate from
% to
%.
Commercial and industrial
Reduced weighted-average contractual interest rate from
% to
%.
Mortgage
Reduced weighted-average contractual interest rate from
% to
%.
Consumer:
Credit cards
Reduced weighted-average contractual interest rate from
% to
%.
Personal
Reduced weighted-average contractual interest rate from
% to
%.
Auto
Reduced weighted-average contractual interest rate from
% to
%.
Other
Reduced weighted-average contractual interest rate from
.0% to 0.0%.
Term extension
Loan Type
Financial Effect
Commercial multi-family
Added a weighted-average of
CRE non-owner occupied
Added a weighted-average of
CRE owner occupied
Added a weighted-average of
Commercial and industrial
Added a weighted-average of
Construction
Added a weighted-average of
Mortgage
Added a weighted-average of
Consumer:
Personal
Added a weighted-average of
Auto
Added a weighted-average of
Principal forgiveness
Loan Type
Financial Effect
CRE owner occupied
Reduced the amortized cost basis of the loans by $
Other than insignificant payment delay
Loan Type
Financial Effect
CRE non-owner occupied
Added a weighted-average of
CRE owner occupied
Added a weighted-average of
Commercial and industrial
Added a weighted-average of
Mortgage
Added a weighted-average of
Consumer:
Credit cards
Added a weighted-average of
173
The following table presents, by class, the performance of loans that have been modified during the year ended December 31,
2023.
These loans will continue in non-accrual status, and presented as past due 90 days or more, until the borrower has demonstrated a
willingness and ability to make the restructured loan payments (at least six months of sustained performance after the modification
or one year for loans providing for quarterly or semi-annual payments) and management has concluded that it is probable that the
borrower would not be in payment default in the foreseeable future.
BPPR
Past Due 90 days or more [1]
(In thousands)
30-59 days
60-89 days
Past due 90
days or more
Total past
due
Current
Total
With Payment
Default
Without
Payment Default
Commercial multi-family
$
$
$
$
$
$
$
$
CRE non-owner occupied
CRE owner occupied
Commercial and industrial
Mortgage
Consumer:
Total
$
$
$
$
$
$
$
$
[1] Loans that were in non-accrual status at the time of modification are presented as past due until the borrower has demonstrated a willingness and ability
to make the restructured loan payments. Payment default is defined as a restructured loan becoming 90 days past due after being modified, foreclosed or
charged-off, whichever occurs first. The recorded investment as of period end is inclusive of all partial paydowns and charge-offs since the modification
date. Loans modified with financial difficulty that were fully paid down, charged-off or foreclosed upon by period end are not reported.
Popular U.S.
Past Due 90 days or more [1]
(In thousands)
30-59 days
60-89 days
Past due 90
days or more
Total past
due
Current
Total
With Payment
Default
Without
Payment Default
CRE owner occupied
$
$
$
$
$
$
$
$
Commercial and industrial
Construction
Mortgage
Consumer:
Total
$
$
$
$
$
$
$
$
[1] Loans that were in non-accrual status at the time of modification are presented as past due until the borrower has demonstrated a willingness and ability
to make the restructured loan payments. Payment default is defined as a restructured loan becoming 90 days past due after being modified, foreclosed or
charged-off, whichever occurs first. The recorded investment as of period end is inclusive of all partial paydowns and charge-offs since the modification
date. Loans modified with financial difficulty that were fully paid down, charged-off or foreclosed upon by period end are not reported.
174
Popular Inc.
Past Due 90 days or more [1]
(In thousands)
30-59 days
60-89 days
Past due 90
days or more
Total past
due
Current
Total
With Payment
Default
Without
Payment Default
Commercial multi-family
$
$
$
$
$
$
$
$
CRE non-owner occupied
CRE owner occupied
Commercial and industrial
Construction
Mortgage
Consumer:
Total
$
$
$
$
$
$
$
$
[1] Loans that were in non-accrual status at the time of modification are presented as past due until the borrower has demonstrated a willingness and ability
to make the restructured loan payments. Payment default is defined as a restructured loan becoming 90 days past due after being modified, foreclosed or
charged-off, whichever occurs first. The recorded investment as of period end is inclusive of all partial paydowns and charge-offs since the modification
date. Loans modified with financial difficulty that were fully paid down, charged-off or foreclosed upon by period end are not reported.
Payment default is defined as a restructured loan becoming 90 days past due after being modified, foreclosed or charged-off,
whichever occurs first. During the year ended December 31, 2023, the outstanding balance of loans modified for borrowers under
financial difficulties that were subject to payment default during the year ended preceding the default date was $
For the year ended December 31, 2023, extension of maturity and the combination of reduction of interest rate and extension of
maturity amounted to $
financial difficulties that were subject to payment default during the year preceding the default date.
Legacy TDR Modifications
A modification of a loan, prior to ASU 2022-02, constituted a troubled debt restructuring (TDR) when a borrower was experiencing
financial difficulty and the modification constituted a concession. For a summary of the legacy accounting policy related to TDRs,
refer to the Summary of Significant Accounting Policies included in Note 2 to the 2022 Form 10-K.
The outstanding balance of loans classified as TDRs amounted to $
commitments to lend additional funds to debtors owing receivables whose terms have been modified in TDRs amounted to $
million related to the commercial and construction loan portfolios at December 31, 2022.
The following table presents the outstanding balance of loans classified as TDRs according to their accruing status and the related
allowance at December 31, 2022.
175
December 31, 2022
(In thousands)
Accruing
Non-Accruing
Total
Related
Allowance
Loans held-in-portfolio:
$
$
$
$
[1]
Loans held-in-portfolio
$
$
$
$
[1] At December 31, 2022, accruing mortgage loan TDRs include $
The following table presents the loan count by type of modification for those loans modified in a TDR during the year ended
December 31, 2022. Loans modified as TDRs for the U.S. operations are considered insignificant to the Corporation.
Popular Inc.
For the year ended December 31, 2022
Reduction in interest
rate
Extension of maturity
date
Combination of reduction in
interest rate and extension of
maturity date
Other
Commercial real estate non-owner occupied
Commercial real estate owner occupied
Commercial and industrial
Mortgage
Leasing
Consumer:
Total
The following table presents, by class, quantitative information related to loans modified as TDRs during year ended December 31,
2022.
176
Popular, Inc.
For the year ended December 31, 2022
(Dollars in thousands)
Loan count
Pre-modification outstanding
recorded investment
Post-modification
outstanding recorded
investment
Increase (decrease) in the
allowance for loan losses as
a result of modification
Commercial real estate non-owner occupied
$
$
$
Commercial real estate owner occupied
(2,078 )
Commercial and industrial
Mortgage
Leasing
Consumer:
Total
$
$
$
The following table presents, by class, TDRs that were subject to payment default and that had been modified as a TDR during the
twelve months preceding the default date. Payment default is defined as a restructured loan becoming 90 days past due after being
modified, foreclosed or charged-off, whichever occurs first. The recorded investment as of period end is inclusive of all partial
paydowns and charge-offs since the modification date. Loans modified as a TDR that were fully paid down, charged-off or
foreclosed upon by period end are not reported.
Popular Inc.
Defaulted during the year ended December 31, 2022
(Dollars in thousands)
Loan count
Recorded investment as of first default date
Commercial real estate owner occupied
$
Commercial and industrial
Mortgage
Leasing
Consumer:
Total
$
177
Commercial, consumer and mortgage loans modified in a TDR are closely monitored for delinquency as an early indicator of
possible future default. If loans modified in a TDR subsequently default, the allowance for credit losses may be increased or partial
charge-offs may be taken to further write-down the carrying value of the loan.
Credit Quality
The Corporation has defined a risk rating system to assign a rating to all credit exposures, particularly for the commercial and
construction loan portfolios. Risk ratings in the aggregate provide the Corporation’s management the asset quality profile for the
loan portfolio. The risk rating system provides for the assignment of ratings at the obligor level based on the financial condition of the
borrower. The risk rating analysis process is performed at least once a year or more frequently if events or conditions change which
may deteriorate the credit quality. In the case of consumer and mortgage loans, these loans are classified considering their
delinquency status at the end of the reporting period.
The Corporation’s obligor risk rating scales range from rating 1 (Excellent) to rating 14 (Loss). The obligor risk rating reflects the risk
of payment default of a borrower in the ordinary course of business.
Pass Credit Classifications:
Pass (Scales 1 through 8) – Loans classified as pass have a well defined primary source of repayment, with no apparent
risk, strong financial position, minimal operating risk, profitability, liquidity and strong capitalization.
Watch (Scale 9) – Loans classified as watch have acceptable business credit, but borrower’s operations, cash flow or
financial condition evidence more than average risk, requires above average levels of supervision and attention from Loan
Officers.
Special Mention (Scale 10) - Loans classified as special mention have potential weaknesses that deserve management’s
close attention. If left uncorrected, these potential weaknesses may result in deterioration of the repayment prospects for
the loan or of the Corporation’s credit position at some future date.
Adversely Classified Classifications:
Substandard (Scales 11 and 12) - Loans classified as substandard are deemed to be inadequately protected by the
current net worth and payment capacity of the obligor or of the collateral pledged, if any. Loans classified as such have
well-defined weaknesses that jeopardize the liquidation of the debt. They are characterized by the distinct possibility that
the institution will sustain some loss if the deficiencies are not corrected.
Doubtful (Scale 13) - Loans classified as doubtful have all the weaknesses inherent in those classified as substandard,
with the additional characteristic that the weaknesses make the collection or liquidation in full, on the basis of currently
existing facts, conditions, and values, highly questionable and improbable.
Loss (Scale 14) - Uncollectible and of such little value that continuance as a bankable asset is not warranted. This
classification does not mean that the asset has absolutely no recovery or salvage value, but rather it is not practical or
desirable to defer writing off this asset even though partial recovery may be effected in the future.
Risk ratings scales 10 through 14 conform to regulatory ratings. The assignment of the obligor risk rating is based on relevant
information about the ability of borrowers to service their debts such as current financial information, historical payment experience,
credit documentation, public information, and current economic trends, among other factors.
The following tables present the amortized cost basis, net of unearned income, of loans held-in-portfolio based on the Corporation’s
assignment of obligor risk ratings as defined at December 31, 2023 and 2022 by vintage year.
178
December 31, 2023
Term Loans
Revolving
Loans
Amortized
Cost Basis
Revolving
Loans
Converted to
Term Loans
Amortized
Cost Basis
Amortized Cost Basis by Origination Year
(In thousands)
2023
2022
2021
2020
2019
Prior
Years
Total
BPPR
Commercial:
Commercial multi-family
Watch
$
$
$
$
$
$
$
$
$
Special Mention
Substandard
Pass
Total commercial
multi-family
$
$
$
$
$
$
$
$
$
Commercial real estate non-owner occupied
Watch
$
$
$
$
$
$
$
$
$
Special Mention
Substandard
Pass
Total commercial
real estate non-
owner occupied
$
$
$
$
$
$
$
$
$
Year-to-Date gross
write-offs
$
$
$
$
$
$
$
$
$
Commercial real estate owner occupied
Watch
$
$
$
$
$
$
$
$
$
Special Mention
Substandard
Doubtful
Pass
Total commercial
real estate owner
occupied
$
$
$
$
$
$
$
$
$
Year-to-Date gross
write-offs
$
$
$
$
$
$
$
$
$
Commercial and industrial
Watch
$
$
$
$
$
$
$
$
$
Special Mention
Substandard
Doubtful
Pass
Total commercial
and industrial
$
$
$
$
$
$
$
$
$
Year-to-Date gross
write-offs
$
$
$
$
$
$
$
$
$
Construction
Watch
$
$
$
$
$
$
$
$
$
Special Mention
Substandard
$
Pass
Total construction
$
$
$
$
$
$
$
$
$
Year-to-Date gross
write-offs
$
$
$
$
$
$
$
$
$
Mortgage
Substandard
$
$
$
$
$
$
$
$
$
Pass
Total mortgage
$
$
$
$
$
$
$
$
$
Year-to-Date gross
write-offs
$
$
$
$
$
$
$
$
$
179
December 31, 2023
Term Loans
Revolving
Loans
Amortized
Cost Basis
Revolving
Loans
Converted to
Term Loans
Amortized
Cost Basis
Amortized Cost Basis by Origination Year
(In thousands)
2023
2022
2021
2020
2019
Prior
Years
Total
BPPR
Leasing
Substandard
$
$
$
$
$
$
$
$
$
Loss
Pass
Total leasing
$
$
$
$
$
$
$
$
$
Year-to-Date gross
write-offs
$
$
$
$
$
$
$
$
$
Consumer:
Credit cards
Substandard
$
$
$
$
$
$
$
$
$
Loss
Pass
Total credit cards
$
$
$
$
$
$
$
$
$
Year-to-Date gross
write-offs
$
$
$
$
$
$
$
$
$
HELOCs
Substandard
$
$
$
$
$
$
$
$
$
Pass
$
$
$
$
$
$
$
$
$
Total HELOCs
$
$
$
$
$
$
$
$
$
Year-to-Date gross
write-offs
$
$
$
$
$
$
$
$
$
Personal
Substandard
$
$
$
$
$
$
$
$
$
Loss
Pass
Total Personal
$
$
$
$
$
$
$
$
$
Year-to-Date gross
write-offs
$
$
$
$
$
$
$
$
$
Auto
Substandard
$
$
$
$
$
$
$
$
$
Loss
Pass
Total Auto
$
$
$
$
$
$
$
$
$
Year-to-Date gross
write-offs
$
$
$
$
$
$
$
$
$
Other consumer
Substandard
$
$
$
$
$
$
$
$
$
Loss
Pass
Total Other
consumer
$
$
$
$
$
$
$
$
$
Year-to-Date gross
write-offs
$
$
$
$
$
$
$
$
$
Total BPPR
$
$
$
$
$
$
$
$
$
180
December 31, 2023
Term Loans
Revolving
Loans
Amortized
Cost Basis
Revolving
Loans
Converted to
Term Loans
Amortized
Cost Basis
Amortized Cost Basis by Origination Year
(In thousands)
2023
2022
2021
2020
2019
Prior
Years
Total
Popular U.S.
Commercial:
Commercial multi-family
Watch
$
$
$
$
$
$
$
$
$
Special Mention
Substandard
Pass
Total commercial
multi-family
$
$
$
$
$
$
$
$
$
Commercial real estate non-owner occupied
Watch
$
$
$
$
$
$
$
$
$
Special Mention
Substandard
Pass
Total commercial
real estate non-
owner occupied
$
$
$
$
$
$
$
$
$
Year-to-Date gross
write-offs
$
$
$
$
$
$
$
$
$
Commercial real estate owner occupied
Watch
$
$
$
$
$
$
$
$
$
Special Mention
Substandard
Pass
Total commercial
real estate owner
occupied
$
$
$
$
$
$
$
$
$
Year-to-Date gross
write-offs
$
$
$
$
$
$
$
$
$
Commercial and industrial
Watch
$
$
$
$
$
$
$
$
$
Special Mention
Substandard
Pass
Total commercial
and industrial
$
$
$
$
$
$
$
$
$
Year-to-Date gross
write-offs
$
$
$
$
$
$
$
$
$
Construction
Watch
$
$
$
$
$
$
$
$
$
Special Mention
Substandard
Pass
Total construction
$
$
$
$
$
$
$
$
$
Mortgage
Substandard
$
$
$
$
$
$
$
$
$
Pass
Total mortgage
$
$
$
$
$
$
$
$
$
181
December 31, 2023
Term Loans
Revolving
Loans
Amortized
Cost Basis
Revolving
Loans
Converted to
Term Loans
Amortized
Cost Basis
Amortized Cost Basis by Origination Year
(In thousands)
2023
2022
2021
2020
2019
Prior
Years
Total
Popular U.S.
Consumer:
Credit cards
Pass
$
$
$
$
$
$
$
$
$
Total credit cards
$
$
$
$
$
$
$
$
$
Year-to-Date gross
write-offs
$
$
$
$
$
$
$
$
$
HELOCs
Substandard
$
$
$
$
$
$
$
$
$
Loss
Pass
Total HELOCs
$
$
$
$
$
$
$
$
$
Year-to-Date gross
write-offs
$
$
$
$
$
$
$
$
$
Personal
Substandard
$
$
$
$
$
$
$
$
$
Loss
Pass
Total Personal
$
$
$
$
$
$
$
$
$
Year-to-Date gross
write-offs
$
$
$
$
$
$
$
$
$
Other consumer
Substandard
$
$
$
$
$
$
$
$
$
Pass
Total Other
consumer
$
$
$
$
$
$
$
$
$
Year-to-Date gross
write-offs
$
$
$
$
$
$
$
$
$
Total Popular U.S.
$
$
$
$
$
$
$
$
$
182
December 31, 2023
Term Loans
Revolving
Loans
Amortized
Cost Basis
Revolving
Loans
Converted to
Term Loans
Amortized
Cost Basis
Amortized Cost Basis by Origination Year
(In thousands)
2023
2022
2021
2020
2019
Prior
Years
Total
Popular, Inc.
Commercial:
Commercial multi-family
Watch
$
$
$
$
$
$
$
$
$
Special Mention
Substandard
Pass
Total commercial
multi-family
$
$
$
$
$
$
$
$
$
Commercial real estate non-owner occupied
Watch
$
$
$
$
$
$
$
$
$
Special Mention
Substandard
Pass
Total commercial
real estate non-
owner occupied
$
$
$
$
$
$
$
$
$
Year-to-Date gross
write-offs
$
$
$
$
$
$
$
$
$
Commercial real estate owner occupied
Watch
$
$
$
$
$
$
$
$
$
Special Mention
Substandard
Doubtful
Pass
Total commercial
real estate owner
occupied
$
$
$
$
$
$
$
$
$
Year-to-Date gross
write-offs
$
$
$
$
$
$
$
$
$
Commercial and industrial
Watch
$
$
$
$
$
$
$
$
$
Special Mention
Substandard
Doubtful
Pass
Total commercial
and industrial
$
$
$
$
$
$
$
$
$
Year-to-Date gross
write-offs
$
$
$
$
$
$
$
$
$
183
December 31, 2023
Term Loans
Revolving
Loans
Amortized
Cost Basis
Revolving
Loans
Converted to
Term Loans
Amortized
Cost Basis
Amortized Cost Basis by Origination Year
(In thousands)
2023
2022
2021
2020
2019
Prior
Years
Total
Popular, Inc.
Construction
Watch
$
$
$
$
$
$
$
$
$
Special Mention
Substandard
Pass
Total construction
$
$
$
$
$
$
$
$
$
Year-to-Date gross
write-offs
$
$
$
$
$
$
$
$
$
Mortgage
Substandard
$
$
$
$
$
$
$
$
$
Pass
Total mortgage
$
$
$
$
$
$
$
$
$
Year-to-Date gross
write-offs
$
$
$
$
$
$
$
$
$
Leasing
Substandard
$
$
$
$
$
$
$
$
$
Loss
Pass
Total leasing
$
$
$
$
$
$
$
$
$
Year-to-Date gross
write-offs
$
$
$
$
$
$
$
$
$
184
December 31, 2023
Term Loans
Revolving
Loans
Amortized
Cost Basis
Revolving
Loans
Converted to
Term Loans
Amortized
Cost Basis
Amortized Cost Basis by Origination Year
(In thousands)
2023
2022
2021
2020
2019
Prior
Years
Total
Popular, Inc.
Consumer:
Credit cards
Substandard
$
$
$
$
$
$
$
$
$
Loss
Pass
Total credit cards
$
$
$
$
$
$
$
$
$
Year-to-Date gross
write-offs
$
$
$
$
$
$
$
$
$
HELOCs
Substandard
$
$
$
$
$
$
$
$
$
Loss
Pass
Total HELOCs
$
$
$
$
$
$
$
$
$
Year-to-Date gross
write-offs
$
$
$
$
$
$
$
$
$
Personal
Substandard
$
$
$
$
$
$
$
$
$
Loss
Pass
Total Personal
$
$
$
$
$
$
$
$
$
Year-to-Date gross
write-offs
$
$
$
$
$
$
$
$
$
Auto
Substandard
$
$
$
$
$
$
$
$
$
Loss
Pass
Total Auto
$
$
$
$
$
$
$
$
$
Year-to-Date gross
write-offs
$
$
$
$
$
$
$
$
$
Other consumer
Substandard
$
$
$
$
$
$
$
$
$
Loss
Pass
Total Other
consumer
$
$
$
$
$
$
$
$
$
Year-to-Date gross
write-offs
$
$
$
$
$
$
$
$
$
Total Popular Inc.
$
$
$
$
$
$
$
$
$
185
December 31, 2022
Term Loans
Revolving
Loans
Amortized
Cost Basis
Revolving
Loans
Converted to
Term Loans
Amortized
Cost Basis
Amortized Cost Basis by Origination Year
(In thousands)
2022
2021
2020
2019
2018
Prior
Years
Total
BPPR
Commercial:
Commercial multi-family
Watch
$
$
$
$
$
$
$
$
$
Special Mention
Substandard
Pass
Total commercial
multi-family
$
$
$
$
$
$
$
$
$
Commercial real estate non-owner occupied
Watch
$
$
$
$
$
$
$
$
$
Special Mention
Substandard
Pass
Total commercial
real estate non-
owner occupied
$
$
$
$
$
$
$
$
$
Commercial real estate owner occupied
Watch
$
$
$
$
$
$
$
$
$
Special Mention
Substandard
Doubtful
Pass
Total commercial
real estate owner
occupied
$
$
$
$
$
$
$
$
$
Commercial and industrial
Watch
$
$
$
$
$
$
$
$
$
Special Mention
Substandard
Doubtful
Loss
Pass
Total commercial
and industrial
$
$
$
$
$
$
$
$
$
Construction
Watch
$
$
$
$
$
$
$
$
$
Substandard
Pass
Total construction
$
$
$
$
$
$
$
$
$
Mortgage
Substandard
$
$
$
$
$
$
$
$
$
Pass
Total mortgage
$
$
$
$
$
$
$
$
$
Leasing
Substandard
$
$
$
$
$
$
$
$
$
Loss
Pass
Total leasing
$
$
$
$
$
$
$
$
$
186
December 31, 2022
Term Loans
Revolving
Loans
Amortized
Cost Basis
Revolving
Loans
Converted to
Term Loans
Amortized
Cost Basis
Amortized Cost Basis by Origination Year
(In thousands)
2022
2021
2020
2019
2018
Prior
Years
Total
BPPR
Consumer:
Credit cards
Substandard
$
$
$
$
$
$
$
$
$
Loss
Pass
Total credit cards
$
$
$
$
$
$
$
$
$
HELOCs
Pass
$
$
$
$
$
$
$
$
$
Total HELOCs
$
$
$
$
$
$
$
$
$
Personal
Substandard
$
$
$
$
$
$
$
$
$
Loss
Pass
Total Personal
$
$
$
$
$
$
$
$
$
Auto
Substandard
$
$
$
$
$
$
$
$
$
Loss
Pass
Total Auto
$
$
$
$
$
$
$
$
$
Other consumer
Substandard
$
$
$
$
$
$
$
$
$
Loss
Pass
Total Other
consumer
$
$
$
$
$
$
$
$
$
Total BPPR
$
$
$
$
$
$
$
$
$
187
December 31, 2022
Term Loans
Revolving
Loans
Amortized
Cost Basis
Revolving
Loans
Converted to
Term Loans
Amortized
Cost Basis
Amortized Cost Basis by Origination Year
(In thousands)
2022
2021
2020
2019
2018
Prior
Years
Total
Popular U.S.
Commercial:
Commercial multi-family
Watch
$
$
$
$
$
$
$
$
$
Special Mention
Substandard
Pass
Total commercial
multi-family
$
$
$
$
$
$
$
$
$
Commercial real estate non-owner occupied
Watch
$
$
$
$
$
$
$
$
$
Special Mention
Substandard
Pass
Total commercial
real estate non-
owner occupied
$
$
$
$
$
$
$
$
$
Commercial real estate owner occupied
Watch
$
$
$
$
$
$
$
$
$
Special Mention
Substandard
Pass
Total commercial
real estate owner
occupied
$
$
$
$
$
$
$
$
$
Commercial and industrial
Watch
$
$
$
$
$
$
$
$
$
Special Mention
Substandard
Loss
Pass
Total commercial
and industrial
$
$
$
$
$
$
$
$
$
Construction
Watch
$
$
$
$
$
$
$
$
$
Special Mention
Substandard
Pass
Total construction
$
$
$
$
$
$
$
$
$
Mortgage
Substandard
$
$
$
$
$
$
$
$
$
Pass
Total mortgage
$
$
$
$
$
$
$
$
$
188
December 31, 2022
Term Loans
Revolving
Loans
Amortized
Cost Basis
Revolving
Loans
Converted to
Term Loans
Amortized
Cost Basis
Amortized Cost Basis by Origination Year
(In thousands)
2022
2021
2020
2019
2018
Prior
Years
Total
Popular U.S.
Consumer:
Credit cards
Pass
$
$
$
$
$
$
$
$
$
Total credit cards
$
$
$
$
$
$
$
$
$
HELOCs
Substandard
$
$
$
$
$
$
$
$
$
Loss
Pass
Total HELOCs
$
$
$
$
$
$
$
$
$
Personal
Substandard
$
$
$
$
$
$
$
$
$
Loss
Pass
Total Personal
$
$
$
$
$
$
$
$
$
Other consumer
Substandard
$
$
$
$
$
$
$
$
$
Pass
Total Other
consumer
$
$
$
$
$
$
$
$
$
Total Popular U.S.
$
$
$
$
$
$
$
$
$
189
December 31, 2022
Term Loans
Revolving
Loans
Amortized
Cost Basis
Revolving
Loans
Converted to
Term Loans
Amortized
Cost Basis
Amortized Cost Basis by Origination Year
(In thousands)
2022
2021
2020
2019
2018
Prior
Years
Total
Popular, Inc.
Commercial:
Commercial multi-family
Watch
$
$
$
$
$
$
$
$
$
Special Mention
Substandard
Pass
Total commercial
multi-family
$
$
$
$
$
$
$
$
$
Commercial real estate non-owner occupied
Watch
$
$
$
$
$
$
$
$
$
Special Mention
Substandard
Pass
Total commercial
real estate non-
owner occupied
$
$
$
$
$
$
$
$
$
Commercial real estate owner occupied
Watch
$
$
$
$
$
$
$
$
$
Special Mention
Substandard
Doubtful
Pass
Total commercial
real estate owner
occupied
$
$
$
$
$
$
$
$
$
Commercial and industrial
Watch
$
$
$
$
$
$
$
$
$
Special Mention
Substandard
Doubtful
Loss
Pass
Total commercial
and industrial
$
$
$
$
$
$
$
$
$
190
December 31, 2022
Term Loans
Revolving
Loans
Amortized
Cost Basis
Revolving
Loans
Converted to
Term Loans
Amortized
Cost Basis
Amortized Cost Basis by Origination Year
(In thousands)
2022
2021
2020
2019
2018
Prior
Years
Total
Popular, Inc.
Construction
Watch
$
$
$
$
$
$
$
$
$
Special Mention
Substandard
Pass
Total construction
$
$
$
$
$
$
$
$
$
Mortgage
Substandard
$
$
$
$
$
$
$
$
$
Pass
Total mortgage
$
$
$
$
$
$
$
$
$
Leasing
Substandard
$
$
$
$
$
$
$
$
$
Loss
Pass
Total leasing
$
$
$
$
$
$
$
$
$
191
December 31, 2022
Term Loans
Revolving
Loans
Amortized
Cost Basis
Revolving
Loans
Converted to
Term Loans
Amortized
Cost Basis
Amortized Cost Basis by Origination Year
(In thousands)
2022
2021
2020
2019
2018
Prior
Years
Total
Popular, Inc.
Consumer:
Credit cards
Substandard
$
$
$
$
$
$
$
$
$
Loss
Pass
Total credit cards
$
$
$
$
$
$
$
$
$
HELOCs
Substandard
$
$
$
$
$
$
$
$
$
Loss
Pass
Total HELOCs
$
$
$
$
$
$
$
$
$
Personal
Substandard
$
$
$
$
$
$
$
$
$
Loss
Pass
Total Personal
$
$
$
$
$
$
$
$
$
Auto
Substandard
$
$
$
$
$
$
$
$
$
Loss
Pass
Total Auto
$
$
$
$
$
$
$
$
$
Other consumer
Substandard
$
$
$
$
$
$
$
$
$
Loss
Pass
Total Other
consumer
$
$
$
$
$
$
$
$
$
Total Popular Inc.
$
$
$
$
$
$
$
$
$
192
Note 10 – Mortgage banking activities
Income from mortgage banking activities includes mortgage servicing fees earned in connection with administering residential
mortgage loans and valuation adjustments on mortgage servicing rights. It also includes gain on sales and securitizations of
residential mortgage loans, losses on repurchased loans, including interest advances, and trading gains and losses on derivative
contracts used to hedge the Corporation’s securitization activities. In addition, fair value valuation adjustments to residential
mortgage loans held for sale, if any, are recorded as part of the mortgage banking activities.
The following table presents the components of mortgage banking activities:
Years ended December 31,
(In thousands)
2023
2022
2021
Mortgage servicing fees, net of fair value adjustments:
Mortgage servicing fees
$
$
$
Mortgage servicing rights fair value adjustments
(11,589 )
(10,206 )
Total mortgage servicing fees, net of fair value adjustments
Net (loss) gain on sale of loans, including valuation on loans held for sale
(88 )
(251 )
Trading account profit:
Unrealized loss on outstanding derivative positions
(138 )
Realized gains on closed derivative positions
Total trading account profit
Losses on repurchased loans, including interest advances [1]
(283 )
(657 )
(773 )
Total mortgage banking activities
$
$
$
[1]
Effective on January 1, 2023, loans held-for-sale are stated at fair value. Prior to such date, loans held-for-sale were stated at lower -of-cost-or-
market.
193
Note 11 – Transfers of financial assets and mortgage servicing assets
The Corporation typically transfers conforming residential mortgage loans in conjunction with GNMA, FNMA and FHLMC
securitization transactions whereby the loans are exchanged for cash or securities and servicing rights. As seller, the Corporation
has made certain representations and warranties with respect to the originally transferred loans and, in the past, has sold certain
loans with credit recourse to a government-sponsored entity, namely FNMA. Refer to Note 23 to the Consolidated Financial
Statements for a description of such arrangements.
did not contain any credit recourse arrangements.
The following tables present the initial fair value of the assets obtained as proceeds from residential mortgage loans securitized
during the years ended December 31, 2023 and 2022:
Proceeds Obtained During the Year Ended December 31, 2023
(In thousands)
Level 1
Level 2
Level 3
Initial fair value
Assets
Trading account debt securities:
Mortgage-backed securities - GNMA
$
$
$
$
Mortgage-backed securities - FNMA
Total trading account debt securities
$
$
$
$
Mortgage servicing rights
$
$
$
$
Total
$
$
$
$
Proceeds Obtained During the Year Ended December 31, 2022
(In thousands)
Level 1
Level 2
Level 3
Initial fair value
Assets
Trading account debt securities:
Mortgage-backed securities - GNMA
$
$
$
$
Mortgage-backed securities - FNMA
Mortgage-backed securities - FHLMC
Total trading account debt securities
$
$
$
$
Mortgage servicing rights
$
$
$
$
Total
$
$
$
$
During the year ended December 31, 2023, the Corporation retained servicing rights on whole loan sales involving approximately
$
million). All loan sales performed during the years ended December 31, 2023 and 2022 were without credit recourse agreements.
The Corporation recognizes as assets the rights to service loans for others, whether these rights are purchased or result from asset
transfers such as sales and securitizations. These mortgage servicing rights (“MSRs”) are measured at fair value.
The Corporation uses a discounted cash flow model to estimate the fair value of MSRs. The discounted cash flow model
incorporates assumptions that market participants would use in estimating future net servicing income, including estimates of
prepayment speeds, discount rate, cost to service, escrow account earnings, contractual servicing fee income, prepayment and late
fees, among other considerations. Prepayment speeds are adjusted for the loans’ characteristics and portfolio behavior.
The following table presents the changes in MSRs measured using the fair value method for the years ended December 31, 2023
and 2022.
194
Residential MSRs
(In thousands)
December 31, 2023
December 31, 2022
Fair value at beginning of period
$
$
Additions
Changes due to payments on loans
(9,934 )
(11,063 )
Reduction due to loan repurchases
(606 )
(779 )
Changes in fair value due to changes in valuation model inputs or assumptions
(529 )
Other
(1,269 )
(837 )
Fair value at end of period
$
$
[1] Represents changes due to collection / realization of expected cash flows over time.
[2] At December 31, 2023, PB had MSRs amounting to $
During the quarter ended June 30, 2023 the Corporation terminated a servicing agreement, in which it acted as sub-servicer for a
third party, for a portfolio with an unpaid principal balance of approximately $
approximately $
Residential mortgage loans serviced for others were $
Net mortgage servicing fees, a component of mortgage banking activities in the Consolidated Statements of Operations, include the
changes from period to period in the fair value of the MSRs, including changes due to collection / realization of expected cash flows.
The banking subsidiaries receive servicing fees based on a percentage of the outstanding loan balance. These servicing fees are
credited to income when they are collected. At December 31, 2023, those weighted average mortgage servicing fees were
%
(2022 –
%). Under these servicing agreements, the banking subsidiaries do not generally earn significant prepayment penalty
fees on the underlying loans serviced.
The section below includes information on assumptions used in the valuation model of the MSRs, originated and purchased. Key
economic assumptions used in measuring the servicing rights derived from loans securitized or sold by the Corporation during the
years ended December 31, 2023 and 2022 were as follows:
Years ended
December 31, 2023
December 31, 2022
BPPR
PB
BPPR
PB
Prepayment speed
%
%
%
%
Weighted average life (in years)
Discount rate (annual rate)
%
%
%
%
Key economic assumptions used to estimate the fair value of MSRs derived from sales and securitizations of mortgage loans
performed by the banking subsidiaries and servicing rights purchased from other financial institutions, and the sensitivity to
immediate changes in those assumptions, were as follows as of the end of the periods reported:
195
Originated MSRs
Purchased MSRs
December 31,
December 31,
December 31,
December 31,
(In thousands)
2023
2022
2023
2022
Fair value of servicing rights
$
$
$
$
Weighted average life (in years)
Weighted average prepayment speed (annual rate)
%
%
%
%
Impact on fair value of 10% adverse change
$
(696 )
$
(730 )
$
(1,440 )
$
(1,602 )
Impact on fair value of 20% adverse change
$
(1,365 )
$
(1,433 )
$
(2,827 )
$
(3,143 )
Weighted average discount rate (annual rate)
%
%
%
%
Impact on fair value of 10% adverse change
$
(1,387 )
$
(1,485 )
$
(2,871 )
$
(3,256 )
Impact on fair value of 20% adverse change
$
(2,686 )
$
(2,876 )
$
(5,562 )
$
(6,304 )
At December 31, 2023, the Corporation serviced $
to the Corporation, from which $
on changes in the Corporation’s liability of estimated losses related to loans serviced with credit recourse.
Under the GNMA securitizations, the Corporation, as servicer, has the right to repurchase (but not the obligation), at its option and
without GNMA’s prior authorization, any loan that is collateral for a GNMA guaranteed mortgage-backed security when certain
delinquency criteria are met. At the time that individual loans meet GNMA’s specified delinquency criteria and are eligible for
repurchase, the Corporation is deemed to have regained effective control over these loans if the Corporation was the pool issuer. At
December 31, 2023, the Corporation had recorded $
Condition related to this buy-back option program (2022 - $
forbearance programs but continue to reflect the contractual delinquency until the borrower repays deferred payments or completes
a payment deferral modification or other borrower assistance alternative. As long as the Corporation continues to service the loans
that continue to be collateral in a GNMA guaranteed mortgage-backed security, the MSR is recognized by the Corporation.
During the year ended December 31, 2023, the Corporation repurchased approximately $
GNMA servicing portfolio (2022 - $
the transaction, which results in a reduction of the servicing costs for these severely delinquent loans, mostly related to principal and
interest advances. The risk associated with the loans is reduced due to their guaranteed nature. The Corporation may place these
loans under modification programs offered by FHA, VA or United States Department of Agriculture (USDA) or other loss mitigation
programs offered by the Corporation, and once brought back to current status, these may be either retained in portfolio or re-sold in
the secondary market.
196
Note 12 - Premises and equipment
Premises and equipment are stated at cost less accumulated depreciation and amortization as follows:
(In thousands)
Useful life in years
2023
2022
Premises and equipment:
Land
$
$
Buildings
10-50
Equipment
2-10
Leasehold improvements
3-10
Subtotal
Construction in progress
Premises and equipment, net
$
$
Depreciation and amortization of premises and equipment for the year 2023 was $
million), of which $
(2022 - $
Occupancy expense of premises and equipment is net of rental income of $
For information related to the amortization expense of finance leases, refer to Note 33 - Leases.
197
Note 13 – Other real estate owned
The following tables present the activity related to Other Real Estate Owned (“OREO”), for the years ended December 31, 2023,
2022 and 2021.
For the year ended December 31, 2023
OREO
OREO
(In thousands)
Commercial/Construction
Mortgage
Total
Balance at beginning of period
$
$
$
Write-downs in value
(607 )
(2,179 )
(2,786 )
Additions
Sales
(3,428 )
(73,548 )
(76,976 )
Other adjustments
(254 )
(237 )
Ending balance
$
$
$
For the year ended December 31, 2022
OREO
OREO
(In thousands)
Commercial/Construction
Mortgage
Total
Balance at beginning of period
$
$
$
Write-downs in value
(959 )
(1,517 )
(2,476 )
Additions
Sales
(7,453 )
(61,453 )
(68,906 )
Other adjustments
(533 )
(425 )
Ending balance
$
$
$
For the year ended December 31, 2021
OREO
OREO
(In thousands)
Commercial/ Construction
Mortgage
Total
Balance at beginning of period
$
$
$
Write-downs in value
(1,058 )
(2,161 )
(3,219 )
Additions
Sales
(7,282 )
(52,666 )
(59,948 )
Other adjustments
(943 )
(546 )
Ending balance
$
$
$
198
Note 14 − Other assets
The caption of other assets in the consolidated statements of financial condition consists of the following major categories:
(In thousands)
December 31, 2023
December 31, 2022
Net deferred tax assets (net of valuation allowance)
$
$
Investments under the equity method
Prepaid taxes
Other prepaid expenses
Capitalized software costs
Derivative assets
Trades receivable from brokers and counterparties
Receivables from investments maturities
Principal, interest and escrow servicing advances
Guaranteed mortgage loan claims receivable
Operating ROU assets (Note 33)
Finance ROU assets (Note 33)
Assets for pension benefit
Others
Total other assets
$
$
The Corporation regularly incurs in capitalizable costs associated with software development or licensing which are recorded within
the Other Assets line item in the accompanying Consolidated Statements of Financial Condition. In addition, the Corporation incurs
costs associated with hosting arrangements that are service contracts that are also recorded within Other Assets. The hosting
arrangements can include capitalizable implementation costs that are amortized during the term of the hosting arrangement.
The
following table summarizes the composition of acquired or developed software costs as well as costs related to hosting
arrangements:
Gross Carrying
Accumulated
Net
Carrying
(In thousands)
Amount
Amortization
Value
December 31, 2023
Software development costs
$
$
$
Software license costs
Cloud computing arrangements
Total Capitalized software costs [1] [2]
$
$
$
December 31, 2022
Software development costs
$
$
$
Software license costs
Cloud computing arrangements
Total Capitalized software costs [1] [2]
$
$
$
[1]
Software intangible assets are presented as part of Other Assets in the Consolidated Statements of Financial Condition.
[2]
The tables above excludes assets that have been fully amortized.
Total amortization expense for all capitalized software and hosting arrangement cost, reflected as part of technology and software
expenses in the consolidated statement of operations, is as follows:
Year ended December 31,
(In thousands)
2023
2022
2021
Software development and license costs
$
$
$
Cloud computing arrangements
Total amortization expense
$
$
$
199
Note 15 – Goodwill and other intangible assets
The changes in the carrying amount of goodwill for the year ended December 31, 2023 and 2022, allocated by reportable segments,
were as follows (refer to Note 37 for the definition of the Corporation’s reportable segments):
December 31, 2023
Balance at
Goodwill on
Goodwill
Balance at
(In thousands)
January 1, 2023
impairment
December 31, 2023
Banco Popular de Puerto Rico
$
$
$
$
Popular U.S.
(23,000 )
Total Popular, Inc.
$
$
$
(23,000 )
$
December 31, 2022
Balance at
Goodwill on
Goodwill
Balance at
(In thousands)
January 1, 2022
impairment
December 31, 2022
Banco Popular de Puerto Rico
$
$
$
$
Popular U.S.
(9,000 )
Total Popular, Inc.
$
$
$
(9,000 )
$
The goodwill recognized during the year ended December 31, 2022 in the reportable segment of Banco Popular de Puerto Rico of
$
information related to the assets acquired and liabilities assumed as a result of business combinations, including goodwill and other
intangible assets.
The following table reflects the components of other intangible assets subject to amortization:
Other intangible assets
Gross
Net
Carrying
Accumulated
Carrying
(In thousands)
Amount
Amortization
Value
December 31, 2023
Core deposits
$
$
$
Other customer relationships
Total other intangible assets
$
$
$
December 31, 2022
Core deposits
$
$
$
Other customer relationships
Total other intangible assets
$
$
$
During the year ended December 31, 2023, the Corporation recognized $
intangible assets with definite useful lives (2022 - $
The following table presents the estimated amortization of the intangible assets with definite useful lives for each of the following
periods:
200
(In thousands)
Year 2024
$
Year 2025
Year 2026
Year 2027
Year 2028
Later years
Results of the Annual Goodwill Impairment Test
The Corporation’s goodwill and other identifiable intangible assets having an indefinite useful life are tested for impairment, at least
annually and on a more frequent basis if events or circumstances indicate impairment could have taken place. Such events could
include, among others, a significant adverse change in the business climate, an adverse action by a regulator, an unanticipated
change in the competitive environment and a decision to change the operations or dispose of a reporting unit.
Management monitors events or changes in circumstances between annual tests to determine if these events or changes in
circumstances would more likely than not reduce the fair value of its reporting units below their carrying amounts.
The Corporation performed the annual goodwill impairment evaluation for the entire organization during the third quarter of 2023
using July 31, 2023 as the annual evaluation date. The reporting units utilized for this evaluation were those that are one level below
the business segments, which are the legal entities within the reportable segment. The Corporation follows push-down accounting,
as such all goodwill is assigned to the reporting units when carrying out a business combination.
In determining the fair value of each reporting unit, the Corporation generally uses a combination of methods, including market price
multiples of comparable companies and transactions, as well as discounted cash flow analysis. Management evaluates the
particular circumstances of each reporting unit in order to determine the most appropriate valuation methodology and the weights
applied to each valuation methodology, as applicable. The Corporation evaluates the results obtained under each valuation
methodology to identify and understand the key value drivers in order to ascertain that the results obtained are reasonable and
appropriate under the circumstances. Elements considered include current market and economic conditions, developments in
specific lines of business, and any particular features in the individual reporting units.
The computations require management to make estimates and assumptions. Critical assumptions that are used as part of these
evaluations include:
●
●
●
●
●
For purposes of the market comparable companies’ approach, valuations were determined by calculating average price multiples of
relevant value drivers from a group of companies that are comparable to the reporting unit being analyzed and applying those price
multiples to the value drivers of the reporting unit. Management uses judgment in the determination of which value drivers are
considered more appropriate for each reporting unit. Comparable companies’ price multiples represent minority-based multiples and
thus, a control premium adjustment is added to the comparable companies’ market multiples applied to the reporting unit’s value
drivers.
For purposes of the market comparable transactions’ approach, valuations had been previously determined by the Corporation by
calculating average price multiples of relevant value drivers from a group of transactions for which the target companies are
comparable to the reporting unit being analyzed and applying those price multiples to the value drivers of the reporting unit.
For purposes of the discounted cash flows (“DCF”) approach, the valuation is based on estimated future cash flows. The financial
projections used in the DCF valuation analysis for each reporting unit are based on the most recent (as of the valuation date)
financial projections presented to the Corporation’s Asset / Liability Management Committee (“ALCO”). The growth assumptions
201
included in these projections are based on management’s expectations for each reporting unit’s financial prospects considering
economic and industry conditions as well as particular plans of each entity (i.e. restructuring plans, de-leveraging, etc.). The cost of
equity used to discount the cash flows was calculated using the Ibbotson Build-Up Method and ranged from
% to
% for
the 2023 analysis. The Ibbotson Build-Up Method builds up a cost of equity starting with the rate of return of a “risk-free” asset (20-
year U.S. Treasury note) and adds to it additional risk elements such as equity risk premium, size premium, industry risk premium,
and a specific geographic risk premium (as applicable). The resulting discount rates were analyzed in terms of reasonability given
the current market conditions.
The results of the BPPR annual goodwill impairment test as of July 31, 2023 indicated that the average estimated fair value using all
valuation methodologies exceeded BPPR’s equity value by approximately $
% compared to $
%, for
the annual goodwill impairment test completed as of July 31, 2022. PB’s annual goodwill impairment test results as of such dates
indicated that the average estimated fair value using all valuation methodologies exceeded PB’s equity value by approximately $
million or
%, compared to $
%, for the annual goodwill impairment test completed as of July 31, 2022. Accordingly,
no impairment was recognized for BPPR or PB. The goodwill balance of BPPR and PB, as legal entities, represented approximately
% of the Corporation’s total goodwill balance as of the July 31, 2023 valuation date.
An impairment of $
lower forecasted cash flows and an increase in the rate used to discount cash flows. During 2022 the Corporation recognized a
goodwill impairment of $
goodwill balance as of December 31, 2023 amounted to $
Furthermore, as part of the analyses, management performed a reconciliation of the aggregate fair values determined for the
reporting units to the market capitalization of the Corporation concluding that the fair value results determined for the reporting units
in the July 31, 2023 annual assessment were reasonable.
The goodwill impairment evaluation process requires the Corporation to make estimates and assumptions with regard to the fair
value of the reporting units. Actual values may differ significantly from these estimates. Such differences could result in future
impairment of goodwill that would, in turn, negatively impact the Corporation’s results of operations and the reporting units where the
goodwill is recorded. Particularly for reporting units with recognized impairments or where the estimated fair value approximates the
equity value, future decreases in fair value estimates could result in additional impairment charges. Additionally, declines in the
Corporation’s market capitalization and adverse economic conditions sustained over a longer period of time negatively affecting
forecasted earnings could increase the risk of goodwill impairment in the future.
A decline in the Corporation’s stock price related to global and/or regional macroeconomic conditions, a deterioration in the Puerto
Rico or the U.S. economies, increases in the rate to discount future cash flows, and lower future earnings estimates could,
individually or in the aggregate, have a material impact on the determination of the fair value of our reporting units, which could in
turn result in an impairment of goodwill in the future. An impairment of goodwill would result in a non-cash expense, net of tax
impact. A charge to earnings related to a goodwill impairment would not materially impact regulatory capital calculations.
The following tables present the gross amount of goodwill and accumulated impairment losses by reportable segments.
202
December 31, 2023
Balance at
Balance at
December 31,
Accumulated
December 31,
2023
impairment
2023
(In thousands)
losses
Banco Popular de Puerto Rico
$
$
$
Popular U.S.
Total Popular, Inc.
$
$
$
December 31, 2022
December 31,
Accumulated
December 31,
2022
impairment
2022
(In thousands)
losses
Banco Popular de Puerto Rico
$
$
$
Popular U.S.
Total Popular, Inc.
$
$
$
203
Note 16 – Deposits
Total deposits as of the end of the periods presented consisted of:
(In thousands)
December 31, 2023
December 31, 2022
Savings accounts
$
$
NOW, money market and other interest bearing demand deposits
Total savings, NOW, money market and other interest bearing demand deposits
Certificates of deposit:
Under $250,000
$250,000 and over
Total interest bearing deposits
$
$
Non- interest bearing deposits
$
$
Total deposits
$
$
A summary of certificates of deposits by maturity at December 31, 2023 follows:
(In thousands)
2024
$
2025
2026
2027
2028
2029 and thereafter
Total certificates of deposit
$
At December 31, 2023, the Corporation had brokered deposits amounting to $
The aggregate amount of overdrafts in demand deposit accounts that were reclassified to loans was $
2023 (December 31, 2022 - $
At December 31, 2023, Puerto Rico public sector deposits amounted to $
bearing accounts. These public funds deposits are indexed to short-term market rates and fluctuate in cost with changes in those
rates, in accordance with contractual terms. Public deposit balances are difficult to predict. For example, the receipt by the Puerto
Rico Government of hurricane recovery related Federal assistance and seasonal tax collections could increase public deposit
balances at BPPR. On the other hand, the amount and timing of reductions in balances are likely to be impacted by, for example,
the speed at which federal assistance is distributed, the financial condition, liquidity and cash management practices of the Puerto
Rico Government and its instrumentalities and the implementation of fiscal and debt adjustment plans approved pursuant to
PROMESA or other actions mandated by the Fiscal Oversight and Management Board for Puerto Rico (the “Oversight Board”).
Generally, these deposits require that the bank pledge high credit quality securities as collateral, therefore, liquidity risk arising from
public sector deposit outflows are lower.
204
Note 17 – Borrowings
Assets sold under agreements to repurchase
Assets sold under agreements to repurchase amounted to $
2022.
The Corporation’s repurchase transactions are overcollateralized with the securities detailed in the table below. The Corporation’s
repurchase agreements have a right of set-off with the respective counterparty under the supplemental terms of the master
repurchase agreements. In an event of default, each party has a right of set-off against the other party for amounts owed in the
related agreement and any other amount or obligation owed in respect of any other agreement or transaction between them.
Pursuant to the Corporation’s accounting policy, the repurchase agreements are not offset with other repurchase agreements held
with the same counterparty.
The following table presents information related to the Corporation’s repurchase transactions accounted for as secured borrowings
that are collateralized with debt securities available-for-sale, debt securities held-to-maturity, other assets held-for-trading purposes
or which have been obtained under agreements to resell. It is the Corporation’s policy to maintain effective control over assets sold
under agreements to repurchase; accordingly, such securities continue to be carried on the Consolidated Statements of Financial
Condition.
Repurchase agreements accounted for as secured borrowings
December 31, 2023
December 31, 2022
Repurchase liability
Repurchase liability
Repurchase
Repurchase
(Dollars in thousands)
interest rate
interest rate
U.S. Treasury securities
$
%
$
%
Total U.S. Treasury securities
Mortgage-backed securities
Total mortgage-backed securities
Collateralized mortgage obligations
Total collateralized mortgage obligations
Total
$
%
$
%
Repurchase agreements in this portfolio are generally short-term, often overnight. As such, our risk is very limited. We manage the
liquidity risks arising from secured funding by sourcing funding globally from a diverse group of counterparties, providing a range of
securities collateral and pursuing longer durations, when appropriate.
205
(Dollars in thousands)
2023
2022
Maximum aggregate balance outstanding at any month-end
$
$
Average monthly aggregate balance outstanding
$
$
Weighted average interest rate:
For the year
%
%
At December 31
%
%
Other short-term borrowings
There were
2022.
The following table presents additional information related to the Corporation’s other short-term borrowings for the years
ended December 31, 2023 and December 31, 2022.
(Dollars in thousands)
2023
2022
Maximum aggregate balance outstanding at any month-end
$
$
Average monthly aggregate balance outstanding
$
$
Weighted average interest rate:
For the year
%
%
At December 31
%
%
206
Notes Payable
The following table presents the composition of notes payable at December 31, 2023 and December 31, 2022.
(In thousands)
December 31, 2023
December 31, 2022
Advances with the FHLB with maturities ranging from
fixed rates ranging from
% to
% (2022 -
% to
%)
$
$
Unsecured senior debt securities maturing on
% (2022-
%), net of debt issuance costs of $
)
[1]
Junior subordinated deferrable interest debentures (related to trust preferred securities) maturing on
% to
% (2022 -
% to
%), net of debt
issuance costs of $
)
Total notes payable
$
$
[1] On March 13, 2023, the Corporation issued $
% Senior Notes due
underwritten public offering. The Corporation used a portion of the net proceeds of the 2028 Notes offering to redeem, on August 14, 2023, the
outstanding $
% Senior Notes which were due on September
. The redemption price was
equal to
% of the principal amount plus accrued and unpaid interest through the redemption date.
A breakdown of borrowings by contractual maturities at December 31, 2023 is included in the table below.
Assets sold under
(In thousands)
agreements to
repurchase
Notes payable
Total
2024
$
$
$
2025
2026
2028
Later years
Total borrowings
$
$
$
At December 31, 2023 and December 31, 2022, the Corporation had FHLB borrowing facilities whereby the Corporation could
borrow up to $
December 31, 2023 and December 31, 2022, the Corporation had placed $
FHLB credit facility as collateral for municipal letters of credit to secure deposits. The FHLB borrowing facilities are collateralized
with securities and loans held-in-portfolio, and do not have restrictive covenants or callable features.
Also, at December 31, 2023, the Corporation has borrowing facilities at the discount window of the Federal Reserve Bank of New
York amounting to $
2022. The facilities are a collateralized source of credit that is highly reliable even under difficult market conditions.
207
Note 18 – Trust preferred securities
Statutory trusts established by the Corporation (Popular North America Capital Trust I and Popular Capital Trust II) had issued trust
preferred securities (also referred to as “capital securities”) to the public. The proceeds from such issuances, together with the
proceeds of the related issuances of common securities of the trusts (the “common securities”), were used by the trusts to purchase
junior subordinated deferrable interest debentures (the “junior subordinated debentures”) issued by the Corporation.
The sole assets of the trusts consisted of the junior subordinated debentures of the Corporation and the related accrued interest
receivable. These trusts are not consolidated by the Corporation pursuant to accounting principles generally accepted in the United
States of America.
The junior subordinated debentures are included by the Corporation as notes payable in the Consolidated Statements of Financial
Condition, while the common securities issued by the issuer trusts are included as debt securities held-to-maturity. The common
securities of each trust are wholly-owned, or indirectly wholly-owned, by the Corporation.
The following table presents financial data pertaining to the different trusts at December 31, 2023 and 2022.
(Dollars in thousands)
December 31, 2023 and 2022
Popular
North America
Popular
Issuer
Capital Trust I
Capital Trust Il
Capital securities
$
$
Distribution rate
%
%
Common securities
$
$
Junior subordinated debentures aggregate liquidation amount
$
$
Stated maturity date
Reference notes
[1],[3],[5]
[2],[4],[5]
[1] Statutory business trust that is wholly-owned by PNA and indirectly wholly-owned by the Corporation.
[2] Statutory business trust that is wholly-owned by the Corporation.
[3] The obligation of PNA under the junior subordinated debenture and its guarantees of the capital securities under the trust is fully and unconditionally
guaranteed on a subordinated basis by the Corporation to the extent set forth in the guarantee agreement.
[4] These capital securities are fully and unconditionally guaranteed on a subordinated basis by the Corporation to the extent set forth in the guarantee
agreement.
[5] The Corporation has the right, subject to any required prior approval from the Federal Reserve, to redeem after certain dates or upon the
occurrence of certain events mentioned below, the junior subordinated debentures at a redemption price equal to 100% of the principal amount, plus
accrued and unpaid interest to the date of redemption. The maturity of the junior subordinated debentures may be shortened at the option of the
Corporation prior to their stated maturity dates (i) on or after the stated optional redemption dates stipulated in the agreements, in whole at any time or
in part from time to time, or (ii) in whole, but not in part, at any time within 90 days following the occurrence and during the continuation of a tax event,
an investment company event or a capital treatment event as set forth in the indentures relating to the capital securities, in each case subject to
regulatory approval.
At December 31, 2023, the Corporation’s $
treatment, but instead qualify for Tier 2 capital treatment compared to $
208
Note 19 − Other liabilities
The caption of other liabilities in the consolidated statements of financial condition consists of the following major categories:
(In thousands)
December 31, 2023
December 31, 2022
Accrued expenses
$
$
Accrued interest payable
Accounts payable
Dividends payable
Trades payable
Liability for GNMA loans sold with an option to repurchase
Reserves for loan indemnifications
Reserve for operational losses
Operating lease liabilities (Note 33)
Finance lease liabilities (Note 33)
Pension benefit obligation
Postretirement benefit obligation
Others
Total other liabilities
$
$
209
Note 20 – Stockholders’ equity
The Corporation’s common stock ranks junior to all series of preferred stock as to dividend rights and / or as to rights on liquidation,
dissolution or winding up of the Corporation. Dividends on preferred stock are payable if declared. The Corporation’s ability to
declare or pay dividends on, or purchase, redeem or otherwise acquire, its common stock is subject to certain restrictions in the
event that the Corporation fails to pay or set aside full dividends on the preferred stock for the latest dividend period. The ability of
the Corporation to pay dividends in the future is limited by regulatory requirements, legal availability of funds, recent and projected
financial results, capital levels and liquidity of the Corporation, general business conditions and other factors deemed relevant by the
Corporation’s Board of Directors.
The Corporation’s common stock trades on the Nasdaq Global Select Market (the “Nasdaq”) under the symbol BPOP. The 2003
Series A Preferred Stock are not listed on Nasdaq.
Preferred stocks
The Corporation has
each series shall have such rights and preferences as shall be fixed by the Board of Directors when authorizing the issuance of that
particular series. The Corporation’s shares of preferred stock at December 31, 2023 consisted of:
●
% non-cumulative monthly income preferred stock, 2003 Series A, no par value, liquidation preference value of $
per share. Holders on record of the 2003 Series A Preferred Stock are entitled to receive, when, as and if declared by the
Board of Directors of the Corporation or an authorized committee thereof, out of funds legally available, non-cumulative
cash dividends at the annual rate per share of
% of their liquidation preference value, or $
month. These shares of preferred stock are perpetual, nonconvertible, have no preferential rights to purchase any
securities of the Corporation and are redeemable solely at the option of the Corporation with the consent of the Board of
Governors of the Federal Reserve System. The redemption price per share is $
. The shares of 2003 Series A
Preferred Stock have no voting rights, except for certain rights in instances when the Corporation does not pay dividends
for a defined period. These shares are not subject to any sinking fund requirement. Cash dividends declared and paid on
the 2003 Series A Preferred Stock amounted to $
Outstanding shares of 2003 Series A Preferred Stock amounted to
Common stock
Dividends
During the year 2023, cash dividends of $
; 2021 - $
) per common share outstanding were declared
amounting to $
common stock at December 31, 2023 (2022 - $
declared to stockholders of record as of the close of business on
, was paid on
. On February 23,
2024, the Corporation’s Board of Directors approved a quarterly cash dividend of $
payable on
.
Accelerated share repurchase transaction (“ASR”)
On August 24, 2022, the Corporation entered into a $
ASR Agreement”), which was accounted for as a treasury transaction. As a result of the receipt of the initial
Corporation recognized in stockholders’ equity approximately $
surplus. The Corporation completed the transaction on December 7, 2022 and received
and recognized approximately $
Corporation repurchase a total of
On March 1, 2022, the Corporation announced that on February 28, 2022 it entered into a $
respect to its common stock (the “March ASR Agreement”), which was accounted for as a treasury transaction. As a result of the
receipt of the initial
stock and $
capital surplus. In total the Corporation repurchased a total of
the March ASR Agreement.
210
On May 3, 2021, the Corporation entered into a $
accounted for as a treasury stock transaction. As a result of the receipt of the initial
stockholders’ equity approximately $
completed the transaction on September 9, 2021 and received
million in treasury stock with a corresponding increase in capital surplus. In total, the Corporation repurchased a total of
shares at an average price of $
Statutory reserve
The Banking Act of the Commonwealth of Puerto Rico requires that
transferred to a statutory reserve account until such statutory reserve equals the total of paid-in capital on common and preferred
stock. Any losses incurred by a bank must first be charged to retained earnings and then to the reserve fund. Amounts credited to
the reserve fund may not be used to pay dividends without the prior consent of the Puerto Rico Commissioner of Financial
Institutions. The failure to maintain sufficient statutory reserves would preclude BPPR from paying dividends. BPPR’s statutory
reserve fund amounted to $
was transferred to the statutory reserve account (2022 - $
reserve requirement in 2023, 2022 and 2021.
211
Note 21 – Regulatory capital requirements
The Corporation, BPPR and PB are subject to various regulatory capital requirements imposed by the federal banking agencies.
Failure to meet minimum capital requirements can lead to certain mandatory and additional discretionary actions by regulators that,
if undertaken, could have a direct material effect on the Corporation’s consolidated financial statements. Popular, Inc., BPPR and
PB are subject to Basel III capital requirements, including minimum and well capitalized regulatory capital ratios and compliance
with the standardized approach for determining risk-weighted assets.
The Basel III Capital Rules established a Common Equity Tier I (“CET1”) capital measure and related regulatory capital ratio CET1
to risk-weighted assets.
The Basel III Capital Rules provide that a depository institution will be deemed to be well capitalized if it maintained a leverage ratio
of at least
%, a CET1 ratio of at least
%, a Tier 1 risk-based capital ratio of at least
% and a total risk-based ratio of at least
%. Management has determined that at December 31, 2023 and 2022, the Corporation exceeded all capital adequacy
requirements to which it is subject.
The Corporation has been designated by the Federal Reserve Board as a Financial Holding Company (“FHC”) and is eligible to
engage in certain financial activities permitted under the Gramm-Leach-Bliley Act of 1999.
Pursuant to the adoption of the CECL accounting standard on January 1, 2020, the Corporation elected to use a five-year transition
period option as permitted in the final interim regulatory capital rules effective March 31, 2020. The five-year transition period
provision delays for two years the estimated impact of the adoption of the CECL accounting standard on regulatory capital, followed
by a three-year transition period to phase out the aggregate amount of the capital benefit provided during the initial two-year delay.
On August 26, 2020, federal banking regulators issued a final rule to modify the Basel III regulatory capital rules applicable to
banking organizations to allow those organizations participating in the Paycheck Protection Program (“PPP”) established under the
Coronavirus Aid, Relief and Economic Security Act (the “CARES Act”) to neutralize the regulatory capital effects of participating in
the program. Specifically, the agencies have clarified that banking organizations, including the Corporation and its Bank
subsidiaries, are permitted to assign a zero percent risk weight to PPP loans for purposes of determining risk-weighted assets and
risk-based capital ratios. Additionally, in order to facilitate use of the Paycheck Protection Program Liquidity Facility (the “PPPL
Facility”), which provides Federal Reserve Bank loans to eligible financial institutions such as the Corporation’s Bank subsidiaries to
fund PPP loans, the agencies further clarified that, for purposes of determining leverage ratios, a banking organization is permitted
to exclude from total average assets PPP loans that have been pledged as collateral for a PPPL Facility. As of December 31, 2023,
the Corporation has $
At December 31, 2023 and 2022, BPPR and PB were well-capitalized under the regulatory framework for prompt corrective action.
The following tables present the Corporation’s risk-based capital and leverage ratios at December 31, 2023 and 2022 under the
Basel III regulatory guidance.
212
Actual
Capital adequacy minimum
requirement (including
conservation capital buffer) [1]
(Dollars in thousands)
Amount
Ratio
Amount
Ratio
2023
Total Capital (to Risk-Weighted Assets):
Corporation
$
%
$
%
BPPR
PB
Common Equity Tier I Capital (to Risk-Weighted Assets):
Corporation
$
%
$
%
BPPR
PB
Tier I Capital (to Risk-Weighted Assets):
Corporation
$
%
$
%
BPPR
PB
Tier I Capital (to Average Assets):
Corporation
$
%
$
%
BPPR
PB
[1] The conservation capital buffer included for these ratios is
%, except for the Tier I to Average Asset ratio for which the buffer is not applicable and
therefore the capital adequacy minimum of
% is presented.
213
Actual
Capital adequacy minimum
requirement (including
conservation capital buffer)
(Dollars in thousands)
Amount
Ratio
Amount
Ratio
2022
Total Capital (to Risk-Weighted Assets):
Corporation
$
%
$
%
BPPR
PB
Common Equity Tier I Capital (to Risk-Weighted Assets):
Corporation
$
%
$
%
BPPR
PB
Tier I Capital (to Risk-Weighted Assets):
Corporation
$
%
$
%
BPPR
PB
Tier I Capital (to Average Assets):
Corporation
$
%
$
%
BPPR
PB
The following table presents the minimum amounts and ratios for the Corporation’s banks to be categorized as well-capitalized.
2023
2022
(Dollars in thousands)
Amount
Ratio
Amount
Ratio
Total Capital (to Risk-Weighted Assets):
BPPR
$
%
$
%
PB
Common Equity Tier I Capital (to Risk-Weighted Assets):
BPPR
$
%
$
%
PB
Tier I Capital (to Risk-Weighted Assets):
BPPR
$
%
$
%
PB
Tier I Capital (to Average Assets):
BPPR
$
%
$
%
PB
214
Note 22 – Other comprehensive income (loss)
The following table presents changes in accumulated other comprehensive income (loss) by component for the years ended
December 31, 2023 , 2022 and 2021.
Changes in Accumulated Other Comprehensive (Loss) Income by Component [1]
Years ended December 31,
(In thousands)
2023
2022
2021
Foreign currency translation
Beginning Balance
$
(56,735 )
$
(67,307 )
$
(71,254 )
Other comprehensive (loss) income
(7,793 )
Net change
(7,793 )
Ending balance
$
(64,528 )
$
(56,735 )
$
(67,307 )
Adjustment of pension and
postretirement benefit plans
Beginning Balance
$
(144,335 )
$
(158,994 )
$
(195,056 )
Other comprehensive income (loss) before reclassifications
Amounts reclassified from accumulated other comprehensive loss for
amortization of net losses
Net change
Ending balance
$
(117,893 )
$
(144,335 )
$
(158,994 )
Unrealized net holding
(losses) gains on debt
securities
Beginning Balance
$
(2,323,903 )
$
(96,120 )
$
Other comprehensive income (loss) before reclassifications
(2,261,097 )
(557,002 )
Amounts reclassified from accumulated other comprehensive (loss)
income for gains on securities
(18 )
Amounts reclassified from accumulated other comprehensive (loss)
income for amortization of net unrealized losses of debt securities
transferred from available-for-sale to held-to-maturity
Net change
(2,227,783 )
(557,020 )
Ending balance
$
(1,713,110 )
$
(2,323,903 )
$
(96,120 )
Unrealized net gains (losses)
on cash flow hedges
Beginning Balance
$
$
(2,648 )
$
(4,599 )
Other comprehensive (loss) income before reclassifications
(19 )
Amounts reclassified from accumulated other comprehensive income
(loss)
(26 )
(414 )
Net change
(45 )
Ending balance
$
$
$
(2,648 )
Total
$
(1,895,531 )
$
(2,524,928 )
$
(325,069
[1] All amounts presented are net of tax.
215
The following table presents the amounts reclassified out of each component of accumulated other comprehensive (loss) income for
the years ended December 31, 2023, 2022, and 2021.
Reclassifications Out of Accumulated Other Comprehensive (Loss) Income
Affected Line Item in the
Years ended December 31,
(In thousands)
Consolidated Statements of Operations
2023
2022
2021
Adjustment of pension and postretirement benefit plans
Amortization of net losses
Other operating expenses
$
(19,253 )
$
(15,644 )
$
(20,749 )
Total before tax
(19,253 )
(15,644 )
(20,749 )
Income tax benefit
Total net of tax
$
(12,034 )
$
(9,777 )
$
(12,968 )
Unrealized net holding (losses) gains on debt securities
Realized gain on sale of debt securities
Net gain (loss) on sale of debt securities
$
$
$
Amortization of unrealized net losses of debt
securities transferred to held-to-maturity
Investment securities [1]
(172,883 )
(41,642 )
Total before tax
(172,883 )
(41,642 )
Income tax benefit (expense)
(5 )
Total net of tax
$
(138,306 )
$
(33,314 )
$
Unrealized net gains (losses) losses on cash flow
hedges
Forward contracts
Mortgage banking activities
$
$
$
(704 )
Interest rate swaps
Other operating income
(498 )
(1,143 )
Total before tax
(1,847 )
Income tax (expense) benefit
(15 )
(546 )
Total net of tax
$
$
$
(1,584 )
Total reclassification adjustments, net of tax
$
(150,314 )
$
(42,677 )
$
(14,534 )
[1]
In October 2022, the Corporation transferred U.S. Treasury securities with a fair value of $
sale portfolio to its held-to-maturity portfolio. Refer to Note 6 to the Consolidated Financial Statements for additional information.
216
Note 23 – Guarantees
The Corporation has obligations upon the occurrence of certain events under financial guarantees provided in certain contractual
agreements as summarized below.
The Corporation issues financial standby letters of credit and has risk participation in standby letters of credit issued by other
financial institutions, in each case to guarantee the performance of various customers to third parties. If the customers failed to meet
its financial or performance obligation to the third party under the terms of the contract, then, upon their request, the Corporation
would be obligated to make the payment to the guaranteed party. At December 31, 2023, the Corporation recorded a liability of $
million (December 31, 2022 - $
guarantees under the standby letters of credit. In accordance with the provisions of ASC Topic 460, the Corporation recognizes at
fair value the obligation at inception of the standby letters of credit. The fair value approximates the fee received from the customer
for issuing such commitments. These fees are deferred and are recognized over the commitment period. The contracted amounts in
standby letters of credit outstanding at December 31, 2023 and 2022, shown in Note 24 to the Consolidated Financial Statements,
represent the maximum potential amount of future payments that the Corporation could be required to make under the guarantees
in the event of nonperformance by the customers. These standby letters of credit are used by the customers as a credit
enhancement and typically expire without being drawn upon. The Corporation’s standby letters of credit are generally secured, and
in the event of nonperformance by the customers, the Corporation has rights to the underlying collateral provided, which normally
includes cash, marketable securities, real estate, receivables, and others. Management does not anticipate any material losses
related to these instruments.
Also, from time to time, the Corporation securitized mortgage loans into guaranteed mortgage-backed securities subject in certain
instances, to lifetime credit recourse on the loans that serve as collateral for the mortgage-backed securities. The Corporation has
not sold any mortgage loans subject to credit recourse since 2009. Also, from time to time, the Corporation may sell, in bulk sale
transactions, residential mortgage loans and Small Business Administration (“SBA”) commercial loans subject to credit recourse or
to certain representations and warranties from the Corporation to the purchaser. These representations and warranties may relate,
for example, to borrower creditworthiness, loan documentation, collateral, prepayment and early payment defaults. The Corporation
may be required to repurchase the loans under the credit recourse agreements or representation and warranties.
At December 31, 2023, the Corporation serviced $
subject to credit recourse provisions, principally loans associated with FNMA and FHLMC residential mortgage loan securitization
programs. In the event of any customer default, pursuant to the credit recourse provided, the Corporation is required to repurchase
the loan or reimburse the third party investor for the incurred loss. The maximum potential amount of future payments that the
Corporation would be required to make under the recourse arrangements in the event of nonperformance by the borrowers is
equivalent to the total outstanding balance of the residential mortgage loans serviced with recourse and interest, if applicable.
During 2023, the Corporation repurchased approximately $
credit recourse provisions (2022 - $
underlying collateral securing the mortgage loan. The Corporation suffers losses on these loans when the proceeds from a
foreclosure sale of the property underlying a defaulted mortgage loan are less than the outstanding principal balance of the loan
plus any uncollected interest advanced and the costs of holding and disposing the related property. At December 31, 2023, the
Corporation’s liability established to cover the estimated credit loss exposure related to loans sold or serviced with credit recourse
amounted to $
The following table shows the changes in the Corporation’s liability of
estimated losses from these credit recourses agreements, included in the consolidated statements of financial condition during the
years ended December 31, 2023 and 2022.
Years ended
December 31,
(In thousands)
2023
2022
Balance as of beginning of period
$
$
Provision (benefit) for recourse liability
(1,989 )
(1,715 )
Net charge-offs
(698 )
(3,188 )
Balance as of end of period
$
$
217
The estimated losses to be absorbed under the credit recourse arrangements are recorded as a liability when the loans are sold and
are updated by accruing or reversing expense (categorized in the line item “Adjustments (expense) to indemnity reserves on loans
sold” in the consolidated statements of operations) throughout the life of the loan, as necessary, when additional relevant
information becomes available. The methodology used to estimate the recourse liability is a function of the recourse arrangements
given and considers a variety of factors, which include actual defaults and historical loss experience, foreclosure rate, estimated
future defaults and the probability that a loan would be delinquent. Statistical methods are used to estimate the recourse liability.
Expected loss rates are applied to different loan segmentations. The expected loss, which represents the amount expected to be
lost on a given loan, considers the probability of default and loss severity. The probability of default represents the probability that a
loan in good standing would become 90 days delinquent within the following twelve-month period. Regression analysis quantifies
the relationship between the default event and loan-specific characteristics, including credit scores, loan-to-value ratios, and loan
aging, among others.
When the Corporation sells or securitizes mortgage loans, it generally makes customary representations and warranties regarding
the characteristics of the loans sold. The Corporation’s mortgage operations in Puerto Rico group conforming mortgage loans into
pools which are exchanged for FNMA and GNMA mortgage-backed securities, which are generally sold to private investors, or are
sold directly to FNMA for cash. As required under the government agency programs, quality review procedures are performed by
the Corporation to ensure that asset guideline qualifications are met. To the extent the loans do not meet specified characteristics,
the Corporation may be required to repurchase such loans or indemnify for losses and bear any subsequent loss related to the
loans. The amount purchased under representation and warranty arrangements during the years ended December 31, 2023 and
December 31, 2022 was not considered material for the Corporation.
From time to time, the Corporation sells loans and agrees to indemnify the purchaser for credit losses or any breach of certain
representations and warranties made in connection with the sale.
Servicing agreements relating to the mortgage-backed securities programs of FNMA and GNMA, and to mortgage loans sold or
serviced to certain other investors, including FHLMC, require the Corporation to advance funds to make scheduled payments of
principal, interest, taxes and insurance, if such payments have not been received from the borrowers. At December 31, 2023, the
Corporation serviced $
2022 - $
owner, from liquidation proceeds when the mortgage loan is foreclosed or, in the case of FHA/VA loans, under the applicable FHA
and VA insurance and guarantees programs. However, in the meantime, the Corporation must absorb the cost of the funds it
advances during the time the advance is outstanding. The Corporation must also bear the costs of attempting to collect on
delinquent and defaulted mortgage loans. In addition, if a defaulted loan is not cured, the mortgage loan would be canceled as part
of the foreclosure proceedings and the Corporation would not receive any future servicing income with respect to that loan. At
December 31, 2023, the outstanding balance of funds advanced by the Corporation under such mortgage loan servicing
agreements was approximately $
Corporation’s servicing portfolio experience increased delinquencies, the Corporation would be required to dedicate additional cash
resources to comply with its obligation to advance funds as well as incur additional administrative costs related to increases in
collection efforts.
Popular, Inc. Holding Company (“PIHC”) fully and unconditionally guarantees certain borrowing obligations issued by certain of its
% owned consolidated subsidiaries amounting to $
In addition, at both December 31, 2023 and December 31, 2022, PIHC fully and unconditionally guaranteed on a subordinated basis
$
applicable guarantee agreement. Refer to Note 18 to the consolidated financial statements for further information on the trust
preferred securities.
218
Note 24 – Commitments and contingencies
Off-balance sheet risk
The Corporation is a party to financial instruments with off-balance sheet credit risk in the normal course of business to meet the
financial needs of its customers. These financial instruments include loan commitments, letters of credit and standby letters of credit.
These instruments involve, to varying degrees, elements of credit and interest rate risk in excess of the amount recognized in the
consolidated statements of financial condition.
The Corporation’s exposure to credit loss in the event of nonperformance by the other party to the financial instrument for
commitments to extend credit, standby letters of credit and financial guarantees is represented by the contractual notional amounts
of those instruments. The Corporation uses the same credit policies in making these commitments and conditional obligations as it
does for those reflected on the consolidated statements of financial condition.
Financial instruments with off-balance sheet credit risk, whose contract amounts represent potential credit risk as of the end of the
periods presented were as follows:
(In thousands)
December 31, 2023
December 31, 2022
Commitments to extend credit:
Credit card lines
$
$
Commercial lines of credit
Construction lines of credit
Other consumer unused credit commitments
Commercial letters of credit
Standby letters of credit
Commitments to originate or fund mortgage loans
At December 31, 2023 and December 31, 2022, the Corporation maintained a reserve of approximately $
respectively, for potential losses associated with unfunded loan commitments related to commercial and construction lines of credit.
Other commitments
At December 31, 2023 and December 31, 2022, the Corporation also maintained other non-credit commitments for approximately
$
Business concentration
Since the Corporation’s business activities are concentrated primarily in Puerto Rico, its results of operations and financial condition
are dependent upon the general trends of the Puerto Rico economy and, in particular, the residential and commercial real estate
markets. The concentration of the Corporation’s operations in Puerto Rico exposes it to greater risk than other banking companies
with a wider geographic base. Its asset and revenue composition by geographical area is presented in Note 37 to the Consolidated
Financial Statements.
Puerto Rico has faced significant fiscal and economic challenges for over a decade. In response to such challenges, the U.S.
Congress enacted the Puerto Rico Oversight Management and Economic Stability Act (“PROMESA”) in 2016, which, among other
things, established the Oversight Board and a framework for the restructuring of the debts of the Commonwealth, its
instrumentalities and municipalities. The Commonwealth and several of its instrumentalities have commenced debt restructuring
proceedings under PROMESA. As of the date of this report, while municipalities have been designated as covered entities under
PROMESA, no municipality has commenced, or has been authorized by the Oversight Board to commence, any such debt
restructuring proceeding under PROMESA.
At December 31, 2023, the Corporation’s direct exposure to the Puerto Rico government and its instrumentalities and municipalities
totaled $
outstanding, $
Substantially all of the amount outstanding at December 31, 2023 and December 31, 2022 were obligations from various Puerto
Rico municipalities. In most cases, these were “general obligations” of a municipality, to which the applicable municipality has
pledged its good faith, credit and unlimited taxing power, or “special obligations” of a municipality, to which the applicable
municipality has pledged other revenues. At December 31, 2023,
% of the Corporation’s exposure to municipal loans and
securities was concentrated in the municipalities of San Juan, Guaynabo, Carolina and Caguas.
219
The following table details the loans and investments representing the Corporation’s direct exposure to the Puerto Rico government
according to their maturities as of December 31, 2023:
(In thousands)
Investment
Portfolio
Loans
Total Outstanding
Total Exposure
Central Government
After 1 to 5 years
$
$
$
$
After 5 to 10 years
After 10 years
Total Central Government
Municipalities
Within 1 year
After 1 to 5 years
After 5 to 10 years
After 10 years
Total Municipalities
Total Direct Government Exposure
$
$
$
$
In addition, at December 31, 2023, the Corporation had $
governmental entities but for which the principal source of repayment is non-governmental ($
These included $
governmental instrumentality that has been designated as a covered entity under PROMESA (December 31, 2022 - $
These mortgage loans are secured by first mortgages on Puerto Rico residential properties and the HFA insurance covers losses in
the event of a borrower default and upon the satisfaction of certain other conditions. The Corporation also had at December 31,
2023, $
for which HFA also provides insurance to cover losses in the event of a borrower default and upon the satisfaction of certain other
conditions (December 31, 2022 - $
directly or those serving as collateral for the HFA bonds default and the collateral is insufficient to satisfy the outstanding balance of
these loans, HFA’s ability to honor its insurance will depend, among other factors, on the financial condition of HFA at the time such
obligations become due and payable. The Corporation does not consider the government guarantee when estimating the credit
losses associated with this portfolio. Although the Governor is currently authorized by local legislation to impose a temporary
moratorium on the financial obligations of the HFA, a moratorium on such obligations has not been imposed as of the date hereof.
BPPR’s commercial loan portfolio also includes loans to private borrowers who are service providers, lessors, suppliers or have
other relationships with the government. These borrowers could be negatively affected by the Commonwealth’s fiscal crisis and the
ongoing Title III proceedings under PROMESA. Similarly, BPPR’s mortgage and consumer loan portfolios include loans to
government employees and retirees, which could also be negatively affected by fiscal measures such as employee layoffs or
furloughs or reductions in pension benefits.
In addition, $
Protection Program (“PPP”) and $
at December 31, 2023 (compared to $
also had U.S. Treasury and obligations from the U.S. Government, its agencies or government sponsored entities within the portfolio
of available-for-sale and held-to-maturity securities as described in Note 6 and 7 to the Consolidated Financial Statements.
At December 31, 2023, the Corporation has operations in the United States Virgin Islands (the “USVI”) and has approximately $
million in direct exposure to USVI government entities (December 31, 2022 - $
number of fiscal and economic challenges that could adversely affect the ability of its public corporations and instrumentalities to
service their outstanding debt obligations.
At December 31, 2023, the Corporation has operations in the British Virgin Islands (“BVI”), which islands were negatively affected by
the COVID-19 pandemic, particularly due to a reduction in the tourism activity which accounts for a significant portion of their
economy. Although the Corporation has no significant exposure to a single borrower in the BVI, it has a loan portfolio amounting to
220
approximately $
December 31, 2022.
FDIC Special Assessment
On November 16, 2023, the Federal Deposit Insurance Corporation (“FDIC”) approved a final rule that imposes a special
assessment (the “FDIC Special Assessment”) to recover the losses to the deposit insurance fund (“DIF”) resulting from the FDIC’s
use, in March 2023, of the systemic risk exception to the least-cost resolution test under the Federal Deposit Insurance Act in
connection with the receiverships of several failed banks.
Under the final rule, the assessment base for the special assessment is equal to an insured depository institution’s (“IDI”) estimated
uninsured deposits, as reported in the IDI’s December 31, 2022 Call Report, excluding the first $
deposits. For a holding company that has more than one IDI subsidiary, such as Popular, the $
the company’s IDI subsidiaries in proportion to each IDI’s estimated uninsured deposits. The special assessments will be collected
at an annual rate of approximately
with the first assessment period beginning January 1, 2024. In their December 31, 2022 Call Reports, BPPR and PB reported
estimated uninsured deposits of approximately $
$
2023, representing the full amount of the assessment.
By statute, the FDIC is required to recover the loss arising from the use of a systemic risk determination through one or more special
assessments. As of December 31, 2023, the FDIC’s loss estimate described in the final rule had increased by approximately $
billion to $
%. The exact amount of losses will be determined when the FDIC terminates the related
receiverships considered in the final rule. Accordingly, the special assessment amount and collection period may change as the
estimated loss is periodically adjusted or if the total amount collected varies. If the most recent increase in the FDIC’s
estimate remains unchanged and is assessed in the same manner, the Corporation estimates that the incremental expense for the
FDIC Special Assessment could be approximately $
Legal Proceedings
The nature of Popular’s business ordinarily generates claims, litigation, investigations, and legal and administrative cases and
proceedings (collectively, “Legal Proceedings”). When the Corporation determines that it has meritorious defenses to the claims
asserted, it vigorously defends itself. The Corporation will consider the settlement of cases (including cases where it has meritorious
defenses) when, in management’s judgment, it is in the best interest of the Corporation and its stockholders to do so. On at least a
quarterly basis, Popular assesses its liabilities and contingencies relating to outstanding Legal Proceedings utilizing the most current
information available. For matters where it is probable that the Corporation will incur a material loss and the amount can be
reasonably estimated, the Corporation establishes an accrual for the loss. Once established, the accrual is adjusted on at least a
quarterly basis to reflect any relevant developments, as appropriate. For matters where a material loss is not probable, or the
amount of the loss cannot be reasonably estimated, no accrual is established.
In certain cases, exposure to loss exists in excess of any accrual to the extent such loss is reasonably possible, but not probable.
Management believes and estimates that the range of reasonably possible losses (with respect to those matters where such limits
may be determined, in excess of amounts accrued) for current Legal Proceedings ranged from $
of December 31, 2023. In certain cases, management cannot reasonably estimate the possible loss at this time. Any estimate
involves significant judgment, given the varying stages of the Legal Proceedings (including the fact that many of them are currently
in preliminary stages), the existence of multiple defendants in several of the current Legal Proceedings whose share of liability has
yet to be determined, the numerous unresolved issues in many of the Legal Proceedings, and the inherent uncertainty of the various
potential outcomes of such Legal Proceedings. Accordingly, management’s estimate will change from time-to-time, and actual
losses may be more or less than the current estimate.
While the outcome of Legal Proceedings is inherently uncertain, based on information currently available, advice of counsel, and
available insurance coverage, management believes that the amount it has already accrued is adequate and any incremental
liability arising from the Legal Proceedings in matters in which a loss amount can be reasonably estimated will not have a material
adverse effect on the Corporation’s consolidated financial position. However, in the event of unexpected future developments, it is
221
possible that the ultimate resolution of these matters in a reporting period, if unfavorable, could have a material adverse effect on
the Corporation’s consolidated financial position for that period.
Set forth below is a description of the Corporation’s significant Legal Proceedings.
BANCO POPULAR DE PUERTO RICO
Insufficient Funds and Overdraft Fees Class Actions
Popular was named as a defendant on a putative class action complaint captioned Golden v. Popular, Inc. filed in March 2020
before the U.S. District Court for the Southern District of New York, seeking damages, restitution and injunctive relief. Plaintiff
alleged breach of contract, violation of the covenant of good faith and fair dealing, unjust enrichment and violation of New York
consumer protection law due to Popular’s purported practice of charging overdraft fees (“OD Fees”) on transactions that, under
plaintiffs’ theory, do not overdraw the account. Plaintiff described Popular’s purported practice of charging OD Fees as “Authorize
Positive, Purportedly Settle Negative” (“APPSN”) transactions and alleged that Popular assesses OD Fees over authorized
transactions for which sufficient funds are held for settlement. In August 2020, Popular filed a Motion to Dismiss on several
grounds, including failure to state a claim against Popular, Inc. and improper venue. In October 2020, Plaintiff filed a Notice of
Voluntary Dismissal before the U.S. District Court for the Southern District of New York and, simultaneously, filed an identical
complaint in the U.S. District Court for the District of the Virgin Islands against Popular, Inc., Popular Bank and Banco Popular de
Puerto Rico (“BPPR”). In November 2020, Plaintiff filed a Notice of Voluntary Dismissal against Popular, Inc. and Popular Bank
following a Motion to Dismiss filed on behalf of such entities, which argued failure to state a claim and lack of minimum contacts of
such parties with the U.S.V.I. district court jurisdiction. BPPR, the only defendant remaining in the case, was served with process in
November 2020 and filed a Motion to Dismiss in January 2021.
In October 2021, the District Court, notwithstanding that BPPR’s Motion to Dismiss remained pending resolution, held an initial
scheduling conference and, thereafter, issued a trial management order where it scheduled the deadline for all discovery for
November 2022, and several other trial-related deadlines for June 2023. During a mediation hearing held in October 2022, the
parties reached a settlement in principle on a class-wide basis subject to final court approval. In January 2023, the parties filed
before the Court a motion for preliminary approval of the settlement agreement and, on March 31, 2023, the Court issued an order
granting preliminary approval of the settlement agreement. The Court scheduled the final approval hearing for September 8, 2023.
On September 8, 2023, the Court held a hearing to consider the final approval of the class settlement agreement and, on
September 29, 2023, the Court issued an Opinion and Order granting final approval to the settlement agreement. On December 19,
2023, the Court issued an Order staying all deadlines in the settlement agreement regarding payment of benefit until further notice
after the parties informed the Court that the settlement administrator had mistakenly failed to send the settlement notice to
approximately 3,000 class members. The parties expect to file a supplemental notice plan for court approval by February 29, 2024.
On January 31, 2022, Popular was also named as a defendant on a putative class action complaint captioned Lipsett v. Popular,
Inc. d/b/a Banco Popular, filed before the U.S. District Court for the Southern District of New York, seeking damages, restitution and
injunctive relief. Similar to the claims set forth in the aforementioned Golden complaint, Plaintiff alleges breach of contract, including
violations of the covenant of good faith and fair dealing, as a result of Popular’s purported practice of charging OD Fees for APPSN
transactions. The complaint further alleged that Popular assesses OD Fees over authorized transactions for which sufficient funds
are held for settlement. Popular waived service of process and filed a Motion to Compel Arbitration. In response to Popular’s motion,
Plaintiff filed a Notice of Voluntary Dismissal in April 2022.
On May 13, 2022, Plaintiff in the Lipsett complaint filed a new complaint captioned Lipsett v. Banco Popular North America d/b/a
Popular Community Bank with the same allegations of his previous complaint against Popular. In June 2022, after serving Plaintiff
with a written notice of election to arbitrate the claims asserted in the complaint which went unanswered, Popular Bank (“PB”) filed a
Pre-Motion Conference motion related to a new Motion to Compel Arbitration. After Plaintiff responded to the Pre-Motion conference
motion, the Court allowed PB to file its Motion to Compel Arbitration, which it did in September 2022. Plaintiff opposed such motion
in October 2022, and PB filed its reply in November 2022.
222
On December 9, 2022, the Court issued a Decision and Order denying PB’s Motion to Compel Arbitration. On December 20, 2022,
PB filed a Notice of Appeal with the United States Court of Appeals for the Second Circuit. PB filed its appeal brief on April 5, 2023
and Plaintiff filed his opposition brief on July 5, 2023. PB filed its reply brief on July 26, 2023.
The Court of Appeals held an oral argument on December 4, 2023. On January 10, 2024, the Court of Appeals entered judgment
affirming the trial court’s decision denying PB’s Motion to Compel Arbitration. The formal mandate of the Court of Appeals
remanding the case to the lower court was issued on January 31, 2024. PB expects to file a responsive allegation to the complaint
on or before March 16, 2024.
223
Note 25 – Non-consolidated variable interest entities
The Corporation is involved with
are deemed to be variable interest entities (“VIEs”) since the equity investors at risk have no substantial decision-making rights. The
Corporation does not hold any variable interest in the trusts, and therefore, cannot be the trusts’ primary beneficiary. Furthermore,
the Corporation concluded that it did not hold a controlling financial interest in these trusts since the decisions of the trusts are
predetermined through the trust documents and the guarantee of the trust preferred securities is irrelevant since in substance the
sponsor is guaranteeing its own debt.
Also, the Corporation is involved with various special purpose entities mainly in guaranteed mortgage securitization transactions,
including GNMA and FNMA. The Corporation has also engaged in securitization transactions with FHLMC, but considers its
exposure in the form of servicing fees and servicing advances not to be significant at December 31, 2023. These special purpose
entities are deemed to be VIEs since they lack equity investments at risk. The Corporation’s continuing involvement in these
guaranteed loan securitizations includes owning certain beneficial interests in the form of securities as well as the servicing rights
retained. The Corporation is not required to provide additional financial support to any of the variable interest entities to which it has
transferred the financial assets. The mortgage-backed securities, to the extent retained, are classified in the Corporation’s
Consolidated Statements of Financial Condition as available-for-sale or trading securities. The Corporation concluded that,
essentially, these entities (FNMA and GNMA) control the design of their respective VIEs, dictate the quality and nature of the
collateral, require the underlying insurance, set the servicing standards via the servicing guides and can change them at will, and
can remove a primary servicer with cause, and without cause in the case of FNMA. Moreover, through their guarantee obligations,
agencies (FNMA and GNMA) have the obligation to absorb losses that could be potentially significant to the VIE.
The Corporation holds variable interests in these VIEs in the form of agency mortgage-backed securities and collateralized
mortgage obligations, including those securities originated by the Corporation and those acquired from third parties. Additionally, the
Corporation holds agency mortgage-backed securities and agency collateralized mortgage obligations issued by third party VIEs in
which it has no other form of continuing involvement. Refer to Note 28 to the Consolidated Financial Statements for additional
information on the debt securities outstanding at December 31, 2023 and 2022, which are classified as available-for-sale and
trading securities in the Corporation’s Consolidated Statements of Financial Condition. In addition, the Corporation holds variable
interests in the form of servicing fees, since it retains the right to service the transferred loans in those government-sponsored
special purpose entities (“SPEs”) and may also purchase the right to service loans in other government-sponsored SPEs that were
transferred to those SPEs by a third-party.
The following table presents the carrying amount and classification of the assets related to the Corporation’s variable interests in
non-consolidated VIEs and the maximum exposure to loss as a result of the Corporation’s involvement as servicer of GNMA and
FNMA loans at December 31, 2023 and 2022.
224
(In thousands)
2023
2022
Assets
Servicing assets:
Mortgage servicing rights
$
$
Total servicing assets
$
$
Other assets:
Servicing advances
$
$
Total other assets
$
$
Total assets
$
$
Maximum exposure to loss
$
$
The size of the non-consolidated VIEs, in which the Corporation has a variable interest in the form of servicing fees, measured as
the total unpaid principal balance of the loans, amounted to $
The Corporation determined that the maximum exposure to loss includes the fair value of the MSRs and the assumption that the
servicing advances at December 31, 2023 and 2022 will not be recovered. The agency debt securities are not included as part of
the maximum exposure to loss since they are guaranteed by the related agencies.
ASU 2009-17 requires that an ongoing primary beneficiary assessment should be made to determine whether the Corporation is the
primary beneficiary of any of the VIEs it is involved with. The conclusion on the assessment of these non-consolidated VIEs has not
changed since their initial evaluation. The Corporation concluded that it is still not the primary beneficiary of these VIEs, and
therefore, these VIEs are not required to be consolidated in the Corporation’s financial statements at December 31, 2023.
225
Note 26 – Derivative instruments and hedging activities
The use of derivatives is incorporated as part of the Corporation’s overall interest rate risk management strategy to minimize
significant unplanned fluctuations in earnings and cash flows that are caused by interest rate volatility. The Corporation’s goal is to
manage interest rate sensitivity by modifying the repricing or maturity characteristics of certain balance sheet assets and liabilities
so that the net interest income is not materially affected by movements in interest rates. The Corporation uses derivatives in its
trading activities to facilitate customer transactions, and as a means of risk management. As a result of interest rate fluctuations,
hedged fixed and variable interest rate assets and liabilities will appreciate or depreciate in fair value. The effect of this unrealized
appreciation or depreciation is expected to be substantially offset by the Corporation’s gains or losses on the derivative instruments
that are linked to these hedged assets and liabilities. As a matter of policy, the Corporation does not use highly leveraged derivative
instruments for interest rate risk management.
The credit risk attributed to the counterparty’s nonperformance risk is incorporated in the fair value of the derivatives. Additionally,
the fair value of the Corporation’s own credit standing is considered in the fair value of the derivative liabilities. During the year
ended December 31, 2023, inclusion of the credit risk in the fair value of the derivatives resulted in a gain of $
Corporation’s credit standing adjustment. During the years ended December 31, 2022 and 2021, the Corporation recognized a loss
of $
The Corporation’s derivatives are subject to agreements which allow a right of set-off with each respective counterparty. In an event
of default, each party has a right of set-off against the other party for amounts owed in the related agreement and any other amount
or obligation owed in respect of any other agreement or transaction between them.
Pursuant to the Corporation’s accounting policy,
the fair value of derivatives is not offset with the fair value of other derivatives held with the same counterparty even if these
agreements allow a right of set-off. In addition, the fair value of derivatives is not offset with the amounts for the right to reclaim
financial collateral or the obligation to return financial collateral.
Financial instruments designated as cash flow hedges or non-hedging derivatives outstanding at December 31, 2023 and 2022
were as follows:
226
Notional amount
Derivative assets
Derivative liabilities
Statement of
Fair value at
Statement of
Fair value at
At December 31,
condition
December 31,
condition
December 31,
(In thousands)
2023
2022
classification
2023
2022
classification
2023
2022
Derivatives designated as
Forward contracts
$
$
Other assets
$
$
Other liabilities
$
$
Total derivatives designated
$
$
$
$
$
$
Derivatives not designated
Forward contracts
$
$
-
$
$
Other liabilities
$
$
Interest rate caps
Other assets
Other liabilities
Indexed options on deposits
Other assets
-
-
-
Bifurcated embedded options
-
-
-
Interest
bearing
deposits
Total derivatives not
$
$
$
$
$
$
Total derivative assets
$
$
$
$
$
$
Cash Flow Hedges
The Corporation utilizes forward contracts to hedge the sale of mortgage-backed securities with duration terms over one month.
Interest rate forwards are contracts for the delayed delivery of securities, which the seller agrees to deliver on a specified future date
at a specified price or yield. These forward contracts are hedging a forecasted transaction and thus qualify for cash flow hedge
accounting. Changes in the fair value of these forward contracts designated as cash flow hedges are recorded in other
comprehensive income (loss).
Effective on January 1, 2023, the Corporation discontinued the hedge accounting treatment of certain forward contracts for which
the changes in fair value were recorded, net of taxes, in accumulated other comprehensive income (loss) and subsequently
reclassified to net income (loss) in the same period that the hedged transaction impacted earnings. As a result of this change, the
changes in the fair value of these forward contracts are being recorded through net income. At December 31, 2023, there were no
derivatives designated as cash flow hedges.
For cash flow hedges, net gains (losses) on derivative contracts that are reclassified from accumulated other comprehensive income
(loss) to current period earnings are included in the line item in which the hedged item is recorded and during the period in which the
forecasted transaction impacts earnings, as presented in the tables below.
Year ended December 31, 2023
(In thousands)
Amount of net gain (loss)
recognized in OCI on
derivatives (effective
portion)
Classification in the statement of
operations of the net gain (loss)
reclassified from AOCI into income
(effective portion and ineffective
portion)
Amount of net gain
(loss) reclassified from
AOCI into income
(effective portion)
Amount of net gain
(loss) recognized in
income on derivatives
(ineffective portion)
Forward contracts
$
(30 )
$
$
Total
$
(30 )
$
$
227
Year ended December 31, 2022
(In thousands)
Amount of net gain (loss)
recognized in OCI on
derivatives (effective
portion)
Classification in the statement of
operations of the net gain (loss)
reclassified from AOCI into income
(effective portion and ineffective
portion)
Amount of net gain
(loss) reclassified from
AOCI into income
(effective portion)
Amount of net gain
(loss) recognized in
income on derivatives
(ineffective portion)
Forward contracts
$
$
$
Total
$
$
$
Year ended December 31, 2021
(In thousands)
Amount of net gain (loss)
recognized in OCI on
derivatives (effective
portion)
Classification in the statement of
operations of the net gain (loss)
reclassified from AOCI into income
(effective portion and ineffective
portion)
Amount of net gain
(loss) reclassified from
AOCI into income
(effective portion)
Amount of net gain
(loss) recognized in
income on derivatives
(ineffective portion)
Forward contracts
$
$
(704 )
$
Total
$
$
(704 )
$
Fair Value Hedges
At December 31, 2023 and 2022, there were
Non-Hedging Activities
For the year ended December 31, 2023, the Corporation recognized a gain of $
of $
Amount of Net Gain (Loss) Recognized in Income on Derivatives
Year ended
Year ended
Year ended
Classification of Net Gain (Loss)
December 31,
December 31,
December 31,
(In thousands)
Recognized in Income on Derivatives
2023
2022
2021
Forward contracts
Mortgage banking activities
$
$
$
Interest rate caps
Other operating income
(18 )
Indexed options on deposits
Interest expense
(5,290 )
Bifurcated embedded options
Interest expense
(5,326 )
(6,538 )
Total
$
$
$
Forward Contracts
The Corporation has forward contracts to sell mortgage-backed securities, which are accounted for as trading derivatives. Changes
in their fair value are recognized in mortgage banking activities.
Interest Rate Caps
The Corporation enters into interest rate caps as an intermediary on behalf of its customers and simultaneously takes offsetting
positions under the same terms and conditions, thus minimizing its market and credit risks.
Indexed and Embedded Options
The Corporation offers certain customers’ deposits whose return are tied to the performance of the Standard and Poor’s (“S&P 500”)
stock market indexes, and other deposits whose returns are tied to other stock market indexes or other equity securities
performance. The Corporation bifurcated the related options embedded within these customers’ deposits from the host contract in
accordance with ASC Subtopic 815-15. In order to limit the Corporation’s exposure to changes in these indexes, the Corporation
purchases indexed options which returns are tied to the same indexes from major broker dealer companies in the over the counter
market. Accordingly, the embedded options and the related indexed options are marked-to-market through earnings.
228
Note 27 – Related party transactions
The Corporation grants loans to its directors, executive officers, including certain related individuals or organizations, and affiliates in
the ordinary course of business. The activity and balance of these loans were as follows:
(In thousands)
Balance at December 31, 2021
$
New loans
Payments
(15,402 )
Other changes, including existing loans to new related parties
Balance at December 31, 2022
$
New loans
Payments
(9,731 )
Other changes, including existing loans to new related parties
Balance at December 31, 2023
$
New loans and payments include disbursements and collections from existing lines of credit.
The Corporation has had loan transactions with the Corporation’s directors, executive officers, including certain related individuals or
organizations, and affiliates, and proposes to continue such transactions in the ordinary course of its business, on substantially the
same terms, including interest rates and collateral, as those prevailing for comparable loan transactions with third parties. Except as
discussed below, the extensions of credit have not involved and do not currently involve more than normal risks of collection or
present other unfavorable features.
In 2010, as part of the Westernbank FDIC assisted transaction, BPPR acquired five commercial loans made to entities that were
wholly owned by one brother-in-law of a director of the Corporation. The loans were secured by real estate and personally
guaranteed by the director’s brother-in-law. The loans were originated by Westernbank between 2001 and 2005 and had an
aggregate outstanding principal balance of approximately $
and 2014, the loans were restructured to consist of (i)
with a
% annual interest rate (“Notes A”) and (ii)
%
annual interest rate, to be paid upon maturity (“Notes B”). The restructured notes had an original maturity of September 30, 2016
and, thereafter, various interim renewals were approved to allow for the re-negotiation of a longer-term extension. On April 2022,
one of these interim extensions decreased the interest rate applicable to the Notes A to
% and maintained the Notes B at an
interest rate of
%. In November 2022, BPPR and related parties of the Corporation’s director entered into a three-year extension of
the loans, until November 2025, which, among other things: (i) increased the interest rate applicable to Notes A to
% and
maintained the Notes B at an interest rate of
% and (ii) established a principal repayment schedule for Notes A, including a $
million mandatory prepayment. The three-year extension of the loans was approved by the Audit Committee in accordance with the
Related Party Policy. The aggregate outstanding balance on the loans as of December 31, 2023 was approximately $
which approximately $
approximately $
In April 2010, in connection with the acquisition of the Westernbank assets from the FDIC, as receiver, BPPR acquired a term loan
to a corporate borrower partially owned by an investment corporation in which the Corporation’s Chairman, at that time the Chief
Executive Officer, as well as certain of his family members, are the owners. In addition, the Chairman’s sister is the owner of an
entity that holds an ownership interest in the borrower. At the time the loan was acquired by BPPR, it had an unpaid principal
balance of $
the loan had an unpaid principal balance of $
recognized by BPPR as a capital contribution representing the difference between the fair value and the book value of the loan at
the time of transfer. Immediately upon being acquired by PIHC, the loan’s maturity was extended by 90 days (under the same terms
as originally contracted) to provide the PIHC additional time to evaluate a refinancing or long-term extension of the loan. In August
2017, the credit facility was refinanced with a stated maturity in February 2019. During 2017, the facility was subject to the loan
payment moratorium offered as part of the hurricane relief efforts. As such, interest payments amounting to approximately $
229
million were deferred and capitalized as part of the loan balance. In February 2019, the Audit Committee approved, under the
Related Party Policy, a
-month renewal of the loan at an interest rate of
% and a
-year amortization schedule. In
December
2021, the Corporation refinanced the then-current $
%, a maturity
date of December 2026 and a
-year amortization schedule. Payments of principal and interest of approximately $
$
approximately $
At December 31, 2023, the Corporation’s banking subsidiaries held deposits from related parties amounting to approximately $
million (2022 - $
From time to time, the Corporation, in the ordinary course of business, obtains services from related parties that have some
association with the Corporation. Management believes the terms of such arrangements are consistent with arrangements entered
into with independent third parties.
For the year ended December 31, 2023, the Corporation made contributions of approximately $
Popular and Popular Bank Foundation, which are not-for-profit corporations dedicated to philanthropic work (2022 - $
The Corporation also provided human and operational resources to support the activities of the Fundación Banco Popular which in
2023 amounted to approximately $
Related party transactions with Evertec, as an affiliate
Until August 15, 2022, the Corporation had an investment in Evertec, Inc. (“Evertec”) which provides various processing and
information technology services to the Corporation and its subsidiaries and gave BPPR access to the ATH network owned and
operated by Evertec. This investment was accounted for under the equity method. The Corporation recorded $
dividends from its investment in Evertec during the year ended December 31, 2022.
On July 1, 2022, BPPR completed its previously announced acquisition of certain assets from Evertec Group, LLC (“Evertec Group”)
to service certain BPPR channels, in exchange for shares of Evertec held by BPPR. The transaction was accounted for as a
business combination. In connection with this transaction, BPPR also entered into amended and restated service agreements with
Evertec Group pursuant to which Evertec Group will continue to provide various information technology and transaction processing
services to Popular, BPPR and their respective subsidiaries. As part of the transaction, BPPR and Evertec entered into a revenue
sharing structure for BPPR in connection with its merchant acquiring relationship with Evertec. On August 15, 2022, the Corporation
completed the sale of its remaining shares of common stock of Evertec, together with the aforementioned business acquisition (the
“Evertec Transactions”. As a result, the Corporation discontinued accounting for its proportionate share of Evertec’s income (loss)
and changes in stockholder’s equity under the equity method of accounting in the third quarter of 2022. The Corporation recorded a
pre-tax gain of $
The following table presents the Corporation’s proportionate share of Evertec’s income (loss) and changes in stockholders’ equity
for the years ended December 31, 2022 and 2021.
230
Year ended December 31,
(In thousands)
2022
2021
Share of Evertec income and Gain from the Evertec
Transactions and related accounting adjustments [1]
$
$
Share of other changes in Evertec's stockholders' equity
Share of Evertec's changes in equity recognized in income and
Gain from the Evertec Transaction and related accounting
adjustments
$
$
[1] The Gain from the Evertec Transactions and related accounting adjustments are reflected within other operating income in the accompanying
consolidated financial statements. As discussed in Note 4, the Corporation recognized an additional $
connection with the Business Acquisition Transaction.
The following table presents the impact of transactions and service payments between the Corporation and Evertec (as an affiliate)
and their impact on the results of operations for the years ended December 31, 2022 and 2021. Items that represent expenses to
the Corporation are presented with parenthesis.
Years ended December 31,
(In thousands)
2022 [1]
2021
Category
Interest expense on deposits
$
(267 )
$
(388 )
Interest expense
ATH and credit cards interchange income from services to Evertec
Other service fees
Rental income charged to Evertec
Net occupancy
Fees on services provided by Evertec
(128,681 )
(245,945 )
Professional fees
Other services provided to Evertec
Other operating expenses
Total
$
(111,315 )
$
(211,616 )
[1] Includes activity through June 30, 2022.
Centro Financiero BHD, S.A.
At December 31, 2023, the Corporation had a
% equity interest in Centro Financiero BHD, S.A. (“BHD”), one of the largest
banking and financial services groups in the Dominican Republic. During the year ended December 31, 2023, the Corporation
recorded $
amount of $
cash dividend distributions and $
(December 31, 2022 - $
Investment Companies
The Corporation, through its subsidiary Popular Asset Management LLC (“PAM”), provides advisory services to several investment
companies registered under the Investment Company Act of 1940 in exchange for a fee. The Corporation, through its subsidiary
BPPR, also provides transfer agency services to these investment companies. These fees are calculated at an annual rate of the
average net assets of the investment company, as defined in each agreement. Due to its advisory role, the Corporation considers
these investment companies as related parties.
For the year ended December 31, 2023 administrative fees charged to these investment companies amounted to $
(December 31, 2022 -
million (December 31, 2022 - $
231
Note 28 – Fair value measurement
ASC Subtopic 820-10 “Fair Value Measurements and Disclosures” establishes a fair value hierarchy that prioritizes the inputs to
valuation techniques used to measure fair value into three levels in order to increase consistency and comparability in fair value
measurements and disclosures. The hierarchy is broken down into three levels based on the reliability of inputs as follows:
●
Level 1
- Unadjusted quoted prices in active markets for identical assets or liabilities that the Corporation has the ability to
access at the measurement date. Valuation on these instruments does not necessitate a significant degree of judgment
since valuations are based on quoted prices that are readily available in an active market.
●
Level 2
- Quoted prices other than those included in Level 1 that are observable either directly or indirectly. Level 2 inputs
include quoted prices for similar assets or liabilities in active markets, quoted prices for identical or similar assets or
liabilities in markets that are not active, or other inputs that are observable or that can be corroborated by observable
market data for substantially the full term of the financial instrument.
●
Level 3
- Inputs are unobservable and significant to the fair value measurement. Unobservable inputs reflect the
Corporation’s own judgements about assumptions that market participants would use in pricing the asset or liability.
The Corporation maximizes the use of observable inputs and minimizes the use of unobservable inputs by requiring that the
observable inputs be used when available. Fair value is based upon quoted market prices when available. If listed prices or quotes
are not available, the Corporation employs internally-developed models that primarily use market-based inputs including yield
curves, interest rates, volatilities, and credit curves, among others. Valuation adjustments are limited to those necessary to ensure
that the financial instrument’s fair value is adequately representative of the price that would be received or paid in the marketplace.
These adjustments include amounts that reflect counterparty credit quality, the Corporation’s credit standing, constraints on liquidity
and unobservable parameters that are applied consistently.
The estimated fair value may be subjective in nature and may involve uncertainties and matters of significant judgment for certain
financial instruments. Changes in the underlying assumptions used in calculating fair value could significantly affect the results.
Fair Value on a Recurring and Nonrecurring Basis
The following fair value hierarchy tables present information about the Corporation’s assets and liabilities measured at fair value on
a recurring basis at December 31, 2023 and 2022:
232
At December 31, 2023
(In thousands)
Level 1
Level 2
Level 3
Measured at NAV
Total
RECURRING FAIR VALUE MEASUREMENTS
Assets
Debt securities available-for-sale:
U.S. Treasury securities
$
$
$
$
$
Collateralized mortgage obligations - federal
agencies
Mortgage-backed securities
Other
Total debt securities available-for-sale
$
$
$
$
$
Trading account debt securities, excluding
derivatives:
U.S. Treasury securities
$
$
$
$
$
Obligations of Puerto Rico, States and political
subdivisions
Collateralized mortgage obligations
Mortgage-backed securities
Other
Total trading account debt securities, excluding
derivatives
$
$
$
$
$
Equity securities
$
$
$
$
$
Mortgage servicing rights
Loans held-for-sale
Derivatives
Total assets measured at fair value on a
recurring basis
$
$
$
$
$
Liabilities
Derivatives
$
$
(21,103 )
$
$
$
(21,103 )
Total liabilities measured at fair value on a
recurring basis
$
$
(21,103 )
$
$
$
(21,103 )
233
At December 31, 2022
(In thousands)
Level 1
Level 2
Level 3
Measured at NAV
Total
RECURRING FAIR VALUE MEASUREMENTS
Assets
Debt securities available-for-sale:
U.S. Treasury securities
$
$
$
$
$
Collateralized mortgage obligations - federal
agencies
Mortgage-backed securities
Other
Total debt securities available-for-sale
$
$
$
$
$
Trading account debt securities, excluding
derivatives:
U.S. Treasury securities
$
$
$
$
$
Obligations of Puerto Rico, States and political
subdivisions
Collateralized mortgage obligations
Mortgage-backed securities
Other
Total trading account debt securities, excluding
derivatives
$
$
$
$
$
Equity securities
$
$
$
$
$
Mortgage servicing rights
Derivatives
Total assets measured at fair value on a
recurring basis
$
$
$
$
$
Liabilities
Derivatives
$
$
(17,000 )
$
$
$
(17,000 )
Total liabilities measured at fair value on a
recurring basis
$
$
(17,000 )
$
$
$
(17,000 )
Beginning in the first quarter of 2023, the Corporation has elected the fair value option for newly originated mortgage loans held-for-
sale. This election better aligns with the management of the portfolio from a business perspective. As of December 31, 2022, the
Corporation had not elected the fair value option for any of the loans in the held for sale portfolio.
Loans held-for-sale measured at fair value
Loans held-for-sale measured at fair value were priced based on secondary market prices. These loans are classified as Level 2.
The following table summarizes the difference between the aggregate fair value and the aggregate unpaid principal balance for
mortgage loans originated as held-for-sale measured at fair value as of December 31,2023.
(In thousands)
December 31, 2023
Aggregate Unpaid
Fair Value
Principal Balance
Difference
Loans held for sale
$
$
$
For the year ended December 31,2023, changes in the fair value of mortgage loans held-for-sale for which the Corporation elected
the fair value option, were not considered material.
The fair value information included in the following tables is not as of period end, but as of the date that the fair value measurement
was recorded during the years ended December 31, 2023, 2022 and 2021 and excludes nonrecurring fair value measurements of
assets no longer outstanding as of the reporting date.
234
Year ended December 31, 2023
(In thousands)
Level 1
Level 2
Level 3
Total
NONRECURRING FAIR VALUE MEASUREMENTS
Assets
Write-downs
Loans
[1]
$
$
$
$
$
(3,157 )
Other real estate owned
[2]
(1,516 )
Other foreclosed assets
[2]
(28 )
Total assets measured at fair value on a nonrecurring basis
$
$
$
$
$
(4,701 )
[1] Relates mainly to certain impaired collateral dependent loans. The impairment was measured based on the fair value of the collateral, which is
derived from appraisals that take into consideration prices in observed transactions involving similar assets in similar locations. Costs to sell are
excluded from the reported fair value amount.
[2] Represents the fair value of foreclosed real estate and other collateral owned that were written down to their fair value. Costs to sell are
excluded from the reported fair value amount.
Year ended December 31, 2022
(In thousands)
Level 1
Level 2
Level 3
Total
NONRECURRING FAIR VALUE MEASUREMENTS
Assets
Write-downs
Loans
[1]
$
$
$
$
$
(2,067 )
Other real estate owned
[2]
(1,026 )
Other foreclosed assets
[2]
(1 )
Long-lived assets held-for-sale
[3]
(2,155 )
Total assets measured at fair value on a nonrecurring basis
$
$
$
$
$
(5,249 )
[1] Relates mainly to certain impaired collateral dependent loans. The impairment was measured based on the fair value of the collateral, which is
derived from appraisals that take into consideration prices in observed transactions involving similar assets in similar locations. Costs to sell are
excluded from the reported fair value amount.
[2] Represents the fair value of foreclosed real estate and other collateral owned that were written down to their fair value. Costs to sell are
excluded from the reported fair value amount.
[3] Represents the fair value of long-lived assets held-for-sale that were written down to their fair value.
Year ended December 31, 2021
(In thousands)
Level 1
Level 2
Level 3
Total
NONRECURRING FAIR VALUE MEASUREMENTS
Assets
Write-downs
Loans
[1]
$
$
$
$
$
(3,721 )
Other real estate owned
[2]
(1,579 )
Other foreclosed assets
[2]
(33 )
Long-lived assets held-for-sale
[3]
(5,320 )
Trademark
[4]
(5,404 )
Total assets measured at fair value on a nonrecurring basis
$
$
$
$
$
(16,057 )
[1] Relates mostly to certain impaired collateral dependent loans. The impairment was measured based on the fair value of the collateral, which
is derived from appraisals that take into consideration prices in observed transactions involving similar assets in similar locations. Costs to sell are
excluded from the reported fair value amount.
[2] Represents the fair value of foreclosed real estate and other collateral owned that were written down to their fair value. Costs to sell are
excluded from the reported fair value amount.
[3] Represents the fair value of long-lived assets held-for-sale that were written down to their fair value.
[4] Represents the fair value of a trademark due to a write-down on impairment.
235
The following tables present the changes in Level 3 assets and liabilities measured at fair value on a recurring basis for the years
ended December 31, 2023, 2022, and 2021.
Year ended December 31, 2023
MBS
Other
classified
classified
CMOs
MBS
Other
as debt
as debt
classified
classified
securities
securities
securities
as trading
as trading
classified as
Mortgage
available-
available-
account debt
account debt
trading account
servicing
Total
Contingent
Total
(In thousands)
for-sale
for-sale
securities
securities
debt securities
rights
assets
Consideration
liabilities
Balance at January 1, 2023
$
$
$
$
$
$
$
$
$
Gains (losses) included in
earnings
(2 )
(40 )
(11,589 )
(11,631 )
Gains (losses) included in OCI
(5 )
(5 )
Additions
Sales
(1,269 )
(1,269 )
Settlements
(100 )
(112 )
(101 )
Balance at December 31, 2023
$
$
$
$
$
$
$
$
$
Changes in unrealized gains
(losses) included in earnings
relating to assets still held at
December 31, 2023
$
$
$
$
(1 )
$
$
(529 )
$
(512 )
$
$
Year ended December 31, 2022
MBS
Other
Other
classified
classified
CMOs
MBS
securities
as debt
as debt
classified
classified
classified
securities
securities
as trading
as trading
as trading
Mortgage
available-
available-
account debt
account debt
account debt
servicing
Total
Contingent
Total
(In thousands)
for-sale
for-sale
securities
securities
securities
rights
assets
Consideration
liabilities
Balance at January 1, 2022
$
$
$
$
$
$
$
$
(9,241 )
$
(9,241 )
Gains (losses) included in
earnings
(2 )
(73 )
Gains (losses) included in OCI
(15 )
(15 )
Additions
Settlements
(100 )
(88 )
(188 )
Balance at December 31, 2022
$
$
$
$
$
$
$
$
$
Changes in unrealized gains
(losses) included in earnings
relating to assets still held at
December 31, 2022
$
$
$
(2 )
$
$
(23 )
$
$
$
$
Year ended December 31, 2021
MBS
Other
classified
CMOs
securities
as debt
classified
classified
securities
as trading
as trading
Mortgage
available-
account debt
account debt
servicing
Total
Contingent
Total
(In thousands)
for-sale
securities
securities
rights
assets
Consideration
liabilities
Balance at January 1, 2021
$
$
$
$
$
$
$
Gains (losses) included in earnings
(1 )
(101 )
(10,216 )
(10,318 )
Gains (losses) included in OCI
(13 )
(13 )
Additions
(9,241 )
(9,241 )
Settlements
(175 )
(107 )
(282 )
Balance at December 31, 2021
$
$
$
$
$
$
(9,241 )
$
(9,241 )
Changes in unrealized gains (losses) included in
earnings relating to assets still held at December 31,
2021
$
$
(1 )
$
(45 )
$
$
$
$
236
Gains and losses (realized and unrealized) included in earnings for the years ended December 31, 2023, 2022, and 2021 for Level
3 assets and liabilities included in the previous tables are reported in the consolidated statement of operations as follows:
2023
2022
2021
Total
Changes in unrealized
Total
Changes in unrealized
Total
Changes in unrealized
gains (losses)
gains (losses)
gains (losses)
gains (losses)
gains (losses)
gains (losses)
included
relating to assets still
included
relating to assets still
included
relating to assets still
(In thousands)
in earnings
held at reporting date
in earnings
held at reporting date
in earnings
held at reporting date
Mortgage banking activities
$
(11,589 )
$
(529 )
$
$
$
(10,216 )
$
Trading account (loss) profit
(42 )
(71 )
(21 )
(102 )
(46 )
Other operating income
Total
$
(11,631 )
$
(512 )
$
$
$
(10,318 )
$
The following tables include quantitative information about significant unobservable inputs used to derive the fair value of Level 3
instruments, excluding those instruments for which the unobservable inputs were not developed by the Corporation such as prices
of prior transactions and/or unadjusted third-party pricing sources at December 31, 2023 and 2022.
Fair value at
(In thousands)
2023
Valuation technique
Unobservable inputs
Weighted average (range) [1]
CMO's - trading
$
Discounted cash flow model
Weighted average life
Yield
%
Prepayment speed
%
Other - trading
$
Discounted cash flow model
Weighted average life
Yield
Prepayment speed
Loans held-in-portfolio
$
[2]
External appraisal
Haircut applied on
external appraisals
% (
% -
%)
Other real estate owned
$
[3]
External appraisal
Haircut applied on
external appraisals
.0%
[1]
Weighted average of significant unobservable inputs used to develop Level 3 fair value measurements were calculated by relative fair value.
[2]
Loans held-in-portfolio in which haircuts were not applied to external appraisals were excluded from this table.
[3]
Other real estate owned in which haircuts were not applied to external appraisals were excluded from this table.
Fair value at
(In thousands)
2022
Valuation technique
Unobservable inputs
Weighted average (range) [1]
CMO's - trading
$
Discounted cash flow model
Weighted average life
Yield
% (
% -
%)
Prepayment speed
% (
% -
%)
Other - trading
$
Discounted cash flow model
Weighted average life
Yield
Prepayment speed
Loans held-in-portfolio
$
[2]
External appraisal
Haircut applied on
external appraisals
% (
.0% -
%)
Other real estate owned
$
[3]
External appraisal
Haircut applied on
external appraisals
% (
.0% -
.0%)
[1]
Weighted average of significant unobservable inputs used to develop Level 3 fair value measurements were calculated by relative fair value.
[2]
Loans held-in-portfolio in which haircuts were not applied to external appraisals were excluded from this table.
[3]
Other real estate owned in which haircuts were not applied to external appraisals were excluded from this table.
237
.
Following is a description of the Corporation’s valuation methodologies used for assets and liabilities measured at fair value. The
disclosure requirements exclude certain financial instruments and all non-financial instruments. Accordingly, the aggregate fair value
amounts of the financial instruments disclosed do not represent management’s estimate of the underlying value of the Corporation.
Trading account debt securities and debt securities available-for-sale
●
maturity treasury curve. These securities are classified as Level 2. U.S. Treasury bills are classified as Level 1 given the
high volume of trades and pricing based on those trades.
●
agency securities, which fair value is based on an active exchange market and on quoted market prices for similar
securities. The U.S. agency securities are classified as Level 2.
●
include municipal bonds. The bonds are segregated and the like characteristics divided into specific sectors. Market
inputs used in the evaluation process include all or some of the following: trades, bid price or spread, two sided markets,
quotes, benchmark curves including but not limited to Treasury benchmarks, LIBOR and swap curves, market data feeds
such as those obtained from municipal market sources, discount and capital rates, and trustee reports. The municipal
bonds are classified as Level 2.
●
value derived from similar bonds defined by credit quality and market sector. Their fair value incorporates an option
adjusted spread. The agency MBS are classified as Level 2. Other agency MBS such as GNMA Puerto Rico Serials are
priced using an internally-prepared pricing matrix with quoted prices from local brokers dealers. These particular MBS are
classified as Level 3.
●
theoretical value derived from similar bonds defined by credit quality and market sector and for which fair value
incorporates an option adjusted spread. The option adjusted spread model includes prepayment and volatility
assumptions, ratings (whole loans collateral) and spread adjustments. These CMOs are classified as Level 2. Other
CMOs, due to their limited liquidity, are classified as Level 3 due to the insufficiency of inputs such as executed trades,
credit information and cash flows.
●
instruments, these securities are classified as Level 2.
●
corporate securities, quoted prices for these security types are obtained from broker dealers. Given that the quoted prices
are for similar instruments or do not trade in highly liquid markets, these securities are classified as Level 2. Given that the
fair value was estimated based on a discounted cash flow model using unobservable inputs, interest-only strips are
classified as Level 3.
Equity securities
Equity securities are comprised principally of shares in closed-ended and open-ended mutual funds and other equity securities.
Closed-end funds are traded on the secondary market at the shares’ market value. Open-ended funds are considered to be liquid,
as investors can sell their shares continually to the fund and are priced at NAV. Mutual funds are classified as Level 2. Other equity
securities that do not trade in highly liquid markets are also classified as Level 2, except for one equity security that do not have
readily determinable fair value and is under an investment company is measured at NAV.
Mortgage servicing rights
238
Mortgage servicing rights (“MSRs”) do not trade in an active market with readily observable prices. MSRs are priced using a
discounted cash flow model valuation performed by a third party. The discounted cash flow model incorporates assumptions that
market participants would use in estimating future net servicing income, including portfolio characteristics, prepayments
assumptions, discount rates, delinquency and foreclosure rates, late charges, other ancillary revenues, cost to service and other
economic factors. Prepayment speeds are adjusted for the loans’ characteristics and portfolio behavior. Due to the unobservable
nature of certain valuation inputs, the MSRs are classified as Level 3.
Derivatives
Interest rate caps and indexed options are traded in over-the-counter active markets. These derivatives are indexed to an
observable interest rate benchmark, such as LIBOR or equity indexes, and are priced using an income approach based on present
value and option pricing models using observable inputs. Other derivatives are liquid and have quoted prices, such as forward
contracts or “to be announced securities” (“TBAs”). All of these derivatives are classified as Level 2. The non-performance risk is
determined using internally-developed models that consider the collateral held, the remaining term, and the creditworthiness of the
entity that bears the risk, and uses available public data or internally-developed data related to current spreads that denote their
probability of default.
Contingent consideration liability
The fair value of the contingent consideration, which relates to earnout payments that could be payable to K2 over a three-year
period, was calculated based on a discounted cash flow technique using the probability-weighted average from likely scenarios.
This contingent consideration is classified as Level 3.
Loans held-in-portfolio that are collateral dependent
The impairment is measured based on the fair value of the collateral, which is derived from appraisals that take into consideration
prices in observed transactions involving similar assets in similar locations and which could be subject to internal adjustments.
These collateral dependent loans are classified as Level 3.
Loans measured at fair value or measured at the lower of cost or market
Loans held-for-sale measured at fair value or measured at the lower of cost or market were priced based on secondary market
prices. These loans are classified as Level 2.
Other real estate owned and other foreclosed assets
Other real estate owned includes real estate properties securing mortgage, consumer, and commercial loans. Other foreclosed
assets include primarily automobiles securing auto loans. The fair value of foreclosed assets may be determined using an external
appraisal, broker price opinion, or an internal valuation. These foreclosed assets are classified as Level 3 since they are subject to
internal adjustments.
ROU assets and leasehold improvements
The impairment was measured based on the sublease rental value of the branches that were subject to the strategic realignment of
PB’s New York Metro Branch network. These ROU assets and leasehold improvements are classified as Level 3.
Long-lived assets held-for-sale
The Corporation evaluates for impairment its long-lived assets, whenever events or changes in circumstances indicate that the
carrying amount of an asset may not be recoverable and records a write down for the difference between the carrying amount and
the fair value less cost to sell. These long-lived assets held-for-sale are classified as Level 3.
Trademark
The write-down on impairment of a trademark was based on the discontinuance of origination thru e-loan platform. This trademark is
classified as Level 3.
239
Note 29 – Fair value of financial instruments
The fair value of financial instruments is the amount at which an asset or obligation could be exchanged in a current transaction
between willing parties, other than in a forced or liquidation sale. For those financial instruments with no quoted market prices
available, fair values have been estimated using present value calculations or other valuation techniques, as well as management’s
best judgment with respect to current economic conditions, including discount rates, estimates of future cash flows, and prepayment
assumptions. Many of these estimates involve various assumptions and may vary significantly from amounts that could be realized
in actual transactions.
The fair values reflected herein have been determined based on the prevailing rate environment at December 31, 2023 and
December 31, 2022, as applicable. In different interest rate environments, fair value estimates can differ significantly, especially for
certain fixed rate financial instruments. In addition, the fair values presented do not attempt to estimate the value of the
Corporation’s fee generating businesses and anticipated future business activities, that is, they do not represent the Corporation’s
value as a going concern. There have been no changes in the Corporation’s valuation methodologies and inputs used to estimate
the fair values for each class of financial assets and liabilities not measured at fair value.
The following tables present the carrying amount and estimated fair values of financial instruments with their corresponding level in
the fair value hierarchy. The aggregate fair value amounts of the financial instruments disclosed do not represent management’s
estimate of the underlying value of the Corporation.
240
December 31, 2023
Carrying
Measured
(In thousands)
amount
Level 1
Level 2
Level 3
at NAV
Fair value
Financial Assets:
Cash and due from banks
$
$
$
$
$
$
Money market investments
Trading account debt securities, excluding derivatives
[1]
Debt securities available-for-sale
[1]
Debt securities held-to-maturity:
U.S. Treasury securities
$
$
$
$
$
$
Obligations of Puerto Rico, States and political
subdivisions
Collateralized mortgage obligation-federal agency
Securities in wholly owned statutory business trusts
Total debt securities held-to-maturity
$
$
$
$
$
$
Equity securities:
FHLB stock
$
$
$
$
$
$
FRB stock
Other investments
Total equity securities
$
$
$
$
$
$
Loans held-for-sale
$
$
$
$
$
$
Loans held-in-portfolio
Mortgage servicing rights
Derivatives
December 31, 2023
Carrying
Measured
(In thousands)
amount
Level 1
Level 2
Level 3
at NAV
Fair value
Financial Liabilities:
Deposits:
Demand deposits
$
$
$
$
$
$
Time deposits
Total deposits
$
$
$
$
$
$
Assets sold under agreements to repurchase
$
$
$
$
$
$
Notes payable:
FHLB advances
$
$
$
$
$
$
Unsecured senior debt securities
Junior subordinated deferrable interest debentures
(related to trust preferred securities)
Total notes payable
$
$
$
$
$
$
Derivatives
$
$
$
$
$
$
[1]
Refer to Note 28 to the Consolidated Financial Statements for the fair value by class of financial asset and its hierarchy level.
241
December 31, 2022
Carrying
Measured
(In thousands)
amount
Level 1
Level 2
Level 3
at NAV
Fair value
Financial Assets:
Cash and due from banks
$
$
$
$
$
$
Money market investments
Trading account debt securities, excluding derivatives
[1]
Debt securities available-for-sale
[1]
Debt securities held-to-maturity:
U.S. Treasury securities
$
$
$
$
$
$
Obligations of Puerto Rico, States and political
subdivisions
Collateralized mortgage obligation-federal agency
Securities in wholly owned statutory business trusts
Total debt securities held-to-maturity
$
$
$
$
$
$
Equity securities:
FHLB stock
$
$
$
$
$
$
FRB stock
Other investments
Total equity securities
$
$
$
$
$
$
Loans held-for-sale
$
$
$
$
$
$
Loans held-in-portfolio
Mortgage servicing rights
Derivatives
December 31, 2022
Carrying
Measured
(In thousands)
amount
Level 1
Level 2
Level 3
at NAV
Fair value
Financial Liabilities:
Deposits:
Demand deposits
$
$
$
$
$
$
Time deposits
Total deposits
$
$
$
$
$
$
Assets sold under agreements to repurchase
$
$
$
$
$
$
Other short-term borrowings
[2]
Notes payable:
FHLB advances
$
$
$
$
$
$
Unsecured senior debt securities
Junior subordinated deferrable interest debentures
(related to trust preferred securities)
Total notes payable
$
$
$
$
$
$
Derivatives
$
$
$
$
$
$
[1]
Refer to Note 28 to the Consolidated Financial Statements for the fair value by class of financial asset and its hierarchy level.
[2]
Refer to Note 17 to the Consolidated Financial Statements for the composition of other short-term borrowings.
The notional amount of commitments to extend credit at December 31, 2023 and December 31, 2022 is $
respectively, and represents the unused portion of credit facilities granted to customers. The notional amount of letters of credit at
December 31, 2023 and December 31, 2022 is $
is required to be paid in the event of nonperformance. The fair value of commitments to extend credit and letters of credit, which are
based on the fees charged to enter into those agreements, are not material to Popular’s financial statements.
242
Note 30 – Employee benefits
Certain employees of BPPR are covered by three non-contributory defined benefit pension plans, the Banco Popular de Puerto Rico
Retirement Plan and two Restoration Plans (the “Pension Plans”). Pension benefits are based on age, years of credited service,
and final average compensation.
The Pension Plans are currently closed to new hires and the accrual of benefits are frozen to all participants. The Pension Plans’
benefit formula is based on a percentage of average final compensation and years of service as of the plan freeze date. Normal
retirement age under the retirement plan is age 65 with 5 years of service. Pension costs are funded in accordance with minimum
funding standards under the Employee Retirement Income Security Act of 1974 (“ERISA”). Benefits under the Pension Plans are
subject to the U.S. and Puerto Rico Internal Revenue Code limits on compensation and benefits. Benefits under restoration plans
restore benefits to selected employees that are limited under the Banco Popular de Puerto Rico Retirement Plan due to U.S. and
Puerto Rico Internal Revenue Code limits and a compensation definition that excludes amounts deferred pursuant to nonqualified
arrangements.
In addition to providing pension benefits, BPPR provides certain health care benefits for certain retired employees (the “OPEB
Plan”). Regular employees of BPPR, hired before February 1, 2000, may become eligible for health care benefits, provided they
reach retirement age while working for BPPR.
The Corporation’s funding policy is to make annual contributions to the Pension Plans, when necessary, in amounts which fully
provide for all benefits as they become due under the plans.
The Corporation’s pension fund investment strategy is to invest in a prudent manner for the exclusive purpose of providing benefits
to participants. A well defined internal structure has been established to develop and implement a risk-controlled investment strategy
that is targeted to produce a total return that, when combined with BPPR contributions to the fund, will maintain the fund’s ability to
meet all required benefit obligations. Risk is controlled through diversification of asset types, such as investments in domestic and
international equities and fixed income.
Equity investments include various types of stock and index funds. Also, this category includes Popular, Inc.’s common stock. Fixed
income investments include U.S. Government securities and other U.S. agencies’ obligations, corporate bonds, mortgage loans,
mortgage-backed securities and index funds, among others. A designated committee periodically reviews the performance of the
pension plans’ investments and assets allocation. The Trustee and the money managers are allowed to exercise investment
discretion, subject to limitations established by the pension plans’ investment policies. The plans forbid money managers to enter
into derivative transactions, unless approved by the Trustee.
The overall expected long-term rate-of-return-on-assets assumption reflects the average rate of earnings expected on the funds
invested or to be invested to provide for the benefits included in the benefit obligation. The assumption has been determined by
reflecting expectations regarding future rates of return for the plan assets, with consideration given to the distribution of the
investments by asset class and historical rates of return for each individual asset class. This process is reevaluated at least on an
annual basis and if market, actuarial and economic conditions change, adjustments to the rate of return may come into place.
The Pension Plans weighted average asset allocation as of December 31, 2023 and 2022 and the approved asset allocation
ranges, by asset category, are summarized in the table below.
Minimum allotment
Maximum allotment
2023
2022
Equity
%
%
%
%
Debt securities
%
%
%
%
Popular related securities
%
%
%
%
Cash and cash equivalents
%
%
%
%
243
The following table sets forth by level, within the fair value hierarchy, the Pension Plans’ assets at fair value at December 31, 2023
and 2022. Investments measured at net asset value per share (“NAV”) as a practical expedient have not been classified in the fair
value hierarchy, but are presented in order to permit reconciliation of the plans’ assets.
2023
2022
(In thousands)
Level 1
Level 2
Level 3
Measured
at NAV
Total
Level 1
Level 2
Level 3
Measured
at NAV
Total
Obligations of the U.S.
Government, its agencies,
states and political
subdivisions
$
$
$
$
$
$
$
$
$
$
Corporate bonds and
debentures
Equity securities - Common
Stock
Equity securities - ETF's
Foreign commingled trust
funds
Mutual fund
Mortgage-backed securities
Cash and cash equivalents
Accrued investment income
Total assets
$
$
$
$
$
$
$
$
$
$
244
The closing prices reported in the active markets in which the securities are traded are used to value the investments.
Following is a description of the valuation methodologies used for investments measured at fair value:
●
Government and its agencies obligations are based on an active exchange market and on quoted market prices for similar
securities. U.S. agency structured notes are priced based on a bond’s theoretical value from similar bonds defined by
credit quality and market sector and for which the fair value incorporates an option adjusted spread in deriving their fair
value. The fair value of municipal bonds are based on trade data on these instruments reported on Municipal Securities
Rulemaking Board (“MSRB”) transaction reporting system or comparable bonds from the same issuer and credit quality.
These securities are classified as Level 2, except for the governmental index funds that are measured at NAV.
●
in the active market in which the bond is traded. These securities are classified as Level 2, except for the
c
orporate bond
funds that are measured at NAV.
●
and high liquidity are classified as Level 1.
●
market. Highly liquid ETF’s are classified as Level 1 while less liquid ETF’s are classified as Level 2.
●
●
Level 2.
●
since it is available on demand or due to their short-term maturity. Cash and cash equivalents are classified as Level 1.
●
Since there is a lack of observable inputs related to instrument specific attributes, these are reported as Level 3.
The preceding valuation methods may produce a fair value calculation that may not be indicative of net realizable value or reflective
of future fair values. Furthermore, although the plan believes its valuation methods are appropriate and consistent with other market
participants, the use of different methodologies or assumptions to determine the fair value of certain financial instruments could
result in a different fair value measurement at the reporting date.
The following table presents the change in Level 3 assets measured at fair value.
245
(In thousands)
2023
2022
Balance at beginning of year
$
$
Purchases, sales, issuance and settlements (net)
(985 )
Balance at end of year
$
$
There were
years ended December 31, 2023 and 2022. There were
December 31, 2023 and 2022.
Information on the shares of common stock held by the pension plans is provided in the table that follows.
(In thousands, except number of shares information)
2023
2022
Shares of Popular, Inc. common stock
Fair value of shares of Popular, Inc. common stock
$
$
Dividends paid on shares of Popular, Inc. common stock held by the plan
$
$
The following table presents the components of net periodic benefit cost for the years ended December 31, 2023, 2022 and 2021.
Pension Plans
OPEB Plan
(In thousands)
2023
2022
2021
2023
2022
2021
(in thousands)
Service cost
$
$
$
$
$
$
Other operating expenses:
Interest cost
Expected return on plan assets
(34,365 )
(35,388 )
(38,679 )
Recognized net actuarial loss
(2,212 )
Net periodic cost (benefit)
$
$
(545 )
$
(3,810 )
$
$
$
Other Adjustments
Total cost (benefit)
$
$
(545 )
$
(3,810 )
$
$
$
246
The following table sets forth the aggregate status of the plans and the amounts recognized in the consolidated financial statements
at December 31, 2023 and 2022.
Pension Plans
OPEB Plan
(In thousands)
2023
2022
2023
2022
Change in benefit obligation:
Benefit obligation at beginning of year
$
$
$
$
Service cost
Interest cost
Actuarial (gain)/loss
[1]
(194,473 )
(1,180 )
(39,479 )
Benefits paid
(40,790 )
(48,022 )
(6,384 )
(6,619 )
Other adjustments
Benefit obligation at end of year
$
$
$
$
Change in fair value of plan assets:
Fair value of plan assets at beginning of year
$
$
$
$
Actual return on plan assets
(192,807 )
Employer contributions
Benefits paid
(40,790 )
(48,022 )
(6,384 )
(6,619 )
Fair value of plan assets at end of year
$
$
$
$
Funded status of the plan:
Benefit obligation at end of year
$
(635,794 )
$
(628,175 )
$
(117,045 )
$
(118,336 )
Fair value of plan assets at end of year
Funded status at year end
$
$
(8,290 )
$
(117,045 )
$
(118,336 )
Amounts recognized in accumulated other comprehensive loss:
Net loss/(gain)
(25,454 )
(26,486 )
Accumulated other comprehensive loss (AOCL)
$
$
$
(25,454 )
$
(26,486 )
Reconciliation of net (liabilities) assets:
Net liabilities at beginning of year
$
(8,290 )
$
$
(118,336 )
$
(159,958 )
Amount recognized in AOCL at beginning of year, pre-tax
(26,486 )
Amount prepaid (liability) at beginning of year
(144,822 )
(146,965 )
Total benefit cost
(18,648 )
(4,061 )
(4,476 )
Contributions
Amount prepaid (liability) at end of year
(142,499 )
(144,822 )
Amount recognized in AOCL
(200,094 )
(243,434 )
Net asset/(liabilities) at end of year
$
$
(8,290 )
$
(117,045 )
$
(118,336 )
[1]
For 2023, the significant component of the Pension Plans actuarial gain were mainly related to a higher return on the fair value of plan assets partially
offset by an increase in the obligation due to a decrease in the single weighted-average discount rates. For OPEB plans, significant components of
the actuarial gain that changed the benefit obligation were mainly related to the per capita assumption at year end that improved the funded position
and the gain associated with census data updates and plan experience better than expected offset by the decrease in discount rates. For 2022,
significant components of the Pension Plans actuarial gain that changed the benefit obligation were mainly related to an increase in the single
weighted-average discount rates partially offset by a lower return on the fair value of plan assets. For OPEB Plans significant components of the
actuarial gain that change the benefit obligation were mainly related to an increase in discount rates and the per capita claim assumption at year-end
which was lower than expected partially offset by the health care cost trend assumption which was updated to reflect inflationary pressures in the
health care industry.
247
The following table presents the change in accumulated other comprehensive loss (“AOCL”), pre-tax, for the years ended December
31, 2023 and 2022.
(In thousands)
Pension Plans
OPEB Plan
2023
2022
2023
2022
Accumulated other comprehensive loss at beginning of year
$
$
$
(26,486 )
$
Increase (decrease) in AOCL:
Recognized during the year:
Amortization of actuarial losses
(21,465 )
(15,644 )
Occurring during the year:
Net actuarial (gains)/losses
(21,875 )
(1,180 )
(39,479 )
Total (decrease) increase in AOCL
(43,340 )
(39,479 )
Accumulated other comprehensive loss at end of year
$
$
$
(25,454 )
$
(26,486 )
The Corporation estimates the service and interest cost components utilizing a full yield curve approach in the estimation of these
components by applying the specific spot rates along the yield curve used in the determination of the benefit obligation to their
underlying projected cash flows.
To determine benefit obligation at year end, the Corporation used a weighted average of annual spot rates applied to future
expected cash flows for years ended December 31, 2023 and 2022.
The following table presents the discount rate and assumed health care cost trend rates used to determine the benefit obligation
and net periodic benefit cost for the plans:
Pension Plan
OPEB Plan
Weighted average assumptions used to
determine net periodic benefit cost for the
years ended December 31:
2023
2022
2021
2023
2022
2021
Discount rate for benefit obligation
%
%
%
%
%
%
Discount rate for service cost
N/A
N/A
N/A
%
%
%
Discount rate for interest cost
%
0 -
%
%
%
%
%
Expected return on plan assets
0 -
%
0 -
%
0 -
0
%
N/A
N/A
N/A
Initial health care cost trend rate
N/A
N/A
N/A
%
%
%
Ultimate health care cost trend rate
N/A
N/A
N/A
%
%
%
Year that the ultimate trend rate is reached
N/A
N/A
N/A
Pension Plans
OPEB Plan
Weighted average assumptions used to determine benefit obligation at
December 31:
2023
2022
2023
2022
Discount rate for benefit obligation
-
%
-
%
%
%
Initial health care cost trend rate
N/A
N/A
%
%
Ultimate health care cost trend rate
N/A
N/A
%
%
Year that the ultimate trend rate is reached
N/A
N/A
248
The following table presents information for plans with a projected benefit obligation and accumulated benefit obligation in excess of
plan assets for the years ended December 31, 2023 and 2022.
Pension Plans
OPEB Plan
(In thousands)
2023
2022
2023
2022
Projected benefit obligation
$
$
$
$
Accumulated benefit obligation
Fair value of plan assets
The following table presents information for plans with plan assets in excess of its projected benefit obligation and accumulated
benefit obligation for the years ended December 31, 2023 and 2022.
Pension Plans
OPEB Plan
(In thousands)
2023
2022
2023
2022
Projected benefit obligation
$
$
$
$
Accumulated benefit obligation
Fair value of plan assets
The Corporation expects to pay the following contributions to the plans during the year ended December 31, 2024.
(In thousands)
2024
Pension Plans
$
OPEB Plan
$
Benefit payments projected to be made from the plans during the next ten years are presented in the table below.
(In thousands)
Pension Plans
OPEB Plan
2024
$
$
2025
2026
2027
2028
2029 - 2033
249
The table below presents a breakdown of the plans’ assets and liabilities at December 31, 2023 and 2022.
Pension Plans
OPEB Plan
(In thousands)
2023
2022
2023
2022
Non-current assets
$
$
$
$
Current liabilities
Non-current liabilities
Savings plans
The Corporation also provides defined contribution savings plans pursuant to Section 1081.01(d) of the Puerto Rico Internal
Revenue Code and Section 401(k) of the U.S. Internal Revenue Code, as applicable, for substantially all the employees of the
Corporation. Investments in the plans are participant-directed, and employer matching contributions are determined based on the
specific provisions of each plan. Employees are fully vested in the employer’s contribution after five years of service. The cost of
providing these benefits in the year ended December 31, 2023 was $
The plans held
) shares of common stock of the Corporation with a market value of approximately
$
250
Note 31 – Net income per common share
The following table sets forth the computation of net income per common share (“EPS”), basic and diluted, for the years ended
December 31, 2023, 2022 and 2021:
(In thousands, except per share information)
2023
2022
2021
Net income
$
$
$
Preferred stock dividends
(1,412 )
(1,412 )
(1,412 )
Net income applicable to common stock
$
$
$
Average common shares outstanding
Average potential dilutive common shares
Average common shares outstanding - assuming dilution
Basic EPS
$
$
$
Diluted EPS
$
$
$
Potential common shares consist of shares of common stock issuable under the assumed exercise of stock options, restricted stock
and performance share awards using the treasury stock method. This method assumes that the potential common shares are
issued and the proceeds from exercise, in addition to the amount of compensation cost attributed to future services, are used to
purchase shares of common stock at the exercise date. The difference between the number of potential common shares issued and
the shares of common stock purchased is added as incremental shares to the actual number of shares outstanding to compute
diluted earnings per share. Warrants, stock options, restricted stock and performance share awards, if any, that result in lower
potential common shares issued than shares of common stock purchased under the treasury stock method are not included in the
computation of dilutive earnings per share since their inclusion would have an antidilutive effect in earnings per common share.
251
Note 32 – Revenue from contracts with customers
The following table presents the Corporation’s revenue streams from contracts with customers by reportable segment for the years
ended December 31, 2023, 2022
Years ended December 31,
(In thousands)
2023
2022
2021
BPPR
Popular U.S.
BPPR
Popular U.S.
BPPR
Popular U.S.
Service charges on deposit accounts
$
$
$
$
$
$
Other service fees:
Debit card fees
Insurance fees, excluding reinsurance
Credit card fees, excluding late fees and membership fees
Sale and administration of investment products
Trust fees
Total revenue from contracts with customers
[1]
$
$
$
$
$
$
[1] The amounts include intersegment transactions of $
.0 million, $
.0 million and $
2023, 2022 and 2021.
Revenue from contracts with customers is recognized when, or as, the performance obligations are satisfied by the Corporation by
transferring the promised services to the customers. A service is transferred to the customer when, or as, the customer obtains
control of that service. A performance obligation may be satisfied over time or at a point in time. Revenue from a performance
obligation satisfied over time is recognized based on the services that have been rendered to date. Revenue from a performance
obligation satisfied at a point in time is recognized when the customer obtains control over the service. The transaction price, or the
amount of revenue recognized, reflects the consideration the Corporation expects to be entitled to in exchange for those promised
services. In determining the transaction price, the Corporation considers the effects of variable consideration. Variable consideration
is included in the transaction price only to the extent it is probable that a significant reversal in the amount of cumulative revenue
recognized will not occur. The Corporation is the principal in a transaction if it obtains control of the specified goods or services
before they are transferred to the customer. If the Corporation acts as principal, revenues are presented in the gross amount of
consideration to which it expects to be entitled and are not netted with any related expenses. On the other hand, the Corporation is
an agent if it does not control the specified goods or services before they are transferred to the customer. If the Corporation acts as
an agent, revenues are presented in the amount of consideration to which it expects to be entitled, net of related expenses.
Following is a description of the nature and timing of revenue streams from contracts with customers:
Service charges on deposit accounts
Service charges on deposit accounts are earned on retail and commercial deposit activities and include, but are not limited to,
nonsufficient fund fees, overdraft fees and checks stop payment fees. These transaction-based fees are recognized at a point in
time, upon occurrence of an activity or event or upon the occurrence of a condition which triggers the fee assessment. The
Corporation is acting as principal in these transactions.
Debit card fees
Debit card fees include, but are not limited to, interchange fees, surcharging income and foreign transaction fees. These transaction-
based fees are recognized at a point in time, upon occurrence of an activity or event or upon the occurrence of a condition which
triggers the fee assessment. Interchange fees are recognized upon settlement of the debit card payment transactions. The
Corporation is acting as principal in these transactions.
Insurance fees
Insurance fees include, but are not limited to, commissions and contingent commissions. Commissions and fees are recognized
when related policies are effective since the Corporation does not have an enforceable right to payment for services completed to
date. An allowance is created for expected adjustments to commissions earned related to policy cancellations. Contingent
commissions are recorded on an accrual basis when the amount to be received is notified by the insurance company. The
252
Corporation is acting as an agent since it arranges for the sale of the policies and receives commissions if, and when, it achieves
the sale.
Credit card fees
Credit card fees include, but are not limited to, interchange fees, additional card fees, cash advance fees, balance transfer fees,
foreign transaction fees, and returned payments fees. Credit card fees are recognized at a point in time, upon the occurrence of an
activity or an event. Interchange fees are recognized upon settlement of the credit card payment transactions. The Corporation is
acting as principal in these transactions.
Sale and administration of investment products
Fees from the sale and administration of investment products include, but are not limited to, commission income from the sale of
investment products, asset management fees, underwriting fees, and mutual fund fees.
Commission income from investment products is recognized on the trade date since clearing, trade execution, and custody services
are satisfied when the customer acquires or disposes of the rights to obtain the economic benefits of the investment products and
brokerage contracts have no fixed duration and are terminable at will by either party. The Corporation is acting as principal in these
transactions since it performs the service of providing the customer with the ability to acquire or dispose of the rights to obtain the
economic benefits of investment products.
Asset management fees are satisfied over time and are recognized in arrears. At contract inception, the estimate of the asset
management fee is constrained from the inclusion in the transaction price since the promised consideration is dependent on the
market and thus is highly susceptible to factors outside the manager’s influence. As advisor, the broker-dealer subsidiary is acting
as principal.
Underwriting fees are recognized at a point in time, when the investment products are sold in the open market at a markup. When
the broker-dealer subsidiary is lead underwriter, it is acting as an agent. In turn, when it is a participating underwriter, it is acting as
principal.
Mutual fund fees, such as distribution fees, are considered variable consideration and are recognized over time, as the uncertainty
of the fees to be received is resolved as NAV is determined and investor activity occurs. The promise to provide distribution-related
services is considered a single performance obligation as it requires the provision of a series of distinct services that are
substantially the same and have the same pattern of transfer. When the broker-dealer subsidiary is acting as a distributor, it is acting
as principal. In turn, when it acts as third-party dealer, it is acting as an agent.
Trust fees
Trust fees are recognized from retirement plan, mutual fund administration, investment management, trustee, escrow, and custody
and safekeeping services. These asset management services are considered a single performance obligation as it requires the
provision of a series of distinct services that are substantially the same and have the same pattern of transfer. The performance
obligation is satisfied over time, except for optional services and certain other services that are satisfied at a point in time.
Revenues are recognized in arrears, when, or as, the services are rendered. The Corporation is acting as principal since, as asset
manager, it has the obligation to provide the specified service to the customer and has the ultimate discretion in establishing the fee
paid by the customer for the specified services.
253
Note 33 – Leases
The Corporation enters in the ordinary course of business into operating and finance leases for land, buildings and equipment.
These contracts generally do not include purchase options or residual value guarantees. The remaining lease terms of
years considers options to extend the leases for up to
obtain substantially all of the economic benefits from the use of the asset and the right to direct the use of the asset.
The Corporation recognizes right-of-use assets (“ROU assets”) and lease liabilities related to operating and finance leases in its
Consolidated Statements of Financial Condition under the caption of other assets and other liabilities, respectively. Refer to Note 14
and Note 19 to the Consolidated Financial Statements, respectively, for information on the balances of these lease assets and
liabilities.
The Corporation uses the incremental borrowing rate for purposes of discounting lease payments for operating and finance leases,
since it does not have enough information to determine the rates implicit in the leases. The discount rates are based on fixed-rate
and fully amortizing borrowing facilities of its banking subsidiaries that are collateralized. For leases held by non-banking
subsidiaries, a credit spread is added to this rate based on financing transactions with a similar credit risk profile.
The following table presents the undiscounted cash flows of operating and finance leases for each of the following periods:
December 31, 2023
(In thousands)
2024
2025
2026
2027
2028
Later
Years
Total Lease
Payments
Less: Imputed
Interest
Total
Operating Leases
$
$
$
$
$
$
$
(18,255 )
$
Finance Leases
(3,494 )
The following table presents the lease cost recognized by the Corporation in the Consolidated Statements of Operations as follows:
Years ended December 31,
(In thousands)
2023
2022
2021
Finance lease cost:
Amortization of ROU assets
$
$
$
Interest on lease liabilities
Operating lease cost
Short-term lease cost
Variable lease cost
Sublease income
(66 )
(37 )
(70 )
Net gain recognized from sale and leaseback transaction
[1]
(7,007 )
Total lease cost
[2]
$
$
$
[1]
During the quarter ended September 30, 2021, the Corporation recognized the transfer of two corporate office buildings as a sale. Since these
sale and partial leaseback transactions were considered to be at fair value, no portion of the gain on sale was deferred.
[2]
Total lease cost is recognized as part of net occupancy expense, except for the net gain recognized from sale and leaseback transactions which
was included as part of other operating income.
The following table presents supplemental cash flow information and other related information related to operating and finance
leases.
254
Years ended December 31,
(Dollars in thousands)
2023
2022
2021
Cash paid for amounts included in the measurement of lease liabilities:
Operating cash flows from operating leases
[1]
$
$
$
Operating cash flows from finance leases
Financing cash flows from finance leases
[1]
ROU assets obtained in exchange for new lease obligations:
Operating leases
[2]
$
$
$
Finance leases
Weighted-average remaining lease term:
Operating leases
years
years
years
Finance leases
years
years
years
Weighted-average discount rate:
Operating leases
%
%
%
Finance leases
%
%
%
[1]
During the quarter ended March 31, 2021, the Corporation made base lease termination payments amounting to $
the closure of nine branches as a result of the strategic realignment of PB’s New York Metro branch network.
[2]
During the quarter ended September 30, 2021, the Corporation recognized a lease liability of $
the same amount as a result of the partial leaseback of two corporate office buildings.
As of December 31, 2023, the Corporation has additional operating leases contracts that have not yet commenced with an
undiscounted contract amount of $3.9 million, which will have lease terms ranging from
255
Note 34 - Stock-based compensation
Incentive Plan
the Corporation to issue several types of stock-based compensation to employees and directors of the Corporation and/or any of its
subsidiaries (the “2020 Incentive Plan”). The 2020 Incentive Plan replaced the Popular, Inc. 2004 Omnibus Incentive Plan, which
was in effect prior to the adoption of the 2020 Incentive Plan (the “2004 Incentive Plan” and, together with the 2020 Incentive Plan,
the “Incentive Plan”). Participants under the Incentive Plan are designated by the Talent and Compensation Committee of the Board
of Directors (or its delegate, as determined by the Board). Under the Incentive Plan, the Corporation has issued restricted stock and
performance shares to its employees and restricted stock and restricted stock units (“RSUs”) to its directors.
The restricted stock granted under the Incentive Plan to employees becomes vested based on the employees’ continued service
with Popular. Unless otherwise stated in an agreement,
The performance share awards granted under the Incentive Plan consist of the opportunity to receive shares of Popular, Inc.’s
common stock provided that the Corporation achieves certain goals during a three-year performance cycle. The goals will be based
on two metrics weighted equally: the Relative Total Shareholder Return (“TSR”) and the Absolute Return on Average Tangible
Common Equity (“ROATCE”) goal. The TSR metric is considered to be a market condition under ASC 718. For equity settled
awards based on a market condition, the fair value is determined as of the grant date and is not subsequently revised based on
actual performance. The ROATCE metric is considered to be a performance condition under ASC 718. The fair value is
determined based on the probability of achieving the ROATCE goal as of each reporting period. The TSR and ROATCE metrics are
equally weighted and work independently.
The following table summarizes the restricted stock and performance shares activity under the Incentive Plan for members of
management.
256
(Not in thousands)
Shares
Weighted-average
grant date fair value
Non-vested at January 1, 2021
$
Granted
Performance Shares Quantity Adjustment
Vested
(273,974 )
Forfeited
(8,440 )
Non-vested at December 31, 2021
$
Granted
Performance Shares Quantity Adjustment
Vested
(240,033 )
Forfeited
(1,625 )
Non-vested at December 31, 2022
$
Granted
Performance Shares Quantity Adjustment
Vested
(243,133 )
Forfeited
(16,444 )
Non-vested at December 31, 2023
$
During the year ended December 31, 2023,
; 2021 -
) and
performance shares (2022 -
; 2021 -
) were awarded to management under the Incentive Plan.
During the year ended December 31, 2023, the Corporation recognized $
management incentive awards, with a tax benefit of $
million, with a tax benefit of $
and performance shares vested was $
of $
recognized $
$
restricted stock awards and performance shares to members of management at December 31, 2023 was $
expected to be recognized over a weighted-average period of
The following table summarizes the restricted stock activity under the Incentive Plan for members of the Board of Directors:
(Not in thousands)
Units/Stocks
Weighted-average grant
date fair value
Non-vested at January 1, 2021
Granted
$
Vested
(20,638 )
Forfeited
Non-vested at December 31, 2021
Granted
$
Vested
(25,321 )
Forfeited
Non-vested at December 31, 2022
Granted
$
Vested
(39,104 )
Forfeited
Non-vested at December 31, 2023
257
The equity awards granted to members of the Board of Directors of Popular, Inc. (the “Directors”) will vest and become non-
forfeitable on the grant date of such award. Effective in May 2019, all equity awards granted to the Directors may be paid in either
common stock or RSUs at each Directors election. If RSUs are elected, the Directors may defer the delivery of the shares of
common stock underlying the RSUs award until their retirement. To the extent that cash dividends are paid on the Corporation’s
outstanding common stock, the Directors will receive an additional number of RSUs that reflect a reinvested dividend equivalent.
For 2023, 2021 and 2021, Directors elected RSUs and common stock. For the year ended December 31, 2023,
RSUs and no shares of common stock). For the year ended December 31, 2023, $
these RSUs and unrestricted stocks were recognized, with a tax benefit of $
million; 2021 - $
ended December 31, 2023 for the Directors was $
258
Note 35 – Income taxes
The components of income tax expense for the years ended December 31, 2023, 2022, and 2021 are summarized in the following
table.
(In thousands)
2023
2022
2021
Current income tax expense:
Puerto Rico
$
$
$
Federal and States
Deferred income tax (benefit) expense:
Puerto Rico
(50,871 )
(4,373 )
Federal and States
(28,756 )
(43,139 )
(33,129 )
Total income tax expense
$
$
$
The reasons for the difference between the income tax expense applicable to income before provision for income taxes and the
amount computed by applying the statutory tax rate in Puerto Rico were as follows:
2023
2022
2021
(In thousands)
Amount
% of pre-tax
income
Amount
% of pre-tax
income
Amount
% of pre-tax
income
Computed income tax at statutory rates
$
%
$
%
$
%
Net benefit of tax exempt interest income
(95,222 )
(14 )
(165,065 )
(13 )
(139,426 )
(12 )
Effect of income subject to preferential tax rate
(1,854 )
(86,797 )
(7 )
(11,981 )
(1 )
Deferred tax asset valuation allowance
(21,469 )
(2 )
NOL Adjustments
(34,817 )
(3 )
Difference in tax rates due to multiple jurisdictions
(12,857 )
(2 )
(26,887 )
(2 )
(30,719 )
(3 )
Change in tax rates
(18,714 )
(3 )
Unrecognized tax benefits
(1,529 )
(1,503 )
(5,484 )
Other tax benefits
(2,925 )
State and local taxes
Others
(13,734 )
(2 )
(9,227 )
(1 )
(5,398 )
Income tax expense
$
%
$
%
$
%
For the year ended December 31, 2023, the Corporation recorded income tax expense of $
for the same period of 2022. The net increase of $
source of taxable income between both years. For the year ended December 31, 2023, the income before tax was lower than for
the year ended December 31, 2022, which would have resulted in a lower income tax expense; however, the income tax expense
for 2022 benefited from: the reversal of a portion of the deferred tax assets valuation allowance of the U. S. operations, resulting in
an income tax benefit of $
a preferential tax rate.
Deferred income taxes reflect the net tax effects of temporary differences between the carrying amounts of assets and liabilities for
financial reporting purposes and their tax bases. Significant components of the Corporation’s deferred tax assets and liabilities at
December 31, 2023 and 2022 were as follows:
259
December 31, 2023
PR
US
Total
Deferred tax assets:
Tax credits available for carryforward
$
$
$
Net operating loss and other carryforward available
Postretirement and pension benefits
Allowance for credit losses
Depreciation
FDIC-assisted transaction
Lease liability
Unrealized net loss on investment securities
Difference in outside basis from pass-through entities
Mortgage Servicing Rights
Other temporary differences
Total gross deferred tax assets
Deferred tax liabilities:
Intangibles
Right of use assets
Deferred loan origination fees/cost
(1,056 )
Loans acquired
Other temporary differences
Total gross deferred tax liabilities
Valuation allowance
Net deferred tax asset
$
$
$
PR
US
Total
Deferred tax assets:
Tax credits available for carryforward
$
$
$
Net operating loss and other carryforward available
Postretirement and pension benefits
Allowance for credit losses
Depreciation
FDIC-assisted transaction
Lease liability
Unrealized net loss on investment securities
Difference in outside basis from pass-through entities
Mortgage Servicing Rights
Other temporary differences
Total gross deferred tax assets
Deferred tax liabilities:
Intangibles
Right of use assets
Deferred loan origination fees/cost
Loans acquired
Other temporary differences
Total gross deferred tax liabilities
Valuation allowance
Net deferred tax asset
$
$
$
260
The net deferred tax asset shown in the table above at December 31, 2023 is reflected in the consolidated statements of financial
condition as $
in deferred tax liabilities (in the “other liabilities” caption) (December 31, 2022- $
assets or liabilities of individual tax-paying subsidiaries of the Corporation in their respective tax jurisdiction, Puerto Rico or the
United States.
The net reduction in the valuation allowance of approximately $
was due primarily to the change in the blended state tax rate applicable to net operating losses of the U.S. operation.
The deferred tax asset related to the NOLs and other carryforwards as of December 31, 2023, expires as follows:
(In thousands)
2024
$
2025
2026
2027
2028
2029
2030
2031
2032
2033
2034
2035
$
At December 31, 2023 the net deferred tax asset of the U.S. operations amounted to $
$
deferred tax asset by taxing jurisdiction. The U. S. operations sustained profitability for the three years period ended December 31,
2023. The financial results for year 2023 were lower than prior year; however, this additional component of negative evidence was
offset by positive evidence of recent historical results, still demonstrating financial stability for the U. S. Operations. The historical
financial results are objectively verifiable positive evidence, evaluated together with the positive evidence of stable credit metrics, in
combination with the length of the expiration of the NOLs. On the other hand, the Corporation evaluated the negative evidence
accumulated over the years, including financial results lower than expectations and challenges to the economy due to inflationary
pressures and global geopolitical uncertainty that have resulted in a reduction of pre-tax income for the year 2023. As of December
31, 2023, after weighting all positive and negative evidence, the Corporation concluded that it is more likely than not that
approximately $
realized. The Corporation based this determination on its estimated earnings available to realize the deferred tax asset for the
remaining carryforward period, together with the historical level of book income adjusted by permanent differences. Management
will continue to monitor and review the U.S. operation’s results, the pre-tax earnings forecast, and other factors, including net
income versus forecast, targeted loan growth, net interest income margin, changes in deposits costs, allowance for credit losses,
charge offs, NPLs inflows and NPA balances, to assess the future realization of the deferred tax asset.
At December 31, 2023, the Corporation’s net deferred tax assets related to its Puerto Rico operations amounted to $
The Corporation’s Puerto Rico Banking operation has strong historical record of profitability. This is considered a strong piece of
objectively verifiable positive evidence that outweigh any negative evidence considered by Management in the evaluation of the
realization of the deferred tax asset. Based on this evidence and Management’s estimate of future taxable income, the Corporation
has concluded that it is more likely than not that such net deferred tax asset of the Puerto Rico Banking operations will be realized.
The Holding Company operation is in a cumulative loss position, taking into account taxable income exclusive of reversing
temporary differences, for the three years period ended December 31, 2023. Management expects these losses will be a trend in
future years. This objectively verifiable negative evidence is considered by management strong negative evidence that will suggest
that income in future years will be insufficient to support the realization of all of the deferred tax asset. After weighting all positive
261
and negative evidence, management concluded, as of the reporting date, that it is more likely than not that the Holding Company
will not be able to realize any portion of the deferred tax assets. Accordingly, the Corporation has maintained a full valuation
allowance on the deferred tax asset of $
The Corporation’s subsidiaries in the United States file a consolidated federal income tax return. The intercompany settlement of
taxes paid is based on tax sharing agreements which generally allocate taxes to each entity based on a separate return basis.
The following table presents a reconciliation of unrecognized tax benefits.
(In millions)
Balance at January 1, 2022
$
Reduction as a result of lapse of statute of limitations
(1.0 )
Balance at December 31, 2022
$
Reduction as a result of change in tax position
(1.0 )
Balance at December 31, 2023
$
At December 31, 2023, the total amount of interest recognized in the statement of financial condition approximated $
(2022 - $
due to the expiration of the statute of limitation (2022 - $
determined that, as of December 31, 2023 and 2022, there was no need to accrue for the payment of penalties. The Corporation’s
policy is to report interest related to unrecognized tax benefits in income tax expense, while the penalties, if any, are reported in
other operating expenses in the consolidated statements of operations.
After consideration of the effect on U.S. federal tax of unrecognized U.S. state tax benefits, the total amount of unrecognized tax
benefits, including U.S. and Puerto Rico that, if recognized, would affect the Corporation’s effective tax rate, was approximately $
million at December 31, 2023 (2022 - $
The amount of unrecognized tax benefits may increase or decrease in the future for various reasons including adding amounts for
current tax year positions, expiration of open income tax returns due to the statute of limitations, changes in management’s
judgment about the level of uncertainty, status of examinations, litigation and legislative activity, and the addition or elimination of
uncertain tax positions.
The Corporation and its subsidiaries file income tax returns in Puerto Rico, the U.S. federal jurisdiction, various U.S. states and
political subdivisions, and foreign jurisdictions. As of December 31, 2023, the following years remain subject to examination in the
U.S. Federal jurisdiction – 2020 and thereafter and in the Puerto Rico jurisdiction – 2018 and thereafter.
262
Note 36 – Supplemental disclosure on the consolidated statements of cash flows
Additional disclosures on cash flow information and non-cash activities for the years ended December 31, 2023, 2022 and 2021 are
listed in the following table:
(In thousands)
2023
2022
2021
Income taxes paid
$
$
$
Interest paid
Non-cash activities:
[1]
[1]
Includes loans securitized into trading securities and subsequently sold before year end.
The following table provides a reconciliation of cash and due from banks, and restricted cash reported within the Consolidated
Statement of Financial Condition that sum to the total of the same such amounts shown in the Consolidated Statement of Cash
Flows.
(In thousands)
December 31, 2023
December 31, 2022
December 31, 2021
Cash and due from banks
$
$
$
Restricted cash and due from banks
Restricted cash in money market investments
Total cash and due from banks, and restricted cash
[2]
$
$
$
[2]
Refer to Note 5 - Restrictions on cash and due from banks and certain securities for nature of restrictions.
263
Note 37 – Segment reporting
The Corporation’s corporate structure consists of
markets the segments serve, as well as on the products and services offered by the segments.
Banco Popular de Puerto Rico:
The Banco Popular de Puerto Rico reportable segment includes commercial, consumer and retail banking operations conducted at
BPPR, including U.S. based activities conducted through its New York Branch. It also includes the lending operations of Popular
Auto and Popular Mortgage. Other financial services within the BPPR segment include the trust service units of BPPR, asset
management services of Popular Asset Management, the brokerage and investment banking operations of Popular Securities, and
the insurance agency and reinsurance businesses of Popular Insurance, Popular Risk Services, Popular Life Re, and Popular Re.
Popular U.S.:
Popular U.S. reportable segment consists of the banking operations of Popular Bank (PB), Popular Insurance Agency, U.S.A., and
PEF. PB operates through a retail branch network in the U.S. mainland under the name of Popular, and equipment leasing and
financing services through PEF. Popular Insurance Agency, U.S.A. offers investment and insurance services across the PB branch
network.
The Corporate group consists primarily of the holding companies Popular, Inc., Popular North America, Popular International Bank
and certain of the Corporation’s investments accounted for under the equity method, including Evertec, until August 15, 2022, and
Centro Financiero BHD, León.
The accounting policies of the individual operating segments are the same as those of the Corporation. Transactions between
reportable segments are primarily conducted at market rates, resulting in profits that are eliminated for reporting consolidated results
of operations.
The tables that follow present the results of operations and total assets by reportable segments:
December 31, 2023
Intersegment
(In thousands)
BPPR
Popular U.S.
Eliminations
Net interest income
$
$
$
Provision for credit losses
Non-interest income
(404 )
Amortization of intangibles
Goodwill impairment charge
Depreciation expense
Other operating expenses
(404 )
Income tax expense
Net income
$
$
$
Segment assets
$
$
$
(426,058 )
Reportable
Total
(In thousands)
Corporate
Eliminations
Popular, Inc.
Net interest income (expense)
$
$
(30,778 )
$
$
Provision for credit losses (benefit)
(300 )
Non-interest income
(4,827 )
Amortization of intangibles
Goodwill impairment charge
Depreciation expense
Other operating expenses
(4,525 )
Income tax expense (benefit)
(1,333 )
(80 )
Net income
$
$
$
(222 )
$
Segment assets
$
$
$
(5,258,849 )
$
264
December 31, 2022
Intersegment
(In thousands)
BPPR
Popular U.S.
Net interest income
$
$
$
Provision for credit losses
Non-interest income
(547 )
Amortization of intangibles
Goodwill impairment charge
Depreciation expense
Other operating expenses
(543 )
Income tax expense
(25,205 )
Net income
$
$
$
(1 )
Segment assets
$
$
$
(421,781 )
Reportable
Total
(In thousands)
Corporate
Eliminations
Popular, Inc.
Net interest income (expense)
$
$
(29,149 )
$
$
Provision for credit losses
Non-interest income
(4,460 )
Amortization of intangibles
Goodwill impairment charge
Depreciation expense
Other operating expenses
(4,822 )
Income tax expense
Net income
$
$
$
$
Segment assets
$
$
$
(5,078,964 )
$
December 31, 2021
Banco Popular
Intersegment
(In thousands)
de Puerto Rico
Popular U.S.
Net interest income
$
$
$
Provision for credit losses (benefit)
(136,352 )
(56,897 )
Non-interest income
(548 )
Amortization of intangibles
Depreciation expense
Other operating expenses
(544 )
Income tax expense
Net income
$
$
$
Segment assets
$
$
$
(31,528 )
Reportable
Total
(In thousands)
Corporate
Eliminations
Popular, Inc.
Net interest income (expense)
$
$
(38,159 )
$
$
Provision for credit losses (benefit)
(193,249 )
(215 )
(193,464 )
Non-interest income
(3,687 )
Amortization of intangibles
Depreciation expense
Other operating expenses
(545 )
(3,725 )
Income tax expense (benefit)
(1,085 )
Net income
$
$
$
(48 )
$
Segment assets
$
$
$
(5,065,038 )
$
265
Geographic Information
The following information presents selected financial information based on the geographic location where the Corporation conducts
its business. The banking operations of BPPR are primarily based in Puerto Rico, where it has the largest retail banking franchise.
BPPR also conducts banking operations in the U.S. Virgin Islands, the British Virgin Islands and New York. BPPR’s banking
operations in the mainland United States include commercial lending activities. BPPR’s commercial lending activities in the U.S.,
through its New York Branch, include periodic loan participations with PB. During the year ended December 31, 2023, BPPR
participated in loans originated by PB totaling $
million (2022 - $
segment related to its operations in the United States amounted to $
multifamily loans (2022 - $
(2022 - $
2023, the BPPR segment generated approximately $
operations in the United States, including net interest income and other service fees. In the Virgin Islands, the BPPR segment offers
banking products, including loans and deposits. The BPPR segment generated $
December 31, 2023 (2022 - $
(In thousands)
2023
2022
2021
Revenues:
[1]
Puerto Rico
$
$
$
United States
Other
Total consolidated revenues
$
$
$
[1]
Total revenues include net interest income, service charges on deposit accounts, other service fees, mortgage banking activities, net gain on sale
of debt securities, net gain (loss), including impairment on equity securities, net profit (loss) on trading account debt securities, net loss on sale of
loans, including valuation adjustments on loans held-for-sale, adjustments to indemnity reserves on loans sold, and other operating income.
Selected Balance Sheet Information
(In thousands)
2023
2022
2021
Puerto Rico
Total assets
$
$
$
Loans
Deposits
United States
Total assets
$
$
$
Loans
Deposits
Other
Total assets
$
$
$
Loans
Deposits
[1]
[1]
Represents deposits from BPPR operations located in the U.S. and British Virgin Islands.
266
Note 38 - Popular, Inc. (holding company only) financial information
The following condensed financial information presents the financial position of Popular, Inc. Holding Company only at December
31, 2023 and 2022, and the results of its operations and cash flows for the years ended December 31, 2023, 2022 and 2021.
Condensed Statements of Condition
December 31,
(In thousands)
2023
2022
ASSETS
Cash and due from banks (includes $
))
$
$
Money market investments
Debt securities held-to-maturity, at amortized cost (includes $
securities from statutory trusts (2022 - $
))
[1]
Equity securities, at lower of cost or realizable value
Investment in BPPR and subsidiaries, at equity
Investment in Popular North America and subsidiaries, at equity
Investment in other non-bank subsidiaries, at equity
Other loans
Less - Allowance for credit losses
Premises and equipment
Investment in equity method investees
Other assets (includes $
))
Total assets
$
$
LIABILITIES AND STOCKHOLDERS' EQUITY
Notes payable
$
$
Other liabilities (includes $
))
Stockholders’ equity
Total liabilities and stockholders’ equity
$
$
[1] Refer to Note 18 to the consolidated financial statements for information on the statutory trusts.
Condensed Statements of Operations
Years ended December 31,
(In thousands)
2023
2022
2021
Income:
Dividends from subsidiaries
$
$
$
Interest income (includes $
; 2021 -
$
))
Losses (earnings) from investments in equity method investees
(84 )
Other operating income
Net gains (losses), including impairment, on equity securities
(4,446 )
(525 )
Total income
Expenses:
Interest expense
Provision for credit losses (benefit)
(300 )
(215 )
Operating expense (includes expenses for services provided by subsidiaries and affiliate of
$
)), net of reimbursement by subsidiaries for services
provided by parent of $
)
Total expenses
Income before income taxes and equity in undistributed earnings of subsidiaries
Income tax expense
Income before equity in undistributed earnings of subsidiaries
Equity in undistributed earnings of subsidiaries
Net income
$
$
$
Comprehensive income (loss), net of tax
$
$
(1,097,218 )
$
267
Condensed Statements of Cash Flows
Years ended December 31,
(In thousands)
2023
2022
2021
Cash flows from operating activities:
Net income
$
$
$
Adjustments to reconcile net income to net cash provided by operating activities:
Equity in earnings of subsidiaries, net of dividends or distributions
(357,014 )
(526,603 )
(151,737 )
Provision for credit (benefit) losses
(300 )
(215 )
Amortization of intangibles
Net accretion of discounts and amortization of premiums and deferred fees
Share-based compensation
Losses (earnings) from investments under the equity method, net of dividends or distributions
(14,170 )
(26,360 )
(Gain) loss on:
Disposition of stock as part of the Evertec Transactions
(137,813 )
Sale of foreclosed assets, including write-downs
Net increase in:
Equity securities
(5,158 )
(339 )
(3,662 )
Other assets
(62 )
(1,952 )
(1,970 )
Net increase (decrease) in:
Interest payable
(1,042 )
Other liabilities
(3,377 )
Total adjustments
(351,099 )
(661,656 )
(150,040 )
Net cash provided by operating activities
Cash flows from investing activities:
Net (increase) decrease in money market investments
(165,000 )
(94,000 )
Proceeds from calls, paydowns, maturities and redemptions of investment securities held-to-maturity
Net repayments on other loans
Capital contribution to subsidiaries
(4,150 )
(54,188 )
(12,900 )
Return of capital from wholly owned subsidiaries
Proceeds from disposition of stock as part of the Evertec Transactions
Acquisition of premises and equipment
(2,266 )
(2,224 )
(1,788 )
Proceeds from sale of premises and equipment
Proceeds from sale of foreclosed assets
Net cash (used in) provided by investing activities
(106,096 )
(101,038 )
Cash flows from financing activities:
Payments of notes payable
(300,000 )
(186,664 )
Proceeds from issuance of notes payable
Proceeds from issuance of common stock
Dividends paid
(159,860 )
(161,516 )
(141,466 )
Net payments for repurchase of common stock
(1,396 )
(631,965 )
(350,656 )
Payments related to tax withholding for share-based compensation
(4,083 )
(5,771 )
(5,107 )
Net cash used in financing activities
(58,233 )
(785,773 )
(673,400 )
Net increase in cash and due from banks, and restricted cash
Cash and due from banks, and restricted cash at beginning of period
Cash and due from banks, and restricted cash at end of period
$
$
$
268
During the year ended December 31, 2023, Popular, Inc. (parent company only) received dividend distributions from PNA
amounting to $
2021 - $
Inc. received distributions from its direct equity method investees amounting to $
million were related to dividend distributions (2021 - $
Notes payable include junior subordinated debentures issued by the Corporation that are associated to capital securities issued by
the Popular Capital Trust II and medium-term notes. Refer to Note 18 for a description of significant provisions related to these
junior subordinated debentures. The following table presents the aggregate amounts by contractual maturities of notes payable at
December 31, 2023:
Year
(In thousands)
2024
$
2025
2026
2027
2028
Later years
Total
$
269
SIGNATURES
Pursuant to the requirements of Section 13 or 15 (d) of the Securities Exchange Act of 1934, the registrant has duly caused this
report to be signed on its behalf by the undersigned, thereunto duly authorized on February 29, 2024.
POPULAR, INC.
(Registrant)
By: /S/ IGNACIO ALVAREZ
Ignacio Alvarez
President and
Chief Executive Officer
Pursuant to the requirements of the Securities Exchange Act of 1934, this report has been signed below by the following persons
on behalf of the registrant and in the capacities and on the dates indicated.
/S/ RICHARD L. CARRIÓN
Chairman of the Board
2/29/2024
Richard L. Carrión
Chairman of the Board
/S/ IGNACIO ALVAREZ
President, Chief Executive Officer
2/29/2024
Ignacio Alvarez
and Director
President and Chief Executive Officer
/S/ CARLOS J. VÁZQUEZ
Principal Financial Officer
2/29/2024
Carlos J. Vázquez
Executive Vice President
/S/ JORGE J. GARCÍA
Principal Accounting Officer
2/29/2024
Jorge J. García
Senior Vice President and Comptroller
/S/ ALEJANDRO M. BALLESTER
Director
2/29/2024
Alejandro M. Ballester
S/ MARÍA LUISA FERRÉ
Director
2/29/2024
María Luisa Ferré
/S/ C. KIM GOODWIN
Director
2/29/2024
C. Kim Goodwin
/S/ JOAQUÍN E. BACARDÍ, III
Director
2/29/2024
Joaquín E. Bacardi, III
/S/ CARLOS A. UNANUE
Director
2/29/2024
Carlos A. Unanue
/S/ JOHN W. DIERCKSEN
Director
2/29/2024
John W. Diercksen
/S/ MYRNA M. SOTO
Director
2/29/2024
Myrna M. Soto
/S/ ROBERT CARRADY
Director
2/29/2024
Robert Carrady
/S/ JOSÉ R. RODRÍGUEZ
Director
2/29/2024
José R. Rodríguez
/S/ BETTY DEVITA
Director
2/29/2024
Betty Devita
/S/ ALEJANDRO M. SÁNCHEZ
Director
2/29/2024
Alejandro M. Sánchez