UNITED STATES
SECURITIES AND EXCHANGE COMMISSION
Washington, DC 20549
FORM 10-K
| ANNUAL REPORT PURSUANT TO SECTION 13 OR 15(d) OF THE SECURITIES EXCHANGE ACT OF 1934, | |||||
for the Fiscal Year Ended December 31 , 2023
Commission File Number: 0-23695
(Exact name of registrant as specified in its charter)
| (State or other jurisdiction of incorporation or organization) | (I.R.S. Employer Identification No.) | |||||||||||||
| (Address of principal executive offices) | (Zip Code) | |||||||||||||
(617 ) 425-4600
(Registrant's telephone number, including area code)
Securities registered pursuant to Section 12(b) of the Act:
| Title of Each Class | Trading Symbol(s) | Name of Each Exchange on Which Registered | ||||||
Securities registered pursuant to Section 12 (g) of the Act: None
Indicate by check mark if the registrant is a well-known seasoned issuer, as defined in Rule 405 of the Securities Act of 1934. Yes ☐ No ☒
Indicate by check mark if the registrant is not required to file reports pursuant to Section 13 or 15(d) of the Securities Act of 1934. Yes ☐ No ☒
Indicate by check mark whether the registrant (1) has filed all reports required to be filed by Section 13 or 15(d) of the Securities Exchange Act of 1934 during the preceding 12 months (or for such shorter period that the registrant was required to file such reports) and (2) has been subject to such filing requirement for the past 90 days. Yes ☒ No ☐
Indicate by check mark whether the registrant (1) has submitted electronically every Interactive Data File required to be submitted pursuant to Rule 405 of Regulation S-T (§232.405 of this chapter) during the preceding 12 months (or for such shorter period that the registrant was required to submit such files). Yes ☒ No ☐
Indicate by check mark whether the registrant is a large accelerated filer, an accelerated filer, a non-accelerated filer, a smaller reporting company, or emerging growth company. See the definitions of "large accelerated filer", "accelerated filer", "smaller reporting company", and "emerging growth company" in Rule 12b-2 of the Exchange Act.
| ☒ | Accelerated filer | ☐ | ||||||||||||||||||
| Non-accelerated filer | ☐ | Smaller Reporting Company | ||||||||||||||||||
| Emerging growth company | ||||||||||||||||||||
If an emerging growth company, indicate by check mark if the registrant has elected not to use the extended transition period for complying with any new or revised financial accounting standards provided pursuant to Section 13(a) of the Exchange Act. ☐
Indicate by check mark whether the registrant has filed a report on and attestation to its management’s assessment of the effectiveness of its internal control over financial reporting under Section 404(b) of the Sarbanes-Oxley Act (15 U.S.C. 7262(b)) by the registered public accounting firm that prepared or issued its audit report. ☒
If securities are registered pursuant to Section 12(b) of the Act, indicate by check mark whether the financial statements of the registrant included in the filing reflect the correction of an error to previously issued financial statements. ☐
Indicate by check mark whether any of those error corrections are restatements that required a recovery analysis of incentive-based compensation received by any of the registrant’s executive officers during the relevant recovery period pursuant to
§240.10D-1(b). ☐
Indicate by check mark if the registrant is a shell company (as defined in Rule 12b-2 of the Act). Yes ☐ No ☒
As of June 30, 2023, the last business day of the registrant's most recently completed second fiscal quarter, the aggregate market value of the shares of common stock held by nonaffiliates, based upon the closing price per share of the registrant's common stock as reported on Nasdaq, was approximately $754.4 million.
As of February 27, 2024, there were 96,998,075 and 88,894,577 shares of the registrant's common stock, par value $0.01 per share, issued and outstanding, respectively.
DOCUMENTS INCORPORATED BY REFERENCE
Portions of the Registrant’s Proxy Statement for the 2024 Annual Meeting of Shareholders are incorporated herein by reference in Part III of this Annual Report on Form 10-K to the extent stated herein. Such proxy statement will be filed with the Securities and Exchange Commission within 120 days of the Registrant’s fiscal year ending December 31, 2023.
BROOKLINE BANCORP, INC. AND SUBSIDIARIES
2023 FORM 10-K
Table of Contents
| Page | ||||||||
FORWARD-LOOKING STATEMENTS
Certain statements contained in this Annual Report on Form 10-K that are not historical facts may constitute forward-looking statements within the meaning of Section 27A of the Securities Act of 1933, as amended, and Section 21E of the Securities Exchange Act of 1934, as amended, and are intended to be covered by the safe harbor provisions of the Private Securities Litigation Reform Act of 1995. Forward-looking statements involve risks and uncertainties. These statements, which are based on certain assumptions and describe Brookline Bancorp, Inc.'s (the "Company’s") future plans, strategies and expectations, can generally be identified by the use of the words "may," "will," "should," "could," "would," "plan," "potential," "estimate," "project," "believe," "intend," "anticipate," "expect," "target" and similar expressions. These statements include, among others, statements regarding the Company's intent, belief or expectations with respect to economic conditions, trends affecting the Company's financial condition or results of operations, and the Company's exposure to market, liquidity, interest-rate and credit risk.
Forward-looking statements are based on the current assumptions underlying the statements and other information with respect to the beliefs, plans, objectives, goals, expectations, anticipations, estimates and intentions of management and the financial condition, results of operations, future performance and business are only expectations of future results. Although the Company believes that the expectations reflected in the Company’s forward-looking statements are reasonable, the Company’s actual results could differ materially from those projected in the forward-looking statements as a result of, among other important factors, changes in interest rates; general economic conditions (including inflation and concerns about liquidity) on a national basis or in the local markets in which the Company operates; turbulence in the capital and debt markets; competitive pressures from other financial institutions; changes in consumer behavior due to changing political, business and economic conditions, or legislative or regulatory initiatives; changes in the value of securities and other assets in the Company’s investment portfolio; increases in loan and lease default and charge-off rates; the adequacy of allowances for loan and lease losses; decreases in deposit levels that necessitate increases in borrowing to fund loans and investments; operational risks including, but not limited to, cybersecurity incidents, fraud, natural disasters, and future pandemics; changes in regulation; the possibility that future credit losses may be higher than currently expected due to changes in economic assumptions and adverse economic developments; the risk that goodwill and intangibles recorded in the Company’s financial statements will become impaired; and changes in assumptions used in making such forward-looking statements; and the other risks and uncertainties detailed in Item 1A, "Risk Factors." Forward-looking statements speak only as of the date on which they are made. The Company does not undertake any obligation to update any forward-looking statement to reflect circumstances or events that occur after the date the forward-looking statements are made.
PART I
Item 1. Business
General
Brookline Bancorp, Inc. (the "Company"), a Delaware corporation, is the holding company for Brookline Bank and its subsidiaries, Bank Rhode Island ("BankRI") and its subsidiaries, PCSB Bank and its subsidiaries, and Clarendon Private, LLC (“Clarendon Private”). Brookline Securities Corp, previously a subsidiary of Brookline Bancorp, Inc., was dissolved in November 2023.
Brookline Bank, headquartered in Boston, Massachusetts, has three wholly-owned subsidiaries, Longwood Securities Corp., First Ipswich Insurance Agency, and Eastern Funding LLC ("Eastern Funding"), and operates 29 full-service banking offices and two lending offices in the Greater Boston metropolitan area. In 2020, First Ipswich Bank, formerly a wholly-owned subsidiary of the Company, was merged with and into Brookline Bank.
BankRI, headquartered in Providence, Rhode Island, has three direct subsidiaries, Acorn Insurance Agency, BRI Realty Corp., and BRI Investment Corp. and its wholly-owned subsidiary, BRI MSC Corp., and operates 22 full-service banking offices in the Greater Providence, Rhode Island, area. Macrolease Corporation, previously a subsidiary of BankRI, was merged into Eastern Funding LLC in the second quarter of 2022.
On January 1, 2023, the Company completed its acquisition of PCSB Financial Corporation ("PCSB"), the parent company of PCSB Bank. PCSB Bank, headquartered in Yorktown Heights, New York, operates as a separate subsidiary of the Company. PCSB Bank has one wholly-owned subsidiary, UpCounty Realty Corp., and operates 14 banking offices throughout the Lower Hudson Valley of New York.
The Company, through Brookline Bank, BankRI and PCSB Bank (the "Banks"), offers a wide range of commercial, business and retail banking services, including a full complement of cash management products, on-line banking services, and consumer and residential loans and investment services, designed to meet the financial needs of small- to mid-sized businesses and individuals throughout Central New England and the Lower Hudson Valley in New York. Specialty lending activities, including equipment financing, are focused in the New York and New Jersey metropolitan area, with services offered throughout the United States. As full-service financial institutions, the Banks and their subsidiaries focus on the continued
1
addition of well-qualified customers, the deepening of long-term banking relationships through a full complement of products and excellent customer service, and strong risk management. Clarendon Private is a registered investment advisor with the Securities and Exchange Commission (the "SEC"). Through Clarendon Private, the Company offers a wide range of wealth management services to individuals, families, endowments and foundations to help these clients meet their long-term financial goals.
The Company's headquarters and executive management are located at 131 Clarendon Street, Boston, Massachusetts 02116, and its telephone number is 617-425-4600.
Overview of Results
The loan and lease portfolio increased $2.0 billion, or 26.1%, to $9.6 billion at December 31, 2023 from $7.6 billion at December 31, 2022. The Company's commercial loan portfolios, which totaled $8.2 billion, or 84.7% of total loans and leases, as of December 31, 2023, increased $1.7 billion, or 27.2%, from $6.4 billion, or 84.0% of total loans and leases, as of December 31, 2022, primarily driven by the acquisition of PCSB.
Total deposits increased $2.0 billion, or 31.1%, to $8.5 billion at December 31, 2023 from $6.5 billion as of December 31, 2022, primarily driven by the acquisition of PCSB. Core deposits, which include demand checking, NOW, money market and savings accounts, increased 15.3% to $6.1 billion as of December 31, 2023 from $5.3 billion at December 31, 2022. The Company's core deposits were 71.3% of total deposits at December 31, 2023, a decrease from 81.0% at December 31, 2022.
The allowance for loan and lease losses increased $19.0 million, or 19.3%, to $117.5 million as of December 31, 2023 from $98.5 million as of December 31, 2022. The ratio of the allowance for loan and lease losses to total loans and leases was 1.22% as of December 31, 2023 compared to 1.29% as of December 31, 2022. Nonperforming assets as of December 31, 2023 were $45.3 million, up from $15.3 million at the end of 2022. Nonperforming assets were 0.40% and 0.17% of total assets as of December 31, 2023 and December 31, 2022, respectively.
Net interest income increased $39.9 million, or 13.3%, to $339.7 million in 2023 compared to $299.8 million in 2022. Net interest margin decreased 43 basis points to 3.24% in 2023 from 3.67% in 2022. Net income for 2023 decreased $34.7 million, or 31.7%, to $75.0 million from $109.7 million for 2022. Basic and fully diluted earnings per common share ("EPS") decreased to $0.85 for 2023 from $1.42 for 2022. See Item 7. “Management's Discussion and Analysis of Financial Condition and Results of Operations.”
Competition
The Company provides banking services in the Greater Boston, Massachusetts, Providence, Rhode Island, and New York, New York, metropolitan marketplaces, each of which is dominated by several large national banking institutions. The Company faces considerable competition from banking and non-banking organizations, including traditional banks, online banks, financial technology companies, wealth management companies and others, in its market area for all aspects of banking and related service activities. Competitive factors considered for loan generation include product offerings, interest rates, terms offered, services provided and geographic locations. Competitive factors considered in attracting and retaining deposits include product offerings and rate of return, convenient branch locations and automated teller machines and online access to accounts.
Market Area and Credit Risk Concentration
As of December 31, 2023, the Company, through its Banks, operated 65 full-service banking offices in Greater Boston, Massachusetts, Rhode Island and New York. The Banks' deposits are gathered from the general public, primarily in the communities in which the banking offices are located. Based on June 30, 2023, Federal Deposit Insurance Corporation ("FDIC") statistics, the five largest banks in Massachusetts have an aggregate market share of approximately 68%, the three largest banks in Rhode Island have an aggregate deposit market share of approximately 68%, and the three largest banks in New York have an aggregate deposit market share of approximately 51%. The Banks' lending activities are concentrated primarily in the Greater Boston, Massachusetts, and Providence, Rhode Island, metropolitan areas, eastern Massachusetts, southern New Hampshire, other Rhode Island areas and the Lower Hudson Valley in New York. In addition, the Company, through Eastern Funding, conducts equipment financing activities in the greater New York and New Jersey metropolitan area and elsewhere in the United States.
Commercial real estate loans. Multi-family and commercial real estate mortgage loans typically generate higher yields, but also involve greater credit risk. In addition, many of the Banks' borrowers have more than one multi-family or commercial real estate loan outstanding. The Banks manage this credit risk by prudent underwriting with conservative debt service coverage and loan-to-value ratios at origination; lending to seasoned real estate owners/managers, frequently with personal guarantees of repayment; using reasonable appraisal practices; cross-collateralizing loans to one borrower when deemed prudent; and limiting
2
the amount and types of construction lending. As of December 31, 2023, the largest commercial real estate relationship in the Company's portfolio was $61.5 million.
Commercial loans and equipment leasing. Brookline Bank originates commercial loans and leases for working capital and other business-related purposes, and concentrate such lending to companies located primarily in Massachusetts, and, in the case of Eastern Funding, on a nationwide basis. BankRI and PCSB Bank originate commercial loans and lines of credit for various business-related purposes, for businesses located primarily in Rhode Island and the Lower Hudson Valley of New York, respectively.
Because commercial loans are typically made on the basis of the borrower's ability to repay from the cash flow of the business, the availability of funds for the repayment of commercial and industrial loans may be significantly dependent on the success of the business itself. Further, the collateral securing the loans may be difficult to value, may fluctuate in value based on the success of the business and may deteriorate over time. For this reason, these loans and leases involve greater credit risk. Loans and leases originated by Eastern Funding generally earn higher yields because the borrowers are typically small businesses with limited capital such as laundries, fitness centers and tow truck operators. The Banks manage the credit risk inherent in commercial lending by requiring strong debt service coverage ratios; limiting loan-to-value ratios; securing personal guarantees from borrowers; and limiting industry concentrations, franchisee concentrations and the duration of loan maturities. As of December 31, 2023, the largest commercial relationship in the Company's portfolio was $65.9 million.
Consumer loans. Retail customers of Brookline Bank typically live and work in the Boston metropolitan area and eastern Massachusetts. Retail customers of BankRI typically live and work throughout Rhode Island. Retail customers of PCSB Bank typically live and work throughout New York. Our consumers value personalized service, local community knowledge and engagement and the choice between branch access and technology solutions. The Banks' consumer loan portfolios, which include residential mortgage loans, home equity loans and lines of credit, and other consumer loans, cater to the borrowing needs of this customer base. Credit risk in these portfolios is managed by limiting loan-to-value ratios at loan origination and by requiring borrowers to demonstrate strong credit histories. As of December 31, 2023, the largest consumer relationship in the Company's portfolio was $67.5 million.
Economic Conditions and Governmental Policies
Repayment of multi-family and commercial real estate loans are generally dependent on the properties generating sufficient income to cover operating expenses and debt service. Repayment of commercial loans and leases generally are dependent on the demand for the borrowers' products or services and the ability of borrowers to compete and operate on a profitable basis. Repayment of residential mortgage loans and home equity loans generally are dependent on the financial well-being of the borrowers and their capacity to service their debt levels. The asset quality of the Company's loan and lease portfolio, therefore, is greatly affected by the economy. Should there be any setback in the economy or increase in the unemployment rates in the Boston, Providence, or New York, metropolitan areas, the resulting negative consequences could affect occupancy rates in the properties financed by the Company and cause certain individual and business borrowers to be unable to service their debt obligations.
Personnel and Human Capital Resources
As of December 31, 2023, the Company had 974 full-time employees and 44 part-time employees. The employees are not represented by a collective bargaining unit and the Company considers its relationship with its employees to be good.
We encourage and support the growth and development of our employees. Continual learning and career development is advanced through ongoing performance and development conversations with employees, internally developed training programs, customized corporate training engagements and educational reimbursement programs.
The safety, health and wellness of our employees is a top priority. On an ongoing basis, we promote the health and wellness of our employees by strongly encouraging work-life balance, offering flexible work schedules, keeping the employee portion of health care premiums to a minimum and sponsoring various wellness programs.
We believe our commitment to living out our core values, actively prioritizing concern for our employees' well-being, supporting our employees' career goals, offering competitive wages and providing valuable fringe benefits aids in retention of our top-performing employees.
3
Access to Available Information
As a public company, Brookline Bancorp, Inc. is subject to the informational requirements of the Securities Exchange Act of 1934, as amended (the “Exchange Act”), and in accordance therewith, files reports, proxy and information statements and other information with the SEC. The Company makes available on or through its internet website, www.brooklinebancorp.com, without charge, its annual reports on Form 10-K, proxy statements, quarterly reports on Form 10-Q, current reports on Form 8-K and amendments to those reports filed or furnished pursuant to Section 13(a) or 15(d) of the Exchange Act, as soon as reasonably practicable after such reports are electronically filed with, or furnished to, the SEC. The Company's reports filed with, or furnished to, the SEC are also available at the SEC's website at www.sec.gov. Press releases are also maintained on the Company's website. Additional information for Brookline Bank, BankRI, PCSB Bank, Eastern Funding, and Clarendon Private can be found at www.brooklinebank.com, www.bankri.com, www.pcsb.com, www.easternfunding.com, and www.clarendonprivate.com, respectively. Information on the Company's and any subsidiary's website is not incorporated by reference into this document and should not be considered part of this Report.
The Company's common stock is traded on the Nasdaq Global Select MarketSM under the symbol “BRKL”.
Supervision and Regulation
The following discussion addresses elements of the regulatory framework applicable to bank holding companies and their subsidiaries. This regulatory framework is intended primarily for the protection of the safety and soundness of depository institutions, the federal deposit insurance system, and depositors, rather than for the protection of shareholders of a bank holding company such as the Company.
As a bank holding company, the Company is subject to regulation, supervision and examination by the Board of Governors of the Federal Reserve System ( the "FRB") under the Bank Holding Company Act of 1956, as amended (the “BHCA”), and by the Massachusetts Commissioner of Banks (the “Commissioner”) under Massachusetts General Laws Chapter 167A. The FRB is also the primary federal regulator of the Banks. In addition, Brookline Bank is subject to regulation, supervision and examination by the Massachusetts Division of Banks (“MDOB”), BankRI is subject to regulation, supervision and examination by the Banking Division of the Rhode Island Department of Business Regulation (the “RIBD”), and PCSB Bank is subject to regulation, supervision and examination by the New York State Department of Financial Services (“NYDFS”).
The following is a summary of certain aspects of various statutes and regulations applicable to the Company and its subsidiaries. This summary is not a comprehensive analysis of all applicable law, and is qualified by reference to the full text of the statutes and regulations referenced below, which may be modified or amended from time to time.
Regulation of the Company
The Company is subject to regulation, supervision and examination by the FRB, which has the authority, among other things, to order bank holding companies to cease and desist from unsafe or unsound banking practices; to assess civil money penalties; and to order termination of non-banking activities or termination of ownership and control of a non-banking subsidiary by a bank holding company.
Source of Strength
Under the BHCA, as amended by the Dodd-Frank Act, the Company is required to serve as a source of financial strength for the Banks in the event of the financial distress of the Banks. This provision of the Dodd-Frank Act codifies the longstanding policy of the FRB. This support may be required at times when the bank holding company may not have the resources to provide the additional financial support required by its subsidiary banks. In the event of a bank holding company's bankruptcy, any commitment by the bank holding company to a federal bank regulatory agency to maintain the capital of a bank subsidiary will be assumed by the bankruptcy trustee and entitled to priority of payment.
Acquisitions and Activities
The BHCA prohibits a bank holding company, without prior approval of the FRB, from acquiring all or substantially all the assets of a bank, acquiring control of a bank, merging or consolidating with another bank holding company, or acquiring direct or indirect ownership or control of any voting shares of another bank or bank holding company if, after such acquisition, the acquiring bank holding company would control more than 5% of any class of the voting shares of such other bank or bank holding company. Further, as a Massachusetts bank holding company, the Company generally must obtain the prior approval of the Massachusetts Board of Bank Incorporation to acquire ownership or control of more than 5% of any voting stock in any other banking institution, acquire substantially all the assets of a bank, or merge with another bank holding company. However, there is an exemption from this approval requirement in certain cases in which the banking institution to be acquired,
4
simultaneously with the acquisition, merges with a banking institution subsidiary of the Company in a transaction approved by the Commissioner.
The BHCA also generally prohibits a bank holding company from engaging directly or indirectly in activities other than those of banking, managing or controlling banks or furnishing services to its subsidiary banks. However, among other permitted activities, a bank holding company may engage in and may own shares of companies engaged in certain activities that the FRB has determined to be so closely related to banking or managing and controlling banks as to be a proper incident thereto, subject to certain notification requirements.
Limitations on Acquisitions of Company Common Stock
The Change in Bank Control Act prohibits a person or group of persons from acquiring “control” of a bank holding company unless the FRB has been notified and has not objected to the transaction. Under rebuttable presumptions of control established by the FRB, the acquisition of control of voting securities of a bank holding company constitutes an acquisition of control under the Change in Bank Control Act, requiring prior notice to the FRB, if, immediately after the transaction, the acquiring person (or persons acting in concert) will own, control, or hold with power to vote 10% or more of any class of voting securities of the bank holding company, and if either (i) the bank holding company has registered securities under Section 12 of the Securities Exchange Act of 1934, or (ii) no other person will own, control, or hold the power to vote a greater percentage of that class of voting securities immediately after the transaction.
In addition, the BHCA prohibits any company from acquiring control of a bank or bank holding company without first having obtained the approval of the FRB. Among other circumstances, under the BHCA, a company has control of a bank or bank holding company if the company owns, controls or holds with power to vote 25% or more of a class of voting securities of the bank or bank holding company; controls in any manner the election of a majority of directors or trustees of the bank or bank holding company; or the FRB has determined, after notice and opportunity for hearing, that the company has the power to exercise a controlling influence over the management or policies of the bank or bank holding company. The FRB has established presumptions of control under which the acquisition of control of 5% or more of a class of voting securities of a bank holding company, together with other factors enumerated by the FRB, could constitute the acquisition of control of a bank holding company for purposes of the BHCA.
Regulation of the Banks
Brookline Bank is subject to regulation, supervision and examination by the MDOB and the FRB. BankRI is subject to regulation, supervision and examination by the RIBD and the FRB. PCSB Bank is subject to regulation, supervision and examination by the NYDFS and the FRB. The enforcement powers available to federal and state banking regulators include, among other things, the ability to issue cease and desist or removal orders to terminate insurance of deposits; to assess civil money penalties; to issue directives to increase capital; to place the bank into receivership; and to initiate injunctive actions against banking organizations and institution-affiliated parties.
Deposit Insurance
Deposit obligations of the Banks are insured by the FDIC's Deposit Insurance Fund up to $250,000 per separately insured depositor for deposits held in the same right and capacity.
Deposit insurance premiums are based on assets. For the year ending December 31, 2023, the Banks' FDIC insurance assessments costs were approximately $7.8 million.
The FDIC has the authority to adjust deposit insurance assessment rates at any time. The FDIC is also required to recover losses to its Deposit Insurance Fund arising from the use of the systemic risk exception invoked on March 12, 2023. On November 16, 2023, the FDIC approved a final rule to implement a special assessment to recover such losses. Under the final rule, each insured depository institution’s assessment base for the special assessment is generally equal to estimated uninsured deposits as reported in the Call Report or FFIEC 002 as of December 31, 2022, after applying a $5 billion deduction.
In addition, under the Federal Deposit Insurance Act (the “FDIA”), the FDIC may terminate deposit insurance, among other circumstances, upon a finding that the institution has engaged in unsafe and unsound practices; is in an unsafe or unsound condition to continue operations; or has violated any applicable law, regulation, rule, order or condition imposed by the FDIC.
Cross-Guarantee
Under the cross-guarantee provisions of the FDIA, the FDIC can hold any FDIC-insured depository institution liable for any loss suffered or anticipated by the FDIC in connection with (i) the “default” of a commonly controlled FDIC-insured depository institution; or (ii) any assistance provided by the FDIC to a commonly controlled FDIC-insured depository institution “in danger of default.”
5
Acquisitions and Branching
The Banks must seek prior approval from the FRB to acquire another bank or establish a new branch office. Brookline Bank must also seek prior approval from the MDOB to acquire another bank or establish a new branch office, BankRI must also seek prior approval from the RIBD to acquire another bank or establish a new branch office, and PCSB Bank must also seek prior approval from the NYDFS to acquire another bank or establish a new branch office. Well capitalized and well managed banks may acquire other banks in any state, subject to certain deposit concentration limits and other conditions, pursuant to the Riegle-Neal Interstate Banking and Branching Efficiency Act of 1994, as amended by the Dodd-Frank Act. In addition, the Dodd-Frank Act authorizes a state-chartered bank to establish new branches on an interstate basis to the same extent a bank chartered by the host state may establish branches.
Activities and Investments of Insured State-Chartered Banks
The FDIA generally limits the types of equity investments that FDIC-insured state-chartered member banks, such as the Banks, may make and the kinds of activities in which such banks may engage, as a principal, to those that are permissible for national banks. Further, the Gramm-Leach-Bliley Act of 1999 (the “GLBA”) permits state banks, to the extent permitted under state law, to engage through “financial subsidiaries” in certain activities which are permissible for subsidiaries of a financial holding company. In order to form a financial subsidiary, a state-chartered bank must be well capitalized, and must comply with certain capital deduction, risk management and affiliate transaction rules, among other requirements. In addition, the Federal Reserve Act provides that state member banks are subject to the same restrictions with respect to purchasing, selling, underwriting, and holding of investment securities as national banks.
Brokered Deposits
The FDIA and federal regulations generally limit the ability of an insured depository institution to accept, renew or roll over any brokered deposit unless the institution's capital category is “well capitalized” or, with regulatory approval, “adequately capitalized.” Certain depository institutions that have brokered deposits in excess of 10% of total assets will be subject to increased FDIC deposit insurance premium assessments. Additionally, depository institutions considered “adequately capitalized” that need regulatory approval to accept, renew or roll over any brokered deposits are subject to additional restrictions on the interest rate they may pay on deposits. As of December 31, 2023, none of the Banks had brokered deposits in excess of 10% of total assets.
Section 202 of the Economic Growth, Regulatory Relief, and Consumer Protection Act (the "Economic Growth Act"), which was enacted in 2018, amended the FDIA to exempt a capped amount of reciprocal deposits from treatment as brokered deposits for certain insured depository institutions.
The Community Reinvestment Act
The Community Reinvestment Act (“CRA”) requires the FRB to evaluate each of the Banks with regard to their performance in helping to meet the credit needs of the communities each of the Banks serve, including low and moderate-income neighborhoods, consistent with safe and sound banking operations, and to take this record into consideration when evaluating certain applications. The FRB's CRA regulations are generally based upon objective criteria of the performance of institutions under three key assessment tests: (i) a lending test, to evaluate the institution's record of making loans in its service areas; (ii) an investment test, to evaluate the institution's record of investing in community development projects, affordable housing, and programs benefiting low- or moderate-income individuals and businesses; and (iii) a service test, to evaluate the institution's delivery of services through its branches, ATMs, and other offices. Failure of an institution to receive at least a “satisfactory” rating could inhibit the Banks or the Company from undertaking certain activities, including engaging in activities permitted as a financial holding company under GLBA and acquisitions of other financial institutions. Each Bank has achieved a rating of “satisfactory” on its most recent CRA examination. Massachusetts, Rhode Island and New York have adopted specific community reinvestment requirements which are substantially similar to those of the FRB. On October 23, 2023, the FDIC approved changes to its CRA regulations, maintaining the existing CRA ratings but modifying the evaluation framework to replace the existing tests generally applicable to banks with at least $2 billion in assets (the lending, investment, and service tests) with four new tests and associated performance metrics. The new CRA regulations will become effective on January 1, 2026.
6
Lending Restrictions
Federal law limits a bank's authority to extend credit to directors and executive officers of the bank or its affiliates and persons or companies that own, control or have power to vote more than 10% of any class of securities of a bank or an affiliate of a bank, as well as to entities controlled by such persons. Among other things, extensions of credit to insiders are required to be made on terms that are substantially the same as, and follow credit underwriting procedures that are not less stringent than, those prevailing for comparable transactions with unaffiliated persons. Also, the terms of such extensions of credit may not involve more than the normal risk of repayment or present other unfavorable features and may not exceed certain limitations on the amount of credit extended to such persons, individually and in the aggregate, which limits are based, in part, on the amount of the bank's capital.
Capital Adequacy and Safety and Soundness
Regulatory Capital Requirements
The FRB has issued risk-based and leverage capital rules applicable to U.S. banking organizations such as the Company and the Banks. These rules are intended to reflect the relationship between the banking organization's capital and the degree of risk associated with its operations based on transactions recorded on-balance sheet as well as off-balance sheet items. The FRB may from time to time require that a banking organization maintain capital above the minimum levels discussed below, due to the banking organization's financial condition or actual or anticipated growth.
The capital adequacy rules define qualifying capital instruments and specify minimum amounts of capital as a percentage of assets that banking organizations are required to maintain. Common equity Tier 1 capital generally includes common stock and related surplus, retained earnings and, in certain cases and subject to certain limitations, minority interest in consolidated subsidiaries, less goodwill, other non-qualifying intangible assets and certain other deductions. Tier 1 capital for banks and bank holding companies generally consists of the sum of common equity Tier 1 elements, non-cumulative perpetual preferred stock, and related surplus in certain cases and subject to limitations, minority interests in consolidated subsidiaries that do not qualify as common equity Tier 1 capital, less certain deductions. Tier 2 capital generally consists of hybrid capital instruments, perpetual debt and mandatory convertible debt securities, cumulative perpetual preferred stock, term subordinated debt and intermediate-term preferred stock, and, subject to limitations, allowances for loan losses. The sum of Tier 1 and Tier 2 capital less certain required deductions represents qualifying total risk-based capital. Prior to the effectiveness of certain provisions of the Dodd-Frank Act, bank holding companies were permitted to include trust preferred securities and cumulative perpetual preferred stock in Tier 1 capital, subject to limitations. However, the FRB's capital rule applicable to bank holding companies permanently grandfathers nonqualifying capital instruments, including trust preferred securities, issued before May 19, 2010 by depository institution holding companies with less than $15 billion in total assets as of December 31, 2009, subject to a limit of 25% of Tier 1 capital. In addition, under rules that became effective January 1, 2015, accumulated other comprehensive income (positive or negative) must be reflected in Tier 1 capital; however, the Company was permitted to make a one-time, permanent election to continue to exclude accumulated other comprehensive income from capital. The Company has made this election.
Under the capital rules, risk-based capital ratios are calculated by dividing common equity Tier 1, Tier 1, and total risk capital, respectively, by risk-weighted assets. Assets and off-balance sheet credit equivalents are assigned to one of several categories of risk-weights, based primarily on relative risk. Under the FRB's rules, the Company and the Banks are each required to maintain a minimum common equity Tier 1 capital ratio requirement of 4.5%, a minimum Tier 1 capital ratio requirement of 6.0%, a minimum total capital requirement of 8.0% and a minimum leverage ratio requirement of 4.0%. Additionally, these rules require an institution to establish a capital conservation buffer of common equity Tier 1 capital in an amount above the minimum risk-based capital requirements for "adequately capitalized" institutions of more than 2.5% of total risk weighted assets, or face restrictions on the ability to pay dividends, pay discretionary bonuses, and to engaged in share repurchases.
A bank holding company, such as the Company, is considered "well capitalized" if the bank holding company (i) has a total risk based capital ratio of at least 10.0%, (ii) has a Tier 1 risk-based capital ratio of at least 6.0%, and (iii) is not subject to any written agreement order, capital directive or prompt corrective action directive to meet and maintain a specific capital level for any capital measure. In addition, under the FRB's prompt corrective action rules, a state member bank is considered “well capitalized” if it (i) has a total risk-based capital ratio of 10.0% or greater; (ii) a Tier 1 risk-based capital ratio of 8.0% or greater; (iii) a common Tier 1 equity ratio of at least 6.5% or greater, (iv) a leverage capital ratio of 5.0% or greater; and (v) is not subject to any written agreement, order, capital directive, or prompt corrective action directive to meet and maintain a specific capital level for any capital measure. The FRB also considers: (i) concentrations of credit risk; (ii) interest rate risk; and (iii) risks from non-traditional activities, as well as an institution's ability to manage those risks. When determining the adequacy of an institution's capital, this evaluation is a part of the institution's regular safety and soundness examination. Each of the Banks is currently considered well-capitalized under all regulatory definitions.
7
Generally, a bank, upon receiving notice that it is not adequately capitalized (i.e., that it is “undercapitalized”), becomes subject to the prompt corrective action provisions of Section 38 of FDIA that, for example, (i) restrict payment of capital distributions and management fees, (ii) require that its federal bank regulator monitor the condition of the institution and its efforts to restore its capital, (iii) require submission of a capital restoration plan, (iv) restrict the growth of the institution's assets, and (v) require prior regulatory approval of certain expansion proposals. A bank that is required to submit a capital restoration plan must concurrently submit a performance guarantee by each company that controls the bank. A bank that is “critically undercapitalized” (i.e., has a ratio of tangible equity to total assets that is equal to or less than 2.0%) will be subject to further restrictions, and generally will be placed in conservatorship or receivership within 90 days.
The Banks are considered “well capitalized” under the FRB's prompt corrective action rules and the Company is considered “well capitalized” under the FRB's rules applicable to bank holding companies.
Safety and Soundness Standards
Guidelines adopted by the federal bank regulatory agencies pursuant to the FDIA establish general standards relating to internal controls and information systems, internal audit systems, loan documentation, credit underwriting, interest rate exposure, asset growth, asset quality, earnings and compensation, fees and benefits. In general, these guidelines require, among other things, appropriate systems and practices to identify and manage the risk and exposures specified in the guidelines. The guidelines prohibit excessive compensation as an unsafe and unsound practice and describe compensation as excessive when the amounts paid are unreasonable or disproportionate to the services performed by an executive officer, employee, director or principal stockholder. In addition, the federal banking agencies adopted regulations that authorize, but do not require, an agency to order an institution that has been given notice by an agency that it is not satisfying any of such safety and soundness standards to submit a compliance plan. If, after being so notified, an institution fails to submit an acceptable compliance plan or fails in any material respect to implement an acceptable compliance plan, the agency must issue an order directing action to correct the deficiency and may issue an order restricting asset growth, requiring an institution to increase its ratio of tangible equity to assets or directing other actions of the types to which an undercapitalized institution is subject under the “prompt corrective action” provisions of FDIA. See “- Regulatory Capital Requirements” above. If an institution fails to comply with such an order, the agency may seek to enforce such order in judicial proceedings and to impose civil money penalties.
Dividend Restrictions
The Company is a legal entity separate and distinct from the Banks. The revenue of the Company (on a parent company only basis) is derived primarily from dividends paid to it by the Banks. The right of the Company, and consequently the right of shareholders of the Company, to participate in any distribution of the assets or earnings of the Banks through the payment of such dividends or otherwise is subject to the prior claims of creditors of the Banks (including depositors), except to the extent that certain claims of the Company in a creditor capacity may be recognized.
Restrictions on Bank Holding Company Dividends
The FRB has authority to prohibit bank holding companies from paying dividends if such payment is deemed to be an unsafe or unsound practice. The FRB has indicated generally that it may be an unsafe or unsound practice for bank holding companies to pay dividends unless the bank holding company's net income for the prior year is sufficient to fund the dividends and the expected rate of earnings retention is consistent with the organization's capital needs, asset quality and overall financial condition. Further, under the FRB's capital rules, the Company's ability to pay dividends will be restricted if it does not maintain the required capital conservation buffer. See “Capital Adequacy and Safety and Soundness-Regulatory Capital Requirements” above.
Restrictions on Bank Dividends
The FRB has the authority to use its enforcement powers to prohibit a bank from paying dividends if, in its opinion, the payment of dividends would constitute an unsafe or unsound practice. Federal law also prohibits the payment of dividends by a bank that will result in the bank failing to meet its applicable capital requirements on a pro forma basis. In addition, a state member bank may not declare or pay a dividend: (i) if the total of all dividends declared during the calendar year, including the proposed dividend, exceeds the sum of the bank's net income during the current calendar year and the retained net income of the prior two calendar years; or (ii) that would exceed its undivided profits; in either case, unless the dividend has been approved by the FRB. Payment of dividends by a bank is also restricted pursuant to various state regulatory limitations.
Certain Transactions by Bank Holding Companies with their Affiliates
There are various statutory restrictions on the extent to which bank holding companies and their non-bank subsidiaries may borrow, obtain credit from or otherwise engage in “covered transactions” with their insured depository institution subsidiaries. An insured depository institution (and its subsidiaries) may not lend money to, or engage in covered transactions
8
with, its non-depository institution affiliates if the aggregate amount of covered transactions outstanding involving the bank, plus the proposed transaction, exceeds the following limits: (i) in the case of any one such affiliate, the aggregate amount of covered transactions of the insured depository institution and its subsidiaries cannot exceed 10% of the capital stock and surplus of the insured depository institution; and (ii) in the case of all affiliates, the aggregate amount of covered transactions of the insured depository institution and its subsidiaries cannot exceed 20% of the capital stock and surplus of the insured depository institution. For this purpose, “covered transactions” are defined by statute to include a loan or extension of credit to an affiliate, a purchase of or investment in securities issued by an affiliate, a purchase of assets from an affiliate unless exempted by the FRB, the acceptance of securities issued by an affiliate as collateral for a loan or extension of credit to any person or company, the issuance of a guarantee, acceptance or letter of credit on behalf of an affiliate, securities borrowing or lending transactions with an affiliate that creates a credit exposure to such affiliate, or a derivatives transaction with an affiliate that creates a credit exposure to such affiliate. Covered transactions are also subject to certain collateral security requirements. Covered transactions as well as other types of transactions between a bank and a bank holding company must be conducted under terms and conditions, including credit standards, that are at least as favorable to the bank as prevailing market terms. Section 106 of the Bank Holding Company Act Amendment of 1970 provides that, to further competition, a bank holding company and its subsidiaries are prohibited from engaging in certain tying arrangements in connection with any extension of credit, lease or sale of property of any kind, or the furnishing of any service. As of and for the year ending December 31, 2023, there were no such transactions.
Enhanced Prudential Supervision
None of the Banks currently have $10 billion or more of total consolidated assets, but it is possible that one of them may in the near future. In addition, with the merger of PCSB Financial Corporation with and into the Company effective January 1, 2023, the Banks, together with their affiliates, had assets exceeding $10 billion. The Dodd-Frank Act and other federal banking laws subject companies with $10 billion or more of consolidated assets to additional regulatory requirements. Section 1075 of the Dodd-Frank Act, commonly known as the “Durbin Amendment”, amended the Electronic Fund Transfer Act to restrict the amount of interchange fees that may be charged and prohibit network exclusivity for debit card transactions. The Banks are required to begin complying with the restrictions on interchange fees by July 1, 2024, which may negatively impact future payment network fees.
In addition, Section 619 of the Dodd-Frank Act, commonly known as the “Volcker Rule”, which generally prohibits banking entities from engaging in proprietary trading and from acquiring or retaining an ownership interest in or sponsoring certain types of investment funds, does not apply to an insured depository institution if it, and every company that controls it, has total consolidated assets of $10 billion or less and consolidated trading assets and liabilities that are 5% or less of consolidated assets. While each Bank had total consolidated assets of less than $10 billion as of December 31, 2023, the Company, which controls the Banks, has total consolidated assets in excess of $10 billion as of December 31, 2023. The Banks were subject to the Volcker Rule in 2023, and they remain subject to it now. However, we do not anticipate that becoming subject to the Volcker Rule will significantly impact the operations of the Company and the Banks.
Finally, Section 1025 of the Dodd-Frank Act provides that the CFPB has authority to examine any insured depository institution with total assets of more than $10 billion and any affiliate thereof. None of the Banks had, as of December 31, 2023, or has total assets of more than $10 billion.
Consumer Protection Regulation
The Company and the Banks are subject to a number of federal and state laws designed to protect consumers and prohibit unfair or deceptive business practices. These laws include the Equal Credit Opportunity Act, Fair Housing Act, Home Ownership Protection Act, Fair Credit Reporting Act, as amended by the Fair and Accurate Credit Transactions Act of 2003 (the “FACT Act”), GLBA, Truth in Lending Act ("TILA"), the CRA, the Home Mortgage Disclosure Act, Real Estate Settlement Procedures Act, National Flood Insurance Act and various state law counterparts. These laws and regulations mandate certain disclosure requirements and regulate the manner in which financial institutions must interact with customers when taking deposits, making loans, collecting loans and providing other services. Further, the Consumer Financial Protection Bureau ("CFPB") also has a broad mandate to prohibit unfair, deceptive or abusive acts and practices and is specifically empowered to require certain disclosures to consumers and draft model disclosure forms. Failure to comply with consumer protection laws and regulations can subject financial institutions to enforcement actions, fines and other penalties. The FRB examines the Banks for compliance with CFPB rules and enforces CFPB rules with respect to the Banks.
The Dodd-Frank Act prescribes certain standards that mortgage lenders must consider before making a residential mortgage loan, including verifying a borrower's ability to repay such mortgage loan, and allows borrowers to assert violations of certain provisions of the TILA as a defense to foreclosure proceedings. Additionally, the CFPB's qualified mortgage rule requires creditors, such as the Banks, to make a reasonable good faith determination of a consumer's ability to repay any consumer credit transaction secured by a dwelling prior to making the loan.
9
Privacy and Customer Information Security
The GLBA requires financial institutions to implement policies and procedures regarding the disclosure of nonpublic personal information about consumers to nonaffiliated third parties. In general, the Banks must provide their customers with an annual disclosure that explains their policies and procedures regarding the disclosure of such nonpublic personal information and, except as otherwise required or permitted by law, the Banks are prohibited from disclosing such information except as provided in such policies and procedures. If the financial institution only discloses information under exceptions from the GLBA that do not require an opt out to be provided and if there has been no change in the financial institutions privacy policies and procedures since its most recent disclosures provide to customers, an annual disclosure is not required to be provided by the financial institution. The GLBA also requires that the Banks develop, implement and maintain a comprehensive written information security program designed to ensure the security and confidentiality of customer information (as defined under GLBA), to protect against anticipated threats or hazards to the security or integrity of such information and to protect against unauthorized access to or use of such information that could result in substantial harm or inconvenience to any customer. The Banks are also required to send a notice to customers whose “sensitive information” has been compromised if unauthorized use of this information is “reasonably possible.” Most of the states, including the states where the Banks operate, have enacted legislation concerning breaches of data security and the duties of the Banks in response to a data breach. Congress continues to consider federal legislation that would require consumer notice of data security breaches. Pursuant to the FACT Act, the Banks must also develop and implement a written identity theft prevention program to detect, prevent, and mitigate identity theft in connection with the opening of certain accounts or certain existing accounts. Additionally, the FACT Act amended the Fair Credit Reporting Act to generally prohibit a person from using information received from an affiliate to make a solicitation for marketing purposes to a consumer, unless the consumer is given notice and a reasonable opportunity and method to opt out of the making of such solicitations.
Anti-Money Laundering
The Bank Secrecy Act
Under the Bank Secrecy Act (“BSA”), a financial institution is required to have systems in place to detect certain transactions, based on the size and nature of the transaction. Financial institutions are generally required to report to the United States Treasury any cash transactions involving at least $10,000. In addition, financial institutions are required to file suspicious activity reports for any transaction or series of transactions that involve more than $5,000 and which the financial institution knows, suspects or has reason to suspect involves illegal funds, is designed to evade the requirements of the BSA or has no lawful purpose. The Uniting and Strengthening America by Providing Appropriate Tools Required to Intercept and Obstruct Terrorism Act of 2001 (the “USA PATRIOT Act”), which amended the BSA, is designed to deny terrorists and others the ability to obtain anonymous access to the U.S. financial system. The USA PATRIOT Act, together with the implementing regulations of various federal regulatory agencies, has caused financial institutions, such as the Banks, to adopt and implement additional policies or amend existing policies and procedures with respect to, among other things, anti-money laundering compliance, suspicious activity, currency transaction reporting, customer identity verification and customer risk analysis. In evaluating an application to acquire a bank or to merge banks or effect a purchase of assets and assumption of deposits and other liabilities, the applicable federal banking regulator must consider the anti-money laundering compliance record of both the applicant and the target. In addition, under the USA PATRIOT Act, financial institutions are required to take steps to monitor their correspondent banking and private banking relationships as well as, if applicable, their relationships with “shell banks.”
Office of Foreign Assets Control
The U.S. has imposed economic sanctions that affect transactions with designated foreign countries, nationals and others. These sanctions, which are administered by the U.S. Treasury's Office of Foreign Assets Control (“OFAC”), take many different forms. Generally, however, they contain one or more of the following elements: (i) restrictions on trade with or investment in a sanctioned country, including prohibitions against direct or indirect imports from and exports to a sanctioned country and prohibitions on “U.S. persons” engaging in financial or other transactions relating to a sanctioned country or with certain designated persons and entities; (ii) a blocking of assets in which the government or specially designated nationals of the sanctioned country have an interest, by prohibiting transfers of property subject to U.S. jurisdiction (including property in the possession or control of U.S. persons); and (iii) restrictions on transactions with or involving certain persons or entities. Blocked assets (for example, property and bank deposits) cannot be paid out, withdrawn, set off or transferred in any manner without a license from OFAC. Failure to comply with these sanctions could have serious legal and reputational consequences for the Company. As of December 31, 2023, the Company did not have any transactions with sanctioned countries, nationals, and others.
10
Item 1A. Risk Factors
Before deciding to invest in us or deciding to maintain or increase your investment, you should carefully consider the risks described below, in addition to the other information contained in this report and in our other filings with the SEC. The risks and uncertainties described below and in our other filings are not the only ones facing us. Additional risks and uncertainties not presently known to us or that we currently deem immaterial may also affect our business. If any of these known or unknown risks or uncertainties actually occur, our business, financial condition and results of operations could be seriously harmed. In that event, the market price for our common stock could decline and you may lose your investment.
RISKS RELATED TO OUR BUSINESS AND INDUSTRY
The possibility of the economy’s return to recessionary conditions and the possibility of further turmoil or volatility in the financial markets would likely have an adverse effect on our business, financial position, and results of operations.
The economy in the United States and globally has experienced volatility in recent years and may continue to experience such volatility for the foreseeable future. There can be no assurance that economic conditions will not worsen. Unfavorable or uncertain economic conditions can be caused by declines in economic growth, business activity, or investor or business confidence, limitations on the availability or increases in the cost of credit and capital, increases in inflation or interest rates, the timing and impact of changing governmental policies, natural disasters, climate change, epidemics, future pandemics, terrorist attacks, acts of war, or a combination of these or other factors. A worsening of business and economic conditions could have adverse effects on our business, including the following:
•investors may have less confidence in the equity markets in general and in financial services industry stocks in particular, which could place downward pressure on our stock price and resulting market valuation;
•economic and market developments may further affect consumer and business confidence levels and may cause declines in credit usage and adverse changes in payment patterns, causing increases in delinquencies and default rates;
•our ability to assess the creditworthiness of our customers may be impaired if the models and approaches we use to select, manage, and underwrite loans become less predictive of future behaviors;
•we could suffer decreases in demand for loans or other financial products and services or decreased deposits or other investments in accounts with us;
•competition in the financial services industry could intensify as a result of the increasing consolidation of financial services companies in connection with current market conditions or otherwise; and
•the value of loans and other assets or collateral securing loans may decrease.
Our business may be adversely affected by changes in economic conditions in our market area.
We primarily serve individuals and businesses located in the Greater Boston metropolitan area, eastern Massachusetts, Rhode Island, the Lower Hudson Valley in New York, and the Greater New York and New Jersey metropolitan area. Our success is largely dependent on local and regional economic conditions. Unlike other larger institutions, we are not able to spread the risks of unfavorable local economic conditions across a large number of diversified economies. An economic downturn could, therefore, result in losses that materially and adversely affect our business. Recessionary economic conditions, increased unemployment, inflation, a decline in real estate values or other factors beyond our control may adversely affect the ability of our borrowers to repay their loans, and could result in higher loan and lease losses and lower net income for us.
In addition, deterioration or defaults made by issuers of the underlying collateral of our investment securities may cause additional credit-related other-than-temporary impairment charges to our income statement. Our ability to borrow from other financial institutions or to access the debt or equity capital markets on favorable terms or at all could be adversely affected by disruptions in the capital markets or other events, including actions by rating agencies and deteriorating investor expectations.
Changes to interest rates could adversely affect our results of operations and financial condition.
Our consolidated results of operations depend, on a large part, on net interest income, which is the difference between (i) interest income on interest-earning assets, such as loans, leases and securities, and (ii) interest expense on interest-bearing liabilities, such as deposits and borrowed funds. As a result, our earnings and growth are significantly affected by interest rates, which are subject to the influence of economic conditions generally, both domestic and foreign, to events in the capital markets and also to the monetary and fiscal policies of the United States and its agencies, particularly the FRB. The nature and timing of any changes in such policies or general economic conditions and their effect on us cannot be controlled and are extremely difficult to predict. An increase in interest rates could also have a negative impact on our results of operations by reducing the ability of borrowers to repay their current loan obligations, which could not only result in increased loan defaults, foreclosures
11
and charge-offs, but also necessitate further increases to our allowances for loan losses. A decrease in interest rates may trigger loan prepayments, which may serve to reduce net interest income if we are unable to lend those funds to other borrowers or invest the funds at the same or higher interest rates.
Inflationary pressures and rising prices may affect our results of operations and financial condition.
Inflation continued at elevated levels in 2023. Inflationary pressures, including the impact of recent increases in inflation, may remain elevated in 2024. Small to medium-sized businesses may be impacted more during periods of high inflation as they are not able to leverage economics of scale to mitigate cost pressures compared to larger businesses. Consequently, the ability of our business customers to repay their loans may deteriorate, and in some cases this deterioration may occur quickly, which would adversely impact our results of operations and financial condition. Furthermore, a prolonged period of inflation could cause wages and other costs increase, which could adversely affect our results of operations and financial condition.
We face significant and increasing competition in the financial services industry.
We operate in a highly competitive environment that includes financial and non-financial services firms, including traditional banks, online banks, financial technology companies, wealth management companies and others. These companies compete on the basis of, among other factors, size, quality and type of products and services offered, price, technology and reputation. Emerging technologies have the potential to intensify competition and accelerate disruption in the financial services industry. In recent years, non-financial services firms, such as financial technology companies, have begun to offer services traditionally provided by financial institutions. These firms attempt to use technology and mobile platforms to enhance the ability of companies and individuals to borrow money, save and invest. Our ability to compete successfully depends on a number of factors, including our ability to develop and execute strategic plans and initiatives; to develop competitive products and technologies; and to attract, retain and develop a highly skilled employee workforce. If we are not able to compete successfully, we could be placed at a competitive disadvantage, which could result in the loss of customers and market share, and our business, results of operations and financial condition could suffer.
Our business may be adversely affected if we fail to adapt our products and services to evolving industry standards and consumer preferences.
The financial services industry is undergoing rapid technological changes with frequent introductions of new technology driven products and services. The widespread adoption of new technologies, including payment systems, could require substantial expenditures to modify or adapt our existing products and services as the introduction of new or modified products and services can entail significant time and resources. We might not be successful in developing or introducing new products and services, integrating new products or services into our existing offerings, responding or adapting to changes in consumer behavior, preferences, spending, investing and/or saving habits, achieving market acceptance of our products and services, reducing costs in response to pressures to deliver products and services at lower prices or sufficiently developing and maintaining loyal customers.
Development of new products services and technologies may impose additional costs on us and may expose us to increased operational risk.
The introduction of new products and services can entail significant time and resources, including regulatory approvals. Substantial risks and uncertainties are associated with the introduction of new products and services, including technical and control requirements that may need to be developed and implemented, rapid technological change in the industry, our ability to access technical and other information from its clients, the significant and ongoing investments required to bring new products and services to market in a timely manner at competitive prices and the preparation of marketing, sales and other materials that fully and accurately describe the product or service and its underlying risks. Our failure to manage these risks and uncertainties also exposes it to enhanced risk of operational lapses which may result in the recognition of financial statement liabilities. Regulatory and internal control requirements, capital requirements, competitive alternatives, vendor relationships and shifting market preferences may also determine if such initiatives can be brought to market in a manner that is timely and attractive to our clients. Products and services relying on internet and mobile technologies may expose us to fraud and cybersecurity risks. Implementation of certain new technologies, such as those related to artificial intelligence, automation and algorithms, may have unintended consequences due to their limitations, potential manipulation, or our failure to use them effectively. Failure to successfully manage these risks in the development and implementation of new products or services could have a material adverse effect on our business and reputation, as well as on its consolidated results of operations and financial condition.
If our allowance for credit losses is not sufficient to cover actual loan and lease losses, our earnings may decrease.
We periodically make a determination of an allowance for credit losses based on available information, including, but not limited to, the quality of the loan and lease portfolio as indicated by trends in loan risk ratings, payment performance, economic conditions, the value of the underlying collateral and the level of nonaccruing and criticized loans and leases. Management
12
relies on its loan officers and credit quality reviews, its experience and its evaluation of economic conditions, among other factors, in determining the amount of provision required for the allowance for credit losses. Provisions to this allowance result in an expense for the period. If, as a result of general economic conditions, previously incorrect assumptions, or an increase in defaulted loans or leases, we determine that additional increases in the allowance for credit losses are necessary, additional expenses may be incurred.
Determining the allowance for credit losses inherently involves a high degree of subjectivity and requires us to make significant estimates of current credit risks and trends, all of which may undergo material changes. We cannot be sure that we will be able to identify deteriorating credits before they become nonperforming assets or that we will be able to limit losses on those loans and leases that are identified. We have in the past been, and in the future may be, required to increase our allowance for credit losses for any of several reasons. State and federal regulators, in reviewing our loan and lease portfolio as part of a regulatory examination, may request that we increase the allowance for credit losses. Changes in economic conditions or individual business or personal circumstances affecting borrowers, new information regarding existing loans and leases, identification of additional problem loans and leases and other factors, both within and outside of our control, may require an increase in the allowance for credit losses. Any increases in the allowance for credit losses may result in a decrease in our net income and, possibly, our capital, and could have an adverse effect on our financial condition and results of operations.
Our loan and lease portfolios include commercial real estate mortgage loans and commercial loans and leases, including equipment leases, which are generally riskier than other types of loans.
Our commercial real estate and commercial loan and lease portfolios, including equipment leases, currently comprise 84.7% of total loans and leases. Payments on loans secured by commercial real estate are often dependent on the income produced by the underlying properties which, in turn, depends on the successful operation and management of the properties and the businesses that operate within them. Accordingly, repayment of these loans is subject to conditions in the real estate market or the local economy. The COVID-19 pandemic has had a potentially long-term negative impact on certain commercial real estate assets due to the risk that tenants may reduce the office space they lease as some portion of the workforce continues to work remotely on a hybrid or full-time basis. Commercial loans and leases generally carry larger balances and involve a higher risk of nonpayment or late payment than residential mortgage loans. Most commercial loans and leases are secured by borrower business assets such as accounts receivable, inventory, equipment and other fixed assets. Compared to real estate, these types of collateral are more difficult to monitor, harder to value, may depreciate more rapidly and may not be as readily saleable if repossessed. Repayment of commercial loans and leases is largely dependent on the business and financial condition of borrowers. Business cash flows are dependent on the demand for the products and services offered by the borrower's business. Such demand may be reduced when economic conditions are weak or when the products and services offered are viewed as less valuable than those offered by competitors. Because of the risks associated with commercial real estate and commercial loans and leases, including equipment leases, we may experience higher rates of default than if the portfolio were more heavily weighted toward residential mortgage loans. While we seek to minimize these risks in a variety of ways, there can be no assurance that these measures will protect against credit-related losses.
Environmental liability associated with our lending activities could result in losses.
In the course of business, we may acquire, through foreclosure, properties securing loans originated or purchased that are in default. Particularly in commercial real estate lending, there is a risk that material environmental violations could be discovered on these properties. In this event, we might be required to remedy these violations at the affected properties at our sole cost and expense. The cost of remedial action could substantially exceed the value of affected properties. We may not have adequate remedies against the prior owner or other responsible parties and could find it difficult or impossible to sell the affected properties. These events could have an adverse effect on our financial condition and results of operations.
Our securities portfolio performance in difficult market conditions could have adverse effects on our results of operations.
Unrealized losses on investment securities result from changes in credit spreads and liquidity issues in the marketplace, along with changes in the credit profile of individual securities issuers. Under GAAP, we are required to review our investment portfolio periodically for the presence of impairment of our securities, taking into consideration current and future market conditions, the extent and nature of changes in fair value, issuer rating changes and trends, volatility of earnings, current analysts' evaluations, our ability and intent to hold investments until a recovery of fair value, as well as other factors. Adverse developments with respect to one or more of the foregoing factors may require us to deem particular securities to be impaired, with the credit-related portion of the reduction in the value recognized as a charge to our earnings through an allowance. Subsequent valuations, in light of factors prevailing at that time, may result in significant changes in the values of these securities in future periods. Any of these factors could require us to recognize further impairments in the value of our securities portfolio, which may have an adverse effect on our results of operations in future periods.
13
The fair value of our investment securities can fluctuate due to factors outside of our control.
Factors beyond our control can significantly influence the fair value of securities in our portfolio and can cause potential adverse changes to the fair value of these securities. These factors include, but are not limited to, rating agency actions with respect to individual securities, defaults by the issuer or with respect to the underlying securities, and changes in market interest rates and continued instability in the capital markets. For example, in 2023, inflation and rapid increases in interest rates led to a decline in the trading value of previously issued government securities with interest rates below current market interest rates. Any of these factors, among others, could cause other-than-temporary impairments and realized and/or unrealized losses in future periods and declines in other comprehensive income, which could materially and adversely affect our business, results of operations, financial condition and prospects. The process for determining whether impairment of a security is other than-temporary usually requires complex, subjective judgments about the future financial performance and liquidity of the issuer and any collateral underlying the security in order to assess the probability of receiving all contractual principal and interest payments on the security. Significant negative changes to valuations could result in impairments in the value of our securities portfolio, which could have an adverse effect on our financial condition or results of operations.
Potential downgrades of U.S. government securities by one or more of the credit ratings agencies could have a material adverse effect on our operations, earnings and financial condition.
A possible future downgrade of the sovereign credit ratings of the U.S. government and a decline in the perceived creditworthiness of U.S. government-related obligations could impact our ability to obtain funding that is collateralized by affected instruments, as well as affect the pricing of that funding when it is available. A downgrade may also adversely affect the market value of such instruments. We cannot predict if, when or how any changes to the credit ratings or perceived creditworthiness of these organizations will affect economic conditions. Such ratings actions could result in a significant adverse impact on us. Among other things, a downgrade in the U.S. government’s credit rating could adversely impact the value of our securities portfolio and may trigger requirements that we post additional collateral for trades relative to these securities. A downgrade of the sovereign credit ratings of the U.S. government or the credit ratings of related institutions, agencies or instruments could significantly exacerbate the other risks to which we are subject and any related adverse effects on the business, financial condition and results of operations.
The replacement of LIBOR may adversely affect our business, financial condition and results of operations.
LIBOR has been used extensively in the United States as a benchmark for various commercial and financial contracts, including funding sources, adjustable rate mortgages, corporate debt, interest rate swaps and other derivatives. LIBOR was set based on interest rate information reported by certain banks, which stopped reporting such information after June 30, 2023 (although certain U.S. dollar LIBOR settings will continue to be published using a synthetic methodology until September 2024). Other benchmarks may perform differently than LIBOR or may have other consequences that cannot currently be anticipated. The transition from LIBOR to another benchmark rate or rates, such as the Secured Overnight Financing Rate, or "SOFR", could have adverse impacts on our funding costs or net interest margins, as well as any floating-rate obligations, loans, deposits, derivatives, and other financial instruments that currently use LIBOR as a benchmark rate and, ultimately, adversely affect our financial condition and results of operations.
We are subject to liquidity risk, which could negatively affect our funding levels.
Market conditions or other events could negatively affect our access to or the cost of funding, affecting our ongoing ability to accommodate liability maturities and deposit withdrawals, meet contractual obligations, or fund asset growth and new business initiatives at a reasonable cost, in a timely manner and without adverse consequences.
Although we maintain a liquid asset portfolio and have implemented strategies to maintain sufficient and diverse sources of funding to accommodate planned, as well as unanticipated, changes in assets, liabilities, and off-balance sheet commitments under various economic conditions, a substantial, unexpected, or prolonged change in the level or cost of liquidity could have a material adverse effect on us. If the cost effectiveness or the availability of supply in these credit markets is reduced for a prolonged period of time, our funding needs may require us to access funding and manage liquidity by other means. These alternatives may include generating client deposits, securitizing or selling loans, extending the maturity of wholesale borrowings, borrowing under certain secured borrowing arrangements, using relationships developed with a variety of fixed income investors, and further managing loan growth and investment opportunities. These alternative means of funding may result in an increase to the overall cost of funds and may not be available under stressed conditions, which would cause us to liquidate a portion of our liquid asset portfolio to meet any funding needs.
Loss of deposits or a change in deposit mix could increase our cost of funding.
14
Deposits are a low cost and stable source of funding. We compete with banks and other financial institutions for deposits. Funding costs may increase if we lose deposits and are forced to replace them with more expensive sources of funding, if clients shift their deposits into higher cost products or if we need to raise interest rates to avoid losing deposits. Higher funding costs reduce our net interest margin, net interest income and net income.
Wholesale funding sources may prove insufficient to replace deposits at maturity and support our operations and future growth.
We and our banking subsidiaries must maintain sufficient funds to respond to the needs of depositors and borrowers. To manage liquidity, we draw upon a number of funding sources in addition to core deposit growth and repayments and maturities of loans and investments. These sources include Federal Home Loan Bank advances, proceeds from the sale of investments and loans, and liquidity resources at the holding company. Our ability to manage liquidity will be severely constrained if we are unable to maintain access to funding or if adequate financing is not available to accommodate future growth at acceptable costs. In addition, if we are required to rely more heavily on more expensive funding sources to support future growth, our revenues may not increase proportionately to cover our costs. In this case, operating margins and profitability would be adversely affected. Turbulence in the capital and credit markets may adversely affect our liquidity and financial condition and the willingness of certain counterparties and customers to do business with us.
Potential deterioration in the performance or financial position of the Federal Home Loan Bank ("FHLB") of Boston and New York might restrict our funding needs and may adversely impact our financial condition and results of operations.
Significant components of our liquidity needs are met through our access to funding pursuant to our membership in the FHLB. The FHLB is a cooperative that provides services to its member banking institutions. The primary reason for joining the FHLB is to obtain funding. The purchase of stock in the FHLB is a requirement for a member to gain access to funding. Any deterioration in the FHLB’s performance or financial condition may affect our ability to access funding and/or require us to deem the required investment in FHLB stock to be impaired. If we are not able to access funding through the FHLB, we may not be able to meet our liquidity needs, which could have an adverse effect on our results of operations or financial condition. Similarly, if we deem all or part of our investment in FHLB stock impaired, such action could have an adverse effect on our financial condition or results of operations.
Adverse developments affecting the financial services industry, such as actual events or concerns involving liquidity, defaults, or non-performance by financial institutions or transactional counterparties, could adversely affect our financial condition and results of operations.
Actual events involving limited liquidity, defaults, non-performance or other adverse developments that affect financial institutions, transactional counterparties or other companies in the financial services industry or the financial services industry generally, or concerns or rumors about any events of these kinds or other similar risks, have in the past and may in the future lead to market-wide liquidity problems. For example, on May 1, 2023, First Republic Bank went into receivership and its deposits and substantially all of its assets were acquired by JPMorgan Chase Bank, National Association. Similarly, on March 10, 2023, Silicon Valley Bank went into receivership, and on March 12, 2023, Signature Bank went into receivership. On March 12, 2023, the Secretary of the Treasury invoked the systemic risk exception to allow the FDIC to complete its resolution of both Silicon Valley Bank and Signature Bank in a manner that fully protected depositors.
Inflation and rapid increases in interest rates led to a decline in the trading value of previously issued government securities with interest rates below current market interest rates. The FRB announced a program to provide loans to FDIC-insured depository institutions and certain U.S. branches and agencies of foreign banks secured by certain of such government securities to mitigate the risk of potential losses on the sale of such instruments. Currently new advances (with terms up to one year) under the program can only be made through March 11, 2024. There is no guarantee that the Secretary of the Treasury, FDIC and/or FRB, as applicable, will take such actions in the future in the event of the closure of other banks or financial institutions, that they would do so in a timely fashion or that such actions, if taken, would have their intended effect.
The soundness of other financial institutions could adversely affect us.
Our ability to engage in routine funding transactions could be adversely affected by the actions and commercial soundness of other financial institutions. Financial services institutions are interrelated as a result of trading, clearing, counterparty and other relationships. We have exposure to many different counterparties, and we routinely execute transactions with counterparties in the financial industry, including brokers and dealers, other commercial banks, investment banks, mutual and hedge funds, and other financial institutions. As a result, defaults by, or even rumors or questions about, one or more financial services institutions, or the financial services industry generally, could lead to market-wide liquidity problems and losses or defaults by us or by other institutions and organizations. Many of these transactions expose us to credit risk in the event of default of our counterparty or client. In addition, our credit risk may be exacerbated when the collateral held by us cannot be
15
liquidated or is liquidated at prices not sufficient to recover the full amount of the financial instrument exposure due to us. There is no assurance that any such losses would not materially and adversely affect our results of operations.
Damage to our reputation could significantly harm our business, including our competitive position and business prospects.
We are dependent on our reputation within our market area, as a trusted and responsible financial services company, for all aspects of our business with customers, employees, vendors, third-party service providers, and others, with whom we conduct business or potential future businesses. Negative public opinion about the financial services industry generally (including the types of banking and other services that we provide) or us specifically could adversely affect our reputation and our ability to keep and attract customers and employees. Our actual or perceived failure to address various issues could give rise to negative public opinion and reputational risk that could cause harm to us and our business prospects. These issues include, but are not limited to, legal and regulatory requirements; properly maintaining customer and employee personal information; record keeping; money-laundering; sales and trading practices; ethical issues; appropriately addressing potential conflicts of interest; and the proper identification of the legal, reputational, credit, liquidity and market risks inherent in our products. Failure to appropriately address any of these issues could also give rise to additional regulatory restrictions and legal risks, which could, among other consequences, increase the size and number of litigation claims and damages asserted or subject us to enforcement actions, fines and penalties and cause us to incur related costs and expenses.
The proliferation of social media websites utilized by us and other third parties, as well as the personal use of social media by our employees and others, including personal blogs and social network profiles, also may increase the risk that negative, inappropriate or unauthorized information may be posted or released publicly that could harm our reputation or have other negative consequences, including as a result of our employees interacting with our customers in an unauthorized manner in various social media outlets. Any damage to our reputation could affect our ability to retain and develop the business relationships necessary to conduct business, which in turn could negatively impact our financial condition, results of operations, and the market price of our common stock.
We may be unable to attract and retain qualified key employees, which could adversely affect our business prospects, including our competitive position and results of operations.
Our success is dependent upon our ability to attract and retain highly skilled individuals. There is significant competition for those individuals with the experience and skills required to conduct many of our business activities. We may not be able to hire or retain the key personnel that we depend upon for success. The unexpected loss of services of one or more of these or other key personnel could have a material adverse impact on our business because of their skills, knowledge of the markets in which we operate, years of industry experience and the difficulty of promptly finding qualified replacement personnel. Frequently, we compete in the market for talent with entities that are not subject to comprehensive regulation, including with respect to the structure of incentive compensation. Our inability to attract new employees and retain and motivate our existing employees could adversely impact our business.
Our ability to service our debt and pay dividends is dependent on capital distributions from our subsidiary banks, and these distributions are subject to regulatory limits and other restrictions.
We are a legal entity that is separate and distinct from the Banks. Our revenue (on a parent company only basis) is derived primarily from dividends paid to us by the Banks. Our right, and consequently the right of our shareholders, to participate in any distribution of the assets or earnings of the Banks through the payment of such dividends or otherwise is necessarily subject to the prior claims of creditors of the Banks (including depositors), except to the extent that certain claims of ours in a creditor capacity may be recognized. It is possible, depending upon the financial condition of our subsidiary banks and other factors, that applicable regulatory authorities could assert that payment of dividends or other payments is an unsafe or unsound practice. If one or more of our subsidiary banks is unable to pay dividends to us, we may not be able to service our debt or pay dividends on our common stock. Further, our ability to pay dividends on our common stock or service our debt could be restricted if we do not maintain a capital conservation buffer of common equity Tier 1 capital. A reduction or elimination of dividends could adversely affect the market price of our common stock and would adversely affect our business, financial condition, results of operations and prospects. See Item 1, “Business-Supervision and Regulation-Dividend Restrictions” and “Business-Supervision and Regulation-Capital Adequacy and Safety and Soundness-Regulatory Capital Requirements.”
16
We face continuing and growing security risks to our information base, including the information we maintain relating to our customers.
In the ordinary course of business, we rely on electronic communications and information systems to conduct our business and to store sensitive data, including financial information regarding customers. Our electronic communications and information systems infrastructure, as well as the systems infrastructures of the vendors we use to meet our data processing and communication needs, could be susceptible to cyber-attacks, such as denial of service attacks, hacking, terrorist activities or identity theft. Financial services institutions and companies engaged in data processing have reported breaches in the security of their websites or other systems, some of which have involved sophisticated and targeted attacks intended to obtain unauthorized access to confidential information, destroy data, disable or degrade service or sabotage systems, often through the introduction of computer viruses or malware, cyber-attacks and other means. Denial of service attacks have been launched against a number of large financial services institutions. Hacking and identity theft risks, in particular, could cause serious reputational harm. Cyber threats are rapidly evolving and we may not be able to anticipate or prevent all such attacks. Although to date we have not experienced any material losses relating to cyber-attacks or other information security breaches, there can be no assurance that we will not suffer such losses in the future. No matter how well designed or implemented our controls are, we will not be able to anticipate all security breaches of these types, and we may not be able to implement effective preventive measures against such security breaches in a timely manner. A failure or circumvention of our security systems could have a material adverse effect on our business operations and financial condition.
We regularly assess and test our security systems and disaster preparedness, including back-up systems, but the risks are substantially escalating. As a result, cyber-security and the continued enhancement of our controls and processes to protect our systems, data and networks from attacks, unauthorized access or significant damage remain a priority. Accordingly, we may be required to expend additional resources to enhance our protective measures or to investigate and remediate any information security vulnerabilities or exposures. Any breach of our system security could result in disruption of our operations, unauthorized access to confidential customer information, significant regulatory costs, litigation exposure and other possible damages, loss or liability. Such costs or losses could exceed the amount of available insurance coverage, if any, and would adversely affect our earnings. Also, any failure to prevent a security breach or to quickly and effectively deal with such a breach could negatively impact customer confidence, damaging our reputation and undermining our ability to attract and keep customers.
We may not be able to successfully implement future information technology system enhancements, which could adversely affect our business operations and profitability.
We invest significant resources in information technology system enhancements in order to provide functionality and security at an appropriate level. We may not be able to successfully implement and integrate future system enhancements, which could adversely impact the ability to provide timely and accurate financial information in compliance with legal and regulatory requirements, which could result in sanctions from regulatory authorities. Such sanctions could include fines and suspension of trading in our stock, among others. In addition, future system enhancements could have higher than expected costs and/or result in operating inefficiencies, which could increase the costs associated with the implementation as well as ongoing operations.
Failure to properly utilize system enhancements that are implemented in the future could result in impairment charges that adversely impact our financial condition and results of operations and could result in significant costs to remediate or replace the defective components. In addition, we may incur significant training, licensing, maintenance, consulting and amortization expenses during and after systems implementations, and any such costs may continue for an extended period of time.
We rely on other companies to provide key components of our business infrastructure.
Third party vendors provide key components of our business infrastructure such as internet connections, network access and core application processing. While we have selected these third party vendors carefully, we do not control them or their actions. Any problems caused by these third parties, including as a result of their not providing us their services for any reason or their performing their services poorly, could adversely affect our ability to deliver products and services to our customers or otherwise conduct our business efficiently and effectively. Replacing these third party vendors could also entail significant delay and expense.
We may incur significant losses as a result of ineffective risk management processes and strategies.
We seek to monitor and control our risk exposure through a risk and control framework encompassing a variety of separate but complementary financial, credit, operational, compliance, and legal reporting systems; internal controls; management review processes; and other mechanisms. While we employ a broad and diversified set of risk monitoring and risk mitigation techniques, those techniques and the judgments that accompany their application may not be effective and may not anticipate every economic and financial outcome in all market environments or the specifics and timing of such outcomes.
17
Our internal controls, procedures and policies may fail or be circumvented.
Management regularly reviews and updates our internal controls, disclosure controls and procedures, and corporate governance policies and procedures. Any system of controls, however well-designed and operated, is based in part on certain assumptions and can provide only reasonable, not absolute, assurances that the objectives of the system are met. Any failure or circumvention of the controls and procedures or failure to comply with regulations related to controls and procedures could have a material adverse effect on our business, results of operations and financial condition.
Natural disasters, acts of terrorism, pandemics and other external events could harm our business.
Natural disasters can disrupt our operations, result in damage to our properties, reduce or destroy the value of the collateral for our loans and negatively affect the economies in which we operate, which could have a material adverse effect on our results of operations and financial condition. A significant natural disaster, such as a tornado, hurricane, earthquake, fire or flood, could have a material adverse impact on our ability to conduct business, and our insurance coverage may be insufficient to compensate for losses that may occur. Acts of terrorism, war, civil unrest or future pandemics could cause disruptions to our business or the economy as a whole. While we have established and regularly test disaster recovery procedures, the occurrence of any such event could have a material adverse effect on our business, operations and financial condition.
Our financial statements are based in part on assumptions and estimates, which, if wrong, could cause unexpected losses in the future.
Pursuant to U.S. GAAP, we are required to use certain assumptions and estimates in preparing our financial statements, including in determining loan loss and litigation reserves, goodwill impairment and the fair value of certain assets and liabilities, among other items. If assumptions or estimates underlying our financial statements are incorrect, we may experience material losses. See the "Critical Accounting Policies" section in Item 7, "Management's Discussion and Analysis of Financial Condition and Results of Operations."
Changes in accounting standards can be difficult to predict and can materially impact how we record and report our financial condition and results of operations.
Our accounting policies and methods are fundamental to how we record and report our financial condition and results of operations. From time to time, the Financial Accounting Standards Board, or "FASB", changes the financial accounting and reporting principles that govern the preparation of our financial statements. These changes can be hard to anticipate and implement, and can materially impact how we record and report our financial condition and results of operations. In some cases, we could be required to apply a new or revised standard retroactively, resulting in our restating prior period financial statements. Additionally, significant changes to accounting standards may require costly technology changes, additional training and personnel, and other expense that will negatively impact our results of operations.
Changes in tax laws and regulations and differences in interpretation of tax laws and regulations may adversely impact our financial statements.
From time to time, local, state or federal tax authorities change tax laws and regulations, which may result in a decrease or increase to our net deferred tax assets. Local, state or federal tax authorities may interpret tax laws and regulations differently than we do and challenge tax positions that we have taken on tax returns. This may result in differences in the treatment of revenues, deductions, credits and/or differences in the timing of these items. The differences in treatment may result in payment of additional taxes, interest or penalties that could have a material adverse effect on our results.
Future capital offerings may adversely affect the market price of our common stock.
In the future, we may attempt to increase our capital resources or, if our banking subsidiaries' capital ratios fall below required minimums, we could be forced to raise additional capital by making additional offerings of debt, common or preferred stock, trust preferred securities, and senior or subordinated notes. Upon liquidation, holders of our debt securities and shares of preferred stock and lenders with respect to other borrowings will receive distributions of our available assets prior to the holders of our common stock. Additional equity offerings may dilute the holdings of our existing stockholders or reduce the market price of our common stock, or both. Because our decision to issue securities in any future offering will depend on market conditions and other factors beyond our control, we cannot predict or estimate the amount, timing or nature of our future offerings. Moreover, we cannot assure you that such capital will be available to us on acceptable terms or at all. Our inability to raise sufficient additional capital on acceptable terms when needed could adversely affect our businesses, financial condition and results of operations.
18
The market price and trading volume of our common stock may be volatile.
The market price of our common stock may be volatile. In addition, the trading volume in our common stock may fluctuate and cause significant price variations to occur. We cannot assure you that the market price of our common stock will not fluctuate or decline significantly in the future. Some of the factors that could negatively affect our share price or result in fluctuations in the price or trading volume of our common stock include:
•quarterly variations in our operating results or the quality of our assets;
•operating results that vary from the expectations of management, securities analysts and investors;
•changes in expectations as to our future financial performance;
•announcements of innovations, new products, strategic developments, significant contracts, acquisitions and other material events by us or our competitors;
•the operating and securities price performance of other companies that investors believe are comparable to us;
•our past and future dividend practices;
•future sales of our equity or equity-related securities; and
•changes in global financial markets and global economies and general market conditions, such as interest rates, stock, commodity or real estate valuations or volatility.
Anti-takeover provisions could negatively impact our stockholders.
Provisions of Delaware law and provisions of our certificate of incorporation and by-laws could make it more difficult for a third party to acquire control of us or have the effect of discouraging a third party from attempting to acquire control of us, even if a merge might be in the best interest of our stockholders. Our articles of organization authorize our Board of Directors to issue preferred stock without stockholder approval and such preferred stock could be issued as a defensive measure in response to a takeover proposal. These and other provisions could make it more difficult for a third party to acquire us.
If we acquire or seek to acquire other companies, our business may be negatively impacted by certain risks inherent with such acquisitions.
We have acquired and will continue to consider the acquisition of other financial services companies. To the extent that we acquire other companies in the future, our business may be negatively impacted by certain risks inherent with such acquisitions. Some of these risks include the following:
•We may incur substantial expenses in pursuing potential acquisitions;
•Management may divert its attention from other aspects of our business;
•We may assume potential and unknown liabilities of the acquired company as a result of an acquisition;
•The acquired business will not perform in accordance with management's expectations, including because we may lose key clients or employees of the acquired business as a result of the change in ownership;
•Difficulties may arise in connection with the integration of the operations of the acquired business with the operations of our businesses; and
•We may lose key employees of the combined business.
We may be required to write down goodwill and other acquisition-related identifiable intangible assets.
When we acquire a business, a portion of the purchase price of the acquisition may be allocated to goodwill and other identifiable intangible assets. The excess of the purchase price over the fair value of the net identifiable tangible and intangible assets acquired determines the amount of the purchase price that is allocated to goodwill acquired. As of December 31, 2023, goodwill and other identifiable intangible assets were $265.4 million. Under current accounting guidance, if we determine that goodwill or intangible assets are impaired, we would be required to write down the value of these assets. We conduct an annual review to determine whether goodwill and other identifiable intangible assets are impaired. We conduct a quarterly review for indicators of impairment of goodwill and other identifiable intangible assets. Our management recently completed these reviews and concluded that no impairment charge was necessary for the year ended December 31, 2023. We cannot provide assurance whether we will be required to take an impairment charge in the future. Any impairment charge would have a negative effect on stockholders' equity and financial results and may cause a decline in our stock price.
19
Attractive acquisition opportunities may not be available to us in the future, which could limit the growth of our business.
We may not be able to sustain a positive rate of growth or expand our business. We expect that other banking and financial service companies, many of which have significantly greater resources than us, will compete with us in acquiring other financial institutions if we pursue such acquisitions. This competition could increase prices for potential acquisitions that we believe are attractive. Also, acquisitions are subject to various regulatory approvals. If we fail to receive the appropriate regulatory approvals for a transaction, we will not be able to consummate such transaction which we believe to be in our best interests. Among other things, our regulators consider our capital, liquidity, profitability, regulatory compliance and levels of goodwill and intangibles when considering acquisition and expansion proposals. Other factors, such as economic conditions and legislative considerations, may also impede or prohibit our ability to expand our market presence. If we are not able to successfully grow our business, our financial condition and results of operations could be adversely affected.
RISKS RELATED TO OUR REGULATORY ENVIRONMENT
We operate in a highly regulated industry, and laws and regulations, or changes in them, could limit or restrict our activities and could have a material adverse effect on our operations.
We and our banking subsidiaries are subject to extensive state and federal regulation and supervision. Federal and state laws and regulations govern numerous matters affecting us, including changes in the ownership or control of banks and bank holding companies, maintenance of adequate capital and the financial condition of a financial institution, permissible types, amounts and terms of extensions of credit and investments, permissible non-banking activities, the level of reserves against deposits and restrictions on dividend payments. The FRB and the state banking regulators have the power to issue cease and desist orders to prevent or remedy unsafe or unsound practices or violations of law by banks subject to their regulation, and the FRB possesses similar powers with respect to bank holding companies. These and other restrictions limit the manner in which we and our banking subsidiaries may conduct business and obtain financing.
The laws, rules, regulations, and supervisory guidance and policies applicable to us are subject to regular modification and change. Such changes could, among other things, subject us to additional costs, including costs of compliance; limit the types of financial services and products we may offer; and/or increase the ability of non-banks to offer competing financial services and products. Failure to comply with laws, regulations, policies, or supervisory guidance could result in enforcement and other legal actions by federal or state authorities, including criminal and civil penalties, the loss of FDIC insurance, revocation of a banking charter, other sanctions by regulatory agencies, civil money penalties, and/or reputational damage, which could have a material adverse effect on our business, financial condition, and results of operations. See the "Supervision and Regulation" section of Item 1, "Business."
We are subject to numerous laws designed to protect consumers, including the Community Reinvestment Act and fair lending laws, and failure to comply with these laws could lead to a wide variety of sanctions.
The CRA, the Equal Credit Opportunity Act, the Fair Housing Act, and other fair lending laws and regulations impose community investment and nondiscriminatory lending requirements on financial institutions. The CFPB, the Department of Justice and other federal agencies are responsible for enforcing these laws and regulations. A successful regulatory challenge to an institution’s performance under the CRA, the Equal Credit Opportunity Act, the Fair Housing Act or other fair lending laws and regulations could result in a wide variety of sanctions, including damages and civil money penalties, injunctive relief, restrictions on mergers and acquisitions, restrictions on expansion and restrictions on entering new business lines. Private parties may also have the ability to challenge an institution’s performance under fair lending laws in private class action litigation. Such actions could have a material adverse effect on our business, financial condition and results of operations.
We may become subject to enforcements actions even though noncompliance was inadvertent or unintentional.
The financial services industry is subject to intense scrutiny from bank supervisors in the examination process and aggressive enforcement of federal and state regulations, particularly with respect to mortgage-related practices and other consumer compliance matters, and compliance with anti-money laundering, BSA and OFAC regulations, and economic sanctions against certain foreign countries and nationals. Enforcement actions may be initiated for violations of laws and regulations and unsafe or unsound practices. We maintain systems and procedures designed to ensure that we comply with applicable laws and regulations; however, some legal/regulatory frameworks provide for the imposition of fines or penalties for noncompliance even though the noncompliance was inadvertent or unintentional and even though there was in place at the time systems and procedures designed to ensure compliance. Failure to comply with these and other regulations, and supervisory expectations related thereto, may result in fines, penalties, lawsuits, regulatory sanctions, reputation damage, or restrictions on our business.
20
We face significant legal risks, both from regulatory investigations and proceedings and from private actions brought against us.
As a participant in the financial services industry, many aspects of our business involve substantial risk of legal liability. From time to time, customers and others make claims and take legal action pertaining to the performance of our responsibilities. Whether customer claims and legal action related to the performance of our responsibilities are founded or unfounded, if such claims and legal actions are not resolved in a manner favorable to us, they may result in significant expenses, attention from management and financial liability. Any financial liability or reputational damage could have a material adverse effect on our business, which, in turn, could have a material adverse effect on our financial condition and results of operations. There is no assurance that litigation with private parties will not increase in the future. Actions currently pending against us may result in judgments, settlements, fines, penalties or other results adverse to us, which could materially adversely affect our business, financial condition or results of operations, or cause serious reputational harm to us.
The FRB may require us to commit capital resources to support the Banks.
Federal law requires that a holding company act as a source of financial and managerial strength to its subsidiary bank and to commit resources to support such subsidiary bank. Under the “source of strength” doctrine, the FRB may require a holding company to make capital injections into a troubled subsidiary bank and may charge the holding company with engaging in unsafe and unsound practices for failure to commit resources to a subsidiary bank. A capital injection may be required at times when the holding company may not have the resources to provide it and therefore may require the holding company to borrow the funds or raise capital. Any loans by a holding company to its subsidiary bank are subordinate in right of payment to deposits and to certain other indebtedness of such subsidiary bank. In the event of a holding company’s bankruptcy, the bankruptcy trustee will assume any commitment by the holding company to a federal bank regulatory agency to maintain the capital of a subsidiary bank. Moreover, bankruptcy law provides that claims based on any such commitment will be entitled to a priority of payment over the claims of the institution’s general unsecured creditors, including the holders of its note obligations. Thus, any borrowing that must be done by us to make a required capital injection becomes more difficult and expensive and could have an adverse effect on our business, financial condition and results of operations.
We are subject to stringent capital requirements which may adversely impact return on equity, require additional capital raises, or limit the ability to pay dividends or repurchase shares.
Federal regulations establish minimum capital requirements for insured depository institutions, including minimum risk-based capital and leverage ratios, and define “capital” for calculating these ratios. The minimum capital requirements are: (i) a common equity Tier 1 capital ratio of 4.5%; (ii) a Tier 1 to risk-based assets capital ratio of 6%; (iii) a total capital ratio of 8%; and (iv) a Tier 1 leverage ratio of 4%. The regulations also establish a “capital conservation buffer” of 2.5%, which if complied will result in the following minimum ratios: (i) a common equity Tier 1 capital ratio of 7.0%; (ii) a Tier 1 to risk-based assets capital ratio of 8.5%; and (iii) a total capital ratio of 10.5%. An institution will be subject to limitations on paying dividends, engaging in share repurchases and paying discretionary bonuses if its capital level falls below the capital conservation buffer amount. The application of these capital requirements could, among other things, require us to maintain higher capital resulting in lower returns on equity, and we may be required to obtain additional capital to comply or result in regulatory actions if we are unable to comply with such requirements. See Item 1, “Business-Supervision and Regulation-Capital Adequacy and Safety and Soundness-Regulatory Capital Requirements.”
Item 1B. Unresolved Staff Comments
None.
Item 1C. Cybersecurity
As a financial services company, we face cybersecurity risks and threats, and our customers, suppliers, and third-party service providers face cybersecurity risks and threats. As part of the operation of our business, the Company uses, stores, and processes data for our customers, employees, partners, and suppliers. A cybersecurity incident impacting any of these entities could materially adversely affect our operations, performance, or results of operations. In addition, as a financial services company we are subject to extensive regulatory compliance requirements, including those established by the FRB, MDOB, RIDBR, and NYDFS. To address these risks and regulatory requirements, the Company implemented a Cybersecurity Risk Management Program (the “Program”) that is designed to identify, assess and mitigate risks from cybersecurity threats to the data and our systems. The Program adheres to regulatory requirements and the tenets of the Federal Financial Institutions Examination Council (“FFIEC”) handbook and the National Institute of Standards and Technology (“NIST”) Cybersecurity Framework (“CSF”).
21
Risk Management Oversight and Governance
Our Chief Information Security Officer (“CISO”), assisted by our Information Security team, has primary responsibility for assessing and managing the Program and reporting on cybersecurity matters to the Company’s Board of Directors and members of executive management. Our CISO has extensive experience managing information technology systems and information security systems, previously served as the Company’s Chief Information Officer, and holds the Certified Information Systems Security Professional (“CISSP”) and Certified Information Security Manager (“CISM”) certifications. Our CISO regularly updates members of executive management on developments surrounding cybersecurity. The CISO reports to the Risk Committee of the Board of Directors and provides regular reports to the Board of Directors and Risk Committee on emerging cybersecurity issues and the Company’s cybersecurity infrastructure.
Our Program is overseen by the Company’s Board of Directors, which has delegated certain responsibilities to the Audit Committee and the Risk Committee. The Chairs of the Audit Committee and Risk Committee, in turn, report to the Board of Directors a summary of the presentations they have received relative to the Program. The Board of Directors oversees management’s processes for identifying and mitigating risks, including cyber risks, to assist in the alignment of our risk exposure with our overall strategic business objectives. The Board of Directors has also engaged an experienced information security advisor to assist them with cybersecurity and data privacy oversight responsibilities. This advisor provides the Board of Directors with independent updates on external market cybersecurity threats and emerging risks on a regular basis.
The Risk Committee, Audit Committee, and the Board of Directors are active in understanding and evaluating cybersecurity risks. The Risk Committee receives and reviews a quarterly Enterprise Risk Management (“ERM”) report from the Chief Risk Officer that is the cumulation of a process that involves discussions with leaders across the Company and incorporates a number of enterprise risk factors, including those related to cybersecurity threats. The Audit Committee receives the results of internal and external penetration testing as well as any other audits applicable to the Company’s information security programs. The Audit Committee actively engages management in discussions surrounding the outcome of these audits.
At least annually, the Board of Directors receives a report from the CISO covering the Company’s information security program. This report includes a review of enhancements to the Company’s programs, a discussion of management’s actions to identify and detect threats and planned action steps in the event of an incident, and an overview of employee training and engagement efforts. In addition, separately, on at least an annual basis, the Board of Directors receives updates from the CISO on the Company’s Incident Response Plan, which outlines steps to be followed in the event of an incident including detection, mitigation, recovery, and notification (including notification to senior management, the Board of Directors, and functional business areas), and remediation.
Cybersecurity Risk Management Program
The Program is designed to identify, assess, manage, mitigate, and respond to cyber threats with the goal of preventing cybersecurity incidents to the extent feasible, while also increasing our system resilience to minimize business disruption in the event we experience a cyber event. Our program is structured to be nimble and adaptable to changes in cybersecurity threats over time and to respond to emerging threats in a timely and efficient manner. Our Program consists of a layered cybersecurity approach and is incorporated into our overall ERM program.
Our Information Security team, led by our CISO, is responsible for monitoring our information systems for vulnerabilities and mitigating any issues. The Information Security team works collaboratively across the Company to understand the potential impacts of a cybersecurity incident and prioritize mitigation and other measures based on, among other things, the materiality to our business. The Information Security team has established processes designed to monitor threats in the cybersecurity landscape which include interacting with intelligence networks, working with researchers, discussions with peers at other companies, monitoring social media, reviewing government alerts and other news items and attending industry specific security conferences and trainings. The team regularly monitors our internal network and customer-facing network to identify any security issues. In addition, the Company augments the team’s monitoring via the engagement of external vendors who provide continuous threat monitoring services of the Company’s environment.
As part of our assessment of the risks to our Company, the Information Security team conducts annual cybersecurity risk assessments to evaluate the inherent risk of our applications and the strength of our controls, and identify the residual risk for each application. In addition, we conduct regular reviews and testing of critical network and application systems to monitor their security. We have adopted internal Company-wide Information Technology and Information Security policies which are reviewed and updated annually and approved by our Board of Directors. Our employees and the Board of Directors attend annual trainings that are designed to raise awareness about cybersecurity threats, reduce our vulnerability, and encourage consideration of cybersecurity threats across the Company. Additional trainings are required for employees in certain roles; these additional trainings are tailored to the employees’ specific duties.
22
We regularly review and update our investments in information technology security to identify and protect critical assets, provide monitoring and alerts, and, as needed, engage third-party experts. To assess the effectiveness of our Program, we have engaged consultants to conduct penetration testing and other vulnerability assessments. Additionally, our Internal Audit department and external auditors conduct assessments of different systems to provide the Audit Committee with information on our risk management processes, including cybersecurity risk management. We also test our defenses internally and conduct regular cybersecurity simulations and tabletop exercises with members of executive management present. These tests and assessments provide useful insights into the strengths and weaknesses of our cybersecurity framework.
Our cybersecurity framework is designed to protect our customers, employees, investors, and our intellectual property. Before purchasing third-party technology or other solutions that could expose the Company’s assets and electronic information, our Information Security and Information Technology teams complete security reviews on the vendors. We also conduct ongoing reviews of cybersecurity risks associated with our third-party service providers. As part of the Company’s Vendor Management Program, annual reviews are conducted for certain third-party vendors. Members of our Information Security team work with our Vendor Management team to review System and Organization Controls (“SOC”) 1 or SOC 2 reports. In the event a third-party vendor is unable to provide either a SOC 1 or SOC 2 report, this group conducts additional reviews to assess the cybersecurity preparedness of the specific vendor. This assessment of the risks associated with the use of third-party service providers is part of our overall vendor management and cybersecurity risk management framework.
Our Company faces a number of cybersecurity risks in connection with the operation of our business which could have a material adverse effect on our business financial condition, results of operations, cash flows, or reputation. Although, to date, such risks have not materially affected us, we have, from time to time, experienced threats and breaches to our data and systems. For more information about the cybersecurity risks we face, see the risk factors entitled “We face continuing and growing security risks to our information base, including the information we maintain relating to our customers.” and “We rely on other companies to provide key components of our business infrastructure.” in Item 1A- Risk Factors.
Item 2. Properties
The Company’s executive administration offices are located at 131 Clarendon Street, Boston, Massachusetts, which is owned by Brookline Bank, as well as its corporate operations center in Lincoln, Rhode Island, which is owned by BankRI, with other administrative and operations functions performed at several different locations. Clarendon Private conducts its business from a portion of the Company's executive administration offices which it leases.
Brookline Bank conducts its business from 29 banking offices, six of which are owned, 22 of which are leased, and one of which is subleased. Brookline Bank's main banking office is leased and located in Brookline, Massachusetts. Brookline Bank also has two additional lending offices and one remote ATM location, all of which are leased. Eastern Funding conducts its business from leased premises in New York City, New York, in Melville, New York, and in Plainview, New York.
BankRI conducts its business from 22 banking offices, six of which are owned and 16 of which are leased. BankRI's main banking office is leased and located in Providence, Rhode Island. BankRI also has two remote ATM locations, all of which are leased.
PCSB Bank conducts its business from 14 banking offices, four of which are owned and 10 of which are leased. PCSB bank's main banking office is leased and located in Yorktown Heights, New York.
Refer to Note 13, "Commitments and Contingencies," to the consolidated financial statements for information regarding the Company's lease commitments as of December 31, 2023.
Item 3. Legal Proceedings
During the fiscal year ended December 31, 2023, the Company was not involved in any legal proceedings other than routine legal proceedings occurring in the ordinary course of business. Management believes that those routine legal proceedings involve, in the aggregate, amounts that are immaterial to the Company's financial condition and results of operations.
Item 4. Mine Safety Disclosures
Not applicable.
23
PART II
Item 5. Market for the Registrant's Common Equity, Related Stockholder Matters and Issuer Purchases of Equity Securities
(a)The common stock of the Company is traded on Nasdaq under the symbol BRKL. The number of registered holders of common stock as of February 27, 2024 was 2,693. The Company currently pays quarterly cash dividends in the amount of $0.135 per share. The Company expects comparable cash dividends will be paid in the future.
Equity Compensation Plan Information
Refer to Note 20, "Employee Benefit Plans" for a discussion of the Company's equity compensation plans.
Five-Year Performance Comparison
The following graph compares total shareholder return on the Company's common stock over the last five years with the S&P 500 Index, the Russell 2000 Index and the KBW Regional Banking Index. Index values are as of December 31 of each of the indicated years.
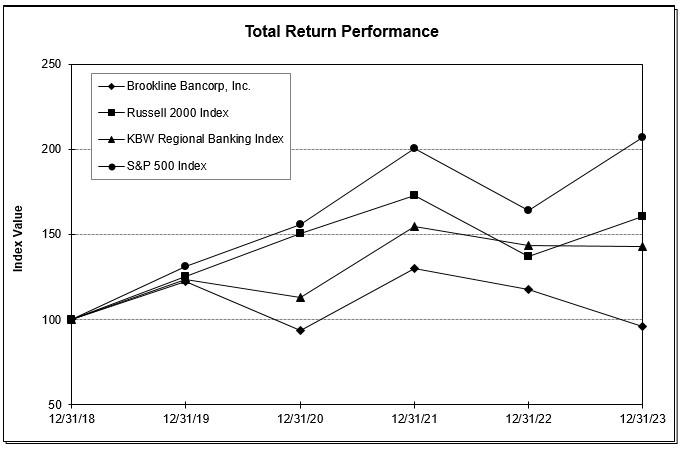
| At December 31, | |||||||||||||||||||||||||||||||||||
| Index | 2018 | 2019 | 2020 | 2021 | 2022 | 2023 | |||||||||||||||||||||||||||||
| Brookline Bancorp, Inc. | 100.00 | 122.59 | 93.59 | 129.84 | 117.57 | 95.86 | |||||||||||||||||||||||||||||
| Russell 2000 Index | 100.00 | 125.52 | 150.55 | 172.80 | 137.36 | 160.62 | |||||||||||||||||||||||||||||
| KBW Regional Banking Index | 100.00 | 123.87 | 113.11 | 154.43 | 143.71 | 143.14 | |||||||||||||||||||||||||||||
| S&P 500 Index | 100.00 | 131.49 | 155.67 | 200.31 | 163.91 | 207.08 | |||||||||||||||||||||||||||||
24
The graph assumes $100 invested on December 31, 2018 in each of the Company's common stock, the S&P 500 Index, the Russell 2000 Index and the KBW Regional Banking Index. The graph also assumes reinvestment of all dividends.
(b)Not applicable.
(c) Not applicable.
Item 6. [Reserved]
Item 7. Management's Discussion and Analysis of Financial Condition and Results of Operations
Introduction
The Company, a Delaware corporation, operates as a multi-bank holding company for Brookline Bank and its subsidiaries; Bank Rhode Island and its subsidiaries ("BankRI"); PCSB Bank and its subsidiaries; and Clarendon Private, LLC. Brookline Securities Corp, previously a subsidiary of Brookline Bancorp, Inc., was dissolved in November 2023.
As a commercially-focused financial institution with 65 full-service banking offices throughout Greater Boston, Rhode Island and New York, the Company, through Brookline Bank, BankRI and PCSB Bank (collectively referred to as the "Banks') offers a wide range of commercial, business and retail banking services, including a full complement of cash management products, foreign exchange services, on-line and mobile banking services, consumer and residential loans and investment advisory services, designed to meet the financial needs of small- to mid-sized businesses and individuals throughout central New England and the Lower Hudson Valley in New York. The Banks and their subsidiaries lend primarily in all New England states and New York, with the exception of equipment financing, 29% of which is in the greater New York and New Jersey metropolitan area and 71% of which is in other areas in the United States of America as of December 31, 2023. Clarendon Private is a registered investment advisor with the SEC. Through Clarendon Private, the Company offers a wide range of wealth management services to individuals, families, endowments and foundations to help these clients meet their long-term financial goals.
The Company focuses its business efforts on profitably growing its commercial lending businesses, both organically and through acquisitions. The Company’s customer focus, multi-bank structure, and risk management are integral to its organic growth strategy and serve to differentiate the Company from its competitors. As full-service financial institutions, the Banks and their subsidiaries focus their efforts on developing and deepening long-term banking relationships with qualified customers through a full complement of products and excellent customer service, and strong risk management.
The Company manages the Banks under uniform strategic objectives, with one set of uniform policies consistently applied by one executive management team. Within this environment, the Company believes that the ability to make customer decisions locally enhances management's motivation, service levels and, as a consequence, the Company's financial results. As such, while most back-office functions are consolidated at the holding company level, branding and decision-making, including credit decisions and pricing, remain largely local in order to better meet the needs of bank customers and further motivate the Banks’ commercial, business and retail bankers. These credit decisions, at the local level, are executed through corporate policies overseen by the Company's credit department.
The competition for loans and leases and deposits remains strong. Loan and deposit growth are also influenced by the rate-setting actions of the Board of Governors of the Federal Reserve System (the "FRB"). Based on management's scenario analysis of deposit sensitivity to the current rate environment and customer's demand for non-depository investment alternatives, management expects that there will be further deposit mix migration and increased deposit sensitivity to interest rates which will negatively impact net interest income and net interest margin.
Management expects pressure on the net interest margin to continue for a quarter or two after the Federal Reserve stops increasing rates, after which the net interest margin is expected to stabilize and then increase as loans continue to reprice into the higher rate environment faster than time deposits and other funding sources. Net interest income models, using a projected flat balance sheet with stable deposit balances and an average sensitivity of deposit rates of approximately 39% to market rates, forecast that a short-term increase in rates will positively affect the Company's net interest income, net interest spread, and net interest margin.
As discussed above, changes in interest rates could also precipitate a change in the mix and volume of the Company's deposits and loans. The future operating results of the Company will depend on its ability to maintain or increase the current net interest income, manage credit risk, increase sources of non-interest income, while managing non-interest expenses.
The Company’s common stock is traded on the Nasdaq Global Select MarketSM under the symbol “BRKL.”
25
Selected Financial Data
The selected financial and other data of the Company set forth below are derived in part from, and should be read in conjunction with, the Consolidated Financial Statements of the Company and Notes thereto presented elsewhere herein.
| At or for the year ended December 31, | |||||||||||||||||||||||||||||
| 2023 | 2022 | 2021 | 2020 | 2019 | |||||||||||||||||||||||||
| (Dollars in Thousands, Except Per Share Data) | |||||||||||||||||||||||||||||
| FINANCIAL CONDITION DATA | |||||||||||||||||||||||||||||
| Total assets | $ | 11,382,256 | $ | 9,185,836 | $ | 8,602,622 | $ | 8,942,424 | $ | 7,856,853 | |||||||||||||||||||
| Total loans and leases | 9,641,589 | 7,644,388 | 7,154,457 | 7,269,553 | 6,737,816 | ||||||||||||||||||||||||
Allowance for loan and lease losses (6) | 117,522 | 98,482 | 99,084 | 114,379 | 61,082 | ||||||||||||||||||||||||
| Allowance for investment security losses | 441 | 102 | — | — | — | ||||||||||||||||||||||||
| Investment securities available-for-sale | 916,601 | 656,766 | 720,866 | 745,822 | 498,995 | ||||||||||||||||||||||||
| Investment securities held-to-maturity | — | — | — | — | 86,780 | ||||||||||||||||||||||||
| Equity securities held-for-trading | — | — | — | 526 | 3,581 | ||||||||||||||||||||||||
| Goodwill and identified intangible assets | 265,429 | 162,208 | 162,703 | 163,579 | 164,850 | ||||||||||||||||||||||||
| Total deposits | 8,548,125 | 6,522,146 | 7,049,906 | 6,910,696 | 5,830,072 | ||||||||||||||||||||||||
Core deposits (1) | 6,092,097 | 5,283,859 | 5,766,669 | 4,826,789 | 3,808,430 | ||||||||||||||||||||||||
| Certificates of deposit | 1,574,855 | 928,143 | 1,117,695 | 1,389,998 | 1,671,738 | ||||||||||||||||||||||||
| Brokered deposits | 881,173 | 310,144 | 165,542 | 693,909 | 349,904 | ||||||||||||||||||||||||
| Total borrowed funds | 1,376,670 | 1,432,652 | 357,321 | 820,247 | 902,749 | ||||||||||||||||||||||||
| Stockholders' equity | 1,198,644 | 992,125 | 995,342 | 941,778 | 945,606 | ||||||||||||||||||||||||
| Tangible stockholders' equity (*) | 933,215 | 829,917 | 832,639 | 778,199 | 780,756 | ||||||||||||||||||||||||
Nonperforming loans and leases (2) | 43,630 | 14,894 | 32,459 | 38,448 | 19,461 | ||||||||||||||||||||||||
Nonperforming assets (3) | 45,324 | 15,302 | 33,177 | 44,963 | 22,092 | ||||||||||||||||||||||||
| EARNINGS DATA | |||||||||||||||||||||||||||||
| Interest and dividend income | $ | 577,287 | $ | 345,186 | $ | 311,529 | $ | 326,817 | $ | 347,626 | |||||||||||||||||||
| Interest expense | 237,576 | 45,415 | 29,156 | 66,654 | 94,326 | ||||||||||||||||||||||||
| Net interest income | 339,711 | 299,771 | 282,373 | 260,163 | 253,300 | ||||||||||||||||||||||||
| Provision (credit) for credit losses on loans | 37,868 | 8,525 | (7,837) | 61,886 | 9,583 | ||||||||||||||||||||||||
| Provision (credit) for credit losses on investments | 339 | 102 | — | — | — | ||||||||||||||||||||||||
| Non-interest income | 31,934 | 28,347 | 26,989 | 24,644 | 29,793 | ||||||||||||||||||||||||
| Non-interest expense | 239,524 | 179,542 | 162,608 | 160,844 | 157,481 | ||||||||||||||||||||||||
| Provision for income taxes | 18,915 | 30,205 | 39,151 | 14,442 | 28,269 | ||||||||||||||||||||||||
| Net income | 74,999 | 109,744 | 115,440 | 47,635 | 87,717 | ||||||||||||||||||||||||
| Operating earnings (*) | 92,928 | 111,255 | 115,468 | 46,124 | 88,184 | ||||||||||||||||||||||||
| PER COMMON SHARE DATA | |||||||||||||||||||||||||||||
| Earnings per share - Basic | $ | 0.85 | $ | 1.42 | $ | 1.48 | $ | 0.60 | $ | 1.10 | |||||||||||||||||||
| Earnings per share - Diluted | 0.85 | 1.42 | 1.48 | 0.60 | 1.10 | ||||||||||||||||||||||||
| Operating earnings per share (*) | 1.05 | 1.44 | 1.48 | 0.58 | 1.10 | ||||||||||||||||||||||||
| Dividends paid per common share | 0.540 | 0.520 | 0.480 | 0.460 | 0.440 | ||||||||||||||||||||||||
| Book value per share (end of period) | 13.48 | 12.91 | 12.82 | 12.05 | 11.87 | ||||||||||||||||||||||||
| Tangible book value per share (*) | 10.50 | 10.80 | 10.73 | 9.96 | 9.80 | ||||||||||||||||||||||||
| Stock price (end of period) | 10.91 | 14.15 | 16.19 | 12.04 | 16.46 | ||||||||||||||||||||||||
| PERFORMANCE RATIOS | |||||||||||||||||||||||||||||
| Net interest margin | 3.24 | % | 3.67 | % | 3.49 | % | 3.17 | % | 3.51 | % | |||||||||||||||||||
| Return on average assets | 0.67 | % | 1.27 | % | 1.36 | % | 0.55 | % | 1.15 | % | |||||||||||||||||||
26
| At or for the year ended December 31, | |||||||||||||||||||||||||||||
| 2023 | 2022 | 2021 | 2020 | 2019 | |||||||||||||||||||||||||
| (Dollars in Thousands, Except Per Share Data) | |||||||||||||||||||||||||||||
| Operating return on average assets (*) | 0.83 | % | 1.29 | % | 1.36 | % | 0.53 | % | 1.15 | % | |||||||||||||||||||
| Return on average tangible assets (*) | 0.69 | % | 1.30 | % | 1.38 | % | 0.56 | % | 1.17 | % | |||||||||||||||||||
| Operating return on average tangible assets (*) | 0.85 | % | 1.32 | % | 1.38 | % | 0.54 | % | 1.17 | % | |||||||||||||||||||
| Return on average stockholders' equity | 6.42 | % | 11.15 | % | 11.93 | % | 5.09 | % | 9.56 | % | |||||||||||||||||||
| Operating return on average stockholders' equity (*) | 7.95 | % | 11.30 | % | 11.93 | % | 4.93 | % | 9.61 | % | |||||||||||||||||||
| Return on average tangible stockholders' equity (*) | 8.36 | % | 13.35 | % | 14.35 | % | 6.17 | % | 11.67 | % | |||||||||||||||||||
| Operating return on average tangible stockholders' equity (*) | 10.36 | % | 13.53 | % | 14.35 | % | 5.97 | % | 11.73 | % | |||||||||||||||||||
| Dividend payout ratio (*) | 63.90 | % | 36.52 | % | 32.45 | % | 76.41 | % | 40.03 | % | |||||||||||||||||||
Efficiency ratio (4) | 64.45 | % | 54.72 | % | 52.56 | % | 56.47 | % | 55.63 | % | |||||||||||||||||||
| GROWTH RATIOS | |||||||||||||||||||||||||||||
Total loan and lease growth (5) | 26.13 | % | 6.85 | % | (1.58) | % | 7.89 | % | 6.89 | % | |||||||||||||||||||
Total deposit growth (5) | 31.06 | % | (7.49) | % | 2.01 | % | 18.54 | % | 6.89 | % | |||||||||||||||||||
| ASSET QUALITY RATIOS | |||||||||||||||||||||||||||||
| Net loan and lease charge-offs as a percentage of average loans and leases | 0.21 | % | 0.05 | % | 0.08 | % | 0.18 | % | 0.11 | % | |||||||||||||||||||
| Nonperforming loans and lease losses as a percentage of total loans and leases | 0.45 | % | 0.19 | % | 0.45 | % | 0.53 | % | 0.29 | % | |||||||||||||||||||
| Nonperforming assets as a percentage of total assets | 0.40 | % | 0.17 | % | 0.39 | % | 0.50 | % | 0.28 | % | |||||||||||||||||||
| Total allowance for loan and leases losses as a percentage of total loans and leases | 1.22 | % | 1.29 | % | 1.38 | % | 1.57 | % | 0.91 | % | |||||||||||||||||||
| CAPITAL RATIOS | |||||||||||||||||||||||||||||
| Stockholders' equity to total assets | 10.53 | % | 10.80 | % | 11.57 | % | 10.53 | % | 12.04 | % | |||||||||||||||||||
| Tangible equity ratio (*) | 8.39 | % | 9.20 | % | 9.87 | % | 8.86 | % | 10.15 | % | |||||||||||||||||||
| Tier 1 leverage capital ratio | 9.02 | % | 10.26 | % | 10.15 | % | 8.92 | % | 10.28 | % | |||||||||||||||||||
| Common equity Tier 1 capital ratio (**) | 10.25 | % | 12.05 | % | 11.86 | % | 11.04 | % | 11.44 | % | |||||||||||||||||||
| Tier 1 risk-based capital ratio | 10.35 | % | 12.18 | % | 11.99 | % | 11.18 | % | 11.58 | % | |||||||||||||||||||
| Total risk-based capital ratio | 12.37 | % | 14.44 | % | 14.30 | % | 13.51 | % | 13.59 | % | |||||||||||||||||||
_______________________________________________________________________________
(1) Core deposits consist of demand checking, NOW, money market and savings accounts.
(2) Nonperforming loans and leases consist of nonaccrual loans and leases.
(3) Nonperforming assets consist of nonperforming loans and leases, other real estate owned and other repossessed assets.
(4) The efficiency ratio is calculated by dividing non-interest expense by the sum of net interest income and non-interest income for the period.
(5) Total growth is calculated by dividing the change in the balance during the period by the balance at the beginning of the period.
(6) The allowance for loan and lease losses for the years ending after December 31, 2019 reflect the adoption of CECL.
(*) Refer to Non-GAAP Financial Measures and Reconciliation to GAAP.
(**) Common equity tier 1 capital ratio is calculated by dividing common equity Tier 1 capital by risk-weighted assets. The ratio was established as part of the implementation of Basel III, effective January 1, 2015.
Executive Overview
Balance Sheet
Total assets increased $2.2 billion, or 23.9%, to $11.4 billion as of December 31, 2023 from $9.2 billion as of December 31, 2022. The increase was primarily driven by the acquisition of PCSB.
Cash and cash equivalents decreased $249.9 million, or 65.3%, to $133.0 million as of December 31, 2023 from $383.0 million as of December 31, 2022.
27
Total loans and leases increased $2.0 billion, or 26.1%, to $9.6 billion as of December 31, 2023 from $7.6 billion as of December 31, 2022. The Company's commercial loan portfolios, which are comprised of commercial real estate loans and commercial loans and leases, totaled $8.2 billion, or 84.7% of total loans and leases as of December 31, 2023, an increase of $1.7 billion, or 27.2%, from $6.4 billion, or 84.0% of total loans and leases, as of December 31, 2022.
Total deposits increased $2.0 billion, or 31.1%, to $8.5 billion as of December 31, 2023 from $6.5 billion as of December 31, 2022, primarily driven by the completion of the PCSB acquisition. Core deposits, which include demand checking, NOW, money market and savings accounts, totaled $6.1 billion, or 71.3% of total deposits as of December 31, 2023, an increase of $0.8 billion, or 15.3%, from $5.3 billion, or 81.0% of total deposits as of December 31, 2022. Certificate of deposit balances totaled $1.6 billion, or 18.4% of total deposits as of December 31, 2023, an increase of $0.6 billion, or 69.7%, from $0.9 billion, or 14.2% of total deposits, as of December 31, 2022. Brokered deposit balances totaled $0.9 billion, or 10.3% of total deposits as of December 31, 2023, an increase of $0.6 billion, or 184.1%, from $0.3 billion, or 4.8% of total deposits, as of December 31, 2022.
Total borrowed funds decreased $56.0 million, or 3.9%, to $1.38 billion as of December 31, 2023 from $1.43 billion as of December 31, 2022.
Asset Quality
Nonperforming assets as of December 31, 2023 totaled $45.3 million, or 0.40% of total assets, compared to $15.3 million, or 0.17% of total assets, as of December 31, 2022. Net charge-offs for the year ended December 31, 2023 were $19.7 million, or 0.21% of average loans and leases, compared to $3.3 million, or 0.05% of average loans and leases, for the year ended December 31, 2022. The increase of $30.0 million in nonperforming assets was primarily driven by increases of $19.0 million in nonperforming commercial real estate loans, $5.4 million in nonperforming equipment financing loans, $3.4 million in nonperforming commercial loans, and $1.6 million in nonperforming residential loans during the year ended December 31, 2023.
The ratio of the allowance for loan and lease losses to total loans and leases was 1.22% as of December 31, 2023, compared to 1.29% as of December 31, 2022.
The ratio of the allowance for loan and lease losses to nonaccrual loans and leases was 269.36% as of December 31, 2023, compared to 661.22% as of December 31, 2022.
Capital Strength
The Company is a "well-capitalized" bank holding company as defined in the FRB's Regulation Y. The Company's common equity Tier 1 capital ratio was 10.25% as of December 31, 2023, compared to 12.05% as of December 31, 2022. The Company's Tier 1 leverage ratio was 9.02% as of December 31, 2023, compared to 10.26% as of December 31, 2022. As of December 31, 2023, the Company's Tier 1 risk-based ratio was 10.35%, compared to 12.18% as of December 31, 2022. The Company's total risk-based ratio was 12.37% as of December 31, 2023, compared to 14.44% as of December 31, 2022.
The Company's ratio of stockholders' equity to total assets was 10.53% and 10.80% as of December 31, 2023 and December 31, 2022, respectively. The Company's tangible equity ratio was 8.39% and 9.20% as of December 31, 2023 and December 31, 2022, respectively.
Net Income
For the year ended December 31, 2023, the Company reported net income of $75.0 million, or $0.85 per basic and diluted share, a decrease of $34.7 million, or 31.7%, from $109.7 million, or $1.42 per basic and diluted share for the year ended December 31, 2022. The decrease in net income is primarily the result of an increase in non-interest expense of $60.0 million and an increase in the provision for credit losses of $29.3 million which includes $16.7 million attributable to the closing of the PCSB Bank acquisition, partially offset by an increase in net interest income of $39.9 million, a decrease in the provision for income taxes of $11.3 million, and an increase in non-interest income of $3.6 million.
The return on average assets was 0.67% for the year ended December 31, 2023, compared to 1.27% for the year ended December 31, 2022. The return on average stockholders' equity was 6.42% for the year ended December 31, 2023, compared to 11.15% for the year ended December 31, 2022.
The net interest margin was 3.24% for the year ended December 31, 2023, down from 3.67% for the year ended December 31, 2022. The decrease in the net interest margin is a result of an increase of 218 basis points in the Company's cost of funds to 3.00% in 2023 from 0.82% in 2022, partially offset by an increase in the yield on interest-earning assets of 128 basis points to 5.50% in 2023 from 4.22% in 2022.
28
Results for 2023 included a provision for credit losses of $37.9 million, as discussed in the "Allowance for Credit Losses—Allowance for Loan and Lease Losses" section below.
Non-interest income increased $3.6 million to $31.9 million for the year ended December 31, 2023 from $28.3 million for the year ended December 31, 2022. Several factors contributed to the year over year increase, including increases of $3.6 million in other non-interest income, $1.4 million in gain on sales of investment securities, net, and $0.7 million in deposit fees, partially offset by decreases of $1.6 million in gain on sales of loans and leases, $0.4 million in loan level derivative income, net., and $0.2 million in loan fees.
Non-interest expense increased $60.0 million to $239.5 million for the year ended December 31, 2023 from $179.5 million for the year ended December 31, 2022, primarily driven the completion of the PCSB acquisition. The increase was largely attributable to increases of $25.4 million in compensation and employee benefits expense, $7.3 million in amortization of identified intangible assets, $6.2 million in equipment and data processing expense, $5.2 million in merger and acquisition expense, $5.1 million in other non-interest expense, $4.7 million in FDIC insurance expense, $4.2 million in occupancy expense, and $2.2 million in professional services expense, partially offset by a decrease of $0.3 million in advertising and marketing expense.
Critical Accounting Policies and Estimates
The accounting policies described below are considered critical to understanding the Company's financial condition and operating results. Such accounting policies are considered to be especially important because they involve a higher degree of complexity and require management to make difficult and subjective judgments which often require assumptions or estimates about matters that are inherently uncertain. The use of different judgments, assumptions and estimates could result in material differences in the Company's operating results or financial condition.
Allowance for Credit Losses
Description. The allowance for credit losses represents management's estimate of expected losses over the life of the loan and lease portfolio. The allowance for credit losses consists of the allowance for loan and lease losses and reserve for unfunded commitments, which are classified as a contra-asset and liability within other liabilities, respectively, on the Consolidated Balance Sheets. Additions to the allowance for credit losses are made by charges to the provision for credit losses. Losses on loans and leases are deducted from the allowance when all or a portion of a loan or lease is considered uncollectible. The determination of the loans on which full collectability is not reasonably assured, the estimates of the fair value of the underlying collateral, and the assessment of economic and other conditions are subject to assumptions and judgments by management. Valuation allowances could differ materially as a result of changes in, or different interpretations of, these assumptions and judgments.
Management evaluates the adequacy of the allowance on a quarterly basis and reviews its conclusion as to the amount to be established with the Audit Committee and the Board of Directors.
As a result of the adoption of ASU 2016-13 effective January 1, 2020, the Company updated its critical accounting policy for the allowance for credit losses. The updates in this standard replace the incurred loss impairment GAAP methodology with the Current Expected Credit Losses ("CECL") methodology. The CECL methodology incorporates current condition, and "reasonable and supportable" forecasts, as well as prepayments, to estimate credit losses over the life of the loan.
Judgments and Uncertainties. In estimating the allowance for credit losses, the Company relies on models and economic forecasts developed by external parties as the primary driver of the allowance for credit losses. These models and forecasts are based on nationwide sets of data. As a result, the Company has calibrated the output of these models to match the performance of a relevant set of peer institutions during the development dataset in order to make the results more relevant to the Company. Additionally, economic forecasts can change significantly over an economic cycle and have a significant level of uncertainty associated with them. The performance of the models is dependent on the variables used in the models being reasonable proxies for the portfolio’s performance; however, these variables may not capture all sources of risk within the portfolio. As a result, management reviews the results and makes qualitative adjustments to the models to capture limitations of the models as necessary. Such qualitative factors may include adjustments to better capture the risk of specialty lending portfolios, the imprecision associated with the economic forecasts, and the ability of the models to capture emerging risks within the portfolio that may not be represented in the historical dataset. These judgments are thoroughly evaluated through management’s review process, and revised on a quarterly basis to account for changes in the facts and circumstances of the portfolio.
Effect if Actual Results Differ From Assumptions. The allowance for credit losses is a reflection of the Company’s best estimate of loss based on a forecast of future conditions as of a point in time. Conditions in the future may vary from those forecasts, causing realized losses to be either higher or lower than forecasted, which will result in either additional provisions from income or a benefit to income based on the performance of the portfolio.
29
Impairment of Goodwill
Description. Goodwill is presumed to have an indefinite useful life and is tested at least annually for impairment. Impairment exists when the carrying amount of goodwill exceeds its implied fair value. If fair value exceeds the carrying amount at the time of testing, goodwill is not considered impaired. Quoted market prices in active markets are the best evidence of fair value and are considered to be used as the basis for measurement, when available. Other acceptable valuation methods include present-value measurements based on multiples of earnings or revenues, or similar performance measures. Differences in valuation techniques could result in materially different evaluations of impairment. In September 2011, the FASB issued Accounting Standards Update ("ASU") 2011-08 which provides guidance for companies when testing goodwill for impairment. The objective of the ASU is to simplify how entities test goodwill for impairment. Pursuant to the ASU, entities may now assess qualitative factors to determine whether it is more likely than not that the fair value of a reporting unit is less than its carrying amount as a basis for determining whether it is necessary to perform the one-step goodwill impairment test. The more likely than not threshold is defined as having a likelihood of more than 50%.
To determine whether it is more likely than not that the fair value of a reporting unit is less than its carrying amount, an entity should consider the extent to which each of the adverse events or circumstances identified could affect the comparison of a reporting unit's fair value with its carrying amount.
Pursuant to the ASU, an entity should place more weight on the events and circumstances that have the greatest impact on a reporting unit's fair value or the carrying amount of its net assets; and may affect its determination of whether it is more likely than not that the fair value of a reporting unit is less than its carrying amount.
In accordance with ASC 350-20-35-3B, an entity can bypass the qualitative assessment and perform the quantitative impairment test. Given the current economic environment, a quantitative analysis was performed where management selected a sample of comparable acquisitions and calculated the control premium associated with each sale. The Company’s market capitalization times the sampled control premium allowed management to compare the calculated market capitalization to the Company’s current book value to determine if an adjustment to goodwill is warranted. The Company did not have any impairment of Goodwill and other identified intangible assets as of December 31, 2023. Further analysis of the Company’s goodwill can be found in Note 9 “Goodwill and Other Intangible Assets” within the notes to the consolidated financial statements.
Judgments and Uncertainties. The determination of fair value is based on valuations using management’s assumptions of comparable transactions including announcement or completion date, industry, asset size, region, or other relevant factors.
Effect if Actual Results Differ From Assumptions. Changes in these quantitative factors, as well as downturns in economic or business conditions, could have a significant adverse impact on the fair value of the reporting unit in relation to the carrying value of goodwill and could result in an impairment loss affecting our consolidated financial statements as a whole.
Business Combinations
Business combinations are generally accounted for under the acquisition method of accounting whereby assets acquired and liabilities assumed in business combinations are recorded at their estimated fair value as of the acquisition date. The determination of fair value may involve the use of internal or third-party valuation specialists to assist in the determination of the fair value of certain assets and liabilities at the acquisition date, including loans and leases, core deposit intangibles and time deposits. The excess of the cost of acquisition over these fair values is recognized as goodwill. A description of the valuation methodologies used to estimate the fair values of the significant assets acquired and liabilities assumed from the acquisition of PCSB can be found in Note 2 "Acquisitions" within the notes to the consolidated financial statements.
Recent Accounting Developments
In March 2020, the Financial Accounting Standards Board ("FASB") issued ASU 2020-04, "Reference Rate Reform (Topic 848)-Facilitation of the Effects of Reference Rate Reform on Financial Reporting" ("ASU 2020-04") to provide optional expedients and exceptions for applying GAAP to certain contracts, hedging relationships, and other transactions affected by reference rate reform if certain criteria are met. The amendments in this update apply only to contracts, hedging relationships, and other transactions that reference the London Interbank Offered Rate ("LIBOR") or another reference rate expected to be discontinued because of reference rate reform. The expedients and exceptions provided by the amendments do not apply to contract modifications made and hedging relationships existing as of December 31, 2022, for which an entity has elected certain optional expedients provided that those elections are retained through the end of the hedging relationship. The amendments in this update are effective for all entities as of March 12, 2020 through December 31, 2022 and do not apply to contract modifications made after December 31, 2022.
30
In January 2021, the FASB issued ASU 2021-01, "Reference Rate Reform (Topic 848)" an update to address concerns around structural risk of interbank offered rates ("IBORs"), particularly, the risk of cessation of the LIBOR. The amendments in this update clarify that certain optional expedients and exceptions in Topic 848 for contract modifications and hedge accounting apply to derivatives that are affected by the discounting transition. In December 2022, FASB issued ASU 2022-06, "Reference Rate Reform (Topic 848)" which deferred the sunset date of Topic 848 to December 31, 2024, to allow for a transition period after the sunset of LIBOR. The Company has adopted the amendments in these updates and established a LIBOR transition committee to guide the Company’s transition from LIBOR. The Company has completed much of the work to transition off the LIBOR index consistent with industry timelines. The working group has identified its products that utilize LIBOR and has implemented fallback language to facilitate the transition to alternative rates. The Company has also evaluated its infrastructure and identified fallback rates as well as started offering alternative indices and new products tied to these alternative indices. The Company does not anticipate the adoption of these standards to have a material impact to the consolidated financial statements.
In August 2021, the FASB issued ASU 2021-06, "Presentation of Financial Statements (Topic 205), Financial Services – Depository and Lending (Topic 942), and Financial Services – Investment Companies (Topic 946)" which updated guidance to align with new SEC regulations with regards to statistical disclosures for banking and savings and loan institutions. This ASU is effective for fiscal years ending on or after December 15, 2021. The Company has adopted ASU 2021-06 as of December 31, 2021. The adoption did not have a material impact on the Company’s consolidated financial statements.
In October 2021, the FASB issued ASU 2021-08, "Business Combinations (Topic 805), Accounting for Contract Assets and Contract Liabilities from Contracts with Customers" which requires that an acquirer recognize and measure contract assets and contract liabilities acquired in a business combination in accordance with Topic 606, Revenue from Contracts with Customers. At the acquisition date, an acquirer should account for the related revenue contracts in accordance with Topic 606 as if it had originated the contracts. The Company adopted ASU 2021-08 as of January 1, 2023 on a prospective basis. The adoption did not have a material impact on the Company's consolidated financial statements.
In March 2022, the FASB issued ASU 2022-02, "Financial Instruments - Credit Losses (Topic 326), Troubled Debt Restructurings and Vintage Disclosures" which addresses concerns regarding the complex accounting for loans modified as troubled debt restructurings (“TDRs”) and also the disclosure of gross writeoff information included in required vintage disclosures. The Company adopted ASU 2022-02 as of January 1, 2023. The enhanced disclosure requirements provided for by ASU 2022-02 were adopted on a prospective basis. Reporting periods prior to the adoption of ASU 2022-02 are presented in accordance with the applicable GAAP. The adoption did not have a material impact on the Company’s consolidated financial statements. Additional details can be found in Note 7, "Allowance for Credit Losses".
See Note 1, “Basis of Presentation” in the notes to the consolidated financial statements for additional information regarding recent accounting developments.
Non-GAAP Financial Measures and Reconciliation to GAAP
In addition to evaluating the Company’s results of operations in accordance with GAAP, management periodically supplements this evaluation with an analysis of certain non-GAAP financial measures, such as the operating earnings metrics, the return on average tangible assets, return on average tangible equity, the tangible stockholders' equity, tangible equity ratio, tangible book value per share and dividend payout ratio. Management believes that these non-GAAP financial measures provide information useful to investors in understanding the Company’s underlying operating performance and trends, and facilitates comparisons with the performance assessment of financial performance, including non-interest expense control, while the tangible equity ratio and tangible book value per share are used to analyze the relative strength of the Company’s capital position.
The methodologies used by the Company for determining the non-GAAP financial measures discussed above may differ from those used by other financial institutions.
Operating Earnings
Operating earnings exclude the after-tax impact of securities gains, the day 1 CECL provision and merger and acquisition expense. By excluding such items, the Company's results can be measured and assessed on a more consistent basis from period to period. Items excluded from operating earnings are also excluded when calculating the operating return and operating efficiency ratios.
31
The following table summarizes the Company's operating earnings and operating earnings per share ("EPS") for the periods indicated:
| Year Ended December 31, | |||||||||||||||||||||||||||||
| 2023 | 2022 | 2021 | 2020 | 2019 | |||||||||||||||||||||||||
| (Dollars in Thousands, Except Per Share Data) | |||||||||||||||||||||||||||||
| Net income, as reported | $ | 74,999 | $ | 109,744 | $ | 115,440 | $ | 47,635 | $ | 87,717 | |||||||||||||||||||
| Less: | |||||||||||||||||||||||||||||
| Security (losses) gains (after-tax) | 1,361 | 252 | (28) | 1,511 | 384 | ||||||||||||||||||||||||
| Add: | |||||||||||||||||||||||||||||
| Day 1 PCSB CECL provision (after tax) | 13,372 | — | — | — | — | ||||||||||||||||||||||||
Merger and acquisition expense (after-tax) (1) | 5,918 | 1,763 | — | — | 851 | ||||||||||||||||||||||||
| Operating earnings | $ | 92,928 | $ | 111,255 | $ | 115,468 | $ | 46,124 | $ | 88,184 | |||||||||||||||||||
| Earnings per share, as reported | $ | 0.85 | $ | 1.42 | $ | 1.48 | $ | 0.60 | $ | 1.10 | |||||||||||||||||||
| Less: | |||||||||||||||||||||||||||||
| Security gains (after-tax) | 0.02 | — | — | 0.02 | — | ||||||||||||||||||||||||
| Add: | |||||||||||||||||||||||||||||
| Day 1 PCSB CECL provision (after tax) | 0.15 | — | — | — | — | ||||||||||||||||||||||||
Merger and acquisition expense (after-tax) (1) | 0.07 | 0.02 | — | — | — | ||||||||||||||||||||||||
| Operating earnings per share | $ | 1.05 | $ | 1.44 | $ | 1.48 | $ | 0.58 | $ | 1.10 | |||||||||||||||||||
(1) Merger and acquisition expense related to the purchase of the remaining minority interest of Eastern Funding in the first quarter of 2019 and the acquisition of PCSB in the first quarter of 2023.
The following table summarizes the Company's operating return on average assets, operating return on average tangible assets, operating return on average stockholders' equity and operating return on average tangible stockholders' equity for the periods indicated:
32
| Year Ended December 31, | |||||||||||||||||||||||||||||
| 2023 | 2022 | 2021 | 2020 | 2019 | |||||||||||||||||||||||||
| (Dollars in Thousands) | |||||||||||||||||||||||||||||
| Operating earnings | $ | 92,928 | $ | 111,255 | $ | 115,468 | $ | 46,124 | $ | 88,184 | |||||||||||||||||||
| Average total assets | $ | 11,214,371 | $ | 8,623,403 | $ | 8,518,200 | $ | 8,683,569 | $ | 7,654,634 | |||||||||||||||||||
| Less: Average goodwill and average identified intangible assets, net | 270,637 | 162,447 | 163,122 | 164,227 | 165,697 | ||||||||||||||||||||||||
| Average tangible assets | $ | 10,943,734 | $ | 8,460,956 | $ | 8,355,078 | $ | 8,519,342 | $ | 7,488,937 | |||||||||||||||||||
| Return on average assets | 0.67 | % | 1.27 | % | 1.36 | % | 0.55 | % | 1.15 | % | |||||||||||||||||||
| Less: | |||||||||||||||||||||||||||||
| Security gains (after-tax) | 0.01 | % | — | % | — | % | 0.02 | % | 0.01 | % | |||||||||||||||||||
| Add: | |||||||||||||||||||||||||||||
| Day 1 PCSB CECL provision (after tax) | 0.12 | % | — | % | — | % | — | % | — | % | |||||||||||||||||||
| Merger and acquisition expense (after-tax) | 0.05 | % | 0.02 | % | — | % | — | % | 0.01 | % | |||||||||||||||||||
| Operating return on average assets | 0.83 | % | 1.29 | % | 1.36 | % | 0.53 | % | 1.15 | % | |||||||||||||||||||
| Return on average tangible assets | 0.69 | % | 1.30 | % | 1.38 | % | 0.56 | % | 1.17 | % | |||||||||||||||||||
| Less: | |||||||||||||||||||||||||||||
| Security gains (after-tax) | 0.01 | % | — | % | — | % | 0.02 | % | 0.01 | % | |||||||||||||||||||
| Add: | |||||||||||||||||||||||||||||
| Day 1 PCSB CECL provision (after tax) | 0.12 | % | — | % | — | % | — | % | — | % | |||||||||||||||||||
| Merger and acquisition expense (after-tax) | 0.05 | % | 0.02 | % | — | % | — | % | 0.01 | % | |||||||||||||||||||
| Operating return on average tangible assets | 0.85 | % | 1.32 | % | 1.38 | % | 0.54 | % | 1.17 | % | |||||||||||||||||||
| Average total stockholders' equity | $ | 1,168,106 | $ | 984,237 | $ | 967,538 | $ | 936,075 | $ | 917,286 | |||||||||||||||||||
| Less: Average goodwill and average identified intangible assets, net | 270,637 | 162,447 | 163,122 | 164,227 | 165,697 | ||||||||||||||||||||||||
| Average tangible stockholders' equity | $ | 897,469 | $ | 821,790 | $ | 804,416 | $ | 771,848 | $ | 751,589 | |||||||||||||||||||
| Return on average stockholders' equity | 6.42 | % | 11.15 | % | 11.93 | % | 5.09 | % | 9.56 | % | |||||||||||||||||||
| Less: | |||||||||||||||||||||||||||||
| Security gains (after-tax) | 0.12 | % | 0.03 | % | — | % | 0.16 | % | 0.04 | % | |||||||||||||||||||
| Add: | |||||||||||||||||||||||||||||
| Day 1 PCSB CECL provision (after tax) | 1.14 | % | — | % | — | % | — | % | — | % | |||||||||||||||||||
| Merger and acquisition expense (after-tax) | 0.51 | % | 0.18 | % | — | % | — | % | 0.09 | % | |||||||||||||||||||
| Operating return on average stockholders' equity | 7.95 | % | 11.30 | % | 11.93 | % | 4.93 | % | 9.61 | % | |||||||||||||||||||
| Return on average tangible stockholders' equity | 8.36 | % | 13.35 | % | 14.35 | % | 6.17 | % | 11.67 | % | |||||||||||||||||||
| Less: | |||||||||||||||||||||||||||||
| Security gains (after-tax) | 0.15 | % | 0.03 | % | — | % | 0.20 | % | 0.05 | % | |||||||||||||||||||
| Add: | |||||||||||||||||||||||||||||
| Day 1 PCSB CECL provision (after tax) | 1.49 | % | — | % | — | % | — | % | — | % | |||||||||||||||||||
| Merger and acquisition expense (after-tax) | 0.66 | % | 0.21 | % | — | % | — | % | 0.11 | % | |||||||||||||||||||
| Operating return on average tangible stockholders' equity | 10.36 | % | 13.53 | % | 14.35 | % | 5.97 | % | 11.73 | % | |||||||||||||||||||
33
The following table summarizes the Company’s return on average tangible assets and return on average tangible stockholders’ equity for the periods indicated:
| Year Ended December 31, | |||||||||||||||||||||||||||||
| 2023 | 2022 | 2021 | 2020 | 2019 | |||||||||||||||||||||||||
| (Dollars in Thousands) | |||||||||||||||||||||||||||||
| Net income, as reported | $ | 74,999 | $ | 109,744 | $ | 115,440 | $ | 47,635 | $ | 87,717 | |||||||||||||||||||
| Average total assets | $ | 11,214,371 | $ | 8,623,403 | $ | 8,518,200 | $ | 8,683,569 | $ | 7,654,634 | |||||||||||||||||||
| Less: Average goodwill and average identified intangible assets, net | 270,637 | 162,447 | 163,122 | 164,227 | 165,697 | ||||||||||||||||||||||||
| Average tangible assets | $ | 10,943,734 | $ | 8,460,956 | $ | 8,355,078 | $ | 8,519,342 | $ | 7,488,937 | |||||||||||||||||||
| Return on average tangible assets | 0.69 | % | 1.30 | % | 1.38 | % | 0.56 | % | 1.17 | % | |||||||||||||||||||
| Average total stockholders' equity | $ | 1,168,106 | $ | 984,237 | $ | 967,538 | $ | 936,075 | $ | 917,286 | |||||||||||||||||||
| Less: Average goodwill and average identified intangible assets, net | 270,637 | 162,447 | 163,122 | 164,227 | 165,697 | ||||||||||||||||||||||||
| Average tangible stockholders' equity | $ | 897,469 | $ | 821,790 | $ | 804,416 | $ | 771,848 | $ | 751,589 | |||||||||||||||||||
| Return on average tangible stockholders' equity | 8.36 | % | 13.35 | % | 14.35 | % | 6.17 | % | 11.67 | % | |||||||||||||||||||
The following table summarizes the Company's tangible equity ratio for the periods indicated:
| At December 31, | |||||||||||||||||||||||||||||
| 2023 | 2022 | 2021 | 2020 | 2019 | |||||||||||||||||||||||||
| (Dollars in Thousands) | |||||||||||||||||||||||||||||
| Total stockholders' equity | $ | 1,198,644 | $ | 992,125 | $ | 995,342 | $ | 941,778 | $ | 945,606 | |||||||||||||||||||
| Less: Goodwill and identified intangible assets, net | 265,429 | 162,208 | 162,703 | 163,579 | 164,850 | ||||||||||||||||||||||||
| Tangible stockholders' equity | $ | 933,215 | $ | 829,917 | $ | 832,639 | $ | 778,199 | $ | 780,756 | |||||||||||||||||||
| Total assets | $ | 11,382,256 | $ | 9,185,836 | $ | 8,602,622 | $ | 8,942,424 | $ | 7,856,853 | |||||||||||||||||||
| Less: Goodwill and identified intangible assets, net | 265,429 | 162,208 | 162,703 | 163,579 | 164,850 | ||||||||||||||||||||||||
| Tangible assets | $ | 11,116,827 | $ | 9,023,628 | $ | 8,439,919 | $ | 8,778,845 | $ | 7,692,003 | |||||||||||||||||||
| Tangible equity ratio | 8.39 | % | 9.20 | % | 9.87 | % | 8.86 | % | 10.15 | % | |||||||||||||||||||
34
The following table summarizes the Company's tangible book value per share for the periods indicated:
| Year Ended December 31, | |||||||||||||||||||||||||||||
| 2023 | 2022 | 2021 | 2020 | 2019 | |||||||||||||||||||||||||
| (Dollars in Thousands) | |||||||||||||||||||||||||||||
| Tangible stockholders' equity | $ | 933,215 | $ | 829,917 | $ | 832,639 | $ | 778,199 | $ | 780,756 | |||||||||||||||||||
| Common shares issued | 96,998,075 | 85,177,172 | 85,177,172 | 85,177,172 | 85,177,172 | ||||||||||||||||||||||||
| Less: | |||||||||||||||||||||||||||||
| Treasury shares | 7,354,399 | 7,731,445 | 7,037,464 | 6,525,783 | 5,003,127 | ||||||||||||||||||||||||
| Unallocated ESOP | — | — | 24,660 | 51,114 | 79,548 | ||||||||||||||||||||||||
| Unvested restricted stock | 749,099 | 601,495 | 500,098 | 458,800 | 406,450 | ||||||||||||||||||||||||
| Common shares outstanding | 88,894,577 | 76,844,232 | 77,614,950 | 78,141,475 | 79,688,047 | ||||||||||||||||||||||||
| Tangible book value per share | $ | 10.50 | $ | 10.80 | $ | 10.73 | $ | 9.96 | $ | 9.80 | |||||||||||||||||||
The following table summarizes the Company's dividend payout ratio for the periods indicated:
| Year Ended December 31, | |||||||||||||||||||||||||||||
| 2023 | 2022 | 2021 | 2020 | 2019 | |||||||||||||||||||||||||
| (Dollars in Thousands) | |||||||||||||||||||||||||||||
| Dividends paid | $ | 47,926 | $ | 40,077 | $ | 37,463 | $ | 36,396 | $ | 35,110 | |||||||||||||||||||
| Net income, as reported | $ | 74,999 | $ | 109,744 | $ | 115,440 | $ | 47,635 | $ | 87,717 | |||||||||||||||||||
| Dividend payout ratio | 63.90 | % | 36.52 | % | 32.45 | % | 76.41 | % | 40.03 | % | |||||||||||||||||||
35
Financial Condition
Loans and Leases
The following table summarizes the Company's portfolio of loan and lease receivables as of the dates indicated:
| At December 31, | |||||||||||||||||||||||||||||||||||||||||||||||||||||||||||
| 2023 | 2022 | 2021 | 2020 | 2019 | |||||||||||||||||||||||||||||||||||||||||||||||||||||||
| Balance | Percent of Total | Balance | Percent of Total | Balance | Percent of Total | Balance | Percent of Total | Balance | Percent of Total | ||||||||||||||||||||||||||||||||||||||||||||||||||
| (Dollars in Thousands) | |||||||||||||||||||||||||||||||||||||||||||||||||||||||||||
| Commercial real estate loans: | |||||||||||||||||||||||||||||||||||||||||||||||||||||||||||
| Commercial real estate | $ | 4,047,288 | 42.0 | % | $ | 3,046,746 | 39.9 | % | $ | 2,842,791 | 39.6 | % | $ | 2,578,773 | 35.4 | % | $ | 2,491,011 | 37.0 | % | |||||||||||||||||||||||||||||||||||||||
| Multi-family mortgage | 1,415,191 | 14.7 | % | 1,150,597 | 15.1 | % | 1,099,818 | 15.4 | % | 1,013,432 | 13.9 | % | 932,163 | 13.8 | % | ||||||||||||||||||||||||||||||||||||||||||||
| Construction | 302,050 | 3.1 | % | 206,805 | 2.7 | % | 160,431 | 2.2 | % | 231,621 | 3.2 | % | 246,048 | 3.7 | % | ||||||||||||||||||||||||||||||||||||||||||||
| Total commercial real estate loans | 5,764,529 | 59.8 | % | 4,404,148 | 57.7 | % | 4,103,040 | 57.2 | % | 3,823,826 | 52.5 | % | 3,669,222 | 54.5 | % | ||||||||||||||||||||||||||||||||||||||||||||
| Commercial loans and leases: | |||||||||||||||||||||||||||||||||||||||||||||||||||||||||||
| Commercial | 984,441 | 10.2 | % | 752,948 | 9.9 | % | 666,677 | 10.3 | % | 642,452 | 15.6 | % | 729,502 | 10.8 | % | ||||||||||||||||||||||||||||||||||||||||||||
| Equipment financing | 1,370,648 | 14.2 | % | 1,216,585 | 15.9 | % | 1,105,611 | 15.5 | % | 1,092,461 | 15.0 | % | 1,052,408 | 15.6 | % | ||||||||||||||||||||||||||||||||||||||||||||
| Condominium association | 44,579 | 0.5 | % | 46,966 | 0.6 | % | 47,137 | 0.7 | % | 50,770 | 0.7 | % | 56,838 | 0.8 | % | ||||||||||||||||||||||||||||||||||||||||||||
| Total commercial loans and leases | 2,399,668 | 24.9 | % | 2,016,499 | 26.4 | % | 1,887,136 | 26.5 | % | 2,274,899 | 31.3 | % | 1,838,748 | 27.2 | % | ||||||||||||||||||||||||||||||||||||||||||||
| Consumer loans: | |||||||||||||||||||||||||||||||||||||||||||||||||||||||||||
| Residential mortgage | 1,082,804 | 11.2 | % | 844,614 | 11.0 | % | 799,737 | 11.2 | % | 791,317 | 10.9 | % | 814,245 | 12.1 | % | ||||||||||||||||||||||||||||||||||||||||||||
| Home equity | 344,182 | 3.6 | % | 322,622 | 4.2 | % | 324,156 | 4.5 | % | 346,652 | 4.8 | % | 376,819 | 5.6 | % | ||||||||||||||||||||||||||||||||||||||||||||
| Other consumer | 50,406 | 0.5 | % | 56,505 | 0.7 | % | 40,388 | 0.6 | % | 32,859 | 0.5 | % | 38,782 | 0.6 | % | ||||||||||||||||||||||||||||||||||||||||||||
| Total consumer loans | 1,477,392 | 15.3 | % | 1,223,741 | 15.9 | % | 1,164,281 | 16.3 | % | 1,170,828 | 16.2 | % | 1,229,846 | 18.3 | % | ||||||||||||||||||||||||||||||||||||||||||||
| Total loans and leases | 9,641,589 | 100.0 | % | 7,644,388 | 100.0 | % | 7,154,457 | 100.0 | % | 7,269,553 | 100.0 | % | 6,737,816 | 100.0 | % | ||||||||||||||||||||||||||||||||||||||||||||
| Allowance for loan and lease losses | (117,522) | (98,482) | (99,084) | (114,379) | (61,082) | ||||||||||||||||||||||||||||||||||||||||||||||||||||||
| Net loans and leases | $ | 9,524,067 | $ | 7,545,906 | $ | 7,055,373 | $ | 7,155,174 | $ | 6,676,734 | |||||||||||||||||||||||||||||||||||||||||||||||||
The following table sets forth the growth in the Company’s loan and lease portfolios during the year ending December 31, 2023:
| At December 31, 2023 | At December 31, 2022 | Dollar Change | Percent Change (Annualized) | ||||||||||||||||||||
| (Dollars in Thousands) | |||||||||||||||||||||||
| Commercial real estate | $ | 5,764,529 | $ | 4,404,148 | $ | 1,360,381 | 30.9 | % | |||||||||||||||
| Commercial | 2,399,668 | 2,016,499 | 383,169 | 19.0 | % | ||||||||||||||||||
| Consumer | 1,477,392 | 1,223,741 | 253,651 | 20.7 | % | ||||||||||||||||||
| Total loans and leases | $ | 9,641,589 | $ | 7,644,388 | $ | 1,997,201 | 26.1 | % | |||||||||||||||
| Total core loans and leases | $ | 9,641,589 | $ | 7,644,131 | $ | 1,997,458 | 26.1 | % | |||||||||||||||
36
The following table presents the maturity distribution of the Company's loan portfolio as of December 31, 2023.
| At December 31, 2023 | |||||||||||||||||||||||||||||
| 1 Year or Less | After 1-5 Years | After 5-15 Years | After 15 Years | Total | |||||||||||||||||||||||||
| (Dollars in Thousands) | |||||||||||||||||||||||||||||
| Commercial real estate | $ | 2,136,221 | $ | 2,690,355 | $ | 929,177 | $ | 8,776 | $ | 5,764,529 | |||||||||||||||||||
| Commercial | 452,905 | 1,383,267 | 504,184 | 59,312 | 2,399,668 | ||||||||||||||||||||||||
| Consumer | 270,343 | 233,372 | 219,442 | 754,235 | 1,477,392 | ||||||||||||||||||||||||
| Total | $ | 2,859,469 | $ | 4,306,994 | $ | 1,652,803 | $ | 822,323 | $ | 9,641,589 | |||||||||||||||||||
The following table presents the distribution of the Company's loans that were due after one year between fixed and variable interest rates as of December 31, 2023.
| At December 31, 2023 | |||||||||||||||||
| Fixed | Variable | Total | |||||||||||||||
| (Dollars in Thousands) | |||||||||||||||||
| Commercial real estate | $ | 1,735,003 | $ | 1,893,305 | $ | 3,628,308 | |||||||||||
| Commercial | 1,188,281 | 758,482 | 1,946,763 | ||||||||||||||
| Consumer | 674,915 | 532,134 | 1,207,049 | ||||||||||||||
| Total | $ | 3,598,199 | $ | 3,183,921 | $ | 6,782,120 | |||||||||||
The Company's loan portfolio consists primarily of first mortgage loans secured by commercial, multi-family and residential real estate properties located in the Company's primary lending area, loans to business entities, including commercial lines of credit, loans to condominium associations and loans and leases used to finance equipment used by small businesses. The Company also provides financing for construction and development projects, home equity and other consumer loans.
The Company employs seasoned commercial lenders and retail bankers who rely on community and business contacts as well as referrals from customers, attorneys and other professionals to generate loans and deposits. Existing borrowers are also an important source of business since many of them have more than one loan outstanding with the Company. The Company's ability to originate loans depends on the strength of the economy, trends in interest rates, and levels of customer demand and market competition.
The Company's current policy is that the total credit exposure to one obligor relationship may not exceed $60.0 million unless approved by the Credit Committee, a committee of the Company's Board of Directors. As of December 31, 2023, there were four borrowers with commitments over $60.0 million. The total of those commitments was $259.5 million or 2.2% of total loans and commitments as of December 31, 2023. As of December 31, 2022, there were three borrowers with loans and commitments over $60.0 million. The total of those loans and commitments was $208.5 million, or 2.2% of total loans and commitments, as of December 31, 2022.
The Company has written underwriting policies to control the inherent risks in loan origination. The policies address approval limits, loan-to-value ratios, appraisal requirements, debt service coverage ratios, loan concentration limits and other matters relevant to loan underwriting.
Commercial Real Estate Loans
The commercial real estate portfolio is comprised of commercial real estate loans, multi-family mortgage loans, and construction loans and is the largest component of the Company's overall loan portfolio, representing 59.8% of total loans and leases outstanding as of December 31, 2023.
Typically, commercial real estate loans are larger in size and involve a greater degree of risk than owner-occupied residential mortgage loans. Loan repayment is usually dependent on the successful operation and management of the properties and the value of the properties securing the loans. Economic conditions can greatly affect cash flows and property values.
A number of factors are considered in originating commercial real estate and multi-family mortgage loans. The qualifications and financial condition of the borrower (including credit history), as well as the potential income generation and the value and condition of the underlying property, are evaluated. When evaluating the qualifications of the borrower, the Company considers the financial resources of the borrower, the borrower's experience in owning or managing similar property and the borrower's payment history with the Company and other financial institutions. Factors considered in evaluating the underlying property include the net operating income of the mortgaged premises before debt service and depreciation, the debt
37
service coverage ratio (the ratio of cash flow before debt service to debt service), the use of conservative capitalization rates, and the ratio of the loan amount to the appraised value. Generally, personal guarantees are obtained from commercial real estate loan borrowers.
Commercial real estate and multi-family mortgage loans are typically originated for terms of five to fifteen years with amortization periods of 20 to 30 years. Many of the loans are priced at inception on a fixed-rate basis generally for periods ranging from two to five years with repricing periods for longer-term loans. When possible, prepayment penalties are included in loan covenants on these loans. For commercial customers who are interested in loans with terms longer than five years, the Company offers loan level derivatives to accommodate customer need.
The Company's urban and suburban market area is characterized by a large number of apartment buildings, condominiums and office buildings. As a result, commercial real estate and multi-family mortgage lending has been a significant part of the Company's activities for many years. These types of loans typically generate higher yields, but also involve greater credit risk. Many of the Company's borrowers have more than one multi-family or commercial real estate loan outstanding with the Company.
The commercial real estate portfolio was composed primarily of loans secured by multi-family buildings ($1.3 billion), office buildings ($876.4 million), retail stores ($960.2 million), industrial properties ($765.2 million), mixed-use properties ($507.0 million), lodging services ($203.4 million) and food services ($77.9 million) as of December 31, 2023. As of that date, approximately 78.2% of the commercial real estate loans outstanding were secured by properties located in New England; primarily in the Greater Boston and Greater Providence markets, with additional exposure of approximately 16.5% of the commercial real estate loans outstanding were also secured by properties in the State of New York, nearly all of which is in the Lower Hudson Valley region.
The following table presents the percentage of the Company's commercial real estate loan portfolio by borrower type that is owner and non-owner occupied as of December 31, 2023.
| At December 31, 2023 | |||||||||||||||||
| Owner Occupied | Non-Owner Occupied | Total | |||||||||||||||
| Borrower type: | |||||||||||||||||
| Multi-family buildings | — | % | 23.33 | % | 23.33 | % | |||||||||||
| Office buildings | 1.30 | % | 13.90 | % | 15.20 | % | |||||||||||
| Retail stores | 1.95 | % | 14.71 | % | 16.66 | % | |||||||||||
| Industrial properties | 2.66 | % | 10.61 | % | 13.27 | % | |||||||||||
| Mixed-use properties | 0.70 | % | 8.09 | % | 8.79 | % | |||||||||||
| Lodging services | 0.14 | % | 3.39 | % | 3.53 | % | |||||||||||
| Food Services | 0.80 | % | 0.55 | % | 1.35 | % | |||||||||||
| Other | 9.65 | % | 8.22 | % | 17.87 | % | |||||||||||
| Total | 17.20 | % | 82.80 | % | 100.00 | % | |||||||||||
The following table presents the percentage of the Company's commercial real estate loan portfolio by geographic concentration that is owner and non-owner occupied as of December 31, 2023.
| At December 31, 2023 | |||||||||||||||||
| Owner Occupied | Non-Owner Occupied | Total | |||||||||||||||
| Geographic concentration: | |||||||||||||||||
| New England | 11.55 | % | 66.66 | % | 78.21 | % | |||||||||||
| New York | 3.20 | % | 13.26 | % | 16.46 | % | |||||||||||
| Other | 2.87 | % | 2.46 | % | 5.33 | % | |||||||||||
| Total | 17.62 | % | 82.38 | % | 100.00 | % | |||||||||||
Construction and development financing is generally considered to involve a higher degree of risk than long-term financing on improved, occupied real estate and thus has lower concentration limits than do other commercial credit classes. Risk of loss on a construction loan is largely dependent upon the accuracy of the initial estimate of construction costs, the estimated time to sell or rent the completed property at an adequate price or rate of occupancy, and market conditions. If the
38
estimates and projections prove to be inaccurate, the Company may be confronted with a project which, upon completion, has a value that is insufficient to assure full loan repayment.
Criteria applied in underwriting construction loans for which the primary source of repayment is the sale of the property is different from the criteria applied in underwriting construction loans for which the primary source of repayment is the stabilized cash flow from the completed project. For those loans where the primary source of repayment is from resale of the property, in addition to the normal credit analysis performed for other loans, the Company also analyzes project costs, the attractiveness of the property in relation to the market in which it is located and demand within the market area. For those construction loans where the source of repayment is the stabilized cash flow from the completed project, the Company analyzes not only project costs but also how long it might take to achieve satisfactory occupancy and the reasonableness of projected rental rates in relation to market rental rates.
Commercial Loans
The commercial loan and lease portfolio is comprised of commercial loans, equipment financing loans and leases and condominium association loans representing 24.9% of total loans outstanding as of December 31, 2023.
The commercial loan and lease portfolio is composed primarily of loans in the following sectors: small businesses ($852.6 million), transportation services ($368.4 million), food services ($238.7 million), recreation services ($142.6 million), rental and leasing services ($68.3 million), manufacturing ($139.7 million), and retail ($149.4 million) as of December 31, 2023.
The Company provides commercial banking services to companies in its market area. Approximately 39.6% of the commercial loans outstanding as of December 31, 2023 were made to borrowers located in New England; primarily in the Greater Boston and Greater Providence markets. The remaining 60.4% of the commercial loans outstanding were made to borrowers in other areas in the United States of America, primarily by the Company's equipment financing divisions. Product offerings include lines of credit, term loans, letters of credit, deposit services and cash management. These types of credit facilities have as their primary source of repayment cash flows from the operations of a business. Interest rates offered are available on a floating basis tied to the prime rate or a similar index or on a fixed-rate basis referenced on the Federal Home Loan Bank of Boston index.
Credit extensions are made to established businesses on the basis of loan purpose and assessment of capacity to repay as determined by an analysis of their financial statements, the nature of collateral to secure the credit extension and, in most instances, the personal guarantee of the owner of the business as well as industry and general economic conditions.
The Company’s equipment financing divisions focus on market niches in which its lenders have deep experience and industry contacts, and on making loans to customers with business experience. An important part of the Company’s equipment financing loan origination volume comes from equipment manufacturers and existing customers as they expand their operations. The equipment financing portfolio is composed primarily of loans to finance laundry, tow trucks, fitness, dry cleaning and convenience store equipment. Approximately 11.0% of the commercial loans outstanding were made by the equipment financing divisions to borrowers located in the State of New York. Typically, the loans are priced at a fixed rate of interest and require monthly payments over their three- to seven-year life. The yields earned on equipment financing loans are higher than those earned on the commercial loans made by the Banks because they involve a higher degree of credit risk. Equipment financing customers are typically small-business owners who operate with limited financial resources and who face greater risks when the economy weakens or unforeseen adverse events arise. Because of these characteristics, personal guarantees of borrowers are usually obtained along with liens on available assets. The size of loan is determined by an analysis of cash flow and other characteristics pertaining to the business and the equipment to be financed, based on detailed revenue and profitability data of similar operations.
Loans to condominium associations are for the purpose of funding capital improvements, are made for five- to ten-year terms and are secured by a general assignment of condominium association revenues. Among the factors considered in the underwriting of such loans are the level of owner occupancy, the financial condition and history of the condominium association, the attractiveness of the property in relation to the market in which it is located and the reasonableness of estimates of the cost of capital improvements to be made. Depending on loan size, funds are advanced as capital improvements are made and, in more complex situations, after completion of engineering inspections.
Consumer Loans
The consumer loan portfolio is comprised of residential mortgage loans, home equity loans and lines of credit, and other consumer loans representing, 15.3% of total loans outstanding as of December 31, 2023. The Company focuses its mortgage and home equity lending on existing and new customers within its branch networks in its urban and suburban marketplaces in the Greater Boston and Providence metropolitan areas along with the Lower Hudson Valley area of New York.
39
The Company originates adjustable and fixed rate residential mortgage loans secured by one- to four-family residences. Each residential mortgage loan granted is subject to a satisfactorily completed application, employment verification, credit history and a demonstrated ability to repay the debt. Generally, loans are not made when the loan-to-value ratio exceeds 80% unless private mortgage insurance is obtained and/or there is a financially strong guarantor. Appraisals are performed by outside independent appraisers.
Underwriting guidelines for home equity loans and lines of credit are similar to those for residential mortgage loans. Home equity loans and lines of credit are limited to no more than 80% of the appraised value of the property securing the loan including the amount of any existing first mortgage liens.
Other consumer loans have historically been a modest part of the Company's loan originations. As of December 31, 2023, other consumer loans equaled $50.4 million, or 0.5% of total loans outstanding.
Asset Quality
Criticized and Classified Assets
The Company's management rates certain loans and leases as "other assets especially mentioned" ("OAEM"), "substandard" or "doubtful" based on criteria established under banking regulations. These loans and leases are collectively referred to as "criticized" assets. Loans and leases rated OAEM have potential weaknesses that deserve management's close attention. If left uncorrected, these potential weaknesses may result in deterioration of the repayment prospects of the loan or lease at some future date. Loans and leases rated as substandard are inadequately protected by the payment capacity of the obligor or of the collateral pledged, if any. Substandard loans and leases have a well-defined weakness or weaknesses that jeopardize the liquidation of debt and are characterized by the distinct possibility that the Company will sustain some loss if existing deficiencies are not corrected. Loans and leases rated as doubtful have well-defined weaknesses that jeopardize the orderly liquidation of debt and partial loss of principal is likely. As of December 31, 2023, the Company had $128.0 million of total assets that were designated as criticized. This compares to $108.2 million of assets designated as criticized as of December 31, 2022. The increase of $19.8 million in criticized assets was primarily driven by $11.9 million in equipment financing loans, $8.4 million in commercial real estate loans, and $3.4 million in construction loans becoming criticized during the year ended December 31, 2023. This was partially offset by $4.6 million in multi-family loans being paid off during the year ending December 31, 2023.
Nonperforming Assets
"Nonperforming assets" consist of nonaccrual loans and leases, other real estate owned ("OREO") and other repossessed assets. Under certain circumstances, the Company may restructure the terms of a loan or lease as a concession to a borrower, except for acquired loans and leases which are individually evaluated against expected performance on the date of acquisition. These restructured loans and leases are generally considered "nonperforming loans and leases" until a history of collection of at least six months on the restructured terms of the loan or lease has been established. OREO consists of real estate acquired through foreclosure proceedings and real estate acquired through acceptance of a deed in lieu of foreclosure. Other repossessed assets consist of assets that have been acquired through foreclosure that are not real estate and are included in other assets on the Company's consolidated balance sheets.
Accrual of interest on loans generally is discontinued when contractual payment of principal or interest becomes past due 90 days or, if in management's judgment, reasonable doubt exists as to the full timely collection of interest. When a loan is placed on nonaccrual status, interest accruals cease and all previously accrued and uncollected interest is reversed and charged against current interest income. Interest payments on nonaccrual loans are generally applied to principal. If collection of the principal is reasonably assured, interest payments are recognized as income on the cash basis. Loans are generally returned to accrual status when principal and interest payments are current, full collectability of principal and interest is reasonably assured and a consistent record of at least six months of performance has been achieved.
In cases where a borrower experiences financial difficulties and the Company makes or reasonably expects to make certain concessionary modifications to contractual terms, the loan is classified as a modified loan. In determining whether a debtor is experiencing financial difficulties, the Company considers, among other factors, if the debtor is in payment default or is likely to be in payment default in the foreseeable future without the modification, the debtor declared or is in the process of declaring bankruptcy, there is substantial doubt that the debtor will continue as a going concern, the debtor's entity-specific projected cash flows will not be sufficient to service its debt, or the debtor cannot obtain funds from sources other than the existing creditors at market terms for debt with similar risk characteristics.
As of December 31, 2023, the Company had nonperforming assets of $45.3 million, representing 0.40% of total assets, compared to nonperforming assets of $15.3 million, or 0.17% of total assets as of December 31, 2022. The increase of $30.0 million was primarily driven by increases of $19.0 million in nonperforming commercial real estate loans, $5.4 million in
40
nonperforming equipment financing loans, $3.4 million in nonperforming commercial loans, and $1.6 million in nonperforming residential loans during the year ended December 31, 2023.
The Company evaluates the underlying collateral of each nonaccrual loan and lease and continues to pursue the collection of interest and principal. Management believes that the current level of nonperforming assets remains manageable relative to the size of the Company's loan and lease portfolio. If economic conditions were to worsen or if the marketplace were to experience prolonged economic stress, it is likely that the level of nonperforming assets would increase, as would the level of charged-off loans.
Past Due and Accruing
As of December 31, 2023 and December 31, 2022, the Company had minimal loans and leases greater than 90 days past due and accruing.
41
The following table sets forth information regarding nonperforming assets for the periods indicated:
| At December 31, | |||||||||||||||||||||||||||||
| 2023 | 2022 | 2021 | 2020 | 2019 | |||||||||||||||||||||||||
| (Dollars in Thousands) | |||||||||||||||||||||||||||||
| Nonperforming loans and leases: | |||||||||||||||||||||||||||||
| Nonaccrual loans and leases: | |||||||||||||||||||||||||||||
| Commercial real estate | $ | 19,608 | $ | 607 | $ | 10,848 | $ | 3,300 | $ | 2,845 | |||||||||||||||||||
| Multi-family mortgage | — | — | — | — | 84 | ||||||||||||||||||||||||
| Construction | — | 707 | — | 3,853 | — | ||||||||||||||||||||||||
| Total commercial real estate loans | 19,608 | 1,314 | 10,848 | 7,153 | 2,929 | ||||||||||||||||||||||||
| Commercial | 3,886 | 464 | 2,318 | 7,702 | 4,909 | ||||||||||||||||||||||||
| Equipment financing | 14,984 | 9,653 | 15,014 | 16,757 | 9,822 | ||||||||||||||||||||||||
| Condominium association | — | 58 | 84 | 112 | 151 | ||||||||||||||||||||||||
| Total commercial loans and leases | 18,870 | 10,175 | 17,416 | 24,571 | 14,882 | ||||||||||||||||||||||||
| Residential mortgage | 4,292 | 2,680 | 3,909 | 5,587 | 753 | ||||||||||||||||||||||||
| Home equity | 860 | 723 | 285 | 1,136 | 896 | ||||||||||||||||||||||||
| Other consumer | — | 2 | 1 | 1 | 1 | ||||||||||||||||||||||||
| Total consumer loans | 5,152 | 3,405 | 4,195 | 6,724 | 1,650 | ||||||||||||||||||||||||
| Total nonaccrual loans and leases | 43,630 | 14,894 | 32,459 | 38,448 | 19,461 | ||||||||||||||||||||||||
| Other real estate owned | 780 | — | — | 5,415 | — | ||||||||||||||||||||||||
| Other repossessed assets | 914 | 408 | 718 | 1,100 | 2,631 | ||||||||||||||||||||||||
| Total nonperforming assets | $ | 45,324 | $ | 15,302 | $ | 33,177 | $ | 44,963 | $ | 22,092 | |||||||||||||||||||
| Loans and leases past due greater than 90 days and accruing | $ | 228 | $ | 33 | $ | 1 | $ | 11,975 | $ | 10,109 | |||||||||||||||||||
| Total delinquent loans and leases 61-90 days past due | 5,300 | 2,218 | 6,081 | 16,129 | 4,978 | ||||||||||||||||||||||||
| Restructured loans and leases not included in nonperforming assets | — | 16,385 | 12,580 | 11,483 | 17,076 | ||||||||||||||||||||||||
| Total nonaccrual loans and leases as a percentage of total loans and leases | 0.45 | % | 0.19 | % | 0.45 | % | 0.53 | % | 0.29 | % | |||||||||||||||||||
| Total nonperforming assets as a percentage of total assets | 0.40 | % | 0.17 | % | 0.39 | % | 0.50 | % | 0.28 | % | |||||||||||||||||||
| Total delinquent loans and leases 61-90 days past due as a percentage of total loans and leases | 0.05 | % | 0.03 | % | 0.08 | % | 0.22 | % | 0.07 | % | |||||||||||||||||||
Allowances for Credit Losses
The allowance for credit losses consists of general and specific allowances and reflects management's estimate of expected loan and lease losses over the life of the loan or lease. Management uses a consistent and systematic process and methodology to evaluate the adequacy of the allowance for credit losses on a quarterly basis. Management continuously evaluates and challenges inputs and assumptions in the allowance for credit losses.
While management evaluates currently available information in establishing the allowance for credit losses, future adjustments to the allowance for loan and lease losses may be necessary if conditions differ substantially from the assumptions used in making the evaluations. Management performs a comprehensive review of the allowance for credit losses on a quarterly basis. In addition, various regulatory agencies, as an integral part of their examination process, periodically review a financial
42
institution's allowance for credit losses and carrying amounts of other real estate owned. Such agencies may require the financial institution to recognize additions or reductions to the allowance based on their judgments about information available to them at the time of their examination.
The Company’s allowance methodology provides a quantification of probable losses in the portfolio. Under the current methodology, management estimates losses over the life of the loan using reasonable and supportable forecasts. Forecasts, loan data, and model documentation are extensively analyzed and reviewed throughout the quarter to ensure estimated losses are appropriate at quarter end. Qualitative adjustments are applied when model output does not align with management expectations. These adjustments are thoroughly reviewed and documented to provide clarity and a reasonable basis for any deviations from the model. For December 31, 2023, qualitative adjustments were applied to the commercial real estate, commercial, and consumer portfolios resulting in a net addition in total reserves compared to modeled calculations.
The following tables present the changes in the allowance for loans and lease losses by portfolio category for the years ended December 31, 2023, 2022, 2021, 2020, and 2019, respectively.
| Year Ended December 31, 2023 | |||||||||||||||||||||||
| Commercial Real Estate | Commercial | Consumer | Total | ||||||||||||||||||||
| (In Thousands) | |||||||||||||||||||||||
| Balance at December 31, 2022 | $ | 68,154 | $ | 26,604 | $ | 3,724 | $ | 98,482 | |||||||||||||||
| Charge-offs | (1,204) | (19,990) | (41) | (21,235) | |||||||||||||||||||
| Recoveries | 132 | 1,406 | 34 | 1,572 | |||||||||||||||||||
| Provision (credit) for loan and lease losses | 14,328 | 21,537 | 2,838 | 38,703 | |||||||||||||||||||
| Balance at December 31, 2023 | $ | 81,410 | $ | 29,557 | $ | 6,555 | $ | 117,522 | |||||||||||||||
| Total loans and leases | $ | 5,764,529 | $ | 2,399,668 | $ | 1,477,392 | $ | 9,641,589 | |||||||||||||||
| Total allowance for loan and lease losses as a percentage of total loans and leases | 1.41 | % | 1.23 | % | 0.44 | % | 1.22 | % | |||||||||||||||
| Year Ended December 31, 2022 | |||||||||||||||||||||||
| Commercial Real Estate | Commercial | Consumer | Total | ||||||||||||||||||||
| (In Thousands) | |||||||||||||||||||||||
| Balance at December 31, 2021 | $ | 69,213 | $ | 27,055 | $ | 2,816 | $ | 99,084 | |||||||||||||||
| Charge-offs | (37) | (5,068) | (28) | (5,133) | |||||||||||||||||||
| Recoveries | 24 | 1,725 | 64 | 1,813 | |||||||||||||||||||
| Provision (credit) for loan and lease losses | (1,046) | 2,892 | 872 | 2,718 | |||||||||||||||||||
| Balance at December 31, 2022 | $ | 68,154 | $ | 26,604 | $ | 3,724 | $ | 98,482 | |||||||||||||||
| Total loans and leases | $ | 4,404,148 | $ | 2,016,499 | $ | 1,223,741 | $ | 7,644,388 | |||||||||||||||
| Total allowance for loan and lease losses as a percentage of total loans and leases | 1.55 | % | 1.32 | % | 0.30 | % | 1.29 | % | |||||||||||||||
43
| Year Ended December 31, 2021 | |||||||||||||||||||||||
| Commercial Real Estate | Commercial | Consumer | Total | ||||||||||||||||||||
| (In Thousands) | |||||||||||||||||||||||
| Balance at December 31, 2020 | $ | 80,132 | $ | 29,498 | $ | 4,749 | $ | 114,379 | |||||||||||||||
| Charge-offs | (28) | (7,464) | (34) | (7,526) | |||||||||||||||||||
| Recoveries | 12 | 1,541 | 239 | 1,792 | |||||||||||||||||||
| Provision (credit) for loan and lease losses | (10,903) | 3,480 | (2,138) | (9,561) | |||||||||||||||||||
| Balance at December 31, 2021 | $ | 69,213 | $ | 27,055 | $ | 2,816 | $ | 99,084 | |||||||||||||||
| Total loans and leases | $ | 4,103,040 | $ | 1,887,136 | $ | 1,164,281 | $ | 7,154,457 | |||||||||||||||
| Allowance for loan and lease losses as a percentage of total loans and leases | 1.69 | % | 1.43 | % | 0.24 | % | 1.38 | % | |||||||||||||||
| Year Ended December 31, 2020 | |||||||||||||||||||||||
| Commercial Real Estate | Commercial | Consumer | Total | ||||||||||||||||||||
| (In Thousands) | |||||||||||||||||||||||
| Balance at December 31, 2019 | $ | 30,285 | $ | 24,826 | $ | 5,971 | $ | 61,082 | |||||||||||||||
| Adoption of ASU 2016-13 (CECL) | 11,694 | (2,672) | (2,390) | 6,632 | |||||||||||||||||||
| Balance at beginning of period, adjusted | 41,979 | 22,154 | 3,581 | 67,714 | |||||||||||||||||||
| Charge-offs | (3,514) | (11,113) | (36) | (14,663) | |||||||||||||||||||
| Recoveries | 94 | 1,407 | 201 | 1,702 | |||||||||||||||||||
| Provision (credit) for loan and lease losses | 41,573 | 17,050 | 1,003 | 59,626 | |||||||||||||||||||
| Balance at December 31, 2020 | $ | 80,132 | $ | 29,498 | $ | 4,749 | $ | 114,379 | |||||||||||||||
| Total loans and leases | $ | 3,823,826 | $ | 2,274,899 | $ | 1,170,828 | $ | 7,269,553 | |||||||||||||||
| Allowance for loan and lease losses as a percentage of total loans and leases | 2.10 | % | 1.30 | % | 0.41 | % | 1.57 | % | |||||||||||||||
| Year Ended December 31, 2019 | |||||||||||||||||||||||
| Commercial Real Estate | Commercial | Consumer | Total | ||||||||||||||||||||
| (In Thousands) | |||||||||||||||||||||||
| Balance at December 31, 2018 | $ | 28,187 | $ | 25,283 | $ | 5,222 | $ | 58,692 | |||||||||||||||
| Charge-offs | — | (8,911) | (127) | (9,038) | |||||||||||||||||||
| Recoveries | — | 1,688 | 179 | 1,867 | |||||||||||||||||||
| Provision (credit) for loan and lease losses | 2,098 | 6,766 | 697 | 9,561 | |||||||||||||||||||
| Balance at December 31, 2019 | $ | 30,285 | $ | 24,826 | $ | 5,971 | $ | 61,082 | |||||||||||||||
| Total loans and leases | $ | 3,669,222 | $ | 1,838,748 | $ | 1,229,846 | $ | 6,737,816 | |||||||||||||||
| Allowance for loan and lease losses as a percentage of total loans and leases | 0.83 | % | 1.35 | % | 0.49 | % | 0.91 | % | |||||||||||||||
At December 31, 2023, the allowance for loan and lease losses increased to $117.5 million, or 1.22% of total loans and leases outstanding. This compared to an allowance for loan and lease losses of $98.5 million, or 1.29% of total loans and leases outstanding, as of December 31, 2022.
Net charge-offs in the loans and leases portfolio for the years ending December 31, 2023 and 2022 were $19.7 million and $3.3 million, respectively. The $16.4 million increase in net charge-offs was primarily driven by net charge-off increases of $13.1 million in commercial loans, $2.2 million in equipment financing loans, and $1.1 million in commercial real estate loans.
Management believes that the allowance for loan and lease losses as of December 31, 2023 is appropriate based on the facts and circumstances discussed further below.
44
The following tables set forth the Company's percent of allowance for loan and lease losses to the total allowance for loan and lease losses and the percent of loans to total loans for each of the categories listed at the dates indicated.
| At December 31, | |||||||||||||||||||||||||||||||||||||||||||||||||||||
| 2023 | 2022 | 2021 | |||||||||||||||||||||||||||||||||||||||||||||||||||
| Amount | Percent of Allowance to Total Allowance | Percent of Loans in Each Category to Total Loans | Amount | Percent of Allowance to Total Allowance | Percent of Loans in Each Category to Total Loans | Amount | Percent of Allowance to Total Allowance | Percent of Loans in Each Category to Total Loans | |||||||||||||||||||||||||||||||||||||||||||||
| (Dollars in Thousands) | |||||||||||||||||||||||||||||||||||||||||||||||||||||
| Commercial real estate | $ | 53,633 | 45.7 | % | 42.0 | % | $ | 44,536 | 45.3 | % | 39.9 | % | $ | 44,843 | 45.3 | % | 39.6 | % | |||||||||||||||||||||||||||||||||||
| Multi-family mortgage | 16,626 | 14.1 | % | 14.7 | % | 16,885 | 17.1 | % | 15.1 | % | 17,474 | 17.6 | % | 15.4 | % | ||||||||||||||||||||||||||||||||||||||
| Construction | 11,151 | 9.5 | % | 3.1 | % | 6,733 | 6.8 | % | 2.7 | % | 6,896 | 7.0 | % | 2.2 | % | ||||||||||||||||||||||||||||||||||||||
| Total commercial real estate loans | 81,410 | 69.3 | % | 59.8 | % | 68,154 | 69.2 | % | 57.7 | % | 69,213 | 69.9 | % | 57.2 | % | ||||||||||||||||||||||||||||||||||||||
| Commercial | 15,527 | 13.2 | % | 10.2 | % | 12,190 | 12.4 | % | 9.9 | % | 9,068 | 9.2 | % | 10.3 | % | ||||||||||||||||||||||||||||||||||||||
| Equipment financing | 13,869 | 11.8 | % | 14.2 | % | 14,315 | 14.5 | % | 15.9 | % | 17,907 | 18.0 | % | 15.5 | % | ||||||||||||||||||||||||||||||||||||||
| Condominium association | 161 | 0.1 | % | 0.5 | % | 99 | 0.1 | % | 0.6 | % | 80 | 0.1 | % | 0.7 | % | ||||||||||||||||||||||||||||||||||||||
| Total commercial loans and leases | 29,557 | 25.1 | % | 24.9 | % | 26,604 | 27.0 | % | 26.4 | % | 27,055 | 27.3 | % | 26.5 | % | ||||||||||||||||||||||||||||||||||||||
| Residential mortgage | 3,669 | 3.2 | % | 11.2 | % | 1,894 | 1.9 | % | 11.0 | % | 1,297 | 1.3 | % | 11.2 | % | ||||||||||||||||||||||||||||||||||||||
| Home equity | 2,255 | 1.9 | % | 3.6 | % | 1,478 | 1.5 | % | 4.2 | % | 1,335 | 1.3 | % | 4.5 | % | ||||||||||||||||||||||||||||||||||||||
| Other consumer | 631 | 0.5 | % | 0.5 | % | 352 | 0.4 | % | 0.7 | % | 184 | 0.2 | % | 0.6 | % | ||||||||||||||||||||||||||||||||||||||
| Total consumer loans | 6,555 | 5.6 | % | 15.3 | % | 3,724 | 3.8 | % | 15.9 | % | 2,816 | 2.8 | % | 16.3 | % | ||||||||||||||||||||||||||||||||||||||
| Total | $ | 117,522 | 100.0 | % | 100.0 | % | $ | 98,482 | 100.0 | % | 100.0 | % | $ | 99,084 | 100.0 | % | 100.0 | % | |||||||||||||||||||||||||||||||||||
45
| At December 31, | |||||||||||||||||||||||||||||||||||
| 2020 | 2019 | ||||||||||||||||||||||||||||||||||
| Amount | Percent of Allowance to Total Allowance | Percent of Loans in Each Category to Total Loans | Amount | Percent of Allowance to Total Allowance | Percent of Loans in Each Category to Total Loans | ||||||||||||||||||||||||||||||
| (Dollars in Thousands) | |||||||||||||||||||||||||||||||||||
| Commercial real estate | $ | 46,357 | 40.6 | % | 35.4 | % | $ | 21,519 | 35.3 | % | 37.0 | % | |||||||||||||||||||||||
| Multi-family mortgage | 22,559 | 19.7 | % | 13.9 | % | 6,436 | 10.5 | % | 13.8 | % | |||||||||||||||||||||||||
| Construction | 11,216 | 9.8 | % | 3.2 | % | 2,330 | 3.8 | % | 3.7 | % | |||||||||||||||||||||||||
| Total commercial real estate loans | 80,132 | 70.1 | % | 52.5 | % | 30,285 | 49.6 | % | 54.5 | % | |||||||||||||||||||||||||
| Commercial | 8,089 | 7.1 | % | 15.6 | % | 12,849 | 21.0 | % | 10.8 | % | |||||||||||||||||||||||||
| Equipment financing | 21,292 | 18.6 | % | 15.0 | % | 11,595 | 19.0 | % | 15.6 | % | |||||||||||||||||||||||||
| Condominium association | 117 | 0.1 | % | 0.7 | % | 382 | 0.6 | % | 0.8 | % | |||||||||||||||||||||||||
| Total commercial loans and leases | 29,498 | 25.8 | % | 31.3 | % | 24,826 | 40.6 | % | 27.2 | % | |||||||||||||||||||||||||
| Residential mortgage | 1,967 | 1.7 | % | 10.9 | % | 3,717 | 6.1 | % | 12.1 | % | |||||||||||||||||||||||||
| Home equity | 2,504 | 2.2 | % | 4.8 | % | 2,132 | 3.5 | % | 5.6 | % | |||||||||||||||||||||||||
| Other consumer | 278 | 0.2 | % | 0.5 | % | 122 | 0.2 | % | 0.6 | % | |||||||||||||||||||||||||
| Total consumer loans | 4,749 | 4.1 | % | 16.2 | % | 5,971 | 9.8 | % | 18.3 | % | |||||||||||||||||||||||||
| Total | $ | 114,379 | 100.0 | % | 100.0 | % | $ | 61,082 | 100.0 | % | 100.0 | % | |||||||||||||||||||||||
Investment Securities and Restricted Equity Securities
The investment portfolio exists primarily for liquidity purposes, and secondarily as sources of interest and dividend income, interest-rate risk management and tax planning as a counterbalance to loan and deposit flows. Investment securities are utilized as part of the Company's asset/liability management and may be sold in response to, or in anticipation of, factors such as changes in market conditions and interest rates, security prepayment rates, deposit outflows, liquidity concentrations and regulatory capital requirements.
The investment policy of the Company, which is reviewed and approved by the Board of Directors on an annual basis, specifies the types of investments that are acceptable, required investment ratings by at least one nationally recognized rating agency, concentration limits and duration guidelines. Compliance with the investment policy is monitored on a regular basis. In general, the Company seeks to maintain a high degree of liquidity and targets cash, cash equivalents and investment securities available-for-sale balances between 10% and 30% of total assets.
Cash, cash equivalents, and investment securities increased $9.9 million, or 1.0%, to $1.05 billion as of December 31, 2023 compared to $1.04 billion as of December 31, 2022. The increase was primarily driven by a increase in investment securities available-for-sale. Cash, cash equivalents, and investment securities were 9.22% of total assets as of December 31, 2023, compared to 11.32% of total assets at December 31, 2022.
46
The following table sets forth certain information regarding the amortized cost and market value of the Company's investment securities at the dates indicated:
| At December 31, | |||||||||||||||||||||||||||||||||||
| 2023 | 2022 | 2021 | |||||||||||||||||||||||||||||||||
| Amortized Cost | Fair Value | Amortized Cost | Fair Value | Amortized Cost | Fair Value | ||||||||||||||||||||||||||||||
| (In Thousands) | |||||||||||||||||||||||||||||||||||
| Investment securities available-for-sale: | |||||||||||||||||||||||||||||||||||
| GSE debentures | $ | 220,604 | $ | 201,127 | $ | 176,751 | $ | 152,422 | $ | 219,723 | $ | 217,505 | |||||||||||||||||||||||
| GSE CMOs | 66,463 | 61,617 | 19,977 | 18,220 | 27,892 | 28,139 | |||||||||||||||||||||||||||||
| GSE MBSs | 186,614 | 169,997 | 159,824 | 140,576 | 196,930 | 199,772 | |||||||||||||||||||||||||||||
| Municipal obligations | 18,785 | 18,922 | — | — | — | — | |||||||||||||||||||||||||||||
| Corporate debt obligations | 20,521 | 19,716 | 14,076 | 13,764 | 22,178 | 22,683 | |||||||||||||||||||||||||||||
| U.S. Treasury bonds | 470,764 | 444,737 | 362,850 | 331,307 | 253,878 | 252,268 | |||||||||||||||||||||||||||||
| Foreign government obligations | 500 | 485 | 500 | 477 | 500 | 499 | |||||||||||||||||||||||||||||
| Total investment securities available-for-sale | $ | 984,251 | $ | 916,601 | $ | 733,978 | $ | 656,766 | $ | 721,101 | $ | 720,866 | |||||||||||||||||||||||
| Restricted equity securities: | |||||||||||||||||||||||||||||||||||
| FHLB stock | $ | 55,548 | $ | 52,914 | $ | 10,488 | |||||||||||||||||||||||||||||
| FRB stock | 21,881 | 18,241 | 18,241 | ||||||||||||||||||||||||||||||||
| Other | 166 | 152 | 252 | ||||||||||||||||||||||||||||||||
| Total restricted equity securities | $ | 77,595 | $ | 71,307 | $ | 28,981 | |||||||||||||||||||||||||||||
Total investment securities and restricted equity securities primarily consist of investment securities available-for-sale, stock in the FHLB and stock in the FRB. The total securities portfolio increased $266.1 million, or 36.6% since December 31, 2022. As of December 31, 2023, the total securities portfolio was 8.73% of total assets, compared to 7.93% of total assets as of December 31, 2022.
The fair value of investment securities is based principally on market prices and dealer quotes received from third-party, nationally-recognized pricing services for identical investment securities such as U.S. Treasury and agency securities. The Company's equity securities held-for-trading are priced this way and are included in Level 1. These prices are validated by comparing the primary pricing source with an alternative pricing source when available. When quoted market prices for identical securities are unavailable, the Company uses market prices provided by independent pricing services based on recent trading activity and other observable information, including but not limited to market interest-rate curves, referenced credit spreads and estimated prepayment speeds where applicable. These investments include certain U.S. and government agency debt securities, municipal and corporate debt securities, U.S. Government-sponsored enterprises ("GSE") residential mortgage backed securities ("MBSs") and collateralized mortgage obligations ("CMOs"), trust preferred securities, and equity securities held-for-trading.
Additionally, management reviews changes in fair value from period to period and performs testing to ensure that prices received from the third parties are consistent with their expectation of the market. Changes in the prices obtained from the pricing service are analyzed from month to month, taking into consideration changes in market conditions including changes in mortgage spreads, changes in U.S. Treasury security yields and changes in generic pricing of 15-year and 30-year securities. Additional analysis may include a review of prices provided by other independent parties, a yield analysis, a review of average life changes using Bloomberg analytics and a review of historical pricing for the particular security.
As of December 31, 2023, the fair value of all investment securities available-for-sale was $916.6 million and carried a total of $67.7 million of net unrealized losses, compared to a fair value of $656.8 million and net unrealized losses of $77.2 million as of December 31, 2022. As of December 31, 2023, $717.2 million, or 77.8%, of the portfolio, had gross unrealized losses of $69.0 million. This compares to $630.5 million, or 96.0%, of the portfolio with gross unrealized losses of $77.5 million as of December 31, 2022. The Company's unrealized loss position decreased in 2023 driven by a change in the portfolio mix from shorter duration MBS to longer duration U.S. Treasury bonds. For additional discussion on investment securities available-for-sale by security type, see Note 4, "Investment Securities."
47
The Company reviews its debt securities portfolio on a quarterly basis in accordance with ASC 326. This analysis is done using probability of default and loss given default assumptions where a model is created to determine CECL for the remaining life of the securities. For the year ended December 31, 2023, the Company recognized $0.4 million as an allowance for credit loss. For additional discussion on how the Company validates fair values provided by the third-party pricing service, see Note 21, “Fair Value of Financial Instruments.”
Maturities, calls and principal repayments for investment securities available-for-sale totaled $272.4 million for the year ended December 31, 2023 compared to $98.6 million for the same period in 2022. For the year ended December 31, 2023, the Company sold $230.0 million of investment securities available for sale, compared to $78.8 million for the same period in 2022. For the year ended December 31, 2023, the Company purchased $362.9 million of investment securities available-for-sale, compared to $197.6 million for the same period in 2022.
Restricted Equity Securities
FHLB Stock—The Company invests in the stock of the FHLB of Boston and New York as one of the requirements to borrow. As of December 31, 2023 on 2022, the Company did not have excess balance of capital stock.
As of December 31, 2023, the Company owned stock in the FHLB of Boston and New York with a carrying value of $55.5 million, an increase of $2.6 million from $52.9 million as of December 31, 2022. The Company continually reviews its investment to determine if impairment exists. The Company reviews recent public filings, rating agency analysis and other factors when making its determination. See Note 5, "Restricted Equity Securities" to the consolidated financial statements for further information about the FHLB.
Federal Reserve Bank Stock—The Company invests in the stock of the Federal Reserve Bank of Boston and New York, as a condition of the membership for the Banks in the Federal Reserve System. In 2023, the Company maintained its investment in the stock of the Federal Reserve Banks to adjust for deposit growth. The FRB is the primary federal regulator for the Company and the Banks.
48
Carrying Value, Weighted Average Yields, and Contractual Maturities of Investment and Restricted Equity Securities
The table below sets forth certain information regarding the carrying value, weighted average yields and contractual maturities of the Company's investment and restricted equity securities portfolio at the date indicated.
_______________________________________________________________________________
| Balance at December 31, 2023 | |||||||||||||||||||||||||||||||||||||||||||||||||||||||||||
| One Year or Less | After One Year Through Five Years | After Five Years Through Ten Years | After Ten Years | Total | |||||||||||||||||||||||||||||||||||||||||||||||||||||||
| Carrying Value | Weighted Average Yield (1) | Carrying Value | Weighted Average Yield (1) | Carrying Value | Weighted Average Yield (1) | Carrying Value | Weighted Average Yield (1) | Carrying Value | Weighted Average Yield (1) | ||||||||||||||||||||||||||||||||||||||||||||||||||
| (Dollars in Thousands) | |||||||||||||||||||||||||||||||||||||||||||||||||||||||||||
| Investment securities available-for-sale: | |||||||||||||||||||||||||||||||||||||||||||||||||||||||||||
| GSE debentures | $ | 24,655 | 3.02 | % | $ | 80,240 | 4.18 | % | $ | 87,684 | 1.23 | % | $ | 8,548 | 2.46 | % | $ | 201,127 | 2.68 | % | |||||||||||||||||||||||||||||||||||||||
| GSE CMOs | — | — | % | 768 | 2.79 | % | 8,125 | 3.40 | % | 52,724 | 4.88 | % | 61,617 | 4.66 | % | ||||||||||||||||||||||||||||||||||||||||||||
| GSE MBSs | 53 | 1.72 | % | 9,195 | 2.44 | % | 20,084 | 2.69 | % | 140,665 | 2.82 | % | 169,997 | 2.78 | % | ||||||||||||||||||||||||||||||||||||||||||||
| Municipal obligations | 9,553 | 4.43 | % | 921 | 3.29 | % | 916 | 2.66 | % | 7,532 | 3.47 | % | 18,922 | 3.91 | % | ||||||||||||||||||||||||||||||||||||||||||||
| Corporate debt obligations | 8,420 | 3.53 | % | — | — | % | 11,297 | 4.62 | % | — | — | % | 19,716 | 4.15 | % | ||||||||||||||||||||||||||||||||||||||||||||
| U.S. Treasury bonds | 98,660 | 4.63 | % | 241,126 | 2.84 | % | 104,952 | 1.42 | % | — | — | % | 444,737 | 2.90 | % | ||||||||||||||||||||||||||||||||||||||||||||
| Foreign government obligations | — | — | % | 485 | 1.97 | % | — | — | % | — | — | % | 485 | 1.97 | % | ||||||||||||||||||||||||||||||||||||||||||||
| Total investment securities available-for-sale | $ | 141,341 | 4.27 | % | $ | 332,735 | 3.15 | % | $ | 233,058 | 1.69 | % | $ | 209,469 | 3.35 | % | $ | 916,601 | 3.00 | % | |||||||||||||||||||||||||||||||||||||||
| Restricted equity securities (2): | |||||||||||||||||||||||||||||||||||||||||||||||||||||||||||
| FHLB stock | $ | — | — | % | $ | — | — | % | $ | — | — | % | $ | 55,548 | 8.27 | % | $ | 55,548 | 8.27 | % | |||||||||||||||||||||||||||||||||||||||
| FRB stock | — | — | % | — | — | % | — | — | % | 21,881 | 6.00 | % | 21,881 | 6.00 | % | ||||||||||||||||||||||||||||||||||||||||||||
| Other stock | — | — | % | — | — | % | — | — | % | 166 | — | % | 166 | — | % | ||||||||||||||||||||||||||||||||||||||||||||
| Total restricted equity securities | $ | — | — | % | $ | — | — | % | $ | — | — | % | $ | 77,595 | 7.61 | % | $ | 77,595 | 7.61 | % | |||||||||||||||||||||||||||||||||||||||
(1) Yields have been calculated on a pre-tax basis. The Company holds no investment securities available-for-sale that are tax-exempt.
(2) Equity securities have no contractual maturity, therefore they are reported above in the over ten year maturity column.
49
Deposits
The following table presents the Company's deposit mix at the dates indicated.
| At December 31, | |||||||||||||||||||||||||||||||||||||||||||||||||||||
| 2023 | 2022 | 2021 | |||||||||||||||||||||||||||||||||||||||||||||||||||
| Amount | Percent of Total | Weighted Average Rate | Amount | Percent of Total | Weighted Average Rate | Amount | Percent of Total | Weighted Average Rate | |||||||||||||||||||||||||||||||||||||||||||||
| (Dollars in Thousands) | |||||||||||||||||||||||||||||||||||||||||||||||||||||
| Non-interest-bearing deposits: | |||||||||||||||||||||||||||||||||||||||||||||||||||||
| Demand checking accounts | $ | 1,678,406 | 19.6 | % | — | % | $ | 1,802,518 | 27.6 | % | — | % | $ | 1,888,462 | 26.8 | % | — | % | |||||||||||||||||||||||||||||||||||
| Interest-bearing deposits: | |||||||||||||||||||||||||||||||||||||||||||||||||||||
| NOW accounts | 661,863 | 7.8 | % | 0.60 | % | 544,118 | 8.3 | % | 0.18 | % | 604,097 | 8.6 | % | 0.08 | % | ||||||||||||||||||||||||||||||||||||||
| Savings accounts | 1,669,018 | 19.5 | % | 2.63 | % | 762,271 | 11.7 | % | 0.70 | % | 915,804 | 13.0 | % | 0.09 | % | ||||||||||||||||||||||||||||||||||||||
| Money market accounts | 2,082,810 | 24.4 | % | 3.07 | % | 2,174,952 | 33.4 | % | 1.63 | % | 2,358,306 | 33.5 | % | 0.26 | % | ||||||||||||||||||||||||||||||||||||||
| Certificate of deposit accounts | 1,574,855 | 18.4 | % | 3.88 | % | 928,143 | 14.2 | % | 1.68 | % | 1,117,695 | 15.9 | % | 0.71 | % | ||||||||||||||||||||||||||||||||||||||
| Brokered deposit accounts | 881,173 | 10.3 | % | 4.36 | % | 310,144 | 4.8 | % | 3.00 | % | 165,542 | 2.3 | % | 0.04 | % | ||||||||||||||||||||||||||||||||||||||
| Total interest-bearing deposits | 6,869,719 | 80.4 | % | 3.08 | % | 4,719,628 | 72.4 | % | 1.41 | % | 5,161,444 | 73.2 | % | 0.30 | % | ||||||||||||||||||||||||||||||||||||||
| Total deposits | $ | 8,548,125 | 100.0 | % | 2.48 | % | $ | 6,522,146 | 100.0 | % | 1.02 | % | $ | 7,049,906 | 100.0 | % | 0.22 | % | |||||||||||||||||||||||||||||||||||
The Company seeks to increase its core deposits and decrease its loan-to-deposit ratio over time, while continuing to increase deposits as a percentage of total funding sources. The Company's loan-to-deposit ratio was 112.8% as of December 31, 2023, compared to 117.2% as of December 31, 2022.
Total deposits increased $2.0 billion, or 31.1%, to $8.5 billion as of December 31, 2023, compared to $6.5 billion as of December 31, 2022. Deposits as a percentage of total assets increased from 71.0% as of December 31, 2022 to 75.1% as of December 31, 2023. The increase in deposits as a percentage of total assets is due to increases in all deposit accounts, except money market accounts.
In 2023, core deposits increased $0.8 billion. The ratio of core deposits to total deposits decreased from 81.0% as of December 31, 2022 to 71.3% as of December 31, 2023, as a result of increases in certificate of deposit and brokered deposit accounts.
Certificate of deposit accounts increased $646.7 million to $1.6 billion as of December 31, 2023, compared to $0.9 billion as of December 31, 2022. Certificate of deposit accounts increased as a percentage of total deposits to 18.4% as of December 31, 2023 from 14.2% as of December 31, 2022.
Brokered deposits increased $571.0 million to $881.2 million as of December 31, 2023, compared to $310.1 million as of December 31, 2022. Brokered deposits increased as a percentage of total deposits to 10.3% as of December 31, 2023 from 4.8% as of December 31, 2022. The increase in brokered deposits was primarily driven by the purchase of brokered certificate of deposits. Brokered deposits allow the Company to seek additional funding by attracting deposits from outside the Company's core market. The Company's investment policy limits the amount of brokered deposits to 15% of total assets.
The following table sets forth the distribution of the average balances of the Company's deposit accounts for the years indicated and the weighted average interest rates on each category of deposits presented. Averages for the years presented are based on daily balances.
50
| Year Ended December 31, | |||||||||||||||||||||||||||||||||||||||||||||||||||||
| 2023 | 2022 | 2021 | |||||||||||||||||||||||||||||||||||||||||||||||||||
| Average Balance | Percent of Total Average Deposits | Weighted Average Rate | Average Balance | Percent of Total Average Deposits | Weighted Average Rate | Average Balance | Percent of Total Average Deposits | Weighted Average Rate | |||||||||||||||||||||||||||||||||||||||||||||
| (Dollars in Thousands) | |||||||||||||||||||||||||||||||||||||||||||||||||||||
| Core deposits: | |||||||||||||||||||||||||||||||||||||||||||||||||||||
| Non-interest-bearing demand checking accounts | $ | 1,823,759 | 21.7 | % | — | % | $ | 1,879,620 | 27.3 | % | — | % | $ | 1,787,959 | 25.8 | % | — | % | |||||||||||||||||||||||||||||||||||
| NOW accounts | 720,572 | 8.5 | % | 0.59 | % | 598,267 | 8.7 | % | 0.14 | % | 502,189 | 7.3 | % | 0.10 | % | ||||||||||||||||||||||||||||||||||||||
| Savings accounts | 1,439,293 | 17.1 | % | 1.94 | % | 882,881 | 12.8 | % | 0.25 | % | 793,141 | 11.5 | % | 0.12 | % | ||||||||||||||||||||||||||||||||||||||
| Money market accounts | 2,205,430 | 26.1 | % | 2.64 | % | 2,387,670 | 34.6 | % | 0.64 | % | 2,288,740 | 33.1 | % | 0.27 | % | ||||||||||||||||||||||||||||||||||||||
| Total core deposits | 6,189,054 | 73.4 | % | 1.46 | % | 5,748,438 | 83.4 | % | 0.32 | % | 5,372,029 | 77.6 | % | 0.14 | % | ||||||||||||||||||||||||||||||||||||||
| Certificate of deposit accounts | 1,428,727 | 16.9 | % | 3.09 | % | 998,580 | 14.5 | % | 0.82 | % | 1,210,451 | 17.5 | % | 0.97 | % | ||||||||||||||||||||||||||||||||||||||
| Brokered deposit accounts | 819,419 | 9.7 | % | 5.02 | % | 146,038 | 2.1 | % | 1.99 | % | 338,734 | 4.9 | % | 0.38 | % | ||||||||||||||||||||||||||||||||||||||
| Total deposits | $ | 8,437,200 | 100.0 | % | 2.08 | % | $ | 6,893,056 | 100.0 | % | 0.43 | % | $ | 6,921,214 | 100.0 | % | 0.30 | % | |||||||||||||||||||||||||||||||||||
As of December 31, 2023 and 2022, the Company had outstanding certificate of deposit of $250,000 or more, maturing as follows:
| At December 31, | |||||||||||||||||||||||
| 2023 | 2022 | ||||||||||||||||||||||
| Amount | Weighted Average Rate | Amount | Weighted Average Rate | ||||||||||||||||||||
| (Dollars in Thousands) | |||||||||||||||||||||||
| Maturity period: | |||||||||||||||||||||||
| Six months or less | $ | 291,049 | 4.02 | % | $ | 108,100 | 1.32 | % | |||||||||||||||
| Over six months through 12 months | 163,277 | 4.59 | % | 62,489 | 1.82 | % | |||||||||||||||||
| Over 12 months | 29,637 | 3.91 | % | 101,654 | 2.96 | % | |||||||||||||||||
| Total certificate of deposit of $250,000 or more | $ | 483,963 | 4.21 | % | $ | 272,243 | 2.05 | % | |||||||||||||||
The following table presents the Company's insured and uninsured deposit mix at the date indicated.
| At December 31, 2023 | |||||||||||||||||||||||||||||||||||
| (Dollars in Millions) | |||||||||||||||||||||||||||||||||||
| Commercial | Consumer | Municipal | Brokered | Total | % | ||||||||||||||||||||||||||||||
| Insured or Collateralized | $ | 2,048 | $ | 3,085 | $ | 239 | $ | 881 | $ | 6,253 | 73 | % | |||||||||||||||||||||||
| Uninsured | 1,315 | 958 | 22 | — | 2,295 | 27 | % | ||||||||||||||||||||||||||||
| Total | $ | 3,363 | $ | 4,043 | $ | 261 | $ | 881 | $ | 8,548 | 100 | % | |||||||||||||||||||||||
| Composition | 39 | % | 47 | % | 3 | % | 10 | % | 100 | % | |||||||||||||||||||||||||
As of December 31, 2023, the Company had uninsured municipal deposits requiring collateral of $148.1 million, included in Insured or Collateralized in the table above, which are covered by specific collateral and FHLB letters of credit. The remaining deposits, included in Insured or Collateralized in the table above, are insured with the FDIC or via reciprocal products.
51
Borrowed Funds
The following table sets forth certain information regarding FHLB advances, subordinated debentures and notes and other borrowed funds for the periods indicated:
| Year Ended December 31, | |||||||||||||||||
| 2023 | 2022 | 2021 | |||||||||||||||
| (Dollars in Thousands) | |||||||||||||||||
| Borrowed funds: | |||||||||||||||||
| Average balance outstanding | $ | 1,301,905 | $ | 542,923 | $ | 404,814 | |||||||||||
| Maximum amount outstanding at any month end during the year | 1,630,102 | 1,432,652 | 686,346 | ||||||||||||||
| Balance outstanding at end of year | 1,376,670 | 1,432,652 | 357,321 | ||||||||||||||
| Weighted average interest rate for the period | 4.69 | % | 2.87 | % | 2.06 | % | |||||||||||
| Weighted average interest rate at end of period | 5.01 | % | 4.41 | % | 1.70 | % | |||||||||||
Advances from the FHLB of Boston and FHLB of New York
On a long-term basis, the Company intends to continue to increase its core deposits. The Company also uses FHLB borrowings and other wholesale borrowings as part of the Company's overall strategy to fund loan growth and manage interest-rate risk and liquidity. The advances are secured by a blanket security agreement which requires the Banks to maintain certain qualifying assets as collateral, principally mortgage loans and securities in an aggregate amount at least equal to outstanding advances. The maximum amount that the FHLBs will advance to member institutions, including the Company, fluctuates from time to time in accordance with the policies of the FHLBs. The Company may also borrow from the FRB's "discount window" as necessary.
FHLB borrowings decreased $14.6 million to $1.22 billion as of December 31, 2023 from $1.24 billion as of December 31, 2022. The decrease in FHLB borrowings was primarily due to lower liquidity needs. The Company's remaining borrowing capacity from the FHLB of Boston and FHLB of New York for advances and repurchase agreements was $1.3 billion as of December 31, 2023.
Other Borrowed Funds
In addition to advances from the FHLB and subordinated debentures and notes, the Company utilizes other funding
sources as part of the overall liquidity strategy. Those funding sources include repurchase agreements and committed and uncommitted lines of credit with several financial institutions.
The Company periodically enters into repurchase agreements with its larger deposit and commercial customers as part of its cash management services which are typically overnight borrowings. Repurchase agreements with customers decreased
$42.7 million to $9.3 million as of December 31, 2023 from $52.0 million as of December 31, 2022.
As of December 31, 2023, the Banks also have access to funding through certain uncommitted lines via American Financial Exchange ("AFX") as well as other large financial institution specific lines.
The Company has access to the FRB's "discount window" to supplement its liquidity. The Company has $273.0 million of borrowing capacity at the FRB as of December 31, 2023. As of December 31, 2023, the Company did not have any borrowings with the FRB outstanding. As of December 31, 2023, the Company had no borrowings outstanding with these committed and uncommitted lines.
Subordinated Debentures and Notes
In connection with the acquisition of Bancorp Rhode Island, Inc., the Company assumed three subordinated debentures issued by a subsidiary of Bancorp Rhode Island, Inc.
On September 15, 2014, the Company offered $75.0 million of 6.0% fixed-to-floating subordinated notes due September
15, 2029. The Company is obligated to pay 6.0% interest semiannually between September 2014 and September 2024. Subsequently, the Company is obligated to pay 3-month LIBOR plus 3.315% quarterly until the notes mature in September 2029. As of December 31, 2023, the Company had capitalized costs of $0.6 million in relation to the issuance of these subordinated notes.
52
The following table summarizes the Company's subordinated debentures and notes at the dates indicated.
| Carrying Amount | ||||||||||||||||||||||||||||||||
| Issue Date | Rate | Maturity Date | Next Call Date | December 31, 2023 | December 31, 2022 | |||||||||||||||||||||||||||
| (Dollars in Thousands) | ||||||||||||||||||||||||||||||||
| June 26, 2003 | Variable; 3-month SOFR + 3.10% | June 26, 2033 | March 25, 2024 | $ | 4,904 | $ | 4,887 | |||||||||||||||||||||||||
| March 17, 2004 | Variable; 3-month CME term SOFR + tenor spread adjustment + 2.79% | March 17, 2034 | March 17, 2024 | 4,857 | 4,830 | |||||||||||||||||||||||||||
| September 15, 2014 | 6.0% Fixed-to-Variable; 3-month LIBOR + 3.315% | September 15, 2029 | September 15, 2024 | 74,427 | 74,327 | |||||||||||||||||||||||||||
| Total | $ | 84,188 | $ | 84,044 | ||||||||||||||||||||||||||||
Derivative Financial Instruments
The Company has entered into loan level derivatives, risk participation agreements, and foreign exchange contracts with certain commercial customers and concurrently enters into offsetting swaps with third-party financial institutions. The Company may also, from time to time, enter into risk participation agreements. The Company uses interest rate futures that are designated and qualify as cash flow hedging instruments.
The following table summarizes certain information concerning the Company's loan level derivatives, risk participation agreements, and foreign exchange contracts at December 31, 2023 and 2022:
| At December 31, 2023 | At December 31, 2022 | |||||||
| (Dollars in Thousands) | ||||||||
| Interest rate derivatives (Notional amounts): | $ | 225,000 | $ | 150,000 | ||||
| Loan level derivatives (Notional Amount): | ||||||||
| Receive fixed, pay variable | $ | 1,733,198 | $ | 1,489,709 | ||||
| Pay fixed, receive variable | 1,733,198 | 1,489,709 | ||||||
| Risk participation-out agreements | 542,387 | 393,624 | ||||||
| Risk participation-in agreements | 100,313 | 75,223 | ||||||
| Foreign exchange contracts (Notional Amount) | ||||||||
| Buys foreign currency, sells U.S. currency | $ | 3,262 | $ | 2,383 | ||||
| Sells foreign currency, buys U.S. currency | 3,895 | 2,400 | ||||||
| Fixed weighted average interest rate of the swap portfolio | 2.96 | % | 2.65 | % | ||||
| Floating weighted average interest rate of the swap portfolio | 5.70 | % | 4.68 | % | ||||
| Weighted average remaining term to maturity (in months) | 75 | 69 | ||||||
| Fair value: | ||||||||
| Recognized as an asset: | ||||||||
| Interest rate derivatives | $ | 234 | $ | 34 | ||||
| Loan level derivatives | 99,876 | 108,963 | ||||||
| Risk participation-out agreements | 1,238 | 347 | ||||||
| Foreign exchange contracts | 139 | 130 | ||||||
| Recognized as a liability: | ||||||||
| Interest rate derivatives | $ | 2,842 | $ | 3,170 | ||||
| Loan level derivatives | 99,876 | 108,963 | ||||||
| Risk participation-in agreements | 310 | 31 | ||||||
| Foreign exchange contracts | 132 | 112 | ||||||
53
Stockholders' Equity and Dividends
The Company's total stockholders' equity was $1,198.6 million as of December 31, 2023, representing a $206.5 million increase compared to $992.1 million at December 31, 2022. The increase for the twelve months ended December 31, 2023, primarily reflects the acquisition of PCSB of $167 million, net income attributable to the Company of $75.0 million, unrealized gain on securities available-for-sale of $7.6 million, partially offset by dividends paid by the Company of $47.9 million.
For the year ended December 31, 2023, the dividend payout ratio was 63.9%, compared to 36.5% for the year ended December 31, 2022. The dividends paid in the fourth quarter of 2023 represented the Company's 99th consecutive quarter of dividend payments. The Company's quarterly dividend distribution was $0.135 per share for each quarter of 2023.
Stockholders' equity represented 10.53% of total assets as of December 31, 2023 and 10.80% of total assets as of December 31, 2022. Tangible stockholders' equity (total stockholders' equity less goodwill and identified intangible assets, net) represented 8.39% of tangible assets (total assets less goodwill and identified intangible assets, net) as of December 31, 2023 and 9.20% as of December 31, 2022.
On November 10, 2021, the Company's Board of Directors (the "Board") approved a stock repurchase program authorizing management to repurchase up to $20.0 million of the Company's common stock, commencing on November 15, 2021 and ending on December 31, 2022. On June 24, 2022, the Company suspended the program. As of June 24, 2022, 956,341 shares of the Company's common stock were repurchased by the Company at the weighted average price of $14.41.
Results of Operations
The primary drivers of the Company's net income are net interest income, which is strongly affected by the net yield on and growth of interest-earning assets and liabilities ("net interest margin"), the quality of the Company's assets, its levels of non-interest income and non-interest expense, and its tax provision.
The Company's net interest income represents the difference between interest income earned on its investments, loans and leases, and its cost of funds. Interest income is dependent on the amount of interest-earning assets outstanding during the period and the yield earned thereon. Cost of funds is a function of the average amount of deposits and borrowed money outstanding during the year and the interest rates paid thereon. The net interest margin is calculated by dividing net interest income by average interest-earning assets. Net interest spread is the difference between the average rate earned on interest-earning assets and the average rate paid on interest-bearing liabilities. The increases or decreases, as applicable, in the components of interest income and interest expense, expressed in terms of fluctuation in average volume and rate, are summarized under "Rate/Volume Analysis" below. Information as to the components of interest income, interest expense and average rates is provided under "Average Balances, Net Interest Income, Interest-Rate Spread and Net Interest Margin" below.
Because the Company's assets and liabilities are not identical in duration and in repricing dates, the differential between the two is vulnerable to changes in market interest rates as well as the overall shape of the yield curve. These vulnerabilities are inherent to the business of banking and are commonly referred to as "interest-rate risk." How interest-rate risk is measured and, once measured, how much interest-rate risk is taken are based on numerous assumptions and other subjective judgments. See the discussion in the "Measuring Interest-Rate Risk" section of Item 7A, "Quantitative and Qualitative Disclosures about Market Risk" below.
The quality of the Company's assets also influences its earnings. Loans and leases that are not paid on a timely basis and exhibit other weaknesses can result in the loss of principal and/or interest income. Additionally, the Company must make timely provisions to the allowance for loan and lease losses based on estimates of probable losses inherent in the loan and lease portfolio. These additions, which are charged against earnings, are necessarily greater when greater probable losses are expected. Further, the Company incurs expenses as a result of resolving troubled assets. These variables reflect the "credit risk" that the Company takes on in the ordinary course of business and are further discussed under "Financial Condition—Asset Quality" above.
Average Balances, Net Interest Income, Interest-Rate Spread and Net Interest Margin
The following table sets forth information about the Company's average balances, interest income and interest rates earned on average interest-earning assets, interest expense and interest rates paid on average interest-bearing liabilities, interest-rate spread and net interest margin for the years ended December 31, 2023, 2022 and 2021. Average balances are derived from daily average balances and yields include fees, costs and purchase-accounting-related premiums and discounts which are considered adjustments to coupon yields in accordance with GAAP.
54
| Year Ended December 31, | |||||||||||||||||||||||||||||||||||||||||||||||||||||
| 2023 | 2022 | 2021 | |||||||||||||||||||||||||||||||||||||||||||||||||||
| Average Balance | Interest (1) | Average Yield/ Cost | Average Balance | Interest (1) | Average Yield/ Cost | Average Balance | Interest (1) | Average Yield/ Cost | |||||||||||||||||||||||||||||||||||||||||||||
| (Dollars in Thousands) | |||||||||||||||||||||||||||||||||||||||||||||||||||||
| Assets: | |||||||||||||||||||||||||||||||||||||||||||||||||||||
| Interest-earning assets: | |||||||||||||||||||||||||||||||||||||||||||||||||||||
| Debt securities | $ | 947,782 | $ | 29,891 | 3.15 | % | $ | 706,580 | $ | 13,079 | 1.85 | % | $ | 729,147 | $ | 12,178 | 1.67 | % | |||||||||||||||||||||||||||||||||||
| Marketable and restricted equity securities | 72,264 | 5,572 | 7.71 | % | 36,813 | 1,898 | 5.15 | % | 34,074 | 1,172 | 3.44 | % | |||||||||||||||||||||||||||||||||||||||||
| Short-term investments | 158,718 | 8,329 | 5.25 | % | 104,288 | 1,440 | 1.38 | % | 217,784 | 252 | 0.12 | % | |||||||||||||||||||||||||||||||||||||||||
| Total investments | 1,178,764 | 43,792 | 3.72 | % | 847,681 | 16,417 | 1.94 | % | 981,005 | 13,602 | 1.39 | % | |||||||||||||||||||||||||||||||||||||||||
Commercial real estate loans (2) | 5,654,385 | 307,652 | 5.37 | % | 4,238,960 | 172,811 | 4.02 | % | 3,854,357 | 139,451 | 3.57 | % | |||||||||||||||||||||||||||||||||||||||||
Commercial loans (2) | 929,077 | 59,110 | 6.28 | % | 744,972 | 34,105 | 4.52 | % | 1,020,627 | 47,647 | 4.61 | % | |||||||||||||||||||||||||||||||||||||||||
Equipment financing (2) | 1,277,224 | 92,112 | 7.21 | % | 1,148,673 | 75,767 | 6.60 | % | 1,081,287 | 71,906 | 6.65 | % | |||||||||||||||||||||||||||||||||||||||||
Consumer loans (2) | 1,470,677 | 75,098 | 5.10 | % | 1,199,804 | 46,295 | 3.86 | % | 1,157,940 | 39,142 | 3.38 | % | |||||||||||||||||||||||||||||||||||||||||
| Total loans and leases | 9,331,363 | 533,972 | 5.72 | % | 7,332,409 | 328,978 | 4.49 | % | 7,114,211 | 298,146 | 4.19 | % | |||||||||||||||||||||||||||||||||||||||||
| Total interest-earning assets | 10,510,127 | 577,764 | 5.50 | % | 8,180,090 | 345,395 | 4.22 | % | 8,095,216 | 311,748 | 3.85 | % | |||||||||||||||||||||||||||||||||||||||||
| Allowance for loan and lease losses | (120,613) | (95,542) | (110,122) | ||||||||||||||||||||||||||||||||||||||||||||||||||
| Non-interest-earning assets | 824,857 | 538,855 | 533,106 | ||||||||||||||||||||||||||||||||||||||||||||||||||
| Total assets | $ | 11,214,371 | $ | 8,623,403 | $ | 8,518,200 | |||||||||||||||||||||||||||||||||||||||||||||||
| Liabilities and Stockholders' Equity: | |||||||||||||||||||||||||||||||||||||||||||||||||||||
| Interest-bearing liabilities: | |||||||||||||||||||||||||||||||||||||||||||||||||||||
| Interest-bearing deposits: | |||||||||||||||||||||||||||||||||||||||||||||||||||||
| NOW accounts | $ | 720,572 | 4,275 | 0.59 | % | $ | 598,267 | 853 | 0.14 | % | $ | 502,189 | 493 | 0.10 | % | ||||||||||||||||||||||||||||||||||||||
| Savings accounts | 1,439,293 | 27,974 | 1.94 | % | 882,881 | 2,228 | 0.25 | % | 793,141 | 950 | 0.12 | % | |||||||||||||||||||||||||||||||||||||||||
| Money market accounts | 2,205,430 | 58,153 | 2.64 | % | 2,387,670 | 15,392 | 0.64 | % | 2,288,740 | 6,214 | 0.27 | % | |||||||||||||||||||||||||||||||||||||||||
| Certificate of deposit accounts | 1,428,727 | 44,122 | 3.09 | % | 998,580 | 8,210 | 0.82 | % | 1,210,451 | 11,758 | 0.97 | % | |||||||||||||||||||||||||||||||||||||||||
| Brokered deposit accounts | 819,419 | 41,141 | 5.02 | % | 146,038 | 2,909 | 1.99 | % | 338,734 | 1,298 | 0.38 | % | |||||||||||||||||||||||||||||||||||||||||
Total interest-bearing deposits (3) | 6,613,441 | 175,665 | 2.66 | % | 5,013,436 | 29,592 | 0.59 | % | 5,133,255 | 20,713 | 0.40 | % | |||||||||||||||||||||||||||||||||||||||||
| Advances from the FHLB | 1,092,996 | 52,467 | 4.73 | % | 340,569 | 9,355 | 2.71 | % | 232,175 | 3,302 | 1.40 | % | |||||||||||||||||||||||||||||||||||||||||
| Subordinated debentures and notes | 84,116 | 5,476 | 6.51 | % | 83,971 | 5,133 | 6.11 | % | 83,821 | 4,967 | 5.93 | % | |||||||||||||||||||||||||||||||||||||||||
| Other borrowed funds | 124,793 | 3,968 | 3.18 | % | 118,383 | 1,335 | 1.13 | % | 88,818 | 174 | 0.20 | % | |||||||||||||||||||||||||||||||||||||||||
| Total borrowed funds | 1,301,905 | 61,911 | 4.69 | % | 542,923 | 15,823 | 2.87 | % | 404,814 | 8,443 | 2.06 | % | |||||||||||||||||||||||||||||||||||||||||
| Total interest-bearing liabilities | 7,915,346 | 237,576 | 3.00 | % | 5,556,359 | 45,415 | 0.82 | % | 5,538,069 | 29,156 | 0.53 | % | |||||||||||||||||||||||||||||||||||||||||
| Non-interest-bearing liabilities: | |||||||||||||||||||||||||||||||||||||||||||||||||||||
Non-interest-bearing demand checking accounts (3) | 1,823,759 | 1,879,620 | 1,787,959 | ||||||||||||||||||||||||||||||||||||||||||||||||||
| Other non-interest-bearing liabilities | 307,160 | 203,187 | 224,634 | ||||||||||||||||||||||||||||||||||||||||||||||||||
| Total liabilities | 10,046,265 | 7,639,166 | 7,550,662 | ||||||||||||||||||||||||||||||||||||||||||||||||||
| Stockholders' equity | 1,168,106 | 984,237 | 967,538 | ||||||||||||||||||||||||||||||||||||||||||||||||||
| Total liabilities and equity | $ | 11,214,371 | $ | 8,623,403 | $ | 8,518,200 | |||||||||||||||||||||||||||||||||||||||||||||||
Net interest income (tax-equivalent basis) / Interest-rate spread (4) | 340,188 | 2.50 | % | 299,980 | 3.40 | % | 282,592 | 3.32 | % | ||||||||||||||||||||||||||||||||||||||||||||
| Less adjustment of tax-exempt income | 477 | 209 | 219 | ||||||||||||||||||||||||||||||||||||||||||||||||||
| Net interest income | $ | 339,711 | $ | 299,771 | $ | 282,373 | |||||||||||||||||||||||||||||||||||||||||||||||
Net interest margin (5) | 3.24 | % | 3.67 | % | 3.49 | % | |||||||||||||||||||||||||||||||||||||||||||||||
_________________________________________________________________________
(1) Tax-exempt income on debt securities, equity securities and industrial revenue bonds are included in commercial real estate loans on a tax-equivalent basis.
(2) Loans on nonaccrual status are included in the average balances.
(3) Including non-interest-bearing checking accounts, the average interest rate on total deposits was 2.08%, 0.43% and 0.30% in the years ended December 31, 2023, 2022 and 2021, respectively.
(4) Interest-rate spread represents the difference between the yield on interest-earning assets and the cost of interest-bearing liabilities.
(5) Net interest margin represents net interest income (tax equivalent basis) divided by average interest-earning assets.
See "Comparison of Years Ended December 31, 2023 and December 31, 2022" and "Comparison of Years Ended December 31, 2022 and December 31, 2021" below for a discussion of average assets and liabilities, net interest income, interest-rate spread and net interest margin.
55
Rate/Volume Analysis
The following table presents, on a tax-equivalent basis, the extent to which changes in interest rates and changes in volume of interest-earning assets and interest-bearing liabilities have affected the Company's interest income and interest expense during the periods indicated. Information is provided in each category with respect to: (i) changes attributable to changes in volume (changes in volume multiplied by prior rate), (ii) changes attributable to changes in rate (changes in rate multiplied by prior volume), and (iii) the net change. The changes attributable to the combined impact of volume and rate have been allocated proportionately to the changes due to volume and the changes due to rate.
| Year Ended December 31, 2023 Compared to Year Ended December 31, 2022 | Year Ended December 31, 2022 Compared to Year Ended December 31, 2021 | ||||||||||||||||||||||||||||||||||
| Increase (Decrease) Due To | Increase (Decrease) Due To | ||||||||||||||||||||||||||||||||||
| Volume | Rate | Net Change | Volume | Rate | Net Change | ||||||||||||||||||||||||||||||
| (In Thousands) | |||||||||||||||||||||||||||||||||||
| Interest and dividend income: | |||||||||||||||||||||||||||||||||||
| Investments: | |||||||||||||||||||||||||||||||||||
| Debt securities | $ | 5,497 | $ | 11,315 | $ | 16,812 | $ | (385) | $ | 1,286 | $ | 901 | |||||||||||||||||||||||
| Marketable and restricted equity securities | 2,423 | 1,251 | 3,674 | 101 | 625 | 726 | |||||||||||||||||||||||||||||
| Short-term investments | 1,081 | 5,808 | 6,889 | (203) | 1,391 | 1,188 | |||||||||||||||||||||||||||||
| Total investments | 9,001 | 18,374 | 27,375 | (487) | 3,302 | 2,815 | |||||||||||||||||||||||||||||
| Loans and leases: | |||||||||||||||||||||||||||||||||||
| Commercial real estate loans | 67,228 | 67,613 | 134,841 | 14,740 | 18,620 | 33,360 | |||||||||||||||||||||||||||||
| Commercial loans and leases | 9,708 | 15,297 | 25,005 | (12,629) | (913) | (13,542) | |||||||||||||||||||||||||||||
| Equipment financing | 8,952 | 7,393 | 16,345 | 4,410 | (549) | 3,861 | |||||||||||||||||||||||||||||
| Consumer loans | 11,098 | 17,705 | 28,803 | 1,454 | 5,699 | 7,153 | |||||||||||||||||||||||||||||
| Total loans | 96,986 | 108,008 | 204,994 | 7,975 | 22,857 | 30,832 | |||||||||||||||||||||||||||||
| Total change in interest and dividend income | 105,987 | 126,382 | 232,369 | 7,488 | 26,159 | 33,647 | |||||||||||||||||||||||||||||
| Interest expense: | |||||||||||||||||||||||||||||||||||
| Deposits: | |||||||||||||||||||||||||||||||||||
| NOW accounts | 205 | 3,217 | 3,422 | 116 | 244 | 360 | |||||||||||||||||||||||||||||
| Savings accounts | 2,196 | 23,550 | 25,746 | 121 | 1,157 | 1,278 | |||||||||||||||||||||||||||||
| Money market accounts | (1,258) | 44,019 | 42,761 | 281 | 8,897 | 9,178 | |||||||||||||||||||||||||||||
| Certificate of deposit accounts | 4,836 | 31,076 | 35,912 | (1,884) | (1,664) | (3,548) | |||||||||||||||||||||||||||||
| Brokered deposit accounts | 28,741 | 9,491 | 38,232 | (1,100) | 2,711 | 1,611 | |||||||||||||||||||||||||||||
| Total deposits | 34,720 | 111,353 | 146,073 | (2,466) | 11,345 | 8,879 | |||||||||||||||||||||||||||||
| Borrowed funds: | |||||||||||||||||||||||||||||||||||
| Advances from the FHLB | 32,236 | 10,876 | 43,112 | 2,015 | 4,038 | 6,053 | |||||||||||||||||||||||||||||
| Subordinated debentures and notes | 9 | 334 | 343 | 9 | 157 | 166 | |||||||||||||||||||||||||||||
| Other borrowed funds | 76 | 2,557 | 2,633 | 78 | 1,083 | 1,161 | |||||||||||||||||||||||||||||
| Total borrowed funds | 32,321 | 13,767 | 46,088 | 2,102 | 5,278 | 7,380 | |||||||||||||||||||||||||||||
| Total change in interest expense | 67,041 | 125,120 | 192,161 | (364) | 16,623 | 16,259 | |||||||||||||||||||||||||||||
| Change in tax-exempt income | 268 | — | 268 | (10) | — | (10) | |||||||||||||||||||||||||||||
| Change in net interest income | $ | 38,678 | $ | 1,262 | $ | 39,940 | $ | 7,862 | $ | 9,536 | $ | 17,398 | |||||||||||||||||||||||
See "Comparison of Years Ended December 31, 2023 and December 31, 2022" and "Comparison of Years Ended December 31, 2022 and December 31, 2021" below for a discussion of changes in interest income, interest-rate spread and net interest margin resulting from changes in rates and volumes.
56
Comparison of Years Ended December 31, 2023 and December 31, 2022
Net Interest Income
Net interest income increased $39.9 million to $339.7 million for the year ended December 31, 2023 from $299.8 million for the year ended December 31, 2022. The increase year over year reflects a $205.0 million increase in interest income on loans and leases, along with a $27.1 million increase in interest income on debt securities, short term investments and restricted equity securities, offset by a $192.2 million increase in interest expense on deposits and borrowings, which is reflective of the increase in volume and rising interest rate environment.
Net interest margin decreased by 43 basis points to 3.24% in 2023 from 3.67% in 2022. The Company's weighted average interest rate on loans (prior to purchase accounting adjustments) increased to 5.72% for the year ended December 31, 2023 from 4.49% for the year ended December 31, 2022.
The yield on interest-earning assets increased to 5.50% for the year ended December 31, 2023 from 4.22% for the year ended December 31, 2022. The increase is the result of higher yields on loans and leases and investments. The Company recorded $2.9 million in prepayment penalties and late charges, which contributed 3 basis points to yields on interest-earning assets for the year ended December 31, 2023 compared to $4.8 million, or 6 basis points, for the year ended December 31, 2022.
The cost of funds increased 218 basis points to 3.00% for the year ended December 31, 2023 from 0.82% for the year ended December 31, 2022. Refer to "Financial Condition - Borrowed Funds" above for more details.
Management seeks to position the balance sheet to be neutral to assets sensitive changes in interest rates. From 2017 through 2019, short term interest rates rose while at the same time net interest income, net interest spread, and net interest margin also increased. During 2020, interest rates declined sharply in response to the economic impact of the COVID-19 pandemic, and began to increase in the first quarter of 2022. In recent months, the Treasury yield curve has inverted and flattened at the long end. Short term rates have risen sharply due to multiple rate hikes implemented by the FRB. The shape of the curve indicates rates will begin to decline within a year and flatten around the 7-year mark. The short term increase in rates positively affected the Company's net interest income, net interest spread, and net interest margin initially. As is expected in the near term, the net interest margin is compressing as deposit pricing "catches up" and investable funds migrate among depository and non-depository categories. Management expects this to persist for a quarter or two after the FRB stops increasing rates, after which time net interest margin is expected to stabilize and then increase as loans continue to reprice into the higher rate environment. To the extent that the FRB cuts rates in the near term, net interest income and net interest margin will be highly dependent on the ability to move deposit pricing down in the same magnitude of the cuts to achieve margin expansion.
Interest Income—Loans and Leases
| Year Ended December 31, | Dollar Change | Percent Change | |||||||||||||||||||||
| 2023 | 2022 | ||||||||||||||||||||||
| (Dollars in Thousands) | |||||||||||||||||||||||
| Interest income—loans and leases: | |||||||||||||||||||||||
| Commercial real estate loans | $ | 307,652 | $ | 172,811 | $ | 134,841 | 78.0 | % | |||||||||||||||
| Commercial loans | 58,878 | 33,896 | 24,982 | 73.7 | % | ||||||||||||||||||
| Equipment financing | 92,112 | 75,767 | 16,345 | 21.6 | % | ||||||||||||||||||
| Residential mortgage loans | 46,350 | 29,726 | 16,624 | 55.9 | % | ||||||||||||||||||
| Other consumer loans | 28,747 | 16,569 | 12,178 | 73.5 | % | ||||||||||||||||||
| Total interest income—loans and leases | $ | 533,739 | $ | 328,769 | $ | 204,970 | 62.3 | % | |||||||||||||||
Interest income from loans and leases was $533.7 million for 2023, and represented a yield on total loans of 5.72%. This compares to $328.8 million of interest on loans and leases and a yield of 4.49% for 2022. The $205.0 million increase in interest income from loans and leases was driven by the acquisition of PCSB Bank, along with an increase of $97.0 million in origination volume, and an increase of $108.0 million in interest rates changes.
57
Interest Income—Investments
| Year Ended December 31, | Dollar Change | Percent Change | |||||||||||||||||||||
| 2023 | 2022 | ||||||||||||||||||||||
| (Dollars in Thousands) | |||||||||||||||||||||||
| Interest income—investments: | |||||||||||||||||||||||
| Debt securities | $ | 29,648 | $ | 13,079 | $ | 16,569 | 126.7 | % | |||||||||||||||
| Marketable and restricted equity securities | 5,571 | 1,898 | 3,673 | 193.5 | % | ||||||||||||||||||
| Short-term investments | 8,329 | 1,440 | 6,889 | 478.4 | % | ||||||||||||||||||
| Total interest income—investments | $ | 43,548 | $ | 16,417 | $ | 27,131 | 165.3 | % | |||||||||||||||
Total investment income was $43.5 million for the year ended December 31, 2023 compared to $16.4 million for the year ended December 31, 2022. As of December 31, 2023, the yield on total investments was 3.72% compared to 1.94% as of December 31, 2022. This year over year increase in total investment income of $27.1 million, or 165.3%, was driven by a $18.4 million increase due to rates and a $9.0 million increase due to volume.
Interest Expense—Deposits and Borrowed Funds
| Year Ended December 31, | Dollar Change | Percent Change | |||||||||||||||||||||
| 2023 | 2022 | ||||||||||||||||||||||
| (Dollars in Thousands) | |||||||||||||||||||||||
| Interest expense: | |||||||||||||||||||||||
| Deposits: | |||||||||||||||||||||||
| NOW accounts | $ | 4,275 | $ | 853 | $ | 3,422 | 401.2 | % | |||||||||||||||
| Savings accounts | 27,974 | 2,228 | 25,746 | 1155.6 | % | ||||||||||||||||||
| Money market accounts | 58,153 | 15,392 | 42,761 | 277.8 | % | ||||||||||||||||||
| Certificate of deposit accounts | 44,122 | 8,210 | 35,912 | 437.4 | % | ||||||||||||||||||
| Brokered deposit accounts | 41,141 | 2,909 | 38,232 | 1,314.3 | % | ||||||||||||||||||
| Total interest expense—deposits | 175,665 | 29,592 | 146,073 | 493.6 | % | ||||||||||||||||||
| Borrowed funds: | |||||||||||||||||||||||
| Advances from the FHLB | 52,467 | 9,355 | 43,112 | 460.8 | % | ||||||||||||||||||
| Subordinated debentures and notes | 5,476 | 5,133 | 343 | 6.7 | % | ||||||||||||||||||
| Other borrowed funds | 3,968 | 1,335 | 2,633 | 197.2 | % | ||||||||||||||||||
| Total interest expense—borrowed funds | 61,911 | 15,823 | 46,088 | 291.3 | % | ||||||||||||||||||
| Total interest expense | $ | 237,576 | $ | 45,415 | $ | 192,161 | 423.1 | % | |||||||||||||||
Deposits
In 2023, interest paid on deposits increased $146.1 million, or 493.6%, compared to 2022. The increase in interest expense on deposits was driven by an increase of $111.4 million due to higher interest rates and an increase of $34.7 million primarily driven by the growth in volume of average brokered deposits and certificate of deposit balances. For the year ended December 31, 2023, purchase accounting amortization was $1.3 million on acquired deposits and one basis point. The Company did not record any purchase accounting amortization in 2022.
Borrowed Funds
As of December 31, 2023, the Company's borrowed funds include $1.2 billion in FHLB borrowings, $84.2 million in subordinated debentures and notes, and $69.3 million in other borrowed funds. In 2023, the average balance of FHLB borrowings increased $752.4 million, or 220.9%, the average balance of other borrowed funds, which includes repurchase agreements and other borrowings, increased $6.4 million, or 5.4%, and the average balance of subordinated debentures and notes increased $145.0 thousand, or 0.2%, for the year ended December 31, 2023.
For the year ended December 31, 2023, interest paid on borrowed funds increased $46.1 million, or 291.3% year over year. The cost of borrowed funds increased to 4.69% for the year ended December 31, 2023 from 2.87% for the year ended December 31, 2022. The increase in interest expense was driven by an increase of $32.3 million due to volume and an increase of $13.8 million due to borrowing rates. For the year ended December 31, 2023, purchase accounting amortization was $0.3
58
million on acquired borrowed funds compared to amortization of $0.1 million for the year ended December 31, 2022. Purchase accounting amortization had no impact on the Company's net interest margin.
Provision for Credit Losses
The provisions for credit losses are set forth below:
| Year Ended December 31, | ||||||||||||||
| 2023 | 2022 | |||||||||||||
| (In Thousands) | ||||||||||||||
| Provision (credit) for credit losses: | ||||||||||||||
| Commercial real estate | $ | 14,328 | $ | (1,046) | ||||||||||
| Commercial | 21,537 | 2,892 | ||||||||||||
| Consumer | 2,838 | 872 | ||||||||||||
| Total provision (credit) for loan and lease losses | 38,703 | 2,718 | ||||||||||||
| Unfunded credit commitments | (835) | 5,807 | ||||||||||||
| Investment securities available-for-sale | 339 | 102 | ||||||||||||
| Total provision (credit) for credit losses | $ | 38,207 | $ | 8,627 | ||||||||||
For the year ended December 31, 2023, the provision for credit losses increased $29.6 million to $38.2 million from $8.6 million for the year ended December 31, 2022. This increase in the provision for 2023 is largely driven by a $16 million increase in acquired loans as a result of the PCSB acquisition.
See management’s discussion of “Financial Condition — Allowance for Loan and Lease Losses” and Note 7, “Allowance for Credit Losses,” to the audited consolidated financial statements for a description of how management determined the allowance for loan and lease losses for each portfolio and class of loans.
Non-Interest Income
The following table sets forth the components of non-interest income:
| Year Ended December 31, | Dollar Change | Percent Change | |||||||||||||||||||||
| 2023 | 2022 | ||||||||||||||||||||||
| (Dollars in Thousands) | |||||||||||||||||||||||
| Deposit fees | $ | 11,611 | $ | 10,919 | $ | 692 | 6.3 | % | |||||||||||||||
| Loan fees | 2,036 | 2,208 | (172) | (7.8) | % | ||||||||||||||||||
| Loan level derivative income, net | 3,890 | 4,246 | (356) | (8.4) | % | ||||||||||||||||||
| Gain (loss) on sales of investment securities, net | 1,704 | 321 | 1,383 | 430.8 | % | ||||||||||||||||||
| Gain on sales of loans and leases | 2,581 | 4,136 | (1,555) | (37.6) | % | ||||||||||||||||||
| Other | 10,112 | 6,517 | 3,595 | 55.2 | % | ||||||||||||||||||
| Total non-interest income | $ | 31,934 | $ | 28,347 | $ | 3,587 | 12.7 | % | |||||||||||||||
For the year ended December 31, 2023, non-interest income increased $3.6 million, or 12.7%, to $31.9 million compared to $28.3 million for the same period in 2022. The increase was primarily driven by increases of $3.6 million in other income and $1.4 million in gain on sales of investment securities, net, partially offset by a decrease of $1.6 million in gain on sales of loans and leases.
Other income increased $3.6 million, or 55.2%, to $10.1 million for the year ended December 31, 2023 from $6.5 million for the same period in 2022, primarily driven by higher gain on interest rate derivatives, BOLI income, and wealth management income.
Gain on sales of loans and leases decreased $1.6 million, or 37.6%, to $2.6 million for the year ended December 31, 2023 from $4.1 million for the same period in 2022, primarily driven by a decrease in loan participations in 2023.
59
For the year ended December 31, 2023, gain on sales of investment securities increased $1.4 million, or 430.8%, to $1.7 million, compared to a gain of $0.3 million for the same period in 2022, primarily driven by a $1.7 million gain on sales of investments from the repositioning of the PCSB portfolio.
Non-Interest Expense
The following table sets forth the components of non-interest expense:
| Year Ended December 31, | Dollar Change | Percent Change | |||||||||||||||||||||
| 2023 | 2022 | ||||||||||||||||||||||
| (Dollars in Thousands) | |||||||||||||||||||||||
| Compensation and employee benefits | $ | 138,895 | $ | 113,487 | $ | 25,408 | 22.4 | % | |||||||||||||||
| Occupancy | 20,203 | 16,002 | 4,201 | 26.3 | % | ||||||||||||||||||
| Equipment and data processing | 27,004 | 20,833 | 6,171 | 29.6 | % | ||||||||||||||||||
| Professional services | 7,226 | 5,060 | 2,166 | 42.8 | % | ||||||||||||||||||
| FDIC insurance | 7,844 | 3,177 | 4,667 | 146.9 | % | ||||||||||||||||||
| Advertising and marketing | 4,724 | 4,980 | (256) | (5.1) | % | ||||||||||||||||||
| Amortization of identified intangible assets | 7,840 | 494 | 7,346 | 1487.0 | % | ||||||||||||||||||
| Merger and acquisition expense | 7,411 | 2,249 | 5,162 | 229.5 | % | ||||||||||||||||||
| Other | 18,377 | 13,260 | 5,117 | 38.6 | % | ||||||||||||||||||
| Total non-interest expense | $ | 239,524 | $ | 179,542 | $ | 59,982 | 33.4 | % | |||||||||||||||
For the year ended December 31, 2023, non-interest expense increased $60.0 million, or 33.4%, to $239.5 million compared to $179.5 million for the same period in 2022. The increase was primarily driven by increases of $25.4 million in compensation and employee benefits, $7.3 million in amortization of identified intangible assets, $6.2 million in equipment and data processing, $5.2 million in merger and acquisition expense, $5.1 million in other expense, $4.7 million in FDIC insurance, $4.2 million in occupancy, and $2.2 million in professional services.
The efficiency ratio increased to 64.45% for the year ended December 31, 2023 from 54.72% for the same period in 2022. The increase year over year was primarily driven by higher non-interest expense, partially offset by higher net interest income and non-interest income in 2023.
Compensation and employee benefits expense increased $25.4 million, or 22.4%, to $138.9 million for the year ended December 31, 2023 from $113.5 million for the same period in 2022. The increase was primarily driven by an increase in employee headcount, predominantly from the PCSB acquisition, driving increases in salaries, retirement plan and health care benefits, partially offset by a decrease in incentive/bonus.
Amortization of identified intangible assets expense increased $7.3 million to $7.8 million for the year ended December 31, 2023 from $0.5 million for the same period in 2022. The increase in 2023 was primarily driven by intangible core deposit valuation for the PCSB acquisition.
Equipment and data processing expense increased $6.2 million, or 29.6%, to $27.0 million for the year ended December 31, 2023 from $20.8 million for the same period in 2022. The increase was primarily driven by higher software expenses.
Merger and acquisition expense increased $5.2 million to $7.4 million for the year ended December 31, 2023 from $2.2 million for the same period in 2022. The increase was driven by merger-related expenses related to the PCSB acquisition.
Other expense increased $5.1 million, or 38.6%, to $18.4 million for the year ended December 31, 2023 from $13.3 million for the same period in 2022. The increase was primarily driven by lower deferred loan expenses, higher directors' fees and higher miscellaneous expenses.
60
Provision for Income Taxes
| Year Ended December 31, | Dollar Change | Percent Change | |||||||||||||||||||||
| 2023 | 2022 | ||||||||||||||||||||||
| (Dollars in Thousands) | |||||||||||||||||||||||
| Income before provision for income taxes | $ | 93,914 | $ | 139,949 | $ | (46,035) | (32.9) | % | |||||||||||||||
| Provision for income taxes | 18,915 | 30,205 | (11,290) | (37.4) | % | ||||||||||||||||||
| Net income, | $ | 74,999 | $ | 109,744 | $ | (34,745) | (31.7) | % | |||||||||||||||
| Effective tax rate | 20.1 | % | 21.6 | % | N/A | (6.9) | % | ||||||||||||||||
The Company recorded income tax expense of $18.9 million for 2023, compared to $30.2 million for 2022. This represents an effective tax rate of 20.1% and 21.6% for 2023 and 2022, respectively. The decrease in the Company's effective tax rate is due to continued participation in energy tax credit investments, and increased benefits in the Company's investments in affordable housing projects.
Comparison of Years Ended December 31, 2022 and December 31, 2021
Net Interest Income
Net interest income increased $17.4 million to $299.8 million for the year ended December 31, 2022 from $282.4 million for the year ended December 31, 2021. The increase year over year reflects a $30.8 million increase in interest income on loans and leases, along with a $2.8 million increase in interest income on investment securities and short term investments, offset by a $16.3 million increase in interest expense on deposit and borrowings, which is reflective of the rising interest rate environment.
Net interest margin increased by 18 basis points to 3.67% in 2022 from 3.49% in 2021. Excluding the Paycheck Protection Program ("PPP") loans, net interest margin increased by 31 basis points to 3.65% in 2022 from 3.34% in 2021. The Company's weighted average interest rate on loans (prior to purchase accounting adjustments) increased to 4.49% for the year ended December 31, 2022 from 4.19% for the year ended December 31, 2021.
The yield on interest-earning assets increased to 4.22% for the year ended December 31, 2022 from 3.85% for the year ended December 31, 2021. This increase is the result of higher yields on loans and leases and investments, partially offset by lower fee income from PPP loans. The Company recorded $4.8 million in prepayment penalties and late charges, which contributed 6 basis points to yields on interest-earning assets for the year ended December 31, 2022 compared to $5.9 million, or 7 basis points, for the year ended December 31, 2021.
The overall cost of funds (including non-interest-bearing demand checking accounts) increased 29 basis points to 0.82% for the year ended December 31, 2022 from 0.53% for the year ended December 31, 2021. Refer to "Financial Condition - Borrowed Funds" above for more details.
Management seeks to position the balance sheet to be neutral to assets sensitive to changes in interest rates. From 2017 through 2019, short term interest rates rose while at the same time net interest income, net interest spread, and net interest margin also increased. During 2020, interest rates declined sharply in response to the economic impact of the COVID-19 pandemic, and started to rise in the first quarter of 2022. In recent months, the yield curve has begun to invert and flatten on the long end. Short term rates are continuing to rise due to multiple rate hikes imposed by the FRB. The shape of the curve indicates rates will begin to fall within a year and flatten around the 7-year mark. This type of curve positively effects the Company’s net interest income, net interest spread, and net interest margin in the short term but will have a negative effect in the long term. Due to, among other things, ongoing pricing pressures in the loan and deposit portfolios, net interest income may also be negatively affected by changes in the amount of accretion on acquired loans and leases, deposits and borrowed funds, which is included in interest income and interest expense, respectively.
61
Interest Income—Loans and Leases
| Year Ended December 31, | Dollar Change | Percent Change | |||||||||||||||||||||
| 2022 | 2021 | ||||||||||||||||||||||
| (Dollars in Thousands) | |||||||||||||||||||||||
| Interest income—loans and leases: | |||||||||||||||||||||||
| Commercial real estate loans | $ | 172,811 | $ | 139,451 | $ | 33,360 | 23.9 | % | |||||||||||||||
| Commercial loans | 33,896 | 47,426 | (13,530) | (28.5) | % | ||||||||||||||||||
| Equipment financing | 75,767 | 71,906 | 3,861 | 5.4 | % | ||||||||||||||||||
| Residential mortgage loans | 29,726 | 27,933 | 1,793 | 6.4 | % | ||||||||||||||||||
| Other consumer loans | 16,569 | 11,211 | 5,358 | 47.8 | % | ||||||||||||||||||
| Total interest income—loans and leases | $ | 328,769 | $ | 297,927 | $ | 30,842 | 10.4 | % | |||||||||||||||
Interest income from loans and leases was $328.8 million for 2022, and represented a yield on total loans of 4.49%. This compares to $297.9 million of interest on loans and leases and a yield of 4.19% for 2021. The $30.8 million increase in interest income from loans and leases was primarily due to an increase of $8.0 million in origination volume, and an increase of $22.8 million related to interest rates changes.
Interest Income—Investments
| Year Ended December 31, | Dollar Change | Percent Change | |||||||||||||||||||||
| 2022 | 2021 | ||||||||||||||||||||||
| (Dollars in Thousands) | |||||||||||||||||||||||
| Interest income—investments: | |||||||||||||||||||||||
| Debt securities | $ | 13,079 | $ | 12,178 | $ | 901 | 7.4 | % | |||||||||||||||
| Marketable and restricted equity securities | 1,898 | 1,172 | 726 | 61.9 | % | ||||||||||||||||||
| Short-term investments | 1,440 | 252 | 1,188 | 471.4 | % | ||||||||||||||||||
| Total interest income—investments | $ | 16,417 | $ | 13,602 | $ | 2,815 | 20.7 | % | |||||||||||||||
Total investment income was $16.4 million for the year ended December 31, 2022 compared to $13.6 million for the year ended December 31, 2021. As of December 31, 2022, the yield on total investments was 1.94% compared to 1.39% as of December 31, 2021. This year over year increase in total investment income of $2.8 million, or 20.7%, was driven by a $3.3 million increase due to rates and a $0.5 million decrease due to volume.
62
Interest Expense—Deposits and Borrowed Funds
| Year Ended December 31, | Dollar Change | Percent Change | |||||||||||||||||||||
| 2022 | 2021 | ||||||||||||||||||||||
| (Dollars in Thousands) | |||||||||||||||||||||||
| Interest expense: | |||||||||||||||||||||||
| Deposits: | |||||||||||||||||||||||
| NOW accounts | $ | 853 | $ | 493 | $ | 360 | 73.0 | % | |||||||||||||||
| Savings accounts | 2,228 | 950 | 1,278 | 134.5 | % | ||||||||||||||||||
| Money market accounts | 15,392 | 6,214 | 9,178 | 147.7 | % | ||||||||||||||||||
| Certificate of deposit accounts | 8,210 | 11,758 | (3,548) | (30.2) | % | ||||||||||||||||||
| Brokered deposit accounts | 2,909 | 1,298 | 1,611 | 124.1 | % | ||||||||||||||||||
| Total interest expense—deposits | 29,592 | 20,713 | 8,879 | 42.9 | % | ||||||||||||||||||
| Borrowed funds: | |||||||||||||||||||||||
| Advances from the FHLBB | 9,355 | 3,302 | 6,053 | 183.3 | % | ||||||||||||||||||
| Subordinated debentures and notes | 5,133 | 4,967 | 166 | 3.3 | % | ||||||||||||||||||
| Other borrowed funds | 1,335 | 174 | 1,161 | 667.2 | % | ||||||||||||||||||
| Total interest expense—borrowed funds | 15,823 | 8,443 | 7,380 | 87.4 | % | ||||||||||||||||||
| Total interest expense | $ | 45,415 | $ | 29,156 | $ | 16,259 | 55.8 | % | |||||||||||||||
Deposits
In 2022, interest paid on deposits increased $8.9 million, or 42.9%, compared to 2021. The increase in interest expense on deposits was driven by an increase of $11.3 million due to higher interest rates, offset by a decrease of $2.5 million primarily driven by the decline in volume of average certificate of deposit and brokered deposit balances.
Borrowed Funds
As of December 31, 2022, the Company's borrowed funds include: $1.2 billion in FHLBB advances, $110.8 million in other borrowed funds, and $84.0 million in subordinated debentures and notes. In 2022, the average balance of FHLBB advances increased $108.4 million, or 46.7%, the average balance of other borrowed funds, which includes repurchase agreements and other borrowings, increased $29.6 million, or 33.3%, and the average balance of subordinated debentures and notes increased $0.2 million, or 0.2%, for the year ended December 31, 2022.
For the year ended December 31, 2022, interest paid on borrowed funds increased $7.4 million, or 87.4% year over year. The cost of borrowed funds increased to 2.87% for the year ended December 31, 2022 from 2.06% for the year ended December 31, 2021. The increase in interest expense was driven by an increase of $5.3 million due to borrowing rates and an increase of $2.1 million due to volume. For the year ended December 31, 2022, purchase accounting accretion was $47.0 thousand on acquired borrowed funds compared to accretion of $51.0 thousand for the year ended December 31, 2021. Purchase accounting accretion had no impact on the Company's net interest margin.
63
Provision for Credit Losses
The provisions for credit losses are set forth below:
| Year Ended December 31, | ||||||||||||||
| 2022 | 2021 | |||||||||||||
| (In Thousands) | ||||||||||||||
| Provision (credit) for loan and lease losses: | ||||||||||||||
| Commercial real estate | $ | (1,046) | $ | (10,903) | ||||||||||
| Commercial | 2,892 | 3,480 | ||||||||||||
| Consumer | 872 | (2,138) | ||||||||||||
| Total provision (credit) for loan and lease losses | 2,718 | (9,561) | ||||||||||||
| Unfunded credit commitments | 5,807 | 1,724 | ||||||||||||
| Investment securities available-for-sale | $ | 102 | $ | — | ||||||||||
| Total provision (credit) for credit losses | $ | 8,627 | $ | (7,837) | ||||||||||
For the year ended December 31, 2022, the provision for credit losses increased $16.4 million to $8.6 million from a credit of $7.8 million for the year ended December 31, 2021. This increase in the provision for 2022 is primarily related to loan growth and projected economic forecasts.
See management’s discussion of “Financial Condition — Allowance for Loan and Lease Losses” and Note 7, “Allowance for Credit Losses,” to the audited consolidated financial statements for a description of how management determined the allowance for loan and lease losses for each portfolio and class of loans.
Non-Interest Income
The following table sets forth the components of non-interest income:
| Year Ended December 31, | Dollar Change | Percent Change | |||||||||||||||||||||
| 2022 | 2021 | ||||||||||||||||||||||
| (Dollars in Thousands) | |||||||||||||||||||||||
| Deposit fees | $ | 10,919 | $ | 10,578 | $ | 341 | 3.2 | % | |||||||||||||||
| Loan fees | 2,208 | 2,095 | 113 | 5.4 | % | ||||||||||||||||||
| Loan level derivative income, net | 4,246 | 4,680 | (434) | (9.3) | % | ||||||||||||||||||
| Gain (loss) on sales of investment securities, net | 321 | (38) | 359 | (944.7) | % | ||||||||||||||||||
| Gain on sales of loans and leases | 4,136 | 3,737 | 399 | 10.7 | % | ||||||||||||||||||
| Other | 6,517 | 5,937 | 580 | 9.8 | % | ||||||||||||||||||
| Total non-interest income | $ | 28,347 | $ | 26,989 | $ | 1,358 | 5.0 | % | |||||||||||||||
For the year ended December 31, 2022, non-interest income increased $1.4 million, or 5.0%, to $28.3 million compared to $27.0 million for the same period in 2021. The increase was primarily driven by increases of $0.6 million in other income, $0.4 million in gain on sales of loans and leases, and $0.4 million in gain on sales of investment securities, partially offset by a decrease of $0.4 million in loan level derivative income, net.
Other income increased $0.6 million, or 9.8%, to $6.5 million for the year ended December 31, 2022 from $5.9 million for the same period in 2021, primarily driven by higher wealth management income, other income, commissions-insurance agency and rental income, partially offset by higher losses on interest rate derivatives, lower BOLI income, and higher losses on sale of fixed assets.
Gain on sales of loans and leases increased $0.4 million, or 10.7%, to $4.1 million for the year ended December 31, 2022 from $3.7 million for the same period in 2021, primarily driven by an increase in loan participations in 2022.
For the year ended December 31, 2022, gain on sales of investment securities increased $0.4 million, or 944.7%, to $0.3 million, compared to a loss of $38.0 thousand for the same period in 2021, primarily driven by a $6.1 million gain on sales of restricted equity securities, partially offset by a $5.8 million loss on sales of investments.
64
Non-Interest Expense
The following table sets forth the components of non-interest expense:
| Year Ended December 31, | Dollar Change | Percent Change | |||||||||||||||||||||
| 2022 | 2021 | ||||||||||||||||||||||
| (Dollars in Thousands) | |||||||||||||||||||||||
| Compensation and employee benefits | $ | 113,487 | $ | 106,786 | $ | 6,701 | 6.3 | % | |||||||||||||||
| Occupancy | 16,002 | 14,961 | 1,041 | 7.0 | % | ||||||||||||||||||
| Equipment and data processing | 20,833 | 18,322 | 2,511 | 13.7 | % | ||||||||||||||||||
| Professional services | 5,060 | 4,694 | 366 | 7.8 | % | ||||||||||||||||||
| FDIC insurance | 3,177 | 2,980 | 197 | 6.6 | % | ||||||||||||||||||
| Advertising and marketing | 4,980 | 4,167 | 813 | 19.5 | % | ||||||||||||||||||
| Amortization of identified intangible assets | 494 | 876 | (382) | (43.6) | % | ||||||||||||||||||
| Merger and acquisition expense | 2,249 | — | 2,249 | N/A | |||||||||||||||||||
| Other | 13,260 | 9,822 | 3,438 | 35.0 | % | ||||||||||||||||||
| Total non-interest expense | $ | 179,542 | $ | 162,608 | $ | 16,934 | 10.4 | % | |||||||||||||||
For the year ended December 31, 2022, non-interest expense increased $16.9 million, or 10.4%, to $179.5 million compared to $162.6 million for the same period in 2021. The increase was primarily driven by increases of $6.7 million in compensation and employee benefits, $3.4 million in other expense, $2.5 million in equipment and data processing, $2.2 million in merger and acquisition expense, $1.0 million in occupancy, $0.8 million in advertising and marketing, and $0.4 million in professional services, partially offset by a decrease of $0.4 million in amortization of identified intangible assets.
The efficiency ratio increased to 54.72% for the year ended December 31, 2022 from 52.56% for the same period in 2021. The increase year over year was primarily driven by higher non-interest expense, partially offset by higher net interest income and non-interest income in 2022.
Compensation and employee benefits expense increased $6.7 million, or 6.3%, to $113.5 million for the year ended December 31, 2022 from $106.8 million for the same period in 2021. The increase was primarily driven by increases in employee headcount and salaries and a decrease in salaries deferred costs, partially offset by a decrease in retirement plan benefits.
Equipment and data processing expense increased $2.5 million, or 13.7%, to $20.8 million for the year ended December 31, 2022 from $18.3 million for the same period in 2021. The increase was primarily driven by higher software licenses and subscription expenses, professional services-IT consulting expense, equipment depreciation expense, and ATM maintenance expense.
Merger and acquisition expense increased $2.2 million to $2.2 million for the year ended December 31, 2022. For the same period in 2021, the Company did not incur any merger-related expenses. The increase in 2022 was primarily driven by merger-related expenses related to the PCSB acquisition.
Other expense increased $3.4 million, or 35.0%, to $13.3 million for the year ended December 31, 2022 from $9.8 million for the same period in 2021. The increase was primarily driven by a gain of $2.2 million on the sale of other real estate owned property in 2021, and increases in travel and accommodations expense in 2022, partially offset by decreases in commissions paid to a third party for new leases in 2022.
65
Provision for Income Taxes
| Year Ended December 31, | Dollar Change | Percent Change | |||||||||||||||||||||
| 2022 | 2021 | ||||||||||||||||||||||
| (Dollars in Thousands) | |||||||||||||||||||||||
| Income before provision for income taxes | $ | 139,949 | $ | 154,591 | $ | (14,642) | (9.5) | % | |||||||||||||||
| Provision for income taxes | 30,205 | 39,151 | (8,946) | (22.8) | % | ||||||||||||||||||
| Net income, before non-controlling interest in subsidiary | $ | 109,744 | $ | 115,440 | $ | (5,696) | (4.9) | % | |||||||||||||||
| Effective tax rate | 21.6 | % | 25.3 | % | N/A | (14.6) | % | ||||||||||||||||
The Company recorded income tax expense of $30.2 million for 2022, compared to $39.2 million for 2021. This represents an effective tax rate of 21.6% and 25.3% for 2022 and 2021, respectively. The decrease in the Company's effective tax rate is reflective of the Company's participation in energy tax credit deals done during the third and fourth quarters of 2022.
Liquidity and Capital Resources
Liquidity
Liquidity is defined as the ability to meet current and future financial obligations of a short-term nature. The Company further defines liquidity as the ability to respond to the needs of depositors and borrowers, as well as to earnings enhancement opportunities, in a changing marketplace. Liquidity management is monitored by an Asset/Liability Committee ("ALCO"), consisting of members of management, which is responsible for establishing and monitoring liquidity targets as well as strategies and tactics to meet these targets.
The primary source of funds for the payment of dividends and expenses by the Company are dividends paid to it by the Banks. The primary sources of liquidity for the Banks consist of deposit inflows, loan repayments, borrowed funds, and maturing investment securities.
Deposits, which are considered the most stable source of liquidity, totaled $8.5 billion as of December 31, 2023 and represented 86.1% of total funding (the sum of total deposits and total borrowings), compared to deposits of $6.5 billion, or 82.0% of total funding, as of December 31, 2022. Core deposits, which consist of demand checking, NOW, savings and money market accounts, totaled $6.1 billion as of December 31, 2023 and represented 71.3% of total deposits, compared to core deposits of $5.3 billion, or 81.0% of total deposits, as of December 31, 2022. Additionally, the Company had $881.2 million of brokered deposits as of December 31, 2023, which represented 10.3% of total deposits, compared to $310.1 million or 4.8% of total deposits, as of December 31, 2022. The Company offers attractive interest rates based on market conditions to increase deposits balances, while managing cost of funds.
Borrowings are used to diversify the Company's funding mix and to support asset growth. When profitable lending and investment opportunities exist, access to borrowings provides a means to grow the balance sheet. Borrowings totaled $1.4 billion as of December 31, 2023, representing 13.9% of total funding, compared to $1.4 billion, or 18.0% of total funding, as of December 31, 2022.
As members of the FHLB of Boston and FHLB of New York, the Banks have access to both short- and long-term borrowings. The Company's remaining borrowing capacity from the FHLB of Boston and FHLB of New York for advances and repurchase agreements increased slightly to $1.3 billion as of December 31, 2023 from December 31, 2022, based on the level of qualifying collateral available for these borrowings.
As of December 31, 2023, the Banks also have access to funding through certain uncommitted lines via AFX as well as other large financial institution specific lines.
The Company has access to the FRB's "discount window" to supplement its liquidity. The Company has $273.0 million of borrowing capacity at the FRB as of December 31, 2023. As of December 31, 2023, the Company did not have any borrowings with the FRB outstanding. As of December 31, 2023, the Company had no borrowings outstanding with these committed and uncommitted lines.
Additionally, the Banks have access to liquidity through repurchase agreements and brokered deposits.
In general, the Company seeks to maintain a high degree of liquidity and targets cash, cash equivalents and investment securities available-for-sale balances of between 5% and 15% of total assets. As of December 31, 2023, cash, cash equivalents and investment securities available-for-sale totaled $1.0 billion, or 9.2% of total assets. This compares to $1.0 billion, or 11.3% of total assets as of December 31, 2022.
66
While management believes that the Company has adequate liquidity to meet its commitments, and to fund the Banks' lending and investment activities, the availabilities of these funding sources are subject to broad economic conditions and could be restricted in the future. Such restrictions would impact the Company's immediate liquidity and/or additional liquidity needs.
Capital Resources
As of December 31, 2023 and 2022, the Company and the Banks were under the primary regulation of and required to comply with the capital requirements of the FRB. At those dates, the Company and the Banks exceeded all regulatory capital requirements and the banks were considered "well-capitalized." See "Supervision and Regulation" in Item 1 and Note 19, "Regulatory Capital Requirements", for the Company's and the Banks' actual and required capital amounts and ratios.
Off-Balance-Sheet Arrangements
The Company is party to off-balance sheet financial instruments in the normal course of business to meet the financing needs of its customers and to reduce its own exposure to fluctuations in interest rates. These financial instruments include loan commitments, standby and commercial letters of credit and loan level derivatives. According to GAAP, these financial instruments are not recorded in the financial statements until they are funded or related fees are incurred or received. The effect of such activity on the Company's financial condition and results of operations, such as recorded liability for unfunded credit commitment, is immaterial. See Note 13, "Commitments and Contingencies," to the consolidated financial statements for a description of off-balance-sheet financial instruments.
Contractual Obligations
A summary of contractual obligations by the expected payment period for the date indicated follows.
| Payment Due by Period | |||||||||||||||||||||||||||||
| Less Than One Year | One to Three Years | More than Three Years to Five Years | Over Five Years | Total | |||||||||||||||||||||||||
| (In Thousands) | |||||||||||||||||||||||||||||
| At December 31, 2023: | |||||||||||||||||||||||||||||
| Advances from the FHLB | $ | 742,100 | $ | 474,436 | $ | 1,090 | $ | 5,716 | $ | 1,223,342 | |||||||||||||||||||
| Subordinated debentures and notes | — | — | — | 84,188 | 84,188 | ||||||||||||||||||||||||
| Other borrowed funds | 69,256 | — | — | — | 69,256 | ||||||||||||||||||||||||
Loan commitments (1) | 2,520,371 | — | — | — | 2,520,371 | ||||||||||||||||||||||||
Occupancy lease commitments (2) | 8,112 | 11,968 | 7,149 | 9,676 | 36,905 | ||||||||||||||||||||||||
Purchase obligations (3) | 27,900 | 19,751 | 7,323 | 68 | 55,042 | ||||||||||||||||||||||||
| Employee postretirement obligations | 1,462 | 3,532 | 3,863 | 23,034 | 31,891 | ||||||||||||||||||||||||
| $ | 3,369,201 | $ | 509,687 | $ | 19,425 | $ | 122,682 | $ | 4,020,995 | ||||||||||||||||||||
_______________________________________________________________________________
(1) These amounts represent commitments made by the Company to extend credit to borrowers as long as there is no violation of any condition established in the contract. Commitments generally have fixed expiration dates or other termination clauses. Since some of the commitments are expected to expire without being drawn upon, the total commitment amount does not necessarily represent future cash requirements.
(2) The Company leases certain office space under various noncancellable operating leases. These leases have terms ranging from 1 year to over 20 years. Certain leases contain renewal options and escalation clauses for real estate taxes and other expenditures which can increase rental expenses based principally on the consumer price index and fair market rental value provisions.
(3) Purchase obligations represent agreements to purchase goods or services that are enforceable and legally binding and specify all significant terms.
67
Item 7A. Quantitative and Qualitative Disclosures about Market Risk
Market Risk
Market risk is the risk that the market value or estimated fair value of the Company's assets, liabilities, and derivative financial instruments will decline as a result of changes in interest rates or financial market volatility, or that the Company's net income will be significantly reduced by interest-rate changes.
Interest-Rate Risk
The principal market risk facing the Company is interest-rate risk, which can occur in a variety of forms, including repricing risk, yield-curve risk, basis risk, and prepayment risk. Repricing risk occurs when the change in the average yield of either interest-earning assets or interest-bearing liabilities is more sensitive than the other to changes in market interest rates. Such a change in sensitivity could reflect a number of possible mismatches in the repricing opportunities of the Company's assets and liabilities. Yield-curve risk reflects the possibility that changes in the shape of the yield curve could have different effects on the Company's assets and liabilities. Basis risk occurs when different parts of the balance sheet are subject to varying base rates reflecting the possibility that the spread from those base rates will deviate. Prepayment risk is associated with financial instruments with an option to prepay before the stated maturity, often a disadvantage to person selling the option; this risk is most often associated with the prepayment of loans, callable investments, and callable borrowings.
Asset/Liability Management
Market risk and interest-rate risk management is governed by the Company's Asset/Liability Committee ("ALCO"). The ALCO establishes exposure limits that define the Company's tolerance for interest-rate risk. The ALCO and the Company's Treasury Group measure and manage the composition of the balance sheet over a range of possible changes in interest rates while remaining responsive to market demand for loan and deposit products. The ALCO monitors current exposures versus limits and reports those results to the Board of Directors. The policy limits and guidelines serve as benchmarks for measuring interest-rate risk and for providing a framework for evaluation and interest-rate risk-management decision-making. The Company measures its interest-rate risk by using an asset/liability simulation model. The model considers several factors to determine the Company's potential exposure to interest-rate risk, including measurement of repricing gaps, duration, convexity, value-at-risk, market value of portfolio equity under assumed changes in the level of interest rates, the shape of yield curves, and general market volatility.
Management controls the Company's interest-rate exposure using several strategies, which include adjusting the maturities of securities in the Company's investment portfolio, limiting or expanding the terms of loans originated, limiting fixed-rate deposits with terms of more than five years, and adjusting maturities of FHLB advances. The Company limits this risk by restricting the types of MBSs it invests into those with limited average life changes under certain interest-rate-shock scenarios, or securities with embedded prepayment penalties. The Company also places limits on holdings of fixed-rate mortgage loans with maturities greater than five years. The Company enters into interest rate swaps as part of its interest rate risk management strategy. These interest rate swaps are designated as cash flow hedges and involve the receipt of variable rate amounts from a counterparty in exchange for the Company making fixed payments.
Measuring Interest-Rate Risk
As noted above, interest-rate risk can be measured by analyzing the extent to which the repricing of assets and liabilities are mismatched to create an interest-rate sensitivity gap. An asset or liability is said to be interest-rate sensitive within a specific period if it will mature or reprice within that period. The interest-rate sensitivity gap is defined as the difference between the amount of interest-earning assets maturing or repricing within a specific time period and the amount of interest-bearing liabilities maturing or repricing within that same time period. A gap is considered positive when the amount of interest-rate-sensitive assets exceeds the amount of interest-rate-sensitive liabilities. A gap is considered negative when the amount of interest-rate-sensitive liabilities exceeds the amount of interest-rate-sensitive assets. During a period of falling interest rates, therefore, a positive gap would tend to adversely affect net interest income. Conversely, during a period of rising interest rates, a positive gap position would tend to result in an increase in net interest income.
The Company's interest-rate risk position is measured using both income simulation and interest-rate sensitivity "gap" analysis. Income simulation is the primary tool for measuring the interest-rate risk inherent in the Company's balance sheet at a given point in time by showing the effect on net interest income, over a twelve-month period, of a variety of interest-rate shocks. These simulations take into account repricing, maturity, and prepayment characteristics of individual products. The ALCO reviews simulation results to determine whether exposure resulting from changes in market interest rates remains within established tolerance levels over a twelve-month horizon, and develops appropriate strategies to manage this exposure. The Company's interest-rate risk analysis remains modestly asset-sensitive as of December 31, 2023.
68
The assumptions used in the Company’s interest-rate sensitivity simulation discussed above are inherently uncertain and, as a result, the simulations cannot precisely measure net interest income or precisely predict the impact of changes in interest rates.
As of December 31, 2023, net interest income simulation indicated that the Company's exposure to changing interest rates was within tolerance. The ALCO reviews the methodology utilized for calculating interest-rate risk exposure and may periodically adopt modifications to this methodology. The following table presents the estimated impact of interest-rate changes on the Company's estimated net interest income over the twelve-month periods indicated:
| Estimated Exposure to Net Interest Income over Twelve-Month Horizon Beginning | |||||||||||||||||||||||
| December 31, 2023 | December 31, 2022 | ||||||||||||||||||||||
| Gradual Change in Interest Rate Levels | Dollar Change | Percent Change | Dollar Change | Percent Change | |||||||||||||||||||
| (Dollars in Thousands) | |||||||||||||||||||||||
| Up 300 basis points shock | $ | 13,318 | 3.9 | % | $ | 22,790 | 7.4 | % | |||||||||||||||
| Up 200 basis points ramp | 7,068 | 2.1 | % | 8,747 | 2.8 | % | |||||||||||||||||
| Up 100 basis points ramp | 3,389 | 1.0 | % | 4,477 | 1.5 | % | |||||||||||||||||
| Down 100 basis points ramp | (5,042) | (1.5) | % | (6,160) | (2.0) | % | |||||||||||||||||
The estimated impact of a 300 basis points increase in market interest rates on the Company's estimated net interest income over a twelve-month horizon was a positive 3.9% as of December 31, 2023, compared to a positive 7.4% as of December 31, 2022. The balance sheet became less asset sensitive as deposit outflows caused a reliance on wholesale funding.
Economic Value of Equity ("EVE") at Risk Simulation is conducted in tandem with net interest income simulations to ascertain a longer term view of the Company’s interest-rate risk position by capturing longer-term repricing risk and options risk embedded in the balance sheet. It measures the sensitivity of the economic value of equity to changes in interest rates. The EVE at Risk Simulation values only the current balance sheet and does not incorporate growth assumptions. As with the net interest income simulation, this simulation captures product characteristics such as loan resets, repricing terms, maturity dates, and rate caps and floors. Key assumptions include loan prepayment speeds, deposit pricing elasticity, and non-maturity deposit attrition rates. These assumptions can have significant impacts on valuation results as the assumptions remain in effect for the entire life of each asset and liability. The Company conducts non-maturity deposit behavior studies on a periodic basis to support deposit assumptions used in the valuation process. All key assumptions are subject to a periodic review.
EVE at Risk is calculated by estimating the net present value of all future cash flows from existing assets and liabilities using current interest rates as well as parallel shocks to the current interest-rate environment. The following table sets forth the estimated percentage change in the Company’s EVE at Risk, assuming various shifts in interest rates.
| Estimated Percent Change in Economic Value of Equity | ||||||||||||||
| Parallel Shock in Interest Rate Levels | At December 31, 2023 | At December 31, 2022 | ||||||||||||
| Up 300 basis points | (6.3) | % | 0.3 | % | ||||||||||
| Up 200 basis points | (4.4) | % | 0.5 | % | ||||||||||
| Up 100 basis points | (2.2) | % | 0.8 | % | ||||||||||
| Down 100 basis points | 2.1 | % | (3.0) | % | ||||||||||
The Company's EVE asset sensitivity decreased from December 31, 2022 to December 31, 2023 due to deposit outflows, increase in wholesale funding, along with an inverted yield curve.
The Company also uses interest-rate sensitivity "gap" analysis to provide a more general overview of its interest-rate risk profile. The interest-rate sensitivity gap is defined as the difference between interest-earning assets and interest-bearing liabilities maturing or repricing within a given time period. The table below shows the Company's interest-rate sensitivity gap position as of December 31, 2023.
69
| One Year or Less | More than One Year to Two Years | More than Two Years to Three Years | More than Three Years to Five Years | More than Five Years | Total | ||||||||||||||||||||||||||||||
| (Dollars in Thousands) | |||||||||||||||||||||||||||||||||||
Interest-earning assets (1): | |||||||||||||||||||||||||||||||||||
| Short-term investments | $ | 98,513 | $ | — | $ | — | $ | — | $ | — | $ | 98,513 | |||||||||||||||||||||||
| Weighted average rate | 5.33 | % | — | % | — | % | — | % | — | % | 5.33 | % | |||||||||||||||||||||||
Investment securities (1) (3) | 182,968 | 98,133 | 127,663 | 192,738 | 315,100 | 916,602 | |||||||||||||||||||||||||||||
| Weighted average rate | 2.39 | % | 1.84 | % | 2.42 | % | 2.39 | % | 2.27 | % | 2.29 | % | |||||||||||||||||||||||
Commercial real estate loans (1) | 2,657,682 | 705,831 | 713,684 | 1,217,190 | 470,142 | 5,764,529 | |||||||||||||||||||||||||||||
| Weighted average rate | 6.55 | % | 4.38 | % | 4.19 | % | 4.76 | % | 5.44 | % | 5.52 | % | |||||||||||||||||||||||
Commercial loans and leases (1) | 1,039,263 | 441,126 | 366,725 | 413,113 | 139,442 | 2,399,669 | |||||||||||||||||||||||||||||
| Weighted average rate | 7.52 | % | — | % | 7.03 | % | 7.41 | % | 7.25 | % | 7.32 | % | |||||||||||||||||||||||
Consumer loans (1) | 637,555 | 123,596 | 118,583 | 187,784 | 409,874 | 1,477,392 | |||||||||||||||||||||||||||||
| Weighted average rate | 6.99 | % | 4.02 | % | 4.01 | % | 4.40 | % | 5.34 | % | 5.72 | % | |||||||||||||||||||||||
| Total interest-earning assets | 4,615,981 | 1,368,686 | 1,326,655 | 2,010,825 | 1,334,558 | 10,656,705 | |||||||||||||||||||||||||||||
| Weighted average rate | 6.64 | % | 5.01 | % | 4.79 | % | 5.05 | % | 4.85 | % | 5.67 | % | |||||||||||||||||||||||
Interest-bearing liabilities (1): | |||||||||||||||||||||||||||||||||||
| NOW accounts | $ | — | $ | — | $ | — | $ | — | $ | 661,863 | $ | 661,863 | |||||||||||||||||||||||
| Weighted average rate | — | % | — | % | — | % | — | % | 0.60 | % | 0.60 | % | |||||||||||||||||||||||
| Savings accounts | — | — | — | — | 1,669,018 | 1,669,018 | |||||||||||||||||||||||||||||
| Weighted average rate | — | % | — | % | — | % | — | % | 2.63 | % | 2.63 | % | |||||||||||||||||||||||
| Money market savings accounts | 2,082,810 | — | — | — | — | 2,082,810 | |||||||||||||||||||||||||||||
| Weighted average rate | 3.07 | % | — | % | — | % | — | % | — | % | 3.07 | % | |||||||||||||||||||||||
Certificates of deposit (1) | 1,430,459 | 87,564 | 17,028 | 39,804 | — | 1,574,855 | |||||||||||||||||||||||||||||
| Weighted average rate | 3.98 | % | 3.73 | % | 1.52 | % | 1.71 | % | — | % | 3.88 | % | |||||||||||||||||||||||
| Brokered deposits | 725,687 | 156,241 | — | (755) | — | 881,173 | |||||||||||||||||||||||||||||
| Weighted average rate | 4.27 | % | 5.17 | % | — | % | — | % | — | % | 4.43 | % | |||||||||||||||||||||||
Borrowed funds (1) | 898,465 | 473,388 | 1,095 | 2,148 | 1,573 | 1,376,669 | |||||||||||||||||||||||||||||
| Weighted average rate | 5.08 | % | 4.87 | % | 2.77 | % | 2.01 | % | 5.00 | % | 5.00 | % | |||||||||||||||||||||||
| Total interest-bearing liabilities | 5,137,421 | 717,193 | 18,123 | 41,197 | 2,332,454 | 8,246,388 | |||||||||||||||||||||||||||||
| Weighted average rate | 3.85 | % | 4.79 | % | 1.60 | % | 1.76 | % | 2.06 | % | 3.28 | % | |||||||||||||||||||||||
Interest sensitivity gap (2) | $ | (521,440) | $ | 651,493 | $ | 1,308,532 | $ | 1,969,628 | $ | (997,896) | $ | 2,410,317 | |||||||||||||||||||||||
| Cumulative interest sensitivity gap | $ | (521,440) | $ | 130,053 | $ | 1,438,585 | $ | 3,408,213 | $ | 2,410,317 | |||||||||||||||||||||||||
| Cumulative interest sensitivity gap as a percentage of total assets | (4.58) | % | 1.14 | % | 12.64 | % | 29.94 | % | 21.18 | % | |||||||||||||||||||||||||
| Cumulative interest sensitivity gap as a percentage of total interest-earning assets | (4.89) | % | 1.22 | % | 13.50 | % | 31.98 | % | 22.62 | % | |||||||||||||||||||||||||
(1) Interest-earning assets and interest-bearing liabilities are included in the period in which the balances are expected to be redeployed and/or repriced as a result of anticipated prepayments, scheduled rate adjustments and contractual maturities.
(2) Interest sensitivity gap represents the difference between interest-earning assets and interest-bearing liabilities.
(3) Investment securities include all debt, equity and restricted equity securities and unrealized gains and losses on investment securities.
70
As of December 31, 2023, interest-earning assets maturing or repricing within one year amounted to $4.62 billion and interest-bearing liabilities maturing or repricing within one year amounted to $5.14 billion, resulting in a cumulative one-year negative gap position of $521.4 million or 4.89% of total interest-earning assets. As of December 31, 2022, the Company had a cumulative one-year positive gap position of $9.3 million, or 0.11% of total interest-earning assets. The change in the cumulative one-year gap position from December 31, 2022 was due to a shift in funding mix from non-maturity deposits to wholesale funding.
Interest rates paid on NOW accounts, savings accounts and money market accounts are subject to change at any time and such deposits are available for immediate withdrawal. A review of rates paid on these deposit categories over the last several years indicated that the amount and timing of rate changes did not coincide with the amount and timing of rate changes on other deposits when the FRB adjusted its benchmark federal funds rate.
Management views NOW and savings accounts to be less sensitive to interest rates than money market accounts and these accounts are therefore characterized as stable long-term funding sensitive beyond five years. Management views money market accounts to be more volatile deposits and these accounts are therefore characterized as sensitive to changes in interest rates within the first year.
Item 8. Financial Statements and Supplementary Data
The following financial statements and supplementary data required by this item are presented on the following pages which appear elsewhere herein:
71
Item 9. Changes in and Disagreements with Accountants on Accounting and Financial Disclosure
None.
Item 9A. Controls and Procedures
Under the supervision and with the participation of the Company's management, including the Company's Chief Executive Officer (Principal Executive Officer) and Chief Financial and Strategy Officer (Principal Financial Officer), the Company has evaluated the effectiveness of its disclosure controls and procedures (as defined in Rule 13a-15(e) and 15d-15(e) under the Exchange Act) as of the end of the period covered by this report. Based upon that evaluation, the Chief Executive Officer and Chief Financial and Strategy Officer concluded that, as of the end of the period covered by this report, the Company's disclosure controls and procedures were effective to ensure that information required to be disclosed in the reports that the Company files or submits under the Exchange Act is (i) recorded, processed, summarized and reported, within the time periods specified in the SEC's rules and forms and (ii) accumulated and communicated to the Company's management, including its Chief Financial and Strategy Officer, as appropriate to allow timely decisions regarding required disclosure.
There has been no change in the Company's internal control over financial reporting identified in connection with the quarterly evaluation that occurred during the Company's last fiscal quarter that has materially and detrimentally affected, or is reasonably likely to materially and detrimentally affect, the Company's internal control over financial reporting.
The Company's management is responsible for establishing and maintaining adequate internal control over financial reporting as such term is defined in Exchange Act Rule 13a-15(f). The Company's internal control system was designed to provide reasonable assurance to its management and the Board of Directors regarding the preparation and fair presentation of published financial statements. All internal control systems, no matter how well designed have inherent limitations. Therefore, even those systems determined to be effective can provide only reasonable assurance with respect to financial statement preparation and presentation. The Company's management assessed the effectiveness of its internal control over financial reporting as of the end of the period covered by this report. In addition, the effectiveness of the Company's internal control over financial reporting as of the end of the period covered by this report has been audited by KPMG LLP, an independent registered public accounting firm as stated in its report which is included in Item 8 of this Annual Report on Form 10-K.
Management's Report on Internal Control Over Financial Reporting as of December 31, 2023 appears on page F-1 herein and the related Report of Independent Registered Public Accounting Firm thereon appears on page F-2 herein.
Item 9B. Other Information
(a). None.
(b). During the three months ended December 31, 2023, none of the Company’s directors or officers (as defined in Rule 16a-1(f) of the Securities Exchange Act of 1934) adopted terminated
Item 9C. Disclosure Regarding Foreign Jurisdictions that Prevent Inspections
Not applicable.
PART III
Item 10. Directors, Executive Officers and Corporate Governance
The information required by this item is incorporated herein by reference to the Company's Proxy Statement to be filed in connection with the Annual Meeting of Stockholders (the "Proxy Statement").
Item 11. Executive Compensation
The information required by this item is incorporated herein by reference to the Proxy Statement, except as to information disclosed therein pursuant to Item 402(v) of Regulation S-K relating to pay versus performance.
Item 12. Security Ownership of Certain Beneficial Owners and Management and Related Stockholder Matters
The information required by this item is incorporated herein by reference to the Proxy Statement.
Item 13. Certain Relationships and Related Transactions, and Director Independence
The information required by this item is incorporated herein by reference to the Proxy Statement.
72
Item 14. Principal Accounting Fees and Services
Our independent registered public accounting firm is KPMG LLP , Boston, MA , Auditor Firm ID: 185
The information required by this item is incorporated herein by reference to the Proxy Statement.
73
PART IV
Item 15. Exhibits, Financial Statement Schedules
(a)Financial Statements
All financial statements are included in Item 8 of Part II of this Annual Report on Form 10-K.
(2)Financial Statement Schedules
All financial statement schedules have been omitted because they are not required, not applicable or are included in the consolidated financial statements or related notes.
(3)Exhibits
The exhibits listed in paragraph (b) below are filed herewith or incorporated herein by reference to other filings.
(b)Exhibits
EXHIBIT INDEX
| Exhibit | Description | |||||||
| 3.1 | ||||||||
| 3.2 | ||||||||
| 4 | ||||||||
| 4.1 | ||||||||
| 4.2 | ||||||||
| 4.3 | Form of Global Note to represent the 6.000% Fixed-to-Floating Rate Subordinated Notes due September 15, 2029 (contained in the First Supplemental Indenture included as Exhibit 4.2) | |||||||
| 4.4 | ||||||||
| 10.1+ | ||||||||
| 10.4+ | ||||||||
| 10.4.1+ | ||||||||
| 10.5+ | ||||||||
| 10.5.1+ | ||||||||
| 10.6+ | ||||||||
| 10.6.1+ | ||||||||
| 10.6.2+ | ||||||||
| 10.6.3+ | ||||||||
| 10.6.4 | ||||||||
74
| Exhibit | Description | |||||||
| 10.8+ | ||||||||
| 10.9+ | ||||||||
| 10.12+ | ||||||||
| 10.13+ | ||||||||
| 10.14+ | ||||||||
| 21 | Subsidiaries of the Registrant (incorporated by reference in Part I, Item 1. "Business—General" of this Annual Report on Form 10-K) | |||||||
| 23* | ||||||||
| 31.1* | ||||||||
| 31.2* | ||||||||
| 32.1** | ||||||||
| 32.2** | ||||||||
| 97 | ||||||||
| 101.INS | XBRL Instance Document - the instance document does not appear in the Interactive Data File because its XBRL tags are embedded within the Inline XBRL document | |||||||
| 101.SCH | XBRL Taxonomy Extension Schema Document | |||||||
| 101.CAL | XBRL Taxonomy Extension Calculation Linkbase Document | |||||||
| 101.DEF | XBRL Taxonomy Extension Definition Linkbase Document | |||||||
| 101.LAB | XBRL Taxonomy Extension Label Linkbase Document | |||||||
| 101.PRE | XBRL Taxonomy Extension Presentation Linkbase Document | |||||||
| 104 | Cover Page Interactive Data File (formatted in Inline XBRL and included in Exhibit 101) | |||||||
_______________________________________________________________________________
* Filed herewith
** Furnished herewith
+ Management contract or compensatory plan or agreement
(c)Other Required Financial Statements and Schedules
Not applicable.
Item 16. Form 10-K Summary
Not applicable.
75
SIGNATURES
Pursuant to the requirements of Section 13 or 15(d) of the Securities Exchange Act of 1934, the Registrant has duly caused this report to be signed on its behalf by the undersigned, thereunto duly authorized.
| Date: February 27, 2024 | BROOKLINE BANCORP, INC. | |||||||
| By: | /s/ PAUL A. PERRAULT | |||||||
Paul A. Perrault Chairman and Chief Executive Officer | ||||||||
Pursuant to the requirements of the Securities Exchange Act of 1934, this report has been signed below by the following persons on behalf of the Registrant and in the capacities and on the dates indicated.
| By: | /s/ PAUL A. PERRAULT | By: | /s/ CARL M. CARLSON | |||||||||||||||||
Paul A. Perrault, Chairman and Chief Executive Officer (Principal Executive Officer) | Carl M. Carlson, Co-President, Chief Financial and Strategy Officer (Principal Financial Officer) | |||||||||||||||||||
| Date: February 27, 2024 | Date: February 27, 2024 | |||||||||||||||||||
| By: | /s/ MARGARET BOLES FITZGERALD | By: | /s/ BOGDAN NOWAK | |||||||||||||||||
Margaret Boles Fitzgerald, Director | Bogdan Nowak, Director | |||||||||||||||||||
| Date: February 27, 2024 | Date: February 27, 2024 | |||||||||||||||||||
| By: | /s/ JOANNE CHANG | By: | /s/ CHARLES H. PECK | |||||||||||||||||
Joanne Chang, Director | Charles H. Peck, Director | |||||||||||||||||||
| Date: February 27, 2024 | Date: February 27, 2024 | |||||||||||||||||||
| By: | /s/ JOHN J. DOYLE, JR. | By: | /s/ JOHN M. PEREIRA | |||||||||||||||||
John J. Doyle, Jr., Director | John M. Pereira, Director | |||||||||||||||||||
| Date: February 27, 2024 | Date: February 27, 2024 | |||||||||||||||||||
| By: | /s/ WILLARD I. HILL, JR. | By: | /s/ MERRILL W. SHERMAN | |||||||||||||||||
Willard I. Hill, Jr., Director | Merrill W. Sherman, Director | |||||||||||||||||||
| Date: February 27, 2024 | Date: February 27, 2024 | |||||||||||||||||||
| By: | /s/ THOMAS J. HOLLISTER | By: | /s/ JOSEPH J. SLOTNIK | |||||||||||||||||
Thomas J. Hollister, Director | Joseph J. Slotnik, Lead Director | |||||||||||||||||||
| Date: February 27, 2024 | Date: February 27, 2024 | |||||||||||||||||||
76
MANAGEMENT'S REPORT ON INTERNAL CONTROL
OVER FINANCIAL REPORTING
The management of Brookline Bancorp, Inc. is responsible for establishing and maintaining adequate internal control over financial reporting. Brookline Bancorp, Inc.'s internal control system was designed to provide reasonable assurance to the Company's management and Board of Directors regarding the preparation and fair presentation of published financial statements.
All internal control systems, no matter how well-designed, have inherent limitations. Therefore, even those systems determined to be effective can provide only reasonable assurance with respect to financial statement preparation and presentation.
Brookline Bancorp, Inc.'s management assessed the effectiveness of the Company's internal control over financial reporting as of December 31, 2023. In making this assessment, it used the criteria set forth by the Committee of Sponsoring Organizations of the Treadway Commission (COSO) in Internal Control—Integrated Framework (2013). Based on our assessment, we believe that, as of December 31, 2023, the Company's internal control over financial reporting is effective based on those criteria.
Brookline Bancorp, Inc.'s independent registered public accounting firm has issued an audit report on the effectiveness of the Company's internal control over financial reporting. This report appears on page F-2.
| /s/ PAUL A. PERRAULT | /s/ CARL M. CARLSON | |||||||
| Paul A. Perrault | Carl M. Carlson | |||||||
| Chairman and Chief Executive Officer (Principal Executive Officer) | Co-President, Chief Financial and Strategy Officer (Principal Financial Officer) | |||||||
F-1
Report of Independent Registered Public Accounting Firm
To the Stockholders and Board of Directors
Brookline Bancorp, Inc.:
Opinion on Internal Control Over Financial Reporting
We have audited Brookline Bancorp, Inc. and subsidiaries' (the Company) internal control over financial reporting as of December 31, 2023, based on criteria established in Internal Control – Integrated Framework (2013) issued by the Committee of Sponsoring Organizations of the Treadway Commission. In our opinion, the Company maintained, in all material respects, effective internal control over financial reporting as of December 31, 2023, based on criteria established in Internal Control – Integrated Framework (2013) issued by the Committee of Sponsoring Organizations of the Treadway Commission.
We also have audited, in accordance with the standards of the Public Company Accounting Oversight Board (United States) (PCAOB), the consolidated balance sheets of the Company as of December 31, 2023 and 2022, the related consolidated statements of income, comprehensive income, changes in stockholders’ equity, and cash flows for each of the years in the three-year period ended December 31, 2023, and the related notes (collectively, the consolidated financial statements), and our report dated February 27, 2024 expressed an unqualified opinion on those consolidated financial statements.
Basis for Opinion
The Company’s management is responsible for maintaining effective internal control over financial reporting and for its assessment of the effectiveness of internal control over financial reporting, included in the accompanying Management's Report on Internal Control Over Financial Reporting. Our responsibility is to express an opinion on the Company’s internal control over financial reporting based on our audit. We are a public accounting firm registered with the PCAOB and are required to be independent with respect to the Company in accordance with the U.S. federal securities laws and the applicable rules and regulations of the Securities and Exchange Commission and the PCAOB.
We conducted our audit in accordance with the standards of the PCAOB. Those standards require that we plan and perform the audit to obtain reasonable assurance about whether effective internal control over financial reporting was maintained in all material respects. Our audit of internal control over financial reporting included obtaining an understanding of internal control over financial reporting, assessing the risk that a material weakness exists, and testing and evaluating the design and operating effectiveness of internal control based on the assessed risk. Our audit also included performing such other procedures as we considered necessary in the circumstances. We believe that our audit provides a reasonable basis for our opinion.
Definition and Limitations of Internal Control Over Financial Reporting
A company’s internal control over financial reporting is a process designed to provide reasonable assurance regarding the reliability of financial reporting and the preparation of financial statements for external purposes in accordance with generally accepted accounting principles. A company’s internal control over financial reporting includes those policies and procedures that (1) pertain to the maintenance of records that, in reasonable detail, accurately and fairly reflect the transactions and dispositions of the assets of the company; (2) provide reasonable assurance that transactions are recorded as necessary to permit preparation of financial statements in accordance with generally accepted accounting principles, and that receipts and expenditures of the company are being made only in accordance with authorizations of management and directors of the company; and (3) provide reasonable assurance regarding prevention or timely detection of unauthorized acquisition, use, or disposition of the company’s assets that could have a material effect on the financial statements.
Because of its inherent limitations, internal control over financial reporting may not prevent or detect misstatements. Also, projections of any evaluation of effectiveness to future periods are subject to the risk that controls may become inadequate because of changes in conditions, or that the degree of compliance with the policies or procedures may deteriorate.
/s/ KPMG LLP
Boston, Massachusetts
February 27, 2024
F-2
Report of Independent Registered Public Accounting Firm
To the Stockholders and Board of Directors
Brookline Bancorp, Inc.:
Opinion on the Consolidated Financial Statements
We have audited the accompanying consolidated balance sheets of Brookline Bancorp, Inc. and subsidiaries (the Company) as of December 31, 2023 and 2022, the related consolidated statements of income, comprehensive income, changes in stockholders’ equity, and cash flows for each of the years in the three-year period ended December 31, 2023, and the related notes (collectively, the consolidated financial statements). In our opinion, the consolidated financial statements present fairly, in all material respects, the financial position of the Company as of December 31, 2023 and 2022, and the results of its operations and its cash flows for each of the years in the three-year period ended December 31, 2023, in conformity with U.S. generally accepted accounting principles.
We also have audited, in accordance with the standards of the Public Company Accounting Oversight Board (United States) (PCAOB), the Company’s internal control over financial reporting as of December 31, 2023, based on criteria established in Internal Control – Integrated Framework (2013) issued by the Committee of Sponsoring Organizations of the Treadway Commission, and our report dated February 27, 2024 expressed an unqualified opinion on the effectiveness of the Company’s internal control over financial reporting.
Basis for Opinion
These consolidated financial statements are the responsibility of the Company’s management. Our responsibility is to express an opinion on these consolidated financial statements based on our audits. We are a public accounting firm registered with the PCAOB and are required to be independent with respect to the Company in accordance with the U.S. federal securities laws and the applicable rules and regulations of the Securities and Exchange Commission and the PCAOB.
We conducted our audits in accordance with the standards of the PCAOB. Those standards require that we plan and perform the audit to obtain reasonable assurance about whether the consolidated financial statements are free of material misstatement, whether due to error or fraud. Our audits included performing procedures to assess the risks of material misstatement of the consolidated financial statements, whether due to error or fraud, and performing procedures that respond to those risks. Such procedures included examining, on a test basis, evidence regarding the amounts and disclosures in the consolidated financial statements. Our audits also included evaluating the accounting principles used and significant estimates made by management, as well as evaluating the overall presentation of the consolidated financial statements. We believe that our audits provide a reasonable basis for our opinion.
Critical Audit Matters
The critical audit matters communicated below are matters arising from the current period audit of the consolidated financial statements that were communicated or required to be communicated to the audit committee and that: (1) relate to accounts or disclosures that are material to the consolidated financial statements and (2) involved our especially challenging, subjective, or complex judgments. The communication of critical audit matters does not alter in any way our opinion on the consolidated financial statements, taken as a whole, and we are not, by communicating the critical audit matters below, providing separate opinions on the critical audit matters or on the accounts or disclosures to which they relate.
Assessment of the collective allowance for credit losses
As discussed in Notes 1 and Note 7 to the consolidated financial statements, the Company’s allowance for credit losses related to loans and leases and unfunded commitments evaluated on a collective basis as of December 31, 2023 (the collective ACL) was $125.5 million, which consists of an allowance for loan and lease losses evaluated on a collective basis of $108.4 million and a reserve for unfunded commitments, evaluated on a collective basis of $17.1 million. The collective ACL is calculated using models developed by a third party, which include Commercial real estate lifetime, Commercial and industrial lifetime, and Retail lifetime models (collectively, the lifetime loss rate models). Lifetime loss rate models calculate the expected losses over the life of the loan based on the exposure at default, loan attributes and reasonable and supportable economic forecasts. The exposure at default considers the current unpaid balance, prepayment assumptions and utilization of unfunded commitment assumptions. In order to capture the unique risk characteristics of the loan and lease portfolios, the lifetime loss rate models segment the portfolios based on individual loan attributes and credit risk ratings for commercial loans. The economic forecasts include various projections of certain macro-economic variables. The Company uses multiple economic forecasts, which are probability weighted. The collective ACL estimate incorporates reasonable and supportable forecasts of various macro-economic variables over the remaining life of loans and leases. The development of the reasonable and supportable forecasts assumes each macro-economic variable will revert to long-term expectations. The Company calibrates expected losses for each
F-3
model using a scalar, which is determined by examining the loss rates of peer banks that have similar operations and asset bases to the Company and comparing these peer group loss rates to the model results. In addition, adjustments are made to the quantitative model outputs for relevant qualitative factors.
We identified the assessment of the collective ACL as a critical audit matter. A high degree of audit effort, including specialized skills and knowledge, and subjective and complex auditor judgment was involved in the assessment due to measurement uncertainty. Specifically, the assessment encompassed the evaluation of the collective ACL methodology, including the methods and models used to estimate (1) the lifetime loss rates and their significant assumptions, including portfolio segmentation, the economic forecasts including the various projections of certain macro-economic variables, the related weighting of the economic forecasts, the scalar applied to each model, utilization of unfunded commitments assumptions, and credit risk ratings for commercial loans, and (2) the qualitative factors and their significant assumptions and inputs, including historic loss patterns and the impact of current portfolio metrics. The assessment also included an evaluation of the conceptual soundness and performance of the models.
The following are the primary procedures we performed to address this critical audit matter. We evaluated the design and tested the operating effectiveness of certain internal controls related to the Company’s measurement of the collective ACL estimates, including over the:
•design of the collective ACL methodology
•continued use of the lifetime loss rate models
•identification and determination of the significant assumptions used in the lifetime loss rate models
•performance monitoring of the lifetime loss rate models for the collective ACL
•development of the qualitative factors, including the significant assumptions used in the measurement of the qualitative factors
•analysis of the collective ACL results and trends.
We evaluated the Company’s process to develop the collective ACL estimate by testing certain sources of data and assumptions that the Company used and considered the relevance and reliability of such data and assumptions. We also evaluated whether (1) the Company’s collective ACL methodology is in compliance with U.S. generally accepted accounting principles, (2) the loan portfolio is segmented by similar risk characteristics by comparing to the Company’s business environment and relevant industry practices and (3) the methodology used to determine the utilization of unfunded commitments assumptions is conceptually sound by comparing it to relevant Company specific metrics and trends and applicable industry practices. In addition, we involved credit risk professionals with specialized skills and knowledge, who assisted in:
•evaluating judgments made by the Company relative to the performance testing of the lifetime loss rate models by comparing them to relevant Company-specific metrics and trends and the applicable industry and regulatory practices
•testing the conceptual soundness and performance testing of the lifetime loss rate models by inspecting the model documentation to determine whether the models are suitable for their intended use
•evaluating the methodology utilized to incorporate reasonable and supportable forecast scenarios and related weightings used for each macro-economic variable by comparing it to the Company’s business environment and relevant industry practices
•assessing the composition of the peer group used in determining the scalar used to calibrate the model results by comparing to specific portfolio risk characteristics
•testing individual credit risk ratings for a selection of commercial loans by evaluating the financial performance of the borrower, sources of repayment, and any relevant guarantees or underlying collateral
•evaluating the methodology used to develop the qualitative factors and the effect of those factors on the collective ACL compared with relevant credit risk factors and consistency with credit trends.
Fair value measurement of loans and the core deposit intangible asset acquired in the PCSB Financial Corporation business combination
As discussed in Note 2 to the consolidated financial statements, on January 1, 2023, the Company completed the acquisition of PCSB Financial Corporation. The transaction was accounted for as a business combination. Accordingly, the purchase price was allocated to the assets acquired and liabilities assumed based on their estimated fair values as of the acquisition date. As
F-4
part of the acquisition, the Company acquired loans with a fair value of $1.3 billion and a core deposit intangible asset with a fair value of $30.3 million. The fair value of the loans was based on a discounted cash flow methodology, with assumptions applied based on pools in which the loans were classified. The methodology considered the contractual terms of the loans and assumptions related to the prepayment rate and discount rate to estimate the projected cash flows. The loss rates for the loans were estimated using Probability of Default and Loss Given Default assumptions. The fair value of the core deposit intangible asset was based on the after-tax cost savings method that considered customer attrition, deposit interest rates, service charge income, overhead expense, discount rate, and costs of alternative funding.
We identified the fair value measurements of loans and the core deposit intangible asset as a critical audit matter. A high degree of audit effort, including specialized skills and knowledge, and subjective and complex auditor judgment was involved in the assessment of the fair value measurements due to significant measurement uncertainty. Specifically, the assessment of the fair value measurements encompassed the evaluation of the (1) fair value measurement methodologies, and (2) loan fair value measurement key assumptions, including discount rate and estimated loss rates based on Probability of Default and Loss Given Default; and core deposit intangible asset fair value measurement key assumptions, including customer attrition, service charge income, overhead expense, and costs of alternative funding.
The following are the primary procedures we performed to address this critical audit matter. We evaluated the design and tested the operating effectiveness of certain internal controls related to the Company’s fair value measurements of loans and the core deposit intangible asset including controls over the (1) development of the overall fair value methodologies, and (2) determination of the key assumptions used in the fair value estimates.
We involved valuation professionals with specialized skills and knowledge, who assisted in:
•developing an independent range of fair values for certain loans and the core deposit intangible asset, including the development of independent assumptions utilizing market data, and
•assessing the Company’s estimate of fair value for certain loans and the core deposit intangible asset by comparing it to the independently developed range.
/s/ KPMG LLP
We have served as the Company’s auditor since 2003.
Boston, Massachusetts
February 27, 2024
F-5
BROOKLINE BANCORP, INC. AND SUBSIDIARIES
Consolidated Balance Sheets
| At December 31, | |||||||||||
| 2023 | 2022 | ||||||||||
| (In Thousands Except Share Data) | |||||||||||
| ASSETS | |||||||||||
| Cash and due from banks | $ | $ | |||||||||
| Short-term investments | |||||||||||
| Total cash and cash equivalents | |||||||||||
| Investment securities available-for-sale | |||||||||||
| Total investment securities | |||||||||||
| Allowance for investment security losses | ( | ( | |||||||||
| Net investment securities | |||||||||||
| Loans and leases: | |||||||||||
| Commercial real estate loans | |||||||||||
| Commercial loans and leases | |||||||||||
| Consumer loans | |||||||||||
| Total loans and leases | |||||||||||
| Allowance for loan and lease losses | ( | ( | |||||||||
| Net loans and leases | |||||||||||
| Restricted equity securities | |||||||||||
Premises and equipment, net of accumulated depreciation of $ | |||||||||||
| Right-of-use asset operating leases | |||||||||||
| Deferred tax asset | |||||||||||
| Goodwill | |||||||||||
Identified intangible assets, net of accumulated amortization of $ | |||||||||||
| Other real estate owned ("OREO") and repossessed assets, net | |||||||||||
| Other assets | |||||||||||
| Total assets | $ | $ | |||||||||
| LIABILITIES AND STOCKHOLDERS' EQUITY | |||||||||||
| Deposits: | |||||||||||
| Non-interest-bearing deposits: | |||||||||||
| Demand checking accounts | $ | $ | |||||||||
| Interest-bearing deposits: | |||||||||||
| NOW accounts | |||||||||||
| Savings accounts | |||||||||||
| Money market accounts | |||||||||||
| Certificate of deposit accounts | |||||||||||
| Brokered deposit accounts | |||||||||||
| Total interest-bearing deposits | |||||||||||
| Total deposits | |||||||||||
| Borrowed funds: | |||||||||||
| Advances from the Federal Home Loan Bank ("FHLB") of Boston and New York | |||||||||||
| Subordinated debentures and notes | |||||||||||
| Other borrowed funds | |||||||||||
| Total borrowed funds | |||||||||||
| Operating lease liabilities | |||||||||||
| Mortgagors' escrow accounts | |||||||||||
| Reserve for unfunded credits | |||||||||||
| Accrued expenses and other liabilities | |||||||||||
| Total liabilities | |||||||||||
| Commitments and contingencies (Note 13) | |||||||||||
| Stockholders' Equity: | |||||||||||
Common stock, $ | |||||||||||
| Additional paid-in capital | |||||||||||
| Retained earnings | |||||||||||
| Accumulated other comprehensive (loss) income | ( | ( | |||||||||
Treasury stock, at cost; | ( | ( | |||||||||
| Total stockholders' equity | |||||||||||
| Total liabilities and stockholders' equity | $ | $ | |||||||||
See accompanying notes to consolidated financial statements.
F-6
BROOKLINE BANCORP, INC. AND SUBSIDIARIES
Consolidated Statements of Income
| Year Ended December 31, | |||||||||||||||||
| 2023 | 2022 | 2021 | |||||||||||||||
| (In Thousands Except Share Data) | |||||||||||||||||
| Interest and dividend income: | |||||||||||||||||
| Loans and leases | $ | $ | $ | ||||||||||||||
| Debt securities | |||||||||||||||||
| Restricted equity securities | |||||||||||||||||
| Short-term investments | |||||||||||||||||
| Total interest and dividend income | |||||||||||||||||
| Interest expense: | |||||||||||||||||
| Deposits | |||||||||||||||||
| Borrowed funds | |||||||||||||||||
| Total interest expense | |||||||||||||||||
| Net interest income | |||||||||||||||||
| Provision (credit) for credit losses on loans | ( | ||||||||||||||||
| Provision for credit losses on investments | |||||||||||||||||
| Net interest income after provision for credit losses | |||||||||||||||||
| Non-interest income: | |||||||||||||||||
| Deposit fees | |||||||||||||||||
| Loan fees | |||||||||||||||||
| Loan level derivative income, net | |||||||||||||||||
| Gain (loss) on investment securities, net | ( | ||||||||||||||||
| Gain on sales of loans and leases | |||||||||||||||||
| Other | |||||||||||||||||
| Total non-interest income | |||||||||||||||||
| Non-interest expense: | |||||||||||||||||
| Compensation and employee benefits | |||||||||||||||||
| Occupancy | |||||||||||||||||
| Equipment and data processing | |||||||||||||||||
| Professional services | |||||||||||||||||
| FDIC insurance | |||||||||||||||||
| Advertising and marketing | |||||||||||||||||
| Amortization of identified intangible assets | |||||||||||||||||
| Merger and acquisition expense | |||||||||||||||||
| Other | |||||||||||||||||
| Total non-interest expense | |||||||||||||||||
| Income before provision for income taxes | |||||||||||||||||
| Provision for income taxes | |||||||||||||||||
| Net income | |||||||||||||||||
| Earnings per common share: | |||||||||||||||||
| Basic | $ | $ | $ | ||||||||||||||
| Diluted | |||||||||||||||||
| Weighted average common shares outstanding during the year: | |||||||||||||||||
| Basic | |||||||||||||||||
| Diluted | |||||||||||||||||
| Dividends declared per common share | $ | $ | $ | ||||||||||||||
See accompanying notes to consolidated financial statements.
F-7
BROOKLINE BANCORP, INC. AND SUBSIDIARIES
Consolidated Statements of Comprehensive Income
| Year Ended December 31, | |||||||||||||||||
| 2023 | 2022 | 2021 | |||||||||||||||
| (In Thousands) | |||||||||||||||||
| Net income | $ | $ | $ | ||||||||||||||
| Investment securities available-for-sale: | |||||||||||||||||
| Unrealized securities holding gains (losses) | ( | ( | |||||||||||||||
| Income tax (expense) benefit | ( | ||||||||||||||||
| Net unrealized securities holding gains (losses) before reclassification adjustments, net of taxes | ( | ( | |||||||||||||||
| Less reclassification adjustments for securities gains (losses) included in net income: | |||||||||||||||||
| Gain (loss) on sales of securities, net | ( | ( | |||||||||||||||
| Income tax (expense) benefit | |||||||||||||||||
| Net reclassification adjustments for securities gains (losses) included in net income | ( | ( | |||||||||||||||
| Net unrealized securities holding gains (losses) | ( | ( | |||||||||||||||
| Cash flow hedges: | |||||||||||||||||
| Change in fair value of cash flow hedges | ( | ( | |||||||||||||||
| Reclassification adjustment for (income) expense recognized in earnings | — | ( | ( | ||||||||||||||
| Income tax (expense) benefit | |||||||||||||||||
| Net change in fair value of cash flow hedges, net of taxes | ( | ( | |||||||||||||||
| Less reclassification adjustment for change in fair value of cash flow hedges: | |||||||||||||||||
| Gain (loss) on change in fair value of cash flow hedges | ( | — | — | ||||||||||||||
| Income tax (expense) benefit | — | — | |||||||||||||||
| Net reclassification adjustment for change in fair value of cash flow hedges | ( | — | — | ||||||||||||||
| Net change in fair value of cash flow hedges | |||||||||||||||||
| Postretirement benefits: | |||||||||||||||||
| Adjustment of accumulated obligation for postretirement benefits | |||||||||||||||||
| Income tax (expense) benefit | ( | ( | ( | ||||||||||||||
| Net adjustment of accumulated obligation for postretirement benefits | |||||||||||||||||
| Other comprehensive gain (loss), net of taxes | ( | ( | |||||||||||||||
| Comprehensive income | |||||||||||||||||
See accompanying notes to consolidated financial statements.
F-8
BROOKLINE BANCORP, INC. AND SUBSIDIARIES
Consolidated Statements of Changes in Stockholders' Equity
Year Ended December 31, 2023, 2022 and 2021
| Common Stock | Additional Paid-in Capital | Retained Earnings | Accumulated Other Comprehensive Income (Loss) | Treasury Stock | Unallocated Common Stock Held by ESOP | Total Stockholders' Equity | ||||||||||||||||||||||||||||||||||||||
| (In Thousands) | ||||||||||||||||||||||||||||||||||||||||||||
| Balance at December 31, 2022 | $ | $ | $ | $ | ( | $ | ( | $ | $ | |||||||||||||||||||||||||||||||||||
| Net income | — | — | — | — | — | |||||||||||||||||||||||||||||||||||||||
| PCSB acquisition | — | — | — | — | ||||||||||||||||||||||||||||||||||||||||
| Other comprehensive income (loss) | — | — | — | — | — | |||||||||||||||||||||||||||||||||||||||
Common stock dividends of $ | — | — | ( | — | — | — | ( | |||||||||||||||||||||||||||||||||||||
| Restricted stock awards, net of awards surrendered | — | ( | — | — | — | ( | ||||||||||||||||||||||||||||||||||||||
| Compensation under recognition and retention plans | — | ( | — | — | — | |||||||||||||||||||||||||||||||||||||||
| Balance at December 31, 2023 | $ | $ | $ | $ | ( | $ | ( | $ | $ | |||||||||||||||||||||||||||||||||||
See accompanying notes to consolidated financial statements.
F-9
BROOKLINE BANCORP, INC. AND SUBSIDIARIES
Consolidated Statements of Changes in Stockholders' Equity (Continued)
Year Ended December 31, 2023, 2022 and 2021
| Common Stock | Additional Paid-in Capital | Retained Earnings | Accumulated Other Comprehensive Income (Loss) | Treasury Stock | Unallocated Common Stock Held by ESOP | Total Stockholders' Equity | |||||||||||||||||||||||||||||||||||
| (In Thousands) | |||||||||||||||||||||||||||||||||||||||||
| Balance at December 31, 2021 | $ | $ | $ | $ | ( | $ | ( | $ | ( | $ | |||||||||||||||||||||||||||||||
| Net income | — | — | — | — | — | ||||||||||||||||||||||||||||||||||||
| Other comprehensive income (loss) | — | — | — | ( | — | — | ( | ||||||||||||||||||||||||||||||||||
Common stock dividends of $ | — | — | ( | — | — | — | ( | ||||||||||||||||||||||||||||||||||
| Restricted stock awards, net of awards surrendered | — | ( | — | — | — | ( | |||||||||||||||||||||||||||||||||||
| Compensation under recognition and retention plans | — | ( | — | — | — | ||||||||||||||||||||||||||||||||||||
| Treasury stock, repurchase shares | — | — | — | — | ( | — | ( | ||||||||||||||||||||||||||||||||||
Common stock held by ESOP committed to be released ( | — | — | — | — | |||||||||||||||||||||||||||||||||||||
| Balance at December 31, 2022 | $ | $ | $ | $ | ( | $ | ( | $ | $ | ||||||||||||||||||||||||||||||||
See accompanying notes to consolidated financial statements.
F-10
BROOKLINE BANCORP, INC. AND SUBSIDIARIES
Consolidated Statements of Changes in Stockholders' Equity (Continued)
Year Ended December 31, 2023, 2022 and 2021
| Common Stock | Additional Paid-in Capital | Retained Earnings | Accumulated Other Comprehensive Income (Loss) | Treasury Stock | Unallocated Common Stock Held by ESOP | Total Stockholders' Equity | |||||||||||||||||||||||||||||||||||
| (In Thousands) | |||||||||||||||||||||||||||||||||||||||||
| Balance at December 31, 2020 | $ | $ | $ | $ | $ | ( | $ | ( | $ | ||||||||||||||||||||||||||||||||
| Net income | — | — | — | — | — | ||||||||||||||||||||||||||||||||||||
| Other comprehensive income (loss) | — | — | — | ( | — | — | ( | ||||||||||||||||||||||||||||||||||
Common stock dividends of $ | — | — | ( | — | — | — | ( | ||||||||||||||||||||||||||||||||||
| Restricted stock awards, net of awards surrendered | — | ( | — | — | — | ( | |||||||||||||||||||||||||||||||||||
| Compensation under recognition and retention plans | — | ( | — | — | — | ||||||||||||||||||||||||||||||||||||
| Treasury stock, repurchase shares | — | — | — | — | ( | — | ( | ||||||||||||||||||||||||||||||||||
Common stock held by ESOP committed to be released ( | — | — | — | — | |||||||||||||||||||||||||||||||||||||
| Balance at December 31, 2021 | $ | $ | $ | $ | ( | $ | ( | $ | ( | $ | |||||||||||||||||||||||||||||||
See accompanying notes to consolidated financial statements.
F-11
BROOKLINE BANCORP, INC. AND SUBSIDIARIES
Consolidated Statements of Cash Flows
| Year Ended December 31, | |||||||||||||||||
| 2023 | 2022 | 2021 | |||||||||||||||
| (In Thousands) | |||||||||||||||||
| Cash flows from operating activities: | |||||||||||||||||
| Net income | $ | $ | $ | ||||||||||||||
| Adjustments to reconcile net income to net cash provided from operating activities: | |||||||||||||||||
| Provision (credit) for credit losses | ( | ||||||||||||||||
| Deferred income tax expense | |||||||||||||||||
| Depreciation of premises and equipment | |||||||||||||||||
| (Accretion) amortization of investment securities deferred, net | ( | ||||||||||||||||
| (Accretion) amortization of premiums and discounts and deferred loan and lease origination costs, net | ( | ||||||||||||||||
| Amortization of identified intangible assets | |||||||||||||||||
| Amortization of debt issuance costs | |||||||||||||||||
| (Accretion) amortization of acquisition fair value adjustments, net | ( | ( | |||||||||||||||
| (Gain) loss on investment securities, net | ( | ( | |||||||||||||||
| Gain on sales of loans and leases | ( | ( | ( | ||||||||||||||
| (Loss) gain on sales of OREO | ( | ||||||||||||||||
| Write-down of OREO and other repossessed assets | |||||||||||||||||
| Compensation under recognition and retention plans | |||||||||||||||||
| ESOP shares committed to be released | |||||||||||||||||
| Net change in: | |||||||||||||||||
| Cash surrender value of bank-owned life insurance | ( | ( | ( | ||||||||||||||
| Equity securities held-for-trading | |||||||||||||||||
| Other assets | ( | ||||||||||||||||
| Accrued expenses and other liabilities | ( | ( | |||||||||||||||
| Net cash provided from operating activities | |||||||||||||||||
| Cash flows from investing activities: | |||||||||||||||||
| Proceeds from sales of investment securities available-for-sale | |||||||||||||||||
| Proceeds from maturities, calls, and principal repayments of investment securities available-for-sale | |||||||||||||||||
| Purchases of investment securities available-for-sale | ( | ( | ( | ||||||||||||||
| Proceeds from redemption/sales of restricted equity securities | |||||||||||||||||
| Purchase of restricted equity securities | ( | ( | ( | ||||||||||||||
| Proceeds from sales of loans and leases held-for-investment, net | |||||||||||||||||
| Net increase in loans and leases | ( | ( | ( | ||||||||||||||
| Acquisitions, net of cash and cash equivalents acquired | ( | ||||||||||||||||
| Purchase of premises and equipment, net | ( | ( | ( | ||||||||||||||
| Proceeds from sales of OREO and other repossessed assets | |||||||||||||||||
| Net cash (used for) provided from investing activities | ( | ( | |||||||||||||||
| (Continued) | |||||||||||||||||
See accompanying notes to consolidated financial statements.
F-12
| Year Ended December 31, | |||||||||||||||||
| 2023 | 2022 | 2021 | |||||||||||||||
| (In Thousands) | |||||||||||||||||
| Cash flows from financing activities: | |||||||||||||||||
| (Decrease) increase in demand checking, NOW, savings and money market accounts | ( | ( | |||||||||||||||
| Increase (decrease) in certificates of deposit and brokered certificates of deposit | ( | ||||||||||||||||
| Proceeds from FHLB advances | |||||||||||||||||
| Repayment of FHLB advances | ( | ( | ( | ||||||||||||||
| (Decrease) increase in other borrowed funds, net | ( | ( | |||||||||||||||
| (Decrease) increase in mortgagors' escrow accounts, net | ( | ( | |||||||||||||||
| Repurchases of common stock | ( | ( | |||||||||||||||
| Payment of dividends on common stock | ( | ( | ( | ||||||||||||||
| Payment of income taxes for shares withheld in share based activity | ( | ( | ( | ||||||||||||||
| Net cash provided from (used for) financing activities | ( | ||||||||||||||||
| Net increase (decrease) in cash and cash equivalents | ( | ( | |||||||||||||||
| Cash and cash equivalents at beginning of year | |||||||||||||||||
| Cash and cash equivalents at end of year | $ | $ | $ | ||||||||||||||
| Supplemental disclosure of cash flow information: | |||||||||||||||||
| Cash paid during the year for: | |||||||||||||||||
| Interest on deposits, borrowed funds and subordinated debt | $ | $ | $ | ||||||||||||||
| Income taxes | |||||||||||||||||
| Non-cash investing activities: | |||||||||||||||||
| Transfer from loans to other real estate owned and other repossessed assets | $ | $ | $ | ||||||||||||||
| Acquisition of PCSB Financial Corporation | |||||||||||||||||
| Fair value of assets acquired, net of cash and cash equivalents acquired | $ | ||||||||||||||||
| Fair value of liabilities assumed | |||||||||||||||||
| Common stock issued | |||||||||||||||||
See accompanying notes to consolidated financial statements.
F-13
BROOKLINE BANCORP, INC. AND SUBSIDIARIES
Notes to Consolidated Financial Statements
(1) Basis of Presentation
Overview
Brookline Bancorp, Inc. (the "Company") is a bank holding company (within the meaning of the Bank Holding Company Act of 1956, as amended) and the parent of Brookline Bank, a Massachusetts-chartered trust company, Bank Rhode Island ("BankRI"), a Rhode Island-chartered financial institution, and PCSB Bank, a New York-chartered commercial bank (collectively referred to as the "Banks"). The Banks are all members of the Federal Reserve System. The Company is also the parent of Clarendon Private, LLC ("Clarendon Private"). The Company's primary business is to provide commercial, business and retail banking services to its corporate, municipal and retail customers through the Banks and its non-bank subsidiaries. Until February 14, 2020 (the "Merger Closing Date"), the Company was also the parent of First Ipswich Bank ("First Ipswich"), a Massachusetts-chartered trust company. Effective upon the Merger Closing Date, First Ipswich was merged with and into Brookline Bank, with Brookline as the surviving institution. Brookline Securities Corp. ("BSC"), previously a subsidiary of the Company was dissolved in November 2023.
Brookline Bank, which includes its wholly-owned subsidiaries Longwood Securities Corp., Eastern Funding LLC ("Eastern Funding") and First Ipswich Insurance Agency, operates 29 full-service banking offices in the Greater Boston metropolitan area with two additional lending offices. BankRI, which includes its wholly-owned subsidiaries, Acorn Insurance Agency, BRI Realty Corp., BRI Investment Corp. and its wholly-owned subsidiary, BRI MSC Corp., operates 22 full-service banking offices in the Greater Providence, Rhode Island area. Macrolease Corporation ("Macrolease"), previously a subsidiary of BankRI, was merged into Eastern Funding LLC in the second quarter of 2022. PCSB Bank, which includes its wholly-owned subsidiary, UpCounty Realty Corp., operates 14 full-service banking offices in the Lower Hudson Valley of New York. Clarendon Private is a registered investment advisor with the Securities and Exchange Commission ("SEC"). Through Clarendon Private, the Company offers a wide range of wealth management services to individuals, families, endowments and foundations to help these clients meet their long-term financial goals.
The Company's activities include acceptance of commercial, municipal and retail deposits, origination of mortgage loans on commercial and residential real estate located principally in Central New England and the Lower Hudson Valley of New York, origination of commercial loans and leases to small- and mid-sized businesses, investment in debt and equity securities, and the offering of cash management and wealth and investment advisory services. The Company also provides specialty equipment financing through its subsidiary Eastern Funding, which is based in New York City, New York, and Plainview, New York.
The Company and the Banks are supervised, examined and regulated by the Board of Governors of the Federal Reserve System ("FRB"). As a Massachusetts-chartered trust company, Brookline Bank is also subject to supervision, examination and regulation by Massachusetts Division of Banks. As a Rhode Island-chartered financial institution, BankRI is subject to regulation, examination and regulation by the Banking Division of the Rhode Island Department of Business Regulation. As a New York chartered commercial bank, PCSB Bank is subject to supervision, examination and regulation by the New York State Department of Financial Services. Clarendon Private is also subject to regulation by the SEC.
The Federal Deposit Insurance Corporation ("FDIC") offers insurance coverage on all deposits up to $250,000 per depositor at each of the Banks. As FDIC-insured depository institutions, the Banks are also secondarily subject to supervision, examination and regulation by the FDIC.
Basis of Financial Statement Presentation
The Company's consolidated financial statements have been prepared in conformity with U.S. generally accepted accounting principles ("GAAP") as set forth by the Financial Accounting Standards Board ("FASB") in its Accounting Standards Codification and through the rules and interpretive releases of the SEC under the authority of federal securities laws.
The consolidated financial statements include the accounts of the Company and its wholly-owned subsidiaries. All significant intercompany transactions and balances are eliminated in consolidation.
In preparing these consolidated financial statements, management is required to make significant estimates and assumptions that affect the reported amounts of assets, liabilities, income, expenses and disclosure of assets and liabilities. Actual results could differ from those estimates based upon changing conditions, including economic conditions and future events. Material estimates that are particularly susceptible to significant changes in the near-term include the determination of
F-14
BROOKLINE BANCORP, INC. AND SUBSIDIARIES
Notes to Consolidated Financial Statements (Continued)
the allowance for loan and lease losses, the determination of fair market values of assets and liabilities, including acquired loans, the review of goodwill and intangibles for impairment and the review of deferred tax assets for valuation allowance.
The judgments used by management in applying these significant estimates may be affected by a further and prolonged deterioration in the economic environment, which may result in changes to future financial results. For example, subsequent evaluations of the loan and lease portfolio, in light of the factors then prevailing, may result in significant changes in the allowance for loan and lease losses in future periods, and the inability to collect outstanding principal may result in increased loan and lease losses.
Cash and Cash Equivalents
For purposes of reporting asset balances and cash flows, cash and cash equivalents includes cash on hand and due from banks (including cash items in process of clearing), interest-bearing deposits with banks, federal funds sold, money market mutual funds and other short-term investments with original maturities of three months or less.
Investment Securities
Investment securities, other than those reported as short-term investments, are classified at the time of purchase as "available-for-sale," "held-to-maturity," or "held-for-trading." Classification is periodically re-evaluated for consistency with the Company's goals and objectives. Equity investments in the Federal Home Loan Bank ("FHLB") of Boston and New York, the Federal Reserve Bank of Boston, the Federal Reserve Bank of New York, and other restricted equities are discussed in more detail in Note 5, "Restricted Equity Securities."
Investment Securities Available-for-Sale, Held-to-Maturity, and Held-for-Trading
Investment securities for which the Company has the positive intent and ability to hold to maturity are classified as held-to-maturity and carried at amortized cost. Those investment securities held for indefinite periods of time but not necessarily to maturity are classified as available-for-sale. Investment securities held for indefinite periods of time include investment securities that management intends to use as part of its asset/liability, liquidity, and/or capital management strategies and may be sold in response to changes in interest rates, maturities, asset/liability mix, liquidity needs, regulatory capital needs or other business factors. Investment securities available-for-sale are carried at estimated fair value, primarily obtained from a third-party pricing service, with unrealized gains and losses reported on an after-tax basis in stockholders' equity as accumulated other comprehensive income or loss. Investment securities expected to be held for very short term duration, used for hedging, or are marketable equity securities are typically designated held-for-trading. Held-for-trading securities are carried at estimated fair value principally based on market prices and dealer quotes received from third-party and nationally-recognized pricing services. Gains and losses for held-for-trading are reported on the income statement as gains on investment securities, net. As of December 31, 2023 and 2022, the Company did not make any adjustments to the prices provided by the third-party pricing service.
Security transactions are recorded on the trade date. Realized gains and losses are determined using the specific identification method and are recorded in non-interest income. Interest and dividends on securities are recorded using the accrual method. Premiums and discounts on securities are amortized or accreted into interest income using the level-yield method over the remaining period to contractual maturity, adjusted for the effect of actual prepayments in the case of mortgage-backed securities ("MBSs") and collateralized mortgage obligations ("CMOs"). These estimates of prepayment assumptions are made based upon the actual performance of the underlying security, current interest rates, the general market consensus regarding changes in mortgage interest rates, the contractual repayment terms of the underlying loans, the priority rights of the investors to the cash flows from the mortgage securities and other economic conditions. When differences arise between anticipated prepayments and actual prepayments, the effective yield is recalculated to reflect actual payments to date and anticipated future payments. Unamortized premium or discount is adjusted to the amount that would have existed had the new effective yield been applied since purchase, with a corresponding charge or credit to interest income.
F-15
BROOKLINE BANCORP, INC. AND SUBSIDIARIES
Notes to Consolidated Financial Statements (Continued)
Restricted Equity Securities
Loans
Loans and Leases Held-to-Maturity
Loans the Company originates for the portfolio, and for which it has the intent and ability to hold to maturity, are reported at amortized cost, inclusive of deferred loan origination fees and expenses, less unadvanced funds due to borrowers on loans and the allowance for loan and lease losses.
Interest income on loans and leases originated for the portfolio is accrued on unpaid principal balances as earned. Loan origination fees and direct loan origination costs are deferred, and the net fee or cost is recognized in interest income using the interest method. Deferred amounts are recognized for fixed-rate loans over the contractual life of the loans and for adjustable-rate loans over the period of time required to adjust the contractual interest rate to a yield approximating a market rate at the origination date. If a loan is prepaid, the unamortized portion of the loan origination costs, including third party referral related costs not subject to rebate from the dealer, is charged to income.
Loans and Leases Held-for-Sale
Management identifies and designates certain newly originated loans and leases for sale to specific financial institutions, subject to the underwriting criteria of those financial institutions. These loans and leases are held for sale and are carried at the lower of cost or market as determined in the aggregate. Deferred loan fees and costs are included in the determination of the gain or loss on sale. The Company had no loans and leases held-for-sale as of December 31, 2023 and 2022.
Nonperforming Loans
Nonaccrual Loans
Accrual of interest on loans generally is discontinued when contractual payment of principal or interest becomes past due 90 days or, if in management's judgment, reasonable doubt exists as to the full timely collection of interest. Exceptions may be made if the loan has matured and is in the process of renewal or is well-secured and in the process of collection. When a loan is placed on nonaccrual status, interest accruals cease and uncollected accrued interest is reversed and charged against current interest income. Interest payments on nonaccrual loans are generally applied to principal. If collection of the principal is reasonably assured, interest payments are recognized as income on the cash basis. Loans are generally returned to accrual status when principal and interest payments are current, full collectability of principal and interest is reasonably assured and a consistent record of at least six consecutive months of performance has been achieved.
Impaired Loans
A loan is considered to be impaired when, based on current information and events, it is probable that the Company will be unable to collect all amounts due (both interest and principal) according to the contractual terms of the loan agreement. Smaller-balance, homogeneous loans that are evaluated collectively for impairment, such as residential, home equity and other consumer loans are specifically excluded from the impaired loan portfolio except where the loan is modified. The Company has defined the population of impaired loans to include nonaccrual loans and modified loans.
When the ultimate collectability of the total principal of an impaired loan or lease is in doubt and the loan is on nonaccrual status, all payments are applied to principal, under the cost recovery method. When the ultimate collectability of the total principal of an impaired loan or lease is not in doubt and the loan or lease is on nonaccrual status, contractual interest is credited to interest income when received, under the cash basis method.
The value of an impaired loan is measured based upon the present value of expected future cash flows discounted at the loan's effective interest rate, or the fair value of the collateral if the loan is collateral-dependent and its payment is expected
F-16
BROOKLINE BANCORP, INC. AND SUBSIDIARIES
Notes to Consolidated Financial Statements (Continued)
solely based on the underlying collateral. For impaired loans deemed collateral dependent, where impairment is measured using the fair value of the collateral, the Company will either obtain a new appraisal or use another available source of collateral assessment to determine a reasonable estimate of the fair value of the collateral.
Interest collected on impaired loans is either applied against principal or reported as income according to management's judgment as to the collectability of principal. If management does not consider a loan ultimately collectible within an acceptable time frame, payments are applied as principal to reduce the loan balance. If full collection of the remaining recorded investment should subsequently occur, interest receipts are recorded as interest income on a cash basis.
Loan Modifications
In determining whether a debtor is experiencing financial difficulties, the Company considers, among other factors, whether the debtor is in payment default or is likely to be in payment default in the foreseeable future without the modification, if the debtor declared or is in the process of declaring bankruptcy, there is substantial doubt that the debtor will continue as a going concern, the debtor's entity-specific projected cash flows will not be sufficient to service its debt, if the debtor has securities that have been delisted or are in the process of being delisted, or the debtor cannot obtain funds from sources other than the existing creditors at market terms for debt with similar risk characteristics.
Disclosable modifications under current guidance include principal forgiveness, interest rate reductions, significant payment delays, maturity extensions, or any combination of the aforementioned modifications. The Company tracks and discloses the performance of these modifications with respect to delinquency and re-modification status.
Allowance for Credit Losses
Management has established a methodology to determine the adequacy of the allowance for credit losses that assesses the risks and losses expected on the loan and lease portfolio and unfunded commitments. Additions to the allowance for credit losses are made by charges to the provision for credit losses. Losses on loans and leases are charged off against the allowance when all or a portion of a loan or lease is considered uncollectible. Subsequent recoveries on loans previously charged off, if any, are credited to the allowance when realized.
To calculate the allowance for loans collectively evaluated, management uses models developed by a third party. The Commercial real estate ("CRE"), Commercial and industrial ("C&I"), and Retail lifetime loss rate models calculate the expected losses over the life of the loan based on exposure at default loan attributes and reasonable, supportable economic forecasts. The exposure at default considers the current unpaid balance, prepayment assumptions and utilization of expected utilization assumptions. The expected loss estimates for two small commercial portfolios and a runoff auto portfolio are based on historical loss rates.
Key assumptions used in the models include portfolio segmentation, prepayments, the expected utilization of unfunded commitments, risk rating and a scalar, among others. The portfolios are segmented by loan level attributes such as loan type, loan size, date of origination, and delinquency status to create homogenous loan pools. Pool level metrics are calculated and loss rates are subsequently applied to the pools as the loans have like characteristics. Prepayment assumptions are embedded within the models and are based on the same data used for model development and incorporate adjustments for reasonable and supportable forecasts. Model development data and developmental time periods vary by model, but all use at least ten years of historical data and capture at least one recessionary period. Expected utilization is based on current utilization and a loan equivalency ("LEQ") factor. LEQ varies by current utilization and provides a reasonable estimate of expected draws and borrower behavior. Assumptions and model inputs are reviewed in accordance with model monitoring practices and as information becomes available.
Historical loss rate models apply a loss rate to the outstanding balance of the loan. Management uses historical loss rates for condominium association, auto, and government lease portfolio segments because these loans have distinct, historical, or expected loss patterns and a de minimus effect on the overall allowance and provision.
F-17
BROOKLINE BANCORP, INC. AND SUBSIDIARIES
Notes to Consolidated Financial Statements (Continued)
Management elected to use multiple economic forecasts in determining the reserve to account for economic uncertainty. The forecasts include various projections of Gross Domestic Product ("GDP"), interest rates, property price indices, and employment measures. The forecasts are probability-weighted based on available information at the time of the calculation execution. Scenario weighting and model parameters are reviewed for each calculation and are subject to change. The models recognize that the life of a loan may exceed the economic forecast, therefore, the models employ mean reversion techniques at the input level to predict credit losses for loans that are expected to mature beyond the forecast period. The forecasts utilized at December 31, 2023 reflect the immediate and longer-term effects of a rising interest rate environment and inflationary conditions.
The CRE lifetime loss rate, C&I lifetime loss rate, and Retail lifetime loss rate models were developed using the historical loss experience of all banks in the model’s developmental dataset. Banks in the model’s developmental dataset may have different loss experiences due to geography and portfolio as well as variances in operational and underwriting procedures from the Company, and therefore, the Company calibrates expected losses using a scalar for each model. Each scalar was calculated by examining the loss rates of peer banks that have similar operations and asset bases to the Company and comparing these peer group loss rates to the model results. Peer group loss rates were used in the scalar calculation because management believes the peer group’s historical losses provide a better reflection of the Company’s current portfolio and operating procedures than the Company’s historical losses. Qualitative adjustments are also applied to select segments of the loan portfolio where applicable.
For December 31, 2023, management applied qualitative adjustments to the CRE lifetime loss rate and C&I lifetime loss rate. These adjustments were made based on historical loss patterns, current loan and portfolio metrics, and expert judgment based on professional experience. These qualitative adjustments resulted in additions to reserves for the CRE and C&I portfolio, as compared to the model output.
The general allowance related to loans collectively evaluated for impairment was determined using a formula-based approach utilizing the risk ratings of individual credits and loss factors derived from historic portfolio loss rates over a lookback period, which include estimates of incurred losses over an estimated loss emergence period (“LEP”). The LEP was generated utilizing a charge-off look-back analysis which studied the time from the first indication of elevated risk of repayment (or other early event indicating a problem) to eventual charge-off to support the LEP considered in the allowance calculation. This
reserving methodology established the approximate number of months of LEP that represented incurred losses for each portfolio.
In addition to quantitative measures, relevant qualitative factors included, but were not limited to: (1) levels and trends in past due and impaired loans, (2) levels and trends in charge-offs, (3) changes in underwriting standards, policy exceptions, and credit policy, (4) experience of lending management and staff, (5) economic trends, (6) industry conditions, (7) effects of changes in credit concentrations, (8) interest rate environment, and (9) regulatory and other changes. The general allowance related to the acquired loans collectively evaluated for impairment were determined based upon the degree, if any, of deterioration in the pooled loans subsequent to acquisition. The qualitative factors used in the determination was the same as those used for originated loans.
Specific reserves are established for loans individually evaluated for impairment when amortized cost basis is greater than the discounted present value of expected future cash flows or, in the case of collateral-dependent loans, when there is an excess of a loan's amortized cost basis over the fair value of its underlying collateral. When loans and leases do not share risk characteristics with other financial assets they are evaluated individually. Individually evaluated loans are reviewed quarterly with adjustments made to the calculated reserve as necessary.
Liability for Unfunded Commitments
In the ordinary course of business, the Company enters into commitments to extend credit, commercial letters of credit, and standby letters of credit. Such financial instruments are recorded in the financial statements when they become payable. The credit risk associated with these commitments is evaluated in a manner similar to the allowance for loan and lease losses.
F-18
BROOKLINE BANCORP, INC. AND SUBSIDIARIES
Notes to Consolidated Financial Statements (Continued)
Premises and Equipment
Premises and equipment are carried at cost less accumulated depreciation and amortization, except for land which is carried at cost. Premises and equipment are depreciated using the straight-line method over the estimated useful life of the assets. Leasehold improvements are amortized using the straight-line method over the shorter of the lease term or the estimated useful life of the improvements.
Costs related to internal-use software development projects that provide significant new functionality are capitalized. Internal-use software is software acquired or modified solely to meet the Company's needs and for which there is no plan to market the software externally. Direct and indirect costs associated with the application development stage of internal use software are capitalized until such time that the software is substantially complete and ready for its intended use. Capitalized costs are amortized on a straight-line basis over the remaining estimated life of the software. Computer software and development costs incurred in the preliminary project stage, as well as training and maintenance costs, are expensed as incurred.
Leases
Bank-Owned Life Insurance
The Company acquired bank-owned life insurance ("BOLI") plans as part of its acquisitions of PCSB Bank, First Ipswich Bank and BankRI. BOLI represents life insurance on the lives of certain current and former employees who have provided positive consent allowing their employer to be the beneficiary of such policies. BankRI and Brookline Bank as successor in interest to First Ipswich Bank, are the beneficiaries of their respective policies. The Banks utilize BOLI as tax-efficient financing for their benefit obligations to their employees, including their retirement obligations and Supplemental Executive Retirement Plans ("SERPs").
Since the Banks are the primary beneficiaries of their respective insurance policies, increases in the cash value of the policies, as well as insurance proceeds received, are recorded in non-interest income and are not subject to income taxes. BOLI is recorded at the cash value of the policies, less any applicable cash surrender charges, and is reflected as an asset in the accompanying consolidated balance sheets. Cash proceeds, if any, are classified as cash flows from investing activities.
Goodwill and Other Identified Intangible Assets
F-19
BROOKLINE BANCORP, INC. AND SUBSIDIARIES
Notes to Consolidated Financial Statements (Continued)
OREO and Other Repossessed Assets
Derivatives
The Company utilizes loan level derivatives which consists of interest rate contracts (swaps, caps and floors), and risk participation agreements as part of the Company's interest-rate risk management strategy for certain assets and liabilities and not for speculative purposes. Based on the Company's intended use for the loan level derivatives at inception, the Company designates the derivative as either an economic hedge of an asset or liability, or a hedging instrument subject to the hedge accounting provisions of FASB ASC Topic 815, "Derivatives and Hedging". These derivatives designated as cash flow hedges involve the receipt of fixed rate amounts from a counterparty in exchange for the Company making variable rate payments.
Loan level derivatives and foreign exchange contracts entered into on behalf of our customers are designated as economic hedges and are recorded at fair value within other assets or liabilities. Changes in the fair value of these non hedging derivatives are recorded directly through earnings at each reporting period.
Transfer of Financial Assets
Transfers of financial assets are accounted for as sales when control over the assets has been surrendered. Control over transferred assets is deemed to be surrendered when (1) the assets have been isolated from the Company, (2) the transferee obtains the right (free of conditions that constrain it from taking advantage of that right) to pledge or exchange the transferred assets, and (3) the Company does not maintain effective control over the transferred assets through an agreement to repurchase them before their maturity.
Securities Sold under Agreements to Repurchase
The Company enters into sales of securities under agreements to repurchase with the Banks' commercial customers. These agreements are treated as financings, and the obligations to repurchase securities sold are reflected as a liability in the consolidated balance sheets. Securities pledged as collateral under agreements to repurchase are reflected as assets in the accompanying consolidated balance sheets.
Employee Benefits
Costs related to the Company's 401(k) plan are recognized in current earnings. Costs related to the Company's nonqualified deferred compensation plan, SERPs and postretirement benefits are recognized over the vesting period or the related service periods of the participating employees. Changes in the funded status of postretirement benefits are recognized through comprehensive income in the year in which changes occur.
The Company previously maintained an Employee Stock Ownership Plan ("ESOP") which was closed pending final regulatory and government approval.
The fair value of restricted stock awards and stock option grants are determined as of the grant date and are recorded as compensation expense over the period in which the shares of restricted stock awards and stock options vest. Forfeitures are accounted for as they occur.
F-20
BROOKLINE BANCORP, INC. AND SUBSIDIARIES
Notes to Consolidated Financial Statements (Continued)
Fair Value Measurements
ASC 820-10, "Fair Value Measurements and Disclosures," defines fair value as the price that would be received to sell an asset or paid to transfer a liability in an orderly transaction between market participants. A fair value measurement assumes that the transaction to sell the asset or transfer the liability occurs in the principal market for the asset or liability or, in the absence of a principal market, the most advantageous market for the asset or liability. The price in the principal (or most advantageous) market used to measure the fair value of the asset or liability is not adjusted for transaction costs. An orderly transaction is a transaction that assumes exposure to the market for a period prior to the measurement date to allow for marketing activities that are usual and customary for transactions involving such assets and liabilities. It is not a forced transaction. Market participants are buyers and sellers in the principal market that are independent, knowledgeable, able to transact, and willing to transact.
A fair-value hierarchy for valuation inputs that gives the highest priority to quoted prices in active markets for identical assets or liabilities and the lowest priority to unobservable inputs are included in ASC 820. The fair value hierarchy is as follows:
Level 1: Inputs are unadjusted quoted prices in active markets for assets and liabilities identical to those reported at fair value.
Level 2: Inputs other than quoted prices included within Level 1. Level 2 inputs are observable either directly or indirectly. These inputs might include quoted prices for similar assets or liabilities in active markets, quoted prices for identical or similar assets in markets that are not active, inputs other than quoted prices that are observable for the asset or liability (such as interest rates, volatilities, prepayment speeds, credit risks, etc.) or inputs that are derived principally from or corroborated by market data by correlation or other means.
Level 3: Inputs are unobservable inputs for an asset or liability that reflect an entity's own assumptions about the assumptions that market participants would use in pricing the assets or liabilities. These inputs are used to determine fair value only when observable inputs are not available.
Earnings per Common Share
Income Taxes
Income taxes are accounted for under the asset and liability method. Under this method, deferred tax assets and liabilities are recognized for the future tax consequences attributable to differences between the financial statement carrying amounts of existing assets and liabilities and their respective tax bases.
Deferred tax assets and liabilities are measured using enacted tax rates expected to apply to taxable income in the years in which those temporary differences are expected to be recovered or settled. The effect on deferred tax assets and liabilities of a change in tax rates is recognized in income in the period that includes the enactment date.
Tax positions that are more likely than not to be sustained upon a tax examination are recognized in the Company's financial statements to the extent that the benefit is greater than 50% likely of being recognized. Interest resulting from underpayment of income taxes is classified as income tax expense in the first period the interest would begin accruing according to the provision of the relevant tax law. Penalties resulting from underpayment of income taxes are classified as income tax expense in the period for which the Company claims or expects to claim an uncertain tax position or in the period in which the Company's judgment changes regarding an uncertain tax position.
For new investment tax credits ("ITC"), the Company chose to apply the flow-through method and immediately recognize the ITC benefit in income tax expense, as opposed to deferring.
F-21
BROOKLINE BANCORP, INC. AND SUBSIDIARIES
Notes to Consolidated Financial Statements (Continued)
Business Combinations
Business combinations are generally accounted for under the acquisition method of accounting whereby assets acquired and liabilities assumed in business combinations are recorded at their estimated fair value as of the acquisition date. The determination of fair value may involve the use of internal or third-party valuation specialists to assist in the determination of the fair value of certain assets and liabilities at the acquisition date, including loans and leases, core deposit intangibles and time deposits. The excess of the cost of acquisition over these fair values is recognized as goodwill. A description of the valuation methodologies used to estimate the fair values of the significant assets acquired and liabilities assumed from the acquisition of PCSB can be found in Note 2 "Acquisitions" within the notes to the consolidated financial statements.
Treasury Stock
Any shares repurchased under the Company's share repurchase programs were purchased in open-market transactions and are held as treasury stock. Treasury stock also consists of common stock withheld to satisfy federal, state and local income tax withholding requirements for employee restricted stock awards upon vesting. All treasury stock is held at cost.
Segment Reporting
An operating segment is defined as a component of a business for which separate financial information is available that is evaluated regularly by the chief operating decision-maker in deciding how to allocate resources and evaluate performance. The Company is a bank holding company with subsidiaries engaged in the business of banking and activities closely related to banking. The Company's banking business provided substantially all of its total revenues and pre-tax income in 2023, 2022 and 2021. Therefore, the Company has determined to be a single segment.
Accounting Standards Adopted in 2023, 2022 and 2021
In March 2020, the FASB issued ASU 2020-04, " Reference Rate Reform (Topic 848)-Facilitation of the Effects of Reference Rate Reform on Financial Reporting" ("ASU 2020-04") to provide optional expedients and exceptions for applying GAAP to certain contracts, hedging relationships, and other transactions affected by reference rate reform if certain criteria are met. The amendments in this update apply only to contracts, hedging relationships, and other transactions that reference the London Interbank Offered Rate ("LIBOR") or another reference rate expected to be discontinued because of reference rate reform. The expedients and exceptions provided by the amendments do not apply to contract modifications made and hedging relationships existing as of December 31, 2022, for which an entity has elected certain optional expedients provided that those elections are retained through the end of the hedging relationship. The amendments in this update are effective for all entities as of March 12, 2020 through December 31, 2022 and do not apply to contract modifications made after December 31, 2022.
In January 2021, FASB issued ASU 2021-01, "Reference Rate Reform (Topic 848)" an update to address concerns around structural risk of interbank offered rates ("IBORs"), particularly, the risk of cessation of the LIBOR. The amendments in this update clarify that certain optional expedients and exceptions in Topic 848 for contract modifications and hedge accounting apply to derivatives that are affected by the discounting transition. In December 2022, FASB issued ASU 2022-06, "Reference Rate Reform (Topic 848)" which deferred the sunset date of Topic 848 to December 31, 2024, to allow for a transition period after the sunset of LIBOR. The Company has adopted the amendments in these updates and established a LIBOR transition committee to guide the Company’s transition from LIBOR. The Company has completed much of the work to transition off the LIBOR index consistent with industry timelines. The working group has identified its products that utilize LIBOR and has implemented fallback language to facilitate the transition to alternative rates. The Company has also evaluated its infrastructure and identified fallback rates as well as started offering alternative indices and new products tied to these alternative indices. The Company does not anticipate the adoption of these standards to have a material impact to the consolidated financial statements.
In August 2021, the FASB issued ASU 2021-06, "Presentation of Financial Statements (Topic 205), Financial Services – Depository and Lending (Topic 942), and Financial Services – Investment Companies (Topic 946) which updated guidance to align with new SEC regulations with regards to statistical disclosures for banking and savings and loan institutions. This ASU is effective for fiscal years ending on or after December 15, 2021. The Company adopted ASU 2021-06 as of December 31, 2021. The adoption did not have a material impact on the Company’s consolidated financial statements.
In October 2021, the FASB issued ASU 2021-08, "Business Combinations (Topic 805), Accounting for Contract Assets and Contract Liabilities from Contracts with Customers" which requires that an acquirer recognize and measure contract assets and contract liabilities acquired in a business combination in accordance with Topic 606, Revenue from Contracts with Customers. At the acquisition date, an acquirer should account for the related revenue contracts in accordance with Topic 606
F-22
BROOKLINE BANCORP, INC. AND SUBSIDIARIES
Notes to Consolidated Financial Statements (Continued)
as if it had originated the contracts. The Company adopted ASU 2021-08 as of January 1, 2023 on a prospective basis. The adoption did not have a material impact on the Company's consolidated financial statements.
F-23
BROOKLINE BANCORP, INC. AND SUBSIDIARIES
Notes to Consolidated Financial Statements (Continued)
(2) Acquisitions
PCSB Financial Corporation
On January 1, 2023, the Company completed its previously announced acquisition (the “merger”) of PCSB Financial Corporation (“PCSB”). Pursuant to the merger agreement, each share of PCSB common stock outstanding at the effective time of the merger was converted into the right to receive, at the holder’s election, either $22.00 in cash consideration or 1.3284 shares of Company common stock for each share of PCSB common stock, subject to allocation procedures to ensure that 60 % of the outstanding shares of PCSB common stock was converted to Company common stock. PCSB’s bank subsidiary, PCSB Bank, operates as a separate subsidiary of the Company and has 14 banking offices throughout the Lower Hudson Valley of New York State.
The transaction was accounted for as a business combination. Accordingly, the purchase price was allocated to the assets acquired and liabilities assumed based on their fair values as of the merger effective date. The determination of fair value required management to make estimates about discount rates, future expected cash flows, market conditions, and other future events that are highly subjective in nature and are subject to change. Fair value estimates of the assets acquired and liabilities assumed may be adjusted for a period up to one year (the measurement period) from the closing date of the merger if new information is obtained about facts and circumstances that existed as of the merger effective date that, if known, would have affected the measurement of the amounts recognized as of that date.
During the year ended December 31, 2023, the Company incurred merger-related expenses totaling $7.4 million.
The following table summarizes the preliminary purchase price allocation to the estimated fair value of the assets acquired and liabilities assumed as of the date of the acquisition:
| Net Assets Acquired at Fair Value | |||||
| (In Thousands) | |||||
| Purchase price consideration | $ | ||||
| ASSETS | |||||
| Cash | |||||
| Investments | |||||
Loans (1) | |||||
| Allowance for credit losses on PCD loans | ( | ||||
| Premises and equipment | |||||
| Core deposit and other intangibles | |||||
| Other assets | |||||
| Total assets acquired | $ | ||||
| LIABILITIES | |||||
| Deposits | $ | ||||
| Borrowings | |||||
| Other liabilities | |||||
| Total liabilities assumed | $ | ||||
| Net assets acquired | |||||
| Goodwill | $ | ||||
In connection with the merger, the Company recorded $80.8 million of goodwill, which represents the excess of the purchase price over the fair value of the net assets acquired.
F-24
BROOKLINE BANCORP, INC. AND SUBSIDIARIES
Notes to Consolidated Financial Statements (Continued)
Fair values of the major categories of assets acquired and liabilities assumed were determined as follows:
Cash and Cash Equivalents
The fair values of cash and cash equivalents approximate the respective carrying amounts because the instruments are payable on demand or have short-term maturities.
Investments
The fair values for investment securities available-for-sale were based on quoted market prices, where available. If quoted market prices were not available, fair value estimates are based on observable inputs, including quoted market prices for similar instruments. Investment securities held-to-maturity were reclassified to investment securities available-for-sale based on the Company's intent at closing.
In 2023, the Company restructured the investment portfolio acquired from PCSB. The Company sold approximately 75 % of the portfolio which equates to $228.3 million of book value of predominantly longer dated Agency mortgage-backed securities ("MBS"), Agency collateralized mortgage obligations ("CMOs"), corporate and municipal securities. The weighted average duration of these securities was 6.1 years with an average risk weighting of assets of 33 %. The Company recognized a $1.7 million gain from selling these securities.
Proceeds from the sale and additional cash on hand was used to purchase $379.5 million of short duration securities, the majority of which are US Treasuries, Agency debt and Agency MBS, and a small position of short term Municipal Bond Anticipation Notes. Additional details can be found in Note 3, "Investment Securities".
The weighted average duration of these securities was 2.1 years with an average risk weighting of assets of 8 %.
Loans
The fair value of the loan portfolio was calculated on an individual loan basis using discounted cash flow analysis, with results presented and assumptions applied on a summary basis based on pools in which the loans were classified. This analysis took into consideration the contractual terms of the loans and assumptions related to the discount rate, including cost of debt, cost of equity, servicing cost and other liquidity/risk premium considerations to estimate the projected cash flows and prepayment rate. The loss rates for the loans were estimated using Probability of Default (cumulative) and Loss Given Default assumptions. The assumptions used in determining the fair value of the loan portfolio were considered reasonable from a market-participant viewpoint.
The Company recorded a $49.8 million discount from the results of the loan accounting valuation.
Deposits - Core Deposits Intangible ("CDI")
Accounts included in the CDI include demand deposits, NOW accounts, money market accounts and savings accounts. The fair value of the CDI was derived from using a financial institution-specific income approach, specifically the after-tax cost savings method. Assumptions used in the valuation of the CDI include customer attrition, deposit interest rates, service charge income, overhead expense, discount rate, and costs of alternative funding.
The Company recorded a $30.3 million CDI from the results of the deposit valuation. The CDI is being amortized at an accelerated rate over 7 years using the sum-of-the-years method.
Certificates of Deposits
The certificates of deposits were recorded at fair value. The determination of the fair value was calculated using discounted cash flow analysis, which involved present valuing the contractual payments over the remaining life of the certificate of deposit at market based-rates.
The Company recorded a $3.2 million discount from the results of the certificate of deposit valuation.
F-25
BROOKLINE BANCORP, INC. AND SUBSIDIARIES
Notes to Consolidated Financial Statements (Continued)
Borrowings
The fair value of the FHLB advances were ascertained by using discounted cash flow analysis of the contractual payments over the remaining life of the advances at market-based interest rates. The FHLB advances were disaggregated on an individual advance basis and management used FHLB of New York rates as of December 30, 2022 as the market rate in the present value calculation.
The Company recorded a $0.3 million discount on the assumed FHLB advances.
PCD Loans and Leases
Purchased loans and leases that have experienced more-than-insignificant deterioration in credit quality since origination are considered purchase credit deteriorated ("PCD"). For PCD loans and leases, the initial estimate of expected credit losses was established through an adjustment to the unpaid principal balance and non-credit discount at acquisition.
The following table reconciles the unpaid principal balance to the fair value of PCD loans and leases:
| (In Thousands) | |||||
| Total unpaid principal balance | $ | ||||
| Allowance for credit losses at acquisition | ( | ||||
| Non-credit discount | ( | ||||
| Fair value | $ | ||||
F-26
BROOKLINE BANCORP, INC. AND SUBSIDIARIES
Notes to Consolidated Financial Statements (Continued)
Supplemental Pro Forma Financial Information
The following table summarizes supplemental pro forma financial information giving effect to the merger as if it had been completed on January 1, 2022:
| At December 31, | ||||||||||||||
| 2023 | 2022 | |||||||||||||
| (In Thousands) | ||||||||||||||
| Net interest income | ||||||||||||||
| Non-interest income | ||||||||||||||
| Net income | ||||||||||||||
The supplemental pro forma financial information does not necessarily reflect the results of operations that would have occurred had Brookline Bancorp, Inc. merged with PCSB on January 1, 2022. The supplemental pro forma financial information includes the impact of (i) accreting and amortizing the discounts and premiums associated with the estimated fair value adjustments to acquired loans and leases, investment securities, deposits, and borrowings, (ii) the amortization of recognized intangible assets, (iii) accreting and amortizing the discounts and premiums associated with acquired premises and leases, and (iv) the related estimated income tax effects. Costs savings and other business synergies related to the merger are not included in the supplemental pro forma financial information.
In addition, the supplemental pro forma financial information was adjusted to include the $7.4 million of merger-related expenses recognized during the twelve months ended December 31, 2023, as summarized in the following table:
| At December 31, | |||||
| 2023 | |||||
| (In Thousands) | |||||
Compensation and benefits (1) | $ | ||||
Technology and equipment (2) | |||||
Professional and outside services (3) | |||||
Other expense (4) | |||||
| Total merger-related expenses | $ | ||||
(1) Comprised primarily of severance and employee retention costs.
(2) Comprised primarily of technology contract termination fees.
(3) Comprised primarily of advisory, legal, accounting, and other professional fees.
(4) Comprised primarily of costs of travel and other miscellaneous expenses.
Brookline Bancorp, Inc.’s operating results for the year ended December 31, 2023 include the operating results of acquired assets and assumed liabilities of PCSB subsequent to the merger on January 1, 2023. The amount of net interest income, non-interest income and net income of $63.2 million, $4.5 million and $3.3 million, respectively, attributable to the acquisition of PCSB were included in Brookline Bancorp, Inc.’s Consolidated Statement of Income for the year ended December 31, 2023. PCSB’s net interest income, non-interest income and net income noted above reflect management’s best estimates, based on information available at the reporting date.
(3) Cash, Cash Equivalents and Short-Term Investments
Aggregate reserve balances included in cash and cash equivalents were $108.3 million and $301.2 million, respectively, as of December 31, 2023 and 2022.
F-27
BROOKLINE BANCORP, INC. AND SUBSIDIARIES
Notes to Consolidated Financial Statements (Continued)
Short-term investments are summarized as follows:
| At December 31, | |||||||||||
| 2023 | 2022 | ||||||||||
| (In Thousands) | |||||||||||
| FRB interest bearing reserve | $ | $ | |||||||||
| FHLB overnight deposits | |||||||||||
| Total short-term investments | $ | $ | |||||||||
(4) Investment Securities
The following tables set forth investment securities available-for-sale at the dates indicated:
| At December 31, 2023 | |||||||||||||||||||||||
| Amortized Cost | Gross Unrealized Gains | Gross Unrealized Losses | Estimated Fair Value | ||||||||||||||||||||
| (In Thousands) | |||||||||||||||||||||||
| Investment securities available-for-sale: | |||||||||||||||||||||||
| GSE debentures | $ | $ | $ | $ | |||||||||||||||||||
| GSE CMOs | |||||||||||||||||||||||
| GSE MBSs | |||||||||||||||||||||||
| Municipal obligations | |||||||||||||||||||||||
| Corporate debt obligations | |||||||||||||||||||||||
| U.S. Treasury bonds | |||||||||||||||||||||||
| Foreign government obligations | |||||||||||||||||||||||
| Total investment securities available-for-sale | $ | $ | $ | $ | |||||||||||||||||||
| At December 31, 2022 | |||||||||||||||||||||||
| Amortized Cost | Gross Unrealized Gains | Gross Unrealized Losses | Estimated Fair Value | ||||||||||||||||||||
| (In Thousands) | |||||||||||||||||||||||
| Investment securities available-for-sale: | |||||||||||||||||||||||
| GSE debentures | $ | $ | $ | $ | |||||||||||||||||||
| GSE CMOs | |||||||||||||||||||||||
| GSE MBSs | |||||||||||||||||||||||
| Corporate debt obligations | |||||||||||||||||||||||
| U.S. Treasury bonds | |||||||||||||||||||||||
| Foreign government obligations | |||||||||||||||||||||||
| Total investment securities available-for-sale | $ | $ | $ | $ | |||||||||||||||||||
As of December 31, 2023, the fair value of all investment securities available-for-sale was $916.6 million, with net unrealized losses of $67.7 million, compared to a fair value of $656.8 million and net unrealized losses of $77.2 million as of December 31, 2022. As of December 31, 2023, $717.2 million, or 77.8 % of the portfolio, had gross unrealized losses of $69.0 million, compared to $630.5 million, or 96.0 % of the portfolio, with gross unrealized losses of $77.5 million as of December 31, 2022.
As of December 31, 2023 and 2022, the Company did not hold any securities as held to maturity; all securities were held as available-for-sale.
F-28
BROOKLINE BANCORP, INC. AND SUBSIDIARIES
Notes to Consolidated Financial Statements (Continued)
Investment Securities as Collateral
As of December 31, 2023 and 2022, respectively, $791.2 million and $387.9 million of investment securities were pledged as collateral for repurchase agreements; municipal deposits; treasury, tax and loan deposits ("TT&L"); swap agreements; FRB borrowings; and FHLB of Boston and FHLB of New York borrowings. The Banks did no
Allowance for Credit Losses-Available-for-Sale Securities
For available-for-sale securities in an unrealized loss position, management first assesses whether (i) the Company intends to sell the security, or (ii) it is more likely than not that the Company will be required to sell the security before recovery of its amortized cost basis. If either criterion is met, any previously recognized allowances are charged-off and the security's amortized cost is written down to fair value through income. If neither criterion is met, the security is evaluated to determine whether the decline in fair value has resulted from credit losses or other factors. In making this assessment, management considers the extent to which fair value is less than amortized cost, any changes to the rating of the security by a rating agency and any adverse conditions specifically related to the security, among other factors.
If this assessment indicates that a credit loss exists, the present value of cash flows expected to be collected from the security is compared to the amortized cost basis of the security. If the present value of cash flows expected to be collected is less than the amortized cost basis, an allowance for credit loss is recorded, limited by the amount that the fair value is less than the amortized cost basis. Any impairment that has not been recorded through an ACL is recognized in other comprehensive income. Adjustments to the allowance are reported as a component of credit loss expense. Available-for-sale securities are charged-off against the allowance or, in the absence of any allowance, written down through income when deemed uncollectible or when either of the aforementioned criteria regarding intent or requirement to sell is met. The Company has made the accounting policy election to exclude accrued interest receivable on available-for-sale securities from the estimate of credit losses. Accrued interest receivables 4.1 million and $2.6 million, respectively, as of December 31, 2023 and 2022.
A debt security is placed on nonaccrual status at the time any principal or interest payments become more than 90 days delinquent or if full collection of interest or principal becomes uncertain. Accrued interest for a debt security placed on nonaccrual is reversed against interest income. There were no debt securities on nonaccrual status and therefore there was no accrued interest related to debt securities reversed against interest income for the years ended December 31, 2023 and 2022.
Assessment for Available for Sale Securities for Impairment
Investment securities as of December 31, 2023 and 2022 that have been in a continuous unrealized loss position for less than twelve months or twelve months or longer are as follows:
| At December 31, 2023 | |||||||||||||||||||||||||||||||||||
| Less than Twelve Months | Twelve Months or Longer | Total | |||||||||||||||||||||||||||||||||
| Estimated Fair Value | Unrealized Losses | Estimated Fair Value | Unrealized Losses | Estimated Fair Value | Unrealized Losses | ||||||||||||||||||||||||||||||
| (In Thousands) | |||||||||||||||||||||||||||||||||||
| Investment securities available-for-sale: | |||||||||||||||||||||||||||||||||||
| GSE debentures | $ | $ | $ | $ | $ | $ | |||||||||||||||||||||||||||||
| GSE CMOs | |||||||||||||||||||||||||||||||||||
| GSE MBSs | |||||||||||||||||||||||||||||||||||
| Municipal obligations | |||||||||||||||||||||||||||||||||||
| Corporate debt obligations | |||||||||||||||||||||||||||||||||||
| U.S. Treasury bonds | |||||||||||||||||||||||||||||||||||
| Foreign government obligations | |||||||||||||||||||||||||||||||||||
| Temporarily impaired investment securities available-for-sale | |||||||||||||||||||||||||||||||||||
| Total temporarily impaired investment securities | $ | $ | $ | $ | $ | $ | |||||||||||||||||||||||||||||
F-29
BROOKLINE BANCORP, INC. AND SUBSIDIARIES
Notes to Consolidated Financial Statements (Continued)
| At December 31, 2022 | |||||||||||||||||||||||||||||||||||
| Less than Twelve Months | Twelve Months or Longer | Total | |||||||||||||||||||||||||||||||||
| Estimated Fair Value | Unrealized Losses | Estimated Fair Value | Unrealized Losses | Estimated Fair Value | Unrealized Losses | ||||||||||||||||||||||||||||||
| (In Thousands) | |||||||||||||||||||||||||||||||||||
| Investment securities available-for-sale: | |||||||||||||||||||||||||||||||||||
| GSE debentures | $ | $ | $ | $ | $ | $ | |||||||||||||||||||||||||||||
| GSE CMOs | |||||||||||||||||||||||||||||||||||
| GSE MBSs | |||||||||||||||||||||||||||||||||||
| U.S. Treasury bonds | |||||||||||||||||||||||||||||||||||
| Foreign government obligations | |||||||||||||||||||||||||||||||||||
| Temporarily impaired investment securities available-for-sale | |||||||||||||||||||||||||||||||||||
| Total temporarily impaired investment securities | $ | $ | $ | $ | $ | $ | |||||||||||||||||||||||||||||
The Company performs regular analysis on the investment securities available-for-sale portfolio to determine whether a decline in fair value indicates that an investment security is impaired. In making these impairment determinations, management considers, among other factors, projected future cash flows; credit subordination and the creditworthiness; capital adequacy and near-term prospects of the issuers.
Management also considers the Company's capital adequacy, interest-rate risk, liquidity and business plans in assessing whether it is more likely than not that the Company will sell or be required to sell the investment securities before recovery. If the Company determines that a security investment is impaired and that it is more likely than not that the Company will not sell or be required to sell the investment security before recovery of its amortized cost, the credit portion of the impairment loss is recognized in the Company's consolidated statement of income and the noncredit portion is recognized in accumulated other comprehensive income. The credit portion of the impairment represents the difference between the amortized cost and the present value of the expected future cash flows of the investment security. If the Company determines that a security is impaired and it is more likely than not that it will sell or be required to sell the investment security before recovery of its amortized cost, the entire difference between the amortized cost and the fair value of the security will be recognized in the Company's consolidated statement of income.
Investment Securities Available-For-Sale Impairment Analysis
The following discussion summarizes, by investment security type, the basis for evaluating if the applicable investment securities within the Company’s available-for-sale portfolio were impaired as of December 31, 2023. The Company has determined it is more likely than not that the Company will not sell or be required to sell the investment securities before recovery of its amortized cost. The Company's ability and intent to hold these investment securities until recovery is supported by the Company's strong capital and liquidity positions as well as its historically low portfolio turnover. As such, management has determined that the investment securities are not impaired as of December 31, 2023. If market conditions for investment securities worsen or the creditworthiness of the underlying issuers deteriorates, it is possible that the Company may recognize additional impairment in future periods.
U.S. Government-Sponsored Enterprises
The Company invests in securities issued by U.S. Government-sponsored enterprises ("GSEs"), including GSE debentures, mortgage-backed securities ("MBSs"), and collateralized mortgage obligations ("CMOs"). GSE securities include obligations issued by the Federal National Mortgage Association ("FNMA"), the Federal Home Loan Mortgage Corporation ("FHLMC"), the Government National Mortgage Association ("GNMA"), the FHLB and the Federal Farm Credit Bank. As of December 31, 2023, the Company held GNMA MBSs and CMOs, and Small Business Administration ("SBA") commercial loan asset-backed securities in its available-for-sale portfolio with an estimated fair value of $33.9 million, all of which were backed explicitly by the full faith and credit of the U.S. Government, compared to $2.7 million as of December 31, 2022.
F-30
BROOKLINE BANCORP, INC. AND SUBSIDIARIES
Notes to Consolidated Financial Statements (Continued)
As of December 31, 2023, the Company owned 43 GSE debentures with a total fair value of $201.1 million, and a net unrealized loss of $19.5 million. The acquisition of PSCB accounted for $39.2 million of the total fair value at December 31, 2023. As of December 31, 2022, the Company held 32 GSE debentures with a total fair value of $152.4 million, and a net unrealized loss of $24.3 million. As of December 31, 2023, 27 of the 43 securities in this portfolio were in an unrealized loss position. As of December 31, 2022, 31 of the 32 securities in this portfolio were in an unrealized loss position. All securities are performing and backed by the implicit (FHLB/FNMA/FHLMC) or explicit (GNMA/SBA) guarantee of the U.S. Government. During the twelve months ended December 31, 2023, the Company purchased $40.8 million of GSE debentures securities compared to the same period in 2022, when the Company did not purchase any GSE debentures securities.
As of December 31, 2023, the Company owned 60 GSE CMOs with a total fair value of $61.6 million and a net unrealized loss of $4.8 million. The acquisition of PSCB accounted for $47.0 million of the total fair value at December 31, 2023. As of December 31, 2022, the Company held 32 GSE CMOs with a total fair value of $18.2 million with a net unrealized loss of $1.8 million. As of December 31, 2023, 57 of the 60 securities in this portfolio were in an unrealized loss position. As of December 31, 2022, all of the securities in this portfolio were in an unrealized loss position. All securities are performing and backed by the implicit (FHLB/FNMA/FHLMC) or explicit (GNMA) guarantee of the U.S. Government. For the years ended December 31, 2023 and 2022, the Company did no
As of December 31, 2023, the Company owned 146 GSE MBSs with a total fair value of $170.0 million and a net unrealized loss of $16.6 million. The acquisition of PSCB accounted for $46.5 million of the total fair value at December 31, 2023. As of December 31, 2022, the Company held 134 GSE MBSs with a total fair value of $140.6 million with a net unrealized loss of $19.2 million. As of December 31, 2023, 125 of the 146 securities in this portfolio were in an unrealized loss position. As of December 31, 2022, 128 of the 134 securities in this portfolio were in an unrealized loss position. All securities are performing and backed by the implicit (FHLB/FNMA/FHLMC) or explicit (GNMA) guarantee of the U.S. Government. During the twelve months ended December 31, 2023, the Company purchased $39.4 million of GSE MBS securities compared to the same period in 2022, when the Company did not purchase any GSE debentures securities.
Municipal Obligations
The Company invests in certain state and municipal securities with high credit ratings for portfolio diversification and tax planning purposes. As of December 31, 2023, the Company owned 44 municipal obligation securities with a total fair value of $18.9 million and a net unrealized gain of $0.1 million. The acquisition of PCSB, and purchases year to date accounted for all of the total fair value at December 31, 2023. As of December 31, 2022, the Company did not hold any municipal securities. As of December 31, 2023, 6 of the 44 securities in this portfolio were in an unrealized loss position. During the twelve months ended December 31, 2023, the Company purchased $10.0 million of municipal securities compared to the same period in 2022 when the Company did not purchase any municipal securities.
Corporate Obligations
The Company may invest in high-quality corporate obligations to provide portfolio diversification and improve the overall yield on the portfolio. As of December 31, 2023, the Company owned 11 corporate obligation securities with a total fair value of $19.7 million and a net unrealized loss of $0.8 million. The acquisition of PSCB accounted for $13.3 million of the total fair value at December 31, 2023. As of December 31, 2022, the Company held 4 corporate obligation securities with a total fair value of $13.8 million and a net unrealized loss of $0.3 million. As of December 31, 2023, 9 of the 11 securities in this portfolio were in an unrealized loss position. As of December 31, 2022, all of the securities in this portfolio were in an unrealized loss position. Full collection of the obligations is expected because the financial condition of the issuers is sound, they have not defaulted on scheduled payments, the obligations are rated investment grade, and the Company has the ability and intent to hold the obligations for a period of time to recover the amortized cost. For the years ended December 31, 2023 and 2022, the Company did no
F-31
BROOKLINE BANCORP, INC. AND SUBSIDIARIES
Notes to Consolidated Financial Statements (Continued)
U.S. Treasury Bonds
The Company invests in securities issued by the U.S. government. As of December 31, 2023, the Company owned 66 U.S. Treasury bonds with a total fair value of $444.7 million and a net unrealized loss of $26.0 million. The acquisition of PSCB accounted for $166.1 million of the total fair value at December 31, 2023. As of December 31, 2022, the Company owned 41 U.S. Treasury bonds with a total fair value of $331.3 million and a net unrealized loss of $31.5 million. As of December 31, 2023, 53 of the 66 securities in this portfolio were in an unrealized loss position. As of December 31, 2022, 38 of the 41 securities in this portfolio were in unrealized loss positions. During the twelves months ended December 31, 2023 the Company purchased $272.7 million U.S. Treasury bonds compared to the same period in 2022 when the Company purchased $197.1 million, of U.S. Treasury bonds.
Foreign Government Obligations
As of December 31, 2023 and 2022, the Company owned 1 0.5
Portfolio Maturities
The final stated maturities of the debt securities are as follows for the periods indicated:
| At December 31, | |||||||||||||||||||||||||||||||||||
| 2023 | 2022 | ||||||||||||||||||||||||||||||||||
| Amortized Cost | Estimated Fair Value | Weighted Average Rate | Amortized Cost | Estimated Fair Value | Weighted Average Rate | ||||||||||||||||||||||||||||||
| (Dollars in Thousands) | |||||||||||||||||||||||||||||||||||
| Investment securities available-for-sale: | |||||||||||||||||||||||||||||||||||
| Within 1 year | $ | $ | $ | $ | |||||||||||||||||||||||||||||||
| After 1 year through 5 years | |||||||||||||||||||||||||||||||||||
| After 5 years through 10 years | |||||||||||||||||||||||||||||||||||
| Over 10 years | |||||||||||||||||||||||||||||||||||
| $ | $ | $ | $ | ||||||||||||||||||||||||||||||||
Actual maturities of debt securities will differ from those presented above since certain obligations amortize and may also provide the issuer the right to call or prepay the obligation prior to scheduled maturity without penalty. MBSs and CMOs are included above based on their final stated maturities; the actual maturities, however, may occur earlier due to anticipated prepayments and stated amortization of cash flows.
As of December 31, 2023, issuers of debt securities with an estimated fair value of $122.0 million had the right to call or prepay the obligations. Of the $122.0 million, approximately $6.4 million matures in less then 1 year, $59.7 million matures in 1-5 years, $48.0 million matures in 6-10 years, and $7.9 million mature after ten years. As of December 31, 2022, issuers of debt securities with an estimated fair value of approximately $53.1 million had the right to call or prepay the obligations. Of the $53.1 million, approximately $2.5 million matures in less than 1 year, $6.3 million matures in 1-5 years, $37.4 million matures in 6-10 years, and $6.9 million matures after ten years.
Security Sales
The proceeds from the sale of investment securities available-for-sale were $230.0 million during the year ended December 31, 2023. This compares to $78.8 million securities sold during the year ended December 31, 2022. Securities sales executed during the twelve months ended were related to the acquisition of PCSB and the restructuring of the acquired investment portfolio
F-32
BROOKLINE BANCORP, INC. AND SUBSIDIARIES
Notes to Consolidated Financial Statements (Continued)
| Year Ended December 31, | |||||||||||
| 2023 | 2022 | ||||||||||
| (In Thousands) | |||||||||||
| Proceeds from sales of investment securities available-for-sale | $ | $ | |||||||||
| Gross gains from sales | |||||||||||
| Gross losses from sales | ( | ( | |||||||||
| Gain (loss) on sales of securities, net | $ | $ | ( | ||||||||
(5) Restricted Equity Securities
Investments in the restricted equity securities of various entities are as follows:
| At December 31, | |||||||||||
| 2023 | 2022 | ||||||||||
| (In Thousands) | |||||||||||
| FHLB stock | $ | $ | |||||||||
| FRB stock | |||||||||||
| Other restricted equity securities | |||||||||||
| $ | $ | ||||||||||
The Company invests in the stock of FHLB Boston and New York as one of the requirements to borrow. As of December 31, 2023 and 2022, FHLB stock is recorded at its carrying value, which is equal to cost and which management believes approximates its fair value. The FHLB Boston paid a dividend to member banks at an annualized rate of 765 basis points in 2023. The FHLB Boston increased its dividend from 667 basis points in the first quarter of 2023 to 831 basis points in the fourth quarter of 2023. The FHLB New York paid a dividend to member banks at an annualized rate of 888 basis points in 2023. The FHLB New York increased its dividend from 775 basis points in the first quarter of 2023 to 975 basis points in the fourth quarter of 2023. As of December 31, 2023, the Company's investment in FHLB stock met the total stock investment requirement.
The Company invests in the stock of the Federal Reserve Bank of Boston and the Federal Reserve Bank of New York as required by its the Banks' membership in the Federal Reserve system. As of December 31, 2023 and 2022, Federal Reserve Bank stock is recorded at its carrying value, which is equal to cost and which management believes approximates its fair value.
F-33
BROOKLINE BANCORP, INC. AND SUBSIDIARIES
Notes to Consolidated Financial Statements (Continued)
(6) Loans and Leases
The following table presents the amortized cost of loans and leases and weighted average coupon rates for the loan and lease portfolios at the dates indicated:
| At December 31, 2023 | At December 31, 2022 | ||||||||||||||||||||||
| Balance | Weighted Average Coupon | Balance | Weighted Average Coupon | ||||||||||||||||||||
| (Dollars In Thousands) | |||||||||||||||||||||||
| Commercial real estate loans: | |||||||||||||||||||||||
| Commercial real estate | $ | % | $ | % | |||||||||||||||||||
| Multi-family mortgage | % | % | |||||||||||||||||||||
| Construction | % | % | |||||||||||||||||||||
| Total commercial real estate loans | % | % | |||||||||||||||||||||
| Commercial loans and leases: | |||||||||||||||||||||||
Commercial | % | % | |||||||||||||||||||||
| Equipment financing | % | % | |||||||||||||||||||||
| Condominium association | % | % | |||||||||||||||||||||
| Total commercial loans and leases | % | % | |||||||||||||||||||||
| Consumer loans: | |||||||||||||||||||||||
| Residential mortgage | % | % | |||||||||||||||||||||
| Home equity | % | % | |||||||||||||||||||||
| Other consumer | % | % | |||||||||||||||||||||
| Total consumer loans | % | % | |||||||||||||||||||||
| Total loans and leases | $ | % | $ | % | |||||||||||||||||||
Accrued interest on loans and leases, which were excluded from the amortized cost of loans and leases totaled $39.1 million and $26.1 million at December 31, 2023 and December 31, 2022, respectively, and were included in other assets in the accompanying consolidated balance sheets.
The net unamortized deferred loan origination costs and premium and discount on acquired loans included in total loans and leases were $(29.0 ) million and $11.3 million as of December 31, 2023 and 2022, respectively.
The Banks and their subsidiaries lend primarily in New England and New York, with the exception of equipment financing, of which 29 % is in the Greater New York and New Jersey metropolitan area and 71 % of which is in other areas in the United States of America as of December 31, 2023.
The Banks' authority to extend credit to their respective directors and executive officers, as well as to entities controlled by such persons, is currently governed by the requirements of the Sarbanes-Oxley Act and Regulation O of the FRB. Among other things, these provisions require that extensions of credit to insiders (1) be made on terms that are substantially the same as, and follow credit underwriting procedures that are not less stringent than, those prevailing for comparable transactions with unaffiliated persons and that do not involve more than the normal risk of repayment or present other unfavorable features; and (2) not exceed certain limitations on the amount of credit extended to such persons, individually and in the aggregate, which limits are based, in part, on the amount of the Banks' capital. In addition, the extensions of credit to insiders must be approved by the applicable Bank's Board of Directors.
F-34
BROOKLINE BANCORP, INC. AND SUBSIDIARIES
Notes to Consolidated Financial Statements (Continued)
The following table summarizes the change in the total amounts of loans and advances to directors, executive officers and their affiliates for the periods indicated. All loans were performing as of December 31, 2023 and 2022.
| Year Ended December 31, | |||||||||||
| 2023 | 2022 | ||||||||||
| (Dollars In Thousands) | |||||||||||
| Balance at beginning of year | $ | $ | |||||||||
| New loans granted during the year | |||||||||||
| New loans to existing relationship | |||||||||||
| Net (repayments)/additional drawals | |||||||||||
| Balance at end of year | $ | $ | |||||||||
Unfunded commitments on extensions of credit to related parties totaled $30.1 million and $12.1 million as of December 31, 2023 and 2022, respectively.
Loans and Leases Pledged as Collateral
As of December 31, 2023 and 2022, there were $3.5 billion and $2.4 billion, respectively, of loans and leases pledged as collateral for repurchase agreements; municipal deposits; treasury, tax and loan deposits; swap agreements; FRB borrowings, and FHLB borrowings. The Banks did no
(7) Allowance for Credit Losses
The following tables present the changes in the allowance for loan and lease losses and the recorded investment in loans and leases by portfolio segment for the periods indicated:
| Year Ended December 31, 2023 | |||||||||||||||||||||||
| Commercial Real Estate | Commercial | Consumer | Total | ||||||||||||||||||||
| (In Thousands) | |||||||||||||||||||||||
| Balance at December 31, 2022 | $ | $ | $ | $ | |||||||||||||||||||
| Charge-offs | ( | ( | ( | ( | |||||||||||||||||||
| Recoveries | |||||||||||||||||||||||
| Provision (credit) for loan and lease losses excluding unfunded commitments | |||||||||||||||||||||||
| Balance at December 31, 2023 | $ | $ | $ | $ | |||||||||||||||||||
The table above excludes the establishment of the initial reserve for PCD loans and leases of $2.3 million, net of
$2.3 million of day one charge-offs recognized at the date of the acquisition in accordance with GAAP.
| Year Ended December 31, 2022 | |||||||||||||||||||||||
| Commercial Real Estate | Commercial | Consumer | Total | ||||||||||||||||||||
| (In Thousands) | |||||||||||||||||||||||
| Balance at December 31, 2021 | $ | $ | $ | $ | |||||||||||||||||||
| Charge-offs | ( | ( | ( | ( | |||||||||||||||||||
| Recoveries | |||||||||||||||||||||||
| Provision (credit) for loan and lease losses excluding unfunded commitments | ( | ||||||||||||||||||||||
| Balance at December 31, 2022 | $ | $ | $ | $ | |||||||||||||||||||
F-35
BROOKLINE BANCORP, INC. AND SUBSIDIARIES
Notes to Consolidated Financial Statements (Continued)
The allowance for credit losses for unfunded credit commitments, which is included in other liabilities, was $19.8 million, and $20.6 million at December 31, 2023 and December 31, 2022, respectively. $17.1 million of the allowance for credit losses for unfunded commitments at December 31, 2023 was collectively evaluated.
Provision for Credit Losses
The (credit) provisions for credit losses are set forth below for the periods indicated:
| Year Ended December 31, | |||||||||||||||||
| 2023 | 2022 | 2021 | |||||||||||||||
| (In Thousands) | |||||||||||||||||
| Provision (credit) for loan and lease losses: | |||||||||||||||||
| Commercial real estate | $ | $ | ( | $ | ( | ||||||||||||
| Commercial | |||||||||||||||||
| Consumer | ( | ||||||||||||||||
| Total provision (credit) for loan and lease losses | ( | ||||||||||||||||
| Unfunded credit commitments | ( | ||||||||||||||||
| Investment securities available-for-sale | |||||||||||||||||
| Total provision (credit) for credit losses | $ | $ | $ | ( | |||||||||||||
Allowance for Credit Losses Methodology
Management has established a methodology to determine the adequacy of the allowance for credit losses that assesses the risks and losses expected on the loan and lease portfolio and unfunded commitments. Additions to the allowance for credit losses are made by charges to the provision for credit losses. Losses on loans and leases are charged off against the allowance when all or a portion of a loan or lease is considered uncollectible. Subsequent recoveries on loans previously charged off, if any, are credited to the allowance when realized.
To calculate the allowance for loans collectively evaluated, management uses models developed by a third party. Commercial real estate ("CRE"), commercial and industrial ("C&I"), and retail lifetime loss rate models calculate the expected losses over the life of the loan based on exposure at default loan attributes and reasonable, supportable economic forecasts. The exposure at default considers the current unpaid balance, prepayment assumptions and expected utilization assumptions. The expected loss estimates for two small commercial portfolios are based on historical loss rates.
Key assumptions used in the models include portfolio segmentation, prepayments, and the expected utilization of unfunded commitments, among others. The portfolios are segmented by loan level attributes such as loan type, loan size, date of origination, and delinquency status to create homogenous loan pools. Pool level metrics are calculated and loss rates are subsequently applied to the pools as the loans have like characteristics. Prepayment assumptions are embedded within the models and are based on the same data used for model development and incorporate adjustments for reasonable and supportable forecasts. Model development data and developmental time periods vary by model, but all use at least ten years of historical data and capture at least one recessionary period. Expected utilization is based on current utilization and a loan equivalency ("LEQ") factor. LEQ varies by current utilization and provides a reasonable estimate of expected draws and borrower behavior. Assumptions and model inputs are reviewed in accordance with model monitoring practices and as information becomes available.
The ACL estimate incorporates reasonable and supportable forecasts of various macro-economic variables over the remaining life of loans and leases. The development of the reasonable and supportable forecast assume each macro-economic variable will revert to long-term expectations, with reversion characteristics unique to specific economic indicators and forecasts. Reversion towards long-term expectations generally begins to three years from the forecast start date and largely completes within the first five years .
Management elected to use multiple economic forecasts in determining the reserve to account for economic uncertainty. The forecasts include various projections of Gross Domestic Product ("GDP"), interest rates, property price indices, and employment measures. Scenario weighting and model parameters are reviewed for each calculation and updated to reflect facts and circumstances as of the financial statement date. The forecasts utilized at December 31, 2023 reflect the immediate and longer-term effects of a rising interest rate environment and inflationary conditions.
F-36
BROOKLINE BANCORP, INC. AND SUBSIDIARIES
Notes to Consolidated Financial Statements (Continued)
As of December 31, 2023, management applied qualitative adjustments to the CRE lifetime loss rate, C&I lifetime loss rate, and retail lifetime loss rate models. These adjustments addressed model limitations, were based on historical loss patterns, and targeted specific risks within certain portfolios. A general qualitative adjustment was applied to all models to account for general economic uncertainty by placing a greater probability on negative economic forecasts. Additional qualitative adjustments were applied to the commercial, multifamily, and commercial real estate (includes owner occupied, non-owner occupied, and construction) portfolios based on the Company’s historical loss experience and the loss experience of the Company’s peer group. High risk segments of the Eastern Funding portfolios also received additional qualitative adjustments based on recent loss history and expected liquidation values. These qualitative adjustments resulted in additions to reserves for all portfolios, as compared to the model output.
Specific reserves are established for loans individually evaluated for impairment when amortized cost basis is greater than the discounted present value of expected future cash flows or, in the case of collateral-dependent loans, when there is an excess of a loan's amortized cost basis over the fair value of its underlying collateral. When loans and leases do not share risk characteristics with other financial assets they are evaluated individually. Individually evaluated loans are reviewed quarterly with adjustments made to the calculated reserve as necessary.
The general allowance for loan and lease losses was $108.4 million as of December 31, 2023, compared to $95.4 million as of December 31, 2022. The increase in the general allowance was primarily driven by the acquisition of PCSB Bank in 2023, which contributed $14.7 million of the $13.0 million increase, and was offset by an overall decrease in the general allowance of all entities, excluding PCSB Bank.
The specific allowance for loan and lease losses was $9.1 million as of December 31, 2023, compared to $3.1 million as of December 31, 2022. The increase of $6.0 million was primarily driven by a $5.0 million increase in the specific reserve for commercial real estate relationships and a $1.5 million increase in specific reserve for select equipment financing relationships, offset by a $0.6 million decrease in the specific reserve for C&I relationships.
As of December 31, 2023, management believes that the methodology for calculating the allowance is sound and that the allowance provides a reasonable basis for determining and reporting on expected losses over the lifetime of the Company’s loan portfolio.
Credit Quality Assessment
At the time of loan origination, a rating is assigned based on the capacity to pay and general financial strength of the borrower, the value of assets pledged as collateral, and the evaluation of third party support such as a guarantor. The Company continually monitors the credit quality of the loan portfolio using all available information. The officer responsible for handling each loan is required to initiate changes to risk ratings when changes in facts and circumstances occur that warrant an upgrade or downgrade in a loan rating. Based on this information, loans demonstrating certain payment issues or other weaknesses may be categorized as delinquent, adversely risk-rated, nonperforming and/or put on nonaccrual status. Additionally, in the course of resolving such loans, the Company may choose to restructure the contractual terms of certain loans to match the borrower's ability to repay the loan based on their current financial condition. If a restructured loan meets certain criteria, it may be categorized as a modified loan.
The Company reviews numerous credit quality indicators when assessing the risk in its loan portfolio. For all loans, the Company utilizes an eight-grade loan rating system, which assigns a risk rating to each borrower based on a number of quantitative and qualitative factors associated with a loan transaction. Factors considered include industry and market conditions; position within the industry; earnings trends; operating cash flow; asset/liability values; debt capacity; guarantor strength; management and controls; financial reporting; collateral; and other considerations. In addition, the Company's independent loan review group evaluates the credit quality and related risk ratings in all loan portfolios. The results of these reviews are reported to the Risk Committee of the Board of Directors on a periodic basis and annually to the Board of Directors. For the consumer loans, the Company heavily relies on payment status for calibrating credit risk.
The ratings categories used for assessing credit risk in the commercial real estate, multi-family mortgage, construction, commercial, equipment financing, condominium association and other consumer loan and lease classes are defined as follows:
F-37
BROOKLINE BANCORP, INC. AND SUBSIDIARIES
Notes to Consolidated Financial Statements (Continued)
1 -4 Rating—Pass
Loan rating grades "1" through "4" are classified as "Pass," which indicates borrowers are performing in accordance with the terms of the loan and are less likely to result in loss due to the capacity of the borrower to pay and the adequacy of the value of assets pledged as collateral.
5 Rating—Other Assets Especially Mentioned ("OAEM")
Borrowers exhibit potential credit weaknesses or downward trends deserving management's attention. If not checked or corrected, these trends will weaken the Company's asset and position. While potentially weak, currently these borrowers are marginally acceptable; no loss of principal or interest is envisioned.
6 Rating—Substandard
Borrowers exhibit well defined weaknesses that jeopardize the orderly liquidation of debt. Substandard loans may be inadequately protected by the current net worth and paying capacity of the obligors or by the collateral pledged, if any. Normal repayment from the borrower is in jeopardy. Although no loss of principal is envisioned, there is a distinct possibility that a partial loss of interest and/or principal will occur if the deficiencies are not corrected. Collateral coverage may be inadequate to cover the principal obligation.
7 Rating—Doubtful
Borrowers exhibit well-defined weaknesses that jeopardize the orderly liquidation of debt with the added provision that the weaknesses make collection of the debt in full, on the basis of currently existing facts, conditions, and values, highly questionable and improbable. Serious problems exist to the point where partial loss of principal is likely.
8 Rating—Definite Loss
Borrowers deemed incapable of repayment. Loans to such borrowers are considered uncollectible and of such little value that continuation as active assets of the Company is not warranted.
Assets rated as "OAEM," "substandard" or "doubtful" based on criteria established under banking regulations are collectively referred to as "criticized" assets.
Credit Quality Information
The following tables present the recorded investment in loans in each class as of December 31, 2023 and December 31, 2022 by credit quality indicator and year originated.
| December 31, 2023 | |||||||||||||||||||||||||||||
| 2023 | 2022 | 2021 | 2020 | 2019 | Prior | Revolving Loans | Revolving Loans Converted to Term Loans | Total | |||||||||||||||||||||
| (In Thousands) | |||||||||||||||||||||||||||||
| Commercial Real Estate | |||||||||||||||||||||||||||||
| Pass | $ | $ | $ | $ | $ | $ | $ | $ | $ | ||||||||||||||||||||
| OAEM | |||||||||||||||||||||||||||||
| Substandard | |||||||||||||||||||||||||||||
| Doubtful | |||||||||||||||||||||||||||||
| Total | |||||||||||||||||||||||||||||
| Current -period gross writeoffs | |||||||||||||||||||||||||||||
F-38
BROOKLINE BANCORP, INC. AND SUBSIDIARIES
Notes to Consolidated Financial Statements (Continued)
| December 31, 2023 | |||||||||||||||||||||||||||||
| 2023 | 2022 | 2021 | 2020 | 2019 | Prior | Revolving Loans | Revolving Loans Converted to Term Loans | Total | |||||||||||||||||||||
| (In Thousands) | |||||||||||||||||||||||||||||
| Multi-Family Mortgage | |||||||||||||||||||||||||||||
| Pass | |||||||||||||||||||||||||||||
| Substandard | |||||||||||||||||||||||||||||
| Total | |||||||||||||||||||||||||||||
| Construction | |||||||||||||||||||||||||||||
| Pass | |||||||||||||||||||||||||||||
| Substandard | |||||||||||||||||||||||||||||
| Total | |||||||||||||||||||||||||||||
| Commercial | |||||||||||||||||||||||||||||
| Pass | |||||||||||||||||||||||||||||
| OAEM | |||||||||||||||||||||||||||||
| Substandard | |||||||||||||||||||||||||||||
| Doubtful | |||||||||||||||||||||||||||||
F-39
BROOKLINE BANCORP, INC. AND SUBSIDIARIES
Notes to Consolidated Financial Statements (Continued)
| December 31, 2023 | |||||||||||||||||||||||||||||
| 2023 | 2022 | 2021 | 2020 | 2019 | Prior | Revolving Loans | Revolving Loans Converted to Term Loans | Total | |||||||||||||||||||||
| (In Thousands) | |||||||||||||||||||||||||||||
| Total | |||||||||||||||||||||||||||||
| Current-period gross writeoffs | |||||||||||||||||||||||||||||
| Equipment Financing | |||||||||||||||||||||||||||||
| Pass | |||||||||||||||||||||||||||||
| OAEM | |||||||||||||||||||||||||||||
| Substandard | |||||||||||||||||||||||||||||
| Doubtful | |||||||||||||||||||||||||||||
| Total | |||||||||||||||||||||||||||||
| Current-period gross writeoffs | |||||||||||||||||||||||||||||
| Condominium Association | |||||||||||||||||||||||||||||
| Pass | |||||||||||||||||||||||||||||
| Total | |||||||||||||||||||||||||||||
| Other Consumer | |||||||||||||||||||||||||||||
| Pass | |||||||||||||||||||||||||||||
| Total | |||||||||||||||||||||||||||||
| Current-period gross writeoffs | |||||||||||||||||||||||||||||
| Total | |||||||||||||||||||||||||||||
| Pass | |||||||||||||||||||||||||||||
| OAEM | |||||||||||||||||||||||||||||
| Substandard | |||||||||||||||||||||||||||||
| Doubtful | |||||||||||||||||||||||||||||
| Total | $ | $ | $ | $ | $ | $ | $ | $ | $ | ||||||||||||||||||||
As of December 31, 2023, there were no loans categorized as definite loss.
| December 31, 2022 | |||||||||||||||||||||||||||||
| 2022 | 2021 | 2020 | 2019 | 2018 | Prior | Revolving Loans | Revolving Loans Converted to Term Loans | Total | |||||||||||||||||||||
| (In Thousands) | |||||||||||||||||||||||||||||
| Commercial Real Estate | |||||||||||||||||||||||||||||
| Pass | $ | $ | $ | $ | $ | $ | $ | $ | $ | ||||||||||||||||||||
| OAEM | |||||||||||||||||||||||||||||
F-40
BROOKLINE BANCORP, INC. AND SUBSIDIARIES
Notes to Consolidated Financial Statements (Continued)
| December 31, 2022 | |||||||||||||||||||||||||||||
| Substandard | |||||||||||||||||||||||||||||
| Total | |||||||||||||||||||||||||||||
| Multi-Family Mortgage | |||||||||||||||||||||||||||||
| Pass | |||||||||||||||||||||||||||||
| Substandard | |||||||||||||||||||||||||||||
| Total | |||||||||||||||||||||||||||||
| Construction | |||||||||||||||||||||||||||||
| Pass | |||||||||||||||||||||||||||||
| OAEM | |||||||||||||||||||||||||||||
| Substandard | |||||||||||||||||||||||||||||
| Total | |||||||||||||||||||||||||||||
| Commercial | |||||||||||||||||||||||||||||
| Pass | |||||||||||||||||||||||||||||
| OAEM | |||||||||||||||||||||||||||||
| Substandard | |||||||||||||||||||||||||||||
| Doubtful | |||||||||||||||||||||||||||||
| Total | |||||||||||||||||||||||||||||
| Equipment Financing | |||||||||||||||||||||||||||||
| Pass | |||||||||||||||||||||||||||||
| OAEM | |||||||||||||||||||||||||||||
| Substandard | |||||||||||||||||||||||||||||
| Doubtful | |||||||||||||||||||||||||||||
| Total | |||||||||||||||||||||||||||||
| Condominium Association | |||||||||||||||||||||||||||||
| Pass | |||||||||||||||||||||||||||||
| Substandard | |||||||||||||||||||||||||||||
| Total | |||||||||||||||||||||||||||||
| Other Consumer | |||||||||||||||||||||||||||||
| Pass | |||||||||||||||||||||||||||||
| Substandard | |||||||||||||||||||||||||||||
| Total | |||||||||||||||||||||||||||||
| Total | |||||||||||||||||||||||||||||
| Pass | |||||||||||||||||||||||||||||
| OAEM | |||||||||||||||||||||||||||||
| Substandard | |||||||||||||||||||||||||||||
| Doubtful | |||||||||||||||||||||||||||||
| Total | $ | $ | $ | $ | $ | $ | $ | $ | $ | ||||||||||||||||||||
As of December 31, 2022, there were no loans categorized as definite loss.
For residential mortgage and home equity loans, the borrowers' credit scores contribute as a reserve metric in the retail loss rate model.
F-41
BROOKLINE BANCORP, INC. AND SUBSIDIARIES
Notes to Consolidated Financial Statements (Continued)
| December 31, 2023 | |||||||||||||||||||||||||||||
| 2023 | 2022 | 2021 | 2020 | 2019 | Prior | Revolving Loans | Revolving Loans Converted to Term Loans | Total | |||||||||||||||||||||
| (In Thousands) | |||||||||||||||||||||||||||||
| Residential | |||||||||||||||||||||||||||||
| Credit Scores | |||||||||||||||||||||||||||||
| Over 700 | $ | $ | $ | $ | $ | $ | $ | $ | $ | ||||||||||||||||||||
| 661 - 700 | |||||||||||||||||||||||||||||
| 600 and below | |||||||||||||||||||||||||||||
| Data not available* | |||||||||||||||||||||||||||||
| Total | |||||||||||||||||||||||||||||
| Current-period gross writeoffs | |||||||||||||||||||||||||||||
| Home Equity | |||||||||||||||||||||||||||||
| Credit Scores | |||||||||||||||||||||||||||||
| Over 700 | |||||||||||||||||||||||||||||
| 661 - 700 | |||||||||||||||||||||||||||||
| 600 and below | |||||||||||||||||||||||||||||
| Data not available* | |||||||||||||||||||||||||||||
| Total | $ | $ | $ | $ | $ | $ | $ | $ | $ | ||||||||||||||||||||
* Represents loans made to trusts and purchased mortgages.
| December 31, 2022 | |||||||||||||||||||||||||||||
| 2022 | 2021 | 2020 | 2019 | 2018 | Prior | Revolving Loans | Revolving Loans Converted to Term Loans | Total | |||||||||||||||||||||
| (In Thousands) | |||||||||||||||||||||||||||||
| Residential | |||||||||||||||||||||||||||||
| Credit Scores | |||||||||||||||||||||||||||||
| Over 700 | $ | $ | $ | $ | $ | $ | $ | $ | $ | ||||||||||||||||||||
| 661 - 700 | |||||||||||||||||||||||||||||
| 600 and below | |||||||||||||||||||||||||||||
| Data not available* | |||||||||||||||||||||||||||||
| Total | |||||||||||||||||||||||||||||
| Home Equity | |||||||||||||||||||||||||||||
| Credit Scores | |||||||||||||||||||||||||||||
| Over 700 | |||||||||||||||||||||||||||||
| 661 - 700 | |||||||||||||||||||||||||||||
| 600 and below | |||||||||||||||||||||||||||||
| Data not available* | |||||||||||||||||||||||||||||
| Total | $ | $ | $ | $ | $ | $ | $ | $ | $ | ||||||||||||||||||||
F-42
BROOKLINE BANCORP, INC. AND SUBSIDIARIES
Notes to Consolidated Financial Statements (Continued)
Age Analysis of Past Due Loans and Leases
The following tables present an age analysis of the recorded investment in total loans and leases as of December 31, 2023 and 2022.
| At December 31, 2023 | ||||||||||||||||||||||||||||||||||||||||||||||||||
| Past Due | Past Due Greater Than 90 Days and Accruing | Non-accrual | Non-accrual with no related Allowance | |||||||||||||||||||||||||||||||||||||||||||||||
| 31-60 Days | 61-90 Days | Greater Than 90 Days | Total | Current | Total Loans and Leases | |||||||||||||||||||||||||||||||||||||||||||||
| (In Thousands) | ||||||||||||||||||||||||||||||||||||||||||||||||||
| Commercial real estate loans: | ||||||||||||||||||||||||||||||||||||||||||||||||||
| Commercial real estate | $ | $ | $ | $ | $ | $ | $ | $ | $ | |||||||||||||||||||||||||||||||||||||||||
| Multi-family mortgage | ||||||||||||||||||||||||||||||||||||||||||||||||||
| Construction | ||||||||||||||||||||||||||||||||||||||||||||||||||
| Total commercial real estate loans | ||||||||||||||||||||||||||||||||||||||||||||||||||
| Commercial loans and leases: | ||||||||||||||||||||||||||||||||||||||||||||||||||
| Commercial | ||||||||||||||||||||||||||||||||||||||||||||||||||
| Equipment financing | ||||||||||||||||||||||||||||||||||||||||||||||||||
| Condominium association | ||||||||||||||||||||||||||||||||||||||||||||||||||
| Total commercial loans and leases | ||||||||||||||||||||||||||||||||||||||||||||||||||
| Consumer loans: | ||||||||||||||||||||||||||||||||||||||||||||||||||
| Residential mortgage | ||||||||||||||||||||||||||||||||||||||||||||||||||
| Home equity | ||||||||||||||||||||||||||||||||||||||||||||||||||
| Other consumer | ||||||||||||||||||||||||||||||||||||||||||||||||||
| Total consumer loans | ||||||||||||||||||||||||||||||||||||||||||||||||||
| Total loans and leases | $ | $ | $ | $ | $ | $ | $ | $ | $ | |||||||||||||||||||||||||||||||||||||||||
F-43
BROOKLINE BANCORP, INC. AND SUBSIDIARIES
Notes to Consolidated Financial Statements (Continued)
| At December 31, 2022 | ||||||||||||||||||||||||||||||||||||||||||||||||||
| Past Due | Past Due Greater Than 90 Days and Accruing | |||||||||||||||||||||||||||||||||||||||||||||||||
| 31-60 Days | 61-90 Days | Greater Than 90 Days | Total | Current | Total Loans and Leases | Non-accrual | Non-accrual with no related Allowance | |||||||||||||||||||||||||||||||||||||||||||
| (In Thousands) | ||||||||||||||||||||||||||||||||||||||||||||||||||
| Commercial real estate loans: | ||||||||||||||||||||||||||||||||||||||||||||||||||
| Commercial real estate | $ | $ | $ | $ | $ | $ | $ | $ | $ | |||||||||||||||||||||||||||||||||||||||||
| Multi-family mortgage | ||||||||||||||||||||||||||||||||||||||||||||||||||
| Construction | ||||||||||||||||||||||||||||||||||||||||||||||||||
| Total commercial real estate loans | ||||||||||||||||||||||||||||||||||||||||||||||||||
| Commercial loans and leases: | ||||||||||||||||||||||||||||||||||||||||||||||||||
| Commercial | ||||||||||||||||||||||||||||||||||||||||||||||||||
| Equipment financing | ||||||||||||||||||||||||||||||||||||||||||||||||||
| Condominium association | ||||||||||||||||||||||||||||||||||||||||||||||||||
| Total commercial loans and leases | ||||||||||||||||||||||||||||||||||||||||||||||||||
| Consumer loans: | ||||||||||||||||||||||||||||||||||||||||||||||||||
| Residential mortgage | ||||||||||||||||||||||||||||||||||||||||||||||||||
| Home equity | ||||||||||||||||||||||||||||||||||||||||||||||||||
| Other consumer | ||||||||||||||||||||||||||||||||||||||||||||||||||
| Total consumer loans | ||||||||||||||||||||||||||||||||||||||||||||||||||
| Total loans and leases | $ | $ | $ | $ | $ | $ | $ | $ | $ | |||||||||||||||||||||||||||||||||||||||||
There is no interest income recognized on non-accrual loans for the year ending December 31, 2022.
Impaired Loans and Leases
A loan is considered to be impaired when, based on current information and events, it is probable that the Company will be unable to collect all amounts due (both interest and principal) according to the contractual terms of the loan agreement. The loans and leases risk-rated "substandard" or worse are considered impaired. The Company has also defined the population of impaired loans to include nonaccrual loans and modified loans. Impaired loans and leases which do not share similar risk characteristics with other loans are individually evaluated for credit losses. Specific reserves are established for loans and leases with deterioration in the present value of expected future cash flows or, in the case of collateral-dependent loans and leases, any increase in the loan or lease amortized cost basis over the fair value of the underlying collateral discounted for estimated selling costs. In contrast, the loans and leases which share similar risk characteristics and are not included in the individually evaluated population are collectively evaluated for credit losses.
The following tables present information regarding individually evaluated and collectively evaluated allowance for loan and lease losses for credit losses on loans and leases at the dates indicated.
F-44
BROOKLINE BANCORP, INC. AND SUBSIDIARIES
Notes to Consolidated Financial Statements (Continued)
| At December 31, 2023 | |||||||||||||||||||||||
| Commercial Real Estate | Commercial | Consumer | Total | ||||||||||||||||||||
| (In Thousands) | |||||||||||||||||||||||
| Allowance for Loan and Lease Losses: | |||||||||||||||||||||||
| Individually evaluated | $ | $ | $ | $ | |||||||||||||||||||
| Collectively evaluated | |||||||||||||||||||||||
| Total | $ | $ | $ | $ | |||||||||||||||||||
| Loans and Leases: | |||||||||||||||||||||||
| Individually evaluated | $ | $ | $ | $ | |||||||||||||||||||
| Collectively evaluated | |||||||||||||||||||||||
| Total | $ | $ | $ | $ | |||||||||||||||||||
| At December 31, 2022 | |||||||||||||||||||||||
| Commercial Real Estate | Commercial | Consumer | Total | ||||||||||||||||||||
| (In Thousands) | |||||||||||||||||||||||
| Allowance for Loan and Lease Losses: | |||||||||||||||||||||||
| Individually evaluated | $ | $ | $ | $ | |||||||||||||||||||
| Collectively evaluated | |||||||||||||||||||||||
| Total | $ | $ | $ | $ | |||||||||||||||||||
| Loan and Lease Losses: | |||||||||||||||||||||||
| Individually evaluated | $ | $ | $ | $ | |||||||||||||||||||
| Collectively evaluated | |||||||||||||||||||||||
| Total | $ | $ | $ | $ | |||||||||||||||||||
Loan Modifications
In January 2023, the Company adopted ASU 2022-02, “Financial Instruments - Credit Losses (Topic 326): Troubled Debt Restructurings and Vintage Disclosures” (“ASU 2022-02”), which eliminated the accounting guidance for troubled debt restructurings (“TDRs”) while enhancing disclosure requirements for certain loan refinancing and restructurings by creditors when a borrower is experiencing financial difficulty. This guidance was applied on a prospective basis. Upon adoption of this guidance, the Company estimates the reserve for modifications to borrowers experiencing financial difficulty in a manner similar to the process for non-modified loans.
The following tables present the amortized cost basis of loan modifications made to borrowers experiencing financial difficulty during the periods indicated.
F-45
BROOKLINE BANCORP, INC. AND SUBSIDIARIES
Notes to Consolidated Financial Statements (Continued)
| At December 31, 2023 | |||||||||||||||||||||||
| Number of Loans | Amortized Cost | % of Total Class of Loans and Leases | Financial Effect | ||||||||||||||||||||
| (In thousands) | |||||||||||||||||||||||
| Maturity Extension | |||||||||||||||||||||||
| CRE | $ | % | The loan was given a year maturity extension. The financial effect was deemed "de minimis." | ||||||||||||||||||||
| C&I | % | All | |||||||||||||||||||||
| Significant Payment Delays | |||||||||||||||||||||||
| C&I | % | Both loans were given restructured payment plans to assist borrowers. The financial effect was deemed "de minimis." | |||||||||||||||||||||
| Combination - Maturity Extension and Significant Payment Delays | |||||||||||||||||||||||
| CRE | % | Loans were given year maturity extensions, with a partial deferral of interest payments. The financial effect was deemed "de minimis." | |||||||||||||||||||||
| C&I | % | Loans were given to | |||||||||||||||||||||
| Combination - Maturity Extension and Interest Rate Reduction | |||||||||||||||||||||||
| C&I | % | A portion of loans were given month maturity extensions and interest rate reductions. Other loans were given year maturity extensions and a | |||||||||||||||||||||
| Total | $ | % | |||||||||||||||||||||
The following tables present the aging analysis of loan modifications made to borrowers experiencing financial difficulty during the periods indicated.
| At December 31, 2023 | |||||||||||||||||||||||||||||
| Current | 30-60 Days Past Due | 61-90 Days Past Due | 90+ Days Past Due | Modified | |||||||||||||||||||||||||
| (In thousands) | |||||||||||||||||||||||||||||
| Total Modifications | $ | ||||||||||||||||||||||||||||
F-46
BROOKLINE BANCORP, INC. AND SUBSIDIARIES
Notes to Consolidated Financial Statements (Continued)
The following table sets forth information regarding troubled debt restructured loans and leases at the dates indicated:
| At December 31, 2022 | ||||||||
| (In Thousands) | ||||||||
| Troubled debt restructurings: | ||||||||
| On accrual | $ | |||||||
| On nonaccrual | ||||||||
| Total troubled debt restructurings | $ | |||||||
Total TDR loans and leases were $19.9 million at December 31, 2022.
| At and for the Year Ended December 31, 2022 | |||||||||||||||||||||||||||||||||||||||||
| Recorded Investment | Specific Allowance for Loan and Lease Losses | Defaulted (1) | |||||||||||||||||||||||||||||||||||||||
| Number of Loans/ Leases | At Modification | At End of Period | Nonaccrual Loans and Leases | Number of Loans/ Leases | Recorded Investment | ||||||||||||||||||||||||||||||||||||
| (Dollars in Thousands) | |||||||||||||||||||||||||||||||||||||||||
| Commercial | |||||||||||||||||||||||||||||||||||||||||
| Equipment financing | |||||||||||||||||||||||||||||||||||||||||
| Home equity | |||||||||||||||||||||||||||||||||||||||||
| Total loans and leases | $ | $ | $ | $ | $ | ||||||||||||||||||||||||||||||||||||
______________________________________________________________________
(1) Includes loans and leases that have been modified within the past twelve months and subsequently had payment defaults during the period indicated.
| At and for the Year Ended December 31, 2021 | |||||||||||||||||||||||||||||||||||||||||
| Recorded Investment | Specific Allowance for Loan and Lease Losses | Defaulted (1) | |||||||||||||||||||||||||||||||||||||||
| Number of Loans/ Leases | At Modification | At End of Period | Nonaccrual Loans and Leases | Number of Loans/ Leases | Recorded Investment | ||||||||||||||||||||||||||||||||||||
| (Dollars in Thousands) | |||||||||||||||||||||||||||||||||||||||||
| Commercial real estate | $ | $ | $ | $ | $ | ||||||||||||||||||||||||||||||||||||
| Commercial | |||||||||||||||||||||||||||||||||||||||||
| Equipment financing | |||||||||||||||||||||||||||||||||||||||||
| Residential mortgage | |||||||||||||||||||||||||||||||||||||||||
| Home equity | |||||||||||||||||||||||||||||||||||||||||
| Total loans and leases | |||||||||||||||||||||||||||||||||||||||||
______________________________________________________________________
(1) Includes loans and leases that have been modified within the past twelve months and subsequently had payment defaults during the period indicated.
The following table sets forth the Company's end-of-period balances for TDRs that were modified during the periods indicated, by type of modification.
| Year Ended December 31, | |||||||||||
| 2022 | 2021 | ||||||||||
| (In Thousands) | |||||||||||
| Extended maturity | $ | $ | |||||||||
| Combination maturity, principal, interest rate | |||||||||||
| Total loans modified | $ | $ | |||||||||
F-47
BROOKLINE BANCORP, INC. AND SUBSIDIARIES
Notes to Consolidated Financial Statements (Continued)
The TDR loans and leases that were modified for the year ending December 31, 2022 were $7.8 million.
Net charge-offs of the performing and nonperforming troubled debt restructuring loans and leases for the year ending December 31, 2022 were $0.1 million.
The commitments to lend funds to debtors owning receivables whose terms had been modified in TDRs as of December 31, 2022 were $1.9 million.
(8) Premises and Equipment
Premises and equipment consist of the following:
| At December 31, | Estimated Useful Life | ||||||||||||||||||||||
| 2023 | 2022 | ||||||||||||||||||||||
| (In Thousands) | (In Years) | ||||||||||||||||||||||
| Land | $ | $ | NA | ||||||||||||||||||||
| Fine art | NA | ||||||||||||||||||||||
| Computer equipment | |||||||||||||||||||||||
| Vehicles | |||||||||||||||||||||||
| Core processing system and software | |||||||||||||||||||||||
| Furniture, fixtures and equipment | |||||||||||||||||||||||
| Office building and improvements | |||||||||||||||||||||||
| Total | |||||||||||||||||||||||
| Accumulated depreciation and amortization | |||||||||||||||||||||||
| Total premises and equipment | $ | $ | |||||||||||||||||||||
Depreciation and amortization expense is calculated using the straight-line method and is included in occupancy and equipment and data processing expense in the Consolidated Statements of Income. For the years ended December 31, 2023, and 2022, depreciation and amortization expense related to premises and equipment totaled $8.5 million, and $6.1 million respectively.
(9) Goodwill and Other Intangible Assets
The changes in the carrying value of goodwill for the periods indicated were as follows:
| Year Ended December 31, | |||||||||||
| 2023 | 2022 | ||||||||||
| (In Thousands) | |||||||||||
| Balance at beginning of year | $ | $ | |||||||||
| Additions | |||||||||||
| Balance at end of year | $ | $ | |||||||||
F-48
BROOKLINE BANCORP, INC. AND SUBSIDIARIES
Notes to Consolidated Financial Statements (Continued)
The following is a summary of the Company's other intangible assets:
| At December 31, 2023 | At December 31, 2022 | ||||||||||||||||||||||||||||||||||
| Gross Amount | Accumulated Amortization | Carrying Amount | Gross Amount | Accumulated Amortization | Carrying Amount | ||||||||||||||||||||||||||||||
| (In Thousands) | |||||||||||||||||||||||||||||||||||
| Other intangible assets: | |||||||||||||||||||||||||||||||||||
| Core deposits | $ | $ | $ | $ | $ | $ | |||||||||||||||||||||||||||||
| Trade name | |||||||||||||||||||||||||||||||||||
| Trust relationship | |||||||||||||||||||||||||||||||||||
| Other intangible | |||||||||||||||||||||||||||||||||||
| Total other intangible assets | $ | $ | $ | $ | $ | $ | |||||||||||||||||||||||||||||
The addition of goodwill and the increase in core deposit intangibles at December 31, 2023 are both due to the acquisition of PCSB which was closed on January 1, 2023.
At December 31, 2013, the Company concluded that the BankRI name would continue to be utilized in its marketing strategies; therefore, the trade name with carrying value of $1.1 million, has an indefinite life and ceased to amortize.
The weighted-average amortization period for the core deposit intangible is 5.98 years. There were no
The estimated aggregate future amortization expense for other intangible assets for each of the next five years and thereafter is as follows:
| Year ended December 31: | Amount | ||||
| (In Thousands) | |||||
| 2024 | $ | ||||
| 2025 | |||||
| 2026 | |||||
| 2027 | |||||
| 2028 | |||||
| Thereafter | |||||
| Total | $ | ||||
(10) Other Assets
BOLI
BOLI is recorded at the cash surrender value of the policies, less any applicable cash surrender charges, and is recorded in other assets. As of December 31, 2023 and 2022, BankRI owned seven 44.8 four policies with a net cash surrender value of $36.9 million. As of December 31, 2023 and 2022, Brookline Bank, as successor-in-interest to First Ipswich Bank owned two 0.7
The Company recorded a total of $2.1 million, $1.0 million, and $1.2 million of tax exempt income from these policies in 2023, 2022, and 2021, respectively. They are included in the Company’s other non-interest income in the consolidated statements of income. Included in the 2023 and 2021 income is a death benefit received on a former employee in the amount of $256 thousand and $228 thousand respectively.
Affordable Housing Investments
The Company invests in affordable housing projects that benefit low- and moderate-income individuals. As of December 31, 2023, the Company had investments in 20 of these projects. The project sponsor or general partner controls the
F-49
BROOKLINE BANCORP, INC. AND SUBSIDIARIES
Notes to Consolidated Financial Statements (Continued)
project's management. In each case, the Company is a limited partner with less than 99 % of the outstanding equity interest in any single project.
The Company uses the proportional amortization method to account for investments in affordable housing projects. The proportional amortization method calculation and the operating losses or gains for these investments are included as a component of the provision for income taxes in the Company’s consolidated statements of income. Under the proportional amortization method, the initial costs of the investment in qualified affordable housing projects is amortized based on the tax credits and other benefits received.
Further information regarding the Company's investments in affordable housing projects follows:
| At December 31, | |||||||||||
| 2023 | 2022 | ||||||||||
| (In Thousands) | |||||||||||
| Investments in affordable housing projects included in other assets | $ | $ | |||||||||
| Unfunded commitments related to affordable housing projects included in other liabilities | |||||||||||
| Investment in affordable housing tax credits | |||||||||||
| Investment in affordable housing tax benefits | |||||||||||
| For the year ended December 31, | |||||||||||
| 2023 | 2022 | 2021 | |||||||||
| (In Thousands) | |||||||||||
| Investment amortization included in provision for income taxes | $ | $ | $ | ||||||||
| Amount recognized as income tax benefit | |||||||||||
F-50
BROOKLINE BANCORP, INC. AND SUBSIDIARIES
Notes to Consolidated Financial Statements (Continued)
(11) Deposits
A summary of deposits follows:
| December 31, 2023 | December 31, 2022 | ||||||||||||||||||||||
| Amount | Weighted Average Rate | Amount | Weighted Average Rate | ||||||||||||||||||||
| (Dollars in Thousands) | |||||||||||||||||||||||
| Demand checking accounts | $ | % | $ | % | |||||||||||||||||||
| NOW accounts | % | % | |||||||||||||||||||||
| Savings accounts | % | % | |||||||||||||||||||||
| Money market accounts | % | % | |||||||||||||||||||||
| Total core deposit accounts | % | % | |||||||||||||||||||||
| Certificate of deposit accounts maturing: | |||||||||||||||||||||||
| Within six months | $ | % | $ | % | |||||||||||||||||||
| After six months but within 1 year | % | % | |||||||||||||||||||||
| After 1 year but within 2 years | % | % | |||||||||||||||||||||
| After 2 years but within 3 years | % | % | |||||||||||||||||||||
| After 3 years but within 4 years | % | % | |||||||||||||||||||||
| After 4 years but within 5 years | % | % | |||||||||||||||||||||
| 5+ Years | % | % | |||||||||||||||||||||
| Total certificate of deposit accounts | % | % | |||||||||||||||||||||
| Brokered deposit accounts | % | % | |||||||||||||||||||||
| Total deposits | $ | % | $ | % | |||||||||||||||||||
Certificate of deposit accounts issued in amounts of $250,000 484.0 million and $272.2 million as of December 31, 2023 and 2022, respectively.
Interest expense on deposit balances is summarized as follows
| Year Ended December 31, | |||||||||||||||||
| 2023 | 2022 | 2021 | |||||||||||||||
| (In Thousands) | |||||||||||||||||
| Interest-bearing deposits: | |||||||||||||||||
| NOW accounts | $ | $ | $ | ||||||||||||||
| Savings accounts | |||||||||||||||||
| Money market accounts | |||||||||||||||||
| Certificate of deposit accounts | |||||||||||||||||
| Brokered deposit accounts | |||||||||||||||||
| Total interest-bearing deposits | $ | $ | $ | ||||||||||||||
Related Party Deposits
Deposit accounts of directors, executive officers and their affiliates totaled $69.3 million and $72.8 million as of December 31, 2023 and 2022, respectively.
Collateral Pledged to Deposits
As of December 31, 2023 and 2022, $262.8 million and $205.6 million, respectively, of collateral was pledged for municipal deposits and TT&L.
F-51
BROOKLINE BANCORP, INC. AND SUBSIDIARIES
Notes to Consolidated Financial Statements (Continued)
(12) Borrowed Funds
Borrowed funds are comprised of the following:
| At December 31, | |||||||||||
| 2023 | 2022 | ||||||||||
| (In Thousands) | |||||||||||
| Advances from the FHLB | $ | $ | |||||||||
| Subordinated debentures and notes | |||||||||||
| Other borrowed funds | |||||||||||
| Total borrowed funds | $ | $ | |||||||||
Interest expense on borrowed funds for the periods indicated is as follows:
| Year Ended December 31, | |||||||||||||||||
| 2023 | 2022 | 2021 | |||||||||||||||
| (In Thousands) | |||||||||||||||||
| Advances from the FHLB | $ | $ | $ | ||||||||||||||
| Subordinated debentures and notes | |||||||||||||||||
| Other borrowed funds | |||||||||||||||||
| Total interest expense on borrowed funds | $ | $ | $ | ||||||||||||||
Collateral Pledged to Borrowed Funds
As of December 31, 2023 and 2022, $4.3 billion and $2.1 billion, respectively, of investment securities and loans and leases, were pledged as collateral for repurchase agreements, swap agreements, FHLB/FRB borrowings, municipal deposits, and TT&L. The Banks did no
Advances from the FHLB of Boston and FHLB of New York
FHLB advances mature as follows(1):
_______________________________________________________________________________
| At December 31, | |||||||||||||||||||||||||||||||||||
| 2023 | 2022 | ||||||||||||||||||||||||||||||||||
| Amount | Callable Amount | Weighted Average Rate | Amount | Callable Amount | Weighted Average Rate | ||||||||||||||||||||||||||||||
| (Dollars in Thousands) | |||||||||||||||||||||||||||||||||||
| Within 1 year | $ | $ | % | $ | $ | % | |||||||||||||||||||||||||||||
| Over 1 year to 2 years | % | % | |||||||||||||||||||||||||||||||||
| Over 2 years to 3 years | % | % | |||||||||||||||||||||||||||||||||
| Over 3 years to 4 years | % | % | |||||||||||||||||||||||||||||||||
| Over 4 years to 5 years | % | % | |||||||||||||||||||||||||||||||||
| Over 5 years | % | % | |||||||||||||||||||||||||||||||||
| $ | $ | % | $ | $ | % | ||||||||||||||||||||||||||||||
(1) Excludes $0.1 million in FHLB borrowings fair value adjustment related to the acquisition of PCSB in 2023.
Actual maturities of the advances may differ from those presented above since the FHLB has the right to call certain advances prior to the scheduled maturity.
The FHLB advances are secured by blanket pledge agreements which require the Banks to maintain certain qualifying assets as collateral. The Banks did no t have any FRB borrowings as of December 31, 2023. The Company's remaining borrowing capacity from the FHLB of Boston and FHLB of New York for advances and repurchase agreements was $1.3 billion as of December 31, 2023. The total amount of qualifying collateral for FHLB and FRB borrowings was $3.9 billion as of December 31, 2023.
F-52
BROOKLINE BANCORP, INC. AND SUBSIDIARIES
Notes to Consolidated Financial Statements (Continued)
Other Borrowed Funds
Information concerning other borrowed funds is as follows for the periods indicated below:
| Year Ended December 31, | |||||||||||
| 2023 | 2022 | ||||||||||
| (Dollars In Thousands) | |||||||||||
| Outstanding at end of year | $ | $ | |||||||||
| Average outstanding for the year | |||||||||||
| Maximum outstanding at any month-end | |||||||||||
| Weighted average rate at end of year | % | % | |||||||||
| Weighted average rate paid for the year | % | % | |||||||||
In addition to advances from the FHLB and subordinated debentures and notes, the Company utilizes other funding sources as part of the overall liquidity strategy. Those funding sources include repurchase agreements and committed and uncommitted lines of credit with several financial institutions.
The Company periodically enters into repurchase agreements with its larger deposit and commercial customers as part of its cash management services which are typically overnight borrowings. Repurchase agreements with customers decreased $42.7 million to $9.3 million as of December 31, 2023 from $52.0 million as of December 31, 2022.
As of December 31, 2023, the Banks also have access to funding through certain uncommitted lines via American Financial Exchange (AFX) as well as other large financial institution specific lines.
The Company has access to the FRB's "discount window" to supplement its liquidity. The Company has $273.0 million of borrowing capacity at the FRB as of December 31, 2023. As of December 31, 2023, the Company did not have any borrowings with the FRB outstanding. As of December 31, 2023, the Company had no
Subordinated Debentures and Notes
On September 15, 2014, the Company issued $75.0 million of 6.0 % fixed-to-floating subordinated notes due September 15, 2029. The Company is obligated to pay 6.0 % interest semiannually between September 2014 and September 2024. Subsequently, the Company is obligated to pay 3-month LIBOR plus 3.315 % quarterly until the notes mature in September 2029.
The following table summarizes the Company's subordinated debentures and notes at the dates indicated.
| Carrying Amount | ||||||||||||||||||||||||||||||||
| Issue Date | Rate | Maturity Date | Next Call Date | December 31, 2023 | December 31, 2022 | |||||||||||||||||||||||||||
| (Dollars in Thousands) | ||||||||||||||||||||||||||||||||
| June 26, 2003 | Variable; 3-month SOFR + | June 26, 2033 | March 25, 2024 | $ | $ | |||||||||||||||||||||||||||
| March 17, 2004 | Variable; 3-month CME term SOFR + tenor spread adjustment + | March 17, 2034 | March 17, 2024 | |||||||||||||||||||||||||||||
| September 15, 2014 | 3-month LIBOR + | September 15, 2029 | September 15, 2024 | |||||||||||||||||||||||||||||
| Total | $ | $ | ||||||||||||||||||||||||||||||
F-53
BROOKLINE BANCORP, INC. AND SUBSIDIARIES
Notes to Consolidated Financial Statements (Continued)
The above carrying amounts of the acquired subordinated debentures included $0.2 million of accretion adjustments and $0.6 million of capitalized debt issuance costs as of December 31, 2023. This compares to $0.3 million of accretion adjustments and $0.7 million of capitalized debt issuance costs as of December 31, 2022.
(13) Commitments and Contingencies
Off-Balance Sheet Financial Instruments
The Company is party to off-balance sheet financial instruments in the normal course of business to meet the financing needs of its customers and to reduce its own exposure to fluctuations in interest rates. These financial instruments include loan commitments, standby and commercial letters of credits, and loan level derivatives. According to GAAP, these financial instruments are not recorded in the financial statements until they are funded or related fees are incurred or received.
The contract amounts reflect the extent of the involvement the Company has in particular classes of these instruments. Such commitments involve, to varying degrees, elements of credit risk and interest-rate risk in excess of the amount recognized in the consolidated balance sheets. The Company's exposure to credit loss in the event of non-performance by the counterparty is represented by the fair value of the instruments. The Company uses the same policies in making commitments and conditional obligations as it does for on-balance sheet instruments.
Financial instruments with off-balance-sheet risk at the dates indicated follow:
| At December 31, | |||||||||||
| 2023 | 2022 | ||||||||||
| (In Thousands) | |||||||||||
| Financial instruments whose contract amounts represent credit risk: | |||||||||||
| Commitments to originate loans and leases: | |||||||||||
| Commercial real estate | $ | $ | |||||||||
| Commercial | |||||||||||
| Residential mortgage | |||||||||||
| Unadvanced portion of loans and leases | |||||||||||
| Unused lines of credit: | |||||||||||
| Home equity | |||||||||||
| Other consumer | |||||||||||
| Other commercial | |||||||||||
| Unused letters of credit: | |||||||||||
| Financial standby letters of credit | |||||||||||
| Performance standby letters of credit | |||||||||||
| Commercial and similar letters of credit | |||||||||||
| Interest rate derivatives | |||||||||||
| Loan level derivatives: | |||||||||||
| Receive fixed, pay variable | |||||||||||
| Pay fixed, receive variable | |||||||||||
| Risk participation-out agreements | |||||||||||
| Risk participation-in agreements | |||||||||||
| Foreign exchange contracts: | |||||||||||
| Buys foreign currency, sells U.S. currency | |||||||||||
| Sells foreign currency, buys U.S. currency | |||||||||||
Commitments to extend credit are agreements to lend to a customer as long as there is no violation of any condition established in the contract. Commitments generally have fixed expiration dates or other termination clauses and may require the payment of a fee by the customer. Since some of the commitments are expected to expire without being drawn upon, the total
F-54
BROOKLINE BANCORP, INC. AND SUBSIDIARIES
Notes to Consolidated Financial Statements (Continued)
commitment amounts do not necessarily represent future cash requirements. The Company evaluates each customer's creditworthiness on a case-by-case basis. The amount of collateral obtained, if any, is based on management's credit evaluation of the borrower.
Standby and commercial letters of credits are conditional commitments issued by the Company to guarantee performance of a customer to a third party. These standby and commercial letters of credit are primarily issued to support the financing needs of the Company's commercial customers. The credit risk involved in issuing letters of credit is essentially the same as that involved in extending loans to customers.
The reserve for unfunded credit commitments, which is included in other liabilities, was $19.8 million and $20.6 million as of December 31, 2023 and December 31, 2022, respectively. See Note 7, "Allowance for Credit Losses" for further discussion on the Company's methodology for determining the ACL, which includes the reserve for unfunded commitments.
From time to time, the Company enters into loan level derivatives, risk participation agreements or foreign exchange contracts with commercial customers and third-party financial institutions. These derivatives allow the Company to offer long-term fixed-rate commercial loans while mitigating the interest-rate or foreign exchange risk of holding those loans. In a loan level derivative transaction, the Company lends to a commercial customer on a floating-rate basis and then enters into a loan level derivative with that customer. Concurrently, the Company enters into offsetting swaps with a third-party financial institution, effectively minimizing its net interest-rate risk exposure resulting from such transactions. The fair value of these derivatives are presented in Footnote 16.
Lease Commitments
The Company leases certain office space under various noncancellable operating leases as well as other assets. These leases have terms ranging from 1 year to over 20 years. Certain leases contain renewal options and escalation clauses which can increase rental expenses based principally on the consumer price index and fair market rental value provisions. All of the Company's current outstanding leases are classified as operating leases.
The Company considered the following criteria when determining whether a contract contains a lease, the existence of an identifiable asset and the right to obtain substantially all of the economic benefits from use of the asset through the period. The Company used the FHLB classic advance rates available as of the lease's start dates as as the discount rate to determine the net present value of the remaining lease payments.
Total lease commitments increased from $19.5 million as of December 31, 2022 to $32.0 million as of December 31, 2023. The increase is primarily due to the addition of leases for PCSB Bank locations.
F-55
BROOKLINE BANCORP, INC. AND SUBSIDIARIES
Notes to Consolidated Financial Statements (Continued)
| At December 31, 2023 | At December 31, 2022 | At December 31, 2021 | |||||||||
| (In Thousands) | |||||||||||
| The components of lease expense were as follow: | |||||||||||
| Operating lease cost | $ | $ | $ | ||||||||
| Supplemental cash flow information related to leases was as follows: | |||||||||||
| Cash paid for amounts included in the measurement of lease liabilities: | |||||||||||
| Operating cash flows for operating leases | $ | $ | $ | ||||||||
| Right-of-use assets obtained in exchange for new lease obligations: | |||||||||||
| Operating leases assets | $ | $ | $ | ||||||||
| Operating leases liabilities | $ | $ | $ | ||||||||
| Supplemental balance sheet information related to leases was as follows: | |||||||||||
| Operating Leases | |||||||||||
| Operating lease right-of-use assets | $ | $ | $ | ||||||||
| Operating lease liabilities | |||||||||||
| Weighted Average Remaining Lease Term | |||||||||||
| Operating leases | |||||||||||
| Weighted Average Discount Rate | |||||||||||
| Operating leases | % | % | % | ||||||||
A summary of future minimum rental payments under such leases at the dates indicated follows:
| Year ended December 31, | Minimum Rental Payments | ||||
| (In Thousands) | |||||
| 2024 | $ | ||||
| 2025 | |||||
| 2026 | |||||
| 2027 | |||||
| 2028 | |||||
| Thereafter | |||||
| Total | $ | ||||
| Less imputed interest | ( | ||||
| $ | |||||
Certain leases contain escalation clauses for real estate taxes and other expenditures, which are not included above. Total rental expense was $8.5 million in 2023. This compares to total rent expense of $6.0 million and $5.9 million in 2022 and 2021, respectively.
A portion of the Company's headquarters was rented to third-party tenants which generated rental income of $0.2 million in 2023 compared to $0.2 million and $0.1 million in 2022 and 2021 respectively.
F-56
BROOKLINE BANCORP, INC. AND SUBSIDIARIES
Notes to Consolidated Financial Statements (Continued)
Legal Proceedings
In the normal course of business, there are various outstanding legal proceedings. In the opinion of management, after consulting with legal counsel, the consolidated financial position and results of operations of the Company are not expected to be affected materially by the outcome of such proceedings.
(14) Earnings per Share ("EPS")
The following table is a reconciliation of basic EPS and diluted EPS:
| For the year ended December 31, | |||||||||||||||||||||||||||||||||||
| 2023 | 2022 | 2021 | |||||||||||||||||||||||||||||||||
| Basic | Fully Diluted | Basic | Fully Diluted | Basic | Fully Diluted | ||||||||||||||||||||||||||||||
| (Dollars in Thousands, Except Per Share Amounts) | |||||||||||||||||||||||||||||||||||
| Numerator: | |||||||||||||||||||||||||||||||||||
| Net income | $ | $ | $ | $ | $ | $ | |||||||||||||||||||||||||||||
| Denominator: | |||||||||||||||||||||||||||||||||||
| Weighted average shares outstanding | |||||||||||||||||||||||||||||||||||
| Effect of dilutive securities | — | — | — | ||||||||||||||||||||||||||||||||
| Adjusted weighted average shares outstanding | |||||||||||||||||||||||||||||||||||
| EPS | $ | $ | $ | $ | $ | $ | |||||||||||||||||||||||||||||
(15) Comprehensive Income/(Loss)
Comprehensive income (loss) represents the sum of net income (loss) and other comprehensive income (loss). For the years ended December 31, 2023, 2022 and 2021, the Company’s other comprehensive income (loss) include the following three components: (i) unrealized holding gains (losses) on investment securities available-for-sale; (ii) change in the fair value of cash flow hedges and (iii) adjustment of accumulated obligation for postretirement benefits.
Changes in accumulated other comprehensive income (loss) by component, net of tax, were as follows for the periods indicated:
| Year Ended December 31, 2023 | |||||||||||||||||||||||
Investment Securities Available-for-Sale | Net Change in Fair Value of Cash Flow Hedges | Postretirement Benefits | Accumulated Other Comprehensive Income (Loss) | ||||||||||||||||||||
| (In Thousands) | |||||||||||||||||||||||
| Balance at December 31, 2022 | $ | ( | $ | ( | $ | $ | ( | ||||||||||||||||
| Other comprehensive income (loss) | ( | ||||||||||||||||||||||
| Reclassification adjustment for (income) expense recognized in earnings | ( | ||||||||||||||||||||||
| Balance at December 31, 2023 | $ | ( | $ | ( | $ | $ | ( | ||||||||||||||||
F-57
BROOKLINE BANCORP, INC. AND SUBSIDIARIES
Notes to Consolidated Financial Statements (Continued)
| Year Ended December 31, 2022 | |||||||||||||||||||||||
Investment Securities Available-for-Sale | Net Change in Fair Value of Cash Flow Hedges | Postretirement Benefits | Accumulated Other Comprehensive Income (Loss) | ||||||||||||||||||||
| (In Thousands) | |||||||||||||||||||||||
| Balance at December 31, 2021 | $ | ( | $ | $ | $ | ( | |||||||||||||||||
| Other comprehensive income (loss) | ( | ( | ( | ||||||||||||||||||||
| Reclassification adjustment for (income) expense recognized in earnings | ( | ||||||||||||||||||||||
| Balance at December 31, 2022 | $ | ( | $ | ( | $ | $ | ( | ||||||||||||||||
| Year Ended December 31, 2021 | |||||||||||||||||||||||
Investment Securities Available-for-Sale | Net Change in Fair Value of Cash Flow Hedges | Postretirement Benefits | Accumulated Other Comprehensive Income (Loss) | ||||||||||||||||||||
| (In Thousands) | |||||||||||||||||||||||
| Balance at December 31, 2020 | $ | $ | $ | ( | $ | ||||||||||||||||||
| Other comprehensive income (loss) | ( | ( | |||||||||||||||||||||
| Reclassification adjustment for (income) expense recognized in earnings | ( | ( | ( | ||||||||||||||||||||
| Balance at December 31, 2021 | $ | ( | $ | $ | $ | ( | |||||||||||||||||
F-58
BROOKLINE BANCORP, INC. AND SUBSIDIARIES
Notes to Consolidated Financial Statements (Continued)
(16) Derivatives and Hedging Activities
The Company executes loan level derivative products such as interest rate swap agreements with commercial banking customers to aid them in managing their interest rate risk. The interest rate swap contracts allow the commercial banking customers to convert floating rate loan payments to fixed rate loan payments. The Company concurrently enters into offsetting swaps with a third party financial institution, effectively minimizing its net risk exposure resulting from such transactions. The third party financial institution exchanges the customer's fixed rate loan payments for floating rate loan payments. As the interest rate swap agreements associated with this program do not meet hedge accounting requirements, changes in the fair value are recognized directly in earnings.
The Company believes using interest rate derivatives adds stability to interest income and expense and allows the Company to manage its exposure to interest rate movements. The Company enters into interest rate swaps as part of its interest rate risk management strategy. These interest rate swaps are designated as cash flow hedges and involve the receipt of fixed rate amounts from a counterparty in exchange for the Company making variable rate payments. The Company enters into interest rate swaps as hedging instruments against the interest rate risk associated with the Company's FHLB borrowings. For derivative instruments that are designated and qualify as cash flow hedging instruments, the effective portion of the gains or losses is reported as a component of other comprehensive income, and is reclassified into earnings in the period that the hedged forecasted transaction affects earnings.
The following table reflects the Company's derivative positions as of the date indicated below for interest rate derivatives which qualify as cash flow hedges for accounting purposes. The Company's cash flow hedges are subject to the hedge accounting provisions of FASB ASC Topic 815, "Derivatives and Hedging".
| At December 31, 2023 | ||||||||||||||||||||||||||||||||
| Notional Amount | Average Maturity | Weighted Average Rate | Fair Value | |||||||||||||||||||||||||||||
| Current Rate Paid | Received Fixed Swap Rate | |||||||||||||||||||||||||||||||
| (in thousands) | (in years) | (in thousands) | ||||||||||||||||||||||||||||||
| Interest rate swaps on loans | $ | % | % | $ | ( | |||||||||||||||||||||||||||
| At December 31, 2022 | |||||||||||||||||||||||||||||
| Notional Amount | Average Maturity | Weighted Average Rate | Fair Value | ||||||||||||||||||||||||||
| Current Rate Paid | Received Fixed Swap Rate | ||||||||||||||||||||||||||||
| (in thousands) | (in years) | (in thousands) | |||||||||||||||||||||||||||
| Interest rate swaps on loans | $ | % | % | $ | ( | ||||||||||||||||||||||||
The Company utilizes risk participation agreements with other banks participating in commercial loan arrangements. Participating banks guarantee the performance on borrower-related interest rate swap contracts. Risk participation agreements are derivative financial instruments and are recorded at fair value. These derivatives are not designated as hedges and therefore, changes in fair value are recorded directly through earnings at each reporting period. Under a risk participation-out agreement, a derivative asset, the Company participates out a portion of the credit risk associated with the interest rate swap position executed with the commercial borrower, for a fee paid to the participating bank.
The Company offers foreign exchange contracts to commercial borrowers to accommodate their business needs. These foreign exchange contracts do not qualify as hedges for accounting purposes. To mitigate the market and liquidity risk associated with these foreign exchange contracts, the Company enters into similar offsetting positions with a third party financial institution.
Asset derivatives and liability derivatives are included in other assets and accrued expenses and other liabilities on the consolidated balance sheets.
F-59
BROOKLINE BANCORP, INC. AND SUBSIDIARIES
Notes to Consolidated Financial Statements (Continued)
The following tables present the Company's customer related derivative positions for the periods indicated below for those derivatives not designated as hedging:
| Notional Amount Maturing | |||||||||||||||||||||||||||||||||||||||||||||||
| Number of Positions | Less than 1 year | Less than 2 years | Less than 3 years | Less than 4 years | Thereafter | Total | Fair Value | ||||||||||||||||||||||||||||||||||||||||
| December 31, 2023 | |||||||||||||||||||||||||||||||||||||||||||||||
| (Dollars In Thousands) | |||||||||||||||||||||||||||||||||||||||||||||||
| Loan level derivatives | |||||||||||||||||||||||||||||||||||||||||||||||
| Receive fixed, pay variable | $ | $ | $ | $ | $ | $ | $ | ||||||||||||||||||||||||||||||||||||||||
| Pay fixed, receive variable | |||||||||||||||||||||||||||||||||||||||||||||||
| Risk participation-out agreements | |||||||||||||||||||||||||||||||||||||||||||||||
| Risk participation-in agreements | |||||||||||||||||||||||||||||||||||||||||||||||
| Foreign exchange contracts | |||||||||||||||||||||||||||||||||||||||||||||||
| Buys foreign currency, sells U.S. currency | $ | $ | $ | $ | $ | $ | $ | ||||||||||||||||||||||||||||||||||||||||
| Sells foreign currency, buys U.S. currency | |||||||||||||||||||||||||||||||||||||||||||||||
| Notional Amount Maturing | |||||||||||||||||||||||||||||||||||||||||||||||
| Number of Positions | Less than 1 year | Less than 2 years | Less than 3 years | Less than 4 years | Thereafter | Total | Fair Value | ||||||||||||||||||||||||||||||||||||||||
| December 31, 2022 | |||||||||||||||||||||||||||||||||||||||||||||||
| (Dollars In Thousands) | |||||||||||||||||||||||||||||||||||||||||||||||
| Loan level derivatives | |||||||||||||||||||||||||||||||||||||||||||||||
| Receive fixed, pay variable | $ | $ | $ | $ | $ | $ | $ | ||||||||||||||||||||||||||||||||||||||||
| Pay fixed, receive variable | |||||||||||||||||||||||||||||||||||||||||||||||
| Risk participation-out agreements | |||||||||||||||||||||||||||||||||||||||||||||||
| Risk participation-in agreements | |||||||||||||||||||||||||||||||||||||||||||||||
| Foreign exchange contracts | |||||||||||||||||||||||||||||||||||||||||||||||
| Buys foreign currency, sells U.S. currency | $ | $ | $ | $ | $ | $ | $ | ||||||||||||||||||||||||||||||||||||||||
| Sells foreign currency, buys U.S. currency | |||||||||||||||||||||||||||||||||||||||||||||||
F-60
BROOKLINE BANCORP, INC. AND SUBSIDIARIES
Notes to Consolidated Financial Statements (Continued)
Changes in the fair value are recognized directly in the Company's consolidated statements of income and are included in in the consolidated statements of income. The table below presents the net gain (loss) recognized in income due to changes in the fair value for the year ended December 31, 2023 and 2022.
| Year Ended December 31, | |||||||||||
| 2023 | 2022 | ||||||||||
| (In Thousands) | |||||||||||
| Net (loss) gain recognized in income on: | |||||||||||
| Net risk participation agreements | $ | $ | ( | ||||||||
| Foreign exchange contracts | ( | ||||||||||
| Total | $ | $ | ( | ||||||||
By using derivative financial instruments, the Company exposes itself to credit risk which is the risk of failure by the counterparty to perform under the terms of the derivative contract. When the fair value of a derivative contract is positive, the counterparty owes the Company, which creates credit risk for the Company. When the fair value of a derivative is negative, the Company owes the counterparty and, therefore, it does not possess credit risk. The credit risk in derivative instruments is mitigated by entering into transactions with highly-rated counterparties that management believes to be creditworthy and by limiting the amount of exposure to each counterparty by either cross collateralizing the underlying hedged loan or through bilateral posting of collateral to cover exposure. As the swaps are subject to master netting agreements, the Company had limited exposure relating to loan level derivatives with institutional counterparties as of December 31, 2023 and 2022. The estimated net credit risk exposure for derivative financial instruments was zero
Certain derivative agreements contain provisions that require the Company to post collateral if the derivative exposure exceeds a threshold amount. The Company posted collateral of $81.5 million and $2.4 million in the normal course of business as of December 31, 2023 and 2022, respectively.
F-61
BROOKLINE BANCORP, INC. AND SUBSIDIARIES
Notes to Consolidated Financial Statements (Continued)
The tables below present the offsetting of derivatives and amounts subject to master netting agreements not offset in the consolidated balance sheet at the dates indicated:
| At December 31, 2023 | |||||||||||||||||||||||||||||||||||
| Gross Amounts Recognized | Gross Amounts Offset in the Statement of Financial Position | Net Amounts Presented in the Statement of Financial Position | Gross Amounts Not Offset in the Statement of Financial Position | Net Amount | |||||||||||||||||||||||||||||||
| Financial Instruments Pledged | Cash Collateral Pledged | ||||||||||||||||||||||||||||||||||
| (In Thousands) | |||||||||||||||||||||||||||||||||||
| Derivatives designated as hedging instruments: | |||||||||||||||||||||||||||||||||||
| Interest rate derivatives | $ | $ | $ | $ | $ | $ | |||||||||||||||||||||||||||||
| Derivatives not designated as hedging instruments: | |||||||||||||||||||||||||||||||||||
| Loan level derivatives | $ | $ | $ | $ | $ | $ | |||||||||||||||||||||||||||||
| Risk participation-out agreements | |||||||||||||||||||||||||||||||||||
| Foreign exchange contracts | |||||||||||||||||||||||||||||||||||
| Total | $ | $ | $ | $ | $ | $ | |||||||||||||||||||||||||||||
| Derivatives designated as hedging instruments: | |||||||||||||||||||||||||||||||||||
| Interest rate derivatives | $ | $ | $ | $ | $ | $ | |||||||||||||||||||||||||||||
| Derivatives not designated as hedging instruments: | |||||||||||||||||||||||||||||||||||
| Loan level derivatives | $ | $ | $ | $ | $ | $ | |||||||||||||||||||||||||||||
| Risk participation-in agreements | |||||||||||||||||||||||||||||||||||
| Foreign exchange contracts | |||||||||||||||||||||||||||||||||||
| Total | $ | $ | $ | $ | $ | $ | |||||||||||||||||||||||||||||
F-62
BROOKLINE BANCORP, INC. AND SUBSIDIARIES
Notes to Consolidated Financial Statements (Continued)
| At December 31, 2022 | |||||||||||||||||||||||||||||||||||
| Gross Amounts Recognized | Gross Amounts Offset in the Statement of Financial Position | Net Amounts Presented in the Statement of Financial Position | Gross Amounts Not Offset in the Statement of Financial Position | Net Amount | |||||||||||||||||||||||||||||||
| Financial Instruments Pledged | Cash Collateral Pledged | ||||||||||||||||||||||||||||||||||
| (In Thousands) | |||||||||||||||||||||||||||||||||||
| Derivatives designated as hedging instruments: | |||||||||||||||||||||||||||||||||||
| Interest rate derivatives | $ | $ | $ | $ | $ | $ | |||||||||||||||||||||||||||||
| Derivatives not designated as hedging instruments: | |||||||||||||||||||||||||||||||||||
| Loan level derivatives | $ | $ | $ | $ | $ | $ | |||||||||||||||||||||||||||||
| Risk participation-out agreements | |||||||||||||||||||||||||||||||||||
| Foreign exchange contracts | |||||||||||||||||||||||||||||||||||
| Total | $ | $ | $ | $ | $ | $ | |||||||||||||||||||||||||||||
| Derivatives designated as hedging instruments: | |||||||||||||||||||||||||||||||||||
| Interest rate derivatives | $ | $ | $ | $ | $ | $ | |||||||||||||||||||||||||||||
| Derivatives not designated as hedging instruments: | |||||||||||||||||||||||||||||||||||
| Loan level derivatives | $ | $ | $ | $ | $ | $ | |||||||||||||||||||||||||||||
| Risk participation-in agreements | |||||||||||||||||||||||||||||||||||
| Foreign exchange contracts | |||||||||||||||||||||||||||||||||||
| Total | $ | $ | $ | $ | $ | $ | |||||||||||||||||||||||||||||
The Company has agreements with certain of its derivative counterparties that contain credit-risk-related contingent provisions. These provisions provide the counterparty with the right to terminate its derivative positions and require the Company to settle its obligations under the agreements if the Company defaults on certain of its indebtedness or if the Company fails to maintain its status as a well-capitalized institution.
| Fair Value | ||||||||
| Year Ended December 31, 2023 | Year Ended December 31, 2022 | |||||||
| (Dollars in Thousands) | ||||||||
| Derivatives designated as hedges | $ | ( | $ | ( | ||||
| (Loss) in OCI on derivatives (effective portion), net of tax | $ | ( | $ | ( | ||||
| Gain (loss) reclassified from OCI into interest income or interest expense (effective portion) | $ | ( | $ | |||||
The guidance in ASU 2017-12 requires that amounts in accumulated other comprehensive income that are included in the assessment of effectiveness should be reclassified into earnings in the same period in which the hedged forecasted transactions impact earnings. A portion of the balance reported in accumulated other comprehensive income related to derivatives will be reclassified to interest expense as interest payments are made or received on the Company’s interest rate swaps. The Company monitors the risk of counterparty default on an ongoing basis.
F-63
BROOKLINE BANCORP, INC. AND SUBSIDIARIES
Notes to Consolidated Financial Statements (Continued)
(17) Income Taxes
Income tax expense is comprised of the following amounts:
| Year Ended December 31, | |||||||||||||||||
| 2023 | 2022 | 2021 | |||||||||||||||
| (In Thousands) | |||||||||||||||||
| Current provision: | |||||||||||||||||
| Federal | $ | $ | $ | ||||||||||||||
| State | |||||||||||||||||
| Total current provision | |||||||||||||||||
| Deferred provision (benefit) | |||||||||||||||||
| Federal | |||||||||||||||||
| State | |||||||||||||||||
| Total deferred provision (benefit) | |||||||||||||||||
| Total provision for income taxes | $ | $ | $ | ||||||||||||||
Total provision for income taxes differed from the amounts computed due to the following:
| Year Ended December 31, | |||||||||||||||||
| 2023 | 2022 | 2021 | |||||||||||||||
| (Dollars In Thousands) | |||||||||||||||||
| Expected income tax expense at statutory federal tax rate | $ | $ | $ | ||||||||||||||
| State taxes, net of federal income tax benefit | |||||||||||||||||
| Bank-owned life insurance | ( | ( | ( | ||||||||||||||
| Tax-exempt interest income | ( | ( | ( | ||||||||||||||
| Merger and acquisition expense | |||||||||||||||||
| Energy tax credits | ( | ( | |||||||||||||||
| Investments in affordable housing projects | ( | ( | ( | ||||||||||||||
| Other, net | |||||||||||||||||
| Total provision for income taxes | $ | $ | $ | ||||||||||||||
| Effective income tax rate | % | % | % | ||||||||||||||
The Company's effective tax rate was 20.1 % as of December 31, 2023 compared to 21.6 % as of December 31, 2022. The Company's effective tax rate was lower in 2023 due to the Company's continued participation in energy tax credit investments, and increased benefits in the Company's investments in affordable housing projects.
F-64
BROOKLINE BANCORP, INC. AND SUBSIDIARIES
Notes to Consolidated Financial Statements (Continued)
The tax effects of temporary differences that give rise to significant portions of the deferred tax assets and liabilities at the dates indicated are as follows:
| At December 31, | |||||||||||
| 2023 | 2022 | ||||||||||
| (In Thousands) | |||||||||||
| Deferred tax assets: | |||||||||||
| Allowance for credit losses | $ | $ | |||||||||
| Right-of-use asset - operating leases | |||||||||||
| Deferred compensation | |||||||||||
| Identified intangible assets and goodwill | |||||||||||
| Supplemental Executive Retirement Plans | |||||||||||
| Net operating loss carryforwards | |||||||||||
| Postretirement benefits | |||||||||||
| Nonaccrual interest | |||||||||||
| Restricted stock and stock option plans | |||||||||||
| Unrealized loss on investment securities available-for-sale | |||||||||||
| Acquisition fair value adjustments | |||||||||||
| Other | |||||||||||
| Total gross deferred tax assets | |||||||||||
| Deferred tax liabilities: | |||||||||||
| Operating leases - liability | |||||||||||
| Identified intangible assets and goodwill | |||||||||||
| Deferred loan origination costs, net | |||||||||||
| Depreciation | |||||||||||
| Prepaid expense | |||||||||||
| Accrued Expense | |||||||||||
| Acquisition fair value adjustments | |||||||||||
| Other | |||||||||||
| Total gross deferred tax liabilities | |||||||||||
| Net deferred tax asset | $ | $ | |||||||||
The Company has determined that a valuation allowance is not required for any of its deferred tax assets because it believes that it is more likely than not that these assets will reverse against future taxable income.
(18) Stockholders' Equity
Preferred Stock
The Company is authorized to issue 50,000,000 shares of serial preferred stock, par value $0.01 per share, from time to time in one or more series subject to limitations of law. The Board of Directors is authorized to fix the designations, powers, preferences, limitations and rights of the shares of each such series. As of December 31, 2023, there were no shares of preferred stock issued.
F-65
BROOKLINE BANCORP, INC. AND SUBSIDIARIES
Notes to Consolidated Financial Statements (Continued)
Capital Distributions and Restrictions Thereon
The Company is a legal entity separate and distinct from each of the Banks and Clarendon Private. The Company's primary source of revenue is dividends paid to it by the Banks and Clarendon Private.
The FRB has authority to prohibit the Company from paying dividends to the Company's shareholders if such payment is deemed to be an unsafe or unsound practice. The FRB has indicated generally that it may be an unsafe or unsound practice for bank holding companies to pay dividends unless the bank holding company's net income over the preceding year is sufficient to fund the dividends and the expected rate of earnings retention is consistent with the organization's capital needs, asset quality and overall financial condition.
The FRB also has the authority to use its enforcement powers to prohibit the Banks from paying dividends to the Company if, in its opinion, the payment of dividends would constitute an unsafe or unsound practice. Federal law also prohibits the payment of dividends by a bank that will result in the bank failing to meet its applicable capital requirements on a pro forma basis. In addition, a state bank that is a member of the Federal Reserve System may not declare or pay a dividend if the total of all dividends declared during the calendar year, including the proposed dividend, exceeds the sum of the bank's net income (as reportable in its Reports of Condition and Income) during the current calendar year and the retained net income of the prior two calendar years, unless the dividend has been approved by the FRB. Payment of dividends by a bank is also restricted pursuant to various state regulatory limitations, including those enforced by the Massachusetts Division of Banks in the case of Brookline Bank, the Banking Division of the Rhode Island Department of Business Regulation in the case of BankRI and New York State Department of Financial Services in the case of PCSB.
Common Stock Repurchases
On January 27, 2021, the Company's Board of Directors (the "Board") approved a stock repurchase program authorizing management to repurchase up to $10.0 million of the Company's common stock commencing on February 1, 2021 and ending on December 31, 2021. As of September 30, 2021, 690,253 shares of the Company's common stock were repurchased by the Company at a weighted average price of $14.46 .
On November 10, 2021, the Board approved a stock repurchase program authorizing management to repurchase up to $20.0 million of the Company's common stock, commencing on November 15, 2021 and ending on December 31, 2022. On June 24, 2022 the Company suspended the program. As of June 24, 2022, 956,341 shares of the Company's common stock were repurchased by the Company at a weighted average price of $14.41 .
Repurchases may be made from time to time depending on market conditions and other factors, and will be conducted through open market or private transactions, through block trades, and pursuant to any trading plan that may be adopted in accordance with the Securities and Exchange Commission Rule 10b5-1. There is no guarantee as to the exact number of shares, if any, to be repurchased by the Company.
Restricted Retained Earnings
As part of the stock offering in 2002 and as required by regulation, Brookline Bank established a liquidation account for the benefit of eligible account holders and supplemental eligible account holders who maintain their deposit accounts at Brookline Bank after the stock offering. In the unlikely event of a complete liquidation of Brookline Bank (and only in that event), eligible depositors who continue to maintain deposit accounts at Brookline Bank shall be entitled to receive a distribution from the liquidation account.
Accordingly, retained earnings of the Company are deemed to be restricted up to the balance of the liquidation account. The liquidation account balance is reduced annually to the extent that eligible depositors have reduced their qualifying deposits as of each anniversary date. Subsequent increases in deposit account balances do not restore an account holder's interest in the liquidation account.
The liquidation account totaled $8.9 million (unaudited), $9.9 million (unaudited), and $11.3 million (unaudited) at
December 31, 2023, 2022 and 2021, respectively.
F-66
BROOKLINE BANCORP, INC. AND SUBSIDIARIES
Notes to Consolidated Financial Statements (Continued)
(19) Regulatory Capital Requirements
The Company's primary source of cash is dividends from the Banks. The Banks are subject to certain restrictions on the amount of dividends that they may declare without prior regulatory approval. In addition, the dividends declared cannot be in excess of the amount which would cause the Banks to fall below the minimum required for capital adequacy purposes.
The Company is a bank holding company within the meaning of the Bank Holding Company Act of 1956, as amended and as such, must comply with the capital requirements of the FRB at the consolidated level. As member banks of the FRB, Brookline Bank, BankRI and PCSB Bank are also required to comply with the regulatory capital requirement of the FRB.
The FRB has promulgated regulations imposing minimum capital requirements for bank holding companies and state member banks as well as prompt corrective action regulations for state member banks that implement the system of prompt corrective action established by Section 38 of the Federal Deposit Insurance Act, as amended (the "FDIA"). Under the prompt corrective action regulations in effect as of December 31, 2023, a bank is "well-capitalized" if it has: (1) a total risk-based capital ratio of 10.0 % or greater; (2) a Tier 1 risk-based capital ratio of 8.0 % or greater; (3) a common equity Tier 1 capital ratio of 6.5 % or greater; (4) a Tier 1 leverage ratio of 5.0 % or greater; and (5) is not subject to any written agreement, order, capital directive or prompt corrective action directive to meet and maintain a specific capital level for any capital measure.
Failure to meet minimum capital requirements can initiate certain mandatory and possibly additional discretionary actions by regulators that, if undertaken, could have a direct material effect on the Company's financial statements. Under capital adequacy guidelines, the Company and each of the Banks must meet specific capital guidelines that involve quantitative measures of the Company's and the Banks' assets, liabilities and certain off-balance sheet items as calculated under regulatory accounting practices. In addition, the prompt corrective action rules applicable to state member banks establish a framework of supervisory actions for state member banks that are not at least adequately capitalized. The Company's and the Banks' capital amounts and classification are also subject to qualitative judgments by the regulators about components, risk weightings, and other factors. Bank holding companies are not subject to prompt corrective action requirements. However, a bank holding company is considered "well capitalized" for purpose of the FRB's Regulation Y if the bank holding company maintains on a consolidated basis a total risk-based capital ratio of 10.0% or greater and a Tier 1 risk-based capital ratio of 6.0% or greater and is not subject to any written agreement under capital directive or prompt correction action directive issued by the FRB to meet and maintain a specific capital level for any capital measure.
The Company and the Banks are required to maintain a capital conservation buffer composed of common equity Tier 1 capital equal to 2.5% of risk-weighted assets above the amounts required to be adequately capitalized in order to avoid limitations on capital distributions, including dividend payments and certain discretionary bonus payments to executive officers. Capital ratios required to be considered well-capitalized exceed the ratios required under the capital conservation buffer requirement at December 31, 2023.
As of December 31, 2023, the Company and the Banks exceeded all regulatory capital requirements and were considered “well-capitalized” under applicable rules. The following table presents actual and required capital ratios as of December 31, 2023 for the Company and the Banks.
F-67
BROOKLINE BANCORP, INC. AND SUBSIDIARIES
Notes to Consolidated Financial Statements (Continued)
| Actual | Minimum Required for Capital Adequacy Purposes | Minimum Required for Fully Phased in Capital Adequacy Purposes plus Capital Conservation Buffer | Minimum Required to be Considered “Well-Capitalized” Under Prompt Corrective Action Provisions | ||||||||||||||||||||||||||||||||||||||||||||
| Amount | Ratio | Amount | Ratio | Amount | Ratio | Amount | Ratio | ||||||||||||||||||||||||||||||||||||||||
| (Dollars in Thousands) | |||||||||||||||||||||||||||||||||||||||||||||||
| At December 31, 2023: | |||||||||||||||||||||||||||||||||||||||||||||||
| Brookline Bancorp, Inc. | |||||||||||||||||||||||||||||||||||||||||||||||
Common equity Tier 1 capital ratio (1) | $ | % | $ | % | $ | % | N/A | N/A | |||||||||||||||||||||||||||||||||||||||
Tier 1 leverage capital ratio (2) | % | % | % | N/A | N/A | ||||||||||||||||||||||||||||||||||||||||||
Tier 1 risk-based capital ratio (3) | % | % | % | N/A | N/A | ||||||||||||||||||||||||||||||||||||||||||
Total risk-based capital ratio (4) | % | % | % | N/A | N/A | ||||||||||||||||||||||||||||||||||||||||||
| Brookline Bank | |||||||||||||||||||||||||||||||||||||||||||||||
Common equity Tier 1 capital ratio (1) | $ | % | $ | % | $ | % | $ | % | |||||||||||||||||||||||||||||||||||||||
Tier 1 leverage capital ratio (2) | % | % | % | % | |||||||||||||||||||||||||||||||||||||||||||
Tier 1 risk-based capital ratio (3) | % | % | % | % | |||||||||||||||||||||||||||||||||||||||||||
Total risk-based capital ratio (4) | % | % | % | % | |||||||||||||||||||||||||||||||||||||||||||
| BankRI | |||||||||||||||||||||||||||||||||||||||||||||||
Common equity Tier 1 capital ratio (1) | $ | % | $ | % | $ | % | $ | % | |||||||||||||||||||||||||||||||||||||||
Tier 1 leverage capital ratio (2) | % | % | % | % | |||||||||||||||||||||||||||||||||||||||||||
Tier 1 risk-based capital ratio (3) | % | % | % | % | |||||||||||||||||||||||||||||||||||||||||||
Total risk-based capital ratio (4) | % | % | % | % | |||||||||||||||||||||||||||||||||||||||||||
| PCSB Bank | |||||||||||||||||||||||||||||||||||||||||||||||
Common equity Tier 1 capital ratio (1) | % | % | % | % | |||||||||||||||||||||||||||||||||||||||||||
Tier 1 leverage capital ratio (2) | % | % | % | % | |||||||||||||||||||||||||||||||||||||||||||
Tier 1 risk-based capital ratio (3) | % | % | % | % | |||||||||||||||||||||||||||||||||||||||||||
Total risk-based capital ratio (4) | % | % | % | % | |||||||||||||||||||||||||||||||||||||||||||
_______________________________________________________________________________
(1) Common equity Tier 1 capital ratio is calculated by dividing common equity Tier 1 capital by risk-weighted assets.
(2) Tier 1 leverage capital ratio is calculated by dividing Tier 1 capital by average assets.
(3) Tier 1 risk-based capital ratio is calculated by dividing Tier 1 capital by risk-weighted assets.
(4) Total risk-based capital ratio is calculated by dividing total capital by risk-weighted assets.
F-68
BROOKLINE BANCORP, INC. AND SUBSIDIARIES
Notes to Consolidated Financial Statements (Continued)
The following table presents actual and required capital ratios as of December 31, 2022 for the Company and the Banks under the regulatory capital rules then in effect.
| Actual | Minimum Required for Capital Adequacy Purposes | Minimum Required for Fully Phased in Capital Adequacy Purposes plus Capital Conservation Buffer | Minimum Required to be Considered “Well-Capitalized” Under Prompt Corrective Action Provisions | ||||||||||||||||||||||||||||||||||||||||||||
| Amount | Ratio | Amount | Ratio | Amount | Ratio | Amount | Ratio | ||||||||||||||||||||||||||||||||||||||||
| (Dollars in Thousands) | |||||||||||||||||||||||||||||||||||||||||||||||
| At December 31, 2022: | |||||||||||||||||||||||||||||||||||||||||||||||
| Brookline Bancorp, Inc. | |||||||||||||||||||||||||||||||||||||||||||||||
Common equity Tier 1 capital ratio (1) | $ | % | $ | % | $ | % | N/A | N/A | |||||||||||||||||||||||||||||||||||||||
Tier 1 leverage capital ratio (2) | % | % | % | N/A | N/A | ||||||||||||||||||||||||||||||||||||||||||
Tier 1 risk-based capital ratio (3) | % | % | % | N/A | N/A | ||||||||||||||||||||||||||||||||||||||||||
Total risk-based capital ratio (4) | % | % | % | N/A | N/A | ||||||||||||||||||||||||||||||||||||||||||
| Brookline Bank | |||||||||||||||||||||||||||||||||||||||||||||||
Common equity Tier 1 capital ratio (1) | $ | % | $ | % | $ | % | $ | % | |||||||||||||||||||||||||||||||||||||||
Tier 1 leverage capital ratio (2) | % | % | % | % | |||||||||||||||||||||||||||||||||||||||||||
Tier 1 risk-based capital ratio (3) | % | % | % | % | |||||||||||||||||||||||||||||||||||||||||||
Total risk-based capital ratio (4) | % | % | % | % | |||||||||||||||||||||||||||||||||||||||||||
| BankRI | |||||||||||||||||||||||||||||||||||||||||||||||
Common equity Tier 1 capital ratio (1) | $ | % | $ | % | $ | % | $ | % | |||||||||||||||||||||||||||||||||||||||
Tier 1 leverage capital ratio (2) | % | % | % | % | |||||||||||||||||||||||||||||||||||||||||||
Tier 1 risk-based capital ratio (3) | % | % | % | % | |||||||||||||||||||||||||||||||||||||||||||
Total risk-based capital ratio (4) | % | % | % | % | |||||||||||||||||||||||||||||||||||||||||||
_______________________________________________________________________________
(1) Common equity Tier 1 capital ratio is calculated by dividing common equity Tier 1 capital by risk-weighted assets.
(2) Tier 1 leverage capital ratio is calculated by dividing Tier 1 capital by average assets.
(3) Tier 1 risk-based capital ratio is calculated by dividing Tier 1 capital by risk-weighted assets.
(4) Total risk-based capital ratio is calculated by dividing total capital by risk-weighted assets.
F-69
BROOKLINE BANCORP, INC. AND SUBSIDIARIES
Notes to Consolidated Financial Statements (Continued)
(20) Employee Benefit Plans
Postretirement Benefits
Postretirement benefits are provided for part of the annual expense of health insurance premiums for certain retired employees and their dependents. No contributions are made by the Company to invest in assets allocated for the purpose of funding this benefit obligation. The following table presents the change in plan assets and change in benefit obligation:
| Year Ended December 31, | |||||||||||||||||
| 2023 | 2022 | 2021 | |||||||||||||||
| (In Thousands) | |||||||||||||||||
| Change in plan assets: | |||||||||||||||||
| Fair value of plan assets at beginning of year | $ | $ | $ | ||||||||||||||
| Employer contributions | |||||||||||||||||
| Benefits paid | ( | ( | ( | ||||||||||||||
| Fair value of plan assets at end of year | $ | $ | $ | ||||||||||||||
| Change in benefit obligation: | |||||||||||||||||
| Benefit obligation at beginning of year | $ | $ | $ | ||||||||||||||
| Service cost | |||||||||||||||||
| Interest cost | |||||||||||||||||
| Estimated benefits paid | ( | ( | ( | ||||||||||||||
| Actuarial (gain) loss | ( | ( | ( | ||||||||||||||
| Benefit obligation at end of year | $ | $ | $ | ||||||||||||||
| Funded status at end of year | $ | $ | $ | ||||||||||||||
| Accumulated benefit obligation at end of year | $ | $ | $ | ||||||||||||||
The liability for the postretirement benefits included in accrued expenses and other liabilities was $1.6 million, $1.5 million, and $2.0 million as of December 31, 2023, 2022 and 2021, respectively.
The following table presents the components of net periodic postretirement benefit cost and other amounts recognized in other comprehensive income:
| Year Ended December 31, | |||||||||||||||||
| 2023 | 2022 | 2021 | |||||||||||||||
| (In Thousands) | |||||||||||||||||
| Net periodic benefit expense: | |||||||||||||||||
| Service cost | $ | $ | $ | ||||||||||||||
| Interest cost | |||||||||||||||||
| Prior service credit | ( | ||||||||||||||||
| Actuarial gain | ( | ||||||||||||||||
| Net periodic benefit expense | $ | $ | $ | ||||||||||||||
| Changes in postretirement benefit obligation recognized in other comprehensive income: | |||||||||||||||||
| Net actuarial (loss) gain | $ | $ | |||||||||||||||
| Prior service credit | ( | ||||||||||||||||
| Total pre-tax changes in postretirement benefit obligation recognized in other comprehensive income | $ | $ | $ | ||||||||||||||
F-70
BROOKLINE BANCORP, INC. AND SUBSIDIARIES
Notes to Consolidated Financial Statements (Continued)
The discount rate used to determine the actuarial present value of projected postretirement benefit obligations was 4.82 % in 2023, 5.02 % in 2022 and 2.77 % in 2021. There is no estimated prior service credit that will be amortized from accumulated other comprehensive income into net periodic benefit cost in 2024.
The actual health care trend used to measure the accumulated postretirement benefit obligation in 2023 for plan participants below age 65 and for plan participants over age 65 was (1.1 )% and 3.4 %, respectively. In 2022, the rate for plan participants below age 65 and for plan participants over age 65 was 8.0 % and 1.6 %, respectively. The health care trend rates for 2022 and 2023 are based on actual changes in medical premium rates for those years. The rates to be used in 2024 through 2027 are expected to be in the range of 8 % to 6.5 % and to decline gradually thereafter to 4.5 %. Assumed health care trend rates may have a significant effect on the amounts reported for the postretirement benefit plan. A 1% change in assumed health care cost trend rates would have the following effects:
| Year Ended December 31, 2023 | |||||||||||
| 1% Increase | 1% Decrease | ||||||||||
| (In Thousands) | |||||||||||
| Effect on total service and interest cost components of net periodic postretirement benefit costs | $ | $ | ( | ||||||||
| Effect on the accumulated postretirement benefit obligation | ( | ||||||||||
401(k) Plan
The Company administers one 401(k) plan, which is a qualified, tax-exempt profit-sharing plan with a salary deferral feature under Section 401(k) of the Internal Revenue Code. Each employee, excluding temporary employees, who has attained the age of 21 is eligible to participate in the 401(k) plan by making voluntary contributions, subject to certain limits based on federal tax laws. The Company makes a matching contribution of the amount contributed by eligible employees, up to 5 % of the employee's yearly compensation. Expenses associated with the plans were $4.6 million in 2023, $3.8 million in 2022, and $3.6 million in 2021.
Nonqualified Deferred Compensation Plan
The Company also maintains a Nonqualified Deferred Compensation Plan (the "Nonqualified Plan") under which certain participants may contribute the amounts they are precluded from contributing to the Company's 401(k) plan because of the qualified plan limitations, and additional compensation deferrals that may be advantageous for personal income tax or other planning reasons. Expenses associated with the Nonqualified Plan in 2023, 2022 and 2021 were $645.8 thousand, $477.6 thousand, and $409.4 thousand, respectively. Accrued liabilities associated with the Nonqualified Plan in 2023, 2022, and 2021 were $1.3 thousand, $1.3 thousand, and $109.5 thousand, respectively.
Supplemental Executive Retirement Agreements
The Company acquired two Supplemental Executive Retirement Plans (the "SERPs") as part of its acquisition of BankRI. The Company maintains the SERPs for certain senior executives who are entitled to an annual retirement benefit. As of December 31, 2023, there were 14 participants in the SERPs. The Company funded a Rabbi Trust to provide a partial funding source for the Company's liabilities under the SERPs. In 2016, a portion of the Company's BOLI assets were transferred into the Rabbi Trust as a replacement for the funds previously held in the Rabbi Trust. In 2020, additional BOLI assets were transferred into the Rabbi Trust. The Company records the liability for the SERPs based on an actuarial calculation in accordance with GAAP, and no actuarial gains and losses are recognized.
Total expense under the SERPs for the year ended December 31, 2023 was $589 thousand compared to a benefit in 2022 of $2.1 million and an expense in 2021 of $6.0 thousand. Aggregate benefits payable included in accrued expenses and other liabilities as of December 31, 2023 and 2022 were $10.8 million and $10.7 million, respectively.
The nominal discount rate used to determine the actuarial present value of projected benefits under the agreements was 5.00 % and 5.00 % in the years 2023 and 2022, respectively.
F-71
BROOKLINE BANCORP, INC. AND SUBSIDIARIES
Notes to Consolidated Financial Statements (Continued)
Defined Benefit Pension Plan
As part of the acquisition of PCSB, the Company acquired a pension plan covering certain employees (the "PCSB Pension Plan"). The PCSB Pension Plan has been terminated and the Company has filed a request for a determination letter with the Internal Revenue Service.The PCSB Pension Plan is currently over-funded with assets of $7.3 million that are included in other assets in the Company's balance sheet. During the year ended December 31, 2023, the PCSB Pension Plan had unrealized gains of $903 thousand reflected in other comprehensive income. No contributions were made to the PCSB Pension Plan in 2023.
Employee Stock Ownership Plan
The Company previously maintained an Employee Stock Ownership Plan ("ESOP") which was closed pending final regulatory and government approval. Compensation and employee benefit expense related to ESOP were $0.0 million in 2023 and $0.4 million in 2022.
Share-Based Compensation Plans
As of December 31, 2023, the Company had one active equity plan: the 2021 Brookline Bancorp, Inc. Stock Option and Incentive Plan ("2021 Plan") with 1,750,000 authorized shares. As a result of the 2021 Plan having been approved by the Company's stockholders at the 2021 annual meeting of stockholders, the Company discontinued granting awards under the 2014 Equity Incentive Plan (the "2014 Plan"), and no further shares will be granted as awards under the 2014 Plan. The 2021 Plan and the 2014 Plan together referred to as the "Plans."
Of the awarded shares, generally 50 % vest ratably over three years with one-third of such shares vesting at each of the first, second and third anniversary dates of the awards. The remaining 50 % of each award has a cliff vesting schedule and vest three years after the award date based on the level of the Company's achievement of identified performance targets in comparison to the level of achievement of such identified performance targets by a defined peer group. The specific performance measure targets are approved annually by the Compensation Committee and are discussed in the Company's Proxy Statement. If a grantee leaves the Company prior to the vest date of an award, any unvested shares are forfeited. Dividends declared with respect to shares awarded will be held by the Company and paid to the grantee only when the shares vest.
Shares issued upon vesting may be either authorized but unissued shares or reacquired shares held by the Company as treasury shares. Any shares not issued because vesting requirements are not met will be retired back to treasury and be made available again for issuance under the Plans.
Total expense for the Plans was $4.1 million in 2023, $3.3 million in 2022 and $2.6 million in 2021, respectively. Total income tax benefits on vested awards was $0.0 million in 2023, $0.0 million in 2022, and $0.1 million in 2021. There were no income tax benefits on the 2023 vesting due to the stock price at the vesting date being lower overall than the stock price at the grant date. Dividends paid on unvested awards under the 2021 Plan and the 2014 Plan were $0.3 million in 2023, $0.2 million in 2022, and $0.2 million in 2021.
The following table presents information about the Company's restricted stock awards as of and for the year ending December 31, 2023:
| Restricted Stock Awards Outstanding | Weighted Average Price per Share | ||||||||||||||||
| (Dollars in Thousands, Except Per Share Amounts) | |||||||||||||||||
| Restricted Stock Awards: | |||||||||||||||||
| Outstanding at December 31, 2022 | $ | ||||||||||||||||
| Granted | |||||||||||||||||
| Vested | ( | ||||||||||||||||
| Forfeited / Canceled | ( | ||||||||||||||||
| Outstanding at December 31, 2023 | $ | ||||||||||||||||
| Unrecognized compensation cost | $ | ||||||||||||||||
| Weighted average remaining recognition period (months) | |||||||||||||||||
F-72
BROOKLINE BANCORP, INC. AND SUBSIDIARIES
Notes to Consolidated Financial Statements (Continued)
The following table presents information about the securities authorized for issuance under the Company's equity compensation plan:
| Number of Securities to Be Issued Upon Exercise of Outstanding Options, Warrants, and rights (a) | Weighted Average Exercise Price of Outstanding Options, Warrants and Right (b) | Number of Securities Remaining Available for Future Issuance (Excluding Securities in Column (a)) (c) | ||||||||||||||||||
Equity compensation plans approved by security holders (1) | $ | (2) | ||||||||||||||||||
| Equity compensation plans not approved by security holders | ||||||||||||||||||||
| Total | $ | |||||||||||||||||||
(1) Consists of the 2021 Plan.
(21) Fair Value of Financial Instruments
A description of the valuation methodologies used for assets and liabilities measured at fair value on a recurring and non-recurring basis, as well as the general classification of such instruments pursuant to the valuation hierarchy, is set forth below. There were no changes in the valuation techniques used during 2023 and 2022.
F-73
BROOKLINE BANCORP, INC. AND SUBSIDIARIES
Notes to Consolidated Financial Statements (Continued)
Assets and Liabilities Recorded at Fair Value on a Recurring Basis
The following table set forth the carrying value of assets and liabilities measured at fair value on a recurring basis at December 31, 2023 and 2022:
| Carrying Value as of December 31, 2023 | |||||||||||||||||||||||
| Level 1 | Level 2 | Level 3 | Total | ||||||||||||||||||||
| (In Thousands) | |||||||||||||||||||||||
| Assets: | |||||||||||||||||||||||
| Investment securities available-for-sale: | |||||||||||||||||||||||
| GSE debentures | $ | $ | $ | $ | |||||||||||||||||||
| GSE CMOs | |||||||||||||||||||||||
| GSE MBSs | |||||||||||||||||||||||
| Municipal obligations | |||||||||||||||||||||||
| Corporate debt obligations | |||||||||||||||||||||||
| U.S. Treasury bonds | |||||||||||||||||||||||
| Foreign government obligations | |||||||||||||||||||||||
| Total investment securities available-for-sale | $ | $ | $ | $ | |||||||||||||||||||
| Interest rate derivatives | $ | $ | |||||||||||||||||||||
| Loan level derivatives | |||||||||||||||||||||||
| Risk participation-out agreements | |||||||||||||||||||||||
| Foreign exchange contracts | |||||||||||||||||||||||
| Liabilities: | |||||||||||||||||||||||
| Interest rate derivatives | $ | $ | $ | $ | |||||||||||||||||||
| Loan level derivatives | |||||||||||||||||||||||
| Risk participation-in agreements | |||||||||||||||||||||||
| Foreign exchange contracts | |||||||||||||||||||||||
F-74
BROOKLINE BANCORP, INC. AND SUBSIDIARIES
Notes to Consolidated Financial Statements (Continued)
| Carrying Value as of December 31, 2022 | |||||||||||||||||||||||
| Level 1 | Level 2 | Level 3 | Total | ||||||||||||||||||||
| (In Thousands) | |||||||||||||||||||||||
| Assets: | |||||||||||||||||||||||
| Investment securities available-for-sale: | |||||||||||||||||||||||
| GSE debentures | $ | $ | $ | $ | |||||||||||||||||||
| GSE CMOs | |||||||||||||||||||||||
| GSE MBSs | |||||||||||||||||||||||
| Corporate debt obligations | |||||||||||||||||||||||
| U.S. Treasury bonds | |||||||||||||||||||||||
| Foreign government obligations | |||||||||||||||||||||||
| Total investment securities available-for-sale | $ | $ | $ | $ | |||||||||||||||||||
| Interest rate derivatives | |||||||||||||||||||||||
| Loan level derivatives | |||||||||||||||||||||||
| Risk participation-out agreements | |||||||||||||||||||||||
| Foreign exchange contracts | |||||||||||||||||||||||
| Liabilities: | |||||||||||||||||||||||
| Interest rate derivatives | $ | $ | $ | $ | |||||||||||||||||||
| Loan level derivatives | $ | $ | $ | $ | |||||||||||||||||||
| Risk participation-in agreements | |||||||||||||||||||||||
| Foreign exchange contracts | |||||||||||||||||||||||
Investment Securities Available-for-Sale
The fair value of investment securities is based principally on market prices and dealer quotes received from third-party and nationally-recognized pricing services for identical investment securities such as U.S. Treasury and agency securities. These prices are validated by comparing the primary pricing source with an alternative pricing source when available. When quoted market prices for identical securities are unavailable, the Company uses market prices provided by independent pricing services based on recent trading activity and other observable information, including but not limited to market interest-rate curves, referenced credit spreads and estimated prepayment speeds where applicable. These investments include GSE debentures, GSE mortgage-related securities, SBA commercial loan asset backed securities, corporate debt securities, municipal obligations and U.S. Treasury bonds, all of which are included in Level 2. As of December 31, 2023, certain corporate debt securities and municipal obligations were valued using pricing models included in Level 3, compared to December 31, 2022 when no securities were included in Level 3.
Additionally, management reviews changes in fair value from period to period and performs testing to ensure that prices received from the third parties are consistent with management's expectation of the market. Changes in the prices obtained from the pricing service are analyzed from month to month, taking into consideration changes in market conditions including changes in mortgage spreads, changes in U.S. Treasury security yields and changes in generic pricing of 15 -year and 30 -year securities. Additional analysis may include a review of prices provided by other independent parties, a yield analysis, a review of average life changes using Bloomberg analytics and a review of historical pricing for a particular security.
Derivatives and Hedging Instruments
The fair value of interest rate derivatives designated as hedging instruments, loan level derivatives, risk participation agreements (RPA in/out), and foreign exchange contracts represent a Level 2 valuation and are based on settlement values adjusted for credit risks associated with the counterparties and the Company and observable market interest rate curves and foreign exchange rates where applicable. Credit risk adjustments consider factors such as the likelihood of default by the Company and its counterparties, its net exposures and remaining contractual life. To date, the Company has not realized any losses due to a counterparty's inability to pay any net uncollateralized position. Refer also to Note 16, "Derivatives and Hedging Activities."
F-75
BROOKLINE BANCORP, INC. AND SUBSIDIARIES
Notes to Consolidated Financial Statements (Continued)
There were no transfers between levels for assets and liabilities recorded at fair value on a recurring basis during 2023 or 2022.
The following tables summarize information about significant unobservable inputs related to the Company's categories of Level 3 financial assets and liabilities measured on a recurring basis. As part of the PCSB acquisition, select municipal obligations and corporate debt securities are held in Level 3.
| Quantitative Information About Level 3 Fair Value Measurements - Recurring Basis | |||||||||||||||||||||||||||||
| Financial Instrument | Estimated Fair Value | Valuation Technique(s) | Significant Unobservable Inputs | Range of Inputs | Weighted Average | ||||||||||||||||||||||||
| (In Thousands) | |||||||||||||||||||||||||||||
| December 31, 2023 | |||||||||||||||||||||||||||||
| Assets | |||||||||||||||||||||||||||||
| Municipal obligations | $ | Discounted Cash Flow | Discount Rate from Bloomberg BVAL | % | |||||||||||||||||||||||||
| Corporate debt obligations | Observable Bids | Bloomberg TRACE | |||||||||||||||||||||||||||
The following table summarizes the changes in estimated fair value for all assets and liabilities measured at estimated fair value on a recurring basis using significant unobservable inputs (Level 3).
| Changes in Estimated Fair Value of Level 3 Financial Assets and Liabilities - Recurring Basis | |||||||||||
| Twelve Months Ended December 31, 2023 | |||||||||||
| (In Thousands) | |||||||||||
| Municipal obligations | Corporate debt obligations | ||||||||||
| Beginning balance | $ | $ | |||||||||
| Purchases | |||||||||||
| Included in comprehensive income | |||||||||||
| Acquired from PCSB | |||||||||||
| Transfers out | |||||||||||
| Sales | ( | ||||||||||
| Maturities, calls, and paydowns | ( | ( | |||||||||
| Ending balance | $ | $ | |||||||||
F-76
BROOKLINE BANCORP, INC. AND SUBSIDIARIES
Notes to Consolidated Financial Statements (Continued)
Assets and Liabilities Recorded at Fair Value on a Non-Recurring Basis
Assets and liabilities measured at fair value on a non-recurring basis as of December 31, 2023 and 2022 are summarized below:
| Carrying Value as of December 31, 2023 | |||||||||||||||||||||||
| Level 1 | Level 2 | Level 3 | Total | ||||||||||||||||||||
| (In Thousands) | |||||||||||||||||||||||
| Assets measured at fair value on a non-recurring basis: | |||||||||||||||||||||||
| Collateral-dependent impaired loans and leases | $ | $ | $ | $ | |||||||||||||||||||
| OREO | |||||||||||||||||||||||
| Repossessed assets | |||||||||||||||||||||||
| Total assets measured at fair value on a non-recurring basis | $ | $ | $ | $ | |||||||||||||||||||
| Carrying Value as of December 31, 2022 | |||||||||||||||||||||||
| Level 1 | Level 2 | Level 3 | Total | ||||||||||||||||||||
| (In Thousands) | |||||||||||||||||||||||
| Assets measured at fair value on a non-recurring basis: | |||||||||||||||||||||||
| Collateral-dependent impaired loans and leases | $ | $ | $ | $ | |||||||||||||||||||
| OREO | $ | $ | $ | $ | |||||||||||||||||||
| Repossessed assets | |||||||||||||||||||||||
| Total assets measured at fair value on a non-recurring basis | $ | $ | $ | $ | |||||||||||||||||||
Collateral-Dependent Impaired Loans and Leases
For nonperforming loans and leases where the credit quality of the borrower has deteriorated significantly, fair values of the underlying collateral were estimated using purchase and sales agreements (Level 2), or comparable sales or recent appraisals (Level 3), adjusted for selling costs and other expenses.
Other Real Estate Owned
The Company records OREO at the lower of cost or fair value. In estimating fair value, the Company utilizes purchase and sales agreements (Level 2) or comparable sales, recent appraisals or cash flows discounted at an interest rate commensurate with the risk associated with these cash flows (Level 3), adjusted for selling costs and other expenses.
Repossessed Assets
Repossessed assets are carried at estimated fair value less costs to sell based on auction pricing (Level 2).
The table below presents quantitative information about significant unobservable inputs (Level 3) for assets measured at fair value on a recurring basis at the dates indicated.
_______________________________________________________________________________
| Fair Value | Valuation Technique | ||||||||||||||||
| At December 31, 2023 | At December 31, 2022 | ||||||||||||||||
| (Dollars in Thousands) | |||||||||||||||||
| Collateral-dependent impaired loans and leases | $ | $ | Appraisal of collateral (1) | ||||||||||||||
| Other real estate owned | Appraisal of collateral (1) | ||||||||||||||||
(1) Fair value is generally determined through independent appraisals of the underlying collateral. The Company may also use another available source of collateral assessment to determine a reasonable estimate of the fair value of the collateral. Appraisals may be adjusted by management for qualitative factors such as economic factors and estimated liquidation expenses. The range of the unobservable inputs used may vary but is generally 0 % - 10 % on the discount for costs to sell and 0 % - 15 % on appraisal adjustments.
F-77
BROOKLINE BANCORP, INC. AND SUBSIDIARIES
Notes to Consolidated Financial Statements (Continued)
Summary of Estimated Fair Values of Financial Instruments
The following table presents the carrying amount, estimated fair value, and placement in the fair value hierarchy of the Company's financial instruments at the dates indicated. This table excludes financial instruments for which the carrying amount approximates fair value. Financial assets for which the fair value approximates carrying value include cash and cash equivalents, restricted equity securities, and accrued interest receivable. Financial liabilities for which the fair value approximates carrying value include non-maturity deposits, short-term borrowings, and accrued interest payable. There were no transfers between levels during 2023.
| Fair Value Measurements | |||||||||||||||||||||||||||||
| Carrying Value | Estimated Fair Value | Level 1 Inputs | Level 2 Inputs | Level 3 Inputs | |||||||||||||||||||||||||
| (In Thousands) | |||||||||||||||||||||||||||||
| At December 31, 2023 | |||||||||||||||||||||||||||||
| Financial assets: | |||||||||||||||||||||||||||||
| Loans and leases, net | $ | $ | $ | $ | $ | ||||||||||||||||||||||||
| Financial liabilities: | |||||||||||||||||||||||||||||
| Certificates of deposit | |||||||||||||||||||||||||||||
| Borrowed funds | |||||||||||||||||||||||||||||
| At December 31, 2022 | |||||||||||||||||||||||||||||
| Financial assets: | |||||||||||||||||||||||||||||
| Loans and leases, net | $ | $ | $ | $ | $ | ||||||||||||||||||||||||
| Financial liabilities: | |||||||||||||||||||||||||||||
| Certificates of deposit | |||||||||||||||||||||||||||||
| Borrowed funds | |||||||||||||||||||||||||||||
Loans and Leases
The fair values of performing loans and leases was estimated by segregating the portfolio into its primary loan and lease categories—commercial real estate mortgage, multi-family mortgage, construction, commercial, equipment financing, condominium association, residential mortgage, home equity and other consumer. These categories were further disaggregated based upon significant financial characteristics such as type of interest rate (fixed / variable) and payment status (current / past-due). Using the exit price valuation method, the Company discounts the contractual cash flows for each loan category using interest rates currently being offered for loans with similar terms to borrowers of similar quality and incorporates estimates of future loan prepayments.
Deposits
The fair values of deposit liabilities with no stated maturity (demand, NOW, savings and money market savings accounts) are equal to the carrying amounts payable on demand. The fair value of certificates of deposit represents contractual cash flows discounted using interest rates currently offered on deposits with similar characteristics and remaining maturities. The fair value estimates for deposits do not include the benefit that results from the low-cost funding provided by the Company's core deposit relationships (deposit-based intangibles).
Borrowed Funds
The fair value of federal funds purchased is equal to the amount borrowed. The fair value of FHLB advances and repurchase agreements represents contractual repayments discounted using interest rates currently available for borrowings with similar characteristics and remaining maturities. The fair values reported for retail repurchase agreements are based on the discounted value of contractual cash flows. The discount rates used are representative of approximate rates currently offered on borrowings with similar characteristics and maturities. The fair values reported for subordinated deferrable interest debentures are based on the discounted value of contractual cash flows. The discount rates used are representative of approximate rates currently offered on instruments with similar terms and maturities.
F-78
BROOKLINE BANCORP, INC. AND SUBSIDIARIES
Notes to Consolidated Financial Statements (Continued)
(22) Condensed Parent Company Financial Statements
Condensed Parent Company Balance Sheets as of December 31, 2023 and 2022 and Statements of Income for the years ended December 31, 2023, 2022 and 2021 are as follows. The Statement of Stockholders' Equity is not presented below as the parent company's stockholders' equity is that of the consolidated company.
Balance Sheets
| At December 31, | |||||||||||
| 2023 | 2022 | ||||||||||
| (In Thousands) | |||||||||||
| ASSETS | |||||||||||
| Cash and due from banks | $ | $ | |||||||||
| Short-term investments | |||||||||||
| Total cash and cash equivalents | |||||||||||
| Restricted equity securities | |||||||||||
| Premises and equipment, net | |||||||||||
| Deferred tax asset | |||||||||||
| Investment in subsidiaries, at equity | |||||||||||
| Goodwill | |||||||||||
| Other assets | |||||||||||
| Total assets | $ | $ | |||||||||
| LIABILITIES AND STOCKHOLDERS' EQUITY | |||||||||||
| Borrowed funds | $ | $ | |||||||||
| Accrued expenses and other liabilities | |||||||||||
| Total liabilities | |||||||||||
| Stockholders' equity: | |||||||||||
Common stock, $ | |||||||||||
| Additional paid-in capital | |||||||||||
| Retained earnings | |||||||||||
| Accumulated other comprehensive loss | ( | ( | |||||||||
Treasury stock, at cost; | ( | ( | |||||||||
| Total stockholders' equity | |||||||||||
| Total liabilities and stockholders' equity | $ | $ | |||||||||
F-79
BROOKLINE BANCORP, INC. AND SUBSIDIARIES
Notes to Consolidated Financial Statements (Continued)
Statements of Income
| Year Ended December 31, | |||||||||||||||||
| 2023 | 2022 | 2021 | |||||||||||||||
| (In Thousands) | |||||||||||||||||
| Interest and dividend income: | |||||||||||||||||
| Dividend income from subsidiaries | $ | $ | $ | ||||||||||||||
| Short-term investments | |||||||||||||||||
| ESOP loan to Brookline Bank | |||||||||||||||||
| Intercompany loan to Brookline Bank | |||||||||||||||||
| Total interest and dividend income | |||||||||||||||||
| Interest expense: | |||||||||||||||||
| Borrowed funds | |||||||||||||||||
| Net interest income | |||||||||||||||||
| Non-interest income: | |||||||||||||||||
| Gain on securities, net | |||||||||||||||||
| Other | |||||||||||||||||
| Total non-interest income | |||||||||||||||||
| Non-interest expense: | |||||||||||||||||
| Compensation and employee benefits | |||||||||||||||||
| Occupancy | |||||||||||||||||
Equipment and data processing (1) | ( | ( | ( | ||||||||||||||
| Directors' fees | |||||||||||||||||
| Franchise taxes | |||||||||||||||||
| Insurance | |||||||||||||||||
| Professional services | ( | ||||||||||||||||
| Advertising and marketing | |||||||||||||||||
| Merger and acquisition expense | |||||||||||||||||
Other (1) | ( | ( | ( | ||||||||||||||
| Total non-interest expense | |||||||||||||||||
| Income before income taxes | |||||||||||||||||
| Credit for income taxes | ( | ( | ( | ||||||||||||||
| Income before equity in undistributed income of subsidiaries | |||||||||||||||||
| Equity in undistributed income of subsidiaries | ( | ||||||||||||||||
| Net income | $ | $ | $ | ||||||||||||||
_______________________________________________________________________________
(1) The Parent Company received a net benefit in 2023, 2022 and 2021 from the intercompany allocation of expense that is eliminated in consolidation.
F-80
BROOKLINE BANCORP, INC. AND SUBSIDIARIES
Notes to Consolidated Financial Statements (Continued)
Statements of Cash Flows
| Year Ended December 31, | |||||||||||||||||
| 2023 | 2022 | 2021 | |||||||||||||||
| (In Thousands) | |||||||||||||||||
| Cash flows from operating activities: | |||||||||||||||||
| Net income attributable to parent company | $ | $ | $ | ||||||||||||||
| Adjustments to reconcile net income to net cash provided from operating activities: | |||||||||||||||||
| Equity in undistributed income of subsidiaries | ( | ( | |||||||||||||||
| Depreciation of premises and equipment | |||||||||||||||||
| Amortization of debt issuance costs | |||||||||||||||||
| Other operating activities, net | ( | ( | ( | ||||||||||||||
| Net cash provided from operating activities | |||||||||||||||||
| Cash flows from investing activities: | |||||||||||||||||
| Repayment of ESOP loan by Brookline Bank | |||||||||||||||||
| Pay down of intercompany loan to Brookline Bank | |||||||||||||||||
| Proceeds from sale of restricted equity securities | |||||||||||||||||
| Purchase of premises and equipment | ( | ( | ( | ||||||||||||||
| Outlays for PCSB acquisition | ( | ||||||||||||||||
| Net cash (used for) provided from investing activities | ( | ( | |||||||||||||||
| Cash flows from financing activities: | |||||||||||||||||
| Payment of dividends on common stock | ( | ( | ( | ||||||||||||||
| Net cash used for from financing activities | ( | ( | ( | ||||||||||||||
| Net (decrease) increase in cash and cash equivalents | ( | ||||||||||||||||
| Cash and cash equivalents at beginning of year | |||||||||||||||||
| Cash and cash equivalents at end of year | $ | $ | $ | ||||||||||||||
(23) Revenue from Contracts with Customers
Overview
Revenue from contracts with customers in the scope of ASC 606 ("Topic 606") is measured based on the consideration specified in the contract with a customer and excludes amounts collected on behalf of third parties. The Company recognizes revenue from contracts with customers when it satisfies its performance obligations.
The Company’s performance obligations are generally satisfied as services are rendered and can either be satisfied at a point in time or over time. Unsatisfied performance obligations at the report date are not material to our consolidated financial statements.
In certain cases, other parties are involved with providing services to our customers. If the Company is a principal in the transaction (providing services itself or through a third party on its behalf), revenues are reported based on the gross consideration received from the customer and any related expenses are reported in gross non-interest expense. If the Company is an agent in the transaction (referring to another party to provide services), the Company reports its net fee or commission retained as revenue.
A substantial portion of the Company’s revenue is specifically excluded from the scope of Topic 606. This exclusion is associated with financial instruments, including interest income on loans and investment securities, in addition to loan derivative income and gains on loan and investment sales. For the revenue that is in-scope of Topic 606, the following is a description of principal activities from which the Company generates its revenue from contracts with customers, separated by the timing of revenue recognition.
F-81
BROOKLINE BANCORP, INC. AND SUBSIDIARIES
Notes to Consolidated Financial Statements (Continued)
Revenue Recognized at a Point in Time
The Company recognizes revenue that is transactional in nature and such revenue is earned at a point in time. Revenue that is recognized at a point in time includes card interchange fees (fee income related to debit card transactions), ATM fees, wire transfer fees, overdraft charge fees, and stop-payment and returned check fees. Additionally, revenue is collected from loan fees, such as letters of credit, line renewal fees and application fees. Such revenue is derived from transactional information and is recognized as revenue immediately as the transactions occur or upon providing the service to complete the customer’s transaction.
Revenue Recognized Over Time
The Company recognizes revenue over a period of time, generally monthly, as services are performed and performance obligations are satisfied. Such revenue includes commissions on investments, insurance sales and service charges on deposit accounts. Fee revenue from service charges on deposit accounts represents the service charges assessed to customers who hold deposit accounts at the Banks.
F-82