UNITED STATES
SECURITIES AND EXCHANGE COMMISSION
Washington, D.C. 20549
FORM 10-K
(Mark One)
Annual report pursuant to section 13 or 15(d) of the Securities Exchange Act of 1934 | |||||
For the fiscal year ended December 31 , 2023
or
Transition report pursuant to section 13 or 15(d) of the Securities Exchange Act of 1934 | |||||
For the transition period from ________ to _________
Commission File Number: 001-39095
(Exact name of registrant as specified in its charter)
 | ||||||||||||||||||||||||||
| (State or other jurisdiction of | (I.R.S. Employer | |||||||||||||||||||||||||
| incorporation or organization) | Identification No.) | |||||||||||||||||||||||||
(Address of principal executive offices) (Zip code)
(866 ) 279-0698
(Registrant’s telephone number, including area code)
Securities registered pursuant to Section 12(b) of the Act:
| Title of each class | Trading Symbol(s) | Name of each exchange on which registered | ||||||||||||
Securities registered pursuant to Section 12(g) of the Act: None
______________________________
Indicate by check mark if the registrant is a well-known seasoned issuer, as defined in Rule 405 of the Securities Act. Yes ☒ No ☐
Indicate by check mark if the registrant is not required to file reports pursuant to Section 13 or Section 15(d) of the Act. Yes ☐ No ☒
Note: Checking the box above will not relieve any registrant required to file reports pursuant to Section 13 or 15(d) of the Exchange Act from their obligations under those Sections.
Indicate by check mark whether the registrant (1) has filed all reports required to be filed by Section 13 or 15(d) of the Securities Exchange Act of 1934 during the preceding 12 months (or for such shorter period that the registrant was required to file such reports), and (2) has been subject to such filing requirements for the past 90 days. Yes ☒ No ☐
Indicate by check mark whether the registrant has submitted electronically every Interactive Data File required to be submitted pursuant to Rule 405 of Regulation S-T (§ 232.405 of this chapter) during the preceding 12 months (or for such shorter period that the registrant was required to submit such files). Yes ☒ No ☐
Indicate by check mark whether the registrant is a large accelerated filer, an accelerated filer, a non-accelerated filer, a smaller reporting company, or an emerging growth company. See the definitions of “large accelerated filer,” “accelerated filer,” “smaller reporting company,” and “emerging growth company” in Rule 12b-2 of the Exchange Act.
☒ | Accelerated filer | ☐ | ||||||||||||
| Non-accelerated filer | ☐ | Smaller reporting company | ||||||||||||
| Emerging growth company | ||||||||||||||
If an emerging growth company, indicate by check mark if the registrant has elected not to use the extended transition period for complying with any new or revised financial accounting standards provided pursuant to Section 13(a) of the Exchange Act. ☐
Indicate by check mark whether the registrant has filed a report on and attestation to its management's assessment of the effectiveness of its internal control over financial reporting under Section 404(b) of the Sarbanes-Oxley Act (15 U.S.C. 7262(b)) by the registered public accounting firm that prepared or issued its audit report. ☒
If securities are registered pursuant to Section 12(b) of the Act, indicate by check mark whether the financial statements of the registrant included in the filing reflect the correction of an error to previously issued financial statements. ☐
Indicate by check mark whether any of those error corrections are restatements that required a recovery analysis of incentive-based compensation received by any of the registrant’s executive officers during the relevant recovery period pursuant to §240.10D-1(b). ☐
Indicate by check mark whether the registrant is a shell company (as defined in Rule 12b-2 of the Exchange Act). Yes ☐ No ☒
As of June 30, 2023 (the last business day of the registrant’s second fiscal quarter), the registrant's aggregate market value of its voting and non-voting common equity held by non-affiliates was $1,468,831,948 .
As of February 20, 2024, there were 64,738,058 shares of Class A common stock outstanding and 51,933,957 shares of Class B common stock outstanding.
DOCUMENTS INCORPORATED BY REFERENCE
Portions of the registrant’s Proxy Statement for the 2024 Annual Meeting of Stockholders to be filed with the Securities and Exchange Commission within 120 days of the end of the fiscal year to which this report relates are incorporated by reference into Part III of this Form 10-K.
BRP GROUP, INC.
INDEX
| Page | ||||||||||||||
Note Regarding Forward-Looking Statements
We have made statements in this Annual Report on Form 10-K, including matters discussed under Item 1A. Risk Factors, Item 3. Legal Proceedings, Item 7. Management’s Discussion and Analysis of Financial Condition and Results of Operations, and in other sections of this Annual Report on Form 10-K, that are forward-looking statements. In some cases, you can identify these statements by forward-looking words such as “may,” “might,” “will,” “should,” “expects,” “plans,” “anticipates,” “believes,” “estimates,” “predicts,” “potential” or “continue,” the negative of these terms and other comparable terminology. These forward-looking statements, which are subject to risks, uncertainties and assumptions about us, may include projections of our future financial performance, our anticipated growth strategies and anticipated trends in our business. These statements are only predictions based on our current expectations and projections about future events. There are important factors that could cause our actual results, level of activity, performance or achievements to differ materially from the results, level of activity, performance or achievements expressed or implied by the forward-looking statements, including those factors discussed under Item 1A. Risk Factors.
Although we believe the expectations reflected in the forward-looking statements are reasonable, we cannot guarantee future results, level of activity, performance or achievements. Moreover, neither we nor any other person assumes responsibility for the accuracy and completeness of any of these forward-looking statements. We are under no duty to update any of these forward-looking statements after the date of this Annual Report on Form 10-K to conform our prior statements to actual results or revised expectations.
3
Commonly Used Defined Terms
The following terms have the following meanings throughout this Annual Report on Form 10-K unless the context indicates or requires otherwise:
| Acquired Revenue | Revenue attributable to acquired business for the most recent trailing twelve-month period prior to acquisition by BRP at the time the due diligence was concluded based on a quality of earnings review and not an audit | |||||||
| Amended LLC Agreement | Third Amended and Restated Limited Liability Company Agreement of BRP, as amended | |||||||
| book of business | Insurance policies bound by us on behalf of our Clients | |||||||
| bps | Basis points | |||||||
| BRP | Baldwin Risk Partners, LLC, our operating company and direct subsidiary of BRP Group | |||||||
| BRP's LLC Members | Holders of membership interests of Baldwin Risk Partners, LLC | |||||||
| BRP Group | BRP Group, Inc., our parent company | |||||||
| Clients | Our insureds | |||||||
| Colleagues | Our employees | |||||||
| Exchange Act | Securities Exchange Act of 1934, as amended | |||||||
| GAAP | Accounting principles generally accepted in the United States of America | |||||||
| Insurance Company Partners | Insurance companies with which we have a contractual relationship | |||||||
| JPM Credit Agreement | Credit Agreement, dated as of October 14, 2020, between Baldwin Risk Partners, LLC, as borrower, JPMorgan Chase Bank, N.A., as the Administrative Agent, the Guarantors party thereto, the Lenders party thereto and the Issuing Lenders party thereto, as amended by the Amendment No. 1 to Credit Agreement dated as of May 7, 2021, Amendment No. 2 to Credit Agreement dated as of June 2, 2021, Amendment No. 3 to Credit Agreement dated as of August 6, 2021, Amendment No. 4 to Credit Agreement dated as of December 16, 2021, Amendment No. 5 to Credit Agreement dated as of March 28, 2022, Amendment No. 6 to Credit Agreement dated as of June 27, 2023 and Amendment No. 7 to Credit Agreement dated as of September 15, 2023 | |||||||
| LIBOR | London Interbank Offered Rate | |||||||
| LLC Units | Membership interests of Baldwin Risk Partners, LLC | |||||||
| MGA | Managing General Agent | |||||||
| MSI | Millennial Specialty Insurance, LLC, a 2019 Partner | |||||||
| Operating Groups | Our reportable segments | |||||||
| Partners | Companies that we have acquired, or in the case of asset acquisitions, the producers | |||||||
| Partnerships | Strategic acquisitions made by the Company | |||||||
| Pre-IPO LLC Members | Owners of LLC Units of Baldwin Risk Partners, LLC prior to our initial public offering | |||||||
| QBE Program Administrator Agreement | Agreement entered into in connection with the Westwood Partnership with an affiliate of QBE Holdings, Inc., the prior owner of Westwood, under which our MGA of the Future business provides program administrator services to QBE Insurance Corporation in connection with the portion of our builder-sourced homeowners book that is underwritten by affiliates of QBE Insurance Corporation | |||||||
| Revolving Facility | Our revolving credit facility under the JPM Credit Agreement with commitments in an aggregate principal amount of $600.0 million, maturing April 1, 2027 | |||||||
| Risk Advisors | Our producers | |||||||
| SEC | U.S. Securities and Exchange Commission | |||||||
| Securities Act | Securities Act of 1933, as amended | |||||||
| SOFR | Secured Overnight Financing Rate | |||||||
| Tax Receivable Agreement | Tax Receivable Agreement between BRP Group, Inc. and the holders of LLC Units in Baldwin Risk Partners, LLC entered into on October 28, 2019 | |||||||
| Term Loan B | Our term loan facility under the JPM Credit Agreement with a principal amount of $1.02 billion, maturing October 14, 2027 | |||||||
| Westwood | Westwood Insurance Agency, a 2022 Partner | |||||||
4
PART I
ITEM 1. BUSINESS
The Company
BRP Group, Inc. (“BRP Group,” the “Company,” “we,” “us” or “our”) is an independent insurance distribution firm delivering tailored insurance and risk management insights and solutions that give our Clients the peace of mind to pursue their purpose, passion and dreams. We support our Clients, Colleagues, Insurance Company Partners and communities through the deployment of vanguard resources, technology and capital to drive both organic and inorganic growth. When we consistently execute for these key stakeholders, we believe that the outcome is an increase in value for our fifth stakeholder, our stockholders. We are innovating the industry by taking a holistic and tailored approach to risk management, insurance and employee benefits. Our growth plan includes continuing to recruit, train and develop industry leading talent, continuing to add geographic representation, insurance product expertise and end-client industry expertise via our Partnership strategy, and continuing to build out our MGA of the Future platform, which delivers proprietary, technology-enabled insurance solutions to our internal Risk Advisors as well as to a growing channel of external distribution partners. We are a destination employer supported by an award-winning culture, powered by exceptional people and fueled by industry-leading growth and innovation.
We represent over two million Clients across the United States and internationally. Our nearly 4,000 Colleagues include approximately 700 Risk Advisors, who are fiercely independent, relentlessly competitive and “insurance geeks.” We have approximately 115 offices in 24 states, all of which are equipped to provide diversified products and services to empower our Clients at every stage through our three Operating Groups.
In 2011, we adopted the “Azimuth” as our corporate and cultural constitution. Named after a historical navigation tool used to find “true north,” the Azimuth asserts our core values, business basics and stakeholder promises. The ideals encompassed by the Azimuth support our mission to deliver indispensable, tailored insurance and risk management insights and solutions to our Clients. We strive to be regarded as the preeminent insurance advisory firm—fueled by relationships, powered by people and exemplified by client adoption and loyalty. This type of environment is upheld by the distinct vernacular we use to describe our services and culture. We are a Firm, instead of an agency; we have Colleagues, instead of employees; and we have Risk Advisors, instead of producers/agents. We serve Clients instead of customers and we refer to our strategic acquisitions as Partnerships. We refer to insurance brokerages that we have acquired, or in the case of asset acquisitions, the producers, as Partners.
Industry
Our core products include commercial property and casualty insurance, employee benefits insurance, personal lines insurance, wealth management and retirement services, and Medicare. As a distributor of these products, we compete on the basis of reputation, client service, industry insights and know-how, product offerings, ability to tailor our services to the specific needs of a Client and, to a lesser extent, price of our services. In the United States, our industry is comprised of large, global participants, such as those described in the section titled “Competition” below. The remainder of our industry is highly fragmented and comprised of over 30,000 regional and community participants that vary significantly in size and scope.
Despite the recent consolidation in the insurance brokerage industry, the industry remains highly fragmented, and the number of independent agencies has remained roughly constant since 2006. The fragmented industry landscape presents us with the opportunity to continue acquiring high-quality Partners.
Commission revenues are generally based on a percentage of the premiums paid by insureds and normally follow premium levels. Insurance premiums are cyclical in nature and may vary widely based on market conditions. Various factors, including competition for market share among underwriting enterprises, increased underwriting capacity and improved economies of scale following consolidations, can result in flat or reduced property/casualty premium rates (a “soft” market). A soft market tends to put downward pressure on commission revenues. Various countervailing factors, such as greater than anticipated loss experience, unexpected loss exposure and capital shortages, can result in increasing property/casualty premium rates (a “hard” market). A hard market tends to favorably impact commission revenues. Hard and soft markets may be broad-based or more narrowly focused across individual product lines or geographic areas. As markets harden, buyers of insurance (such as our brokerage Clients), have historically tried to mitigate premium increases and the higher commissions these premiums generate, including by raising their deductibles and/or reducing the overall amount of insurance coverage they purchase. As the market softens, or costs decrease, these trends have historically reversed. During a hard market, buyers may switch to negotiated fee in lieu of commission arrangements to compensate us for placing their risks, or may consider the alternative insurance market, which includes self-insurance, captives, rent-a-captives, risk retention groups and capital market solutions to transfer risk.
5
Commercial Property and Casualty Industry
Commercial property and casualty brokers provide businesses with access to property, professional liability, workers’ compensation, management liability, commercial auto insurance products as well as risk-management services. In addition to negotiating competitive policy terms on behalf of clients, insurance brokers also serve as a distribution channel for insurers and often perform much of the administrative functions. Insurance brokers generate revenues through commissions, calculated as a percentage of total insurance premium, and through fees for management and consulting services. We have relationships with leading commercial writers, as well as regional insurers who have a presence in our target markets. We conduct commercial property and casualty business within all of our Operating Groups, which includes manufacturing our own proprietary products within our MGA of the Future platform. Current products include commercial umbrella and management liability, with several additional commercial lines products in our existing product pipeline.
Employee Benefits Industry
Employee benefit advisors provide businesses and their employees with access to individual and group medical, dental, life and disability coverage. In addition to functioning as distributors, employee benefits brokers also provide assistance with benefit plan design. Employee benefits brokers’ capabilities often enable middle-market businesses to fully outsource their employee benefits program design, management and administration without committing internal resources or investing substantial capital in systems. Employee benefit advisors generate revenues through commissions and fees for management and consulting services. In recent years, as a result of the Affordable Care Act (“ACA”), healthcare has become increasingly more complex, and the demand has grown for sophisticated employee benefits consultants. We expect this trend to continue and believe we remain well positioned as a result of our consistent investment in our employee benefits capabilities. We conduct employee benefits business within our Insurance Advisory Solutions and Mainstreet Insurance Solutions Operating Groups.
Personal Lines Industry
Personal lines brokers provide individual consumers with access to home, auto, umbrella and recreational insurance products. Similar to commercial lines agents, personal lines insurance agents generate revenues through commissions and fees for management and consulting services. In addition to negotiating competitive policy terms on behalf of clients, insurance brokers also serve as a distribution channel for insurers and often perform much of the administrative functions. We conduct personal lines business within all of our Operating Groups. We believe that embedded distribution will play a meaningful role in the future of personal lines—to that end, we have made deep investments in technology to enable our long-term vision of creating a one-stop, digital distribution platform for advisors, consumers and businesses alike. We believe our retail agency model, embedded technology, national distribution capabilities and ability to build proprietary products in our MGA of the Future platform uniquely position us to execute on this strategy.
Wealth Management and Retirement Services
Wealth management and retirement services is comprised of financial solutions for small and mid-sized businesses and certain individuals. Our specialties include risk management, employee benefits, and retirement plan consulting. We advise on corporate retirement plans and executive benefits focused on employee retention and engagement. We also provide comprehensive financial planning and wealth management services to high-net-worth individuals and families. Wealth management services can include investment advisory services, tax and financial planning, and other services. We conduct wealth management and retirement services within our Insurance Advisory Solutions Operating Group.
Medicare Industry
In the U.S., Medicare provides health insurance to retirees, who by definition lack coverage via an employer sponsored healthcare program. U.S. citizens typically become eligible for Medicare upon turning 65 years old. The Medicare market is split between the Original Medicare Plan, a fee-for-service plan managed by the federal government which represents approximately two-thirds of the market, and Medicare Advantage, a rapidly growing private Medicare option representing approximately one-third of the market. Medicare advisors within our Mainstreet Insurance Solutions Operating Group assist in determining optimal coverage and healthcare/doctor access based on an individual’s healthcare needs and spending limitations.
6
Business Strategy
We believe our business strategy is centered around using the results of outstanding service to Clients to reinvest the vast majority of retained earnings into future growth, which we believe over time produces better and more sustainable results for all of our stakeholders, including our Clients, Colleagues, Insurance Company Partners, the communities in which we work and live, and our stockholders. For our Clients, our growth affords us the ability to provide better advice and an expanded and more cost effective suite of insurance solutions. For our Colleagues, our growth provides expanded career and development opportunities. For our Insurance Company Partners, our growth facilitates expanded access to a more diversified universe of Clients and more distributed pools of risk. For our communities, our growth facilitates enhanced economic contribution, and the ability of our Colleagues to make charitable impacts. And for our stockholders, we believe that revenue growth, along with margin accretion over time, will generate significant free cash flow and growth in firm value.
We have taken, and will continue to take, a two-pronged approach to growing our business, which includes investing meaningfully into our existing businesses to drive organic growth, and to drive inorganic growth via our Partnership strategy.
Over time, our organic growth will be driven primarily by our ability to continue to win new business, our ability to offer and advise on a broader array of insurance solutions in an increasingly larger geographic footprint, and to capture an increasingly larger portion of the economics associated with the sale of insurance. To achieve this, we have invested heavily in our sales leadership infrastructure and recruitment of sales talent, technology talent and solutions to better deliver insurance insights and solutions to our Advisors and Clients. In our MGA of the Future platform, we continue to deliver proprietary and technology-enabled insurance solutions that provide our Advisors and select external distribution partners speed, ease of use, and certainty of execution, while also delivering BRP an enhanced share of the economics associated with the underlying insurance transaction. Factors contributing to our organic growth include net new business growth, fees, rate increases, retention, exposure unit growth, and contingent commissions. Contributions to organic revenue growth from recent Partnerships begins after BRP has owned the Partner firm for 12 months.
We did not execute any Partnerships during 2023 and we continue to anticipate relatively little Partnership activity in 2024. Though Partnerships have contributed meaningful inorganic growth to BRP and we expect them to contribute to our long-term growth strategy, we anticipate they will be more episodic in nature going forward. Adding new Colleagues through Partnerships can significantly bolster our geographic footprint, product expertise, and end-Client industry expertise, while adding incremental industry-leading talent to our organization. We are uniquely focused on the industry’s best and fastest growing independent firms, and we believe we offer a truly differentiated value proposition to prospective Partners relative to our more mature and/or private equity-backed peers, which includes retained business decision-making autonomy, leadership opportunities for new Partners and an environment focused on entrepreneurialism and the continued growth of our Partners’ businesses. We believe our success attracting high quality Partners has validated our differentiated value proposition—we have consummated Partnerships with 35 firms since the beginning of 2020, for a total of $538.7 million of Acquired Revenue, which includes eight “Top 100” firms since 2020, more than any other peer in our industry. We also have a highly systematic and regimented integration process for all new Partners, supported by our fully dedicated integration team, which balances ensuring proper operational, financial and accounting, and technology and cybersecurity controls with business decision-making autonomy and impact on new Colleagues.
The financial impact of Partnerships may affect the comparability of our results from period to period. While we did not execute on any Partnership opportunities during 2023, we completed three Partnerships for an aggregate purchase price of $413.8 million during 2022, which contributed $143.6 million of revenue in 2023.
We continue to make the investments designed to better service our Clients and establish a competitive advantage in the industry. Ongoing investments to date include, but are not limited to, continued buildout of our MGA of the Future platform, continued buildout of our tech-enabled homeowners efforts (both in the MGA of the Future and in our Mainstreet Insurance Solutions business), numerous enterprise-wide technology initiatives, pursuing potential alternative capacity, and continued hiring of Risk Advisors and sales leadership infrastructure in our Insurance Advisory Solutions and Mainstreet Insurance Solutions Operating Groups.
7
Operating Groups
We completed a strategic review of our organizational structure in January 2023 and determined that the chief operating decision maker, our chief executive officer, would change the way he manages and operates our MainStreet and Medicare businesses. Effective in the first quarter of 2023, our chief executive officer reviews the Medicare and Mainstreet businesses on a combined basis as one operating segment, also determined to be an Operating Group, Mainstreet Insurance Solutions, which is used by our chief executive officer to make decisions about the resources to be allocated to the Operating Group and to assess its performance. In addition, the Middle Market and Specialty Operating Groups were rebranded as Insurance Advisory Solutions and Underwriting, Capacity & Technology Solutions, respectively, effective in the first quarter of 2023.
Effective in the first quarter of 2023, our business is divided into three Operating Groups: Insurance Advisory Solutions, Underwriting, Capacity & Technology Solutions and Mainstreet Insurance Solutions.
Insurance Advisory Solutions Operating Group (“IAS”)
IAS provides expertly-designed commercial risk management, employee benefits and private risk management solutions for businesses and high-net-worth individuals, as well as their families. Risk management solutions typically involve the sale of a wide variety of both commercial and personal lines insurance products that mitigate risks for firms and individuals. Employee benefits solutions can include health plans, dental plans, and retirement accounts for firms and their employees. We are privileged to have partnered with some of the highest quality independent insurance brokers across the country with vast and varied strategic capabilities and expertise. We have been intentional in recognizing and elevating this talent across the organization to build world class industry-focused practice groups and product Centers of Excellence that can be leveraged by the entire firm.
Underwriting, Capacity & Technology Solutions Operating Group (“UCTS”)
UCTS consists of three distinct businesses—our specialty wholesale broker business, our MGA of the Future platform and, as of the third quarter of 2023, our newly launched reinsurance brokerage business, Juniper Re. Our specialty wholesale broker business, which is expected to be sold in the first quarter of 2024, delivers professionals, individuals and niche industry businesses expanded access to exclusive specialty markets, capabilities and programs requiring complex underwriting and placement. Through our MGA of the Future platform (representing approximately 90% of UCTS' revenue during 2023), we manufacture proprietary, technology-enabled insurance products that are then distributed (in many instances via technology and/or API integrations) internally via our Risk Advisors across our other Operating Groups and externally via select distribution partners, with a focus on sheltered channels where our products deliver speed, ease of use and certainty of execution, an example of which is our national embedded renters insurance product sold at point of lease via integrations with property management software providers. As a prominent growth driver for BRP, we have invested heavily in the expansion of our MGA of the Future product suite, which is now comprised of more than 12 products across both commercial and personal lines, including new product launches in 2023 (high-net-worth homeowners, flood and commercial property products).
Mainstreet Insurance Solutions Operating Group (“MIS”)
MIS offers personal insurance, commercial insurance, and life and health solutions to individuals and businesses in their communities, with a focus on accessing Clients via sheltered distribution channels, which include, but are not limited to, new home builders, realtors, mortgage originators/lenders, master planned communities, and various other community centers of influence. We have invested deeply in talent, technology and capabilities across MIS, including in Westwood's homeowners solutions that are embedded in many of the top home builders in the U.S., the national expansion of our distribution footprint through our National Mortgage and Real Estate Center, and enhanced digital capabilities focused on improving the Advisor and Client experience. MIS also offers consultation for government assistance programs and solutions, including traditional Medicare, Medicare Advantage and Affordable Care Act, to seniors and eligible individuals through a network of primarily independent contractor agents.
Competition
The business of providing insurance products and services is highly competitive. We compete for Clients on the basis of reputation, client service, program and product offerings, and our ability to tailor products and services to meet the specific needs of a Client. We actively compete with numerous integrated financial services organizations as well as insurance companies and brokers, producer groups, individual insurance agents, investment management firms, independent financial planners and broker-dealers, including public participants, such as Aon plc, Marsh & McLennan Companies, Inc., Willis Towers Watson plc, Arthur J. Gallagher & Co. and Brown & Brown Inc.; private company participants, such as AssuredPartners, Inc., Hub International Limited and USI, Inc.; and in our personal lines business, Goosehead Insurance, Inc.
8
Clients and Insurers
Our Clients are highly diversified and include individuals, professionals, businesses, including those in niche industries, and specialty insurers. No material part of our business depends upon a single Client or on a few Clients. The loss of any one Client would not have a material adverse effect on our operations. In 2023, our largest single Client represented less than 1% of our total commissions and fees.
We have relationships with a significant number of Insurance Company Partners who contribute to the commissions and fees we generate. While we do not have a dependency on any one Insurance Company Partner, we derive a significant portion of our core commissions and fees from a limited number of Insurance Company Partners. In 2023, two Insurance Company Partners accounted for an aggregate of approximately 17% of our total core commissions and fees.
Human Capital
BRP is an independent Colleague-centric insurance advisory firm fueled by relationships, powered by people, and exemplified by our Colleagues’ ability to deliver tailored insurance and risk management insights and solutions to our Clients. Our success continues to be driven by our greatest asset, our talented team of Colleagues, each of which plays a crucial role in helping us achieve our firm goals. We attract Colleagues who share our passion for nurturing relationships and focusing on service, and who are inspired by the core values outlined in our cultural guide, The Azimuth.
Powered by People
As of December 31, 2023, BRP had nearly 4,000 Colleagues, the vast majority of whom are full-time. There were 3,851 full-time Colleagues (98% of total Colleague population) and 76 part-time Colleagues. The firm also partners with over 4,500 independent contracted agents, primarily supporting our Medicare business.
BRP is a place for Colleagues to build a career, not just have a job, and we believe every Colleague should feel a sense of ownership in the firm. To promote that connection, we grant all newly-hired Colleagues shares of BRP Group common stock.
We highly value the powerful and innovative results that come from seeking and weighing a broad range of perspectives and we strive to hire and promote talent that brings wide ranging diversity of thought, background, and experience.
•More than half of our executive leadership team joined BRP from other industries, bringing unique background and thoughtful insight on our continued best path to success.
•As of December 31, 2023, women comprise 58% of our Colleague population and 50% of our leadership positions.
•We benefit from a wide age range and experience level within the firm. We have a robust mix of entry-level and post-college Colleagues. This balanced representation fosters our talent strategy of providing great mentoring and learning opportunities for our developing Colleagues.
•Our talent acquisition team continues to proactively source and contact underrepresented candidates as part of our recruiting process for open roles. Importantly, we hire for competency, capability, and potential, while maintaining a competitive culture that values and rewards results.
BRP continues to make additional investments in ensuring we remain competitive in attracting top talent. All Colleagues are paid at least $15.00 per hour and we're proud to be an employer leading by example when it comes to living wages. We have also continued to maintain a relatively high annual retention rate, which was 77% for 2023. Our commitment to rewarding our Colleagues is evidenced by merit increases and bonuses we have continued to pay each year.
Culture and Belonging
Part of being better together means we operate with transparency and strive to make it easy for others to know us and trust us by striving to always do the right thing in an open and authentic way. We actively seek out our Colleagues’ input through our formal and anonymous PULSE survey, asking for feedback on a variety of topics including career path opportunities, trust in team and leadership, and feeling valued. The results of this annual pulse check are always shared with Colleagues and leadership so thoughtful and meaningful improvements can be made to enhance engagement.
Another way we aim to create a sense of belonging for our Colleagues is by striving to be a destination employer. We are continuously recognized for our people-first approach, our commitment to a culture of continuous learning, and for providing a place where our Colleagues learn, grow, and thrive.
•BRP continued to be Great Place to Work-Certified™ and once again ranked as a Fortune Best Workplaces in Financial Services and Insurance™ in 2023.
9
•We were also recognized by Top Workplaces USA as a 2023 nationally recognized employer for making the world a better place to work by prioritizing a people-centered culture and giving employees a voice.
We have a variety of ways we promote our culture, support our communities, and take care of each other within the BRP family.
•We sponsor a “Colleagues In Action” program that supports charities, events, and causes that are important and meaningful to our Colleagues.
•We promote our Colleagues actively participating in community outreach by providing three days of Community Service PTO.
•AHT Insurance's International Aid and Development Practice is enabling International Development Organizations and Non-Governmental Organizations to operate safely and securely, to help the most vulnerable communities in some of the highest risk communities in the world.
•To help any qualifying Colleague experiencing extraordinary hardship, we provide the BRP True North Colleague Fund (operated by America’s Charities, a 501(c)(3) non-profit organization), to which Colleagues can also contribute by making a donation. BRP has pledged up to $250,000 to the fund and is honored to provide an additional dollar-for-dollar match for Colleague contributions up to another $250,000.
•We believe in having fun at work and celebrating our successes by promoting peer recognition at all levels of the firm through our “Give a Wow” compliment program. We share “Give a Wows” with Colleagues during our quarterly Town Hall meetings.
Nurture and Grow Talent
We care about our Colleagues and their families from a holistic perspective and genuinely believe that taking great care of our Colleagues allows them to live their best life. We offer comprehensive benefits such as health care and retirement savings through an employer-match 401(k) plan, along with a variety of other personalized benefits valued by our Colleagues, such as:
•Summertime Friday half-days;
•Employee assistance program services, including mental health;
•Expert referral services in legal and financial assistance;
•Company sponsored BRP Vitality Wellness Program, including a partnership with Aaptiv to provide customizable fitness benefits for Colleagues;
•Health Savings Account with $600+ employer contribution;
•Adoption assistance program;
•Paid leave for new parents; and
•Paid sick days and 11 nationally recognized holidays observed.
To support the ongoing growth and development of our Colleagues, we provide education and training on a variety of topics, including technical, professional and business development, client experience, leadership development, regulatory and compliance topics.
•In 2023, we continued our development of the Azimuth Institute. We began this three-to-five-year project in 2022 to provide both foundational training and a learning journey for all our IAS client-facing roles in the areas of job skills, system training, insurance acumen, power skills, business development and leadership training for leaders.
•In 2023, we successfully launched our North Star Program within the Azimuth Institute, which provides an innovative learning journey designed for newly hired, high-potential young professionals to equip them with the skills, knowledge, and behaviors needed to ensure continued success in their careers. The program consists of a 90-day comprehensive training program that takes new client service specialists through the core elements of policy coverage and the workflows necessary to process them in our agency management system. This training is followed by six months of insurance acumen in either the Professional Risk Consultant or Associate in Risk Management designation program. Following completion of the program, participants have a deeper understanding of the what, the how, and the why behind the core skills and behaviors needed to thrive in their new roles.
10
•In partnership with The Institutes, we entered into an enterprise agreement with the premier educational purveyor of technical acumen to the insurance industry. Today we provide access to over 200 of The Institutes course offerings across Commercial, Benefits and Private Risk, all of which are easily accessible through our learning management system.
•We continue to offer a catalog of more than 400 custom-built training courses, all designed in-house to support individual growth and professional development. We have expanded our adoption of the LinkedIn Learning platform that provides access to more than 9,000 skill courses across a broad array of topics that open up a whole new world of learning for our Colleagues.
•We enhanced our sales training program, SCORE (Strategize, Connect, Obtain, Retain and Earn Referrals), for new and developing Risk Advisors—a 10-week intensive training offered as a combination of online, instructor-led and real-life application training to develop their skills for generating new business and providing exceptional service to our Clients, and added SCORE PRO—a 6-month advanced sales development program for Advisors interested in propelling their profession to the next level.
•We support the continuing education and certification needs of our Colleagues by providing access to a variety of technical training courses. Examples of content include Cyber Risk Fundamentals, Professional Liability and Commercial Property.
•During the fourth quarter of 2023, we successfully piloted a Leadership Development Workshop at our National Mortgage and Real Estate Center to further develop our MIS leadership group. In 2024, we will continue to focus on building leadership capability by implementing contemporary performance coaching and development practices designed to empower our leaders and enable our Colleagues to grow and thrive.
We also promote Colleague growth and development through an ongoing performance feedback model, including 90-day and 120-day check-ins for new Colleagues, and a formal year-end performance check-in for all Colleagues. Our performance feedback processes enable every Colleague to have clear alignment with how we execute on our goals, maximize their performance potential, and drive their own development and growth through individual development plans.
Cultivating an Ethical Environment for our Colleagues and Clients
We take very seriously our responsibility to operate with the highest level of integrity and foster an ethical environment for both our Colleagues and Clients. We have established numerous policies and procedures outlining our intention to live our values and do business in a responsible and ethical manner, including providing avenues for asking questions or reporting concerns about non-compliance. Many of these can be found publicly on our Company website at baldwinriskpartners.com or our investor relations website at ir.baldwinriskpartners.com. Documented policies and procedures include, but are not limited to:
•The Azimuth (our cultural and corporate constitution, available on our Company website);
•Code of Business Conduct and Ethics (available in the “Governance” section of our investor relations website);
•Whistleblower Policy, which governs reporting of concerns related to accounting, auditing and ethical violations (available in the “Governance” section of our investor relations website);
•Statement of Policy Concerning Trading in Company Securities, which prohibits Colleagues from trading BRP Group securities while in possession of Material Non-Public Information (available in the “Governance” section of our investor relations website);
•Privacy Policy, which governs how we handle personal client information in a responsible manner (available at the bottom of our Company homepage);
•Transparency & Disclosure Statement, which sets forth our commitment to fair dealings with our Clients (available at the bottom of our Company homepage); and
•Anti-Corruption Policy, which defines our commitment to adhere to the Foreign Corrupt Practices Act (“FCPA”) and avoid corrupt business practices (available in the “Governance” section of our investor relations website).
11
Seasonality
The insurance brokerage market is seasonal and our results of operations are somewhat affected by seasonal trends. Our Adjusted EBITDA and Adjusted EBITDA Margins are typically highest in the first quarter and lowest in the fourth quarter. This variation is primarily due to fluctuations in our revenues, while overhead remains consistent throughout the year. Our revenues are generally highest in the first quarter due to a higher degree of first quarter policy commencements and renewals in certain IAS and MIS lines of business such as employee benefits, commercial and Medicare. In addition, a higher proportion of our first quarter revenue is derived from our highest margin businesses.
Partnerships can significantly impact Adjusted EBITDA and Adjusted EBITDA Margins in a given year and may increase the amount of seasonality within the business, especially results attributable to Partnerships that have not been fully integrated into our business or owned by us for a full year.
Regulation
Our activities in connection with insurance brokerage services are subject to regulation and supervision by state regulatory authorities. State insurance laws are often complex and generally grant broad discretion to supervisory authorities in adopting regulations and supervising regulated activities, which generally includes the licensing of insurance brokers and agents, intermediaries and third-party administrators. Our continuing ability to provide insurance brokerage in the states in which we currently operate is dependent upon our compliance with the rules and regulations promulgated by the regulatory authorities in each of these states.
The health insurance industry is heavily regulated by the ACA, Centers for Medicare & Medicaid Services (“CMS”) and state jurisdictions. Each jurisdiction has its own rules and regulations relating to the offer and sale of health insurance plans, typically administered by a department of insurance, department of financial services, or similar regulatory authority. We are required to maintain valid life or health agency or agent licenses in each jurisdiction in which we transact health insurance business.
Regulations and guidelines issued by CMS place a number of requirements on health insurance carriers and agents and brokers in connection with the marketing and sale of Medicare Advantage and Medicare Part D prescription drug plans. We are subject to similar requirements of state insurance departments with respect to our marketing and sale of Medicare Supplement plans. CMS and state insurance department regulations and guidelines include a number of prohibitions regarding the ability to contact Medicare-eligible individuals and place many restrictions on the marketing of Medicare-related plans. In addition, the laws and regulations applicable to the marketing and sale of Medicare-related plans are ambiguous, complex and, particularly with respect to regulations and guidance issued by CMS for Medicare Advantage and Medicare Part D prescription drug plans, change frequently.
We are subject to federal law and the laws of many states that require financial institutions to protect the security and confidentiality of certain sensitive client information, notify customers about their policies and practices relating to collection, disclosure and security of certain sensitive client information. The Health Insurance Portability and Accountability Act (“HIPAA”) and regulations adopted pursuant to HIPAA require us to maintain the privacy of protected health information that we collect on behalf of Insurance Company Partners and employer-sponsored health plans, implement measures to safeguard such information and provide notification in the event of certain breaches in the privacy or confidentiality of such information. The use and disclosure of certain data that we collect from consumers is also regulated by the Gramm-Leach-Bliley Act (“GLBA”) and state statutes implementing GLBA, which generally require brokers to provide Clients with notice regarding how their non-public personal health and financial information is used and the opportunity to “opt out” of certain disclosures before sharing such information with a third party, and which generally require safeguards for the protection of personal information.
In addition, our portfolio of companies includes several registered investment advisors (“RIAs”), each of which are federally registered with the SEC. Our portfolio includes a limited purpose broker dealer (“LPBD”), registered with the SEC, and the Financial Industry Regulatory Authority (“FINRA”). These areas of our financial services business are also subject to rules formulated by the SEC under both the Investment Advisers Act of 1940 (the “40 Act”) and the Exchange Act, as well as by state securities regulators under applicable state law. Through a combination of the SEC, FINRA, the 40 Act and the Exchange Act, our RIAs and the LPBD are heavily regulated in the areas of duties to Clients, disclosures, communications, contracting, fee sharing, oversight and audit.
As a publicly-traded company, we are required to file certain reports, and are subject to various marketing restrictions, among other requirements, in connection with the Exchange Act and SEC regulations.
12
Climate Change Risk Management
As an insurance distribution firm, our operations do not have a large environmental footprint or significant direct greenhouse gas emissions. We are committed to thoughtful stewardship of the environment and our resources while managing the impact on our business.
Through our strategic planning process and risk management framework, we identify and track a number of ways in which our industry, our Clients, and our operations are being impacted by climate change issues today, or could be impacted by climate change issues in the medium-to-long-term. We take a number of actions to address relevant opportunities and risks.
•Evolving Client Solutions: Climate-related issues can have an impact on our Clients in a number of ways, for which we can offer relevant risk management guidance.
•Promoting Client Safety: As a commitment to our Clients’ safety and well-being, we provide resources and information to help prepare for and protect against severe weather events.
•Ensuring Operational Continuity: We recognize that workplace emergencies might result from extreme weather events, exacerbated by the impacts of climate change, including hurricanes, floods, tornados, and other natural or environmental disasters. In order to manage workplace emergencies, we have developed and implemented a company-wide Emergency Preparedness Plan, which describes the process by which we respond when a major event threatens to harm our organization, our stakeholders, or the general public. Critical elements of the Plan include assigned responsibilities, relevant operating procedures, crisis communication guidelines, and evacuation and recovery procedures.
Our Corporate Structure
BRP Group is a holding company and its sole material asset is a controlling ownership and profits interest in BRP. BRP Group has engaged to date only in activities relating to BRP. All of our business is conducted through BRP and its consolidated subsidiaries and affiliates, and the financial results of BRP and its consolidated subsidiaries are included in the consolidated financial statements of BRP Group.
BRP is currently taxed as a partnership for federal income tax purposes and, as a result, its members, including BRP Group, pay taxes with respect to their allocable shares of its net taxable income. We expect that redemptions and exchanges of LLC Units will result in increases in the tax basis in our share of the tangible and intangible assets of BRP that otherwise would not have been available. These increases in tax basis may reduce the amount of tax that we would otherwise be required to pay in the future. The Tax Receivable Agreement requires BRP Group to pay 85% of the amount of such cash savings, if any, in U.S. federal, state and local income tax or franchise tax that we actually realize to BRP’s LLC Members that redeem and exchange LLC Units. Furthermore, payments under the Tax Receivable Agreement will give rise to additional tax benefits and therefore additional payments under the Tax Receivable Agreement itself.
Available Information
We make available free of charge on our website our Annual Reports on Form 10-K, Quarterly Reports on Form 10-Q and Current Reports on Form 8-K, and any amendments to those reports filed or furnished pursuant to Section 13(a) or 15(d) of the Exchange Act, as soon as reasonably practicable after those reports are electronically filed with, or furnished to, the SEC. To access these filings, go to our investor relations website at ir.baldwinriskpartners.com, click on “Financials” and then click on “SEC Filings.” We also make available other reports filed with or furnished to the SEC under the Exchange Act, including our proxy statements and reports filed by officers and directors under Section 16(a) of the Exchange Act, as well as our Code of Business Conduct and Ethics, our Insider Trading and Whistleblower Policies, and charters for our Audit Committee, Compensation Committee, Nominating and Corporate Governance Committee, Technology and Cyber Risk Committee and Executive Committee. To access these filings, go to our investor relations website, click on “Governance” and then click on “Governance Overview.” In addition, our website may include disclosure relating to certain non-GAAP financial measures that we may make public orally, telephonically, by webcast, by broadcast or by similar means from time to time. The SEC also maintains an internet site that contains reports, proxy and information statements, and other information filed electronically by us with the SEC, which are available at www.sec.gov.
We may use our website as a channel of distribution of material company information. Financial and other material information regarding the Company is routinely posted on and accessible through our website. Any information on our or the SEC's website or obtained through any such website is not part of this Annual Report on Form 10-K.
Our Investor Relations Department can be contacted at ir@baldwinriskpartners.com by going to our investor relations website, clicking on “Resources” and then “Contact IR,” or by telephone at (813) 259-8032.
13
ITEM 1A. RISK FACTORS
Summary Risk Factors
Some of the factors that could materially and adversely affect our business, financial condition, results of operations or prospects, include the following:
•We may not have sufficient cash flows from operating activities, cash on hand and available capital sources to service any indebtedness, pay contingent earnout liabilities, or finance other working capital needs, which could force us to sell assets, cease operations or take other detrimental actions for our business.
•We have debt outstanding that could adversely affect our financial flexibility and subjects us to restrictions and limitations that could significantly impact our ability to effectively operate our business.
•We may incur significant additional indebtedness, which may affect our ability to satisfy our obligations under the JPM Credit Agreement.
•Downgrades in our credit ratings could increase future debt financing costs and limit the future availability of debt financing.
•Macroeconomic conditions, political events, other market conditions in the U.S. and around the world and a decline in economic activity could have a material adverse effect on our financial condition and results of operations.
•Volatility or declines in premiums or other adverse trends in the insurance industry may seriously undermine our profitability.
•Because the commissions and fees we earn on the sale of certain insurance products is based on premiums and commission rates set by our Insurance Company Partners, any decreases in these premiums or commission rates, or actions by our Insurance Company Partners seeking repayment of commissions, could result in commissions and fees decreases or expenses to us.
•Quarterly and annual variations in our commissions that result from the timing of policy renewals and the net effect of new and lost business production may have unexpected effects on our results of operations.
•Conditions impacting our Insurance Company Partners or other parties with whom we do business may impact us.
•If we are unable to apply technology effectively in driving value for our Clients through technology-based solutions or gain internal efficiencies through the application of technology and related tools, our results of operations, client relationships, growth and compliance programs could be adversely affected.
•Competition in our industry is intense and, if we are unable to compete effectively, we may lose Clients and our business, financial condition and results of operations may be negatively affected.
•Our inability to retain or hire qualified Colleagues, as well as the loss of any of our executive officers or senior leaders, could negatively impact our reputation and/or ability to retain existing business and generate new business.
•The occurrence of natural or man-made disasters, health epidemics and pandemics, and associated governmental responses, could result in declines in business and increases in claims that could adversely affect our business, financial condition and results of operations.
•Our inability to successfully recover should we experience a disaster or other business continuity problem could cause material financial loss, loss of human capital, regulatory actions, reputational harm or legal liability.
•If our ability to enroll individuals during enrollment periods is impeded, our business, results of operations and financial condition could be harmed.
•Partnerships have been, and may in the future continue to be, important to our growth. We may not be able to successfully identify and acquire Partners or integrate Partners into our company, and we may become subject to certain liabilities assumed or incurred in connection with our Partnerships that could harm our business, results of operations and financial condition.
•An impairment of goodwill could have a material adverse effect on our financial condition and results of operations.
•In connection with the implementation of our corporate strategies, we face risks associated with the entry into new lines of business and the growth and development of these businesses.
14
•Our business had historically been highly concentrated in the Southeastern United States. While we still maintain a concentration in the Southeastern United States, our rapid growth has resulted in our having several regional concentrations of our business, such that adverse economic conditions, natural disasters, loss trends or regulatory changes in one of these regions could adversely affect our financial condition.
•We derive a significant portion of our commissions and fees from a limited number of our Insurance Company Partners, the loss of which could result in additional expense and loss of market share.
•Our business may be harmed if we lose our relationships with Insurance Company Partners, fail to maintain good relationships with Insurance Company Partners, become dependent upon a limited number of Insurance Company Partners or fail to develop new Insurance Company Partner relationships.
•We rely on third parties to perform key functions of our business operations, enabling our provision of services to our Clients. These third parties may act in ways that could harm our business.
•We rely on a single vendor or a limited number of vendors to provide certain key products or services to us, and the inability of these key vendors to meet our needs could have a material adverse effect on our business.
•We have experienced significant growth in recent periods, and our recent growth rates may not be indicative of our future growth. As our costs increase, we may not be able to generate sufficient revenue to achieve and, if achieved, maintain profitability.
•Certain of our results of operations and financial metrics may be difficult to predict as a result of seasonality.
•E&O claims against us, and other incidents, claims, risks, exposures and/or liabilities that require us to make claims against our insurance policies, may negatively affect our business, financial condition and results of operations.
•Non-compliance with or changes in laws, regulations or licensing requirements applicable to us could restrict our ability to conduct our business and/or could adversely affect our business, financial condition and results of operations.
•Proposed tort reform legislation, if enacted, could decrease demand for casualty insurance, thereby reducing our commissions revenues.
•Our business depends on information processing systems. Data breaches or other security incidents with respect to our or our vendors’ information processing systems may hurt our business, financial condition and results of operations.
•We are a holding company with our principal asset being our 55% ownership interest in BRP, and our Pre-IPO LLC Members, whose interest in our business may be different from yours, have approval rights over certain transactions and actions taken by us.
•In certain circumstances, BRP will be required to make distributions to us and the other holders of LLC Units, and the distributions that BRP will be required to make may be substantial.
•We will be required to pay BRP’s LLC Members and any other persons that become parties to the Tax Receivable Agreement for certain tax benefits we may receive, and the amounts we may pay could be significant.
15
Risks Relating to our Business Operations and Industry
We may not have sufficient cash flows from operating activities, cash on hand and available capital sources to service any indebtedness, pay contingent earnout liabilities, or finance other working capital needs, which could force us to sell assets, cease operations or take other detrimental actions for our business.
As of December 31, 2023, our cash and cash equivalents were $116.2 million and we had $259.0 million of available borrowing capacity on the Revolving Facility under the JPM Credit Agreement. We will continue to expend substantial cash resources for the foreseeable future for servicing our debt obligations and future earnout payment liabilities. Borrowings under our JPM Credit Agreement include $998.7 million under the Term Loan B and $341.0 million on the Revolving Facility bearing interest at December 31, 2023 of 8.97% and 8.46%, respectively, through their respective expiration dates of October 2027 and April 2027. In connection with certain prior Partnerships and acquisitions of select books of business, we are required to pay contingent earnouts. Based on estimates of the Partners’ future performance using financial projections for the earnout period, the aggregate estimated contingent earnout liabilities included on our consolidated balance sheet at December 31, 2023 was $276.5 million, of which $10.8 million must be settled in cash and the remaining $265.7 million can be settled in cash or stock at our option. The undiscounted estimated contingent earnout obligation at December 31, 2023 was $309.0 million, of which $11.9 million must be settled in cash and the remaining $297.1 million can be settled in cash or stock at our option. The maximum estimated exposure to the contingent earnout liabilities was $607.4 million at December 31, 2023. There is no assurance that we will have sufficient cash flows from operating activities, cash on hand and available capital sources to service any indebtedness or pay contingent earnout liabilities when due, or finance other working capital needs, and failure to do so may result in a material adverse effect on our business, operations, and financial condition. Refer to Item 7. Management’s Discussion and Analysis of Financial Condition and Results of Operations—Liquidity and Capital Resources—Contractual Obligations and Commitments for further discussion of our debt obligations and contingent earnout liabilities.
If our cash flows and capital resources are at any time insufficient to fund our obligations, we may be forced to reduce or delay investments and capital expenditures, or to sell assets, seek additional capital, restructure or refinance our indebtedness, or reduce or cease operations. There can be no assurance that additional capital or debt financing will be available to us at any time. Even if additional capital is available, we may not be able to obtain debt or equity financing on terms favorable to us. In the absence of such operating results and resources, we could face substantial liquidity problems and might be required to reduce or curtail our operations.
We have debt outstanding that could adversely affect our financial flexibility and subjects us to restrictions and limitations that could significantly impact our ability to effectively operate our business.
As of December 31, 2023, we had total consolidated debt outstanding of approximately $1.3 billion, collateralized by substantially all the Company’s assets, including a pledge of all equity securities the Company holds in each of its subsidiaries. During the year ended December 31, 2023, we had debt servicing costs of $394.9 million, inclusive of $284.4 million in principal repayments and $105.4 million of interest payments.
The level of debt we have outstanding during any period could adversely affect our financial flexibility. We also bear risk at the time debt matures. Our ability to make interest and principal payments, to refinance our debt obligations and to fund our planned capital expenditures will depend on our ability to generate cash from operations. Our ability to generate cash from operations is, to a certain extent, subject to general economic, financial, competitive, legislative, regulatory and other factors that are beyond our control, such as an environment of rising interest rates. The need to service our indebtedness will also reduce our ability to use cash for other purposes, including earnouts, working capital, dividends to stockholders, acquisitions, capital expenditures, share repurchases and general corporate purposes. If we cannot service our indebtedness, we may have to take actions such as selling assets, raising additional equity or reducing or delaying capital expenditures, strategic acquisitions and investments, any of which could impede the implementation of our business strategy or prevent us from entering into transactions that would otherwise benefit our business. Additionally, we may not be able to effect such actions, if necessary, on favorable terms, or at all. We may not be able to refinance any of our indebtedness on favorable terms, or at all.
16
The JPM Credit Agreement contains covenants that, among other things, restrict our ability to make certain restricted payments, incur additional debt, engage in certain asset sales, mergers, acquisitions or similar transactions, create liens on assets, engage in certain transactions with affiliates, change our business or make certain investments and require us to comply with certain financial covenants. The restrictions in the JPM Credit Agreement governing our debt may prevent us from taking actions that we believe would be in the best interest of our business and our stockholders and may make it difficult for us to execute our business strategy successfully or effectively compete with companies that are not similarly restricted. We may also incur future debt obligations that might subject us to additional or more restrictive covenants that could affect our financial and operational flexibility, including our ability to pay dividends. We cannot make any assurances that we will be able to refinance our debt or obtain additional financing on terms acceptable to us, or at all. A failure to comply with the restrictions under the JPM Credit Agreement could result in a default under the financing obligations or could require us to obtain waivers from our lenders for failure to comply with these restrictions. The occurrence of a default that remains uncured or the inability to secure a necessary consent or waiver could cause our obligations with respect to our debt to be accelerated and have a material adverse effect on our business, financial condition and results of operations.
We may incur significant additional indebtedness, which may affect our ability to satisfy our obligations under the JPM Credit Agreement.
Under the terms of the JPM Credit Agreement, we may be able to incur significant additional indebtedness, including secured indebtedness, in the future. This could require us to dedicate a substantial portion of our cash flow from operations to payments on our indebtedness, reduce the availability of our cash flow to fund working capital and capital expenditures and execute on our Partnership strategy, expose us to the risk of increased interest rates and increase our vulnerability to adverse economic or industry conditions. If new indebtedness is added to our current indebtedness levels, the related risks that we face could be increased, and we may not be able to meet all of our debt obligations. Furthermore, the terms of any future indebtedness we may incur could include more restrictive covenants, which could affect our financial and operational flexibility, including our ability to pay dividends.
Downgrades in our credit ratings could increase future debt financing costs and limit the future availability of debt financing.
The major rating agencies routinely evaluate our credit profile and assign credit ratings to us. During 2023, we experienced a downgrade in our credit rating based on our increased level of credit risk as a result of increased amount of our total debt outstanding, the financial impacts of the rising interest rate environment and a recent deterioration in the general macroeconomic environment. If we need to raise capital in the future (for example, in order to maintain adequate liquidity, fund maturing debt obligations or finance acquisitions or other initiatives), credit rating downgrades would increase our financing costs, and could limit our access to financing sources. We may also face the risk of a credit rating downgrade if we do not retire or refinance the debt to levels acceptable to the credit rating agencies in a timely manner.
Macroeconomic conditions, political events, other market conditions in the U.S. and around the world and a decline in economic activity could have a material adverse effect on our financial condition and results of operations.
Macroeconomic conditions, political events and other market conditions in the U.S. and around the world, including the recent resurgence of inflation and interest rate increases, and the risk that the U.S. economy will decelerate into a recession, affect the financial services industry. These conditions may reduce demand for our services or depress pricing for those services, which could have a material adverse effect on our costs and results of operations. Changes in macroeconomic and political conditions, such as the impact from rising inflation and interest rates could also shift demand to services for which we do not have a competitive advantage, and this could negatively affect the amount of business that we are able to obtain. Any changes in U.S. trade policy could trigger retaliatory actions by affected countries, resulting in “trade wars,” which could affect volume of economic activity in the U.S., including demand for our services.
For example, the demand for insurance policies may be depressed by higher levels of inflation. In addition, a significant portion of our operating expenses goes to employee compensation and benefits, which, in addition to other areas of our operating expenses, are sensitive to inflation. To maintain our ability to successfully compete for the best talent, rising inflation rates may require us to provide compensation increases beyond historical increases, which may significantly increase our compensation costs. Consequently, inflation is expected to increase our operating expenses (both compensation and non-compensation related) over time and may adversely impact our results of operating cash flow.
Moreover, we have various agreements to lease office space located in 24 states throughout the U.S. and part of such leases contain effective annual rent escalations either fixed or indexed based on a consumer price index or other index. During higher inflationary periods, our rent expenses may increase significantly, which may adversely affect to our business, financial condition, results of operations, and cash flows.
17
Furthermore, during inflationary periods, interest rates have historically increased, which would have a direct effect on the interest expense in case we decide to refinance our existing long-term borrowings, including the JPM Credit Agreement, or incur in any additional indebtedness.
In addition to macroeconomic conditions, political events and other market conditions, other factors such as business commissions and fees, microeconomic conditions, and the volatility and strength of the capital markets, can affect our business and economic environment. The demand for insurance generally rises as the overall level of economic activity increases and generally falls as such activity decreases, affecting both the commissions and fees generated by our IAS, MIS and UCTS Operating Groups. Downward fluctuations in the year-over-year insurance premiums charged by our Insurance Company Partners to protect against the same risk, referred to in the industry as softening of the insurance market, could adversely affect our business as a significant portion of the earnings are determined as a percentage of premium charged to our Clients. Insolvencies and consolidations associated with an economic downturn could adversely affect our brokerage business through the loss of Clients by hampering our ability to place insurance business. Also, some of our Clients may experience liquidity problems or other financial difficulties in the event of a prolonged deterioration in the economy, or any segment or sub-segment of the economy, which could have an adverse effect on our collectability of receivables. Errors and omissions claims against us, which we refer to as E&O claims, may increase in economic downturns, adversely affecting our brokerage business. In addition, other incidents, claims, risks, exposures and/or liabilities that require us to make claims against our own policies of insurance may have a similar effect. Also, the volatility or decline of economic or other market conditions could result in the increased surrender of insurance products or cause individuals to forgo insurance, thereby impacting our contingent commissions, which are primarily driven by our Insurance Company Partners’ growth and profitability metrics. A decline in economic activity could have a material adverse effect on our business, financial condition and results of operations.
Volatility or declines in premiums or other adverse trends in the insurance industry may seriously undermine our profitability.
We derive most of our commissions and fees from our brokerage and related services. We do not determine the insurance premiums on which our commissions are generally based. Moreover, insurance premiums are cyclical in nature and may vary widely based on market conditions. Because of market cycles for insurance product pricing, which we cannot predict or control, our brokerage commissions and fees and profitability can be volatile or remain depressed for significant periods of time. In addition, there have been and may continue to be—including as a result of substantial increases in insurance premiums— various trends in the insurance industry toward alternative insurance markets, including, among other things, greater levels of self-insurance, captives, rent-a-captives, risk retention groups and non-insurance capital markets-based solutions to traditional insurance. Our ability to generate premium-based commission revenue may also be challenged by the growing desire of some clients to compensate brokers based upon flat fees rather than a percentage of premium. This could negatively impact us because fees are generally not indexed for inflation and might not increase with premiums as commissions do or with the level of service provided.
As traditional risk-bearing insurance companies continue to outsource the production of premium commissions and fees to non-affiliated brokers or agents such as us, those insurance companies may seek to further minimize their expenses by reducing the commission rates payable to insurance brokers or agents. The reduction of these commission rates, along with general volatility or declines in premiums, may significantly affect our profitability. Because we do not determine the timing or extent of premium pricing changes, it is difficult to precisely forecast our commission and contingent commissions and fees, including whether they will significantly decline. As a result, we may have to adjust our budgets for future acquisitions, capital expenditures, dividend payments, loan repayments and other expenditures to account for unexpected changes in commissions and fees, and any decreases in premium rates may adversely affect our business, financial condition and results of operations.
18
Because the commissions and fees we earn on the sale of certain insurance products is based on premiums and commission rates set by our Insurance Company Partners, any decreases in these premiums or commission rates, or actions by our Insurance Company Partners seeking repayment of commissions, could result in commissions and fees decreases or expenses to us.
We derive commissions and fees from the sale of insurance products that are paid by our Insurance Company Partners from whom our Clients purchase insurance. Because payments for the sale of insurance products are processed internally by our Insurance Company Partners, we may not receive a payment that is otherwise expected in any particular period until after the end of that period, which can adversely affect our ability to budget for significant future expenditures. Additionally, our Insurance Company Partners or their affiliates may, under certain circumstances, seek the chargeback or repayment of commissions as a result of policy lapse, surrender, cancellation, rescission, default or upon other specified circumstances. As a result of the chargeback or repayment of commissions, we may incur an expense in a particular period related to commissions and fees previously recognized in a prior period and reflected in our financial statements. Such an expense could have a material adverse effect on our financial condition and results of operations, particularly if the expense is greater than the amount of related commissions and fees retained by us.
The commission rates are set by our Insurance Company Partners and are based on the premiums that the Insurance Company Partners charge. The potential for changes in premium rates is significant, due to pricing cyclicality in the insurance market. In addition, the insurance industry has been characterized by periods of intense price competition due to excessive underwriting capacity and periods of favorable premium levels due to shortages of capacity. Capacity could also be reduced by our Insurance Company Partners’ failing or withdrawing from writing certain coverages and/or geographic areas that we offer our Clients. Commission rates and premiums can change based on prevailing legislative, economic and competitive factors that affect our Insurance Company Partners. These factors, which are not within our control, include the capacity of our Insurance Company Partners to place new business, underwriting and non-underwriting profits of our Insurance Company Partners, consumer demand for insurance products, the availability of comparable products from other insurance companies at a lower cost and the availability of alternative insurance products, such as government benefits and self-insurance products, to consumers. We cannot predict the timing or extent of future changes in commission rates or premiums or the effect any of these changes will have on our business, financial condition and results of operations.
Quarterly and annual variations in our commissions that result from the timing of policy renewals and the net effect of new and lost business production may have unexpected effects on our results of operations.
Our commission income (including profit-sharing contingent commissions and override commissions) can vary quarterly or annually due to the timing of policy renewals and the net effect of new and lost business production. We do not control the factors that cause these variations. Specifically, Clients’ demand for insurance products can influence the timing of renewals, new business and lost business (which includes policies that are not renewed and cancellations). In addition, we rely on our Insurance Company Partners for the payment of certain commissions. Quarterly and annual fluctuations in commissions and fees based on increases and decreases associated with the timing of new business, policy renewals and payments from our Insurance Company Partners may adversely affect our financial condition, results of operations and cash flows.
Profit-sharing contingent commissions are special revenue-sharing override commissions paid by our Insurance Company Partners based on the attainment of certain metrics such as the profitability, volume or growth of the business placed with such companies generally during the prior year. These are not guaranteed payments and our Insurance Company Partners may change the calculations or potentially elect to stop paying them at all on an annual basis. Over the last two years contingent commissions generally have been in the range of 7.0% to 9.0% of the year’s total core commissions and fees. Increases in loss ratios experienced by our Insurance Company Partners will result in a decreased profit to them and may result in decreases in payments of contingent or profit-sharing commissions to us. Due to, among other things, potentially poor macroeconomic conditions, the inherent uncertainty of loss in our Clients’ industries and changes in underwriting criteria (including profitability, volume or growth thresholds), due in part to the high loss ratios experienced by our Insurance Company Partners, we cannot predict the payment of these profit-sharing contingent commissions. Further, we have no control over the ability of our Insurance Company Partners to estimate loss reserves, which affects our ability to make profit-sharing calculations. Override commissions are paid by our Insurance Company Partners based on the attainment of certain metrics such as the profitability, volume or growth of the business that we place with them and are generally paid over the course of the year or in the beginning of the following year. Because profit-sharing contingent commissions and override commissions materially affect our commissions and fees, any decrease in their payment to us could adversely affect our results of operations, profitability and our financial condition.
19
See “—Our business had historically been highly concentrated in the Southeastern United States. While we still maintain a concentration in the Southeastern United States, our rapid growth has resulted in our having several regional concentrations of our business, such that adverse economic conditions, natural disasters, loss trends or regulatory changes in one of these regions could adversely affect our financial condition.”
Conditions impacting our Insurance Company Partners or other parties with whom we do business may impact us.
We have a significant amount of accounts receivable from our Insurance Company Partners with whom we place insurance. If those Insurance Company Partners were to experience liquidity problems or other financial difficulties, we could encounter delays or defaults in payments owed to us, which could have a significant adverse impact on our financial condition and results of operations. The potential for one of our Insurance Company Partners to cease writing insurance we offer our Clients could negatively impact overall capacity in the industry, which in turn could have the effect of reduced placement of certain lines and types of insurance and reduced commissions and fees and profitability for us. Questions about one of our Insurance Company Partners’ perceived stability or financial strength may contribute to such Insurance Company Partners’ strategic decisions to focus on certain lines of insurance to the detriment of others. The failure of an Insurance Company Partner with whom we place insurance could result in E&O claims against us by our Clients, and the failure of our Insurance Company Partners could make the E&O insurance we rely upon cost prohibitive or unavailable, which could have a significant adverse impact on our financial condition and results of operations. In addition, if any of our Insurance Company Partners merge or if one of our large Insurance Company Partners fails or withdraws from certain geographic areas or from offering certain lines of insurance, overall risk-taking capital capacity could be negatively affected, which could reduce our ability to place certain lines of insurance and, as a result, reduce our commissions and fees and profitability. Such failures or insurance withdrawals on the part of our Insurance Company Partners could occur for any number of reasons, including large unexpected payouts related to climate events or other emerging risk areas.
If we are unable to apply technology effectively in driving value for our Clients through technology-based solutions or gain internal efficiencies through the application of technology and related tools, our results of operations, client relationships, growth and compliance programs could be adversely affected.
Our future success depends, in part, on our ability to anticipate and respond effectively to the threat of, and the opportunity presented by, digital disruption and other technology change. These may include new applications or insurance-related services based on artificial intelligence, machine learning, robotics, blockchain or new approaches to data mining. We may be exposed to competitive risks related to the adoption and application of new technologies by established market participants (for example, through disintermediation) or new entrants such as technology companies, Insurtech start-up companies and others. We must also develop and implement technology solutions and technical expertise among our employees that anticipate and keep pace with rapid and continuing changes in technology, industry standards, client preferences and control standards. We may not be successful in anticipating or responding to these developments on a timely and cost-effective basis, and our ideas may not be accepted in the marketplace. Additionally, the effort to gain technological expertise and develop new technologies in our business may require us to incur significant expenses. Our technological development projects may also not deliver the benefits we expect once they are completed or may be replaced or become obsolete more quickly than expected, which could result in the accelerated recognition of expenses. If we cannot develop or implement new technologies as quickly as our competitors, or if our competitors develop more cost-effective technologies or product offerings, we could experience a material adverse effect on our results of operations, client relationships, growth and compliance programs. Our investments in new products and services may not generate the expected returns, which could hinder our ability to generate organic growth in the future.
Competition in our industry is intense and, if we are unable to compete effectively, we may lose Clients and our business, financial condition and results of operations may be negatively affected.
The business of providing insurance products and services is highly competitive and we expect competition to intensify. We compete for Clients on the basis of reputation, Client service, program and product offerings and our ability to tailor products and services to meet the specific needs of a Client.
20
We actively compete with numerous integrated financial services organizations as well as Insurance Company Partners and brokers, producer groups, individual insurance agents, investment management firms, independent financial planners and broker-dealers. Competition may reduce the fees that we can obtain for services provided, which would have an adverse effect on commissions and fees and margins. Many of our competitors have greater financial and marketing resources than we do and may be able to offer products and services that we do not currently offer and may not offer in the future. To the extent that banks, securities firms, insurance companies’ affiliates and the financial services industry may experience further consolidation, we may experience increased competition from insurance companies and the financial services industry, as a growing number of larger financial institutions increasingly, and aggressively, offer a wider variety of financial services, including insurance intermediary services. In addition, a number of insurance companies are engaged in the direct sale of insurance, primarily to individuals, and do not pay commissions to brokers or other market intermediaries. Furthermore, we compete with various other companies that provide risk-related services or alternatives to traditional insurance services, including Insurtech start-up companies, which are focused on using technology and innovation, including artificial intelligence (AI), digital platforms, data analytics, robotics and blockchain, to simplify and improve the Client experience, increase efficiencies, alter business models and effect other potentially disruptive changes in the industries in which we operate. In addition, in recent years, private equity sponsors have invested tens of billions of dollars into the insurance sector, transforming existing players and creating new ones to compete with large brokers. These new competitors, alliances among competitors or mergers of competitors could emerge and gain significant market share, and some of our competitors may have or may develop a lower cost structure, adopt more aggressive pricing policies or provide services that gain greater market acceptance than the services that we offer or develop. With respect to our sale of Medicare-related insurance, we also compete with government-run health insurance exchanges. The federal government operates a website where Medicare beneficiaries can purchase Medicare Advantage and Medicare Part D prescription drug plans or be referred to carriers to purchase Medicare Supplement plans. We also compete with the original Medicare program. The Affordable Care Act exchanges have websites where individuals and small businesses can purchase health insurance, and they also have offline customer support and enrollment capabilities.
Competitors may be able to respond to the need for technological changes and innovate faster, or price their services more aggressively. They may also compete for skilled professionals, finance acquisitions, fund internal growth and compete for market share more effectively than we do. To respond to increased competition and pricing pressure, we may have to lower the cost of our services or decrease the level of services provided to Clients, which could have an adverse effect on our business, financial condition and results of operations.
Some of our competitors may be able to sustain the costs of litigation more effectively than we can because they have substantially greater resources. In the event that any of such competitors initiates litigation against us, such litigation, even if without merit, could be time-consuming and costly to defend and may divert management’s attention and resources away from our business and adversely affect our business, financial condition and results of operations.
Similarly, any increase in competition due to new legislative or industry developments could adversely affect us. These developments include:
•increased capital-raising by insurance companies, which could result in new capital in the industry, which in turn may lead to lower insurance premiums and commissions;
•insurance companies selling insurance directly to the insured without the involvement of a broker or other intermediary;
•changes in our business compensation model as a result of legal, policy and/or regulatory developments;
•federal and state governments establishing programs to provide property insurance in catastrophe-prone areas or other alternative market types of coverage that compete with, or completely replace, insurance products offered by insurance companies;
•climate change regulation in the U.S. and around the world moving us toward a low-carbon economy, which could create new competitive pressures around innovative insurance solutions; and
•increased competition from new market participants such as banks, accounting firms, consulting firms and Internet or other technology firms offering risk management, insurance brokerage services or new distribution channels for insurance, such as payroll firms.
New competition as a result of these or other competitive or industry developments could cause the demand for our products and services to decrease, which could in turn adversely affect our business, financial condition and results of operations.
21
Our inability to retain or hire qualified Colleagues, as well as the loss of any of our executive officers or senior leaders, could negatively impact our reputation and/or ability to retain existing business and generate new business.
Our success depends on our ability to attract and retain skilled and experienced personnel. There is significant competition from within the insurance industry and from businesses outside the industry for exceptional employees, especially in key positions. Our competitors may be able to offer a work environment with higher compensation or more opportunities than we can. Any new personnel we hire may not be or become as productive as we expect, as we may face challenges in adequately or appropriately integrating them into our workforce and culture. Our effort to retain and develop personnel may also result in significant additional expenses, which could adversely affect our profitability. We can make no assurances that qualified Colleagues will continue to be employed or that we will be able to attract and retain qualified personnel in the future. If we are not able to successfully attract, retain and motivate our Colleagues, whether as a result of an insufficient number of qualified applicants, difficulty in recruiting new Colleagues, or inadequate resources to train, integrate, and retain qualified Colleagues, our business, financial condition, results of operations and reputation could be materially and adversely affected.
In addition, we could be adversely affected if we fail to adequately plan for the succession of our senior leaders, including our founders and key executives, or if one or more of them is the victim of any accident, injury, illness or other ailment. In particular, our future success depends substantially on the continued service of our co-founder and Chairman, Lowry Baldwin, and our Chief Executive Officer, Trevor Baldwin. The loss of our senior managers or other key personnel (including the legacy management of certain joint ventures or acquired subsidiaries) in any circumstance, including any limitation on the performance of their duties or short- or long-term absence as a result of any accident, injury, illness or other ailment, or our inability to continue to identify, recruit and retain such personnel, could materially and adversely affect our business, financial condition and results of operations.
The occurrence of natural or man-made disasters, health epidemics and pandemics and associated governmental responses, could result in declines in business and increases in claims that could adversely affect our business, financial condition and results of operations.
We are exposed to various risks arising out of natural disasters, including earthquakes, hurricanes, fires, floods, landslides, tornadoes, typhoons, tsunamis, hailstorms, explosions, climate events or weather patterns and public health crises, epidemics or pandemic health events, as well as man-made disasters, including acts of terrorism, military actions, cyber-terrorism, explosions and biological, chemical or radiological events, and associated governmental responses. The continued threat of terrorism and ongoing military actions may cause significant volatility in global financial markets, and a natural or man-made disaster could trigger an economic downturn in the areas directly or indirectly affected by the disaster. These consequences could, among other things, result in a decline in business and increased claims from those areas. They could also result in reduced underwriting capacity of our Insurance Company Partners, making it more difficult for our Colleagues and contracted agents to place business. Disasters also could disrupt public and private infrastructure, including communications and financial services, which could disrupt our ordinary business operations. Any increases in loss ratios due to natural or man-made disasters could impact our contingent commissions, which are primarily driven by both growth and profitability metrics.
A natural or man-made disaster also could disrupt the operations of our counterparties or result in increased prices for the products and services they provide to us. Finally, a natural or man-made disaster could increase the incidence or severity of E&O claims against us, or other incidents, claims, risks, exposures and/or liabilities that require us to make claims against our insurance policies.
See “—Our business had historically been highly concentrated in the Southeastern United States. While we still maintain a concentration in the Southeastern United States, our rapid growth has resulted in our having several regional concentrations of our business, such that adverse economic conditions, natural disasters, loss trends or regulatory changes in one of these regions could adversely affect our financial condition.”
22
Our inability to successfully recover should we experience a disaster or other business continuity problem could cause material financial loss, loss of human capital, regulatory actions, reputational harm or legal liability.
Our operations are dependent upon our ability to protect our personnel, offices, and technology infrastructure against damage from business continuity events that could have a significant disruptive effect on our operations. Should we experience a local or regional disaster or other business continuity problem, such as an earthquake, hurricane, terrorist attack, pandemic, protest or riot, security breach, power loss, telecommunications failure or other natural or man-made disaster, our continued success will depend, in part, on the availability of personnel, office facilities, and the proper functioning of computer, telecommunication and other related systems and operations. In events like these, we can experience near-term operational challenges in particular areas of our operations. We could potentially lose key executives, personnel, client data or experience material adverse interruptions to our operations or delivery of services to Clients in a disaster recovery scenario. We may experience additional disruption due to system upgrades, outages, an increase in remote work or other impacts as a result of health epidemics or pandemics. Our inability to successfully recover should we experience a disaster or other business continuity problem, could materially interrupt our business operations and cause material financial loss, loss of human capital, regulatory actions, reputational harm, damaged client relationships, or legal liability. Our insurance coverage with respect to natural disasters is limited and is subject to deductibles and coverage limits. Such coverage may not be adequate, or may not continue to be available at commercially reasonable rates and terms.
If our ability to enroll individuals during enrollment periods is impeded, our business, results of operations and financial condition could be harmed.
It is difficult for the health insurance Risk Advisors we employ and our systems and processes to handle the increased volume of health insurance transactions that occur in a short period of time during the healthcare reform annual open enrollment period and the Medicare annual enrollment period. We hire additional Colleagues on a temporary or seasonal basis in a limited period of time to address the expected increase in the volume of health insurance transactions during the Medicare annual enrollment period. We must ensure that our health insurance Risk Advisors and those of outsourced call centers are timely licensed, trained and certified and have the appropriate authority to sell health insurance in a number of states and for a number of different health insurance companies. We depend on our own Colleagues, state departments of insurance, government exchanges and Insurance Company Partners for licensing, certification and appointment. If our ability to market and sell Medicare-related health insurance and individual and family health insurance is constrained during an enrollment period for any reason, such as technology failures, reduced allocation of resources, any inability to timely employ, license, train, certify and retain our Colleagues and our contractors and their health insurance Risk Advisors to sell health insurance, interruptions in the operation of our website or systems or issues with government-run health insurance exchanges, we could acquire fewer members, suffer a reduction in our membership and our business, results of operations and financial condition could be harmed.
Partnerships have been, and may in the future continue to be, important to our growth. We may not be able to successfully identify and acquire Partners or integrate Partners into our company, and we may become subject to certain liabilities assumed or incurred in connection with our Partnerships that could harm our business, results of operations and financial condition.
Strategic acquisitions to complement and further expand our business, which we refer to as Partnerships, have been an important part of our competitive strategy. The acquisition landscape is competitive and accordingly we do not expect that Partnerships will be as important to our growth in 2024, although we will remain active in pursuing potential transactions. Our ability to identify and complete acquisitions, or if we are inefficient or unsuccessful at integrating any Partner into our operations, may impact our ability to achieve our planned rates of growth or improve our market share, profitability or competitive position in specific markets or services. The process of integrating a Partner has created, and will continue to create, operating difficulties. The risks we face include:
•diversion of management time and focus from operating our core business to acquisition integration challenges;
•excessive costs of deploying our business support and financial management tools in acquired companies;
•delays in the successful integration of the Partner into our operations;
•failure to successfully integrate the Partner into our operations, including cultural challenges associated with integrating and retaining Colleagues;
•failure to achieve anticipated efficiencies or benefits, including through the loss of key Clients or personnel of the Partner;
•failure to realize our strategic objectives for the Partner or further develop the Partner; and
23
•the consequences of the conduct of our acquired companies prior to their acquisition by us, including the occurrence of data breaches or other cybersecurity attacks during the integration of information systems, as well as increased costs associated with implementing state and regulatory compliance procedures, including data privacy and cybersecurity protections.
Furthermore, when regulatory approval of our proposed Partnerships is required, our ability to complete such Partnerships may be limited by an ongoing regulatory review or other issues with the relevant regulator.
There may be liabilities that we fail to discover while conducting due diligence, that we inadequately assess or that are not properly disclosed to us. In particular, to the extent that any Partner (i) failed to comply with or otherwise violated applicable laws or regulations, (ii) failed to fulfill contractual obligations to Clients, Insurance Company Partners or other third parties such as vendors, service providers or contracted agents, or (iii) incurred material liabilities or obligations to Clients that are not identified during the diligence process, we, as the successor owner, may be financially responsible for these violations, failures and liabilities and may suffer financial or reputational harm or otherwise be adversely affected. In addition, as part of a Partnership, we may assume responsibilities and obligations of the Partner pursuant to the terms and conditions of agreements entered by the acquired entity that are not consistent with the terms and conditions that we typically accept and require. We also may be subject to litigation or other claims in connection with a Partner, including claims from Colleagues, Clients, stockholders or other third parties. Any material liabilities we incur that are associated with our Partnerships could harm our business, results of operations and financial condition.
Our Partnership strategy is also affected by our ability to secure additional debt or equity financing in the future to fund acquisitions. We may not be able to obtain such additional financing or, if available, it may not be in amounts and on terms acceptable to us. We cannot predict or guarantee that we will successfully identify suitable acquisition candidates, consummate any Partnership or integrate any Partner. Any failure to do so could have an adverse impact on our business, results of operations and financial condition.
An impairment of goodwill could have a material adverse effect on our financial condition and results of operations.
When we acquire Partners, we record goodwill and other intangible assets. As of December 31, 2023, goodwill represented 40% of our total assets. Goodwill is not amortized and is subject to assessment for impairment at least annually. The identification and measurement of goodwill impairment involves the estimation of the fair value of our reporting units. We compare the fair value of each reporting unit with its carrying amount to determine if there is potential impairment of goodwill. Management reviews the carrying value attributed to each reporting unit at least annually to determine if the facts and circumstances suggest that there is impairment.
We may in the future be required to take additional goodwill or other asset impairment charges. Any such non-cash charges could have a material adverse effect on our financial condition and results of operations.
In connection with the implementation of our corporate strategies, we face risks associated with the entry into new lines of business and the growth and development of these businesses.
From time to time, either through Partnerships or internal development, we may enter new lines of business or offer new products and services within existing lines of business. These new lines of business or new products and services may present additional risks, particularly in instances where the markets are not fully developed. Such risks include the investment of significant time and resources; the possibility that these efforts will not be successful; the possibility that the marketplace does not accept our products or services, or that we are unable to retain Clients that adopt our new products or services; and the risk of additional liabilities associated with these efforts. Other risks include developing knowledge of and experience in the new lines of business, integrating the Partner into our systems and culture, recruiting professionals and developing and capitalizing on new relationships with experienced market participants. External factors, such as compliance with new or revised regulations, competitive alternatives and shifting market preferences may also impact the successful implementation of a new line of business. Failure to manage these risks in the acquisition or development of new businesses could materially and adversely affect our business, financial condition and results of operations. In addition, if we dispose of or otherwise exit certain businesses, there can be no assurance that we will not incur certain disposition-related charges, or that we will be able to reduce overhead related to the divested assets. Our investments in new products and services may not generate the expected returns, which could hinder our ability to generate organic growth in the future.
24
Our business had historically been highly concentrated in the Southeastern United States. While we still maintain a concentration in the Southeastern United States, our rapid growth has resulted in our having several regional concentrations of our business, such that adverse economic conditions, natural disasters, loss trends or regulatory changes in one of these regions could adversely affect our financial condition.
A significant portion of our business remains concentrated in the Southeastern U.S., with several other regional concentrations. The insurance business is primarily a state-regulated industry, and therefore state legislatures may enact laws that adversely affect the insurance industry. Because our business is concentrated in several regions of the U.S., we face greater exposure to unfavorable changes in regulatory conditions in those regions than insurance intermediaries whose operations are more diversified through a greater number of states. In addition, the occurrence of adverse economic conditions, natural or other disasters, loss trends or other circumstances specific to or otherwise significantly impacting these states could adversely affect our financial condition, results of operations and cash flows. Increases in loss ratios, combined ratios and related costs experienced by our Insurance Company Partners will result in a decreased profit to them and may result in decreases in payments of contingent or profit-sharing commissions to us. This trend may also cause one or more of our Insurance Company Partners to reduce or cease writing insurance we offer our Clients, whether in part, entirely or on a geographic basis, which in turn could reduce our ability to place certain lines of insurance and, as a result, reduce our commissions and fees and profitability.
In addition, we are susceptible to losses and interruptions caused by hurricanes (particularly in Florida, where our headquarters and numerous offices are located), earthquakes, tornadoes, power shortages, telecommunications failures, water shortages, floods, fire, extreme weather conditions, geopolitical events, such as terrorist acts, and other natural or man-made disasters. Hurricanes in particular may have an outsized impact on the insurance industry. We expect to continue to grow our footprint throughout the country and beyond, but our plans to execute on this geographic diversification effort may not be successful.
We derive a significant portion of our commissions and fees from a limited number of our Insurance Company Partners, the loss of which could result in additional expense and loss of market share.
For the year ended December 31, 2023, two Insurance Company Partners accounted for an aggregate of approximately 17% of our total core commissions and fees. Should either of these Insurance Company Partners seek to terminate their respective arrangements with us or in the case of material financial impairment of such Insurance Company Partners, we could be forced to move our business to other Insurance Company Partners and additional expense and loss of market share could possibly result.
Our business may be harmed if we lose our relationships with Insurance Company Partners, fail to maintain good relationships with Insurance Company Partners, become dependent upon a limited number of Insurance Company Partners or fail to develop new Insurance Company Partner relationships.
Our business typically enters into contractual agency relationships with Insurance Company Partners that are sometimes unique to BRP Group, but nonexclusive and terminable on short notice by either party for any reason. In many cases, Insurance Company Partners also have the ability to amend the terms of our agreements unilaterally, including commission rates on short notice. Our Insurance Company Partners may be unwilling to allow us to sell their existing or new insurance products or may amend our agreements with them, for a variety of reasons, including for competitive or regulatory reasons or because of a reluctance to distribute their products through our platform. Our Insurance Company Partners may decide to rely on their own internal distribution channels, choose to exclude us from their most profitable or popular products, or decide not to distribute insurance products in individual markets in certain geographies or altogether. The termination or amendment of our relationship with an Insurance Company Partner could reduce the variety of insurance products we offer. We also could lose a source of, or be paid reduced commissions for, future sales and could lose renewal commissions for past sales. Our business could also be harmed if we fail to develop new Insurance Company Partner relationships.
In the future, it may become necessary for us to offer insurance products from a reduced number of Insurance Company Partners or to derive a greater portion of our commissions and fees from a more concentrated number of Insurance Company Partners as our business and the insurance industry evolve. Should our dependence on a smaller number of Insurance Company Partners increase, whether as a result of the termination of Insurance Company Partner relationships, Insurance Company Partner consolidation or otherwise, we may become more vulnerable to adverse changes in our relationships with our Insurance Company Partners, particularly in states where we offer insurance products from a relatively small number of Insurance Company Partners or where a small number of insurance companies dominate the market. The termination, amendment or consolidation of our relationship with our Insurance Company Partners could harm our business, financial condition and results of operations.
25
We rely on third parties to perform key functions of our business operations, enabling our provision of services to our Clients. These third parties may act in ways that could harm our business.
We rely on third parties, and in some cases subcontractors, to provide services, data, and information, such as technology, information security, billing systems, funds transfers, data processing and administration and support functions, that are critical to our business operations. These third parties include correspondents, agents and other brokerage and intermediaries, insurance markets, data providers, plan trustees, payroll service providers, benefits administrators, software and system vendors, health plan providers, investment managers and providers of human resources, among others. As we do not fully control the actions of these third parties, we are subject to the risk that their decisions, actions or inactions may adversely impact us and replacing these service providers could create significant delays and expenses. Because we do not control our vendors and our ability to monitor their cybersecurity is limited, we cannot ensure the cybersecurity measures they take will be sufficient to protect any information we share with them or to which they may have access. Due to applicable laws and regulations or contractual obligations, we may be held responsible for security breaches, cyberattacks or other similar incidents attributed to our vendors as they relate to the information we share with them or to which we grant them access. A failure by third parties to comply with service level agreements or regulatory or legal requirements in a high-quality and timely manner, particularly during periods of our peak demand for their services, could result in economic and reputational harm to us. In addition, we face risks as we transition from in-house functions to third-party support functions and providers, or vice versa, that there may be disruptions in service or other unintended results that may adversely affect our business operations. These third parties face their own technology, operating, business, and economic risks, and any significant failures by them, including the improper use or disclosure of our confidential Client, Colleague, consumer, or Company information, could cause harm to our reputation. An interruption in or the cessation of service by any service provider as a result of systems failures, data breaches or other cybersecurity incidents, capacity constraints, financial difficulties, or for any other reason could disrupt our operations, impact our ability to offer certain products and services, and result in contractual or regulatory fines or penalties, liability claims from Clients, or Colleagues, damage to our reputation, and harm to our business.
We rely on a single vendor or a limited number of vendors to provide certain key products or services to us, and the inability of these key vendors to meet our needs could have a material adverse effect on our business.
Historically, we have contracted with and rely on a single vendor or a limited number of vendors to provide certain key products or services to us such as information technology support and billing systems. If these vendors are unable to meet our needs because they fail to perform adequately, are no longer in business, are experiencing shortages or supply chain issues or discontinue a certain product or service we need, our business, financial condition and results of operations may be adversely affected. By way of example, certain payment processing vendors of ours have in the past discontinued or threatened to discontinue, and may in the future discontinue or threaten to discontinue, certain payment processing products upon which we rely in certain parts of our business, which if executed upon could disrupt our ability to operate those certain parts of our business and/or could require us to make substantial additional investments to remediate.
While alternative sources for these products and services exist, in the event we are forced to rely on them, we may not be able to develop these alternative sources quickly and cost-effectively or at all, which could materially impair our ability to operate our business. Furthermore, our vendors may request changes in pricing, payment terms or other contractual obligations between the parties, which could require us to make substantial additional investments.
We have experienced significant growth in recent periods, and our recent growth rates may not be indicative of our future growth. As our costs increase, we may not be able to generate sufficient revenue to achieve and, if achieved, maintain profitability.
We have experienced significant revenue growth in recent periods. In future periods, we may not be able to sustain revenue growth consistent with recent history, or at all. We believe our revenue growth depends on a number of factors, including, but not limited to, our ability to:
•attract new Clients, successfully deploy and implement our products, obtain Client renewals and provide our Clients with excellent Client support;
•increase our network of Insurance Company Partners and the profit-sharing, override and/or contingent commissions that we earn from such Insurance Company Partners;
•adequately expand, train, integrate and retain our Colleagues, including our executive officers and senior leaders, and maintain or increase our sales force’s productivity;
•improve our internal control over financial reporting and disclosure controls and procedures to ensure timely and accurate reporting of our operational and financial results;
26
•successfully introduce new products and enhance existing products;
•successfully deploy information technology assets for use by our Colleagues and interaction with our Clients and Insurance Company Partners;
•adapt to the ever-changing regulatory and legal landscape;
•protect sensitive, personal and confidential information and data within BRP’s custody from third party bad actors;
•successfully identify and acquire new Partners;
•successfully integrate Partnerships into the Company in an operationally efficient manner;
•service our existing indebtedness;
•access the capital markets or otherwise obtain access to capital to satisfy future needs of the Company;
•successfully introduce our products to new markets and geographies; and
•successfully compete against larger companies and new market entrants.
We may not successfully accomplish any of these objectives and ongoing macroeconomic and geopolitical uncertainty may impact our ability to successfully accomplish any of the above, and as a result, it is difficult for us to forecast our future results of operations. Our historical growth rate should not be considered indicative of our future performance and may decline in the future. In future periods, our revenue could grow more slowly than in recent periods or decline for any number of reasons, including those outlined above. If our revenue or revenue growth rates decline, investors’ perceptions of our business may be adversely affected and the market price of common stock could decline.
Certain of our results of operations and financial metrics may be difficult to predict as a result of seasonality.
We have presented, and may continue to present, certain non-GAAP financial measures, such as Adjusted EBITDA and Adjusted EBITDA Margin, in filings with the SEC and other public statements. Any failure to accurately report and present our non-GAAP financial measures could cause us to fail to meet our reporting obligations and could cause investors to lose confidence in our reported financial and other information, which would likely have a negative effect on the trading price of our stock.
The insurance brokerage market is seasonal and our results of operations are somewhat affected by seasonal trends. Our Adjusted EBITDA and Adjusted EBITDA Margins are typically highest in the first quarter and lowest in the fourth quarter. This variation is primarily due to fluctuations in our revenue, while overhead remains consistent throughout the year. Our revenues are generally highest in the first quarter due to the impact of contingent commission payments received in the first quarter from Insurance Company Partners that we cannot readily estimate before receipt without the risk of significant reversal and a higher degree of first quarter policy commencements and renewals in certain IAS and MIS lines of business such as employee benefits, commercial and Medicare. In addition, a higher proportion of our first quarter revenue is derived from our highest margin businesses.
Partnerships can significantly impact Adjusted EBITDA and Adjusted EBITDA Margins in a given year and may increase the amount of seasonality within the business, especially results attributable to Partnerships that have not been fully integrated into our business or owned by us for a full year.
Damage to our reputation could have a material adverse effect on our business.
Our reputation is one of our key assets. We advise our Clients on and provide services related to a wide range of subjects and our ability to attract and retain Clients depends greatly on the external perceptions of our level of service, trustworthiness, business practices, financial condition and other subjective qualities. If a Client is not satisfied with our services, it could cause us to incur additional costs and impair profitability or lose the Client relationship altogether, which may negatively impact other Clients’ perception regarding us. Our success is also dependent on maintaining a good reputation with existing and potential Colleagues, investors, Insurance Company Partners, vendors, regulators and the communities in which we operate. Negative perceptions or publicity regarding these or other matters, including our association with Clients or business partners who themselves have a damaged reputation, or from actual or alleged conduct by us or our Colleagues, could damage our reputation. Any of these matters could have a material adverse effect on our business, financial condition and results of operations.
27
Increasing scrutiny and changing expectations from investors, Clients and our Colleagues with respect to our environmental, social and governance (“ESG”) practices may impose additional costs on us or expose us to new or additional risks.
There is increased focus, including from governmental organizations, investors, employees and Clients, on ESG issues such as environmental stewardship, climate change, diversity and inclusion, pay equity, racial justice, workplace conduct and cybersecurity and data privacy. There can be no certainty that we will manage such issues successfully, or that we will successfully meet society’s expectations as to our proper role. Negative public perception, adverse publicity or negative comments in social media, including as a result of actions taken by companies we acquire before the acquisition, could damage our reputation, or harm our relationships with investors, other stakeholders, regulators and the communities in which we operate, if we do not, or are not perceived to, adequately address these issues. Any harm to our reputation could impact Colleague engagement and retention and the willingness of Clients and Insurance Company Partners to do business with us.
A variety of organizations have developed ratings to measure the performance of companies on ESG topics, and the results of these assessments are widely publicized. Investments in funds that specialize in companies that perform well in such assessments are increasingly popular, and major institutional investors have publicly emphasized the importance of such ESG measures to their investment decisions. Unfavorable ratings of BRP Group or our industry, as well as omission of inclusion of our stock into ESG-oriented investment funds may lead to negative investor sentiment and the diversion of investment to other companies or industries, which could have a negative impact on our stock price.
The provision of advisory services to Clients with respect to captive insurance, and specifically, utilization of an 831(b) election, is subject to numerous, complex and frequently changing laws, regulations and governmental interpretations of the same, and non-compliance or changes in laws and regulations or governmental interpretations of the same, could harm our business, results of operations and financial condition.
We have an advisory services business that assists certain Clients with establishment of captive insurance companies, for their own purposes, which leverage the benefits of Section 831(b) of the Internal Revenue Code of 1986, as amended, and which are subject to audit and oversight from the Internal Revenue Service (“IRS”). The IRS has conducted investigations, and may be conducting investigations, of certain peers of ours that also provide similar services, with respect to whether or not such third parties are acting as a tax shelter promoter in connection with those operations. We have no reason to believe that we have been or are currently a target of any such investigation. If the IRS were to disallow 831(b) elections, modify its guidance around 831(b) elections, or otherwise investigate our business and conclude that we are a tax shelter promoter, such actions, whether or not merited, could harm our business, results of operations and financial condition.
If we fail to manage future growth effectively, our business could be materially adversely affected.
We have experienced rapid growth. This growth has placed significant demands on management and our operational infrastructure. As we continue to grow, we must effectively integrate, develop and motivate a large number of new Colleagues, while maintaining the beneficial aspects of our Company culture. If we do not manage the growth of our business and operations effectively, the quality of our services and efficiency of our operations could suffer and we may not be able to execute on our business plan, which could harm our brand, results of operations and overall business.
Our corporate culture has contributed to our success, and if we cannot maintain this culture, or if we experience a change in management, management philosophy or business strategy, our business may be harmed.
We believe that a significant contributor to our success has been our entrepreneurial and sales-oriented culture, as outlined in the Azimuth, our corporate constitution. As we grow, including from the integration of Colleagues and businesses acquired in connection with previous or future Partnerships, we may find it difficult to maintain important aspects of our corporate culture, which could negatively affect our profitability or our ability to retain and recruit people of the highest integrity and quality who are essential to our future success. We may face pressure to change our culture as we grow, particularly if we experience difficulties in attracting competent personnel who are willing to embrace our culture. In addition, as our organization grows and we are required to implement more complex organizational structures, or if we experience a change in management, management philosophy or business strategy, we may find it increasingly difficult to maintain the beneficial aspects of our corporate culture, which could negatively impact our future success.
28
Our results may be adversely affected by changes in the mode of compensation in the insurance industry.
In the past, state regulators have scrutinized the manner in which insurance brokers are compensated. For example, the Attorney General of the State of New York brought charges against members of the insurance brokerage community. These actions have created uncertainty concerning longstanding methods of compensating insurance brokers. Given that the insurance brokerage industry has faced scrutiny from regulators in the past over its compensation practices, and the transparency and discourse to Clients regarding brokers’ compensation, it is possible that regulators may choose to revisit the same or other practices in the future. If they do so, compliance with new regulations along with any sanctions that might be imposed for past practices deemed improper could have an adverse impact on our future results of operations and inflict significant reputational harm on our business.
Climate risks, risks associated with the physical effects of climate events, and risks associated with governmental responses to climate risks, could adversely affect our business, results of operations and financial condition.
The effects of climate events continue to create an alarming level of concern. The U.S. Congress, state legislatures and federal and state regulatory agencies continue to propose numerous initiatives to supplement the global effort to address climate and climate-related events. If new legislation or regulation is enacted, we could incur increased costs and capital expenditures to comply with its limitations, which may impact our financial condition and operating performance.
In addition, the U.S. Federal Reserve recently identified the climate as a systemic risk to the economy. It also reported that a gradual change in investor sentiment regarding climate risk introduces the possibility of abrupt tipping points or significant swings in sentiment, which could create unpredictable follow-on effects in financial markets. If this occurred, not only would we be negatively impacted by the general economic decline, but a drop in the stock market affecting our stock price could negatively impact our ability to grow through mergers and acquisitions financed using our common stock.
The transition to a low-carbon economy could harm specific industries or sectors such as oil and gas in ways that could impact our business. Our Clients in certain industries may be more adversely affected by climate events and could go out of business or have reduced needs for insurance-related services, which could adversely impact our revenues. Negative publicity arising from our association with Clients in disfavored businesses or industries, or the perception that we are not sufficiently focused on climate risks, could damage our reputation with investors, Clients, Colleagues and regulators. In addition, the transition to a low-carbon economy could give rise to the need for innovative insurance and risk management solutions for entirely new industries and companies, as well as advice and services to bolster climate resilience for existing companies. If we fail to innovate in response to these changes, we could lose market share to our competitors or new market entrants that do.
Moreover, if our Insurance Company Partners fail or withdraw from offering certain lines of coverage because of large payouts related to climate events, overall risk-taking capital capacity could be negatively affected, which could reduce our ability to place certain lines of coverage and, as a result, reduce our revenues and profitability.
Furthermore, climate events may pose physical risks to our business, such as the frequency and intensity of unfavorable weather conditions, such as fires, hurricanes, tornadoes, drought, water shortages, rainfall, unseasonably warm. Overall, climate events, their effects and the resulting, unknown impact could have a material adverse effect on our financial condition and results of operations.
Risks Relating to Legal, Compliance and Regulatory Matters
E&O claims against us, and other incidents, claims, risks, exposures and/or liabilities that require us to make claims against our insurance policies, may negatively affect our business, financial condition and results of operations.
We have significant insurance agency and brokerage operations, and are subject to claims and litigation in the ordinary course of business resulting from alleged and actual E&O in placing insurance and rendering coverage advice. In addition, many of our Colleagues regularly interact with Clients and prospective Clients in the field, which increases the risks of property and casualty claims arising from such interactions. Further, many of our office locations are in jurisdictions (such as California, Texas and Florida) that see higher incidents of climate events (such as hurricanes, other aggressive weather patterns and earthquakes). Dealing with any of these activities can involve the expenditure of substantial amounts of money. Since E&O claims against us may allege our liability for all or part of the amounts in question, claimants may seek large damage awards. These claims can involve significant defense costs. E&O could include failure to, whether negligently or intentionally, place coverage on behalf of Clients, provide our Insurance Company Partners with complete and accurate information relating to the risks being insured or appropriately apply funds that we hold on a fiduciary basis. It is not always possible to prevent or detect E&O and other types of claims, and the precautions we take may not be effective in all cases.
29
We have E&O insurance coverage to protect against the risk of liability resulting from our alleged and actual E&O. We also maintain a variety of other property and casualty policies of insurance providing varying degrees of protection against loss and damage to our property and liability for certain conduct of our Colleagues. Prices for these policies of insurance and the scope and limits of the coverage terms available depend on our claims history as well as market conditions that are outside of our control. While we endeavor to purchase coverage that is appropriate to our assessment of our risk, we are unable to predict with certainty the frequency, nature or magnitude of claims for direct or consequential damages or whether our policies of insurance will cover such claims.
In establishing liabilities for claims, we utilize case level reviews by outside counsel and an internal analysis to estimate potential losses. The liability is reviewed annually and adjusted as developments warrant. Given the unpredictability of E&O and other claims and of litigation that could flow from them, it is possible that an adverse outcome in a particular matter could have a material adverse effect on our results of operations, financial condition or cash flow in a given quarterly or annual period.
Non-compliance with or changes in laws, regulations or licensing requirements applicable to us could restrict our ability to conduct our business and/or could adversely affect our business, financial condition and results of operations.
The industry in which we operate is subject to extensive regulation. We are subject to regulation and supervision both federally and in each applicable local jurisdiction. In general, these regulations are designed to protect Clients and the insured and to protect the integrity of the financial markets, rather than to protect stockholders or creditors. Our ability to conduct business in these jurisdictions depends on our compliance with the rules and regulations, including securities laws, promulgated by federal, state and other regulatory and self-regulatory authorities. Failure to comply with regulatory requirements, or changes in regulatory requirements or interpretations, could result in actions by regulators, potentially leading to fines and penalties, adverse publicity and damage to our reputation in the marketplace. There can be no assurance that we will be able to adapt effectively to any changes in law. Furthermore, in some areas of our business, we act on the basis of our own or the industry's interpretations of applicable laws or regulations, which may conflict from state to state. In the event those interpretations eventually prove different from the interpretations of regulatory authorities, we may be penalized. In extreme cases, revocation of a subsidiary’s authority to do business in one or more jurisdictions could result from failure to comply with regulatory requirements. Due to the complexity, periodic modification and differing interpretations of state insurance laws and regulations, we may not have always been, and we may not always be, in compliance with them. In addition, we could face lawsuits by Clients, the insured and other parties for alleged violations of certain of these laws and regulations. It is difficult to predict whether changes resulting from new laws and regulations, as well as changes in interpretation of current laws and regulations, will affect the industry or our business and, if so, to what degree.
Colleagues and principals who engage in the solicitation, negotiation or sale of insurance, or provide certain other insurance services, generally are required to be licensed individually. Insurance and laws and regulations govern whether licensees may share commissions with unlicensed entities and individuals. We believe that any payments we make to third parties are in compliance with applicable laws. However, should any regulatory agency take a contrary position and prevail, we will be required to change the manner in which we pay fees to such Colleagues or principals or require entities receiving such payments to become registered or licensed.
State insurance laws grant supervisory agencies, including state departments of insurance, departments of financials services, and similar regulatory authorities, broad administrative authority. State insurance regulators and the National Association of Insurance Commissioners continually review existing laws and regulations, some of which affect our business. These supervisory agencies regulate many aspects of the insurance business, including, the licensing of insurance brokers and agents and other insurance intermediaries, the handling of third-party funds held in a fiduciary capacity and trade practices, such as marketing, advertising and compensation arrangements entered into by insurance brokers and agents. This legal and regulatory oversight could reduce our profitability or limit our growth by increasing the costs of legal and regulatory compliance, and by limiting or restricting the products or services we sell, the markets we serve or enter, the methods by which we sell our products and services, and the form of compensation we can accept from our Clients, Insurance Company Partners and third parties. Moreover, in response to perceived excessive cost or inadequacy of available insurance, states have from time to time created state insurance funds and assigned risk pools, which compete directly, on a subsidized basis, with private insurance providers.
Federal, state and other regulatory and self-regulatory authorities have focused on, and continue to devote substantial attention to, the insurance industry as well as to the sale of products or services to seniors. Regulatory review or the issuance of interpretations of existing laws and regulations may result in the enactment of new laws and regulations that could adversely affect our operations or our ability to conduct business profitably. We are unable to predict whether any such laws or regulations will be enacted and to what extent such laws and regulations would affect our business.
30
Other legislative developments that could adversely affect us include: changes in our business compensation model as a result of regulatory developments (for example, the Patient Protection and Affordable Care Act), and federal and state governments establishing programs to provide health insurance or other alternative market types of coverage, that compete with, or completely replace, insurance products offered by insurance carriers. Also, as climate risk issues become more prevalent, the U.S. is beginning to respond to these issues. This increasing governmental focus on climate risks may result in new environmental regulations that cause us to incur additional compliance costs, which may adversely impact our results of operations and financial condition.
An increasing quantity of state legislatures and judiciaries, as well as the Federal Trade Commission, have begun promulgating laws, orders and regulations that reflect a shifting sentiment against the enforceability of certain types of restrictive covenant agreements, including non-compete agreements and non-solicitation agreements, that are core to our business. The further promulgation of such laws, orders and regulations could adversely affect our operations or our ability to conduct business profitably. We are unable to predict whether any such laws, orders or regulations will be enacted, and if enacted, enforceable, and to what extent such laws and regulations would affect our business.
Proposed tort reform legislation, if enacted, could decrease demand for casualty insurance, thereby reducing our commission revenues.
Legislation concerning tort reform has been considered, from time to time, in the United States Congress and in several state legislatures. Among the provisions considered in such legislation have been limitations on damage awards, including punitive damages, and various restrictions applicable to class action lawsuits. Enactment of these or similar provisions by Congress, or by states in which we sell insurance, could reduce the demand for casualty insurance policies or lead to a decrease in policy limits of such policies sold, thereby reducing our commission revenues.
Regulations affecting Insurance Company Partners with which we place insurance affect how we conduct our operations.
Our Insurance Company Partners are also regulated by state departments of insurance for solvency and other issues and are subject to reserve requirements. We cannot guarantee that all Insurance Company Partners with which we do business comply with regulations instituted by state departments of insurance. We may need to expend resources to address questions or concerns regarding our relationships with these Insurance Company Partners, which diverts management resources away from business operations.
Our business is subject to risks related to legal proceedings, regulatory investigations, and governmental inquiries and actions.
We are subject to litigation, regulatory investigations and claims arising in the ordinary course of our business operations. The risks associated with these matters often may be difficult to assess or quantify and the existence and magnitude of potential claims often remain unknown for substantial periods of time. While we have insurance coverage for some of these potential claims, others may not be covered by insurance, insurers may dispute coverage or any ultimate liabilities may exceed our coverage. We may be subject to actions and claims relating to the sale, solicitation and negotiation of insurance, including the suitability of such products and services, as well as denials of coverage from our Insurance Company Partners. Actions and claims may result in the rescission of such sales; consequently, our Insurance Company Partners may seek to recoup commissions paid to us, which may lead to legal action against us. The outcome of such actions cannot be predicted and such claims or actions could have a material adverse effect on our business, financial condition and results of operations.
We are subject to laws and regulations, as well as regulatory investigations. The insurance industry has been subject to a significant level of scrutiny by various regulatory bodies, including state Attorneys General offices and state departments of insurance, concerning certain practices within the insurance industry. These practices include, without limitation, the receipt of contingent commissions by insurance brokers and agents from insurance companies and the extent to which such compensation has been disclosed, the collection of agency fees, which we define as fees separate from commissions charged directly to Clients for efforts performed in the issuance of new insurance policies, bid rigging and related matters. From time to time, our subsidiaries receive informational requests from governmental authorities.
There have been a number of revisions to existing, or proposals to modify or enact new, laws and regulations regarding insurance agents and brokers. These actions have imposed or could impose additional obligations on us with respect to our products sold. Some insurance companies have agreed with regulatory authorities to end the payment of contingent commissions on insurance products, which could impact our commissions that are based on the volume, consistency and profitability of business generated by us.
31
We cannot predict the impact that any new laws, rules or regulations may have on our business, financial condition and results of operations. Given the current regulatory environment and the number of our subsidiaries operating in local markets throughout the country, it is possible that we will become subject to further governmental inquiries and subpoenas and have lawsuits filed against us. Regulators may raise issues during investigations, examinations or audits that could, if determined adversely, have a material impact on us. The interpretations of regulations by regulators may change and statutes may be enacted with retroactive impact. We could also be materially adversely affected by any new industry-wide regulations or practices that may result from these proceedings.
Our involvement in any investigations and lawsuits would cause us to incur additional legal and other costs and, if we were found to have violated any laws, we could be required to pay fines, damages and other costs, perhaps in material amounts. Regardless of final costs, these matters could have a material adverse effect on us by exposing us to negative publicity, reputational damage, harm to client relationships or diversion of personnel and management resources.
In addition, we may from time to time be subject to certain litigation brought by one or more of our stockholders. The outcome of any such litigation, particularly class action lawsuits, is difficult to assess or quantify. Plaintiffs in these types of lawsuits may seek recovery of very large or indeterminate amounts, and the magnitude of the potential loss relating to such lawsuits, including the possibility of having attorney’s fees awarded, may remain unknown for substantial periods of time. The cost to defend such litigation may be significant. There may also be adverse publicity associated with litigation, regardless of whether the allegations are valid or whether we are ultimately found liable. As a result, litigation may materially adversely affect our businesses, financial condition and results of operations.
The marketing and sale of Medicare plans are subject to numerous, complex and frequently changing laws and regulations, and non-compliance or changes in laws and regulations could harm our business, results of operations and financial condition.
The marketing and sale of Medicare plans are subject to numerous laws, regulations and guidelines at the federal and state level. The marketing and sale of Medicare Advantage and Medicare Part D prescription drug plans are principally regulated by CMS. The marketing and sale of Medicare Supplement plans are principally regulated on a state-by-state basis by state departments of insurance. The laws and regulations applicable to the marketing and sale of Medicare plans are numerous, ambiguous and complex, and, particularly with respect to regulations and guidance issued by CMS for Medicare Advantage and Medicare Part D prescription drug plans, change frequently. The telephone calls on which we enroll individuals into Medicare Advantage and Medicare Part D prescription drug plans are required to be recorded. Health insurance companies audit these recordings for compliance and listen to them in connection with their investigation of complaints. In addition, Medicare eligible individuals may receive a special election period and the ability to change Medicare Advantage and Medicare Part D prescription drug plans outside the Medicare annual enrollment period in the event that the sale of the plan was not in accordance with CMS rules and guidelines. Given CMS’s scrutiny of Medicare product health insurance companies and the responsibility of the Insurance Company Partners for actions that we take, Insurance Company Partners may terminate our relationship with them or take other corrective action if our Medicare product sales, marketing and operations are not in compliance or give rise to too many complaints. The termination of our relationship with Insurance Company Partners for this reason would reduce the products we are able to offer, could result in the loss of commissions for past and future sales and would otherwise harm our business, results of operations and financial condition.
As a result of the laws, regulations and guidelines relating to the sale of Medicare plans, we have altered, and likely will have to continue to alter, our websites and sales process to comply with several requirements that are not applicable to our sale of non-Medicare-related health insurance plans. For instance, many aspects of our online platforms and our marketing material and processes, as well as changes to these platforms, materials and processes, including call center scripts, must be filed on a regular basis with CMS and reviewed and approved by health insurance companies in light of CMS requirements. In addition, certain aspects of our Medicare plan marketing partner relationships have been in the past, and will be in the future, subjected to CMS and health insurance company review. Changes to the laws, regulations and guidelines relating to Medicare plans, their interpretation or the manner in which they are enforced could be incompatible with these relationships, our platforms or our sale of Medicare plans, which could harm our business, results of operations and financial condition.
Due to changes in CMS guidance or enforcement or interpretation of existing guidance applicable to our marketing and sale of Medicare products, or as a result of new laws, regulations and guidelines, CMS, state departments of insurance or Insurance Company Partners may determine to object to or not to approve aspects of our online platforms or marketing material and processes and may determine that certain existing aspects of our Medicare-related business are not in compliance. As a result, the progress of our Medicare operations could be slowed or we could be prevented from operating aspects of our Medicare commissions and fees generating activities altogether, which would harm our business, results of operations and financial condition, particularly if it occurred during the Medicare annual enrollment period.
32
We have received, and may in the future receive, inquiries from CMS or state departments of insurance regarding our marketing and business practices and compliance with laws and regulations. Inquiries and proceedings initiated by the government could adversely impact our health insurance licenses, require us to pay fines, require us to modify marketing and business practices, result in litigation and otherwise harm our business, operating results or financial condition.
In May 2021, CMS changed its process for the submission and approval of marketing materials related to Medicare Advantage and Medicare Part D prescription drug plans. The practical application of the previous process allowed for a lead carrier to handle most of the review and filing of Medicare plan marketing materials with CMS. The new process requires each carrier to approve of each filed marketing material and has resulted in a more complicated and time consuming process to get our marketing material filed with CMS and through the process with carriers. In October 2021, CMS issued new guidance that significantly broadens the types of marketing materials that we are required to file with CMS, including the requirement to file certain generic marketing materials that refer to the benefits or costs of Medicare Advantage or Medicare Part D prescription drug plans but that do not specifically mention a health insurance carrier's name or a specific plan. As a result, we now submit to each Medicare Advantage and Medicare Part D prescription drug plan carrier with which we have a relationship a significantly larger number of marketing materials than we have in the past. We may not be able to use certain of our marketing materials and implement our marketing programs effectively if CMS or an Insurance Company Partner has comments or disapproves of our marketing materials. If we do not timely file the additional marketing materials with CMS, if Insurance Company Partners do not adapt to the new CMS requirements or increase the efficiency with which they review our marketing material, or if we or our marketing partners are not successful in timely receiving Insurance Company Partner or CMS approval of our marketing materials, it could harm our sales and also harm our ability to efficiently change and implement new or existing marketing material, including call center scripts and our websites, which could impact negatively in our business, operating results and financial condition, particularly if such delay or non-compliance occurs during the Medicare annual enrollment period.
Efforts to reduce healthcare costs and alter healthcare financing practices could adversely affect our business.
The U.S. healthcare industry is subject to increased governmental regulation at both the federal and state levels. Certain proposals have been made at the federal and state government levels in an effort to control healthcare costs, including proposing to lower reimbursement under the Medicare program. These proposals include “single payor” government funded healthcare and price controls on prescription drugs. If these or similar efforts are successful, our business and operations could be materially adversely affected. In addition, changing political, economic and regulatory influences may affect healthcare financing and reimbursement practices. If the current healthcare financing and reimbursement system changes significantly, our business could be materially adversely affected. Congress periodically considers proposals to reform the U.S. healthcare system such as the Patient Protection and Affordable Care Act and the Health Care and Education Reconciliation Act in 2010. Our Insurance Company Partners may react to these proposals and the uncertainty surrounding them by reducing or delaying purchases of services that we provide. We cannot predict what effect, if any, these proposals may have on our business. Other legislative or market-driven changes in the healthcare system that we cannot anticipate could also materially adversely affect our consolidated results of operations, consolidated financial position or consolidated cash flow from operations.
Risks Relating to Intellectual Property and Cybersecurity
Our business depends on information processing systems. Data breaches or other security incidents with respect to our or our vendors' information processing systems may hurt our business, financial condition and results of operations.
Our ability to provide insurance services to Clients and to create and maintain comprehensive tracking and reporting of Client accounts depends on our capacity to collect, store, retrieve and otherwise process data, manage significant databases and expand and periodically upgrade our information processing capabilities. As our operations evolve, we will need to continue to make investments in new and enhanced information systems. Additionally, as our information system providers revise and upgrade their hardware, software and equipment technology, we may encounter difficulties integrating these new technologies into our business. Interruption or loss of our information processing capabilities or adverse consequences from implementing new or enhanced systems could have a material adverse effect on our business, financial condition and results of operations.
33
In the course of providing financial services, we may electronically store, transmit or otherwise process personally identifiable information, such as social security numbers or credit card or bank information, of Clients or employees of Clients. Breaches in data security or infiltration of our network security by unauthorized persons could cause interruptions in operations and damage to our reputation, among other adverse impacts. While we maintain policies, procedures and technological safeguards designed to protect the security and privacy of this information, we cannot entirely eliminate the risk of, and have in the past experienced, improper access to or disclosure of personally identifiable information and related costs to mitigate the consequences from such events. Privacy laws, rules and regulations are matters of growing public concern and are continuously changing in the states in which we operate. The failure to adhere to or successfully implement procedures to respond to these laws, rules and regulations could result in legal liability or impairment to our reputation.
Further, despite security measures we and our vendors take, our systems and those of our vendors may be vulnerable to physical break-ins, unauthorized access, viruses or other disruptive problems. As we continue to expand our business through Partnerships, we may be exposed to increased vulnerability to data breaches, cybersecurity attacks and other security incidents during the integration of information systems. If our systems or facilities were infiltrated or damaged, our Clients could experience data loss, financial loss and significant business interruption leading to a material adverse effect on our business, financial condition and results of operations. We may be required to expend significant additional resources to modify protective measures, to investigate and remediate vulnerabilities or other exposures or to make required notifications.
Our business depends on a strong brand, and any failure to maintain, protect, defend and enhance our brand would hurt our ability to grow our business, particularly in new markets where we have limited brand recognition.
We have developed, and will continue to develop, a strong brand that we believe has contributed significantly to the success of our business. Maintaining, protecting and enhancing those brands is critical to growing our business, particularly in new markets where we have limited brand recognition. If we do not successfully build and maintain a strong brand, our business could be materially harmed. Maintaining and enhancing the quality of our brand may require us to make substantial investments in areas such as marketing, community relations, outreach and employee training. We actively engage in advertisements, targeted promotional mailings and email communications, and engage on a regular basis in public relations and sponsorship activities. These investments may be substantial and may fail to encompass the optimal range of traditional, online and social advertising media to achieve maximum exposure and benefit to our brand. Moreover, our brand promotion activities may not generate brand awareness or yield increased revenue and, even if they do, any increased revenue may not offset the expenses we incur in building our brand. If we fail to successfully promote and maintain our brand or incur substantial expenses in an unsuccessful attempt to promote and maintain our brand, we may fail to attract new Clients or retain our existing Clients to the extent necessary to realize a sufficient return on our brand-building efforts.
We believe that our portfolio of trademarks (some of which are pending registration) have significant value and that these and other intellectual property are valuable assets that are critical to our success. Unauthorized uses or other infringement, misappropriation or violation of our trademarks, service marks or other intellectual property could diminish the value of our brand and may adversely affect our business. Effective intellectual property protection may not be available in every market in which we operate. Moreover, the laws of some countries do not protect intellectual property and proprietary rights to the same extent as the laws of the United States, and mechanisms for enforcement of intellectual property rights in some foreign countries may be inadequate. Additionally, we cannot guarantee that future trademark registrations for pending or future applications will issue, or that any registered trademarks will be enforceable or provide adequate protection of our intellectual property and other proprietary rights. The United States Patent and Trademark Office and various foreign trademark offices also require compliance with a number of procedural, documentary, fee payment and other similar provisions during the trademark registration process and after a registration has issued. There are situations in which noncompliance can result in abandonment or cancellation of a trademark filing, resulting in partial or complete loss of trademark rights in the relevant jurisdiction. If this occurs, our competitors might be able to enter the market under identical or similar brands.
Failure to adequately protect our intellectual property rights could damage our brand and impair our ability to compete effectively. Even where we have effectively secured statutory protection for our trademarks and other intellectual property, our competitors and other third parties may infringe, misappropriate or otherwise violate our intellectual property. In the course of litigation, or as a preventative measure, such competitors and other third parties may attempt to challenge the scope of our rights or invalidate our intellectual property. If such challenges were to be successful, it could limit our ability to prevent others from using similar marks or designs may ultimately result in a reduced distinctiveness of our brand in the minds of consumers. Defending or enforcing our trademark rights, branding practices and other intellectual property could result in the expenditure of significant resources and divert the attention of management, which in turn may materially and adversely affect our business and results of operations, even if such defense or enforcement is ultimately successful.
34
Failure to obtain, maintain, protect, defend or enforce our intellectual property rights, or allegations that we have infringed, misappropriated or otherwise violated the intellectual property rights of others, could harm our reputation, ability to compete effectively, business, financial condition and results of operations.
Our success and ability to compete depends in part on our ability to obtain, maintain, protect, defend and enforce our intellectual property. To protect our intellectual property rights, we rely on a combination of trademark and copyright laws in the United States and certain other jurisdictions (whether via international convention, treaty or otherwise), trade secret protection, confidentiality agreements and other contractual arrangements with our affiliates, Colleagues, Clients, Partners and others. However, such measures provide only limited protection and the steps that we take to protect our intellectual property may be inadequate to deter infringement, misappropriation or other violation of our intellectual property or proprietary information. Policing unauthorized use of our intellectual property is difficult, expensive and time-consuming, particularly in countries where the laws may not be as protective of intellectual property rights as those in the United States and where mechanisms for enforcement of intellectual property rights may be weak. We may be required to spend significant resources to monitor and protect our intellectual property rights. In addition, we may be unable to detect the unauthorized use of our intellectual property rights.
Failure to protect our intellectual property adequately could harm our reputation and affect our ability to compete effectively. In addition, even if we initiate litigation against third parties, such as suits alleging infringement, misappropriation or other violation of our intellectual property, we may not prevail. Litigation brought to protect and enforce our intellectual property rights could be costly, time-consuming and distracting to management. Our efforts to enforce our intellectual property rights may be met with defenses, counterclaims and countersuits attacking the validity and enforceability of our intellectual property rights. Additionally, because of the substantial amount of discovery required in connection with intellectual property litigation, there is a risk that some of our confidential information could be compromised by disclosure during this type of litigation. An adverse determination of any litigation proceedings could put our intellectual property at risk of being invalidated or interpreted narrowly and could put our related intellectual property at risk of not issuing or being cancelled. There could also be public announcements of the results of hearings, motions, or other interim proceedings or developments. If securities analysts or investors perceive these results to be negative, it could have a material adverse effect on the price of our common stock. Any of the foregoing could adversely affect our business, financial condition and results of operations.
Meanwhile, third parties may assert intellectual property-related claims against us, including claims of infringement, misappropriation or other violation of their intellectual property, which may be costly to defend, could require the payment of damages, legal fees, settlement payments, royalty payments and other costs or damages, including treble damages if we are found to have willfully infringed, and could limit our ability to use or offer certain technologies, products or other intellectual property. Any intellectual property claims, with or without merit, could be expensive, take significant time and divert management’s resources, time and attention from other business concerns. Moreover, other companies, including our competitors, may have the capability to dedicate substantially greater resources to enforce their intellectual property rights and to defend claims that may be brought against them. Successful challenges against us could require us to modify or discontinue our use of technology or business processes where such use is found to infringe, misappropriate or otherwise violate the rights of others, or require us to purchase costly licenses from third parties, which may not be available on commercially reasonable terms, or at all. Even if a license is available to us, it could be non-exclusive thereby giving our competitors and other third parties access to the same technologies licensed to us, and we may be required to pay significant upfront fees, milestone payments or royalties, which would increase our operating expenses. Any of the foregoing could adversely affect our business, financial condition and results of operations.
Improper disclosure of confidential, personal or proprietary information, whether due to human error, misuse of information by Colleagues, contractors, vendors or third party bad actors, or as a result of cyberattacks or other security incidents with respect to our or our vendors’ systems, tools, information, processes or services, or failure to comply with applicable laws, rules, regulations, orders, industry standards and contractual obligations regarding data privacy, security and/or cybersecurity, could result in regulatory scrutiny, legal and financial liability, reputational harm, lost revenue, and remediation costs, and could have an adverse effect on our business and/or operations.
We maintain confidential, personal and proprietary information relating to our Company, our Colleagues, our Insurance Company Partners, our vendors and our actual and prospective Clients. This information could include personally identifiable information, protected health information, such as information regarding the medical history of Clients, financial information, and other categories of sensitive or protected information. We are subject to laws, rules, regulations, orders, industry standards, contractual obligations and other legal obligations relating to the collection, use, retention, security, transfer, storage, disposition and other processing of this information. These requirements may also apply to transfers of information among our affiliates, as well as to transactions we enter into with unaffiliated third-parties.
35
Cybersecurity risks have significantly increased in recent years, in part, because of the proliferation of new technologies, the use of the internet and telecommunications technologies to exchange information and conduct transactions, and the increased sophistication and activities of computer hackers, organized crime, terrorists, and other external parties, including foreign state actors. We have in the past and may in the future be subject to cyberattacks. These cyberattacks could include computer viruses, malicious or destructive code, phishing attacks, social engineering attacks, denial of service or information, improper access by employees or third-party partners or other security breaches that have or could in the future result in the unauthorized release, gathering, monitoring, misuse, loss or destruction of our confidential, proprietary, personal, and other information concerning Colleagues, Clients, Insurance Company Partners, vendors or consumers, or otherwise materially disrupt our network access or business operations.
Cybersecurity breaches, cyberattacks and other similar incidents, including, among other things, computer viruses, denial of service or information attacks, ransomware attacks, credential stuffing, social engineering, human error, fraud, unauthorized parties gaining access to our information technology systems, malware infections, phishing campaigns and vulnerability exploit attempts could disrupt the security of our internal systems and business applications or those of our vendors and impair our ability to provide services to our Clients and protect the privacy of their data. Any such incidents may also compromise confidential business information, result in intellectual property or other confidential or proprietary information being lost or stolen, including Client, Colleague or Company data, which could harm our reputation, competitive position or otherwise adversely affect our business. Cyber threats are constantly evolving, which makes it more difficult to detect cybersecurity incidents, assess their severity or impact in a timely manner, and successfully defend against them. The hybrid and remote work environment is increasing the attack surface available to criminals, as more companies and individuals work remotely and otherwise work online. Consequently, the risk of a cybersecurity incident has increased, and as cybersecurity threats evolve, we may be required to expend significant additional resources to continue to modify or enhance our protective measures or to investigate or remediate any information security vulnerabilities, security breaches, cyberattacks or other similar incidents. We cannot provide assurances that our preventative efforts, or those of our vendors or service providers, will be successful, and we may not be able to anticipate all security breaches, cyberattacks or other similar incidents, detect or react to such incidents in a timely manner, implement guaranteed preventive measures against such incidents, or adequately remediate any such incident.
Although we maintain policies, procedures and technical safeguards designed to protect the security and privacy of confidential, personal and proprietary information, we cannot eliminate the risk of, and have in the past experienced, improper access to or disclosure of personally identifiable information and related costs to mitigate the consequences from such events. It is possible that the measures we implement, including our security controls over personal data and training of Colleagues on data security, may not prevent improper access to, disclosure of or misuse of confidential, personal or proprietary information. This could cause harm to our reputation, create legal exposure or subject us to liability under laws that protect personal data, resulting in increased costs or loss of commissions and fees. In addition, improper access to or disclosure of personal and proprietary information could occur in a target we acquire prior to the acquisition or as a result of actions taken prior to the acquisition or during the integration period. Even if we receive indemnification for such events (which may not be the cure), such events could cause harm to our reputation, create legal exposure or subject us to liability under laws that protect personal data.
The occurrence of any security breach, cyberattack or other similar incident with respect to our or our vendors’ systems, or our failure to make adequate or timely disclosures to the public, regulators, law enforcement agencies or affected individuals, as applicable, following any such event, could cause harm to our reputation, subject us to additional regulatory scrutiny, expose us to civil litigation, fines, damages or injunctions or subject us to liability under applicable data privacy, cybersecurity and other laws, rules and regulations, resulting in increased costs or loss of commissions and fees, any of which could have a material adverse effect on our business, financial condition and results of operations. Additionally, we cannot be certain that our insurance coverage will be adequate for cybersecurity liabilities actually incurred, that insurance will continue to be available to us on economically reasonable terms, or at all, or that our insurer will not deny coverage as to any future claim.
We are subject to complex and frequently changing laws, rules and regulations in the various jurisdictions in which we operate relating to the collection, use, retention, security, transfer, storage, disposition and other processing of personal information. For example, legislators in the United States have passed new and more robust cybersecurity legislation in light of the recent broad-based cyberattacks at a number of companies. These and similar initiatives around the country could increase the cost of developing, implementing or securing our networks, tools, systems and other information technology assets and require us to allocate more resources to improved technologies, adding to our information technology and compliance costs. Ensuring that our collection, use, retention, security, transfer, storage, disposition and other processing of personal information complies with applicable laws, regulations, rules and standards regarding data privacy and cybersecurity in relevant jurisdictions can increase operating costs, impact the development of new products or services, and reduce operational efficiency.
36
At the federal level, we are subject to, among other laws, rules and regulations, the GLBA, which requires financial institutions to, among other things, periodically disclose their privacy policies and practices relating to sharing personal information and, in some cases, enables retail customers to opt out of the sharing of certain personal information with unaffiliated third parties. The GLBA also requires financial institutions to implement an information security program that includes administrative, technical and physical safeguards to ensure the security and confidentiality of consumer records and information. We are also subject to the rules and regulations promulgated under the authority of the Federal Trade Commission, which regulates unfair or deceptive acts or practices, including with respect to data privacy and cybersecurity. Moreover, the United States Congress has recently considered, and is currently considering, various proposals for more comprehensive data privacy and cybersecurity legislation, to which we may be subject if passed. Data privacy and cybersecurity are also areas of increasing state legislative focus and we are, or may in the future become, subject to various state laws and regulations regarding data privacy and cybersecurity. For example, the California Consumer Protection Act of 2018 (the “CCPA”), which became effective on January 1, 2020, applies to for-profit businesses that conduct business in California and meet certain revenue or data collection thresholds. The CCPA gives California residents the right to, among other things, request disclosure of information collected about them and whether that information has been sold to others, request deletion of personal information (subject to certain exceptions), opt out of the sale of their personal information, and not be discriminated against for exercising these rights. The CCPA contains several exemptions, including an exemption applicable to personal information that is collected, processed, sold or disclosed pursuant to the GLBA. Further, effective in most material respects starting on January 1, 2023, the California Privacy Rights Act (“CPRA”) (which was passed via a ballot initiative as part of the November 2020 election) has significantly modified the CCPA, including by expanding California residents’ rights with respect to certain sensitive personal information. The CPRA also creates a new state agency which will be vested with authority to implement and enforce the CCPA and the CPRA. Other states where we do business, or may in the future do business, or from which we otherwise collect, or may in the future otherwise collect, personal information of residents have adopted or are considering adopting similar laws. For example, Virginia and Colorado have recently adopted comprehensive data privacy laws similar to the CCPA, which went into effect in January and July of 2023, respectively. In addition, laws in all 50 U.S. states generally require businesses to provide notice under certain circumstances to consumers whose personal information has been improperly accessed, disclosed or otherwise compromised as a result of a data breach. Certain state laws and regulations may be more stringent, broader in scope, or offer greater individual rights, with respect to personal information than federal or other state laws and regulations, and such laws and regulations may differ from each other, which may complicate compliance efforts and increase compliance costs. Aspects of the CCPA, the CPRA, and other federal and state laws and regulations relating to data privacy and cybersecurity, as well as their enforcement, remain unclear, and we may be required to modify our practices in an effort to comply with them.
Further, while we strive to publish and prominently display privacy policies that are accurate, comprehensive, and compliant with applicable laws, regulations, rules and industry standards, we cannot ensure that our privacy policies and other statements regarding our practices will be sufficient to protect us from claims, proceedings, liability or adverse publicity relating to data privacy or cybersecurity. Although we endeavor to comply with our privacy policies, we may at times fail to do so or be alleged to have failed to do so. The publication of our privacy policies and other documentation that provide promises and assurances about privacy, data protection and cybersecurity can subject us to potential federal or state action if they are found to be deceptive, unfair, or misrepresentative of our actual practices.
Any actual or perceived failure to adhere to, or successfully implement processes in response to, changing legal or regulatory requirements in this area or to comply with our privacy policies could result in legal liability, including litigation (including class actions), claims, proceedings, regulatory fines, penalties or other sanctions, governmental investigations, enforcement actions, the expenditure of substantial costs, time and other resources, damage to our reputation in the marketplace and other adverse impacts, any of which could have a material adverse effect on our business, financial condition and results of operations.
A failure or disruption of our operational processes or systems, whether due to technological error or human error or misconduct, could negatively impact our reputation, customers, clients, businesses or results of operations and financial condition.
We seek to maintain and develop new software or technology where appropriate to better serve our Clients. This includes developing new software, technology, and automated systems (including, but not limited to, billing systems) to support our insurance products. Notwithstanding these upgrades and the proliferation of technology and technology-based risk and control systems, our businesses ultimately rely on people as our greatest resource, and, from time to time, they have in the past and may in the future make mistakes or engage in violations of applicable policies, laws, rules or procedures that are not always caught immediately by our technological processes or by our controls and other procedures, which are intended to prevent and detect such errors or violations. We have in the past and in the future could experience operational incidents caused by human error due to failure to properly utilize software or technology or adhere to applicable policies and procedures, calculation errors, mistakes in addressing emails, errors in software or model development or implementation, or simple errors in judgment.
37
Operational incidents could result in financial losses as well as misappropriation, corruption, or loss of confidential Client specific information, including social security numbers, private health information, payment card numbers, or bank account information. Such an incident could significantly negatively impact our reputation, customers, clients, businesses or results of operations and financial condition. Cyber-related and other operational incidents can also result in legal and regulatory proceedings, fines, and other costs.
We rely on the availability and performance of information technology services provided by third parties.
While we maintain some of our critical information technology systems, we also depend on third-party service providers to provide important information technology services relating to, among other things, agency management services, sales and service support, network, device and event monitoring, cybersecurity, electronic communications and certain finance functions. If the service providers to which we outsource these functions do not perform effectively, we may not be able to achieve the expected cost savings and may have to incur additional costs to correct errors made by such service providers. Depending on the function involved, such errors may also lead to business disruption, processing inefficiencies, the loss of or damage to intellectual property through a security breach, the loss of sensitive, personal or confidential data through a security breach, or otherwise. While we and our third-party service providers have not experienced any significant disruption, failure or breach impacting our or their information technology systems, any such disruption, failure or breach could adversely affect our business, financial condition and results of operations.
Risks Relating to our Organizational Structure
We are a holding company with our principal asset being our 55% ownership interest in BRP, and our Pre-IPO LLC Members, whose interest in our business may be different from yours, have approval rights over certain transactions and actions taken by us or BRP.
We are a holding company, and our principal asset is our direct or indirect ownership of 55% of the outstanding LLC Units. We have no independent means of generating commissions and fees.
Further, we are a party to a Stockholders Agreement entered into in connection with the initial public offering with the Pre-IPO LLC Members. Pursuant to the terms of the Stockholders Agreement, so long as the Pre-IPO LLC Members and their permitted transferees (collectively, the “Holders”) beneficially own at least 10% of the aggregate number of outstanding shares of our common stock (the “Substantial Ownership Requirement”), the Holders have approval rights over certain transactions and actions taken by us and BRP, including:
•a merger, consolidation or sale of all or substantially all of the assets of BRP and its subsidiaries;
•any dissolution, liquidation or reorganization (including filing for bankruptcy) of BRP and its subsidiaries or any acquisition or disposition of any asset for consideration in excess of 5% of our and our subsidiaries' total assets on a consolidated basis;
•the incurrence, guarantee, assumption or refinancing of indebtedness, or grant of a security interest, in excess of 10% of total assets (or that would cause aggregate indebtedness or guarantees thereof to exceed 10% of total assets);
•the issuance of certain additional equity interests of the Company, BRP or any of their subsidiaries in an amount exceeding $10 million (other than pursuant to an equity incentive plan that has been approved by our board of directors);
•the establishment or amendment of any equity, purchase or bonus plan for the benefit of employees, consultants, officers or directors;
•any capital or other expenditure in excess of 5% of total assets;
•the declaration or payment of dividends on Class A common stock or distributions by BRP on LLC Units other than tax distributions as defined in the Amended LLC Agreement;
•changing the number of directors on our board of directors;
•hiring, termination or replacement of, establishment of compensation (including benefits) payable to, or making other significant decisions involving, our or BRP's senior management and key employees, including our Chief Executive Officer, including entry into or modification of employment agreements, adopting or modifying plans relating to any incentive securities or employee benefit plans or granting incentive securities or benefits under any existing plans;
•changing our or BRP’s jurisdiction of incorporation;
•changing the location of our or BRP’s headquarters;
38
•changing our or BRP’s name;
•changing our or BRP’s fiscal year;
•changing our public accounting firm;
•amendments to our or BRP’s governing documents; and
•adopting a shareholder rights plan.
Furthermore, the Stockholders Agreement provides that, for so long as the Substantial Ownership Requirement is met, the Holders may designate the nominees for a majority of the members of our board of directors, including the Chairman of our board of directors.
Notwithstanding the rights afforded to the Holders under the Stockholders Agreement, Baldwin Insurance Group Holdings, LLC, an entity controlled by Lowry Baldwin, our Chairman and the Holder of a majority of the shares of the Company's Class B common stock held by all of the Holders (the “Majority Holder”), and the Company have entered into a consent and defense agreement (the “Consent Agreement”) pursuant to which the Majority Holder has irrevocably consented to and approved, on behalf of itself and the other Holders, certain transactions and actions taken by the Company and BRP (each, a “Specified Matter”) that the Independent Committee (as defined below) determines in good faith is in the best interests of the Company and its stockholders in their capacity as such, in satisfaction of the approval rights with respect to such Specific Matter. Further, the Majority Holder irrevocably agreed, on behalf of itself and the other Holders, not to designate any nominee for election to service on the Company's board if the Independent Committee determines in good faith that action by the board in furtherance of the nomination of such person to the board would not be in the best interests of the Company and its stockholders in their capacity as such.
A group comprised of Lowry Baldwin, our Chairman, Baldwin Insurance Group Holdings, LLC, an entity controlled by Lowry Baldwin, Elizabeth Krystyn, Laura Sherman, Trevor Baldwin, our Chief Executive Officer, Dan Galbraith, President, BRP and Chief Executive Officer, Retail Brokerage Operations, and Brad Hale, our Chief Financial Officer, and certain trusts established by such individuals, have entered into a Voting Agreement, as amended, with Lowry Baldwin, our Chairman, pursuant to which, in connection with any meeting of our stockholders or any written consent of our stockholders, each such person and trust party will agree to vote or exercise their right to consent in the manner directed by Lowry Baldwin. As of the date of this Annual Report on Form 10-K, Lowry Baldwin through the Voting Agreement beneficially owns 25.4% of the voting power of our common stock.
This concentration of ownership and voting power may also delay, defer or even prevent an acquisition by a third party or other change of control of our Company, which could deprive you of an opportunity to receive a premium for your shares of Class A common stock and may make some transactions more difficult or impossible without the support of the Holders, even if such events are in the best interests of stockholders other than the Holders. Furthermore, this concentration of voting power with Holders may have a negative impact on the price of our Class A common stock. In addition, the Holders will have the ability to designate the nominees for a majority of the members of our board of directors, including the Chairman of our board of directors, until the Substantial Ownership Requirement is no longer met. As a result, the Holders may not be inclined to permit us to issue additional shares of Class A common stock, including for the facilitation of acquisitions, if it would dilute their holdings below the Substantial Ownership Requirement.
Furthermore, Holders’ interests may not be fully aligned with yours, which could lead to actions that are not in your best interests. Because the Holders hold a majority of their economic interests in our business through BRP rather than through BRP Group, they may have conflicting interests with holders of shares of our Class A common stock. For example, the Holders may be in a different tax position than holders of shares of our Class A common stock, which could influence their decisions regarding whether and when BRP should dispose of assets or incur new or refinance existing indebtedness, especially in light of the existence of the Tax Receivable Agreement, and whether and when we should undergo certain changes of control for purposes of the Tax Receivable Agreement or terminate the Tax Receivable Agreement. In addition, the structuring of future transactions may take into consideration these tax or other considerations even where no similar benefit would accrue to holders of shares of our Class A common stock. Pursuant to the Bipartisan Budget Act of 2015, for tax years beginning after December 31, 2017, if the IRS makes audit adjustments to BRP’s federal income tax returns, it may assess and collect any taxes (including any applicable penalties and interest) resulting from such audit adjustment directly from BRP. If, as a result of any such audit adjustment, BRP is required to make payments of taxes, penalties and interest, BRP’s cash available for distributions to us may be substantially reduced. These rules are not applicable to BRP for tax years beginning on or prior to December 31, 2017. In addition, the Holders’ significant ownership in us and approval rights under the Stockholders Agreement may discourage someone from making a significant equity investment in us, or could discourage transactions involving a change in control, including transactions in which you as a holder of shares of our Class A common stock might otherwise receive a premium for your shares over the then-current market price.
39
In certain circumstances, BRP will be required to make distributions to us and the other holders of LLC Units, and the distributions that BRP will be required to make may be substantial.
Under the Amended LLC Agreement, BRP will generally be required from time to time to make pro rata distributions in cash to us and the other holders of LLC Units at certain assumed tax rates in amounts that are intended to be sufficient to cover the taxes on our and the other LLC Unit holders’ respective allocable shares of the taxable income of BRP. As a result of (i) potential differences in the amount of net taxable income allocable to us and the other LLC Unit holders, (ii) the lower tax rate applicable to corporations than individuals and (iii) the favorable tax benefits that we anticipate receiving from (a) previous acquisitions by BRP Group of LLC Units and future taxable redemptions or exchanges of LLC Units for shares of our Class A common stock or cash and (b) payments under the Tax Receivable Agreement, we expect that these tax distributions will be in amounts that exceed our tax liabilities and obligations to make payments under the Tax Receivable Agreement. Our board of directors will determine the appropriate uses for any excess cash so accumulated, which may include, among other uses, dividends, repurchases of our Class A common stock, the payment of obligations under the Tax Receivable Agreement and the payment of other expenses. We will have no obligation to distribute such cash (or other available cash other than any declared dividend) to our stockholders. No adjustments to the redemption or exchange ratio of LLC Units for shares of Class A common stock will be made as a result of either (i) any cash distribution by us or (ii) any cash that we retain and do not distribute to our stockholders. To the extent that we do not distribute such excess cash as dividends on our Class A common stock and instead, for example, hold such cash balances or lend them to BRP, holders of LLC Units would benefit from any value attributable to such cash balances as a result of their ownership of Class A common stock following a redemption or exchange of their LLC Units.
We will be required to pay BRP’s LLC Members and any other persons that become parties to the Tax Receivable Agreement for certain tax benefits we may receive, and the amounts we may pay could be significant.
Previous acquisitions by BRP Group of LLC Units from BRP's LLC Members and future taxable redemptions or exchanges by BRP’s LLC Members of LLC Units for shares of our Class A common stock or cash, as well as other transactions described herein, are expected to result in tax basis adjustments to the assets of BRP that will be allocated to us and thus produce favorable tax attributes. These tax attributes would not be available to us in the absence of those transactions. The tax basis adjustments are expected to reduce the amount of tax that we would otherwise be required to pay in the future.
The Tax Receivable Agreement with BRP’s LLC Members provides for the payment by us to BRP’s LLC Members of 85% of the amount of cash savings, if any, in U.S. federal, state and local income tax or franchise tax that we actually realize as a result of (i) any increase in tax basis in BRP Group’s assets resulting from (a) previous acquisitions by BRP Group of LLC Units from BRP’s LLC Members, (b) the purchase of LLC Units from BRP’s LLC Members using the net proceeds from any future offering, (c) redemptions or exchanges by BRP’s LLC Members of LLC Units for shares of our Class A common stock or cash or (d) payments under the Tax Receivable Agreement and (ii) tax benefits related to imputed interest resulting from payments made under the Tax Receivable Agreement. The payment obligations under the Tax Receivable Agreement are our obligations and not obligations of BRP.
The actual increases in tax basis with respect to future taxable redemptions, exchanges or purchases of LLC Units, as well as the amount and timing of any payments we are required to make under the Tax Receivable Agreement will depend on a number of factors, including the market value of our Class A common stock at the time of future redemptions or exchanges, the prevailing federal tax rates applicable to us over the life of the Tax Receivable Agreement (as well as the assumed combined state and local tax rate), the amount and timing of the taxable income that we generate in the future and the extent to which future redemptions, exchanges or purchases of LLC Units are taxable transactions.
Payments under the Tax Receivable Agreement are not conditioned on BRP’s LLC Members’ continued ownership of us. There may be a material negative effect on our liquidity if the payments under the Tax Receivable Agreement exceed the actual benefits we receive in respect of the tax attributes subject to the Tax Receivable Agreement and/or distributions to us by BRP are not sufficient to permit us to make payments under the Tax Receivable Agreement.
In addition, although we are not aware of any issue that would cause the IRS to challenge the tax basis increases or other benefits arising under the Tax Receivable Agreement, BRP’s LLC Members will not reimburse us for any payments previously made if such tax basis increases or other tax benefits are subsequently disallowed, except that any excess payments made to BRP’s LLC Members will be netted against future payments otherwise to be made under the Tax Receivable Agreement, if any, after our determination of such excess. As a result, in such circumstances, we could make payments to BRP’s LLC Members under the Tax Receivable Agreement that are greater than our actual cash tax savings and we may not be able to recoup those payments, which could negatively impact our liquidity.
40
In addition, the Tax Receivable Agreement provides that, upon certain mergers, asset sales or other forms of business combination, or certain other changes of control, our or our successor’s obligations with respect to tax benefits would be based on certain assumptions, including that we or our successor would have sufficient taxable income to fully utilize the increased tax deductions and tax basis and other benefits covered by the Tax Receivable Agreement. As a result, upon a change of control, we could be required to make payments under the Tax Receivable Agreement that are greater than the specified percentage of our actual cash tax savings, which could negatively impact our liquidity.
This provision of the Tax Receivable Agreement may result in situations where BRP’s LLC Members have interests that differ from or are in addition to those of our other stockholders. In addition, we could be required to make payments under the Tax Receivable Agreement that are substantial and in excess of our, or a potential acquirer’s, actual cash savings in income tax.
Our obligations under the Tax Receivable Agreement will also apply with respect to any person who is issued LLC Units in the future and who becomes a party to the Tax Receivable Agreement.
Finally, because we are a holding company with no operations of our own, our ability to make payments under the Tax Receivable Agreement depends on the ability of BRP to make distributions to us. The JPM Credit Agreement restricts the ability of BRP to make distributions to us, which could affect our ability to make payments under the Tax Receivable Agreement. To the extent that we are unable to make payments under the Tax Receivable Agreement for any reason, such payments will be deferred and will accrue interest until paid, which could negatively impact our results of operations and could also affect our liquidity in periods in which such payments are made.
We are dependent upon distributions from BRP to pay dividends, if any, and taxes, make payments under the Tax Receivable Agreement and pay other expenses.
As the sole managing member of BRP, we intend to cause BRP to make distributions to the holders of LLC Units and us, in amounts sufficient to (i) cover all applicable taxes payable by us and the holders of LLC Units, (ii) allow us to make any payments required under the Tax Receivable Agreement and (iii) fund dividends to our stockholders in accordance with our dividend policy, to the extent that our board of directors declares such dividends.
Deterioration in the financial conditions, earnings or cash flow of BRP and its subsidiaries for any reason could limit or impair their ability to pay such distributions. Additionally, to the extent that we need funds and BRP is restricted from making such distributions to us under applicable law or regulation, as a result of covenants in its debt agreements or otherwise, we may not be able to obtain such funds on terms acceptable to us, or at all, and, as a result, could suffer a material adverse effect on our liquidity and financial condition.
Risks Relating to Ownership of our Class A Common Stock
Some provisions of Delaware law and our certificate of incorporation and by-laws may deter third parties from acquiring us and diminish the value of our Class A common stock.
Our certificate of incorporation and by-laws provide for, among other things:
•division of our board of directors into three classes of directors, with each class as equal in number as possible, serving staggered three-year terms;
•until the Substantial Ownership Requirement is no longer met, the Holders may designate a majority of the nominees for election to our board of directors, including the nominee for election to serve as Chairman of our board of directors;
•our ability to issue additional shares of Class A common stock and to issue preferred stock with terms that our board of directors may determine, in each case without stockholder approval (other than as specified in our certificate of incorporation);
•the absence of cumulative voting in the election of directors; and
•advance notice requirements for stockholder proposals and nominations.
These provisions in our certificate of incorporation and by-laws may discourage, delay or prevent a transaction involving a change in control of our company that is in the best interest of our minority stockholders. Even in the absence of a takeover attempt, the existence of these provisions may adversely affect the prevailing market price of our Class A common stock if they are viewed as discouraging future takeover attempts. These provisions could also make it more difficult for stockholders to nominate directors for election to our board of directors and take other corporate actions.
41
Certain statutory provisions afforded to stockholders are not applicable to us.
Our certificate of incorporation and Stockholders Agreement provides that, to the fullest extent permitted by law, the doctrine of “corporate opportunity” under Delaware law will only apply against our directors and officers and their respective affiliates for competing activities related to insurance brokerage activities. This doctrine will not apply to any business activity other than insurance brokerage activities. Furthermore, the Pre-IPO LLC Members have business relationships outside of our business.
We may issue a substantial amount of our common stock in the future, which could cause dilution to investors and otherwise adversely affect our stock price.
A key element of our growth strategy is to make acquisitions. As part of our acquisition strategy, we may issue shares of our common stock, as well as LLC Units of BRP, as consideration for such acquisitions. These issuances could be significant. To the extent that we make acquisitions and issue our shares of common stock as consideration, your equity interest in us will be diluted. Any such issuance will also increase the number of outstanding shares of common stock that will be eligible for sale in the future. Persons receiving shares of our common stock in connection with these acquisitions may be more likely to sell off their common stock, which may influence the price of our common stock. In addition, the potential issuance of additional shares in connection with anticipated acquisitions could lessen demand for our common stock and result in a lower price than might otherwise be obtained. We may issue a significant amount of our common stock in the future for other purposes as well, including in connection with financings, including to finance the cash portion of acquisition consideration to execute on our Partnership strategy, for compensation purposes, in connection with strategic transactions or for other purposes.
We expect that our stock price will be volatile, which could cause the value of your investment to decline, and you may not be able to resell your shares for a profit.
Securities markets worldwide have experienced, and are likely to continue to experience, significant price and volume fluctuations. This market volatility, as well as general economic, market or political conditions, could reduce the market price of our Class A common stock regardless of our results of operations. The trading price of our Class A common stock is likely to be volatile and subject to wide price fluctuations in response to various factors, including:
•market conditions in the broader stock market in general, or in our industry in particular;
•actual or anticipated fluctuations in our quarterly financials and results of operations;
•introduction of new products and services by us or our competitors;
•issuance of new or changed securities analysts’ reports or recommendations;
•investor perceptions of us and the industries in which we or our Clients operate;
•low trading volumes or sales, or anticipated sales, of large blocks of our Class A common stock, including those by our existing investors or our Partners;
•concentration of Class A common stock ownership;
•additions or departures of key personnel;
•regulatory or political developments;
•litigation and governmental investigations;
•changing economic and political conditions;
•the perceived adequacy of our ESG efforts;
•our ability or perceived ability to:
◦attract new Clients, successfully deploy and implement our products, obtain Client renewals and provide our Clients with excellent Client support;
◦increase our network of Insurance Company Partners and the profit-sharing, override and/or contingent commissions that we earn from such Insurance Company Partners;
◦adequately expand, train, integrate and retain our Colleagues, including our executive officers and senior leaders, and maintain or increase our sales force’s productivity;
◦improve our internal control over financial reporting and disclosure controls and procedures to ensure timely and accurate reporting of our operational and financial results;
42
◦successfully introduce new products and enhance existing products;
◦successfully deploy information technology assets for use by our Colleagues and interaction with our Clients and Insurance Company Partners;
◦adapt to the ever-changing regulatory and legal landscape;
◦protect sensitive, personal and confidential information and data within BRP’s custody from third party bad actors;
◦successfully identify and acquire new Partners;
◦successfully integrate Partnerships into the Company in an operationally efficient manner;
◦service our existing indebtedness;
◦access the capital markets or otherwise obtain access to capital to satisfy future needs of the Company;
◦successfully introduce our products to new markets and geographies; and
◦successfully compete against larger companies and new market entrants.
•announced or completed acquisitions of businesses or technologies by us or our competitors; and
•new laws or regulations or new interpretations of existing laws or regulations applicable to our business, including developments relating to the health care industry and the marketing and sale of Medicare plans.
These and other factors may cause the market price and demand for shares of our Class A common stock to fluctuate substantially, which may limit or prevent investors from readily selling their shares of Class A common stock and may otherwise negatively affect the liquidity of our Class A common stock. In addition, in the past, when the market price of a stock has been volatile, holders of that stock have sometimes instituted securities class action litigation against the company that issued the stock. If any of our stockholders brought a lawsuit against us, we could incur substantial costs defending the lawsuit. Such a lawsuit could also divert the time and attention of our management from our business, which could significantly harm our profitability and reputation.
Our ability to pay dividends to our Class A common stockholders may be limited by our holding company structure, contractual restrictions and regulatory requirements.
We are a holding company and have no material assets other than our ownership of LLC Units in BRP and we do not have any independent means of generating commissions and fees. We intend to cause BRP to make pro rata distributions to BRP’s LLC Members and us in an amount at least sufficient to allow us and BRP’s LLC Members to pay all applicable taxes, to make payments under the Tax Receivable Agreement and to pay our corporate and other overhead expenses. BRP is a distinct legal entity and may be subject to legal or contractual restrictions that, under certain circumstances, may limit our ability to obtain cash from them. If BRP is unable to make distributions, we may not receive adequate distributions, which could materially and adversely affect our dividends and financial position and our ability to fund any dividends to Class A common stock.
Our board of directors will periodically review the cash generated from our business and the capital expenditures required to finance our global growth plans and determine whether to declare periodic dividends to our stockholders. Our board of directors will take into account general economic and business conditions, including our financial condition and results of operations, capital requirements, contractual restrictions, including restrictions and covenants contained in the JPM Credit Agreement, business prospects and other factors that our board of directors considers relevant. In addition, the JPM Credit Agreement limits the amount of distributions that BRP can make to us and the purposes for which distributions could be made. Accordingly, we may not be able to pay dividends to our Class A common stockholders even if our board of directors would otherwise deem it appropriate. Refer to Item 7. Management’s Discussion and Analysis of Financial Condition and Results of Operations—Liquidity and Capital Resources for additional information.
43
Short selling could increase the volatility of our stock price of our Class A Common Stock.
Short selling is the practice of selling securities that the seller does not own but rather has borrowed or intends to borrow from a third party with the intention of buying identical securities at a later date to return to the lender. A short seller hopes to profit from a decline in the value of the securities between the sale of the borrowed securities and the purchase of the replacement shares, as the short seller expects to pay less in that purchase than it received in the sale. As it is therefore in the short seller’s interest for the price of the stock to decline, some short sellers publish, or arrange for the publication of, opinions or characterizations regarding the relevant issuer, its business prospects and similar matters, calculated to or which may create negative market momentum, and which may permit them to obtain profits for themselves as a result of selling the stock short. These opinions and characterizations may contain falsehoods, incomplete and deceptive statements and/or otherwise be misleading. Issuers whose securities have historically had limited trading volumes, and issuers who are susceptible to relatively high volatility levels, can be particularly vulnerable to such short seller attacks. In addition to impacting the pricing of our stock, such short seller attacks could also divert the time and attention of our management from our business, which could significantly harm our profitability and reputation.
If securities analysts do not publish research or reports about our business or if they publish negative evaluations of our Class A common stock, the price of our Class A common stock could decline.
The trading market for our Class A common stock will rely in part on the research and reports that industry or securities analysts publish about us or our business. We currently have research coverage by industry and securities analysts. If no or few analysts continue coverage of us, the trading price of our Class A common stock would likely decrease. If one or more of the analysts covering our business downgrade their evaluations of our Class A common stock, the price of our Class A common stock could decline. If one or more of these analysts cease to cover our Class A common stock, we could lose visibility in the trading market for our Class A common stock, which in turn could cause our Class A common stock price to decline.
If we experience material weaknesses or significant deficiencies in the future, or otherwise fail to maintain an effective environment of internal controls, we may not be able to accurately or timely report our financial condition or results of operations, which may adversely affect investor confidence in us and, as a result, the value of our common stock.
If we identify material weaknesses or significant deficiencies in our internal control over financial reporting in the future, or if we are unable to comply with the demands that will be placed upon us as a public company, including the requirements of Section 404 of the Sarbanes-Oxley Act, in a timely manner, we may be unable to accurately report our financial results, or report them within the timeframes required by the SEC. In addition, if we are unable to disclose that our internal control over financial reporting is effective, or if our independent registered public accounting firm is unable to express an opinion as to the effectiveness of our internal control over financial reporting, investors may lose confidence in the accuracy and completeness of our financial reports, we may face restricted access to the capital markets, and our stock price may be adversely affected.
ITEM 1B. UNRESOLVED STAFF COMMENTS
None.
ITEM 1C. CYBERSECURITY
We face significant and persistent cybersecurity risks due to: the scope of geographies, networks and systems we must defend against cybersecurity attacks; the complexity, technical sophistication, value, and widespread use of our systems, products and processes; the attractiveness of our systems, products and processes to threat actors (including state-sponsored organizations) seeking to inflict harm on us or our Clients; and our use of third-party products, services and components.
44
While we have not, as of the date of this Form 10-K, experienced a cybersecurity threat or incident that resulted in a material adverse impact to our business or operations, there can be no guarantee that we will not experience such an incident in the future. Such incidents, whether or not successful, could result in our incurring significant costs related to, for example, rebuilding our internal systems, implementing additional threat protection measures, providing modifications or replacements to our products and services, defending against litigation, responding to regulatory inquiries or actions, paying damages, providing Clients with incentives to maintain a business relationship with us, or taking other remedial steps with respect to third parties, as well as incurring significant reputational harm. In addition, these threats are constantly evolving, thereby increasing the difficulty of successfully defending against them or implementing adequate preventative measures. We seek to detect and investigate unauthorized attempts and attacks against our network, products and services, and to prevent their occurrence and recurrence where practicable through changes or updates to our internal processes and tools and changes or updates to our products and services; however, we remain potentially vulnerable to known or unknown threats. In some instances, we, our trading partners, our Clients, and our service providers and contractors can be unaware of a threat or incident or its magnitude and effects. Further, there is increasing regulation regarding responses to cybersecurity incidents, including reporting to regulators, which could subject us to additional liability and reputational harm. Refer to Item 1A. Risk Factors of this Annual Report on Form 10-K for more information on our cybersecurity risks.
Our business involves the storage and transmission of a significant amount of confidential and sensitive information. As a result, we take the confidentiality, integrity and availability of this highly sensitive information seriously and invest significant time, effort and resources into protecting such information. Our cybersecurity strategy was designed with the foregoing principles in mind and prioritizes detecting and responding to threats and effective management of security risks.
To implement our cybersecurity strategy, we maintain various safeguards to secure the data we hold, including encrypting sensitive data, utilizing a robust 24/7/365 security monitoring system, regularly assessing product features for security vulnerabilities, conducting continuous internal penetration tests, and leveraging multi-factor authentication to help effectively protect sensitive information and appropriate access rights. We also have data and cybersecurity protection and control policies to facilitate a secure environment for sensitive information and to preserve the availability of critical data and systems. We have processes in place to assess and manage vendor cybersecurity risks, which include initial and periodic security program reviews through the use of third party vendors who specialize in this subject matter. We have engaged our independent, internal audit team that reports directly to the Chair of the Audit Committee of our board of directors to audit our adherence to our cybersecurity policies. These audits help us assess our internal preparedness, adherence to best practices and industry standards, and compliance with applicable laws and regulations as well as help us to identify areas for continued focus and improvement. We conduct annual information security awareness training for employees involved in the systems or processes connected to confidential and sensitive information. We also carry insurance that provides certain, limited protection against potential losses arising from a cybersecurity incident.
The Technology & Cyber Risk Committee of our board of directors (the “TCRC”) is responsible for overseeing and reviewing our cybersecurity program and cybersecurity risk exposure and the steps taken to monitor and mitigate such exposure. The TCRC updates the full board of directors on cybersecurity matters periodically.
Our information security team for IAS, MIS and Corporate is led by our Chief Digital & Information Officer (“CDIO”), who also serves as our Chief Information Security Officer (“CISO”) for IAS, MIS and Corporate. Our CDIO/CISO reports to our President, BRP & CEO, Retail Brokerage Operations. Our CDIO/CISO has served in the role since 2021 and has experience in application security, intrusion detection, penetration testing, complex threat modeling, and unconventional cyber-attack vectors, having previously led technology teams at Comerica Bank, HSBC, Citibank and General Electric. Our CDIO/CISO oversees a team of information security professionals who are devoted full time to assessing and managing cybersecurity threats on a day-to-day basis. Our CDIO/CISO attends each quarterly meeting of the TCRC to brief members on information security matters and discuss cybersecurity risks generally.
Our information security team for UCTS is led by our President of Digital Strategy & Innovation (“PDSI”), who also serves as our CISO for UCTS. Our PDSI/CISO reports to our President, BRP & CEO, Underwriting, Capacity and Technology Operations. Our PDSI/CISO has served in the role since 2022 and has experience in application security, intrusion detection, penetration testing, complex threat modeling, and unconventional cyber-attack vectors, having previously led technology teams at Crum & Forster, QBE North America, QBE FIRST, N.E.W. Customer Service Companies, Inc. and Wipro Technologies. Our PDSI/CISO oversees a team of information security professionals who are devoted full time to assessing and managing cybersecurity threats on a day-to-day basis. Our PDSI/CISO also attends each quarterly meeting of the TCRC to brief members on information security matters and discuss cybersecurity risks generally.
In addition, our management team has established an internal Cyber Steering Committee (the “Cyber SteerCo”), which includes processes designed to identify, assess, categorize, and monitor key current and evolving risks facing us, including cybersecurity risks. Each of the CDIO/CISO and PDSI/CISO sit on the Cyber SteerCo along with the our General Counsel and former CISO.
45
Management is made aware of current and evolving cybersecurity risks through the Cyber SteerCo reporting. Furthermore, in the event of a material or potentially material cybersecurity event, senior members of management are promptly informed of such event and oversee triage, response, and disclosure efforts pursuant to the terms of a documented incident response plan.
ITEM 2. PROPERTIES
Our corporate headquarters is located in leased offices in Tampa, Florida. The leases consist of approximately 105,000 square feet and expire in August 2030. Our insurance brokerage business leases office space in approximately 115 operating locations located in 24 states throughout the U.S. These offices are generally located in shopping centers, small office parks and office buildings, with lease terms expiring through the next seven years. These facilities are suitable for our needs and we believe that they are well maintained.
ITEM 3. LEGAL PROCEEDINGS
We are involved in various claims and legal actions arising in the ordinary course of business. In the opinion of management, the ultimate disposition of these matters will not have a material adverse effect on our consolidated financial position, results of operations or liquidity.
ITEM 4. MINE SAFETY DISCLOSURES
Not applicable.
46
PART II
ITEM 5. MARKET FOR REGISTRANT’S COMMON EQUITY, RELATED STOCKHOLDER MATTERS AND ISSUER PURCHASES OF EQUITY SECURITIES
Our Class A common stock is listed on the Nasdaq Global Select Market (“Nasdaq”) under the symbol “BRP.” Our Class B common stock is not listed nor traded on any stock exchange.
On February 20, 2024, there were 123 stockholders of record of our Class A common stock and 58 stockholders of record of our Class B common stock. The number of record holders does not include persons who held shares of our Class A common stock in nominee or “street name” accounts through brokers.
Dividend Policy
Subject to funds being legally available, we intend to cause BRP to make pro rata distributions to the holders of LLC Units and us in an amount at least sufficient to allow us and the holders of LLC Units to pay all applicable taxes, to make payments under the Tax Receivable Agreement and to pay our corporate and other overhead expenses. The declaration and payment of any dividends will be at the sole discretion of our board of directors, which may change our dividend policy at any time. We do not currently pay dividends outside of tax payments. Should that change, our board of directors will take into account:
•general economic and business conditions;
•our financial condition and operating results;
•our available cash and current and anticipated cash needs;
•our capital requirements;
•contractual, legal, tax and regulatory restrictions and implications on the payment of dividends by us to our stockholders or by our subsidiaries (including BRP) to us; and
•such other factors as our board of directors may deem relevant.
BRP Group is a holding company and has no material assets other than its ownership of LLC Units in BRP, and as a consequence, our ability to declare and pay dividends to the holders of our Class A common stock will be subject to the ability of BRP to provide distributions to us. If BRP makes such distributions, the holders of LLC Units will be entitled to receive equivalent distributions from BRP. However, because we must pay taxes, make payments under the Tax Receivable Agreement and pay our expenses, amounts ultimately distributed as dividends to holders of our Class A common stock are expected to be less than the amounts distributed by BRP to the holders of LLC Units on a per share basis.
Assuming BRP makes distributions to its members in any given year, the determination to pay dividends, if any, to our Class A common stockholders out of the portion, if any, of such distributions remaining after our payment of taxes, Tax Receivable Agreement payments and expenses (any such portion, an “excess distribution”) will be made by our board of directors. Because our board of directors may determine to pay or not pay dividends to our Class A common stockholders, our Class A common stockholders may not necessarily receive dividend distributions relating to excess distributions, even if BRP makes such distributions to us.
Sales of Unregistered Securities
None.
47
Issuer Purchases of Equity Securities
The following table provides information about our repurchase of shares of our Class A common stock during the three months ended December 31, 2023:
Total Number of Shares Purchased(1) | Average Price Paid per Share | Total Number of Shares Purchased as Part of Publicly Announced Plans or Programs | Maximum Value that may yet be Purchased under the Plans or Programs | ||||||||||||||||||||
| October 1, 2023 to October 31, 2023 | 71,730 | $ | 22.08 | — | $ | — | |||||||||||||||||
| November 1, 2023 to November 30, 2023 | 349 | 20.17 | — | — | |||||||||||||||||||
| December 1, 2023 to December 31, 2023 | 52,093 | 17.62 | — | — | |||||||||||||||||||
| Total | 124,172 | $ | 20.20 | — | $ | — | |||||||||||||||||
__________
(1) We purchased 124,172 shares during the three months ended December 31, 2023, which were acquired from our employees to cover required tax withholding on the vesting of shares granted under the BRP Group Omnibus Incentive and Partnership Inducement Award Plans.
Performance Graph
The following performance graph compares the cumulative total shareholder return of an investment in our Class A common stock since October 24, 2019 (first day of trading) through December 31, 2023 to the cumulative total return of the Russell 2000 Index (“Russell 2000”) and the Standard & Poor Composite 1500 Insurance Brokers Index (“S&P 1500”). The graph assumes that $100 was invested on October 24, 2019 and the reinvestment of dividends, if any. The share price performance presented below is not necessarily indicative of future results.
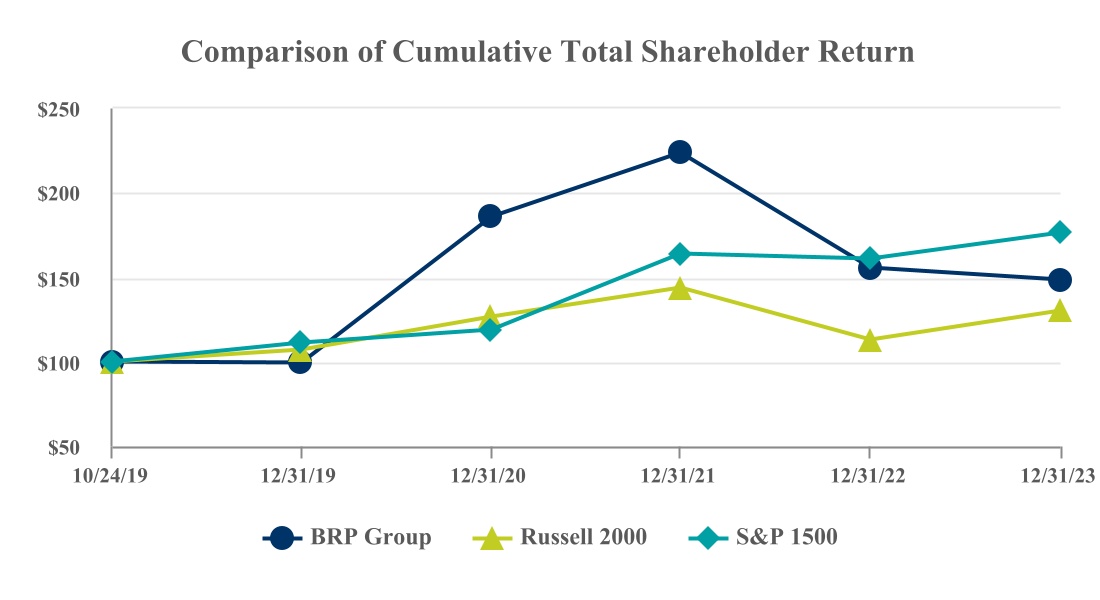
48
ITEM 6. RESERVED
ITEM 7. MANAGEMENT’S DISCUSSION AND ANALYSIS OF FINANCIAL CONDITION AND RESULTS OF OPERATIONS
The following discussion and analysis of our financial condition and results of operations should be read in conjunction with our consolidated financial statements and the related notes and other financial information included elsewhere in this Annual Report on Form 10-K. In addition to historical consolidated financial information, the following discussion contains forward-looking statements that reflect our plans, estimates, and beliefs. Our actual results may differ materially from those discussed in the forward-looking statements as a result of various factors, including those set forth in Item 1A. Risk Factors and included elsewhere in this Annual Report on Form 10-K.
EXECUTIVE SUMMARY OF 2023 FINANCIAL RESULTS
We are a rapidly growing independent insurance distribution firm delivering solutions that give our Clients the peace of mind to pursue their purpose, passion and dreams. The following is a summary of our 2023 financial results:
Revenues for the year ended December 31, 2023 were $1.2 billion, an increase of $237.8 million, or 24%, year over year. Core commissions and fees grew organically by $161.7 million as a result of new and renewal business from Clients across industry sectors and continued outperformance from our MGA of the Future platform. 2023 commissions and fees also grew $44.7 million from the impact of 2022 Partnerships for which there were no comparable revenues in the same period of 2022 and $25.5 million from profit-sharing and other revenue driven by improvements in performance on our profit-sharing arrangements. In addition, investment income grew $6.7 million due to an improved cash management strategy and growing yield on our invested cash.
Operating expenses for the year ended December 31, 2023 were $1.3 billion, an increase of $249.3 million, or 25%, year over year. The increase in operating expenses was primarily attributable to commissions, employee compensation and benefits, which grew in part due to the correlation of compensation to our revenue growth and as a result of investing in our future as we continue to launch new products in our MGA of the Future product suite and expand the distribution footprint of our national mortgage and real estate channel. Change in fair value of contingent consideration increased due to positive changes in revenue growth trends of certain partners and accretion of the contingent earnout obligations approaching their respective measurement dates. Other operating expenses increased in part as a result of our continued investments in technology and new product development and expansion.
Interest expense, net, for the year ended December 31, 2023 was $119.5 million, an increase of $48.4 million, or 68%, year over year. Interest expense, net, increased as a result of the higher interest rate environment during 2023 and, to a lesser extent, higher average borrowings outstanding on our credit facility.
Other income (expense), net, for the year ended December 31, 2023 was $(0.7) million, a decrease of $26.9 million year over year. Other income (expense), net, decreased as a result of a fair value gain recognized on interest rate caps in 2022 in connection with rising interest rates and market estimates for future rate increases.
Net loss for the year ended December 31, 2023 was $164.0 million, an increase of $87.3 million compared to a net loss of $76.7 million in the same period of 2022.
Adjusted EBITDA for the year ended December 31, 2023 was $250.2 million, an increase of $53.7 million year over year. Adjusted EBITDA Margin was 21% for 2023 compared to 20% for 2022.
Organic Revenue for the year ended December 31, 2023 was $1.2 billion as compared to $700.1 million for the same period of 2022. Organic Revenue Growth was $187.2 million, or 19%, for 2023 compared to $132.6 million, or 23%, for 2022. Refer to the Non-GAAP Financial Measures section below for reconciliations of Adjusted EBITDA, Adjusted EBITDA Margin, Organic Revenue and Organic Revenue Growth to the most directly comparable GAAP financial measures.
49
RESULTS OF OPERATIONS FOR THE YEARS ENDED DECEMBER 31, 2023 AND 2022
For a discussion of our 2021 financial results and a comparison of financial results for the years ended December 31, 2022 to 2021, refer to Part II, Item 7. Management’s Discussion and Analysis of Financial Condition and Results of Operations of our Annual Report on Form 10-K filed with the SEC on February 28, 2023 and the Company's Current Report on Form 8-K (relating to the Company's reclassification of historical segment information) filed with the SEC on May 9, 2023.
The following discussion and analysis of our financial condition and results of operations should be read in conjunction with our financial statements as of December 31, 2023 and 2022 and for the years ended December 31, 2023, 2022 and 2021 and the related notes and other financial information included in Item 8. Financial Statements and Supplementary Data of this Annual Report on Form 10-K.
In addition to historical financial information, the following discussion and analysis contains forward-looking statements that involve risks, uncertainties and assumptions. Our actual results and timing of selected events may differ materially from those anticipated in these forward-looking statements as a result of many factors, including those discussed under Item 1A. Risk Factors.
The following is a discussion of our consolidated results of operations for the years ended December 31, 2023 and 2022.
| For the Years Ended December 31, | Variance | |||||||||||||||||||||||||
| (in thousands, except percentages) | 2023 | 2022 | Amount | % | ||||||||||||||||||||||
Revenues: | ||||||||||||||||||||||||||
Commissions and fees | $ | 1,211,828 | $ | 980,720 | $ | 231,108 | 24 | % | ||||||||||||||||||
| Investment income | 6,727 | — | 6,727 | — | % | |||||||||||||||||||||
| Total revenues | 1,218,555 | 980,720 | 237,835 | 24 | % | |||||||||||||||||||||
Operating expenses: | ||||||||||||||||||||||||||
Commissions, employee compensation and benefits | 911,354 | 719,445 | 191,909 | 27 | % | |||||||||||||||||||||
Other operating expenses | 190,267 | 173,708 | 16,559 | 10 | % | |||||||||||||||||||||
Amortization expense | 92,704 | 81,738 | 10,966 | 13 | % | |||||||||||||||||||||
Change in fair value of contingent consideration | 61,083 | 32,307 | 28,776 | 89 | % | |||||||||||||||||||||
Depreciation expense | 5,698 | 4,620 | 1,078 | 23 | % | |||||||||||||||||||||
Total operating expenses | 1,261,106 | 1,011,818 | 249,288 | 25 | % | |||||||||||||||||||||
| Operating loss | (42,551) | (31,098) | (11,453) | 37 | % | |||||||||||||||||||||
| Other income (expense): | ||||||||||||||||||||||||||
Interest expense, net | (119,465) | (71,072) | (48,393) | 68 | % | |||||||||||||||||||||
| Other income (expense), net | (718) | 26,137 | (26,855) | (103) | % | |||||||||||||||||||||
Total other expense | (120,183) | (44,935) | (75,248) | 167 | % | |||||||||||||||||||||
| Loss before income taxes | (162,734) | (76,033) | (86,701) | 114 | % | |||||||||||||||||||||
| Income tax expense | 1,285 | 715 | 570 | 80 | % | |||||||||||||||||||||
| Net loss | (164,019) | (76,748) | (87,271) | 114 | % | |||||||||||||||||||||
| Less: net loss attributable to noncontrolling interests | (73,878) | (34,976) | (38,902) | |||||||||||||||||||||||
| Net loss attributable to BRP Group | $ | (90,141) | $ | (41,772) | $ | (48,369) | ||||||||||||||||||||
50
Seasonality
The insurance brokerage market is seasonal and our results of operations are somewhat affected by seasonal trends. Our Adjusted EBITDA and Adjusted EBITDA Margins are typically highest in the first quarter and lowest in the fourth quarter. This variation is primarily due to fluctuations in our revenues, while overhead remains consistent throughout the year. Our revenues are generally highest in the first quarter due to a higher degree of first quarter policy commencements and renewals in certain IAS and MIS lines of business such as employee benefits, commercial and Medicare. In addition, a higher proportion of our first quarter revenue is derived from our highest margin businesses.
Partnerships can significantly impact Adjusted EBITDA and Adjusted EBITDA Margins in a given year and may increase the amount of seasonality within the business, especially results attributable to Partnerships that have not been fully integrated into our business or owned by us for a full year.
Commissions and Fees
We earn commissions and fees by facilitating the arrangement between Insurance Company Partners and Clients for the carrier to provide insurance to the insured party. Our commissions and fees are usually a percentage of the premium paid by the insured and generally depend on the type of insurance, the particular Insurance Company Partner and the nature of the services provided. Under certain arrangements with Clients, we earn pre-negotiated service fees for insurance placement services. Additionally, we earn policy fees for acting in the capacity of an MGA and fulfilling certain administrative functions on behalf of Insurance Company Partners, including delivery of policy documents, processing payments and other administrative functions. We may also receive profit-sharing commissions, which represent variable consideration paid by Insurance Company Partners associated with the placement of coverage. Profit-sharing commissions are generally based primarily on underwriting results, but may also contain considerations for volume, growth or retention. Other revenue streams include other ancillary income, premium financing income and marketing income based on negotiated cost reimbursement for fulfilling specific targeted Medicare marketing campaigns.
Commissions and fees increased by $231.1 million, or 24%, year over year to $1.2 billion driven by organic growth in core commissions and fees of $161.7 million related to new and renewal business across Client industry sectors and continued outperformance from our MGA of the Future platform. Commissions and fees also increased $44.7 million from the impact of 2022 Partnerships for which there were no comparable revenues in the same period of 2022 and $25.5 million from profit-sharing and other revenue driven by improvements in performance on our profit-sharing arrangements.
Major Sources of Commissions and Fees
The following table sets forth our commissions and fees by major source for the years ended December 31, 2023 and 2022:
| For the Years Ended December 31, | Variance | |||||||||||||||||||||||||
| (in thousands, except percentages) | 2023 | 2022 | Amount | % | ||||||||||||||||||||||
| Commission revenue | $ | 967,552 | $ | 786,794 | $ | 180,758 | 23 | % | ||||||||||||||||||
Profit-sharing revenue | 93,437 | 66,091 | 27,346 | 41 | % | |||||||||||||||||||||
| Consulting and service fee revenue | 74,637 | 61,244 | 13,393 | 22 | % | |||||||||||||||||||||
Policy fee and installment fee revenue | 65,386 | 55,362 | 10,024 | 18 | % | |||||||||||||||||||||
Other income | 10,816 | 11,229 | (413) | (4) | % | |||||||||||||||||||||
| Total commissions and fees | $ | 1,211,828 | $ | 980,720 | $ | 231,108 | ||||||||||||||||||||
Commission revenue represents commissions earned from providing insurance placement services to Clients. Commission revenue increased by $180.8 million, or 23%, year over year. Commission revenue grew organically by $140.0 million as a result of new and renewal business across all industries. In addition, 2023 commission revenue grew $40.7 million from the impact of 2022 Partnerships for which there were no comparable revenues in the same period of 2022.
Profit-sharing revenue represents bonus-type revenue earned as a sales incentive provided by certain Insurance Company Partners. Profit-sharing revenue increased by $27.3 million, or 41%, year over year driven by improvements in performance against profit-sharing measures such as premium volumes and loss ratio-related parameters.
Consulting and service fee revenue represents negotiated fees earned for providing insurance placement services to Clients and specialty insurance consulting revenue. Consulting and service fee revenue increased by $13.4 million, or 22%, year over year, driven by growth in service fees earned by our legacy risk management and captive businesses.
51
Policy fee and installment fee revenue represents revenue earned by our UCTS Operating Group for acting in the capacity of an MGA and providing payment processing services and other administrative functions on behalf of Insurance Company Partners. Policy fee and installment fee revenue increased by $10.0 million, or 18%, year over year driven by growth in our multi-family product.
Other income consists of other ancillary income, premium financing income and marketing income that is based on agreed upon cost reimbursement for fulfilling specific targeted Medicare marketing campaigns. Other income was relatively flat year over year.
Investment Income
Investment income is earned by investing assets held in trust. Investment income earned in 2023 was $6.7 million due to improvements in our cash management strategy and growing yield on our invested cash.
Commissions, Employee Compensation and Benefits
Commissions, employee compensation and benefits is our largest expense. It consists of (i) base compensation comprising salary, bonuses and benefits paid and payable to Colleagues, commissions paid to Colleagues and outside commissions paid to others; and (ii) equity-based compensation associated with the grants of restricted and unrestricted stock awards to senior management, Colleagues, Risk Advisors and directors. We expect to continue to experience a general rise in commissions, employee compensation and benefits expense commensurate with expected revenue growth as our compensation arrangements with our Colleagues and Risk Advisors contain significant bonus or commission components driven by the results of our operations. In addition, we operate in competitive markets for human capital and need to maintain competitive compensation levels as we expand geographically and create new products and services.
Commissions, employee compensation and benefits expense increased $191.9 million, or 27%, year over year, due in part to the correlation of compensation to our revenue growth and as a result of investing in our future as we continue to launch new products in our MGA of the Future product suite and expand the distribution footprint of our national mortgage and real estate channel. Colleague compensation and benefits increased $77.4 million, or 16%, from supporting the growth of our business. Outside commissions increased $49.1 million, or 31%, due to a change in business mix and overall growth in the business. The increase in commissions, employee compensation and benefits expense also includes $25.1 million attributable to the impact of 2022 Partnerships for which there was no comparable compensation expense in the same period of 2022. Other increases to commissions, employee compensation and benefits expense include severance of $17.3 million related to the retirement of two of our executive officers and Colleague terminations, and share-based compensation expense of $8.8 million.
Other Operating Expenses
Other operating expenses include travel, accounting, legal and other professional fees, placement fees, rent, office expenses and other costs associated with our operations. Our occupancy-related costs and professional services expenses, in particular, generally increase or decrease in relative proportion to the number of our Colleagues and the overall size and scale of our business operations.
Other operating expenses increased $16.6 million year over year driven by investments in technology to support our growth of $17.3 million, lead generation fees relating to the expansion of our national mortgage and real estate channel of $2.2 million, rent expense of $2.7 million and payment processing fees for our MGA business of $1.5 million. These increases were partially offset by lower costs for repairs and maintenance of $4.0 million and professional fees of $2.9 million.
Amortization Expense
Amortization expense increased by $11.0 million year over year driven in part by amortization of intangible assets recorded in connection with our Westwood Partnership.
Change in Fair Value of Contingent Consideration
Change in fair value of contingent consideration was a $61.1 million loss for the year ended December 31, 2023 as compared to a $32.3 million loss for the same period of 2022. The fair value loss related to contingent consideration for 2023 was impacted by positive changes in revenue growth trends of certain partners and accretion of the contingent earnout obligations approaching their respective measurement dates.
52
Interest Expense, Net
Interest expense, net, increased by $48.4 million year over year resulting primarily from the higher interest rate environment and, to a lesser extent, higher average borrowings outstanding on our credit facility. We expect interest expense to increase slightly in 2024 as interest rates are expected to remain high in the near-term.
Refer to Item 7A. Qualitative and Quantitative Disclosures About Market Risk for further discussion of the impact of rising interest rates on our results of operations, financial condition and cash flows.
Other Income (Expense), Net
Other income (expense), net, decreased by $26.9 million year over year driven by a $26.2 million gain recognized on interest rate caps for 2022 in connection with rising interest rates and market estimates for future rate increases. Comparatively, we recognized a $1.7 million loss on interest rate caps for 2023.
FINANCIAL CONDITION—COMPARISON OF CONSOLIDATED FINANCIAL CONDITION AT DECEMBER 31, 2023 TO DECEMBER 31, 2022.
Our total assets and total liabilities increased $39.8 million and $160.9 million, respectively, year over year. The most significant changes in assets and liabilities are described below.
Premiums, commissions and fees receivable, net increased $95.8 million and premiums payable to insurance companies increased $84.3 million. The increase in each can be attributed to our revenue growth and the timing of cash collections and payments.
Intangible assets, net decreased $82.6 million as a result of amortization expense of $92.7 million, offset in part by capitalized software development costs of $18.3 million related to infrastructure to support our business.
Accrued expenses and other current liabilities increased $27.2 million as a result of higher accrued compensation and benefits of $8.8 million and accrued expenses of $10.2 million related to bonus and severance expense. Accrued expenses and other current liabilities also include an earnout incentive bonus of $8.0 million related to a portion of a contingent earnout earned by one of our Partners, which is payable to certain Colleagues at the Partner's option.
Long term debt increased $160.1 million and our revolving line of credit decreased $164.0 million. During 2023, we increased our long-term debt borrowings with an incremental loan of $170.0 million and we used $165.0 million of the proceeds to partially repay outstanding amounts on the revolving line of credit, resulting in increased available borrowing capacity under the revolving line of credit to pay our future earnout obligations.
Contingent earnout liabilities increased $9.5 million resulting from an increase of $61.1 million related to fair value adjustments impacted by positive changes in revenue growth trends of certain Partners, offset in part by $52.3 million of settlements.
At December 31, 2023, assets and liabilities held for sale were $64.4 million and $43.9 million, respectively, as a result of our intention to sell our specialty wholesale broker business as describe in Note 3 to our consolidated financial statements included elsewhere in this Annual Report on Form 10-K. Assets held for sale are primarily comprised of premiums, commissions and fees receivable, net, intangible assets, net and goodwill, which reclassified $36.5 million, $11.7 million and $9.5 million from each of the respective financial statement captions. Liabilities held for sale are primarily comprised of premiums payable to insurance companies of $42.3 million.
NON-GAAP FINANCIAL MEASURES
Adjusted EBITDA, Adjusted EBITDA Margin, Organic Revenue, Organic Revenue Growth, Adjusted Net Income and Adjusted Diluted Earnings Per Share (“EPS”), are not measures of financial performance under GAAP and should not be considered substitutes for GAAP measures, including commissions and fees (for Organic Revenue and Organic Revenue Growth), net income (loss) (for Adjusted EBITDA and Adjusted EBITDA Margin), net income (loss) attributable to BRP Group (for Adjusted Net Income) or diluted earnings (loss) per share (for Adjusted Diluted EPS), which we consider to be the most directly comparable GAAP measures. These non-GAAP financial measures have limitations as analytical tools, and when assessing our operating performance, you should not consider these non-GAAP financial measures in isolation or as substitutes for commissions and fees, net income (loss), net income (loss) attributable to BRP Group, diluted earnings (loss) per share or other consolidated income statement data prepared in accordance with GAAP. Other companies in our industry may define or calculate these non-GAAP financial measures differently than we do, and accordingly, these measures may not be comparable to similarly titled measures used by other companies.
53
We define Adjusted EBITDA as net income (loss) before interest, taxes, depreciation, amortization, change in fair value of contingent consideration and certain items of income and expense, including share-based compensation expense, transaction-related Partnership and integration expenses, severance, and certain non-recurring items, including those related to raising capital. We believe that Adjusted EBITDA is an appropriate measure of operating performance because it eliminates the impact of income and expenses that do not relate to business performance, and that the presentation of this measure enhances an investor’s understanding of our financial performance.
Adjusted EBITDA Margin is Adjusted EBITDA divided by total revenues. Adjusted EBITDA Margin is a key metric used by management and our board of directors to assess our financial performance. We believe that Adjusted EBITDA Margin is an appropriate measure of operating performance because it eliminates the impact of income and expenses that do not relate to business performance, and that the presentation of this measure enhances an investor’s understanding of our financial performance. We believe that Adjusted EBITDA Margin is helpful in measuring profitability of operations on a consolidated level.
Adjusted EBITDA and Adjusted EBITDA Margin have important limitations as analytical tools. For example, Adjusted EBITDA and Adjusted EBITDA Margin:
•do not reflect any cash capital expenditure requirements for the assets being depreciated and amortized that may have to be replaced in the future;
•do not reflect changes in, or cash requirements for, our working capital needs;
•do not reflect the impact of certain cash charges resulting from matters we consider not to be indicative of our ongoing operations;
•do not reflect the interest expense or the cash requirements necessary to service interest or principal payments on our debt;
•do not reflect share-based compensation expense and other non-cash charges; and
•exclude certain tax payments that may represent a reduction in cash available to us.
We calculate Organic Revenue based on commissions and fees for the relevant period by excluding the first twelve months of commissions and fees generated from new Partners. Organic Revenue Growth is the change in Organic Revenue period-to-period, with prior period results adjusted to include commissions and fees that were excluded from Organic Revenue in the prior period because the relevant Partners had not yet reached the twelve-month owned mark, but which have reached the twelve-month owned mark in the current period. For example, revenues from a Partner acquired on June 1, 2022 are excluded from Organic Revenue for 2022. However, after June 1, 2023, results from June 1, 2022 to December 31, 2022 for such Partners are compared to results from June 1, 2023 to December 31, 2023 for purposes of calculating Organic Revenue Growth in 2023. Organic Revenue Growth is a key metric used by management and our board of directors to assess our financial performance. We believe that Organic Revenue and Organic Revenue Growth are appropriate measures of operating performance as they allow investors to measure, analyze and compare growth in a meaningful and consistent manner.
We define Adjusted Net Income as net income (loss) attributable to BRP Group adjusted for depreciation, amortization, change in fair value of contingent consideration and certain items of income and expense, including share-based compensation expense, transaction-related Partnership and integration expenses, severance, and certain non-recurring costs that, in the opinion of management, significantly affect the period-over-period assessment of operating results, and the related tax effect of those adjustments. We believe that Adjusted Net Income is an appropriate measure of operating performance because it eliminates the impact of income and expenses that do not relate to business performance.
Adjusted Diluted EPS measures our per share earnings excluding certain expenses as discussed above and assuming all shares of Class B common stock were exchanged for Class A common stock on a one-for-one basis. Adjusted Diluted EPS is calculated as Adjusted Net Income divided by adjusted diluted weighted-average shares outstanding. We believe Adjusted Diluted EPS is useful to investors because it enables them to better evaluate per share operating performance across reporting periods.
54
Adjusted EBITDA and Adjusted EBITDA Margin
The following table reconciles Adjusted EBITDA and Adjusted EBITDA Margin to net loss, which we consider to be the most directly comparable GAAP financial measure:
| For the Years Ended December 31, | ||||||||||||||
| (in thousands, except percentages) | 2023 | 2022 | ||||||||||||
| Revenues | $ | 1,218,555 | $ | 980,720 | ||||||||||
| Net loss | $ | (164,019) | $ | (76,748) | ||||||||||
| Adjustments to net loss: | ||||||||||||||
| Interest expense, net | 119,465 | 71,072 | ||||||||||||
| Amortization expense | 92,704 | 81,738 | ||||||||||||
| Change in fair value of contingent consideration | 61,083 | 32,307 | ||||||||||||
| Share-based compensation | 56,222 | 47,389 | ||||||||||||
| Transaction-related Partnership and integration expenses | 28,748 | 34,588 | ||||||||||||
| Severance | 18,514 | 1,255 | ||||||||||||
| Depreciation expense | 5,698 | 4,620 | ||||||||||||
| (Gain) loss on interest rate caps | 1,670 | (26,220) | ||||||||||||
| Income tax provision | 1,285 | 715 | ||||||||||||
Other(1) | 28,834 | 25,774 | ||||||||||||
| Adjusted EBITDA | $ | 250,204 | $ | 196,490 | ||||||||||
| Adjusted EBITDA Margin | 21 | % | 20 | % | ||||||||||
__________
(1) Other addbacks to Adjusted EBITDA include certain income and expenses that are considered to be non-recurring or non-operational, including certain recruiting costs, professional fees, litigation costs and bonuses. In 2022, these addbacks also included certain expenses related to remediation efforts.
Organic Revenue and Organic Revenue Growth
The following table reconciles Organic Revenue and Organic Revenue Growth to commissions and fees, which we consider to be the most directly comparable GAAP financial measure:
| For the Years Ended December 31, | ||||||||||||||
| (in thousands, except percentages) | 2023 | 2022 | ||||||||||||
| Commissions and fees | $ | 1,211,828 | $ | 980,720 | ||||||||||
Partnership commissions and fees(1) | (44,696) | (280,660) | ||||||||||||
| Organic Revenue | $ | 1,167,132 | $ | 700,060 | ||||||||||
Organic Revenue Growth(2) | $ | 187,213 | $ | 132,610 | ||||||||||
Organic Revenue Growth %(2) | 19 | % | 23 | % | ||||||||||
__________
(1) Includes the first twelve months of such commissions and fees generated from newly acquired Partners.
(2) Organic Revenue for the year ended December 31, 2022 used to calculate Organic Revenue Growth for the year ended December 31, 2023 was $979.9 million, which is adjusted to reflect revenues from Partnerships that reached the twelve-month owned mark during the year ended December 31, 2023.
55
Adjusted Net Income and Adjusted Diluted EPS
The following table reconciles Adjusted Net Income to net loss attributable to BRP Group and reconciles Adjusted Diluted EPS to diluted loss per share, which we consider to be the most directly comparable GAAP financial measures:
| For the Years Ended December 31, | ||||||||||||||
| (in thousands, except per share data) | 2023 | 2022 | ||||||||||||
| Net loss attributable to BRP Group | $ | (90,141) | $ | (41,772) | ||||||||||
| Net loss attributable to noncontrolling interests | (73,878) | (34,976) | ||||||||||||
| Amortization expense | 92,704 | 81,738 | ||||||||||||
| Change in fair value of contingent consideration | 61,083 | 32,307 | ||||||||||||
| Share-based compensation | 56,222 | 47,389 | ||||||||||||
| Transaction-related Partnership and integration expenses | 28,748 | 34,588 | ||||||||||||
| Severance | 18,514 | 1,255 | ||||||||||||
| (Gain) loss on interest rate caps, net of cash settlements | 12,588 | (24,012) | ||||||||||||
| Depreciation | 5,698 | 4,620 | ||||||||||||
| Amortization of deferred financing costs | 5,129 | 5,120 | ||||||||||||
Other(1) | 28,834 | 25,774 | ||||||||||||
| Adjusted pre-tax income | 145,501 | 132,031 | ||||||||||||
Adjusted income taxes(2) | 14,405 | 13,071 | ||||||||||||
| Adjusted Net Income | $ | 131,096 | $ | 118,960 | ||||||||||
| Weighted-average shares of Class A common stock outstanding - diluted | 60,135 | 56,825 | ||||||||||||
| Dilutive effect of unvested stock awards | 3,874 | 3,526 | ||||||||||||
Exchange of Class B common stock(3) | 53,132 | 55,450 | ||||||||||||
| Adjusted diluted weighted-average shares outstanding | 117,141 | 115,801 | ||||||||||||
| Adjusted Diluted EPS | $ | 1.12 | $ | 1.03 | ||||||||||
| Diluted loss per share | $ | (1.50) | $ | (0.74) | ||||||||||
| Effect of exchange of Class B common stock and net loss attributable to noncontrolling interests per share | 0.10 | 0.08 | ||||||||||||
| Other adjustments to loss per share | 2.64 | 1.80 | ||||||||||||
| Adjusted income taxes per share | (0.12) | (0.11) | ||||||||||||
| Adjusted Diluted EPS | $ | 1.12 | $ | 1.03 | ||||||||||
___________
(1) Other addbacks to Adjusted Net Income include certain income and expenses that are considered to be non-recurring or non-operational, including certain recruiting costs, professional fees, litigation costs and bonuses. In 2022, these addbacks also included certain expenses related to remediation efforts.
(2) Represents corporate income taxes at assumed effective tax rate of 9.9% applied to adjusted pre-tax income.
(3) Assumes the full exchange of Class B common stock for Class A common stock pursuant to the Amended LLC Agreement.
56
INSURANCE ADVISORY SOLUTIONS OPERATING GROUP RESULTS
The Insurance Advisory Solutions Operating Group (“IAS”) provides expertly-designed commercial risk management, employee benefits and private risk management solutions for businesses and high-net-worth individuals, as well as their families, through our national footprint which has assimilated some of the highest quality independent insurance brokers in the country with vast and varied strategic capabilities and expertise.
| For the Years Ended December 31, | Variance | |||||||||||||||||||||||||
| (in thousands, except percentages) | 2023 | 2022 | Amount | % | ||||||||||||||||||||||
Revenues: | ||||||||||||||||||||||||||
Commissions and fees | $ | 626,828 | $ | 558,776 | $ | 68,052 | 12 | % | ||||||||||||||||||
| Investment income | 3,637 | — | 3,637 | — | % | |||||||||||||||||||||
| Total revenues | 630,465 | 558,776 | 71,689 | 13 | % | |||||||||||||||||||||
Operating expenses: | ||||||||||||||||||||||||||
Commissions, employee compensation and benefits | 433,596 | 385,492 | 48,104 | 12 | % | |||||||||||||||||||||
Other operating expenses | 79,100 | 73,638 | 5,462 | 7 | % | |||||||||||||||||||||
Amortization expense | 51,568 | 50,209 | 1,359 | 3 | % | |||||||||||||||||||||
Change in fair value of contingent consideration | 41,481 | 26,429 | 15,052 | 57 | % | |||||||||||||||||||||
Depreciation expense | 1,462 | 1,476 | (14) | (1) | % | |||||||||||||||||||||
Total operating expenses | 607,207 | 537,244 | 69,963 | 13 | % | |||||||||||||||||||||
| Operating income | 23,258 | 21,532 | 1,726 | 8 | % | |||||||||||||||||||||
| Total other income (expense) | (106) | 497 | (603) | (121) | % | |||||||||||||||||||||
| Income before income taxes | $ | 23,152 | $ | 22,029 | $ | 1,123 | 5 | % | ||||||||||||||||||
Commissions and Fees
IAS generates commissions for placing insurance policies on behalf of its Insurance Company Partners. IAS generates profit-sharing income based on either the underlying book of business or performance, such as loss ratios. IAS also generates fees from consulting and service fee arrangements, which are in place with certain Clients for a negotiated fee.
IAS commissions and fees increased $68.1 million, or 12%, year over year to $626.8 million. Core commissions and fees grew organically by $58.9 million, which was driven by 17% sales velocity (new business as a percentage of prior year commissions and fees) and resultant net new business across Client industry sectors, as well as by growth arising from rate and exposure of 3%. Certain industries, such as construction, were impacted by a difficult financing environment, which caused a slowdown in job starts. Renewal business was impacted by rate increases across many property-related policies, partially offset by premium rate reductions in lines such as Directors and Officers Liability. IAS commissions and fees also increased from profit-sharing and other revenue of $9.3 million driven by improvements in performance against profit-sharing measures such as premium volumes and loss ratio-related parameters.
Commissions, Employee Compensation and Benefits
Commissions, employee compensation and benefits expense for IAS increased $48.1 million, or 12%, year over year. Colleague compensation, and benefits increased $33.7 million, or 9%, in correlation with our revenue growth. IAS commissions, employee compensation and benefits expense for 2023 also included $8.5 million related to contingent earnout liabilities that were reclassified, at the Partner's option, to an earnout incentive bonus that will be paid out to Colleagues.
Other Operating Expenses
Other operating expenses for IAS increased $5.5 million year over year, driven by our investment in technology to support our growth and integration activity of $6.2 million and travel and entertainment costs of $2.9 million. These increases were partially offset by lower costs for professional fees of $1.5 million, software and internet expenses of $1.3 million and consulting fees of $1.1 million.
57
Change in Fair Value of Contingent Consideration
Change in fair value of contingent consideration for IAS was a $41.5 million loss for the year ended December 31, 2023 as compared to a $26.4 million loss for the same period of 2022. The fair value loss related to contingent consideration for 2023 was impacted by positive changes in revenue growth trends of certain Partners and accretion of the contingent earnout obligations approaching their respective measurement dates.
UNDERWRITING, CAPACITY & TECHNOLOGY SOLUTIONS OPERATING GROUP RESULTS
The Underwriting, Capacity & Technology Solutions Operating Group (“UCTS”) consists of three distinct businesses. Through our MGA of the Future platform, we manufacture proprietary, technology-enabled insurance products with a focus on sheltered channels where our products deliver speed, ease of use and certainty of execution, an example of which is our national embedded renters insurance product sold at point of lease via integrations with property management software providers. Our MGA of the Future product suite is now comprised of more than 12 products across personal, commercial and specialty lines. Our specialty wholesale broker business delivers professionals, individuals and niche industry businesses expanded access to exclusive specialty markets, capabilities and programs requiring complex underwriting and placement. And in the third quarter of 2023, we launched our reinsurance brokerage business, Juniper Re.
| For the Years Ended December 31, | Variance | |||||||||||||||||||||||||
| (in thousands, except percentages) | 2023 | 2022 | Amount | % | ||||||||||||||||||||||
Revenues: | ||||||||||||||||||||||||||
Commissions and fees | $ | 418,014 | $ | 307,748 | $ | 110,266 | 36 | % | ||||||||||||||||||
| Investment income | 2,135 | — | 2,135 | — | % | |||||||||||||||||||||
| Total revenues | 420,149 | 307,748 | 112,401 | 37 | % | |||||||||||||||||||||
Operating expenses: | ||||||||||||||||||||||||||
Commissions, employee compensation and benefits | 311,708 | 218,859 | 92,849 | 42 | % | |||||||||||||||||||||
Other operating expenses | 44,663 | 31,313 | 13,350 | 43 | % | |||||||||||||||||||||
Amortization expense | 18,188 | 16,946 | 1,242 | 7 | % | |||||||||||||||||||||
Change in fair value of contingent consideration | 17,755 | 5,354 | 12,401 | 232 | % | |||||||||||||||||||||
Depreciation expense | 705 | 615 | 90 | 15 | % | |||||||||||||||||||||
Total operating expenses | 393,019 | 273,087 | 119,932 | 44 | % | |||||||||||||||||||||
| Operating income | 27,130 | 34,661 | (7,531) | (22) | % | |||||||||||||||||||||
| Total other income (expense) | 1,148 | (371) | 1,519 | n/m | ||||||||||||||||||||||
| Income before income taxes | $ | 28,278 | $ | 34,290 | $ | (6,012) | (18) | % | ||||||||||||||||||
__________
n/m not meaningful
Commissions and Fees
UCTS generates commissions for underwriting and placing insurance policies on behalf of its Insurance Company Partners. In addition, UCTS generates policy fee and installment fee revenue for acting in the capacity of an MGA and fulfilling certain administrative functions on behalf of Insurance Company Partners, including delivery of policy documents, processing payments and other administrative functions. UCTS also generates profit-sharing income, generally based on the profitability on the underlying book of business of the policies it generates on behalf of its Insurance Company Partners. Furthermore, UCTS generates fees from service fee arrangements, which are in place with certain customers for a negotiated fee.
UCTS commissions and fees increased $110.3 million, or 36%, year over year to $418.0 million. The increase is primarily attributable to higher core commissions and fees of $99.0 million, which was driven by continued outperformance in our multi-family business (accounting for $28 million of the year-over-year increase in core commissions and fees) and momentum in our homeowners and commercial umbrella products (accounting for $33 million and $17 million, respectively, of the year-over-year increase in core commissions and fees), with the remaining contribution attributable to new business across our other product lines. Profit-sharing and other revenue increased by $11.3 million driven by strong underwriting performance in our multi-family and homeowners product suite.
58
Commissions, Employee Compensation and Benefits
Commissions, employee compensation and benefits expense for UCTS includes both outside commissions paid to partners that distribute UCTS' MGA products and compensation paid primarily to Colleagues, and to a small extent, outside contractors. Commissions, employee compensation and benefits expense for UCTS increased $92.8 million year over year as a result of increases in outside commissions and other compensation. Outside commissions increased $55.8 million, or 36%, in line with the growth in UCTS commissions and fees. Colleague compensation, and benefits increased $27.9 million, or 45%, driven by continued investments in headcount to support the growth of existing and new products.
Other Operating Expenses
Other operating expenses for UCTS increased $13.4 million year over year, driven by continued investments in infrastructure to support the growth of the business of $10.1 million and payment processing fees for our MGA business of $1.5 million.
Change in Fair Value of Contingent Consideration
Change in fair value of contingent consideration for UCTS was a $17.8 million loss for the year ended December 31, 2023 as compared to a $5.4 million loss for the same period of 2022. The fair value loss related to contingent consideration for 2023 was impacted by positive changes in revenue growth trends of certain partners and accretion of the contingent earnout obligations approaching their respective measurement dates.
MAINSTREET INSURANCE SOLUTIONS OPERATING GROUP RESULTS
The Mainstreet Insurance Solutions Operating Group (“MIS”) offers personal insurance, commercial insurance, and life and health solutions to individuals and businesses in their communities, with a focus on accessing clients via sheltered distribution channels, which include, but are not limited to, new home builders, realtors, mortgage originators/lenders, master planned communities, and various other community centers of influence. MIS also offers consultation for government assistance programs and solutions, including traditional Medicare, Medicare Advantage and Affordable Care Act, to seniors and eligible individuals through a network of primarily independent contractor agents.
| For the Years Ended December 31, | Variance | |||||||||||||||||||||||||
| (in thousands, except percentages) | 2023 | 2022 | Amount | % | ||||||||||||||||||||||
Revenues: | ||||||||||||||||||||||||||
Commissions and fees | $ | 234,697 | $ | 157,038 | $ | 77,659 | 49 | % | ||||||||||||||||||
| Total revenues | 234,697 | 157,038 | 77,659 | 49 | % | |||||||||||||||||||||
Operating expenses: | ||||||||||||||||||||||||||
Commissions, employee compensation and benefits | 148,240 | 97,732 | 50,508 | 52 | % | |||||||||||||||||||||
Other operating expenses | 31,698 | 25,702 | 5,996 | 23 | % | |||||||||||||||||||||
Amortization expense | 22,848 | 14,578 | 8,270 | 57 | % | |||||||||||||||||||||
Change in fair value of contingent consideration | 1,847 | 524 | 1,323 | 252 | % | |||||||||||||||||||||
Depreciation expense | 570 | 278 | 292 | 105 | % | |||||||||||||||||||||
Total operating expenses | 205,203 | 138,814 | 66,389 | 48 | % | |||||||||||||||||||||
| Operating income | 29,494 | 18,224 | 11,270 | 62 | % | |||||||||||||||||||||
| Total other income | 30 | 28 | 2 | 7 | % | |||||||||||||||||||||
| Income before income taxes | $ | 29,524 | $ | 18,252 | $ | 11,272 | 62 | % | ||||||||||||||||||
Commissions and Fees
MIS generates commissions for placing insurance policies on behalf of its Insurance Company Partners. In addition, MIS generates profit-sharing income based on either the underlying book of business or performance, such as loss ratios. MIS also generates commissions and fees in the form of marketing income, which is earned through co-branded marketing campaigns with our Insurance Company Partners.
59
MIS commissions and fees increased $77.7 million, or 49%, year over year to $234.7 million. MIS core commissions and fees grew organically by $30.8 million driven by our legacy Mainstreet business (accounting for $8.6 million of the year-over-year increase in core commissions and fees), the national mortgage and real estate channel (accounting for $6.3 million of the year-over-year increase in core commissions and fees), and our Westwood Partner (accounting for $15.9 million of the year-over-year increase in core commissions and fees subsequent to reaching the twelve-month owned mark). MIS commissions and fees also grew $42.2 million from the impact of 2022 Partnerships for which there were no comparable revenues in the same period of 2022. In addition, MIS profit-sharing and other revenue increased by $4.8 million primarily resulting from improvements in loss ratios and the number of policies sold.
Commissions, Employee Compensation and Benefits
Commissions, employee compensation and benefits expense for MIS increased $50.5 million. or 52%, year over year, due in part to the correlation of compensation to our revenue growth and as a result of investing in our future as we continue to expand the distribution footprint of our national mortgage and real estate channel. Significant drivers of commissions, employee compensation and benefits expense include Colleague compensation and benefits, which increased $12.2 million, or 21%, and outside commissions, which increased $9.4 million, or 25%. The increase in commissions, employee compensation and benefits expense also includes $24.5 million attributable to the impact of 2022 Partnerships for which there was no comparable compensation expense in the same period of 2022.
Other Operating Expenses
Other operating expenses in MIS increased $6.0 million year over year, driven by higher lead generation fees relating to the expansion of our national mortgage and real estate channel of $4.3 million, investment in technology to support our growth of $2.5 million and travel and entertainment of $1.1 million. These increases were partially offset by lower costs for professional fees of $1.7 million.
Amortization Expense
Amortization expense in MIS increased $8.3 million year over year, primarily driven by the amortization of intangible assets recorded in connection with our Westwood Partnership.
Change in Fair Value of Contingent Consideration
The fair value loss related to contingent consideration for MIS of $1.8 million in 2023 was primarily related to our Westwood Partnership, which outperformed on our platform since the date of Partnership.
60
CORPORATE AND OTHER RESULTS
| For the Years Ended December 31, | Variance | |||||||||||||||||||||||||
| (in thousands, except percentages) | 2023 | 2022 | Amount | % | ||||||||||||||||||||||
Revenues: | ||||||||||||||||||||||||||
Commissions and fees | $ | (67,711) | $ | (42,842) | $ | (24,869) | 58 | % | ||||||||||||||||||
| Investment income | 955 | — | 955 | — | % | |||||||||||||||||||||
| Total revenues | (66,756) | (42,842) | (23,914) | 56 | % | |||||||||||||||||||||
Operating expenses: | ||||||||||||||||||||||||||
Commissions, employee compensation and benefits | 17,810 | 17,362 | 448 | 3 | % | |||||||||||||||||||||
Other operating expenses | 34,806 | 43,055 | (8,249) | (19) | % | |||||||||||||||||||||
Amortization expense | 100 | 5 | 95 | n/m | ||||||||||||||||||||||
Depreciation expense | 2,961 | 2,251 | 710 | 32 | % | |||||||||||||||||||||
Total operating expenses | 55,677 | 62,673 | (6,996) | (11) | % | |||||||||||||||||||||
| Operating loss | (122,433) | (105,515) | (16,918) | 16 | % | |||||||||||||||||||||
| Other income (expense): | ||||||||||||||||||||||||||
Interest expense, net | (119,652) | (71,334) | (48,318) | 68 | % | |||||||||||||||||||||
| Other income (expense), net | (1,603) | 26,245 | (27,848) | (106) | % | |||||||||||||||||||||
Total other expense | (121,255) | (45,089) | (76,166) | 169 | % | |||||||||||||||||||||
| Loss before income taxes | (243,688) | (150,604) | (93,084) | 62 | % | |||||||||||||||||||||
| Income tax expense | 1,170 | 715 | 455 | 64 | % | |||||||||||||||||||||
| Net loss | $ | (244,858) | $ | (151,319) | $ | (93,539) | 62 | % | ||||||||||||||||||
__________
n/m not meaningful
Commissions and Fees
The Corporate and Other non-reportable segment records the elimination of intercompany revenue from the Operating Groups. During 2023, UCTS recorded intercompany commissions and fees of $65.9 million related to the QBE Program Administrator Agreement and agency bill arrangements, and MIS recorded intercompany commissions of $1.8 million under agency bill and direct bill arrangements.
The substantial increase in intercompany commissions and fees year over year is related to the QBE Program Administrator Agreement, which was effective May 1, 2022. We expect revenue recognized from this agreement to continue to grow as we serve as the MGA on more intersegment revenue such as homeowners insurance sold through MIS.
Commissions, Employee Compensation and Benefits
The Corporate and Other non-reportable segment records the elimination of intercompany commissions, employee compensation and benefits expense from the Operating Groups. Corporate and Other commissions, employee compensation and benefits decreased from higher intercompany commissions expense elimination of $24.9 million, which was offset by higher severance expense of $13.0 million related to the retirement of two of our executive officers and Colleague terminations, and higher advisor commissions expense of $13.1 million.
A significant portion of the intercompany commissions, employee compensation and benefits expense recorded to Corporate and Other is related to the QBE Program Administrator Agreement. We expect commissions, employee compensation and benefits expense related to this agreement to continue to grow as we serve as the MGA on more intersegment revenue such as homeowners insurance sold through the MIS.
61
Other Operating Expenses
Other operating expenses in Corporate and Other decreased $8.2 million year over year driven by lower costs for travel and entertainment of $3.2 million, repairs and maintenance of $2.1 million, licenses and taxes of $1.6 million, advertising and marketing of $1.3 million and consulting fees of $1.1 million. These decreases were partially offset by higher costs for rent expense of $1.9 million.
Interest Expense, Net
Interest expense, net, increased by $48.3 million year over year resulting primarily from the higher interest rate environment and, to a lesser extent, higher average borrowings outstanding on our credit facility. We expect interest expense to increase slightly in 2024 as interest rates are expected to remain high in the near-term.
Other Income (Expense), Net
Other income (expense), net, decreased by $27.8 million year over year driven by a $26.2 million gain recognized on interest rate caps for 2022 in connection with rising interest rates and market estimates for future rate increases. Comparatively, we recognized a $1.7 million loss on interest rate caps for 2023.
LIQUIDITY AND CAPITAL RESOURCES
Our primary liquidity needs for the foreseeable future will include cash to (i) provide capital to facilitate the organic growth of our business and to fund future Partnerships, (ii) pay operating expenses, including cash compensation to our Colleagues and expenses related to being a public company, (iii) make payments under the Tax Receivable Agreement, (iv) pay interest and principal due on borrowings under the JPM Credit Agreement, (v) pay contingent earnout liabilities, (vi) pay income taxes, and (vii) fund potential investments in third party businesses that support the growth of our business, which may include the sponsorship of, and a minority, non-controlling interest in, an investment fund, the purpose of which may include facilitating the establishment of additional and alternative capacity that supports the growth of our MGA of the Future business.
We have historically financed our operations and funded our debt service through the sale of our insurance products and services, and we have financed significant cash needs to fund growth through the acquisition of Partners through debt and equity financing.
In the near term, we intend to fund our earnout obligations with cash and cash equivalents, cash flow from operations and available borrowings. During 2023, we increased our borrowings under the Term Loan B by $170.0 million and we used $165.0 million of the proceeds to partially repay outstanding amounts under the Revolving Facility, which increased our available borrowing capacity to pay our future earnout obligations. From time to time, we will consider raising additional debt or equity financing if and as necessary to support our growth, including in connection with the exploration of Partnership opportunities or to refinance existing obligations on an opportunistic basis.
As of December 31, 2023, our cash and cash equivalents were $116.2 million and we had $259.0 million of available borrowing capacity on the Revolving Facility under the JPM Credit Agreement. We believe that our cash and cash equivalents, cash flow from operations and available borrowings will be sufficient to fund our working capital and meet our commitments for the next twelve months and beyond.
See Item 1A. “Risk Factors—Risks Relating to our Business Operations and Industry—Partnerships have been, and may in the future continue to be, important to our growth. We may not be able to successfully identify and acquire Partners or integrate Partners into our company, and we may become subject to certain liabilities assumed or incurred in connection with our Partnerships that could harm our business, results of operations and financial condition.”
JPM Credit Agreement
As of December 31, 2023, our JPM Credit Agreement provides for senior secured credit facilities in an aggregate principal amount of $1.62 billion, which consists of (i) a term loan facility in the principal amount of $1.02 billion maturing in October 2027 (the “Term Loan B”) and (ii) a revolving credit facility with commitments in an aggregate principal amount of $600.0 million maturing in April 2027 (the “Revolving Facility”).
The Term Loan B accrues interest at term SOFR plus a credit spread adjustment between 11 bps and 43 bps based on the term SOFR rate plus an applicable margin of 350 bps, subject to a term SOFR floor of 50 bps. At December 31, 2023, the outstanding borrowings on the Term Loan B of $998.7 million had an applicable interest rate of 8.97%.
62
Borrowings under the Revolving Facility accrue interest at SOFR plus 210 bps to SOFR plus 310 bps based on total net leverage ratio. BRP will pay a letter of credit fee equal to the margin then in effect with respect to SOFR loans under the Revolving Facility multiplied by the daily amount available to be drawn under any letter of credit, a fronting fee and any customary documentary and processing charges for any letter of credit issued under the JPM Credit Agreement. The outstanding borrowings on the Revolving Facility of $341.0 million had an applicable interest rate of 8.46% at December 31, 2023. The Revolving Facility is also subject to a commitment fee of 0.40% on the unused capacity at December 31, 2023.
We have entered into interest rate cap agreements to limit the potential impact of interest rate changes on cash flows. The interest rate caps limit the variability of the base rate to the amount of the cap. The interest rate cap agreements in place at December 31, 2023 mitigate the interest rate volatility on $300.0 million of debt to a maximum base rate of 1.50% through March 2024 and mitigate the interest rate volatility on $1.2 billion of debt to a maximum base rate of 7.00% through November 2025.
The Revolving Facility and the Term Loan B are collateralized by a first priority lien on substantially all the assets of BRP, including a pledge of all equity securities of certain of its subsidiaries. The JPM Credit Agreement contains covenants that, among other things, restrict our ability to make certain restricted payments, incur additional debt, engage in certain asset sales, mergers, acquisitions or similar transactions, create liens on assets, engage in certain transactions with affiliates, change our business, make certain investments or restrict BRP’s ability to make dividends or other distributions to BRP Group. In addition, the JPM Credit Agreement contains financial covenants requiring us to maintain our Total First Lien Net Leverage Ratio (as defined in the JPM Credit Agreement) at or below 7.00 to 1.00.
Contractual Obligations and Commitments
The following table represents our contractual obligations and commitments, aggregated by type, at December 31, 2023:
| Payments Due by Period | |||||||||||||||||||||||||||||
| (in thousands) | Total | Less than 1 year | 1-3 years | 3-5 years | More than 5 years | ||||||||||||||||||||||||
Operating leases(1) | $ | 111,197 | $ | 21,499 | $ | 39,532 | $ | 32,422 | $ | 17,744 | |||||||||||||||||||
Debt obligations payable(2) | 1,766,074 | 128,209 | 253,661 | 1,384,204 | — | ||||||||||||||||||||||||
Undiscounted estimated contingent earnout obligation(3) | 308,997 | 233,433 | 75,564 | — | — | ||||||||||||||||||||||||
| USF Grant | 4,200 | 848 | 1,720 | 1,632 | — | ||||||||||||||||||||||||
| Total | $ | 2,190,468 | $ | 383,989 | $ | 370,477 | $ | 1,418,258 | $ | 17,744 | |||||||||||||||||||
__________
(1) Represents noncancelable operating leases for our facilities, including operating leases classified as held for sale on the consolidated balance sheet at December 31, 2023. Operating lease expense was $23.2 million and $19.9 million for the years ended December 31, 2023 and 2022, respectively.
(2) Represents scheduled debt obligation and interest payments under the JPM Credit Agreement.
(3) Represents the total expected future payments to be made to Partners at December 31, 2023.
Our contractual obligations and commitments are comprised of operating lease obligations, principal and interest payments on our borrowings under the JPM Credit Agreement, potential payments of contingent earnout liabilities and our commitment to the University of South Florida (“USF”).
Our operating lease obligations represent noncancelable agreements for our corporate headquarters and office space for our insurance brokerage business. Our operating lease agreements expire through February 2031. These obligations do not include leases with an initial term of twelve months or less, which are expensed as incurred. We may extend, terminate or otherwise modify or sub-lease facilities as needed to best suit the needs of our business. The lease term is the non-cancelable period of the lease and includes options to extend or terminate the lease when it is reasonably certain that an option will be exercised.
Borrowings under our JPM Credit Agreement include $998.7 million under the Term Loan B and $341.0 million on the Revolving Facility. Interest payable on outstanding borrowings on the Term Loan B and Revolving Facility in the table above was calculated based on applicable interest rates at December 31, 2023 of 8.97% and 8.46%, respectively, through their respective maturity dates of October 2027 and April 2027.
63
Substantially all of our Partnerships and certain acquisitions of select books of business that do not constitute a complete business enterprise include contractual earnout provisions. We record an estimation of the fair value of the contingent earnout obligations at the Partnership date as a component of the consideration paid. Our contingent earnout obligations are measured at fair value each reporting period based on the present value of the expected future payments to be made to Partners in accordance with the provisions outlined in the respective purchase agreements. The recorded obligations are based on estimates of the Partners’ future performance using financial projections for the earnout measurement period. The aggregate estimated contingent earnout liabilities included on our consolidated balance sheet at December 31, 2023 was $276.5 million, of which $10.8 million must be settled in cash and the remaining $265.7 million can be settled in cash or stock at our option. The undiscounted estimated contingent earnout obligation presented in the table above represents the total expected future payments to be made to the Partners. The undiscounted estimated contingent earnout obligation at December 31, 2023 was $309.0 million, of which $11.9 million must be settled in cash and the remaining $297.1 million can be settled in cash or stock at our option. The maximum estimated exposure to the contingent earnout liabilities was $607.4 million at December 31, 2023.
As of December 31, 2023, we have a remaining commitment to USF to donate $4.2 million through October 2028. The gift will provide support for the School of Risk Management and Insurance in the USF Muma College of Business. It is currently anticipated that Lowry Baldwin, the Company's Chairman, will fund half of this commitment.
Effects of Inflation
Certain of our lease agreements feature annual rent escalations either fixed or based on a consumer price index or other index, which, historically, have not had a material impact on our results of operations, including our results of operations for the years ended December 31, 2023, 2022 and 2021. Given the recent rise in inflation, we anticipate the inflation rate increase for the upcoming year to be higher than those of past years. Despite this anticipated increase, we do not anticipate the inflation rate increase for 2024 to have a material impact on our results of operations. We have monitored and will continue to monitor the components of compensation costs and operating expenses for the potential impact of inflation.
Off-Balance Sheet Arrangements
We do not invest in any off-balance sheet vehicles that provide liquidity, capital resources, market or credit risk support, or engage in any activities that expose us to any liability that is not reflected in our consolidated financial statements except for those described under this Liquidity and Capital Resources section.
Dividend Policy
Assuming BRP makes distributions to its members in any given year, the determination to pay dividends, if any, to our Class A common stockholders out of the portion, if any, of such distributions remaining after our payment of taxes, Tax Receivable Agreement payments and expenses (any such portion, an “excess distribution”) will be made at the sole discretion of our board of directors. Our board of directors may change our dividend policy at any time. Refer to Item 5. Market for Registrant’s Common Equity, Related Stockholder Matters and Issuer Purchases of Equity Securities—Dividend Policy for additional information.
Tax Receivable Agreement
BRP Group is a party to the Tax Receivable Agreement with BRP’s LLC Members that provides for the payment by BRP Group to BRP’s LLC Members of 85% of the amount of cash savings, if any, in U.S. federal, state and local income tax or franchise tax that BRP Group actually realizes as a result of (i) any increase in tax basis in BRP assets resulting from (a) previous acquisitions by BRP Group of LLC Units from BRP’s LLC Members, (b) the acquisition of LLC Units from BRP’s LLC Members using the net proceeds from any future offering, (c) redemptions or exchanges by BRP’s LLC Members of LLC Units and the corresponding number of shares of Class B common stock for shares of Class A common stock or cash or (d) payments under the Tax Receivable Agreement, and (ii) tax benefits related to imputed interest resulting from payments made under the Tax Receivable Agreement.
64
Holders of LLC Units (other than BRP Group) may, subject to certain conditions and transfer restrictions described above, redeem or exchange their LLC Units for shares of Class A common stock of BRP Group on a one-for-one basis. BRP intends to make an election under Section 754 of the Internal Revenue Code of 1986, as amended, and the regulations thereunder (the “Code”) effective for each taxable year in which a redemption or exchange of LLC Units for shares of Class A common stock occurs, which is expected to result in increases to the tax basis of the assets of BRP at the time of a redemption or exchange of LLC Units. The redemptions or exchanges are expected to result in increases in the tax basis of the tangible and intangible assets of BRP. These increases in tax basis may reduce the amount of tax that BRP Group would otherwise be required to pay in the future. The Tax Receivable Agreement with BRP’s LLC Members provides for the payment by us to BRP’s LLC Members of 85% of the amount of cash savings, if any, in U.S. federal, state and local income tax or franchise tax that BRP Group actually realizes as a result of the transactions listed in the preceding paragraph. This payment obligation is an obligation of BRP Group and not of BRP. For purposes of the Tax Receivable Agreement, the cash tax savings in income tax will be computed by comparing the actual income tax liability of BRP Group (calculated with certain assumptions) to the amount of such taxes that BRP Group would have been required to pay had there been no increase to the tax basis of the assets of BRP as a result of the redemptions or exchanges and had BRP Group not entered into the Tax Receivable Agreement. Estimating the amount of payments that may be made under the Tax Receivable Agreement is by its nature imprecise, insofar as the calculation of amounts payable depends on a variety of factors. The actual increase in tax basis, as well as the amount and timing of any payments under the Tax Receivable Agreement, will vary depending upon a number of factors, including the timing of redemptions or exchanges, the price of shares of our Class A common stock at the time of the redemption or exchange, the extent to which such redemptions or exchanges are taxable, the amount and timing of our income, the tax rates then applicable and the portion of our payments under the Tax Receivable Agreement constituting imputed interest. We account for the effects of these increases in tax basis and associated payments under the Tax Receivable Agreement arising from future redemptions or exchanges as follows:
•we record an increase in deferred tax assets for the estimated income tax effects of the increases in tax basis based on enacted federal and state tax rates at the date of the redemption or exchange;
•to the extent we estimate that we will not realize the full benefit represented by the deferred tax asset, based on an analysis that will consider, among other things, our expectation of future earnings, we reduce the deferred tax asset with a valuation allowance; and
•we record 85% of the estimated realizable tax benefit (which is the recorded deferred tax asset less any recorded valuation allowance) as an increase to the liability due under the Tax Receivable Agreement and the remaining 15% of the estimated realizable tax benefit as an increase to additional paid-in capital.
All of the effects of changes in any of our estimates after the date of the redemption or exchange will be included in net income. Similarly, the effect of subsequent changes in the enacted tax rates will be included in net income.
During 2023, we exchanged 2,082,424 LLC Units of BRP on a one-for-one basis for shares of BRP Group's Class A common stock and cancelled the corresponding shares of BRP Group's Class B common stock. We receive an increase in our share of the tax basis in the net assets of BRP due to the interests being redeemed. We have assessed the realizability of the net deferred tax assets and in that analysis have considered the relevant positive and negative evidence available to determine whether it is more likely than not that some portion or all of the deferred tax assets will be realized. We have recorded a full valuation allowance against the deferred tax assets at BRP Group as of December 31, 2023, which will be maintained until there is sufficient evidence to support the reversal of all or some portion of these allowances.
Deferred Tax Assets
To determine the realizability of our deferred tax assets, we analyzed if the Company was in a cumulative pre-tax income or loss position over a three-year period (2021, 2022 and 2023). Based on the analysis, the Company is in a pre-tax book loss position, and therefore we have determined that its deferred tax assets are not more likely than not to be realized. Accordingly, we maintain a full valuation allowance against our deferred tax assets. As the Company emerges from its cumulative loss position, we will reassess the realizability of our deferred tax assets and the necessity for a full valuation allowance.
65
Sources and Uses of Cash
The following table summarizes our cash flows from operating, investing and financing activities for the periods indicated:
| For the Years Ended December 31, | Variance | ||||||||||||||||
| (in thousands) | 2023 | 2022 | |||||||||||||||
| Net cash provided by (used in) operating activities | $ | 44,644 | $ | (2,462) | $ | 47,106 | |||||||||||
| Net cash used in investing activities | (21,922) | (414,357) | 392,435 | ||||||||||||||
| Net cash provided by (used in) financing activities | (26,230) | 419,553 | (445,783) | ||||||||||||||
| Net increase (decrease) in cash and cash equivalents and restricted cash | (3,508) | 2,734 | (6,242) | ||||||||||||||
Cash and cash equivalents and restricted cash at beginning of year | 230,471 | 227,737 | 2,734 | ||||||||||||||
Cash and cash equivalents and restricted cash at end of year | $ | 226,963 | $ | 230,471 | $ | (3,508) | |||||||||||
Operating Activities
The primary sources and uses of cash for operating activities are net income (loss) adjusted for non-cash items and changes in assets and liabilities, or operating working capital, and payment of contingent earnout consideration. Net cash provided by operating activities increased $47.1 million year over year, driven by an increase in cash related to lower contingent earnout consideration payments in excess of the liability recognized at the acquisition date of $25.6 million and better operating leverage year over year.
Investing Activities
The primary sources and uses of cash for investing activities relate to cash consideration paid to fund Partnerships and other investments to grow our business. Net cash used in investing activities decreased $392.4 million year over year, driven by a decrease in cash consideration paid for Partnership activity of $389.2 million as a result of an overall decrease in Partnership activity during 2023.
Financing Activities
The primary sources and uses of cash for financing activities relate to the issuance of our Class A common stock; debt servicing costs in connection with the JPM Credit Agreement, as well as purchases, sales and settlements of interest rate caps to mitigate interest rate volatility on that debt; payment of contingent earnout consideration; and other equity transactions. Net cash provided by financing activities decreased $445.8 million year over year to net cash used in financing activities of $26.2 million, driven by a decrease in net proceeds from borrowings on our credit facilities of $464.9 million, offset in part by an increase in cash from fewer payments of contingent earnout consideration up to the amount of purchase price accrual of $20.4 million.
RECENT ACCOUNTING PRONOUNCEMENTS
Please refer to Note 1 to our consolidated financial statements included in Item 8. Financial Statements and Supplementary Data of this Annual Report on Form 10-K for a discussion of recent accounting pronouncements that may impact us.
66
CRITICAL ACCOUNTING POLICIES AND ESTIMATES
Our consolidated financial statements are prepared in accordance with GAAP, which requires management to make estimates, judgments and assumptions that affect the reported amounts of assets and liabilities and disclosures of contingent assets and liabilities at the date of the financial statements and the reported amounts of revenues and expenses during the reporting period. Our estimates, judgments and assumptions are continually evaluated based on historical experience, known or expected trends, independent valuations and other factors we believe to be reasonable under the circumstances. As future events and their effects cannot be determined with precision, actual results could differ significantly from these estimates. Our most critical accounting policies and estimates, as discussed below, govern the more significant judgments and estimates used in the preparation of our consolidated financial statements.
Critical Accounting Policies
Revenue Recognition
Commission revenue is earned at a point in time upon the effective date of bound insurance coverage, as no performance obligation exists after coverage is bound. The Company makes its best estimate of direct bill commissions at the policy effective date, particularly in employee benefits within IAS, which is subject to change based on enrollment and other factors over the policy period.
Commission revenue is recorded net of an allowance for estimated policy cancellations. The allowance for estimated policy cancellations is determined based on an evaluation of historical and current cancellation data.
Medicare contracts in the Mainstreet Insurance Solutions Operating Group are multi-year arrangements in which we are entitled to renewal commissions. However, we have applied a constraint to renewal commissions that limits revenue recognized when a risk of significant reversals exists based on: (i) historical renewal patterns; and (ii) the influence of external factors outside of our control, including policyholder discretion over plans and Insurance Company Partner relationship, political influence, and a contractual provision, which limits our right to receive renewal commissions to ongoing compliance and regulatory approval of the relevant Insurance Company Partner and compliance with the Centers for Medicare and Medicaid Services.
Profit-sharing commissions represent a form of variable consideration, which includes additional commissions over base commissions received from Insurance Company Partners. A constraint of variable consideration is necessary when commissions and fees are subject to significant reversal. Profit-sharing commissions associated with loss performance are uncertain, and therefore, are subject to significant reversal as loss data remains subject to material change. Management estimates profit-sharing commissions using historical outcomes and known trends impacting premium volume or loss ratios, subject to a constraint. The constraint is relieved when management estimates commissions and fees that are not subject to significant reversal, which often coincides with the earlier of written notification from the Insurance Company Partner that the target has been achieved or cash collection. Year-end amounts incorporate estimates subject to a constraint or where applicable, are based on confirmation from Insurance Company Partners after calculation of premium volume or loss ratios that are impacted by catastrophic losses.
Costs to obtain contracts includes compensation in the form of producer commissions paid on new business. These incremental costs are capitalized as deferred commission expense and amortized over five years, which represents management’s estimate of the average period over which a Client maintains its initial coverage relationship with the original Insurance Company Partner.
The nature of estimates used in recognizing commissions and fees revenue do not involve a significant level of subjectivity, judgment, or estimation uncertainty that could have a material impact on the Company's results of operations.
Critical Accounting Estimates
We have determined that there are significant judgments and uncertainties included in the application of guidance for impairment of intangible assets and goodwill; valuation of contingent consideration; and valuation allowance for deferred tax assets. The nature of the estimates and assumptions used and the impact the estimates and assumptions could have on our actual results are discussed in the tables below.
67
| Description | Judgments and Uncertainties | Effect if Actual Results Differ from Assumptions | ||||||||||||
| Impairment of Intangible Assets | ||||||||||||||
| We evaluate our definite-lived intangible assets for impairment whenever events or changes in circumstances indicate that the carrying amount of such assets may not be recoverable. These events and circumstances include, but are not limited to: higher than expected attrition for relationships; a current expectation that an intangible asset will be disposed of significantly before the end of its previously estimated useful life, such as when we classify a business as held for sale; or a significant adverse change in the extent or manner in which we use an intangible asset. Undiscounted cash flow analyses are used to determine if impairment exists; if impairment is determined to exist, the loss is calculated based on estimated fair value. | Our impairment evaluations require us to apply judgment in determining whether a triggering event has occurred, including the evaluation of whether it is more-likely-than-not that a intangible asset will be disposed of significantly before the end of its previously estimated useful life. Incorrect estimation of useful lives may result in inaccurate amortization charges over future periods leading to future impairment. Our impairment loss calculations contain uncertainties because they require management to make assumptions and to apply judgment to estimate future cash flows and asset fair values, including forecasting useful lives of the assets and selecting the discount rate that reflects the risk inherent in future cash flows. | During the last three years, we have not made any changes in the accounting methodology used to evaluate the impairment of intangible assets or to estimate the useful lives of our intangible assets. At December 31, 2023, we had $1.0 billion of intangible assets, which are included in each of our reporting units at the following amounts: Insurance Advisory Solutions—$678.2 million Underwriting, Capacity & Technology Solutions—$109.4 million Mainstreet Insurance Solutions—$221.7 million We performed a qualitative analysis of each of our asset groups as of October 1, 2023 and determined that there were no events or changes in circumstances that had occurred to indicate that the carrying amount of our intangible assets may not be recoverable. The Company also determined there were no triggering events through December 31, 2023 that would cause the Company to perform an interim period analysis. We did not record impairment charges for intangible assets in 2023, 2022 or 2021. | ||||||||||||
68
| Description | Judgments and Uncertainties | Effect if Actual Results Differ from Assumptions | ||||||||||||
| Impairment of Goodwill | ||||||||||||||
| Goodwill is not amortized but rather tested at least annually for impairment, or more often if events or changes in circumstances indicate it is more-likely-than-not that the carrying amount of the asset may not be recoverable. Goodwill is tested for impairment at the reporting unit level, which represents the operating segment. Goodwill is tested for impairment by either performing a qualitative evaluation or a quantitative test. The qualitative evaluation is an assessment of factors to determine whether it is more-likely-than-not that the fair value of a reporting unit is less than its carrying amount, including goodwill. We may elect not to perform the qualitative assessment for some or all of our reporting units and instead perform a quantitative impairment test. We estimate the fair value of each reporting unit using a combination of the income approach and the market approach. The income approach incorporates the use of a discounted cash flow method in which the estimated future cash flows and terminal value are calculated for each reporting unit and then discounted to present value using an appropriate discount rate. | Our impairment evaluations require us to apply judgment in determining whether a triggering event has occurred. The valuation of our reporting units requires significant judgment in evaluation of recent indicators of market activity and estimated future cash flows, discount rates, and other factors. Our impairment analyses contain inherent uncertainties due to uncontrollable events that could positively or negatively impact anticipated future economic and operating conditions. In making these estimates, the weighted-average cost of capital is utilized to calculate the present value of future cash flows and terminal value. Many variables go into estimating future cash flows, including estimates of our future revenue growth and operating results. When estimating our projected revenue growth and future operating results, we consider industry trends, economic data, and our competitive advantage. The market approach estimates fair value of a reporting unit by using market comparables for reasonably similar public companies. | During the last three years, we have not made any changes in the accounting methodology used to evaluate impairment of goodwill. At December 31, 2023, we had $1.4 billion of goodwill. Our goodwill is included in each of our Operating Groups at the following amounts: Insurance Advisory Solutions—$906.1 million Underwriting, Capacity & Technology Solutions—$261.9 million Mainstreet Insurance Solutions—$244.3 million A quantitative goodwill impairment analysis was performed for each of our reporting units as of October 1, 2023. Based on these studies, the implied fair value of each of our reporting units was substantially in excess of its carrying value. Therefore, we concluded there were no indicators of impairment. A hypothetical 10% decrease in the estimated fair value of any of our reporting units would not have resulted in a different conclusion. | ||||||||||||
69
| Description | Judgments and Uncertainties | Effect if Actual Results Differ from Assumptions | ||||||||||||
| Valuation of Contingent Consideration | ||||||||||||||
Substantially all of our Partnerships and certain acquisitions of select books of business that do not constitute a complete business enterprise include contingent consideration arrangements, which are based on the acquired company achieving thresholds related to revenues, total insured value or number of rented units. The structure of these contingent earn-out arrangements can reduce the risk of overpaying for acquisitions if the projected financial results are not achieved. The fair values of these contingent consideration arrangements are included as part of the purchase price of the acquired companies on their respective acquisition dates. For each transaction, we estimate the fair value of contingent earnout payments as part of the initial purchase price and record the estimated fair value of contingent consideration as a liability on the consolidated balance sheets. The fair values of the earnout arrangements are estimated by discounting the expected future contingent payments to present value using a variation of the income approach, specifically using a Monte Carlo Simulation approach. We have 26 Partners with a corresponding contingent consideration liability still outstanding at December 31, 2023. | The fair value of the contingent consideration arrangements is estimated by simulating the metrics corresponding to a payment using a Monte Carlo Simulation approach and discounting the expected future contingent payments to present value. The key assumptions used in our valuation were: (i) forecast of revenue, total insured value or number of rented units, (ii) the volatility associated with the revenues, total insured value or number of rented units, (iii) risk-adjusted discount rate applied to forecasted revenues, total insured value or number of rented units, and (iv) the credit-adjusted discount rate related to the payment of the contingent consideration. These estimates are influenced by many factors, including historical financial information, guideline public company data, and management's expectations for future revenue of the acquired businesses, total insured value and number of rented units, as well as market conditions, economic conditions and the company’s performance. Changes in these inputs could have a significant impact on the fair value of the contingent consideration liability. | We review and re-assess the estimated fair value of contingent consideration on a quarterly basis, and the updated fair value could be materially different from the initial estimates or prior quarterly amounts. Any changes in the estimated fair value of contingent considerations and adjustments to the estimated fair value related to unobservable inputs will be recognized within change in fair value of contingent consideration in the consolidated statements of comprehensive loss. We recognized $61.1 million of expense related to the change in fair value of contingent consideration in 2023. At December 31, 2023, we recorded $276.5 million of contingent consideration liabilities related to the 26 contingent consideration arrangements still outstanding and the total potential maximum of the contingent consideration payments is $607.4 million. If all remaining revenue, insured value and rental units targets were achieved, our Partners would be entitled to payments of up to $408.8 million in calendar year 2024 for achieving targets through September 30, 2024; $188.5 million in calendar year 2025 for achieving targets through September 30, 2025; and $10.0 million in calendar year 2026 for achieving targets through September 30, 2026. If the actual achievement of contingent consideration payments in 2024 through 2026 was at the maximum target amounts, we would record an additional $330.9 million of expense over the next three years. | ||||||||||||
70
| Description | Judgments and Uncertainties | Effect if Actual Results Differ from Assumptions | ||||||||||||
Valuation Allowance for Deferred Tax Assets | ||||||||||||||
| We record a tax provision for the anticipated tax consequences of the reported results of operations. We compute the provision for income taxes using the asset and liability method, under which deferred tax assets and liabilities are recognized for the expected future tax consequences of temporary differences between the financial reporting and tax bases of assets and liabilities, and for operating losses and tax credit carryforwards. We measure deferred tax assets and liabilities using the currently enacted tax rates in each jurisdiction that applies to taxable income in effect for the years in which those tax assets are expected to be realized or settled. We are required to establish a valuation allowance for deferred tax assets and record a charge to income if it is determined, based on available evidence at the time the determination is made, that it is more likely than not that some portion or all of the deferred tax assets will not be realized. | Our evaluation of the realizability of the deferred tax assets contains uncertainties because it requires management to make assumptions and to apply judgment to estimate future taxable income or loss. Many variables go into estimating future taxable income or loss, including estimates of our future revenue growth and management's expectations of ongoing investments. Our evaluation also requires management to consider significant, objective evidence to determine if it is more likely than not that we will be able to realize our deferred tax assets in the future. Considerations include recent results of operations, projected future taxable income, tax-planning strategies, potential changes in tax law and rates, and future reversals of existing taxable temporary differences. | During the last three years, we have not made any changes in the accounting methodology used to evaluate the realizability of the deferred tax assets. We review and re-assess our cumulative three-year loss before income taxes on a quarterly basis. Deferred tax assets have been reduced by a full valuation allowance at December 31, 2023 due to a determination that it is more likely than not that all of the deferred tax assets will not be realized based on the weight of all available evidence. If we had concluded that it was more likely than not that the full deferred tax assets will be realized, our valuation allowance would have been reversed and we would have recognized deferred tax assets of approximately $140.1 million on our consolidated balance sheet at December 31, 2023. If we did not have a valuation allowance established, we would have recognized an income tax benefit of approximately $19.3 million for the year ended December 31, 2023. | ||||||||||||
71
ITEM 7A. QUANTITATIVE AND QUALITATIVE DISCLOSURES ABOUT MARKET RISK
Market risk is the potential loss arising from adverse changes in market rates and prices, such as premium amounts, interest rates and equity prices. We are exposed to market risk through our investments and borrowings under the JPM Credit Agreement. We use derivative instruments to mitigate our risk related to the effect of rising interest rates on our cash flows. However, we do not use derivative instruments for trading or speculative purposes.
Our invested assets are held primarily as cash and cash equivalents and restricted cash. To a lesser extent, we may also utilize certificates of deposit, U.S. treasury securities and professionally managed short duration fixed income funds. These investments are subject to market risk. The fair values of our invested assets at December 31, 2023 and 2022 approximated their respective carrying values due to their short-term duration and therefore, such market risk is not considered to be material.
At December 31, 2023, we had $998.7 million and $341.0 million of borrowings outstanding under the Term Loan B and the Revolving Facility, respectively. These borrowings bear interest on a floating basis tied to either the prime rate or one of various other variable rates as defined in the JPM Credit Agreement. The variable rate currently in effect for each of the Term Loan B and the Revolving Facility is SOFR. The Term Loan B accrues interest at term SOFR plus a credit spread adjustment between 11 bps and 43 bps based on the term SOFR rate plus an applicable margin of 350 bps, subject to a term SOFR floor of 50 bps. Borrowings under the Revolving Facility accrue interest at SOFR plus 210 bps to SOFR plus 310 bps based on total net leverage ratio.
We have entered into interest rate cap agreements to limit the potential impact of interest rate changes on cash flows. The interest rate caps limit the variability of the base rate to the amount of the cap. The interest rate cap agreements in place at December 31, 2023 mitigate the interest rate volatility on $300.0 million of debt to a maximum base rate of 1.50% through March 2024 and mitigate the interest rate volatility on $1.2 billion of debt to a maximum base rate of 7.00% through November 2025. Taking the interest rate cap agreements into consideration, an increase of 100 basis points on the variable interest rates in effect at December 31, 2023 would increase our annual interest expense for the JPM Credit Agreement by $10.4 million.
72
ITEM 8. FINANCIAL STATEMENTS AND SUPPLEMENTARY DATA
| Page | ||||||||
Report of Independent Registered Public Accounting Firm (PCAOB ID: | ||||||||
| BRP Group, Inc. Consolidated Financial Statements | ||||||||
| Notes to Consolidated Financial Statements | ||||||||
Report of Independent Registered Public Accounting Firm
To the Board of Directors and Stockholders of BRP Group, Inc.
Opinions on the Financial Statements and Internal Control over Financial Reporting
We have audited the accompanying consolidated balance sheets of BRP Group, Inc. and its subsidiaries (the “Company”) as of December 31, 2023 and 2022, and the related consolidated statements of comprehensive loss, of stockholders’ equity and mezzanine equity and of cash flows for each of the three years in the period ended December 31, 2023, including the related notes (collectively referred to as the “consolidated financial statements”). We also have audited the Company's internal control over financial reporting as of December 31, 2023, based on criteria established in Internal Control - Integrated Framework (2013) issued by the Committee of Sponsoring Organizations of the Treadway Commission (COSO).
In our opinion, the consolidated financial statements referred to above present fairly, in all material respects, the financial position of the Company as of December 31, 2023 and 2022, and the results of its operations and its cash flows for each of the three years in the period ended December 31, 2023 in conformity with accounting principles generally accepted in the United States of America. Also in our opinion, the Company maintained, in all material respects, effective internal control over financial reporting as of December 31, 2023, based on criteria established in Internal Control - Integrated Framework (2013) issued by the COSO.
Basis for Opinions
The Company's management is responsible for these consolidated financial statements, for maintaining effective internal control over financial reporting, and for its assessment of the effectiveness of internal control over financial reporting, included in Management’s Annual Report on Internal Control Over Financial Reporting appearing under Item 9A. Our responsibility is to express opinions on the Company’s consolidated financial statements and on the Company's internal control over financial reporting based on our audits. We are a public accounting firm registered with the Public Company Accounting Oversight Board (United States) (PCAOB) and are required to be independent with respect to the Company in accordance with the U.S. federal securities laws and the applicable rules and regulations of the Securities and Exchange Commission and the PCAOB.
We conducted our audits in accordance with the standards of the PCAOB. Those standards require that we plan and perform the audits to obtain reasonable assurance about whether the consolidated financial statements are free of material misstatement, whether due to error or fraud, and whether effective internal control over financial reporting was maintained in all material respects.
Our audits of the consolidated financial statements included performing procedures to assess the risks of material misstatement of the consolidated financial statements, whether due to error or fraud, and performing procedures that respond to those risks. Such procedures included examining, on a test basis, evidence regarding the amounts and disclosures in the consolidated financial statements. Our audits also included evaluating the accounting principles used and significant estimates made by management, as well as evaluating the overall presentation of the consolidated financial statements. Our audit of internal control over financial reporting included obtaining an understanding of internal control over financial reporting, assessing the risk that a material weakness exists, and testing and evaluating the design and operating effectiveness of internal control based on the assessed risk. Our audits also included performing such other procedures as we considered necessary in the circumstances. We believe that our audits provide a reasonable basis for our opinions.
74
Definition and Limitations of Internal Control over Financial Reporting
A company’s internal control over financial reporting is a process designed to provide reasonable assurance regarding the reliability of financial reporting and the preparation of financial statements for external purposes in accordance with generally accepted accounting principles. A company’s internal control over financial reporting includes those policies and procedures that (i) pertain to the maintenance of records that, in reasonable detail, accurately and fairly reflect the transactions and dispositions of the assets of the company; (ii) provide reasonable assurance that transactions are recorded as necessary to permit preparation of financial statements in accordance with generally accepted accounting principles, and that receipts and expenditures of the company are being made only in accordance with authorizations of management, acting under the authority delegated to them by the Board; and (iii) provide reasonable assurance regarding prevention or timely detection of unauthorized acquisition, use, or disposition of the company’s assets that could have a material effect on the financial statements.
Because of its inherent limitations, internal control over financial reporting may not prevent or detect misstatements. Also, projections of any evaluation of effectiveness to future periods are subject to the risk that controls may become inadequate because of changes in conditions, or that the degree of compliance with the policies or procedures may deteriorate.
Critical Audit Matter
The critical audit matter communicated below is a matter arising from the current period audit of the consolidated financial statements that was communicated or required to be communicated to the audit committee and that (i) relates to accounts or disclosures that are material to the consolidated financial statements and (ii) involved our especially challenging, subjective, or complex judgments. The communication of critical audit matters does not alter in any way our opinion on the consolidated financial statements, taken as a whole, and we are not, by communicating the critical audit matter below, providing a separate opinion on the critical audit matter or on the accounts or disclosures to which it relates.
Valuation of Contingent Earnout Liabilities
As described in Note 19 to the consolidated financial statements, the Company’s contingent earnout liabilities balance was $276.5 million as of December 31, 2023. The fair value of the contingent earnout liabilities is based on Monte Carlo simulations that measure the present value of the expected future payments to be made to acquired companies or producers (“Partners”) in accordance with the provisions outlined in the respective purchase agreements. In determining the fair value, management estimates the Partner’s future performance using financial projections developed for the Partner and market participant assumptions that were derived for revenue growth, the number of rental units tracked or the insured value of sourced homeowners insurance. Management estimates future payments using the earnout formula and performance targets specified in each purchase agreement and the financial projections. These payments are discounted to present value using a risk-adjusted rate.
The principal considerations for our determination that performing procedures relating to the valuation of contingent earnout liabilities is a critical matter are (i) the significant judgment by management in estimating the fair value of the contingent earnout liabilities; (ii) a high degree of auditor judgment, subjectivity, and effort in performing procedures and evaluating management’s significant assumptions related to revenue growth and risk-adjusted discount rates; and (iii) the audit effort involved the use of professionals with specialized skill and knowledge.
75
Addressing the matter involved performing procedures and evaluating audit evidence in connection with forming our overall opinion on the consolidated financial statements. These procedures included testing the effectiveness of controls relating to management’s valuation of the contingent earnout liabilities, including the development of the significant assumptions related to revenue growth and risk-adjusted discount rates. These procedures also included, among others (i) reading the purchase agreements and terms related to the contingent earnout and (ii) testing management’s process for estimating the fair value of the contingent earnout liabilities. Testing management’s process included evaluating the appropriateness of the valuation method, testing the completeness and accuracy of underlying data provided by management, and evaluating the reasonableness of the significant assumptions related to revenue growth and risk-adjusted discount rates. Evaluating the significant assumptions related to revenue growth and risk-adjusted discount rates involved considering the historical performance of the Partners, the historical performance of the Company, as well as industry and economic performance and forecasts. Professionals with specialized skill and knowledge were used to assist in evaluating the appropriateness of the Company’s valuation method and the reasonableness of the risk-adjusted discount rates.
/s/ PricewaterhouseCoopers LLP
February 28, 2024
We have served as the Company’s auditor since 2019.
76
BRP GROUP, INC.
Consolidated Balance Sheets
| December 31, | ||||||||||||||
| (in thousands, except share and per share data) | 2023 | 2022 | ||||||||||||
| Assets | ||||||||||||||
| Current assets: | ||||||||||||||
| Cash and cash equivalents | $ | $ | ||||||||||||
| Restricted cash | ||||||||||||||
| Premiums, commissions and fees receivable, net | ||||||||||||||
| Prepaid expenses and other current assets | ||||||||||||||
| Assets held for sale | ||||||||||||||
| Total current assets | ||||||||||||||
| Property and equipment, net | ||||||||||||||
| Right-of-use assets | ||||||||||||||
| Other assets | ||||||||||||||
| Intangible assets, net | ||||||||||||||
| Goodwill | ||||||||||||||
| Total assets | $ | $ | ||||||||||||
Liabilities, Mezzanine Equity and Stockholders’ Equity | ||||||||||||||
| Current liabilities: | ||||||||||||||
| Premiums payable to insurance companies | $ | $ | ||||||||||||
| Producer commissions payable | ||||||||||||||
| Accrued expenses and other current liabilities | ||||||||||||||
| Related party notes payable | ||||||||||||||
| Current portion of contingent earnout liabilities | ||||||||||||||
| Liabilities held for sale | ||||||||||||||
| Total current liabilities | ||||||||||||||
| Revolving line of credit | ||||||||||||||
| Long-term debt, less current portion | ||||||||||||||
| Contingent earnout liabilities, less current portion | ||||||||||||||
| Operating lease liabilities, less current portion | ||||||||||||||
| Other liabilities | ||||||||||||||
| Total liabilities | ||||||||||||||
| Commitments and contingencies (Note 20) | ||||||||||||||
| Mezzanine equity: | ||||||||||||||
| Redeemable noncontrolling interest | ||||||||||||||
| Stockholders’ equity: | ||||||||||||||
Class A common stock, par value $ | ||||||||||||||
Class B common stock, par value $ | ||||||||||||||
| Additional paid-in capital | ||||||||||||||
| Accumulated deficit | ( | ( | ||||||||||||
| Stockholder notes receivable | ( | |||||||||||||
| Total stockholders’ equity attributable to BRP Group | ||||||||||||||
| Noncontrolling interest | ||||||||||||||
| Total stockholders’ equity | ||||||||||||||
| Total liabilities, mezzanine equity and stockholders’ equity | $ | $ | ||||||||||||
See accompanying Notes to Consolidated Financial Statements.
77
BRP GROUP, INC.
Consolidated Statements of Comprehensive Loss
| For the Years Ended December 31, | ||||||||||||||||||||
| (in thousands, except share and per share data) | 2023 | 2022 | 2021 | |||||||||||||||||
Revenues: | ||||||||||||||||||||
Commissions and fees | $ | $ | $ | |||||||||||||||||
| Investment income | ||||||||||||||||||||
| Total revenues | ||||||||||||||||||||
Operating expenses: | ||||||||||||||||||||
Commissions, employee compensation and benefits | ||||||||||||||||||||
Other operating expenses | ||||||||||||||||||||
Amortization expense | ||||||||||||||||||||
Change in fair value of contingent consideration | ||||||||||||||||||||
Depreciation expense | ||||||||||||||||||||
Total operating expenses | ||||||||||||||||||||
| Operating loss | ( | ( | ( | |||||||||||||||||
Other income (expense): | ||||||||||||||||||||
Interest expense, net | ( | ( | ( | |||||||||||||||||
| Other income (expense), net | ( | |||||||||||||||||||
Total other expense | ( | ( | ( | |||||||||||||||||
| Loss before income taxes | ( | ( | ( | |||||||||||||||||
| Income tax expense | ||||||||||||||||||||
| Net loss | ( | ( | ( | |||||||||||||||||
| Less: net loss attributable to noncontrolling interests | ( | ( | ( | |||||||||||||||||
| Net loss attributable to BRP Group | $ | ( | $ | ( | $ | ( | ||||||||||||||
| Comprehensive loss | $ | ( | $ | ( | $ | ( | ||||||||||||||
| Comprehensive loss attributable to noncontrolling interests | ( | ( | ( | |||||||||||||||||
| Comprehensive loss attributable to BRP Group | ( | ( | ( | |||||||||||||||||
| Basic and diluted loss per share | $ | ( | $ | ( | $ | ( | ||||||||||||||
Basic and diluted weighted-average shares of Class A common stock outstanding | ||||||||||||||||||||
See accompanying Notes to Consolidated Financial Statements.
78
BRP GROUP, INC.
Consolidated Statements of Stockholders’ Equity and Mezzanine Equity
| Stockholders' Equity | Mezzanine Equity | |||||||||||||||||||||||||||||||||||||||||||||||||||||||||||||
| Class A Common Stock | Class B Common Stock | Additional Paid-in Capital | Accumulated Deficit | Stockholder Notes Receivable | Non- controlling Interest | Total | Redeemable Non- controlling Interest | |||||||||||||||||||||||||||||||||||||||||||||||||||||||
| (in thousands, except share data) | Shares | Amount | Shares | Amount | ||||||||||||||||||||||||||||||||||||||||||||||||||||||||||
| Balance at December 31, 2020 | $ | $ | $ | $ | ( | $ | ( | $ | $ | $ | ||||||||||||||||||||||||||||||||||||||||||||||||||||
| Net income (loss) | — | — | — | — | — | ( | — | ( | ( | |||||||||||||||||||||||||||||||||||||||||||||||||||||
| Issuances of Class A common stock, net of underwriting discounts and offering costs | — | — | — | — | — | |||||||||||||||||||||||||||||||||||||||||||||||||||||||||
| Equity issued in business combinations | — | — | — | |||||||||||||||||||||||||||||||||||||||||||||||||||||||||||
| Share-based compensation, net of forfeitures | — | — | — | — | — | |||||||||||||||||||||||||||||||||||||||||||||||||||||||||
| Redemption of Class B common stock | ( | — | — | — | ( | — | ||||||||||||||||||||||||||||||||||||||||||||||||||||||||
| Tax distributions to BRP's LLC Members | — | — | — | — | — | — | — | ( | ( | — | ||||||||||||||||||||||||||||||||||||||||||||||||||||
| Repayment of stockholder notes receivable | — | — | — | — | — | — | — | — | ||||||||||||||||||||||||||||||||||||||||||||||||||||||
| Balance at December 31, 2021 | ( | ( | ||||||||||||||||||||||||||||||||||||||||||||||||||||||||||||
| Net income (loss) | — | — | — | — | — | ( | — | ( | ( | |||||||||||||||||||||||||||||||||||||||||||||||||||||
| Equity issued in business combinations | — | — | — | — | — | |||||||||||||||||||||||||||||||||||||||||||||||||||||||||
| Share-based compensation, net of forfeitures | — | — | — | ( | — | |||||||||||||||||||||||||||||||||||||||||||||||||||||||||
| Redemption and cancellation of Class B common stock | ( | ( | — | — | ( | — | ||||||||||||||||||||||||||||||||||||||||||||||||||||||||
| Tax distributions to BRP's LLC Members | — | — | — | — | — | — | — | ( | ( | — | ||||||||||||||||||||||||||||||||||||||||||||||||||||
| Repayment of stockholder notes receivable | — | — | — | — | — | — | — | — | ||||||||||||||||||||||||||||||||||||||||||||||||||||||
| Balance at December 31, 2022 | ( | ( | ||||||||||||||||||||||||||||||||||||||||||||||||||||||||||||
| Net income (loss) | — | — | — | — | — | ( | — | ( | ( | |||||||||||||||||||||||||||||||||||||||||||||||||||||
| Share-based compensation, net of forfeitures | — | — | — | — | — | |||||||||||||||||||||||||||||||||||||||||||||||||||||||||
| Redemption of Class B common stock | ( | — | — | — | ( | — | ||||||||||||||||||||||||||||||||||||||||||||||||||||||||
| Cancellation of Class A common stock | ( | ( | — | — | ( | — | — | — | ||||||||||||||||||||||||||||||||||||||||||||||||||||||
| Tax distributions to BRP's LLC Members | — | — | — | — | — | — | — | ( | ( | — | ||||||||||||||||||||||||||||||||||||||||||||||||||||
| Repayment of stockholder notes receivable | — | — | — | — | — | — | — | — | ||||||||||||||||||||||||||||||||||||||||||||||||||||||
| Distributions to variable interest entities | — | — | — | — | — | — | — | — | — | ( | ||||||||||||||||||||||||||||||||||||||||||||||||||||
| Balance at December 31, 2023 | $ | $ | $ | $ | ( | $ | $ | $ | $ | |||||||||||||||||||||||||||||||||||||||||||||||||||||
See accompanying Notes to Consolidated Financial Statements.
79
BRP GROUP, INC.
Consolidated Statements of Cash Flows
| For the Years Ended December 31, | ||||||||||||||||||||
| (in thousands) | 2023 | 2022 | 2021 | |||||||||||||||||
Cash flows from operating activities: | ||||||||||||||||||||
| Net loss | $ | ( | $ | ( | $ | ( | ||||||||||||||
| Adjustments to reconcile net loss to net cash provided by (used in) operating activities: | ||||||||||||||||||||
| Depreciation and amortization | ||||||||||||||||||||
| Change in fair value of contingent consideration | ||||||||||||||||||||
| Share-based compensation expense | ||||||||||||||||||||
| Payment of contingent earnout consideration in excess of purchase price accrual | ( | ( | ( | |||||||||||||||||
| Amortization of deferred financing costs | ||||||||||||||||||||
| (Gain) loss on interest rate caps | ( | |||||||||||||||||||
| Other loss | ||||||||||||||||||||
| Changes in operating assets and liabilities, net of effect of acquisitions: | ||||||||||||||||||||
| Premiums, commissions and fees receivable, net | ( | ( | ( | |||||||||||||||||
| Prepaid expenses and other current assets | ( | ( | ( | |||||||||||||||||
| Right-of-use assets | ( | ( | ||||||||||||||||||
| Accounts payable, accrued expenses and other current liabilities | ||||||||||||||||||||
| Operating lease liabilities | ( | |||||||||||||||||||
| Other liabilities | ( | |||||||||||||||||||
| Net cash provided by (used in) operating activities | ( | |||||||||||||||||||
Cash flows from investing activities: | ||||||||||||||||||||
| Capital expenditures | ( | ( | ( | |||||||||||||||||
| Proceeds from the sale of assets | ||||||||||||||||||||
| Cash consideration paid for asset acquisitions | ( | ( | ( | |||||||||||||||||
| Investments in and loans to business ventures | ( | ( | ( | |||||||||||||||||
Cash consideration paid for business combinations, net of cash received | ( | ( | ||||||||||||||||||
Net cash used in investing activities | ( | ( | ( | |||||||||||||||||
Cash flows from financing activities: | ||||||||||||||||||||
Proceeds from issuance of Class A common stock, net of underwriting discounts | ||||||||||||||||||||
| Payment of common stock offering costs | ( | |||||||||||||||||||
| Payment of contingent earnout consideration up to amount of purchase price accrual | ( | ( | ( | |||||||||||||||||
| Proceeds from revolving line of credit | ||||||||||||||||||||
| Payments on revolving line of credit | ( | ( | ( | |||||||||||||||||
| Proceeds from long-term debt | ||||||||||||||||||||
| Payments on long-term debt | ( | ( | ( | |||||||||||||||||
| Payments of debt issuance costs | ( | ( | ( | |||||||||||||||||
| Proceeds from the sale and settlement of interest rate caps | ||||||||||||||||||||
| Purchase of interest rate caps | ( | ( | ||||||||||||||||||
| Tax distributions to BRP's LLC Members | ( | ( | ||||||||||||||||||
| Proceeds from repayment of stockholder notes receivable | ||||||||||||||||||||
| Distributions to variable interest entities | ( | |||||||||||||||||||
| Net cash provided by (used in) financing activities | ( | |||||||||||||||||||
| Net increase (decrease) in cash and cash equivalents and restricted cash | ( | |||||||||||||||||||
Cash and cash equivalents and restricted cash at beginning of year | ||||||||||||||||||||
Cash and cash equivalents and restricted cash at end of year | $ | $ | $ | |||||||||||||||||
See accompanying Notes to Consolidated Financial Statements.
80
BRP GROUP, INC.
Consolidated Statements of Cash Flows (Continued)
| For the Years Ended December 31, | ||||||||||||||||||||
| (in thousands) | 2023 | 2022 | 2021 | |||||||||||||||||
| Supplemental schedule of cash flow information: | ||||||||||||||||||||
| Cash paid for interest | $ | $ | $ | |||||||||||||||||
| Cash paid for taxes | ||||||||||||||||||||
| Disclosure of non-cash investing and financing activities: | ||||||||||||||||||||
| Right-of-use assets obtained in exchange for operating lease liabilities | $ | $ | $ | |||||||||||||||||
| Capital expenditures incurred but not yet paid | ||||||||||||||||||||
| Right-of-use assets increased through lease modifications and reassessments | ||||||||||||||||||||
| Contingent earnout liabilities assumed in business combinations and asset acquisitions | ||||||||||||||||||||
| Increase (decrease) in goodwill resulting from measurement period adjustments for prior year business combinations | ( | ( | ||||||||||||||||||
| Equity interest issued in business combinations and asset acquisitions | ||||||||||||||||||||
| Conversion of contingent earnout liability to related party notes payable and to settle related party notes receivable | ||||||||||||||||||||
| Equity issued in satisfaction of a liability | ||||||||||||||||||||
| Non-cash debt issuance costs incurred | ||||||||||||||||||||
| Non-cash tax distributions payable | ||||||||||||||||||||
| Reconciliation of cash and cash equivalents and restricted cash: | ||||||||||||||||||||
| Cash and cash equivalents and restricted cash per consolidated balance sheet | $ | |||||||||||||||||||
| Restricted cash included in assets held for sale | ||||||||||||||||||||
| Cash and cash equivalents and restricted cash at end of year per consolidated statements of cash flows | $ | |||||||||||||||||||
See accompanying Notes to Consolidated Financial Statements.
81
BRP GROUP, INC.
Notes to Consolidated Financial Statements
1. Business and Basis of Presentation
BRP Group, Inc. (“BRP Group” or the “Company”) was incorporated in the state of Delaware on July 1, 2019 . BRP Group is a diversified insurance agency and services organization that markets and sells insurance products and services to its Clients throughout the U.S. A significant portion of the Company’s business is concentrated in the Southeastern U.S., with several other regional concentrations. BRP Group and its subsidiaries operate through three reportable segments (“Operating Groups”), including Insurance Advisory Solutions, Underwriting, Capacity & Technology Solutions and Mainstreet Insurance Solutions, which are discussed in more detail in Note 21.
Principles of Consolidation
The consolidated financial statements include the accounts of BRP Group and its wholly-owned subsidiaries. All intercompany transactions and balances have been eliminated in consolidation.
As the sole manager of Baldwin Risk Partners, LLC (“BRP”), BRP Group operates and controls all the business and affairs of BRP, and has the sole voting interest in, and controls the management of, BRP. Accordingly, BRP Group consolidates BRP in its consolidated financial statements, resulting in a noncontrolling interest related to the membership interests of BRP (the “LLC Units”) held by BRP's members (“BRP's LLC Members”) in its consolidated financial statements.
The Company has prepared these consolidated financial statements in accordance with Accounting Standards Codification (“ASC”) Topic 810, Consolidation (“Topic 810”). Topic 810 requires that if an enterprise is the primary beneficiary of a variable interest entity, the assets, liabilities, and results of operations of the variable interest entity should be included in the consolidated financial statements of the enterprise. The Company has recognized certain entities as variable interest entities, of which the Company is the primary beneficiary, and has included the accounts of these entities in the consolidated financial statements. Refer to Note 4 for additional information regarding the Company’s variable interest entities.
Topic 810 also requires that the equity of a noncontrolling interest shall be reported on the consolidated balance sheets within total equity of the Company. Certain redeemable noncontrolling interests are reported on the consolidated balance sheets as mezzanine equity. Topic 810 also requires revenues, expenses, gains, losses, net income or loss, and other comprehensive income or loss to be reported in the consolidated financial statements at consolidated amounts, which include amounts attributable to the owners of the parent and the noncontrolling interests. Refer to the Redeemable Noncontrolling Interest and Noncontrolling Interest sections of Note 2 for additional information.
Use of Estimates
The preparation of consolidated financial statements in conformity with accounting principles generally accepted in the United States of America (“GAAP”) requires management to make estimates and assumptions that affect the reported amounts of assets and liabilities, disclosures of contingent assets and liabilities at the date of the consolidated financial statements and the reported amounts of revenue and expenses during the reporting period. Actual results could differ from these estimates. Significant estimates underlying the accompanying consolidated financial statements include the application of guidance for revenue recognition; impairment of intangible assets and goodwill; the valuation of contingent consideration; and the valuation allowance for deferred tax assets.
Changes in Presentation
Effective in January 2023, the Company’s Mainstreet and Medicare businesses were combined under one Operating Group, Mainstreet Insurance Solutions. In addition, the Middle Market and Specialty Operating Groups were rebranded as Insurance Advisory Solutions and Underwriting, Capacity & Technology Solutions, respectively. Prior year segment reporting information in Note 21 has been recast to conform to the current organizational structure.
In addition, certain prior year amounts have been reclassified to conform to current year presentation. These reclassifications had no impact on the Company's previously reported consolidated financial position or results of operations.
82
Recently Issued Accounting Standards
In November 2023, the Financial Accounting Standards Board (“FASB”) issued Accounting Standards Update (“ASU”) No. 2023-07, Segment Reporting (“Topic 280”)—Improvements to Reportable Segment Disclosures (“ASU 2023-07”) to enhance the disclosure requirements for reportable segments. ASU 2023-07 requires disclosure of significant segment expenses regularly provided to the chief operating decision maker (“CODM”), as well as an aggregate amount of other segment items included within segment profit or loss and a description of its composition. Additionally, ASU 2023-07 requires disclosure of the title and position of the CODM and a description of how the CODM utilizes the reported measure of segment profit or loss to assess segment performance. ASU 2023-07 requires segment disclosures under Topic 280 on an annual and interim basis. This guidance is effective for fiscal years beginning after December 15, 2023 and interim periods within fiscal years beginning after December 15, 2024. The Company expects the adoption of this standard to expand its annual and interim segment disclosures, but otherwise have no impact on the consolidated financial statements.
In December 2023, the FASB issued ASU No. 2023-09, Income Taxes (Topic 740)—Improvements to Income Tax Disclosures (“ASU 2023-09”) to enhance the transparency and usefulness of income tax disclosures. ASU 2023-09 requires disclosure of specific categories and disaggregation of information in the rate reconciliation table using both percentages and reporting currency amounts. ASU 2023-09 also requires disclosure of disaggregated information related to income taxes paid, income or loss from continuing operations before income tax expense or benefit, and income tax expense or benefit from continuing operations. This guidance is effective for fiscal years beginning after December 15, 2024. The Company expects the adoption of this standard to expand its income tax disclosures, but otherwise have no impact on the consolidated financial statements.
Recently Adopted Accounting Standards
In October 2021, the FASB issued ASU No. 2021-08, Business Combinations (Topic 805)—Accounting for Contract Assets and Contract Liabilities from Contracts with Customers (“ASU 2021-08”) to improve the accounting for acquired revenue contracts with customers in a business combination by addressing diversity in practice and inconsistency related to (i) the recognition of an acquired contract liability and (ii) payment terms and their effect on subsequent revenue recognized by the acquirer. ASU 2021-08 requires that, at the acquisition date, an entity recognize and measure contract assets and contract liabilities acquired in a business combination in accordance with ASC Topic 606, Revenue from Contracts with Customers (“Topic 606”) as if it had originated the contracts, while also taking into account how the acquiree applied Topic 606. The Company adopted ASU 2021-08 effective January 1, 2023. The adoption of this guidance did not have any impact on our consolidated financial statements.
In March 2020, the FASB issued ASU No. 2020-04, Reference Rate Reform (“Topic 848”)—Facilitation of the Effects of Reference Rate Reform on Financial Reporting (“ASU 2020-04”), which established optional expedients and exceptions for applying GAAP to contracts, hedging relationships, and other transactions affected by reference rate reform to provide temporary relief during the transition period of Topic 848 and ease the potential burden of accounting for, or recognizing the effects of, reference rate reform on financial reporting. In December 2022, the FASB issued ASU No. 2022-06, Reference Rate Reform (Topic 848): Deferral of the Sunset Date of Topic 848 to defer the sunset date of Topic 848 from December 31, 2022 to December 31, 2024 as a result of the extension of the intended cessation of USD LIBOR to June 30, 2023. The Company has adopted the optional expedient within ASU 2020-04 to account for modifications of contracts within the scope of ASC Topic 470, Debt, including Amendment No. 6 to the JPM Credit Agreement dated June 27, 2023 discussed in Note 11. The adoption of this guidance did not have any impact on our consolidated financial statements.
2. Significant Accounting Policies
Revenue Recognition
The Company recognizes revenue in accordance with Topic 606.
The Company earns commission revenue by providing insurance placement services to insureds (“Clients”) under direct bill and agency bill arrangements with Insurance Company Partners for private risk management, commercial risk management, wealth management, employee benefits and Medicare insurance types. Commission revenues are usually a percentage of the premium paid by Clients and generally depend upon the type of insurance, the Insurance Company Partner and the nature of the services provided. In some limited cases, the Company shares commissions with other agents or brokers who have acted jointly with the Company in a transaction. The Company controls the fulfillment of the performance obligation and its relationship with its Insurance Company Partners and the outside agents. Commissions shared with downstream agents or brokers are recorded in commission, employee compensation and benefits expense in the consolidated statements of comprehensive loss.
83
Commission revenue is recorded net of allowances for estimated policy cancellations, which are determined based on an evaluation of historical and current cancellation data.
Commissions for brokerage services may be invoiced near the effective date of the underlying policy or over the term of the arrangement in installments during the policy period. However, regardless of the payment terms, commissions are recognized at a point in time upon the effective date of bound insurance coverage, as no performance obligation exists after coverage is bound.
The Company earns service fee revenue for providing insurance placement services to Clients for a negotiated fee and consulting revenue is earned by providing specialty insurance consulting. Service fee and consulting revenues from certain agreements are recognized over time depending on when the services within the contract are satisfied and when the Company has transferred control of the related services to the customer.
Profit-sharing commissions represent bonus-type revenue that is earned by the Company as a sales incentive provided by certain Insurance Company Partners. The Company receives profit-sharing commissions based primarily on underwriting results, but may also contain considerations for volume, growth, loss performance or retention. Profit-sharing commissions associated with relatively predictable measures are estimated and recognized over time. The profit-sharing commissions are recorded as the underlying policies that contribute to the achievement of the metric are placed with any adjustments recognized when payments are received or as additional information that affects the estimate becomes available. Profit-sharing commissions associated with loss performance are uncertain, and therefore, are subject to significant reversal as loss data remains subject to material change. Management estimates profit-sharing commissions using historical outcomes and known trends impacting premium volume or loss ratios, subject to a constraint. The constraint is relieved when management estimates the revenue is not subject to significant reversal, which often coincides with the earlier of written notice from the Insurance Company Partner that the target has been achieved, or cash collection. Year-end amounts incorporate estimates subject to a constraint or where applicable, are based on confirmation from Insurance Company Partners after calculation of premium volume or loss ratios that are impacted by catastrophic losses.
The Company earns policy fee revenue for acting in its capacity as a managing general agent (“MGA”) on behalf of the Insurance Company Partner and fulfilling certain services including delivery of policy documents, processing payments and other administrative functions during the term of the insurance policy. Policy fee revenue is deferred and recognized over the life of the policy. These deferred amounts are recognized as contract liabilities, which are included as a component of accrued expenses and other current liabilities on the consolidated balance sheets. The Company earns installment fee revenue for payment processing services performed on behalf of the Insurance Company Partner related to policy premiums paid on an installment basis. The Company recognizes installment fee revenue in the period the services are performed.
The Company also earns investment income, which primarily consists of interest earnings on available cash invested in treasury money market funds. The Company recognizes investment income in the period the revenue is earned.
The Company pays an incremental amount of compensation in the form of producer commissions on new business. These incremental costs are capitalized as deferred commission expense and amortized over five years, which represents management’s estimate of the average benefit period for new business. The Company has concluded that this period is consistent with the transfer to the Client of the services to which the asset relates.
Due to the relatively short time period between the information gathering phase and binding insurance coverage, the Company has determined that costs to fulfill contracts are not significant. Therefore, costs to fulfill a contract are expensed as incurred.
Cash Equivalents
The Company considers all highly liquid short-term instruments with original maturities of three months or less to be cash equivalents.
Restricted Cash
Restricted cash includes amounts that are legally restricted as to use or withdrawal. Restricted cash represents cash collected from Clients that is payable to Insurance Company Partners and for which segregation of this cash is required by contract with the relevant insurance company providing coverage or by law within the state. The Company also holds restricted cash specifically in its role as an MGA.
84
Premiums, Commissions and Fees Receivable, Net
Premiums receivable represent premiums due from Clients when the Company acts in its capacity as insurance agent or broker on behalf of the Insurance Company Partner. In an agency bill contract, the Company typically collects premiums from Clients and, after deducting its authorized commissions, remits the net premiums to the appropriate Insurance Company Partners. Commissions receivable reflect commissions due from Insurance Company Partners. In a direct bill contract, the Insurance Company Partners collect the premiums directly from Clients and remit the applicable commissions to the Company. Fees receivable represent policy fees, consulting fees, service fees and other related amounts due from Clients in service transactions.
Premiums, commissions and fees receivable are reported net of allowances for estimated policy cancellations. The allowance for estimated policy cancellations was $12.6 million and $8.4 million at December 31, 2023 and 2022, respectively, which represents a reserve for future reversals in commission and fee revenues related to the potential cancellation of Client insurance policies that were in force as of each year end. The allowance for estimated policy cancellations is established through a charge to revenues. The allowance for estimated policy cancellations is offset in part by a producer commissions chargeback of $5.7 million and $3.3 million at December 31, 2023 and 2022, respectively. The producer commissions chargeback is established through a charge to commissions, employee compensation and benefits expense and is netted against producer commissions payable on the consolidated balance sheets.
The Company recognizes an allowance for credit losses that reflects the Company's estimate of expected credit losses for its premiums, commissions and fees receivable. This allowance is not significant during any periods presented.
Property and Equipment, Net
Property and equipment is stated at cost. For financial reporting purposes, depreciation of property and equipment is calculated using the straight-line method over the estimated useful lives of the assets as follows:
| Useful Life (in Years) | ||||||||
| Leasehold improvements | ||||||||
| Furniture | ||||||||
| Equipment | ||||||||
| Other | ||||||||
Leasehold improvements are amortized on a straight-line basis over the shorter of their estimated useful life or the reasonably assured lease term at inception of the lease. When assets are retired or otherwise disposed of, the cost and related accumulated depreciation are removed from the accounts. The difference between the net book value of the assets and proceeds from disposal is recognized as a gain or loss on disposal, which is included in other income (expense), net in the consolidated statements of comprehensive loss. Routine maintenance and repairs are charged to expense as incurred, while costs of improvements and renewals are capitalized.
Property and equipment is evaluated for impairment whenever events or changes in circumstances indicate that the carrying value may not be recoverable. An asset is considered to be impaired when the sum of the undiscounted future net cash flows expected to result from the use of the asset and its eventual disposition does not exceed its carrying amount. The amount of the impairment loss, if any, is measured as the amount by which the carrying value of the asset exceeds its fair value.
Capitalized Software
The Company capitalizes certain costs to develop software for internal use as capitalized software in accordance with ASC Topic 350-40, Internal-Use Software. Costs incurred during the preliminary project stage and post-implementation stage of an internal-use software project are expensed as incurred while costs incurred during the application development stage of an internal-use software project are capitalized. Costs related to updates and enhancements to the software are only capitalized if they result in additional functionality to the Company. Capitalized software was $28.5 million and $10.1 million at December 31, 2023 and 2022, respectfully, which is presented net of accumulated amortization of $1.4 million at December 31, 2023 on the consolidated balance sheets. Capitalized software is included as a component of software under intangible assets, net on the consolidated balance sheets. The Company amortizes capitalized software on the straight-line basis over estimated useful lives of to five years . Amortization expense recorded for capitalized software was $1.4 million for the year ended December 31, 2023.
85
Intangible Assets, Net and Goodwill
The Company has recognized separately identifiable intangible assets in connection with strategic acquisitions made by the Company (“Partnerships”), as well as those related to software purchased and developed for internal use. Intangible assets identified in a Partnership are recorded at fair value on the acquisition date. The excess of the purchase price in a business combination over the fair value of the identifiable tangible and intangible assets acquired and liabilities assumed is assigned to goodwill.
Intangible assets are stated at cost, less accumulated amortization, and consist of acquired relationships, software and trade names acquired in connection with business combinations. Acquired relationships and trade names are being amortized based on a pattern of economic benefit over estimated useful lives of 15 to 20 years and to five years , respectively. Software is amortized on the straight-line basis over estimated useful lives of to five years .
Management assesses the fair value of acquired relationships, software and trade names by considering the estimated future cash flow benefits associated with ownership of the assets through the use of recognized income approach valuation methods. The valuation of these intangible assets involves significant assumptions concerning matters such as revenue and expense growth rates, customer attrition rates, obsolescence rates, royalty rates and discount rates.
The Company reviews its definite-lived intangible assets and other long-lived assets for impairment whenever an event occurs that indicates the carrying amount of an asset may not be recoverable. No impairment was recorded for the years ended December 31, 2023, 2022 or 2021.
Goodwill is subject to an impairment assessment on an annual basis or whenever indicators of impairment are present. The Company generally performs a qualitative assessment to determine whether a quantitative impairment test is necessary. On October 1, 2023, the Company elected to perform the quantitative test in lieu of the optional qualitative assessment. In a quantitative assessment, the Company compares the fair value of each reporting unit with its carrying amount to determine if there is potential impairment of goodwill. If the carrying value of a reporting unit is greater than the fair value, an impairment charge is recorded for the amount that the carrying amount of the reporting unit, including goodwill, exceeds its fair value, limited to the amount of goodwill of the reporting unit. No impairment was recorded for the years ended December 31, 2023, 2022 or 2021.
Deferred Financing Costs, Net
Deferred financing costs consist of origination fees and debt issuance costs related to obtaining and amending credit facilities. The Company has recorded these costs as an asset and liability on the consolidated balance sheets in accordance with ASC Topic 835-30, Interest. Deferred financing costs associated with revolving credit facilities are included in other assets on the consolidated balance sheets while those related to term loans are recorded as an offset to long-term debt. At December 31, 2023 and 2022, deferred financing costs included in other assets were $6.4 3.5 million and $2.8 million, respectively. Deferred financing costs and original issue discount included in long-term debt totaled $32.0 million and $27.0 million, net of accumulated amortization of $11.7 million and $7.3 million, at December 31, 2023 and 2022, respectively. Such costs are amortized using the effective interest method over the terms of the respective debt. Amortization of deferred financing costs, which is included in interest expense, net in the accompanying consolidated statements of comprehensive loss, was approximately $5.1 3.5 million for the year ended December 31, 2021.
Derivative Instruments
The Company utilizes derivative financial instruments, consisting of interest rate caps, to manage the Company’s interest rate exposure. Derivative instruments are recognized as assets or liabilities at fair value on the consolidated balance sheets. The Company has not designated these derivatives as hedging instruments for accounting purposes and, accordingly, the changes in fair value of these derivatives are recognized in earnings. Cash payments and receipts under the derivative instruments are classified within cash flows from financing activities in the accompanying consolidated statements of cash flows. The Company does not use derivative instruments for trading or speculative purposes.
86
Self-Insurance Reserve
The Company has a self-insured health insurance plan for which it carries an insurance program with specific retention levels or high per-claim deductibles for expected losses. The Company records a liability for all unresolved claims and for an estimate of incurred but not reported (“IBNR”) claims at the anticipated cost that falls below its specified retention levels or per-claim deductible amounts. In establishing reserves, the Company considers actuarial assumptions and judgments regarding economic conditions and the frequency and severity of claims. The Company had an IBNR reserve of $3.8 million and $1.8 million at December 31, 2023 and 2022, respectively, which is included in accrued expenses and other current liabilities on the consolidated balance sheets.
Leases
The Company accounts for leases under ASC Topic 842, Leases (“Topic 842”). A lease is an agreement between two or more parties that creates enforceable rights and obligations that conveys the right to control the use of an identified asset for a period of time in exchange for consideration. Topic 842 requires an entity to determine whether a contract is a lease or contains a lease at the inception of the contract, considering all relevant facts and circumstances. There are two main components in determining if a contract is a lease: (i) a right to use an identified asset and (ii) control over the use of the identified asset. A customer does not have the right to use an identified asset if, at inception of the contract, a supplier has the substantive right to substitute the asset throughout the period of use. Control over the use of the identified asset requires a customer to obtain “substantially all the economic benefits” and to have the “ability to direct the use of the asset.”
Topic 842 requires the recognition of right-of-use assets and lease liabilities on the balance sheet. Leases are classified at their commencement date, which is defined as the date on which the lessor makes the underlying asset available for use by the lessee, as either operating or finance leases based on the economic substance of the agreement. The Company recognizes right-of-use assets and lease liabilities on its consolidated balance sheets for operating leases. Lease liabilities are measured at the lease commencement date as the present value of the future lease payments determined using either (i) the interest rate implicit in the lease, if readily determinable, or (ii) the Company's incremental borrowing rate on the lease commencement date. Right-of-use assets are measured as the lease liability plus initial direct costs and prepaid lease payments less lease incentives. The lease term is the non-cancelable period of the lease and includes options to extend or terminate the lease when it is reasonably certain that an option will be exercised.
The Company elected to not separate lease and non-lease components and instead accounts for them as a single lease component for all classes of underlying assets. The Company does not include variable payments that are not based on an index or rate in the single lease component, regardless of whether they are related to the lease or non-lease component.
The Company elected to not recognize a lease liability or right-of-use asset on the consolidated balance sheets for leases with an initial term of 12 months or less. Operating lease expenses on capitalized leases and short-term leases are recognized on a straight-line basis over the respective lease term, inclusive of rent escalation provisions and rent holidays, as a component of other operating expense in the consolidated statements of comprehensive loss.
Contingent Earnout Liabilities
The Company accounts for contingent consideration relating to business combinations as a contingent earnout liability and an increase to goodwill at the date of acquisition and continually remeasures the liability at each balance sheet date by recording changes in fair value through change in fair value of contingent consideration in the consolidated statements of comprehensive loss. The ultimate settlement of contingent earnout liabilities relating to business combinations may be for amounts that are materially different from the amounts initially recorded and may cause volatility in the Company’s results of operations.
The Company accounts for contingent consideration relating to asset acquisitions as a contingent earnout liability and an increase to the cost of the acquired assets on a relative fair value basis at the date of acquisition. Once recognized, the contingent earnout liability is not derecognized until the contingency is resolved and the consideration is issued or becomes issuable. If the amount initially recognized as a liability exceeds the fair value of the contingent consideration issued or issuable, the entity recognizes that amount as a reduction to the cost of the acquired assets. The ultimate settlement of contingent earnout liabilities relating to asset acquisitions may be for amounts that are materially different from the amounts initially recorded.
The Company determines the fair value of contingent earnout liabilities based on future cash flow projections under various potential scenarios and weighs the probability of these outcomes as discussed further in Note 19.
87
Assets and Liabilities Held for Sale
The Company classifies assets and related liabilities as held for sale (the “disposal group”) when: (i) management has committed to a plan to sell the disposal group, (ii) the disposal group is available for immediate sale, (iii) there is an active program to locate a buyer, (iv) the sale and transfer of the disposal group is probable within one year, (v) the disposal group is being actively marketed for sale at price that is reasonable in relation to its current fair value, and (vi) it is unlikely that significant changes will be made to the plan to sell the disposal group.
Assets and liabilities held for sale are presented separately within the consolidated balance sheets with any adjustments necessary to measure the disposal group at the lower of its carrying value or fair value less costs to sell. Goodwill is allocated to the disposal group based on the relative fair value of the disposal group and the portion of the reporting unit to be retained. Any gain or loss on held for sale assets and liabilities is included as a component of other income (expense), net in the consolidated statements of comprehensive loss. Depreciation of property and equipment and amortization of intangible and right-of-use assets are not recorded while these assets are classified as held for sale. For each period the disposal group remains classified as held for sale, its recoverability is reassessed and any necessary adjustments are made to its carrying value. Refer to Note 3 for a discussion of assets and liabilities held for sale at December 31, 2023.
Redeemable Noncontrolling Interest
ASC Topic 480, Distinguishing Liabilities from Equity, requires noncontrolling interests that are redeemable for cash or other assets to be classified outside of permanent equity if they are redeemable (i) at a fixed or determinable price on a fixed or determinable date, (ii) at the option of the holder, or (iii) upon the occurrence of an event that is not solely within the control of the issuer.
Redeemable noncontrolling interests are reported at estimated redemption value measured as the greater of estimated fair value at the end of each reporting period or the historical cost basis of the redeemable noncontrolling interest adjusted for cumulative earnings or loss allocations. The resulting increases or decreases to redemption value, if applicable, are recognized as adjustments to retained earnings.
Noncontrolling Interest
Noncontrolling interests are reported at historical cost basis adjusted for cumulative earnings or loss allocations and classified as a component of stockholders’ equity on the consolidated balance sheets.
Income Taxes
BRP is treated as a partnership for U.S. federal, state and local income tax purposes. As a partnership, BRP’s taxable income or loss is included in the taxable income of its members. BRP Group and BRP Colleague Inc., an indirect subsidiary of BRP Group, are both C corporations and taxable entities.
The Company accounts for income taxes pursuant to the asset and liability method, which requires the recognition of deferred income tax assets and liabilities related to the expected future tax consequences arising from temporary differences between the carrying amounts and tax bases of assets and liabilities based on enacted statutory tax rates applicable to the periods in which the temporary differences are expected to reverse. Any effects of changes in income tax rates or laws are included in income tax expense in the period of enactment.
The Company and its subsidiaries follow ASC Topic 740, Income Taxes. A component of this standard prescribes a recognition and measurement threshold of uncertain tax positions taken or expected to be taken in a tax return. For those benefits to be recognized, a tax position must be more likely than not to be sustained upon examination by taxing authorities. Management has evaluated the Company’s tax positions and concluded that the Company has taken no uncertain tax positions that require adjustment to the financial statements to comply with the provisions of this guidance. The Company does not expect any of its tax positions to change significantly in the near term.
88
Tax Receivable Agreement
The Company’s future exchanges of LLC Units from BRP’s LLC Members and the corresponding number of shares of Class B common stock for shares of Class A common stock, is expected to result in increases in its share of the tax basis of the tangible and intangible assets of BRP, which will increase the tax depreciation and amortization deductions that otherwise would not have been available to BRP Group. These increases in tax basis and tax depreciation and amortization deductions are expected to reduce the amount of cash taxes that BRP Group would otherwise be required to pay in the future. BRP Group has entered into a Tax Receivable Agreement with the other members of BRP that requires it to pay them 85 % of the amount of cash savings, if any, in U.S. federal, state, and local income tax that BRP Group actually realizes (or, under certain circumstances, is deemed to realize) as a result of the increases in tax basis in connection with exchanges by the recipients described above and certain other tax benefits attributable to payments under the Tax Receivable Agreement.
Share-Based Compensation
Share-based payments to directors, officers, Colleagues and consultants are measured based on the estimated grant-date fair value. The grant-date fair value of restricted and unrestricted stock awards is equal to the market value of BRP Group’s Class A common stock on the date of grant. The Company also issues stock awards that vest based on service conditions, performance conditions, or market conditions. The Company applies the Black-Scholes option-pricing model, a Monte Carlo Simulation, or a lattice model, depending on the vesting conditions, in determining the fair value of performance-based restricted stock unit awards to Colleagues. The Company recognizes share-based compensation expense over the requisite service period for awards expected to ultimately vest. The Company recognizes forfeitures as they occur. Refer to Note 15 for additional information regarding our share-based compensation plans.
Fair Value of Financial Instruments
Contingencies
The Company accounts for contingencies in accordance with ASC Topic 450-20, Loss Contingencies. Liabilities for loss contingencies arising from various claims and legal actions are recorded when it is probable that a liability has been incurred and the amount is reasonably estimable. In certain cases, where a range of loss exists, the Company accrues the minimum amount in the range if no amount within the range is a better estimate than any other amount. Refer to Note 20 for additional information regarding the Company's contingencies.
Concentrations
3. Assets and Liabilities Held for Sale
Since its launch in January 2020, the Company's specialty wholesale broker business has not benefited from the same degree of capital allocation, focus and prioritization as the retail and MGA businesses. After assessing the various paths forward for the specialty wholesale broker business near the end of 2023, management concluded that a plan to sell the specialty wholesale broker business creates the greatest opportunity for both the Company and the specialty wholesale broker business.
The Company determined that its specialty wholesale broker business, operating within the Underwriting, Capacity & Technology Solutions Operating Group, met the criteria to be classified as held for sale at December 31, 2023. The assets and liabilities of the specialty wholesale broker business have been recorded as held for sale at their carrying value, which was determined to be lower than the fair value of the net assets less costs to sell and, as a result, no gain or loss was recorded. The planned divestiture did not meet the criteria of a discontinued operation and the Company will continue to report the operating results for its specialty wholesale broker business as continuing operations in the consolidated statements of comprehensive loss until a sale is completed. Subsequent to the end of 2023, the Company entered into a definitive agreement for the sale of the business, which is expected to close on March 1, 2024. Refer to Note 22 for additional information.
89
The table below provides a summary of the major classes of assets and liabilities that have been classified as held for sale on the consolidated balance sheets:
| (in thousands) | December 31, 2023 | |||||||
| Restricted cash | $ | |||||||
| Premiums, commissions and fees receivable, net | ||||||||
| Property and equipment, net | ||||||||
| Right-of-use assets | ||||||||
| Other assets | ||||||||
| Intangible assets, net | ||||||||
| Goodwill | ||||||||
| Assets held for sale | $ | |||||||
| Premiums payable to insurance companies | $ | |||||||
| Producer commissions payable | ||||||||
Accrued expenses and other current liabilities(1) | ||||||||
| Operating lease liabilities, less current portion | ||||||||
| Liabilities held for sale | $ | |||||||
__________
(1) Includes the current portion of operating lease liabilities.
4. Variable Interest Entities
Topic 810 requires a reporting entity to consolidate a variable interest entity (“VIE”) when the reporting entity has a variable interest or combination of variable interests that provide the entity with a controlling financial interest in the VIE. The Company continually assesses whether it has a controlling financial interest in each of its VIEs to determine if it is the primary beneficiary of the VIE and should, therefore, consolidate each of the VIEs. A reporting entity is considered to have a controlling financial interest in a VIE if it has (i) the power to direct the activities of a VIE that most significantly impact the VIE’s economic performance, and (ii) the obligation to absorb the losses of, or the right to receive benefits from, the VIE that could potentially be significant to the VIE.
The Company determined that it is the primary beneficiary of its VIEs, which include Laureate Insurance Partners, LLC, BKS Smith, LLC, BKS MS, LLC and BKS Partners Galati Marine Solutions, LLC. The Company has consolidated its VIEs into the accompanying consolidated financial statements.
Total revenues and expenses of the Company’s consolidated VIEs included in the consolidated statements of comprehensive loss were $2.0 million and $1.1 million, respectively, for the year ended December 31, 2023, $1.7 million and $1.0 million, respectively, for the year ended December 31, 2022, and $1.0 million and $0.6 million, respectively, for the year ended December 31, 2021.
Total assets and liabilities of the Company's consolidated VIEs included on the consolidated balance sheets were $0.8 million and $0.2 million, respectively, at December 31, 2023 and $0.4 million and $0.1 million, respectively, at December 31, 2022. The assets of the consolidated VIEs can only be used to settle the obligations of the consolidated VIEs and the creditors of the liabilities of the consolidated VIEs do not have recourse to the Company.
90
5. Revenue
The following table provides disaggregated revenues by major source:
| For the Years Ended December 31, | ||||||||||||||||||||
| (in thousands) | 2023 | 2022 | 2021 | |||||||||||||||||
Commission revenue(1) | $ | $ | $ | |||||||||||||||||
Profit-sharing revenue(2) | ||||||||||||||||||||
Consulting and service fee revenue(3) | ||||||||||||||||||||
Policy fee and installment fee revenue(4) | ||||||||||||||||||||
Other income(5) | ||||||||||||||||||||
Investment income(6) | ||||||||||||||||||||
| Total revenues | $ | $ | $ | |||||||||||||||||
__________
(1) Commission revenue is earned by providing insurance placement services to Clients under direct bill and agency bill arrangements with Insurance Company Partners for private risk management, commercial risk management, wealth management, employee benefits and Medicare insurance types.
(2) Profit-sharing revenue represents bonus-type revenue that is earned by the Company as a sales incentive provided by certain Insurance Company Partners.
(3) Service fee revenue is earned for providing insurance placement services to Clients for a negotiated fee and consulting revenue is earned by providing specialty insurance consulting.
(4) Policy fee revenue represents revenue earned for acting in the capacity of an MGA and fulfilling certain administrative functions on behalf of Insurance Company Partners, including delivery of policy documents, processing payments and other administrative functions. Installment fee revenue represents revenue earned by the Company for providing payment processing services on behalf of Insurance Company Partners related to policy premiums paid on an installment basis.
(5) Other income includes other ancillary income, premium financing income and marketing income that is based on agreed-upon cost reimbursement for fulfilling specific targeted Medicare marketing campaigns.
(6) Investment income represents interest earnings on available cash invested in treasury money market funds.
The application of Topic 606 requires the use of management judgment. The following are the areas of most significant judgment as it relates to Topic 606:
•The Company considers the policyholders as representative of its customers in the majority of contractual relationships, with the exception of Medicare contracts in its Mainstreet Insurance Solutions Operating Group, where the Insurance Company Partner is considered its customer.
•Medicare contracts in the Mainstreet Insurance Solutions Operating Group are multi-year arrangements in which the Company is entitled to renewal commissions. However, the Company has applied a constraint to renewal commissions that limits revenue recognized when a risk of significant reversals exists based on: (i) historical renewal patterns; and (ii) the influence of external factors outside of the Company’s control, including policyholder discretion over plans and Insurance Company Partner relationship, political influence, and a contractual provision, which limits the Company’s right to receive renewal commissions to ongoing compliance and regulatory approval of the relevant Insurance Company Partner and compliance with the Centers for Medicare and Medicaid Services.
•The Company recognizes separately contracted commission revenue at the effective date of insurance placement and considers any ongoing interaction with the customer to be insignificant in the context of the obligations of the contract.
•Variable consideration includes estimates of direct bill commissions, reserves for policy cancellations and accruals for profit-sharing income.
•Costs to obtain a contract are deferred and recognized over five years , which represents management’s estimate of the average benefit period for new business.
•Due to the relatively short time period between the information gathering phase and binding insurance coverage, the Company has determined that costs to fulfill contracts are not significant. Therefore, costs to fulfill a contract are expensed as incurred.
91
6. Contract Assets and Liabilities
Contract assets arise when the Company recognizes (i) revenue for amounts which have not yet been billed and (ii) receivables for premiums to be collected on behalf of Insurance Company Partners. Contract liabilities relate to payments received in advance of performance under the contract before the transfer of a good or service to the customer. Contract assets are included in premiums, commissions and fees receivable, net and contract liabilities are included in accrued expenses and other current liabilities on the consolidated balance sheets. The balances of contract assets and liabilities arising from contracts with customers were as follows:
| December 31, | ||||||||||||||
| (in thousands) | 2023 | 2022 | ||||||||||||
| Contract assets | $ | $ | ||||||||||||
| Contract liabilities | ||||||||||||||
During the year ended December 31, 2023, the Company recognized revenue of $31.0 million related to the contract liabilities balance at December 31, 2022.
7. Deferred Commission Expense
The Company pays an incremental amount of compensation in the form of producer commissions on new business. In accordance with ASC Topic 340, Other Assets and Deferred Costs, these incremental costs are deferred and amortized over five years, which represents management’s estimate of the average benefit period for new business. Deferred commission expense represents producer commissions that are capitalized and not yet expensed and are included in other assets on the consolidated balance sheets. The table below provides a rollforward of deferred commission expense:
| For the Years Ended December 31, | ||||||||||||||
| (in thousands) | 2023 | 2022 | ||||||||||||
| Balance at beginning of year | $ | $ | ||||||||||||
| Costs capitalized | ||||||||||||||
| Amortization | ( | ( | ||||||||||||
| Deferred commission expense classified as held for sale | ( | |||||||||||||
| Balance at end of year | $ | $ | ||||||||||||
8. Property and Equipment, Net
Property and equipment, net consists of the following:
| December 31, | ||||||||||||||
| (in thousands) | 2023 | 2022 | ||||||||||||
| Equipment | $ | $ | ||||||||||||
| Leasehold improvements | ||||||||||||||
| Furniture | ||||||||||||||
| Construction in process | ||||||||||||||
| Other | ||||||||||||||
| Total property and equipment | ||||||||||||||
| Accumulated depreciation | ( | ( | ||||||||||||
| Property and equipment, net | $ | $ | ||||||||||||
Depreciation expense recorded for property and equipment was $5.7 million, $4.6 million and $2.8 million for the years ended December 31, 2023, 2022 and 2021, respectively.
92
9. Intangible Assets, Net and Goodwill
Intangible assets consist of the following:
| December 31, 2023 | December 31, 2022 | |||||||||||||||||||||||||||||||||||||
| (in thousands) | Gross Carrying Value | Accumulated Amortization | Net Carrying Value | Gross Carrying Value | Accumulated Amortization | Net Carrying Value | ||||||||||||||||||||||||||||||||
Acquired relationships(1) | $ | $ | ( | $ | $ | $ | ( | $ | ||||||||||||||||||||||||||||||
| Software | ( | ( | ||||||||||||||||||||||||||||||||||||
| Trade names | ( | ( | ||||||||||||||||||||||||||||||||||||
| Total intangible assets | $ | $ | ( | $ | $ | $ | ( | $ | ||||||||||||||||||||||||||||||
__________
(1) Acquired relationships exclude $20.7 million of gross carrying value and $9.4 million of accumulated amortization classified as held for sale at December 31, 2023.
The Company had several asset acquisitions during each of the years ended December 31, 2023 and 2022, which resulted in the addition of acquired relationships of $3.5 million and $3.4 million, respectively, with estimated weighted-average useful lives of 15 years and 18.7 years, respectively. The Company also had several business combinations during the year ended December 31, 2022, which resulted in the addition of acquired relationships of $189.8 million, software of $29.5 million and trade names of $4.4 million with estimated weighted-average useful lives of 20 years, 5 years and 4.9 years, respectively.
Amortization expense recorded for intangible assets was $92.7 million, $81.7 million and $48.7 million for the years ended December 31, 2023, 2022 and 2021, respectively.
Future annual estimated amortization expense over the next five years for intangible assets is as follows (in thousands):
| For the Years Ending December 31, | Amortization | |||||||
| 2024 | $ | |||||||
| 2025 | ||||||||
| 2026 | ||||||||
| 2027 | ||||||||
| 2028 | ||||||||
The changes in carrying value of goodwill by Operating Group are as follows:
| (in thousands) | Insurance Advisory Solutions | Underwriting, Capacity & Technology Solutions | Mainstreet Insurance Solutions | Total | ||||||||||||||||||||||
| Balance at December 31, 2021 | $ | $ | $ | $ | ||||||||||||||||||||||
| Goodwill of acquired businesses | ||||||||||||||||||||||||||
Measurement period adjustments(1) | ||||||||||||||||||||||||||
| Balance at December 31, 2022 | ||||||||||||||||||||||||||
Measurement period adjustments(2) | ( | ( | ||||||||||||||||||||||||
Goodwill classified as held for sale(3) | ( | ( | ||||||||||||||||||||||||
| Balance at December 31, 2023 | $ | $ | $ | $ | ||||||||||||||||||||||
__________
(1) Measurement period adjustments recorded during 2022 relating to businesses acquired in 2021 increased premiums, commissions and fees receivable by $3.8 million, increased current liabilities by $9.1 million, and increased consideration by $0.2 million.
(2) Measurement period adjustments recorded during 2023 relating to businesses acquired in 2022 decreased current liabilities by $0.2 million.
93
10. Accrued Expenses and Other Current Liabilities
Accrued expenses and other current liabilities consist of the following:
| December 31, | ||||||||||||||
| (in thousands) | 2023 | 2022 | ||||||||||||
| Accrued compensation and benefits | $ | $ | ||||||||||||
| Contract liabilities | ||||||||||||||
| Accrued expenses | ||||||||||||||
| Current portion of operating lease liabilities | ||||||||||||||
| Current portion of long-term debt | ||||||||||||||
Earnout incentive bonus(1) | ||||||||||||||
| Other | ||||||||||||||
| $ | $ | |||||||||||||
__________
11. Long-Term Debt
On October 14, 2020, the Company entered into a credit agreement with JPMorgan Chase Bank, N.A (the “JPM Credit Agreement”). As of December 31, 2022, the JPM Credit Agreement, as amended, provided for senior secured credit facilities in an aggregate principal amount of $1.45 billion, which consisted of (i) a term loan facility in the principal amount of $850.0 million maturing October 14, 2027 (the “Term Loan B”) and (ii) a revolving credit facility with commitments in an aggregate principal amount of $600.0 million maturing April 1, 2027 (the “Revolving Facility”). The JPM Credit Agreement is secured by substantially all assets of the Company.
Through June 30, 2023, the Term Loan B bore interest at LIBOR plus 350 bps, subject to a LIBOR floor of 50 bps. On June 27, 2023, the Company entered into Amendment No. 6 to the JPM Credit Agreement, under which, effective July 1, 2023, the interest rate on the Term Loan B changed to term SOFR plus a credit spread adjustment between 11 bps and 43 bps based on the term SOFR rate plus an applicable margin of 350 bps, subject to a term SOFR floor of 50 bps. The other terms of the Term Loan B and the terms of the Revolving Facility remained unchanged.
On September 15, 2023, the Company entered into Amendment No. 7 to the JPM Credit Agreement to provide for a new senior secured first lien incremental term loan facility in an aggregate principal amount of $170.0 million (the “Incremental Term Loan B”), which represents an increase in the aggregate principal amount of the Term Loan B from $850.0 million to $1.02 billion. The Company used a portion of the proceeds from the Incremental Term Loan B to partially repay outstanding amounts under the Revolving Facility.
The Company capitalized debt issuance costs related to the JPM Credit Agreement of $5.0 million and $1.8 million during the years ended December 31, 2023 and 2022, respectively.
At December 31, 2023, the outstanding borrowings on the Term Loan B of $998.7 million had an applicable interest rate of 8.97 %. Comparatively, at December 31, 2022, the outstanding borrowings on the Term Loan B of $838.1 million had an applicable interest rate of 7.79 %. The outstanding borrowings on the Term Loan B are presented net of unamortized debt issuance costs of $20.3 million and $19.7 million on the consolidated balance sheets at December 31, 2023 and 2022, respectively.
94
Future annual maturities of the Term Loan B are as follows as of December 31, 2023:
| (in thousands) | Amount | |||||||
| Payments for the years ending December 31, | ||||||||
| 2024 | $ | |||||||
| 2025 | ||||||||
| 2026 | ||||||||
| 2027 | ||||||||
| Total long-term debt | ||||||||
| Less: unamortized debt discount and issuance costs | ( | |||||||
| Net long-term debt | $ | |||||||
Borrowings under the Revolving Facility accrue interest at SOFR plus 210 bps to SOFR plus 310 bps based on total net leverage ratio. The outstanding borrowings on the Revolving Facility of $341.0 million at December 31, 2023 had an applicable interest rate of 8.46 %. Comparatively, the outstanding borrowings on the Revolving Facility of $505.0 million at December 31, 2022 had an applicable interest rate of 7.41 %. The Revolving Facility is also subject to a commitment fee of 0.40
The JPM Credit Agreement requires the Company to meet certain financial covenants and comply with customary affirmative and negative covenants as listed in the underlying agreement. The Company was in compliance with these covenants at December 31, 2023.
Interest Rate Caps
The Company uses interest rate caps to mitigate its exposure to interest rate risk on its debt by limiting the impact of interest rate changes on cash flows. The interest rate caps limit the variability of the applicable base rate to the amount of the cap. At December 31, 2023, the Company held three interest rate caps; one interest rate cap with a notional amount of $300.0 million and interest rate cap of 1.50 % expiring on March 10, 2024 and two interest rate caps each with a notional amount of $600.0 7.00 2.6 million and $15.2 million at December 31, 2023 and 2022, respectively.
The Company recognized a loss on interest rate caps of $1.7 million for the year ended December 31, 2023, which included an unrealized fair value loss of $12.6 million, offset in part by a realized gain related to settlements received of $10.9 million. The unrealized fair value loss for 2023 relates to changes in the interest rate curve and our March 10, 2024 interest rate cap approaching maturity. Comparatively, the Company recognized and a gain on interest rate caps of $26.2 million for the year ended December 31, 2022 in connection with rising interest rates and market estimates for future rate increases. The gain or loss on interest rate caps is included as a component of other income (expense), net in the consolidated statements of comprehensive loss.
12. Leases
The Company has operating leases relating to its facilities and office equipment with terms expiring though February 2031. Determination of whether a new contract is a lease is made at contract inception or at the modification date for a modified contract. The Company's operating leases may require fixed rental payments, variable lease payments based on usage or sales and fixed non-lease costs relating to the leased asset. Fixed non-lease costs such as common-area maintenance costs are included in the measurement of the right-of-use asset and lease liability as the Company does not separate lease and non-lease components. Variable lease payments are generally not included in the measurement of the right-of-use asset and lease liability and are recorded as lease expense in the period incurred. Short-term leases of 12 months or less are expensed in conjunction with the Company's short-term policy election.
The Company's operating leases may include renewal or termination options. Options to extend or terminate leases are excluded from balance sheet recognition until the options are reasonably certain to be exercised. The Company only included executed options to extend its leases in its calculation of right-of-use assets and lease liabilities at December 31, 2023.
95
Operating lease right-of-use assets and lease liabilities were as follows:
| December 31, | ||||||||||||||
| (in thousands) | 2023 | 2022 | ||||||||||||
| Assets: | ||||||||||||||
| Right-of-use assets | $ | $ | ||||||||||||
| Liabilities: | ||||||||||||||
| Operating lease liabilities, current portion | $ | $ | ||||||||||||
| Operating lease liabilities, non-current | ||||||||||||||
| Total operating lease liabilities | $ | $ | ||||||||||||
The components of the lease costs were as follows:
| For the Years Ended December 31, | ||||||||||||||||||||
| (in thousands) | 2023 | 2022 | 2021 | |||||||||||||||||
| Operating lease costs | $ | $ | $ | |||||||||||||||||
| Variable lease costs | ||||||||||||||||||||
Supplemental cash flow information relating to our leases was as follows:
| For the Years Ended December 31, | ||||||||||||||||||||
| (in thousands) | 2023 | 2022 | 2021 | |||||||||||||||||
| Cash paid for amounts included in measurement of lease liabilities: | ||||||||||||||||||||
| Operating cash flows used in operating leases | $ | $ | $ | |||||||||||||||||
| Operating lease non-cash items: | ||||||||||||||||||||
| Right-of-use assets obtained in exchange for operating lease liabilities | $ | $ | $ | |||||||||||||||||
| Right-of-use assets increased through lease modifications and reassessments | ||||||||||||||||||||
Weighted average remaining lease terms and discount rates were as follows:
| December 31, | ||||||||||||||
| 2023 | 2022 | |||||||||||||
| Operating leases: | ||||||||||||||
| Remaining lease term | ||||||||||||||
| Discount rate | % | % | ||||||||||||
96
Future minimum lease payments under non-cancelable operating lease agreements at December 31, 2023 were as follows:
| (in thousands) | Minimum Future Lease Payments | |||||||
| For the years ending December 31, | ||||||||
| 2024 | $ | |||||||
| 2025 | ||||||||
| 2026 | ||||||||
| 2027 | ||||||||
| 2028 | ||||||||
| Thereafter | ||||||||
| Total minimum lease payments | ||||||||
| Less: amounts representing interest or imputed interest | ( | |||||||
| Present value of lease liabilities | $ | |||||||
13. Stockholders’ Equity and Noncontrolling Interest
Capital Stock
BRP Group’s certificate of incorporation authorized capital stock consisting of 300 million shares of Class A common stock with a par value $0.01 per share, 100 million shares of Class B common stock with a par value of $0.0001 per share, and 50 million shares of preferred stock with a par value of $0.01 per share.
The following table shows a rollforward of our common stock outstanding for the prior three years:
| Class A Common Stock | Class B Common Stock | |||||||||||||
| Shares issued at December 31, 2020 | ||||||||||||||
| Shares issued to the public in follow-on offerings | — | |||||||||||||
| Shares issued in connection with Partnerships | ||||||||||||||
| Common stock and restricted stock grants under Partnership Inducement Award Plan, net of forfeitures and shares withheld for taxes | — | |||||||||||||
| Common stock and restricted stock grants under Omnibus Incentive Plan, net of forfeitures and shares withheld for taxes | — | |||||||||||||
| Redemption of Class B shares of common stock for Class A shares | ( | |||||||||||||
| Shares issued at December 31, 2021 | ||||||||||||||
| Shares issued in connection with Partnerships | — | |||||||||||||
| Common stock and restricted stock grants under Partnership Inducement Award Plan, net of forfeitures and shares withheld for taxes | ( | — | ||||||||||||
| Common stock and restricted stock grants under Omnibus Incentive Plan, net of forfeitures and shares withheld for taxes | — | |||||||||||||
| Redemption of Class B shares of common stock for Class A shares | ( | |||||||||||||
| Equity issued in satisfaction of a liability | — | |||||||||||||
| Forfeiture of unvested Class B shares | — | ( | ||||||||||||
| Shares issued at December 31, 2022 | ||||||||||||||
| Common stock and restricted stock grants under Partnership Inducement Award Plan, net of forfeitures and shares withheld for taxes | ( | — | ||||||||||||
| Common stock and restricted stock grants under Omnibus Incentive Plan, net of forfeitures and shares withheld for taxes | — | |||||||||||||
| Redemption of Class B shares of common stock for Class A shares | ( | |||||||||||||
| Cancellation of Class A shares to settle obligation from Partner | ( | — | ||||||||||||
| Shares issued at December 31, 2023 | ||||||||||||||
97
Class A Common Stock
Stockholders of BRP Group’s Class A common stock are entitled to one vote for each share held of record on all matters on which stockholders are entitled to vote generally, including the election or removal of directors, although they do not have cumulative voting rights in the election of directors. Stockholders of Class A common stock are entitled to receive dividends when and if declared by our board of directors, subject to any restrictions on the payment of dividends.
Upon our liquidation, dissolution or winding up and after payment in full of all amounts required to be paid to creditors and to the holders of preferred stock having liquidation preferences, if any, the stockholders of Class A common stock will be entitled to receive pro rata our remaining assets available for distribution.
Class B Common Stock
The Class B common stock can be exchanged (together with a corresponding number of LLC Units) for shares of Class A common stock on a one-for-one basis, subject to certain restrictions, and the shares of Class B common stock will be cancelled on a one-for-one basis with the redemption or exchange. Except for transfers to us pursuant to the Amended LLC Agreement or to certain permitted transferees, BRP’s LLC Members are not permitted to sell, transfer or otherwise dispose of any LLC Units or shares of Class B common stock.
Each share of Class B common stock entitles the stockholder to one vote per share, together with holders of Class A common stock as a single class, on all matters submitted to a vote of our stockholders. If at any time the ratio at which LLC Units are redeemable or exchangeable for shares of Class A common stock changes from one-for-one, the number of votes to which Class B common stockholders are entitled will be adjusted accordingly. Class B common stockholders will vote together with Class A common stockholders as a single class on all matters on which stockholders are entitled to vote generally, except as otherwise required by law. Class B common stockholders do not have cumulative voting rights in the election of directors, nor do they have any right to receive dividends or to receive a distribution upon a liquidation or winding up of BRP Group.
Noncontrolling Interest
BRP Group is the sole managing member of BRP. As such, BRP Group consolidates BRP in its consolidated financial statements, resulting in a noncontrolling interest related to the LLC Units held by BRP’s LLC Members in its consolidated financial statements.
The following table summarizes the ownership interest in BRP:
| December 31, 2023 | December 31, 2022 | |||||||||||||||||||||||||
| LLC Units | Percentage | LLC Units | Percentage | |||||||||||||||||||||||
| Interest in BRP held by BRP Group | % | % | ||||||||||||||||||||||||
| Noncontrolling interest in BRP held by BRP’s LLC Members | % | % | ||||||||||||||||||||||||
| Total | % | % | ||||||||||||||||||||||||
14. Related Party Transactions
Due to/from Related Parties
The Company has $1.5 million due from related parties at December 31, 2023, which includes amounts due from Partners for post-closing cash requirements in accordance with Partnership agreements. This receivable also includes $0.8 million for a loan made to an entity formed for the benefit of MSI and with which BRP, Lowry Baldwin, the Company's Chairman, and members of the Company's executive management team have made capital commitments. Due from related parties is included in prepaid expenses and other current assets on the consolidated balance sheets.
Related party notes payable of $1.5
Commission Revenue
The Company serves as a broker for Holding Company of the Villages, Inc. (“The Villages”), a significant shareholder, and certain affiliated entities. Commission revenue recorded from transactions with The Villages and affiliated entities was $2.1 1.8 million for the year ended December 31, 2021.
98
The Company serves as a broker for certain entities in which a member of our board of directors has a material interest. Commission revenue recorded from transactions with these entities was $0.3
Commissions and Consulting Expense
Two brothers of Lowry Baldwin, the Company's Chairman, collectively received producer commissions from the Company comprising approximately $0.6
The Company had a consulting agreement with Accenture, with which an independent member of our board of directors holds an executive leadership position. Consulting expense recorded as a result of this transaction was $0.4 million and $1.2 million for the years ended December 31, 2023 and 2022, respectively.
Rent Expense
The Company has various agreements to lease office space from wholly-owned subsidiaries of The Villages. Rent expense ranges from approximately $3,000 to $12,000 per month, per lease. Lease agreements expire on various dates through December 2027. Total rent expense incurred with respect to The Villages and its wholly-owned subsidiaries was approximately $0.4 0.5 million for the year ended December 31, 2021. Total right-of-use assets and operating lease liabilities included on the Company's balance sheets relating to these lease agreements were $1.4 1.7
The Company has various agreements to lease office space from other related parties. Rent expense ranges from approximately $1,000 to $59,000 per month, per lease. Lease agreements expire on various dates through December 2030. Total rent expense incurred with respect to other related parties was approximately $3.9 million, $3.8 million and $2.5 million for the years ended December 31, 2023, 2022 and 2021, respectively. Total right-of-use assets and operating lease liabilities included on the Company's balance sheets relating to these lease agreements were $12.9 million and $13.4 million, respectively, at December 31, 2023 and $15.0 million and $15.4 million, respectively, at December 31, 2022.
Other
Lowry Baldwin, the Company's Chairman, paid $0.3
15. Share-Based Compensation
Omnibus Incentive Plan and Partnership Inducement Award Plan
On October 24, 2019, the Company adopted the BRP Group, Inc. Omnibus Incentive Plan (the “Omnibus Plan”) and on November 27, 2020, the Company adopted the BRP Group, Inc. Partnership Inducement Award Plan (the “Inducement Plan” and collectively with the Omnibus Plan, the “Plans”) to motivate and reward Colleagues and certain other individuals to perform at the highest level and contribute significantly to the Company’s success, thereby furthering the best interests of BRP Group’s stockholders. The Plans permit the grant of both nonqualified and incentive stock options, stock appreciation rights, restricted stock awards (“RSAs”), restricted stock unit awards (“RSUs”), other performance awards (including performance-based RSUs (“PSUs”) issued in connection with the Long-Term Incentive Plan (“LTIP”) for executives), cash-based awards and share-based awards to the Company’s directors, officers, Colleagues and, solely with respect to the Omnibus Plan, consultants. The aggregate value of all compensation paid to a non-employee director under the Omnibus Plan in any calendar year may not exceed $250,000 and awards granted under the Inducement Plan require a minimum vesting period of one year .
The Plans are administered by the Compensation Committee, the members of which are independent members of the board of directors. The Compensation Committee assesses issuances under the Plans in the context of the Company's fully-diluted capital composition, which includes shares of Class A common stock and Class B common stock.
The total number of shares of Class A common stock authorized for issuance under the Omnibus Plan and Inducement Plan was 8,461,907 and 3,000,000 , respectively, at December 31, 2023. Under the Omnibus Plan, the number of shares of Class A common stock reserved for issuance will increase on the first day of each fiscal year by the lesser of (i) 2 % of the aggregate shares of Class A and Class B common stock outstanding on the last day of the immediately preceding fiscal year and (ii) such number of shares as determined by the Company’s board of directors. In accordance therewith, the number of authorized shares of Class A common stock reserved for issuance under the Omnibus Plan increased by 2,331,128 shares effective January 1, 2024.
99
At December 31, 2023, there were 1,385,732 and 1,626,454 shares of Class A common stock available for grant under the Omnibus Plan and Inducement Plan, respectively. The Company issues new shares of Class A common stock upon the grant of RSAs and the vesting of PSUs. During the year ended December 31, 2023, the Company made awards of RSAs, PSUs and fully-vested shares under the Plans to its non-employee directors, officers, Colleagues and consultants. Fully-vested shares issued to directors, officers and Colleagues during the year ended December 31, 2023 were vested upon issuance while RSAs issued to Colleagues and consultants generally either cliff vest after to four years or vest ratably over to five years . The vesting of RSAs and PSUs issued to the Company's executive officers is discussed below under Long-Term Incentive Plan.
The following table summarizes the activity for awards granted by the Company under the Plans:
| Shares | Weighted-Average Grant-Date Fair Value Per Share | |||||||||||||
| Non-vested awards outstanding at December 31, 2020 | $ | |||||||||||||
| Granted | ||||||||||||||
| Vested and settled | ( | |||||||||||||
| Forfeited | ( | |||||||||||||
| Non-vested awards outstanding at December 31, 2021 | ||||||||||||||
| Granted | ||||||||||||||
| Vested and settled | ( | |||||||||||||
| Forfeited | ( | |||||||||||||
| Non-vested awards outstanding at December 31, 2022 | ||||||||||||||
| Granted | ||||||||||||||
| Vested and settled | ( | |||||||||||||
| Forfeited | ( | |||||||||||||
| Non-vested awards outstanding at December 31, 2023 | ||||||||||||||
Non-vested awards outstanding at December 31, 2023 that are expected to vest | ||||||||||||||
The total fair value of shares that vested and settled under the Plans was $40.0 million, $21.4 million and $6.0 million for the years ended December 31, 2023, 2022 and 2021, respectively. Non-vested awards outstanding at December 31, 2023 include 596,272 PSUs expected to vest, which have an aggregate intrinsic value of $14.3 million and a weighted-average remaining contractual term of 1.6 years.
Share-based compensation is recognized ratably over the vesting period of the respective awards and includes expense related to issuances under the Plans, MIU Conversion LLC Units (defined below) and, prior to 2023, advisor incentive awards. Share-based compensation also includes the portion of annual bonuses that are payable in fully-vested shares of Class A common stock. The Company recognizes share-based compensation expense for the Plans net of actual forfeitures. The Company recorded share-based compensation expense of $56.2 million, $47.4 million and $19.2 million for the years ended December 31, 2023, 2022 and 2021, respectively. Shared-based compensation expense is included in commissions, employee compensation and benefits expense in the consolidated statements of comprehensive loss. The Company had $64.0 million of total unrecognized compensation cost related to non-vested shares at December 31, 2023, which is expected to be recognized over a weighted-average period of 2.0 years.
Long-Term Incentive Plan
During the years ended December 31, 2023, 2022 and 2021, the Compensation Committee awarded the Company’s executive officers incentive compensation awards under the LTIP consisting of (i) PSUs with an aggregate target grant date value of $7.6 million, $5.1 million and $3.1 million, respectively, and (ii) RSAs with an aggregate grant date value of $0.4 million, $1.5 million and $1.0 million, respectively. The incentive compensation awards granted during the years ended December 31, 2023, 2022 and 2021 have an aggregate maximum value of $25.9 million, $14.2 million and $8.8 million, respectively.
100
As part of the adoption of the LTIP each year, the Compensation Committee approves the form of PSU award agreement (the “Form PSU Award Agreement”) under the Omnibus Plan in connection with the granting of PSUs to its executive officers. The Form PSU Award Agreement provides for the granting of PSUs, which generally vest in the quarter following the end of a performance period of three years . The number of PSUs, if any, that will actually be earned pursuant to a PSU award will depend on the level of performance achieved with respect to applicable performance goals during the applicable performance period. The RSAs vest in equal annual installments over five years .
Valuation Assumptions
The fair value of PSUs with market conditions was estimated on the grant date using a Monte Carlo analysis to model the value of the PSUs using the following assumptions. Expected volatility is based on an average of implied volatility on the valuation date and the one-year historical volatility of BRP Group and publicly-traded companies within a peer group and the Russell 3000 Index. The risk-free interest rate is based on the U.S. Treasury rates in effect at the time of the grant. Expected term is based on the remaining measurement period of the awards at the grant date. The assumptions used in calculating the fair value of the PSUs with market conditions are set forth in the table below.
| For the Years Ended December 31, | ||||||||||||||||||||
| 2023 | 2022 | 2021 | ||||||||||||||||||
| Expected volatility minimum | % | % | % | |||||||||||||||||
| Expected volatility maximum | % | % | % | |||||||||||||||||
| Risk-free interest rate | % | % | % | |||||||||||||||||
| Expected term | ||||||||||||||||||||
Management Incentive Units
Management Incentive Units (“MIUs”) were non-voting units issued to certain senior management prior to October 2019. In connection with the Company's initial public offering in October 2019, all remaining MIUs were converted to restricted LLC Units (and corresponding shares of Class B common stock) (“MIU Conversion LLC Units”) that contained identical vesting conditions to the original MIU issuances. As such, no MIUs remain issued and outstanding.
The non-vested MIU Conversion LLC Units vested according to time-based benchmarks through 2023. There were 429,747 , 450,744 and 467,237 MIU Conversion LLC Units that vested during the years ended December 31, 2023, 2022 and 2021, respectively.
16. Retirement Plan
The Company sponsors a 401(k) retirement plan for Colleagues who meet specific age and service requirements. This plan allows for participants to make salary deferral contributions. Employer matching and profit-sharing contributions to this plan are discretionary. Company contributions were $16.9 million, $11.4 million and $5.1 million for the years ended December 31, 2023, 2022 and 2021, respectively.
17. Income Taxes
BRP Group is the sole managing member of BRP, which is treated as a partnership for U.S. federal, state and local income tax purposes. As a partnership, BRP is not subject to U.S. federal and certain state and local income taxes. Any taxable income or loss generated by BRP is passed through to and included in the taxable income or loss of its partners, including BRP Group, on a pro rata basis. BRP Group is subject to U.S. federal income taxes, in addition to state and local income taxes, with respect to BRP Group’s allocable share of income of BRP.
101
Components of income tax expense include the following:
| For the Years Ended December 31, | ||||||||||||||||||||
| (in thousands) | 2023 | 2022 | 2021 | |||||||||||||||||
| Current | ||||||||||||||||||||
| Federal | $ | $ | $ | |||||||||||||||||
| State and local | ||||||||||||||||||||
| Total current income tax expense | ||||||||||||||||||||
| Deferred | ||||||||||||||||||||
| Federal | ( | ( | ||||||||||||||||||
| State and local | ||||||||||||||||||||
| Total deferred income tax expense | ( | |||||||||||||||||||
| Total income tax expense | $ | $ | $ | |||||||||||||||||
Income tax expense at the Company’s effective tax rate differed from the statutory tax rate as follows:
| For the Years Ended December 31, | ||||||||||||||||||||
| (in thousands) | 2023 | 2022 | 2021 | |||||||||||||||||
| Loss before income taxes | $ | ( | $ | ( | $ | ( | ||||||||||||||
| Noncontrolling interest | ||||||||||||||||||||
Tax provision at statutory rate ( | ( | ( | ( | |||||||||||||||||
| Effect of: | ||||||||||||||||||||
| Valuation allowance | ||||||||||||||||||||
| State and local income tax | ( | ( | ( | |||||||||||||||||
| Meals and entertainment | ||||||||||||||||||||
| IRC 162(m) | ||||||||||||||||||||
| Share-based compensation | ( | |||||||||||||||||||
| State rate change | ( | ( | ||||||||||||||||||
| True-up and adjustments | ( | |||||||||||||||||||
| MIU issuance | ||||||||||||||||||||
| Other | ||||||||||||||||||||
| Total income tax expense | $ | $ | $ | |||||||||||||||||
The following table summarizes the components of deferred tax assets and liabilities:
| December 31, | ||||||||||||||
| (in thousands) | 2023 | 2022 | ||||||||||||
| Deferred tax assets | ||||||||||||||
| Investment in Partnerships | $ | $ | ||||||||||||
| 163(j) limitation carryforward | ||||||||||||||
| Net operating loss | ||||||||||||||
| Capitalized transaction costs | ||||||||||||||
| Charitable contributions | ||||||||||||||
| Total deferred tax assets | ||||||||||||||
| Less: valuation allowance | ( | ( | ||||||||||||
| Net deferred tax assets | $ | $ | ||||||||||||
102
Deferred tax balances reflect the impact of temporary differences between the carrying amount of assets and liabilities and their tax basis and are stated at the tax rates in effect when the temporary differences are expected to be recovered or settled. The Company assessed the future realization of the tax benefit of its existing deferred tax assets and concluded that it is more likely than not that all of the deferred tax assets will not be realized in the future. As a result, the Company recorded a valuation allowance of $140.1 million and $103.9 million against its deferred tax assets at December 31, 2023 and 2022, respectively.
As of December 31, 2023, the Company has not recognized any uncertain tax positions, penalties, or interest as management has concluded that no such positions exist. The Company is subject to federal examination for tax years beginning with the year ended December 31, 2020 and state examination for tax years beginning with the year ended December 31, 2019. One of the Company's subsidiaries is currently under audit with the IRS for the year ended December 31, 2020. The Company is not under audit for other taxable entities, jurisdictions or tax years. In addition, all of our federal net operating losses and 163(j) interest expense limitations can be carried forward indefinitely while our state net operating losses will begin to expire in 2039.
Tax Receivable Agreement
BRP makes an election under Section 754 of the Internal Revenue Code of 1986, as amended, and the regulations thereunder (the “Code”) effective for each taxable year in which a redemption or exchange of LLC Units and corresponding Class B common stock for shares of Class A common stock occurs. Exchanges result in tax basis adjustments to the assets of BRP, which produce favorable tax attributes and reduce the amount of tax that BRP Group is required to pay. The Company has determined that it is more likely than not that these benefits will not be realized.
BRP Group is a party to the Tax Receivable Agreement with BRP’s LLC Members that provides for the payment by BRP Group to BRP’s LLC Members of 85 % of the amount of cash savings, if any, in U.S. federal, state and local income tax or franchise tax that BRP Group actually realizes as a result of (i) any increase in tax basis in BRP assets resulting from (a) previous acquisitions by BRP Group of LLC Units from BRP’s LLC Members, (b) the acquisition of LLC Units from BRP’s LLC Members using the net proceeds from any future offering, (c) redemptions or exchanges by BRP’s LLC Members of LLC Units and the corresponding number of shares of Class B common stock for shares of Class A common stock or cash or (d) payments under the Tax Receivable Agreement, and (ii) tax benefits related to imputed interest resulting from payments made under the Tax Receivable Agreement.
This payment obligation is an obligation of BRP Group and not of BRP. For purposes of the Tax Receivable Agreement, the cash tax savings in income tax will be computed by comparing the actual income tax liability of BRP Group (calculated with certain assumptions) to the amount of such taxes that BRP Group would have been required to pay had there been no increase to the tax basis of the assets of BRP as a result of the redemptions or exchanges and had BRP Group not entered into the Tax Receivable Agreement. Estimating the amount of payments that may be made under the Tax Receivable Agreement is by its nature imprecise, insofar as the calculation of amounts payable depends on a variety of factors. While the actual increase in tax basis, as well as the amount and timing of any payments under the Tax Receivable Agreement, will vary depending upon a number of factors, including the timing of redemptions or exchanges, the price of shares of our Class A common stock at the time of the redemption or exchange, the extent to which such redemptions or exchanges are taxable and the amount and timing of our income. The Company accounts for the effects of these increases in tax basis and associated payments under the Tax Receivable Agreement arising from future redemptions or exchanges as follows:
•records an increase in deferred tax assets for the estimated income tax effects of the increases in tax basis based on enacted federal and state tax rates at the date of the redemption or exchange;
•to the extent it is estimated that the Company will not realize the full benefit represented by the deferred tax asset, based on an analysis that will consider, among other things, our expectation of future earnings, the Company reduces the deferred tax asset with a valuation allowance; and
•records 85 % of the estimated realizable tax benefit (which is the recorded deferred tax asset less any recorded valuation allowance) as an increase to the liability due under the Tax Receivable Agreement and the remaining 15 % of the estimated realizable tax benefit as an increase to additional paid-in capital.
All of the effects of changes in any of our estimates after the date of the redemption or exchange will be included in net income. Similarly, the effect of subsequent changes in the enacted tax rates will be included in net income.
18. Earnings (Loss) Per Share
Basic earnings (loss) per share is computed by dividing net income (loss) attributable to BRP Group by the weighted-average number of shares of Class A common stock outstanding during the period. Diluted earnings (loss) per share is computed giving effect to all potentially dilutive shares of common stock.
103
The following table sets forth the computation of basic and diluted loss per share:
| For the Years Ended December 31, | ||||||||||||||||||||
| (in thousands, except per share data) | 2023 | 2022 | 2021 | |||||||||||||||||
| Basic and diluted loss per share: | ||||||||||||||||||||
| Loss attributable to BRP Group | $ | ( | $ | ( | $ | ( | ||||||||||||||
| Shares used for basic and diluted loss per share: | ||||||||||||||||||||
| Basic and diluted weighted-average shares of Class A common stock outstanding | ||||||||||||||||||||
| Basic and diluted loss per share | $ | ( | $ | ( | $ | ( | ||||||||||||||
Potentially dilutive securities consist of unvested stock awards, including RSAs and PSUs, in addition to shares of Class B common stock, which can be exchanged (together with a corresponding number of LLC Units) for shares of Class A common stock on a one-for-one basis. The following potentially dilutive securities were excluded from the Company's diluted weighted-average number of shares outstanding calculation for the periods presented as their inclusion would have been anti-dilutive.
| For the Years Ended December 31, | ||||||||||||||||||||
| 2023 | 2022 | 2021 | ||||||||||||||||||
| Unvested RSAs and PSUs | ||||||||||||||||||||
| Shares of Class B common stock | ||||||||||||||||||||
The shares of Class B common stock do not share in the earnings or losses attributable to BRP Group, and therefore, are not participating securities. Accordingly, a separate presentation of basic and diluted earnings per share of Class B common stock under the two-class method has not been included.
19. Fair Value Measurements
ASC Topic 820, Fair Value Measurement (“Topic 820”) established a framework for measuring fair value. That framework provides a fair value hierarchy that prioritizes the inputs to valuation techniques used to measure fair value. The hierarchy gives the highest priority to unadjusted quoted prices in active markets for identical assets or liabilities (Level 1 measurement) and the lowest priority to unobservable inputs (Level 3 measurement). The three levels of the fair value hierarchy under Topic 820 are described below:
Level 1: Inputs to the valuation methodology are unadjusted quoted prices for identical assets or liabilities in active markets that the Company has the ability to access.
Level 2: Inputs to the valuation methodology are quoted market prices for similar instruments in active markets, quoted prices for identical or similar instruments in markets that are not active, and model-based valuation techniques for which all significant assumptions are observable in the market.
Level 3: Inputs to the valuation methodology are unobservable and significant to the fair value measurement.
The fair value measurement level for assets and liabilities within the fair value hierarchy is based on the lowest level of any input that is significant to the fair value measurement. Valuation techniques used need to maximize the use of observable inputs and minimize the use of unobservable inputs.
104
Assets and Liabilities Measured at Fair Value on a Recurring Basis
The following table summarizes the Company’s assets and liabilities measured at fair value on a recurring basis within each level of the fair value hierarchy:
| December 31, | ||||||||||||||
| (in thousands) | 2023 | 2022 | ||||||||||||
| Level 2 | ||||||||||||||
| $ | $ | |||||||||||||
| Level 2 Assets | $ | $ | ||||||||||||
| Level 3 | ||||||||||||||
| Contingent earnout liabilities | $ | $ | ||||||||||||
| Level 3 Liabilities | $ | $ | ||||||||||||
The fair value of interest rate caps is determined using the market standard methodology of discounting the future expected cash receipts that would occur if variable interest rates rise above the strike rate of the caps. The variable interest rates used in the calculation of projected receipts on the caps are based on an expectation of future interest rates derived from observable market interest rate curves and volatilities.
Methodologies used for liabilities measured at fair value on a recurring basis within Level 3 of the fair value hierarchy at December 31, 2023 and 2022 are based on limited unobservable inputs. These methods may produce a fair value calculation that may not be indicative of the net realizable value or reflective of future fair values. Furthermore, while the Company believes its valuation methods are appropriate and consistent with other market participants, the use of methodologies or assumptions to determine the fair value of certain financial instruments could result in a different fair value measurement at the reporting date.
The fair value of contingent earnout liabilities is based on sales projections for the acquired entities, which are reassessed each reporting period. Based on the Company’s ongoing assessment of the fair value of its contingent earnout liabilities, the Company recorded a net increase in the estimated fair value of such liabilities of $61.1 million, $32.3 million and $45.2 million for the years ended December 31, 2023, 2022 and 2021, respectively. The Company has assessed the maximum estimated exposure to the contingent earnout liabilities to be $607.4 million at December 31, 2023.
The Company measures contingent earnout liabilities at fair value each reporting period using significant unobservable inputs classified within Level 3 of the fair value hierarchy. The Company uses a probability weighted value analysis as a valuation technique to convert future estimated cash flows to a single present value amount. The significant unobservable inputs used in the fair value measurements are sales projections over the earnout period, and the probability outcome percentages assigned to each scenario. Significant increases or decreases to either of these inputs would result in a significantly higher or lower liability with a higher liability capped by the contractual maximum of the contingent earnout liabilities. Ultimately, the liability will be equivalent to the amount settled, and the difference between the fair value estimate and amount settled will be recorded in earnings for business combinations, or as a change in the cost of the assets acquired for asset acquisitions.
The fair value of the contingent earnout liabilities is based on Monte Carlo simulations that measure the present value of the expected future payments to be made to Partners in accordance with the provisions outlined in the respective purchase agreements, which is a Level 3 fair value measurement. In determining fair value, the Company estimates the Partner’s future performance using financial projections developed by management for the Partner and market participant assumptions that were derived for revenue growth, the number of rental units tracked or the insured value of sourced homeowners insurance. Revenue growth rates generally ranged from 10 % to 35 % at December 31, 2023 and from 8 % to 35 % at December 31, 2022. The Company estimates future payments using the earnout formula and performance targets specified in each purchase agreement and these financial projections. These payments are discounted to present value using a risk-adjusted rate that takes into consideration market-based rates of return that reflect the ability of the Partner to achieve the targets. These discount rates generally ranged from 7.50 % to 13.75 % at December 31, 2023 and from 6.50 % to 18.00 % at December 31, 2022. Changes in financial projections, market participant assumptions for revenue growth, or the risk-adjusted discount rate, would result in a change in the fair value of contingent consideration.
105
The following table sets forth a summary of the changes in the fair value of the Company’s contingent earnout liabilities, which are measured at fair value on a recurring basis utilizing Level 3 assumptions in their valuation:
| For the Years Ended December 31, | ||||||||||||||
| (in thousands) | 2023 | 2022 | ||||||||||||
| Balance at beginning of year | $ | $ | ||||||||||||
Change in fair value of contingent consideration(1) | ||||||||||||||
| Fair value of contingent consideration issuances | ||||||||||||||
Settlement of contingent consideration(2) | ( | ( | ||||||||||||
| Balance at end of year | $ | $ | ||||||||||||
__________
(1) The Company reclassified $8.5 million of its contingent earnout liabilities through the issuance of an incentive bonus during the year ended December 31, 2023, which results in a reduction to the change in fair value of contingent consideration and an increase to commissions, employee compensation and benefits expense in the consolidated statements of comprehensive loss. The incentive bonus that remains unpaid at the end of the year is reflected as an earnout incentive bonus in Note 10.
(2) The Company settled $2.1 million and $61.5
Fair Value of Assets and Liabilities Not Measured at Fair Value
The fair value of long-term debt and the revolving line of credit is based on an estimate using a discounted cash flow analysis and current borrowing rates for similar types of borrowing arrangements. The carrying amount and estimated fair value of long-term debt and the revolving line of credit were as follows:
| Fair Value Hierarchy | December 31, 2023 | December 31, 2022 | |||||||||||||||||||||||||||
| (in thousands) | Carrying Amount | Estimated Fair Value | Carrying Amount | Estimated Fair Value | |||||||||||||||||||||||||
Long-term debt(1) | Level 2 | $ | $ | $ | $ | ||||||||||||||||||||||||
| Revolving line of credit | Level 2 | ||||||||||||||||||||||||||||
__________
(1) The carrying amount of long-term debt reflects outstanding borrowings on the Term Loan B, which are presented net of unamortized debt discount and issuance costs of $20.3 million and $19.7 million at December 31, 2023 and 2022, respectively, on the consolidated balance sheets.
20. Commitments and Contingencies
As of December 31, 2023, BRP has a remaining commitment to USF to donate $4.2 million through October 2028. The gift will provide support for the School of Risk Management and Insurance in the USF Muma College of Business. It is currently anticipated that Lowry Baldwin, the Company's Chairman, will fund half of the amounts to be donated by BRP.
Legal
The Company is involved in various claims and legal actions arising in the ordinary course of business. A liability is recorded when a loss is considered probable and is reasonably estimable in accordance with GAAP. In the opinion of management, the ultimate resolution of these matters will not have a material adverse effect on the Company’s consolidated financial position, results of operations or liquidity.
106
21. Segment Information
The Company completed a strategic review of its organizational structure in January 2023 and determined that the chief operating decision-maker, the chief executive officer, would change the way he manages and operates the Company’s Mainstreet and Medicare businesses. Effective in the first quarter of 2023, the chief executive officer reviews the Medicare and Mainstreet businesses on a combined basis as one operating segment, also determined to be an Operating Group, Mainstreet Insurance Solutions, which is used by the chief executive officer to make decisions about the resources to be allocated to the Operating Group and to assess its performance. In addition, the Middle Market and Specialty Operating Groups were rebranded as Insurance Advisory Solutions and Underwriting, Capacity & Technology Solutions, respectively, effective in the first quarter of 2023.
Effective in the first quarter of 2023, BRP Group’s business is divided into three Operating Groups: Insurance Advisory Solutions, Underwriting, Capacity & Technology Solutions and Mainstreet Insurance Solutions.
•The Insurance Advisory Solutions (“IAS”) Operating Group provides expertly-designed commercial risk management, employee benefits and private risk management solutions for businesses and high-net-worth individuals, as well as their families, through our national footprint which has assimilated some of the highest quality independent insurance brokers in the country with vast and varied strategic capabilities and expertise.
•The Underwriting, Capacity & Technology Solutions (“UCTS”) Operating Group consists of three distinct businesses—our specialty wholesale broker business, our MGA of the Future platform and, as of the third quarter of 2023, our newly launched reinsurance brokerage business, Juniper Re. Our specialty wholesale broker business delivers professionals, individuals and niche industry businesses expanded access to exclusive specialty markets, capabilities and programs requiring complex underwriting and placement. Through its MGA of the Future platform, the Company manufactures proprietary, technology-enabled insurance products that are then distributed (in many instances via technology and/or API integrations) internally via Risk Advisors across its other Operating Groups and externally via select distribution partners, with a focus on sheltered channels where our products deliver speed, ease of use and certainty of execution, an example of which is the national embedded renters insurance product sold at point of lease via integrations with property management software providers.
•The Mainstreet Insurance Solutions (“MIS”) Operating Group offers personal insurance, commercial insurance and life and health solutions to individuals and businesses in their communities, with a focus on accessing Clients via sheltered distribution channels, which include, but are not limited to, new home builders, realtors, mortgage originators/lenders, master planned communities, and various other community centers of influence. The MIS Operating Group also offers consultation for government assistance programs and solutions, including traditional Medicare, Medicare Advantage and Affordable Care Act, to seniors and eligible individuals through a network of primarily independent contractor agents.
In all its Operating Groups, the Company generates commissions from insurance placement under both agency bill and direct bill arrangements, and profit-sharing income based on either the underlying book of business or performance, such as loss ratios. All Operating Groups also generate other ancillary income and premium financing income.
In the IAS and UCTS Operating Groups, the Company generates fees from service fee and consulting arrangements. Service fee arrangements are in place with certain Clients for providing insurance placement services.
In the UCTS Operating Group, the Company generates fees from policy fee and installment fee arrangements. Policy fee revenue is earned for acting in the capacity of an MGA and providing payment processing services and other administrative functions on behalf of Insurance Company Partners.
In the MIS Operating Group, the Company generates commissions and fees from marketing income, which is earned through co-branded Medicare marketing campaigns with the Company’s Insurance Company Partners.
In addition, the Company generates investment income in the IAS and UCTS Operating Groups and the Corporate and Other non-reportable segment.
The Company’s chief operating decision maker, the chief executive officer, uses net income (loss) and net income (loss) before interest, taxes, depreciation, amortization, and one-time transactional-related expenses or non-recurring items to manage resources and make decisions about the business.
107
Summarized financial information regarding the Company’s Operating Groups is shown in the following tables. The Corporate and Other non-reportable segment includes any expenses not allocated to the Operating Groups and corporate-related items, including interest expense. Intersegment revenue and expenses are eliminated through Corporate and Other. Service center expenses and other overhead are allocated to the Company’s Operating Groups based on either revenue or headcount as applicable to each expense.
| For the Year Ended December 31, 2023 | |||||||||||||||||||||||||||||
| (in thousands) | Insurance Advisory Solutions | Underwriting, Capacity & Technology Solutions | Mainstreet Insurance Solutions | Corporate and Other | Total | ||||||||||||||||||||||||
Revenues: | |||||||||||||||||||||||||||||
Commissions and fees(1) | $ | $ | $ | $ | ( | $ | |||||||||||||||||||||||
| Investment income | |||||||||||||||||||||||||||||
| Total revenues | ( | ||||||||||||||||||||||||||||
Operating expenses: | |||||||||||||||||||||||||||||
Commissions, employee compensation and benefits(1) | |||||||||||||||||||||||||||||
Other operating expenses | |||||||||||||||||||||||||||||
| Amortization expense | |||||||||||||||||||||||||||||
Change in fair value of contingent consideration | |||||||||||||||||||||||||||||
| Depreciation expense | |||||||||||||||||||||||||||||
| Total operating expenses | |||||||||||||||||||||||||||||
Operating income (loss) | ( | ( | |||||||||||||||||||||||||||
Other income (expense): | |||||||||||||||||||||||||||||
Interest income (expense), net | ( | ( | |||||||||||||||||||||||||||
| Other income (expense), net | ( | ( | ( | ||||||||||||||||||||||||||
| Total other income (expense) | ( | ( | ( | ||||||||||||||||||||||||||
Income (loss) before income taxes | ( | ( | |||||||||||||||||||||||||||
| Income tax expense | |||||||||||||||||||||||||||||
Net income (loss) | $ | $ | $ | $ | ( | $ | ( | ||||||||||||||||||||||
Capital expenditures | $ | $ | $ | $ | $ | ||||||||||||||||||||||||
| At December 31, 2023 | |||||||||||||||||||||||||||||
| Total assets | $ | $ | $ | $ | $ | ||||||||||||||||||||||||
__________
(1) During the year ended December 31, 2023, the UCTS Operating Group recorded intercompany commissions and fees of $65.9 million and the MIS Operating Group recorded intercompany commissions and fees of $1.8 million. Intercompany commissions and fees and intercompany commission expense are eliminated through Corporate and Other.
108
| For the Year Ended December 31, 2022 | |||||||||||||||||||||||||||||
| (in thousands) | Insurance Advisory Solutions | Underwriting, Capacity & Technology Solutions | Mainstreet Insurance Solutions | Corporate and Other | Total | ||||||||||||||||||||||||
Revenues: | |||||||||||||||||||||||||||||
Commissions and fees(1) | $ | $ | $ | $ | ( | $ | |||||||||||||||||||||||
| Total revenues | ( | ||||||||||||||||||||||||||||
Operating expenses: | |||||||||||||||||||||||||||||
Commissions, employee compensation and benefits(1) | |||||||||||||||||||||||||||||
Other operating expenses | |||||||||||||||||||||||||||||
| Amortization expense | |||||||||||||||||||||||||||||
Change in fair value of contingent consideration | |||||||||||||||||||||||||||||
| Depreciation expense | |||||||||||||||||||||||||||||
| Total operating expenses | |||||||||||||||||||||||||||||
Operating income (loss) | ( | ( | |||||||||||||||||||||||||||
Other income (expense): | |||||||||||||||||||||||||||||
Interest income (expense), net | ( | ( | |||||||||||||||||||||||||||
| Other income (expense), net | ( | ( | |||||||||||||||||||||||||||
| Total other income (expense) | ( | ( | ( | ||||||||||||||||||||||||||
Income (loss) before income taxes | ( | ( | |||||||||||||||||||||||||||
| Income tax expense | |||||||||||||||||||||||||||||
Net income (loss) | $ | $ | $ | $ | ( | $ | ( | ||||||||||||||||||||||
Capital expenditures | $ | $ | $ | $ | $ | ||||||||||||||||||||||||
| At December 31, 2022 | |||||||||||||||||||||||||||||
| Total assets | $ | $ | $ | $ | $ | ||||||||||||||||||||||||
__________
(1) During the year ended December 31, 2022, the IAS Operating Group recorded intercompany commissions and fees of $1.7 million; the UCTS Operating Group recorded intercompany commissions and fees of $39.2 million; and the MIS Operating Group recorded intercompany commissions and fees of $1.9 million. Intercompany commissions and fees and intercompany commission expense are eliminated through Corporate and Other.
109
| For the Year Ended December 31, 2021 | |||||||||||||||||||||||||||||
| (in thousands) | Insurance Advisory Solutions | Underwriting, Capacity & Technology Solutions | Mainstreet Insurance Solutions | Corporate and Other | Total | ||||||||||||||||||||||||
Revenues: | |||||||||||||||||||||||||||||
Commissions and fees(1) | $ | $ | $ | $ | ( | $ | |||||||||||||||||||||||
| Total revenues | ( | ||||||||||||||||||||||||||||
Operating expenses: | |||||||||||||||||||||||||||||
Commissions, employee compensation and benefits(1) | |||||||||||||||||||||||||||||
Other operating expenses | |||||||||||||||||||||||||||||
| Amortization expense | |||||||||||||||||||||||||||||
Change in fair value of contingent consideration | |||||||||||||||||||||||||||||
| Depreciation expense | |||||||||||||||||||||||||||||
| Total operating expenses | |||||||||||||||||||||||||||||
Operating income (loss) | ( | ( | |||||||||||||||||||||||||||
Other income (expense): | |||||||||||||||||||||||||||||
Interest income (expense), net | ( | ( | ( | ( | |||||||||||||||||||||||||
| Other income (expense), net | ( | ( | ( | ||||||||||||||||||||||||||
| Total other income (expense) | ( | ( | ( | ( | |||||||||||||||||||||||||
| Income (loss) before taxes | ( | ( | |||||||||||||||||||||||||||
| Income tax expense | |||||||||||||||||||||||||||||
Net income (loss) | $ | $ | $ | $ | ( | $ | ( | ||||||||||||||||||||||
Capital expenditures | $ | $ | $ | $ | $ | ||||||||||||||||||||||||
__________
(1) During the year ended December 31, 2021, the IAS Operating Group recorded intercompany commissions and fees of $1.5 million; the UCTS Operating Group recorded intercompany commissions and fees of $0.2 million; and the MIS Operating Group recorded intercompany commissions and fees of $1.1 million. Intercompany commissions and fees and intercompany commission expense are eliminated through Corporate and Other.
22. Subsequent Events
On January 26, 2024, the Company signed a definitive agreement for the sale of its specialty wholesale broker business for proceeds of approximately $58.9 million. The transaction is expected to close on March 1, 2024, subject to customary closing conditions. The Company has not yet completed a determination of the gain or loss to be recognized from this transaction. Refer to Note 3 for additional information on the specialty wholesale broker business, the assets and liabilities of which were classified as held for sale as of December 31, 2023.
On January 30, 2024, the Company accelerated settlement of Brush Creek Partners' contingent earnout and entered into notes payable agreements with each of Brush Creek Partners' stockholders for a combined principal amount of $8.2 million. The related party notes are payable as follows: (i) $2.05 million is payable within 30 days of the date of the agreement, and (ii) $6.15 million is payable on February 28, 2025.
On January 1, 2024, the Company's FounderShield Partner moved from the UCTS Operating Group to the IAS Operating Group. As of December 31, 2023, this realignment has not yet been reflected within the Company's financial statements. Quarterly reports on Form 10-Q for the 2024 periods will include a revision of the UCTS and IAS Operating Groups and corresponding information for prior periods will be retrospectively revised to reflect this change.
110
ITEM 9. CHANGES IN AND DISAGREEMENTS WITH ACCOUNTANTS ON ACCOUNTING AND FINANCIAL DISCLOSURE
None.
ITEM 9A. CONTROLS AND PROCEDURES
Evaluation of Disclosure Controls and Procedures
Under the supervision and with the participation of management, including our Chief Executive Officer and Chief Financial Officer, we conducted an evaluation of the effectiveness of our disclosure controls and procedures as defined in Rules 13a-15(e) and 15d-15(e) under the Exchange Act as of the end of the period covered by this Annual Report on Form 10-K. The term “disclosure controls and procedures,” as defined in Rules 13a-15(e) and 15d-15(e) under the Exchange Act, means controls and other procedures of a company that are designed to ensure that information required to be disclosed by a company in the reports that it files or submits under the Exchange Act is recorded, processed, summarized and reported, within the time periods specified in the SEC’s rules and forms. Disclosure controls and procedures include, without limitation, controls and procedures designed to ensure that information required to be disclosed by a company in the reports that it files or submits under the Exchange Act is accumulated and communicated to the company’s management, including its principal executive officer and principal financial officer, as appropriate to allow timely decisions regarding required disclosure. Management recognizes that any controls and procedures, no matter how well designed and operated, can provide only reasonable assurance of achieving their objectives and management necessarily applies its judgment in evaluating the cost-benefit relationship of possible controls and procedures. Based on this evaluation, our Chief Executive Officer and Chief Financial Officer have concluded that our disclosure controls and procedures were effective at a reasonable assurance level as of December 31, 2023.
Management's Annual Report on Internal Control Over Financial Reporting
Management is responsible for establishing and maintaining adequate internal control over financial reporting as defined in Rules 13a-15(f) and 15d-15(f) under the Exchange Act.
Internal control over financial reporting is a process designed by, or under the supervision of, our principal executive officer and principal financial officer, to provide reasonable assurance regarding the reliability of financial reporting and the preparation of our consolidated financial statements for external purposes in accordance with generally accepted accounting principles. Management’s internal control over financial reporting includes those policies and procedures that (i) pertain to the maintenance of records that, in reasonable detail, accurately and fairly reflect the transactions and dispositions of our assets, (ii) provide reasonable assurance that transactions are recorded as necessary to permit preparation of financial statements in accordance with generally accepted accounting principles and that our receipts and expenditures are being made only in accordance with authorizations of management, acting under authority delegated to them by our board of directors, and (iii) provide reasonable assurance regarding prevention or timely detection of unauthorized acquisition, use or disposition of our assets that could have a material effect on our financial statements.
Management, including our Chief Executive Officer and our Chief Financial Officer, assessed the effectiveness of our internal control over financial reporting as of December 31, 2023. In making this assessment, management used the criteria established in Internal Control—Integrated Framework (2013) set forth by the Committee of Sponsoring Organizations of the Treadway Commission (“COSO”). Based on this assessment, management has concluded that our internal control over financial reporting was effective as of December 31, 2023 to provide reasonable assurance regarding the reliability of financial reporting and preparation of the consolidated financial statements in accordance with generally accepted accounting principles. The effectiveness of our internal control over financial reporting as of December 31, 2023 has been audited by PricewaterhouseCoopers LLP, an independent registered public accounting firm, as stated in their report, which is included in the Report of Independent Registered Public Accounting Firm section under Item 8. Financial Statements and Supplementary Data of this Annual Report on Form 10-K.
Changes in Internal Control over Financial Reporting
There were no changes in our internal control over financial reporting that occurred during the quarter ended December 31, 2023, which were identified in connection with management’s evaluation required by paragraph (d) of Rules 13a-15 and 15d-15 under the Exchange Act, that materially affected, or that are reasonably likely to materially affect, our internal control over financial reporting.
111
ITEM 9B. OTHER INFORMATION
On February 27, 2024, the Compensation Committee of the Company’s board of directors approved a one-time $750,000 promotion bonus payment to Mr. Daniel Galbraith, President, BRP and CEO, Retail Brokerage Operations. If, before February 27, 2025, Mr. Galbraith’s employment is terminated (i) by the Company for Cause or (ii) by Mr. Galbraith without Good Reason, Mr. Galbraith will be required to repay a portion of the promotion bonus payment, pro-rated based on the proportionate number of days served in his role prior to the termination of his employment with the Company in relation to the one-year period ending on February 27, 2025. The terms “Cause” and “Good Reason” are defined by reference in the Summary of Mr. Galbraith's One-Time Promotion Bonus Payment, which is filed as Exhibit 10.3 to this Annual Report on 10-K.
ITEM 9C. DISCLOSURE REGARDING FOREIGN JURISDICTIONS THAT PREVENT INSPECTIONS
None.
112
PART III
ITEM 10. DIRECTORS, EXECUTIVE OFFICERS AND CORPORATE GOVERNANCE
The information required by this item is incorporated herein by reference to the definitive Proxy Statement to be filed with the SEC pursuant to Regulation 14A within 120 days after the end of the fiscal year covered by this Annual Report on Form 10-K.
We have adopted a Code of Business Conduct and Ethics that applies to all employees, including executive officers, and to directors. The Code of Business Conduct and Ethics is available on the Governance Overview page of our investor relations website at ir.baldwinriskpartners.com. Any approved amendments to, or waiver of, any provision of the Code of Business Conduct and Ethics will be posted on our investor relations website at the aforementioned address.
ITEM 11. EXECUTIVE COMPENSATION
The information required by this item is incorporated herein by reference to the definitive Proxy Statement to be filed with the SEC pursuant to Regulation 14A within 120 days after the end of the fiscal year covered by this Annual Report on Form 10-K.
ITEM 12. SECURITY OWNERSHIP OF CERTAIN BENEFICIAL OWNERS AND MANAGEMENT AND RELATED STOCKHOLDER MATTERS
The information required by this item is incorporated herein by reference to the definitive Proxy Statement to be filed with the SEC pursuant to Regulation 14A within 120 days after the end of the fiscal year covered by this Annual Report on Form 10-K.
ITEM 13. CERTAIN RELATIONSHIPS AND RELATED TRANSACTIONS, AND DIRECTOR INDEPENDENCE
The information required by this item is incorporated herein by reference to the definitive Proxy Statement to be filed with the SEC pursuant to Regulation 14A within 120 days after the end of the fiscal year covered by this Annual Report on Form 10-K.
ITEM 14. PRINCIPAL ACCOUNTANT FEES AND SERVICES
The information required by this item is incorporated herein by reference to the definitive Proxy Statement to be filed with the SEC pursuant to Regulation 14A within 120 days after the end of the fiscal year covered by this Annual Report on Form 10-K.
113
PART IV
ITEM 15. EXHIBITS AND FINANCIAL STATEMENT SCHEDULES
The following documents are filed as part of this Annual Report on Form 10-K.
(1) Consolidated financial statements: Refer to Item 8. Financial Statements and Supplementary Data elsewhere in this Annual Report on Form 10-K.
(2) Consolidated financial statement schedules. All schedules are omitted for the reason that the information is included in the consolidated financial statements or the notes thereto or that they are not required or are not applicable.
(3) Exhibits: The exhibits listed in the accompanying index are filed, furnished or incorporated by reference as part of this Annual Report on Form 10-K.
| Exhibit No. | Description of Exhibit | |||||||
| 3.1 | ||||||||
| 3.2 | ||||||||
| 3.3 | ||||||||
| 3.4 | ||||||||
| 4.1* | ||||||||
10.1† | ||||||||
10.2† | ||||||||
10.3†* | ||||||||
10.4† | ||||||||
10.5† | ||||||||
10.6† | ||||||||
10.7† | ||||||||
10.8† | ||||||||
10.9†* | ||||||||
114
| Exhibit No. | Description of Exhibit | |||||||
10.10† | ||||||||
10.11†* | ||||||||
10.12† | ||||||||
10.13† | ||||||||
10.14† | ||||||||
10.15† | ||||||||
10.16† | ||||||||
| 10.17 | ||||||||
| 10.18 | First Amendment to the Third Amended and Restated Limited Liability Company Agreement of Baldwin Risk Partners, LLC, dated as of November 3, 2020, by and among Baldwin Risk Partners, LLC and its members (incorporated herein by reference to Exhibit 10.15 of the registrant's Annual Report on Form 10-K filed with the Securities and Exchange Commission on February 28, 2023). | |||||||
10.19† | ||||||||
| 10.20 | ||||||||
| 10.21 | ||||||||
| 10.22 | ||||||||
| 10.23 | ||||||||
| 10.24 | ||||||||
| 10.25 | ||||||||
| 10.26 | ||||||||
115
| Exhibit No. | Description of Exhibit | |||||||
| 10.27 | ||||||||
| 10.28 | ||||||||
| 10.29 | ||||||||
| 10.30 | ||||||||
| 10.31 | Amendment No. 7 to Credit Agreement, dated as of September 15, 2023, by and among Baldwin Risk Partners, LLC, a Delaware limited liability company, JPMorgan Chase Bank, N.A., as the Administrative Agent, the Guarantors party thereto, the Lenders party thereto and the Issuing Lenders party thereto (incorporated herein by reference to Exhibit 10.1 to the registrant's Current Report on Form 8-K filed with the Securities and Exchange Commission on September 19, 2023). | |||||||
| 21* | ||||||||
| 23.1* | ||||||||
| 31.1* | ||||||||
| 31.2* | ||||||||
| 32** | ||||||||
| 97* | ||||||||
| 101.INS* | Inline XBRL Instance Document - the Instance document does not appear in the Interactive Data file because XBRL tags are embedded within the Inline XBRL document | |||||||
| 101.SCH* | Inline XBRL Taxonomy Extension Schema Document | |||||||
| 101.CAL* | Inline XBRL Taxonomy Extension Calculation Linkbase Document | |||||||
| 101.DEF* | Inline XBRL Taxonomy Extension Definition Linkbase Document | |||||||
| 101.LAB* | Inline XBRL Taxonomy Extension Label Linkbase Document | |||||||
| 101.PRE* | Inline XBRL Taxonomy Extension Presentation Linkbase Document | |||||||
| 104 | Cover Page Interactive Data File (formatted as inline XBRL and contained in Exhibit 101) | |||||||
__________
* Filed herewith
** Furnished herewith and as such are deemed not “filed” for purposes of Section 18 of the Exchange Act, nor shall they be deemed incorporated by reference in any filing under the Securities Act, except as shall be expressly set forth by specific reference in such filing.
† Management contract or compensatory plan or arrangement.
ITEM 16. FORM 10-K SUMMARY
None.
116
SIGNATURES
Pursuant to the requirements of Section 13 or 15(d) of the Securities Exchange Act of 1934, the registrant has duly caused this report to be signed on its behalf by the undersigned, thereunto duly authorized.
| BRP GROUP, INC. | ||||||||
| Date: February 28, 2024 | By: | /s/ Trevor L. Baldwin | ||||||
| Trevor L. Baldwin | ||||||||
Chief Executive Officer | ||||||||
117
Pursuant to requirements of the Securities Exchange Act of 1934, this report has been signed below by the following persons on behalf of the registrant and in the capacities and on the dates indicated.
| Signature | Title | Date | ||||||||||||
| /s/ Lowry Baldwin | Chairman of the Board of Directors | February 28, 2024 | ||||||||||||
| Lowry Baldwin | ||||||||||||||
| /s/ Trevor L. Baldwin | Chief Executive Officer and Director | February 28, 2024 | ||||||||||||
| Trevor L. Baldwin | (Principal Executive Officer) | |||||||||||||
| /s/ Bradford L. Hale | Chief Financial Officer | February 28, 2024 | ||||||||||||
| Bradford L. Hale | (Principal Financial Officer) | |||||||||||||
| /s/ Corbyn Lichon | Chief Accounting Officer | February 28, 2024 | ||||||||||||
| Corbyn Lichon | (Principal Accounting Officer) | |||||||||||||
| /s/ Jay Cohen | Director | February 28, 2024 | ||||||||||||
| Jay Cohen | ||||||||||||||
| /s/ Joseph J. Kadow | Director | February 28, 2024 | ||||||||||||
| Joseph J. Kadow | ||||||||||||||
| /s/ Barbara Matas | Director | February 28, 2024 | ||||||||||||
| Barbara Matas | ||||||||||||||
| /s/ Sathish Muthukrishnan | Director | February 28, 2024 | ||||||||||||
| Sathish Muthukrishnan | ||||||||||||||
| /s/ Sunita Parasuraman | Director | February 28, 2024 | ||||||||||||
| Sunita Parasuraman | ||||||||||||||
| /s/ Ellyn Shook | Director | February 28, 2024 | ||||||||||||
| Ellyn Shook | ||||||||||||||
| /s/ Chris Sullivan | Director | February 28, 2024 | ||||||||||||
| Chris Sullivan | ||||||||||||||
| /s/ Myron Williams | Director | February 28, 2024 | ||||||||||||
| Myron Williams | ||||||||||||||
118