UNITED STATES
SECURITIES AND EXCHANGE COMMISSION
WASHINGTON, D.C. 20549
__________________________________________________________________________________________________________________________________________
FORM 10-K
__________________________________________________________________________________________________________________________________________
ANNUAL REPORT PURSUANT TO SECTION 13 OR 15(d) OF THE SECURITIES EXCHANGE ACT OF 1934 FOR THE FISCAL YEAR ENDED DECEMBER 31, 2023 | |||||
| TRANSITION REPORT PURSUANT TO SECTION 13 OR 15(d) OF THE SECURITIES EXCHANGE ACT OF 1934 FOR THE TRANSITION PERIOD FROM ______________ TO ______________ | |||||
Commission File Number: 000-55931
__________________________________________________________________________________________________________________________________________

(Exact name of registrant as specified in its charter)
__________________________________________________________________________________________________________________________________________
| (State or other jurisdiction of incorporation or organization) | (I.R.S. Employer Identification No.) | ||||
(Address of principal executive offices) (Zip Code)
(212 ) 583-5000
(Registrant’s telephone number, including area code)
__________________________________________________________________________________________________________________________________________
Securities registered pursuant to Section 12(b) of the Act: None
| Title of each class | Trading Symbol(s) | Name of each exchange on which registered | ||||||||||||
Securities registered pursuant to Section 12(g) of the Act: Title of Each Class | ||||||||||||||
Indicate by check mark if the registrant is a well-known seasoned issuer, as defined in Rule 405 of the Securities Act. Yes ☐ No ☒
Indicate by check mark if the registrant is not required to file reports pursuant to Section 13 or Section 15(d) of the Act. Yes ☐ No ☒
Indicate by check mark whether the registrant (1) has filed all reports required to be filed by Section 13 or 15(d) of the Securities Exchange Act of 1934 during the preceding 12 months (or for such shorter period that the registrant was required to file such reports), and (2) has been subject to such filing requirements for the past 90 days. Yes ☒ No ☐
Indicate by check mark whether the registrant has submitted electronically every Interactive Data File required to be submitted pursuant to Rule 405 of Regulation S-T (§232.405 of this chapter) during the preceding 12 months (or for such shorter period that the registrant was required to submit such files). Yes ☒ No ☐
Indicate by check mark whether the registrant is a large accelerated filer, an accelerated filer, a non-accelerated filer, smaller reporting company, or an emerging growth company.
See the definitions of “large accelerated filer,” “accelerated filer,” “smaller reporting company,” and “emerging growth company” in Rule 12b-2 of the Exchange Act.
| Large accelerated filer | ☐ | Accelerated filer | ☐ | |||||||||||
| ☒ | Smaller reporting company | |||||||||||||
| Emerging growth company | ||||||||||||||
If an emerging growth company, indicate by check mark if the registrant has elected not to use the extended transition period for complying with any new or revised financial accounting standards provided pursuant to Section 13(a) of the Exchange Act. Yes ☐ No ☐
Indicate by check mark whether the registrant has filed a report on and attestation to its management’s assessment of the effectiveness of its internal control over financial reporting under Section 404(b) of the Sarbanes-Oxley Act (15 U.S.C. 7262(b)) by the registered public accounting firm that prepared or issued its audit report. ☐
If securities are registered pursuant to Section 12(b) of the Act, indicate by check mark whether the financial statements of the registrant included in the filing reflect the correction of an error to previously issued financial statements. ☐
Indicate by check mark whether any of those error corrections are restatements that required a recovery analysis of incentive‐based compensation received by any of the registrant’s executive officers during the relevant recovery period pursuant to §240.10D‐1(b). ☐
Indicate by check mark whether the Registrant is a shell company (as defined in Rule 12b-2 of the Exchange Act. Yes ☐ No ☒
The aggregate market value of the common stock held by non-affiliates of the registrant: There is currently no established public market for the Registrant’s shares of common stock.
As of March 28, 2024, the registrant had the following shares outstanding (in thousands): 1,453,326 shares of Class S common stock, 2,351,344 shares of Class I common stock, 55,531 shares of Class T common stock, 152,815 shares of Class D, 2,246 shares of Class C common stock, and 0 shares of Class F common stock.
DOCUMENTS INCORPORATED BY REFERENCE
Part III of this Annual Report on Form 10-K incorporates information by reference from the registrant’s definitive proxy statement with respect to its 2023 annual meeting of stockholders to be filed with the Securities and Exchange Commission within 120 days after the close of the registrant’s fiscal year.
Table of Contents
| Page | ||||||||
ITEM 1C. | ||||||||
ITEM 2. | ||||||||
ITEM 7. | ||||||||
ITEM 9. | ||||||||
ITEM 11. | ||||||||
ITEM 15. | ||||||||
ITEM 16. | ||||||||
F-1 | ||||||||
2
CAUTIONARY NOTE REGARDING FORWARD-LOOKING STATEMENTS; RISK FACTOR SUMMARY
This Annual Report on Form 10-K contains forward-looking statements within the meaning of the federal securities laws and the Private Securities Litigation Reform Act of 1995. These forward-looking statements can be identified by the use of forward-looking terminology such as “may,” “will,” “expect,” “intend,” “anticipate,” “estimate,” “believe,” “continue,” “identify” or other similar words or the negatives thereof. These may include our financial estimates and their underlying assumptions, statements about plans, objectives, intentions and expectations with respect to positioning, including the impact of macroeconomic trends and market forces, future operations, repurchases, acquisitions, future performance, and statements identified but not yet disclosed acquisitions. Such forward-looking statements are subject to various risks and uncertainties. Accordingly, there are or will be important factors that could cause actual outcomes or results to differ materially from those indicated in such statements. We believe these factors include but are not limited to those described under the section entitled “Risk Factors” in this report, as such factors may be updated from time to time in our periodic filings with the United States Securities and Exchange Commission (“SEC”), which are accessible on the SEC’s website at www.sec.gov. These factors should not be construed as exhaustive and should be read in conjunction with the other cautionary statements that are included in this document (or our prospectus and other filings). Except as otherwise required by federal securities laws, we undertake no obligation to publicly update or revise any forward-looking statements, whether as a result of new information, future developments or otherwise.
The following is a summary of principal risk factors that may materially adversely affect our business, financial condition, results of operations and cash flows. The following should be read in conjunction with the more complete discussion of the risk factors we face, which are set forth more fully in “Part I. Item 1A. Risk Factors”.
•Since there is no public trading market for shares of our common stock, repurchase of shares by us is generally the only way to dispose of your shares. Our share repurchase plan, which is approved and administered by our board of directors, provides our stockholders with the opportunity to request that we repurchase their shares on a monthly basis, but we are not obligated to repurchase any shares, and our board of directors may determine to (and will, depending on the facts and circumstances) repurchase only some, or even none, of the shares that have been requested to be repurchased in any particular month in their discretion. In addition, repurchases will be subject to available liquidity and other significant restrictions, including repurchase limitations that have in the past been, and may in the future be, exceeded, resulting in our repurchase of shares on a pro rata basis. Further, our board of directors has in the past made exceptions to the limitations in our share repurchase plan and may in the future, in certain circumstances, make exceptions to such repurchase limitations (or repurchase fewer shares than such repurchase limitations), or modify or suspend our share repurchase plan if, in its reasonable judgment, it deems such action to be in our best interest and the best interest of our stockholders, such as when repurchase requests would place an undue burden on our liquidity, adversely affect our operations or impose an adverse impact on us that would outweigh the benefit of repurchasing shares submitted for repurchase. Our board of directors cannot terminate our share repurchase plan absent a liquidity event which results in our stockholders receiving cash or securities listed on a national securities exchange or where otherwise required by law. As a result, our shares should be considered as having only limited liquidity and at times may be illiquid.
•Distributions are not guaranteed and may be funded from sources other than cash flow from operations, including, without limitation, borrowings, the sale of our assets, and repayments of our real estate debt investments. We have no limits on the amounts we may fund from such sources.
•The purchase and repurchase price for shares of our common stock are generally based on our prior month’s net asset value (“NAV”) and are not based on any public trading market. While there will be annual appraisals of our properties performed by independent third-party appraisal firms, the valuation of properties is inherently subjective and our NAV may not accurately reflect the actual price at which our properties could be liquidated on any given day.
•We are dependent on BX REIT Advisors L.L.C (the “Adviser”) to conduct our operations, as well as the persons and firms the Adviser retains to provide services on our behalf. The Adviser will face conflicts of interest as a result of, among other things, the allocation of investment opportunities among us and Other Blackstone Accounts, the allocation of time of its investment professionals and the substantial fees that we will pay to the Adviser.
•Principal and interest payments on any of our outstanding borrowings will reduce the amount of funds available for distribution or investment in additional real estate assets.
•There are limits on the ownership and transferability of our shares. See “Description of Capital Stock—Restrictions on Ownership and Transfer” in the prospectus for our public offering of shares of our common stock (the “Offering”) (as amended and/or supplemented from time to time, the “Prospectus”).
•We do not own the Blackstone name, but we are permitted to use it as part of our corporate name pursuant to a trademark license agreement with an affiliate of Blackstone. Use of the name by other parties or the termination of our trademark license agreement may harm our business.
3
•We intend to continue to qualify as a real estate investment trust (“REIT”) for U.S. federal income tax purposes. However, if we fail to qualify as a REIT and no relief provisions apply, our NAV and cash available for distribution to our stockholders could materially decrease.
•The acquisition of investment properties may be financed in substantial part by borrowing, which increases our exposure to loss. The use of leverage involves a high degree of financial risk and will increase the exposure of the investments to adverse economic factors such as rising interest rates, downturns in the economy or deteriorations in the condition of our investments.
•Investing in commercial real estate assets involves certain risks, including but not limited to: tenants’ inability to pay rent; increases in interest rates and lack of availability of financing; tenant turnover and vacancies; and changes in supply of or demand for similar properties in a given market.
•Recent concerns about the real estate market, increases in interest rates, rising inflation, energy costs and geopolitical issues have contributed to increased volatility and diminished expectations for the economy and market going forward. Our operating results will be affected by global and national economic and market conditions generally and by the local economic conditions where our properties are located, including changes with respect to rising vacancy rates or decreasing market rental rates; inability to lease space on favorable terms; bankruptcies, financial difficulties or lease defaults by our tenants, particularly for our tenants with net leases for large properties; rising inflation, changes in interest rates and supply chain disruptions; market volatility and changes in government rules, regulations and fiscal policies, such as property taxes, zoning laws, limitations on rental rates, and compliance costs with respect to environmental laws.
•Our portfolio is currently concentrated in certain industries and geographies, and, as a consequence, our aggregate return may be substantially affected by adverse economic or business conditions affecting that particular type of asset or geography.
•Competition for investment opportunities may reduce our profitability and the return on your investment.
Although we believe that the expectations reflected in the forward-looking statements are reasonable, we cannot guarantee future results, levels of activity, performance, or achievements. We caution you not to place undue reliance on these forward-looking statements. All written and oral forward-looking statements attributable to us or persons acting on our behalf are qualified in their entirety by these cautionary statements. Moreover, unless we are required by law to update these statements, we will not necessarily update or revise any forward-looking statements included or incorporated by reference in this Annual Report on Form 10-K after the date hereof, either to conform them to actual results or to changes in our expectations. We urge you to carefully consider the foregoing summary together with the risks discussed in Part I., Item 1A. “Risk Factors” and Part II, Item 7. “Management’s Discussion and Analysis of Financial Condition and Results of Operations.”
Website Disclosure
We use our website (www.breit.com) as a channel of distribution of company information. The information we post through this channel may be deemed material. Accordingly, investors should monitor this channel, in addition to following our press releases and SEC filings. The contents of our website are not, however, a part of this Annual Report on Form 10-K.
4
PART I.
ITEM 1. BUSINESS
References herein to “Blackstone Real Estate Income Trust,” the “Company,” “BREIT,” “we,” “us,” or “our” refer to Blackstone Real Estate Income Trust, Inc., a Maryland corporation, and its subsidiaries unless the context specifically requires otherwise.
General Description of Business and Operations
BREIT invests primarily in stabilized, income-generating commercial real estate across asset classes in the United States and, to a lesser extent, outside the United States. We also invest to a lesser extent in real estate debt investments. Our objective is to bring Blackstone’s leading institutional quality real estate investment platform to income focused investors. We are externally managed by the Adviser, a subsidiary of Blackstone Inc. (“Blackstone”). We were incorporated in Maryland on November 16, 2015. We are the sole general partner of BREIT Operating Partnership L.P. (“BREIT OP”), a Delaware limited partnership, and we own substantially all of our assets through BREIT OP. We currently operate our business in nine reportable segments: Rental Housing, Industrial, Net Lease, Data Centers, Hospitality, Self Storage, Retail, and Office properties, and Investments in Real Estate Debt. Rental Housing includes multifamily and other types of rental housing such as manufactured, student, affordable, and single family rental housing, as well as senior living. Net Lease includes the real estate assets of The Bellagio Las Vegas (the “Bellagio”) and The Cosmopolitan of Las Vegas (the “Cosmopolitan”).
BREIT is a non-listed, perpetual life real estate investment trust (“REIT”). We qualified as a REIT under the Internal Revenue Code of 1986, as amended (the “Code”) for U.S. federal income tax purposes and generally will not be subject to U.S. federal income taxes on our taxable income to the extent we annually distribute all of our net taxable income to stockholders and maintain our qualification as a REIT.
As of March 28, 2024, we had received cumulative net proceeds of $75.0 billion from the sale of shares of our Class S, Class I, Class T, Class D and Class C common stock in our continuous public offering and private offerings, and units of BREIT OP. We have contributed the net proceeds from the sale of shares to BREIT OP in exchange for a corresponding number of Class S, Class I, Class T, Class D and Class C units. BREIT OP has primarily used the net proceeds to make investments in real estate and real estate debt and for other general corporate purposes (including to fund repurchase requests under our share repurchase plan from time to time) as further described below under “Investment Portfolio.” We intend to continue selling shares of our common stock on a monthly basis through our continuous public offering and private offerings.
Our Adviser
We are externally managed by our Adviser, and pursuant to the advisory agreement between us and the Adviser (the “Advisory Agreement”), we have delegated to the Adviser the authority to source, evaluate and monitor our investment opportunities and to make decisions related to the acquisition, management, financing and disposition of our assets, in accordance with our investment objectives, guidelines, policies and limitations, as well as provide us with our executive management team. Our board of directors will at all times have oversight and policy-making authority over us, including responsibility for governance, financial controls, compliance and disclosure.
Our Adviser is a part of Blackstone’s alternative asset management business, which is the world’s largest alternative asset manager. Blackstone's assets under management include investment vehicles focused on private equity, real estate, public debt and equity, infrastructure, life sciences, growth equity, opportunistic, non-investment grade credit, real assets and secondary funds, all on a global basis. Through its different businesses, Blackstone had total assets under management of $1.0 trillion as of December 31, 2023.
In connection with the performance of its duties, our Adviser benefits from the resources, relationships, and expertise of the 782 professionals in Blackstone’s global real estate group. Blackstone has built the world’s preeminent global real estate business with $336.9 billion of investor capital under management as of December 31, 2023. Blackstone’s real estate group (“Blackstone Real Estate”) provides the benefit of proven experience navigating market cycles, a vast portfolio that provides real time data insights, a disciplined investment approach with centralized decision making and deep industry expertise and relationships.
Our chief executive officer, chief financial officer, and other executive officers are senior Blackstone Real Estate professionals. Our Adviser, our executive officers, and other personnel supplied to us by our Adviser are each not obligated to dedicate any specific amount of time to our business. Our Adviser is subject to the supervision and oversight of our board of directors and has only such functions and authority as our board of directors delegates to it. Pursuant to the Advisory Agreement, our Adviser is entitled to receive a base management fee and expense reimbursements. In addition, BREIT Special Limited Partner L.P. (the “Special Limited Partner”), a wholly-owned subsidiary of Blackstone, is entitled to receive a performance participation allocation. See Note 10 to our consolidated
5
financial statements and Item 13 “Certain Relationships and Related Transactions, and Director Independence” in this Annual Report on Form 10-K for more detail on the terms of the Advisory Agreement.
Investment Objectives
Our investment objectives are to invest in assets that will enable us to:
•provide attractive current income in the form of regular, stable cash distributions;
•preserve and protect invested capital;
•realize appreciation in NAV from proactive investment management and asset management; and
•provide an investment alternative for stockholders seeking to allocate a portion of their long-term investment portfolios to commercial real estate with lower volatility than listed public real estate companies.
Investment Strategy
Our investment strategy is to acquire primarily stabilized, income-generating commercial real estate across asset classes in the United States and, to a lesser extent, outside the United States. We also invest to a lesser extent in real estate debt investments.
Our investment strategy seeks to capitalize on Blackstone’s scale and the real-time information provided by its real estate holdings to identify and acquire investments at attractive pricing. We also seek to benefit from Blackstone’s reputation and ability to transact at scale with speed and certainty, and its long-standing and extensive relationships in the real estate industry.
Our investments in primarily stabilized, income-generating U.S. commercial real estate focus on a range of asset types. These may include rental housing, industrial, net lease, data centers, self storage, hospitality, retail and office assets, as well as other sectors. For a breakdown of our portfolio by asset type see the “Investments in Real Estate” section below.
Our real estate debt investment strategy is focused on generating current income and contributing to our overall net returns. Alongside our credit facilities and operating cash flow, our real estate debt investments may provide an additional source of liquidity. These liquidity sources are collectively used for cash management, satisfying stock repurchases under our share repurchase plan and other purposes. We benefit from the Blackstone Real Estate Debt Strategies team to assist with investing and managing this portion of our portfolio. The Blackstone Real Estate Debt Strategies team leverages the competitive advantages of the broader Blackstone Real Estate platform and its own proprietary investment models to seek attractive real estate debt investment opportunities throughout the capital structure.
Investments in Real Estate
We invest primarily in stabilized, income-generating commercial real estate across assets in the United States and, to a lesser extent, outside the United States. We also invest in equity of public and private real estate-related companies, including real estate-related operating companies. We may also acquire assets that require some amount of capital investment in order to be renovated or repositioned as well as develop properties and make investments in other real assets such as infrastructure.
We do not designate specific geography or sector allocations for the portfolio; rather we invest in regions or asset classes where we see the best opportunities that support our investment objectives.
6
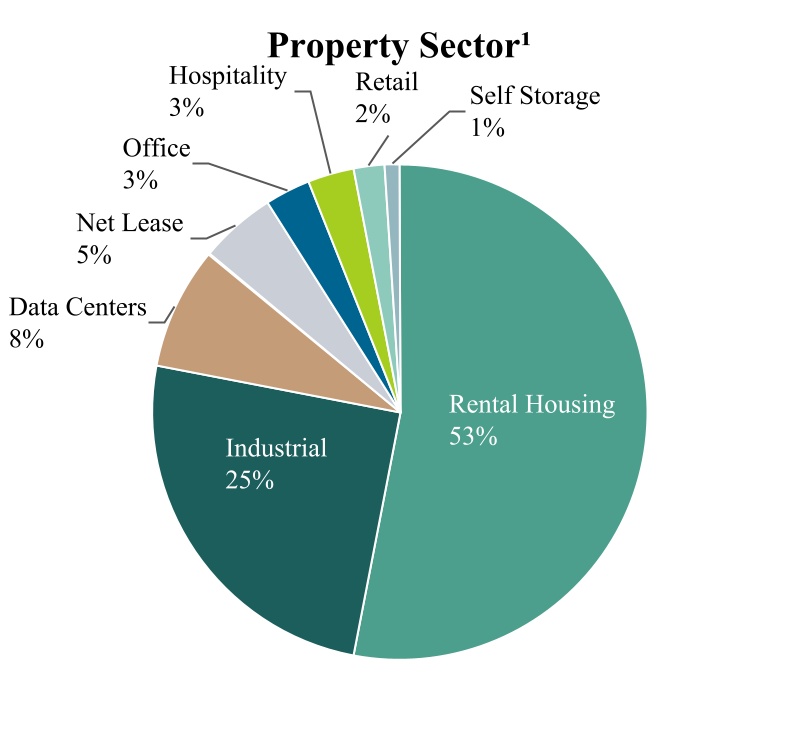
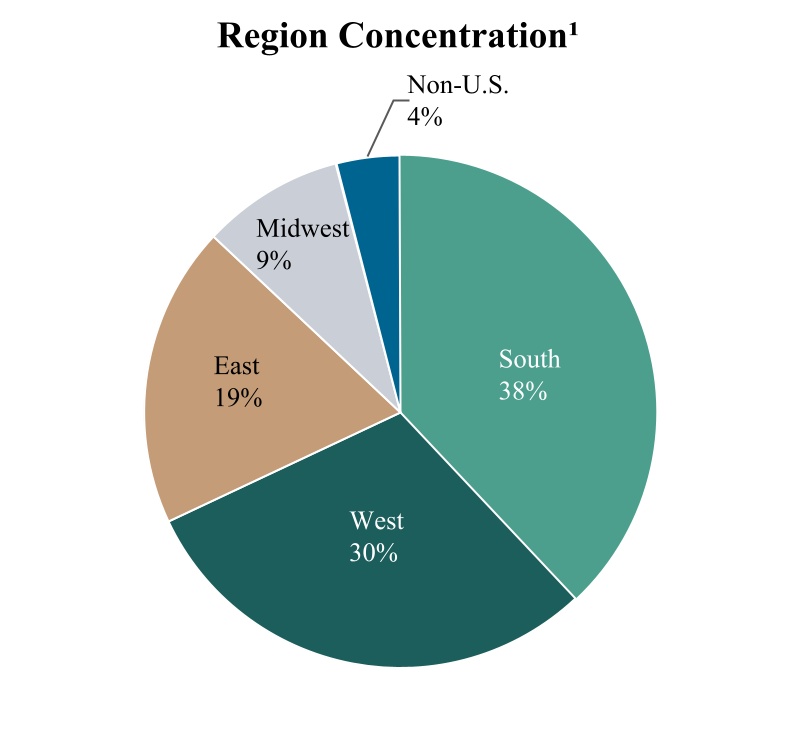
The following charts further describe the diversification of our investments in real estate based on fair value as of December 31, 2023:
___________________________
1“Property Sector” weighting is measured as the asset value of real estate investments for each sector category divided by the asset value of all real estate investments, excluding the value of any third-party interests in such real estate investments. “Region Concentration” represents regions as defined by the National Council of Real Estate Fiduciaries (“NCREIF”) and the weighting is measured as the asset value of our real estate properties for each regional category divided by the asset value of all real estate properties, excluding the value of any third-party interests in such real estate properties. “Non-U.S.” reflects investments in Europe and Canada. “Real estate investments” include wholly-owned property investments, BREIT’s share of property investments held through joint ventures and equity in public and private real estate-related companies.
7
The following map identifies the top markets of our real estate portfolio composition based on fair value as of December 31, 2023:
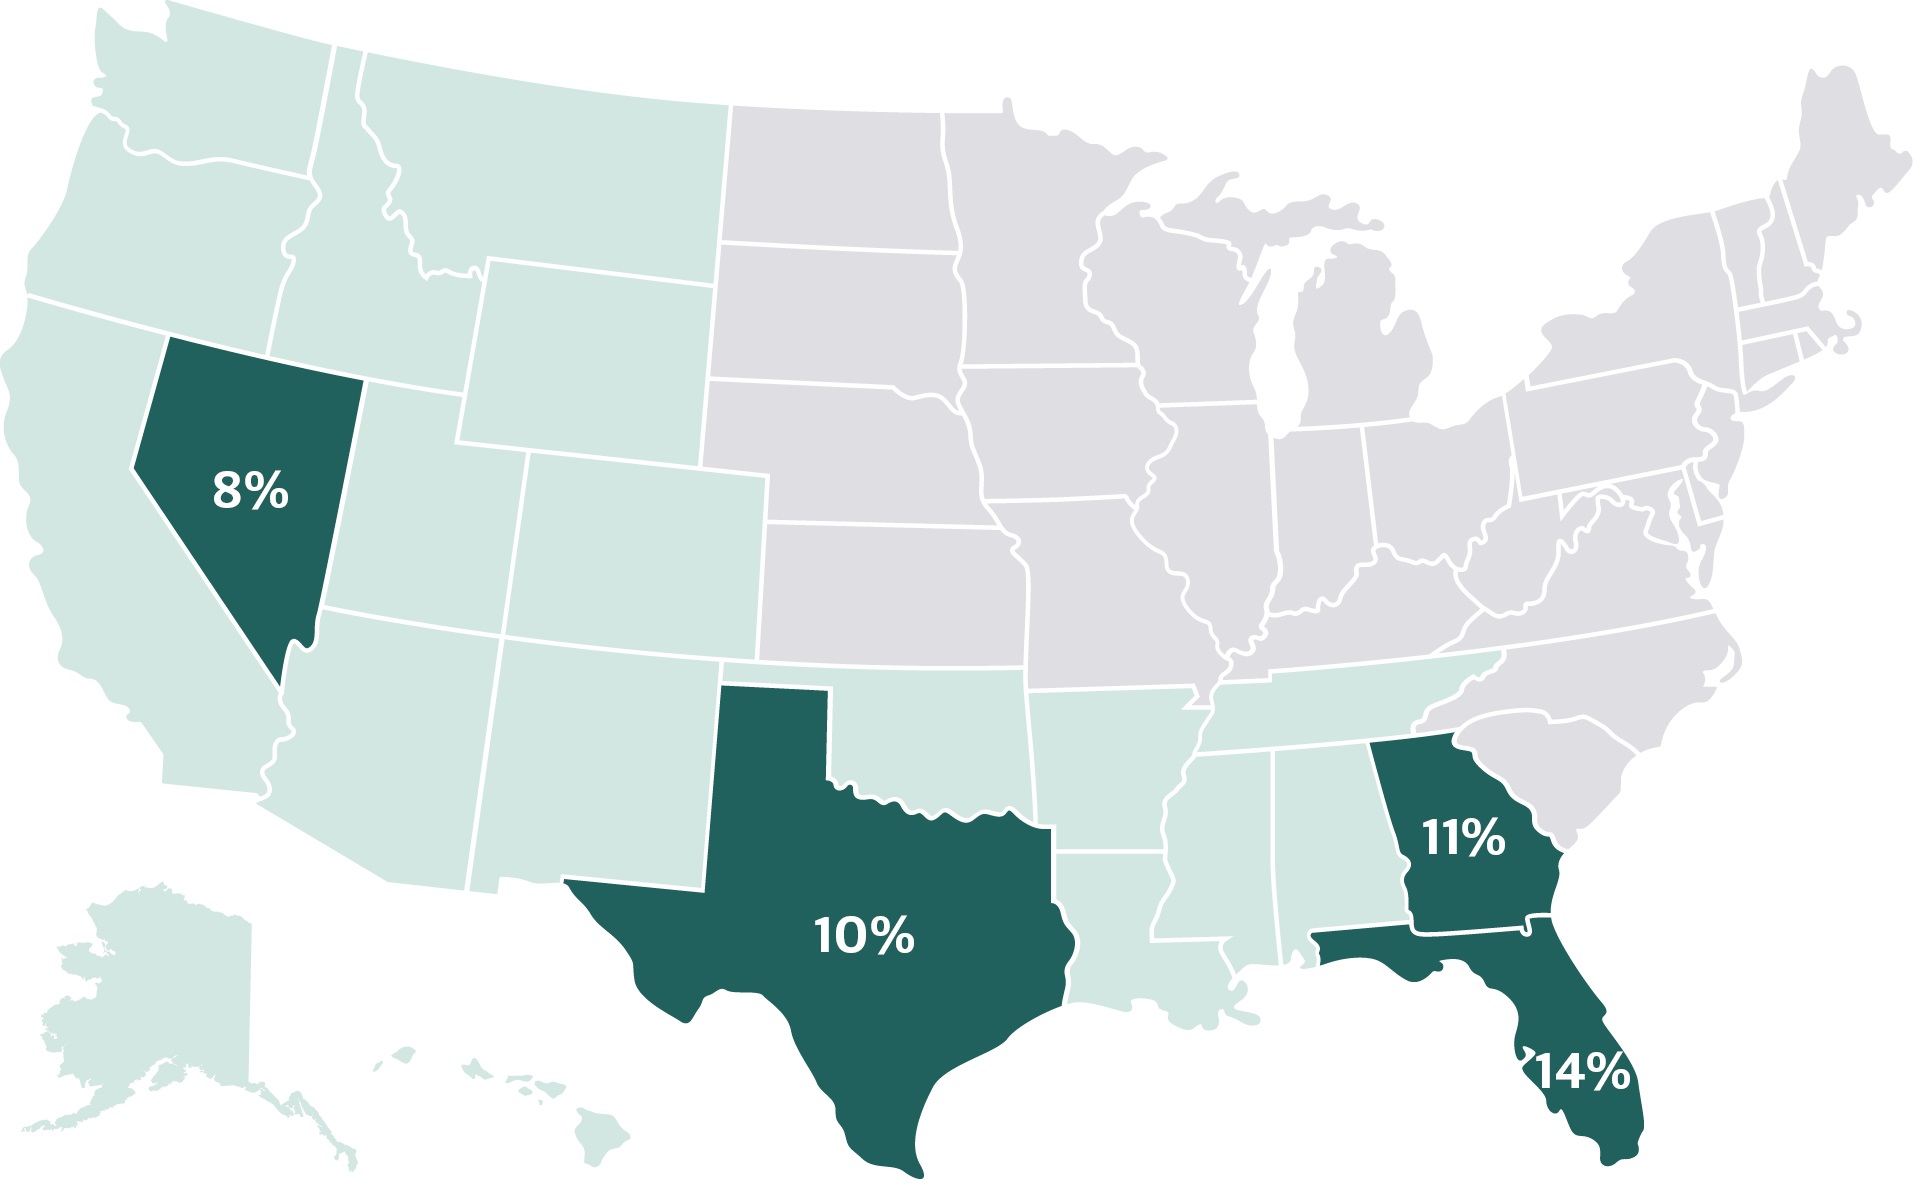
The select states highlighted represent BREIT’s top 4 states by portfolio weighting. Portfolio weighting is measured as the asset value of real estate properties for each state divided by the total asset value of all real estate properties, excluding the value of any third-party interests in such real estate investments. BREIT is invested in additional states that are not highlighted above.
As of December 31, 2023, we owned a diversified portfolio of income producing assets comprising 4,834 properties and 28,324 single family rental homes concentrated in growth markets primarily focused in Rental Housing, Industrial, Data Centers and Net Lease properties, and to a lesser extent Self Storage, Hospitality, Retail, and Office properties.
Investments in Real Estate Debt
Our real estate debt investments focus on non-distressed public and private real estate debt, including, but not limited to, commercial mortgage-backed securities (“CMBS”), residential mortgage-backed securities (“RMBS”) and other residential credit, real estate-related corporate credit, mortgage loans, mezzanine loans, interests in collateralized debt obligation and collateralized loan obligation vehicles and equity interests in public and private entities that invest in real estate debt as one of their core businesses, and may also include related derivative instruments. Our investments in real estate debt are focused in the United States, but also include investments issued or backed by real estate in countries outside the United States.
Borrowing Policies
We use financial leverage to provide additional funds to support our investment activities. This allows us to make more investments than would otherwise be possible, resulting in a broader portfolio, and enhances the return on our equity capital. Subject to the limitation on indebtedness for money borrowed in our charter described below, our target leverage ratio is approximately 60%. Our leverage ratio is measured by dividing (i) consolidated property-level and entity-level debt, net of cash and loan-related restricted cash, by (ii) the asset value of real estate investments (measured using the greater of fair market value and cost) plus the equity in our settled real estate debt investments. Indebtedness incurred (i) in connection with funding a deposit in advance of the closing of an investment or (ii) as other working capital advances, will not be included as part of the calculation above. Our leverage ratio would be higher if the indebtedness on our real estate debt investments and pro rata share of debt within our unconsolidated investments were taken into account.
Our real estate debt portfolio has embedded leverage through the use of reverse repurchase agreements and similar financings, and may also have embedded leverage through the use of derivatives, including, but not limited to, total return swaps, securities lending arrangements and credit default swaps. During times of increased investment and capital markets activity, but subject to the limitation on indebtedness for money borrowed in our charter described below, we may employ greater leverage in order to quickly build a broader portfolio of assets. We may leverage our portfolio by assuming or incurring secured or unsecured property-level or entity-level debt. An example of property-level debt is a mortgage loan secured by an individual property or portfolio of properties incurred or assumed in connection with our acquisition of such property or portfolio of properties. An example of entity-level debt is a line of credit obtained by us or our Operating Partnership. We currently have secured and unsecured credit facilities from third parties and an uncommitted line of credit from an affiliate of Blackstone. We may decide to seek to obtain additional credit facilities under which we would reserve borrowing capacity. Borrowings under current or any future lines of credit may be used to fund acquisitions, repurchase shares, or for any other corporate purpose.
8
Under our charter, we have a limitation that precludes us from borrowing in excess of 300% of the cost of our net assets, which approximates borrowing 75% of the cost of our investments (unless a majority of our independent directors approves any borrowing in excess of the limit and we disclose the justification for doing so to our stockholders), but such restriction does not restrict the amount of indebtedness we may incur with respect to any individual property or portfolio.
For an overview of our borrowings, see Item 7 — “Management’s Discussion and Analysis of Financial Condition and Results of Operations — Liquidity and Capital Resources.”
Taxation of the Company
We elected to be taxed as a REIT under the Code commencing with our taxable year ended December 31, 2017. We generally must distribute annually at least 90% of our taxable net income, subject to certain adjustments and excluding any net capital gain, in order for U.S. federal income tax not to apply to our earnings that we distribute. To the extent that we satisfy this distribution requirement, but distribute less than 100% of our net taxable income, we will be subject to U.S. federal income tax on our undistributed taxable income. In addition, we will be subject to a 4% nondeductible excise tax if the actual amount that we pay out to our stockholders in a calendar year is less than a minimum amount specified under U.S. federal tax laws.
Our qualification as a REIT also depends on our ability to meet various other requirements imposed by the Code, which relate to organizational structure, diversity of stock ownership, and certain restrictions with regard to the nature of our assets and the sources of our income. Even if we qualify as a REIT, we may be subject to certain U.S. federal income and excise taxes and state and local taxes on our income and assets. If we fail to maintain our qualification as a REIT for any taxable year, we may be subject to material penalties as well as federal, state, and local income tax on our taxable income at regular corporate rates and we would not be able to qualify as a REIT for the subsequent four full taxable years.
Furthermore, we have one or more taxable REIT subsidiaries (“TRSs”) that pay federal, state, and local income tax on their net taxable income. See Item 1A—“Risk Factors—Risks Related to our REIT Status and Certain Other Tax Items” for additional tax status information.
Governmental Regulations
As an owner of real estate, our operations are subject, in certain instances, to supervision and regulation by U.S. and other governmental authorities, and may be subject to various laws and judicial and administrative decisions imposing various requirements and restrictions, which include, among other things: (i) federal and state securities laws and regulations; (ii) federal, state and local tax laws and regulations, (iii) state and local laws relating to real property; (iv) federal, state and local environmental laws, ordinances, and regulations, and (v) various laws relating to housing, including permanent and temporary rent control and stabilization laws, the Americans with Disabilities Act of 1990 and the Fair Housing Amendment Act of 1988, among others.
Compliance with the federal, state and local laws described above has not had a material adverse effect on our business, assets, results of operations, financial condition and ability to pay distributions, and we do not believe that our existing portfolio will require us to incur material expenditures to comply with these laws and regulations.
Competition
We face competition from various entities for investment opportunities, including other REITs, pension funds, insurance companies, investment funds and companies, partnerships and developers. In addition to third-party competitors, other programs sponsored by our Adviser and its affiliates, particularly those with investment strategies that overlap with ours, will seek competing investment opportunities under Blackstone’s prevailing policies and procedures.
In the face of this competition, we have access to our Adviser’s and Blackstone’s professionals and their industry expertise and relationships, which we believe provide us with a competitive advantage and help us source, evaluate and compete for potential investments. We believe these relationships will enable us to compete more effectively for attractive investment opportunities. However, we may not be able to achieve our business goals or expectations due to the competitive risks that we face. For additional information concerning these competitive risks, see Item 1A—“Risk Factors—Risks Related to Our Investment Activities.”
9
Environmental, Social and Governance
As an externally managed company, BREIT’s day-to-day operations are managed by our Adviser and our executive officers under the oversight of our Board of Directors. Our executive officers are senior Blackstone Real Estate professionals and our Adviser is a subsidiary of Blackstone and part of Blackstone Real Estate. As such, many of the environmental, social and governance (“ESG”) initiatives undertaken by Blackstone may be relevant to our business and certain of the business decisions made on our behalf by employees of our Adviser to deliver returns for its investors. Blackstone’s ESG efforts are anchored in the goal of generating strong returns for investors in furtherance of its fiduciary duty. Blackstone also has a dedicated Global Real Estate ESG team that works closely with Blackstone Real Estate asset management teams across the globe to build on existing ESG efforts and scale them in the firm's global real estate portfolio. The Global Real Estate ESG team also works with certain of the Real Estate team’s portfolio companies to drive long-term value through sustainability practices, energy efficiency and decarbonization at scale.
Human Capital
We have no employees other than those employed by the management companies that were acquired in connection with the acquisitions of the Home Partners of America Portfolio, April Housing Portfolio, Preferred Apartment Communities Portfolio and the American Campus Communities Portfolio, none of whom are executive officers of the Company or are involved in the management of the Company. Our operations are conducted by our Adviser.
Conflicts of Interest
We are subject to conflicts of interest arising out of our relationship with Blackstone, including our Adviser and its affiliates. See Item 1A — “Risk Factors — Risks Related to Conflicts of Interest.”
Available Information
Stockholders may obtain copies of our filings with the SEC, free of charge from the website maintained by the SEC at www.sec.gov or from our website at www.breit.com.
We are providing the address to our website solely for the information of investors. The information on our website is not a part of, nor is it incorporated by reference into, this Annual Report on Form 10-K.
10
ITEM 1A. RISK FACTORS
You should specifically consider the following material risks in addition to the other information contained in this Annual Report on Form 10-K. The occurrence of any of the following risks might have a material adverse effect on our business and financial condition. The risks and uncertainties discussed below are not the only ones we face, but do represent those risks and uncertainties that we believe are most significant to our business, operating results, financial condition, prospects and forward-looking statements. As used herein, the term “you” refers to our current stockholders or potential investors in our common stock, as applicable.
Risks Related to Our Organizational Structure
We have held certain of our current investments for only a limited period of time and you will not have the opportunity to evaluate our future investments before we make them, which makes your investment more speculative.
We have held certain of our current investments for a limited period of time and are not able to provide you with information to assist you in evaluating the merits of any specific properties or real estate debt that we may acquire in the future, except for investments that may be described in one or more supplements to the Prospectus. Because we have not held certain of our current investments for a long period of time, it may be difficult for you to evaluate our success in achieving our investment objectives. We will continue to seek to invest substantially all of the future net offering proceeds from the Offering and certain private offerings, after the payment of fees and expenses, in the acquisition of or investment in interests in properties and real estate debt. However, because you will be unable to evaluate the economic merit of our future investments before we make them, you will have to rely entirely on the ability of the Adviser to select suitable and successful investment opportunities. Furthermore, the Adviser has broad discretion in selecting the types of properties we will invest in and the tenants of those properties, and you will not have the opportunity to evaluate potential investments. These factors increase the risk that your investment may not generate returns comparable to other real estate investment alternatives.
We have incurred net losses under U.S. Generally Accepted Accounting Policies (“GAAP”) in the past and may incur net losses in the future, and we have an accumulated deficit and may continue to have an accumulated deficit in the future.
For the years ended December 31, 2023 and December 31, 2022, we had net loss attributable to our stockholders of approximately $691.8 million and $883.5 million, respectively. As of December 31, 2023 and December 31, 2022, we had an accumulated loss of approximately $4.0 billion and $3.3 billion, respectively. These amounts largely reflect the expense of real estate depreciation and amortization in accordance with GAAP, which was approximately $3.8 billion and $4.1 billion, respectively, during these periods. For the years ended December 31, 2023 and 2022, our FAD was $1.7 billion and $1.9 billion, respectively.
Net loss and accumulated deficit are calculated and presented in accordance with GAAP, which, among other things, requires depreciation of real estate investments to be calculated on a straight-line basis. As a result, our operating results imply that the value of our real estate investments will decrease evenly over a set time period. However, we believe that the value of real estate investments will fluctuate over time based on market conditions. Thus, in addition to GAAP financial metrics, management reviews certain non-GAAP financial metrics that exclude real estate-related depreciation and amortization, including FAD, as an additional meaningful non-GAAP supplemental disclosure to provide information for evaluating our operating results. See “Selected Information Regarding our Operations— Funds from Operations, Adjusted Funds from Operations and Funds Available for Distribution” for reconciliations of FAD to GAAP net loss attributable to common stockholders and for considerations on how to review this metric.
The Adviser manages our portfolio pursuant to very broad investment guidelines and generally is not required to seek the approval of our board of directors for each investment, financing or asset allocation decision made by it, which may result in our making riskier investments and which could adversely affect our results of operations and financial condition.
Our board of directors approved very broad investment guidelines that delegate to the Adviser the authority to execute acquisitions and dispositions of real estate and real estate debt on our behalf, so long as such acquisitions or dispositions are consistent with the investment guidelines and our charter. The Adviser will implement on our behalf the strategies and discretionary approaches it believes from time to time may be best suited to prevailing market conditions in furtherance of that purpose, subject to the limitations under our investment guidelines and our charter. There can be no assurance that the Adviser will be successful in implementing any particular strategy or discretionary approach to our investment activities. Furthermore, the diversification and type of investments may differ substantially from our prior investments. For example, future investments may focus on different sectors of real estate or different geographic areas than is the case for our current investment portfolio. Our board of directors reviews our investment guidelines on an annual basis (or more often as it deems appropriate) and reviews our investment portfolio periodically. Pre-approval of our board of directors or a committee of independent directors will be required only as set forth in our charter (including for transactions with affiliates of the Adviser) or for the acquisition or disposition of assets that are not in accordance with our investment guidelines. In addition, in conducting periodic reviews, our directors rely primarily on information provided to them by the Adviser.
11
Furthermore, transactions entered into on our behalf by the Adviser may be costly, difficult or impossible to unwind when they are subsequently reviewed by our board of directors.
There is currently no public trading market for shares of our common stock; therefore, your ability to dispose of your shares will likely be limited to repurchase by us. If you do sell your shares to us, you may receive less than the price you paid.
There is no current public trading market for shares of our common stock, and we do not expect that such a market will ever develop. Therefore, repurchase of shares by us will likely be the only way for you to dispose of your shares, and such repurchases are limited by the share repurchase plan. We expect to continue to repurchase shares at a price equal to the transaction price of the class of shares being repurchased on the date of repurchase (which will generally be equal to our prior month’s NAV per share) and not based on the price at which you initially purchased your shares except that, subject to limited exceptions, shares that have not been outstanding for at least one year will be repurchased at 98% of the transaction price. As a result, you may receive less than the price you paid for your shares when you sell them to us pursuant to our share repurchase plan. See Item 5—“Market for Registrant’s Common Equity, Related Stockholder Matters and Issuer Purchases of Equity Securities—Share Repurchases.”
Your ability to have your shares repurchased through our share repurchase plan is limited. We may choose to repurchase fewer shares than have been requested to be repurchased, in our discretion at any time, and the amount of shares we may repurchase is subject to limitations overseen by our board of directors. Our board of directors may make exceptions to the limitations in our share repurchase plan (or repurchase fewer shares than such repurchase limitations), or modify or suspend our share repurchase plan if, in its reasonable judgment, it deems such action to be in our best interest and the best interest of our stockholders.
We may choose to repurchase fewer shares than have been requested in any particular month to be repurchased under our share repurchase plan, which is approved and administered by our board of directors, or none at all, in our discretion at any time. We may repurchase fewer shares than have been requested to be repurchased due to lack of readily available funds because of adverse market conditions beyond our control, the need to maintain liquidity for our operations or because we have determined that investing in real property or other illiquid investments is a better use of our capital than repurchasing our shares. In addition, the aggregate NAV of total repurchases (including repurchases at certain non-U.S. investor access funds primarily created to hold shares of our common stock but excluding any Early Repurchase Deduction applicable to the repurchased shares) is limited, in any calendar month, to no more than 2% of our aggregate NAV (measured using the aggregate NAV as of the end of the immediately preceding month) and, in any calendar quarter, to shares whose aggregate value is no more than 5% of our aggregate NAV (measured using the average aggregate NAV at the end of the immediately preceding three months). For the avoidance of doubt, both of these limits are assessed each month in a calendar quarter. We have in the past received, and may in the future receive, repurchase requests that exceed the limits under our share repurchase plan, and we have in the past repurchased less than the full amount of shares requested, resulting in the repurchase of shares on a pro rata basis. For example, we began a period of prorated fulfillment of repurchase requests in November 2022, in accordance with the limitations specified in our share repurchase plan. In such case, we accepted repurchase requests from each investor up to such repurchase limitations. Further, our board of directors has in the past made exceptions to the limitations in our share repurchase plan and may in the future, in certain circumstances, make exceptions to such repurchase limitations (or repurchase fewer shares than such repurchase limitations), or modify or suspend our share repurchase plan if, in its reasonable judgment, it deems such action to be in our best interest and the best interest of our stockholders. Our board of directors cannot terminate our share repurchase plan absent a liquidity event which results in our stockholders receiving cash or securities listed on a national securities exchange or where otherwise required by law. If the full amount of all shares of our common stock requested to be repurchased in any given month are not repurchased, funds will be allocated pro rata based on the total number of shares of common stock being repurchased without regard to class and subject to the volume limitation. All unsatisfied repurchase requests must be resubmitted after the start of the next month or quarter, or upon the recommencement of the share repurchase plan, as applicable.
The vast majority of our assets consist of properties that cannot generally be readily liquidated without impacting our ability to realize full value upon their disposition. Therefore, we may not always have a sufficient amount of cash to immediately satisfy repurchase requests. Should repurchase requests, in our board of directors’ judgment, place an undue burden on our liquidity, adversely affect our operations or risk having an adverse impact on the Company as a whole, or should our board of directors otherwise determine that investing our liquid assets in real properties or other investments rather than repurchasing our shares is in the best interests of the Company as a whole, then our board of directors may determine to repurchase fewer shares than have been requested to be repurchased (including relative to the 2% monthly limit and 5% quarterly limit under our share repurchase plan), or none at all. Upon suspension of our share repurchase plan, our share repurchase plan requires our board of directors to consider at least quarterly whether the continued suspension of the plan is in the best interest of the Company and its stockholders; however, we are not required to authorize the recommencement of the share repurchase plan within any specified period of time. As a result, a stockholder’s ability to have their shares repurchased by us has been limited in the past, and may be limited in the future, and at times stockholders have not been able to, and may not in the future be able to, liquidate their investment. See Item 5—“Market for Registrant’s Common Equity, Related Stockholder Matters and Issuer Purchases of Equity Securities—Share Repurchases.”
12
Economic events that may cause our stockholders to request that we repurchase their shares may materially adversely affect our cash flow and our results of operations and financial condition.
Events affecting economic conditions in the United States and/or elsewhere or globally, such as the general negative performance of the real estate sector (including as a result of inflation or higher interest rates), actual or perceived instability in the U.S. banking system or market volatility (including as a result of the ongoing hostilities between Russia and Ukraine and more recently, conflict and escalating tensions in the Middle East) could cause our stockholders to seek repurchase of their shares pursuant to our share repurchase plan at a time when such events are adversely affecting the performance of our assets. Even if we decide to satisfy all resulting repurchase requests, our cash flow and liquidity could be materially adversely affected, and we may incur additional leverage. In addition, if we determine to sell assets to satisfy repurchase requests, we may not be able to realize the return on such assets that we may have been able to achieve had we sold at a more favorable time, and our results of operations and financial condition, including, without limitation, breadth of our portfolio by property type and location, could be materially adversely affected.
In addition, stockholders have and may continue to seek to repurchase some or all of the shares of our common stock that they hold. A significant volume of repurchase requests in a given period has in the past and may in the future cause requests to exceed the 2% monthly and 5% quarterly limits under our share repurchase plan, resulting in less than the full amount of repurchase requests being satisfied in such period.
We face risks associated with the deployment of our capital.
In light of the nature of our continuous public offering as well as ongoing and periodic private offerings in relation to our investment strategy and the need to be able to deploy potentially large amounts of capital quickly to capitalize on potential investment opportunities, if we have difficulty identifying and purchasing suitable investments on attractive terms, there could be a delay between the time we receive net proceeds from the sale of shares of our common stock in the Offering or any private offering and the time we invest the net proceeds. We may also from time to time hold cash pending deployment into investments or have less than our targeted leverage, which cash or shortfall in target leverage may at times be significant, particularly at times when we are receiving high amounts of offering proceeds and/or times when there are few attractive investment opportunities. Such cash may be held in an account for the benefit of our stockholders that may be invested in money market accounts or other similar temporary investments, each of which is subject to management fees.
In the event we are unable to find suitable investments such cash may be maintained for longer periods which would be dilutive to overall investment returns. This could cause a substantial delay in the time it takes for your investment to realize its full potential return and could adversely affect our ability to pay regular distributions of cash flow from operations to you. It is not anticipated that the temporary investment of such cash into money market accounts or other similar temporary investments pending deployment into investments will generate significant interest, and investors should understand that such low interest payments on the temporarily invested cash may adversely affect overall returns. In the event we fail to timely invest the net proceeds of sales of our common stock or do not deploy sufficient capital to meet our targeted leverage, our results of operations and financial condition may be adversely affected.
If we are unable to successfully integrate new investments and manage our growth, our results of operations and financial condition may suffer.
We have in the past and may in the future significantly increase the size and/or change the types of investments in our portfolio. We may be unable to successfully and efficiently integrate newly acquired investments into our existing portfolio or otherwise effectively manage our assets or growth. In addition, increases in the size of our investment portfolio and/or changes in our investment focus may place significant demands on our Adviser’s administrative, operational, asset management, financial and other resources which could lead to decreased efficiency. Any failure to effectively manage such growth or increase in scale could adversely affect our results of operations and financial condition.
The amount and source of distributions we may make to our stockholders is uncertain, and we may be unable to generate sufficient cash flows from our operations to make distributions to our stockholders at any time in the future.
We have not established a minimum distribution payment level, and our ability to make distributions to our stockholders may be adversely affected by a number of factors, including the risk factors described in this Annual Report on Form 10-K. We may not generate sufficient income to make distributions to our stockholders. Our board of directors (or a committee of our board of directors) will make determinations regarding distributions based upon, among other factors, our financial performance, debt service obligations, debt covenants, REIT qualification and tax requirements and capital expenditure requirements. Among the factors that could impair our ability to make distributions to our stockholders are:
•our inability to invest the proceeds from sales of our shares on a timely basis in income-generating properties;
13
•our inability to realize attractive risk-adjusted returns on our investments;
•high levels of repurchase requests under our share repurchase plan for a prolonged period of time, which could lead to the disposition of investments to generate liquidity to satisfy repurchase requests;
•high levels of expenses or reduced revenues that reduce our cash flow or non-cash earnings; and
•defaults in our investment portfolio or decreases in the value of our investments.
As a result, we may not be able to make distributions to our stockholders at any time in the future, and the level of any distributions we do make to our stockholders may not increase or even be maintained over time, any of which could materially and adversely affect the value of your investment.
We may pay distributions from sources other than our cash flow from operations, including, without limitation, borrowings, the sale of our assets, repayments of our real estate debt investments, return of capital or offering proceeds and advances or the deferral of fees and expenses, and we have no limits on the amounts we may fund from such sources.
We may not generate sufficient cash flow from operations to fully fund distributions to stockholders. Therefore, we may fund distributions to our stockholders from sources other than cash flow from operations, including, without limitation, borrowings, the sale of our assets, repayments of our real estate debt investments, return of capital or offering proceeds and advances or the deferral of fees and expenses. The extent to which we fund distributions from sources other than cash flow from operations will depend on various factors, including the level of participation in our distribution reinvestment plan, the extent to which the Adviser elects to receive its management fee in shares of our common stock and/or Operating Partnership units and the Special Limited Partner elects to receive distributions on its performance participation interest in Operating Partnership units, how quickly we invest the proceeds from this and any future offering and the performance of our investments, including our real estate debt portfolio. Funding distributions from borrowings, the sale of our assets, repayments of our real estate debt investments, return of capital or offering proceeds, and advances or the deferral of fees and expenses will result in us having less funds available to acquire properties or other real estate-related investments. As a result, the return you realize on your investment may be reduced. Doing so may also negatively impact our ability to generate cash flows. Likewise, funding distributions from the sale of additional securities will dilute your interest in us on a percentage basis and may impact the value of your investment especially if we sell these securities at prices less than the price you paid for your shares. We may be required to continue to fund our regular distributions from a combination of some of these sources if our investments fail to perform, if expenses are greater than our revenues or due to numerous other factors. We cannot predict when, if ever, distribution payments sourced from borrowings and from proceeds may occur, and an extended period of such payments would likely be unsustainable. We have not established a limit on the amount of our distributions that may be funded from any of these sources.
To the extent we borrow funds to pay distributions, we would incur borrowing costs and these borrowings would require a future repayment. The use of these sources for distributions and the ultimate repayment of any liabilities incurred could adversely impact our ability to pay distributions in future periods, decrease our NAV, decrease the amount of cash we have available for operations and new investments and adversely impact the value of your investment.
We may also defer operating expenses or pay expenses (including the fees of the Adviser or distributions to the Special Limited Partner) with shares of our common stock or Operating Partnership units in order to preserve cash flow for the payment of distributions. The ultimate repayment of these deferred expenses could adversely affect our operations and reduce the future return on your investment. We may repurchase shares or redeem Operating Partnership units from the Adviser or the Special Limited Partner shortly after issuing such shares or units as compensation. The payment of expenses in shares of our common stock or with Operating Partnership units will dilute your ownership interest in our portfolio of assets. There is no guarantee any of our operating expenses will be deferred and the Adviser and Special Limited Partner are under no obligation to receive future fees or distributions in shares of our common stock or Operating Partnership units and may elect to receive such amounts in cash.
Payments to the Adviser or the Special Limited Partner in the form of common stock or Operating Partnership units they elect to receive in lieu of fees or distributions will dilute future cash available for distribution to our stockholders.
The Adviser or the Special Limited Partner may choose to receive, and have in the past received, shares of our common stock or Operating Partnership units in lieu of certain fees or distributions. The holders of all Operating Partnership units are entitled to receive cash from operations pro rata with the distributions being paid to us and such distributions to the holder of the Operating Partnership units will reduce the cash available for distribution to us and to our stockholders. Furthermore, under certain circumstances the Operating Partnership units held by the Adviser or the Special Limited Partner are required to be repurchased, in cash at the holder’s election, and there may not be sufficient cash to make such a repurchase payment; therefore, we may need to use cash from operations, borrowings, offering proceeds or other sources to make the payment, which will reduce cash available for distribution to you or for investment in our operations. The Special Limited Partner may receive such distributions of units related to its performance participation interest quarterly, and the frequency of repurchases of units from the Special Limited Partner may increase compared to
14
prior periods in which such distributions were payable to the Special Limited Partner on an annual basis. Although the Special Limited Partner is required to pay a Quarterly Shortfall Obligation (as defined below) with respect to units received in connection with distributions of Quarterly Allocations (as defined below), there is no guarantee this Quarterly Shortfall Obligation will adequately offset the dilutive impacts on us. Repurchases of our shares or Operating Partnership units from the Adviser paid to the Adviser as a management fee are not subject to the monthly and quarterly volume limitations or the Early Purchase Deduction, and such repurchases may receive priority over other shares submitted for repurchase during such period. The amount of Operating Partnership units issued to the Special Limited Partner may be significant, particularly during periods in which the value of our real estate portfolio appreciates, resulting in higher performance participation allocation. Repurchases of our shares or Operating Partnership units from the Special Limited Partner distributed to the Special Limited Partner with respect to its performance participation interest are not subject to the Early Purchase Deduction, but such repurchases are subject to the monthly and quarterly volume limitations and do not receive priority over other shares submitted for repurchase during such period.
Purchases and repurchases of shares of our common stock are not made based on the current NAV per share of our common stock.
Generally, our offering price per share and the price at which we make repurchases of our shares will equal the NAV per share of the applicable class as of the last calendar day of the prior month, plus, in the case of our offering price, applicable upfront selling commissions and dealer manager fees. The NAV per share, if calculated as of the date on which you make your subscription request or repurchase request, may be significantly different than the transaction price you pay or the repurchase price you receive. Certain of our investments or liabilities are subject to high levels of volatility from time to time and could change in value significantly between the end of the prior month as of which our NAV is determined and the date that you acquire or repurchase our shares, however the prior month’s NAV per share will generally continue to be used as the transaction price per share and repurchase price per share. In exceptional circumstances, we may in our sole discretion, but are not obligated to, offer and repurchase shares at a different price that we believe reflects the NAV per share of such stock more appropriately than the prior month’s NAV per share, including by updating a previously disclosed transaction price, in cases where we believe there has been a material change (positive or negative) to our NAV per share since the end of the prior month and we believe an updated price is appropriate. In such exceptional cases, the transaction price and the repurchase price will not equal our NAV per share as of any time.
Valuations and appraisals of our real estate and real estate debt are estimates of fair value and may not necessarily correspond to realizable value.
For the purposes of calculating our monthly NAV, our properties will generally initially be valued at cost, which we expect to represent fair value at that time. The Adviser will then value our properties monthly, based on current material market data and other information deemed relevant, with review for reasonableness each month by an independent valuation advisor. Each property will be valued by an independent third-party appraisal firm annually. Annual appraisals may be delayed for a short period in exceptional circumstances. Concurrent with the appraisal process, the Adviser will value each property and, taking into account the appraisal, among other factors, will determine the appropriate valuation within the range provided by the independent third-party appraisal firm.
Investments in real estate debt and other securities with readily available market quotations will be valued monthly at fair market value. Certain investments, such as mortgages, mezzanine loans, preferred equity or private company investments, are unlikely to have market quotations. In the case of loans acquired by us, such initial value will generally be the acquisition price of such loan. In the case of loans originated by us, such initial value will generally be the par value of such loan. Each such investment will then be valued by the Adviser within the first three full months after we invest in such investment and no less than quarterly thereafter. Additionally, the Adviser may in its discretion consider material market data and other information that becomes available after the end of the applicable month in valuing our assets and liabilities and calculating our NAV for a particular month. For more information regarding our valuation process, see “Net Asset Value Calculation and Valuation Guidelines” in the Prospectus.
Although monthly valuations of each of our real properties will be reviewed for reasonableness by an independent valuation advisor, such reviews are based on asset- and portfolio-level information provided by the Adviser, including historical operating revenues and expenses of the properties, lease agreements on the properties, revenues and expenses of the properties, information regarding recent or planned capital expenditures and any other information relevant to valuing the real property, which information will not be independently verified by the independent valuation advisor. Similarly, each month, the independent valuation advisor will review for reasonableness our quarterly valuations (and our monthly updates of such valuations) of our real estate debt and other securities for which market quotations are not readily available. However, such valuations are based on information provided by the Adviser, which information will not be verified by the independent valuation advisor. While the independent valuation advisor is responsible for reviewing our property and certain real estate debt and other securities valuations as set forth in our valuation guidelines, the independent valuation advisor is not responsible for, and does not calculate, our NAV, and the Adviser is ultimately and solely responsible for the determination of our NAV.
15
Within the parameters of our valuation guidelines, the valuation methodologies used to value our properties and certain of our investments will involve subjective judgments and projections and may not be accurate. Valuation methodologies will also involve assumptions and opinions about future events, which may or may not turn out to be correct. Valuations and appraisals of our properties and other investments will be only estimates of fair value. Ultimate realization of the value of an asset depends to a great extent on economic, market and other conditions beyond our control and the control of the Adviser and the independent valuation advisor. Further, valuations do not necessarily represent the price at which an asset would sell, since market prices of assets can only be determined by negotiation between a willing buyer and seller. As such, the carrying value of an asset may not reflect the price at which the asset could be sold in the market, and the difference between carrying value and the ultimate sales price could be material. In addition, accurate valuations are more difficult to obtain in times of low transaction volume because there are fewer market transactions that can be considered in the context of the appraisal.
There will be no retroactive adjustment in the valuation of such assets, the offering price of our shares of common stock, the price we paid to repurchase shares of our common stock or NAV-based fees we paid to the Adviser and Blackstone Securities Partners L.P. (the “Dealer Manager”), an affiliate of the Adviser, to the extent such valuations prove to not accurately reflect the realizable value of our assets. Because the price you will pay for shares of our common stock in the Offering, and the price at which your shares may be repurchased by us pursuant to our share repurchase plan are generally based on our prior month’s NAV per share, you may pay more than realizable value or receive less than realizable value for your investment.
Our NAV per share amounts may change materially if the appraised values of our properties materially change from prior appraisals or the actual operating results for a particular month differ from what we originally budgeted for that month.
We anticipate that the annual appraisals of our properties will be conducted on a rolling basis, such that properties may be appraised at different times but each property would be appraised at least once per year. In addition, all of our single family rental housing (“SFR”) properties will be appraised at the same time on an annual basis. When these appraisals are considered by the Adviser for purposes of valuing the relevant property, there may be a material change in our NAV per share amounts for each class of our common stock from those previously reported. In addition, actual operating results for a given month may differ from what we originally budgeted for that month, which may cause a material increase or decrease in the NAV per share amounts. We will not retroactively adjust the NAV per share of each class reported for the previous month. Therefore, because a new annual appraisal may differ materially from the prior appraisal or the actual results from operations may be better or worse than what we previously budgeted for a particular month, the adjustment to take into consideration the new appraisal or actual operating results may cause the NAV per share for each class of our common stock to increase or decrease, and such increase or decrease will occur in the month the adjustment is made.
It may be difficult to reflect, fully and accurately, material events that may impact our monthly NAV.
The Adviser’s determination of our monthly NAV per share will be based in part on appraisals of each of our properties provided annually by independent third-party appraisal firms and quarterly valuations of our real estate debt and other securities for which market prices are not readily available provided by the Adviser and reviewed by an independent valuation advisor, each in accordance with valuation guidelines approved by our board of directors. As a result, our published NAV per share in any given month may not fully reflect any or all changes in value that may have occurred since the most recent appraisal or valuation. The Adviser will review appraisal reports and monitor our real estate and real estate debt, and is responsible for notifying the applicable independent valuation advisor of the occurrence of any property-specific or market-driven event it believes may cause a material valuation change in the real estate valuation, but it may be difficult to reflect fully and accurately rapidly changing market conditions or material events that may impact the value of our real estate and real estate debt or liabilities between valuations, or to obtain complete information regarding any such events in a timely manner. For example, an unexpected termination or renewal of a material lease, a material increase or decrease in vacancies or an unanticipated structural or environmental event at a property may cause the value of a property to change materially, yet obtaining sufficient relevant information after the occurrence has come to light and/or analyzing fully the financial impact of such an event may be difficult to do and may require some time. As a result, the NAV per share may not reflect a material event until such time as sufficient information is available and analyzed, and the financial impact is fully evaluated, such that our NAV may be appropriately adjusted in accordance with our valuation guidelines. Depending on the circumstance, the resulting potential disparity in our NAV may be in favor or to the detriment of either stockholders who repurchase their shares, or stockholders who buy new shares, or existing stockholders.
NAV calculations are not governed by governmental or independent securities, financial or accounting rules or standards.
The methods used by our Adviser and State Street or its affiliates to calculate our monthly NAV, including the components used in calculating our NAV, are not prescribed by rules of the SEC or any other regulatory agency. Further, there are no accounting rules or standards that prescribe which components should be used in calculating NAV, and our NAV is not audited by our independent registered public accounting firm. We calculate and publish NAV monthly solely for purposes of establishing the price at which we sell and repurchase shares of our common stock on a monthly basis, and you should not view our monthly NAV, on its own, as a
16
measure of our historical or future financial condition or performance. The components and methodology used in calculating our NAV may differ from those used by other companies now or in the future.
In addition, calculations of our NAV, to the extent that they incorporate valuations of our assets and liabilities, are not prepared in accordance with GAAP. These valuations may differ from liquidation values that could be realized in the event that we were forced to sell assets.
Additionally, errors may occur in calculating our NAV, which could impact the price at which we sell and repurchase shares of our common stock and the amount of the Adviser’s management fee and the Special Limited Partner’s performance participation interest. The Adviser has implemented certain policies and procedures to address such errors in NAV calculations. If such errors were to occur, the Adviser, depending on the circumstances surrounding each error and the extent of any impact the error has on the price at which shares of our common stock were sold or repurchased or on the amount of the Adviser’s management fee or the Special Limited Partner’s performance participation interest, may determine in its sole discretion to take certain corrective actions in response to such errors, including, subject to Blackstone’s policies and procedures, making adjustments to prior NAV calculations. You should carefully review the disclosure of our valuation policies and how NAV will be calculated under “Net Asset Value Calculation and Valuation Guidelines” in the Prospectus.
Our board of directors may, in the future, adopt certain measures under Maryland law without stockholder approval that may have the effect of making it less likely that a stockholder would receive a “control premium” for his or her shares.
Corporations incorporated under Maryland law with a class of equity securities registered under the Securities Exchange Act of 1934, as amended (the “Exchange Act”), and at least three independent directors are permitted to elect to be subject, by a charter or bylaw provision or a resolution of its board of directors and notwithstanding any contrary charter or bylaw provision, to any or all of five provisions:
•staggering the board of directors into three classes;
•requiring a two-thirds vote of stockholders to remove directors;
•providing that only the board of directors can fix the size of the board;
•providing that all vacancies on the board, regardless of how the vacancy was created, may be filled only by the affirmative vote of a majority of the remaining directors in office and for the remainder of the full term of the class of directors in which the vacancy occurred; and
•providing for a majority requirement for the calling by stockholders of a special meeting of stockholders.
These provisions may discourage an extraordinary transaction, such as a merger, tender offer or sale of all or substantially all of our assets, all of which might provide a premium price for stockholders’ shares. In our charter, we have elected that vacancies on our board of directors be filled only by the remaining directors and for the remainder of the full term of the directorship in which the vacancy occurred. Through other provisions in our charter and bylaws, we vest in our board of directors the exclusive power to fix the number of directorships, provided that the number is not less than three. We have not elected to be subject to any of the other provisions described above, but our charter does not prohibit our board of directors from opting into any of these provisions in the future.
Further, under the Maryland Business Combination Act, we may not engage in any merger or other business combination with an “interested stockholder” (which is defined as (1) any person who beneficially owns, directly or indirectly, 10% or more of the voting power of our outstanding voting stock and (2) an affiliate or associate of ours who, at any time within the two-year period prior to the date in question, was the beneficial owner, directly or indirectly, of 10% or more of the voting power of our then outstanding stock) or any affiliate of that interested stockholder for a period of five years after the most recent date on which the interested stockholder became an interested stockholder. A person is not an interested stockholder if our board of directors approved in advance the transaction by which such stockholder would otherwise have become an interested stockholder. In approving a transaction, our board of directors may provide that its approval is subject to compliance, at or after the time of approval, with any terms or conditions determined by our board of directors. After the five-year period ends, any merger or other business combination with the interested stockholder or any affiliate of the interested stockholder must be recommended by our board of directors and approved by the affirmative vote of at least:
•80% of all votes entitled to be cast by holders of outstanding shares of our voting stock; and
17
•two-thirds of all of the votes entitled to be cast by holders of outstanding shares of our voting stock other than those shares owned or held by the interested stockholder with whom or with whose affiliate the business combination is to be effected or held by an affiliate or associate of the interested stockholder.
These supermajority voting provisions do not apply if, among other things, our stockholders receive a minimum price (as defined in the Maryland General Corporation Law (the “MGCL”)) for their common stock and the consideration is received in cash or in the same form as previously paid by the interested stockholder.
The statute permits various exemptions from its provisions, including business combinations that are exempted by our board of directors prior to the time the interested stockholder becomes an interested stockholder. Our board of directors has adopted a resolution exempting any business combination involving us and any person, including Blackstone, the Dealer Manager and the Adviser, from the provisions of this law, provided that such business combination is first approved by our board of directors.
Our charter permits our board of directors to authorize us to issue preferred stock on terms that may subordinate the rights of the holders of our current common stock or discourage a third party from acquiring us.
Our board of directors is permitted, subject to certain restrictions set forth in our charter, to authorize the issuance of shares of preferred stock without stockholder approval. Further, our board of directors may classify or reclassify any unissued shares of common or preferred stock into other classes or series of stock and establish the preferences, conversion or other rights, voting powers, restrictions, limitations as to dividends and other distributions, qualifications, and terms or conditions of redemption of the stock and may amend our charter from time to time to increase or decrease the aggregate number of shares or the number of shares of any class or series that we have authority to issue without stockholder approval. Thus, our board of directors could authorize us to issue shares of preferred stock with terms and conditions that could subordinate the rights of the holders of our common stock or have the effect of delaying, deferring or preventing a change in control of us, including an extraordinary transaction such as a merger, tender offer or sale of all or substantially all of our assets, that might provide a premium price for holders of our common stock.
Maryland law limits, in some cases, the ability of a third party to vote shares acquired in a “control share acquisition.”
The Maryland Control Share Acquisition Act provides that “control shares” of a Maryland corporation acquired in a “control share acquisition” have no voting rights except to the extent approved by stockholders by a vote of two-thirds of the votes entitled to be cast on the matter. Shares of stock owned by the acquirer, by officers or by employees who are directors of the corporation, are excluded from shares entitled to vote on the matter. “Control shares” are voting shares of stock which, if aggregated with all other shares of stock owned by the acquirer or in respect of which the acquirer can exercise or direct the exercise of voting power (except solely by virtue of a revocable proxy), would entitle the acquirer to exercise voting power in electing directors within specified ranges of voting power. Control shares do not include shares the acquiring person is then entitled to vote as a result of having previously obtained stockholder approval or shares acquired directly from the corporation. A “control share acquisition” means the acquisition of issued and outstanding control shares, subject to certain exceptions. The control share acquisition statute does not apply: (1) to shares acquired in a merger, consolidation or statutory share exchange if the Maryland corporation is a party to the transaction; or (2) to acquisitions approved or exempted by the charter or bylaws of the Maryland corporation. Our bylaws contain a provision exempting from the Control Share Acquisition Act any and all acquisitions of our stock by any person. There can be no assurance that this provision will not be amended or eliminated at any time in the future. For a more detailed discussion on the Maryland laws governing control share acquisitions, see “Certain Provisions of Maryland Corporate Law and Our Charter and Bylaws—Control Share Acquisition” in the Prospectus.
Maryland law and our organizational documents limit our rights and the rights of our stockholders to recover claims against our directors and officers, which could reduce your and our recovery against them if they cause us to incur losses.
Maryland law provides that a director will not have any liability as a director so long as he or she performs his or her duties in accordance with the applicable standard of conduct. In addition, our charter generally limits the personal liability of our directors and officers for monetary damages subject to the limitations of the North American Securities Administrators Association’s Statement of Policy Regarding Real Estate Investment Trusts, as revised and adopted on May 7, 2007 (the “NASAA REIT Guidelines”) and Maryland law. Maryland law and our charter provide that no director or officer shall be liable to us or our stockholders for monetary damages unless the director or officer (1) actually received an improper benefit or profit in money, property or services or (2) was actively and deliberately dishonest as established by a final judgment as material to the cause of action. Moreover, our charter generally requires us to indemnify and advance expenses to our directors and officers for losses they may incur by reason of their service in those capacities unless their act or omission was material to the matter giving rise to the proceeding and was committed in bad faith or was the result of active and deliberate dishonesty, they actually received an improper personal benefit in money, property or services or, in the case of any criminal proceeding, they had reasonable cause to believe the act or omission was unlawful. Further, we have entered into separate indemnification agreements with each of our officers and directors. As a result, you and we may have more limited rights against our directors or officers than might otherwise exist under common law, which could reduce your and our
18
recovery from these persons if they act in a manner that causes us to incur losses. In addition, we are obligated to fund the defense costs incurred by these persons in some cases. However, our charter provides that we may not indemnify our directors or officers, or the Adviser and its affiliates, for any liability or loss suffered by them or hold our directors or officers, the Adviser and its affiliates harmless for any liability or loss suffered by us, unless they have determined, in good faith, that the course of conduct that caused the loss or liability was in our best interests, they were acting on our behalf or performing services for us, the liability or loss was not the result of negligence or misconduct by our non-independent directors, the Adviser and its affiliates, or gross negligence or willful misconduct by our independent directors, and the indemnification or agreement to hold harmless is recoverable only out of our net assets and not from the stockholders. See “Management—Limited Liability and Indemnification of Directors, Officers, the Adviser and Other Agents” in the Prospectus.
Maryland law limits our stockholders’ ability to amend our charter or dissolve us without the approval of our board of directors.
Although the NASAA REIT Guidelines indicate that stockholders are permitted to amend our charter or terminate us without the necessity for concurrence by our board of directors, we are required to comply with the MGCL, which provides that any amendment to our charter or any dissolution of our company must first be declared advisable by our board of directors. Therefore, our stockholders may vote to authorize the amendment of our charter or the dissolution of our company, but only after such action has been declared advisable by our board of directors. Accordingly, the only proposals to amend our charter or to dissolve our company that will be presented to our stockholders will be those that have been declared advisable by our board of directors and also require approval by our stockholders.
Your interest in us will be diluted if we issue additional shares. Your interest in our assets will also be diluted if the Operating Partnership issues additional units.
Holders of our common stock will not have preemptive rights to any shares we issue in the future. Our charter authorizes us to issue up to 12,100,000,000 shares of capital stock, of which 12,000,000,000 shares are classified as common stock, par value $0.01 per share, of which 500,000,000 shares are classified as Class T shares, 3,000,000,000 shares are classified as Class S shares, 1,500,000,000 shares are classified as Class D shares, 6,000,000,000 shares are classified as Class I shares, 500,000,000 shares are classified as Class C shares, and 500,000,000 shares are classified as Class F shares and 100,000,000 shares are classified as preferred stock, par value $0.01 per share. We have also issued shares in private offerings and Operating Partnership units to holders other than the Company and made equity grants to our independent directors and service providers, and expect to make more such issuances in the future. In addition, our board of directors may amend our charter from time to time to increase or decrease the aggregate number of authorized shares of capital stock or the number of authorized shares of capital stock of any class or series without stockholder approval. Our board of directors may elect, without stockholder approval, to: (1) sell additional shares in this or future public offerings; (2) issue shares of our common stock or units in our Operating Partnership in private offerings; (3) issue shares of our common stock or Operating Partnership units upon the exercise of the options we may grant to our independent directors or future employees; (4) issue shares of our common stock or Operating Partnership units to the Adviser or the Special Limited Partner, or their successors or assigns, in payment of an outstanding obligation to pay fees for services rendered to us or the performance participation allocation; (5) issue shares of our common stock or Operating Partnership units to sellers of properties we acquire, or (6) issue equity incentive compensation to certain employees of our portfolio companies, other affiliated service providers, or to third parties as satisfaction of obligations under incentive compensation arrangements. To the extent we issue additional shares of common stock after your purchase in the Offering, your percentage ownership interest in us will be diluted. Because we hold all of our assets through the Operating Partnership, to the extent we issue additional units of our Operating Partnership after you purchase shares in the Offering, your percentage ownership interest in our assets will be diluted. Because certain classes of the units of our Operating Partnership may, in the discretion of our board of directors, be exchanged for shares of our common stock, any merger, exchange or conversion between our Operating Partnership and another entity ultimately could result in the issuance of a substantial number of shares of our common stock, thereby diluting the percentage ownership interest of other stockholders. Because of these and other reasons, our stockholders may experience substantial dilution in their percentage ownership of our shares or their interests in the underlying assets held by our Operating Partnership. Operating Partnership units may have different and preferential rights to the claims of common units of our Operating Partnership which correspond to the common stock held by our stockholders. Certain units in our Operating Partnership may have different and preferential rights to the terms of the common Operating Partnership units which correspond to the common stock held by our stockholders.
We are not required to comply with certain reporting requirements, including those relating to auditor’s attestation reports on the effectiveness of our system of internal control over financial reporting, accounting standards and disclosure about our executive compensation, that apply to other public companies.
So long as our shares of common stock are not traded on a securities exchange, we will be deemed to be a “non-accelerated filer” under the Exchange Act, and as a non-accelerated filer, we will be exempt from compliance with the auditor attestation requirements of Section 404 of the Sarbanes-Oxley Act. In addition, so long as we are externally managed by the Adviser and we do not directly compensate our executive officers, or reimburse the Adviser or its affiliates for salaries, bonuses, benefits and severance payments for
19
persons who also serve as one of our executive officers or as an executive officer of the Adviser, we do not have any executive compensation.
Our UPREIT structure may result in potential conflicts of interest with limited partners in our Operating Partnership whose interests may not be aligned with those of our stockholders.
Our directors and officers have duties to our corporation and our stockholders under Maryland law and our charter in connection with their management of the corporation. At the same time, we, as general partner, have fiduciary duties under Delaware law to our Operating Partnership and to the limited partners in connection with the management of our Operating Partnership. Our duties as general partner of our Operating Partnership and its partners may come into conflict with the duties of our directors and officers to the corporation and our stockholders. Under Delaware law, a general partner of a Delaware limited partnership owes its limited partners the duties of good faith and fair dealing. Other duties, including fiduciary duties, may be modified or eliminated in the partnership’s partnership agreement. The partnership agreement of our Operating Partnership provides that, for so long as we own a controlling interest in our Operating Partnership, any conflict that cannot be resolved in a manner not adverse to either our stockholders or the limited partners may be resolved in favor of our stockholders.
Additionally, the partnership agreement expressly limits our liability by providing that we and our officers, directors, agents and employees will not be liable or accountable to our Operating Partnership for losses sustained, liabilities incurred or benefits not derived if we or our officers, directors, agents or employees acted in good faith. In addition, our Operating Partnership is required to indemnify us and our officers, directors, employees, agents and designees to the extent permitted by applicable law from and against any and all claims arising from operations of our Operating Partnership, unless it is established that: (1) the act or omission was material to the matter giving rise to the proceeding and either was committed in bad faith or was the result of active and deliberate dishonesty; (2) the indemnified party received an improper personal benefit in money, property or services; or (3) in the case of a criminal proceeding, the indemnified person had reasonable cause to believe that the act or omission was unlawful.
The provisions of Delaware law that allow the fiduciary duties of a general partner to be modified by a partnership agreement have not been tested in a court of law, and we have not obtained an opinion of counsel covering the provisions set forth in the partnership agreement that purport to waive or restrict our fiduciary duties.
Your investment return may be reduced if we are required to register as an investment company under the Investment Company Act.
We intend to continue to conduct our operations so that neither we, nor our Operating Partnership nor the subsidiaries of our Operating Partnership are investment companies under the Investment Company Act of 1940, as amended (the “Investment Company Act”). However, there can be no assurance that we and our subsidiaries will be able to successfully avoid operating as an investment company.
A change in the value of any of our assets could negatively affect our ability to maintain our exclusion from regulation under the Investment Company Act. To maintain compliance with the applicable exclusion under the Investment Company Act, we may be unable to sell assets we would otherwise want to sell and may need to sell assets we would otherwise wish to retain. In addition, we may have to acquire additional assets that we might not otherwise have acquired or may have to forego opportunities to acquire assets that we would otherwise want to acquire and would be important to our investment strategy.
If we were required to register as an investment company but failed to do so, we would become subject to substantial regulation with respect to our capital structure (including our ability to use borrowings), management, operations, transactions with affiliated persons (as defined in the Investment Company Act), and portfolio composition, including disclosure requirements and restrictions with respect to diversification and industry concentration, and other matters. Compliance with the Investment Company Act would, accordingly, limit our ability to make certain investments and require us to significantly restructure our business plan, which could materially adversely affect our NAV and our ability to pay distributions to our stockholders.
We depend on the Adviser and its affiliates to develop appropriate systems and procedures to control operational risk.
Operational risks arising from mistakes made in the confirmation or settlement of transactions, from transactions not being properly booked, evaluated or accounted for or other similar disruption in our operations may cause us to suffer financial losses, the disruption of our business, liability to third parties, regulatory intervention or damage to our reputation. We depend on the Adviser and its affiliates to develop the appropriate systems and procedures to control operational risk. We rely heavily on our Adviser’s financial, accounting, treasury, communications and other data processing systems. The ability of our Adviser’s systems to accommodate transactions could also constrain our ability to properly manage our portfolio. Generally, the Adviser will not be liable for losses incurred due to the occurrence of any such errors.
20
We are subject to the risk that our trading orders may not be executed in a timely and efficient manner due to various circumstances, including, without limitation, systems failure or human error. As a result, we could be unable to achieve the market position selected by the Adviser or might incur a loss in liquidating our positions. Since some of the markets in which we may effect transactions are over-the-counter or interdealer markets, the participants in such markets are typically not subject to credit evaluation or regulatory oversight comparable to that which members of exchange-based markets are subject. We are also exposed to the risk that a counterparty will not settle a transaction in accordance with its terms and conditions, thereby causing us to suffer a loss.
Cybersecurity risks and data protection could result in the loss of data, interruptions in our business, damage to our reputation, and subject us to regulatory actions, increased costs and financial losses, each of which could have a material adverse effect on our business and results of operations.
Our operations are highly dependent on our information systems and technology, and we rely heavily on our and Blackstone’s financial, accounting, treasury, communications and other data processing systems. Such systems may fail to operate properly or become disabled as a result of tampering or a breach of the network security systems or otherwise. In addition, such systems are from time to time subject to cyberattacks which are continually evolving and may increase in sophistication and frequency in the future. Attacks on Blackstone and its affiliates and their portfolio companies’ and service providers’ systems could involve, and in some instances have in the past involved, attempts that are intended to obtain unauthorized access to our proprietary information or personal identifying information of our stockholders, destroy data or disable, degrade or sabotage our systems, or divert or otherwise steal funds, including through the introduction of “phishing” attempts and other forms of social engineering, computer viruses and other malicious code.
Cybersecurity incidents and cyber-attack, denial of service attacks, ransomware attacks, and social engineering attempts (including business email compromise attacks) have been occurring globally at a more frequent and severe level and will likely continue to increase in frequency in the future (including as a consequence of the COVID-19 pandemic and the increased frequency of virtual working arrangements). There have been a number of recent highly publicized cases involving the dissemination, theft and destruction of corporate information or other assets, as a result of a failure to follow procedures by employees or contractors or as a result of actions by a variety of third parties, including nation state actors and terrorist or criminal organizations. Blackstone, we and our service providers and other market participants increasingly depend on complex information technology and communications systems to conduct business functions, and their operations rely on the secure access to, and processing, storage and transmission of confidential and other information in their systems and those of their respective third-party service providers. These information, technology and communications systems are subject to a number of different threats or risks that could adversely affect Blackstone or us. For example, the information and technology systems as well as those of Blackstone, its portfolio companies and other related parties, such as service providers, may be vulnerable to damage or interruption from cybersecurity breaches, computer viruses or other malicious code, network failures, computer and telecommunication failures, infiltration by unauthorized persons and other security breaches, usage errors by their respective professionals or service providers, power, communications or other service outages and catastrophic events such as fires, tornadoes, floods, hurricanes and earthquakes. Cyberattacks, ransomware and other security threats could originate from a wide variety of external sources, including cyber criminals, nation state hackers, hacktivists and other outside parties. Cyberattacks and other security threats could also originate from the malicious or accidental acts of insiders.
There has been an increase in the frequency and sophistication of the cyber and security threats Blackstone faces, with attacks ranging from those common to businesses generally to those that are more advanced and persistent, which may target Blackstone because Blackstone holds a significant amount of confidential and sensitive information about its and our investors, its and our portfolio companies and potential investments. As a result, we and Blackstone may face a heightened risk of a security breach or disruption with respect to this information. If successful, these types of attacks on our or Blackstone’s network or other systems could have a material adverse effect on our business and results of operations, due to, among other things, the loss of investor or proprietary data, interruptions or delays in the operation of our business and damage to our reputation. There can be no assurance that measures Blackstone takes to ensure the integrity of its systems will provide protection, especially because cyberattack techniques used change frequently may persist undetected over extended periods of time, and may not be mitigated in a timely manner to prevent or minimize the impact of an attack on Blackstone or its affiliates.
If unauthorized parties gain access to such information and technology systems, they may be able to steal, publish, delete or modify private and sensitive information, including nonpublic personal information related to shareholders (and their beneficial owners) and material nonpublic information. Although Blackstone has implemented, and its portfolio companies and service providers may implement, various measures to manage risks relating to these types of events, such systems could prove to be inadequate and, if compromised, could become inoperable for extended periods of time, cease to function properly or fail to adequately secure private information. There also have been several publicized cases of ransomware where hackers have requested ransom payments in exchange for not disclosing client or customer information or restoring access to information technology or communications systems. Blackstone does not control the cybersecurity and systems put in place by third-party service providers, and such third-party service providers may have limited indemnification obligations to Blackstone, its portfolio companies and us, each of which could be negatively impacted as a result. Breaches such as those involving covertly introduced malware, impersonation of authorized users and
21
industrial or other espionage may not be identified even with sophisticated prevention and detection systems, potentially resulting in further harm and preventing them from being addressed appropriately. The failure of these systems or of disaster recovery plans for any reason could cause significant interruptions in Blackstone’s, its affiliates’, their portfolio companies’ or our operations and result in a failure to maintain the security, confidentiality or privacy of sensitive data, including personal information relating to shareholders, material nonpublic information and the intellectual property and trade secrets and other sensitive information in the possession of Blackstone and portfolio companies. We, Blackstone or a portfolio company could be required to make a significant investment to remedy the effects of any such failures, harm to their reputations, legal claims that they and their respective affiliates may be subjected to, regulatory action or enforcement arising out of applicable privacy and other laws, adverse publicity and other events that may affect their business and financial performance.
Even if we or Blackstone are not targeted directly, cyberattacks on the U.S. and foreign governments, financial markets, financial institutions, or other businesses, including borrowers, vendors, software creators, cybersecurity service providers, and other third parties with whom we do business, may occur, and such events could disrupt our normal business operations and networks in the future.
In addition, Blackstone operates in businesses that are highly dependent on information systems and technology. The costs related to cyber or other security threats or disruptions may not be fully insured or indemnified by other means. In addition, we could also suffer losses in connection with updates to, or the failure to timely update, our information systems and technology. In addition, we are reliant on third-party service providers for certain aspects of our business, including for administrative services, as well as for certain information systems and technology, including cloud-based services. These third-party service providers could also face ongoing cybersecurity threats and compromises of their systems and as a result, unauthorized individuals could gain access to certain confidential data.
Cybersecurity has become a top priority for regulators around the world. The SEC recently adopted amendments to its rules that relate to cybersecurity risk management, strategy, governance, and incident reporting for entities that are subject to Exchange Act reporting requirements (such as BREIT), and many jurisdictions in which we and Blackstone operate have, or are considering adopting, laws and regulations relating to data privacy, cybersecurity and protection of personal information, including, as examples the General Data Protection Regulation in the European Union that went into effect in May 2018 and the California Consumer Privacy Act that went into effect on January 1, 2020 and was amended by the California Privacy Rights Act, which became effective on January 1, 2023. Virginia, Colorado, Utah and Connecticut recently enacted similar data privacy legislation that went into effect in 2023, and Connecticut, Indiana, Montana, Oregon, Tennessee, and Texas have enacted laws that will go into effect at varying times through 2026. Some jurisdictions have also enacted or proposed laws requiring companies to notify individuals and government agencies of data security breaches involving certain types of personal data.
While we have taken various measures and made significant efforts and investment to ensure that our policies, processes and systems are both robust and compliant with these obligations, our potential liability remains a concern, particularly given the continued and rapid development of privacy laws and regulations around the world, the lack of harmonization of such laws and regulations, and increased criminal and civil enforcement actions and private litigation. We cannot assure you that our data protection efforts and our investment in information technology will prevent significant breakdowns, data leakages, breaches in our systems, or those of our third-party vendors and other contractors and consultants, or other cyber incidents that could have a material adverse effect upon our reputation, business, operations, or financial condition. The techniques used by cyber criminals change frequently, may not be recognized until launched, and can originate from a wide variety of sources. Any inability, or perceived inability, by us to adequately address privacy concerns, or comply with applicable laws, regulations, policies, industry standards and guidance, contractual obligations, or other legal obligations, even if unfounded, could result in significant regulatory and third party liability, increased costs, disruption of our business and operations, and a loss of tenant and investor confidence and other reputational damage. Furthermore, as new privacy-related laws and regulations are implemented, the time and resources needed for us to comply with such laws and regulations continues to increase and become a significant compliance workstream.
Breaches in our security or in the security of third party service providers, whether malicious in nature or through inadvertent transmittal or other loss of data, could potentially jeopardize us and Blackstone, Blackstone’s employees’ or our investors’ or counterparties’ confidential, proprietary and other information processed and stored in, and transmitted through our or Blackstone’s computer systems and networks, or otherwise cause interruptions or malfunctions in our or Blackstone’s, its employees’, our investors’, our counterparties’ or third parties’ business and operations, which could result in significant financial losses, increased costs, disruption in our business, liability to our investors and other counterparties, regulatory intervention and reputational damage. Furthermore, if we or Blackstone fail to comply with the relevant laws and regulations or fail to provide the appropriate regulatory or other notifications of breach in a timely manner, it could result in regulatory investigations and penalties, which could lead to negative publicity and reputational harm and may cause our investors or Blackstone fund investors and clients to lose confidence in the effectiveness of our or Blackstone’s security measures.
22
Blackstone’s technology, data and intellectual property and the technology, data and intellectual property of its portfolio companies are also subject to a heightened risk of theft or compromise to the extent Blackstone and its portfolio companies engage in operations outside the United States, in particular in those jurisdictions that do not have comparable levels of protection of proprietary information and assets such as intellectual property, trademarks, trade secrets, know-how and customer information and records. In addition, Blackstone and its portfolio companies may be required to compromise protections or forego rights to technology, data and intellectual property in order to operate in or access markets in a foreign jurisdiction. Any such direct or indirect compromise of these assets could have a material adverse impact on such businesses.
Finally, we depend on our headquarters in New York City, where most of Blackstone’s personnel involved in our business are located, for the continued operation of our business. A disaster or a disruption in the infrastructure that supports our business, including a disruption involving electronic communications or other services used by us or third parties with whom we conduct business, or directly affecting our headquarters, could have a material adverse impact on our ability to continue to operate our business without interruption. Blackstone’s disaster recovery programs may not be sufficient to mitigate the harm that may result from such a disaster or disruption. In addition, insurance and other safeguards might only partially reimburse us for our losses, if at all.
Compliance with the SEC’s Regulation Best Interest by participating broker-dealers may negatively impact our ability to raise capital in the Offering, which could harm our ability to achieve our investment objectives.
Broker-dealers are required to comply with Regulation Best Interest, which, among other requirements, establishes a new standard of conduct for broker-dealers and their associated persons when making a recommendation of any securities transaction or investment strategy involving securities to a retail customer. The full impact of Regulation Best Interest on participating broker-dealers cannot be determined at this time, and it may negatively impact whether participating broker-dealers and their associated persons recommend the offering to certain retail customers. In particular, under SEC guidance concerning Regulation Best Interest, a broker-dealer recommending an investment in our shares should consider a number of factors, under the care obligation of Regulation Best Interest, including but not limited to cost and complexity of the investment and reasonably available alternatives in determining whether there is a reasonable basis for the recommendation. As a result, high cost, high risk and complex products may be subject to greater scrutiny by broker-dealers. Broker-dealers may recommend a more costly or complex product as long as they have a reasonable basis to believe is in the best interest of a particular retail customer. However, if broker-dealers choose alternatives to our shares, many of which likely exist, such as an investment in listed entities, which may be a reasonable alternative to an investment in us as such investments may feature characteristics like lower cost, nominal commissions at the time of initial purchase, less complexity and lesser or different risks, our ability to raise capital will be adversely affected. If Regulation Best Interest reduces our ability to raise capital in this Offering, it may harm our ability to achieve our objectives.
Risks Related to Investments in Real Estate
Our operating results will be affected by economic and regulatory changes that impact the real estate market in general.
We are subject to risks generally attributable to the ownership of real property, including:
•changes in global, national, regional or local economic, demographic or capital market conditions (including volatility as a result of the ongoing conflict between Russia and Ukraine and more recently, conflict and escalating tensions in the Middle East and the rapidly evolving measures in response and economic impacts resulting from actual or perceived instability in the U.S. banking system);
•future adverse national real estate trends, including increasing vacancy rates, declining rental rates and general deterioration of market conditions;
•changes in supply of or demand for similar properties in a given market or metropolitan area, which could result in rising vacancy rates or decreasing market rental rates;
•vacancies, fluctuations in the average occupancy and room rates for hotel properties or inability to lease space on favorable terms;
•increased competition for properties targeted by our investment strategy;
•bankruptcies, financial difficulties or lease defaults by our tenants, particularly for our tenants with net leases for large properties;
•inflation;
•increases in interest rates and lack of availability of financing; and
•changes in government rules, regulations and fiscal policies, including increases in property taxes, changes in zoning laws, limitations on rental rates, and increasing costs to comply with environmental laws.
All of these factors are beyond our control. Any negative changes in these factors could affect our performance and our ability to meet our obligations and make distributions to stockholders.
23
Our success is dependent on general market and economic conditions.
The real estate industry generally and the success of our investment activities in particular will both be affected by global and national economic and market conditions generally and by the local economic conditions where our properties are located. These factors may affect the level and volatility of real estate prices, which could impair our profitability or result in losses. In addition, general fluctuations in the market prices of securities, interest rates and inflation may affect our investment opportunities and the value of our investments. Blackstone’s financial condition may be adversely affected by a significant economic downturn and it may be subject to legal, regulatory, reputational and other unforeseen risks that could have a material adverse effect on Blackstone’s businesses and operations (including the Adviser).
A depression, recession or slowdown in the U.S. real estate market or one or more regional real estate markets, and to a lesser extent, the global economy (or any particular segment thereof) would have a pronounced impact on us, the value of our assets and our profitability, impede the ability of our assets to perform under or refinance their existing obligations, and impair our ability to effectively deploy our capital or realize upon investments on favorable terms. We would also be affected by any overall weakening of, or disruptions in, the financial markets. Any of the foregoing events could result in substantial losses to our business, which losses will likely be exacerbated by the presence of leverage in our capital structure or our investments’ capital structures.
Market disruptions in a single country could cause a worsening of conditions on a regional and even global level, and economic problems in a single country are increasingly affecting other markets and economies. A continuation of this trend could result in problems in one country adversely affecting regional and even global economic conditions and markets.
The U.S. government has imposed tariffs on certain foreign goods, including steel and aluminum and has indicated a willingness to impose tariffs on imports of other products. Some foreign governments, including China, have instituted retaliatory tariffs on certain U.S. goods and have indicated a willingness to impose additional tariffs on U.S. products. Global trade disruption, significant introductions of trade barriers and bilateral trade frictions, together with any future downturns in the global economy resulting therefrom, could adversely affect our performance.
The failure of certain financial institutions, namely banks, may increase the possibility of a sustained deterioration of financial market
liquidity, or illiquidity at clearing, cash management and/or custodial financial institutions. The failure of a bank (or banks) with
which we and/or our tenants have a commercial relationship could adversely affect, among other things, our or our tenant’s ability to
access deposits or borrow from financial institutions on favorable terms.
Rising inflation may adversely affect our financial condition and results of operations.
Inflation in the United States remained elevated throughout 2022 and 2023 and may continue to remain high in the future. While inflation has shown signs of moderating, it remains uncertain whether substantial inflation in the United States will be sustained over an extended period of time or have a significant effect on the United States or other economies. Rising inflation could have an adverse impact on our operating costs, including any floating rate mortgages, credit facilities, property operating expenses and general and administrative expenses, as these costs could increase at a rate higher than our rental and other revenue. Inflation could also have an adverse effect on consumer spending, which could impact our tenants’ revenues and, in turn, our percentage rents, where applicable.
In addition, leases of long-term duration or which include renewal options that specify a maximum rate increase may result in below-market lease rates over time if we do not accurately estimate inflation or market lease rates. Provisions of our leases designed to mitigate the risk of inflation and unexpected increases in market lease rates, such as periodic rental increases, may not adequately protect us from the impact of inflation or unexpected increases in market lease rates. If we are subject to below-market lease rates on a significant number of our properties pursuant to long-term leases and our operating and other expenses are increasing faster than anticipated, our business, financial condition, results of operations, cash flows or our ability to satisfy our debt service obligations or to pay distributions on our common stock could be materially adversely affected.
Financial regulatory changes in the United States could adversely affect our business.
The financial services industry continues to be the subject of heightened regulatory scrutiny in the United States. There has been active debate over the appropriate extent of regulation and oversight of investment funds and their managers. We may be adversely affected as a result of new or revised regulations imposed by the SEC or other U.S. governmental regulatory authorities or self-regulatory organizations that supervise the financial markets. We also may be adversely affected by changes in the interpretation or enforcement of existing laws and regulations by these governmental authorities and self-regulatory organizations. Further, new regulations or interpretations of existing laws may result in enhanced disclosure obligations, including with respect to climate change or environmental, social and governance factors, which could negatively affect us and materially increase our regulatory burden. Increased regulations generally increase our costs, and we could continue to experience higher costs if new laws require us to spend more time or buy new technology to comply effectively.
24
Any changes in the regulatory framework applicable to our business, including the changes described above, may impose additional compliance and other costs, increase regulatory investigations of the investment activities of our funds, require the attention of our senior management, affect the manner in which we conduct our business and adversely affect our profitability. The full extent of the impact on us of any new laws, regulations or initiatives that may be proposed is impossible to determine.
We, the Adviser, the Dealer Manager and respective affiliates are subject to regulatory oversight, which could negatively impact our operations, cash flow or financial condition, impose additional costs on us or otherwise adversely affect our business.
Our business and the businesses of the Adviser, the Dealer Manager and their affiliates are subject to extensive regulation, including periodic examinations, inquiries and investigations which may result in examinations, enforcement and other proceedings, by governmental agencies and self-regulatory organizations in the jurisdictions in which we and they operate around the world, including the SEC and various other U.S. federal, state and local agencies. These authorities have regulatory powers dealing with many aspects of financial services, including the authority to grant, and in specific circumstances to cancel, permissions to carry on particular activities.
We, the Adviser, the Dealer Manager and their respective affiliates have received, and may in the future receive, requests for information, inquiries and informal or formal investigations or subpoenas from such regulators from time to time in connection with such inquiries and proceedings and otherwise in the ordinary course of business. These requests could relate to a broad range of matters, including specific practices of our business, the Adviser, the Dealer Manager, our investments or other investments the Adviser or its affiliates make on behalf of their clients, potential conflicts of interest between us and the Adviser, Dealer Manager or their affiliates, or industry wide practices. SEC actions and initiatives can have an adverse effect on our financial results, including as a result of the imposition of a sanction, a limitation on our, Blackstone’s or our personnel’s activities, or changing our historic practices. Any adverse publicity relating to an investigation, proceeding or imposition of these sanctions could harm our or Blackstone’s reputation and have an adverse effect on our future fundraising or operations. The costs of responding to legal or regulatory information requests, any increased reporting, registration and compliance requirements will be borne by us in the form of legal or other expenses, litigation, regulatory proceedings or penalties, may divert the attention of our management, may cause negative publicity that adversely affects investor sentiment, and may place us at a competitive disadvantage, including to the extent that we, the Adviser, the Dealer Manager or any of their respective affiliates are required to disclose sensitive business information or alter business practices.
The long-term macroeconomic effects of the COVID-19 pandemic and any future pandemic or epidemic could have an adverse impact on our financial performance and results of operations.
Outbreaks of contagious disease, including COVID-19, or other adverse public health developments in the U.S. or worldwide could
have a material adverse effect on our business, financial condition and results of operations. While many of the direct impacts of the COVID-19 pandemic have eased, the longer-term macroeconomic effects on global supply chains, inflation, labor shortages and wage increases continue to impact many industries, including certain of our investments. Moreover, with the potential for new strains of existing viruses to emerge or other pandemics or epidemics, governments and businesses may re-impose aggressive measures to help slow its spread in the future.
Long-term macroeconomic effects from a pandemic or epidemic, including from supply and labor shortages, workforce reductions in response to challenging economic conditions, or shifts in demand for real estate may have an adverse impact on our portfolio which includes office, hotel, and other asset classes that are particularly negatively impacted by such supply and labor issues. The impact of such long-term effects may disproportionally affect certain asset classes and geographic areas. For example, many businesses increasingly permit employees to work from home and make use of flexible work schedules, open workplaces, videoconferences and teleconferences, which could have a longer-term impact on the demand for both office space and hotel rooms for business travel, which could adversely affect our investments in office or hotel properties. While we believe that our portfolio is well-positioned for the post-COVID environment, there can be no assurance that we will realize entire value of certain investments. For more information on the concentration of our portfolio by property type and geographic region, see Item 7. “Management’s Discussion and Analysis of Financial Condition and Results of Operations.” The full extent of the impact and effects of COVID-19, and any future pandemics or epidemics, will depend on future developments, including, among other factors, how rapidly variants develop, availability, acceptance and effectiveness of vaccines along with related travel advisories, quarantines and restrictions, the recovery time of the disrupted supply chains and industries, the impact of labor market interruptions, the impact of government interventions, and uncertainty with respect to the duration of the global economic slowdown. COVID-19, or any future pandemics or epidemics, and resulting impacts on the financial, economic and capital markets environment, and future developments in these and other areas present uncertainty and risk with respect to our performance, results of operations and ability to continue to pay distributions.
25
We are subject to additional risks from our non-U.S. investments.
We have in the past and may in the future invest in real estate located outside of the United States and real estate debt issued in, and/or backed by real estate in, countries outside the United States. Non-U.S. real estate and real estate-related investments involve certain factors not typically associated with investing in real estate and real estate-related investments in the United States, including risks relating to (i) currency exchange matters, including fluctuations in the rate of exchange between the U.S. dollar and the various non-U.S. currencies in which such investments are denominated, and costs associated with conversion of investment principal and income from one currency into another; (ii) differences in conventions relating to documentation, settlement, corporate actions, stakeholder rights and other matters; (iii) differences between U.S. and non-U.S. real estate markets, including potential price volatility in and relative illiquidity of some non-U.S. markets; (iv) the absence of uniform accounting, auditing and financial reporting standards, practices and disclosure requirements and differences in government supervision and regulation; (v) certain economic, social and political risks, including potential exchange-control regulations, potential restrictions on non-U.S. investment and repatriation of capital, the risks associated with political, economic or social instability, including the risk of sovereign defaults, regulatory change, and the possibility of expropriation or confiscatory taxation or the imposition of withholding or other taxes on dividends, interest, capital gains, other income or gross sale or disposition proceeds, and adverse economic and political developments; (vi) the possible imposition of non-U.S. taxes on income and gains and gross sales or other proceeds recognized with respect to such investments; (vii) differing and potentially less well-developed or well-tested corporate laws regarding stakeholder rights, creditors’ rights (including the rights of secured parties), fiduciary duties and the protection of investors; (viii) different laws and regulations including differences in the legal and regulatory environment or enhanced legal and regulatory compliance; (ix) political hostility to investments by foreign investors; (x) war or other hostilities, and (xi) less publicly available information. Furthermore, while we may have the capacity, but not the obligation, to mitigate such additional risks, including through the utilization of certain foreign exchange hedging instruments, there is no guarantee that we will be successful in mitigating such risks and in turn may introduce additional risks and expenses linked to such efforts.
Our portfolio is currently concentrated in certain industries and geographies and may in the future be concentrated in a limited number of industries, geographies or investments.
Our portfolio may be heavily concentrated at any time in only a limited number of industries, geographies or investments, and, as a consequence, our aggregate return may be substantially affected by the unfavorable performance of such investments. Currently, our portfolio is heavily concentrated in rental housing and industrial assets and geographically concentrated in the southern and western regions of the United States, and in particular Atlanta, Georgia and Las Vegas, Nevada. Concentration of our investments in a particular type of asset or geography, our portfolio makes us more susceptible to fluctuations in value resulting from adverse economic or business conditions affecting that particular type of asset or geography. Our concentration in Las Vegas exposes us to risks related to the economic health and other factors unique to that city, which is in turn largely reliant on the gaming and tourism industries. See “—Our investments in real estate associated with gaming facilities will be impacted by the risks associated with the gaming industry.” For investments that the Adviser intends to finance (directly or by selling assets), there is a risk that such financing may not be completed, which could result in us holding a larger percentage of our assets in a single investment and asset type than desired. Investors have no assurance as to the degree of diversification in our investments, either by geographic region or asset type.
We may change our investment and operational policies without stockholder consent.
Except for changes to the investment restrictions contained in our charter, which require stockholder consent to amend, we may change our investment and operational policies, including our policies with respect to investments, operations, indebtedness, capitalization and distributions, at any time without the consent of our stockholders, which could result in our making investments that are different from, and possibly riskier or more highly leveraged than, the types of investments described in the Prospectus. Our board of directors also approved very broad investment guidelines with which we must comply, but these guidelines provide the Adviser with broad discretion and can be changed by our board of directors. A change in our investment strategy may, among other things, increase our exposure to real estate market fluctuations, default risk and interest rate risk, all of which could materially affect our results of operations and financial condition.
We may have difficulty selling our properties, which may limit our flexibility and ability to pay distributions.
Because real estate investments are relatively illiquid, it could be difficult for us to promptly sell one or more of our properties on favorable terms or at all. Additionally, we have in the past and may in the future agree to lock-out or other provisions when we acquire a property that materially restrict us from selling such property or our interest in such property for a period of time. This may limit our ability to change our portfolio quickly in response to adverse changes in the performance of any such property or economic or market trends or to create liquidity to satisfy repurchase requests or maintain distribution levels. In addition, U.S. federal tax laws that impose a 100% excise tax on gains from sales of dealer property by a REIT (generally, property held-for-sale, rather than investment) could limit our ability to sell properties and may affect our ability to sell properties without adversely affecting returns to our stockholders. These restrictions could adversely affect our results of operations and financial condition.
26
We face risks associated with property acquisitions.
We acquire properties and portfolios of properties, including large portfolios that could result in changes to our capital structure. Our acquisition activities and their success are subject to the following risks:
•we may be unable to complete an acquisition after making a non-refundable deposit or guarantee and incurring certain other acquisition-related costs;
•we may be unable to obtain financing for acquisitions on commercially reasonable terms or at all;
•acquired properties may fail to perform as expected;
•acquired properties may be located in new markets in which we may face risks associated with a lack of market knowledge or understanding of the local economy, lack of business relationships in the area and unfamiliarity with local governmental and permitting procedures; and
•we may be unable to quickly and efficiently integrate new acquisitions, particularly acquisitions of portfolios of properties, into our existing operations.
In addition, while we will invest primarily in stabilized, income-generating real estate, we may also acquire assets that require some amount of capital investment in order to be renovated or repositioned. These investments are generally subject to higher risk of loss than investments in stabilized real estate and there is no guarantee that any renovation or repositioning will be successful, or that the actual costs will not be greater than our estimates.
The sale and disposition of real properties carry certain litigation risks at the property level that may reduce our profitability and the return on your investment.
The acquisition, ownership and disposition of real properties carry certain specific litigation risks. Litigation may be commenced with respect to a property acquired by us in relation to activities that took place prior to our acquisition of such property. In addition, at the time of disposition of an individual property, a potential buyer may claim that it should have been afforded the opportunity to purchase the asset or alternatively that such potential buyer should be awarded due diligence expenses incurred or statutory damages for misrepresentation relating to disclosure made, if such buyer is passed over in favor of another as part of our efforts to maximize sale proceeds. Similarly, successful buyers may later sue us under various damage theories, including those sounding in tort, for losses associated with latent defects or other problems not uncovered in due diligence.
Competition for investment opportunities may reduce our profitability and the return on your investment.
We face competition from various entities for investment opportunities in properties, including other REITs, real estate operating companies, pension funds, insurance companies, investment funds and companies, partnerships and developers, some of which are likely a source of reasonable alternatives under Regulation Best Interest. In addition to third-party competitors, other programs sponsored by the Adviser and its affiliates, particularly those with investment strategies that overlap with ours may seek investment opportunities in accordance with Blackstone’s prevailing policies and procedures. Some of these entities may have greater access to capital to acquire properties than we have. Competition from these entities may reduce the number of suitable investment opportunities offered to us or increase the bargaining power of property owners seeking to sell. Additionally, disruptions and dislocations in the credit markets could have a material impact on the cost and availability of debt to finance real estate acquisitions, which is a key component of our acquisition strategy. The lack of available debt on reasonable terms or at all could result in a further reduction of suitable investment opportunities and create a competitive advantage for other entities that have greater financial resources than we do. In addition, over the past several years, a number of real estate funds and publicly traded and non-traded REITs have been formed and others have been consolidated (and many such existing funds have grown in size) for the purpose of investing in real estate and/or real estate-related assets. Additional real estate funds, vehicles and REITs with similar investment objectives are expected to be formed in the future by other unrelated parties and further consolidations may occur (resulting in larger funds and vehicles). Consequently, it is expected that competition for appropriate investment opportunities would reduce the number of investment opportunities available to us and adversely affect the terms, including price, upon which investments can be made. This competition may cause us to acquire properties and other investments at higher prices or by using less-than-ideal capital structures, and in such case our returns will be lower and the value of our assets may not appreciate or may decrease significantly below the amount we paid for such assets. If such events occur, you may experience a lower return on your investment.
27
We may make a substantial amount of joint venture investments, including with Blackstone affiliates. Joint venture investments could be adversely affected by our lack of sole decision-making authority, our reliance on the financial condition of our joint venture partners and disputes between us and our joint venture partners.
We have made joint venture investments with third parties and Blackstone affiliates and we expect to make additional joint venture investments in the future. We have entered into, and expect to continue to enter into, joint ventures as part of an acquisition with the seller of the properties. Generally, we expect the level of control we have with respect to any joint venture will correspond to our
economic interest in such joint venture, but this may not always be the case. We may acquire non-controlling interests or shared control interests in joint ventures. Even if we have some control in a joint venture, we would not be in a position to exercise sole decision-making authority regarding the joint venture. Investments in joint ventures may, under certain circumstances, involve risks not present were another party not involved, including the possibility that joint venture partners might become bankrupt or fail to fund their required capital contributions. Joint venture partners may have economic or other business interests or goals that are inconsistent with our business interests or goals, and may be in a position to take actions contrary to our policies or objectives. Such investments may also have the potential risk of impasses on decisions, such as a sale, because neither we nor the joint venture partner would have full control over the joint venture. Disputes between us and joint venture partners may result in litigation or arbitration that would increase our expenses and prevent our officers and directors from focusing their time and effort on our business. Consequently, actions by or disputes with joint venture partners might result in subjecting properties owned by the joint venture to additional risk. In some cases, our joint venture partner may be entitled to property management fees, promote or other incentive fee payments as part of the arrangement of the joint venture. In addition, we may in certain circumstances be liable for the actions of our joint venture partners.
In addition, in connection with investments in which we participate alongside any Other Blackstone Accounts, the Adviser may decline to exercise, or delegate to a third party, certain control, foreclosure and similar governance rights relating to such shared investments for legal, tax, regulatory or other reasons. There is no guarantee that we will be able to co-invest with any Other Blackstone Account in the future. In addition, we may participate in follow-on investments in the joint ventures with Other Blackstone Accounts in which the Other Blackstone Accounts may invest less than their pro rata share or may not participate at all or vice versa. We will not participate in joint ventures in which we do not have or share control to the extent that we believe such participation would potentially threaten our status as a non-investment company exempt from the Investment Company Act. This may prevent us from receiving an allocation with respect to certain investment opportunities that are suitable for both us and one or more Other Blackstone Accounts.
If we have a right of first refusal to buy out a joint venture partner, we may be unable to finance such a buy-out if it becomes exercisable or we are required to purchase such interest at a time when it would not otherwise be in our best interest to do so. If our interest is subject to a buy/sell right, we may not have sufficient cash, available borrowing capacity or other capital resources to allow us to elect to purchase an interest of a joint venture partner subject to the buy/sell right, in which case we may be forced to sell our interest as the result of the exercise of such right when we would otherwise prefer to keep our interest. In some joint ventures we may be obligated to buy all or a portion of our joint venture partner’s interest in connection with a crystallization event, and we may be unable to finance such a buy-out when such crystallization event occurs, which may result in interest or other penalties accruing on the purchase price. If we buy our joint venture partner’s interest we will have increased exposure in the underlying investment. The price we use to buy our joint venture partner’s interest or sell our interest is typically determined by negotiations between us and our joint venture partner and there is no assurance that such price will be representative of the value of the underlying property or equal to our then-current valuation of our interest in the joint venture that is used to calculate our NAV. Finally, we may not be able to sell our interest in a joint venture if we desire to exit the venture for any reason or if our interest is likewise subject to a right of first refusal of our joint venture partner, our ability to sell such interest may be adversely impacted by such right. Joint ownership arrangements with Blackstone affiliates may also entail further conflicts of interest. Joint venture partners may receive ongoing fees in connection with providing service to the joint venture or its properties, including promote fees, beyond their equity investment, which would reduce the amount of our economic interest.
Some additional risks and conflicts related to our joint venture investments (including joint venture investments with Blackstone affiliates) include:
•the joint venture partner could have economic or other interests that are inconsistent with or different from our interests, including interests relating to the financing, management, governance, operation, leasing or sale of the assets purchased by such joint venture;
•our joint venture partners may receive ongoing fees from our joint ventures, including promote payments and potential buyouts of their equity investments, all of which may reduce amounts otherwise payable to us;
28
•tax, Investment Company Act and other regulatory requirements applicable to the joint venture partner could cause it to want to take actions contrary to our interests. For example, if the joint venture partner conducts its operations so as to not be an investment company by complying with the requirements under Section 3(a)(1)(C) of the Investment Company Act or seeks to have some or all of its investments in majority-owned subsidiaries that qualify for the exemption pursuant to Section 3(c)(5)(C) of the Investment Company Act, such joint venture partner could seek to dispose of or continue to hold joint venture investments for reasons other than the business case of particular assets, which could be at odds with us;
•the joint venture partner could have joint control or joint governance of the joint venture even in cases where its economic stake in the joint venture is significantly less than ours;
•under the joint venture arrangement, there will be cases where neither we nor the joint venture partner will be in a position to unilaterally control the joint venture, and deadlocks may occur. Such deadlocks could adversely impact the operations and profitability of the joint venture, including as a result of the inability of the joint venture to act quickly in connection with a potential acquisition or disposition. In addition, depending on the governance structure of such joint venture partner, decisions of such vehicle may be subject to approval by individuals who are independent of Blackstone;
•under the joint venture arrangement, we and the joint venture partner may have a buy/sell right and, as a result of an impasse that triggers the exercise of such right, we could be forced to sell our investment in the joint venture, or buy the joint venture partner’s share of the joint venture at a time when it would not otherwise be in our best interest to do so;
•if the joint venture partner charges fees or incentive allocation to the joint venture arrangement, the joint venture partner could have an incentive to hold assets longer or otherwise behave to maximize fees and incentive allocation paid, even when doing so is not in our best interest;
•the joint venture partner could have authority to remove the Blackstone affiliated investment manager of the joint venture. If such removal were to occur, we would be joint venture partners with a third-party manager, in which case it could be significantly more difficult for us to implement our investment objective with respect to any of our investments held through such joint ventures;
•our participation in investments in which a joint venture partner participates will be less than what our participation would have been had such joint venture partner not participated, and because there may be no limit on the amount of capital that such joint venture partner can raise, the degree of our participation in such investments may decrease over time;
•under the joint venture arrangement, we and the joint venture partner could each have preemptive rights in respect of future issuances by the joint venture, which could limit a joint venture’s ability to attract new third-party capital;
•under the joint venture arrangement, a removal of the Adviser could trigger change of control restrictions that may include buy/sell rights like those described above, a loss of governance rights in the joint venture or other adverse consequences;
•under the joint venture arrangement, we and the joint venture partner could be subject to lock-ups, which could prevent us from disposing of our interests in the joint venture at a time it determines it would be advantageous to exit; and
•the joint venture partner could have a right of first offer, tag-along rights, drag-along rights, consent rights or other similar rights in respect of any transfers of the ownership interests in the joint venture to third parties, which could have the effect of making such transfers more complicated or limiting or delaying us from selling our interest in the applicable investment.
Furthermore, we may have conflicting fiduciary obligations when we acquire properties with our affiliates or other related entities; as a result, in any such transaction we may not have the benefit of arm’s-length negotiations of the type normally conducted between unrelated parties.
29
Acquiring or attempting to acquire multiple properties in a single transaction may adversely affect our operations.
We have in the past acquired, and may in the future, acquire multiple properties in a single transaction. Portfolio acquisitions typically are more complex and expensive than single-property acquisitions, and the risk that a multiple-property acquisition does not close may be greater than in a single-property acquisition. Portfolio acquisitions may also result in us owning investments in geographically dispersed markets, placing additional demands on the Adviser in managing the properties in the portfolio. In addition, a seller may require that a group of properties be purchased as a package and/or also include certain additional investments or transactions even though, were it not part of the overall transaction, we may not want to purchase one or more properties included in such portfolio or participate in additional investments or transactions. In these situations, if we are unable to identify another person or entity to acquire the unwanted properties or investments, or if the seller imposes a lock-out period or other restriction on a subsequent sale, we may be required to operate such properties or attempt to dispose of such properties or investments (if not subject to a lock-out period). We have also shared in the past and may in the future share the acquisition of large portfolios of properties with our affiliates, which can result in conflicts of interest, including as to the allocation of properties within the portfolio and the prices attributable to such properties. See “Risks Related to Conflicts of Interest—We may invest in joint ventures with Other Blackstone Accounts or divide a pool of investments among us and Other Blackstone Accounts.” It may also be difficult for the Adviser to fully analyze each property in a large portfolio, increasing the risk that properties do not perform as anticipated. We also may be required to accumulate a large amount of cash to fund such acquisitions. We would expect the returns that we earn on such cash to be less than the returns on investments in real property. The risks related to acquiring multiple properties in a single transaction may be more pronounced in SFR acquisitions, where numerous SFR properties each with relatively small values individually are acquired in large portfolio, making it difficult for the Adviser to analyze individual properties. Therefore, acquiring multiple properties in a single transaction may reduce the overall yield on our portfolio.
In the event we obtain options to acquire properties, we may lose the amount paid for such options whether or not the underlying property is purchased.
We may obtain options to acquire certain properties. The amount paid for an option, if any, is normally surrendered if the property is not purchased and may or may not be credited against the purchase price if the property is purchased. Any unreturned option payments will reduce the amount of cash available for further investments or distributions to our stockholders.
The due diligence process that the Adviser undertakes in regard to investment opportunities may not reveal all facts that may be
relevant in connection with an investment, and if the Adviser incorrectly evaluates the risks of our investments, we may experience
losses.
Before making investments for us, the Adviser conducts due diligence that it deems reasonable and appropriate based on the facts and circumstances relevant to each potential investment. When conducting due diligence, the Adviser may be required to evaluate important and complex issues, including but not limited to those related to business, financial, tax, accounting, environmental, ESG, legal, and regulatory and macroeconomic trends. With respect to ESG, the nature and scope of the Adviser’s diligence will vary based on the investment, but may include a review of, among other things: energy management, air and water pollution, land contamination, human capital management, human rights, employee health and safety, accounting standards and bribery and corruption. Outside consultants, legal advisors, accountants and investment banks may be involved in the due diligence process in varying degrees depending on the type of potential investment. The due diligence investigation with respect to any investment opportunity may not reveal or highlight all relevant facts (including fraud) or risks that may be necessary or helpful in evaluating such investment opportunity, and the Adviser may not identify or foresee future developments that could have a material adverse effect on an investment. In addition, selecting and evaluating material ESG factors is subjective by nature, and there is no guarantee that the criteria utilized or judgment exercised by the Adviser or a third-party ESG specialist (if any) will reflect the beliefs, values, internal policies or preferred practices of any particular investor or align with the beliefs or values or preferred practices of other asset managers or with market trends. The materiality of sustainability risks and impacts on an individual potential investment or portfolio as a whole are dependent on many factors, including the relevant industry, country, asset class and investment style. The Adviser’s loss estimates may not prove accurate, as actual results may vary from estimates. If the Adviser underestimates the asset-level losses relative to the price we pay for a particular investment, we may be required to recognize an impairment and/or realize losses with respect to such investment.
Moreover, investment analyses and decisions by the Adviser may frequently be required to be undertaken on an expedited
basis to take advantage of investment opportunities. In such cases, the information available to the Adviser at the time of making an
investment decision may be limited, and they may not have access to detailed information regarding such investment. Further, some matters covered by the Adviser’s diligence, such as ESG, are continuously evolving and the Adviser may not accurately or fully anticipate such evolution. For instance, the Adviser’s ESG framework does not represent a universally recognized standard for assessing ESG considerations as there are different frameworks and methodologies being implemented by other asset managers, in addition to numerous international initiatives on the subject.
30
There can be no assurance that the Adviser will be able to detect or prevent irregular accounting, employee misconduct or other fraudulent practices or material misstatements or omissions during the due diligence phase or during our efforts to monitor and disclose information about the investment on an ongoing basis or that any risk management procedures implemented by us will be adequate.
When conducting due diligence and making an assessment regarding an investment, the Adviser will rely on the resources available to it, including information provided or reported by the seller of the investment and, in some circumstances, third-party investigations. The due diligence investigation that the Adviser carries out with respect to any investment opportunity may not reveal or highlight all relevant facts that may be necessary or helpful in evaluating such investment opportunity. Moreover, such an investigation will not necessarily result in the investment being successful. Conduct occurring at the portfolio property, even activities that occurred prior to our investment therein, could have an adverse impact us.
In the event of fraud by the seller of any portfolio property, we may suffer a partial or total loss of capital invested in that property. An additional concern is the possibility of material misrepresentation or omission on the part of the seller. Such inaccuracy or incompleteness may adversely affect the value of our investments in such portfolio property. We will rely upon the accuracy and completeness of representations made by sellers of portfolio properties in the due diligence process to the extent reasonable when we make our investments, but cannot guarantee such accuracy or completeness. In addition, we rely on information, including financial information and non-GAAP metrics, provided by sellers of our investments for disclosure to our investors about potential acquisitions or current assets owned by us. Accordingly, although we believe such information to be accurate, such information cannot be independently verified by the Adviser, and in some cases such information has not been independently reviewed or audited while under our ownership or control or at all. We cannot assure you that that the financial statements or metrics of properties we have acquired or will acquire would not be materially different if such statements or metrics had been independently audited or reviewed.
Consultants, legal advisors, appraisers, accountants, investment banks and other third parties may be involved in the due diligence process and/or the ongoing operation of our portfolio properties to varying degrees depending on the type of investment. For example, certain asset management and finance functions, such as data entry relating to a portfolio property, may be outsourced to a third-party service provider whose fees and expenses will be borne by such portfolio property or us. Such involvement of third-party advisors or consultants may present a number of risks primarily relating to our reduced control of the functions that are outsourced.
We may be subject to expenses and liabilities related to employees of certain portfolio entities owned by us.
We may be subject to expenses and liabilities related to employees of certain portfolio entities owned by us. For example, we acquired the management teams as part of our acquisitions of Simply Self Storage, American Campus Communities, April Housing and Home Partners of America, and we may acquire other management teams as part of transactions in the future. Such expenses and liabilities include compensation, overhead and other administrative costs, as well as potential liabilities that are commonly faced by employers, such as workers’ disability and compensation claims, potential labor disputes, and other employee-related liabilities and grievances. We may also be subject to other operational risks from such employees, including cybersecurity risks or as a result of employee error or malfeasance. In addition, we may encounter unforeseen costs and expenses associated with acquiring such portfolio entities and such expenses may have an adverse effect on our results of operations.
We rely on property managers to operate our properties and leasing agents to lease vacancies in our properties.
The Adviser hires property managers to manage our properties and leasing agents to lease vacancies in our properties. These property managers may be our affiliates or partners in joint ventures that we enter into. We may also use portfolio entities owned by us to provide these property management, leasing and similar services. The property managers have significant decision-making authority with respect to the management of our properties. We are particularly dependent on property managers of any hospitality and leisure properties we invest in. In cases where we use third party property managers, our ability to direct and control how our properties are managed on a day-to-day basis may be limited. Thus, the success of our business may depend in large part on the ability of our property managers to manage the day-to-day operations and the ability of our leasing agents to lease vacancies in our properties. In cases where we use one of our portfolio entities to provide property management services, we will directly incur the expenses of property management and the other costs and obligations associated with operating the portfolio entity, including the compensation of our portfolio entity employees. Any adversity experienced by, or problems in our relationship with, our property managers or leasing agents could adversely impact the operation and profitability of our properties.
31
We depend on tenants for our revenue, and therefore our revenue is dependent on the success and economic viability of our tenants. Our reliance on single or significant tenants in certain buildings may decrease our ability to lease vacated space and could adversely affect our income, performance, operations and ability to pay distributions.
Rental income from real property, directly or indirectly, constitutes a significant portion of our income. Delays in collecting accounts receivable from tenants could adversely affect our cash flows and financial condition. In addition, the inability of a single major tenant or a number of smaller tenants to meet their rental obligations would adversely affect our income. Therefore, our financial success is indirectly dependent on the success of the businesses operated by the tenants in our properties or in the properties securing debts we may own. The weakening of the financial condition of or the bankruptcy or insolvency of a significant tenant or a number of smaller tenants and vacancies caused by defaults of tenants or the expiration of leases may adversely affect our operations, performance and our ability to pay distributions.
Generally, under U.S. bankruptcy law, a debtor tenant has 120 days to exercise the option of assuming or rejecting the obligations under any unexpired lease for nonresidential real property, which period may be extended once by the bankruptcy court for an additional 90 days. If the tenant assumes its lease, the tenant must cure all defaults under the lease and may be required to provide adequate assurance of its future performance under the lease. If the tenant rejects the lease, we will have a claim against the tenant’s bankruptcy estate. Although rent owing for the period between filing for bankruptcy and rejection of the lease may be afforded administrative expense priority and paid in full, pre-bankruptcy arrears and amounts owing under the remaining term of the lease will be afforded general unsecured claim status (absent collateral securing the claim). Moreover, amounts owing under the remaining term of the lease will be capped. Other than equity and subordinated claims, general unsecured claims are the last claims paid in a bankruptcy and therefore funds may not be available to pay such claims in full.
Some of our properties may be leased to a single or significant tenant and, accordingly, may be suited to the particular or unique needs of such tenant. We may have difficulty replacing such a tenant if the floor plan of the vacant space limits the types of businesses that can use the space without major renovation. In addition, the resale value of the property could be diminished because the market value of a particular property will depend principally upon the value of the leases of such property.
Similarly, certain of our other properties, including certain net leases, industrial warehouses and student housing properties, are leased out to single tenants or tenants that are otherwise reliant on a single enterprise to remain in business and our hotel properties are generally operated by a single operator. Adverse impacts to such tenants, businesses or operators, including as a result of changes in market or economic conditions, natural disasters, outbreaks of an infectious disease, pandemic or any other serious public health concern, political events or other factors that may impact the operation of these properties, may have negative effects on our business and financial results. As a result, such tenants or operators have been, and may in the future be, required to suspend operations at our properties for what could be an extended period of time. Further, if such tenants default under their leases or such operators are unable to operate our properties, we may not be able to promptly enter into a new lease or operating arrangement for such properties, rental rates or other terms under any new leases or operating arrangement may be less favorable than the terms of the current lease or operating arrangement or we may be required to make capital improvements to such properties for a new tenant or operator, any of which could adversely impact our operating results.
We may be unable to renew leases as leases expire.
We may not be able to lease properties that are vacant or become vacant because a tenant decides not to renew its lease or by the continued default of a tenant under its lease. In addition, certain of the properties we acquire may have some level of vacancy at the time of acquisition. Certain other properties may be specifically suited to the particular needs of a tenant and may become vacant after we acquire them. Even if a tenant renews its lease or we enter into a lease with a new tenant, the terms of the new lease may be less favorable than the terms of the old lease. In addition, the resale value of the property could be diminished because the market value may depend principally upon the value of the property’s leases. If we are unable to promptly renew or enter into new leases, or if the rental rates are lower than expected, our results of operations and financial condition will be adversely affected. For example, following the termination or expiration of a tenant’s lease there may be a period of time before we will begin receiving rental payments under a replacement lease. During that period, we will continue to bear fixed expenses such as interest, real estate taxes, maintenance, security, repairs and other operating expenses. In addition, declining economic conditions may impair our ability to attract replacement tenants and achieve rental rates equal to or greater than the rents paid under previous leases. Increased competition for tenants may require us to make capital improvements to properties which would not have otherwise been planned. Any unbudgeted capital improvements that we undertake may divert cash that would otherwise be available for distributions or for satisfying repurchase requests. Ultimately, to the extent that we are unable to renew leases or re-let space as leases expire, decreased cash flow from tenants will result, which could adversely impact our operating results.
32
We may be required to expend funds to correct defects or to make improvements before a tenant can be found for a property at an attractive lease rate or an investment in a property can be sold. No assurance can be given that we will have funds available to correct those defects or to make those improvements. In acquiring a property, we may agree to lock-out provisions that materially restrict us from selling that property for a period of time or impose other restrictions, such as a limitation on the amount of debt that can be placed on that property. These factors and others that could impede our ability to respond to adverse changes in the performance of our properties could significantly affect our financial condition and operating results.
Leases with retail properties’ tenants may restrict us from re-leasing space.
Most leases with retail tenants contain provisions giving the particular tenant the exclusive right to sell particular types of merchandise or provide specific types of services within the particular retail center. These provisions may limit the number and types of prospective tenants interested in leasing space in a particular retail property.
Our properties face significant competition.
We face significant competition from owners, operators and developers of properties. Substantially all of our properties will face competition from similar properties in the same market. This competition may affect our ability to attract and retain tenants and may reduce the rents we are able to charge. These competing properties may have vacancy rates higher than our properties, which may result in their owners being willing to lease available space at lower prices than the space in our properties. If one of our properties were to lose an anchor tenant, this could impact the leases of other tenants, who may be able to modify or terminate their leases as a result.
Our properties may be leased at below-market rates under long-term leases.
We have in the past sought, and may in the future seek, to negotiate longer-term leases to reduce the cash flow volatility associated with lease rollovers, provided that contractual rent increases are generally included. In addition, where appropriate, we will seek leases that provide for operating expenses, or expense increases, to be paid by the tenants. These leases may allow tenants to renew the lease with pre-defined rate increases. If we do not accurately judge the potential for increases in market rental rates, or if our negotiated increases provide for a discount to then-current market rental rates (in exchange for lower volatility), we may set the rental rates of these long-term leases at levels such that even after contractual rental increases, the resulting rental rates are less than then-current market rental rates. Further, we may be unable to terminate those leases or adjust the rent to then-prevailing market rates. As a result, our income and distributions to our stockholders could be lower than if we did not enter into long-term leases.
We may experience material losses or damage related to our properties and such losses may not be covered by insurance.
We may experience material losses related to our properties arising from natural disasters, such as extreme weather events, climate change, earthquakes or floods, and acts of God, vandalism or other crime, faulty construction or accidents, fire, outbreaks of an infectious disease, pandemic or any other serious public health concern, war, acts of terrorism (including cyber sabotage or similar attacks) or other catastrophes. We plan to carry insurance covering our properties under policies the Adviser deems appropriate. The Adviser will select policy specifications and insured limits that it believes to be appropriate and adequate given the relative risk of loss, the cost of the coverage and industry practice. Insurance policies on our properties may include some coverage for losses that are generally catastrophic in nature, such as losses due to terrorism, earthquakes and floods, but we cannot assure you that it will be adequate to cover all losses and some of our policies will be insured subject to limitations involving large deductibles or co-payments and policy limits that may not be sufficient to cover losses. In general, losses related to terrorism are becoming harder and more expensive to insure against. In some cases, the insurers exclude terrorism, in others the coverage against terrorist acts is limited, or available only for a significant price. A similar dynamic has been unfolding with respect to certain weather and fire events, with insurers excluding certain investments that have high risk of weather, earthquake or fire events. As the effects of climate change increase, we expect the frequency and impact of weather and climate related events and conditions could increase as well. Climate
change may also increase the cost of, or decrease the availability of, property insurance on terms we find acceptable. As a result of these factors, not all investments may be insured against terrorism, weather or fire. If we or one or more of our tenants experience a loss that is uninsured or that exceeds policy limits, we could lose the capital invested in the damaged properties as well as the anticipated future cash flows from those properties. In addition, if the damaged properties are subject to recourse indebtedness, we would continue to be liable for the indebtedness, even if these properties were irreparably damaged. Certain of these events, such as war or an outbreak of an infectious disease, could have a broader negative impact on the global or local economy, thereby affecting us or the Adviser.
33
We could become subject to liability for environmental violations, regardless of whether we caused such violations.
We could become subject to liability in the form of fines or damages for noncompliance with environmental laws and regulations. These laws and regulations generally govern wastewater discharges, air emissions, the operation and removal of underground and above-ground storage tanks, the use, storage, treatment, transportation and disposal of solid hazardous materials, the remediation of contaminated property associated with the disposal of solid and hazardous materials and other health and safety-related concerns. Some of these laws and regulations may impose joint and several liability on tenants, owners or managers for the costs of investigation or remediation of contaminated properties, regardless of fault or the legality of the original disposal. Under various federal, state and local environmental laws, ordinances, and regulations, a current or former owner or manager of real property may be liable for the cost to remove or remediate hazardous or toxic substances, wastes, or petroleum products on, under, from, or in such property. These costs could be substantial and liability under these laws may attach whether or not the owner or manager knew of, or was responsible for, the presence of such contamination. Even if more than one person may have been responsible for the contamination, each liable party may be held entirely responsible for all of the clean-up costs incurred.
In addition, third parties may sue the owner or manager of a property for damages based on personal injury, natural resources, or property damage and/or for other costs, including investigation and clean-up costs, resulting from the environmental contamination. The presence of contamination on one of our properties, or the failure to properly remediate a contaminated property, could give rise to a lien in favor of the government for costs it may incur to address the contamination, or otherwise adversely affect our ability to sell or lease the property or borrow using the property as collateral. In addition, if contamination is discovered on our properties, environmental laws may impose restrictions on the manner in which the property may be used or businesses may be operated, and these restrictions may require substantial expenditures or prevent us from entering into leases with prospective tenants. There can be no assurance that future laws, ordinances or regulations will not impose any material environmental liability, or that the environmental condition of our properties will not be affected by the operations of the tenants, by the existing condition of the land, by operations in the vicinity of the properties. There can be no assurance that these laws, or changes in these laws, will not have a material adverse effect on our business, results of operations or financial condition. We could also suffer losses if reserves or insurance proceeds prove inadequate to cover any such matters. The cost to perform any remediation, and the cost to defend against any related claims, could exceed the value of the relevant investment, and in such cases we could be forced to satisfy the claims from other assets and investments. We may have an indemnity from a third party purporting to cover these liabilities, but there can be no assurance as to the financial viability of any indemnifying party at the time a claim arises. In addition, some environmental laws create a lien on a contaminated asset in favor of governments or government agencies for costs they may incur in connection with the contamination.
Our costs associated with complying with the Americans with Disabilities Act of 1990 (the “ADA”) may affect cash available for distributions.
Any domestic properties we acquire will generally be subject to the ADA. Under the ADA, all places of public accommodation are required to comply with federal requirements related to access and use by disabled persons. The ADA has separate compliance requirements for “public accommodations” and “commercial facilities” that generally require that buildings and services be made accessible and available to people with disabilities. The ADA’s requirements could require removal of access barriers and could result in the imposition of injunctive relief, monetary penalties or, in some cases, an award of damages. We may not acquire properties that comply with the ADA or we may not be able to allocate the burden on the seller or other third party, such as a tenant, to ensure compliance with the ADA in all cases.
Our properties are, and any properties we acquire in the future will be, subject to property taxes that may increase in the future, which could adversely affect our cash flow.
Our properties are, and any properties we acquire in the future will be, subject to real and personal property taxes that may increase as property tax rates change and as the properties are assessed or reassessed by taxing authorities. Some of our leases may provide that the property taxes, or increases therein, are charged to the lessees as an expense related to the properties that they occupy. As the owner of the properties, however, we are ultimately responsible for payment of the taxes to the government. If property taxes increase, our tenants may be unable (or not obligated) to make the required tax payments, ultimately requiring us to pay the taxes. In addition, we are generally responsible for property taxes related to any vacant space. If we purchase rental housing properties, the leases for such properties typically will not allow us to pass through real estate taxes and other taxes to residents of such properties. Consequently, any tax increases may adversely affect our results of operations at such properties.
34
Certain of our investments are in the form of ground leases, which provide limited rights to the underlying property.
We hold and may in the future invest from time to time in real properties that are subject to ground leases. As a lessee under a ground lease, we may be exposed to the possibility of losing the property upon termination, or an earlier breach by us, of the ground lease, which may adversely impact our investment performance. Furthermore, ground leases generally provide for certain provisions that limit the ability to sell certain properties subject to the lease. In order to assign or transfer rights and obligations under certain ground leases, we will generally need to obtain consent of the landlord of such property, which, in turn, could adversely impact the price realized from any such sale.
Certain of our industrial properties may be special use and/or build-to-suit and may be difficult to sell or re-let upon tenant defaults or lease terminations.
Certain of our industrial properties may include special use and/or build-to-suit properties. These types of properties are relatively illiquid compared to other types of real estate and financial assets and this illiquidity will limit our ability to quickly change our portfolio in response to changes in economic or other conditions. With such properties, if the current lease is terminated or not renewed, we may be required to renovate the property or to make rent concessions in order to lease the property to another tenant, finance the property or sell the property. In addition, in the event we are forced to sell the property, we may have difficulty selling it to a party other than the tenant or borrower due to the special purpose for which the property may have been designed. These and other limitations may affect our ability to sell or re-let our industrial properties and adversely affect our results of operations at such properties.
Certain properties may require an expedited transaction, which may result in limited information being available about the property prior to its acquisition.
Investment analyses and decisions by the Adviser may be required to be undertaken on an expedited basis to take advantage of investment opportunities. In such cases, the information available to the Adviser at the time of making an investment decision may be limited, and the Adviser may not have access to detailed information regarding the investment property or portfolio of properties, such as physical characteristics, environmental matters, zoning regulations or other local conditions affecting such investment. Therefore, no assurance can be given that the Adviser will have knowledge of all circumstances that may adversely affect an investment, and we may make investments which we would not have made if more extensive due diligence had been undertaken. Because large portfolios of properties still generally require diligence to analyze individual properties, these risks are exacerbated in expedited transactions of large portfolios. In addition, the Adviser may use consultants, legal advisors, appraisers, accountants, investment banks and other third parties in connection with its evaluation and/or diligence of certain investments. No assurance can be given as to the accuracy or completeness of the information provided by such third parties, and we may incur liability as a result of such third parties’ actions.
We face risks in effecting operating improvements.
In some cases, the success of an investment will depend, in part, on our ability to restructure and effect improvements in the operations of a property. The activity of identifying and implementing restructuring programs and operating improvements at property entails a high degree of uncertainty. There can be no assurance that we will be able to successfully identify and implement such restructuring programs and improvements.
Many factors affect the single-family rental housing market, and the Company may be negatively affected by its assumptions surrounding and general conditions of the single-family rental housing market.
Any potential returns on our investments related to the single-family rental housing market will depend upon many factors including, but not limited to:
•the availability of properties or other investments that meet our investment criteria and our ability to acquire such properties at favorable prices and interest rates;
•real estate appreciation or depreciation in our target markets;
•the condition of our properties;
•our ability to contain renovation, maintenance, marketing and other operating costs for our properties;
•our ability to maintain high occupancy rates and target rent levels;
35
•general economic conditions in our target markets, such as changes in employment and household earnings and expenses; the effects of rent controls, stabilization laws and other laws or regulations regarding rental rates and tenant rights; and
•changes in, and changes in enforcement of, laws, regulations and government policies including health, safety, environmental, property, zoning and tax laws.
We will have no control over many of these factors, which could adversely affect our operations. Our success will also depend, in part, on our assumptions about our target properties, target lessees, renovation, maintenance and other operating costs, and rental rates and occupancy levels and, if our assumptions prove to be inaccurate, this may adversely affect our operations and results.
A number of our rental housing properties are part of homeowner’s associations (“HOAs”), and we and tenants of such properties are subject to the rules and regulations of such HOAs, which are subject to change and may be arbitrary or restrictive. Violations of such rules may subject us to additional fees, penalties and litigation with such HOAs which would be costly.
A number of our rental housing properties are located within HOAs, which are private entities that regulate the activities of owners and occupants of, and levy assessments on, properties in a rental housing subdivision. We pay all HOA fees and assessments directly. The majority of the HOA fees due on our properties are billed annually. The fees are paid when due by our property managers and are included in our property and operating expenses. HOAs in which we own properties may have or may enact onerous or arbitrary rules that restrict our ability to restore, market or lease our properties or require us to restore or maintain such properties at standards or costs that are in excess of our planned budgets. Such rules may include requirements for landscaping, limitations on signage promoting a property for lease or sale or the requirement that specific construction materials be used in restorations. Some HOAs also impose limits on the number of property owners who may rent their homes, which, if met or exceeded, would cause us to incur additional costs to sell the property and opportunity costs of lost rental revenue. Furthermore, many HOAs impose restrictions on the conduct of occupants of homes and the use of common areas, and we may have tenants who violate HOA rules and for which we may be liable as the property owner. Additionally, the boards of directors of the HOAs in which we own property may not make important disclosures about the properties or may block our access to HOA records, initiate litigation, restrict our ability to sell our properties, impose assessments or arbitrarily change the HOA rules. Furthermore, in certain jurisdictions, HOAs may have a statutory right of first refusal to purchase certain types of properties we may desire to sell. Moreover, in certain jurisdictions (such as in Florida), HOAs may be entitled to dispute rent increases, which may result in arbitration. We may be unaware of or unable to review or comply with HOA rules before purchasing a property, and any such excessively restrictive or arbitrary regulations may cause us to sell such property at a loss, prevent us from renting such property or otherwise reduce our cash flow from such property, which would have an adverse effect on our returns on these properties.
Our industrial tenants may be adversely affected by a decline in manufacturing activity in the United States.
Fluctuations in manufacturing activity in the United States may adversely affect our industrial tenants and therefore the demand for and profitability of our industrial properties. Trade agreements with foreign countries have given employers the option to utilize less expensive foreign manufacturing workers. Outsourcing manufacturing activities could reduce the demand for U.S. workers, thereby reducing the profitability of our industrial tenants and the demand for and profitability of our industrial properties.
We could be negatively impacted by the condition of Fannie Mae or Freddie Mac and by changes in government support for rental housing.
Federal National Mortgage Association (“Fannie Mae”) and Federal Home Loan Mortgage Corporation (“Freddie Mac”) are a major source of financing for rental housing real estate in the United States. We expect to utilize loan programs sponsored by these entities as a key source of capital to finance our growth and our operations. In September 2008, the U.S. government increased its control of Fannie Mae and Freddie Mac and placed both companies into a government conservatorship under the Federal Housing Finance Agency. In December 2009, the U.S. Treasury increased its financial support for these conservatorships. In February 2011, the Obama administration released its blueprint for winding down Fannie Mae and Freddie Mac and for reforming the system of housing finance. Since that time, members of Congress have introduced and Congressional committees have considered a substantial number of bills that include comprehensive or incremental approaches to winding down Fannie Mae and Freddie Mac or changing their purposes, businesses or operations. A decision by the U.S. government to eliminate or downscale Fannie Mae or Freddie Mac or to reduce government support for rental housing more generally may adversely affect interest rates, capital availability, development of rental housing communities and the value of rental housing assets and, as a result, may adversely affect our future growth and operations. Any potential reduction in loans, guarantees and credit-enhancement arrangements from Fannie Mae and Freddie Mac could jeopardize the effectiveness of the rental housing sector’s derivative securities market, potentially causing breaches in loan covenants, and through reduced loan availability, impact the value of rental housing assets, which could impair the value of a significant portion
36
of rental housing communities. Specifically, the potential for a decrease in liquidity made available to the rental housing sector by Fannie Mae and Freddie Mac could:
•make it more difficult for us to secure new takeout financing for any rental housing development projects we acquire;
•hinder our ability to refinance any completed rental housing assets;
•decrease the amount of available liquidity and credit that could be used to broaden our portfolio through the acquisition of rental housing assets; and
•require us to obtain other sources of debt capital with potentially different terms.
Short-term leases expose us to the effects of declining market rent and could adversely impact our ability to make cash distributions to you.
Substantially all of our rental housing leases are on a short-term basis. Because these leases generally permit the residents to leave at the end of the lease term without penalty, our rental revenues would be impacted by declines in market rents more quickly than if our leases were for longer terms.
Increased levels of unemployment could adversely affect the occupancy and rental rates of any rental housing properties we acquire.
Increased levels of unemployment in rental housing markets could significantly decrease occupancy and rental rates. In times of increasing unemployment, rental housing occupancy and rental rates have historically been adversely affected by:
•oversupply or reduced demand for apartment homes;
•rental residents deciding to share rental units and therefore rent fewer units;
•potential residents moving back into family homes or delaying leaving family homes;
•a reduced demand for higher-rent units;
•a decline in household formation;
•persons enrolled in college delaying leaving college or choosing to proceed to or return to graduate school in the absence of available employment;
•rent control or rent stabilization laws, or other laws regulating housing, that could prevent us from raising rents sufficiently to offset increases in operating costs;
•the inability or unwillingness of residents to pay rent increases; and
•increased collection losses.
These factors generally have contributed to lower rental rates. To the extent that we invest in any rental housing properties, our results of operations, financial condition and ability to make distributions to you may be adversely affected if these factors do not improve or worsen.
If any credit market disruptions or economic slowdowns occur, any investments in multifamily properties may face increased competition from single-family homes and condominiums for rent, which could limit our ability to retain residents, lease apartment units or increase or maintain rents.
Any multifamily communities in which we invest may compete with numerous housing alternatives in attracting residents, including single-family homes and condominiums available for rent. Such competitive housing alternatives may become more prevalent in a particular area in the event of any tightening of mortgage lending underwriting criteria, homeowner foreclosures, declines in single-family home and condominium sales or lack of available credit. The number of single-family homes and condominiums for rent in a particular area could limit our ability to retain residents, lease apartment units or increase or maintain rents.
The multifamily rental housing properties in which we invest must comply with the Fair Housing Amendment of 1988.
The multifamily rental housing properties in which we invest domestically, if any, must comply with the Fair Housing Amendment Act of 1988 (“FHAA”) which requires that multifamily communities first occupied after March 13, 1991 be accessible to handicapped residents and visitors. Compliance with the FHAA could require removal of structural barriers to handicapped access in a community, including the interiors of apartment units covered under the FHAA. Recently there has been heightened scrutiny of multifamily housing communities for compliance with the requirements of the FHAA and the ADA and an increasing number of substantial enforcement actions and private lawsuits have been brought against multifamily communities to ensure compliance with these requirements. Noncompliance with the FHAA and the ADA could result in the imposition of fines, awards of damages to private litigants, payment of attorneys’ fees and other costs to plaintiffs, substantial litigation costs and substantial costs of remediation.
37
We have and continue to expect to make investments in low income areas or affordable housing developments.
Investment opportunities may include projects and initiatives located in low-income areas, including, without limitation, low-income or affordable housing developments and businesses located in low income areas. There are significant risks associated with the ownership of these projects and initiatives. There may be federal, state and local governmental regulatory restrictions on the operation, rental and transfer of these investments, such as the requirement that the owners of the investments rent or sell certain rental housing units to persons or families of low or moderate income and that the amount of rent that may be charged for these units may be less than market rates. These restrictions may adversely affect economic performance relative to properties that are not subject to these restrictions. For example, selling property that is subject to affordable housing regulatory restrictions may limit its sale price, and accordingly adversely impact our investment performance. In addition, the long-term nature of investments in government-assisted housing limits our ability to vary our portfolio in response to changing economic, financial and investment conditions; these properties are also subject to changes in local economic circumstances and housing patterns, as well as rising operating costs, vacancies, rent collection difficulties, energy shortages and other factors which have an impact on real estate values. These properties also require greater management expertise and may have higher operating expenses than conventional housing projects. Certain of our properties were developed under the U.S. federal Low Income Housing Tax Credit (“LIHTC”) program, and such properties are subject to regulatory and rent restrictions. Properties in low-income areas may also (a) be in an early stage of development and not have a proven operating history, (b) be operating at a loss or have significant variations in operating results, (c) be engaged in a rapidly changing business with products subject to a substantial risk of obsolescence, (d) require substantial additional capital to support their operations, to finance expansion or to maintain their competitive position, (e) rely on the services of a limited number of key individuals, the loss of any of whom could significantly adversely affect a project’s performance, (f) face intense competition, including competition from companies and projects with greater financial resources, more extensive development, marketing and other capabilities, and a larger number of qualified management and technical personnel, (g) utilize innovative and untested operational and business strategies, including new business partnerships and teams, and (h) otherwise have a weak financial condition or be experiencing financial difficulties that could result in insolvency, liquidation, dissolution, reorganization or bankruptcy of the project. Congress and the current presidential administration of the United States have proposed various changes to the LIHTC program. In November 2021, the U.S. House of Representatives passed the Build Back Better Act (H.R. 5376), which included an expansion of the LIHTC program among other measures. The Build Back Better Act is not law and is subject to change. We cannot predict what proposals regarding the LIHTC, if any, might actually be enacted by Congress, and what effect, if any, the proposals might have on our operations. Further, there is often less publicly available information concerning these properties than for larger, more established businesses. These risks may adversely affect the performance of the properties and result in substantial losses. Furthermore, many of the risks associated with investing in real estate may be exacerbated in connection with properties in low-income areas. A downturn in the economy may impact the success of businesses in low-income areas and the operations of tenants in low-income areas. Businesses in which we have invested may experience declining revenues or file for bankruptcy. In addition, tenants in properties held by us may experience declining revenues, vacate the premises early, or file for bankruptcy, which could reduce a tenant’s ability to pay base rent, percentage rent or other charges. Finally, we may own certain low-income properties through complicated ownership structures due to tax or regulatory reasons, which may limit the flexibility we have in managing such properties.
Risks associated with climate change may adversely affect our business and financial results and damage our reputation.
There has been increasing awareness of severe weather and other climate events outside of the historical norm as well as increasing concern from government agencies about the effects of climate change on the environment. Transition risks, such as government restrictions, standards or regulations intended to reduce greenhouse gas emissions and potential climate change impacts, are emerging and may increase in the future in the form of restrictions or additional requirements on the development of commercial real estate. Such restrictions and requirements, along with rising insurance premiums resulting from climate change, could increase our costs or require additional technology and capital investment by us, which could adversely affect our results of operations. This is a particular concern in the western and northeastern United States, where some of the most extensive and stringent environmental laws and building construction standards in the U.S. have been enacted, and where we have properties in our investment portfolio. In addition, new climate change-related regulations may result in enhanced disclosure obligations, which could materially increase our regulatory burden and compliance costs. See “—We are subject to evolving ESG disclosure standards and expectations that expose us to numerous risks.”
Further, physical effects of climate change including changes in global weather patterns, rising sea levels, changing temperature averages or extremes and extreme weather events such as hurricanes, droughts or floods, can also have an adverse impact on certain properties. As the effects of climate change increase, we expect the frequency and impact of weather and climate-related events and conditions to increase as well. For example, unseasonal or extreme weather events can have a material impact to hospitality businesses or properties.
Some physical risk is inherent in all properties, particularly properties in certain locations and in light of the unknown potential for extreme weather or other events that could occur related to climate change.
38
We are subject to evolving ESG disclosure standards and expectations that expose us to numerous risks.
Recently, there has been growing concern from advocacy groups, government agencies and the general public on ESG matters and increasingly regulators, customers, investors, employees and other stakeholders are focusing on ESG matters and related disclosures. Such governmental, investor and societal attention to ESG matters, including expanding mandatory and voluntary reporting, diligence, and disclosure on topics such as climate change, human capital management, labor and risk oversight, could expand the nature, scope, and complexity of matters that we are required to manage, assess and report.
We may choose to communicate certain initiatives, commitments and goals, regarding environmental matters, human capital management, responsible sourcing and social investments and other ESG-related matters in our SEC filings or in other disclosures. Any such current or future initiatives, commitments and/or goals are aspirational and there is no guarantee that all or any such initiative, commitment or goal will be achieved; they could be difficult and expensive to implement and we could be criticized for the accuracy, adequacy or completeness of the disclosure. Statements about our ESG-related initiatives, commitments and goals, and progress against those goals, may be based on standards for measuring progress that are still developing, internal controls and processes that continue to evolve, and assumptions that are subject to change in the future. In addition, we could be criticized for the scope or nature of such initiatives, commitments or goals, any failure or perceived failure to demonstrate progress towards such commitments and goals, or for any revisions to these commitments and goals. Further, as part of our ESG practices, we may rely from time to time on third-party data, services and methodologies and such services, data and methodologies could prove to be incomplete or inaccurate. If our or such third parties’ ESG-related data, processes or reporting are incomplete or inaccurate, if we fail to achieve progress with respect to our ESG initiatives, commitments and goals on a timely basis, or at all, our reputation and business results could be adversely affected, particularly if in connection with any such matters we were to become exposed to potential “greenwashing” liability. Further, developing and implementing ESG initiatives, and collecting, measuring and reporting ESG-related information and metrics can be costly, difficult and time-consuming, and are subject to evolving reporting standards that lack harmonization on a global basis, all of which expose our business to additional risk.
Investors and other stakeholders have become more focused on understanding how companies address a variety of ESG factors. As they evaluate investment decisions, many investors look not only at company disclosures but also to ESG rating systems that have been developed by third parties to allow ESG comparisons among companies. The criteria used in these ratings systems may conflict and change frequently, and we cannot predict how these third parties will score us, nor can we have any assurance that they score us accurately or other companies accurately or that other companies have provided them with accurate data. If our ESG ratings, disclosures or practices do not meet the standards set by such investors or our stockholders, they may choose not to invest in our common stock. Relatedly, we risk damage to our reputation, if we do not, or are perceived to not, act responsibly in a number of areas, such as greenhouse gas emissions, energy management, human rights, community relations, workforce health and safety, and business ethics and transparency. Adverse incidents with respect to ESG matters or negative ESG ratings or assessments by third-party ESG raters could impact the value of our brand, or the cost of our operations and relationships with investors, all of which could adversely affect our business and results of operations.
There is a growing regulatory interest across jurisdictions in improving transparency regarding the definition, measurement and disclosure of ESG factors in order to allow investors to validate and better understand sustainability claims, and we are subject to changing rules and regulations promulgated by a number of governmental and self-regulatory organizations, including the SEC and the Financial Accounting Standards Board. These rules and regulations continue to evolve in scope and complexity and many new requirements have been created in response to laws enacted by Congress, making compliance more difficult and uncertain. Further, new and emerging regulatory initiatives in the U.S., EU and U.K. related to climate change and ESG could adversely affect our business, including initiatives and regulations deriving from the European Commission’s May 2018 “action plan on financing sustainable growth,” and the U.K.’s regulations requiring certain entities to make climate-related disclosures, currently in accordance with the Taskforce on Climate-related Financial Disclosures (TCFD) framework.
For example, in the United States, in March 2024, the SEC adopted extensive rules aimed at enhancing and standardizing climate-related disclosures in an effort to foster greater consistency, comparability and reliability of climate-related information among public issuers. The final rule requires registrants to include prescribed climate-related information in their registration statements and annual reports substantially beyond what is currently required, including data regarding information regarding climate-related risks and opportunities and related financial impacts, governance and strategy. Unless challenges to the rule prevail, as a non-accelerated filer, we will be subject to the requirements commencing with the year ending December 31, 2027. In addition, in 2021, the SEC established an enforcement task force to look into ESG practices and disclosures by public companies and investment managers and has started to bring enforcement actions based on ESG disclosures not matching actual investment processes. At the state level, in 2023, California enacted legislation that will ultimately, unless legal challenges prevail, require certain companies that (i) do business in California, to publicly disclose their Scopes 1, 2 and 3 greenhouse gas emissions, with third-party assurance of such data, and issue public reports on their climate-related financial risk and related mitigation measures and (ii) operate in California and make certain climate-related claims, to provide enhanced disclosures around the achievement of such claims. Outside of the U.S., various
39
government authorities have proposed or implemented carbon taxes, requirements for asset managers to integrate climate risk considerations in investment and risk management processes, and mandatory TCFD-aligned reporting for public issuers and certain asset managers and private companies, among other requirements.
Growing interest on the part of investors and regulators in ESG factors and increased demand for, and scrutiny of, ESG-related disclosures, have also increased the risk that companies could be perceived as, or accused of, making inaccurate or misleading statements regarding their ESG efforts or initiatives, or greenwashing. Such perception or accusation could damage our reputation, result in litigation or regulatory actions and adversely impact our ability to raise capital. Relatedly, certain investors have also begun to use ESG data, third-party benchmarks and ESG ratings to allow them to monitor the ESG impact of their investments.
These changing rules, regulations and stakeholder expectations have resulted in, and are likely to continue to result in, increased general and administrative expenses and increased management time and attention spent complying with or meeting such regulations and expectations. If we or our tenants fail or are perceived to fail to comply with applicable rules, regulations and stakeholder expectations, it could negatively impact our reputation and our business results. Further, our business could become subject to additional regulations, penalties and/or risks of regulatory scrutiny and enforcement in the future. We cannot guarantee that our current ESG practices will meet future regulatory requirements, reporting frameworks or best practices, increasing the risk of related enforcement. Compliance with new requirements may lead to increased management burdens and costs. There is also a risk of mismatch between U.S., EU and U.K. initiatives. Generally, we expect investor demands and the prevailing legal environment to require us to devote additional resources to ESG matters in our review of prospective investments and management of existing investments, which could increase our expenses.
We may not be able to attract desirable tenants for our rental housing properties and may have difficulty evicting defaulting tenants.
Our success with rental housing rentals will depend, in large part, upon our ability to attract and retain qualified tenants for our rental housing properties. If we are unable to attract quality tenants our rental revenues will be adversely affected. If certain of our tenants cease paying rent, we may be unable or unwilling to evict such tenants due to legal, regulatory or practical concerns and, as a result, may be unable to enter into a new lease for the applicable unit or property, resulting in lost revenue. In addition, our efforts to evict rental housing tenants may result in litigation, resulting in increased expenses and potential liability for our rental housing properties.
Rent control and other changes in applicable laws, or noncompliance with applicable laws, could adversely affect our rental housing properties.
Lower revenue growth or significant unanticipated expenditures may result from changes in rent control or rent stabilization laws or other rental housing landlord/tenant laws. Municipalities may implement, consider or be urged by advocacy groups to consider rent control or rent stabilization laws and regulations or take other actions that could limit our ability to raise rents based on market conditions. For example, in 2016 in Mountain View, California, voters passed a referendum that limits rent increases on existing tenants (but not on new move-ins) in communities built before 1995. These initiatives and any other future enactments of rent control or rent stabilization laws or other laws regulating rental housing, as well as any lawsuits against us arising from such rent control or other laws, may reduce rental revenues or increase operating costs. Such laws and regulations may limit our ability to charge market rents, increase rents, evict tenants or recover increases in our operating costs and could make it more difficult for us to dispose of properties in certain circumstances. Expenses associated with investments in rental housing properties, such as debt service, real estate taxes, insurance and maintenance costs, are generally not reduced when circumstances cause a reduction in rental income from such properties.
The hospitality or leisure market is seasonal, highly competitive and generally subject to greater volatility than our other market segments.
The hospitality or leisure business is seasonal, highly competitive and influenced by factors such as general and local economic conditions, location, room rates, quality, service levels, reputation and reservation systems, among many other factors. The hospitality or leisure industry generally experiences seasonal slowdown in the third quarter and, to a lesser extent, in the fourth quarter of each year. As a result of such seasonality, there will likely be quarterly fluctuations in results of operations of any hospitality or leisure properties that we own. There are many competitors in this market, and these competitors may have substantially greater marketing and financial resources than those available to us. Competition also comes from non-traditional hospitality sources, such as home-sharing platforms. This competition, along with other factors, such as over-building in the hospitality or leisure industry and certain deterrents to traveling, may increase the number of rooms available and may decrease the average occupancy and room rates of our hospitality or leisure properties. The demand for rooms at any hospitality or leisure properties that we may acquire will change much more rapidly than the demand for space at other properties that we acquire. In addition, any such properties that we may own may be adversely affected by factors outside our control, such as extreme weather conditions or natural disasters, terrorist attacks or alerts,
40
outbreaks of contagious diseases, airline strikes, economic factors and other considerations affecting travel. These factors could have a material adverse effect on our financial condition, results of operations and ability to pay distributions to stockholders.
Our student housing properties are subject to seasonality.
Student housing properties are typically leased during leasing seasons, and our properties are therefore highly dependent on the effectiveness of our marketing and leasing efforts and personnel during such seasons. Additionally, our student housing properties are generally on short-term leases, exposing us to increased leasing risk. We also face economic and operational risks related to the supply of and demand for student housing space in the local market, tenant quality, the higher tenant turnover rate relative to other housing properties, physical attributes of the building in relation to competing buildings (e.g., age, condition, design, appearance, amenities, and location) and access to transportation and proximity to campus, among other factors. We may not be able to re-lease our properties on similar terms, if we are able to re-lease our properties at all. The terms of renewal or re-lease (including the cost of required renovations) may be less favorable to us than the prior lease. If we are unable to re-lease all or a substantial portion of our properties, or if the rental rates upon such re-leasing are significantly lower than expected rates, our cash flows from operations could be adversely affected.
Prior to the commencement of each new lease period, we prepare the units for new incoming residents. Other than revenue generated by in-place leases for returning residents, we do not generally recognize lease revenue during this period referred to as “turn” as we have no leases in place. In addition, during turn, we incur expenses preparing our units for occupancy, which we recognize immediately. This lease turn period results in seasonality in our operating results, and as a result, we may experience significantly reduced cash flows during such periods.
In addition, we may be adversely affected by a change in university admission policies. For example, if a university reduces the number of student admissions, the demand for our student housing properties may be reduced and our occupancy rates may decline. Our student housing properties also compete with university-owned student housing and other national and regional owner-operators of off-campus student housing in a number of markets as well as with smaller local owner-operators. The demand for student housing has been, and may in the future be, impacted by epidemics or pandemics, such as the COVID-19 pandemic, where students could be restricted from living in student housing for all or a considerable portion of the academic school year (or may otherwise have less desire to live in student housing, such as where classes are taught online during such period). In such circumstances, student housing properties may remain unoccupied and accordingly may not generate any revenue and cash flow during such time and the value of an investment in such properties may be adversely affected.
Government housing regulations may limit the opportunities at some of the government-assisted housing properties we invest in, and failure to comply with resident qualification requirements may result in financial penalties and/or loss of benefits, such as rental revenues paid by government agencies.
To the extent that we invest in government-assisted housing, we may acquire properties that benefit from governmental programs intended to provide affordable housing to individuals with low or moderate incomes. These programs, which are typically administered by the U.S. Department of Housing and Urban Development (“HUD”) or state housing finance agencies, typically provide mortgage insurance, favorable financing terms, tax credits or rental assistance payments to property owners. As a condition of the receipt of assistance under these programs, the properties must comply with various requirements, which typically limit rents to pre-approved amounts and impose restrictions on resident incomes. Failure to comply with these requirements and restrictions may result in financial penalties or loss of benefits. In addition, we will often need to obtain the approval of HUD in order to acquire or dispose of a significant interest in or manage a HUD-assisted property.
Our data center investments are subject to risks from changes in demand, technology and tenant preferences and competition in the data center industry.
Our data center investments are subject to operating risks common to the data center industry, which include changes in tenant demands or preferences, a decline in the technology industry, such as a decrease in the use of mobile or web-based commerce, industry slowdowns, business layoffs or downsizing, relocation of businesses, increased costs of complying with existing or new government regulations and other factors; a downturn in the market for data center space generally such as oversupply of or reduced demand for space; increased competition, including from our tenants choosing to develop their own data centers; and the rapid development of new technologies or the adoption of new industry standards that render our tenants’ current products and services or our facilities obsolete or unmarketable. To the extent that any of these or other adverse conditions occur, they are likely to impact market rents for, and cash flows from, our data center investments, which could have a material adverse effect on us.
41
Our data centers may not be suitable for re-leasing without significant expenditures or renovations.
Because many of our data centers contain tenant improvements installed at our tenants’ expense, they may be better suited for a specific data center user or technology industry tenants and could require significant modification in order for us to re-lease vacant space to another data center user or technology industry tenants. The tenant improvements may also become outdated or obsolete as the result of technological change, the passage of time or other factors.
As a result, we may be required to invest significant amounts or offer significant discounts to tenants in order to lease or re-lease that space, either of which could adversely affect our financial and operating results.
Our ability to lease any available space at our data centers to existing or new tenants could be constrained by our ability to obtain
sufficient electrical power.
As current and future tenants increase their power footprint in our data centers over time, the corresponding reduction in available
power could limit our ability to increase occupancy rates or network density within our existing data centers. Furthermore, at certain of our data centers, our aggregate maximum contractual obligation to provide power and cooling to our tenants may exceed the physical capacity at such data centers if tenants were to quickly increase their demand for power and cooling. If we are not able to increase the available power and/or cooling or move the tenant to another location within our data centers with sufficient power and cooling to meet such demand, we could lose the tenant as well as be exposed to liability under our tenant agreements. In addition, our power and cooling systems are difficult and expensive to upgrade. Accordingly, we may not be able to efficiently upgrade or change these systems to meet new demands without incurring significant costs that we may not be able to pass on to our tenants. Any such material loss of tenants, liability or additional costs could adversely affect our business, financial condition and results of operations. Further, we have acquired land that we intend to develop into data centers. We may not be able to obtain the necessary electrical power to do so, which will prevent us from fully developing the land and negatively impact the value of our investment in the land.
We depend on third parties to provide network connectivity to the tenants in our data centers and any delays or disruptions in
connectivity may materially adversely affect our operating results and cash flow.
We are not a telecommunications carrier. Although our tenants generally are responsible for providing their own network connectivity, we still depend upon the presence of telecommunications carriers’ fiber networks serving our data centers in order to attract and retain tenants. We believe that the availability of carrier capacity will directly affect our ability to achieve our projected results. Any carrier may elect not to offer its services within our data centers. Any carrier that has decided to provide network connectivity to our data centers may not continue to do so for any period of time. Further, some carriers are experiencing business difficulties or have announced consolidations. As a result, some carriers may be forced to downsize or terminate connectivity within our data centers, which could have an adverse effect on the business of our tenants and, in turn, our own operating results.
Our data centers may require construction and operation of a sophisticated redundant fiber network. The construction required to connect multiple carrier facilities to our data centers is complex and involves factors outside of our control, including regulatory requirements and the availability of construction resources. If the establishment of highly diverse network connectivity to our data centers does not occur, is materially delayed or is discontinued, or is subject to failure, our operating results and cash flow may be materially adversely affected. Additionally, any hardware or fiber failures on this network may result in significant loss of connectivity to our data centers. This could negatively affect our ability to attract new tenants or retain existing tenants, which could have an adverse effect on our business, financial condition and results of operations.
We may not be able to adapt to changing technologies and tenant requirements, and our data center infrastructure may become
obsolete.
The technology industry generally and specific industries in which certain of our tenants operate are characterized by rapidly changing technology, tenant requirements and industry standards. New systems to deliver power to or eliminate heat in data centers or the development of new server technology that does not require the levels of critical load and heat removal that our facilities are designed to provide and could be run less expensively on a different platform could make our data center infrastructure obsolete. Our power and cooling systems are difficult and expensive to upgrade, and we may not be able to efficiently upgrade or change these systems to meet new demands without incurring significant costs that we may not be able to pass on to our tenants which could adversely impact our business, financial condition and results of operations. In addition, the infrastructure that connects our data centers to the Internet and other external networks may become insufficient, including with respect to latency, reliability and connectivity. We may not be able to adapt to changing technologies or meet customer demands for new processes or technologies in a timely and cost-effective manner, if at all, which would adversely impact our ability to sustain and grow our business.
Further, our inability to adapt to changing tenants requirements may make our data centers obsolete or unmarketable to such customers. Some of our tenants operate at significant scale across numerous data center facilities and have designed cloud and
42
computing networks with redundancies and fail-over capabilities across these facilities, which enhances the resiliency of their networks and applications. As a result, these tenants may realize cost benefits by locating their data center operations in facilities with less electrical or mechanical infrastructure redundancy than is found in our existing data center facilities. Additionally, some of our tenants have begun to operate their data centers using a wider range of humidity levels and at temperatures that are higher than servers customarily have operated at in the past, all of which may result in energy cost savings for these tenants. We may not be able to operate our existing data centers under these environmental conditions, particularly in multi-tenant facilities with other tenants who are not willing to operate under these conditions, and our data centers could be at a competitive disadvantage to facilities that satisfy such requirements. Because we may not be able to modify the redundancy levels or environmental systems of our existing data centers cost effectively, these or other changes in tenant requirements could have a material adverse effect on our business, results of operations and financial condition.
Additionally, due to regulations that apply to our tenants as well as industry standards, they may seek specific requirements from their data centers that we are unable to provide. If new or different regulations or standards are adopted or such extra requirements are demanded by our tenants, we could lose some tenants or be unable to attract new tenants in certain industries, which could materially and adversely affect our operations.
Our retail tenants face competition from numerous retail channels.
Retailers leasing our properties will face continued competition from shopping via the internet, discount or value retailers, factory outlet centers, wholesale clubs, mail order catalogues and operators and television shopping networks. Such competition could adversely affect our tenants and, consequently, our revenues and FAD.
Retail properties depend on anchor tenants to attract shoppers and could be adversely affected by the loss of a key anchor tenant.
Retail properties, like other properties, are subject to the risk that tenants may be unable to make their lease payments or may decline to extend a lease upon its expiration. A lease termination by a tenant that occupies a large area of a retail center (commonly referred to as an anchor tenant) could impact leases of other tenants. Other tenants may be entitled to modify the terms of their existing leases in the event of a lease termination by an anchor tenant, or the closure of the business of an anchor tenant that leaves its space vacant even if the anchor tenant continues to pay rent. Any such modifications or conditions could be unfavorable to us as the property owner and could decrease rents or expense recoveries. Additionally, major tenant closures may result in decreased customer traffic, which could lead to decreased sales at other stores. In the event of default by a tenant or anchor store, we may experience delays and costs in enforcing our rights as landlord to recover amounts due to us under the terms of our agreements with those parties.
We may be adversely affected by trends in the office real estate industry.
Some businesses are rapidly evolving to make employee telecommuting, flexible work schedules, open workplaces and teleconferencing increasingly common. These practices enable businesses to reduce their space requirements. A continuation of the movement towards these practices could over time erode the overall demand for office space and, in turn, place downward pressure on occupancy, rental rates and property valuations, each of which could have an adverse effect on our financial position, results of operations, cash flows and ability to make expected distributions to our stockholders. We may also be negatively impacted by competition from other short-term office or shared space leasing companies.
We could be negatively impacted by increased competition, decreased demand and restrictive zoning ordinances in the manufactured housing markets in which we invest.
The manufactured housing industry is generally subject to many of the same national and regional economic and demographic factors that affect the housing industry generally. These factors, including shortage of consumer financing, public’s perception, consumer confidence, inflation, regional population and employment trends, availability of and cost of alternative housing, weather conditions and general economic conditions, tend to impact manufactured homes to a greater degree than traditional rental housing homes. Our operating results from our manufactured housing investments may be adversely affected by: (i) competition from other available manufactured housing sites or available land for the placement of manufactured homes outside of established communities and alternative forms of housing (such as apartment buildings and site built single-family homes) and (ii) local real estate market conditions such as the oversupply of manufactured housing sites or a reduction in demand for manufactured housing sites in an area. In addition, the inability to secure zoning permits from local authorities may pose the most significant barrier to entry for developing new manufactured housing sites.
Manufactured home loans may be subject to greater credit risk.
We may hold loans secured by manufactured homes, which generally have higher delinquency and default rates than standard residential mortgage loans due to various factors, including, among other things, the manner in which borrowers have handled
43
previous credit, the absence or limited extent of borrowers’ prior credit history, limited financial resources, frequent changes in or loss of employment and changes in borrowers’ personal or domestic situations that affect their ability to repay loans. Any substantial economic slowdown could increase delinquencies, defaults, repossessions and foreclosures with respect to manufactured homes. Also, the value of manufactured homes may depreciate over time, which can negatively impact the manufactured home industry and lead to increased defaults and delinquencies and lower recovery rates upon default.
Our investments in real estate associated with gaming facilities will be impacted by the risks associated with the gaming industry.
We invest in real estate associated with gaming facilities, which are subject to risks associated with the gaming industry, including changes in consumer trends, the impact of gaming regulations on us and/or our tenants, reductions in discretionary consumer spending and corporate spending on conventions and business development and preferences, changes in laws or foreign monetary policies that impact consumer behavior, and other factors over which we have no control. Economic contraction, economic uncertainty or the perception by potential customers of weak or weakening economic conditions may cause a decline in demand for hotels, casino resorts, trade shows and conventions. Such investments may also be affected by risks relating to the tourism industry for the geographic areas in which our properties are located, including cost and availability of air services or other travel methods.
The gaming industry is characterized by a high degree of competition among a large number of participants, including riverboat casinos, dockside casinos, land-based casinos, video lottery, sweepstakes and poker machines not located in casinos, Native American gaming, internet lotteries and other internet wagering gaming services and, in a broader sense, gaming operators face competition from all manner of leisure and entertainment activities. Gaming competition is intense in the markets where our facilities are located. Recently, there has been additional significant competition in the gaming industry as a result of the upgrading or expansion of facilities by existing market participants, the entrance of new gaming participants into a market, the growth of general internet and electronic sports-related gaming and legislative changes, including relating to sports betting. As competing properties and new markets are opened, we and our tenants may be negatively impacted.
Our self storage investments are subject to risks from fluctuating demand and competition in the self-storage industry.
Our self storage investments are subject to operating risks common to the self storage industry, which include business layoffs or downsizing, industry slowdowns, relocation of businesses and changing demographics, changes in supply of, or demand for, similar or competing self storage properties in an area and the excess amount of self storage space in a particular market, changes in market rental rates and inability to collect rents from customers. The self storage industry has at times experienced overbuilding in response to perceived increases in demand. A recurrence of overbuilding might cause our self storage investments to experience a decrease in occupancy levels, as well as limit the ability to increase rents and offer discounted rents.
We invest in commercial properties subject to net leases, which could subject us to losses.
We invest in commercial properties subject to net leases. Typically, net leases require the tenants to pay substantially all of the operating costs associated with the properties. As a result, the value of, and income from, investments in commercial properties subject to net leases will depend, in part, upon the ability of the applicable tenant to meet its obligations to maintain the property under the terms of the net lease. If a tenant fails or becomes unable to so maintain a property, we will be subject to all risks associated with owning the underlying real estate. In addition, we may have limited oversight into the operations or the managers of these properties, subject to the terms of the net leases.
Certain commercial properties subject to net leases in which we invest are occupied by a single tenant and, therefore, the success of such investments is largely dependent on the financial stability of each such tenant. A default of any such tenant on its lease payments to us would cause us to lose the revenue from the property and cause us to have to find an alternative source of revenue to meet any mortgage payment and prevent a foreclosure if the property is subject to a mortgage. In the event of a default, we may experience delays in enforcing our rights as landlord and may incur substantial costs in protecting our investment and re-letting our property. If a lease is terminated, we may also incur significant losses to make the leased premises ready for another tenant and experience difficulty or a significant delay in re-leasing such property.
In addition, net leases typically have longer lease terms and, thus, there is an increased risk that contractual rental increases in future years will fail to result in fair market rental rates during those years.
We may acquire these investments through sale-leaseback transactions, which involve the purchase of a property and the leasing of such property back to the seller thereof. If we enter into a sale-leaseback transaction, we will seek to structure any such sale-leaseback transaction such that the lease will be characterized as a “true lease” for U.S. federal income tax purposes, thereby allowing us to be treated as the owner of the property for U.S. federal income tax purposes. However, we cannot assure you that the IRS will not challenge such characterization. In the event that any such sale-leaseback transaction is challenged and recharacterized as a financing transaction or loan for U.S. federal income tax purposes, deductions for depreciation and cost recovery relating to such property would
44
be disallowed, and the timing of our income inclusion could differ from that of the lease payments. If a sale-leaseback transaction were so recharacterized (or otherwise not respected as a lease), we might fail to satisfy the REIT qualification “asset tests” or “income tests” and, consequently, lose our REIT status effective with the year of recharacterization. Alternatively, the amount of our REIT taxable income could be recalculated, which might also cause us to fail to meet the REIT distribution requirement for a taxable year.
If a tenant of a net lease defaults and we are unable to find a replacement tenant, we may attempt to hold and operate the relevant property ourselves through a taxable REIT subsidiary, which would subject income on the property to corporate-level taxation, thereby reducing our FAD. In certain circumstances, depending on how much capacity we have available of the total value we are permitted to hold in taxable REIT subsidiaries under applicable rules, we may not be able to hold and operate the property in a taxable REIT subsidiary, which could result in the property and the related income not satisfying the REIT qualification asset and income tests and could jeopardize our REIT status.
Technological or other innovations may disrupt the markets and sectors in which we operate and subject us to increased competition or negatively impact the tenants of our properties and the value of our properties.
Recent trends in the real estate market and the sectors in which we invest generally have been toward disrupting the industry with technological or other innovations, and multiple young companies have been successful in capitalizing on this trend toward disruption. In this period of rapid technological and commercial innovation, new businesses and approaches may be created that could affect us, tenants of our properties or our investments or alter the market practices that help frame our strategy. For example, the value of our hospitality properties is affected by competition from the non-traditional hospitality sector (such as short-term rental services), our office properties are affected by competition from shared office spaces (including co-working environments), our retail properties may be affected by changes in consumer behavior, including increased shopping via the internet, and our warehouse industrial properties may be affected if supply chains evolve in a way that decreases the need for traditional warehousing. Any of these new approaches could damage our investments, significantly disrupt the market in which we operate and subject us to increased competition, which could materially and adversely affect our business, financial condition and results of investments. Moreover, given the pace of innovation in recent years, the impact on a particular investment may not have been foreseeable at the time we made the investment. Furthermore, we could base investment decisions on views about the direction or degree of innovation that prove inaccurate and lead to losses.
Supply chain disruptions could create unexpected renovation or maintenance costs or delays and/or could impact our tenants’ businesses, any of which could have a negative effect on our results of operations.
The construction and building industry, similar to many other industries, has experienced worldwide supply chain disruptions due to a multitude of factors that are beyond our control, including the continuing impacts of the COVID-19 pandemic, and such disruptions may continue to occur. Materials, parts and labor have also increased in cost over the recent past, sometimes significantly and over a short period of time, and such increases and volatility may continue or recur from time to time. We may incur costs for a property renovation or maintenance that exceeds our original estimates due to increased costs for materials or labor or other costs that are unexpected. We also may be unable to complete renovation of a property or tenant space on schedule due to supply chain disruptions or labor shortages, which we would expect cause a default under development or construction financing if not timely cured. Some tenants may have the right to terminate their leases if a development or renovation project is not completed on time or may be entitled to agreed-upon remuneration for such delay. The potential liabilities to tenants and lenders in these cases can generally be expected to be recourse to certain of our subsidiaries with substantial other assets. In addition, our tenants’ businesses may also be affected by supply chain issues (particularly for our industrial or retail properties), which could impact their ability to meet their obligations to us under their leases.
We may make investments in land that we seek to develop.
Subject to the limitations of our charter and although not our primary strategy, we may acquire direct or indirect interests in undeveloped land or underdeveloped real estate, which may be non-income producing. To the extent we seek to develop real estate, it will be subject to various related risks, including those associated with obtaining zoning, environmental and other regulatory requirements, the cost and time of completing construction (including risks beyond the control of the Company, such as weather, labor conditions, material shortages, trade disruption (each of which have increased following the COVID-19 pandemic, and, in some circumstances, might result in their unavailability) and counterparty default), the ability to obtain the necessary facilities for the property (such as obtaining power supply for data center projects), and the availability of both construction and permanent financing on favorable terms. Development is also more susceptible to irregular accounting or other fraudulent practices. These risks could result in substantial unanticipated delays or expenses and, under certain circumstances, could prevent completion of development activities. Additionally, development or redevelopment projects can carry an increased risk of litigation with contractors, subcontractors, suppliers, partners, counterparties and others. Assets under development or assets acquired for development may receive little or no cash flow from the date of acquisition through the date of completion of development and may experience operating deficits after the
45
date of completion. In addition, market conditions (and in particular, those prevalent in light of the COVID-19 pandemic) may change during the course of development that make the lease-up, cash flow, and value of such development less profitable than anticipated.
We may face risks related to zoning, siting and permitting, including related to any properties under development.
We may have exposure to assets that are subject to zoning, siting, permitting and other requirements, which may be long, burdensome and costly, and may subject us to additional governmental and public scrutiny. Zoning and permitting processes vary depending on the nature and location of the assets in question and, depending on the asset and activity to be conducted, the approval of multiple federal, state, local and other authorities may be required. Obtaining these approvals may be outside of our control. In addition, zoning, siting and permitting processes often face local opposition and may be challenged by a number of parties, including non-governmental organizations and special interest groups based on alleged security concerns, disturbances to natural habitats for wildlife and adverse aesthetic impacts. Beyond the time-consuming process of applying for the necessary permits, we may be required to undergo public hearings at which local communities will decide whether or not to grant the proper land use designations. Highly motivated citizens in many local communities often oppose plans to develop new properties or to expand existing properties, in many cases demonstrating the “Not in My Backyard” phenomenon. Such factors could make it difficult to develop new development sites and to expand existing
assets. The failure to receive, renew or maintain any required permits or approvals may result in increased compliance costs, the need
for additional capital expenditures or a suspension of some operations.
We may acquire assets opportunistically, which will involve a higher risk of loss than more conservative investment strategies.
While we primarily invest in stabilized income-generating commercial real estate, we to a lesser extent acquire opportunistic assets that we can reposition, redevelop or remarket to create value enhancement and capital appreciation. This may involve the acquisition of properties in markets that are depressed or overbuilt, or have high growth potential in real estate lease rates and sale prices. As a result of our investment in these types of markets, we will face increased risks relating to changes in local market conditions and increased competition for similar properties in the same market, as well as increased risks that these markets will not recover and the value of our properties in these markets will not increase, or will decrease, over time. We may also acquire land that requires development, including for data center properties, and there is no guarantee that we will be able to develop such land successfully or at all. For these and other reasons, we cannot assure you that we will be profitable or that we will realize growth in the value of our real estate properties, and as a result, our ability to make distributions to our stockholders could be affected. Our intended investment approach to acquiring and operating income-generating properties involves more risk than comparable real estate programs that have a targeted holding period for investments that is longer than ours, utilize leverage to a lesser degree or employ more conservative investment strategies.
Risks Related to Investments in Real Estate Debt.
Investments in real estate debt are subject to risks including various creditor risks and early redemption features which may materially adversely affect our results of operations and financial condition.
The debt and other interests in which we may invest may include secured or unsecured debt at various levels of an issuer’s capital structure. The real estate debt in which we may invest may not be protected by financial covenants or limitations upon additional indebtedness, may be illiquid or have limited liquidity, and may not be rated by a credit rating agency. Real estate debt is also subject to other creditor risks, including (i) the possible invalidation of an investment transaction as a “fraudulent conveyance” under relevant creditors’ rights laws, (ii) so-called lender liability claims by the issuer of the obligation and (iii) environmental liabilities that may arise with respect to collateral securing the obligations. Our investments may be subject to early redemption features, refinancing options, pre-payment options or similar provisions which, in each case, could result in the issuer repaying the principal on an obligation held by us earlier than expected, resulting in a lower return to us than anticipated or reinvesting in a new obligation at a lower return to us.
Our debt investments face prepayment risk and interest rate fluctuations that may adversely affect our results of operations and financial condition.
During periods of declining interest rates, the issuer of a security or borrower under a loan may exercise its option to prepay principal earlier than scheduled, forcing us to reinvest the proceeds from such prepayment in lower yielding securities or loans, which may result in a decline in our return. Debt investments frequently have call features that allow the issuer to redeem the security at dates prior to its stated maturity at a specified price (typically greater than par) only if certain prescribed conditions are met. An issuer may choose to redeem debt if, for example, the issuer can refinance the debt at a lower cost due to declining interest rates or an improvement in the credit standing of the issuer. In addition, the market price of our investments will change in response to changes in interest rates and other factors. During periods of declining interest rates, the market price of fixed-rate debt investments generally rises. Conversely, during periods of rising interest rates, the market price of such investments generally declines. The magnitude of these fluctuations in the market price of debt investments is generally greater for securities with longer maturities. In 2022 and 2023
46
the U.S. Federal Reserve raised benchmark overnight interest rates on multiple occasions and may further increase rates in 2024, which has increased, and could continue to increase, our interest rate payments. Any further increases by the U.S. Federal Reserve or other relevant central banks to the benchmark interest rates could also negatively impact the price of debt instruments and could adversely affect the value of our investments and the NAV and price per share of our shares.
Reinvestment risk could affect the price for our shares or their overall returns.
Reinvestment risk is the risk that income from our portfolio will decline if we invest the proceeds from matured, traded or called securities at market interest rates that are below our real estate debt portfolio’s current earnings rate. A decline in income could affect the NAV of our shares or their overall returns.
Debt-oriented real estate investments face a number of general market-related risks that can affect the creditworthiness of issuers, and modifications to certain loan structures and market terms make it more difficult to monitor and evaluate investments.
Any deterioration of real estate fundamentals generally, and in the United States in particular, could negatively impact our performance by making it more difficult for issuers to satisfy their debt payment obligations, increasing the default risk applicable to issuers, and/or making it relatively more difficult for us to generate attractive risk-adjusted returns. Changes in general economic conditions will affect the creditworthiness of issuers and/or real estate collateral relating to our investments and may include economic and/or market fluctuations, changes in environmental and zoning laws, casualty or condemnation losses, regulatory limitations on rents, decreases in property values, changes in the appeal of properties to tenants, changes in supply and demand for competing properties in an area (as a result, for instance, of overbuilding), fluctuations in real estate fundamentals (including average occupancy, operating income and room rates for hotel properties), the financial resources of tenants, changes in availability of debt financing which may render the sale or refinancing of properties difficult or impracticable, changes in building, environmental and other laws, energy and supply shortages, various uninsured or uninsurable risks, natural disasters, political events, trade barriers, currency exchange controls, changes in government regulations (such as rent control), changes in real property tax rates and operating expenses, changes in interest rates, changes in the availability of debt financing and/or mortgage funds which may render the sale or refinancing of properties difficult or impracticable, increased mortgage defaults, increases in borrowing rates, changes in consumer spending, outbreaks of an infectious disease, epidemics/pandemics or other serious public health concerns, negative developments in the economy or political climate that depress travel activity (including restrictions on travel or quarantines imposed), environmental liabilities, contingent liabilities on disposition of assets, acts of God, terrorist attacks, war (including the ongoing hostilities between Russia and Ukraine and more recently, conflict and escalating tensions in the Middle East), demand and/or real estate values generally and other factors that are beyond the control of the Adviser. Such changes may develop rapidly and it may be difficult to determine the comprehensive impact of such changes on our investments, particularly for investments that may have inherently limited liquidity. These changes may also create significant volatility in the markets for our investments which could cause rapid and large fluctuations in the values of such investments. Recent concerns about the real estate market, rising interest rates, inflation, energy costs and geopolitical issues have contributed to increased volatility and diminished expectations for the economy and markets going forward. There can be no assurance that there will be a ready market for the resale of our debt investments because such investments may not be liquid. Illiquidity may result from the absence of an established market for the investments, as well as legal or contractual restrictions on their resale by us. The value of securities of companies which service the real estate business sector may also be affected by such risks.
The Adviser cannot predict whether economic conditions generally, and the conditions for real estate debt investing in particular, will deteriorate in the future. Declines in the performance of the U.S. and global economies or in the real estate debt markets could have a material adverse effect on our investment activities. In addition, market conditions relating to real estate debt investments have evolved since the financial crisis, which has resulted in a modification to certain loan structures and market terms. For example, it has become increasingly difficult for real estate debt investors in certain circumstances to receive full transparency with respect to underlying investments because transactions are often effectuated on an indirect basis through pools or conduit vehicles rather than directly with the borrower. These and other similar changes in loan structures or market terms may make it more difficult for us to monitor and evaluate investments.
The operating and financial risks of issuers and the underlying default risk across capital structures may adversely affect our results of operations and financial condition.
Our securities investments involve credit or default risk, which is the risk that an issuer or borrower will be unable to make principal and interest payments on its outstanding debt when due. The risk of default and losses on real estate debt instruments will be affected by a number of factors, including global, regional and local economic conditions, interest rates, the commercial real estate market in general, an issuer’s equity and the financial circumstances of the issuer, as well as general economic conditions. Such default risk will be heightened to the extent we make relatively junior investments in an issuer’s capital structure since such investments are structurally subordinate to more senior tranches in such issuer’s capital structure, and our overall returns would be adversely affected to the extent one or more issuers is unable to meet its debt payment obligations when due. To the extent we hold an equity or
47
“mezzanine” interest in any issuer that is unable to meet its debt payment obligations, such equity or mezzanine interest could become subordinated to the rights of such issuer’s creditors in a bankruptcy. See “—We invest in subordinated debt, which is subject to greater credit risk than senior debt” below. Furthermore, the financial performance of one or more issuers could deteriorate as a result of, among other things, adverse developments in their businesses, changes in the competitive environment or an economic downturn. As a result, underlying properties or issuers that we expected to be stable may operate, or expect to operate, at a loss or have significant fluctuations in ongoing operating results, may otherwise have a weak financial condition or be experiencing financial distress and subject our investments to additional risk of loss and default.
We generally invest in high-yield debt which is generally subject to more risk than higher rated securities.
Debt that is, at the time of purchase, rated below investment grade (below Baa by Moody’s and below BBB by S&P and Fitch), an equivalent rating assigned by another nationally recognized statistical rating organization or unrated but judged by the Adviser to be of comparable quality are commonly referred to as “high-yield” securities.
Investments in high-yield securities generally provide greater income and increased opportunity for capital appreciation than investments in higher quality securities, but they also typically entail greater price volatility and principal and income risk, including the possibility of issuer default and bankruptcy. High-yield securities are regarded as predominantly speculative with respect to the issuer’s continuing ability to meet principal and interest payments. Debt instruments in the lowest investment grade category also may be considered to possess some speculative characteristics by certain rating agencies. In addition, analysis of the creditworthiness of issuers of high-yield securities may be more complex than for issuers of higher quality securities.
High-yield securities may be more susceptible to real or perceived adverse economic and competitive industry conditions than investment grade securities. A projection of an economic downturn or of a period of rising interest rates, for example, could cause a decline in high yield security prices because the advent of a recession could lessen the ability of an issuer to make principal and interest payments on its debt obligations. If an issuer of high yield securities defaults, in addition to risking non-payment of all or a portion of interest and principal, we may incur additional expenses to seek recovery. The market prices of high-yield securities structured as zero-coupon, step-up or payment-in-kind securities will normally be affected to a greater extent by interest rate changes, and therefore tend to be more volatile than the prices of securities that pay interest currently and in cash.
The secondary market on which high-yield securities are traded may be less liquid than the market for investment grade securities. Less liquidity in the secondary trading market could adversely affect the price at which we could sell a high yield security, and could adversely affect the NAV of our shares. Adverse publicity and investor perceptions, whether or not based on fundamental analysis, may decrease the values and liquidity of high yield securities, especially in a thinly-traded market. When secondary markets for high yield securities are less liquid than the market for investment grade securities, it may be more difficult to value the securities because such valuation may require more research, and elements of judgment may play a greater role in the valuation because there is less reliable, objective data available. During periods of thin trading in these markets, the spread between bid and asked prices is likely to increase significantly and we may have greater difficulty selling our portfolio securities. We will be more dependent on the Adviser’s research and analysis when investing in high-yield securities.
Some of our securities investments may become distressed, which securities would have a high risk of default and may be illiquid.
While it is generally anticipated that our real estate-related investments will focus primarily on investments in non-distressed real estate-related interests (based on our belief that there is not a low likelihood of repayment), our investments may become distressed following our acquisition thereof. Additionally, we may invest in real estate debt investments that we believe are available to purchase at “discounted” rates or “undervalued” prices. Purchasing real estate debt at what may appear to be “undervalued” or “discounted” levels is no guarantee that these investments will generate attractive returns to us or will not be subject to further reductions in value. There is no assurance that such investments can be acquired at favorable prices, that such investments will not default, or that the market for such interests will improve. In addition, the market conditions for real estate debt investments may deteriorate further, which could have an adverse effect on the performance of our investments.
During an economic downturn or recession, securities of financially troubled or operationally troubled issuers are more likely to go into default than securities of other issuers. Securities of financially troubled issuers and operationally troubled issuers are less liquid and more volatile than securities of companies not experiencing financial difficulties. The market prices of such securities are subject to erratic and abrupt market movements and the spread between bid and asked prices may be greater than normally expected. Investment in the securities of financially troubled issuers and operationally troubled issuers involves a high degree of credit and market risk. There is no assurance that the Adviser will correctly evaluate the value of the assets collateralizing such investments or the prospects for a successful reorganization or similar action.
48
These financial difficulties may never be overcome and may cause issuers to become subject to bankruptcy or other similar administrative proceedings, or may require a substantial amount of workout negotiations or restructuring, which may entail, among other things, an extension of the term, a substantial reduction in the interest rate, a substantial writedown of the principal of such investment and other concessions which could adversely affect our returns on the investment. There is a possibility that we may incur substantial or total losses on our investments and in certain circumstances, subject us to certain additional potential liabilities that may exceed the value of our original investment therein.
For example, under certain circumstances, a lender who has inappropriately exercised control over the management and policies of a debtor may have its claims subordinated or disallowed or may be found liable for damages suffered by parties as a result of such actions. In any reorganization or liquidation proceeding relating to our investments, we may lose our entire investment, may be required to accept cash or securities with a value less than our original investment and/or may be required to accept different terms, including payment over an extended period of time. In addition, under certain circumstances payments to us may be reclaimed if any such payment or distribution is later determined to have been a fraudulent conveyance, preferential payment, or similar transactions under applicable bankruptcy and insolvency laws. Furthermore, bankruptcy laws and similar laws applicable to administrative proceedings may delay our ability to realize on collateral for loan positions we held, or may adversely affect the economic terms and priority of such loans through doctrines such as equitable subordination or may result in a restructure of the debt through principles such as the “cramdown” provisions of the bankruptcy laws.
However, even if a restructuring were successfully accomplished, a risk exists that, upon maturity of such investment, replacement “takeout” financing will not be available, resulting in an inability by the issuer to repay the investment. Although unlikely, it is possible that the Adviser may find it necessary or desirable to foreclose on collateral securing one or more real estate debt we acquire. The foreclosure process varies jurisdiction by jurisdiction and can be lengthy and expensive. Issuers often resist foreclosure actions by asserting numerous claims, counterclaims and defenses against the holder of a real estate loan, including, without limitation, lender liability claims and defenses, even when such assertions may have no basis in fact, in an effort to prolong the foreclosure action, which often prolongs and complicates an already difficult and time consuming process. In some states or other jurisdictions, foreclosure actions can take up to several years or more to conclude. During the foreclosure proceedings, an issuer may have the ability to file for bankruptcy, potentially staying the foreclosure action and further delaying the foreclosure process. Foreclosure litigation tends to create a negative public image of the collateral property and may result in disrupting ongoing leasing, management, development and other operations of the property. In the event we foreclose on an investment, we will be subject to the risks associated with owning and operating real estate.
Certain risks associated with CMBS may adversely affect our results of operations and financial condition.
We invest a portion of our assets in pools or tranches of CMBS, including horizontal and other risk retention investments. The collateral underlying CMBS generally consists of commercial mortgages on real property that has a rental housing or commercial use, such as retail space, office buildings, warehouse property and hotels, and which from time to time include assets or properties owned directly or indirectly by one or more Other Blackstone Accounts. CMBS have been issued in a variety of issuances, with varying structures including senior and subordinated classes. The commercial mortgages underlying CMBS generally face the risks described above in “—We may invest in commercial mortgage loans which are non-recourse in nature and include limited options for financial recovery in the event of default; an event of default may adversely affect our results of operations and financial condition.”
Mortgage-backed securities may also have structural characteristics that distinguish them from other securities. The interest rate payable on these types of securities may be set or effectively capped at the weighted average net coupon of the underlying assets themselves. As a result of this cap, the return to investors in such a security would be dependent on the relevant timing and rate of delinquencies and prepayments of mortgage loans bearing a higher rate of interest. In general, early prepayments will have a greater impact on the yield to investors. Federal and state law may also affect the return to investors by capping the interest rates payable by certain mortgagors. Certain mortgage-backed securities may provide for the payment of only interest for a stated period of time. In addition, in a bankruptcy or similar proceeding involving the originator or the servicer of the CMBS (often the same entity or an affiliate), the assets of the issuer of such securities could be treated as never having been truly sold to the originator to the issuer and could be substantively consolidated with those of the originator, or the transfer of such assets to the issuer could be voided as a fraudulent transfer.
The credit markets, including the CMBS market, have periodically experienced decreased liquidity on the primary and secondary markets during periods of market volatility. Such market conditions could re-occur and would impact the valuations of our investments and impair our ability to sell such investments if we were required to liquidate all or a portion of our CMBS investments quickly. Additionally, certain of our securities investments, such as horizontal or other risk retention investments in CMBS, may have certain holding period and other restrictions that limit our ability to sell such investments.
49
Concentrated CMBS investments may pose specific risks beyond the control of the Adviser that may adversely affect our results of operations and financial condition.
Default risks with respect to CMBS investments may be further pronounced in the case of single-issuer CMBSs or CMBSs secured by a small or less diverse collateral pool, which is the majority of our real estate debt portfolio. At any one time, a portfolio of CMBS may be backed by commercial mortgage loans disproportionately secured by properties in only a few states, regions or foreign countries. As a result, such investments may be more susceptible to geographic risks relating to such areas, including adverse economic conditions, declining home values, adverse events affecting industries located in such areas and other factors beyond the control of the Adviser relative to investments in multi-issuer CMBS or a pool of mortgage loans having more diverse property locations.
The quality of the CMBS is dependent on the credit quality and selection of the mortgages for each issuance.
CMBS are also affected by the quality of the credit extended. As a result, the quality of the CMBS is dependent upon the selection of the commercial mortgages for each issuance and the cash flow generated by the commercial real estate assets, as well as the relative diversification of the collateral pool underlying such CMBS and other factors such as adverse selection within a particular tranche or issuance.
There are certain risks associated with the insolvency of obligations backing mortgage-backed securities and other investments.
The real estate loans backing the mortgage-backed securities (“MBS”) and other investments may be subject to various laws enacted in the jurisdiction or state of the borrower for the protection of creditors. If an unpaid creditor files a lawsuit seeking payment, the court may invalidate all or part of the borrower’s debt as a fraudulent conveyance, subordinate such indebtedness to existing or future creditors of the borrower or recover amounts previously paid by the borrower in satisfaction of such indebtedness, based on certain tests for borrower insolvency and other facts and circumstances, which may vary by jurisdiction. There can be no assurance as to what standard a court would apply in order to determine whether the borrower was “insolvent” after giving effect to the incurrence of the indebtedness constituting the mortgage backing the MBS and other investments, or that regardless of the method of valuation, a court would not determine that the borrower was “insolvent” after giving effect to such incurrence. In addition, in the event of the insolvency of a borrower, payments made on such mortgage loans could be subject to avoidance as a “preference” if made within a certain period of time (which may be as long as one year and one day) before insolvency.
There are certain risks associated with MBS interest shortfalls.
Our MBS investments may be subject to interest shortfalls due to interest collected from the underlying loans not being sufficient to pay accrued interest to all of the MBS interest holders. Interest shortfalls to the MBS trust will occur when the servicer does not advance full interest payments on defaulted loans. The servicer in a MBS trust is required to advance monthly principal and interest payments due on a delinquent loan. Once a loan is delinquent for a period of time (generally 60 days), the servicer is required to obtain a new appraisal to determine the value of the property securing the loan. The servicer is only required to advance interest based on the lesser of the loan amount or 90%, generally, of the appraised value. Interest shortfalls occur when 90%, generally, of the appraised value is less than the loan amount and the servicer does not advance interest on the full loan amount. The resulting interest shortfalls impact interest payments on the most junior class in the trust first. As interest shortfalls increase, more senior classes may be impacted. Over time, senior classes may be reimbursed for accumulated shortfalls if the delinquent loans are resolved, but there is no guarantee that shortfalls will be collected. Interest shortfalls to the MBS trust may also occur as a result of accumulated advances and expenses on defaulted loans. When a defaulted loan or foreclosed property is liquidated, the servicer will be reimbursed for accumulated advances and expenses prior to payments to MBS bond holders. If proceeds are insufficient to reimburse the servicer or if a defaulted loan is modified and not foreclosed, the servicer is able to make a claim on interest payments that is senior to the bond holders to cover accumulated advances and expenses. If the claim is greater than interest collected on the loans, interest shortfalls could impact one or more bond classes in a MBS trust until the servicer’s claim is satisfied.
We have acquired and expect in the future to acquire MBS affiliated with Blackstone.
We have acquired and expect in the future to acquire MBS whereby mortgages underlying the MBS were issued or acquired by, properties underlying the mortgages in the MBS are owned by, and/or the MBS is serviced or structured by, a Blackstone affiliate. While we may acquire such MBS from third parties on terms already negotiated by and agreed with third parties and will forgo certain non-economic rights (including voting rights) in such MBS as long as the affiliation persists, which we believe should mostly mitigate any conflicts of interest, there is no assurance that such procedures will adequately address all of the conflicts of interest that may arise or will address such conflicts in a manner that results in the allocation of a particular investment opportunity to us or is otherwise favorable to us. Since certain of our executives are also executives of Blackstone, the same personnel may determine the price and terms for the investments for both us and these entities and there can be no assurance that any procedural protections, such as obtaining market prices or other reliable indicators of fair value, will prevent the consideration we pay for these investments from
50
exceeding their fair value or ensure that we receive terms for a particular investment opportunity that are as favorable as those available from an independent third party.
Our CMBS investments face risks associated with extensions that may adversely affect our results of operations and financial condition.
Our CMBS and other investments may be subject to extension, resulting in the term of the securities being longer than expected. Extensions are affected by a number of factors, including the general availability of financing in the market, the value of the related mortgaged property, the borrower’s equity in the mortgaged property, the financial circumstances of the borrower, fluctuations in the business operated by the borrower on the mortgaged property, competition, general economic conditions and other factors. Such extensions may also be made without the Adviser’s consent.
There are certain risks associated with the servicers of commercial real estate loans underlying CMBS and other investments.
The exercise of remedies and successful realization of liquidation proceeds relating to commercial real estate loans underlying CMBS and other investments may be highly dependent on the performance of the servicer or special servicer. The servicer may not be appropriately staffed or compensated to immediately address issues or concerns with the underlying loans. Such servicers may exit the business and need to be replaced, which could have a negative impact on the portfolio due to lack of focus during a transition. Special servicers frequently are affiliated with investors who have purchased the most subordinate bond classes, and certain servicing actions, such as a loan extension instead of forcing a borrower pay off, may benefit the subordinate bond classes more so than the senior bonds. While servicers are obligated to service the portfolio subject to a servicing standard and maximize the present value of the loans for all bond classes, servicers with an affiliate investment in the CMBS or other investments may have a conflict of interest. There may be a limited number of special servicers available, particularly those which do not have conflicts of interest. In addition, to the extent any such servicers fail to effectively perform their obligations pursuant to the applicable servicing agreements, such failure may adversely affect our investments.
We may invest in commercial mortgage loans which are non-recourse in nature and include limited options for financial recovery in the event of default; an event of default may adversely affect our results of operations and financial condition.
We may invest from time to time in commercial mortgage loans, including mezzanine loans and B-notes, which are secured by rental housing, commercial or other properties and are subject to risks of delinquency and foreclosure and risks of loss. Commercial real estate loans are generally not fully amortizing, which means that they may have a significant principal balance or balloon payment due on maturity. Full satisfaction of the balloon payment by a commercial borrower is heavily dependent on the availability of subsequent financing or a functioning sales market, as well as other factors such as the value of the property, the level of prevailing mortgage rates, the borrower’s equity in the property and the financial condition and operating history of the property and the borrower. In certain situations, and during periods of credit distress, the unavailability of real estate financing may lead to default by a commercial borrower. In addition, in the absence of any such takeout financing, the ability of a borrower to repay a loan secured by an income-generating property will depend upon the successful operation of such property rather than upon the existence of independent income or assets of the borrower. If the net operating income of the property is reduced, the borrower’s ability to repay the loan may be impaired. Furthermore, we may not have the same access to information in connection with investments in commercial mortgage loans, either when investigating a potential investment or after making an investment, as compared to publicly traded securities.
Commercial mortgage loans are usually non-recourse in nature. Therefore, if a commercial borrower defaults on the commercial mortgage loan, then the options for financial recovery are limited in nature. To the extent the underlying default rates with respect to the pool or tranche of commercial real estate loans in which we directly or indirectly invest increase, the performance of our investments related thereto may be adversely affected. Default rates and losses on commercial mortgage loans will be affected by a number of factors, including global, regional and local economic conditions in the area where the mortgage properties are located, the borrower’s equity in the mortgage property, the financial circumstances of the borrower, tenant mix and tenant bankruptcies, property management decisions, including with respect to capital improvements, property location and condition, competition from other properties offering the same or similar services, environmental conditions, real estate tax rates, tax credits and other operating expenses, governmental rules, regulations and fiscal policies, acts of God, terrorism, social unrest and civil disturbances. A continued decline in specific commercial real estate markets and property valuations may result in higher delinquencies and defaults and potentially foreclosures. In the event of default, the lender will have no right to assets beyond collateral attached to the commercial mortgage loan. The overall level of commercial mortgage loan defaults remains significant and market values of the underlying commercial real estate remain distressed in many cases. It has also become increasingly difficult for lenders to dispose of foreclosed commercial real estate without incurring substantial investment losses, ultimately leading to a decline in the value of such investments.
In the event of any default under a mortgage or real estate loan held directly by us, we will bear a risk of loss of principal to the extent of any deficiency between the value of the collateral and the principal and accrued interest of the mortgage or real estate loan, which could have a material adverse effect on our profitability. In the event of the bankruptcy of a mortgage or real estate loan borrower, the
51
mortgage or real estate loan to such borrower will be deemed to be secured only to the extent of the value of the underlying collateral at the time of bankruptcy (as determined by the bankruptcy court), and the lien securing the mortgage or real estate loan will be subject to the avoidance powers of the bankruptcy trustee or debtor-in-possession to the extent the lien is unenforceable under state law. Additionally, in the event of a default under any senior debt, the junior or subordinate lender generally forecloses on the equity, purchases the senior debt or negotiates a forbearance or restructuring arrangement with the senior lender in order to preserve its collateral.
We may invest in structured products or similar products that may include structural and legal risks.
We have and in the future may invest from time to time in structured products, including pools of mortgages, loans and other real estate-related interests. These investments may include debt securities issued by a private investment fund that invests, on a leveraged basis, in bank loans, high-yield debt or other asset groups, certificates issued by a structured investment vehicle that holds pools of commercial mortgage loans. We have and in the future may also invest in credit risk transfer notes that, while not structured products, face similar risks as structured products because they are debt securities issued by governmental agencies but their value depends in part on a pool of mortgage loans. Our investments in structured products are subject to a number of risks, including risks related to the fact that the structured products will be leveraged, and other structural and legal risks related thereto. Utilization of leverage is a speculative investment technique and will generally magnify the opportunities for gain and risk of loss borne by an investor investing in the subordinated debt securities. Many structured products contain covenants designed to protect the providers of debt financing to such structured products. A failure to satisfy those covenants could result in the untimely liquidation of the structured product and a complete loss of our investment therein. In addition, if the particular structured product is invested in a security in which we are also invested, this would tend to increase our overall exposure to the credit of the issuer of such securities, at least on an absolute, if not on a relative basis. The value of an investment in a structured product will depend on the investment performance of the assets in which the structured product invests and will, therefore, be subject to all of the risks associated with an investment in those assets. These risks include the possibility of a default by, or bankruptcy of, the issuers of such assets or a claim that the pledging of collateral to secure any such asset constituted a fraudulent conveyance or preferential transfer that can be subordinated to the rights of other creditors of the issuer of such asset or nullified under applicable law.
We have and may in the future acquire and sell residential credit investments, which may subject us to legal, regulatory and other risks that could adversely impact our business and financial results.
We have and may in the future invest directly and indirectly in residential credit investments, which may include performing loans, nonperforming loans, residential mortgage loans and RMBS, which represent interests in pools of residential mortgage loans secured by one to four family residential mortgage loans. Investments in residential credit (including RMBS) are subject to various risks and uncertainties, including credit, market, interest rate, structural and legal risk. These risks may be magnified by volatility in the economy and in real estate markets generally. Any downturn in the U.S. or global economies may adversely affect the financial condition of residential owners and tenants, making it more difficult for them to meet their periodic repayment obligations relating to residential real estate. Residential credits are not traded on an exchange and there may be a limited market for the securities, especially when there is a perceived weakness in the mortgage and real estate market sectors. In addition, interest and principal payments for RMBS are made more frequently than traditional debt securities and the principal of any RMBS may often be prepaid at any time because the underlying residential mortgage loans may be prepaid at any time.
Residential mortgage loans are obligations of the borrowers thereunder only and are not typically insured or guaranteed by any other person or entity, although such loans may be securitized by government agencies and the securities issued may be guaranteed. The rate of defaults and losses on residential mortgage loans will be affected by a number of factors, including general economic conditions and those in the geographic area where the mortgaged property is located, the terms of the mortgage loan, the borrower’s equity in the mortgaged property, and the financial circumstances of the borrower. Certain mortgage loans may be of sub-prime credit quality (i.e., do not meet the customary credit standards of Fannie Mae and Freddie Mac. Delinquencies and liquidation proceedings are more likely with sub-prime mortgage loans than with mortgage loans that satisfy customary credit standards. If a residential mortgage loan is in default, foreclosure of such residential mortgage loan may be a lengthy and difficult process, and may involve significant expenses. Furthermore, the market for defaulted residential mortgage loans or foreclosed properties may be very limited.
Residential mortgage loans in an issue of RMBS may also be subject to various U.S. federal and state laws, foreign laws, public policies and principles of equity that protect consumers which, among other things, may regulate interest rates and other fees, require certain disclosures, require licensing of originators, prohibit discriminatory lending practices, regulate the use of consumer credit information, and regulate debt collection practices. In addition, a number of legislative proposals have been introduced in the United States at the federal, state, and municipal level that are designed to discourage predatory lending practices. Violation of such laws, public policies, and principles may limit the servicer’s ability to collect all or part of the principal or interest on a residential mortgage loan, entitle the borrower to a refund of amounts previously paid by it, or subject the servicer to damages and administrative enforcement. Any such violation could also result in cash flow delays and losses on the related issue of RMBS.
52
Our investments in RMBS, which may include government mortgage pass-through securities and non-agency RMBS, are subject to certain other risks which may adversely affect our results of operations and financial condition.
Our investments in RMBS are subject to the risks of defaults, foreclosure timeline extension, fraud, home price depreciation and unfavorable modification of loan principal amount, interest rate and amortization of principal accompanying the underlying residential mortgage loans. To the extent that assets underlying our investments are concentrated geographically, by property type or in certain other respects, we may be subject to certain of the foregoing risks to a greater extent. In the event of defaults on the residential mortgage loans that underlie our investments in RMBS and the exhaustion of any underlying or any additional credit support, we may not realize our anticipated return on our investments and we may incur a loss on these investments. At any one time, a portfolio of RMBS may be backed by residential mortgage loans with disproportionately large aggregate principal amounts secured by properties in only a few states or regions in the United States or in only a few foreign countries. As a result, the residential mortgage loans may be more susceptible to geographic risks relating to such areas, such as adverse economic conditions, adverse political changes, adverse events affecting industries located in such areas and natural hazards affecting such areas, than would be the case for a pool of mortgage loans having more diverse property locations. We may also acquire non-agency RMBS, which are backed by residential property but, in contrast to agency RMBS, their principal and interest are not guaranteed by federally chartered entities such as the Fannie Mae and Freddie Mac and, in the case of the Government National Mortgage Association (“Ginnie Mae”), the U.S. government. In addition, we may invest in government mortgage pass-through securities, which represent participation interests in pools of residential mortgage loans purchased from individual lenders by a federal agency or originated by private lenders and guaranteed by a federal agency, including those issued or guaranteed by Ginnie Mae, Fannie Mae and Freddie Mac. Ginnie Mae certificates are direct obligations of the U.S. Government and, as such, are backed by the “full faith and credit” of the United States. Fannie Mae is a federally chartered, privately owned corporation and Freddie Mac is a corporate instrumentality of the United States. Fannie Mae and Freddie Mac certificates are not backed by the full faith and credit of the United States but the issuing agency or instrumentality has the right to borrow, to meet its obligations, from an existing line of credit with the U.S. Treasury. The U.S. Treasury has no legal obligation to provide such line of credit and may choose not to do so.
We will face risks related to our investments in collateralized debt obligations.
We may also invest from time to time in collateralized debt obligations (“CDOs”). CDOs include, among other things, collateralized loan obligations (“CLOs”) and other similarly structured securities. A CLO is a trust typically collateralized by a pool of loans, which may include, among others, domestic and foreign senior secured loans, senior unsecured loans and subordinate corporate loans, including loans that may be rated below investment grade or equivalent unrated loans. CDOs may charge a management fee and administrative expenses. For CLOs, the cash flows from the trust are split into two or more portions, called tranches, varying in risk and yield. The riskiest portion is the “equity” tranche which bears the bulk of defaults from the bonds or loans in the trust and serves to protect the other, more senior tranches from default in all but the most severe circumstances. Since it is partially protected from defaults, a senior tranche from a CLO trust typically has higher ratings and lower yields than the underlying securities, and can be rated investment grade. Despite the protection from the equity tranche, CLO tranches can experience substantial losses due to actual defaults, increased sensitivity to defaults due to collateral default and disappearance of protecting tranches, market anticipation of defaults and aversion to CLO securities as a class. The risks of an investment in a CDO depend largely on the type of the collateral and the class of the CDO in which we invest.
Normally, CLOs and other CDOs are privately offered and sold, and thus are not registered under the securities laws. As a result, certain investments in CDOs may be characterized as illiquid securities and volatility in CLO and CDO trading markets may cause the value of these investments to decline. Moreover, if the underlying mortgage portfolio has been overvalued by the originator, or if the values subsequently decline and, as a result, less collateral value is available to satisfy interest and principal payments and any other fees in connection with the trust or other conduit arrangement for such securities, we may incur significant losses. Also, with respect to the CLOs and CDOs in which we may invest, control over the related underlying loans will be exercised through a special servicer or collateral manager designated by a “directing certificate holder” or a “controlling class representative,” or otherwise pursuant to the related securitization documents. We may acquire classes of CLOs or CDOs for which we may not have the right to appoint the directing certificate holder or otherwise direct the special servicing or collateral management. With respect to the management and servicing of those loans, the related special servicer or collateral manager may take actions that could adversely affect our interests. In addition to the risks associated with debt instruments (e.g., interest rate risk and credit risk), CDOs carry additional risks including, but not limited to: (i) the possibility that distributions from collateral securities will not be adequate to make interest or other payments; (ii) the quality of the collateral may decline in value or default; (iii) the possibility that we may invest in CDOs that are subordinate to other classes; and (iv) the complex structure of the security may not be fully understood at the time of investment and may produce disputes with the issuer or unexpected investment results.
We invest in subordinated debt, which is subject to greater credit risk than senior debt.
We have in the past and may in the future from time to time invest in debt instruments, including junior tranches of CMBS and “mezzanine” or junior mortgage loans (e.g., B-Notes), that are subordinated in an issuer’s capital structure. To the extent we invest in
53
subordinated debt of an issuer’s capital structure, including subordinated CMBS bonds or other “mezzanine” debt, such investments and our remedies with respect thereto, including the ability to foreclose on any collateral securing such investments, will be subject to the rights of holders of more senior tranches in an issuer’s capital structure and, to the extent applicable, contractual inter-creditor, co-lender and participation agreement provisions.
Investments in subordinated debt involve greater credit risk of default and loss than the more senior classes or tranches of debt in an issuer’s capital structure. Subordinated tranches of debt instruments (including mortgage-backed securities) absorb losses from default before other more senior tranches of such instruments, which creates a risk particularly if such instruments (or securities) have been issued with little or no credit enhancement or equity. As a result, to the extent we invest in subordinate debt instruments (including mortgage-backed securities), we would likely receive payments or interest distributions after, and must bear the effects of losses or defaults on, the senior debt (including underlying mortgage loans, senior mezzanine debt or senior CMBS bonds) before, the holders of other more senior tranches of debt instruments with respect to such issuer.
We will face risks related to our investments in mezzanine loans.
Although not directly secured by the underlying real estate, mezzanine loans are also subject to risk of subordination and share certain characteristics of subordinate loan interests described above. As with commercial mortgage loans, repayment of a mezzanine loan is dependent on the successful operation of the underlying commercial properties and, therefore, is subject to similar considerations and risks. Mezzanine loans may also be affected by the successful operation of other properties, but mezzanine loans are not secured by interests in the underlying commercial properties.
With most mezzanine loans, the bulk of the loan balance is payable at maturity with a one-time “balloon payment.” Full satisfaction of the balloon payment by a borrower is heavily dependent on the availability of subsequent financing or a functioning sales market, and full satisfaction of a loan will be affected by a borrower’s access to credit or a functioning sales market. In certain situations, and during periods of credit distress, the unavailability of real estate financing may lead to default by a borrower. In addition, in the absence of any such takeout financing, the ability of a borrower to repay a loan may be impaired. Moreover, mezzanine loans are usually non-recourse in nature. Therefore, if a borrower defaults on the loan, then the options for financial recovery are limited in nature. To the extent the underlying default rates with respect to the pool or tranche of commercial real estate loans in which we directly or indirectly invest increase, the performance of our investments related thereto may be adversely affected.
B-Notes and A/B Structures may pose additional risks that may adversely affect our results of operations and financial condition.
We may invest in B-notes, which are mortgage loans typically (i) secured by a first mortgage on a commercial property or group of related properties and (ii) subordinated to an A-note portion of the same first mortgage secured by the same collateral (which we would not expect to hold). As a result, if a borrower defaults, there may not be sufficient funds remaining to repay B-note holders after payment to the A-note holders. Since each transaction is privately negotiated, B-notes can vary in their structural characteristics and risks. In addition to the risks described above, certain additional risks apply to B-note investments, including those described herein. The B-note portion of a loan is typically small relative to the overall loan, and is in the first loss position. As a means to protect against the holder of the A-note from taking certain actions or, receiving certain benefits to the detriment of the holder of the B-note, the holder of the B-note often (but not always) has the right to purchase the A-note from its holder. If available, this right may not be meaningful to us. For example, we may not have the capital available to protect our B-note interest or purchasing the A-note may alter our overall portfolio and risk/return profile to the detriment of our stockholders. In addition, a B-note may be in the form of a “rake bond.” A “rake bond” is a CMBS backed solely by a single promissory note secured by a mortgaged property, which promissory note is subordinate in right of payment to one or more separate promissory notes secured by the same mortgaged property.
We may invest in a wide range of real estate debt pursuant to our broad investment guidelines.
Pursuant to our broad investment guidelines, our real estate debt investments may include, but are not limited to, CMBS, real estate-related corporate credit, mortgages, loans, mezzanine and other forms of debt (including residential mortgage-backed securities and other residential credit and debt of real estate-related companies), preferred equity and derivatives, and such investments may not be secured by real estate assets. The Adviser may also employ new investment techniques or invest in new instruments that it believes will help achieve our investment objectives, whether or not such investment techniques or instruments are specifically defined herein, so long as such investments are consistent with the investment guidelines and our charter. New investment techniques or instruments may not be thoroughly tested in the market before being employed and may have operational or theoretical shortcomings which could result in unsuccessful investments and, ultimately, losses to us. In addition, any new investment technique or instrument developed by us may be more speculative than earlier investment techniques or instruments and may involve material and unanticipated risks. Our board of directors may also change our investment guidelines without the consent of our stockholders.
54
We invest in real estate-related equity, which is subordinate to any indebtedness, but involves different rights.
We have in the past and may in the future invest from time to time in non-controlling preferred equity positions, common equity and other real estate-related interests. Preferred equity investments generally rank junior to all existing and future indebtedness, including commercial mezzanine and mortgage loans, but rank senior to the owners’ common equity. Preferred equity investments typically pay a dividend rather than interest payments and often have the right for such dividends to accrue if there is insufficient cash flow to pay currently. These interests are not secured by the underlying real estate, but upon the occurrence of a default, the preferred equity provider typically has the right to effectuate a change of control with respect to the ownership of the property. In addition, equity investments may be illiquid or have limited liquidity due to lock-out periods, limited trading volume or other limitations or prohibitions against their transfer, sale, pledge or disposition, including any necessary registration with the SEC requiring coordination with the issuer for the sale of such securities. Our investments in real estate-related equity securities will involve risks relating to the particular issuer of the equity securities, including the financial condition and business outlook of the issuer. Issuers of real estate-related equity securities are subject to their own operating and other expenses and may be subject to a management fee and/or performance-based compensation (e.g., promote), which we as equity holders will indirectly bear. Issuers of real estate-related common equity securities generally invest in real estate or real estate-related assets and are subject to the inherent risks associated with real estate discussed in “— Risks Related to Investments in Real Estate.”
We invest in real estate corporate debt, which consists of secured and unsecured obligations issued by companies in the business of owning and/or operating real estate-related businesses.
We have in the past and may in the future invest in corporate debt obligations of varying maturities issued by U.S. and foreign corporations and other business entities, which may include loans, corporate bonds, debentures, notes and other similar corporate debt instruments, including convertible securities. Bonds are fixed or variable rate debt obligations, including bills, notes, debentures, money market instruments and similar instruments and securities. Corporate debt is generally used by corporations and other issuers to borrow money from investors. The issuer pays the investor a rate of interest and normally must repay the amount borrowed on or before maturity. The rate of interest on corporate debt may be fixed, floating or variable, and may vary inversely with respect to a reference rate. The rate of return or return of principal on some debt obligations may be linked or indexed to the level of exchange rates between the U.S. dollar and a foreign currency or currencies. Debt instruments may be acquired with warrants attached. Certain bonds are “perpetual” in that they have no maturity date.
Our investments in real estate-related corporate credit are subject to a number of risks, including interest rate risk, credit risk, high yield risk, issuer risk, foreign (non-U.S.) investment risk, inflation/deflation risk, liquidity risk, smaller company risk and management risk. We generally will not have direct recourse to real estate assets owned or operated by the issuers of the corporate debt obligations that we invest in and the value of such corporate debt obligations may be impacted by numerous factors and may not be closely tied to the value of the real estate held by the corporate issuer.
We invest in equity of other REITs that invest in real estate or real estate debt as one of their core businesses and other real estate-related companies, which subjects us to certain risks including those risks associated with an investment in our own common stock.
REITs that invest primarily in real estate or real estate debt are subject to the risks of the real estate market, the real estate debt market and the securities market. REITs are dependent upon specialized management skills, have limited diversification and are, therefore, subject to risks inherent in financing a limited number of projects. REITs may be subject to management fees and other expenses, and so when we invest in REITs we will bear our proportionate share of the costs of the REITs’ operations. Investing in REITs and real estate-related companies involves certain unique risks in addition to those risks associated with investing in the real estate industry in general. The market value of REIT shares and the ability of the REIT to distribute income may be adversely affected by several factors, including the risks described herein that relate to an investment in our common stock. REITs depend generally on their ability to generate cash flow to make distributions to shareholders, and certain REITs have self-liquidation provisions by which mortgages held may be paid in full and distributions of capital returns may be made at any time. In addition, distributions received by us from REITs may consist of dividends, capital gains and/or return of capital. Generally, dividends received by us from REIT shares and distributed to our stockholders will not constitute “qualified dividend income” eligible for the reduced tax rate applicable to qualified dividend income. In addition, the performance of a REIT may be affected by changes in the tax laws or by its failure to qualify for tax-free pass-through of income.
REITs (especially mortgage REITs) are also subject to interest rate risk. Rising interest rates may cause REIT investors to demand a higher annual yield, which may, in turn, cause a decline in the market price of the equity securities issued by a REIT.
Investing in certain REITs and real estate-related companies, which often have small market capitalizations, may also involve the same risks as investing in other small capitalization companies. REITs and real estate-related companies may have limited financial resources and their securities may trade less frequently and in limited volume and may be subject to more abrupt or erratic price movements than larger company securities.
55
Certain of our investments may require development or otherwise have additional capital requirements.
Certain of our investments, including those that may be in a development phase, are expected to require additional financing to satisfy their working capital requirements or development strategies. The amount of such additional financing needed could be significant and will depend upon the maturity and objectives of the particular asset, which may be an unfavorable price at such time. Each round of financing (whether from us or other investors) is typically intended to provide enough capital to reach the next major milestone in an asset’s life-cycle. If the funds provided are not sufficient, additional capital may be required to be raised at a price unfavorable to the existing investors, including us. In addition, we may make additional debt and equity investments or exercise warrants, options, convertible securities or other rights that were acquired in the initial investment in such portfolio company in order to preserve our proportionate ownership when a subsequent financing is planned, or to protect our investment when such portfolio company’s performance does not meet expectations. The availability of capital is generally a function of capital market conditions that are beyond the control of us or any portfolio company. There can be no assurance that we or any portfolio company will be able to predict accurately the future capital requirements necessary for success or that additional funds will be available from any source. Failure to provide sufficient additional capital with respect to an investment could adversely affect our performance.
We may face “spread widening” risk related to our investment in securities.
For reasons not necessarily attributable to any of the risks set forth herein (for example, supply/demand imbalances or other market forces), the market spreads of the securities in which we invest may increase substantially causing the securities prices to fall. It may not be possible to predict, or to hedge against, such “spread widening” risk. The perceived discount in pricing described under “—Some of our securities investments may become distressed, which securities would have a high risk of default and may be illiquid.” may still not reflect the true value of the real estate assets underlying such real estate debt in which we may invest, and therefore further deterioration in value with respect thereto may occur following our investment therein. In addition, mark-to-market accounting of our investments will have an interim effect on the reported value prior to realization of an investment.
We utilize derivatives, which involve numerous risks.
We have in the past and may in the future enter into derivatives transactions including, but not limited to, options contracts, futures contracts, options on futures contracts, forward contracts, interest rate swaps, total return swaps, credit default swaps and other swap agreements for investment, hedging or leverage purposes. Derivative instruments, especially when purchased in large amounts, may not be liquid in all circumstances, so that in volatile markets we may not be able to close out a position without incurring a loss. Our use of derivative instruments may be particularly speculative and involves investment risks and transaction costs to which we would not be subject absent the use of these instruments, and use of derivatives generally involves leverage in the sense that the investment exposure created by the derivatives may be significantly greater than our initial investment in the derivative. Leverage magnifies investment, market and certain other risks. Thus, the use of derivatives may result in losses in excess of principal and greater than if they had not been used. The value of such derivatives also depends upon the price of the underlying instrument or commodity. Such derivatives and other customized instruments also are subject to the risk of non-performance by the relevant counterparty. In addition, actual or implied daily limits on price fluctuations and speculative position limits on the exchanges or over-the-counter markets in which we may conduct our transactions in derivative instruments may prevent prompt liquidation of positions, subjecting us to the potential of greater losses. Derivative instruments that may be purchased or sold by us may include instruments not traded over-the-counter or on an exchange. The risk of nonperformance by the obligor on such an instrument may be greater and the ease with which we can dispose of or enter into closing transactions with respect to such an instrument may be less than in the case of an exchange-traded instrument. In addition, significant disparities may exist between “bid” and “asked” prices for derivative instruments that are traded over-the-counter and not on an exchange. Such over-the-counter derivatives are also subject to types and levels of investor protections or governmental regulation that may differ from exchange traded instruments.
The ability to successfully use derivative investments depends on the ability of the Adviser. The skills needed to employ derivatives strategies are different from those needed to select portfolio investments and, in connection with such strategies, the Adviser must make predictions with respect to market conditions, liquidity, market values, interest rates or other applicable factors, which may be inaccurate. The use of derivative investments may require us to sell or purchase portfolio investments at inopportune times or for prices below or above the current market values, may limit the amount of appreciation we can realize on an investment or may cause us to hold a security that we might otherwise want to sell. We will also be subject to credit risk with respect to the counterparties to our derivatives contracts (whether a clearing corporation in the case of exchange-traded instruments or another third party in the case of over-the-counter instruments). In addition, the use of derivatives will be subject to additional unique risks associated with such instruments including a lack of sufficient asset correlation, heightened volatility in reference to interest rates or prices of reference instruments and duration/term mismatch, each of which may create additional risk of loss.
56
Failure to obtain and maintain an exemption from being regulated as a commodity pool operator could subject us to additional regulation and compliance requirements that could materially adversely affect our business, results of operations and financial condition.
Registration with the U.S. Commodity Futures Trading Commission (the “CFTC”) as a “commodity pool operator” or any change in our operations (including, without limitation, any change that causes us to be subject to certain specified covered statutory disqualifications) necessary to maintain our ability to rely upon the exemption from being regulated as a commodity pool operator could adversely affect our ability to implement our investment program, conduct our operations and/or achieve our objectives and subject us to certain additional costs, expenses and administrative burdens. Furthermore, any determination by us to cease or to limit investing in interests that may be treated as “commodity interests” in order to comply with the regulations of the CFTC may have a material adverse effect on our ability to implement our investment objectives and to hedge risks associated with our operations.
We may make open market purchases or invest in traded securities.
Although not anticipated to be a large component of our investment strategy, we have the ability to invest in securities that are traded (publicly or through other active markets (including through private transactions)) and are, therefore, subject to the risks inherent in investing in traded securities. When investing in traded securities, we may be unable to obtain financial covenants or other contractual governance rights, including management rights that it might otherwise be able to obtain in making privately negotiated investments. Moreover, we may not have the same access to information in connection with investments in traded securities, either when investigating a potential investment or after making the investment, as compared to privately negotiated investments. Furthermore, we may be limited in our ability to make investments, and to sell existing investments, in traded securities because Blackstone may be deemed to have material, non-public information regarding the issuers of those securities or as a result of other internal policies or requirements. The inability to sell traded securities in these circumstances could materially adversely affect the investment results. In addition, securities acquired of a public company may, depending on the circumstances and securities laws of the relevant jurisdiction, be subject to lock-up periods.
Political changes may affect the real estate debt markets.
The current regulatory environment in the United States may be impacted by future legislative developments and the regulatory agenda of the then-current U.S. President. The U.S. Department of the Treasury has issued a series of recommendations in several reports for streamlining banking regulation and changing key features of the Dodd-Frank Act and other measures taken by regulators following the 2008 financial crisis.
The outcome of congressional and other elections creates uncertainty with respect to legal, tax and regulatory regimes in which we and our investments, as well as the Adviser and its affiliates, will operate. Any significant changes in, among other things, economic policy (including with respect to interest rates and foreign trade), the regulation of the investment management industry, tax law, immigration policy and/or government entitlement programs could have a material adverse impact on us and our investments.
57
We may utilize non-recourse securitizations of certain of our CMBS investments, which may expose us to risks that could result in losses.
We may seek to utilize non-recourse securitizations of certain of our CMBS investments to the extent consistent with REIT and Investment Company Act requirements. This would likely involve us creating a special-purpose vehicle, contributing a pool of our assets to the entity, and selling interests in the entity on a non-recourse basis to purchasers (whom we would expect to be willing to accept a lower interest rate to invest in investment-grade loan pools). We would expect to retain all or a portion of the equity in the securitized pool of loans or investments. Prior to any such financing, we may use short-term facilities to finance the acquisition of securities until a sufficient quantity of securities had been accumulated, at which time we would refinance these facilities through a securitization, such as a CMBS, or issuance of CLOs, or the private placement of loan participations or other long-term financing. If we were to employ this strategy, we would be subject to the risk that we would not be able to acquire, during the period that our short-term facilities are available, a sufficient amount of eligible securities to maximize the efficiency of a CMBS, CLO or private placement issuance. We also would be subject to the risk that we would not be able to obtain short-term credit facilities or would not be able to renew any short-term credit facilities after they expire should we find it necessary to extend our short-term credit facilities to allow more time to seek and acquire the necessary eligible securities for a long-term financing. The inability to consummate securitizations of our portfolio to finance our loans and investments on a long-term basis could require us to seek other forms of potentially less attractive financing or to liquidate assets at an inopportune time or price, which could adversely affect our performance and our ability to grow our business. Moreover, conditions in the capital markets, including volatility and disruption in the capital and credit markets, may not permit a non-recourse securitization at any particular time or may make the issuance of any such securitization less attractive to us even when we do have sufficient eligible assets. We may also suffer losses if the value of the mortgage loans we acquire declines prior to securitization. Declines in the value of a mortgage loan can be due to, among other things, changes in interest rates and changes in the credit quality of the loan. In addition, transaction costs incurred in executing transactions impact any liability that we may incur, or may be required to reserve for, in connection with executing a transaction can cause a loss to us. To the extent that we incur a loss executing or participating in future securitizations for the reasons described above or for other reasons, it could materially and adversely impact our business and financial condition.
In addition, the securitization of investments in our portfolio might magnify our exposure to losses because any equity interest we retain in the issuing entity would be subordinate to the notes issued to investors and we would, therefore, absorb all of the losses sustained with respect to a securitized pool of assets before the owners of the notes experience any losses. The inability to securitize our portfolio may hurt our performance and our ability to grow our business. At the same time, the securitization of our loans or investments might expose us to losses, as the residual loans or investments in which we do not sell interests will tend to be riskier and more likely to generate losses. Moreover, the Dodd Frank Act contains a risk retention requirement for all asset-backed securities, which requires both public and private securitizers to retain not less than 5% of the credit risk of the assets collateralizing any asset-backed security issuance. Significant restrictions exist, and additional restrictions may be added in the future, regarding who may hold risk retention interests, the structure of the entities that hold risk retention interests and when and how such risk retention interests may be transferred. Therefore such risk retention interests will generally be illiquid. As a result of the risk retention requirements, we may be required to purchase and retain certain interests in a securitization into which we sell mortgage loans and/or when we act as issuer, may be required to sell certain interests in a securitization at prices below levels that such interests have historically yielded and/or may be required to enter into certain arrangements related to risk retention that we have not historically been required to enter into and, accordingly, the risk retention rules may increase our potential liabilities and/or reduce our potential profits in connection with securitization of mortgage loans. It is likely, therefore, that these risk retention rules will increase the administrative and operational costs of asset securitizations.
We may find it necessary or desirable to foreclose on certain of the loans or CMBS we acquire, and the foreclosure process may be lengthy and expensive.
We may find it necessary or desirable to foreclose on certain of the loans or CMBS we acquire, and the foreclosure process may be lengthy and expensive. The protection of the terms of the applicable loan, including the validity or enforceability of the loan and the maintenance of the anticipated priority and perfection of the applicable security interests may not be adequate. Furthermore, claims may be asserted by lenders or borrowers that might interfere with enforcement of our rights. Borrowers may resist foreclosure actions by asserting numerous claims, counterclaims and defenses against us, including, without limitation, lender liability claims and defenses, even when the assertions may have no basis in fact, in an effort to prolong the foreclosure action and seek to force the lender into a modification of the loan or a favorable buy-out of the borrower’s position in the loan. In some states, foreclosure actions can take several years or more to litigate. At any time prior to or during the foreclosure proceedings, the borrower may file for bankruptcy or its equivalent, which would have the effect of staying the foreclosure actions and further delaying the foreclosure process and potentially result in a reduction or discharge of a borrower’s debt. Foreclosure may create a negative public perception of the related property, resulting in a diminution of its value, and in the event of any such foreclosure or other similar real estate owned-proceeding, we would also become the subject to the various risks associated with direct ownership of real estate, including environmental liabilities. Even if we are successful in foreclosing on a loan, the liquidation proceeds upon sale of the underlying real estate may not
58
be sufficient to recover our cost basis in the loan, resulting in a loss to us. Furthermore, any costs or delays involved in the foreclosure of the loan or a liquidation of the underlying property will further reduce the net proceeds and, thus, increase the loss.
Risks Related to Debt Financing
Our significant amount of debt may subject us to increased risk of loss and could adversely affect our results of operations and financial condition.
We currently have outstanding indebtedness and, subject to market conditions and availability, we may incur a significant amount of additional debt through bank credit facilities (including term loans and revolving facilities), warehouse facilities and structured financing arrangements, public and private debt or bond issuances (including through securitizations), repurchase agreements and derivative instruments, in addition to transaction or asset specific funding arrangements. We may also issue additional debt securities to fund our growth. The percentage of leverage we employ will vary depending on our available capital, our ability to obtain and access financing arrangements with lenders, the type of assets we are funding, whether the financing is recourse or non-recourse, debt restrictions contained in those financing arrangements and the lenders’ and rating agencies’ estimate of the stability of our investment portfolio’s cash flow. We may significantly increase the amount of leverage we utilize at any time without approval of our board of directors. In addition, we may leverage individual assets at substantially higher levels. Incurring substantial debt could subject us to many risks that, if realized, would materially and adversely affect us, including the risk that:
•our cash flow from operations may be insufficient to make required payments of principal of and interest on our debt or we may fail to comply with covenants contained in our debt agreements, which is likely to result in (i) acceleration of such debt (and any other debt containing a cross-default or cross-acceleration provision), which we then may be unable to repay from internal funds or to refinance on favorable terms, or at all, (ii) our inability to borrow undrawn amounts under our financing arrangements, even if we are current in payments on borrowings under those arrangements, which would result in a decrease in our liquidity, and/or (iii) the loss of some or all of our collateral assets to foreclosure or sale;
•our debt may increase our vulnerability to adverse economic and industry conditions with no assurance that investment yields will increase in an amount sufficient to offset the higher financing costs;
•we may be required to dedicate a substantial portion of our cash flow from operations to payments on our debt, thereby reducing funds available for operations, future business opportunities, stockholder distributions or other purposes;
•we may be subject to financial covenants under the terms of our debt instruments that limit the flexibility of our operations and may therefore have a negative impact on our results of operations; and
•we may not be able to refinance any debt that matures prior to the maturity (or realization) of an underlying investment it was used to finance on favorable terms or at all.
There can be no assurance that a leveraging strategy will be successful, and such strategy may subject us to increased risk of loss and could adversely affect our results of operations and financial condition.
We may encounter adverse changes in the credit markets.
Any adverse changes, such as those experienced in 2022 and 2023 as a result of rising interest rates, in the global credit markets could make it more difficult for us to obtain favorable financing. Our ability to generate attractive investment returns for our shareholders will be adversely affected to the extent we are unable to obtain favorable financing terms. If we are unable to obtain favorable financing terms, we may not be able to adequately leverage our portfolio, may face increased financing expenses or may face increased restrictions on our investment activities, any of which would negatively impact our performance.
We will incur mortgage indebtedness and other borrowings, which may increase our business risks, could hinder our ability to make distributions and could decrease the value of your investment.
The acquisition of investment properties may be financed in substantial part by borrowing, which increases our exposure to loss. Under our charter, we have a limitation that precludes us from borrowing in excess of 300% of our net assets, which approximates borrowing 75% of the cost of our investments (unless a majority of our independent directors approves any borrowing in excess of the limit and we disclose the justification for doing so to our stockholders), but such restriction does not restrict the amount of indebtedness we may incur with respect to any single investment. Our target leverage ratio is in the range of 60%. Our leverage ratio is measured by dividing (i) consolidated property-level and entity-level debt net of cash and loan-related restricted cash, by (ii) the asset value of real estate investments (measured using the greater of fair market value and cost) plus the equity in our settled real estate debt investments. We may exceed our target leverage ratio, particularly during a market downturn or in connection with a large acquisition. The use of leverage involves a high degree of financial risk and will increase the exposure of the investments to adverse economic factors such as rising interest rates, downturns in the economy or deteriorations in the condition of the investments. Principal and interest payments on indebtedness (including mortgages having “balloon” payments) will have to be made regardless of the
59
sufficiency of cash flow from the properties. Our investments will be impaired by a smaller decline in the value of the properties than is the case where properties are owned with a proportionately smaller amount of debt.
We may incur or increase our mortgage debt by obtaining loans secured by a portfolio of some or all of the real estate acquired and may borrow under mortgages on properties after they are acquired. Depending on the level of leverage and decline in value, if mortgage payments are not made when due, one or more of the properties may be lost (and our investment therein rendered valueless) as a result of foreclosure by the mortgagee(s). A foreclosure may also have substantial adverse tax consequences for us.
Many of these same issues also apply to credit facilities which are expected to be in place at various times as well. For example, the loan documents for such facilities may include various coverage ratios, the continued compliance with which may not be completely within our control. If such coverage ratios are not met, the lenders under such credit facilities may declare any unfunded commitments to be terminated and declare any amounts outstanding to be due and payable. We may also rely on short-term financing that would be especially exposed to changes in availability.
Although borrowings by us have the potential to enhance overall returns that exceed our cost of funds, they will further diminish returns (or increase losses on capital) to the extent overall returns are less than our cost of funds. As a result, the possibilities of profit and loss are increased. Borrowing money to purchase properties provides us with the advantages of leverage, but exposes us to greater market risks and higher current expenses.
Our inability to access funding could have a material adverse effect on our results of operations, financial condition and business.
Our results of operations, financial condition and business may be impacted by our ability to secure bank credit facilities (including term loans and revolving facilities), warehouse facilities and structured financing arrangements, public and private debt or bond issuances (including through securitizations), repurchase agreements and derivative instruments, in addition to transaction or asset specific funding arrangements and additional repurchase agreements on acceptable terms. We may also rely on short-term financing that would be especially exposed to changes in availability. Our access to sources of financing will depend upon a number of factors, over which we have little or no control, including:
•general economic or market conditions;
•the market’s view of the quality of our assets;
•the market’s perception of our growth potential; and
•our current and potential future earnings and cash distributions.
We will need to periodically access the capital markets to, among other things, raise cash to fund new investments. Unfavorable economic conditions, or capital market conditions, such as the volatility of the global credit markets experienced during 2022 and 2023, may increase our funding costs, limit our access to the capital markets or could result in a decision by our potential lenders not to extend credit. An inability to successfully access the capital markets could limit our ability to grow our business and fully execute our business strategy and could decrease our earnings and liquidity. In addition, any dislocation or weakness in the capital and credit markets could adversely affect our lenders and could cause one or more of our lenders to be unwilling or unable to provide us with financing or to increase the costs of that financing. In addition, as regulatory capital requirements imposed on our lenders are increased, they may be required to limit, or increase the cost of, financing they provide to us. In general, this could potentially increase our financing costs and reduce our liquidity or require us to sell assets at an inopportune time or price. We cannot make assurances that we will be able to obtain any additional financing on favorable terms or at all.
In certain cases, financings for our properties may be recourse to us.
Generally, commercial real estate financings are structured as non-recourse to the borrower, which limits a lender’s recourse to the property pledged as collateral for the loan, and not the other assets of the borrower or to any parent of borrower, in the event of a loan default. However, lenders customarily will require that a creditworthy parent entity enter into so-called “recourse carveout” guarantees to protect the lender against certain bad-faith or other intentional acts of the borrower in violation of the loan documents. A “bad boy” guarantee typically provides that the lender can recover losses from the guarantors for certain bad acts, such as fraud or intentional misrepresentation, intentional waste, willful misconduct, criminal acts, misappropriation of funds, voluntary incurrence of prohibited debt and environmental losses sustained by lender. In addition, “bad boy” guarantees typically provide that the loan will be a full personal recourse obligation of the guarantor, for certain actions, such as prohibited transfers of the collateral or changes of control and voluntary bankruptcy of the borrower. These financing arrangements with respect to our investments generally require “bad boy” guarantees from us and/or the Operating Partnership and in the event that such a guarantee is called, our assets could be adversely affected. Moreover, our “bad boy” guarantees could apply to actions of the joint venture partners associated with our investments. While the Adviser expects to negotiate indemnities from such joint venture partners to protect against such risks, there remains the possibility that the acts of such joint venture partner could result in liability to us under such guarantees. We may provide “bad boy”
60
guarantees on behalf of Other Blackstone Accounts investing alongside us and as such guarantees are not for borrowed money, they will typically not be included under our leverage limitations.
If we draw on a line of credit to fund repurchases or for any other reason, our financial leverage ratio could increase beyond our target.
We have lines of credit with financial institutions that are either unsecured or secured by certain of our assets as well as an uncommitted line of credit from an affiliate of Blackstone and we may seek to obtain additional lines of credit in an effort to provide for a ready source of liquidity for any business purpose, including to fund repurchases of shares of our common stock in the event that repurchase requests exceed our operating cash flow and/or net proceeds from our continuous offering. There can be no assurances that we will be able to borrow under or maintain our existing lines of credit or obtain additional lines of credit on financially reasonable terms. In addition, we may not be able to obtain lines of credit of an appropriate size for our business. If we borrow under a line of credit to fund repurchases of shares of our common stock, our financial leverage will increase and may exceed our target leverage ratio. Our leverage may remain at the higher level until we receive additional net proceeds from our continuous offering or generate sufficient operating cash flow or proceeds from asset sales to repay outstanding indebtedness. In connection with a line of credit, distributions may be subordinated to payments required in connection with any indebtedness contemplated thereby. We may utilize a line of credit for the benefit of Other Blackstone Accounts which may invest alongside us in one or more investments. In such circumstances, we generally intend to disclose such arrangements as part of our reporting and enter into arrangements to cause any Other Blackstone Accounts to bear (or reimburse us for) their pro rata share of any costs and expenses (including interest payments) allocable to such extensions of credit.
Volatility in the financial markets and challenging economic conditions could adversely affect our ability to secure debt financing on attractive terms and our ability to service or refinance any future indebtedness that we may incur.
The volatility of the current global credit markets could make it more difficult to obtain favorable financing for investments. During periods of volatility (including the current market environment), which often occur during economic downturns, generally credit spreads widen, interest rates rise, and investor demand for high yield debt declines. These trends result in reduced willingness by investment banks and other lenders to finance new investments and deterioration of available terms. If the overall cost of borrowing increases, either by increases in the index rates or by increases in lender spreads, the increased costs may result in future acquisitions generating lower overall economic returns and potentially reducing future cash flow available for distribution. Disruptions in the debt markets negatively impact our ability to borrow monies to finance the purchase of, or other activities related to, real estate assets. If we are unable to borrow monies on terms and conditions that we find acceptable, we likely will have to reduce the number of properties we can purchase, and the return on the properties we do purchase may be lower. In addition, we may find it difficult, costly or impossible to refinance indebtedness that is maturing. Moreover, to the extent that such marketplace events are not temporary, they could have an adverse impact on the availability of credit to businesses generally and could lead to an overall weakening of the U.S. economy.
Lenders may require us to enter into restrictive covenants relating to our operations, which could limit our ability to make distributions to our stockholders.
When providing financing, a lender may impose restrictions on us that affect our distribution and operating policies and our ability to obtain additional loans. Loan documents we enter into may contain covenants that limit our ability to further mortgage or dispose of the property or discontinue insurance coverage. In addition, loan documents may limit our ability to enter into or terminate certain operating or lease agreements related to the property. Loan documents may also require lender approval of certain actions and as a result of the lender’s failure to grant such approval, we may not be able to take a course of action we deem most profitable. These or other limitations may adversely affect our flexibility and our ability to make distributions to you and the value of your investment.
If we enter into financing arrangements involving balloon payment obligations, it may adversely affect our ability to make distributions to our stockholders.
Some of our financing arrangements may require us to make a lump-sum or “balloon” payment at maturity. Our ability to make a balloon payment is uncertain and may depend upon our ability to obtain replacement financing or our ability to sell particular properties. At the time the balloon payment is due, we may or may not be able to refinance the balloon payment on terms as favorable as the original loan or sell the particular property at a price sufficient to make the balloon payment. Such a refinancing would be dependent upon interest rates and lenders’ policies at the time of refinancing, economic conditions in general and the value of the underlying properties in particular. The effect of a refinancing or sale could affect the rate of return to stockholders and the projected time of disposition of our assets.
61
We use reverse repurchase agreements to finance our securities investments, which may expose us to risks that could result in losses.
We use reverse repurchase agreements as a form of leverage to finance our securities investments, and the proceeds from reverse repurchase agreements are generally invested in additional securities. There is a risk that the market value of the securities acquired from the proceeds received in connection with a reverse repurchase agreement may decline below the price of the securities underlying the reverse repurchase agreement that we have sold but remain obligated to repurchase. Reverse repurchase agreements also involve the risk that the counterparty liquidates the securities we delivered to it under the reverse repurchase agreements following the occurrence of an event of default under the applicable repurchase agreement by us. In addition, there is a risk that the market value of the securities we retain may decline. If the buyer of securities under a reverse repurchase agreement were to file for bankruptcy or experiences insolvency, we may be adversely affected. Furthermore, our counterparty may require us to provide additional margin in the form of cash, securities or other forms of collateral under the terms of the derivative contract. Also, in entering into reverse repurchase agreements, we bear the risk of loss to the extent that the proceeds of the reverse repurchase agreement are less than the value of the underlying securities. In addition, the interest costs associated with reverse repurchase agreements transactions may adversely affect our results of operations and financial condition, and, in some cases, we may be worse off than if we had not used such instruments.
Failure to hedge effectively against interest rate changes may materially adversely affect our results of operations and financial condition.
Subject to any limitations required to maintain qualification as a REIT, we may seek to manage our exposure to interest rate volatility by using interest rate hedging arrangements, such as interest rate cap or collar agreements and interest rate swap agreements. These agreements involve risks, such as the risk that counterparties may fail to honor their obligations under these arrangements and that these arrangements may not be effective in reducing our exposure to interest rate changes. These interest rate hedging arrangements may create additional assets or liabilities from time to time that may be held or liquidated separately from the underlying property or loan for which they were originally established. Hedging may reduce the overall returns on our investments. Failure to hedge effectively against interest rate changes may materially adversely affect our results of operations and financial condition.
The transition away from reference rates and the use of alternative replacement reference rates may adversely affect net interest income related to our loans and investments or otherwise adversely affect our results of operations, cash flows and the market value of our investments.
LIBOR and certain other floating rate benchmark indices have been the subject of national, international and regulatory guidance and
proposals for reform or replacement. The Federal Reserve, in conjunction with the Alternative Reference Rates Committee, a steering committee composed of large U.S. financial institutions, identified SOFR, an index calculated using short-term repurchase agreements backed by U.S. Treasury securities, as its preferred alternative rate for USD LIBOR. As of December 31, 2023, substantially all of our floating rate loans and related financings have transitioned to the applicable replacement benchmark rate, or reference a benchmark rate that is not expected to be replaced. Our loan agreements generally allow us to choose a new index based upon comparable information if the current index is no longer available. While recently there has been a significant clarification of guidance across products on the recommended timing and form of certain transition milestones from industry working groups, overall there is still a substantial amount of uncertainty in the marketplace regarding the transition away from IBOR benchmarks. While we have substantially completed the transition of our loan portfolio to the extent it was tied to USD LIBOR and other IBOR benchmarks, continuing market developments and uncertainty can materially impact our cost of capital and net investment income and any changes to benchmark interest rates could increase our financing costs, which could impact our results of operations, cash flows and the market value of our investments. The elimination of the IBOR benchmarks and/or changes to another index could result in mismatches with the interest rate of investments that we are financing. In addition, the overall financial markets may be disrupted as a result of the phase-out or replacement of IBOR.
Increases in interest rates could increase the amount of our loan payments and adversely affect our ability to make distributions to our stockholders.
Interest we pay on our loan obligations will reduce cash available for distributions. We have and will likely in the future obtain variable rate loans, and as a result, increases in interest rates could increase our interest costs, which could reduce our cash flows and our ability to make distributions to you. In addition, if we need to repay existing loans during periods of rising interest rates, such as the current environment, we could be required to liquidate one or more of our investments at times that may not permit realization of the maximum return on such investments. While we cannot predict factors which may or may not affect interest rates, during the year ended December 31, 2023, a 10% increase in SOFR rate would have resulted in an increase to our interest expense of $33.1 million, net of the impact from our interest rate swaps and caps.
Our current or future credit ratings may not reflect all risks of an investment in our debt securities.
62
Any current or future credit ratings of us are an assessment by third parties of our ability to pay our obligations. Consequently, real or anticipated changes in our current or future credit ratings will generally affect the market value of any of our debt securities. Our current or future credit ratings, however, may not reflect the potential impact of risks related to market conditions generally or other factors discussed above on the market value of or trading market for the publicly issued debt securities.
Risks Related to our Relationship with the Adviser and the Dealer Manager
We depend on the Adviser to select our investments and otherwise conduct our business, and any material adverse change in its financial condition or our relationship with the Adviser could have a material adverse effect on our business and ability to achieve our investment objectives.
Our success is dependent upon our relationship with, and the performance of, the Adviser in the acquisition and management of our real estate portfolio, and our corporate operations, as well as the persons and firms the Adviser retains to provide services on our behalf. The Adviser may suffer or become distracted by adverse financial or operational problems in connection with Blackstone’s business and activities unrelated to us and over which we have no control. Should the Adviser fail to allocate sufficient resources to perform its responsibilities to us for any reason, we may be unable to achieve our investment objectives or to pay distributions to our stockholders.
The termination or replacement of the Adviser could trigger a repayment event under our mortgage loans for some of our properties, the credit agreement governing any of our lines of credit and our repurchase agreements.
Lenders for certain of our properties have requested in the past and may request in the future provisions in the mortgage loan documentation that would make the termination or replacement of the Adviser an event requiring the consent of the lender or immediate repayment of the full outstanding balance of the loan. The termination or replacement of the Adviser could trigger repayment of outstanding amounts under the credit agreements governing our lines of credit that we may obtain or under the repurchase agreements that we may enter into. If a repayment event is triggered with respect to any of our properties, our results of operations and financial condition may be adversely affected.
The Adviser’s inability to retain the services of key real estate professionals could hurt our performance.
The Adviser’s power to approve the acquisition of a particular investment, finance or refinance any new or existing investment or dispose of an existing investment rests with the Investment Committee, sub-committees of the Investment Committee or particular professionals employed by the Adviser, depending on the size and type of the investment. Accordingly, our success depends to a significant degree upon the contributions of certain key real estate professionals employed by the Adviser, each of whom would be difficult to replace. There is ever increasing competition among alternative asset firms, financial institutions, private equity firms, investment advisors, investment managers, real estate investment companies, real estate investment trusts and other industry participants for hiring and retaining qualified investment professionals and there can be no assurance that such professionals will continue to be associated with the us or the Adviser, particularly in light of our perpetual-life nature, or that replacements will perform well. Neither we nor the Adviser have employment agreements with these individuals and they may not remain associated with us. If any of these persons were to cease their association with us, our operating results could suffer. Although there are key real estate professionals employed by the Adviser, we believe the “key person” concept to be inapplicable to our structure as a perpetual-life REIT and do not maintain key person life insurance on any person. Our future success depends, in large part, upon the Adviser’s ability to attract and retain highly skilled managerial, operational and marketing professionals. If the Adviser loses or is unable to obtain the services of highly skilled professionals, our ability to implement our investment strategies could be delayed or hindered.
Any material adverse change to the Dealer Manager’s ability to successfully build and maintain a network of licensed broker-dealers could have a material adverse effect on our business and the Offering.
The dealer manager for the Offering is Blackstone Securities Partners L.P. Any material adverse change to the ability of our Dealer Manager to build and maintain a network of licensed securities broker-dealers and other agents could have a material adverse effect on our business and the Offering. If the Dealer Manager is unable to build and maintain a sufficient network of participating broker-dealers to distribute shares in the Offering, our ability to raise proceeds through the Offering and implement our investment strategy may be adversely affected. In addition, the Dealer Manager currently serves and may serve as dealer manager for other issuers. As a result, the Dealer Manager may experience conflicts of interest in allocating its time between the Offering and such other issuers, which could adversely affect our ability to raise proceeds through the Offering and implement our investment strategy. Further, the participating broker-dealers retained by the Dealer Manager may have numerous competing investment products, some with similar or identical investment strategies and areas of focus as us, which they may elect to emphasize to their retail clients.
63
You will not have the benefit of an independent due diligence review in connection with the Offering and, if a conflict of interest arises between us and Blackstone, we may incur additional fees and expenses.
Because the Adviser and the Dealer Manager are affiliates of Blackstone Real Estate, our sponsor, you will not have the benefit of an independent due diligence review and investigation of the type normally performed by an unaffiliated, independent underwriter and its counsel in connection with a securities offering. If any situation arises in which our interests are in conflict with those of the Adviser, the Dealer Manager or its affiliates, and we are required to retain independent counsel, we will incur additional fees and expenses.
The fees we pay in connection with the Offering and the agreements entered into with Blackstone and its affiliates were not determined on an arm’s-length basis and therefore may not be on the same terms we could achieve from a third party.
The compensation paid to the Adviser, Dealer Manager and other Blackstone affiliates for services they provide us was not determined on an arm’s-length basis. All service agreements, contracts or arrangements between or among Blackstone and its affiliates, including the Adviser and us, were not negotiated at arm’s-length. Such agreements include our Advisory Agreement, the Operating Partnership’s partnership agreement, our dealer manager agreement (the “Dealer Manager Agreement”), and any property related corporate services and other agreements we may enter into with affiliates of the Adviser from time to time.
We do not own the Blackstone name, but we may use it as part of our corporate name pursuant to a trademark license agreement with an affiliate of Blackstone. Use of the name by other parties or the termination of our trademark license agreement may harm our business.
We have entered into a trademark license agreement (“Trademark License Agreement”), with Blackstone TM L.L.C. (the “Licensor”), an affiliate of Blackstone, pursuant to which it has granted us a fully paid-up, royalty-free, non-exclusive, non-transferable license to use the name “Blackstone Real Estate Income Trust, Inc.”. Under this agreement, we have a right to use this name for so long as the Adviser (or another affiliate of the Licensor) serves as our advisor (or another advisory entity) and the Adviser remains an affiliate of the Licensor under the Trademark License Agreement. The Trademark License Agreement may also be earlier terminated by either party as a result of certain breaches or for convenience upon 90 days’ prior written notice, provided that upon notification of such termination by us, the Licensor may elect to effect termination of the Trademark License Agreement immediately at any time after 30 days from the date of such notification. The Licensor and its affiliates, such as Blackstone, will retain the right to continue using the “Blackstone” name. We will further be unable to preclude the Licensor from licensing or transferring the ownership of the “Blackstone” name to third parties, some of whom may compete with us. Consequently, we will be unable to prevent any damage to goodwill that may occur as a result of the activities of the Licensor, Blackstone or others. Furthermore, in the event that the Trademark License Agreement is terminated, we will be required to, among other things, change our name. Any of these events could disrupt our recognition in the market place, damage any goodwill we may have generated and otherwise harm our business.
Risks Related to Conflicts of Interest
Various potential and actual conflicts of interest will arise, and these conflicts may not be identified or resolved in a manner favorable to us.
Blackstone has conflicts of interest, or conflicting loyalties, as a result of the numerous activities and relationships of Blackstone, the Dealer Manager, the Adviser and the affiliates, partners, members, shareholders, officers, directors, family members and employees of the foregoing, some of which are described herein. However, not all potential, apparent and actual conflicts of interest are included herein, and additional conflicts of interest could arise as a result of new activities, transactions or relationships commenced in the future. If any matter arises that we and our affiliates (including the Adviser) determine in our good faith judgment constitutes an actual and material conflict of interest, we and our affiliates (including the Adviser) will take such actions as we determine appropriate to mitigate the conflict. Transactions between us and Blackstone or its affiliates will require approval by our board of directors, including a majority of our independent directors. There can be no assurance that our board of directors or Blackstone will identify or resolve all conflicts of interest in a manner that is favorable to us.
The Adviser faces a conflict of interest because the fees it receives for services performed are based in part on our NAV, which the Adviser is ultimately responsible for determining.
The Adviser is paid a management fee for its services based on our NAV, which is calculated by State Street, based on valuations provided by the Adviser. In addition, the distributions to be received by the Special Limited Partner with respect to its performance participation interest in the Operating Partnership are based in part upon the Operating Partnership’s net assets (which is a component of our NAV). The calculation of our NAV includes certain subjective judgments with respect to estimating, for example, the value of our portfolio and our accrued expenses, net portfolio income and liabilities, and therefore, our NAV may not correspond to realizable value upon a sale of those assets. The Adviser may benefit by us retaining ownership of our assets at times when our stockholders may be better served by the sale or disposition of our assets in order to avoid a reduction in our NAV. If our NAV is calculated in a way
64
that is not reflective of our actual NAV, then the purchase price of shares of our common stock or the price paid for the repurchase of your shares of common stock on a given date may not accurately reflect the value of our portfolio, and your shares may be worth less than the purchase price or more than the repurchase price. The valuation of our investments will affect the amount and timing of the management fee paid to the Adviser and the Special Limited Partner’s performance participation interest. As a result, there may be circumstances where the Adviser is incentivized to determine valuations that are higher than the actual fair value of our investments.
The Adviser’s management fee and the Special Limited Partner’s performance participation interest may not create proper incentives or may induce the Adviser and its affiliates to make certain investments, including speculative investments, that increase the risk of our real estate portfolio.
We pay the Adviser a management fee regardless of the performance of our portfolio. The Adviser’s entitlement to a management fee, which is not based upon performance metrics or goals, might reduce its incentive to devote its time and effort to seeking investments that provide attractive risk-adjusted returns for our portfolio. We would be required to pay the Adviser a management fee in a particular period even if we experienced a net loss or a decline in the value of our portfolio during that period.
The existence of the Special Limited Partner’s 12.5% performance participation interest in our Operating Partnership, which is based on our total distributions plus the change in NAV per share, may create an incentive for the Adviser to make riskier or more speculative investments on our behalf or cause us to use more leverage than it would otherwise make in the absence of such performance-based compensation. In addition, the change in NAV per share will be based on the value of our investments on the applicable measurement dates and not on realized gains or losses. As a result, the performance participation interest may receive distributions based on unrealized gains in certain assets at the time of such distributions and such gains may not be realized when those assets are eventually disposed of. Except in limited circumstances, the Special Limited Partner will not be obligated to return any portion of performance participation allocation due to the subsequent negative performance.
Because the management fee and performance participation are based on our NAV, the Adviser may also be motivated to accelerate acquisitions in order to increase NAV or, similarly, delay or curtail repurchases to maintain a higher NAV, and the Dealer Manager may also be incentivized to sell more shares of our common stock to increase aggregate NAV, which would, in each case, increase amounts payable to the Adviser and the Special Limited Partner, but may make it more difficult for us to efficiently deploy new capital. In addition, we are required to reimburse the Adviser or its affiliates for documented costs and expenses incurred by it and its affiliates on our behalf, except those specifically required to be borne by the Adviser under our Advisory Agreement. Accordingly, to the extent that the Adviser retains other parties to provide services to us, expenses allocable to us will increase.
Blackstone personnel work on other projects and conflicts may arise in the allocation of personnel between us and other projects.
The Adviser and its affiliates will devote such time as they determine to be necessary to conduct our business affairs in an appropriate manner. However, Blackstone personnel, including members of the Investment Committee, will work on other projects, serve on other committees (including boards of directors) and source potential investments for and otherwise assist the investment programs of Other Blackstone Accounts and their portfolio entities, including other investment programs to be developed in the future. Time spent on these other initiatives diverts attention from our activities, which could negatively impact us. Furthermore, Blackstone and Blackstone personnel derive financial benefit from these other activities, including fees and performance-based compensation. Our sponsor’s personnel share in the fees and performance-based compensation generated by Other Blackstone Accounts. These and other factors create conflicts of interest in the allocation of time by such personnel.
Blackstone is subject to a number of conflicts of interest, regulatory oversight and legal and contractual restrictions due to its multiple business lines, which may reduce the benefits that Blackstone could otherwise expect to utilize for the Adviser for purposes of identifying and managing our investments.
Blackstone has multiple business lines, including the Blackstone Capital Markets Group, which Blackstone, Other Blackstone Accounts and their portfolio entities and third parties, will in certain circumstances, engage for debt and equity financings and to provide other investment banking, brokerage, investment advisory or other services. As a result of these activities, Blackstone is subject to a number of actual and potential conflicts of interest, greater regulatory oversight and more legal and contractual restrictions than if it had one line of business. For example, Blackstone may come into possession of information that limits our ability to engage in potential transactions. Similarly, other Blackstone businesses and their personnel may be prohibited by law or contract from sharing information with the Adviser or its affiliates that would be relevant to monitoring our investments and other activities. Additionally, Blackstone or Other Blackstone Accounts can be expected to enter into covenants that restrict or otherwise limit our ability to make investments in, or otherwise engage in, certain businesses or activities. For example, Other Blackstone Accounts could have granted exclusivity to a joint venture partner that limits us and Other Blackstone Accounts from owning assets within a certain distance of any of the joint venture’s assets, or Blackstone or an Other Blackstone Account could have entered into a non-compete in connection with a sale or other transaction. These types of restrictions may negatively impact our ability to implement our investment program. Finally, certain personnel who are members of the investment team or investment committee may be excluded from participating in certain investment decisions due to conflicts involving other businesses or for other reasons, including other business activities, in which case
65
we will not benefit from their experience. Our stockholders will not receive a benefit from any fees earned by Blackstone or its personnel from these other businesses.
Blackstone has implemented policies and procedures to address conflicts that arise as a result of its various activities, as well as regulatory and other legal considerations. Because Blackstone has many different asset management and advisory businesses, including private equity, growth equity, a credit business, a hedge fund business, a capital markets group, a life sciences business and a real estate advisory business, it is subject to a number of actual and potential conflicts of interest, greater regulatory oversight and more legal and contractual restrictions than that to which it would otherwise be subject if it had just one line of business. In addressing these conflicts and regulatory, legal and contractual requirements across its various businesses and to protect against the inappropriate sharing and/or use of information between the Blackstone Real Estate group and the other business units at Blackstone, Blackstone has implemented certain policies and procedures (e.g., Blackstone’s information wall policy) regarding the sharing of information which have the potential to reduce the positive synergies and collaborations that the Adviser could otherwise expect to utilize for purposes of identifying, pursuing and managing attractive investments. For example, Blackstone will from time to time come into possession of material nonpublic information with respect to companies in which Other Blackstone Clients may be considering making an investment or companies that are clients of Blackstone. As a consequence, that information, which could be of benefit to the Company, might become restricted to those other respective businesses and otherwise be unavailable to the Company. There can be no assurance, however, that any such policies and/or procedures will be effective in accomplishing their stated purpose and/or that they will not otherwise adversely affect the ability of the Company to effectively achieve its investment objective by unduly limiting the investment flexibility of the Company and/or the flow of otherwise appropriate information between the Adviser and other business units at Blackstone. For example, in some instances, personnel of Blackstone would be unable to assist with the activities of the Company as a result of these walls. There can be no assurance that additional restrictions will not be imposed that would further limit the ability of Blackstone to share information internally. In addition, due to these restrictions, in some instances, the Company may not be able to initiate a transaction that it otherwise might have initiated and may not be able to purchase or sell an investment that it otherwise might have purchased or sold, which could negatively affect its operations.
In addition, to the extent that Blackstone is in possession of material non-public information or is otherwise restricted from trading in certain securities, the Company and the Adviser may also be deemed to be in possession of such information or otherwise restricted. Additionally, the terms of confidentiality or other agreements with or related to companies in which any Blackstone fund has or has considered making an investment or which is otherwise a client of Blackstone will from time to time restrict or otherwise limit the ability of the Company and their affiliates to make investments in or otherwise engage in businesses or activities competitive with such companies. Blackstone reserves the right to enter into one or more strategic relationships in certain regions or with respect to certain types of investments that, although intended to provide greater opportunities for the Company, may require the Company to share such opportunities or otherwise limit the amount of an opportunity the Company can otherwise take.
Blackstone is under no obligation to decline any engagements or investments in order to make an investment opportunity available to us. Blackstone has long-term relationships with a significant number of corporations and their senior management. The Adviser and its affiliates will consider those relationships when evaluating an investment opportunity, which may result in the Adviser or its affiliates choosing not to make such an investment due to such relationships (e.g., investments in a competitor of a client or any other person with whom Blackstone has a relationship). We may be forced to sell or hold existing investments as a result of investment banking relationships or other relationships that Blackstone and its affiliates may have or transactions or investments that Blackstone may make or has made. Therefore, there can be no assurance that all potentially suitable investment opportunities that come to the attention of Blackstone will be made available to us. See “—Certain Other Blackstone Accounts have similar or overlapping investment objectives and guidelines, and we will not be allocated certain opportunities and may be allocated only opportunities with lower relative returns” below. We may also co-invest with clients of Blackstone or other persons with whom Blackstone has a relationship in particular investment opportunities, and other aspects of these Blackstone relationships could influence the decisions made by the Adviser and its affiliates with respect to our investments and otherwise result in a conflict.
Blackstone, its affiliates and their related parties and personnel participate in underwriting and lending syndicates and otherwise act as arrangers of financing, including with respect to the public offering and private placement of debt or equity securities issued by, and loan proceeds borrowed by us or our subsidiaries or advise on such transactions. Underwritings and financings can be on a firm commitment basis or on an uncommitted, or “best efforts”, basis, and the underwriting or financing parties are under no duty to provide any commitment unless specifically set forth in the relevant contract. Blackstone can also be expected to also provide, either alone or alongside third parties performing similar services, placement, financial advisory or other similar services to purchasers or sellers of securities (including in connection with primary offerings, secondary transaction and/or transaction involving special purpose acquisition companies), including loans or instruments issued by its portfolio entities. Blackstone’s compensation for such services is expected to be paid by the applicable seller (including us), one or more underwriters or financing parties (including amounts paid by an issuer and reimbursed by one or more underwriters) and/or other transaction parties. A Blackstone broker-dealer will from time to time act as the managing underwriter, a member of the underwriting syndicate or broker for us or our subsidiaries, or as dealer, broker or advisor to a counterparty to us or our subsidiaries, and purchase securities from or sell securities to us, our subsidiaries, Other Blackstone Accounts or their portfolio entities, or advise on such transactions. Blackstone will also from time to
66
time, on our behalf or on behalf of other parties to a transaction involving us, effect transactions, including transactions in the secondary markets, subject to applicable law that result in commissions or other compensation paid to Blackstone by us or the counterparty to the transaction, thereby creating a potential conflict of interest. Subject to applicable law, Blackstone will from time to time receive underwriting fees, discounts, placement commissions, loan modification or restructuring fees, servicing fees, capital markets, advisory fees, lending arrangement fees, asset/property management fees, insurance (including title insurance fees), incentive fees, consulting fees, monitoring fees, commitment fees, syndication fees, origination fees, organizational fees, operational fees, loan servicing fees, and financing and divestment fees (or, in each case, rebates in lieu of any such fees, whether in the form of purchase price discounts or otherwise, even in cases where Blackstone, an Other Blackstone Account or their portfolio entities are purchasing debt) or other compensation with respect to the foregoing activities, which are not required to be shared with us or our stockholders.
Our independent directors will approve any transactions in which a Blackstone broker-dealer acts as underwriter, as broker for us, or as dealer, broker or advisor, on the other side of a transaction with us only where such directors believe in good faith that such transactions are appropriate for us, and our stockholders, by executing a subscription agreement for our shares, consent to all such transactions, along with other transactions involving conflicts described herein, to the fullest extent permitted by law. Sales of securities for our account will from time to time be bunched or aggregated with orders for other accounts of Blackstone including Other Blackstone Accounts. It could be impossible, as determined by the Adviser and its affiliates in their sole discretion, to receive the same price or execution on the entire volume of securities sold, and the various prices will, in certain circumstances, therefore be averaged which may be disadvantageous to us. When Blackstone serves as underwriter with respect to securities held by us or any of our subsidiaries, we could be subject to a “lock-up” period following the offering under applicable regulations during which time we would be unable to sell any securities subject to the “lock-up”. This may prejudice our ability to dispose of such securities at an opportune time. Blackstone employees are generally permitted to invest in alternative investment funds, real estate funds, hedge funds or other investment vehicles, including our potential competitors. Our stockholders will not receive any benefit from any such investments.
On October 1, 2015, Blackstone spun off its financial and strategic advisory services, restructuring and reorganization advisory services, and its Park Hill fund placement businesses and combined these businesses with PJT Partners Inc. (“PJT”), an independent financial advisory firm founded by Paul J. Taubman. While the combined business operates independently from Blackstone and is not an affiliate thereof, it is expected that there will be substantial overlapping ownership between Blackstone and PJT for a considerable period of time going forward. Therefore, conflicts of interest will arise in connection with transactions between or involving us, on the one hand, and PJT, on the other. The pre-existing relationship between Blackstone and its former personnel involved in financial and strategic advisory services at PJT, the overlapping ownership and co-investment and other continuing arrangements between PJT and Blackstone can be expected to influence the Adviser to select or recommend PJT to perform services for us (the cost of which will generally be borne directly or indirectly by us). Given that PJT is no longer an affiliate of Blackstone, the Adviser and its affiliates will be free to cause us to transact with PJT generally without restriction under our charter notwithstanding the relationship between Blackstone and PJT. See also “— The Adviser may face conflicts of interests in choosing our service providers and certain service providers may provide services to the Dealer Manager, the Adviser or Blackstone on more favorable terms than those payable by us below.
Blackstone receives, generates or obtains various kinds of data and information from us, Other Blackstone Accounts and portfolio entities, including but not limited to data and information relating to business operations, financial information, results, trends, budgets, plans, ESG, energy usage, carbon emissions and related metrics, customer and use data, employee and contractor data, supplier and cost data, and other related data and information, some of which is sometimes referred to as alternative data or “big data.” Blackstone can be expected to be better able to anticipate macroeconomic and other trends, and otherwise develop investment themes or identify specific investment, trading or business opportunities, as a result of its access to (and rights regarding, including use, distribution and derived works rights over) this data and information from us, Other Blackstone Account and portfolio entities. Blackstone has entered and will continue to enter into information sharing and use arrangements, which will give Blackstone access to (and rights regarding, including use, distribution and derived work rights over) data that it would not otherwise obtain in the ordinary course, with us, Other Blackstone Accounts, portfolio entities, related parties and service providers. Further, this alternative data is expected to be aggregated across the Company, Other Blackstone Accounts and portfolio entities. Although Blackstone believes that these activities improve Blackstone’s investment management activities on our behalf and on behalf of Other Blackstone Accounts, information obtained from us and portfolio entities also provides material benefits to Blackstone or Other Blackstone Accounts without compensation or other benefit accruing to us or our stockholders. For example, information from a portfolio entity can be expected to enable Blackstone to better understand a particular industry and execute trading and investment strategies in reliance on that understanding for Blackstone and Other Blackstone Accounts that do not own an interest in the portfolio entity, without compensation or benefit to us or the portfolio entities. Blackstone is expected to serve as the repository for data described in this paragraph, including with ownership rights therein.
Furthermore, except for contractual obligations to third parties to maintain confidentiality of certain information or otherwise limit the scope and purpose of its use or distribution, and regulatory limitations on the use of material nonpublic information, Blackstone is generally free to use and distribute information from our activities to assist in the pursuit of Blackstone’s various other activities,
67
including but not limited to, trading activities for the benefit of Blackstone or an Other Blackstone Account. For example, Blackstone’s ability to trade in securities of an issuer relating to a specific industry may, subject to applicable law, be enhanced by information of a portfolio entity in the same or related industry. Such trading or other business activities is expected to provide a material benefit to Blackstone without compensation or other benefit to us or our stockholders.
The sharing and use of “big data” and other information presents potential conflicts of interest and investors acknowledge and agree that any benefits received by Blackstone or its personnel (including fees (in cash or in kind), costs and expenses) will not offset the Adviser’s management fee or otherwise be shared with investors. As a result, the Adviser has an incentive to pursue investments that have data and information that can be utilized in a manner that benefits Blackstone or Other Blackstone Accounts.
Other present and future activities of Blackstone and its affiliates (including the Adviser and the Dealer Manager) will from time to time give rise to additional conflicts of interest relating to us and our investment activities. In the event that any such conflict of interest arises, we will attempt to resolve such conflicts in a fair and equitable manner. Investors should be aware that conflicts will not necessarily be resolved in favor of our interests.
Blackstone engages various advisors and operating partners who may co-invest alongside us, and there can be no assurance that such advisors and operating partners will continue to serve in such roles.
Blackstone, its affiliates and their personnel and related parties engage and retain strategic advisors, consultants, senior advisors, industry experts, joint venture and other partners and professionals, any of whom might be current or former executives or other personnel of the Adviser, its affiliates, portfolio entities or Other Blackstone Accounts (collectively, “Consultants”), to provide a variety of services. Similarly, we, Other Blackstone Accounts and portfolio entities retain and pay compensation to Consultants to provide services, or to undertake a build-up strategy to originate, acquire and develop assets and businesses in a particular sector or involving a particular strategy. Any amounts paid by us or a portfolio entity to Consultants in connection with the above services, including cash fees, profits, or equity interests in a portfolio entity, discretionary bonus awards, performance-based compensation (e.g., promote), retainers and expense reimbursements, will be treated as our expenses or expenses of the portfolio entity, as the case may be, and will not, even if they have the effect of reducing any retainers or minimum amounts otherwise payable by the Adviser, be chargeable to the Adviser or deemed paid to or received by the Adviser, or offset or reduce any management fees to the Adviser. Also, Consultants may co-invest alongside us in investments, participate in long-term incentive plans of a portfolio entity, which generally will result in us being allocated a smaller share of an investment. Consultants’ benefits described in this paragraph may continue after termination of status as a Consultant.
The time, dedication and scope of work of a Consultant varies considerably. In some cases, a Consultant advises our sponsor on transactions, provides the Adviser with industry-specific insights and feedback on investment themes, assists in transaction due diligence, and makes introductions to, and provides reference checks on, management teams. In other cases, Consultants take on more extensive roles, including serving as executives or directors on the boards of portfolio entities and contributing to the identification and origination of new investment opportunities. We may rely on these Consultants to recommend the Adviser and us as a preferred investment partner and carry out our investment program, but there is no assurance that any Consultant will continue to be involved with us for any length of time. We, Blackstone, and/or portfolio companies can be expected to have formal or informal arrangements with Consultants that may or may not have termination options and may include compensation, no compensation, or deferred compensation until occurrence of a future event, such as commencement of a formal engagement. In certain cases, Consultants have attributes of Blackstone “employees” (e.g., they can be expected to have dedicated offices at Blackstone, receive administrative support from Blackstone personnel, participate in general meetings and events for Blackstone personnel or work on Blackstone matters as their primary or sole business activity, have Blackstone-related e-mail addresses or business cards and participate in certain benefit arrangements typically reserved for Blackstone employees), even though they are not Blackstone employees, affiliates or personnel for purposes of the Dealer Manager Agreement and the Advisory Agreement, and their salary and related expenses are paid by us or by portfolio entities without any reduction or offset to the Adviser’s management fees. Some Consultants work only for us and/or portfolio entities, while other Consultants may have other clients. In particular, in some cases, Consultants, including those with a “Senior Advisor” title, have been and will be engaged with the responsibility to source and recommend transactions to the Adviser potentially on a full-time and/or exclusive basis and, notwithstanding any overlap with the responsibilities of the Adviser under the Advisory Agreement, the compensation to such Consultants could be borne fully by us (with no reduction or offset to the management fee paid to the Adviser). If such Senior Advisors generate investment opportunities on our behalf, such members may receive special additional fees or allocations comparable to those received by a third party in an arm’s length transaction. Consultants could have conflicts of interest between their work for us and portfolio entities, on the one hand, and themselves or other clients, on the other hand, and the Adviser is limited in its ability to monitor and mitigate these conflicts. Additionally, Consultants could provide services on behalf of both us and Other Blackstone Accounts, and any work performed by Consultants retained on our behalf could benefit such Other Blackstone Accounts (and alternatively, work performed by Consultants on behalf of Other Blackstone Accounts could benefit us), and the sponsor shall have no obligation to allocate any portion of the costs to be borne by us in respect of such Consultant to such Other Blackstone Accounts.
68
We may source, sell and/or purchase assets either to or from the Adviser and its affiliates or issued by affiliates of the Adviser, and such transactions may cause conflicts of interest.
We have in the past purchased assets from affiliates of the Adviser and in the future may directly or indirectly source, sell and/or purchase all or any portion of an asset (or portfolio of assets/investments) to or from the Adviser and its affiliates or their respective related parties, including parties which such affiliates or related parties, or Other Blackstone Accounts, own or have invested in. Such transactions will be subject to the approval of a majority of our directors (including a majority of our independent directors) not otherwise interested in the transaction. We may also source, sell to and/or purchase from third parties interests in or assets issued by affiliates of the Adviser or their respective related parties and such transactions would not require approval by our independent directors or an offset of any fees we otherwise owe to the Adviser or its affiliates. The transactions referred to in this paragraph involve conflicts of interest, as our sponsor and its affiliates may receive fees and other benefits, directly or indirectly, from or otherwise have interests in both parties to the transaction.
Certain Other Blackstone Accounts have similar or overlapping investment objectives and guidelines, and we will not be allocated certain opportunities and may be allocated only opportunities with lower relative returns.
Blackstone invests its own capital and third-party capital on behalf of Other Blackstone Accounts in a wide variety of investment opportunities on a global basis. Not every opportunity suitable for us will be allocated to us in whole or in part. First, certain exceptions exist that allow specified types of investment opportunities that fall within our investment objectives or strategy to be allocated in whole or in part to Blackstone itself or Other Blackstone Accounts, such as strategic investments made by Blackstone itself (whether in financial institutions or otherwise) and investments by Other Blackstone Accounts that have investment objectives or guidelines similar to or overlapping, in whole or in part, with ours, to some extent, or pursue similar returns as us but have a different investment strategy or objective. Therefore, there have been and may be circumstances where investments that are consistent with our investment objectives are required or permitted to be offered to, shared with or made by one or more Other Blackstone Accounts (and so, offered to, shared with or made thereby). It is expected that some activities of Blackstone, Other Blackstone Accounts and portfolio entities will compete with us for one or more investment opportunities that are consistent with our investment objectives, and as a result such investment opportunities may only be available on a limited basis, or not at all, to us. The Adviser may have conflicting loyalties in determining whether an investment opportunity should be allocated to us or an Other Blackstone Account. Our sponsor has adopted guidelines and policies, which it can be expected to update from time to time, regarding allocation of investment opportunities.
With respect to Other Blackstone Accounts with investment objectives or guidelines that overlap with ours but that do not have priority over us (including the Private Core+ Accounts), investment opportunities are allocated among us and one or more Other Blackstone Accounts in accordance with our sponsor’s prevailing policies and procedures on a basis that the Adviser and its affiliates believe to be fair and reasonable in their sole discretion, which may be pro rata based on relative available capital, subject to the following considerations: (i) consistency with any applicable investment objectives or focus of ours and such Other Blackstone Accounts (which, for us, includes our primary objective of providing attractive current income in the form of regular, stable cash distributions), (ii) any investment limitations, parameters or contractual provisions of ours and such Other Blackstone Accounts (e.g., a joint venture between us and an Other Blackstone Account must be on substantially similar terms), (iii) the sector, geography/location, expected return profile, expected distribution rates, anticipated cash flows, expected stability or volatility of cash flows, leverage profile, risk profile, and other features of the applicable investment opportunity and its impact on portfolio concentration and diversification, (including, but not limited to, (A) allocations necessary for us or Other Blackstone Accounts to maintain a particular concentration in a certain type of investment (e.g., if an Other Blackstone Account follows a liquid strategy pursuant to which it sells a type of investment more or less frequently than us and we or such Other Blackstone Account needs a non pro rata additional allocation to maintain a particular concentration in that type of investment) and (B) whether a particular fund already has its desired exposure to the investment, sector, industry, geographic region or markets in question), (iv) maintaining structuring and financing flexibility for shared investments (which can result in sharing an investment opportunity equally to the extent each party has sufficient available capital to do so), (v) avoiding allocation that could result in de minimis or odd lot investments, or allocating to a single vehicle when investments are smaller in size and (vi) legal, tax, accounting, regulatory and other considerations deemed relevant by the Adviser and its affiliates (including, without limitation, maintaining our qualification as a REIT and our status as a non-investment company exempt from the Investment Company Act).
Currently, Private Core+ Accounts invest in “Core+” real estate and real estate-related assets in the United States and Canada (which are generally substantially stabilized assets generating relatively stable cash flow), with a focus on office, multifamily, industrial, retail and life sciences assets in major cities and markets across the United States and Canada. To the extent an investment is determined by Blackstone to satisfy the investment objectives of us and the Private Core+ Accounts, such investment will be generally allocated in accordance with Blackstone’s prevailing policies and procedures described above. Certain Other Blackstone Accounts also invest in real estate debt with investment objectives or guidelines that overlap with ours but do not have priority over us. To the extent an investment is determined by Blackstone to satisfy the investment objectives of us and such Other Blackstone Accounts, such investment will be allocated in accordance with Blackstone’s prevailing policies and procedures described above.
69
Furthermore, the Select Opportunistic Blackstone Accounts invest in “opportunistic” real estate and real estate-related assets globally (which often are undermanaged assets and with higher potential for equity appreciation) and have priority over us with respect to such investment opportunities and select investments (e.g., certain core+ life sciences investments, private real estate loans, European and infrastructure investments) will be first offered to certain Other Blackstone Accounts (which we generally expect to have investment strategies distinct from ours but can overlap to some extent). Other Blackstone Accounts having priority over us will result in fewer investment opportunities being made available to us.
The Adviser and its affiliates calculate available capital, weigh the factors described above (which will not be weighted equally) and make other investment allocation decisions in accordance with their prevailing policies and procedures in their sole discretion, taking into account a variety of considerations, which may include, without limitation, net asset value, any actual or anticipated allocations, expected future fundraising and uses of capital, expected investor and other third-party co-investment allocation (i.e., when additional capital is raised alongside a private fund for a single investment) of Other Blackstone Accounts, applicable investment guidelines, excuse rights and investor preferences, any or all reserves, vehicle sizes and stage of investment operations (e.g., early in a vehicle’s investment operations, the vehicle may receive larger allocations than it otherwise would in connection with launching and ramping up, targeted amounts of securities as determined by the Adviser and its affiliates, geographic limitations and actual or anticipated capital needs or other factors determined by the Adviser and its affiliates. Preliminary investment allocation decisions will generally be made on or prior to the time we and such Other Blackstone Accounts commit to make the investment (which in many cases is when the purchase agreement (or equivalent) in respect of such investment opportunity is signed), and are expected to be updated from time to time prior to the time of consummation of the investment (including after deposits are made thereon) due to changes in the factors that Blackstone considers in making investment allocations among us and Other Blackstone Accounts, including, for example, due to changes in available capital (including as a result of investor subscriptions or withdrawals, deployment of capital for other investments or a reassessment of reserves), changes in portfolio composition or changes in actual or expected investor or third-party co-investment allocation, in each case between the time of committing to make the investment and the actual funding of the investment. Such adjustments in investment allocations could be material, could result in a reduced or increased allocation being made available to us and there can be no assurance that we will not be adversely affected thereby. The manner in which our available capital is determined may differ from, or subsequently change with respect to, Other Blackstone Accounts. The amounts and forms of leverage utilized for investments will also be determined by the Adviser and its affiliates in their sole discretion. Any differences or adjustments with respect to the manner in which available capital is determined with respect to us or Other Blackstone Accounts may adversely impact our allocation of particular investment opportunities. There is no assurance that any conflicts arising out of the foregoing will be resolved in our favor. Blackstone is entitled to amend its policies and procedures at any time without prior notice or our consent.
The Adviser makes good faith determinations for allocation decisions based on expectations that will, in certain circumstances, prove inaccurate. Information unavailable to the Adviser, or circumstances not foreseen by the Adviser at the time of allocation, may cause an investment opportunity to yield a different return than expected. For example, an investment opportunity that the Adviser determines to be consistent with the return objectives of an opportunistic “control-oriented” fund rather than the Company could fail to achieve the Adviser’s expectations and underwriting and generate an actual return that would have been appropriate for the Company. Conversely, an investment that the Adviser expects to be consistent with the Company’s return objectives will, in certain circumstances, exceed them. Furthermore, in certain circumstances where the Company is participating alongside one or more Other Blackstone Accounts in an investment opportunity, the Adviser is expected to be required to make initial investment allocation decisions at the time of the signing of the related purchase agreement (or equivalent) and/or funding of the deposit in respect thereof. The Adviser could change the applicable investment allocations as between the Company and such Other Blackstone Accounts between such signing and funding and the closing of such investment opportunity as it determines appropriate based on a number of factors, including (i) changes in available capital (taking into account changes in capital commitment subscriptions, redemptions and/or repurchase requests, transfers, deployment of capital, reserves for future investments among other factors) and (ii) prevailing concentration limits in respect of sector, industry, geographic region or markets in question. In such circumstances, the Company’s and such Other Blackstone Accounts’ respective obligations related to any deposit and transaction costs (including broken deal fees and expenses) would be expected to change accordingly, provided that any such adjustments, particularly in respect of funded deposits, are expected to occur at the time of the closing of the investment and interest or other additional amounts will not be due or payable in respect of any such adjustments. In addition, the Adviser could determine at any point prior to the closing of an investment opportunity that any such investment opportunity that was initially allocated to the Company based on information available to the Company at the time the allocation decision is made should subsequently be reallocated in whole or in part to one or more Other Blackstone Accounts (and vice versa) based on subsequent information received by the Adviser in respect of such investment opportunity (e.g., an investment opportunity that the Adviser initially determines to be consistent with the return objectives of the Company could subsequently be determined to be consistent with the return objectives of an opportunistic “control-oriented” fund). In such circumstance, the Adviser could determine to reallocate all or any portion of any such investment opportunity from the Company to such Other Blackstone Account (or vice versa) (such fund (including the Company) from which an investment opportunity is being reallocated, a “Reallocating Account”), including in circumstances where such Reallocating Account has entered into an exclusivity arrangement or other binding agreement with one or more third parties (any such reallocated investment opportunity, a “Reallocated Investment”). In such cases, if the non-Reallocating Account agrees to pursue the investment, it will reimburse the Reallocating Account for any deferred acquisition costs (including non-refundable or refundable deposits, breakage fees, due diligence costs and
70
other fees and expenses) incurred by the Reallocating Account relating to such Reallocated Investment, which may be so reallocated prior to closing.
The amount of performance-based compensation charged and/or management fees paid by us may be less than or exceed the amount of performance-based compensation charged and/or management fees paid by Other Blackstone Accounts. Such variation may create an incentive for our sponsor to allocate a greater percentage of an investment opportunity to us or such Other Blackstone Accounts, as the case may be.
Under certain circumstances, our Adviser may determine not to pursue some or all of an investment opportunity within our investment objectives and guidelines, including without limitation, as a result of our prior investments, business or other reasons applicable to us, Other Blackstone Accounts, Blackstone or its affiliates.
Under certain circumstances, our Adviser may determine not to pursue some or all of an investment opportunity within our investment objectives and guidelines, including without limitation, as a result of business, reputational or other reasons applicable to us, Other Blackstone Accounts, Blackstone or its affiliates. In addition, the Adviser and its affiliates may determine that we should not pursue some or all of an investment opportunity, including, by way of example and without limitation, because we have already invested sufficient capital in the investment, sector, industry, geographic region or markets in question, as determined by the Adviser and its affiliates in their good faith discretion, or the investment is not appropriate for us for other reasons as determined by the Adviser and its affiliates in their good faith reasonable sole discretion. In any such case Blackstone could, thereafter, offer such opportunity to other parties, including Other Blackstone Accounts, portfolio entities, joint venture partners, related parties or third parties. Any such Other Blackstone Accounts may be advised by a different Blackstone business group with a different investment committee, which could determine an investment opportunity to be more attractive than the Adviser believes to be the case. In any event, there can be no assurance that the Adviser’s assessment will prove correct or that the performance of any investments actually pursued by us will be comparable to any investment opportunities that are not pursued by us. Blackstone, including its personnel, will, in certain circumstances, receive compensation from any such party that makes the investment, including an allocation of carried interest or referral fees, and any such compensation could be greater than amounts paid by us to the Adviser. In some cases Blackstone earns greater fees when Other Blackstone Accounts participate alongside or instead of us in an investment.
When the Adviser and its affiliates determine not to pursue some or all of an investment opportunity for us that would otherwise be within our investment objectives and strategies, and Blackstone provides the opportunity or offers the opportunity to Other Blackstone Accounts, Blackstone, including its personnel (including real estate personnel), can be expected to receive compensation from the Other Blackstone Accounts, whether or not in respect of a particular investment, including an allocation of carried interest or referral fees, and any such compensation could be greater than amounts paid by us to the Adviser. As a result, the Adviser (including real estate personnel who receive such compensation) could be incentivized to allocate investment opportunities away from us to or source investment opportunities for Other Blackstone Accounts.
The Adviser and its affiliates make good faith determinations for allocation decisions based on expectations that will, in certain circumstances, prove inaccurate. Information unavailable to the Adviser, or circumstances not foreseen by the Adviser at the time of allocation, may cause an investment opportunity to yield a different return than expected. For example, an investment opportunity that the Adviser and its affiliates determine to be consistent with the return objective of Other Blackstone Accounts rather than us may not match the expectations and underwriting of the Adviser and its affiliates and generate an actual return that would have been appropriate for us. Conversely, an investment that the Adviser and its affiliates expect to be consistent with our return objectives will, in certain circumstances, fail to achieve them. There is no assurance that any conflicts arising out of the foregoing will be resolved in our favor. Blackstone is entitled to amend its policies and procedures at any time without prior notice or our consent.
Our board of directors has adopted a resolution that renounces our interest or expectancy with respect to business opportunities and competitive activities.
Our board of directors has adopted a resolution that renounces our interest or expectancy in, or in being offered an opportunity to participate in, business opportunities, and provides that none of Blackstone or its affiliates, our directors or any person our directors control must refrain from competing with us or present to us such business opportunities. Under this resolution Blackstone and its affiliates and our directors or any person our directors control would not be obligated to present to us opportunities unless those opportunities are expressly offered to such person in his or her capacity as a director or officer and intended exclusively for us or any of our subsidiaries, and those persons will be able to engage in competing activities without any restriction imposed as a result of Blackstone’s or its affiliates’ status as a stockholder or Blackstone’s affiliates’ status as our officers or directors.
We co-invest with Blackstone affiliates and such investments are at times in different parts of the capital structure of an issuer and may otherwise involve conflicts of interest. When we hold investments in which Other Blackstone Accounts have a different principal investment, conflicts of interest arise between us and Other Blackstone Accounts, and the Adviser may take actions that are adverse to us.
71
We co-invest with Other Blackstone Accounts in investments that are suitable for both us and such Other Blackstone Accounts. We may hold an interest in an investment that is different (including with respect to relative seniority) than the interests held by Other Blackstone Accounts (and in certain circumstances, the Adviser will be unaware of an Other Blackstone Account’s participation, as a result of information walls or otherwise). In these situations, conflicts of interest will arise. In order to mitigate any such conflicts of interest, in certain circumstances we will likely recuse ourselves from participating in any decisions relating or with respect to such investment by us or the applicable investments by the Other Blackstone Accounts, or by establishing groups separated by information barriers (which can be expected to be temporary and limited purpose in nature) within Blackstone to act on behalf of each of the clients. Despite these, and any of the other actions described below that the Adviser may take to mitigate the conflict, Blackstone may be required to take action when it will have conflicting loyalties between its duties to us and such Other Blackstone Accounts, which may adversely impact us. In that regard, actions may be taken for the Other Blackstone Accounts that are adverse to us (and vice versa). If the Other Blackstone Account maintains voting rights with respect to the securities it holds, or if we do not recuse ourselves, Blackstone may be required to take action where it will have conflicting loyalties between its duties to us and such Other Blackstone Account, which may adversely impact us. If we recuse ourselves from decision-making, we will generally rely upon a third party to make the decisions, and the third party could have conflicts or otherwise make decisions that Blackstone would not have made.
There can be no assurance that any conflict will be resolved in our favor. Conflicts can also be expected to arise in determining the amount of an investment, if any, to be allocated among potential investors and the respective terms thereof. There can be no assurance that the return on our investment will be equivalent to or better than the returns obtained by the other affiliates participating in the transaction. In addition, it is anticipated that in a bankruptcy proceeding our interest will likely be subordinated or otherwise adversely affected by virtue of such Other Blackstone Accounts’ involvement and actions relating to such investment. For example, in circumstances where we hold a junior mezzanine interest in an issuer, holders of more senior classes of debt issued by such entity (which may include Other Blackstone Accounts) may take actions for their benefit (particularly in circumstances where such issuer faces financial difficulty or distress) that further subordinate or adversely impact the value of our investment in such issuer.
In connection with negotiating loans, bank or securitization financings in respect of our real estate-related transactions, Blackstone will generally obtain the right to participate on its own behalf (or on behalf of vehicles it manages) in a portion of the financings with respect to such Blackstone-sponsored transactions (including transactions where the underlying collateral includes property owned by Other Blackstone Accounts) upon an agreed upon set of terms. We do not believe that this arrangement has an effect on the overall terms and conditions negotiated with the arrangers of such senior loans other than as described in the preceding sentence. If we make or have an investment in a property in which an Other Blackstone Account has a mezzanine or other debt investment, or vice versa, Blackstone may have conflicting loyalties between its duties to us and to other affiliates. Such investments may inherently give rise to conflicts of interest or perceived conflicts of interest between or among the various classes of securities that may be held by such entities. Because of the affiliation with Blackstone, the Adviser may have a greater incentive to invest in Blackstone-sponsored financings (as compared to real estate-related financings sponsored by other real estate firms or financial sponsors). In certain circumstances, we may be required to commit funds necessary for an investment prior to the time that all anticipated debt (senior and/or mezzanine) financing has been secured. In such circumstance, Other Blackstone Accounts and/or Blackstone itself (using, in whole or in part, its own balance sheet capital), may provide bridge or other short-term financing and/or commitments, which at the time of establishment are intended to be replaced and/or syndicated with longer-term financing. In any such circumstance, the Other Blackstone Accounts and/or Blackstone itself may receive compensation for providing such financing and/or commitment (including origination, ticking or commitment fees), which fees will not be shared with and/or otherwise result in an offset of the management fee paid to the Adviser. The conflicts applicable to Other Blackstone Accounts who invest in different securities of issuers will apply equally to Blackstone itself in such situations.
To the extent that we make or have an investment in, or through the purchase of debt obligations become a lender to, a company in which an Other Blackstone Account has a debt or equity investment (including through investments in CMBS where the underlying properties are owned by Other Blackstone Accounts), or if an Other Blackstone Account participates in a separate tranche of a financing with respect to a portfolio entity, Blackstone will generally have conflicting loyalties between its duties to us and to Other Blackstone Accounts. In that regard, actions may be taken for the Other Blackstone Accounts that are adverse to us (and vice versa). Moreover, we will generally “follow the vote” of other similarly situated third-party creditors (if any) in voting and governance matters where conflicts of interest exist and will have a limited ability to separately protect our investment and will be dependent upon such third parties’ actions (which may not be as capable as the Adviser and may have other conflicts arising from their other relationships, both with Blackstone and other third parties that could impact their decisions). In addition, conflicts can also be expected to arise in determining the amount of an investment, if any, to be allocated among potential investors and the respective terms thereof.
We may seek to participate in investments relating to (i) the refinancing or modifications of loan investments or portfolios held or proposed to be acquired by certain Other Blackstone Accounts, and Other Blackstone Accounts may refinance a loan currently held by us and/or (ii) portfolio entities of one or more Other Blackstone Accounts, including primary or secondary issuances of loans or other interests by such portfolio entities. While it is expected that our participation in connection with any such transactions will generally be negotiated by third parties, such transactions will give rise to potential or actual conflicts of interest.
72
We may invest in joint ventures with Other Blackstone Accounts or divide a pool of investments among us and Other Blackstone Accounts.
To the extent we acquire properties through joint ventures with Other Blackstone Accounts, such investments will be allocated as described above, and we may be allocated interests in such joint ventures that are smaller than the interests of the Other Blackstone Accounts. Generally, we expect the level of control we have with respect to any joint venture will correspond to our economic interest in such joint venture, but this may not always be the case. We may participate in follow-on investments in the joint ventures with Other Blackstone Accounts in which the Other Blackstone Accounts may invest less than their pro rata share or may not participate at all or vice versa. We will not participate in joint ventures in which we do not have or share control to the extent that we believe such participation would potentially threaten our status as a non-investment company exempt from the Investment Company Act. This may prevent us from receiving an allocation with respect to certain investment opportunities that are suitable for both us and one or more Other Blackstone Accounts. Such joint venture investments will involve risks and conflicts of interests. See “—Risks Related Investments in Real Estate—We may make a substantial amount of joint venture investments, including with Blackstone affiliates. Joint venture investments could be adversely affected by our lack of sole decision-making authority, our reliance on the financial condition of our joint venture partners and disputes between us and our joint venture partners.”
Our sponsor may have an opportunity to acquire a property, portfolio or pool of assets, securities and instruments in a single or related transactions with a particular seller that it determines in its sole discretion should be divided and allocated among us and Other Blackstone Accounts, including where certain of such assets, securities or instruments are specifically allocated (in whole or in part) to us and such Other Blackstone Accounts. Such allocations generally would be based on its assessment of, among other things, the expected returns and risk profile of the portfolio and each of the assets therein and may provide greater benefits to Other Blackstone Accounts than to us (or vice versa). For example, some of the assets in a pool may have an opportunistic return profile not appropriate for us. Also, a pool may contain both debt and equity instruments that our sponsor determines should be allocated to different funds. In all of these situations, the combined purchase price paid to a seller would be allocated among the multiple assets, securities and instruments in the pool based on a determination by the seller, by a third-party valuation firm and/or by the Adviser and its affiliates, and therefore among us and the Other Blackstone Accounts acquiring any of the assets, securities and instruments, although our sponsor could, in certain circumstances, allocate value to us and such Other Blackstone Accounts on a different basis than the contractual purchase price. To the extent that any such allocations would cause us to participate in a transaction with Other Blackstone Accounts for a portfolio or pool of assets, securities and instruments that we otherwise may not have acquired individually, our sponsor will have conflicting loyalties between its duties to us and to Other Blackstone Accounts.
Similarly, there will likely be circumstances in which we and Other Blackstone Accounts will sell assets in a single transaction or related transactions to a buyer. In some cases a counterparty will require an allocation of value in the purchase or sale contract, though our sponsor could determine such allocation of value is not accurate and should not be relied upon. Unless an appraisal is required by our charter, our sponsor will generally rely upon internal analysis to determine the ultimate allocation of value, though it could also obtain third-party valuation reports. Regardless of the methodology for allocating value, our sponsor will have conflicting duties to us and Other Blackstone Accounts when they buy or sell assets together in a portfolio, including as a result of different financial incentives our sponsor has with respect to different vehicles, most clearly when the fees and compensation, including performance-based compensation, earned from the different vehicles differ. There can be no assurance that our investment will not be valued or allocated a purchase price that is higher or lower than it might otherwise have been allocated if such investment were acquired or sold independently rather than as a component of a portfolio shared with Other Blackstone Accounts.
The amount of performance-based compensation charged and/or management fees paid by us may be less than or exceed the amount of performance-based compensation charged and/or management fees paid by Other Blackstone Accounts. Such variation may create an incentive for our sponsor to allocate a greater percentage of an investment opportunity to us or such Other Blackstone Accounts, as the case may be.
Blackstone may structure certain investments such that Blackstone will face conflicting fiduciary duties to us and certain debt funds.
It is expected that Blackstone will structure certain investments such that one or more mezzanine or other investment funds, structured vehicles or other collective investment vehicles primarily investing in senior secured loans, distressed debt, subordinated debt, high-yield securities, CMBS and other similar debt instruments managed by affiliates of Blackstone (collectively, “Debt Funds”) are offered the opportunity to participate in the debt tranche of an investment allocated to us. The Adviser and its affiliates owe fiduciary duties to the Debt Funds as well as to us. If the Debt Funds purchase high-yield securities or other debt instruments related to a property or real estate company that we hold an investment in (or if we make or have an investment in or, through the purchase of debt obligations become a lender to, a company or property in which a Debt Fund or an Other Blackstone Account or another Blackstone real estate fund or vehicle has a mezzanine or other debt investment), the Adviser and its affiliates will face a conflict of interest in respect of the advice given to, or the decisions made with regard to, the Debt Funds, such Other Blackstone Accounts and us (e.g., with respect to the terms of such high-yield securities or other debt instruments, the enforcement of covenants, the terms of
73
recapitalizations and the resolution of workouts or bankruptcies). Similarly, certain Other Blackstone Accounts can be expected to invest in securities of publicly traded companies that are actual or potential investments of ours. The trading activities of Other Blackstone Accounts may differ from or be inconsistent with activities that are undertaken for our account in any such securities. In addition, we may not pursue an investment otherwise within our investment objectives and guidelines as a result of such trading activities by Other Blackstone Accounts.
Blackstone may raise and/or manage Other Blackstone Accounts, which could result in the reallocation of Blackstone personnel and the direction of potential investments to such Other Blackstone Accounts.
Blackstone reserves the right to raise and/or manage Other Blackstone Accounts, including opportunistic and stabilized and substantially stabilized real estate funds or separate accounts, dedicated managed accounts, investments suitable for lower risk, lower return funds or higher risk, higher return funds, real estate debt obligation and trading investment vehicles, real estate funds primarily making investments globally, in a particular region outside of the United States and Canada, or in a single sector of the real estate investment space (e.g., office, industrial, retail or rental housing) or making non-controlling investments in public and private debt and equity securities and/or investment funds that may have the same or similar investment objectives or guidelines as us or investments, including those raised by us and one or more managed accounts (or other similar arrangements structured through an entity) for the benefit of one or more specific investors (or related group of investors) which, in each case, may have investment objectives or guidelines that overlap with ours. See “—Certain Other Blackstone Accounts have similar or overlapping investment objectives and guidelines, and we will not be allocated certain opportunities and may be allocated only opportunities with lower relative returns.” In particular, we expect that there will be overlap of real estate and real estate debt investment opportunities with certain Other Blackstone Accounts that are actively investing and similar overlap with future Other Blackstone Accounts. The closing of an Other Blackstone Account could result in the reallocation of Blackstone personnel, including reallocation of existing real estate professionals, to such Other Blackstone Account. In addition, potential investments that may be suitable for us may be directed toward such Other Blackstone Account.
Blackstone’s potential involvement in financing a third party’s purchase of assets from us could lead to potential or actual conflicts of interest.
We may from time to time dispose of all or a portion of an investment by way of a third-party purchaser’s bid where Blackstone or one or more Other Blackstone Accounts is providing financing as part of such bid or acquisition of the investment or underlying assets thereof. This may include the circumstance where Blackstone or one or more Other Blackstone Accounts is making commitments to provide financing at or prior to the time such third-party purchaser commits to purchase such investments or assets from us. Such involvement of Blackstone or one or more Other Blackstone Accounts as such a provider of debt financing in connection with the potential acquisition of portfolio investments by third parties from us may give rise to potential or actual conflicts of interest.
We may provide debt financing in connection with acquisitions by third parties of assets owned by Other Blackstone Accounts.
We may provide financing as part of a third-party purchaser’s bid or acquisition of (or investment in) a portfolio entity (or the underlying assets of) owned by one or more Other Blackstone Accounts (or in connection with the acquisitions by one or more Other Blackstone Accounts or their affiliates of assets or interests (and/or portfolios thereof) owned by a third party). This may include making commitments to provide financing at, prior to or around the time that any such purchaser commits to or makes such investments. We may make investments and provide debt financing with respect to portfolio entities in which Other Blackstone Accounts and/or affiliates hold or subsequently acquire an interest. While the terms and conditions of any such arrangements will generally be on market terms, the involvement of the Other Blackstone Accounts or affiliates in such transactions may affect credit decisions and the terms of such transactions or arrangements and/or may otherwise influence the Adviser’s decisions, which will give rise to potential or actual conflicts of interest and which may adversely impact us. For example, such transactions may involve the partial or complete payoff of such loans (with related proceeds being received by the applicable Other Blackstone Accounts) and/or otherwise result in restructurings of terms and pricing relating to such existing loans with the borrowers thereof in respect of which such Other Blackstone Accounts may receive refinancing proceeds and/or a retained interest in such loans in accordance with such restructuring arrangements. Additionally, in certain situations we may not commit to provide financing until a third party has committed to make a deposit in connection with the acquisition of an investment from an Other Blackstone Account, which may result in us being disadvantaged in the overall bid process or potentially not consummating the investment.
Disputes between Blackstone and our joint venture partners who have pre-existing investments with Blackstone may affect our investments relating thereto.
Some of the third-party operators and joint-venture partners with which the Adviser may elect to co-invest our capital may have pre-existing investments with Blackstone. The terms of these preexisting investments may differ from the terms upon which we invest with such operators and partners. To the extent a dispute arises between Blackstone and such operators and partners, our investments relating thereto may be affected.
74
Certain principals and employees will, in certain circumstances, be involved in and have a greater financial interest in the performance of Other Blackstone Accounts, and such activities may create conflicts of interest in making investment decisions on our behalf.
Certain Blackstone personnel will, in certain circumstances, be subject to a variety of conflicts of interest relating to their responsibilities to us, Other Blackstone Accounts and portfolio entities, and their outside personal or business activities, including as members of investment or advisory committees or boards of directors of or advisors to investment funds, corporations, foundations or other organizations. Such positions create a conflict if such other entities have interests that are adverse to those of us, including if such other entities compete with us for investment opportunities or other resources. The Blackstone personnel in question may have a greater financial interest in the performance of the other entities than our performance. This involvement may create conflicts of interest in making investments on our behalf and on behalf of such other funds, accounts and other entities. Although the Adviser will generally seek to minimize the impact of any such conflicts, there can be no assurance they will be resolved favorably for us. Also, Blackstone personnel are generally permitted to invest in alternative investment funds, private equity funds, real estate funds, hedge funds and other investment vehicles, as well as engage in other personal trading activities relating to companies, assets, securities or instruments (subject to Blackstone’s Code of Ethics requirements), some of which will involve conflicts of interests. Such personal securities transactions will, in certain circumstances, relate to securities or instruments, which can be expected to also be held or acquired by us or Other Blackstone Accounts, or otherwise relate to companies or issuers in which we have or acquire a different principal investment (including, for example, with respect to seniority). There can be no assurance that conflicts of interest arising out of such activities will be resolved in our favor. Investors will not receive any benefit from any such investments, and the financial incentives of Blackstone personnel in such other investments could be greater than their financial incentives in relation to us.In addition, Blackstone has entered, and it can be expected that Blackstone in the future will enter, into strategic relationships with investors (and/or one or more of their affiliates) that involve an overall relationship with Blackstone (which will afford such investor special rights and benefits) for such investor’s (and/or one or more of their affiliates’) investments in one or more Other Blackstone Accounts (“Strategic Relationships”). A Strategic Relationship may involve an investor agreeing to make a capital commitment or extend a commitment or lock-up period, as applicable, to two or more Other Blackstone Accounts, including but not limited to the Company. A Strategic Relationship may also involve Blackstone or its affiliate contributing cash or other assets to support certain return targets with respect to an investment in one or more Other Blackstone Accounts through a Strategic Relationship, which investment returns may also be subject to additional incentive or other fees payable to Blackstone if satisfied in accordance with the terms of the Strategic Relationship program. As a result, Blackstone may be incentivized to allocate investment opportunities to certain Other Blackstone Accounts or source investment opportunities for Strategic Relationships.
The Adviser may face conflicts of interests in choosing our service providers and certain service providers may provide services to the Dealer Manager, the Adviser or Blackstone on more favorable terms than those payable by us.
Pursuant to the terms of our Advisory Agreement, the Adviser may retain, for and on our behalf and at our expense, the services of certain other persons and firms as the Adviser deems necessary or advisable in connection with our management as operations. Certain third-party advisors and other service providers and vendors to us (including accountants, administrators, lenders, bankers, brokers, attorneys, consultants, title agents, loan servicing and administration providers, property managers and investment or commercial banking firms) are owned by Blackstone, us or Other Blackstone Accounts or provide goods or services to, or have other business, personal, financial or other relationships with, Blackstone, the Other Blackstone Accounts and their portfolio entities, the Dealer Manager, the Adviser and affiliates and personnel of the foregoing. Also, advisors, lenders, investors, commercial counterparties, vendors and service providers (including any of their affiliates or personnel) to us could have other commercial or personal relationships with Blackstone, Other Blackstone Accounts and their respective affiliates, personnel or family members of personnel of the foregoing. Expenses allocable to us may increase where service providers are retained to provide services to us.
Certain advisors and service providers (including law firms) may temporarily provide their personnel to Blackstone, us or Other Blackstone Accounts or their portfolio companies pursuant to various arrangements including at cost or at no cost. In certain circumstances, we may also have significant control in selecting individuals or dedicated teams at such advisors and service providers and in determining their compensation. While often we and such Other Blackstone Accounts and their portfolio companies are the beneficiaries of these types of arrangements, Blackstone is from time to time a beneficiary of these arrangements as well, including in circumstances where the advisor or service provider also provides services to us in the ordinary course. Such personnel may provide services in respect of multiple matters, including in respect of matters related to Blackstone, its affiliates and/or portfolio companies and any costs of such personnel may be allocated accordingly.
Although Blackstone selects service providers and vendors it believes are most appropriate in the circumstances based on its knowledge of such service providers and vendors (which knowledge is generally greater in the case of service providers and vendors that have other relationships to Blackstone), the relationship of service providers and vendors to Blackstone as described above will, in certain circumstances, influence Blackstone in deciding whether to select, recommend or form such an advisor or service provider to perform services for us, the cost of which will generally be borne directly or indirectly by us, and incentivize Blackstone to engage
75
such service provider over a third party, utilize the services of such service providers and vendors more frequently than would be the case absent the conflict, or to cause us to pay such service providers and vendors higher fees or commissions than would be the case absent the conflict. The incentive could be created by current income and/or the generation of enterprise value in a service provider or vendor; Blackstone may also have an incentive to invest in or create service providers and vendors to realize on these opportunities. Furthermore, Blackstone will from time to time encourage third-party service providers to Other Blackstone Accounts to use other service providers and vendors in which Blackstone has an interest, and Blackstone has an incentive to use third-party service providers who do so as a result of the additional business for the related service providers and vendors. Fees paid to or value created in these service providers and vendors do not offset or reduce the Adviser’s management fee and are not otherwise shared with us.
In the case of brokers of securities, our sponsor has a best execution policy that it updates from time to time to comply with regulatory requirements in applicable jurisdictions.
Blackstone, Other Blackstone Accounts, portfolio entities, and personnel and related parties of the foregoing will receive fees and compensation, including performance-based and other incentive fees, which could be substantial, for products and services provided to us, such as fees for asset management (including, without limitation, management fees and carried interest/incentive arrangements), development and property management; arranging; underwriting (including, without limitation, evaluation regarding value creation opportunities and ESG risk mitigation), syndication or refinancing of a loan or investment (including acquisition fees, loan modification or restructuring fees); loan servicing; special servicing; administrative services; advisory services on purchase or sale of an asset or company; advisory services; investment banking and capital market services; treasury and valuation services; placement agent services; fund administration; internal legal and tax planning services; information technology products and services; insurance procurement; brokerage solutions and risk management services; data extraction and management products and services; BX Energy Services; Revantage acquisition and disposition program management; fees for monitoring and oversight of loans, property, title and/or other types of insurance and related services; and other products and services (including but not limited to restructuring, consulting, monitoring, commitment, syndication, origination, organizational and financing, and divestment services). Such parties will also provide products and services for fees to Blackstone, Other Blackstone Accounts and portfolio entities, and their personnel and related parties, as well as third parties. Through its Innovations group, Blackstone incubates businesses that can be expected to provide goods and services to us, our portfolio properties, Other Blackstone Accounts and their affiliates, as well as other Blackstone related parties and third parties. By contracting for a product or service from a business related to Blackstone, we would provide not only current income to the business and its stakeholders, but could also create significant enterprise value in them, which would not be shared with us or our stockholders and could benefit Blackstone directly and indirectly. Also, Blackstone, Other Blackstone Accounts and portfolio entities, and their personnel and related parties will, in certain circumstances, receive compensation or other benefits, such as through additional ownership interests or otherwise, directly related to the consumption of products and services by us. We will incur expense in negotiating for any such fees and services. Finally, Blackstone and its personnel and related parties may also receive compensation for origination expenses and with respect to unconsummated transactions.
Blackstone and portfolio entities of Other Blackstone Accounts are and will be counterparties or participants in agreements, transactions and other arrangements with us for the provision of goods and services, purchase and sale of assets and other matters. In addition, certain of our portfolio entities may be counterparties or participants in agreements, transactions and other arrangements with Other Blackstone Accounts for the provision of goods and services, purchase and sale of assets and other matters. These agreements, transactions and other arrangements will involve payment of fees and other amounts, none of which will result in any offset to the management fees we pay to the Adviser notwithstanding that some of the services provided by such portfolio entity are similar in nature to the services provided by the Adviser. Generally, we may engage Blackstone-affiliated portfolio entities or allow our portfolio entities to be engaged by Blackstone-affiliated entities only if a majority of our board of directors, and a majority of the affiliate transaction committee (which is comprised of each of our independent directors) not otherwise interested in the transaction approve the transaction as being fair and reasonable to us and on terms and conditions no less favorable to us than those available from unaffiliated third parties.
We may engage portfolio entities of Other Blackstone Accounts and Other Blackstone Accounts may engage our portfolio entities to provide some or all of the following services: (a) corporate support services (including, without limitation, accounts payable, accounting/audit (e.g., valuation support services), account management (e.g., treasury, customer due diligence), insurance, procurement, placement, brokerage, consulting, cash management, corporate secretarial and executive assistant services, domiciliation, data management, directorship services, finance/budget, human resources (e.g., the onboarding and ongoing development of personnel), communication, public relations and publicity, information technology and software systems support, corporate governance and entity management (e.g., liquidation, dissolution and/or otherwise end of term services), risk management and internal compliance/know-your-client reviews and refreshes, judicial processes, legal, environmental and or sustainability due diligence support (e.g., review of property condition reports, clean energy consumption), climate accounting services, ESG program management services, engineering services, services related to the sourcing, development and implementation of renewable energy, ESG data collection and reporting services, capital planning services, operational coordination (e.g., coordination with JV partners, property managers), risk management, reporting (e.g., on tax, debt, portfolio or other similar topics), and tax analysis and compliance
76
(e.g., CIT and VAT compliance, transfer pricing, internal risk control, treasury and valuation services)), business intelligence and data science services, fundraising support, legal/ business/ finance optimization and innovation (including legal invoice automation), and vendor selection ; (b) borrowing management (including, without limitation, monitoring, restructuring and work-out of performing, sub-performing and nonperforming loans consolidation, cash management, financing management, administrative support and lender relationship management (e.g., coordinating with lender on any ongoing obligations under any relevant borrowing, indebtedness or other credit support (including, any required consultation with or reporting to such lender) , and whole loan servicing oversight (e.g., collateral management, due diligence and servicing oversight))); (c) management services (i.e., management by a portfolio entity, Blackstone affiliate or third party (e.g., a third-party manager) of operational services including personnel operational coordination (i.e., coordination with JV partners, operating partners, and property managers), planning with respect to portfolio composition (including hold / sell analysis support), ESG-related planning (including data collection, review, support and execution), revenue management support and portfolio and property reporting)); (d) operational and other services (i.e., general management of day to day operations, including, without limitation, construction management and oversight (such as management of general contractors on capital projects, tenant improvements, and tenant space build-outs), leasing services (such as leasing strategy, management of third-party brokers, negotiation of major leases, negotiation of leases, and mall income including parking, advertising, and promotional space), project management (such as management of development projects, project design and execution, vendor management, and turnkey services (end-to-end execution for real estate projects)) and property management (such as property-level management, cleaning, energy consumption, security, revenue management, contract management, expense management, capital expenditure projects, facility management, business plan execution, engineering, capital expenditure design and implementation, and reporting, as well as mall management services, such as provision of on-site staff, rent collection, service charge accounting and operation, marketing and advertising, tenant and guest relations, maintenance of common space, selecting and engaging architects, contractors and other third parties involved in construction, supervision of on-site third-party contractors such as facilities’ maintenance, cleaning, and security, and, in outlets and high-end centers services, provision of retail managers to oversee tenant merchandising, promotions, and inventory), tracking Portfolio Entity employees and other advisors utilization and other metrics for fund-level reporting obligations, creating and developing strategic initiatives and road maps with respect to ESG, consolidating and assisting with ESG and other side letter reporting; and (e) transaction support services (including, without limitation, acquisition support, customer due diligence and related on-boarding, liquidation, reporting, relationship management with brokers, banks and other potential sources of investments including development sites and providing diligence and negotiation support to acquire the same, identifying potential investments, coordinating with investors, assembling relevant information, conducting financial and market analyses and modelling, coordinating closing/post-closing procedures for acquisitions, dispositions and other transactions, coordination of design and development works (such as recommending and implementing design decisions), marketing and distribution, overseeing brokers, lawyers, accountants and other advisors, working with consultants and third-parties to pursue entitlements, providing legal, ESG and accounting services, assisting with due diligence, preparation of project feasibility analysis, site visits, transaction consulting and specification of technical analysis and review of (i) design and structural work, (ii) architectural, façade and external finishes, (iii) certifications, (iv) operations and maintenance manuals and (v) statutory documents).
Such portfolio entities of Other Blackstone Accounts that can be expected to provide services to us include, without limitation, the following, and may include additional portfolio entities that may be formed or acquired in the future:
LivCor. We have engaged LivCor, LLC, a portfolio company owned by Blackstone-advised investment vehicles, to provide, as applicable, operational services, management services, loan management services, corporate support services and transaction support services for our multifamily properties.
EQ Management. We have engaged EQ Management, LLC, a portfolio company owned by Blackstone-advised investment vehicles, to provide, as applicable, operational services, management services, loan management services, corporate support services and transaction support services for our office properties.
ShopCore. We have engaged ShopCore Properties TRS Management LLC, a portfolio company owned by Blackstone-advised investment vehicles, to provide, as applicable, operational services, management services, loan management services, corporate support services and transaction support services for our retail properties.
Link. We have engaged Link Logistics Real Estate Holdco LLC, a portfolio company owned by Blackstone-advised investment vehicles, to provide, as applicable, operational services, management services, loan management services, corporate support services and transaction support services for our logistics properties.
BRE Hotels & Resorts. We have engaged BRE Hotels & Resorts LLC, a portfolio company controlled (but not owned) by Blackstone-advised investment vehicles, to provide, as applicable, operational services, management services, loan management services, corporate support services and transaction support services for our hospitality properties.
77
Longview. We have engaged Longview Senior Housing, LLC, a portfolio company owned by Blackstone-advised investment vehicles, to provide, as applicable, operational services, management services, loan management services, corporate support services and transaction support services for our senior housing properties.
Revantage. We have engaged Revantage Corporate Services, LLC and Revantage Global Services Europe S.à r.l. (collectively “Revantage”), portfolio companies owned by Blackstone-advised investment vehicles, to provide, as applicable, corporate support services (including, without limitation, accounting, legal, tax, treasury, valuation services, information technology and data management) and transaction support services to certain of our investments directly.
Beam Living. We have engaged BPP MNY Employer LLC (“Beam Living”), a portfolio company owned by Blackstone-advised investment vehicles, to provide, as applicable, operational services, management services, loan management services, corporate support services and transaction support services for our multifamily properties in New York City.
We compensate these service providers and vendors owned by the Other Blackstone Accounts for services rendered to us, including through promote or other incentive-based compensation payable to their management teams and other related parties. The incentive-based compensation paid with respect to a portfolio entity or property will vary from the incentive based compensation paid with respect to other portfolio entities and properties; as a result the management team or other related parties may have greater incentives with respect to certain properties and portfolio entities relative to others, and the performance of certain properties and portfolio entities may provide incentives to retain management that also service other properties and portfolio entities. Such service providers and vendors may charge for certain goods and services at rates generally consistent with those available in the market for similar goods and services. The discussion regarding the determination of market rates below applies equally in respect of the fees and expenses of the portfolio entity service providers, if charged at rates generally consistent with those available in the market. Such service providers and vendors may also pass through expenses for other services on a cost reimbursement, no-profit, revenue, purchase and sale price, capital spend, or break-even basis, (even if third party customers or clients are charged on a different basis), which break-even point may occur over a period of time such that such service provider or vendor may realize a profit in a given year which would be expected to be applied towards the costs in subsequent period. In such cases, costs and expenses associated with goods and services provided by service providers and vendors owned by Other Blackstone Accounts (including for the avoidance of doubt, all overhead associated with such service providers and vendors owned by Other Blackstone Accounts) are allocated to us and/or the portfolio companies. Such costs and expenses are expected to include any of the following: salaries, wages, benefits and travel expenses; marketing and advertising fees and expenses; legal, compliance, accounting and other professional fees and disbursements; office space, furniture and fixtures, and equipment; insurance premiums; technology expenditures, including hardware and software costs, and servicing costs and upgrades related thereto); costs to engage recruitment firms to hire employees; diligence expenses; one-time costs, including costs related to building-out, expanding and winding-down a portfolio property costs that are of a limited duration or non-recurring (such as start-up or technology build-up costs, one-time technology and systems implementation costs, employee on-boarding, ongoing training and severance payments, and IPO-readiness and other infrastructure costs); related tax costs and/or liabilities determined by Blackstone based on applicable marginal tax rates; and other operating, establishment, expansion and capital expenditures (including financing and interest thereon). Any of the foregoing costs, although allocated in a particular period, will, in certain circumstances, relate to activities occurring outside the period (including in prior periods, such as where any such costs are amortized over an extended period), and therefore we could pay more than our pro rata portion of fees for services. In addition, in certain circumstances, Blackstone also relies on the management team of a portfolio entity with respect to the determination of costs and expenses and allocation thereof and does not oversee or participate in such determinations or allocations. Moreover, to the extent a portfolio entity uses an allocated cost model with respect to fees, costs and expenses, such fees, costs and expenses are typically estimated and/or accrued quarterly (or on another regular periodic basis) but not finalized until year-end and as a result, such year-end true-up is subject to fluctuation and increases such that for a given year, the year-end cumulative amount with respect to fees, costs and expenses may be greater than the sum of the quarterly estimates (or other periodic estimates where applicable) and/or accruals and therefore we could bear more fees, costs and expenses at year-end than had been anticipated throughout the year. The allocation of costs and expenses (including for the avoidance of doubt overhead) among the entities and assets to which services are provided can be expected to be based on any of a number of different methodologies, including, without limitation, on the basis of “cost” as described above, “revenue”, “time-allocation”, “per unit”, “revenue,” “spend,” “number of units,” “per square footage” or “fixed percentage” or purchase or sale price and the particular methodology used to allocate such costs among the entities and assets to which services are provided is expected to vary depending on the types of services provided and the applicable asset class involved and could, in certain circumstances, change from one period to another. There can be no assurance that a different manner of allocation would result in our bearing less or more costs and expenses. In addition, a portfolio entity that uses a “cost” basis methodology may, in certain circumstances, change its allocation methodology, for example, to charging a flat fee for a particular service or instance (or vice versa) or to another methodology described herein or otherwise and such changes may increase or reduce the amounts received by such portfolio entities for the same services. A service provider may subcontract certain of its responsibilities to other portfolio entities. In such circumstances, the relevant subcontractor could invoice the portfolio entity for fees (or in the case of a cost reimbursement arrangement, for allocable costs and expenses) in respect of the services provided by the subcontractor. The portfolio entity, if charging on a cost reimbursement, no-profit or break-even basis, would in turn allocate those costs and expenses as it allocates other fees and expenses as described above. Similarly, Other Blackstone Accounts, their portfolio entities and Blackstone
78
may engage our portfolio entities, including QTS Realty Trust, Home Partners of America, American Campus Communities, April Housing and any of our future portfolio entities, to provide services, and these portfolio entities will generally charge for services in the same manner described above, but we generally will not be reimbursed for any costs (such as start-up costs) relating to such portfolio entity incurred prior to such engagement.
We, Other Blackstone Accounts and their affiliates are expected to enter into joint ventures with third parties to which the service providers and vendors described above will provide services. In some of these cases, the joint venture partner may negotiate to not pay its pro rata share of fees, costs and expenses to be allocated as described above, in which case we, Other Blackstone Accounts and their affiliates that also use the services of the portfolio entity service provider will, directly or indirectly, pay the difference, or the portfolio entity service provider will bear a loss equal to the difference. Moreover, in certain circumstances, the joint venture partner may be allocated fees, costs and expenses pursuant to a different methodology than a portfolio entity’s standard allocation methodology, which could result in us or the portfolio entities being allocated more fees, costs and expenses than they would otherwise be allocated solely pursuant to such standard allocation methodology. Portfolio entity service providers described in this section are generally owned and controlled by one or more Blackstone funds such as Other Blackstone Accounts. In certain instances a similar company could be owned or controlled by Blackstone directly. Service providers described in this risk factor are generally owned and controlled by a Blackstone fund, such as the Other Blackstone Accounts.
Blackstone has a general practice of not entering into any arrangements with advisors, vendors or service providers that provide lower rates or discounts to Blackstone itself compared to those available to us for the same services. However, legal fees for unconsummated transactions are often charged at a discount rate, such that if we consummate a higher percentage of transactions with a particular law firm than Blackstone, Other Blackstone Accounts and their affiliates, we could indirectly pay a higher net effective rate for the services of that law firm than Blackstone or Other Blackstone Accounts or their affiliates. Also, advisors, vendors and service providers often charge different rates or have different arrangements for different types of services. For example, advisors, vendors and service providers often charge fees based on the complexity of the matter as well as the expertise and time required to handle it. Therefore, to the extent the types of services used by us are different from those used by Blackstone, Other Blackstone Accounts and their affiliates and personnel, we can be expected to pay different amounts or rates than those paid by such other persons. Similarly, Blackstone, the Other Blackstone Accounts and affiliates and we can be expected to enter into agreements or other arrangements with vendors and other similar counterparties (whether such counterparties are affiliated or unaffiliated with Blackstone) from time to time whereby such counterparty will, in certain circumstances, charge lower rates (or no fee) or provide discounts or rebates for such counterparty’s products or services depending on the volume of transactions in the aggregate or other factors.
In addition to the service providers (including portfolio entity service providers) and vendors described above, we will engage in transactions with one or more businesses that are owned or controlled by Blackstone directly, not through one of its funds, including the businesses described below. These businesses will, in certain circumstances, also enter into transactions with other counterparties of ours. Blackstone could benefit from these transactions and activities through current income and creation of enterprise value in these businesses. Furthermore, Blackstone will from time to time encourage our third-party service providers to use other Blackstone-affiliated service providers and vendors in connection with our business and the business of portfolio entities and unaffiliated entities, and Blackstone has an incentive to use third-party service providers who do so as a result of the indirect benefit to Blackstone and additional business for the related service providers and vendors. No fees charged by these service providers and vendors will offset or reduce the Adviser’s management fees. Furthermore, Blackstone, the Other Blackstone Accounts and their affiliates and related parties will use the services of these Blackstone affiliates, including at different rates. Although Blackstone believes the services provided by its affiliates are equal or better than those of third parties, Blackstone directly benefits from the engagement of these affiliates, and there is therefore an inherent conflict of interest.
Blackstone-affiliated service providers and vendors, include, without limitation:
LNLS. Lexington National Land Services (“LNLS”) is a Blackstone affiliate that (i) acts as a title agent in facilitating and issuing title insurance, (ii) provides title support services for title insurance underwriters and (iii) acts as escrow agent in connection with investments by us, Other Blackstone Accounts and their affiliates and related parties, and third parties. In exchange for such services LNLS earns fees, which would have otherwise been paid to third parties. If LNLS is involved in a transaction in which we participate, LNLS will benchmark such fees to the extent market data is available except when LNLS is providing such services in a state where the insurance premium or escrow fee, as applicable, is regulated by the state or when LNLS is part of a syndicate of title insurance companies where the insurance premium is negotiated by other title insurance underwriters or their agents.
Certain Blackstone-affiliated service providers and their respective personnel will receive a management promote, an incentive fee and other performance-based compensation in respect of our investments or overall performance, which could be in the form of shares of our common stock. Furthermore, Blackstone-affiliated service providers can be expected to charge costs and expenses based on allocable overhead associated with personnel working on relevant matters (including salaries, benefits and other similar expenses), provided that these amounts will not exceed market rates as determined to be appropriate under the circumstances. Generally, we may engage Blackstone-affiliated service providers only if a majority of our board of directors, and a majority of the affiliate transaction
79
committee (which is comprised of each of our independent directors), not otherwise interested in the transaction approve the transaction as being fair and reasonable to us and on terms and conditions no less favorable to us than those available from unaffiliated third parties.
The Adviser and its affiliates will make determinations of market rates (i.e., rates that fall within a range that the Adviser and its affiliates has determined is reflective of rates in the applicable market and certain similar markets, though not necessarily equal to or lower than the median rate of comparable firms) based on its consideration of a number of factors, which are generally expected to include the experience of the Adviser and its affiliates with non-affiliated service providers as well as benchmarking data and other methodologies determined by the Adviser and its affiliates to be appropriate under the circumstances. In respect of benchmarking, while Blackstone often obtains benchmarking data regarding the rates charged or quoted by third parties for services similar to those provided by Blackstone affiliates in the applicable market or certain similar markets, relevant comparisons may not be available for a number of reasons, including, without limitation, as a result of a lack of a substantial market of providers or users of such services or the confidential or bespoke nature of such services (e.g., within property management services, different assets may receive different property management services). In addition, benchmarking data is based on general market and broad industry overviews, rather than determined on an asset by asset basis. As a result, benchmarking data does not take into account specific characteristics of individual assets then owned or to be acquired (such as location or size), or the particular characteristics of services provided. For these reasons, such market comparisons may not result in precise market terms for comparable services. Expenses to obtain benchmarking data will be borne by us or by Other Blackstone Accounts and will not offset the management fee we pay to the Adviser. Finally, in certain circumstances third-party benchmarking may be considered unnecessary, including because the price for a particular good or service is mandated by law (e.g., title insurance in rate regulated states). In addition, Blackstone is not required to perform or obtain benchmarking analysis of expenses with respect to non-recurring contracts with portfolio entity service providers and will exclude non-recurring costs from benchmarking analysis when such analysis is required, unless otherwise required by our charter. Blackstone is not required to perform or obtain benchmarking analysis or third-party verification of expenses with respect to services provided by portfolio entity service providers on a cost reimbursement, no-profit or break-even basis, or in respect of incentive-based compensation, unless otherwise required by our charter. Some of the services performed by Blackstone-affiliated service providers could also be performed by our sponsor from time to time and vice versa. Fees paid by us to Blackstone-affiliated service providers do not offset or reduce the management fee we pay to the Adviser and are not otherwise shared with us.
For more information regarding our relationships with Blackstone entities providing services to us or our subsidiaries, see “Selected Information Regarding our Operations—Related Party Transactions” in the Prospectus, and “Related Party Transactions” in the notes to our consolidated financial statements appearing in this Annual Report on Form 10-K, each as incorporated herein by reference. Blackstone and Other Blackstone Accounts operate in multiple industries, including the real estate related information technology industry, and provide products and services to or otherwise contract with us, among others. In connection with any such investment, Blackstone and Other Blackstone Accounts (or their respective portfolio entities and personnel and related parties) can be expected to make referrals or introductions to us or other portfolio entities in an effort, in part, to increase the customer base of such companies or businesses or because such referrals or introductions will, in certain circumstances, result in financial benefits, such as cash payments, additional equity ownership, participation in revenue share, accruing to the party making the introduction. In the alternative, Blackstone may form a joint venture (or other business relationship) with such a portfolio entity to implement such arrangements, pursuant to which the joint venture or business provides services (including, without limitation, corporate support services, loan management services, management services, operational services, risk management services, data management services, consulting services, brokerage services, sustainability and clean energy consulting services, insurance procurement, placement, brokerage and consulting services, and other services to such portfolio entities) that are referred to the joint venture or business by Blackstone. Such joint venture or business could use data obtained from such portfolio entities. We typically will not share in any fees, economics, equity or other benefits accruing to Blackstone, Other Blackstone Accounts and their respective portfolio entities as a result of such introduction.
We will enter into agreements regarding group procurement (such as CoreTrust, an independent group purchasing organization), benefits management, purchase of title and other insurance policies (which can be expected to include brokerage or placement thereof) and will otherwise enter into operational, administrative or management related initiatives. Blackstone will allocate the cost of these various services and products purchased on a group basis among us, Other Blackstone Accounts and portfolio entities. Some of these arrangements result in commissions, discounts, rebates or similar payments to Blackstone and its personnel, or Other Blackstone Accounts and their portfolio entities, including as a result of transactions entered into by us, and such commissions or payment will not offset the management fee payable to the Adviser. Blackstone can be expected to also receive consulting, usage or other fees from the parties to these group procurement arrangements. To the extent that a portfolio entity of an Other Blackstone Account is providing such a service, such portfolio entity and such Other Blackstone Account will benefit. Further, the benefits received by the particular portfolio entity providing the service will, in certain circumstances, be greater than those received by us in receiving the service. Conflicts exist in the allocation of the costs and benefits of these arrangements.
We will purchase or bear premiums, fees, costs and expenses (including any expenses or fees of insurance brokers) to insure us, our portfolio properties, the Adviser, Blackstone and their respective directors, officers, employees, agents and representatives and other
80
indemnified parties (and in certain circumstances, such person’s agents and representatives), against liability in connection with our activities. This includes a portion of any premiums, fees, costs and expenses for one or more “umbrella”, group or other insurance policies maintained by Blackstone that cover one or more of us and Other Blackstone Accounts, the Adviser and Blackstone (including their respective directors, officers, employees, agents and representatives and other indemnified parties). The Adviser and its affiliates will make judgments about the allocation of premiums, fees, costs and expenses for such “umbrella”, group or other insurance policies among one or more of us and Other Blackstone Accounts, the Adviser and Blackstone on a fair and reasonable basis, in their discretion, and may make corrective allocations should they determine subsequently that such corrections are necessary or advisable. For example, some property insurance could be allocated on a property-by-property basis in accordance with the relative values of the respective assets that are insured by such policies.
Additionally, we and Other Blackstone Accounts (and their portfolio entities) will, in certain circumstances, jointly contribute to a pool of funds that can be expected to be used to pay losses that are subject to the deductibles on any group insurance policies, which contributions may similarly be allocated in accordance with the relative values of the respective assets that are insured by such policies (or other factors that Blackstone may reasonably determine).
In respect of such insurance arrangements, Blackstone may make corrective allocations from time to time should it determine subsequently that such adjustments are necessary or advisable.
We and Other Blackstone Accounts have self-insured through a captive insurance company (the “captive”) owned entirely by its participants (including us and such Other Blackstone Accounts). This arrangement is expected to provide us with greater control over our insurance program and reduce overall costs of insurance through lower premiums and reduction or elimination of insurance brokerage costs. An affiliate of our sponsor provides oversight of the captive's management, sits on the boards of the captive’s cells, provides a guarantee for a letter of credit to help capitalize the captive and receives a fee based on a percentage of the premiums (subject to the benchmarking process described above). A third-party insurance services firm provides brokerage, administration and insurer management services to the captive. The fees and expenses of the captive, including insurance premiums and fees paid to its manager, are borne by us and Other Blackstone Accounts pro rata based on estimates of insurance premiums that would have been payable for each party’s respective properties, as benchmarked by third parties, and will be paid by each participant annually. While we do not expect to provide any funding in addition to such annual contribution, it is possible that each member of the captive, including us, is required to make additional capital contributions in certain circumstances. This arrangement is expected to provide us with greater control over our property insurance and terrorism insurance programs and reduce overall costs of insurance through lower premiums and reduction or elimination of insurance brokerage costs. We may, however, be negatively affected to the extent there are disproportionate losses incurred on properties held by Other Blackstone Accounts participating in the Captive, including through increased future premiums or the lost ability to recoup capital contributions, and there can be no assurance that the arrangement will not result in under- or over-allocation of costs to us relative to Other Blackstone Accounts or that different allocations or arrangements than those provided above would not result in us and our portfolio companies bearing less (or more) premiums, deductibles, fees, costs and expenses for insurance policies.
The captive currently engages, and is expected to continue to engage, Revantage to provide corporate support services in respect of its activities, (including assisting with captive structuring, related insurance placement and oversight and administration of claims). In connection therewith, Revantage is expected to earn commissions for such services related to the captive property program placement, terrorism insurance, casualty program and other lines of coverage and may earn additional commissions during each such policy year. Such commissions will initially be used to offset costs of the captive (which may include fees to Blackstone and allocated costs associated with Revantage’s account payroll, professional services, travel and entertainment, employee development, technology costs and facilities and office services), with any excess funds being returned to or used for the benefit of participating funds in a reasonable manner, which may include reserving for (or advance payment of) additional anticipated costs or direct reimbursement in accordance with a reasonable allocation. Any such services and fees are in addition to the services provided and fees received by Blackstone. Revantage provides data management services to portfolio properties and may also provide such services directly to us and Other Blackstone Accounts (collectively, “Data Holders”) and Blackstone or an affiliate of Blackstone formed in the future may also provide data management services. Such services may include assistance with obtaining, analyzing, curating, processing, packaging, distributing, organizing, mapping, holding, transforming, enhancing, marketing and selling such data (among other related data management and consulting services) for monetization through licensing or sale arrangements with third parties and, subject to the requirements under our charter (including any necessary approval of by our board of directors, including a majority of our independent directors not interested in the transaction) and any other applicable contractual limitations, with us, Other Blackstone Accounts, portfolio properties and other Blackstone affiliates and associated entities (including funds in which Blackstone and Other Blackstone Accounts make investments, and portfolio entities thereof). Where Blackstone believes appropriate, data from one Data Holder may be pooled with data from other Data Holders. Any revenues arising from such pooled data sets would be allocated between applicable Data Holders on a fair and reasonable basis as determined by Blackstone in its discretion, with Blackstone able to make corrective allocations should it determine subsequently that such corrections were necessary or advisable. Blackstone is expected to receive compensation for such data management services, which may include a percentage of the revenues generated through any licensing or sale arrangements with respect to the relevant data, and which compensation is also expected to include fees, royalties and cost and expense reimbursement (including start-up costs and allocable overhead associated with personnel working on relevant matters (including salaries, benefits and other similar expenses). Additionally, Blackstone is also expected to determine to share and distribute the products from such data management services within Blackstone or its affiliates (including Other Blackstone Accounts or their
81
portfolio entities) at no charge and, in such cases, the Data Holders may not receive any financial or other benefit from having provided such data to Blackstone. The potential receipt of such compensation by Blackstone may create incentives for the Adviser to cause us to invest in portfolio entities with a significant amount of data that it might not otherwise have invested in or on terms less favorable than it otherwise would have sought to obtain.
We may be subject to potential conflicts of interest as a consequence of family relationships that Blackstone employees have with other real estate professionals.
Additionally, certain personnel and other professionals of Blackstone have family members or relatives that are actively involved in industries and sectors in which we invest and/or have business, personal, financial or other relationships with companies in such industries and sectors (including the advisors and service providers described above) or other industries, which gives rise to potential or actual conflicts of interest. For example, such family members or relatives might be officers, directors, personnel or owners of companies or assets which are actual or potential investments of us or our other counterparties and portfolio properties. Moreover, in certain instances, we can be expected to purchase or sell companies or assets from or to, or otherwise transact with, companies that are owned by such family members or relatives or in respect of which such family members or relatives have other involvement. In most such circumstances, we will not be precluded from undertaking any of these investment activities or transactions. To the extent Blackstone determines appropriate, conflict mitigation strategies may be put in place with respect to a particular circumstance, such as internal information barriers or recusal, disclosure or other steps determined appropriate by the Adviser.
We are subject to conflicts of interest related to tenants.
Certain properties owned by us and/or an Other Blackstone Account will, in certain circumstances, be leased out to tenants that are affiliates of Blackstone, including but not limited to Other Blackstone Accounts and/or their respective portfolio companies, which would give rise to a conflict of interest. In such events, the Adviser will endeavor to ensure that such conflicts are resolved in a fair and equitable manner, subject to applicable oversight of the board of directors.
We are party to an uncommitted line of credit with an affiliate of Blackstone.
We have entered into an uncommitted line of credit with Blackstone Holdings Finance Co. L.L.C., an affiliate of Blackstone, pursuant to which we may borrow up to $75.0 million at an interest rate equal to the then-current interest rate offered by an unaffiliated third-party lender or, if no such rate is available, the SOFR rate applicable to such loan plus 2.50%. Because this line of credit is with an affiliate of Blackstone, the terms of the agreement were not negotiated at arm’s-length. Blackstone may face conflicts of interest in connection with any borrowings or disputes under this uncommitted line of credit.
The personnel of the Dealer Manager and the Adviser may trade in securities for their own accounts, subject to restrictions applicable to Blackstone personnel.
The officers, directors, members, managers and employees of the Dealer Manager and the Adviser can be expected to trade in securities and make personal investments for their own accounts, subject to restrictions and reporting requirements as may be required by law and Blackstone policies, or otherwise determined from time to time by the Dealer Manager or the Adviser. Such personal securities transactions and investments will, in certain circumstances, result in conflicts of interest, including to the extent they relate to (i) a company in which we hold or acquire an interest (either directly through a privately negotiated investment or indirectly through the purchase of securities or other traded instruments related thereto) and (ii) entities that have interests which are adverse to ours or pursue similar investment opportunities as us.
We have and expect to continue to have a diverse stockholder group and the interests of our stockholders may conflict with one another and may conflict with the interests of investors in other vehicles that we co-invest with.
Our stockholders may have conflicting investment, tax and other interests with respect to their investments in us and with respect to the interests of investors in other investment vehicles managed or advised by the Adviser or its affiliates that participate in the same investments as us. The conflicting interests of individual stockholders with respect to other stockholders and relative to investors in other investment vehicles and investors relate to, among other things, the nature, structuring, financing, tax profile and timing of disposition of investments. In certain circumstances, we may provide financing, guarantees, enter into currency or derivative transactions or other similar arrangements for access funds primarily created to hold shares of our common stock, including in order to support currency hedging programs at such access funds. These arrangements may cause us to use our funds for such arrangements as opposed to alternative uses and could expose us to certain risks. The Adviser may as a result have conflicts in making these decisions, which may be more beneficial for one or more (but not all) stockholder than for other stockholders. In addition, we may make investments that may have a negative impact on related investments made by the stockholders in separate transactions. In selecting and structuring investments appropriate for us, the Adviser considers the investment, tax and other objectives of us (including our qualification as a REIT) and our stockholders (and those of investors in other investment vehicles managed or advised by the Adviser
82
or its affiliates) that participate in the same investments as us, not the investment, tax or other objectives of any stockholder individually. In addition, certain investors may also be limited partners in Other Blackstone Accounts, including supplemental capital vehicles and co-investment vehicles that invest alongside us in one or more investments, which could create conflicts for the Adviser in the treatment of different investors.
Stockholders may also include affiliates of Blackstone, such as Other Blackstone Accounts, affiliates of portfolio entities, charities or foundations associated with Blackstone personnel and current or former Blackstone personnel, Blackstone’s senior advisors and operating partners, and any such affiliates, funds or persons may also invest in us. Except as provided in our charter, all of these Blackstone-related stockholders will have equivalent rights to vote and withhold consents as nonrelated stockholders. Nonetheless, Blackstone may have the ability to influence, directly or indirectly, these Blackstone-related stockholders.
We may be subject to additional potential conflicts of interests as a consequence of Blackstone’s status as a public company.
As a consequence of Blackstone’s status as a public company, our officers, directors, members, managers and employees and those of the Adviser may take into account certain considerations and other factors in connection with the management of the business and affairs of us and our affiliates that would not necessarily be taken into account if Blackstone were not a public company.
We, Other Blackstone Accounts and their portfolio entities may engage in permissible political activities with the intent of furthering our or their business interests or otherwise.
We, Other Blackstone Accounts and their portfolio entities may, in the ordinary course of our or their respective businesses, make political contributions to elected officials, candidates for elected office or political organizations, hire lobbyists or engage in other permissible political activities with the intent of furthering our or their business interests or otherwise. In certain circumstances, there may be initiatives where such activities are coordinated by Blackstone for the benefit of us, Other Blackstone Accounts and/or their portfolio entities. The interests advanced by a portfolio entity through such activities may, in certain circumstances, not align with or be adverse to our interests, the interests of our stockholders or the interests of Other Blackstone Accounts or their other portfolio entities. The costs of such activities may be allocated among us, Other Blackstone Accounts and their portfolio entities (and borne indirectly by our stockholders). While the costs of such activities will typically be borne by the entity undertaking such activities, such activities may also directly or indirectly benefit us, Other Blackstone Accounts, their portfolio entities or Blackstone. There can be no assurance that any such activities will be successful in advancing our interests or the interests of Other Blackstone Accounts or a portfolio entity or otherwise benefit such entities.
Risks Related to our REIT Status and Certain Other Tax Items
If we do not maintain our qualification as a REIT, we will be subject to tax as a regular corporation and could face a substantial tax liability.
We expect to continue to operate so as to qualify as a REIT under the Code. However, qualification as a REIT involves the application of highly technical and complex Code provisions for which only a limited number of judicial or administrative interpretations exist. Notwithstanding the availability of cure provisions in the Code, various compliance requirements could be failed, which could jeopardize our REIT status. Furthermore, new tax legislation, administrative guidance or court decisions, in each instance potentially with retroactive effect, could make it more difficult or impossible for us to qualify as a REIT. If we fail to qualify as a REIT in any tax year, then:
•we would be taxed as a regular domestic corporation, which under current laws, among other things, means being unable to deduct distributions to stockholders in computing taxable income and being subject to U.S. federal income tax on our taxable income at regular corporate income tax rates;
•any resulting tax liability could be substantial and could have a material adverse effect on our book value;
•unless we were entitled to relief under applicable statutory provisions, we would be required to pay taxes, and therefore, our cash available for distribution to stockholders would be reduced for each of the years during which we did not qualify as a REIT and for which we had taxable income; and
•we generally would not be eligible to requalify as a REIT for the subsequent four full taxable years.
To maintain our REIT status, we may have to borrow funds on a short-term basis during unfavorable market conditions.
To qualify as a REIT, we generally must distribute annually to our stockholders a minimum of 90% of our net taxable income, determined without regard to the dividends-paid deduction and excluding net capital gains. We will be subject to regular corporate income taxes on any undistributed REIT taxable income each year. Additionally, we will be subject to a 4% nondeductible excise tax on any amount by which distributions paid by us in any calendar year are less than the sum of 85% of our ordinary income, 95% of our capital gain net income and 100% of our undistributed income from previous years. Payments we make to our stockholders under
83
our share repurchase plan will not be taken into account for purposes of these distribution requirements. If we do not have sufficient cash to make distributions necessary to preserve our REIT status for any year or to avoid taxation, we may be forced to borrow funds or sell assets even if the market conditions at that time are not favorable for these borrowings or sales. These options could increase our costs or reduce our equity.
Compliance with REIT requirements may cause us to forego otherwise attractive opportunities, which may hinder or delay our ability to meet our investment objectives and reduce your overall return.
To qualify as a REIT, we are required at all times to satisfy tests relating to, among other things, the sources of our income, the nature and diversification of our assets, the ownership of our stock and the amounts we distribute to our stockholders. Compliance with the REIT requirements may impair our ability to operate solely on the basis of maximizing profits. For example, we may be required to make distributions to stockholders at disadvantageous times or when we do not have funds readily available for distribution.
Compliance with REIT requirements may force us to liquidate or restructure otherwise attractive investments.
To qualify as a REIT, at the end of each calendar quarter, at least 75% of the value of our assets must consist of cash, cash items, government securities and qualified real estate assets. The remainder of our investments in securities (other than qualified real estate assets and government securities) generally cannot include more than 10% of the voting securities (other than securities that qualify for the straight debt safe harbor) of any one issuer or more than 10% of the value of the outstanding securities of more than any one issuer unless we and such issuer jointly elect for such issuer to be treated as a “taxable REIT subsidiary” under the Code. Debt will generally meet the “straight debt” safe harbor if the debt is a written unconditional promise to pay on demand or on a specified date a certain sum of money, the debt is not convertible, directly or indirectly, into stock, and the interest rate and the interest payment dates of the debt are not contingent on the profits, the borrower’s discretion, or similar factors. Additionally, no more than 5% of the value of our assets (other than government securities and qualified real estate assets) can consist of the securities of any one issuer, and no more than 20% of the value of our assets may be represented by securities of one or more taxable REIT subsidiaries. If we fail to comply with these requirements at the end of any calendar quarter, we must dispose of a portion of our assets within 30 days after the end of the calendar quarter or qualify for certain statutory relief provisions in order to avoid losing our REIT qualification and suffering adverse tax consequences. In order to satisfy these requirements and maintain our qualification as a REIT, we may be forced to liquidate assets from our portfolio or not make otherwise attractive investments. These actions could have the effect of reducing our income and amounts available for distribution to our stockholders.
Our charter does not permit any person or group to own more than 9.9% in value or number of shares, whichever is more restrictive, of our outstanding common stock or of our outstanding capital stock of any classes or series, and attempts to acquire our common stock or our capital stock of all other classes or series in excess of these 9.9% limits would not be effective without an exemption (prospectively or retroactively) from these limits by our board of directors.
For us to qualify as a REIT under the Code, not more than 50% of the value of our outstanding stock may be owned, directly or indirectly, by five or fewer individuals (including certain entities treated as individuals for this purpose) during the last half of a taxable year. For the purpose of assisting our qualification as a REIT for U.S. federal income tax purposes, among other purposes, our charter prohibits beneficial or constructive ownership by any person or group of more than 9.9%, in value or number of shares, whichever is more restrictive, of the outstanding shares of our outstanding common stock, or 9.9% in value or number of shares, whichever is more restrictive, of our outstanding capital stock of all classes or series, which we refer to as the “Ownership Limit.” The constructive ownership rules under the Code and our charter are complex and may cause shares of the outstanding common stock owned by a group of related persons to be deemed to be constructively owned by one person. As a result, the acquisition of less than 9.9% of our outstanding common stock or our capital stock by a person could cause another person to constructively own in excess of 9.9% of our outstanding common stock or our capital stock, respectively, and thus violate the Ownership Limit. There can be no assurance that our board of directors, as permitted in the charter, will not decrease this Ownership Limit in the future. Any attempt to own or transfer shares of our common stock or capital stock in excess of the Ownership Limit without the consent of our board of directors will result either in the shares in excess of the limit being transferred by operation of our charter to a charitable trust, and the person who attempted to acquire such excess shares not having any rights in such excess shares, or in the transfer being void.
The Ownership Limit may have the effect of precluding a change in control of us by a third party, even if such change in control would be in the best interests of our stockholders or would result in receipt of a premium to the price of our common stock (and even if such change in control would not reasonably jeopardize our REIT status).
The exemptions to the Ownership Limit granted to date may limit our board of directors’ power to increase the Ownership Limit or grant further exemptions in the future.
84
Non-U.S. holders may be subject to U.S. federal income tax upon their disposition of shares of our common stock or upon their receipt of certain distributions from us.
In addition to any potential withholding tax on ordinary dividends, a non-U.S. holder (as such term is defined below under “Material U.S. Federal Income Tax Considerations—Taxation of U.S. Holders of Our Common Stock” in the Prospectus), other than a “qualified shareholder” or a “withholding qualified holder,” that disposes of a “U.S. real property interest” (“USRPI”) (which includes shares of stock of a U.S. corporation whose assets consist principally of USRPIs), is generally subject to U.S. federal income tax under the Foreign Investment in Real Property Tax Act of 1980, as amended (“FIRPTA”), on the amount received from such disposition. Such tax does not apply, however, to the disposition of stock in a REIT that is “domestically controlled.” Generally, a REIT is domestically controlled if less than 50% of its stock, by value, has been owned directly or indirectly by non-U.S. persons during a continuous five-year period ending on the date of disposition or, if shorter, during the entire period of the REIT’s existence. Proposed
Treasury regulations issued on December 29, 2022 modify the existing criteria for qualification as a domestically controlled REIT and
provide that the ownership by non-U.S. persons would be determined by looking through pass through entities and certain U.S. corporations, among others. We cannot assure you that we qualify or would qualify as a domestically controlled REIT at any time, including under the proposed regulations or the final rules if finalized in the proposed form. If we were to fail to so qualify, amounts received by a non-U.S. holder on certain dispositions of shares of our common stock (including a redemption) would be subject to tax under FIRPTA, unless (i) our shares of common stock were regularly traded on an established securities market and (ii) the non-U.S. holder did not, at any time during a specified testing period, hold more than 10% of our common stock. See “Material U.S. Federal Income Tax Considerations—Taxation of Non-U.S. Holders of Our Common Stock—Sales of Our Common Stock” in the Prospectus.
A non-U.S. holder other than a “qualified shareholder” or a “withholding qualified holder,” that receives a distribution from a REIT that is attributable to gains from the disposition of a USRPI as described above, including in connection with a repurchase of our common stock, is generally subject to U.S. federal income tax under FIRPTA to the extent such distribution is attributable to gains from such disposition, regardless of whether the difference between the fair market value and the tax basis of the USRPI giving rise to such gains is attributable to periods prior to or during such non-U.S. holder’s ownership of our common stock. In addition, a repurchase of our common stock, to the extent not treated as a sale or exchange, may be subject to withholding as an ordinary dividend. See “Material U.S. Federal Income Tax Considerations—Taxation of Non-U.S. Holders of Our Common Stock— Distributions, and—Repurchases of our Common Stock” in the Prospectus.
We seek to act in the best interests of the Company as a whole and not in consideration of the particular tax consequences to any specific holder of our stock. Potential non-U.S. holders should inform themselves as to the U.S. tax consequences, and the tax consequences within the countries of their citizenship, residence, domicile, and place of business, with respect to the purchase, ownership and disposition of shares of our common stock.
Investments outside the United States may subject us to additional taxes and could present additional complications to our ability to satisfy the REIT qualification requirements.
Non-U.S. investments may subject us to various non-U.S. tax liabilities, including withholding taxes. In addition, operating in functional currencies other than the U.S. dollar and in environments in which real estate transactions are typically structured differently than they are in the United States or are subject to different legal rules may present complications to our ability to structure non-U.S. investments in a manner that enables us to satisfy the REIT qualification requirements.
We may incur tax liabilities that would reduce our cash available for distribution to you.
Even if we qualify and maintain our status as a REIT, we may become subject to U.S. federal income taxes and related state and local taxes. For example, net income from the sale of properties that are “dealer” properties sold by a REIT (a “prohibited transaction” under the Code) will be subject to a 100% tax. We may not make sufficient distributions to avoid excise taxes applicable to REITs. Similarly, if we were to fail an income test (and did not lose our REIT status because such failure was due to reasonable cause and not willful neglect) we would be subject to tax on the income that does not meet the income test requirements. We also may decide to retain net capital gain we earn from the sale or other disposition of our investments and pay income tax directly on such income. In that event, our stockholders would be treated as if they earned that income and paid the tax on it directly. However, stockholders that are tax-exempt, such as charities or qualified pension plans, would have no benefit from their deemed payment of such tax liability unless they file U.S. federal income tax returns and thereon seek a refund of such tax. We also may be subject to state and local taxes on our income or property, including franchise, payroll, mortgage recording and transfer taxes, either directly or at the level of the other companies through which we indirectly own our assets, such as our taxable REIT subsidiaries, which are subject to full U.S. federal, state, local and foreign corporate-level income taxes. Any taxes we pay directly or indirectly will reduce our cash available for distribution to you.
85
Our board of directors is authorized to revoke our REIT election without stockholder approval, which may cause adverse consequences to our stockholders.
Our charter authorizes our board of directors to revoke or otherwise terminate our REIT election, without the approval of our stockholders, if it determines that changes to U.S. federal income tax laws and regulations or other considerations mean it is no longer in our best interests to qualify as a REIT. Our board of directors has fiduciary duties to us and our stockholders and could only cause such changes in our tax treatment if it determines in good faith that such changes are in our best interests and in the best interests of our stockholders. In this event, we would become subject to U.S. federal income tax on our taxable income and we would no longer be required to distribute most of our net income to our stockholders, which may cause a reduction in the total return to our stockholders.
You may have current tax liability on distributions you elect to reinvest in our common stock.
If you participate in our distribution reinvestment plan, you will be deemed to have received, and for U.S. federal income tax purposes will be taxed on, the amount reinvested in shares of our common stock to the extent the amount reinvested was not a tax-free return of capital. Therefore, unless you are a tax-exempt entity, you may be forced to use funds from other sources to pay your tax liability on the reinvested dividends.
Generally, ordinary dividends payable by REITs do not qualify for reduced U.S. federal income tax rates.
Currently, the maximum tax rate applicable to qualified dividend income payable to certain non-corporate U.S. stockholders is 20%. Dividends payable by REITs, however, generally are not eligible for the reduced rate. Although this does not adversely affect the taxation of REITs or dividends payable by REITs, the more favorable rates applicable to regular corporate qualified dividends could cause certain non-corporate investors to perceive investments in REITs to be relatively less attractive than investments in the stocks of non-REIT corporations that pay dividends, which could adversely affect the value of the shares of REITs, including our common stock.
However, under current law, continuing through 2025, individual taxpayers may be entitled to claim a deduction in determining their taxable income of 20% of ordinary REIT dividends (dividends other than capital gain dividends and dividends attributable to certain qualified dividend income received by us), which temporarily reduces the effective tax rate on such dividends. See “Material U.S. Federal Income Tax Considerations—Taxation of U.S. Holders of Our Common Stock—Distributions Generally” in the Prospectus. You are urged to consult with your tax advisor regarding the effect of this change on your effective tax rate with respect to REIT dividends.
We may be subject to adverse legislative or regulatory tax changes that could increase our tax liability, reduce our operating flexibility and reduce the price of our common stock.
In recent years, numerous legislative, judicial and administrative changes have been made in the provisions of U.S. federal income tax laws applicable to investments similar to an investment in shares of our common stock. On August 16, 2022, President Biden signed into law the Inflation Reduction Act of 2022 (the “IRA”). The IRA includes numerous tax provisions that impact corporations, including the implementation of a corporate alternative minimum tax as well as a 1% excise tax on certain stock repurchases and economically similar transactions with respect to an “applicable corporation.” However, REITs are excluded from the definition of an “applicable corporation” and therefore are not subject to the corporate alternative minimum tax. Additionally, stock repurchases by REITs are specifically excepted from the 1% excise tax. Our taxable REIT subsidiaries operate as standalone corporations and therefore could be adversely affected by the IRA. We will continue to analyze and monitor the application of the IRA to our business; however, the effect of these changes on the value of our assets, our shares or market conditions generally, is uncertain.
Additional changes to the tax laws are likely to continue to occur, and we cannot assure you that any such changes will not adversely affect the taxation of our stockholders. Any such changes could have an adverse effect on an investment in our shares or on the market value or the resale potential of our assets. You are urged to consult with your tax advisor with respect to the impact of the recent legislation on your investment in our shares and the status of legislative, regulatory or administrative developments and proposals and their potential effect on an investment in our shares. Although REITs generally receive certain tax advantages compared to entities taxed as regular corporations, it is possible that future legislation would result in a REIT having fewer tax advantages, and it could become more advantageous for a company that invests in real estate to elect to be treated for U.S. federal income tax purposes as a corporation. As a result, our charter authorizes our board of directors to revoke or otherwise terminate our REIT election, without the approval of our stockholders, if it determines that changes to U.S. federal income tax laws and regulations or other considerations mean it is no longer in our best interests to qualify as a REIT. The impact of tax reform and any potential tax changes on an investment in our shares is uncertain. Prospective investors should consult their own tax advisors regarding changes in tax laws.
86
The failure of a mezzanine loan to qualify as a real estate asset could adversely affect our ability to qualify as a REIT.
We may acquire mezzanine loans, for which the IRS has provided a safe harbor but not rules of substantive law. Pursuant to the safe harbor, if a mezzanine loan meets certain requirements, it will be treated by the IRS as a real estate asset for purposes of the REIT asset tests, and interest derived from the mezzanine loan will be treated as qualifying mortgage interest for purposes of the REIT 75% income test. We may acquire mezzanine loans that do not meet all of the requirements of this safe harbor. In the event we own a mezzanine loan that does not meet the safe harbor, the IRS could challenge such loan’s treatment as a real estate asset for purposes of the REIT asset and income tests and, if such a challenge were sustained, we could fail to qualify as a REIT.
If our Operating Partnership failed to qualify as a partnership or is not otherwise disregarded for U.S. federal income tax purposes, we would cease to qualify as a REIT.
If the IRS were to successfully challenge the status of our Operating Partnership as a partnership or disregarded entity for U.S. federal income tax purposes, it would be taxable as a corporation. In the event that this occurs, it would reduce the amount of distributions that our Operating Partnership could make to us. This would also result in our failing to qualify as a REIT and becoming subject to a corporate-level tax on our income, which would substantially reduce our cash available to pay distributions and the yield on your investment.
Retirement Plan Risks
If the fiduciary of an employee benefit plan subject to the Employee Retirement Income Security Act of 1974, as amended, or ERISA, fails to meet the fiduciary and other standards under ERISA, the Code or common law as a result of an investment in shares of our common stock, the fiduciary could be subject to civil penalties.
There are special considerations that apply to investing in our shares on behalf of a trust, pension, profit sharing or 401(k) plans, health or welfare plans, trusts, individual retirement accounts, or IRAs, or Keogh plans. If you are investing the assets of any of the entities identified in the prior sentence in our common stock, you should satisfy yourself that:
•the investment is consistent with your fiduciary obligations under applicable law, including common law, ERISA and the Code;
•the investment is made in accordance with the documents and instruments governing the trust, plan or IRA, including a plan’s investment policy;
•the investment satisfies the prudence and diversification requirements of Sections 404(a)(1)(B) and 404(a)(1)(C) of ERISA and other applicable provisions of ERISA and the Code;
•the investment will not impair the liquidity of the trust, plan or IRA;
•the investment will not produce “unrelated business taxable income” for the plan or IRA;
•our stockholders will be able to value the assets of the plan annually in accordance with ERISA requirements and applicable provisions of the plan or IRA; and
•the investment will not constitute a non-exempt prohibited transaction under Title I of ERISA or Section 4975 of the Code.
Failure to satisfy the fiduciary standards of conduct and other applicable requirements of ERISA, the Code, or other applicable statutory or common law may result in the imposition of civil penalties, and can subject the fiduciary to equitable remedies. In addition, if an investment in our shares constitutes a non-exempt prohibited transaction under Title I of ERISA or Section 4975 of the Code, the fiduciary that authorized or directed the investment may be subject to the imposition of excise taxes with respect to the amount invested.
If our assets at any time are deemed to constitute “plan assets” under ERISA, that may lead to the rescission of certain transactions, tax or fiduciary liability and our being held in violation of certain ERISA and Code requirements.
Stockholders subject to ERISA and/or Section 4975 of the Code should consult their own advisors as to the effect of ERISA and Section 4975 of the Code on an investment in the shares. As discussed under “Certain ERISA Considerations” in the Prospectus, if our assets are deemed to constitute “plan assets” of stockholders that are Covered Plans (as defined below) (i) certain transactions that we might enter into in the ordinary course of our business might have to be rescinded and may give rise to certain excise taxes and fiduciary liability under Title I of ERISA and/or Section 4975 of the Code; (ii) our management, as well as various providers of fiduciary or other services to us (including the Adviser), and any other parties with authority or control with respect to us or our assets, may be considered fiduciaries or otherwise parties in interest or disqualified persons for purposes of the fiduciary responsibility and prohibited transaction provisions of Title I of ERISA and Section 4975 of the Code; and (iii) the fiduciaries of stockholders that are
87
Covered Plans would not be protected from “co-fiduciary liability” resulting from our decisions and could be in violation of certain ERISA requirements.
Accordingly, prospective investors that are (i) “employee benefit plans” (within the meaning of Section 3(3) of ERISA), which are subject to Title I of ERISA; (ii) “plans” defined in Section 4975 of the Code, which are subject to Section 4975 of the Code (including “Keogh” plans and “individual retirement accounts”); or (iii) entities whose underlying assets are deemed to include plan assets within the meaning of Section 3(42) of ERISA and the regulations thereunder (e.g., an entity of which 25% or more of the total value of any class of equity interests is held by “benefit plan investors” (within the meaning of Section 3(42) of ERISA)) (each such plan, account and entity described in clauses (i), (ii) and (iii) we refer to as “Covered Plans”) should consult with their own legal, tax, financial and other advisors prior to investing to review these implications in light of such investor’s particular circumstances. The sale of our common stock to any Covered Plan is in no respect a representation by us or any other person associated with the offering of our shares of common stock that such an investment meets all relevant legal requirements with respect to investments by plans generally or any particular plan, or that such an investment is appropriate for plans generally or any particular plan.
We may face risks arising from potential control group liability.
Under ERISA and the Code, all members of a group of commonly controlled trades or businesses may be jointly and severally liable for each other’s obligations to any defined benefit pension plans maintained by an entity in the controlled group or to which such entity is obligated to contribute. These obligations may include the obligation to make required pension contributions, the obligation to fund any deficit amount upon pension plan termination and the obligation to pay withdrawal liability owed to a multi-employer (union) plan to which such entity makes contributions if the entity withdraws from an underfunded multi-employer pension plan. A 2013 U.S. Federal Appeals court decision found that certain supervisory and portfolio management activities of a private equity fund
could cause a fund to be considered a trade or business for these purposes, and thus, liable for withdrawal liability owed by a fund’s portfolio company to an underfunded multi-employer plan which covered the employees of the portfolio company. Accordingly, if we invested in a control type investment and if we were found to be engaged in a “trade or business” for ERISA purposes, we and the various entities in which we have a control type investment could be held liable for the defined benefit pension obligations of one or more of such investments.
We may face risks arising from our operation as a VCOC or REOC.
As discussed under “Certain ERISA Considerations” in the Prospectus, we may operate in a manner intended to qualify as a “venture capital operating company” (a “VCOC”) or “real estate operating company” (“REOC”) (each within the meaning of the U.S. Department of Labor regulations promulgated under ERISA), in order to avoid holding “plan assets” within the meaning of ERISA. Operating as a VCOC would require that we obtain rights to substantially participate in or influence the conduct of the management of a number of our investments and, in the case of operating as a REOC, participating in the management and development activities of the underlying real estate. In this regard, we may designate a director to serve on the board of directors of one or more portfolio entities. The designation of directors and other measures contemplated could expose our assets to claims by a portfolio entity, its security holders, and its creditors. While we intend to minimize exposure to these risks, the possibility of successful claims cannot be precluded. Because we may operate in a manner intended to qualify as a VCOC or REOC in order to avoid holding “plan assets” within the meaning of ERISA, we may be restricted or precluded from making certain investments. In addition, such operation could require us to liquidate investments at a disadvantageous time, resulting in lower proceeds than might have been the case without the need for such compliance.
General Risk Factors
We depend on the availability of public utilities and services, especially for water and electric power. Any reduction, interruption or cancellation of these services may adversely affect us.
Public utilities, especially those that provide water and electric power, are fundamental for the sound operation of our assets. The delayed delivery or any material reduction or prolonged interruption of these services could allow tenants to terminate their leases or result in an increase in our costs, as we may be forced to use backup generators or other replacements for the reduced or interrupted utilities, which also could be insufficient to fully operate our facilities and could result in our inability to provide services.
Certain properties may require permits or licenses.
A license, approval or permit may be required to acquire certain investments and their direct or indirect holding companies (or registration may be required before an acquisition can be completed). There can be no guarantee of when and if such a license, approval or permit will be obtained or if the registration will be effected.
88
We face legal risks when making investments.
Investments are usually governed by a complex series of legal documents and contracts. As a result, the risk of dispute over interpretation or enforceability of the documentation may be higher than for other investments. In addition, it is not uncommon for investments to be exposed to a variety of other legal risks. These can include, but are not limited to, environmental issues, land expropriation and other property-related claims, industrial action and legal action from special interest groups.
We may face risks associated with short sales.
Our use of short sales for investment and/or risk management purposes subjects us to risks associated with selling short. We may engage in short sales where we do not own or have the right to acquire the security sold short at no additional cost. Our loss on a short sale theoretically could be unlimited in a case where we are unable, for whatever reason, to close out a short position.
Our short selling strategies may limit our ability to benefit from increases in the markets. Short selling also involves a form of financial leverage that may exaggerate any losses. Also, there is the risk that the counterparty to a short sale may fail to honor its contractual terms, causing a loss to us. Finally, SEC, FINRA or other regulations relating to short selling may restrict our ability to engage in short selling.
We may incur contingent liabilities in connection with the disposition of investments.
In connection with the disposition of an investment, we may be required to make certain representations about the business, financial affairs and other aspects (such as environmental, property, tax, insurance, and litigation) of such investment typical of those made in connection with the sale of a business or other investment comparable to the investment being sold. We may also be required to indemnify the purchasers of such investment to the extent that any such representations are inaccurate or with respect to certain potential liabilities. These arrangements may result in the incurrence of contingent liabilities for which the Adviser may establish reserves or escrow accounts.
We will face risks associated with hedging transactions.
We may utilize a wide variety of derivative and other hedging instruments, including swap arrangements, for risk management purposes, the use of which is a highly specialized activity that may entail greater than ordinary investment risks. Any such derivatives and other hedging transactions may not be effective in mitigating risk in all market conditions or against all types of risk (including unidentified or unanticipated risks), thereby resulting in losses to us. Engaging in derivatives and other hedging transactions, including swap arrangements, may result in a poorer overall performance and operating losses for us than if we had not engaged in any such transaction, and the Adviser may not be able to effectively hedge against, or accurately anticipate, certain risks that may adversely affect our investment portfolio. In addition, our investment portfolio will always be exposed to certain risks that cannot be fully or effectively hedged, such as credit risk relating both to particular securities and counterparties as well as interest rate risks. See “—We invest in derivatives, which involve numerous risks” above.
89
ITEM 1B. UNRESOLVED STAFF COMMENTS
None.
ITEM 1C. Cybersecurity
Cybersecurity Risk Management and Strategy
As an externally managed company, BREIT’s day-to-day operations are managed by the Adviser and our executive officers under the oversight of our board of directors. Our executive officers are senior Blackstone Real Estate professionals and our Adviser is a subsidiary of Blackstone. As such, we are reliant on Blackstone for assessing, identifying and managing material risks to our business from cybersecurity threats. Below are details Blackstone has provided to us regarding its cybersecurity program that are relevant to us.
Blackstone maintains a comprehensive cybersecurity program, including policies and procedures designed to protect its systems, operations, and the data utilized and entrusted to it, including by BREIT, from anticipated threats or hazards. Blackstone utilizes a variety of protective measures as a part of its cybersecurity program. These measures include, where appropriate, physical and digital access controls, patch management, identity verification and mobile device management software, annual employee cybersecurity awareness and best practices training programs, security baselines and tools to report anomalous activity, and monitoring of data usage, hardware and software.
Blackstone tests its cybersecurity defenses regularly through automated and manual vulnerability scanning, to identify and remediate critical vulnerabilities. In addition, it conducts annual “white hat” penetration tests to validate its security posture. Blackstone examines its cybersecurity program every two to three years with third parties, evaluating its effectiveness in part by considering industry standards and established frameworks, such as the National Institute of Standards and Technology and Center for Internet Security, as guidelines. Further, Blackstone engages in cyber incident tabletop exercises and scenario planning exercises involving hypothetical cybersecurity incidents to test its cyber incident response processes. Blackstone’s Chief Security Officer (the “CSO”) and members of Blackstone’s senior management, Legal and Compliance, Technology and Innovations (“BXTI”), and Global Corporate Affairs participate in these exercises. Learnings from these tabletop exercises and any events Blackstone experiences are reviewed, discussed, and incorporated into its cybersecurity framework as appropriate.
In addition to Blackstone’s internal exercises to test aspects of its cybersecurity program, Blackstone periodically engages independent third parties to analyze data on the interactions of users of Blackstone information technology resources, including Blackstone employees, and conduct penetration tests and scanning exercises to assess the performance of Blackstone’s cybersecurity systems and processes.
Blackstone has a comprehensive Security Incident Response Plan (the “IRP”), designed to inform the proper escalation (including, as appropriate, to BREIT’s senior management) of non-routine suspected or confirmed information security or cybersecurity events based on the expected risk an event presents. As appropriate, a Security Incident Response Team composed of individuals from several internal technical and managerial functions may be formed to investigate and remediate the event and determine the extent of external advisor support required, including from external counsel, forensic investigators, and/or law enforcement. The IRP sets out ongoing monitoring or remediating actions to be taken after resolution of an incident. The IRP is reviewed at least annually by our CSO and members of BXTI and Legal and Compliance.
Blackstone maintains a formal cybersecurity risk management process and cybersecurity risk register, designed to track cybersecurity risks at the firm, and integrates these processes into the firm’s overall risk management practices described above. Blackstone’s CSO periodically discusses and reviews cybersecurity risks and related mitigants with its enterprise risk committee and incorporates relevant cybersecurity risk updates and metrics in the semi-annual enterprise-wide risk management report.
Blackstone has a process designed to assess the cybersecurity risks associated with the engagement of third-party vendors, including those of companies externally managed by Blackstone such as BREIT. This assessment is conducted on the basis of, among other factors, the types of services provided and the extent and type of Blackstone data accessed or processed by a third-party vendor. On the basis of its preliminary risk assessment of a third-party vendor, Blackstone may conduct further cybersecurity reviews or request remediation of, or contractual protections related to, any actual or potential identified cybersecurity risks. In addition, where appropriate, Blackstone seeks to include in its contractual arrangements with certain of its third-party vendors provisions addressing best practices with respect to data and cybersecurity, as well as the right to assess, monitor, audit and test such vendors’ cybersecurity programs and practices. Blackstone also utilizes a number of digital controls, which are reviewed at least annually, to monitor and manage third-party access to its internal systems and data.
For a discussion of how risks from cybersecurity threats affect our business, and our reliance on Blackstone in managing these risks, see “Part 1. Item 1A. Risk Factors – Risks Related to Our Organizational Structure – Cybersecurity risks and data protection could
90
result in the loss of data, interruptions in our business, damage to our reputation, and subject us to regulatory actions, increased costs and financial losses, each of which could have a material adverse effect on our business and results of operations” in this Annual Report on Form 10-K.
Cybersecurity Governance
Blackstone has a dedicated cybersecurity team, led by Blackstone’s CSO, who works closely with Blackstone senior management, including Blackstone’s Chief Technology Officer (“CTO”), to develop and advance the firm’s cybersecurity strategy, which applies to BREIT.
Blackstone’s CSO and CTO have extensive experience in cybersecurity and technology, respectively. Blackstone’s CSO, Adam Fletcher, is a Senior Managing Director in BXTI and is responsible for all aspects of cyber and physical security across Blackstone. Prior to his appointment as CSO in 2017, Mr. Fletcher was Blackstone’s Deputy CSO. Before joining Blackstone in 2014, Mr. Fletcher led the International Security organization for Equifax from 2012 to 2014. Mr. Fletcher received a BS in Operations Research and Industrial Engineering from Cornell University.
Blackstone’s CTO, John Stecher, is a Senior Managing Director and head of BXTI. Mr. Stecher is responsible for all aspects of technology across Blackstone. Mr. Stecher also advises Blackstone’s investment teams and acts as a resource to Blackstone portfolio companies, and companies externally managed by Blackstone such as BREIT, on technology-related matters. Before joining Blackstone in 2020, Mr. Stecher was a Managing Director and the Chief Technology Officer and Chief Innovation Officer at Barclays. He was also a member of the Barclays Technology Management Committee. Prior to joining Barclays in 2017, Mr. Stecher held a variety of senior management and engineering roles across Goldman Sachs’ capital markets and technology divisions. Mr. Stecher received a BS in Computer Science from the University of Wisconsin – Madison and a MS in Computer Science from the University of Minnesota.
BXTI conducts periodic cybersecurity risk assessments, including assessments or audits of third-party vendors, and assists with the management and mitigation of identified cybersecurity risks. The CSO and CTO review Blackstone’s cybersecurity framework annually as well as on an event-driven basis as necessary. The CSO and CTO also review the scope of Blackstone’s cybersecurity measures periodically, including in the event of a change in business practices that may implicate the security or integrity of Blackstone’s information and systems.
BREIT’s board of directors is responsible for understanding the primary risks to our business. The audit committee of BREIT’s board of directors is responsible for reviewing BREIT’s and the Adviser’s IT security controls with management and evaluating the adequacy of BREIT’s and the Adviser’s IT security program, compliance and controls with management.
Blackstone’s CSO reports to both our executive officers as well as our board of directors and/or our audit committee annually on cybersecurity matters, including risks facing us and the Adviser and, as applicable, certain incidents. In addition to such annual reports, our board of directors and/or the audit committee receive periodic updates from Blackstone on the primary cybersecurity risks facing us and our Adviser and the measures we and our Adviser are taking to mitigate such risks, as well as on changes to our and our Adviser’s cybersecurity risk profile or certain newly identified risks.
91
ITEM 2. PROPERTIES
For an overview of our real estate investments, see Item 7 — “Management’s Discussion and Analysis of Financial Condition and Results of Operations — Portfolio.”
Principal Executive Offices
Our principal executive and administrative offices are located in leased space at 345 Park Avenue, New York, New York 10154. We consider these facilities to be suitable and adequate for the management and operations of our business.
ITEM 3. LEGAL PROCEEDINGS
From time to time, we may be involved in various claims and legal actions arising in the ordinary course of business. As of December 31, 2023, we were not involved in any material legal proceedings.
ITEM 4. MINE SAFETY DISCLOSURES
Not applicable.
92
PART II.
ITEM 5. MARKET FOR REGISTRANT’S COMMON EQUITY, RELATED STOCKHOLDER MATTERS AND ISSUER PURCHASES OF EQUITY SECURITIES
Offering of Common Stock
The Offering consists of four classes of shares of our common stock, Class S shares, Class I shares, Class T shares, and Class D shares. Our Class C and Class F shares are offered only in a private offering and are not offered in the Offering. The share classes have different upfront selling commissions and dealer manager fees, and different ongoing stockholder servicing fees. Other than the differences in upfront selling commissions, dealer manager fees, and ongoing stockholder servicing fees, each class of common stock has the same economics and voting rights. Shares of our common stock are not listed for trading on a stock exchange or other securities market and there is no established public trading market for our common stock. As of March 28, 2024 there were 114,794 holders of record of our Class S common stock, 85,488 holders of record of our Class I common stock, 7,289 holders of record of our Class T common stock, 9,390 holders of record of our Class D common stock, and four holders of record of our Class C common stock. There were no holders of record of our Class F common stock. This does not include the number of stockholders that hold shares in “street name” through banks or broker-dealers. The following table details the selling commissions, dealer manager fees, and stockholder servicing fees for each applicable share class as of December 31, 2023:
| Class S Shares | Class I Shares | Class T Shares(1) | Class D Shares | Class C Shares | Class F Shares | ||||||||||||||||||||||||||||||
Selling commissions and dealer manager fees (% of transaction price) | up to 3.5% | — | up to 3.5% | up to 1.5% | — | — | |||||||||||||||||||||||||||||
| Stockholder servicing fee (% of NAV) | 0.85% | — | 0.85% | 0.25% | — | — | |||||||||||||||||||||||||||||
(1)For Class T shares sold in the Offering (other than as part of our distribution reinvestment plan), investors will pay upfront selling commissions of up to 3.0% of the transaction price and upfront dealer manager fees of 0.5% of the transaction price, however such amounts may vary at certain participating broker-dealers, provided that the sum will not exceed 3.5% of the transaction price. For Class T shares the stockholder servicing fee includes an advisor stockholder servicing fee of 0.65% per annum, and a dealer stockholder servicing fee of 0.20% per annum, of the aggregate NAV for the Class T shares, however, with respect to Class T shares sold through certain participating broker-dealers, the advisor stockholder servicing fee and the dealer stockholder servicing fee may be other amounts, provided that the sum of such fees will always equal 0.85% per annum of the NAV of such shares.
Blackstone Securities Partners L.P. (the “Dealer Manager”), a registered broker-dealer affiliated with the Adviser, serves as the dealer manager for the Offering. The Dealer Manager is entitled to receive selling commissions and dealer manager fees based on the transaction price of each applicable class of shares sold in the Offering. Through December 31, 2023, the Dealer Manager has not retained any upfront selling commissions, dealer manager or stockholder servicing fees as all such amount were paid to participating broker-dealers.
The purchase price per share for each class of our common stock will generally equal our prior month’s NAV per share, as determined monthly, plus applicable selling commissions and dealer manager fees. Our NAV for each class of shares is based on the net asset values of our investments (including real estate debt), the addition of any other assets (such as cash on hand) and the deduction of any liabilities (such as debt outstanding), including the accrual of any performance participation, and any stockholder servicing fees applicable to such class of shares. Please refer to “Net Asset Value Calculation and Valuation Guidelines” in the Prospectus for the Current Offering (as defined below) for further details on how our NAV is determined.
The following table presents our monthly NAV per share for each applicable share class from January 31, 2021 through December 31, 2023:(1)
| Class S Shares | Class I Shares | Class T Shares | Class D Shares | Class C Shares | ||||||||||||||||||||||||||||
| January 31, 2021 | $ | 11.6987 | $ | 11.6657 | $ | 11.4940 | $ | 11.5267 | $ | — | ||||||||||||||||||||||
| February 28, 2021 | 11.8193 | 11.7875 | 11.6145 | 11.6436 | — | |||||||||||||||||||||||||||
| March 31, 2021 | 11.9269 | 11.8964 | 11.7233 | 11.7476 | — | |||||||||||||||||||||||||||
| April 30, 2021 | 12.1273 | 12.0979 | 11.9228 | 11.9419 | — | |||||||||||||||||||||||||||
| May 31, 2021 | 12.4355 | 12.4088 | 12.2307 | 12.2443 | — | |||||||||||||||||||||||||||
| June 30, 2021 | 12.6302 | 12.6072 | 12.4301 | 12.4303 | — | |||||||||||||||||||||||||||
93
| Class S Shares | Class I Shares | Class T Shares | Class D Shares | Class C Shares | ||||||||||||||||||||||||||||
| July 31, 2021 | 12.9192 | 12.8989 | 12.7174 | 12.7079 | — | |||||||||||||||||||||||||||
| August 31, 2021 | 13.2188 | 13.2019 | 13.0184 | 12.9906 | — | |||||||||||||||||||||||||||
| September 30, 2021 | 13.5118 | 13.5008 | 13.3152 | 13.2637 | — | |||||||||||||||||||||||||||
| October 31, 2021 | 13.9072 | 13.9017 | 13.7102 | 13.6467 | — | |||||||||||||||||||||||||||
| November 30, 2021 | 14.0657 | 14.0634 | 13.8756 | 13.7987 | — | |||||||||||||||||||||||||||
| December 31, 2021 | 14.3008 | 14.2998 | 14.1112 | 14.0283 | — | |||||||||||||||||||||||||||
| January 31, 2022 | 14.5266 | 14.5322 | 14.3344 | 14.2465 | — | |||||||||||||||||||||||||||
| February 28, 2022 | 14.6411 | 14.6406 | 14.4362 | 14.3500 | — | |||||||||||||||||||||||||||
| March 31, 2022 | 14.8234 | 14.8229 | 14.6156 | 14.5273 | — | |||||||||||||||||||||||||||
| April 30, 2022 | 14.9649 | 14.9680 | 14.7523 | 14.6608 | — | |||||||||||||||||||||||||||
| May 31, 2022 | 14.9758 | 14.9810 | 14.7588 | 14.6681 | — | |||||||||||||||||||||||||||
| June 30, 2022 | 14.9778 | 14.9828 | 14.7601 | 14.6688 | — | |||||||||||||||||||||||||||
| July 31, 2022 | 14.9990 | 15.0041 | 14.7803 | 14.6886 | — | |||||||||||||||||||||||||||
| August 31, 2022 | 15.0898 | 15.0947 | 14.8688 | 14.7761 | — | |||||||||||||||||||||||||||
| September 30, 2022 | 15.1036 | 15.1083 | 14.8817 | 14.7879 | — | |||||||||||||||||||||||||||
| October 31, 2022 | 15.0587 | 15.0634 | 14.8367 | 14.7430 | — | |||||||||||||||||||||||||||
| November 30, 2022 | 14.8732 | 14.8777 | 14.6533 | 14.5607 | — | |||||||||||||||||||||||||||
| December 31, 2022 | 14.8234 | 14.8279 | 14.6008 | 14.5117 | — | |||||||||||||||||||||||||||
| January 31, 2023 | 14.7323 | 14.7420 | 14.5107 | 14.4218 | 14.7923 | |||||||||||||||||||||||||||
| February 28, 2023 | 14.7831 | 14.7927 | 14.5612 | 14.4704 | 14.9001 | |||||||||||||||||||||||||||
| March 31, 2023 | 14.5775 | 14.5864 | 14.3580 | 14.2679 | 14.7328 | |||||||||||||||||||||||||||
| April 30, 2023 | 14.5489 | 14.5576 | 14.3291 | 14.2381 | 14.7600 | |||||||||||||||||||||||||||
| May 31, 2023 | 14.5913 | 14.6001 | 14.3700 | 14.2786 | 14.8593 | |||||||||||||||||||||||||||
| June 30, 2023 | 14.6762 | 14.6852 | 14.4528 | 14.3606 | 15.0023 | |||||||||||||||||||||||||||
| July 31, 2023 | 14.8033 | 14.8126 | 14.5772 | 14.4839 | 15.1895 | |||||||||||||||||||||||||||
| August 31, 2023 | 14.8843 | 14.8938 | 14.6561 | 14.5622 | 15.3302 | |||||||||||||||||||||||||||
| September 30, 2023 | 14.8031 | 14.8127 | 14.5752 | 14.4814 | 15.3038 | |||||||||||||||||||||||||||
| October 31, 2023 | 14.6021 | 14.6104 | 14.3764 | 14.2836 | 15.1533 | |||||||||||||||||||||||||||
| November 30, 2023 | 14.3199 | 14.3280 | 14.0976 | 14.0062 | 14.9172 | |||||||||||||||||||||||||||
| December 31, 2023 | 14.0897 | 14.0977 | 13.8702 | 13.7796 | 14.7348 | |||||||||||||||||||||||||||
(1)As of December 31, 2023, no Class F shares were issued and outstanding.
Net Asset Value
Our board of directors, including a majority of our independent directors, has adopted valuation guidelines that contain a comprehensive set of methodologies to be used by our Adviser in connection with our NAV calculation. These guidelines are designed to produce a fair and accurate estimate of the price that would be received for our investments in an arm’s-length transaction between a willing buyer and a willing seller in possession of all material information about our investments.
The calculation of our NAV is intended to be a calculation of the fair value of our assets less our outstanding liabilities as described below and will likely differ materially from the book value of our equity reflected in our financial statements. As a public company, we are required to issue financial statements based on historical cost determined in accordance with GAAP. To calculate our NAV for the purpose of establishing a purchase and repurchase price for our shares, we have adopted a model, as explained below, that adjusts the value of our assets and liabilities from historical cost to fair value generally in accordance with the GAAP principles set forth in FASB Accounting Standards Codification Topic 820, Fair Value Measurements. Our Adviser will calculate the fair value of our real estate properties monthly based in part on values provided by third-party independent appraisers and such calculation will be reviewed by an independent valuation advisor as further discussed below.
94
Because these fair value calculations involve significant professional judgment in the application of both observable and unobservable attributes, the calculated fair value of our assets may differ from their actual realizable value or future fair value. While we believe our NAV calculation methodologies are consistent with standard industry practices, there is no rule or regulation that requires us to calculate NAV in a certain way. As a result, other public REITs may use different methodologies or assumptions to determine NAV. In addition, NAV is not a measure determined under GAAP and the valuations of, and certain adjustments made to, our assets and liabilities used in the determination of NAV will differ materially from comparable historical cost amounts determined in accordance with GAAP. You should not consider NAV to be equivalent to stockholders’ equity or any other measure determined in accordance with GAAP.
The following valuation methods are used for purposes of calculating the significant components of our NAV:
•Consolidated properties are initially valued at cost, which we expect to represent fair value at the time of acquisition. Subsequently, consolidated properties are primarily valued using the discounted cash flow methodology (income approach), whereby a property’s value is calculated by discounting the estimated cash flows and the anticipated terminal value of the subject property by the assumed new buyer’s normalized weighted average cost of capital for the subject property. Consistent with industry practices, the income approach also incorporates subjective judgments regarding comparable rental and operating expense data, capitalization or discount rate, and projections of future rent and expenses based on appropriate evidence as well as the residual value of the asset as components in determining value. Other methodologies that may also be used to value properties include sales comparisons and replacement cost approaches. We believe the discount rate and exit capitalization rate are the key assumptions utilized in the discounted cash flow methodology. Below the tables that set forth our NAV calculation is a sensitivity analysis of the weighted average discount rates and exit capitalization rates for our property investments.
•Investments in real estate debt consist of CMBS and RMBS, which are securities backed by one or more mortgage loans secured by real estate assets, as well as corporate bonds, term loans, mortgage loans, mezzanine loans, and other investments in debt issued by real estate-related companies or secured by real estate assets. The Company generally determines the fair value of its investments in real estate debt by utilizing third-party pricing service providers whenever available. In determining the fair value of a particular investment, pricing service providers may use broker-dealer quotations, reported trades or valuation estimates from their internal pricing models to determine the reported price. The pricing service providers’ internal models for securities such as real estate debt generally consider the attributes applicable to a particular class of the security (e.g., credit rating, seniority), current market data, and estimated cash flows for each security, and incorporate specific collateral performance, as applicable. Certain of the Company’s investments in real estate debt, such as mortgage loans, mezzanine loans and other investments, are unlikely to have readily available market quotations. In such cases, the Company will generally determine the initial value based on the acquisition price of such investment if acquired by the Company or the par value of such investment if originated by the Company. Following the initial measurements, the Company engaged third party service providers to perform valuations for such investments. The service providers will determine fair value by utilizing or reviewing certain of the following (i) market yield data, (ii) discounted cash flow modeling, (iii) collateral asset performance, (iv) local or macro real estate performance, (v) capital market conditions, (vi) debt yield or loan-to-value ratios, and (vii) borrower financial condition and performance. Refer to the Fair Value Measurements section of Note 2 to our Consolidated Financial Statements for additional details on the Company’s investments in real estate debt.
•The Company separately values the assets and liabilities of the investments in unconsolidated entities. To determine the fair value of the real estate assets of the investments in unconsolidated entities, the Company utilizes a discounted cash flow methodology or market comparable methodology, taking into consideration various factors including discount rate, exit capitalization rate and multiples of comparable companies. The Company utilizes third party service providers to perform valuations of the indebtedness of the investments in unconsolidated entities. The fair value of the indebtedness of the investments in unconsolidated entities is determined by modeling the cash flows required by the debt agreements and discounting them back to the present value using weighted average cost of capital. Additionally, current market rates and conditions are considered by evaluating similar borrowing agreements with comparable loan-to-value ratios and credit profiles. After the fair value of the assets and liabilities are determined, the Company applies its ownership interest to the net asset value and reflects this amount as its investments in unconsolidated entities at fair value.
•Mortgage loans, secured term loans, secured revolving credit facilities, secured financings on investments in real estate debt, and unsecured revolving credit facilities are estimated by modeling the cash flows required by the Company’s debt agreements and discounting them back to the present value using an estimated market yield. Additionally, current market rates and conditions are considered by evaluating similar borrowing agreements with comparable loan-to-value ratios and credit profiles. The Company utilizes third party service providers to perform these valuations.
95
NAV and NAV Per Share Calculation
Each share class has an undivided interest in our assets and liabilities, other than class-specific stockholder servicing fees. In accordance with the valuation guidelines, our NAV per share for each share class as of the last calendar day of each month is calculated using a process that reflects several components, including the estimated fair value of (1) each of our properties, (2) our investments in real estate debt, (3) our investments in unconsolidated entities, (4) our mortgage loans, secured term loans, secured revolving credit facilities, secured financings on investments in real estate debt, and unsecured revolving credit facilities, and (5) our other assets and liabilities.
At the end of each month, our change in NAV for each share class is calculated as follows:
•Shares are issued for subscriptions received and distribution reinvestments to each respective share class, as applicable, and are effective on the first day of each month. The proceeds received through subscriptions and distribution reinvestments for each share class are additions to the prior month ending aggregate NAV for each respective share class (including OP units). Additionally, the NAV of each share class is reduced by the respective repurchases for such month. The result represents the aggregate NAV per share class effective as of the first calendar day of the current month.
•Any change in our aggregate NAV (whether an increase or decrease) is allocated among each class of shares (including OP units) based on each class’s relative percentage of the total aggregate NAV effective on the first calendar day of the current month (as described in the previous bullet). Changes in our aggregate NAV include, but are not limited to, net portfolio income from investments, interest expense, realized and unrealized net real estate and debt appreciation, general and administrative expenses, management fee and performance participation allocation. Unrealized net real estate appreciation includes any change in the fair market value of our investments in real estate, investments in real estate debt, investments in unconsolidated entities, mortgage loans, term loans, revolving credit facilities and secured financings in real estate debt.
•Net distributions are typically declared on the last day of each month and are a reduction to the NAV of each respective share class. As a result of the allocation of stockholder servicing fees, the net distributions per share will differ by share class. The monthly stockholder servicing fee is calculated as a percentage of each applicable class of shares’ NAV (Class S, Class T, and Class D). Class I, Class C, and Class F shares are not subject to the stockholder servicing fee.
•NAV per share for each class is calculated by dividing such class’s NAV at the end of each month by the number of shares outstanding for that class at the end of such month.
Please refer to “Net Asset Value Calculation and Valuation Guidelines” in the Prospectus for the Current Offering (as defined below) for further details on how our NAV is determined.
96
Our total NAV presented in the following tables includes the NAV of our Class S, Class I, Class T, Class D, and Class C shares, as well as the partnership interests of BREIT OP held by parties other than the Company. The following table provides a breakdown of the major components of our NAV as of December 31, 2023 ($ and shares/units in thousands):
| Components of NAV | December 31, 2023 | |||||||
| Investments in real estate | $ | 109,657,592 | ||||||
| Investments in real estate debt | 8,345,064 | |||||||
| Investments in unconsolidated entities | 11,146,390 | |||||||
| Cash and cash equivalents | 1,945,262 | |||||||
| Restricted cash | 704,409 | |||||||
| Other assets | 4,601,407 | |||||||
| Mortgage loans, term loans, and revolving credit facilities, net | (61,805,899) | |||||||
| Secured financings of investments in real estate debt | (4,368,269) | |||||||
| Subscriptions received in advance | (68,413) | |||||||
| Other liabilities | (3,133,969) | |||||||
| Accrued performance participation allocation | — | |||||||
| Management fee payable | (63,505) | |||||||
Accrued stockholder servicing fees(1) | (16,247) | |||||||
| Non-controlling interests in joint ventures | (6,202,066) | |||||||
| Net Asset Value | $ | 60,741,756 | ||||||
Number of outstanding shares/units(2) | 4,313,827 | |||||||
(1)Stockholder servicing fees only apply to Class S, Class T, and Class D shares. For purposes of NAV, we recognize the stockholder servicing fee as a reduction of NAV on a monthly basis as such fee is paid. Under GAAP, we accrue the full cost of the stockholder servicing fee as an offering cost at the time we sell Class S, Class T and Class D shares. As of December 31, 2023, the Company has accrued under GAAP $1.0 billion of stockholder servicing fees payable to the Dealer Manager related to the Class S, Class T and Class D shares sold. The Dealer Manager does not retain any of these fees, all of which are retained by, or re-allowed (paid), to participating broker-dealers.
(2)As of December 31, 2023, no Class F shares were outstanding.
The following table provides a breakdown of our total NAV and NAV per share/unit by class as of December 31, 2023 ($ and shares/units in thousands, except per share/unit data):
| NAV Per Share | Class S Shares | Class I Shares | Class T Shares | Class D Shares | Class C Shares | Third-party Operating Partnership Units (1) | Total | |||||||||||||||||||||||||||||||||||||
| Net asset value | $ | 20,968,312 | $ | 33,876,116 | $ | 821,754 | $ | 2,133,002 | $ | 31,478 | $ | 2,911,094 | $ | 60,741,756 | ||||||||||||||||||||||||||||||
Number of outstanding shares/units(2) | 1,488,197 | 2,402,959 | 59,246 | 154,794 | 2,136 | 206,495 | 4,313,827 | |||||||||||||||||||||||||||||||||||||
NAV Per Share/Unit as of December 31, 2023 | $ | 14.0897 | $ | 14.0977 | $ | 13.8702 | $ | 13.7796 | $ | 14.7348 | $ | 14.0977 | ||||||||||||||||||||||||||||||||
(1)Includes the partnership interests of BREIT OP held by BREIT Special Limited Partner, Class B unit holders, and other BREIT OP interests held by parties other than the Company.
(2)As of December 31, 2023, no Class F shares were outstanding.
97
The following table details the weighted average discount rate and exit capitalization rate by property type, which are the key assumptions used in the discounted cash flow valuations as of December 31, 2023:
| Property Type | Discount Rate | Exit Capitalization Rate | ||||||||||||
| Rental Housing | 7.1% | 5.6% | ||||||||||||
| Industrial | 7.5% | 5.9% | ||||||||||||
| Net Lease | 7.4% | 5.6% | ||||||||||||
| Hospitality | 10.1% | 9.1% | ||||||||||||
| Data Centers | 7.3% | 6.2% | ||||||||||||
| Self Storage | 7.6% | 6.6% | ||||||||||||
| Office | 6.9% | 5.2% | ||||||||||||
| Retail | 7.4% | 6.4% | ||||||||||||
These assumptions are determined by our Adviser, and reviewed by our independent valuation advisor. A change in these assumptions would impact the calculation of the value of our property investments. For example, assuming all else equal, the changes listed below would result in the following effects on our investment values:
| Input | Hypothetical Change | Rental Housing Investment Values | Industrial Investment Values | Net Lease Investment Values | Hospitality Investment Values | Data Center Investment Values | Self Storage Investment Values | Office Investment Values | Retail Investment Values | |||||||||||||||||||||||||||||||||||||||||||||||
| Discount Rate | 0.25% decrease | +1.9% | +2.0% | +1.8% | +1.7% | +0.9% | +1.8% | +1.9% | +1.9% | |||||||||||||||||||||||||||||||||||||||||||||||
| (weighted average) | 0.25% increase | (1.9)% | (1.9)% | (1.8)% | (1.6)% | (0.7)% | (1.8)% | (1.9)% | (1.7)% | |||||||||||||||||||||||||||||||||||||||||||||||
| Exit Capitalization Rate | 0.25% decrease | +3.0% | +3.2% | +2.7% | +1.4% | +1.1% | +2.2% | +3.5% | +2.4% | |||||||||||||||||||||||||||||||||||||||||||||||
| (weighted average) | 0.25% increase | (2.7)% | (3.0)% | (2.4)% | (1.3)% | (1.0)% | (2.0)% | (3.2)% | (2.3)% | |||||||||||||||||||||||||||||||||||||||||||||||
The following table reconciles stockholders’ equity and BREIT OP partners’ capital per our Consolidated Balance Sheets to our NAV ($ in thousands):
| December 31, 2023 | |||||
| Stockholders’ equity | $ | 36,350,567 | |||
| Non-controlling interests attributable to BREIT OP | 2,562,306 | ||||
| Redeemable non-controlling interest | 351 | ||||
| Total BREIT stockholders’ equity and BREIT OP partners’ capital under GAAP | 38,913,224 | ||||
| Adjustments: | |||||
| Accrued stockholder servicing fees | 945,407 | ||||
| Accrued affiliate incentive compensation awards | (77,597) | ||||
| Accumulated depreciation and amortization under GAAP | 11,223,926 | ||||
| Unrealized net real estate and real estate debt appreciation | 9,736,796 | ||||
| NAV | $ | 60,741,756 | |||
The following details the adjustments to reconcile total GAAP stockholders’ equity of BREIT and partners’ capital of BREIT OP to our NAV:
–Accrued stockholder servicing fees represent the accrual for the cost of the stockholder servicing fees for Class S, Class T, and Class D shares. Under GAAP, we accrued the full cost of the stockholder servicing fees payable over the life of each share (assuming such share remains outstanding the length of time required to pay the maximum stockholder servicing fee) as an offering cost at the time we sold the Class S, Class T, and Class D shares. Refer to Note 2 to our consolidated financial statements for further details of the GAAP treatment regarding the stockholder servicing fees. For purposes of calculating NAV, we recognize the stockholder servicing fees as a reduction to NAV on a monthly basis when such fees are paid.
–Under GAAP, the affiliate incentive compensation awards are valued as of grant date and compensation expense is recognized over the service period on a straight-line basis with an offset to equity, resulting in no impact to Stockholders’ Equity. For purposes of calculating NAV, we value the awards based on performance in the applicable period and deduct such value from NAV.
98
–We depreciate our investments in real estate and amortize certain other assets and liabilities in accordance with GAAP. Such depreciation and amortization is not recorded for purposes of calculating our NAV.
–Our investments in real estate are presented at their depreciated cost basis in our GAAP consolidated financial statements. Additionally, our mortgage loans, secured and unsecured term loans, secured and unsecured revolving credit facilities, and repurchase agreements (collectively, “Debt”) are presented at their amortized cost basis in our consolidated GAAP financial statements. As such, any increases or decreases in the fair market value of our investments in real estate or our Debt are not included in our GAAP results. For purposes of calculating our NAV, our investments in real estate and our Debt are recorded at fair value.
99
Distributions
Beginning in March 2017, we have declared monthly distributions for each class of our common stock and OP units, which are generally paid 20 days after month-end. We have paid distributions consecutively each month since that time. Each class of our common stock and OP units received the same aggregate gross distribution of $0.6660 per share/unit for the year ended December 31, 2023. Class C shares currently have no distribution amount presented as the class is generally an accumulating share class whereby its share of income will accrete into its NAV. The net distribution varies for each class based on the applicable stockholder servicing fee, which is deducted from the monthly distribution per share/unit and paid directly to the applicable distributor. The table below details the net distribution for each of our share classes and OP units for the year ended December 31, 2023:
The following table details the total net distribution for each of our share classes and OP units for the years ended December 31, 2023, 2022 and 2021:
| Declaration Year | Class S Shares | Class I Shares | Class T Shares | Class D Shares | OP Units | |||||||||||||||||||||||||||
| 2023 | $ | 0.5412 | $ | 0.6660 | $ | 0.5432 | $ | 0.6301 | $ | 0.6660 | ||||||||||||||||||||||
| 2022 | 0.5412 | 0.6685 | 0.5431 | 0.6319 | 0.6685 | |||||||||||||||||||||||||||
| 2021 | 0.5412 | 0.6508 | 0.5427 | 0.6191 | 0.6508 | |||||||||||||||||||||||||||
The following table outlines the tax character of our distributions paid in 2023, 2022 and 2021 as a percentage of total distributions. The distributions declared on December 31, 2023, 2022, and 2021 were paid in January of the following year and are excluded from the analysis below as they were a tax event in the subsequent year.
Ordinary Income(1) | Capital Gains | Return of Capital | |||||||||||||||
| 2023 Tax Year | —% | 14.99% | 85.01% | ||||||||||||||
2022 Tax Year | —% | 5.65% | 94.35% | ||||||||||||||
2021 Tax Year | 4.73% | 3.36% | 91.91% | ||||||||||||||
(1)4.73% of the distributions paid in 2021 are non-qualified.
The following table summarizes our sources of distributions declared to BREIT stockholders and OP unit holders during the years ended December 31, 2023, 2022 and 2021 ($ in thousands):
| Year Ended December 31, 2023 | Year Ended December 31, 2022 | Year Ended December 31, 2021 | |||||||||||||||||||||||||||||||||
| Amount | Percentage | Amount | Percentage | Amount | Percentage | ||||||||||||||||||||||||||||||
| Sources of Distributions | |||||||||||||||||||||||||||||||||||
Cash flows from operating activities(1) | $ | 2,835,890 | 100 | % | $ | 2,756,392 | 100 | % | $ | 1,624,803 | 100 | % | |||||||||||||||||||||||
| Net gains from investment realizations | — | — | — | — | — | — | |||||||||||||||||||||||||||||
| Indebtedness | — | — | — | — | — | — | |||||||||||||||||||||||||||||
| Total sources of distributions | $ | 2,835,890 | 100 | % | $ | 2,756,392 | 100 | % | $ | 1,624,803 | 100 | % | |||||||||||||||||||||||
| Year-to-date cash flows from operating activities | $ | 2,706,489 | $ | 2,728,677 | $ | 1,783,085 | |||||||||||||||||||||||||||||
Net gain on dispositions(2) | $ | 1,611,632 | $ | 659,030 | $ | 55,844 | |||||||||||||||||||||||||||||
(1)Includes our inception to date cash flows from operating activities, which have funded 100% of our distributions.
(2)Net gain on dispositions includes (i) net gains and losses on dispositions of real estate, (ii) net realized gains and losses on sale of investments in real estate debt, and (iii) impairments of investments in real estate, which amounts are not included in cash flows from operating activities.
100
The following table summarizes our distributions declared to BREIT stockholders during the years ended December 31, 2023, 2022 and 2021 ($ in thousands):
| Year Ended December 31, 2023 | Year Ended December 31, 2022 | Year Ended December 31, 2021 | |||||||||||||||||||||||||||||||||
| Amount | Percentage | Amount | Percentage | Amount | Percentage | ||||||||||||||||||||||||||||||
| Distributions | |||||||||||||||||||||||||||||||||||
| Payable in cash | $ | 1,461,944 | 54 | % | $ | 1,276,365 | 48 | % | $ | 758,741 | 47 | % | |||||||||||||||||||||||
| Reinvested in shares | 1,262,796 | 46 | % | 1,405,121 | 52 | % | 843,172 | 53 | % | ||||||||||||||||||||||||||
Total distributions(1) | $ | 2,724,740 | 100 | % | $ | 2,681,486 | 100 | % | $ | 1,601,913 | 100 | % | |||||||||||||||||||||||
Funds from Operations(2) | $ | 953,963 | $ | 2,508,439 | $ | 1,210,441 | |||||||||||||||||||||||||||||
Adjusted Funds from Operations(2) | $ | 2,090,365 | $ | 2,132,484 | $ | 1,286,347 | |||||||||||||||||||||||||||||
Funds Available for Distribution(2) | $ | 1,738,396 | $ | 1,865,474 | $ | 1,289,474 | |||||||||||||||||||||||||||||
(1)Excludes cash paid to third party joint venture partners classified as non-controlling interest under GAAP.
(2)Reflects amounts allocable to BREIT stockholders. See “Funds from Operations, Adjusted Funds from Operations and Funds Available for Distribution” below for descriptions of Funds from Operations (FFO), Adjusted Funds from Operations (AFFO), and Funds Available for Distribution (FAD), for reconciliations of them to GAAP net loss attributable to BREIT stockholders, and for considerations on how to review these metrics.
The following table summarizes our distributions declared to BREIT stockholders and OP unit holders during the years ended December 31, 2023, 2022 and 2021 ($ in thousands):
| Year Ended December 31, 2023 | Year Ended December 31, 2022 | Year Ended December 31, 2021 | |||||||||||||||||||||||||||||||||
| Amount | Percentage | Amount | Percentage | Amount | Percentage | ||||||||||||||||||||||||||||||
| Distributions | |||||||||||||||||||||||||||||||||||
| Payable in cash | $ | 1,515,395 | 53 | % | $ | 1,321,699 | 48 | % | $ | 772,819 | 48 | % | |||||||||||||||||||||||
Reinvested in shares and units | 1,320,495 | 47 | % | 1,434,693 | 52 | % | 851,984 | 52 | % | ||||||||||||||||||||||||||
| Total distributions | $ | 2,835,890 | 100 | % | $ | 2,756,392 | 100 | % | $ | 1,624,803 | 100 | % | |||||||||||||||||||||||
Funds from Operations(2) | $ | 965,223 | $ | 2,571,723 | $ | 1,224,917 | |||||||||||||||||||||||||||||
Adjusted Funds from Operations(2) | $ | 2,147,317 | $ | 2,188,949 | $ | 1,302,448 | |||||||||||||||||||||||||||||
Funds Available for Distribution(2) | $ | 1,810,382 | $ | 1,927,126 | $ | 1,307,726 | |||||||||||||||||||||||||||||
(1)Excludes cash paid to third party joint venture partners classified as non-controlling interest under GAAP.
(2)Reflects amounts allocable to BREIT stockholders and OP unit holders. See “Funds from Operations, Adjusted Funds from Operations and Funds Available for Distribution” below for descriptions of Funds from Operations (FFO), Adjusted Funds from Operations (AFFO), and Funds Available for Distribution (FAD), for reconciliations of them to GAAP net loss attributable to BREIT stockholders, and for considerations on how to review these metrics.
Funds from Operations, Adjusted Funds from Operations and Funds Available for Distribution
We believe funds from operations (“FFO”) is a meaningful non-GAAP supplemental measure of our operating results. Our consolidated financial statements are presented using historical cost accounting which, among other things, requires depreciation of real estate investments. As a result, our operating results imply that the value of our real estate investments have decreased over time. However, we believe that the value of our real estate investments will fluctuate over time based on market conditions and, as such, depreciation under historical cost accounting may be less informative as a measure of our performance. FFO is an operating measure defined by the National Association of Real Estate Investment Trusts (“NAREIT”) that is broadly used in the REIT industry. FFO, as defined by NAREIT and presented below, is calculated as net income or loss (computed in accordance with GAAP), excluding (i) depreciation and amortization, (ii) impairment of investments in real estate, (iii) net gains or losses from sales of real estate, (iv) net gains or losses from change in control, and (v) similar adjustments for non-controlling interests and unconsolidated entities.
We also believe that adjusted FFO (“AFFO”) is an additional meaningful non-GAAP supplemental measure of our operating results. AFFO further adjusts FFO to reflect the performance of our portfolio by adjusting for items we believe are not directly attributable to our operations. Our adjustments to FFO to arrive at AFFO include removing the impact of (i) the performance participation allocation to our Special Limited Partner or other incentive compensation awards that are based on our Net Asset Value, which includes unrealized gains and losses not recorded in GAAP net income (loss), and that are paid in shares or BREIT OP units, even if subsequently repurchased by us, (ii) gains or losses on extinguishment of debt, (iii) changes in fair value of financial instruments, (iv)
101
amortization of accumulated unrealized gains on derivatives previously recognized in other comprehensive income, (v) straight-line rental income and expense, (vi) amortization of deferred financing costs, (vii) amortization of restricted stock awards, (viii) amortization of mortgage premium/discount, (ix) organization costs, (x) severance costs, (xi) net forfeited investment deposits, (xii) amortization of above- and below-market lease intangibles, (xiii) gain or loss on involuntary conversion, and adding (xiv) proceeds from interest rate contract receivables, and (xv) similar adjustments for non-controlling interests and unconsolidated entities.
We also believe that funds available for distribution (“FAD”) is an additional meaningful non-GAAP supplemental measure of our operating results. FAD provides useful information for considering our operating results and certain other items relative to the amount of our distributions. Further, FAD is a metric, among others, that is considered by our board of directors and executive officers when determining the amount of our dividend to stockholders, and we believe is therefore meaningful to stockholders. FAD is calculated as AFFO adjusted for (i) management fees paid in shares or BREIT OP units, even if subsequently repurchased by us, (ii) recurring tenant improvements, leasing commissions, and other capital expenditures, (iii) stockholder servicing fees paid during the period, (iv) realized gains or losses on financial instruments, and (v) similar adjustments for non-controlling interests and unconsolidated entities. FAD is not indicative of cash available to fund our cash needs and does not represent cash flows from operating activities in accordance with GAAP, as FAD is adjusted for stockholder servicing fees and recurring tenant improvements, leasing commission, and other capital expenditures, which are not considered when determining cash flows from operations. Furthermore, FAD excludes (i) adjustments for working capital items and (ii) amortization of discounts and premiums on investments in real estate debt. Cash flows from operating activities in accordance with GAAP would generally be adjusted for such items.
FFO, AFFO, and FAD should not be considered more relevant or accurate than GAAP net income (loss) in evaluating our operating performance. In addition, FFO, AFFO, and FAD should not be considered as alternatives to net income (loss) as indications of our performance or as alternatives to cash flows from operating activities as indications of our liquidity, but rather should be reviewed in conjunction with these and other GAAP measurements. Further, FFO, AFFO, and FAD are not intended to be used as liquidity measures indicative of cash flow available to fund our cash needs, including our ability to make distributions to our stockholders. In addition, our methodology for calculating AFFO and FAD may differ from the methodologies employed by other companies to calculate the same or similar supplemental performance measures, and accordingly, our reported AFFO and FAD may not be comparable to the AFFO and FAD reported by other companies.
102
The following table presents a reconciliation of net loss attributable to BREIT stockholders to FFO, AFFO and FAD attributable to BREIT stockholders ($ in thousands):
| Year Ended December 31, | ||||||||||||||||||||
| 2023 | 2022 | 2021 | ||||||||||||||||||
| Net loss attributable to BREIT stockholders | $ | (691,822) | $ | (883,519) | $ | (804,783) | ||||||||||||||
| Adjustments to arrive at FFO: | ||||||||||||||||||||
| Depreciation and amortization | 4,167,620 | 4,504,687 | 2,093,023 | |||||||||||||||||
| Impairment of investments in real estate | 238,531 | 33,554 | — | |||||||||||||||||
| Net (gain) loss on dispositions of real estate | (2,379,427) | (799,154) | 1,523 | |||||||||||||||||
| Net loss (gain) on change in control | 5,364 | (20,370) | — | |||||||||||||||||
Amount attributable to non-controlling interests for above adjustments(1) | (386,303) | (326,759) | (79,322) | |||||||||||||||||
| FFO attributable to BREIT stockholders | 953,963 | 2,508,439 | 1,210,441 | |||||||||||||||||
| Adjustments to arrive at AFFO: | ||||||||||||||||||||
| Performance participation allocation | — | 742,670 | 1,378,959 | |||||||||||||||||
| Incentive compensation awards | 67,435 | 35,475 | 14,368 | |||||||||||||||||
| Loss on extinguishment of debt | 40,300 | 11,476 | 16,331 | |||||||||||||||||
Changes in fair value of financial instruments(2) | 943,008 | (1,113,318) | (1,208,557) | |||||||||||||||||
| Straight-line rental income and expense | (208,762) | (270,223) | (165,986) | |||||||||||||||||
| Amortization of deferred financing costs | 250,933 | 177,354 | 66,209 | |||||||||||||||||
| Amortization of restricted stock awards | 62,861 | 9,381 | 580 | |||||||||||||||||
Other | 17,391 | 7,979 | (27,559) | |||||||||||||||||
Amount attributable to non-controlling interests for above adjustments(1) | (36,764) | 23,251 | 1,561 | |||||||||||||||||
| AFFO attributable to BREIT stockholders | 2,090,365 | 2,132,484 | 1,286,347 | |||||||||||||||||
| Adjustments to arrive at FAD: | ||||||||||||||||||||
| Management fee | 839,237 | 837,687 | 445,291 | |||||||||||||||||
Recurring tenant improvements, leasing commissions, and other capital expenditures(3) | (644,193) | (515,820) | (253,886) | |||||||||||||||||
| Stockholder servicing fees | (207,406) | (214,625) | (118,811) | |||||||||||||||||
Realized gains on financial instruments(2) | (324,573) | (369,064) | (67,316) | |||||||||||||||||
Amount attributable to non-controlling interests for above adjustments(1) | (15,034) | (5,188) | (2,151) | |||||||||||||||||
| FAD attributable to BREIT stockholders | $ | 1,738,396 | $ | 1,865,474 | $ | 1,289,474 | ||||||||||||||
(1)The difference between FFO, AFFO, and FAD attributable to BREIT stockholders and FFO, AFFO, and FAD attributable to BREIT stockholders and OP unit holders pertains to “amounts attributable to non-controlling interests for above adjustments” within the reconciliations.
(2)Unrealized (gains) losses from changes in fair value of financial instruments primarily relates to mark-to-market changes on our investments in real estate debt, change in net assets of consolidated securitization vehicles, investments in equity securities, and derivatives. Realized (gains) losses on financial instruments primarily results from the sale of our investments in real estate debt and equity securities, and derivatives.
(3)Recurring tenant improvements and leasing commissions are generally related to second-generation leases and other capital expenditures required to maintain our investments. Other capital expenditures exclude projects that we believe will enhance the value of our investments.
103
Unregistered Sales of Equity Securities
During the year ended December 31, 2023, we sold equity securities that were not registered under the Securities Act. As described in Note 10 to our consolidated financial statements, the Adviser is entitled to an annual management fee payable monthly in cash, shares of common stock, or BREIT OP Units, in each case at the Adviser’s election. For the year ended December 31, 2023, the Adviser elected to receive its management fee in Class I shares and Class B units of BREIT OP, and we issued 24.8 million and 28.0 million unregistered Class I shares and Class B units of BREIT OP, respectively, to the Adviser in satisfaction of the 2023 management fee through November 2023. Additionally, we issued 4.5 million Class B units of BREIT OP to the Adviser in January 2024 in satisfaction of the December 2023 management fee.
The Special Limited Partner is entitled to a quarterly performance participation allocation, less any performance participation allocation received with respect to prior quarters in that year (the “Quarterly Allocation”). The Company issued 54.9 million Class I units in BREIT OP to the Special Limited Partner as payment for $817.5 million of Quarterly Allocations through September 30, 2022. If a Quarterly Allocation is made and at the end of a subsequent calendar quarter in the same calendar year the Special Limited Partner is entitled to less than the previously received aggregate Quarterly Allocation(s) (a “Quarterly Shortfall”), then subsequent distributions of any Quarterly Allocations or year-end Performance Allocations in that calendar year will be reduced by an amount equal to such Quarterly Shortfall, until such time as no Quarterly Shortfall remains. If all or any portion of a Quarterly Shortfall remains at the end of a calendar year following the application described in the previous sentence, distributions of any Quarterly Allocations and year-end performance allocations in the subsequent four calendar years will be reduced by (i) the remaining Quarterly Shortfall plus (ii) an annual rate of 5% on the remaining Quarterly Shortfall measured from the first day of the calendar year following the year in which the Quarterly Shortfall arose and compounded quarterly (collectively, the “Quarterly Shortfall Obligation”) until such time as no Quarterly Shortfall Obligation remains. The Special Limited Partner (or its affiliate) may make a full or partial cash payment to reduce the Quarterly Shortfall Obligation at any time. If any Quarterly Shortfall Obligation remains following such subsequent four calendar years, then the Special Limited Partner (or its affiliate) must promptly pay the Operating Partnership the remaining Quarterly Shortfall Obligation in cash. For the year ended December 31, 2022, the year-end performance participation allocation was less than the previously settled aggregate Quarterly Allocations during the calendar year 2022, resulting in a Quarterly Shortfall amount equal to approximately $74.9 million. Such Quarterly Shortfall amount is recorded as a receivable from the Special Limited Partner and is included as a component of Other Assets on the Company's Consolidated Balance Sheets. At the election of the Special Limited Partner, each Class I unit is exchangeable for cash or Class I shares (on a one-for-one basis).
We have also sold Class I and Class C shares to feeder vehicles created primarily to hold Class I and Class C shares and offer indirect interests in such shares to non-U.S. persons. During the year ended December 31, 2023, we received $384.2 million from selling 26.1 million unregistered Class I and Class C shares to such vehicles. We intend to use the net proceeds from such sales for the purposes set forth in the prospectus for our offering and in a manner within the investment guidelines approved by our board of directors, who serve as fiduciaries to our stockholders.
During the year ended December 31, 2023, we received $4.5 billion from selling 302.8 million aggregate unregistered Class I shares to The Regents of the University of California in conjunction with a long-term strategic venture with Blackstone. Each of the foregoing transactions was exempt from the registration provisions of the Securities Act, by virtue of Section 4(a)(2) and/or Regulation D or Regulation S promulgated thereunder.
Share Repurchases
Under our share repurchase plan, to the extent we choose to repurchase shares in any particular month, we will only repurchase shares as of the opening of the last calendar day of that month (each such date, a “Repurchase Date”). Repurchases will be made at the transaction price in effect on the Repurchase Date (which will generally be equal to our prior month’s NAV per share), except that shares that have not been outstanding for at least one year will be repurchased at 98% of the transaction price (the “Early Repurchase Deduction”) subject to certain limited exceptions. Settlements of share repurchases will generally be made within three business days of the Repurchase Date. The Early Repurchase Deduction will not apply to shares acquired through our distribution reinvestment plan.
The aggregate NAV of total repurchases of Class S shares, Class I shares, Class T shares, Class D shares, Class C and Class F shares (including repurchases at certain non-U.S. investor access funds primarily created to hold shares of the Company, but excluding any Early Repurchase Deduction applicable to the repurchased shares) is limited to no more than 2% of our aggregate NAV per month (measured using the aggregate NAV attributable to stockholders as of the end of the immediately preceding month) and no more than 5% of our aggregate NAV per calendar quarter (measured using the average aggregate NAV attributable to stockholders as of the end of the immediately preceding three months). For the avoidance of doubt, both of these limits are assessed during each month in a calendar quarter. We have in the past received, and may in the future receive, repurchase requests that exceed the limits under our share repurchase plan, and we have in the past repurchased less than the full amount of shares requested, resulting in the repurchase of shares on a pro rata basis. In the fourth quarter of 2023, we received repurchase requests that exceeded the 2% monthly limit and 5% quarterly limit under our share repurchase plan. Therefore, as a result of the aforementioned monthly and quarterly limits, we
104
repurchased less than the full amount of shares requested in October 2023, November 2023 and December 2023. For each of the three months ended March 31, 2023, June 30, 2023, and September 30, 2023, we received repurchase requests that exceeded the applicable repurchase limits under our repurchase plan.
Should repurchase requests, in our board of directors’ judgment, place an undue burden on our liquidity, adversely affect our operations or risk having an adverse impact on the Company as a whole, or should our board of directors otherwise determine that investing our liquid assets in real properties or other investments rather than repurchasing our shares is in the best interests of the Company as a whole, our board of directors may determine to repurchase fewer shares than have been requested to be repurchased (including relative to the 2% monthly limit and 5% quarterly limit under our share repurchase plan), or none at all. Further, our board of directors has in the past made exceptions to the limitations in our share repurchase plan and may in the future, in certain circumstances, make exceptions to such repurchase limitations (or repurchase fewer shares than such repurchase limitations), or modify or suspend our share repurchase plan if, in its reasonable judgement, it deems such action to be in our best interest and the best interest of our stockholders. In the event that we determine to repurchase some but not all of the shares submitted for repurchase during any month, shares repurchased at the end of the month will be repurchased on a pro rata basis after we have repurchased all shares for which repurchase has been requested due to death, disability or divorce and other limited exceptions. All unsatisfied repurchase requests must be resubmitted after the start of the next month or quarter, or upon the recommencement of the share repurchase plan, as applicable.
If the transaction price for the applicable month is not made available by the tenth business day prior to the last business day of the month (or is changed after such date), then no repurchase requests will be accepted for such month and stockholders who wish to have their shares repurchased the following month must resubmit their repurchase requests.
During the three months ended December 31, 2023, we repurchased shares of our common stock in the following amounts:
| Month of: | Total Number of Shares Repurchased | Average Price Paid per Share | Total Number of Shares Repurchased as Part of Publicly Announced Plans or Programs | Repurchases as a Percentage of NAV(1) | Maximum Number of Shares Pending Repurchase Pursuant to Publicly Announced Plans or Program(2) | |||||||||||||||||||||||||||
| October 2023 | 84,230,414 | $ | 14.80 | 84,230,414 | 2.0 | % | — | |||||||||||||||||||||||||
| November 2023 | 82,983,631 | $ | 14.60 | 82,983,631 | 2.0 | % | — | |||||||||||||||||||||||||
| December 2023 | 39,805,879 | $ | 14.31 | 39,805,879 | 1.0 | % | — | |||||||||||||||||||||||||
| Total | 207,019,924 | $ | 14.63 | 207,019,924 | 5.0 | % | — | |||||||||||||||||||||||||
(1)Represents aggregate NAV of the shares repurchased under our share repurchase plan over aggregate NAV of all shares outstanding, in each case, based on the NAV as of the last calendar day of the prior month.
(2)For the months ended October 31, 2023, November 30, 2023 and December 31, 2023, the Company received repurchase requests that exceeded both its monthly 2% of NAV and quarterly 5% of NAV limit. In accordance with the Company's share repurchase plan, the Company fulfilled 56% of requested repurchases in October 2023, 67% of requested repurchases in November 2023, and 53% of requested repurchases in December 2023.
The Special Limited Partner continues to hold 24,891 Class I units in BREIT OP. The redemption of Class I units and Class B units and shares held by the Adviser acquired as payment of the Adviser’s management fee are not subject to our share repurchase plan.
ITEM 6. [RESERVED]
105
ITEM 7. MANAGEMENT’S DISCUSSION AND ANALYSIS OF FINANCIAL CONDITION AND RESULTS OF OPERATIONS
This Section of the Annual Report on Form 10-K discusses 2023 and 2022 items and year to year comparison between 2023 and 2022. For the discussion of 2022 compared to 2021, see “Part II. Item 7 Management’s Discussion and Analysis of Financial Condition and Results of Operations” of our Annual Report for the year ended December 31, 2022, which specific discussion is incorporated by reference.
The following discussion should be read in conjunction with the consolidated financial statements and notes thereto appearing elsewhere in this Annual Report on Form 10-K. In addition to historical data, this discussion contains forward-looking statements about our business, operations and financial performance based on current expectations that involve risks, uncertainties and assumptions. Our actual results may differ materially from those in this discussion as a result of various factors, including but not limited to those discussed in Part I Item 1A — “Risk Factors” in this Annual Report on Form 10-K.
Overview
We invest primarily in stabilized, income-generating commercial real estate in the United States and to a lesser extent, outside the United States. We also, to a lesser extent, invest in real estate debt investments. We are the sole general partner and majority limited partner of BREIT Operating Partnership L.P. (“BREIT OP”), a Delaware limited partnership, and we own substantially all of our assets through BREIT OP. We are externally managed by BX REIT Advisors L.L.C. (the “Adviser”). The Adviser is part of the real estate group of Blackstone Inc. (“Blackstone”), a leading investment manager. We currently operate our business in nine reportable segments: Rental Housing, Industrial, Net Lease, Data Centers, Hospitality, Self Storage, Retail, and Office Properties, and Investments in Real Estate Debt. Rental Housing includes multifamily and other types of rental housing such as manufactured, student, affordable, and single family rental housing, as well as senior living. Net Lease includes the real estate assets of The Bellagio Las Vegas (the “Bellagio”) and The Cosmopolitan of Las Vegas (the “Cosmopolitan”). Additional unconsolidated interests are included in the respective property segment.
BREIT is a non-listed, perpetual life real estate investment trust (“REIT”) that qualifies as a REIT under the Internal Revenue Code of 1986, as amended (the “Code”) for U.S. federal income tax. We generally will not be subject to U.S. federal income taxes on our taxable income to the extent we annually distribute all of our net taxable income to stockholders and maintain our qualification as a REIT.
As of March 28, 2024, we had received cumulative net proceeds of $75.0 billion from the sale of 5.8 billion shares of our Class S, Class I, Class T, Class D and Class C common stock in our continuous public offering and private offerings, and units of BREIT OP. We contributed the net proceeds from the sale of shares to BREIT OP in exchange for a corresponding number of Class S, Class I, Class T, Class D and Class C units. BREIT OP has primarily used the net proceeds to make investments in real estate and real estate debt and for other general corporate purposes (including to fund repurchase requests under our share repurchase plan from time to time) as further described below under “Investment Portfolio.” We intend to continue selling shares of our common stock on a monthly basis through our continuous public offering and private offerings.
106
Recent Developments
The Company’s businesses are materially affected by conditions in the financial markets and economic conditions in the United States and, to a lesser extent, elsewhere in the world.
The year ended December 31, 2023 has been characterized by continued volatility in global markets, driven by historic movements in U.S. Treasury bond yields, geopolitical instability, including in the Middle East, and economic uncertainty. Major central banks globally continued monetary policy tightening in the context of historically elevated inflation. In the United States, the Federal Reserve increased the federal funds target range four times over the course of 2023, which reached 5.25%-5.50% in July—the highest level in 22 years. Accordingly, inflation in the United States decelerated throughout the year, with the U.S. consumer price index decreasing from 6.4% annual growth in January 2023 to 3.4% in December 2023, at which time the Federal Reserve signaled that a reduction in the federal funds target range could be appropriate in 2024.
While it is anticipated that central banks may begin to lower interest rates in 2024, interest rates may remain at or near recent highs, which creates further uncertainty for the economy and us and our stockholders. Interest rates remaining elevated for an extended period of time may adversely affect us and our tenants, as higher costs may dampen consumer spending and slow corporate profit growth, which may negatively impact equity values.
Nevertheless, the U.S. economy continued to show resiliency in 2023, underpinned by a strong labor market. Moderating inflation and economic resiliency in the U.S. have led to an increase in investor confidence in recent months. However, the potential for sustained high interest rates and decelerating economic growth may contribute to continued market volatility in the United States and globally.
107
2023 Highlights
Operating Results:
•Declared monthly net distributions totaling $2.7 billion for the year ended December 31, 2023. The details of the average annualized distribution rates and total returns are shown in the following table:
| Class S | Class I | Class T | Class D | |||||||||||||||||||||||
Average Annualized Distribution Rate(1) | 3.7% | 4.5% | 3.8% | 4.4% | ||||||||||||||||||||||
Year-to-Date Total Return, without upfront selling commissions(2) | (1.4)% | (0.5)% | (1.4)% | (0.8)% | ||||||||||||||||||||||
Year-to-Date Total Return, assuming maximum upfront selling commissions(2) | (4.7)% | N/A | (4.7)% | (2.2)% | ||||||||||||||||||||||
Inception-to-Date Total Return, without upfront selling commissions(2) | 9.6% | 10.6% | 9.9% | 10.4% | ||||||||||||||||||||||
Inception-to-Date Total Return, assuming maximum upfront selling commissions(2) | 9.1% | N/A | 9.3% | 10.1% | ||||||||||||||||||||||
Investments:
•Acquired a $200.0 million partnership interest alongside other investment vehicles managed by Blackstone in a newly formed joint venture with the Federal Deposit Insurance Corporation (“FDIC”), which holds a $16.8 billion senior mortgage loan portfolio retained in receivership following the failure of Signature Bank.
•Sold 139 rental housing properties, 128 self storage properties, 19 hospitality properties, 14 industrial properties, five retail properties, and one office property for total net proceeds of $7.4 billion. We recognized a net realized gain of $1.7 billion, net of the impairment recorded during the year, related to the disposition of such properties. This includes the sale of the Company’s wholly-owned interest in Simply Self Storage for net proceeds of $2.1 billion, resulting in a net realized gain of $695.2 million.
•Sold the Company’s 49.9% interest in MGM Grand Las Vegas and Mandalay Bay Resort for $1.3 billion, resulting in a gain on sale of $430.4 million.
•Sold a 23% common equity interest in a joint venture that owns a 95% interest in the Bellagio for $300.0 million. The Company also sold a preferred equity interest in the joint venture for $650.0 million. The Company controls the joint venture and will therefore continue to consolidate its investment in the Bellagio. The transaction resulted in a $425.0 million premium over our carrying value. The aggregate $950.0 million common and preferred equity interest will be included in the Company’s total equity as non-controlling interests.
•Sold the Company’s 7.9% interest in a logistics business for cash consideration of $547.0 million, resulting in a realized gain of $37.1 million.
Capital and Financing Activity:
•The Regents of the University of California (“UC Investments”) subscribed for an aggregate 302.8 million of the Company’s Class I shares for a total purchase price of $4.5 billion in conjunction with a long-term strategic venture with Blackstone.
•Raised $7.7 billion from the sale of shares of our common stock and through private offerings, including the $4.5 billion sold to UC Investments, during the year ended December 31, 2023. Repurchased $13.3 billion of our shares and units from investors during the year ended December 31, 2023.
•Repaid a net $4.0 billion of financings during the year ended December 31, 2023.
Current Portfolio:
•Our portfolio as of December 31, 2023 consisted of investments in real estate (93% based on fair value) and investments in real estate debt (7%).
•Our 4,834 properties(3) as of December 31, 2023 consisted primarily of Rental Housing (53% based on fair value), Industrial (25%), Data Centers (8%) and Net Lease (5%), and our real estate portfolio was primarily concentrated in the following regions: South (38%), West (30%) and East (19%).
•Our investments in real estate debt as of December 31, 2023 consisted of a diversified portfolio of CMBS, RMBS, mortgage and mezzanine loans, and other real estate-related debt. For further details on credit rating and underlying real estate collateral, refer to “Investment Portfolio – Investments in Real Estate Debt.”
(1)The annualized distribution rate is calculated by averaging each of the twelve months’ annualized distribution, divided by the prior month’s net asset value, which is inclusive of all fees and expenses. The Company believes the annualized distribution rate is a useful measure of our overall investment performance.
(2)Total return is calculated as the change in NAV per share during the respective periods plus any distributions per share declared in the period, and assumes any distributions are reinvested in accordance with our distribution reinvestment plan. Total return for periods greater than one year are annualized. The Company believes total return is a useful measure of the overall investment performance of our shares.
(3)Excludes 28,324 single family rental homes. Such single family rental homes are included in the fair value amounts.
108
Investment Portfolio
Portfolio Summary
The following chart allocates our investments in real estate and real estate debt based on fair value as of December 31, 2023:
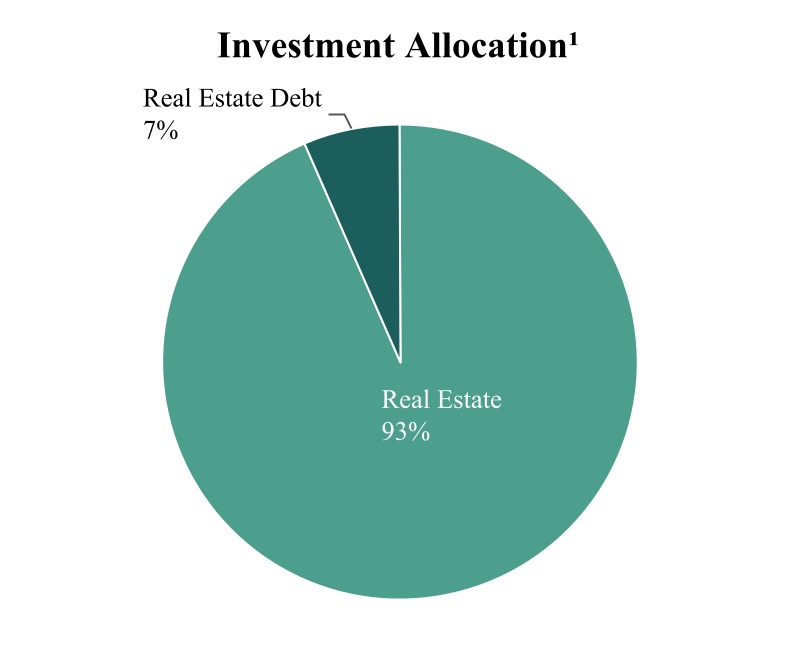
Real Estate Investments
The following charts further describe the diversification of our investments in real estate based on fair value as of December 31, 2023:


(1) “Real estate investments” include wholly-owned property investments, BREIT’s share of property investments held through joint ventures and equity in public and private real estate-related companies. “Real estate debt” includes BREIT’s investments in CMBS, RMBS, mortgage loans, and other debt secured by real estate and real estate related assets, and excludes the impact of consolidating the loans that serve as collateral for certain of our debt securities on our Consolidated Generally Accepted Accounting Principles (“GAAP”) Balance Sheets. “Property Sector” weighting is measured as the asset value of real estate investments for each sector category divided by the asset value of all real estate investments, excluding the value of any third-party interests in such real estate investments. “Region Concentration” represents regions as defined by the National Council of Real Estate Fiduciaries (“NCREIF”) and the weighting is measured as the asset value of our real estate properties for each
109
regional category divided by the asset value of all real estate properties, excluding the value of any third-party interests in such real estate properties. “Non-U.S.” reflects investments in Europe and Canada.
The following table provides a summary of our portfolio by segment as of December 31, 2023:
| Segment | Number of Properties(1) | Sq. Feet (in thousands)/ Units/Keys | Occupancy Rate(2) | Average Effective Annual Base Rent Per Leased Square Foot/Units/Keys(3) | Gross Asset Value(4) ($ in thousands) | Segment Revenue(5) ($ in thousands) | Percentage of Total Revenues | |||||||||||||||||||||||||||||||||||||
Rental Housing(6) | 1,099 | 267,891 units | 93% | $15,138 | $ | 63,293,594 | $ | 5,747,687 | 57% | |||||||||||||||||||||||||||||||||||
| Industrial | 3,209 | 439,092 sq. ft. | 97% | $5.99 | 30,222,823 | 1,810,695 | 18% | |||||||||||||||||||||||||||||||||||||
| Data Centers | 103 | 9,946 sq. ft. | 100% | $14.86 | 10,072,629 | 438,416 | 4% | |||||||||||||||||||||||||||||||||||||
| Net Lease | 2 | 15,409 sq. ft. | 100% | N/A | 5,366,562 | 600,562 | 6% | |||||||||||||||||||||||||||||||||||||
| Office | 14 | 5,164 sq. ft. | 99% | $41.92 | 3,347,581 | 288,823 | 3% | |||||||||||||||||||||||||||||||||||||
| Hospitality | 248 | 33,900 keys | 73% | $189.14/$138.93 | 3,005,530 | 820,429 | 8% | |||||||||||||||||||||||||||||||||||||
| Retail | 79 | 10,752 sq. ft. | 95% | $19.42 | 2,875,363 | 255,558 | 2% | |||||||||||||||||||||||||||||||||||||
| Self Storage | 80 | 5,223 sq. ft. | 86% | $14.36 | 886,187 | 189,498 | 2% | |||||||||||||||||||||||||||||||||||||
| Total | 4,834 | $ | 119,070,269 | $ | 10,151,668 | 100% | ||||||||||||||||||||||||||||||||||||||
(1)Includes properties owned by unconsolidated entities. Single family rental homes are accounted for in rental housing units and are not reflected in the number of properties.
(2)For our industrial, net lease, data centers, retail and office investments, occupancy includes all leased square footage as of December 31, 2023. For our multifamily, student housing and affordable housing investments, occupancy is defined as the percentage of actual rent divided by gross potential rent (defined as actual rent for occupied units and market rent for vacant units) for the three months ended December 31, 2023. For our single family rental housing investments, the occupancy rate includes occupied homes for the three months ended December 31, 2023. For our self storage, manufactured housing and senior living investments, the occupancy rate includes occupied square footage, occupied sites and occupied units, respectively, as of December 31, 2023. The average occupancy rate for our hospitality investments includes paid occupied rooms for the 12 months ended December 31, 2023. Hospitality investments owned less than 12 months are excluded from the average occupancy rate calculation. Unconsolidated investments are excluded from occupancy rate calculations.
(3)For multifamily and rental housing properties other than manufactured housing, average effective annual base rent represents the base rent for the year ended December 31, 2023 per leased unit, and excludes tenant recoveries, straight-line rent, and above-market and below-market lease amortization. For manufactured housing, industrial, net lease, data centers, self storage, office, and retail properties, average effective annual base rent represents the annualized December 31, 2023 base rent per leased square foot or unit and excludes tenant recoveries, straight-line rent, and above-market and below-market lease amortization. For hospitality properties, average effective annual base rent represents Average Daily Rate (“ADR”) and Revenue Per Available Room (“RevPAR”), respectively, for the 12 months ended December 31, 2023. Hospitality investments owned less than 12 months are excluded from the ADR and RevPAR calculations.
(4)Measured as the total fair value of real estate investments for each sector, excluding the value of any third-party interests in such real estate investments.
(5)Segment revenue is presented for the year ended December 31, 2023 and includes our allocable share of revenues generated by unconsolidated entities.
(6)Rental Housing includes multifamily and other types of rental housing such as manufactured, student, affordable, and single family rental housing, as well as senior living. Rental Housing units include multifamily units, affordable housing units, manufactured housing sites, student housing units, single family rental homes and senior living units.
110
Real Estate
The following table provides information regarding our real estate portfolio as of December 31, 2023:
| Segment and Investment | Number of Properties(1) | Location | Acquisition Date | Ownership Interest(2) | Sq. Feet (in thousands)/Units/Keys(1) | Occupancy Rate(3) | ||||||||||||||||||||||||||||||||
| Rental Housing: | ||||||||||||||||||||||||||||||||||||||
| TA Multifamily Portfolio | 2 | Palm Beach Gardens, FL & Gurnee, IL | April 2017 | 100% | 959 units | 93% | ||||||||||||||||||||||||||||||||
| Emory Point | 1 | Atlanta, GA | May 2017 | 100% | 750 units | 94% | ||||||||||||||||||||||||||||||||
| Nevada West Multifamily | 3 | Las Vegas, NV | May 2017 | 100% | 972 units | 94% | ||||||||||||||||||||||||||||||||
| Mountain Gate & Trails Multifamily | 2 | Las Vegas, NV | June 2017 | 100% | 539 units | 94% | ||||||||||||||||||||||||||||||||
| Elysian West Multifamily | 1 | Las Vegas, NV | July 2017 | 100% | 466 units | 95% | ||||||||||||||||||||||||||||||||
| Gilbert Multifamily | 2 | Gilbert, AZ | Sept. 2017 | 90% | 748 units | 92% | ||||||||||||||||||||||||||||||||
| Domain Multifamily | 1 | Dallas, TX | Sept. 2017 | 100% | 395 units | 93% | ||||||||||||||||||||||||||||||||
| ACG II Multifamily | 3 | Various | Sept. 2017 | 94% | 740 units | 94% | ||||||||||||||||||||||||||||||||
| Olympus Multifamily | 3 | Jacksonville, FL | Nov. 2017 | 95% | 1,032 units | 92% | ||||||||||||||||||||||||||||||||
| Amberglen West Multifamily | 1 | Hillsboro, OR | Nov. 2017 | 100% | 396 units | 93% | ||||||||||||||||||||||||||||||||
| Aston Multifamily Portfolio | 6 | Various | Various | 100% | 945 units | 94% | ||||||||||||||||||||||||||||||||
| Talavera and Flamingo Multifamily | 2 | Las Vegas, NV | Dec. 2017 | 100% | 674 units | 92% | ||||||||||||||||||||||||||||||||
| Montair Multifamily | 1 | Thornton, CO | Dec. 2017 | 100% | 320 units | 84% | ||||||||||||||||||||||||||||||||
| Signature at Kendall Multifamily | 2 | Miami, FL | Dec. 2017 | 100% | 546 units | 95% | ||||||||||||||||||||||||||||||||
| Wave Multifamily Portfolio | 4 | Various | May 2018 | 100% | 1,728 units | 93% | ||||||||||||||||||||||||||||||||
| ACG III Multifamily | 2 | Gresham, OR & Turlock, CA | May 2018 | 95% | 475 units | 94% | ||||||||||||||||||||||||||||||||
| Carroll Florida Multifamily | 1 | Jacksonville & Orlando, FL | May 2018 | 100% | 320 units | 94% | ||||||||||||||||||||||||||||||||
| Solis at Flamingo | 1 | Las Vegas, NV | June 2018 | 95% | 524 units | 93% | ||||||||||||||||||||||||||||||||
| Velaire at Aspera | 1 | Phoenix, AZ | July 2018 | 100% | 286 units | 95% | ||||||||||||||||||||||||||||||||
| Coyote Multifamily Portfolio | 6 | Phoenix, AZ | Aug. 2018 | 100% | 1,752 units | 92% | ||||||||||||||||||||||||||||||||
| Avanti Apartments | 1 | Las Vegas, NV | Dec. 2018 | 100% | 414 units | 92% | ||||||||||||||||||||||||||||||||
| Gilbert Heritage Apartments | 1 | Phoenix, AZ | Feb. 2019 | 90% | 256 units | 94% | ||||||||||||||||||||||||||||||||
| Roman Multifamily Portfolio | 11 | Various | Feb. 2019 | 100% | 2,975 units | 93% | ||||||||||||||||||||||||||||||||
| Elevation Plaza Del Rio | 1 | Phoenix, AZ | April 2019 | 90% | 333 units | 94% | ||||||||||||||||||||||||||||||||
| Courtney at Universal Multifamily | 1 | Orlando, FL | April 2019 | 100% | 355 units | 94% | ||||||||||||||||||||||||||||||||
| Citymark Multifamily 2-Pack | 2 | Las Vegas, NV & Lithia Springs, GA | April 2019 | 95% | 608 units | 91% | ||||||||||||||||||||||||||||||||
| Raider Multifamily Portfolio | 4 | Las Vegas, NV | Various | 100% | 1,514 units | 94% | ||||||||||||||||||||||||||||||||
| Bridge II Multifamily Portfolio | 6 | Various | Various | 100% | 2,363 units | 89% | ||||||||||||||||||||||||||||||||
| Miami Doral 2-Pack | 2 | Miami, FL | May 2019 | 100% | 720 units | 94% | ||||||||||||||||||||||||||||||||
| Davis Multifamily 2-Pack | 2 | Raleigh, NC & Jacksonville, FL | May 2019 | 100% | 454 units | 94% | ||||||||||||||||||||||||||||||||
| Slate Savannah | 1 | Savannah, GA | May 2019 | 90% | 272 units | 94% | ||||||||||||||||||||||||||||||||
| Amara at MetroWest | 1 | Orlando, FL | May 2019 | 95% | 411 units | 95% | ||||||||||||||||||||||||||||||||
| Colorado 3-Pack | 1 | Denver, CO | May 2019 | 100% | 300 units | 91% | ||||||||||||||||||||||||||||||||
| Edge Las Vegas | 1 | Las Vegas, NV | June 2019 | 95% | 296 units | 90% | ||||||||||||||||||||||||||||||||
| ACG IV Multifamily | 2 | Woodland, CA & Puyallup, WA | June 2019 | 95% | 606 units | 93% | ||||||||||||||||||||||||||||||||
| Perimeter Multifamily 3-Pack | 3 | Atlanta, GA | June 2019 | 100% | 691 units | 89% | ||||||||||||||||||||||||||||||||
| Anson at the Lakes | 1 | Charlotte, NC | June 2019 | 100% | 694 units | 92% | ||||||||||||||||||||||||||||||||
| San Valiente Multifamily | 1 | Phoenix, AZ | July 2019 | 95% | 604 units | 91% | ||||||||||||||||||||||||||||||||
| Edgewater at the Cove | 1 | Oregon City, OR | Aug. 2019 | 100% | 248 units | 90% | ||||||||||||||||||||||||||||||||
| Haven 124 Multifamily | 1 | Denver, CO | Sept. 2019 | 100% | 562 units | 90% | ||||||||||||||||||||||||||||||||
| Villages at McCullers Walk Multifamily | 1 | Raleigh, NC | Oct. 2019 | 100% | 412 units | 95% | ||||||||||||||||||||||||||||||||
| Canopy at Citrus Park Multifamily | 1 | Largo, FL | Oct. 2019 | 90% | 318 units | 94% | ||||||||||||||||||||||||||||||||
| Ridge Multifamily Portfolio | 4 | Las Vegas, NV | Oct. 2019 | 90% | 1,220 units | 91% | ||||||||||||||||||||||||||||||||
| Charleston on 66th Multifamily | 1 | Tampa, FL | Nov. 2019 | 95% | 258 units | 92% | ||||||||||||||||||||||||||||||||
| Evolve at Timber Creek Multifamily | 1 | Garner, NC | Nov. 2019 | 100% | 304 units | 91% | ||||||||||||||||||||||||||||||||
| Arches at Hidden Creek Multifamily | 1 | Chandler, AZ | Nov. 2019 | 98% | 432 units | 89% | ||||||||||||||||||||||||||||||||
| Terra Multifamily | 1 | Austin, TX | Dec. 2019 | 100% | 372 units | 92% | ||||||||||||||||||||||||||||||||
| Arium Multifamily Portfolio | 3 | Various | Dec. 2019 | 100% | 972 units | 94% | ||||||||||||||||||||||||||||||||
| Easton Gardens Multifamily | 1 | Columbus, OH | Feb. 2020 | 95% | 1,064 units | 94% | ||||||||||||||||||||||||||||||||
| Acorn Multifamily Portfolio | 16 | Various | Feb. & May 2020 | 98% | 6,636 units | 93% | ||||||||||||||||||||||||||||||||
| Indigo West Multifamily | 1 | Orlando, FL | March 2020 | 100% | 456 units | 91% | ||||||||||||||||||||||||||||||||
| The Sixes Multifamily | 1 | Holly Springs, GA | Sept. 2020 | 100% | 340 units | 94% | ||||||||||||||||||||||||||||||||
| Park & Market Multifamily | 1 | Raleigh, NC | Oct. 2020 | 100% | 409 units | 95% | ||||||||||||||||||||||||||||||||
| Cortland Lex Multifamily | 1 | Alpharetta, GA | Oct. 2020 | 100% | 360 units | 95% | ||||||||||||||||||||||||||||||||
| The Palmer Multifamily | 1 | Charlotte, NC | Oct. 2020 | 90% | 318 units | 93% | ||||||||||||||||||||||||||||||||
| Grizzly Multifamily Portfolio | 1 | Atlanta, GA | Oct. 2020 | 100% | 425 units | 93% | ||||||||||||||||||||||||||||||||
| Jaguar Multifamily Portfolio | 9 | Various | Nov. & Dec. 2020 | 100% | 3,014 units | 91% | ||||||||||||||||||||||||||||||||
| Kansas City Multifamily Portfolio | 2 | Overland Park & Olathe, KS | Dec. 2020 | 100% | 620 units | 93% | ||||||||||||||||||||||||||||||||
111
| Segment and Investment | Number of Properties(1) | Location | Acquisition Date | Ownership Interest(2) | Sq. Feet (in thousands)/Units/Keys(1) | Occupancy Rate(3) | ||||||||||||||||||||||||||||||||
| The View at Woodstock Multifamily | 1 | Woodstock, GA | Jan. 2021 | 100% | 320 units | 93% | ||||||||||||||||||||||||||||||||
| Cortona South Tampa Multifamily | 1 | Tampa, FL | April 2021 | 100% | 300 units | 92% | ||||||||||||||||||||||||||||||||
| Crest at Park Central Multifamily | 1 | Dallas, TX | April 2021 | 100% | 387 units | 94% | ||||||||||||||||||||||||||||||||
| Rosery Multifamily Portfolio | 1 | Largo, FL | April 2021 | 100% | 224 units | 92% | ||||||||||||||||||||||||||||||||
| Encore Tessera Multifamily | 1 | Phoenix, AZ | May 2021 | 80% | 240 units | 92% | ||||||||||||||||||||||||||||||||
| Acorn 2.0 Multifamily Portfolio | 16 | Various | Various | 98% | 6,409 units | 93% | ||||||||||||||||||||||||||||||||
| Vue at Centennial Multifamily | 1 | Las Vegas, NV | June 2021 | 100% | 372 units | 94% | ||||||||||||||||||||||||||||||||
| Charlotte Multifamily Portfolio | 2 | Various | June & Aug. 2021 | 100% | 576 units | 93% | ||||||||||||||||||||||||||||||||
| Haven by Watermark Multifamily | 1 | Denver, CO | June 2021 | 100% | 206 units | 92% | ||||||||||||||||||||||||||||||||
| Legacy North Multifamily | 1 | Plano, TX | Aug. 2021 | 100% | 1,675 units | 95% | ||||||||||||||||||||||||||||||||
| The Brooke Multifamily | 1 | Atlanta, GA | Aug. 2021 | 100% | 537 units | 86% | ||||||||||||||||||||||||||||||||
| One Boynton Multifamily | 1 | Boynton Beach, FL | Aug. 2021 | 100% | 494 units | 93% | ||||||||||||||||||||||||||||||||
| Town Lantana Multifamily | 1 | Lantana, FL | Sept. 2021 | 90% | 360 units | 93% | ||||||||||||||||||||||||||||||||
| Ring Multifamily Portfolio | 12 | Various | Sept. 2021 | 100% | 3,030 units | 94% | ||||||||||||||||||||||||||||||||
| Villages at Pecan Grove Multifamily | 1 | Holly Springs, NC | Nov. 2021 | 100% | 336 units | 93% | ||||||||||||||||||||||||||||||||
| Cielo Morrison Multifamily Portfolio | 2 | Charlotte, NC | Nov. 2021 | 90% | 419 units | 92% | ||||||||||||||||||||||||||||||||
| FiveTwo at Highland Multifamily | 1 | Austin, TX | Nov. 2021 | 90% | 390 units | 92% | ||||||||||||||||||||||||||||||||
| Roman 2.0 Multifamily Portfolio | 20 | Various | Dec. 2021 & Jan. 2022 | 100% | 6,342 units | 94% | ||||||||||||||||||||||||||||||||
| Kapilina Beach Homes Multifamily | 1 | Ewa Beach, HI | Dec. 2021 | 100% | 1,459 units | 89% | ||||||||||||||||||||||||||||||||
| SeaTac Multifamily Portfolio | 2 | Edgewood & Everett, WA | Dec. 2021 | 90% | 480 units | 92% | ||||||||||||||||||||||||||||||||
| Villages at Raleigh Beach Multifamily | 1 | Raleigh, NC | Jan. 2022 | 100% | 392 units | 93% | ||||||||||||||||||||||||||||||||
| Raider 2.0 Multifamily Portfolio | 3 | Las Vegas & Henderson, NV | March & April 2022 | 100% | 1,390 units | 91% | ||||||||||||||||||||||||||||||||
| Dallas Multifamily Portfolio | 2 | Irving & Fort Worth, TX | April 2022 | 90% | 759 units | 95% | ||||||||||||||||||||||||||||||||
| Carlton at Bartram Park Multifamily | 1 | Jacksonville, FL | April 2022 | 100% | 750 units | 93% | ||||||||||||||||||||||||||||||||
| Overlook Multifamily Portfolio | 2 | Malden & Revere, MA | April 2022 | 100% | 1,386 units | 93% | ||||||||||||||||||||||||||||||||
| Harper Place at Bees Ferry Multifamily | 1 | Charleston, SC | April 2022 | 100% | 195 units | 94% | ||||||||||||||||||||||||||||||||
| Rapids Multifamily Portfolio | 37 | Various | May 2022 | 100% | 11,245 units | 92% | ||||||||||||||||||||||||||||||||
| 8 Spruce Street Multifamily | 1 | New York, NY | May 2022 | 100% | 900 units | 94% | ||||||||||||||||||||||||||||||||
Pike Multifamily Portfolio(4) | 46 | Various | June 2022 | 100% | 12,332 units | 93% | ||||||||||||||||||||||||||||||||
| ACG V Multifamily | 2 | Stockton, CA | Sept. 2022 | 95% | 449 units | 96% | ||||||||||||||||||||||||||||||||
| Highroads MH | 2 | Phoenix, AZ | April 2018 | 99.6% | 198 units | 97% | ||||||||||||||||||||||||||||||||
| Evergreen Minari MH | 2 | Phoenix, AZ | June 2018 | 99.6% | 115 units | 96% | ||||||||||||||||||||||||||||||||
| Southwest MH | 10 | Various | June 2018 | 99.6% | 2,249 units | 91% | ||||||||||||||||||||||||||||||||
| Hidden Springs MH | 1 | Desert Hot Springs, CA | July 2018 | 99.6% | 317 units | 86% | ||||||||||||||||||||||||||||||||
| SVPAC MH | 2 | Phoenix, AZ | July 2018 | 99.6% | 233 units | 99% | ||||||||||||||||||||||||||||||||
| Riverest MH | 1 | Tavares, FL | Dec. 2018 | 99.6% | 130 units | 97% | ||||||||||||||||||||||||||||||||
| Angler MH Portfolio | 4 | Phoenix, AZ | April 2019 | 99.6% | 770 units | 90% | ||||||||||||||||||||||||||||||||
| Florida MH 4-Pack | 4 | Various | April & July 2019 | 99.6% | 799 units | 94% | ||||||||||||||||||||||||||||||||
| Impala MH | 3 | Phoenix & Chandler, AZ | July 2019 | 99.6% | 333 units | 99% | ||||||||||||||||||||||||||||||||
| Clearwater MHC 2-Pack | 2 | Clearwater, FL | March & Aug. 2020 | 99.6% | 207 units | 95% | ||||||||||||||||||||||||||||||||
| Legacy MH Portfolio | 7 | Various | April 2020 | 99.6% | 1,896 units | 91% | ||||||||||||||||||||||||||||||||
| May Manor MH | 1 | Lakeland, FL | June 2020 | 99.6% | 297 units | 85% | ||||||||||||||||||||||||||||||||
| Royal Oaks MH | 1 | Petaluma, CA | Nov. 2020 | 99.6% | 94 units | 99% | ||||||||||||||||||||||||||||||||
| Southeast MH Portfolio | 22 | Various | Dec. 2020 | 99.6% | 5,858 units | 88% | ||||||||||||||||||||||||||||||||
| Redwood Village MH | 1 | Santa Rosa, CA | July 2021 | 99.6% | 67 units | 99% | ||||||||||||||||||||||||||||||||
| Courtly Manor MH | 1 | Hialeah, FL | Oct. 2021 | 99.6% | 525 units | 100% | ||||||||||||||||||||||||||||||||
| Crescent Valley MH | 1 | Newhall, CA | Nov. 2021 | 99.6% | 85 units | 93% | ||||||||||||||||||||||||||||||||
| EdR Student Housing Portfolio | 20 | Various | Sept. 2018 | 95% | 3,460 units | 97% | ||||||||||||||||||||||||||||||||
| Mercury 3100 Student Housing | 1 | Orlando, FL | Feb. 2021 | 100% | 228 units | 99% | ||||||||||||||||||||||||||||||||
| Signal Student Housing Portfolio | 8 | Various | Aug. 2021 | 96% | 1,749 units | 97% | ||||||||||||||||||||||||||||||||
| Standard at Fort Collins Student Housing | 1 | Fort Collins, CO | Nov. 2021 | 97% | 237 units | 97% | ||||||||||||||||||||||||||||||||
| Intel Student Housing Portfolio | 4 | Reno, NV | Various | 98% | 805 units | 89% | ||||||||||||||||||||||||||||||||
| Signal 2.0 Student Housing Portfolio | 2 | Buffalo, NY & Athens, GA | Dec. 2021 | 97% | 366 units | 92% | ||||||||||||||||||||||||||||||||
| Robin Student Housing Portfolio | 8 | Various | March 2022 | 98% | 1,703 units | 90% | ||||||||||||||||||||||||||||||||
| Legacy on Rio Student Housing | 1 | Austin, TX | March 2022 | 97% | 149 units | 93% | ||||||||||||||||||||||||||||||||
| Mark at Tucson Student Housing | 1 | Mountain, AZ | April 2022 | 97% | 154 units | 99% | ||||||||||||||||||||||||||||||||
| Legacy at Baton Rouge Student Housing | 1 | Baton Rouge, LA | May 2022 | 97% | 300 units | 99% | ||||||||||||||||||||||||||||||||
| American Campus Communities | 146 | Various | Aug. 2022 | 69% | 35,093 units | 96% | ||||||||||||||||||||||||||||||||
Home Partners of America(5) | N/A(1) | Various | Various | Various(5) | 28,324 units | 91% | ||||||||||||||||||||||||||||||||
| Quebec Independent Living Portfolio | 11 | Quebec, Canada | Aug. 2021 & Aug. 2022 | 100% | 3,233 units | 93% | ||||||||||||||||||||||||||||||||
Ace Affordable Housing Portfolio(6) | 484 | Various | Dec. 2021 | Various(6) | 64,915 units | 94% | ||||||||||||||||||||||||||||||||
| Florida Affordable Housing Portfolio | 43 | Various | Various | 100% | 10,965 units | 97% | ||||||||||||||||||||||||||||||||
112
| Segment and Investment | Number of Properties(1) | Location | Acquisition Date | Ownership Interest(2) | Sq. Feet (in thousands)/Units/Keys(1) | Occupancy Rate(3) | ||||||||||||||||||||||||||||||||
| Palm Park Affordable Housing | 1 | Boynton Beach, FL | May 2022 | 100% | 160 units | 98% | ||||||||||||||||||||||||||||||||
| Wasatch 2-Pack | 2 | Spring Valley, CA & Midvale, UT | Oct. 2022 | 100% | 350 units | 95% | ||||||||||||||||||||||||||||||||
| Total Rental Housing | 1,099 | 267,891 units | ||||||||||||||||||||||||||||||||||||
| Industrial: | ||||||||||||||||||||||||||||||||||||||
| HS Industrial Portfolio | 33 | Various | April 2017 | 100% | 5,573 sq. ft. | 100% | ||||||||||||||||||||||||||||||||
| Fairfield Industrial Portfolio | 11 | Fairfield, NJ | Sept. 2017 | 100% | 578 sq. ft. | 98% | ||||||||||||||||||||||||||||||||
| Southeast Industrial Portfolio | 3 | Various | Nov. 2017 | 100% | 1,167 sq. ft. | 100% | ||||||||||||||||||||||||||||||||
| Kraft Chicago Industrial Portfolio | 3 | Aurora, IL | Jan. 2018 | 100% | 1,693 sq. ft. | 100% | ||||||||||||||||||||||||||||||||
| Canyon Industrial Portfolio | 134 | Various | March 2018 | 100% | 19,651 sq. ft. | 96% | ||||||||||||||||||||||||||||||||
| HP Cold Storage Industrial Portfolio | 6 | Various | May 2018 | 100% | 2,259 sq. ft. | 100% | ||||||||||||||||||||||||||||||||
| Meridian Industrial Portfolio | 86 | Various | Nov. 2018 | 99% | 11,185 sq. ft. | 98% | ||||||||||||||||||||||||||||||||
| Summit Industrial Portfolio | 8 | Atlanta, GA | Dec. 2018 | 100% | 631 sq. ft. | 95% | ||||||||||||||||||||||||||||||||
| 4500 Westport Drive | 1 | Harrisburg, PA | Jan. 2019 | 100% | 179 sq. ft. | 100% | ||||||||||||||||||||||||||||||||
| Minneapolis Industrial Portfolio | 34 | Minneapolis, MN | April 2019 | 100% | 2,459 sq. ft. | 95% | ||||||||||||||||||||||||||||||||
| Atlanta Industrial Portfolio | 61 | Atlanta, GA | May 2019 | 100% | 3,779 sq. ft. | 97% | ||||||||||||||||||||||||||||||||
| Patriot Park Industrial Portfolio | 2 | Durham, NC | Sept. 2019 | 100% | 323 sq. ft. | 100% | ||||||||||||||||||||||||||||||||
| Denali Industrial Portfolio | 18 | Various | Sept. 2019 | 100% | 4,098 sq. ft. | 98% | ||||||||||||||||||||||||||||||||
| Jupiter 12 Industrial Portfolio | 298 | Various | Sept. 2019 | 100% | 57,616 sq. ft. | 96% | ||||||||||||||||||||||||||||||||
| 2201 Main Street | 1 | San Diego, CA | Oct. 2019 | 100% | 260 sq. ft. | N/A | ||||||||||||||||||||||||||||||||
| Triangle Industrial Portfolio | 24 | Greensboro, NC | Jan. 2020 | 100% | 2,559 sq. ft. | 98% | ||||||||||||||||||||||||||||||||
| Midwest Industrial Portfolio | 27 | Various | Feb. 2020 | 100% | 5,940 sq. ft. | 87% | ||||||||||||||||||||||||||||||||
| Pancal Industrial Portfolio | 12 | Various | Feb. & April 2020 | 100% | 2,109 sq. ft. | 99% | ||||||||||||||||||||||||||||||||
| Grainger Distribution Center | 1 | Jacksonville, FL | March 2020 | 100% | 297 sq. ft. | 100% | ||||||||||||||||||||||||||||||||
| Diamond Industrial | 1 | Pico Rivera, CA | Aug. 2020 | 100% | 243 sq. ft. | 100% | ||||||||||||||||||||||||||||||||
| Inland Empire Industrial Portfolio | 2 | Etiwanda & Fontana, CA | Sept. 2020 | 100% | 404 sq. ft. | 100% | ||||||||||||||||||||||||||||||||
| Shield Industrial Portfolio | 13 | Various | Dec. 2020 | 100% | 2,079 sq. ft. | 100% | ||||||||||||||||||||||||||||||||
| 7520 Georgetown Industrial | 1 | Indianapolis, IN | Dec. 2020 | 100% | 425 sq. ft. | 100% | ||||||||||||||||||||||||||||||||
WC Infill Industrial Portfolio(7) | 18 | Various | Jan. & Aug. 2021 | 85% | 2,693 sq. ft. | N/A | ||||||||||||||||||||||||||||||||
Vault Industrial Portfolio(7) | 35 | Various | Jan. 2021 | 46% | 6,592 sq. ft. | N/A | ||||||||||||||||||||||||||||||||
| Chicago Infill Industrial Portfolio | 7 | Various | Feb. 2021 | 100% | 1,058 sq. ft. | 100% | ||||||||||||||||||||||||||||||||
| Greensboro Industrial Portfolio | 19 | Various | April 2021 | 100% | 2,068 sq. ft. | 90% | ||||||||||||||||||||||||||||||||
| NW Corporate Center Industrial Portfolio | 3 | El Paso, TX | July 2021 | 100% | 692 sq. ft. | 100% | ||||||||||||||||||||||||||||||||
| I-85 Southeast Industrial Portfolio | 4 | Various | July & Aug. 2021 | 100% | 739 sq. ft. | 100% | ||||||||||||||||||||||||||||||||
Alaska Industrial Portfolio(7) | 27 | Various UK | July & Oct. 2021 | 22% | 8,735 sq. ft. | N/A | ||||||||||||||||||||||||||||||||
| Stephanie Industrial Portfolio | 2 | Henderson, NV | Sept. 2021 | 100% | 338 sq. ft. | 100% | ||||||||||||||||||||||||||||||||
| Capstone Industrial Portfolio | 2 | Brooklyn Park, MN | Sept. 2021 | 100% | 219 sq. ft. | 86% | ||||||||||||||||||||||||||||||||
Winston Industrial Portfolio(8) | 131 | Various | Oct. 2021 | Various | 34,939 sq. ft. | 99% | ||||||||||||||||||||||||||||||||
| Tempe Industrial Center | 1 | Tempe, AZ | Oct. 2021 | 100% | 175 sq. ft. | 100% | ||||||||||||||||||||||||||||||||
| Procyon Distribution Center Industrial | 1 | Las Vegas, NV | Oct. 2021 | 100% | 122 sq. ft. | 100% | ||||||||||||||||||||||||||||||||
| Northborough Industrial Portfolio | 2 | Marlborough, MA | Oct. 2021 | 100% | 600 sq. ft. | 100% | ||||||||||||||||||||||||||||||||
Coldplay Logistics Portfolio(7) | 17 | Various Germany | Oct. 2021 | 10% | 1,546 sq. ft. | N/A | ||||||||||||||||||||||||||||||||
| Canyon 2.0 Industrial Portfolio | 102 | Various | Nov. 2021 | 99% | 15,022 sq. ft. | 97% | ||||||||||||||||||||||||||||||||
| Tropical Sloane Las Vegas Industrial | 1 | Las Vegas, NV | Nov. 2021 | 100% | 171 sq. ft. | 100% | ||||||||||||||||||||||||||||||||
Explorer Industrial Portfolio(7) | 326 | Various | Nov. 2021 | 12% | 67,542 sq. ft. | N/A | ||||||||||||||||||||||||||||||||
Evergreen Industrial Portfolio(7) | 12 | Various Europe | Dec. 2021 | 10% | 6,005 sq. ft. | N/A | ||||||||||||||||||||||||||||||||
| Maplewood Industrial | 14 | Various | Dec. 2021 | 100% | 3,169 sq. ft. | 98% | ||||||||||||||||||||||||||||||||
| Meadowland Industrial Portfolio | 3 | Las Vegas, NV | Dec. 2021 | 100% | 1,138 sq. ft. | 100% | ||||||||||||||||||||||||||||||||
| Bulldog Industrial Portfolio | 7 | Suwanee, GA | Dec. 2021 | 100% | 512 sq. ft. | 98% | ||||||||||||||||||||||||||||||||
| SLC NW Commerce Industrial | 3 | Salt Lake City, UT | Dec. 2021 | 100% | 529 sq. ft. | 100% | ||||||||||||||||||||||||||||||||
Bluefin Industrial Portfolio(7) | 68 | Various | Dec. 2021 | 23% | 10,140 sq. ft. | N/A | ||||||||||||||||||||||||||||||||
| 73 Business Center Industrial Portfolio | 1 | Greensboro, NC | Dec. 2021 | 100% | 218 sq. ft. | 100% | ||||||||||||||||||||||||||||||||
| Amhurst Industrial Portfolio | 8 | Waukegan, IL | March 2022 | 100% | 1,280 sq. ft. | 84% | ||||||||||||||||||||||||||||||||
| Shoals Logistics Center Industrial | 1 | Austell, GA | April 2022 | 100% | 254 sq. ft. | N/A | ||||||||||||||||||||||||||||||||
| Durham Commerce Center Industrial | 1 | Durham, NC | April 2022 | 100% | 132 sq. ft. | 100% | ||||||||||||||||||||||||||||||||
Mileway Industrial Portfolio(7) | 1,613 | Various Europe | Various | 15% | 146,958 sq. ft. | N/A | ||||||||||||||||||||||||||||||||
| Total Industrial | 3,209 | 439,092 sq. ft. | ||||||||||||||||||||||||||||||||||||
| Net Lease: | ||||||||||||||||||||||||||||||||||||||
| Bellagio Net Lease | 1 | Las Vegas, NV | Nov. 2019 | 49% | 8,507 sq. ft. | 100% | ||||||||||||||||||||||||||||||||
| Cosmopolitan Net Lease | 1 | Las Vegas, NV | May 2022 | 80% | 6,902 sq. ft. | 100% | ||||||||||||||||||||||||||||||||
| Total Net Lease | 2 | 15,409 sq. ft. | ||||||||||||||||||||||||||||||||||||
113
| Segment and Investment | Number of Properties(1) | Location | Acquisition Date | Ownership Interest(2) | Sq. Feet (in thousands)/Units/Keys(1) | Occupancy Rate(3) | ||||||||||||||||||||||||||||||||
| Data Centers: | ||||||||||||||||||||||||||||||||||||||
| D.C. Powered Shell Warehouse Portfolio | 9 | Ashburn & Manassas, VA | June & Dec. 2019 | 90% | 1,471 sq. ft. | 100% | ||||||||||||||||||||||||||||||||
| Highpoint Powered Shell Portfolio | 2 | Sterling, VA | June 2021 | 100% | 430 sq. ft. | 100% | ||||||||||||||||||||||||||||||||
QTS Data Centers(7) | 89 | Various | Aug. 2021 | 33.5% | 7,253 sq. ft. | N/A | ||||||||||||||||||||||||||||||||
| Atlantic Powered Shell Portfolio | 3 | Sterling, VA | April 2022 | 100% | 792 sq. ft. | 100% | ||||||||||||||||||||||||||||||||
Phoenix Tower International(9) | N/A | Various | May 2022 | 8.8% | N/A | N/A | ||||||||||||||||||||||||||||||||
| Total Data Centers | 103 | 9,946 sq. ft. | ||||||||||||||||||||||||||||||||||||
| Retail: | ||||||||||||||||||||||||||||||||||||||
| Bakers Centre | 1 | Philadelphia, PA | March 2017 | 100% | 238 sq. ft. | 100% | ||||||||||||||||||||||||||||||||
| Plaza Del Sol Retail | 1 | Burbank, CA | Oct. 2017 | 100% | 166 sq. ft. | 93% | ||||||||||||||||||||||||||||||||
| Vista Center | 1 | Miami, FL | Aug. 2018 | 100% | 89 sq. ft. | 98% | ||||||||||||||||||||||||||||||||
| El Paseo Simi Valley | 1 | Simi Valley, CA | June 2019 | 100% | 197 sq. ft. | 93% | ||||||||||||||||||||||||||||||||
| Towne Center East | 1 | Signal Hill, CA | Sept. 2019 | 100% | 163 sq. ft. | 99% | ||||||||||||||||||||||||||||||||
| Plaza Pacoima | 1 | Pacoima, CA | Oct. 2019 | 100% | 204 sq. ft. | 100% | ||||||||||||||||||||||||||||||||
| Canarsie Plaza | 1 | Brooklyn, NY | Dec. 2019 | 100% | 274 sq. ft. | 98% | ||||||||||||||||||||||||||||||||
| SoCal Grocery Portfolio | 6 | Various | Jan. 2020 | 100% | 685 sq. ft. | 97% | ||||||||||||||||||||||||||||||||
| Northeast Tower Center | 1 | Philadelphia, PA | Aug. 2021 | 100% | 301 sq. ft. | 100% | ||||||||||||||||||||||||||||||||
Southeast Retail Portfolio(7) | 6 | Various | Oct. 2021 | 50% | 1,229 sq. ft. | N/A | ||||||||||||||||||||||||||||||||
| Bingo Retail Portfolio | 12 | Various | Dec. 2021 | 100% | 2,150 sq. ft. | 95% | ||||||||||||||||||||||||||||||||
Pike Retail Portfolio(4)(10) | 47 | Various | June 2022 | Various | 5,056 sq. ft. | 94% | ||||||||||||||||||||||||||||||||
| Total Retail | 79 | 10,752 sq. ft. | ||||||||||||||||||||||||||||||||||||
| Office: | ||||||||||||||||||||||||||||||||||||||
| EmeryTech Office | 1 | Emeryville, CA | Oct. 2019 | 100% | 228 sq. ft. | 95% | ||||||||||||||||||||||||||||||||
| Coleman Highline Office | 1 | San Jose, CA | Oct. 2020 | 100% | 357 sq. ft. | 100% | ||||||||||||||||||||||||||||||||
| Atlanta Tech Center Office | 1 | Atlanta, GA | May 2021 | 100% | 361 sq. ft. | 100% | ||||||||||||||||||||||||||||||||
| Atlantic Complex Office | 3 | Toronto, Canada | Nov. 2021 | 97% | 259 sq. ft. | 99% | ||||||||||||||||||||||||||||||||
One Manhattan West(7) | 1 | New York, NY | March 2022 | 49% | 2,081 sq. ft. | N/A | ||||||||||||||||||||||||||||||||
| One Culver Office | 1 | Culver City, CA | March 2022 | 90% | 373 sq. ft. | 100% | ||||||||||||||||||||||||||||||||
| Montreal Office Portfolio | 2 | Various | March 2022 | 98% | 412 sq. ft. | 95% | ||||||||||||||||||||||||||||||||
| Atlanta Tech Center 2.0 Office | 1 | Atlanta, GA | June 2022 | 100% | 318 sq. ft. | 100% | ||||||||||||||||||||||||||||||||
Pike Office Portfolio(4) | 2 | Various | June 2022 | 100% | 258 sq. ft. | 100% | ||||||||||||||||||||||||||||||||
| Adare Office | 1 | Dublin, Ireland | Aug. 2022 | 75% | 517 sq. ft. | 100% | ||||||||||||||||||||||||||||||||
| Total Office | 14 | 5,164 sq. ft. | ||||||||||||||||||||||||||||||||||||
| Hospitality: | ||||||||||||||||||||||||||||||||||||||
| Hyatt Place UC Davis | 1 | Davis, CA | Jan. 2017 | 100% | 127 keys | 71% | ||||||||||||||||||||||||||||||||
| Hyatt Place San Jose Downtown | 1 | San Jose, CA | June 2017 | 100% | 240 keys | 59% | ||||||||||||||||||||||||||||||||
| Florida Select-Service 4-Pack | 1 | Tampa, FL | July 2017 | 100% | 113 keys | 78% | ||||||||||||||||||||||||||||||||
| Hyatt House Downtown Atlanta | 1 | Atlanta, GA | Aug. 2017 | 100% | 150 keys | 67% | ||||||||||||||||||||||||||||||||
| Boston/Worcester Select-Service 3-Pack | 3 | Boston & Worcester, MA | Oct. 2017 | 100% | 374 keys | 77% | ||||||||||||||||||||||||||||||||
| Henderson Select-Service 2-Pack | 2 | Henderson, NV | May 2018 | 100% | 228 keys | 82% | ||||||||||||||||||||||||||||||||
| Orlando Select-Service 2-Pack | 2 | Orlando, FL | May 2018 | 100% | 254 keys | 87% | ||||||||||||||||||||||||||||||||
| Corporex Select Service Portfolio | 2 | Various | Aug. 2018 | 100% | 225 keys | 80% | ||||||||||||||||||||||||||||||||
| Hampton Inn & Suites Federal Way | 1 | Seattle, WA | Oct. 2018 | 100% | 142 keys | 72% | ||||||||||||||||||||||||||||||||
| Courtyard Kona | 1 | Kailua-Kona, HI | March 2019 | 100% | 455 keys | 80% | ||||||||||||||||||||||||||||||||
| Raven Select Service Portfolio | 14 | Various | June 2019 | 100% | 1,649 keys | 75% | ||||||||||||||||||||||||||||||||
| Urban 2-Pack | 1 | Chicago, IL | July 2019 | 100% | 337 keys | 69% | ||||||||||||||||||||||||||||||||
| Hyatt Regency Atlanta | 1 | Atlanta, GA | Sept. 2019 | 100% | 1,260 keys | 66% | ||||||||||||||||||||||||||||||||
| RHW Select Service Portfolio | 6 | Various | Nov. 2019 | 100% | 557 keys | 73% | ||||||||||||||||||||||||||||||||
| Key West Select Service Portfolio | 4 | Key West, FL | Oct. 2021 | 100% | 519 keys | 85% | ||||||||||||||||||||||||||||||||
| Sunbelt Select Service Portfolio | 3 | Various | Dec. 2021 | 100% | 716 keys | 72% | ||||||||||||||||||||||||||||||||
| HGI Austin University Select Service | 1 | Austin, TX | Dec. 2021 | 100% | 214 keys | 67% | ||||||||||||||||||||||||||||||||
Sleep Extended Stay Hotel Portfolio(7) | 196 | Various | July 2022 | 30% | 24,937 keys | N/A | ||||||||||||||||||||||||||||||||
| Halo Select Service Portfolio | 7 | Various | Aug. & Oct. 2022 | 100% | 1,403 keys | 72% | ||||||||||||||||||||||||||||||||
| Total Hospitality | 248 | 33,900 keys | ||||||||||||||||||||||||||||||||||||
| Self Storage: | ||||||||||||||||||||||||||||||||||||||
| East Coast Storage Portfolio | 21 | Various | Aug. 2019 | 98% | 1,320 sq. ft. | 88% | ||||||||||||||||||||||||||||||||
| Phoenix Storage 2-Pack | 2 | Phoenix, AZ | March 2020 | 98% | 111 sq. ft. | 85% | ||||||||||||||||||||||||||||||||
| Cactus Storage Portfolio | 18 | Various | Sept. & Oct. 2020 | 98% | 1,109 sq. ft. | 86% | ||||||||||||||||||||||||||||||||
114
| Segment and Investment | Number of Properties(1) | Location | Acquisition Date | Ownership Interest(2) | Sq. Feet (in thousands)/Units/Keys(1) | Occupancy Rate(3) | ||||||||||||||||||||||||||||||||
| Caltex Storage Portfolio | 4 | Various | Nov. & Dec. 2020 | 98% | 243 sq. ft. | 89% | ||||||||||||||||||||||||||||||||
| Florida Self Storage Portfolio | 2 | Cocoa & Rockledge, FL | Dec. 2020 | 98% | 157 sq. ft. | 88% | ||||||||||||||||||||||||||||||||
| Pace Storage Portfolio | 1 | Pace, FL | Dec. 2020 | 98% | 71 sq. ft. | 89% | ||||||||||||||||||||||||||||||||
| Flamingo Self Storage Portfolio | 6 | Various | Various | 98% | 399 sq. ft. | 84% | ||||||||||||||||||||||||||||||||
| Alpaca Self Storage Portfolio | 26 | Various | April 2022 | 98% | 1,813 sq. ft. | 85% | ||||||||||||||||||||||||||||||||
| Total Self Storage | 80 | 5,223 sq. ft. | ||||||||||||||||||||||||||||||||||||
| Total Investments in Real Estate | 4,834 | |||||||||||||||||||||||||||||||||||||
(1)Rental Housing includes multifamily and other types of rental housing such as manufactured, student, affordable, and single family rental housing, as well as senior living. Rental Housing units include multifamily units, affordable housing units, manufactured housing sites, student housing units, single family rental homes and senior living units. Single family rental homes are accounted for in rental housing units and are not reflected in the number of properties.
(2)Certain of our joint venture agreements provide the seller or the other partner a profits interest based on achieving certain internal rate of return hurdles. Such investments are consolidated by us and any profits interest due to the other partners is reported within non-controlling interests. The table above also includes properties owned by unconsolidated entities.
(3)For our industrial, net lease, data centers, retail and office investments, occupancy includes all leased square footage as of December 31, 2023. For our multifamily, student housing and affordable housing investments, occupancy is defined as the percentage of actual rent divided by gross potential rent (defined as actual rent for occupied units and market rent for vacant units) for the three months ended December 31, 2023. For our single family rental housing investments, the occupancy rate includes occupied homes for the three months ended December 31, 2023. For our self storage, manufactured housing and senior living investments, the occupancy rate includes occupied square footage, occupied sites and occupied units, respectively, as of December 31, 2023. The average occupancy rate for our hospitality investments includes paid occupied rooms for the 12 months ended December 31, 2023. Hospitality investments owned less than 12 months are excluded from the average occupancy rate calculation. Unconsolidated investments are excluded from occupancy rate calculations.
(4)Represents acquisition of Preferred Apartment Communities (“PAC”).
(5)Includes a 100% interest in 17,666 consolidated single family rental homes, a 44% interest in 8,873 unconsolidated single family rental homes, and a 12% interest in 1,785 unconsolidated single family rental homes.
(6)Includes various ownership interests in 453 consolidated affordable housing units and 31 unconsolidated affordable housing units.
(7)Investment is unconsolidated.
(8)Includes various ownership interests in 105 consolidated industrial properties and 26 unconsolidated industrial properties.
(9)Consists of an unconsolidated joint venture formed by the Company and certain Blackstone-managed investment vehicles invested in a wireless tower business.
(10)Includes 46 wholly-owned retail properties and a 50% interest in one unconsolidated retail property.
115
Lease Expirations
The following schedule details the expiring leases at our consolidated industrial, net lease, data centers, retail, and office properties by annualized base rent and square footage as of December 31, 2023 ($ and square feet data in thousands). The table below excludes our rental housing and self-storage properties as substantially all leases at such properties expire within 12 months:
| Year | Number of Expiring Leases | Annualized Base Rent(1) | % of Total Annualized Base Rent Expiring | Square Feet | % of Total Square Feet Expiring | |||||||||||||||||||||||||||
| 2024 | 744 | $ | 162,703 | 9% | 25,877 | 13% | ||||||||||||||||||||||||||
| 2025 | 691 | 151,286 | 8% | 22,272 | 11% | |||||||||||||||||||||||||||
| 2026 | 731 | 215,116 | 12% | 35,777 | 18% | |||||||||||||||||||||||||||
| 2027 | 709 | 214,336 | 11% | 30,710 | 15% | |||||||||||||||||||||||||||
| 2028 | 642 | 219,247 | 12% | 31,848 | 16% | |||||||||||||||||||||||||||
| 2029 | 275 | 126,906 | 7% | 16,165 | 8% | |||||||||||||||||||||||||||
| 2030 | 138 | 115,153 | 6% | 12,987 | 6% | |||||||||||||||||||||||||||
| 2031 | 97 | 34,219 | 2% | 4,309 | 2% | |||||||||||||||||||||||||||
| 2032 | 65 | 44,594 | 2% | 3,725 | 2% | |||||||||||||||||||||||||||
| 2033 | 71 | 31,997 | 2% | 1,845 | 1% | |||||||||||||||||||||||||||
| Thereafter | 135 | 544,608 | 29% | 14,947 | 8% | |||||||||||||||||||||||||||
| Total | 4,298 | $ | 1,860,165 | 100% | 200,462 | 100% | ||||||||||||||||||||||||||
(1)Annualized base rent is determined from the annualized base rent per leased square foot as of December 31, 2023 and excludes tenant recoveries, straight-line rent, and above-market and below-market lease amortization.
116
Investments in Real Estate Debt
The following charts further describe the diversification of our investments in real estate debt by credit rating and collateral type, based on fair value as of December 31, 2023:
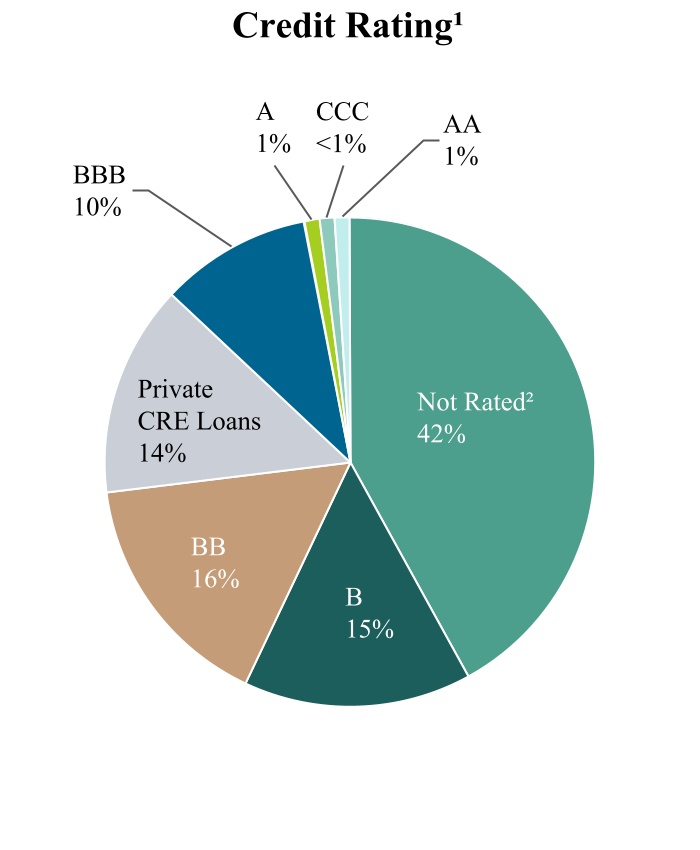
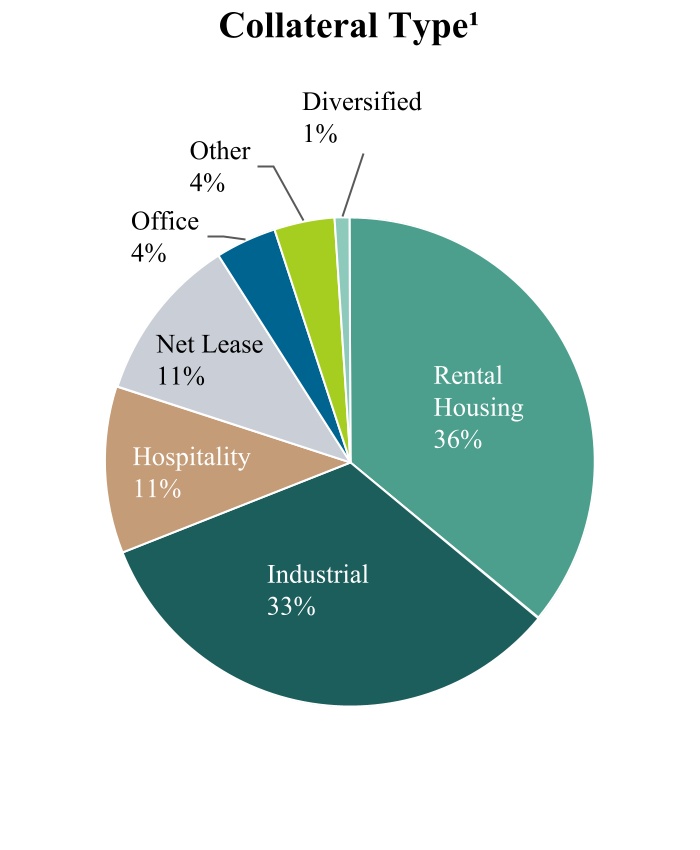
(1)Includes our investments in CMBS, RMBS, mortgage loans, and other debt secured by real estate assets, and excludes the impact of consolidating the loans that serve as collateral for certain of our debt securities on our Consolidated GAAP Balance Sheets.
(2)Not rated positions have a weighted-average LTV at origination of 64%, are primarily composed of 46% industrial and 49% rental housing assets, and include interest-only securities with a fair value of $25.3 million.
117
The following table details our investments in real estate debt as of December 31, 2023 ($ in thousands):
| December 31, 2023 | ||||||||||||||||||||||||||||||||
Type of Security/Loan(1) | Weighted Average Coupon(2) | Weighted Average Maturity Date(3) | Face Amount | Cost Basis | Fair Value | |||||||||||||||||||||||||||
CMBS(4) | +4.0% | 7/12/2033 | $ | 7,057,695 | $ | 6,960,973 | $ | 6,487,805 | ||||||||||||||||||||||||
| RMBS | 4.2% | 3/11/2060 | 294,493 | 285,059 | 214,124 | |||||||||||||||||||||||||||
| Corporate bonds | 5.0% | 7/9/2031 | 92,312 | 94,068 | 84,744 | |||||||||||||||||||||||||||
| Total real estate securities | 8.9% | 5/6/2034 | 7,444,500 | 7,340,100 | 6,786,673 | |||||||||||||||||||||||||||
| Commercial real estate loans | +5.9% | 10/12/2026 | 1,208,030 | 1,200,548 | 1,196,640 | |||||||||||||||||||||||||||
Other investments(5)(6) | 5.7% | 9/21/2029 | 392,226 | 367,730 | 361,751 | |||||||||||||||||||||||||||
| Total investments in real estate debt | 8.9% | 1/22/2033 | $ | 9,044,756 | $ | 8,908,378 | $ | 8,345,064 | ||||||||||||||||||||||||
(1)Includes our investments in CMBS, RMBS, mortgage loans, and other debt secured by real estate assets, and exclude the impact of consolidating the loans that serve as collateral for certain of our debt securities on our Consolidated GAAP Balance Sheets.
(2)The symbol “+” refers to the relevant floating benchmark rates, which include SOFR, SONIA, and EURIBOR, as applicable to each security and loan. Fixed rate CMBS and commercial real estate loans are reflected as a spread over the relevant floating benchmark rates as of December 31, 2023 for purposes of the weighted-averages. Weighted average coupon for CMBS does not include zero-coupon securities. As of December 31, 2023, we have interest rate swaps outstanding with a notional value of $0.6 billion that effectively convert a portion of our fixed rate investments in real estate debt to floating rates. Total weighted average coupon does not include the impact of such interest rate swaps or other derivatives.
(3)Weighted average maturity date is based on the fully extended maturity date of the instrument.
(4)Face amount excludes interest-only securities with a notional amount of $4.2 billion as of December 31, 2023. In addition, CMBS includes zero-coupon securities of $0.4 billion as of December 31, 2023.
(5)Includes interests in unconsolidated joint ventures that hold investments in real estate debt.
(6)Weighted average coupon rate and weighted average maturity date exclude our investment in a joint venture with the FDIC.
118
Results of Operations
The following table sets forth information regarding our consolidated results of operations for the years ended December 31, 2023 and 2022 ($ in thousands, except per share data):
| Year Ended December 31, | Change | ||||||||||||||||
| 2023 | 2022 | $ | |||||||||||||||
| Revenues | |||||||||||||||||
| Rental revenue | $ | 7,816,240 | $ | 6,564,119 | $ | 1,252,121 | |||||||||||
| Hospitality revenue | 694,491 | 721,654 | (27,163) | ||||||||||||||
| Other revenue | 423,674 | 360,605 | 63,069 | ||||||||||||||
| Total revenues | 8,934,405 | 7,646,378 | 1,288,027 | ||||||||||||||
| Expenses | |||||||||||||||||
| Rental property operating | 3,652,121 | 2,916,936 | 735,185 | ||||||||||||||
| Hospitality operating | 479,493 | 508,868 | (29,375) | ||||||||||||||
| General and administrative | 69,176 | 52,652 | 16,524 | ||||||||||||||
| Management fee | 839,237 | 837,687 | 1,550 | ||||||||||||||
| Performance participation allocation | — | 742,670 | (742,670) | ||||||||||||||
| Impairment of investments in real estate | 236,071 | 33,554 | 202,517 | ||||||||||||||
| Depreciation and amortization | 3,811,218 | 4,098,366 | (287,148) | ||||||||||||||
| Total expenses | 9,087,316 | 9,190,733 | (103,417) | ||||||||||||||
| Other income (expense) | |||||||||||||||||
| Income from unconsolidated entities | 119,941 | 182,249 | (62,308) | ||||||||||||||
| Income (loss) from investments in real estate debt | 798,164 | (167,083) | 965,247 | ||||||||||||||
| Change in net assets of consolidated securitization vehicles | 191,703 | (42,119) | 233,822 | ||||||||||||||
(Loss) income from interest rate derivatives | (755,519) | 2,566,720 | (3,322,239) | ||||||||||||||
| Net gain on dispositions of real estate | 1,935,021 | 808,846 | 1,126,175 | ||||||||||||||
| Interest expense, net | (3,072,741) | (2,307,515) | (765,226) | ||||||||||||||
| Loss on extinguishment of debt | (40,300) | (11,476) | (28,824) | ||||||||||||||
| Other expense | (3,319) | (565,575) | 562,256 | ||||||||||||||
Total other income (expense) | (827,050) | 464,047 | (1,291,097) | ||||||||||||||
Net loss | $ | (979,961) | $ | (1,080,308) | $ | 100,347 | |||||||||||
| Net loss attributable to non-controlling interests in third party joint ventures | $ | 247,989 | $ | 173,109 | $ | 74,880 | |||||||||||
Net loss attributable to non-controlling interests in BREIT OP | 40,150 | 23,680 | 16,470 | ||||||||||||||
Net loss attributable to BREIT stockholders | $ | (691,822) | $ | (883,519) | $ | 191,697 | |||||||||||
Net loss per share of common stock — basic and diluted | $ | (0.16) | $ | (0.20) | $ | 0.04 | |||||||||||
Rental Revenue
During the year ended December 31, 2023, rental revenue increased $1.3 billion as compared to the year ended December 31, 2022. The increase can primarily be attributed to a $276.4 million increase in same property revenues and a $1.0 billion increase in non-same property revenues due to the real estate acquisitions, offset by dispositions, we made from January 1, 2022 to December 31, 2023. See Same Property Results of Operations section for further details of the increase in same property revenues.
Hospitality Revenue
During the year ended December 31, 2023, hospitality revenue decreased $27.2 million as compared to the year ended December 31, 2022. The decrease can primarily be attributed to a $57.4 million decrease in non-same property revenues due to the real estate dispositions we made from January 1, 2022 to December 31, 2023, partially offset by a $30.2 million increase in same property revenues. See Same Property Results of Operations section for further details of the increase in same property revenues.
Other Revenue
During the year ended December 31, 2023, other revenue increased $63.1 million as compared to the year ended December 31, 2022. The increase can primarily be attributed to a $19.3 million increase in same property revenues and a $43.8 million increase in non-same property revenues due to the real estate acquisitions, offset by dispositions, we made from January 1, 2022 to December 31, 2023. See Same Property Results of Operations section for further details of the increase in same property revenues.
119
Rental Property Operating Expenses
During the year ended December 31, 2023, rental property operating expenses increased $735.2 million as compared to the year ended December 31, 2022. The increase can primarily be attributed to a $114.3 million increase in same property operating expenses and a $620.9 million increase in non-same property operating expenses due to the real estate acquisitions, offset by dispositions, we made from January 1, 2022 to December 31, 2023. See Same Property Results of Operations section for further details of the increase in same property operating expenses.
Hospitality Operating Expenses
During the year ended December 31, 2023, hospitality operating expenses decreased $29.4 million as compared to the year ended December 31, 2022. The decrease can primarily be attributed to a $56.7 million decrease in non-same property expenses due to the real estate dispositions we made from January 1, 2022 to December 31, 2023, partially offset by a $27.3 million increase in same property operating expenses. See Same Property Results of Operations section for further details of the increase in same property hospitality operating expenses.
General and Administrative expenses
During the year ended December 31, 2023, general and administrative expenses increased $16.5 million compared to the year ended December 31, 2022. The increase was due to an increase in various corporate level expenses during the year ended December 31, 2023 as compared to the year ended December 31, 2022.
Management Fee
During the year ended December 31, 2023, the management fee increased $1.6 million compared to the year ended December 31, 2022. The increase was due to a higher average NAV during the year ended December 31, 2023 as compared to the year ended December 31, 2022.
Performance Participation Allocation
During the year ended December 31, 2023, the performance participation allocation expense decreased $742.7 million compared to the year ended December 31, 2022. The decrease was primarily the result of a lower total return for the year ended December 31, 2023 compared to the year ended December 31, 2022.
Impairment of Investments in Real Estate
During the year ended December 31, 2023, impairments of investments in real estate increased $202.5 million compared to the year ended December 31, 2022. The increase was primarily due to recognizing an aggregate $204.8 million of impairment during the year ended December 31, 2023 related to one office property, two student housing properties, 25 affordable housing properties, and various single family rental homes, as a result of updates to the undiscounted cash flow assumptions to account for a shorter hold period, as we are considering a potential disposition of these investments in the near term.
Depreciation and Amortization
During the year ended December 31, 2023, depreciation and amortization decreased $287.1 million compared to the year ended December 31, 2022. The decrease was primarily driven by the impact of disposition activity from January 1, 2022 through December 31, 2023 and the full amortization of certain intangible assets.
Income from Unconsolidated Entities
During the year ended December 31, 2023, income from unconsolidated entities decreased $62.3 million compared to the year ended December 31, 2022. The decrease was primarily attributable to a decrease of $384.4 million of change in the fair value of unconsolidated entities carried at fair value and a decrease of $110.8 million of income from unconsolidated entities, partially offset by an increase of $432.9 million due to a net realized gain on the sale of our interests in unconsolidated entities.
120
Income (Loss) from Investments in Real Estate Debt
During the year ended December 31, 2023, income from investments in real estate debt increased $1.0 billion compared to the year ended December 31, 2022. For the year ended December 31, 2023, we had net unrealized/realized gains on our investments in real estate debt of $118.5 million and for the year ended December 31, 2022, we had net unrealized/realized losses on our investments in real estate debt of $745.3 million. Additionally, net interest income increased $101.4 million during the year ended December 31, 2023 compared to the year ended December 31, 2022 due to the impact of an increase in floating rates on our investments in real estate debt.
Change in Net Assets of Consolidated Securitization Vehicles
During the year ended December 31, 2023, the change in net assets of consolidated securitization vehicles increased $233.8 million compared to the year ended December 31, 2022. The increase was primarily attributable to an increase of $198.4 million in net unrealized/realized gains and an increase of $35.4 million in interest income due to the impact of an increase in floating rates on our net investments in these securitization vehicles.
(Loss) Income from Interest Rate Derivatives
During the year ended December 31, 2023, income from interest rate derivatives decreased $3.3 billion compared to the year ended December 31, 2022. The decrease was attributable to a decrease in the fair value of derivatives.
Net Gain on Dispositions of Real Estate
During the year ended December 31, 2023, net gain on dispositions of real estate increased $1.1 billion compared to the year ended December 31, 2022. During the year ended December 31, 2023, we recorded $1.9 billion of net gains from the sale of 139 rental housing properties, 128 self storage properties, 19 hospitality properties, 14 industrial properties, five retail properties and one office property. During the year ended December 31, 2022, we recorded $808.8 million of net gain from the disposition of 64 industrial properties, 55 rental housing properties, 7 self storage properties and 2 hospitality properties. The number of properties excludes single family rental homes sold.
Interest Expense, Net
During the year ended December 31, 2023, net interest expense increased $765.2 million compared to the year ended December 31, 2022. The increase was primarily due to the incremental financing we obtained in connection with new investments as well as an increase in floating interest rates.
Other Expense
During the year ended December 31, 2023, other expense decreased $562.3 million compared to the year ended December 31, 2022. For the year ended ended December 31, 2023, we had net unrealized/realized gains on our investments in equity securities of $37.9 million and for the year ended December 31, 2022, we had net unrealized/realized losses on our investments in equity securities of $520.8 million.
Refer to Part II, Item 7. Management’s Discussion and Analysis of Financial Condition and Results of Operations in our Annual Report on Form 10-K for the year ended December 31, 2022 for discussion of our consolidated results of operations for the year ended December 31, 2022 compared to the year ended December 31, 2021, which specific discussion is incorporated herein by reference.
121
Same Property Results of Operations
Net Operating Income (“NOI”) is a supplemental non-GAAP measure of our property operating results that we believe is meaningful because it enables management to evaluate the impact of occupancy, rents, leasing activity, and other controllable property operating results at our real estate. We define NOI as operating revenues less operating expenses, which exclude (i) impairment of investments in real estate, (ii) depreciation and amortization, (iii) straight-line rental income and expense, (iv) amortization of above- and below-market lease intangibles, (v) amortization of accumulated unrealized gains on derivatives previously recognized in other comprehensive income, (vi) lease termination fees, (vii) property expenses not core to the operations of such properties, and (viii) other non-property related revenue and expense items such as (a) general and administrative expenses, (b) management fee, (c) performance participation allocation, (d) incentive compensation awards, (e) income (loss) from investments in real estate debt, (f) change in net assets of consolidated securitization vehicles, (g) income from interest rate derivatives, (h) net gain (loss) on dispositions of real estate, (i) interest expense, net, (j) gain (loss) on extinguishment of debt, (k) other income (expense), and (l) similar adjustments for NOI attributable to non-controlling interests and unconsolidated entities.
We evaluate our consolidated results of operations on a same property basis, which allows us to analyze our property operating results excluding acquisitions and dispositions during the periods under comparison. Properties in our portfolio are considered same property if they were owned for the full periods presented, otherwise they are considered non-same property. Recently developed properties are not included in same property results until the properties have achieved stabilization for both full periods presented. We define stabilization for the property as the earlier of (i) achieving 90% occupancy or (ii) 12 months after receiving a certificate of occupancy. Certain assets are excluded from same property results and are considered non-same property, including (i) properties held-for-sale, (ii) properties that are being redeveloped, (iii) properties identified for future sale, and (iv) interests in unconsolidated entities under contract for sale with hard deposit or other factors ensuring the buyer’s performance. We do not consider our investments in the real estate debt segment or equity securities to be same property.
Same property NOI assists in eliminating disparities in net income due to the acquisition, disposition, development, or redevelopment of properties during the periods presented, and therefore we believe it provides a meaningful performance measure for the comparison of the operating performance of our properties, which we believe is useful to investors. Our same property NOI may not be comparable to that of other companies and should not be considered to be more relevant or accurate in evaluating our operating performance than our GAAP net income (loss).
122
For the years ended December 31, 2023 and December 31, 2022, our same property portfolio consisted of 782 rental housing, 1,518 industrial, one net lease, 15 data centers, 45 hotel, 54 self storage, 32 retail, and six office properties. The following table reconciles GAAP net loss to same property NOI for the year ended December 31, 2023 and 2022 ($ in thousands):
| Year Ended December 31, | Change | ||||||||||||||||
| 2023 | 2022 | $ | |||||||||||||||
Net loss | $ | (979,961) | $ | (1,080,308) | $ | 100,347 | |||||||||||
| Adjustments to reconcile to same property NOI | |||||||||||||||||
| General and administrative | 69,176 | 52,652 | 16,524 | ||||||||||||||
| Management fee | 839,237 | 837,687 | 1,550 | ||||||||||||||
| Performance participation allocation | — | 742,670 | (742,670) | ||||||||||||||
| Impairment of investments in real estate | 236,071 | 33,554 | 202,517 | ||||||||||||||
| Depreciation and amortization | 3,811,218 | 4,098,366 | (287,148) | ||||||||||||||
| Income from unconsolidated entities | (119,941) | (182,249) | 62,308 | ||||||||||||||
| (Income) loss from investments in real estate debt | (798,164) | 167,083 | (965,247) | ||||||||||||||
| Change in net assets of consolidated securitization vehicles | (191,703) | 42,119 | (233,822) | ||||||||||||||
| Loss (income) from interest rate derivatives | 755,519 | (2,566,720) | 3,322,239 | ||||||||||||||
| Net gain on dispositions of real estate | (1,935,021) | (808,846) | (1,126,175) | ||||||||||||||
| Interest expense, net | 3,072,741 | 2,307,515 | 765,226 | ||||||||||||||
| Loss on extinguishment of debt | 40,300 | 11,476 | 28,824 | ||||||||||||||
| Other expense | 3,319 | 565,575 | (562,256) | ||||||||||||||
| Non-core property expenses | 643,681 | 507,945 | 135,736 | ||||||||||||||
Incentive compensation awards(1) | 55,113 | 33,807 | 21,306 | ||||||||||||||
| Lease termination fees | (5,109) | (6,310) | 1,201 | ||||||||||||||
| Amortization of above- and below-market lease intangibles | (62,670) | (60,738) | (1,932) | ||||||||||||||
| Straight-line rental income and expense | (171,849) | (183,301) | 11,452 | ||||||||||||||
| NOI from unconsolidated entities | 810,923 | 730,228 | 80,695 | ||||||||||||||
| NOI attributable to non-controlling interests in third party joint ventures | (447,230) | (162,911) | (284,319) | ||||||||||||||
| NOI attributable to BREIT stockholders | 5,625,650 | 5,079,294 | 546,356 | ||||||||||||||
| Less: Non-same property NOI attributable to BREIT stockholders | 2,194,005 | 1,837,097 | 356,908 | ||||||||||||||
| Same property NOI attributable to BREIT stockholders | $ | 3,431,645 | $ | 3,242,197 | $ | 189,448 | |||||||||||
(1) Included in rental property operating and hospitality operating expense on our Consolidated Statements of Operations.
The following table details the components of same property NOI for the years ended December 31, 2023 and 2022 ($ in thousands):
| Year Ended December 31, | Change | ||||||||||||||||||||||
| 2023 | 2022 | $ | % | ||||||||||||||||||||
| Same property NOI | |||||||||||||||||||||||
| Rental revenue | $ | 4,741,269 | $ | 4,464,888 | $ | 276,381 | 6% | ||||||||||||||||
| Hospitality revenue | 453,870 | 423,675 | 30,195 | 7% | |||||||||||||||||||
| Other revenue | 174,289 | 155,011 | 19,278 | 12% | |||||||||||||||||||
| Total revenues | 5,369,428 | 5,043,574 | 325,854 | 6% | |||||||||||||||||||
| Rental property operating | 1,729,401 | 1,615,128 | 114,273 | 7% | |||||||||||||||||||
| Hospitality operating | 304,302 | 277,040 | 27,262 | 10% | |||||||||||||||||||
| Total expenses | 2,033,703 | 1,892,168 | 141,535 | 7% | |||||||||||||||||||
| Same property NOI attributable to non-controlling interests in third party joint ventures | (164,213) | (159,533) | (4,680) | 3% | |||||||||||||||||||
| Consolidated same property NOI attributable to BREIT stockholders | 3,171,512 | 2,991,873 | 179,639 | 6% | |||||||||||||||||||
| Same property NOI from unconsolidated entities | 260,133 | 250,324 | 9,809 | 4% | |||||||||||||||||||
| Same property NOI attributable to BREIT stockholders | $ | 3,431,645 | $ | 3,242,197 | $ | 189,448 | 6% | ||||||||||||||||
123
Same Property – Rental Revenue
Same property rental revenue increased $276.4 million for the year ended December 31, 2023 compared to the year ended December 31, 2022. The increase was due to a $214.5 million increase in base rental revenue, a $38.9 million increase in tenant reimbursement income as a result of higher operating expenses, and a $23.0 million decrease in bad debt reserves. Our bad debt reserve represents the amount of rental revenue we anticipate we will not be able to collect from our tenants.
The following table details the changes in base rental revenue period over period ($ in thousands):
| Year Ended December 31, | 2023 vs. 2022 | ||||||||||||||||||||||||||||
| Change in Base Rental Revenue | Change in Occupancy Rate | Change in Average Effective Annual Base Rent Per Leased Square Foot/Unit | |||||||||||||||||||||||||||
| 2023 | 2022 | ||||||||||||||||||||||||||||
| Rental Housing | $ | 2,862,770 | $ | 2,722,714 | $ | 140,056 | (1)% | +6% | |||||||||||||||||||||
| Industrial | 984,898 | 919,081 | 65,817 | (1)% | +8% | ||||||||||||||||||||||||
| Net Lease | 260,429 | 255,323 | 5,106 | —% | +2% | ||||||||||||||||||||||||
| Self Storage | 47,798 | 47,380 | 418 | (3)% | +4% | ||||||||||||||||||||||||
| Retail | 96,327 | 94,763 | 1,564 | —% | +1% | ||||||||||||||||||||||||
| Data Centers | 26,734 | 26,163 | 571 | —% | +2% | ||||||||||||||||||||||||
| Office | 43,033 | 42,038 | 995 | +1% | +1% | ||||||||||||||||||||||||
| Total base rental revenue | $ | 4,321,989 | $ | 4,107,462 | $ | 214,527 | |||||||||||||||||||||||
Same Property – Hospitality Revenue
Same property hospitality revenue increased $30.2 million for the year ended December 31, 2023 compared to the year ended December 31, 2022. ADR for the hotels in our same property portfolio increased to $185 from $181 while occupancy increased 4% and RevPAR increased to $137 from $128 during the year ended December 31, 2023 compared to the year ended December 31, 2022.
Same Property – Other Revenue
Same property other revenue increased $19.3 million for the year ended December 31, 2023 compared to the year ended December 31, 2022. The increase was primarily due to increased ancillary income at our rental housing and industrial properties during the year ended December 31, 2023.
Same Property – Rental Property Operating Expenses
Same property rental property operating expenses increased $114.3 million during the year ended December 31, 2023 compared to the year ended December 31, 2022. The increase in rental property operating expenses for the year ended December 31, 2023 was primarily the result of increased real estate taxes and general operating expenses at our rental housing properties.
Same Property – Hospitality Operating Expenses
Same property hospitality operating expenses increased $27.3 million during the year ended December 31, 2023 compared to the year ended December 31, 2022. The increase in hospitality operating expenses was primarily the result of increased operating expenses resulting from increased occupancy at our hotels during the year ended December 31, 2023.
124
Liquidity and Capital Resources
Liquidity
We believe we have sufficient liquidity to operate our business, with $8.1 billion of liquidity as of March 27, 2024. When we refer to our liquidity, this includes amounts available under our undrawn revolving credit facilities of $5.7 billion as well as unrestricted cash and cash equivalents of $2.4 billion. We also expect $0.1 billion of proceeds from dispositions under contract where we have received a non-refundable deposit as of March 27, 2024. We also generate incremental liquidity through our operating cash flows, which were $2.7 billion for the year ended December 31, 2023. In addition, we remain moderately leveraged (48% as of December 31, 2023) and can generate additional liquidity through incurring additional indebtedness secured by our real estate and real estate debt investments, unsecured financings, and other forms of indebtedness. We may also generate incremental liquidity through the sale of our real estate debt investments, which were carried at their estimated fair value of $8.3 billion as of December 31, 2023. Our leverage ratio is measured by dividing (i) consolidated property-level and entity-level debt net of cash and debt-related restricted cash, by (ii) the asset value of real estate investments (measured using the greater of fair market value and cost) plus the equity in our settled real estate debt investments. Indebtedness incurred (i) in connection with funding a deposit in advance of the closing of an investment or (ii) as other working capital advances will not be included as part of the calculation above. Our leverage ratio would be higher if the indebtedness on our real estate debt investments and pro rata share of debt within our unconsolidated investments were taken into account.
In addition to our current liquidity, we obtain incremental liquidity through the sale of shares of our common stock in our continuous public offering and private offerings, and units of BREIT OP, from which we have received cumulative net proceeds of $75.0 billion as of March 27, 2024.
125
Capital Resources
As of December 31, 2023, our indebtedness included loans secured by our properties, repurchase agreements and other financing agreements secured by our investments in real estate debt, and unsecured revolving credit facilities and term loans.
The following table is a summary of our indebtedness as of December 31, 2023 ($ in thousands):
| December 31, 2023 | Principal Balance as of | |||||||||||||||||||||||||||||||
| Indebtedness | Weighted Average Interest Rate(1) | Weighted Average Maturity Date(2) | Maximum Facility Size | December 31, 2023 | December 31, 2022 | |||||||||||||||||||||||||||
| Fixed rate loans secured by our properties: | ||||||||||||||||||||||||||||||||
Fixed rate mortgages(3) | 3.7% | 7/13/2029 | N/A | $ | 23,872,148 | $ | 25,152,361 | |||||||||||||||||||||||||
| Variable rate loans secured by our properties: | ||||||||||||||||||||||||||||||||
| Variable rate mortgages and term loans | +2.5% | 3/29/2027 | N/A | 32,316,849 | 34,141,570 | |||||||||||||||||||||||||||
Variable rate warehouse facilities(4) | +2.0% | 10/4/2025 | $ | 4,388,249 | 3,541,543 | 3,728,340 | ||||||||||||||||||||||||||
Variable rate secured revolving credit facilities(5) | +1.7% | 5/22/2026 | $ | 3,797,702 | 2,489,784 | 2,608,778 | ||||||||||||||||||||||||||
| Total variable rate loans | +2.4% | 1/18/2027 | 38,348,176 | 40,478,688 | ||||||||||||||||||||||||||||
| Total loans secured by our properties | 6.2% | 1/1/2028 | 62,220,324 | 65,631,049 | ||||||||||||||||||||||||||||
| Secured financings of investments in real estate debt: | ||||||||||||||||||||||||||||||||
| Secured financings of investments in real estate debt | +1.4% | 1/4/2025 | N/A | 4,368,269 | 4,966,685 | |||||||||||||||||||||||||||
| Unsecured loans: | ||||||||||||||||||||||||||||||||
| Unsecured term loans | +2.5% | 1/30/2026 | N/A | 1,126,923 | 1,126,923 | |||||||||||||||||||||||||||
| Unsecured variable rate revolving credit facilities | +2.5% | 11/29/2025 | $ | 5,623,077 | — | — | ||||||||||||||||||||||||||
| Affiliate revolving credit facility | +2.5% | 1/24/2025 | 75,000 | — | — | |||||||||||||||||||||||||||
| Total unsecured loans | $ | 5,698,077 | 1,126,923 | 1,126,923 | ||||||||||||||||||||||||||||
| Total indebtedness | $ | 67,715,516 | $ | 71,724,657 | ||||||||||||||||||||||||||||
(1)“+” refers to the relevant floating benchmark rates, which include SOFR, CDOR, EURIBOR, and SONIA as applicable to each loan or secured financing. As of December 31, 2023, we had outstanding interest rate swaps with an aggregate notional balance of $33.0 billion and interest rate caps with an aggregate notional balance of $9.6 billion that mitigate our exposure to potential future interest rate increased under our floating-rate debt.
(2)Weighted average maturity assumes maximum maturity date, including any extensions, where the Company, at its sole discretion, has one or more extension options.
(3)Includes $293.3 million and $364.5 million of loans related to investments in affordable housing properties as of December 31, 2023 and December 31, 2022, respectively. Such loans are generally from municipalities, housing authorities, and other third parties administered through government sponsored affordable housing programs. Certain of these loans may be forgiven if specific affordable housing conditions are maintained.
(4)Additional borrowings under the Company's variable rate warehouse facilities require additional collateral, which are subject to lender approval.
(5)Additional borrowings under the Company's variable rate secured revolving credit facilities are immediately available.
The table above excludes consolidated senior CMBS positions owned by third-parties, which are reflected in our consolidated GAAP balance sheets, as these liabilities are non-recourse to us and can only be satisfied by repayment of the collateral loans underlying such securitizations.
126
The following table is a summary of the impact of derivatives on our weighted average interest rate as of December 31, 2023:
| December 31, 2023 | ||||||||
| Weighted average interest rate of loans secured by our properties | 6.2% | |||||||
Impact of interest rate swaps, caps and other derivatives | (1.9)% | |||||||
| Net weighted average interest rate of loans secured by our properties | 4.3% | |||||||
We registered with the Securities and Exchange Commission (the “SEC”), an offering of up to $60.0 billion in shares of common stock, consisting of up to $48.0 billion in shares in its primary offering and up to $12.0 billion in shares pursuant to its distribution reinvestment plan, which we began using to offer shares of our common stock in March 2022 (the “Current Offering”).
As of March 28, 2024, we have received cumulative net proceeds of $13.9 billion from selling an aggregate of 942.5 million shares of our common stock in the Current Offering, including shares converted from operating partnership units by the Special Limited Partner (consisting of 354.7 million Class S shares, 447.0 million Class I shares, 18.9 million Class T shares, and 121.9 million Class D shares).
Capital Uses
During periods when we are selling more shares than we are repurchasing, we primarily use our capital to acquire our investments, which we also fund with other capital resources. During periods when we are repurchasing more shares than we are selling, we primarily use our capital to fund repurchases. In the fourth quarter of 2023, we received repurchase requests that exceeded the 2% monthly limit and 5% quarterly limit under our share repurchase plan. Therefore, as a result of the aforementioned monthly and quarterly limits, our board of directors exercised its discretion to repurchase less than the full amount of shares requested in October 2023, November 2023 and December 2023. For each of the three months ended March 31, 2023, June 30, 2023, and September 30, 2023, we received repurchase requests that exceeded the applicable repurchase limits under our repurchase plan. We continue to believe that our current liquidity position is sufficient to meet the needs of our business.
In addition, we may have other funding obligations, which we expect to satisfy with the cash flows generated from our investments and our capital resources described above. Such obligations may include distributions to our stockholders, operating expenses, capital expenditures, repayment of indebtedness, and debt service on our outstanding indebtedness. Our operating expenses include, among other things, the management fee we pay to the Adviser and the performance participation allocation that BREIT OP pays to the Special Limited Partner, both of which will impact our liquidity to the extent the Adviser or the Special Limited Partner elects to receive such payments in cash, or subsequently redeem shares or OP units previously issued to them. To date, the Adviser and the Special Limited Partner have both always elected to be paid in a combination of Class I and Class B units, resulting in a non-cash expense.
Cash Flows
The following table provides a breakdown of the net change in our cash and cash equivalents and restricted cash ($ in thousands):
| Year Ended December 31, | ||||||||||||||
| 2023 | 2022 | |||||||||||||
| Cash flows provided by operating activities | $ | 2,706,489 | $ | 2,728,677 | ||||||||||
| Cash flows provided by (used in) investing activities | 9,852,582 | (30,850,066) | ||||||||||||
| Cash flows (used in) provided by financing activities | (12,114,492) | 26,973,179 | ||||||||||||
| Net increase in cash and cash equivalents and restricted cash | $ | 444,579 | $ | (1,148,210) | ||||||||||
Cash flows provided by operating activities decreased $22.2 million during the year ended December 31, 2023 compared to the year ended December 31, 2022 due to decreased cash flows from the operations of our investments in real estate and income on our investments in real estate debt.
Cash flows from investing activities increased $40.7 billion during the year ended December 31, 2023 compared to the year ended December 31, 2022. The increase was primarily due to a net decrease of $30.8 billion in acquisitions of real estate, an increase of $4.5 billion in proceeds from disposition of real estate, a decrease of $3.4 billion in investment in unconsolidated entities, a net increase of $3.4 billion related to investments in real estate debt securities, and an increase of $2.0 billion in return of capital from unconsolidated entities. This was partially offset by a net decrease of $2.0 billion related to real estate-related equity securities, a net decrease of $1.2 billion in proceeds from repayments of real estate loans held by consolidated securitization vehicles, and an increase of $0.2 billion in capital improvements to real estate.
127
Cash flows from financing activities decreased $39.1 billion during the year ended December 31, 2023 compared to the year ended December 31, 2022. The decrease was primarily due to a net decrease of $25.2 billion in borrowings, a decrease of $11.2 billion in proceeds from issuance of common stock, an increase of $2.0 billion in repurchases of common stock, a decrease of $1.5 billion in contributions from non-controlling interests, an increase of $0.4 billion in distributions to non-controlling interests, an increase of $0.2 billion in distributions, and a decrease of $0.1 billion in subscriptions received in advance. This was partially offset by a net decrease of $1.1 billion in repayments of senior obligations of consolidated securitization vehicles and a decrease of $0.4 billion in payment of deferred financing costs.
Critical Accounting Policies
The preparation of the financial statements in accordance with GAAP involve significant judgments and assumptions and require estimates about matters that are inherently uncertain. These judgments will affect our reported amounts of assets and liabilities and our disclosure of contingent assets and liabilities at the dates of the financial statements and the reported amounts of revenue and expenses during the reporting periods. With different estimates or assumptions, materially different amounts could be reported in our consolidated financial statements. The following is a summary of our significant accounting policies that we believe are the most affected by our judgments, estimates, and assumptions. See Note 2 to our consolidated financial statements for further descriptions of the below accounting policies.
Investments in Real Estate
Upon the acquisition of a property, we assess the fair value of the acquired tangible and intangible assets (including land, buildings, tenant improvements, “above-market” and “below-market” leases, acquired in-place leases, other identified intangible assets and assumed liabilities) and we allocate the purchase price to the acquired assets and assumed liabilities, which are on a relative fair value basis. The most significant portion of the allocation is to building and land and requires the use of market based estimates and assumptions. We assess and consider fair value based on estimated cash flow projections that utilize appropriate discount and/or capitalization rates, as well as other available market information. Estimates of future cash flows are based on a number of factors including the historical operating results, known and anticipated trends, and market and economic conditions.
The fair value of the tangible assets of an acquired property considers the value of the property as if it were vacant. We also consider an allocation of purchase price of other acquired intangibles, including acquired in-place leases that may have a customer relationship intangible value, including (but not limited to) the nature and extent of the existing relationship with the tenants, the tenants’ credit quality and expectations of lease renewals.
Acquired above-market and below-market leases are recorded at their fair values (using a discount rate which reflects the risks associated with the leases acquired) equal to the difference between (1) the contractual amounts to be paid pursuant to each in-place lease and (2) management’s estimate of fair market lease rates for each corresponding in-place lease, measured over a period equal to the remaining term of the lease for above-market leases and the initial term plus the term of any below-market fixed rate renewal options for below-market leases. Other intangible assets acquired include amounts for in-place lease values that are based on our evaluation of the specific characteristics of each tenant’s lease. Factors to be considered include estimates of carrying costs during hypothetical expected lease-up periods considering current market conditions, and costs to execute similar leases. In estimating carrying costs, we include real estate taxes, insurance and other operating expenses and estimates of lost rentals at market rates during the expected lease-up periods, depending on local market conditions. In estimating costs to execute similar leases, we consider leasing commissions, legal and other related expenses.
Impairment of Investments in Real Estate
Management reviews its real estate properties for impairment each quarter or when there is an event or change in circumstances that indicates the carrying amount of the real estate may not be recoverable. If the carrying amount of the real estate investment is no longer recoverable and exceeds the fair value of such investment, an impairment loss is recognized. The impairment loss is recognized based on the excess of the carrying amount of the asset over its fair value. The evaluation of anticipated future cash flows is highly subjective and is based in part on assumptions regarding future occupancy, rental rates, capital requirements and anticipated holding periods that could differ materially from actual results. Since cash flows on real estate properties considered to be “long-lived assets to be held and used” are considered on an undiscounted basis to determine whether an asset has been impaired, our strategy of holding properties over the long term directly decreases the likelihood of recording an impairment loss. If our strategy changes or market conditions otherwise dictate an earlier sale date, an impairment loss may be recognized, and such loss could be material to our results. If we determine that an impairment has occurred, the affected assets must be reduced to their fair value.
128
Management classifies the assets and liabilities related to its real estate investments as held-for-sale when a sale is probable to occur within one year. The Company considers a sale to be probable when a binding contract has been executed, the buyer has posted a non-refundable deposit, and there are limited contingencies to closing. The impairment loss is recognized based on the excess of the depreciated cost of the real estate investment over its fair value, less estimated closing costs.
Management reviews its investments in unconsolidated entities for impairment each quarter or when there is an event or change in circumstances that indicates a decrease in value. If there is a decrease in value due to a series of operating losses or other factors, the investment is evaluated to determine if the loss in value is considered other than temporary. Although a current fair value below the carrying value of the investment is an indicator of impairment, we will only recognize an impairment if the loss in value is determined to be an other than temporary impairment (“OTTI”). If an impairment is determined to be other than temporary, we will record an impairment charge sufficient to reduce the investment’s carrying value to its fair value, which would result in a new cost basis. This new cost basis will be used for future periods when recording subsequent income or loss and cannot be written up to a higher value as a result of increases in fair value.
Investments in Real Estate Debt
Our investments in real estate debt consist of securities and loans. We elected to classify our real estate debt securities as trading securities, therefore we carry such investments at fair value. Our investments in loans are also carried at fair value as we elected the fair value option. Investments with readily available actively quoted prices or for which fair value can be measured from actively quoted prices generally will have a higher degree of market price observability and a lesser degree of judgment used in measuring fair value.
In determining the fair value of our investments in real estate debt, we generally utilize third-party pricing service providers and broker-dealer quotations on the basis of the last available bid price. In determining the fair value of a particular investment, pricing service providers may use broker-dealer quotations, reported trades or valuation estimates from their internal pricing models to determine the reported price. The pricing service providers’ internal models for securities such as real estate debt generally consider the attributes applicable to a particular class of the security (e.g., credit rating, seniority), current market data, and estimated cash flows for each class and incorporate deal collateral performance such as prepayment speeds and default rates, as available. These investments are classified as Level 2 within the valuation hierarchy.
Certain of our investments in real estate debt, such as mezzanine loans, are unlikely to have readily available market quotations. In such cases, we determine fair value by utilizing or reviewing certain of the following (i) market yield data, (ii) discounted cash flow modeling, (iii) collateral asset performance, (iv) local or macro real estate performance, (v) capital market conditions, (vi) debt yield or loan-to-value ratios and (vii) borrower financial condition and performance. We classify these investments as Level 3 within the valuation hierarchy. Judgments used to determine fair value of Level 3 instruments are more significant than those required when determining the fair value of instruments classified as Level 1 or 2 due to the inherent uncertainty of the estimates and judgments used. These values may differ materially from the values that would have been used had a ready market for these investments existed. External factors may cause those values and the values of those investments for which readily observable inputs exists, to increase or decrease over time, impacting the value of our investments and therefore our income (loss) from investments in real estate debt.
Recent Accounting Pronouncements
See Note 2 — “Summary of Significant Accounting Policies” to our consolidated financial statements in this Annual Report on Form 10-K for a discussion concerning recent accounting pronouncements.
Commitments and Contingencies
The following table aggregates our contractual obligations and commitments with payments due subsequent to December 31, 2023 ($ in thousands).
| Obligations | Total | Less than 1 year | 1-3 years | 3-5 years | More than 5 years | |||||||||||||||||||||||||||
Indebtedness(1) | $ | 79,087,986 | $ | 10,446,278 | $ | 31,855,830 | $ | 24,274,564 | $ | 12,511,314 | ||||||||||||||||||||||
| Ground leases | 3,362,371 | 41,434 | 84,568 | 86,375 | 3,149,994 | |||||||||||||||||||||||||||
| Total | $ | 82,450,357 | $ | 10,487,712 | $ | 31,940,398 | $ | 24,360,939 | $ | 15,661,308 | ||||||||||||||||||||||
(1)The allocation of our indebtedness includes both principal and interest payments based on the fully extended maturity date and interest rates in effect at December 31, 2023. The table above excludes consolidated senior CMBS positions owned by third-parties, as these liabilities are non-recourse to us and can only be satisfied by repayment of the collateral loans underlying such securitizations.
129
ITEM 7A. QUANTITATIVE AND QUALITATIVE DISCLOSURES ABOUT MARKET RISK
We are exposed to interest rate risk with respect to our variable-rate indebtedness such that an increase in interest rates would result in higher net interest expense. We seek to manage our exposure to interest rate risk by utilizing a mix of fixed and floating rate financings with staggered maturities, and through interest rate hedging agreements to fix or cap a majority of our variable rate debt. As of December 31, 2023, the outstanding principal balance of our variable rate indebtedness was $43.8 billion and consisted of mortgage loans, secured and unsecured term loans, secured and unsecured revolving credit facilities, and secured financings on investments in real estate debt.
Certain of our mortgage loans, secured and unsecured term loans, secured and unsecured revolving credit facilities, and secured financings are variable rate and indexed to SOFR, SONIA, EURIBOR, CDOR, and other similar benchmark rates (collectively, the “Reference Rates”). We have executed interest rate swaps with a notional amount of $33.0 billion and interest rate caps with an aggregate net notional balance of $9.6 billion as of December 31, 2023 to hedge the risk of increasing interest rates. For the year ended December 31, 2023, a 10% increase in each of the Reference Rates would have resulted in increased interest expense of $33.1 million, net of the impact of our interest rate swaps and caps. Our exposure to interest rate risk may vary in future periods as the amount and terms of our interest rate hedging agreements change over time as we implement our hedging program. See “Part I. Item 1A. Risk Factors — Risks Related to Investments in Real Estate Debt — We utilize derivatives, which involve numerous risks” and “Failure to hedge effectively against interest rate changes may materially adversely affect our results of operations and financial condition” and “Part I. Item 1A. Risk Factors — General Risk Factors — We will face risks associated with hedging transactions” for more information on risks associated with our use of derivatives and hedging transactions.
LIBOR and certain other floating rate benchmark indices have been the subject of national, international and regulatory guidance and proposals for reform or replacement. The Federal Reserve, in conjunction with the Alternative Reference Rates Committee, a steering committee composed of large U.S. financial institutions, identified SOFR, an index calculated using short-term repurchase agreements backed by U.S. Treasury securities, as its preferred alternative rate for USD LIBOR. Additionally, market participants have transitioned from GBP LIBOR to the Sterling Overnight Index Average, or SONIA, in line with guidance from the U.K. regulators. As of December 31, 2023, substantially all of our floating rate debt has transitioned to the applicable replacement benchmark rate, or reference a benchmark rate that is not expected to be replaced.
Refer to “Part I. Item 1A. Risk Factors — Risks Related to Debt Financing — We may be adversely affected by the phasing out of the London Interbank Offered Rate (“LIBOR”)” of this Annual Report on Form 10-K for more information on risk factors associated with the LIBOR.
Investments in Real Estate Debt
As of December 31, 2023, we held $8.3 billion of investments in real estate debt, which excludes the impact of consolidating the underlying loans that serve as collateral for certain securitizations on our Consolidated Balance Sheets. Our investments in real estate debt are primarily floating-rate and indexed to the Reference Rates, and as such, exposed to interest rate risk. Our net income will increase or decrease depending on interest rate movements. While we cannot predict factors that may or may not affect interest rates, a 10% increase or decrease in the Reference Rates would have resulted in an increase or decrease to income from investments in real estate debt of $38.9 million for the year ended December 31, 2023.
We may also be exposed to market risk with respect to our investments in real estate debt due to changes in the fair value of our investments. We seek to manage our exposure to market risk with respect to our investments in real estate debt by making investments in real estate debt backed by different types of collateral and varying credit ratings. The fair value of our investments may fluctuate, therefore the amount we will realize upon any sale of our investments in real estate debt is unknown. However, as of December 31, 2023, a 10% change in the fair value of our investments in real estate debt would result in a change in the carrying value of our investments in real estate debt of $0.8 billion.
ITEM 8. FINANCIAL STATEMENTS AND SUPPLEMENTARY DATA
For the financial statements required by this item and the reports of the independent accountants thereon required by Item 14(a)(2). See the accompanying Consolidated Financial Statements beginning on page F-1.
ITEM 9. CHANGES IN AND DISAGREEMENTS WITH ACCOUNTANTS ON ACCOUNTING AND FINANCIAL DISCLOSURE
None.
130
ITEM 9A. CONTROLS AND PROCEDURES
Evaluation of Disclosure Controls and Procedures
The Company maintains disclosure controls and procedures (as that term is defined in Rules 13a-15(e) and 15d-15(e) under the Exchange Act) that are designed to ensure that information required to be disclosed in the Company’s reports under the Exchange Act is recorded, processed, and summarized and reported within the time periods specified in SEC rules and forms, and that such information is accumulated and communicated to the Company’s management, including its Chief Executive Officer and Chief Financial Officer, as appropriate, to allow timely decisions regarding required disclosures. Any controls and procedures, no matter how well designed and operated, can provide only reasonable assurance of achieving the desired control objectives. An evaluation of the effectiveness of the design and operation of our disclosure controls and procedures as of the end of the period covered by this Annual Report on Form 10-K was made under the supervision and with the participation of our management, including our Chief Executive Officer and Chief Financial Officer. Based upon this evaluation, our Chief Executive Officer and Chief Financial Officer have concluded that our disclosure controls and procedures (a) are effective to ensure that information required to be disclosed by us in reports filed or submitted under the Exchange Act is timely recorded, processed, summarized and reported and (b) include, without limitation, controls and procedures designed to ensure that information required to be disclosed by us in reports filed or submitted under the Exchange Act is accumulated and communicated to our management, including our Chief Executive Officer and Chief Financial Officer, as appropriate to allow timely decisions regarding required disclosure.
Changes in Internal Controls over Financial Reporting
There have been no changes in our “internal control over financial reporting” (as defined in Rule 13a-15(f) of the Exchange Act) that occurred during our most recent quarter that have materially affected, or are reasonably likely to materially affect, our internal control over financial reporting.
Management’s Report on Internal Control Over Financial Reporting
Management of the Company, is responsible for establishing and maintaining adequate internal control over financial reporting. The Company’s internal control over financial reporting is a process designed under the supervision of its Chief Executive Officer and Chief Financial Officer to provide reasonable assurance regarding the reliability of financial reporting and the preparation of its consolidated financial statements for external reporting purposes in accordance with GAAP.
The Company’s internal control over financial reporting includes policies and procedures that pertain to the maintenance of records that, in reasonable detail, accurately and fairly reflect transactions and dispositions of assets of the Company; provide reasonable assurances that transactions are recorded as necessary to permit preparation of financial statements in accordance with generally accepted accounting principles, and that receipts and expenditures are being made only in accordance with authorizations of the Company’s management and directors; and provide reasonable assurance regarding prevention or timely detection of unauthorized acquisition, use or disposition of assets that could have a material effect on its consolidated financial statements.
Because of its inherent limitations, internal control over financial reporting may not prevent or detect misstatements. In addition, projections of any evaluation of effectiveness to future periods are subject to the risk that controls may become inadequate because of changes in conditions or that the degree of compliance with the policies or procedures may deteriorate.
Management conducted an assessment of the effectiveness of the Company’s internal control over financial reporting as of December 31, 2023, based on the framework established in Internal Control – Integrated Framework (2013) issued by the Committee of Sponsoring Organizations of the Treadway Commission in 2013. Based on this assessment, management has determined that the Company’s internal control over financial reporting as of December 31, 2023, was effective.
131
ITEM 9B. OTHER INFORMATION
Section 13(r) Disclosure
Pursuant to Section 219 of the Iran Threat Reduction and Syria Human Rights Act of 2012, which added Section 13(r) of the Exchange Act, we hereby incorporate by reference herein Exhibit 99.1 of this report, which includes disclosures regarding activities at Mundys S.p.A., formerly “Atlantia S.p.A.,” which may be, or may have been at the time considered to be, an affiliate of Blackstone and, therefore, our affiliate.
ITEM 9C. DISCLOSURE REGARDING FOREIGN JURISDICTIONS THAT PREVENT INSPECTIONS
Not Applicable.
132
PART III.
ITEM 10. DIRECTORS, EXECUTIVE OFFICERS AND CORPORATE GOVERNANCE
The information required by this item is incorporated by reference to the Company’s definitive proxy statement to be filed not later than April 29, 2024 with the SEC pursuant to Regulation 14A under the Exchange Act.
ITEM 11. EXECUTIVE COMPENSATION
The information required by this item is incorporated by reference to the Company’s definitive proxy statement to be filed not later than April 29, 2024 with the SEC pursuant to Regulation 14A under the Exchange Act.
ITEM 12. SECURITY OWNERSHIP OF CERTAIN BENEFICIAL OWNERS AND MANAGEMENT AND RELATED STOCKHOLDER MATTERS
The information required by this item is incorporated by reference to the Company’s definitive proxy statement to be filed not later than April 29, 2024 with the SEC pursuant to Regulation 14A under the Exchange Act.
ITEM 13. CERTAIN RELATIONSHIPS AND RELATED TRANSACTIONS, AND DIRECTOR INDEPENDENCE
The information required by this item is incorporated by reference to the Company’s definitive proxy statement to be filed not later than April 29, 2024 with the SEC pursuant to Regulation 14A under the Exchange Act.
ITEM 14. PRINCIPAL ACCOUNTANT FEES AND SERVICES
The information required by this item is incorporated by reference to the Company’s definitive proxy statement to be filed not later than April 29, 2024 with the SEC pursuant to Regulation 14A under the Exchange Act.
133
PART IV.
ITEM 15. EXHIBITS, FINANCIAL STATEMENT SCHEDULES
The following documents are filed as part of this Annual Report.
1. Financial Statements:
See Item 8 above.
2. Financial Statement Schedules:
Schedules for which provision is made in the applicable accounting regulations of the SEC are not required under the related
instructions or are not applicable, and therefore have been omitted.
3. Exhibits:
Exhibit Number | Exhibit Description | |||||||
| 3.1 | ||||||||
| 3.2 | ||||||||
| 3.3 | ||||||||
| 3.4 | ||||||||
| 3.5 | ||||||||
3.6 | ||||||||
3.7 | ||||||||
| 3.8 | ||||||||
| 3.9 | ||||||||
4.1 | ||||||||
4.2 | ||||||||
4.3* | ||||||||
134
4.4 | ||||||||
| 10.1 | ||||||||
10.2 | ||||||||
10.3 | ||||||||
10.4 | ||||||||
10.5 | ||||||||
10.6 | ||||||||
10.7 | ||||||||
10.8 | ||||||||
10.9 | ||||||||
21.1* | ||||||||
| 31.1* | ||||||||
| 31.2* | ||||||||
32.1* | ||||||||
32.2* | ||||||||
| 99.1* | ||||||||
| 101.INS+ | Inline XBRL Instance Document | |||||||
| 101.SCH+ | Inline XBRL Taxonomy Extension Schema Document | |||||||
| 101.CAL+ | Inline XBRL Taxonomy Extension Calculation Linkbase Document | |||||||
| 101.LAB+ | Inline XBRL Taxonomy Extension Label Linkbase Document | |||||||
135
| 101.PRE+ | Inline XBRL Taxonomy Extension Presentation Linkbase Document | |||||||
| 101.DEF+ | Inline XBRL Taxonomy Extension Definition Linkbase Document | |||||||
| 104 | Cover Page Interactive Data File (formatted as Inline XBRL and contained in Exhibit 101) | |||||||
| * | Filed herewith. | ||||
| + | This exhibit shall not be deemed “filed” for purposes of Section 18 of the Securities Exchange Act of 1934, as amended (the “Exchange Act”) or otherwise subject to the liability of that Section. Such exhibit shall not be deemed incorporated into any filing under the Securities Act or the Exchange Act. | ||||
The agreements and other documents filed as exhibits to this report are not intended to provide factual information or other disclosure other than with respect to the terms of the agreements or other documents themselves, and you should not rely on them for that purpose. In particular, any representations and warranties made by us in these agreements or other documents were made solely within the specific context of the relevant agreement or document and may not describe the actual state of affairs as of the date they were made or at any other time.
ITEM 16. FORM 10-K SUMMARY
None.
136
SIGNATURES
Pursuant to the requirements of the Securities Exchange Act of 1934, the registrant has duly caused this report to be signed on its behalf by the undersigned thereunto duly authorized.
| BLACKSTONE REAL ESTATE INCOME TRUST, INC. | ||||||||
| March 28, 2024 | /s/ Frank Cohen | |||||||
| Date | Frank Cohen | |||||||
| Chief Executive Officer | ||||||||
| (Principal Executive Officer) | ||||||||
Pursuant to the requirements of the Securities Exchange Act of 1934, this report has been signed below by the following persons on behalf of the Registrant and in the capacities and on the dates indicated.
| March 28, 2024 | /s/ Frank Cohen | |||||||
| Date | Frank Cohen | |||||||
| Chairman of the Board and Chief Executive Officer | ||||||||
| (Principal Executive Officer) | ||||||||
| March 28, 2024 | /s/ Anthony F. Marone, Jr. | |||||||
| Date | Anthony F. Marone, Jr. | |||||||
| Chief Financial Officer and Treasurer | ||||||||
| (Principal Financial Officer) | ||||||||
| March 28, 2024 | /s/ Paul Kolodziej | |||||||
| Date | Paul Kolodziej | |||||||
Deputy Chief Financial Officer | ||||||||
| (Principal Accounting Officer) | ||||||||
| March 28, 2024 | /s/ Robert Harper | |||||||
| Date | Robert Harper | |||||||
| President and Director | ||||||||
| March 28, 2024 | /s/ Wesley LePatner | |||||||
| Date | Wesley LePatner | |||||||
| Chief Operating Officer and Director | ||||||||
| March 28, 2024 | /s/ Brian Kim | |||||||
| Date | Brian Kim | |||||||
| Head of Acquisitions and Capital Markets and Director | ||||||||
| March 28, 2024 | /s/ Raymond J. Beier | |||||||
| Date | Raymond J. Beier | |||||||
| Director | ||||||||
137
| March 28, 2024 | /s/ Susan Carras | |||||||
| Date | Susan Carras | |||||||
| Director | ||||||||
| March 28, 2024 | /s/ Richard I. Gilchrist | |||||||
| Date | Richard I. Gilchrist | |||||||
| Director | ||||||||
| March 28, 2024 | /s/ Field Griffith | |||||||
| Date | Field Griffith | |||||||
| Director | ||||||||
| March 28, 2024 | /s/ Edward Lewis | |||||||
| Date | Edward Lewis | |||||||
| Director | ||||||||
138
INDEX TO CONSOLIDATED FINANCIAL STATEMENTS
Consolidated Financial Statements: | |||||
Report of Independent Registered Public Accounting Firm (PCAOB ID No. | |||||
Consolidated Balance Sheets as of December 31, 2023 and 2022 | |||||
Consolidated Statements of Operations for the Years Ended December 31, 2023, 2022 and 2021 | |||||
Consolidated Statements of Comprehensive Income (Loss) for the Years Ended December 31, 2023, 2022 and 2021 | |||||
Consolidated Statements of Changes in Equity for the Years Ended December 31, 2023, 2022 and 2021 | |||||
Consolidated Statements of Cash Flows for the Years Ended December 31, 2023, 2022 and 2021 | |||||
| Financial Statement Schedule: | |||||
Schedule III—Real Estate and Accumulated Depreciation as of December 31, 2023 | |||||
Financial statement schedules other than those listed are omitted as they are not applicable or the required or equivalent information has been included in the consolidated financial statements or notes thereto.
F-1
REPORT OF INDEPENDENT REGISTERED PUBLIC ACCOUNTING FIRM
To the Stockholders and the Board of Directors of Blackstone Real Estate Income Trust, Inc.
Opinion on the Financial Statements
We have audited the accompanying consolidated balance sheets of Blackstone Real Estate Income Trust, Inc. and subsidiaries (the “Company”) as of December 31, 2023 and 2022, the related consolidated statements of operations, comprehensive income (loss), changes in equity, and cash flows, for each of the three years in the period ended December 31, 2023, and the related notes and the schedule listed in the Index at Item 15 (collectively referred to as the “financial statements”). In our opinion, the financial statements present fairly, in all material respects, the financial position of the Company as of December 31, 2023 and 2022, and the results of its operations and its cash flows for each of the three years in the period ended December 31, 2023, in conformity with accounting principles generally accepted in the United States of America.
Basis for Opinion
These financial statements are the responsibility of the Company’s management. Our responsibility is to express an opinion on the Company’s financial statements based on our audits. We are a public accounting firm registered with the Public Company Accounting Oversight Board (United States) (PCAOB) and are required to be independent with respect to the Company in accordance with the U.S. federal securities laws and the applicable rules and regulations of the Securities and Exchange Commission and the PCAOB.
We conducted our audits in accordance with the standards of the PCAOB. Those standards require that we plan and perform the audit to obtain reasonable assurance about whether the financial statements are free of material misstatement, whether due to error or fraud. The Company is not required to have, nor were we engaged to perform, an audit of its internal control over financial reporting. As part of our audits, we are required to obtain an understanding of internal control over financial reporting but not for the purpose of expressing an opinion on the effectiveness of the Company’s internal control over financial reporting. Accordingly, we express no such opinion.
Our audits included performing procedures to assess the risks of material misstatement of the financial statements, whether due to error or fraud, and performing procedures that respond to those risks. Such procedures included examining, on a test basis, evidence regarding the amounts and disclosures in the financial statements. Our audits also included evaluating the accounting principles used and significant estimates made by management, as well as evaluating the overall presentation of the financial statements. We believe that our audits provide a reasonable basis for our opinion.
Critical Audit Matter
The critical audit matter communicated below is a matter arising from the current-period audit of the financial statements that was communicated or required to be communicated to the audit committee and that (1) relates to accounts or disclosures that are material to the financial statements and (2) involved our especially challenging, subjective, or complex judgments. The communication of critical audit matters does not alter in any way our opinion on the financial statements, taken as a whole, and we are not, by communicating the critical audit matter below, providing a separate opinion on the critical audit matter or on the accounts or disclosures to which it relates.
Impairments of Investment in Real Estate – Hold Period — Refer to Notes 2 and 3 to the financial statements
Critical Audit Matter Description
The Company periodically reviews its real estate investments for impairment or when there is an event or change in circumstances that indicates the carrying amount of the real estate investment may not be recoverable. If an impairment indicator is identified, a real estate investment is considered impaired only if the Company’s estimate of aggregate future undiscounted cash flows, taking into account the estimated probability-weighted hold period, is less than the carrying amount of the investment. Changes in any estimates and/or assumptions, particularly the estimated hold period, could have a material impact on the future undiscounted cash flows.
We identified the Company’s estimate of hold period for real estate investments evaluated for impairment as a critical audit matter because of the significance of the estimate within the Company’s impairment analysis. This required a high degree of auditor judgment and an increased extent of effort, especially given the inherent unpredictability involved in the timing of dispositions of real estate.
F-2
How the Critical Audit Matter Was Addressed in the Audit
Our audit procedures related to the assessment of the Company’s estimated real estate investment hold periods included, among others, the following:
•We engaged in discussions with management regarding the assumptions utilized in the determination of estimated hold periods, and evaluated audit evidence, including inspection of the Company’s Board of Director meeting minutes, to determine whether it supported or contradicted the conclusions reached by the Company.
•We evaluated the reasonableness of the Company’s estimated hold periods by performing a retrospective analysis of disposed properties to the Company’s estimated hold period in periods prior to the disposition.
•We searched public records for indications of whether certain real estate investments may be actively marketed for sale using external tools utilized by our valuation specialists.
/s/ Deloitte & Touche LLP
March 28, 2024
We have served as the Company’s auditor since 2016.
F-3
Blackstone Real Estate Income Trust, Inc. Consolidated Balance Sheets (in thousands, except per share data) | ||
| December 31, 2023 | December 31, 2022 | ||||||||||
| Assets | |||||||||||
| Investments in real estate, net | $ | $ | |||||||||
Investments in unconsolidated entities (includes $ as of December 31, 2023 and December 31, 2022, respectively) | |||||||||||
| Investments in real estate debt | |||||||||||
| Real estate loans held by consolidated securitization vehicles, at fair value | |||||||||||
| Cash and cash equivalents | |||||||||||
| Restricted cash | |||||||||||
| Other assets | |||||||||||
| Total assets | $ | $ | |||||||||
| Liabilities and Equity | |||||||||||
| Mortgage loans, secured term loans, and secured revolving credit facilities, net | $ | $ | |||||||||
| Secured financings of investments in real estate debt | |||||||||||
| Senior obligations of consolidated securitization vehicles, at fair value | |||||||||||
| Unsecured revolving credit facilities and term loans | |||||||||||
| Due to affiliates | |||||||||||
| Other liabilities | |||||||||||
| Total liabilities | |||||||||||
| Commitments and contingencies | |||||||||||
| Redeemable non-controlling interests | |||||||||||
| Equity | |||||||||||
Common stock — Class S shares, $ | |||||||||||
Common stock — Class I shares, $ | |||||||||||
Common stock — Class T shares, $ | |||||||||||
Common stock — Class D shares, $ | |||||||||||
Common stock — Class C shares, $ | |||||||||||
| Additional paid-in capital | |||||||||||
| Accumulated other comprehensive income | |||||||||||
| Accumulated deficit and cumulative distributions | ( | ( | |||||||||
| Total stockholders’ equity | |||||||||||
| Non-controlling interests attributable to third party joint ventures | |||||||||||
| Non-controlling interests attributable to BREIT OP unitholders | |||||||||||
| Total equity | |||||||||||
| Total liabilities and equity | $ | $ | |||||||||
See accompanying notes to consolidated financial statements.
F-4
Blackstone Real Estate Income Trust, Inc. Consolidated Statements of Operations (in thousands, except per share data) | ||
| Year Ended December 31, | ||||||||||||||||||||
| 2023 | 2022 | 2021 | ||||||||||||||||||
| Revenues | ||||||||||||||||||||
| Rental revenue | $ | $ | $ | |||||||||||||||||
| Hospitality revenue | ||||||||||||||||||||
| Other revenue | ||||||||||||||||||||
| Total revenues | ||||||||||||||||||||
| Expenses | ||||||||||||||||||||
| Rental property operating | ||||||||||||||||||||
| Hospitality operating | ||||||||||||||||||||
| General and administrative | ||||||||||||||||||||
| Management fee | ||||||||||||||||||||
| Performance participation allocation | ||||||||||||||||||||
| Impairment of investments in real estate | ||||||||||||||||||||
| Depreciation and amortization | ||||||||||||||||||||
| Total expenses | ||||||||||||||||||||
| Other income (expense) | ||||||||||||||||||||
| Income from unconsolidated entities | ||||||||||||||||||||
| Income (loss) from investments in real estate debt | ( | |||||||||||||||||||
| Change in net assets of consolidated securitization vehicles | ( | |||||||||||||||||||
| (Loss) income from interest rate derivatives | ( | |||||||||||||||||||
| Net gain on dispositions of real estate | ||||||||||||||||||||
| Interest expense, net | ( | ( | ( | |||||||||||||||||
| Loss on extinguishment of debt | ( | ( | ( | |||||||||||||||||
| Other (expense) income | ( | ( | ||||||||||||||||||
| Total other income (expense) | ( | |||||||||||||||||||
| Net loss | $ | ( | $ | ( | $ | ( | ||||||||||||||
| Net loss attributable to non-controlling interests in third party joint ventures | $ | $ | $ | |||||||||||||||||
| Net loss attributable to non-controlling interests in BREIT OP unit holders | ||||||||||||||||||||
| Net loss attributable to BREIT stockholders | $ | ( | $ | ( | $ | ( | ||||||||||||||
| Net loss per share of common stock — basic and diluted | $ | ( | $ | ( | $ | ( | ||||||||||||||
| Weighted-average shares of common stock outstanding, basic and diluted | ||||||||||||||||||||
See accompanying notes to consolidated financial statements.
F-5
Blackstone Real Estate Income Trust, Inc. Consolidated Statements of Comprehensive Income (Loss) (in thousands) | ||
| Year Ended December 31, | ||||||||||||||||||||
| 2023 | 2022 | 2021 | ||||||||||||||||||
| Net loss | $ | ( | $ | ( | $ | ( | ||||||||||||||
| Other comprehensive income (loss): | ||||||||||||||||||||
| Foreign currency translation gain (loss), net | ( | ( | ||||||||||||||||||
| Unrealized (loss) gain on derivatives | ( | |||||||||||||||||||
| Unrealized (loss) gain on derivatives from unconsolidated entities | ( | |||||||||||||||||||
| Other comprehensive (loss) income | ( | ( | ||||||||||||||||||
| Comprehensive loss | ( | ( | ( | |||||||||||||||||
| Comprehensive loss attributable to non-controlling interests in third party joint ventures | ||||||||||||||||||||
| Comprehensive loss attributable to non-controlling interests in BREIT OP unit holders | ||||||||||||||||||||
| Comprehensive loss attributable to BREIT stockholders | $ | ( | $ | ( | $ | ( | ||||||||||||||
See accompanying notes to consolidated financial statements.
F-6
Blackstone Real Estate Income Trust, Inc. Consolidated Statements of Changes in Equity (in thousands, except per share data) | ||
| Par Value | Accumulated Other Comprehensive Income | Accumulated Deficit and Cumulative Distributions | Non- controlling Interests Attributable to Third Party Joint Ventures | Non- controlling Interests Attributable to BREIT OP Unitholders | |||||||||||||||||||||||||||||||||||||||||||||||||||||||||||||||||||
| Common Stock Class S | Common Stock Class I | Common Stock Class T | Common Stock Class D | Common Stock Class C | Additional Paid-in Capital | Total Stockholders' Equity | Total Equity | ||||||||||||||||||||||||||||||||||||||||||||||||||||||||||||||||
| Balance at December 31, 2020 | $ | $ | $ | $ | $ | $ | $ | $ | ( | $ | $ | $ | $ | ||||||||||||||||||||||||||||||||||||||||||||||||||||||||||
| Common stock issued | $ | $ | $ | $ | $ | — | $ | $ | — | $ | — | $ | $ | — | $ | — | $ | ||||||||||||||||||||||||||||||||||||||||||||||||||||||
| Offering costs | — | — | — | — | — | ( | — | — | ( | — | — | ( | |||||||||||||||||||||||||||||||||||||||||||||||||||||||||||
| Distribution reinvestment | — | — | — | — | — | ||||||||||||||||||||||||||||||||||||||||||||||||||||||||||||||||||
| Common stock/units repurchased | ( | ( | ( | ( | — | ( | — | — | ( | ( | ( | ( | |||||||||||||||||||||||||||||||||||||||||||||||||||||||||||
| Amortization of compensation awards | — | — | — | — | — | — | — | ||||||||||||||||||||||||||||||||||||||||||||||||||||||||||||||||
Net loss ($ | — | — | — | — | — | — | — | ( | ( | ( | ( | ( | |||||||||||||||||||||||||||||||||||||||||||||||||||||||||||
| Other comprehensive loss | — | — | — | — | — | — | ( | — | ( | — | — | ( | |||||||||||||||||||||||||||||||||||||||||||||||||||||||||||
Distributions declared on common stock ($ | — | — | — | — | — | — | — | ( | ( | — | — | ( | |||||||||||||||||||||||||||||||||||||||||||||||||||||||||||
| Contributions from non-controlling interests | — | — | — | — | — | — | — | — | — | ||||||||||||||||||||||||||||||||||||||||||||||||||||||||||||||
| Distributions to and redemptions of non-controlling interests | — | — | — | — | — | — | — | — | — | ( | ( | ( | |||||||||||||||||||||||||||||||||||||||||||||||||||||||||||
| Allocation to redeemable non-controlling interests | — | — | — | — | — | ( | — | — | ( | — | — | ( | |||||||||||||||||||||||||||||||||||||||||||||||||||||||||||
| Balance at December 31, 2021 | $ | $ | $ | $ | $ | $ | $ | ( | $ | ( | $ | $ | $ | $ | |||||||||||||||||||||||||||||||||||||||||||||||||||||||||
| Common stock issued | $ | $ | $ | $ | $ | — | $ | $ | — | $ | — | $ | $ | — | $ | — | $ | ||||||||||||||||||||||||||||||||||||||||||||||||||||||
| Offering costs | — | — | — | — | — | ( | — | — | ( | — | — | ( | |||||||||||||||||||||||||||||||||||||||||||||||||||||||||||
| Distribution reinvestment | — | — | — | — | — | ||||||||||||||||||||||||||||||||||||||||||||||||||||||||||||||||||
| Common stock/units repurchased | ( | ( | ( | ( | — | ( | — | — | ( | — | ( | ( | |||||||||||||||||||||||||||||||||||||||||||||||||||||||||||
| Amortization of compensation awards | — | — | — | — | — | — | — | ||||||||||||||||||||||||||||||||||||||||||||||||||||||||||||||||
Net loss ($ | — | — | — | — | — | — | — | ( | ( | ( | ( | ( | |||||||||||||||||||||||||||||||||||||||||||||||||||||||||||
| Other comprehensive loss | — | — | — | — | — | — | — | ||||||||||||||||||||||||||||||||||||||||||||||||||||||||||||||||
Distributions declared on common stock ($ | — | — | — | — | — | — | — | ( | ( | — | — | ( | |||||||||||||||||||||||||||||||||||||||||||||||||||||||||||
| Contributions from non-controlling interests | — | — | — | — | — | — | — | — | — | ||||||||||||||||||||||||||||||||||||||||||||||||||||||||||||||
| Distributions to and redemptions of non-controlling interests | — | — | — | — | — | — | — | ( | ( | ( | |||||||||||||||||||||||||||||||||||||||||||||||||||||||||||||
| Allocation to redeemable non-controlling interests | — | — | — | — | — | ( | — | — | ( | — | — | ( | |||||||||||||||||||||||||||||||||||||||||||||||||||||||||||
| Balance at December 31, 2022 | $ | $ | $ | $ | $ | $ | $ | $ | ( | $ | $ | $ | $ | ||||||||||||||||||||||||||||||||||||||||||||||||||||||||||
Common stock issued (transferred) | $ | $ | A | $ | ( | $ | ( | A | $ | $ | A | $ | — | $ | — | $ | $ | — | $ | — | $ | ||||||||||||||||||||||||||||||||||||||||||||||||||
Reduction in accrual for offering costs, net | — | — | — | — | — | — | — | — | — | ||||||||||||||||||||||||||||||||||||||||||||||||||||||||||||||
| Distribution reinvestment | — | — | — | — | |||||||||||||||||||||||||||||||||||||||||||||||||||||||||||||||||||
| Common stock/units repurchased | ( | ( | ( | ( | — | ( | — | — | ( | — | ( | ( | |||||||||||||||||||||||||||||||||||||||||||||||||||||||||||
| Amortization of compensation awards | — | — | — | — | — | — | — | ||||||||||||||||||||||||||||||||||||||||||||||||||||||||||||||||
Net loss ($ | — | — | — | — | — | — | — | ( | ( | ( | ( | ( | |||||||||||||||||||||||||||||||||||||||||||||||||||||||||||
Other comprehensive loss ($ | — | — | — | — | — | — | ( | — | ( | ( | ( | ( | |||||||||||||||||||||||||||||||||||||||||||||||||||||||||||
Distributions declared on common stock ($ | — | — | — | — | — | — | — | ( | ( | — | ( | ( | |||||||||||||||||||||||||||||||||||||||||||||||||||||||||||
| Contributions from non-controlling interests | — | — | — | — | — | — | — | ||||||||||||||||||||||||||||||||||||||||||||||||||||||||||||||||
Operating distributions to non-controlling interests | — | — | — | — | — | — | — | — | — | ( | — | ( | |||||||||||||||||||||||||||||||||||||||||||||||||||||||||||
Capital distributions to non-controlling interests | — | — | — | — | — | ( | — | — | ( | ( | — | ( | |||||||||||||||||||||||||||||||||||||||||||||||||||||||||||
| Allocation to redeemable non-controlling interests | — | — | — | — | — | — | — | — | — | ||||||||||||||||||||||||||||||||||||||||||||||||||||||||||||||
| Balance at December 31, 2023 | $ | $ | $ | $ | $ | $ | $ | $ | ( | $ | $ | $ | $ | ||||||||||||||||||||||||||||||||||||||||||||||||||||||||||
See accompanying notes to consolidated financial statements.
F-7
Blackstone Real Estate Income Trust, Inc. Consolidated Statements of Cash Flows (in thousands) | ||
| Year Ended December 31, | |||||||||||||||||
| 2023 | 2022 | 2021 | |||||||||||||||
| Cash flows from operating activities: | |||||||||||||||||
| Net loss | $ | ( | $ | ( | $ | ( | |||||||||||
| Adjustments to reconcile net loss to net cash provided by operating activities: | |||||||||||||||||
| Management fee | |||||||||||||||||
| Performance participation allocation | |||||||||||||||||
| Impairment of investments in real estate | |||||||||||||||||
| Depreciation and amortization | |||||||||||||||||
| Net gain on dispositions of real estate | ( | ( | ( | ||||||||||||||
| Loss on extinguishment of debt | |||||||||||||||||
| Unrealized loss (gain) on fair value of financial instruments | ( | ( | |||||||||||||||
| Realized gain on sale of real estate-related equity securities | ( | ( | ( | ||||||||||||||
| Income from unconsolidated entities | ( | ( | ( | ||||||||||||||
| Distributions of earnings from unconsolidated entities | |||||||||||||||||
| Other items | ( | ||||||||||||||||
| Change in assets and liabilities: | |||||||||||||||||
| Increase in other assets | ( | ( | ( | ||||||||||||||
| Increase (decrease) in due to affiliates | ( | ||||||||||||||||
| (Decrease) increase in other liabilities | ( | ||||||||||||||||
| Net cash provided by operating activities | |||||||||||||||||
| Cash flows from investing activities: | |||||||||||||||||
| Acquisitions of real estate | ( | ( | ( | ||||||||||||||
| Capital improvements to real estate | ( | ( | ( | ||||||||||||||
| Proceeds from disposition of real estate | |||||||||||||||||
| Refunds of pre-acquisition costs/deposits | ( | ||||||||||||||||
| Investment in unconsolidated entities | ( | ( | ( | ||||||||||||||
| Dispositions of and return of capital from unconsolidated entities | |||||||||||||||||
| Proceeds from consolidation of previously unconsolidated entities | |||||||||||||||||
| Purchase of investments in real estate debt | ( | ( | ( | ||||||||||||||
| Proceeds from sale/repayment of investments in real estate debt | |||||||||||||||||
| Purchase of real estate-related equity securities | ( | ( | ( | ||||||||||||||
| Proceeds from sale of real estate-related equity securities | |||||||||||||||||
| Proceeds from repayments of real estate loans held by consolidated securitization vehicles | |||||||||||||||||
| Proceeds from settlement of derivative contracts | |||||||||||||||||
| Collateral released (posted) under derivative contracts | ( | ||||||||||||||||
| Other investing activities | |||||||||||||||||
| Net cash provided by (used in) investing activities | ( | ( | |||||||||||||||
| Cash flows from financing activities: | |||||||||||||||||
| Borrowings under mortgage loans, secured term loans, and secured revolving credit facilities | |||||||||||||||||
| Repayments of mortgage loans, secured term loans, and secured revolving credit facilities | ( | ( | ( | ||||||||||||||
| Borrowings under secured financings of investments in real estate debt | |||||||||||||||||
| Repayments of secured financings of investments in real estate debt | ( | ( | ( | ||||||||||||||
| Borrowings under unsecured revolving credit facilities and term loans | |||||||||||||||||
| Repayments of unsecured revolving credit facilities and term loans | ( | ( | |||||||||||||||
| Payment of deferred financing costs | ( | ( | ( | ||||||||||||||
| Sales of senior obligations of consolidated securitization vehicles | |||||||||||||||||
| Repayments of senior obligations of consolidated securitization vehicles | ( | ( | ( | ||||||||||||||
| Proceeds from issuance of common stock | |||||||||||||||||
| Subscriptions received in advance | |||||||||||||||||
| Offering costs paid | ( | ( | ( | ||||||||||||||
| Distributions | ( | ( | ( | ||||||||||||||
| Repurchase of common stock | ( | ( | ( | ||||||||||||||
| Repurchase of management fee shares | ( | ( | |||||||||||||||
| Contributions of proceeds from repurchase of management fee shares to non-controlling interests in BREIT OP | |||||||||||||||||
| Contributions from redeemable non-controlling interest | |||||||||||||||||
| Distributions to and redemption of redeemable non-controlling interest | ( | ( | ( | ||||||||||||||
| Redemption of affiliate service provider incentive compensation awards | ( | ( | ( | ||||||||||||||
| Contributions from non-controlling interests | |||||||||||||||||
| Distributions to and redemptions of non-controlling interests | ( | ( | ( | ||||||||||||||
| Net cash (used in) provided by financing activities | ( | ||||||||||||||||
| Net change in cash and cash equivalents and restricted cash | ( | ||||||||||||||||
| Cash, cash equivalents and restricted cash, beginning of year | |||||||||||||||||
| Effects of foreign currency translation on cash, cash equivalents and restricted cash | ( | ( | |||||||||||||||
| Cash, cash equivalents and restricted cash, end of year | $ | $ | $ | ||||||||||||||
| Reconciliation of cash, cash equivalents and restricted cash to the consolidated balance sheets: | |||||||||||||||||
| Cash and cash equivalents | $ | $ | $ | ||||||||||||||
| Restricted cash | |||||||||||||||||
| Total cash, cash equivalents and restricted cash | $ | $ | $ | ||||||||||||||
F-8
| Supplemental disclosures: | |||||||||||||||||
| Interest paid | $ | $ | $ | ||||||||||||||
| Non-cash investing and financing activities: | |||||||||||||||||
| Assumption of mortgage loans in conjunction with acquisitions of real estate | $ | $ | $ | ||||||||||||||
| Assumption of other assets and liabilities in conjunction with acquisitions of real estate | $ | $ | $ | ||||||||||||||
| Issuance of BREIT OP units as consideration for acquisitions of real estate and purchases of non-controlling interests | $ | $ | $ | ||||||||||||||
| Issuance of BREIT OP units for settlement of joint venture promote liability | $ | $ | $ | ||||||||||||||
| Assumption of other liabilities in conjunction with acquisitions of investments in unconsolidated entities | $ | $ | $ | ||||||||||||||
| Recognition of financing lease liability | $ | $ | $ | ||||||||||||||
| Accrued pre-acquisition costs | $ | $ | $ | ||||||||||||||
| Accrued capital expenditures and acquisition related costs | $ | $ | $ | ||||||||||||||
| Acquired non-controlling interests | $ | $ | $ | ||||||||||||||
| Accrued distributions | $ | $ | $ | ||||||||||||||
| Change in accrued stockholder servicing fee due to affiliate | $ | ( | $ | $ | |||||||||||||
| Redeemable non-controlling interest issued as settlement of performance participation allocation | $ | $ | $ | ||||||||||||||
| Issuance of non-controlling interests for payment of management fees | $ | $ | $ | ||||||||||||||
| Issuance of Class I shares for payment of management fees | $ | $ | $ | ||||||||||||||
| Promote receivable for redeemable non-controlling interest issued in excess of performance participation allocation | $ | $ | $ | ||||||||||||||
| Exchange of redeemable non-controlling interest for Class I or Class C shares | $ | $ | $ | ||||||||||||||
| Exchange of redeemable non-controlling interest for Class I or Class B units | $ | $ | $ | ||||||||||||||
| Exchange of non-controlling interest for Class I shares | $ | $ | $ | ||||||||||||||
| Allocation to redeemable non-controlling interest | $ | $ | $ | ||||||||||||||
| Distribution reinvestment | $ | $ | $ | ||||||||||||||
| Accrued repurchases | $ | $ | $ | ||||||||||||||
| Mortgage payable proceeds in escrow | $ | $ | $ | ||||||||||||||
| Investment in single family rental homes risk retention securities | $ | $ | $ | ||||||||||||||
| Receivable for proceeds from disposition of real estate | $ | $ | $ | ||||||||||||||
| Payable for unsettled investments in real estate debt | $ | $ | $ | ||||||||||||||
| Receivable for unsettled investments in real estate debt | $ | $ | $ | ||||||||||||||
| Net increase in additional paid-in capital resulting from purchases of non-controlling interest | $ | $ | $ | ||||||||||||||
| Interest rate contract receivables resulting from terminated interest rate derivative assets | $ | $ | $ | ||||||||||||||
| Receipt of interest rate derivative assets in exchange for interest rate contract receivables | $ | $ | $ | ||||||||||||||
| Insurance receivable for involuntary conversion | $ | $ | $ | ||||||||||||||
| Consolidation of securitization vehicles | $ | $ | $ | ||||||||||||||
| Deconsolidation of securitization vehicles | $ | $ | $ | ||||||||||||||
| Increases (Decreases) in assets and liabilities resulting from consolidation of previously unconsolidated entities: | |||||||||||||||||
| Investments in real estate, net | $ | $ | $ | ||||||||||||||
| Other assets | $ | $ | $ | ||||||||||||||
| Mortgage loans, net | $ | ( | $ | $ | |||||||||||||
| Other liabilities | $ | ( | $ | $ | |||||||||||||
| Non-controlling interests attributable to third party joint ventures | $ | ( | $ | $ | |||||||||||||
See accompanying notes to consolidated financial statements.
F-9
Blackstone Real Estate Income Trust, Inc.
Notes to Consolidated Financial Statements
1. Organization and Business Purpose
Blackstone Real Estate Income Trust, Inc. (“BREIT” or the “Company”) invests primarily in stabilized, income-generating commercial real estate in the United States and, to a lesser extent, outside the United States. The Company to a lesser extent invests in real estate debt investments. The Company is the sole general partner and majority limited partner of BREIT Operating Partnership L.P., a Delaware limited partnership (“BREIT OP”). BREIT Special Limited Partner L.P. (the “Special Limited Partner”), a wholly-owned subsidiary of Blackstone Inc. (together with its affiliates, “Blackstone”), owns a special limited partner interest in BREIT OP. Substantially all of the Company’s business is conducted through BREIT OP. The Company and BREIT OP are externally managed by BX REIT Advisors L.L.C. (the “Adviser”). The Adviser is part of the real estate group of Blackstone, a leading global investment manager. The Company was formed on November 16, 2015 as a Maryland corporation and qualifies as a real estate investment trust (“REIT”) for U.S. federal income tax purposes.
The Company registered an offering with the Securities and Exchange Commission (the “SEC”) of up to $60.0 billion in shares of common stock, consisting of up to $48.0 billion in shares in its primary offering and up to $12.0 billion in shares pursuant to its distribution reinvestment plan, which the Company began using to offer shares of its common stock in March 2022 (the “Current Offering”). The Company intends to sell any combination of its Class S, I, T and D shares of its common stock, with a dollar value up to the maximum aggregate amount of the Current Offering. The share classes have different upfront selling commissions, dealer manager fees and ongoing stockholder servicing fees. In addition to the Current Offering, the Company is conducting private offerings of Class I and Class C shares to feeder vehicles that offer interests in such vehicles to non-U.S. persons. Each of these transactions is exempt from the registration provisions of the Securities Act of 1933, as amended (the "Securities Act") by virtue of Section 4(a)(2) and/or Regulation D or Regulation S promulgated thereunder. The Company intends to continue selling shares on a monthly basis. As of December 31, 2023, the Company had received aggregate net proceeds of $74.2 billion from selling shares of the Company’s common stock through the Current Offering, prior offerings registered with the SEC, and in unregistered private offerings.
As of December 31, 2023, the Company owned 4,834 properties and 28,324 single family rental homes. The Company currently operates in nine reportable segments: Rental Housing, Industrial, Net Lease, Data Centers, Hospitality, Self Storage, Retail, and Office properties, and Investments in Real Estate Debt. Rental Housing includes multifamily and other types of rental housing such as manufactured, student, affordable and single family rental housing, as well as senior living. Net Lease includes the real estate assets of The Bellagio Las Vegas (the “Bellagio”) and The Cosmopolitan of Las Vegas (the “Cosmopolitan”). Financial results by segment are reported in Note 16 — Segment Reporting.
2. Summary of Significant Accounting Policies
Basis of Presentation
The accompanying consolidated financial statements have been prepared in accordance with accounting principles generally accepted in the United States of America (“GAAP”) and include the accounts of the Company, the Company’s subsidiaries and joint ventures in which the Company has a controlling financial interest. All intercompany balances and transactions have been eliminated in consolidation.
Certain amounts in the Company’s prior period Consolidated Statements of Operations included in income from equity securities and interest rate derivatives of ($476.9 902.7
Additionally, certain amounts in the Company’s prior period Consolidated Statements of Operations included in (loss) income from investments in real estate debt of $140.0 million for the year ended December 31, 2022 have been reclassified to (loss) income from interest rate derivatives and interest expense, net in the amounts of $122.3 million and $17.7 million, respectively, to conform to the current period presentation. For the year ended December 31, 2021, certain amounts included in income (loss) from investments in real estate debt of $44.9 million have been reclassified to (loss) income from interest rate derivatives and interest expense, net in the amounts of $57.5 million and ($12.6 million), respectively, to conform to the current period presentation.
F-10
Principles of Consolidation
The Company consolidates all entities in which it has a controlling financial interest through majority ownership or voting rights and variable interest entities whereby the Company is the primary beneficiary. In determining whether the Company has a controlling financial interest in a partially owned entity and the requirement to consolidate the accounts of that entity, the Company considers whether the entity is a variable interest entity (“VIE”) and whether it is the primary beneficiary. The Company is the primary beneficiary of a VIE when it has (i) the power to direct the most significant activities impacting the economic performance of the VIE and (ii) the obligation to absorb losses or receive benefits significant to the VIE. Entities that do not qualify as VIEs are generally considered voting interest entities (“VOEs”) and are evaluated for consolidation under the voting interest model. VOEs are consolidated when the Company controls the entity through a majority voting interest or other means.
For consolidated joint ventures, the non-controlling partner’s share of the assets, liabilities, and operations of each joint venture is included in non-controlling interests as equity of the Company. The non-controlling partner’s interest is generally computed as the joint venture partner’s ownership percentage. Certain of the joint ventures formed by the Company provide the other partner a profits interest based on certain internal rate of return hurdles being achieved. Any profits interest due to the other partner is also reported within non-controlling interests.
When the requirements for consolidation are not met and the Company has significant influence over the operations of the entity, the investment is accounted for under the equity method of accounting. Investments in unconsolidated entities for which the Company has not elected a fair value option are initially recorded at cost and subsequently adjusted for the Company’s pro-rata share of net income, contributions and distributions. When the Company elects the fair value option (“FVO”), the Company records its share of net asset value of the entity and any related unrealized gains and losses.
The Company owns certain subordinate securities in CMBS securitizations that give the Company certain rights with respect to the underlying loans that serve as collateral for the CMBS securitization. In particular, these subordinate securities typically give the holder the right to direct certain activities of the securitization on behalf of all securityholders, which could impact the securitization's overall economic performance. Such rights, along with the obligation to absorb losses and receive benefits from the ownership of the subordinate securities, require consolidation of these securitizations, which are considered VIEs under GAAP.
As of December 31, 2023, the total assets and liabilities of the Company’s consolidated VIEs, excluding BREIT OP, were $50.3 billion and $37.4 billion, respectively, compared to $52.1 billion and $37.8 billion, respectively, as of December 31, 2022. Such amounts are included on the Company’s Consolidated Balance Sheets.
Use of Estimates
The preparation of consolidated financial statements in conformity with GAAP requires the Company to make estimates and assumptions that affect the reported amounts of assets and liabilities and disclosure of contingent assets and liabilities as of the date of the consolidated financial statements and the reported amounts of revenues and expenses during the reporting period. Actual results may ultimately differ materially from those estimates.
Investments in Real Estate
In accordance with the guidance for business combinations, the Company determines whether the acquisition of a property constitutes a business. If the property acquired does not constitute a business, the Company accounts for the transaction as an asset acquisition. The guidance for business combinations states that when substantially all of the fair value of the gross assets to be acquired is concentrated in a single identifiable asset or group of similar identifiable assets, the asset or set of assets is not a business. All property acquisitions to date, have been accounted for as asset acquisitions.
Whether the acquisition of a property acquired is considered a business combination or asset acquisition, the Company recognizes the identifiable assets acquired, the liabilities assumed, and any non-controlling interest in the acquired entity. In addition, for transactions that are business combinations, the Company evaluates the existence of goodwill or a gain from a bargain purchase. The Company expenses acquisition-related costs associated with business combinations as they are incurred. The Company capitalizes acquisition-related costs associated with asset acquisitions.
F-11
Upon acquisition of a property, the Company assesses the fair value of acquired tangible and intangible assets (including land, buildings, tenant improvements, “above-market” and “below-market” leases, acquired in-place leases, other identified intangible assets and assumed liabilities) and allocates the purchase price to the acquired assets and assumed liabilities. The Company assesses and considers fair value based on estimated cash flow projections that utilize discount and/or capitalization rates that it deems appropriate, as well as other available market information. Estimates of future cash flows are based on a number of factors including the historical operating results, known and anticipated trends, and market and economic conditions.
The fair value of the tangible assets of an acquired property considers the value of the property as if it were vacant. The Company records acquired above-market and below-market leases at their fair values (using a discount rate that reflects the risks associated with the leases acquired) equal to the difference between (1) the contractual amounts to be paid pursuant to each in-place lease and (2) the Company’s estimate of fair market lease rates for each corresponding in-place lease, measured over a period equal to the remaining term of the lease for above-market leases and the initial term plus the term of any below-market fixed rate renewal options for below-market leases. The Company records acquired in-place lease values based on its evaluation of the specific characteristics of each tenant’s lease. Factors to be considered include estimates of carrying costs during hypothetical expected lease-up periods considering current market conditions, and costs to execute similar leases. In estimating carrying costs, the Company includes real estate taxes, insurance and other operating expenses and estimates of lost rentals at market rates during the expected lease-up periods, depending on local market conditions. In estimating costs to execute similar leases, the Company considers leasing commissions, legal and other related expenses.
The Company also considers an allocation of purchase price of other acquired intangibles, including acquired in-place leases that may have a customer relationship intangible value, including (but not limited to) the nature and extent of the existing relationship with the tenants, the tenants’ credit quality and expectations of lease renewals. Based on its acquisitions to date, the Company’s allocation to customer relationship intangible assets has not been material.
Intangible assets and intangible liabilities are recorded as a component of Other Assets and Other Liabilities, respectively, on the Company’s Consolidated Balance Sheets. The amortization of acquired above-market and below-market leases is recorded as an adjustment to Rental Revenue on the Company’s Consolidated Statements of Operations. The amortization of below-market and pre-paid ground leases are recorded as an adjustment to Rental Property Operating or Hospitality Operating Expenses, as applicable, on the Company’s Consolidated Statements of Operations. The amortization of in-place leases is recorded as an adjustment to Depreciation and Amortization Expense on the Company’s Consolidated Statements of Operations.
The cost of buildings and improvements includes the purchase price of the Company’s properties and any acquisition-related costs, along with any subsequent improvements to such properties. The Company’s investments in real estate are stated at cost and are generally depreciated on a straight-line basis over the estimated useful lives of the assets as follows:
| Description | Depreciable Life | |||||||
| Building | ||||||||
| Building- and land improvements | ||||||||
| Furniture, fixtures and equipment | ||||||||
| Lease intangibles | Over lease term | |||||||
Significant improvements to properties are capitalized. When assets are sold or retired, their costs and related accumulated depreciation are removed from the Company’s Consolidated Balance Sheets with the resulting gains or losses reflected in net income or loss for the period.
Repairs and maintenance are expensed as incurred and are included in Rental Property Operating and Hospitality Operating Expenses on the Company’s Consolidated Statements of Operations.
F-12
investments. No
Properties Held-for-Sale
Investments in Unconsolidated Entities
Investments in unconsolidated entities are initially recorded at cost and subsequently adjusted for the Company’s pro-rata share of net income (loss), contributions, and distributions. The Company’s investments in unconsolidated entities are periodically assessed for impairment and an impairment loss is recorded when the fair value of the investment falls below the carrying value and such decline is determined to be other-than-temporary.
The Company has elected the fair value option ("FVO") for certain of its investments in unconsolidated entities and therefore reports these investments at fair value. As such, the resulting unrealized gains and losses are recorded as a component of Income From Unconsolidated Entities on the Company’s Consolidated Statements of Operations.
Investments in Real Estate Debt
The Company’s investments in real estate debt consists of securities and loans. The Company has elected to classify its real estate debt securities as trading securities and carry such investments at fair value. As such, the resulting unrealized gains and losses of such securities are recorded as a component of Income/(Loss) from Investments in Real Estate Debt on the Company’s Consolidated Statements of Operations.
The Company elected the FVO for its investments in loans. As such, the resulting unrealized gains and losses of such loans are recorded as a component of Income/(Loss) from Investments in Real Estate Debt on the Company’s Consolidated Statements of Operations.
Interest income from the Company’s investments in real estate debt is recognized over the life of each investment using the effective interest method and is recorded on the accrual basis. Recognition of premiums and discounts associated with these investments is deferred and recorded over the term of the investment as an adjustment to yield. Interest income is recorded as a component of Income/(Loss) from Investments in Real Estate Debt on the Company’s Consolidated Statements of Operations.
Consolidated Securitization Vehicles
The Company consolidates certain CMBS securitizations within its financial statements. The consolidation of these securitizations results in a gross presentation of the underlying collateral loans as discrete assets, as well as inclusion of the senior CMBS positions owned by third-parties, which are presented as liabilities on the Company’s Consolidated Balance Sheets. Additionally, the changes in fair value of these positions include the interest income and interest expense associated with such CMBS VIEs. The Company does not consider the separate presentation of the components of fair value changes to be relevant, and has elected to present these items in the aggregate as “Change in net assets of consolidated securitization vehicles” on the Company’s Consolidated Statements of Operations. The residual difference between the fair value of the consolidated securitization’s assets and liabilities represents the Company’s beneficial interest in such vehicles. The Company’s Consolidated Statements of Cash Flows includes (i) the consolidation and deconsolidation the securitization vehicles as a non-cash item, (ii) the subsequent repayments of consolidated loans and related CMBS positions presented on a gross basis, and (iii) the Company's purchases and sales of non-controlling securities in consolidated securitization vehicles classified as financing activities. There is no impact from consolidation on the Company’s total equity, net income, cash flows from operating activities, or net cash flows.
F-13
Cash and Cash Equivalents
Cash and cash equivalents represent cash held in banks, cash on hand, and liquid investments with original maturities of three months or less. The Company may have bank balances in excess of federally insured amounts; however, the Company deposits its cash and cash equivalents with high credit-quality institutions to minimize credit risk.
Restricted Cash
As of December 31, 2023 and 2022, restricted cash primarily consists of $636.0 million and $764.6 million, respectively, of amounts in escrow related to real estate taxes and insurance in connection with mortgages at certain of the Company’s properties and security deposits. Other restricted cash primarily consists of cash received for subscriptions prior to the date in which the subscriptions are effective, which is held in a bank account controlled by the Company’s transfer agent in the name of the Company.
Foreign Currency
In the normal course of business, the Company makes investments in real estate and real estate debt outside the United States (“U.S.”) through subsidiaries that have a non-U.S. dollar functional currency. Non-U.S. dollar denominated assets and liabilities of these foreign subsidiaries are translated to U.S. dollars at the prevailing exchange rate at the reporting date and income, expenses, gains, and losses are translated at the average exchange rate over the applicable period. Cumulative translation adjustments arising from the translation of non-U.S. dollar denominated assets and liabilities are recorded in Other Comprehensive Income (Loss).
Derivative Financial Instruments
The Company reports its derivative financial instruments as a component of other assets or other liabilities on its Consolidated Balance Sheets at fair value.
On the date the Company enters into a derivative contract, the Company designates each contract as (i) a hedge of a net investment in a foreign operation, or net investment hedge, (ii) a hedge of a forecasted transaction or of the variability of cash flows to be received or paid related to a recognized asset or liability, or cash flow hedge, (iii) a hedge of a recognized asset or liability, or fair value hedge, or (iv) a derivative instrument not to be designated as a hedging derivative, or non-designated hedge. For all derivatives other than those designated as non-designated hedges, the Company formally documents its hedge relationships and designation at the contract’s inception. This documentation includes the identification of the hedging instruments and the hedged items, its risk management objectives, strategy for undertaking the hedge transaction and its evaluation of the effectiveness of its hedged transaction.
On a quarterly basis, the Company also formally assesses whether the derivative designated in each hedging relationship is expected to be, and has been, highly effective in offsetting changes in the value or cash flows of the hedged items. If it is determined that a derivative is not highly effective at hedging the designated exposure, hedge accounting is discontinued and the changes in fair value of the instrument are included in net income prospectively. All changes in the fair value of derivative instruments that qualify as hedges are reported as a component of accumulated other comprehensive income (loss) on our consolidated financial statements. Deferred gains and losses are reclassified out of accumulated other comprehensive income (loss) and into net income in the same period or periods during which the hedged transaction affects earnings, and are presented in the same line item as the earnings effect of the hedged item. For cash flow hedges, this is typically when the periodic swap settlements are made. To the extent a derivative does not qualify for hedge accounting and is deemed a non-designated hedge, the changes in its fair value are included in net income concurrently.
Proceeds or payments from premiums and periodic settlements of derivative instruments are classified in the same section of the Company's Consolidated Statements of Cash Flows as the underlying hedged item.
Deferred Charges
The Company’s deferred charges include financing and leasing costs. Deferred financing costs include legal, structuring, and other loan costs incurred by the Company for its financing agreements. Deferred financing costs related to the Company’s mortgage loans and term loans are recorded as an offset to the related liability and amortized over the term of the applicable financing instruments. Deferred financing costs related to the Company’s unsecured revolving credit facilities are recorded as a component of Other Assets on the Company’s Consolidated Balance Sheets and amortized over the term of the applicable financing agreements. Deferred leasing costs incurred in connection with new leases, which consist primarily of brokerage and legal fees, are recorded as a component of Other Assets on the Company’s Consolidated Balance Sheets and amortized over the life of the related lease.
F-14
Equity Securities
The Company’s investments in equity securities of public and private real estate-related companies and its investments in a preferred equity security are reported at fair value. As such, the resulting unrealized gains and losses are recorded as a component of Other (Expense) Income on the Company’s Consolidated Statements of Operations. Dividend income from the Company’s equity securities of public real estate-related companies is recognized on the ex-dividend date, while dividend income on its investment in a preferred equity security accrues daily based on the stated terms of the agreement and is payable quarterly in cash. Dividend income is recorded as a component of Other (Expense) Income on the Company’s Consolidated Statements of Operations. Equity securities are recorded as a component of Other Assets on the Company’s Consolidated Balance Sheets.
Revenue Recognition
The Company’s sources of revenue and the related revenue recognition policies are as follows:
Rental revenue — primarily consists of base rent and tenant reimbursement income arising from tenant leases at the Company’s rental housing, industrial, net lease, data center, self storage, retail and office properties. Base rent is recognized on a straight-line basis over the life of the lease, including any rent steps or abatement provisions. The Company begins to recognize revenue upon the acquisition of the related property or when a tenant takes possession of the leased space. Tenant reimbursement income primarily consists of amounts due from tenants for costs related to common area maintenance, real estate taxes, and other recoverable costs included in lease agreements.
Hospitality revenue — consists of income from the Company’s hospitality properties. Hospitality revenue consists primarily of room revenue and food and beverage revenue. Room revenue is recognized when the related room is occupied and other hospitality revenue is recognized when the service is rendered.
The Company evaluates the collectability of receivables related to rental revenue on an individual lease basis and exercises judgment in assessing collectability considering the length of time a receivable has been outstanding, tenant credit-worthiness, payment history, available information about the financial condition of the tenant, and current economic trends, among other factors. Tenant receivables that are deemed uncollectible are recognized as a reduction to rental revenue.
Organization and Offering Costs
Organization costs are expensed as incurred and recorded as a component of General and Administrative Expense on the Company’s Consolidated Statements of Operations and offering costs are charged to equity as such amounts are incurred.
The Adviser agreed to advance $10.2 million of certain organization and offering costs on behalf of the Company (including legal, marketing and fulfillment, regulatory, due diligence, administrative, accounting, tax, transfer agent and other expenses attributable to the Company’s organization, but excluding upfront selling commissions, dealer manager fees and stockholder servicing fees) through December 31, 2017. Such costs are recorded as a component of Due to Affiliates on the Company’s Consolidated Balance Sheets and are being reimbursed to the Adviser pro rata over 60 months beginning January 1, 2018. For both of the years ended December 31, 2022 and 2021, the Company reimbursed $2.0 no new organization costs incurred in 2023.
Blackstone Securities Partners L.P. (the “Dealer Manager”), a registered broker-dealer affiliated with the Adviser, serves as the dealer manager for the Offering. The Dealer Manager is entitled to receive selling commissions and dealer manager fees based on the transaction price of each applicable class of shares sold in the Offering. The Dealer Manager is also entitled to receive a stockholder servicing fee of 0.85 %, 0.85 % and 0.25 % per annum of the aggregate net asset value (“NAV”) of the Company’s outstanding Class S shares, Class T shares, and Class D shares, respectively. There is no stockholder servicing fee with respect to Class I shares, Class C and Class F shares. Offering costs are charged to equity as such amounts are incurred.
The following table details the selling commissions, dealer manager fees, and stockholder servicing fees for each applicable share class as of December 31, 2023:
| Class S Shares | Class I Shares | Class T Shares | Class D Shares | Class C Shares | Class F Shares | |||||||||||||||||||||||||||||||||
Selling commissions and dealer manager fees (% of transaction price) | up to | — | up to | up to | — | — | ||||||||||||||||||||||||||||||||
| Stockholder servicing fee (% of NAV) | — | — | — | |||||||||||||||||||||||||||||||||||
F-15
For Class S shares sold in the Offering (other than as part of the Company’s distribution reinvestment plan), investors will pay upfront selling commissions of up to 3.5 % of the transaction price. For Class T shares sold in the Offering (other than as part of the Company’s distribution reinvestment plan), investors will pay upfront selling commissions of up to 3.0 % of the transaction price and upfront dealer manager fees of 0.5 % of the transaction price, however such amounts may vary at certain participating broker-dealers, provided that the sum will not exceed 3.5 % of the transaction price. For Class D shares sold in the Offering (other than as part of the Company’s distribution reinvestment plan), investors will pay upfront selling commissions of up to 1.5 % of the transaction price.
The Dealer Manager is entitled to receive stockholder servicing fees of 0.85 0.65 % per annum, and a dealer stockholder servicing fee of 0.20 % per annum, of the aggregate NAV for the Class T shares, however, with respect to Class T shares sold through certain participating broker-dealers, the advisor stockholder servicing fee and the dealer stockholder servicing fee may be other amounts, provided that the sum of such fees will always equal 0.85 % per annum of the NAV of such shares. For Class D shares, a stockholder servicing fee equal to 0.25 % per annum of the aggregate NAV for the Class D shares.
Income Taxes
The Company qualifies to be taxed as a REIT under the Internal Revenue Code of 1986, as amended (the “Code”), for U.S. federal income tax purposes. The Company generally will not be subject to federal corporate income tax to the extent it distributes 100% of its taxable income to its stockholders. REITs are subject to a number of other organization and operational requirements. Even if the Company qualifies for taxation as a REIT, it may be subject to certain state and local taxes on its income and property, and federal income and excise taxes on its undistributed income.
Fair Value Measurements
Under normal market conditions, the fair value of an investment is the amount that would be received to sell an asset or transfer a liability in an orderly transaction between market participants at the measurement date (i.e., the exit price). The Company uses a hierarchical framework that prioritizes and ranks the level of market price observability used in measuring investments at fair value. Market price observability is impacted by a number of factors, including the type of investment and the characteristics specific to the investment, and the state of the marketplace, including the existence and transparency of transactions between market participants. Investments with readily available actively quoted prices or for which fair value can be measured from actively quoted prices generally will have a higher degree of market price observability and a lesser degree of judgment used in measuring fair value.
F-16
Investments measured and reported at fair value are classified and disclosed in one of the following levels within the fair value hierarchy:
Level 1 — quoted prices are available in active markets for identical investments as of the measurement date. The Company does not adjust the quoted price for these investments.
Level 2 — quoted prices are available in markets that are not active or model inputs are based on inputs that are either directly or indirectly observable as of the measurement date.
Level 3 — pricing inputs are unobservable and include instances where there is minimal, if any, market activity for the investment. These inputs require significant judgment or estimation by management or third parties when determining fair value and generally represent anything that does not meet the criteria of Levels 1 and 2. Due to the inherent uncertainty of these estimates, these values may differ materially from the values that would have been used had a ready market for these investments existed.
Valuation of assets and liabilities measured at fair value
The Company’s investments in real estate debt are reported at fair value. As of December 31, 2023 and December 31, 2022, the Company’s investments in real estate debt, directly or indirectly, consisted of commercial mortgage backed securities (“CMBS”) and residential mortgage-backed securities (“RMBS”), which are securities backed by one or more mortgage loans secured by real estate assets, as well as corporate bonds, term loans, mezzanine loans, and other investments in debt issued by real estate-related companies or secured by real estate assets. The Company generally determines the fair value of its investments in real estate debt by utilizing third-party pricing service providers whenever available.
In determining the fair value of a particular investment, pricing service providers may use broker-dealer quotations, reported trades or valuation estimates from their internal pricing models to determine the reported price. The pricing service providers’ internal models for securities such as real estate debt generally consider the attributes applicable to a particular class of the security (e.g., credit rating, seniority), current market data, and estimated cash flows for each security, and incorporate specific collateral performance, as applicable.
Certain of the Company’s investments in real estate debt, such as mezzanine loans and other investments, are unlikely to have readily available market quotations. In such cases, the Company will generally determine the initial value based on the acquisition price of such investment if acquired by the Company or the par value of such investment if originated by the Company. Following the initial measurement, the Company generally engages third party service providers to perform valuations for such investments. The service provider will determine fair value by utilizing or reviewing certain of the following (i) market yield data, (ii) discounted cash flow modeling, (iii) collateral asset performance, (iv) local or macro real estate performance, (v) capital market conditions, (vi) debt yield or loan-to-value ratios, and (vii) borrower financial condition and performance. Refer to Note 5 for additional details on the Company’s investments in real estate debt.
The Company has elected to apply the measurement alternative under GAAP and measures both the financial assets and financial liabilities of the CMBS securitizations it consolidates using the fair value of the financial liabilities, which it considers more observable than the fair value of the financial assets.
The Company’s investments in equity securities of public and private real estate-related companies are reported at fair value. In determining the fair value of public equity securities, the Company utilizes the closing price of such securities in the principal market in which the security trades (Level 1 inputs). In determining the fair value of its preferred equity security, the Company utilizes inputs such as stock volatility, discount rate, and risk-free interest rate (Level 2 inputs). To determine the fair value of an investment in a private real estate company, the Company utilizes inputs such as the multiples of comparable companies and select financial statement metrics (Level 3 inputs). As of both December 31, 2023 and December 31, 2022, the Company’s equity securities were recorded as a component of Other Assets on the Company’s Consolidated Balance Sheets.
The resulting unrealized and realized gains and losses from investments in equity securities of public and private real estate-related companies are recorded as a component of Other Income (Expense) on the Company’s Consolidated Statements of Operations. During the years ended December 31, 2023, 2022 and 2021, the Company recognized $37.9 million of net unrealized/realized gain, $520.8 million of net unrealized/realized loss, and $848.2 million of net unrealized gain, respectively, on its investments in equity securities.
F-17
The Company has elected the FVO for certain of its investments in unconsolidated entities and therefore, reports these investments at fair value. The Company separately values the assets and liabilities of the investments in unconsolidated entities. To determine the fair value of the real estate assets of the investments in unconsolidated entities, the Company utilizes a discounted cash flow methodology or market comparable methodology, taking into consideration various factors including discount rate, exit capitalization rate and multiples of comparable companies. The Company utilizes third party service providers to perform valuations of the indebtedness of the investments in unconsolidated entities. The fair value of the indebtedness of the investments in unconsolidated entities is determined by modeling the cash flows and discounting them back to the present value using weighted average cost of debt. Additionally, current market rates and conditions are considered by evaluating similar borrowing agreements with comparable loan-to-value ratios and credit profiles. After the fair value of the assets and liabilities are determined, the Company applies its ownership interest to the net asset value and reflects this amount as its investments in unconsolidated entities at fair value. The inputs used in determining the Company’s investments in unconsolidated entities carried at fair value are considered Level 3. The Company discloses the weighted average cost of capital, which combines the discount rate on the fair value of real estate and the weighted average cost of debt on the fair value of the indebtedness, and exit capitalization rate as key Level 3 inputs.
The Company’s derivative financial instruments are reported at fair value and consist of foreign currency and interest rate contracts. The fair values of the Company's foreign currency and interest rate contracts were estimated using advice from a third-party derivative specialist, based on contractual cash flows and observable inputs comprising yield curves, foreign currency rates and credit spreads (Level 2 inputs).
The following table details the Company’s assets and liabilities measured at fair value on a recurring basis ($ in thousands):
| December 31, 2023 | December 31, 2022 | ||||||||||||||||||||||||||||||||||||||||||||||
| Level 1 | Level 2 | Level 3 | Total | Level 1 | Level 2 | Level 3 | Total | ||||||||||||||||||||||||||||||||||||||||
| Assets: | |||||||||||||||||||||||||||||||||||||||||||||||
| Investments in real estate debt | $ | $ | $ | $ | $ | $ | $ | $ | |||||||||||||||||||||||||||||||||||||||
| Real estate loans held by consolidated securitization vehicles, at fair value | |||||||||||||||||||||||||||||||||||||||||||||||
Equity securities(1) | |||||||||||||||||||||||||||||||||||||||||||||||
| Investments in unconsolidated entities | |||||||||||||||||||||||||||||||||||||||||||||||
Interest rate and foreign currency hedging derivatives(1) | |||||||||||||||||||||||||||||||||||||||||||||||
| Total | $ | $ | $ | $ | $ | $ | $ | $ | |||||||||||||||||||||||||||||||||||||||
| Liabilities: | |||||||||||||||||||||||||||||||||||||||||||||||
| Senior obligations of consolidated securitization vehicles, at fair value | $ | $ | $ | $ | $ | $ | $ | $ | |||||||||||||||||||||||||||||||||||||||
Interest rate and foreign currency hedging derivatives(2) | |||||||||||||||||||||||||||||||||||||||||||||||
| Total | $ | $ | $ | $ | $ | $ | $ | $ | |||||||||||||||||||||||||||||||||||||||
(1)Included in Other Assets in the Company’s Consolidated Balance Sheets.
(2)Included in Other Liabilities in the Company’s Consolidated Balance Sheets.
F-18
The following table details the Company’s assets and liabilities measured at fair value on a recurring basis using Level 3 inputs ($ in thousands):
| Investments in Real Estate Debt | Equity Securities | Investments in Unconsolidated Entities | Real estate loans held by consolidated securitization vehicles, at fair value | Total Assets | Senior obligation of consolidated securitization vehicles, at fair value | ||||||||||||||||||||||||||||||
Balance as of December 31, 2021 | $ | $ | $ | $ | $ | $ | |||||||||||||||||||||||||||||
| Purchases and contributions | |||||||||||||||||||||||||||||||||||
| Sales and repayments | ( | ( | |||||||||||||||||||||||||||||||||
| Distributions received | ( | ( | |||||||||||||||||||||||||||||||||
| Included in net income | |||||||||||||||||||||||||||||||||||
| Income from unconsolidated entities measured at fair value | |||||||||||||||||||||||||||||||||||
Realized gain | ( | ( | |||||||||||||||||||||||||||||||||
Unrealized gain | |||||||||||||||||||||||||||||||||||
Transfer out of Level 3 | ( | ( | ( | ||||||||||||||||||||||||||||||||
| Balance as of December 31, 2022 | $ | $ | $ | $ | $ | $ | |||||||||||||||||||||||||||||
| Purchases and contributions | |||||||||||||||||||||||||||||||||||
| Sales and repayments | ( | ( | ( | ( | |||||||||||||||||||||||||||||||
| Distributions received | ( | ( | |||||||||||||||||||||||||||||||||
| Included in net income | |||||||||||||||||||||||||||||||||||
| Income from unconsolidated entities measured at fair value | |||||||||||||||||||||||||||||||||||
Realized loss | ( | ||||||||||||||||||||||||||||||||||
Unrealized gain | |||||||||||||||||||||||||||||||||||
Transfer out of Level 3(1) | ( | ( | |||||||||||||||||||||||||||||||||
| Balance as of December 31, 2023 | $ | $ | $ | $ | $ | $ | |||||||||||||||||||||||||||||
(1)Transferred from Level 3 to Level 2 as this investment is under contract for sale as of December 31, 2023.
The following tables contain the quantitative inputs and assumptions used for items categorized in Level 3 of the fair value hierarchy ($ in thousands):
| December 31, 2023 | |||||||||||||||||||||||||||||
| Fair Value | Valuation Technique | Unobservable Inputs | Weighted Average Rate | Impact to Valuation from an Increase in Input | |||||||||||||||||||||||||
| Assets | |||||||||||||||||||||||||||||
| Investments in real estate loans | $ | Yield method | Market yield | Decrease | |||||||||||||||||||||||||
| Investments in unconsolidated entities | $ | Discounted cash flow | Weighted average cost of capital | Decrease | |||||||||||||||||||||||||
Exit capitalization rate | Decrease | ||||||||||||||||||||||||||||
| December 31, 2022 | |||||||||||||||||||||||||||||
| Fair Value | Valuation Technique | Unobservable Inputs | Weighted Average Rate | Impact to Valuation from an Increase in Input | |||||||||||||||||||||||||
| Assets | |||||||||||||||||||||||||||||
| Investments in real estate loans | $ | Yield method | Market yield | Decrease | |||||||||||||||||||||||||
| Equity securities | $ | Market comparable | Enterprise value/ stabilized EBITDA | Increase | |||||||||||||||||||||||||
| Investments in unconsolidated entities | $ | Discounted cash flow | Weighted average cost of capital | Decrease | |||||||||||||||||||||||||
Exit capitalization rate | Decrease | ||||||||||||||||||||||||||||
| $ | Market comparable | LTM EBITDA multiple | Increase | ||||||||||||||||||||||||||
F-19
Valuation of assets measured at fair value on a nonrecurring basis
Certain of the Company’s assets are not measured at fair value on an ongoing basis but are subject to fair value adjustments, such as when there is evidence of impairment, and therefore measured at fair value on a nonrecurring basis. The Company reviews its real estate properties for impairment each quarter or when there is an event or change in circumstances that could indicate the carrying amount of the real estate value may not be recoverable.
During the year ended December 31, 2023, the Company recognized an aggregate $204.8 million of impairment charges related to one office property, two student housing properties, 25 affordable housing properties, and various single family rental homes. The impairments were the result of updates to the undiscounted cash flow assumptions to account for a shorter hold period, as the Company is considering a potential disposition of these investments. The cumulative fair value of such real estate investments at the time of impairment was $585.7 million, and was estimated utilizing a discounted cash flow method. The significant unobservable inputs utilized in the analysis were the discount rate (Level 3), which ranged from 6.3 % to 9.4 %, and the exit capitalization rate (Level 3), which ranged from 4.3 % to 12.6 %. During the year ended December 31, 2022, there was no such impairment charge.
During the years ended December 31, 2023 and 2022, the Company recognized an aggregate of $31.3 million and $33.6 million, respectively, of impairment charges related to certain held-for-sale real estate investments where their carrying amount exceeded their fair value, less estimated closing costs. The significant unobservable input utilized in the analysis was the purchase price, which is considered a Level 2 input. Refer to Note 3 for additional details of the impairments.
Valuation of liabilities not measured at fair value
As of December 31, 2023 and December 31, 2022, the fair value of the Company’s mortgage loans, secured term loans, secured revolving credit facilities, secured financings on investments in real estate debt, and unsecured revolving credit facilities was $1.3 billion and $1.4 billion, respectively, below carrying value. Fair value of the Company’s indebtedness is estimated by modeling the cash flows required by the Company’s debt agreements and discounting them back to the present value using an estimated market yield. Additionally, current market rates and conditions are considered by evaluating similar borrowing agreements with comparable loan-to-value ratios and credit profiles. The Company utilizes third party service providers to perform these valuations. The inputs used in determining the fair value of the Company’s indebtedness are considered Level 3.
Earnings Per Share
Basic net loss per share of common stock is determined by dividing net loss attributable to common stockholders by the weighted average number of common shares outstanding during the period. All classes of common stock are allocated net income/(loss) at the same rate per share and receive the same gross distribution per share.
Stock-Based Compensation
F-20
disposition of Simply Self Storage. Refer to Note 10 for additional information on the awards issued to certain employees of the affiliate portfolio companies.
The following table details the incentive compensation awards issued to certain employees of Simply Self Storage, HPA, April Housing and ACC ($ in thousands):
December 31, 2022 | For the Year Ended December 31, 2023 | December 31, 2023 | ||||||||||||||||||||||||||||||||||||
| Plan Year | Unrecognized Compensation Cost | Forfeiture of unvested awards | Value of Awards Issued | Amortization of Compensation Cost | Unrecognized Compensation Cost | Remaining Amortization Period | ||||||||||||||||||||||||||||||||
| 2021 | $ | $ | $ | $ | ( | $ | ||||||||||||||||||||||||||||||||
| 2022 | ( | ( | ||||||||||||||||||||||||||||||||||||
| 2023 | ( | |||||||||||||||||||||||||||||||||||||
| Total | $ | $ | ( | $ | $ | ( | $ | |||||||||||||||||||||||||||||||
Recent Accounting Pronouncements
In December 2023, the FASB issued Accounting Standards Update (“ASU”) 2023-09 “Income Taxes (Topic 740): Improvements to Income Tax Disclosures,” or ASU 2023-09. ASU 2023-09 requires additional disaggregated disclosures on the entity’s effective tax rate reconciliation and additional details on income taxes paid. ASU 2023-09 is effective on a prospective basis, with the option for retrospective application, for annual periods beginning after December 15, 2024 and early adoption is permitted. The Company does not expect the adoption of ASU 2023-09 to have a material impact on its consolidated financial statements.
In November 2023, the FASB issued ASU 2023-07 “Segment Reporting (Topic 280): Improvements to Reportable Segment Disclosures,” or ASU 2023-07. ASU 2023-07 enhances the disclosures required for reportable segments on an annual and interim basis. ASU 2023-07 is effective on a retrospective basis for annual periods beginning after December 15, 2023, for interim periods within fiscal years beginning after December 15, 2024, and early adoption is permitted. The Company does not expect the adoption of ASU 2023-07 to have a material impact on its consolidated financial statements.
In March 2020, the FASB issued ASU 2020-04 “Reference Rate Reform (Topic 848): Facilitation of the Effects of Reference Rate Reform on Financial Reporting,” or ASU 2020-04. ASU 2020-04 provides optional expedients and exceptions to GAAP requirements for modifications on debt instruments, leases, derivatives, and other contracts, related to the market transition from LIBOR, and certain other floating rate benchmark indices, or collectively, “IBORs,” to alternative reference rates. ASU 2020-04 generally considers contract modifications related to reference rate reform to be an event that does not require contract remeasurement at the modification date nor a reassessment of a previous accounting determination. In January 2021, the FASB issued ASU 2021-01 “Reference Rate Reform (Topic 848): Scope,” or ASU 2021-01. ASU 2021-01 clarifies that the practical expedients in ASU 2020-04 apply to derivatives impacted by changes in the interest rate used for margining, discounting, or contract price alignment. In December 2022, the FASB issued ASU 2022-06 “Reference Rate Reform (Topic 848): Deferral of the Sunset Date of Topic 848,” or ASU 2022-06. ASU 2022-06 deferred the sunset date of ASU 2020-04 to December 31, 2024. The guidance in ASU 2020-04 is optional and may be elected over time, through December 31, 2024, as reference rate reform activities occur. Once ASU 2020-04 is elected, the guidance must be applied prospectively for all eligible contract modifications. During the year ended December 31, 2023, the Company adopted ASU 2020-04. The adoption of ASU 2020-04 did not have a material impact on the Company’s consolidated financial statements.
F-21
3. Investments in Real Estate
Investments in real estate, net consisted of the following ($ in thousands):
| December 31, 2023 | December 31, 2022 | ||||||||||
| Building and building improvements | $ | $ | |||||||||
| Land and land improvements | |||||||||||
| Furniture, fixtures and equipment | |||||||||||
| Total | |||||||||||
| Accumulated depreciation and amortization | ( | ( | |||||||||
| Investments in real estate, net | $ | $ | |||||||||
(1)Refer to Note 15 for additional details on the Company’s leases.
Acquisitions
During the year ended December 31, 2023, the Company acquired 110 wholly-owned single family rental homes as well as one rental housing land parcel for a total purchase price of $41.4 million. The Company allocated $30.1 million to building and building improvements and $11.3 million to land and land improvements. During the year ended December 31, 2023, there were no acquired intangibles.
During the year ended December 31, 2022, the Company acquired 270 rental housing properties, 51 retail properties, 34 self storage properties, 13 industrial properties, eight office properties, seven hospitality properties, three data center properties, one net lease and various wholly-owned single family rental homes for a total purchase price of $35.9 billion. The company allocated $29.3 billion to building and building improvements, $4.4 billion to land and land improvements and $2.2 billion to other components of the purchase price.
Dispositions
The following table details the dispositions during the years set forth below ($ in thousands):
| Year Ended December 31, 2023 | Year Ended December 31, 2022 | Year Ended December 31, 2021 | |||||||||||||||||||||||||||||||||||||||||||||||||||||||||
| Segments | Number of Properties | Net Proceeds | Net Gain (Loss)(1) | Number of Properties | Net Proceeds | Net Gain(1) | Number of Properties | Net Proceeds | Net Gain(1) | ||||||||||||||||||||||||||||||||||||||||||||||||||
Rental Housing properties(2) | $ | $ | $ | $ | $ | $ | |||||||||||||||||||||||||||||||||||||||||||||||||||||
Self Storage properties(3) | |||||||||||||||||||||||||||||||||||||||||||||||||||||||||||
| Hospitality properties | |||||||||||||||||||||||||||||||||||||||||||||||||||||||||||
| Industrial properties | |||||||||||||||||||||||||||||||||||||||||||||||||||||||||||
| Retail properties | |||||||||||||||||||||||||||||||||||||||||||||||||||||||||||
| Office properties | ( | ||||||||||||||||||||||||||||||||||||||||||||||||||||||||||
| Total | $ | $ | $ | $ | $ | $ | |||||||||||||||||||||||||||||||||||||||||||||||||||||
(1)For the year ended December 31, 2023, net gain (loss) includes gains of $2.0 billion and losses of $67.1 million. For the year ended December 31, 2022, net gain includes gains of $898.2 million and losses of $89.4 million. For the year ended December 31, 2021, net gain includes gains of $32.4 million and losses of $24.5 million.
(2)The number of properties excludes single family rental homes sold.
F-22
Properties Held-for-Sale
As of December 31, 2023, 21 properties in the Rental Housing segment, one property in the Industrial segment, one property in the Retail segment, and various single family rental homes were classified as held-for-sale. As of December 31, 2022, 23 properties in the Rental Housing segment were classified as held-for-sale. The held-for-sale assets and related liabilities are included as components of Other Assets and Other Liabilities, respectively, on the Company’s Consolidated Balance Sheets.
The following table details the assets and liabilities of the Company’s properties classified as held-for-sale ($ in thousands):
| Assets: | December 31, 2023 | December 31, 2022 | |||||||||
| Investments in real estate, net | $ | $ | |||||||||
| Other assets | |||||||||||
| Total assets | $ | $ | |||||||||
| Liabilities: | |||||||||||
| Mortgage loans, net | $ | $ | |||||||||
| Other liabilities | |||||||||||
| Total liabilities | $ | $ | |||||||||
Impairment
During the year ended December 31, 2023, the Company recognized an aggregate $236.1 million of impairment charges including (i) $204.8 million related to one office property, two student housing properties, 25 affordable housing properties, and various single family rental homes as a result of updates to the undiscounted cash flow assumptions to account for a shorter hold period, and (ii) $31.3 million related to certain held-for-sale real estate investments where their carrying amount exceeded their fair value, less estimated closing costs. During the year ended December 31, 2022, the Company recognized an aggregate of $33.6 million of impairment charges related to certain held-for-sale real estate investments where their carrying amount exceeded their fair value, less estimated closing costs. The Company did not recognize any impairment charges during the year ended December 31, 2021.
F-23
4. Investments in Unconsolidated Entities
The Company holds investments in joint ventures that it accounts for under the equity method of accounting or the fair value option, as the Company’s ownership interest in each joint venture does not meet the requirements for consolidation. Refer to Note 2 for additional details.
The following tables detail the Company’s investments in unconsolidated entities ($ in thousands):
| December 31, 2023 | ||||||||||||||||||||||||||||||||
| Investment in Joint Venture | Segment | Number of Joint Ventures | Number of Properties | Ownership Interest | Book Value | |||||||||||||||||||||||||||
| Unconsolidated entities carried at historical cost: | ||||||||||||||||||||||||||||||||
QTS Data Centers(1) | Data Centers | $ | ||||||||||||||||||||||||||||||
Rental Housing investments(2) | Rental Housing | |||||||||||||||||||||||||||||||
| Hospitality investment | Hospitality | |||||||||||||||||||||||||||||||
Industrial investments(3) | Industrial | |||||||||||||||||||||||||||||||
| Retail investments | Retail | |||||||||||||||||||||||||||||||
| Total unconsolidated entities carried at historical cost | ||||||||||||||||||||||||||||||||
| Unconsolidated entities carried at fair value: | ||||||||||||||||||||||||||||||||
Industrial investments(4) | Industrial | |||||||||||||||||||||||||||||||
Data Center investments(5) | Data Centers | N/A | ||||||||||||||||||||||||||||||
| Office investments | Office | |||||||||||||||||||||||||||||||
Total unconsolidated entities carried at fair value | ||||||||||||||||||||||||||||||||
Total | $ | |||||||||||||||||||||||||||||||
(1)The Company along with certain Blackstone-managed investment vehicles formed a joint venture (“QTS Data Centers”) and acquired all outstanding shares of common stock of QTS Realty Trust (“QTS”).
(2)Includes 10,658 single family rental homes, that are not included in the number of properties.
(3)Includes $244.2 million from investments in three joint ventures formed by the Company and certain Blackstone-managed investment vehicles.
(4)Includes $2.3 billion from investments in three joint ventures formed by the Company and certain Blackstone-managed investment vehicles.
(5)Includes $549.1 million from investments in a digital towers joint venture formed by the Company and certain Blackstone-managed investment vehicles.
F-24
| December 31, 2022 | ||||||||||||||||||||||||||||||||
| Investment in Joint Venture | Segment | Number of Joint Ventures | Number of Properties | Ownership Interest | Book Value | |||||||||||||||||||||||||||
| Unconsolidated entities carried at historical cost: | ||||||||||||||||||||||||||||||||
QTS Data Centers(1) | Data Centers | $ | ||||||||||||||||||||||||||||||
Rental Housing investments(2) | Rental Housing | |||||||||||||||||||||||||||||||
| MGM Grand & Mandalay Bay | Net Lease | |||||||||||||||||||||||||||||||
| Hospitality investment | Hospitality | |||||||||||||||||||||||||||||||
Industrial investments(3) | Industrial | |||||||||||||||||||||||||||||||
| Retail investments | Retail | |||||||||||||||||||||||||||||||
| Total unconsolidated entities carried at historical cost | ||||||||||||||||||||||||||||||||
| Unconsolidated entities at carried at fair value: | ||||||||||||||||||||||||||||||||
Industrial investments(4) | Industrial | |||||||||||||||||||||||||||||||
Data Center investments(5) | Data Centers | N/A | ||||||||||||||||||||||||||||||
| Office investments | Office | |||||||||||||||||||||||||||||||
Total unconsolidated entities carried at fair value | ||||||||||||||||||||||||||||||||
| Total | $ | |||||||||||||||||||||||||||||||
(1)The Company along with certain Blackstone-managed investment vehicles formed a joint venture (“QTS Data Centers”) and acquired all outstanding shares of common stock of QTS Realty Trust (“QTS”).
(2)Includes 10,767 wholly-owned single family rental homes, that are not included in the number of properties.
(3)Includes $242.9 million from investments in three joint ventures formed by the Company and certain Blackstone-managed investment vehicles.
(4)Includes $2.8 billion from investments in four joint ventures formed by the Company and certain Blackstone-managed investment vehicles.
(5)Includes $674.4 million from investments in a digital towers joint venture formed by the Company and certain Blackstone-managed investment vehicles.
The following table details the Company’s income from unconsolidated entities ($ in thousands):
For the Year Ended December 31, | ||||||||||||||||||||||||||
| BREIT Income (Loss) from Unconsolidated Entities | Segment | 2023 | 2022 | 2021 | ||||||||||||||||||||||
| Unconsolidated entities carried at historical cost: | ||||||||||||||||||||||||||
| QTS Data Centers | Data Centers | $ | ( | $ | ( | $ | ( | |||||||||||||||||||
| Rental Housing investments | Rental Housing | ( | ( | ( | ||||||||||||||||||||||
MGM Grand & Mandalay Bay(1) | Net Lease | |||||||||||||||||||||||||
| Hospitality investment | Hospitality | ( | ||||||||||||||||||||||||
| Industrial investments | Industrial | ( | ( | |||||||||||||||||||||||
| Retail investments | Retail | ( | ( | |||||||||||||||||||||||
| Total unconsolidated entities carried at historical cost | ( | |||||||||||||||||||||||||
| Unconsolidated entities carried at fair value: | ||||||||||||||||||||||||||
Industrial investments(2) | Industrial | |||||||||||||||||||||||||
| Data Center investments | Data Centers | ( | ( | |||||||||||||||||||||||
| Office investments | Office | ( | ||||||||||||||||||||||||
| Total unconsolidated entities carried at fair value | ||||||||||||||||||||||||||
| Total | $ | $ | $ | |||||||||||||||||||||||
(1)On January 9, 2023, the Company sold its 49.9 % interest in MGM Grand Las Vegas and Mandalay Bay Resort for cash consideration of $1.3 billion, resulting in a gain on sale of $430.4 million.
(2)On May 25, 2023, the Company sold its 7.9 % interest in a logistics business to an affiliate of Blackstone for cash consideration of $547.0 million, resulting in a realized gain of $37.1 million.
F-25
The following tables provide the combined summarized financial information of our unconsolidated joint ventures as of the dates and for the periods set forth below ($ in thousands):
| Balance Sheets: | December 31, 2023 | December 31, 2022 | ||||||||||||
| Total assets | $ | $ | ||||||||||||
| Total liabilities | $ | $ | ||||||||||||
| BREIT’s share of net equity | $ | $ | ||||||||||||
| BREIT fair value adjustment | ||||||||||||||
| BREIT outside basis | ||||||||||||||
| BREIT investments in unconsolidated entities | $ | $ | ||||||||||||
| For the Year Ended December 31, | ||||||||||||||||||||
| Income Statements: | 2023 | 2022 | 2021 | |||||||||||||||||
| Total revenues | $ | $ | $ | |||||||||||||||||
| Net income | $ | $ | $ | |||||||||||||||||
| BREIT’s share of net income | $ | $ | $ | |||||||||||||||||
| BREIT fair value adjustment | ( | |||||||||||||||||||
| Amortization of outside basis | ( | ( | ( | |||||||||||||||||
| BREIT income from unconsolidated entities | $ | $ | $ | |||||||||||||||||
F-26
5. Investments in Real Estate Debt
The following tables detail the Company’s investments in real estate debt ($ in thousands):
| December 31, 2023 | ||||||||||||||||||||||||||||||||
Type of Security/Loan(1) | Weighted Average Coupon(2) | Weighted Average Maturity Date(3) | Face Amount | Cost Basis | Fair Value | |||||||||||||||||||||||||||
CMBS(4) | + | 7/16/2032 | $ | $ | $ | |||||||||||||||||||||||||||
| RMBS | 3/11/2060 | |||||||||||||||||||||||||||||||
| Corporate bonds | 7/9/2031 | |||||||||||||||||||||||||||||||
| Total real estate securities | 8/28/2033 | |||||||||||||||||||||||||||||||
| Commercial real estate loans | + | 10/12/2026 | ||||||||||||||||||||||||||||||
Other investments(5)(6) | 9/21/2029 | |||||||||||||||||||||||||||||||
| Total investments in real estate debt | 3/26/2032 | $ | $ | $ | ||||||||||||||||||||||||||||
| December 31, 2022 | ||||||||||||||||||||||||||||||||
Type of Security/Loan(1) | Weighted Average Coupon(2) | Weighted Average Maturity Date(3) | Face Amount | Cost Basis | Fair Value | |||||||||||||||||||||||||||
CMBS(4) | + | 12/10/2032 | $ | $ | $ | |||||||||||||||||||||||||||
| RMBS | + | 1/21/2053 | ||||||||||||||||||||||||||||||
| Corporate bonds | 3/17/2031 | |||||||||||||||||||||||||||||||
| Total real estate securities | 11/4/2033 | |||||||||||||||||||||||||||||||
| Commercial real estate loans | + | 7/17/2026 | ||||||||||||||||||||||||||||||
Other investments(5) | 9/21/2029 | |||||||||||||||||||||||||||||||
| Total investments in real estate debt | 5/25/2032 | $ | $ | $ | ||||||||||||||||||||||||||||
(1)This table does not include the Company’s Controlling Class Securities in certain CMBS securitizations that have been consolidated on the Company’s financial statements. The underlying collateral loans and the senior CMBS positions owned by third-parties of such securitizations are presented separately on the Company’s Consolidated Balance Sheets. See Note 6 to the consolidated financial statements.
(2)The symbol “+” refers to the relevant floating benchmark rates, which include SOFR, SONIA, and EURIBOR, as applicable to each security and loan. Fixed rate CMBS and commercial real estate loans are reflected as a spread over the relevant floating benchmark rates for purposes of the weighted-averages. Weighted Average Coupon for CMBS does not include zero-coupon securities.
(3)Weighted average maturity date is based on the fully extended maturity date of the instrument.
(4)Face amount excludes interest-only securities with a notional amount of $0.6 billion and $1.1 billion as of December 31, 2023 and December 31, 2022, respectively.
(5)Includes interests in unconsolidated joint ventures that hold investments in real estate debt.
(6)Weighted average coupon rate and weighted average maturity date exclude our investment in a joint venture with the Federal Deposit Insurance Corporation (“FDIC”).
F-27
The following table details the collateral type of the properties securing the Company’s investments in real estate debt ($ in thousands):
| December 31, 2023 | December 31, 2022 | |||||||||||||||||||||||||||||||||||||
Collateral(1) | Cost Basis | Fair Value | Percentage Based on Fair Value | Cost Basis | Fair Value | Percentage Based on Fair Value | ||||||||||||||||||||||||||||||||
| Industrial | $ | $ | $ | $ | ||||||||||||||||||||||||||||||||||
Rental Housing(2) | ||||||||||||||||||||||||||||||||||||||
| Net Lease | ||||||||||||||||||||||||||||||||||||||
| Hospitality | ||||||||||||||||||||||||||||||||||||||
| Other | ||||||||||||||||||||||||||||||||||||||
| Office | ||||||||||||||||||||||||||||||||||||||
| Diversified | ||||||||||||||||||||||||||||||||||||||
| Total | $ | $ | $ | $ | ||||||||||||||||||||||||||||||||||
(1)This table does not include the Company’s Controlling Class Securities in certain CMBS securitizations that have been consolidated on the Company’s financial statements. The underlying collateral loans and the senior CMBS positions owned by third-parties of such securitizations are presented separately on the Company’s Consolidated Balance Sheets. See Note 6 to the consolidated financial statements.
(2)Rental Housing investments in real estate debt are collateralized by various forms of rental housing including apartments and single family rental homes.
The following table details the credit rating of the Company’s investments in real estate debt ($ in thousands):
| December 31, 2023 | December 31, 2022 | |||||||||||||||||||||||||||||||||||||
Credit Rating(1) | Cost Basis | Fair Value | Percentage Based on Fair Value | Cost Basis | Fair Value | Percentage Based on Fair Value | ||||||||||||||||||||||||||||||||
| AA | $ | $ | $ | $ | ||||||||||||||||||||||||||||||||||
| A | ||||||||||||||||||||||||||||||||||||||
| BBB | ||||||||||||||||||||||||||||||||||||||
| BB | ||||||||||||||||||||||||||||||||||||||
| B | ||||||||||||||||||||||||||||||||||||||
| CCC | ||||||||||||||||||||||||||||||||||||||
| D | ||||||||||||||||||||||||||||||||||||||
| Private commercial real estate loans | ||||||||||||||||||||||||||||||||||||||
Not rated(2) | ||||||||||||||||||||||||||||||||||||||
| Total | $ | $ | $ | $ | ||||||||||||||||||||||||||||||||||
(1)This table does not include the Company’s Controlling Class Securities in certain CMBS securitizations that have been consolidated on the Company’s financial statements. The underlying collateral loans and the senior CMBS positions owned by third-parties of such securitizations are presented separately on the Company’s Consolidated Balance Sheets. See Note 6 to the consolidated financial statements.
(2)As of December 31, 2023, not rated positions have a weighted-average LTV at origination of 64 %, are primarily composed of 55 % industrial and 39 % rental housing assets, and include interest-only securities with a fair value of $9.0 million.
F-28
The following table details the Company’s income (loss) from investments in real estate debt ($ in thousands):
| Year Ended December 31, | ||||||||||||||||||||
| 2023 | 2022 | 2021 | ||||||||||||||||||
| Interest income | $ | $ | $ | |||||||||||||||||
| Unrealized gain (loss) | ( | |||||||||||||||||||
| Realized (loss) gain | ( | ( | ||||||||||||||||||
| Total | ( | |||||||||||||||||||
| Net realized and unrealized (loss) gain on derivatives | ( | |||||||||||||||||||
| Net realized and unrealized (loss) gain on secured financings of investments in real estate debt | ( | |||||||||||||||||||
| Other expense | ( | ( | ( | |||||||||||||||||
| Total income (loss) from investments in real estate debt | $ | $ | ( | $ | ||||||||||||||||
The Company’s investments in real estate debt included certain CMBS and loans collateralized by properties owned by other Blackstone-advised investment vehicles. The following table details the Company’s investments in affiliated real estate debt ($ in thousands):
| Fair Value | Income (Loss) | ||||||||||||||||||||||||||||
| Year Ended December 31, | |||||||||||||||||||||||||||||
| December 31, 2023 | December 31, 2022 | 2023 | 2022 | 2021 | |||||||||||||||||||||||||
| CMBS | $ | $ | $ | $ | ( | $ | |||||||||||||||||||||||
| Commercial real estate loans | ( | ||||||||||||||||||||||||||||
| Total | $ | $ | $ | $ | ( | $ | |||||||||||||||||||||||
The Company acquired such affiliated CMBS from third-parties on market terms negotiated by the majority third-party investors. The Company has forgone all non-economic rights under these CMBS, including voting rights, so long as the Blackstone-advised investment vehicles either own the properties collateralizing the underlying loans, or have an interest in a different part of the capital structure of such CMBS.
The Company acquired commercial real estate loans to borrowers that are owned by Blackstone-advised investment vehicles. The Company has forgone all non-economic rights under these loans, including voting rights, so long as the Blackstone-advised investment vehicle controls the borrowers. These loans were negotiated by third parties without the Company’s involvement.
As of both December 31, 2023 and December 31, 2022, the Company’s investments in real estate debt also included $1.9 250.5 million, $62.1 million and $47.6 million of income related to such CMBS during the years ended December 31, 2023, 2022, and 2021, respectively.
F-29
6. Consolidated Securitization Vehicles
The Company has acquired the controlling class securities of certain CMBS securitizations resulting in the consolidation of such securitizations on its Consolidated Balance Sheets. The consolidation of these securitizations results in a gross presentation of the underlying collateral loans as discrete assets, as well as inclusion of the senior CMBS positions owned by third-parties, which are presented as liabilities on the Company’s Consolidated Balance Sheets. The assets of any particular consolidated securitization can only be used to satisfy the liabilities of that securitization and such assets are not available to the Company for any other purpose. Similarly, the senior CMBS obligations of these securitizations can only be satisfied through repayment of the underlying collateral loans, as they do not have any recourse to the Company or its assets, nor has the Company provided any guarantees with respect to the performance or repayment of the senior CMBS obligations.
The following tables detail the real estate loans held by the consolidated securitization vehicles and the related senior obligations of consolidated securitization vehicles ($ in thousands):
| December 31, 2023 | |||||||||||||||||||||||||||||
| Count | Principal Value | Fair Value | Wtd. Avg. Yield/Cost(1) | Wtd. Avg. Term(2) | |||||||||||||||||||||||||
| Real estate loans held by consolidated securitization vehicles | $ | $ | % | 11/21/2025 | |||||||||||||||||||||||||
| Senior obligations of consolidated securitization vehicles | % | 12/9/2025 | |||||||||||||||||||||||||||
Real estate loans held by consolidated securitization vehicles in excess of senior obligations of consolidated securitization vehicles | $ | $ | % | 6/22/2025 | |||||||||||||||||||||||||
| December 31, 2022 | |||||||||||||||||||||||||||||
| Count | Principal Value | Fair Value | Wtd. Avg. Yield/Cost(1) | Wtd. Avg. Term(2) | |||||||||||||||||||||||||
| Real estate loans held by consolidated securitization vehicles | $ | $ | % | 3/24/2025 | |||||||||||||||||||||||||
| Senior obligations of consolidated securitization vehicles | % | 10/18/2025 | |||||||||||||||||||||||||||
Real estate loans held by consolidated securitization vehicles in excess of senior obligations of consolidated securitization vehicles | $ | $ | % | 5/6/2025 | |||||||||||||||||||||||||
(1)The weighted-average yield and cost represent the all-in rate, which includes both fixed and floating rates, as applicable to each securitization vehicle.
(2)Loan term represents weighted-average final maturity, assuming all extension options are exercised by the borrower. Repayments of senior obligations of consolidated securitization vehicles are tied to timing of the related collateral loan asset repayments. The term of these obligations represents the rated final distribution date of the securitizations.
F-30
7. Mortgage Loans, Secured Term Loans, and Secured Revolving Credit Facilities
The following table details the mortgage loans, secured term loans, and secured revolving credit facilities secured by the Company’s real estate ($ in thousands):
| December 31, 2023 | Principal Balance Outstanding | |||||||||||||||||||||||||||||||
| Indebtedness | Weighted Average Interest Rate(1) | Weighted Average Maturity Date (2)(3) | Maximum Facility Size | December 31, 2023 | December 31, 2022 | |||||||||||||||||||||||||||
| Fixed rate loans: | ||||||||||||||||||||||||||||||||
Fixed rate mortgages(4) | 7/13/2029 | N/A | $ | $ | ||||||||||||||||||||||||||||
| Variable rate loans: | ||||||||||||||||||||||||||||||||
| Variable rate mortgages and secured term loans | 3/29/2027 | N/A | ||||||||||||||||||||||||||||||
Variable rate warehouse facilities(5) | 10/4/2025 | $ | ||||||||||||||||||||||||||||||
Variable rate secured revolving credit facilities(6) | + | 5/22/2026 | $ | |||||||||||||||||||||||||||||
| Total variable rate loans | 1/18/2027 | |||||||||||||||||||||||||||||||
| Total loans secured by real estate | 1/1/2028 | |||||||||||||||||||||||||||||||
| (Discount) premium on assumed debt, net | ( | ( | ||||||||||||||||||||||||||||||
| Deferred financing costs, net | ( | ( | ||||||||||||||||||||||||||||||
| Mortgage loans, secured term loans, and secured revolving credit facilities, net | $ | $ | ||||||||||||||||||||||||||||||
(1)“+” refers to the relevant floating benchmark rates, which include SOFR, CDOR, and EURIBOR as applicable to each loan. As of December 31, 2023, the Company had outstanding interest rate swaps with an aggregate notional balance of $32.4 billion and interest rate caps with an aggregate notional balance of $9.6 billion that mitigate its exposure to potential future interest rate increases under its floating-rate debt. Total weighted average interest rate does not include the impact of derivatives.
(2)Weighted average maturity assumes maximum maturity date, including any extensions, where the Company, at its sole discretion, has one or more extension options.
(3)The majority of the Company’s mortgages contain yield or spread maintenance provisions.
(4)Includes $293.3 million and $364.5 million of loans related to investments in affordable housing properties as of December 31, 2023 and December 31, 2022, respectively. Such loans are generally from municipalities, housing authorities, and other third parties administered through government sponsored affordable housing programs. Certain of these loans may be forgiven if specific affordable housing conditions are maintained.
(5)Additional borrowings under the Company’s variable rate warehouse facilities require additional collateral, which are subject to lender approval.
The following table details the future principal payments due under the Company’s mortgage loans, secured term loans, and secured revolving credit facilities as of December 31, 2023 ($ in thousands):
| Year | Amount | |||||||
| 2024 | $ | |||||||
| 2025 | ||||||||
| 2026 | ||||||||
| 2027 | ||||||||
| 2028 | ||||||||
| Thereafter | ||||||||
| Total | $ | |||||||
The Company repaid certain of its loans in conjunction with the sale or refinancing of the underlying properties and incurred an aggregate realized net loss on extinguishment of debt of $40.3 million, $11.5 million and $16.3 million for the years ended December 31, 2023, 2022, and 2021, respectively. Such losses primarily resulted from the acceleration of related deferred financing costs, prepayment penalties, and transaction costs.
The Company is subject to various financial and operational covenants under certain of its mortgage loans, secured term loans, and secured revolving credit facility agreements. These covenants require the Company to maintain certain financial ratios, which include leverage, debt yield, and debt service coverage, among others. As of December 31, 2023, the Company was in compliance with all of its loan covenants.
F-31
8. Secured Financings of Investments in Real Estate Debt
The Company has entered into master repurchase agreements and other financing agreements secured by certain of its investments in real estate debt. The terms of the master repurchase agreements and other financing agreements provide the lenders the ability to determine the size and terms of the financing provided based upon the particular collateral pledged by the Company from time-to-time, and may require the Company to provide additional collateral in the form of cash, securities, or other assets if the market value of such financed investments decline.
The following tables detail the Company’s secured financings of investments in real estate debt ($ in thousands):
| December 31, 2023 | ||||||||||||||||||||||||||
| Collateral Type | Borrowings Outstanding | Collateral Assets(1) | Weighted Average Interest Rate (2) | Weighted Average Maturity Date | ||||||||||||||||||||||
| CMBS | $ | $ | + | 1/17/2025 | ||||||||||||||||||||||
| Commercial real estate loans | + | 4/21/2024 | ||||||||||||||||||||||||
| RMBS | + | 10/29/2024 | ||||||||||||||||||||||||
| Corporate bonds | + | 11/6/2024 | ||||||||||||||||||||||||
| $ | $ | + | ||||||||||||||||||||||||
| December 31, 2022 | ||||||||||||||||||||||||||
| Collateral Type | Borrowings Outstanding | Collateral Assets(1) | Weighted Average Interest Rate (2) | Weighted Average Maturity Date | ||||||||||||||||||||||
| CMBS | $ | $ | + | 12/27/2023 | ||||||||||||||||||||||
| Commercial real estate loans | + | 11/18/2023 | ||||||||||||||||||||||||
| Corporate bonds | + | 3/23/2024 | ||||||||||||||||||||||||
| RMBS | + | 10/5/2023 | ||||||||||||||||||||||||
| $ | $ | + | ||||||||||||||||||||||||
(1)Represents the fair value of the Company’s investments in real estate debt that serve as collateral.
(2)“+” refers to the relevant floating benchmark rates, which include SOFR, EURIBOR, and SONIA, as applicable to each secured financing. As of December 31, 2023 and December 31, 2022, the Company had interest rate swaps outstanding with a notional value of $0.6 billion and $1.4 billion, respectively, that effectively converts a portion of its fixed rate investments in real estate debt to floating rates to mitigate its exposure to potential future interest rate increases under its floating-rate debt. Total weighted average interest rate does not include the impact of such interest rate swaps or other derivatives.
9. Unsecured Revolving Credit Facilities and Term Loans
The Company is party to unsecured credit facilities with multiple banks. The credit facilities have a weighted average maturity date of November 29, 2024, which may be extended for one year , and an interest rate of SOFR +2.5 %. As of both December 31, 2023 and December 31, 2022, the maximum capacity of the credit facilities was $5.6 no
The Company is party to an unsecured, uncommitted line of credit (the “Line of Credit”) up to a maximum amount of $75.0 million with an affiliate of Blackstone (the “Lender”). The Line of Credit expires on January 24, 2025, and may be extended for up to 12 months, subject to Lender approval. The interest rate is equivalent to the then-current rate offered to the Company by a third-party lender, or, if no such rate is available, SOFR +2.5 %. Each advance under the Line of Credit is repayable on the earliest of (i) the expiration of the Line of Credit, (ii) Lender’s demand and (iii) the date on which the Adviser no longer acts as the Company’s external manager, provided that the Company will have 180 days to make such repayment in the cases of clauses (i) and (ii) and 45 days to make such repayment in the case of clause (iii). As of December 31, 2023 and December 31, 2022, the Company had no
The Company is party to unsecured term loans with multiple banks. The term loans have a weighted average maturity date of January 30, 2026 and an interest rate of SOFR +2.5 %. As of both December 31, 2023 and December 31, 2022, the aggregate outstanding balance of the unsecured term loans was $1.1
F-32
10. Related Party Transactions
Due to Affiliates
The following table details the components of due to affiliates ($ in thousands):
| December 31, 2023 | December 31, 2022 | ||||||||||
| Accrued stockholder servicing fee | $ | $ | |||||||||
| Performance participation allocation | |||||||||||
| Accrued management fee | |||||||||||
| Accrued affiliate service provider expenses | |||||||||||
| Other | |||||||||||
| Total | $ | $ | |||||||||
Accrued Stockholder Servicing Fee
The Company accrues the full amount of the future stockholder servicing fees payable to Blackstone Securities Partners L.P. (the “Dealer Manager”), a registered broker dealer affiliated with the Adviser, for Class S, Class T, and Class D shares, up to the 8.75 % of gross proceeds limit, at the time such shares are sold. The Dealer Manager has entered into agreements with the selected dealers distributing the Company’s shares as part of its continuous public offering, that provide, among other things, for the re-allowance of the full amount of the selling commissions and dealer manager fee, and all or a portion of the stockholder servicing fees received by the Dealer Manager to such selected dealers.
Performance Participation Allocation
The Special Limited Partner holds a performance participation interest in BREIT OP that entitles it to receive an allocation of BREIT OP’s total return. Total return is defined as distributions paid or accrued plus the change in the Company’s Net Asset Value (“NAV”), adjusted for subscriptions and repurchases. Under the BREIT OP agreement, the annual total return will be allocated solely to the Special Limited Partner only after the other unit holders have received a total return of 5 % (after recouping any loss carryforward amount) and such allocation will continue until the allocation between the Special Limited Partner and all other BREIT OP unit holders is equal to 12.5 % and 87.5 %, respectively. Thereafter, the Special Limited Partner will receive an allocation of 12.5 % of the annual total return. The allocation of the performance participation interest is ultimately measured on a calendar year basis and will be paid quarterly in Class I or Class B units of BREIT OP or cash, at the election of the Special Limited Partner. To date, the Special Limited Partner has always elected to be paid in a combination of Class I and Class B units, resulting in a non-cash expense.
Effective March 4, 2022, following the end of each calendar quarter that is not also the end of a calendar year, the Special Limited Partner has been entitled to a performance participation allocation as described above calculated in respect of the portion of the year to date, less any performance participation allocation received with respect to prior quarters in that year (the “Quarterly Allocation”). The performance participation allocation that the Special Limited Partner is entitled to receive at the end of each calendar year will be reduced by the cumulative amount of Quarterly Allocations that year. If a Quarterly Allocation is made and at the end of a subsequent calendar quarter in the same calendar year the Special Limited Partner is entitled to less than the previously received Quarterly Allocation(s) (a “Quarterly Shortfall”), then subsequent distributions of any Quarterly Allocations or year-end performance allocations in that calendar year will be reduced by an amount equal to such Quarterly Shortfall, until such time as no Quarterly Shortfall remains. If all or any portion of a Quarterly Shortfall remains at the end of a calendar year following the application described in the previous sentence, distributions of any Quarterly Allocations and year-end performance allocations in the subsequent four calendar years will be reduced by (i) the remaining Quarterly Shortfall plus (ii) an annual rate of 5 % on the remaining Quarterly Shortfall measured from the first day of the calendar year following the year in which the Quarterly Shortfall arose and compounded quarterly (collectively, the “Quarterly Shortfall Obligation”) until such time as no Quarterly Shortfall Obligation remains; provided, that the Special Limited Partner (or its affiliate) may make a full or partial cash payment to reduce the Quarterly Shortfall Obligation at any time; provided, further, that if any Quarterly Shortfall Obligation remains following such subsequent four calendar years, then the Special Limited Partner (or its affiliate) will promptly pay BREIT OP the remaining Quarterly Shortfall Obligation in cash.
F-33
During the year ended December 31, 2023, the Company did not recognize any performance participation allocation expense in the Company’s Consolidated Statements of Operations due to a negative total return of $355.7 million, which will be treated as a loss carry forward until such amount is recouped. During the years ended December 31, 2022, and 2021 the Company recognized $742.7 million and $1.4 billion, respectively, of performance participation allocation expense in the Company’s Consolidated Statements of Operations. For the year ended December 31, 2022, the full year performance participation allocation was less than the previously distributed Quarterly Allocations resulting in a Quarterly Shortfall amount of $74.9 million. Such Quarterly Shortfall amount is recorded as a receivable from the Special Limited Partner and included as a component of Other Assets on the Company’s Consolidated Balance Sheets. Beginning January 1, 2023, interest on the Quarterly Shortfall began accruing at a 5 % annual rate, compounded quarterly. During the year ended December 31, 2023, the Company accrued interest income of $3.8 million related to such Quarterly Shortfall amount.
As of March 28, 2024, Blackstone owned an aggregate $2.6 billion of shares of the Company and units of BREIT OP. In addition, Blackstone employees, including the Company’s executive officers, owned an aggregate $1.4 billion of shares of the Company and units of BREIT OP.
Accrued Management Fee
The Adviser is entitled to an annual management fee equal to 1.25 % of the Company’s NAV, payable monthly, as compensation for the services it provides to the Company. The management fee can be paid, at the Adviser’s election, in cash, certain classes of shares of the Company’s common stock, or certain classes of BREIT OP units. As of December 31, 2023, the Adviser has elected to receive the management fee in shares of the Company’s common stock and units of BREIT OP, resulting in a non-cash expense. During the years ended December 31, 2023, 2022 and 2021, the Company incurred management fees of $839.2 million, $837.7 million, and $445.3 million, respectively.
During the year ended December 31, 2023, the Company issued 24.8 million unregistered Class I shares and 28.0 million units of BREIT OP to the Adviser as payment for management fees. During the years ended December 31, 2022 and 2021, the Company issued 51.3 million and 30.1 million unregistered Class I shares, respectively, to the Adviser as payment for management fees. On July 31, 2023, 56.7 million Class I shares previously issued for the management fee were exchanged for 56.7 million Class B units of BREIT OP. The Company also had a payable of $63.5 million and $71.6 million related to the management fees as of December 31, 2023 and December 31, 2022, respectively. During January 2024, the Adviser was issued 4.5 million units of BREIT OP as payment for the management fees accrued as of December 31, 2023. The shares and units issued to the Adviser for payment of the management fee were issued at the applicable NAV per share/unit at the end of each month for which the fee was earned. The Adviser did not submit any repurchase requests for shares previously issued as payment for management fees during the years ended December 31, 2023 and 2022.
Accrued affiliate service provider expenses and incentive compensation awards
The Company has engaged Link Logistics Real Estate LLC (“Link”), a portfolio company owned by Blackstone-advised investment vehicles, to provide, as applicable, operational services, management services, loan management services, corporate support services and transaction support services for the Company’s logistics properties.
The Company has engaged LivCor, LLC (“LivCor”), a portfolio company owned by Blackstone-advised investment vehicles, to provide, as applicable, operational services, management services, loan management services, corporate support services and transaction support services for the Company’s multifamily properties.
The Company has engaged ShopCore Properties TRS Management LLC (“ShopCore”), a portfolio company owned by Blackstone-advised investment vehicles, to provide, as applicable, operational services, management services, loan management services, corporate support services and transaction support services for the Company’s retail properties.
The Company has engaged Revantage Corporate Services, LLC and Revantage Global Services Europe S.à r.l. (collectively “Revantage”), portfolio companies owned by Blackstone-advised investment vehicles, to provide, as applicable, corporate support services and transaction support services to certain of our investments directly.
The Company has engaged BRE Hotels & Resorts LLC (“BRE Hotels & Resorts”), a portfolio company owned by Blackstone-advised investment vehicles, to provide, as applicable, operational services, management services, loan management services, corporate support services and transaction support services for the Company’s hospitality properties.
The Company has engaged EQ Management, LLC (“EQ”), a portfolio company owned by Blackstone-advised investment vehicles, to provide, as applicable, operational services, management services, loan management services, corporate support services and transaction support services for the Company’s office properties.
F-34
The Company has engaged BPP MFNY Employer LLC (“Beam Living”), a portfolio company owned by Blackstone-advised investment vehicles, to provide, as applicable, operational services, management services, loan management services and corporate support services for certain of the Company’s multifamily properties in New York City.
The Company has engaged Longview Senior Housing, LLC (“Longview Senior Housing”), a portfolio company owned by Blackstone-advised investment vehicles, to provide, as applicable, operational services, management services, corporate support services and transaction support services for the Company’s senior housing properties.
Affiliate service provider expenses and incentive compensation awards are included as a component of Rental Property Operating and Hospitality Operating expense, as applicable, in the Company’s Consolidated Statements of Operations. Transaction support service fees were capitalized to Investments in Real Estate on the Company’s Consolidated Balance Sheets. Neither Blackstone nor the Adviser receives any fees from these arrangements.
The following table details the amounts incurred for affiliate service providers ($ in thousands):
| Affiliate Service Provider Expenses | Amortization of Affiliate Service Provider Incentive Compensation Awards | Capitalized Transaction Support Services | |||||||||||||||||||||||||||||||||||||||||||||||||||
| Year Ended December 31, | Year Ended December 31, | Year Ended December 31, | |||||||||||||||||||||||||||||||||||||||||||||||||||
| 2023 | 2022 | 2021 | 2023 | 2022 | 2021 | 2023 | 2022 | 2021 | |||||||||||||||||||||||||||||||||||||||||||||
| Link | $ | $ | $ | $ | $ | $ | $ | $ | $ | ||||||||||||||||||||||||||||||||||||||||||||
| LivCor | |||||||||||||||||||||||||||||||||||||||||||||||||||||
| ShopCore | |||||||||||||||||||||||||||||||||||||||||||||||||||||
| Revantage | |||||||||||||||||||||||||||||||||||||||||||||||||||||
| BRE Hotels & Resorts | |||||||||||||||||||||||||||||||||||||||||||||||||||||
| EQ | |||||||||||||||||||||||||||||||||||||||||||||||||||||
| Beam Living | |||||||||||||||||||||||||||||||||||||||||||||||||||||
| Longview Senior Housing | |||||||||||||||||||||||||||||||||||||||||||||||||||||
| $ | $ | $ | $ | $ | $ | $ | $ | $ | |||||||||||||||||||||||||||||||||||||||||||||
The Company issues incentive compensation awards to certain employees of portfolio company service providers. Such awards vest over the life of the awards and stock-based compensation expense is recognized for these awards on a graded vesting attribution method over the applicable vesting period of each award, based on the value of the awards on their grant date, as adjusted for forfeitures. The awards are subject to service periods ranging from to four years . The vesting conditions that are based on the Company achieving certain returns, or other key performance metrics, over a stated hurdle amount are considered market conditions. The achievement of returns, or other key performance metrics, over the stated hurdle amounts, which affect the quantity of awards that vest, is considered a performance condition. If the Company determines it is probable that the performance conditions will be met, the value of the award will be amortized over the service periods, as adjusted for forfeitures. The number of awards expected to vest is evaluated each reporting period and compensation expense is recognized for those awards for which achievement of the performance criteria is considered probable. As of December 31, 2023, the Company has determined it is probable that the performance condition will be met for certain awards and has amortized the value of such awards over the applicable service period. None of Blackstone, the Adviser, or the affiliate portfolio company service providers receive any incentive compensation from the aforementioned arrangements.
The following table details the incentive compensation awards ($ in thousands):
December 31, 2022 | For the Year Ended December 31, 2023 | December 31, 2023 | ||||||||||||||||||||||||||||||||||||
| Plan Year | Unrecognized Compensation Cost | Forfeiture of unvested awards | Value of Awards Issued | Amortization of Compensation Cost | Unrecognized Compensation Cost | Remaining Amortization Period | ||||||||||||||||||||||||||||||||
| 2021 | $ | $ | ( | $ | $ | ( | $ | |||||||||||||||||||||||||||||||
| 2022 | ( | ( | ||||||||||||||||||||||||||||||||||||
| 2023 | ( | |||||||||||||||||||||||||||||||||||||
| $ | $ | ( | $ | $ | ( | $ | ||||||||||||||||||||||||||||||||
F-35
Other
As of December 31, 2023 and December 31, 2022, the Adviser had paid $2.6 million and $1.5 million of expenses on the Company’s behalf for general corporate expenses provided by unaffiliated third parties. Such expenses are reimbursed by the Company to the Advisor in the ordinary course. Additionally, as of December 31, 2023, the Company had a receivable of $4.2 million from certain portfolio companies owned by Blackstone-advised investment vehicles related to incentive compensation awards. As of December 31, 2022, there was no such receivable.
Affiliate Title Service Provider
Blackstone owns Lexington National Land Services (“LNLS”), a title agent company. LNLS acts as an agent for one or more underwriters in issuing title policies and/or providing support services in connection with investments by the Company, Blackstone and their affiliates and related parties, and third-parties. LNLS focuses on transactions in rate-regulated states where the cost of title insurance is non-negotiable. LNLS will not perform services in non-regulated states for the Company, unless (i) in the context of a portfolio transaction that includes properties in rate-regulated states, (ii) as part of a syndicate of title insurance companies where the rate is negotiated by other insurers or their agents, (iii) when a third-party is paying all or a material portion of the premium or (iv) when providing only support services to the underwriter. LNLS earns fees, which would have otherwise been paid to third parties, by providing title agency services and facilitating placement of title insurance with underwriters. Blackstone receives distributions from LNLS in connection with investments by the Company based on its equity interest in LNLS. In each case, there will be no related expense offset to the Company.
During the years ended December 31, 2023 and December 31, 2022, the Company paid LNLS $7.7 million and $27.8 million, respectively, for title services related to, in each case, 53 investments and such costs were either (i) capitalized to Investments in Real Estate, (ii) included in calculating net gain on dispositions of real estate on the Consolidated Statements of Operations or (iii) recorded as deferred financing costs, which is a reduction to Mortgage Loans, Secured Term Loans, and Secured Revolving Credit Facilities on the Consolidated Balance Sheets.
Captive Insurance Company
On July 28, 2020, the Company became a member of a captive insurance company (the “Captive”) owned by the Company and other investment vehicles managed by Blackstone. A Blackstone affiliate provides oversight and management services to the Captive and receives fees based on a percentage of premiums paid for such policies. The fees and expenses of the Captive, including insurance premiums and fees paid to the Blackstone affiliate to manage it, are borne by the Company and the other Blackstone-managed investment vehicles pro rata based on insurance premiums paid for each party’s respective properties.
During the years ended December 31, 2023 and December 31, 2022, the Company contributed $166.2 million and $91.9 million, respectively, of capital to the Captive for insurance premiums and its pro rata share of other expenses. Of these amounts $3.2 million and $1.8 million, respectively, was attributable to the fee paid to a Blackstone affiliate to provide oversight and management services of the Captive. The capital contributed and fees paid are in place of insurance premiums and fees that would otherwise be paid to third party insurance companies.
Other
As of December 31, 2022, the Company had a receivable of $6.0 million from LivCor and such amount is included in Other Assets on the Company’s Consolidated Balance Sheets. As of December 31, 2023, there was no such receivable. As of December 31, 2023, the Company had a receivable of $42.3 million from Link related to the prepayment of certain corporate service fees and such amount is included in Other Assets on the Company’s Consolidated Balance Sheets. As of December 31, 2022, there was no such receivable.
F-36
11. Other Assets and Other Liabilities
The following table details the components of other assets ($ in thousands):
| December 31, 2023 | December 31, 2022 | ||||||||||
| $ | $ | ||||||||||
| Real estate intangibles, net | |||||||||||
| Receivables, net | |||||||||||
| Straight-line rent receivable | |||||||||||
| Held-for-sale assets | |||||||||||
| Equity securities | |||||||||||
| Single family rental homes risk retention securities | |||||||||||
| Prepaid expenses | |||||||||||
| Deferred leasing costs, net | |||||||||||
Due from affiliate(1) | |||||||||||
| Deferred financing costs, net | |||||||||||
| Other | |||||||||||
| Total | $ | $ | |||||||||
(1)Refer to the Performance Participation Allocation section of Note 10 for additional information.
The following table details the components of other liabilities ($ in thousands):
| December 31, 2023 | December 31, 2022 | ||||||||||
| $ | $ | ||||||||||
| Stock repurchases payable | |||||||||||
| Accounts payable and accrued expenses | |||||||||||
| Accrued interest expense | |||||||||||
| Real estate taxes payable | |||||||||||
| Liabilities related to held-for-sale assets | |||||||||||
| Intangible liabilities, net | |||||||||||
| Prepaid rental income | |||||||||||
| Tenant security deposits | |||||||||||
| Distribution payable | |||||||||||
| Subscriptions received in advance | |||||||||||
| Securitized debt obligations, net | |||||||||||
Interest rate and foreign currency hedging derivatives | |||||||||||
| Other | |||||||||||
| Total | $ | $ | |||||||||
F-37
12. Intangibles
The gross carrying amount and accumulated amortization of the Company’s intangible assets and liabilities consisted of the following ($ in thousands):
| December 31, 2023 | December 31, 2022 | ||||||||||
| Intangible assets | |||||||||||
| In-place lease intangibles | $ | $ | |||||||||
| Indefinite life intangibles | |||||||||||
| Above-market lease intangibles | |||||||||||
| Other intangibles | |||||||||||
| Total intangible assets | |||||||||||
| Accumulated amortization | |||||||||||
| In-place lease amortization | ( | ( | |||||||||
| Above-market lease amortization | ( | ( | |||||||||
| Other intangibles amortization | ( | ( | |||||||||
| Total accumulated amortization | ( | ( | |||||||||
| Intangible assets, net | $ | $ | |||||||||
| Intangible liabilities | |||||||||||
| Below-market lease intangibles | $ | $ | |||||||||
| Total intangible liabilities | |||||||||||
| Accumulated amortization | |||||||||||
| Below-market lease amortization | ( | ( | |||||||||
| Total accumulated amortization | ( | ( | |||||||||
| Intangible liabilities, net | $ | $ | |||||||||
The estimated future amortization on the Company’s intangibles for each of the next five years and thereafter as of December 31, 2023 is as follows ($ in thousands):
| In-place Lease Intangibles | Above-market Lease Intangibles | Other Intangibles | Below-market Lease Intangibles | ||||||||||||||||||||
| 2024 | $ | $ | $ | $ | ( | ||||||||||||||||||
| 2025 | ( | ||||||||||||||||||||||
| 2026 | ( | ||||||||||||||||||||||
| 2027 | ( | ||||||||||||||||||||||
| 2028 | ( | ||||||||||||||||||||||
| Thereafter | ( | ||||||||||||||||||||||
Total | $ | $ | $ | $ | ( | ||||||||||||||||||
F-38
13. Derivatives
The Company uses derivative financial instruments to minimize the risks and/or costs associated with the Company’s investments and financing transactions. These derivatives may or may not qualify as net investment, cash flow, or fair value hedges under the hedge accounting requirements of ASC 815 - “Derivatives and Hedging." Derivatives not designated as hedges are not speculative and are used to manage the Company’s exposure to interest rate movements, fluctuations in foreign exchange rates, and other identified risks.
The use of derivative financial instruments involves certain risks, including the risk that the counterparties to these contractual arrangements do not perform as agreed. To mitigate this risk, the Company enters into derivative financial instruments with counterparties it believes to have appropriate credit ratings and that are major financial institutions with which the Company and its affiliates may also have other financial relationships.
Interest Rate Contracts
Certain of the Company’s transactions expose the Company to interest rate risks, which include exposure to variable interest rates on certain loans secured by the Company’s real estate in addition to its secured financings of investments in real estate debt. The Company uses derivative financial instruments, which includes interest rate swaps and caps, and may also include options, floors, and other interest rate derivative contracts, to limit the Company’s exposure to the future variability of interest rates. The Company has the right of offset for certain derivatives, and presents them net on its consolidated financial statements.
The following tables detail the Company’s outstanding interest rate derivatives (notional amount in thousands):
| December 31, 2023 | ||||||||||||||||||||||||||||||||
Interest Rate Derivatives | Number of Instruments | Notional Amount | Weighted Average Strike | Index | Weighted Average Maturity (Years) | |||||||||||||||||||||||||||
Derivatives designated as hedging instruments | ||||||||||||||||||||||||||||||||
| Interest rate swaps - property debt | $ | SOFR | ||||||||||||||||||||||||||||||
Derivatives not designated as hedging instruments | ||||||||||||||||||||||||||||||||
| Interest rate caps - property debt | SOFR | |||||||||||||||||||||||||||||||
Interest rate swaps - property debt | SOFR, EURIBOR | |||||||||||||||||||||||||||||||
Interest rate swaps - secured financings of investments in real estate debt | SOFR | |||||||||||||||||||||||||||||||
| Total | $ | |||||||||||||||||||||||||||||||
| December 31, 2022 | ||||||||||||||||||||||||||||||||
Interest Rate Derivatives | Number of Instruments | Notional Amount | Weighted Average Strike | Index | Weighted Average Maturity (Years) | |||||||||||||||||||||||||||
Derivatives designated as hedging instruments | ||||||||||||||||||||||||||||||||
| Interest rate swaps - property debt | $ | LIBOR, SOFR | ||||||||||||||||||||||||||||||
Derivatives not designated as hedging instruments | ||||||||||||||||||||||||||||||||
| Interest rate caps - property debt | LIBOR, SOFR | |||||||||||||||||||||||||||||||
Interest rate swaps - property debt | LIBOR, SOFR, EURIBOR | |||||||||||||||||||||||||||||||
Interest rate swaps - secured financings of investments in real estate debt | LIBOR, SOFR | |||||||||||||||||||||||||||||||
| Total | $ | |||||||||||||||||||||||||||||||
F-39
Foreign Currency Forward Contracts
Certain of the Company’s international investments expose it to fluctuations in foreign currency exchange rates and interest rates. These fluctuations may impact the value of the Company’s cash receipts and payments in terms of its functional currency, the U.S. dollar. The Company uses foreign currency forward contracts to protect the value or fix the amount of certain investments or cash flows in terms of the U.S. dollar.
The following table details the Company’s outstanding foreign currency forward contracts that were non-designated hedges of foreign currency risk (notional amount in thousands):
| December 31, 2023 | December 31, 2022 | |||||||||||||||||||||||||
| Foreign Currency Forward Contracts | Number of Instruments | Notional Amount | Number of Instruments | Notional Amount | ||||||||||||||||||||||
| Buy USD / Sell EUR Forward | € | € | ||||||||||||||||||||||||
| Buy USD / Sell GBP Forward | £ | £ | ||||||||||||||||||||||||
| Buy EUR / Sell USD Forward | € | € | ||||||||||||||||||||||||
Valuation and Financial Statement Impact
The following table details the fair value of the Company’s derivative financial instruments ($ in thousands):
Fair Value of Derivatives in an Asset(1) Position | Fair Value of Derivatives in a Liability(2) Position | ||||||||||||||||||||||
| December 31, 2023 | December 31, 2022 | December 31, 2023 | December 31, 2022 | ||||||||||||||||||||
Derivatives designated as hedging instruments | |||||||||||||||||||||||
| Interest rate swaps - property debt | $ | $ | $ | $ | |||||||||||||||||||
Total derivatives designated as hedging instruments | |||||||||||||||||||||||
Derivatives not designated as hedging instruments | |||||||||||||||||||||||
Interest rate caps - property debt(3) | |||||||||||||||||||||||
Interest rate swaps - property debt | |||||||||||||||||||||||
Interest rate swaps - secured financings of investments in real estate debt | |||||||||||||||||||||||
| Foreign currency forward contracts | |||||||||||||||||||||||
Total derivatives not designated as hedging instruments | |||||||||||||||||||||||
Total interest rate and foreign currency hedging derivatives | $ | $ | $ | $ | |||||||||||||||||||
(1)Included in Other Assets in the Company’s Consolidated Balance Sheets.
(2)Included in Other Liabilities in the Company’s Consolidated Balance Sheets.
(3)Includes interest rate caps presented on a net basis with an aggregate fair value of $189.7 million and $237.7 million as of December 31, 2023 and December 31, 2022, respectively.
F-40
The following table details the effect of the Company’s derivative financial instruments on the Consolidated Statements of Operations and Consolidated Statements of Comprehensive Income (Loss) ($ in thousands):
Type of Derivative | Realized/Unrealized Gain (Loss) | Location of Gain (Loss) Recognized | Year Ended December 31, | |||||||||||||||||||||||||||||
| 2023 | 2022 | 2021 | ||||||||||||||||||||||||||||||
Included in Net Loss | ||||||||||||||||||||||||||||||||
Interest rate swap – property debt | Unrealized (loss) gain | (1) | $ | ( | $ | $ | ( | |||||||||||||||||||||||||
Interest rate swaps – property debt | Realized gain | (1) | ||||||||||||||||||||||||||||||
| Interest rate caps – property debt | Unrealized (loss) gain | (1) | ( | |||||||||||||||||||||||||||||
Interest rate swaps – secured financings of investments in real estate debt | Unrealized (loss) gain | (1) | ( | |||||||||||||||||||||||||||||
| Foreign currency forward contract | Realized (loss) gain | (2) | ( | |||||||||||||||||||||||||||||
| Foreign currency forward contract | Unrealized gain (loss) | (2) | ( | |||||||||||||||||||||||||||||
| Total | $ | ( | $ | |||||||||||||||||||||||||||||
| Included in Other Comprehensive Income | ||||||||||||||||||||||||||||||||
Interest rate swap – property debt(3) | Unrealized gain | ( | ||||||||||||||||||||||||||||||
| Total | $ | ( | $ | $ | ||||||||||||||||||||||||||||
(1)Included in (loss) income from interest rate derivatives in the Company’s Consolidated Statements of Operations.
(2)Included in income (loss) from investments in real estate debt in the Company’s Consolidated Statements of Operations.
(3)During the years ended December 31, 2023 and December 31, 2022, net gain of $171.4 million and $79.4 million, respectively, was reclassified from accumulated other comprehensive income into net income.
Credit-Risk Related Contingent Features
The Company has entered into agreements with certain of its derivative counterparties that contain provisions whereby if the Company were to default on any of its indebtedness, including default where repayment of the indebtedness has not been accelerated by the lender, the Company may also be declared in default under its derivative obligations. In addition, certain of the Company’s agreements with its derivative counterparties require the Company to post collateral based on a percentage of derivative notional amounts and/or to secure net liability positions.
As of December 31, 2023, the Company was in a net liability position and posted collateral of $23.4 million with three of its counterparties as required under the derivative contracts. As of December 31, 2022, the Company was in a net liability position and posted collateral of $47.6 million with two of its counterparties as required under the derivatives contracts.
F-41
14. Equity and Redeemable Non-controlling Interest
Authorized Capital
As of December 31, 2023, the Company had the authority to issue 12,100,000,000 shares, consisting of the following:
| Number of Shares (in thousands) | Par Value Per Share | |||||||||||||
| Preferred Stock | $ | |||||||||||||
| Class S Shares | $ | |||||||||||||
| Class I Shares | $ | |||||||||||||
| Class T Shares | $ | |||||||||||||
| Class D Shares | $ | |||||||||||||
| Class C Shares | $ | |||||||||||||
| Class F Shares | $ | |||||||||||||
| Total | ||||||||||||||
Common Stock
The following table details the movement in the Company’s outstanding shares of common stock(1) (in thousands):
| Class S | Class I | Class T | Class D | Class C | Total | ||||||||||||||||||||||||||||||
| January 1, 2021 | |||||||||||||||||||||||||||||||||||
| Common stock issued | |||||||||||||||||||||||||||||||||||
| Distribution reinvestment | |||||||||||||||||||||||||||||||||||
| Common stock repurchased | ( | ( | ( | ( | ( | ||||||||||||||||||||||||||||||
Independent directors’ restricted stock grant(2) | |||||||||||||||||||||||||||||||||||
| December 31, 2021 | |||||||||||||||||||||||||||||||||||
| Common stock issued | |||||||||||||||||||||||||||||||||||
| Distribution reinvestment | |||||||||||||||||||||||||||||||||||
| Common stock repurchased | ( | ( | ( | ( | ( | ||||||||||||||||||||||||||||||
Independent directors’ restricted stock grant(2) | |||||||||||||||||||||||||||||||||||
| December 31, 2022 | |||||||||||||||||||||||||||||||||||
Common stock issued(3) | ( | ( | |||||||||||||||||||||||||||||||||
| Distribution reinvestment | |||||||||||||||||||||||||||||||||||
Common stock repurchased(4) | ( | ( | ( | ( | ( | ||||||||||||||||||||||||||||||
Independent directors’ restricted stock grant(2) | |||||||||||||||||||||||||||||||||||
| December 31, 2023 | |||||||||||||||||||||||||||||||||||
(1)As of December 31, 2023, no Class F shares were issued and outstanding.
(2)The independent directors’ restricted stock represents $0.1 one-year service period for each grant.
(3)Includes conversion of shares from Class T and Class D to Class I during the year ended December 31, 2023.
(4)Includes 56.7 million Class I shares previously issued for the management fee that were exchanged for an equivalent amount of Class B units of BREIT OP during the year ended December 31, 2023.
As of January 1, 2023, the Regents of the University of California (“UC Investments”), subscribed for an aggregate 268.9 million Class I shares for a total purchase price of $4.0 billion. The investment was made at the Company’s January 1, 2023 public offering price with fees and terms consistent with existing stockholders. In connection with this investment, a subsidiary of Blackstone entered into a long-term strategic venture with UC Investments.
F-42
Blackstone contributed $1.0 billion of its current holdings in the Company as part of the strategic venture, which provides a waterfall structure with UC Investments receiving a 11.25 % minimum annualized net return on its investment in the Company (supported by a pledge of Blackstone’s contribution) and upside from its investment. In exchange, Blackstone will be entitled to receive an incremental 5 % cash promote payment from UC Investments on any returns received in excess of the specified minimum, in addition to the existing management and incentive fees borne by all holders of Class I shares of the Company. The pledge will also extend to any appreciation and dividends received by Blackstone in respect of the contributed $1.0 billion. After January 2028, the parties have the option to request repurchase of their investments ratably over two years (a minimum average 6-year hold) and any such request will be subject to the terms of our share repurchase plan, as defined below, or policy with Respect to Repurchase of Adviser Class I Shares, dated as of March 10, 2021, as applicable.
On March 1, 2023, UC Investments subscribed for an additional 33.9 million Class I shares for a total purchase price of $500.0 million. This investment was made at the Company’s March 1, 2023 public offering price with fees and terms consistent with existing stockholders. Blackstone contributed an incremental $125.0 million of its current holdings in the Company on the same terms described above.
The Company sold a 23 % common equity interest in a joint venture that owns a 95 % interest in the Bellagio for $300.0 million. The Company also sold a preferred equity interest in the joint venture for $650.0 million. The Company controls the joint venture and will therefore continue to consolidate its investment in the Bellagio. The transaction resulted in a $425.0 million premium over the Company’s carrying value. The aggregate $950.0 million common and preferred equity interest will be included in the Company’s total equity as non-controlling interests.
Share and Unit Repurchases
The Company has adopted a Share Repurchase Plan (the “Repurchase Plan”), which is approved and administered by the Company’s board of directors, whereby, subject to certain limitations, stockholders may request on a monthly basis that the Company repurchases all or any portion of their shares. The Repurchase Plan will be limited to no more than 2 % of the Company’s aggregate NAV per month (measured using the aggregate NAV as of the end of the immediately preceding month) and no more than 5 % of the Company’s aggregate NAV per calendar quarter (measured using the average aggregate NAV as of the end of the immediately preceding three months). For the avoidance of doubt, both of these limits are assessed during each month in a calendar quarter. The Company has in the past received, and may in the future receive, repurchase requests that exceed the limits under the Repurchase Plan, and the Company has in the past repurchased less than the full amount of shares requested, resulting in the repurchase of shares on a pro rata basis.
Should repurchase requests, in the board of directors’ judgment, place an undue burden on its liquidity, adversely affect its operations or risk having an adverse impact on the Company as a whole, or should the board of directors otherwise determine that investing its liquid assets in real properties or other investments rather than repurchasing its shares is in the best interests of the Company as a whole, the Company’s board of directors may determine to repurchase fewer shares than have been requested to be repurchased (including relative to the 2 % monthly limit and 5 % quarterly limit under the Repurchase Plan), or none at all. Further, the Company’s board of directors has in the past made exceptions to the limitations in the Repurchase Plan and may in the future, in certain circumstances, make exceptions to such repurchase limitations (or repurchase fewer shares than such repurchase limitations), or modify or suspend the Repurchase Plan if, in its reasonable judgement, it deems such action to be in the Company’s best interest and the best interest of its stockholders. In the event that the Company receives repurchase requests in excess of the 2 % or 5 % limits, then repurchase requests will be satisfied on a pro rata basis after the Company has repurchased all shares for which repurchase has been requested due to death, disability or divorce and other limited exceptions. All unsatisfied repurchase requests must be resubmitted after the start of the next month or quarter, or upon the recommencement of the Repurchase Plan, as applicable.
For the year ended December 31, 2023, the Company repurchased 874.8 million shares of common stock and 29.3 million units of BREIT OP for a total of $13.3 billion. During the months ended October 31, 2023, November 30, 2023, and December 31, 2023, the
Company received repurchase requests that exceeded the applicable repurchase limits under the Company’s Repurchase Plan. For the
months ended October 31, 2023, November 30, 2023, and December 31, 2023, in accordance with the Repurchase Plan, the Company
fulfilled repurchases equal to 2.0 %, 2.0 % and 1.0 % of NAV, or 56 %, 67 % and 53 % of repurchase requests, respectively.
Distributions
The Company generally intends to distribute substantially all of its taxable income, which does not necessarily equal net income as calculated in accordance with GAAP, to its stockholders each year to comply with the REIT provisions of the Internal Revenue Code.
Each class of common stock receives the same gross distribution per share. The net distribution varies for each class based on the applicable stockholder servicing fee, which is deducted from the monthly distribution per share and paid directly to the applicable distributor. Class C shares currently have no distribution amount presented as the class is generally an accumulating share class whereby its share of income will accrete into its NAV.
F-43
The following table details the aggregate distributions declared for each applicable class of common stock:
| Year Ended December 31, 2023 | |||||||||||||||||||||||
| Class S | Class I | Class T | Class D | ||||||||||||||||||||
| Aggregate gross distributions declared per share of common stock | $ | $ | $ | $ | |||||||||||||||||||
| Stockholder servicing fee per share of common stock | ( | ( | ( | ||||||||||||||||||||
| Net distributions declared per share of common stock | $ | $ | $ | $ | |||||||||||||||||||
| Year Ended December 31, 2022 | |||||||||||||||||||||||
| Class S | Class I | Class T | Class D | ||||||||||||||||||||
| Aggregate gross distributions declared per share of common stock | $ | $ | $ | $ | |||||||||||||||||||
| Stockholder servicing fee per share of common stock | ( | ( | ( | ||||||||||||||||||||
| Net distributions declared per share of common stock | $ | $ | $ | $ | |||||||||||||||||||
| Year Ended December 31, 2021 | |||||||||||||||||||||||
| Class S | Class I | Class T | Class D | ||||||||||||||||||||
| Aggregate gross distributions declared per share of common stock | $ | $ | $ | $ | |||||||||||||||||||
| Stockholder servicing fee per share of common stock | ( | ( | ( | ||||||||||||||||||||
| Net distributions declared per share of common stock | $ | $ | $ | $ | |||||||||||||||||||
Distributions for the year ended December 31, 2023 were characterized, for federal income tax purposes, as 14.99 % capital gains and 85.01 % return of capital. Distributions for the year ended December 31, 2022 were characterized, for federal income tax purposes, as 5.65 % capital gains and 94.35 % return of capital. Distributions for the year ended December 31, 2021 were characterized, for federal income tax purposes, as 4.73 % ordinary income, 3.36 % capital gains and 91.91 % return of capital. Of the 4.73 % characterized as ordinary income, all 4.73 % were non-qualified.
F-44
Redeemable Non-controlling Interest
In connection with its performance participation interest, the Special Limited Partner holds Class I units in BREIT OP. See Note 10 for further details of the Special Limited Partner’s performance participation interest. Because the Special Limited Partner has the ability to redeem its Class I units for Class I shares in the Company or cash, at the election of the Special Limited Partner, the Company has classified these Class I units as Redeemable Non-controlling Interest in mezzanine equity on the Company’s Consolidated Balance Sheets.
The following table details the redeemable non-controlling interest activity related to the Special Limited Partner for the years ended December 31, 2023 and 2022 ($ in thousands):
| Year Ended December 31, | |||||||||||
| 2023 | 2022 | ||||||||||
| Balance at the beginning of the year | $ | $ | |||||||||
| Settlement of current year performance participation allocation | |||||||||||
| Repurchases | ( | ||||||||||
| Conversion to Class I and Class B units | ( | ( | |||||||||
| Conversion to Class I and Class C shares | ( | ( | |||||||||
| GAAP income allocation | ( | ||||||||||
| Distributions | ( | ( | |||||||||
| Fair value allocation | ( | ||||||||||
| Ending balance | $ | $ | |||||||||
In addition to the Special Limited Partner’s interest noted above, certain of the Company’s third party joint ventures also have a redeemable non-controlling interest in such joint ventures. As of December 31, 2023 and December 31, 2022, $197.2 million and $209.3 million, respectively, related to such third party joint ventures was included in Redeemable Non-controlling Interests on the Company’s Consolidated Balance Sheets.
The Redeemable Non-controlling Interests are recorded at the greater of (i) their carrying amount, adjusted for their share of the allocation of GAAP net income (loss) and distributions, or (ii) their redemption value, which is equivalent to the fair value of such interests at the end of each measurement period. Accordingly, the Company recorded an allocation adjustment between Additional Paid-in Capital and Redeemable Non-controlling Interest of $4.2 million, $39.3 million, and $103.4 million, during the years ended December 31, 2023, 2022, and 2021, respectively, to reflect their redemption value.
Non-controlling Interests - BREIT OP unitholders
Class B Units in BREIT OP are available to certain suitable investors in private placements. Class B Units are sold at their NAV per unit, which will equal the NAV per Class I unit of BREIT OP and will generally correspond to the NAV per share of the Company’s Class I shares.
Class B Units are subject to the same fees and expenses of Class I Units and do not have any preferential rights relative to the Company’s interest in BREIT OP, nor are they exchangeable for any shares of the Company’s common stock. Holders of the Class B Units have a right to redeem their units for cash in a manner similar to the ability of the Company’s stockholders to have their shares repurchased under the Company’s share repurchase plan. Class B Unit redemptions are subject to similar limitations as share repurchases under the Company’s share repurchase plan, namely the early repurchase deduction and caps on monthly and quarterly repurchases. Class B Units have the same limited voting rights as the other BREIT OP units and such rights do not affect the Company’s exclusive power, as general partner of BREIT OP, to manage and conduct the business of BREIT OP.
During the year ended December 31, 2023, BREIT OP did not receive Class B Unit subscriptions from affiliates of the Company. During the year ended December 31, 2022, BREIT OP received $110.0 million of such Class B Unit subscriptions. As of December 31, 2023 and 2022, there were 119.2 million and 21.7 million Class B Units outstanding, respectively. Class B Units are recorded as a component of Non-controlling Interests on the Company’s Consolidated Balance Sheets.
The Company did not issue any Class I Units as consideration for acquisitions of real estate during the year ended December 31, 2023. During the year ended December 31, 2022, the Company issued $229.3 million of Class I Units as consideration for acquisitions of real estate.
F-45
15. Leases
Lessor
The Company’s rental revenue primarily consists of rent earned from operating leases at the Company’s rental housing, industrial, net lease, data centers, self storage, retail, and office properties. Leases at the Company’s industrial, data centers, retail, and office properties generally include a fixed base rent, and certain leases also contain a variable rent component. The variable component of the Company’s operating leases at its industrial, data centers, retail, and office properties primarily consist of the reimbursement of operating expenses such as real estate taxes, insurance, and common area maintenance costs. Rental revenue earned from leases at the Company’s rental housing properties primarily consist of a fixed base rent, and certain leases contain a variable component that allows for the pass-through of certain operating expenses such as utilities. Rental revenue earned from leases at the Company’s self storage properties primarily consist of a fixed base rent only.
Rental revenue from leases at the Company’s net lease properties consists of a fixed annual rent that escalates annually throughout the term of the applicable leases, and the tenant is generally responsible for all property-related expenses, including taxes, insurance, and maintenance. The Company’s net lease properties are leased to a single tenant. The Company assessed the lease classification of the net lease properties and determined the leases were each operating leases. The Company’s assessment included the consideration of the present value of the applicable lease payments over the lease terms and the residual value of the leased assets.
Leases at the Company’s industrial, net lease, data centers, retail, and office properties are generally longer term (greater than 12 months in length), and may contain extension and termination options at the lessee’s election. Often, these leases have annual escalations that are tied to the CPI index. Leases at the Company’s rental housing and self storage properties are short term in nature, generally not greater than 12 months in length.
The following table details the components of operating lease income from leases in which the Company is the lessor ($ in thousands):
| Year Ended December 31, | ||||||||||||||||||||
| 2023 | 2022 | 2021 | ||||||||||||||||||
| Fixed lease payments | $ | $ | $ | |||||||||||||||||
| Variable lease payments | ||||||||||||||||||||
| $ | $ | $ | ||||||||||||||||||
The following table presents the undiscounted future minimum rents the Company expects to receive for its industrial, net lease, data centers, retail, and office properties as of December 31, 2023 ($ in thousands). Leases at the Company’s rental housing and self storage properties are short term, generally 12 months or less, and are therefore not included.
| Year | Future Minimum Rents | |||||||
| 2024 | $ | |||||||
| 2025 | ||||||||
| 2026 | ||||||||
| 2027 | ||||||||
| 2028 | ||||||||
| Thereafter | ||||||||
| Total | $ | |||||||
F-46
Lessee
Certain of the Company’s investments in real estate are subject to ground leases. The Company’s ground leases are classified as either operating leases or financing leases based on the characteristics of each lease. As of December 31, 2023, the Company had 93 ground leases classified as operating and three ground leases classified as financing. Each of the Company’s ground leases were acquired as part of the acquisition of real estate, and no incremental costs were incurred for such ground leases. The Company’s ground leases are non-cancelable and certain operating leases contain renewal options.
The following table details the future lease payments due under the Company’s ground leases as of December 31, 2023 ($ in thousands):
| Operating Leases | Financing Leases | ||||||||||
| 2024 | $ | $ | |||||||||
| 2025 | |||||||||||
| 2026 | |||||||||||
| 2027 | |||||||||||
| 2028 | |||||||||||
| Thereafter | |||||||||||
| Total undiscounted future lease payments | |||||||||||
| Difference between undiscounted cash flows and discounted cash flows | ( | ( | |||||||||
| Total lease liability | $ | $ | |||||||||
The Company utilized its incremental borrowing rate at the time of entering such leases, which was between 5 % and 7 %, to determine its lease liabilities. As of December 31, 2023, the weighted average remaining lease term of the Company’s operating leases and financing leases was 60 years and 77 years, respectively.
Payments under the Company’s ground leases primarily contain fixed payment components that may include periodic increases based on an index or periodic fixed percentage escalations. Three of the Company’s ground leases contains a variable component based on a percentage of revenue.
The following table details the fixed and variable components of the Company’s operating leases ($ in thousands):
| Year Ended December 31, | ||||||||||||||||||||
| 2023 | 2022 | 2021 | ||||||||||||||||||
| Fixed ground rent expense | $ | $ | $ | |||||||||||||||||
| Variable ground rent expense | ||||||||||||||||||||
| Total cash portion of ground rent expense | ||||||||||||||||||||
| Straight-line ground rent expense | ||||||||||||||||||||
| Total operating lease costs | $ | $ | $ | |||||||||||||||||
The following table details the fixed and variable components of the Company’s financing leases ($ in thousands):
| Year Ended December 31, | ||||||||||||||||||||
| 2023 | 2022 | 2021 | ||||||||||||||||||
| Interest on lease liabilities | $ | $ | $ | |||||||||||||||||
| Amortization of right-of-use assets | ||||||||||||||||||||
| Total financing lease costs | $ | $ | $ | |||||||||||||||||
F-47
16. Segment Reporting
The Company operates in nine reportable segments: Rental Housing, Industrial, Net Lease, Data Centers, Hospitality, Self Storage, Retail, Office properties, and Investments in Real Estate Debt. The Company allocates resources and evaluates results based on the performance of each segment individually. The Company believes that Segment Net Operating Income is the key performance metric that captures the unique operating characteristics of each segment.
The following table details the total assets by segment ($ in thousands):
| December 31, 2023 | December 31, 2022 | ||||||||||
| Rental Housing | $ | $ | |||||||||
| Industrial | |||||||||||
| Net Lease | |||||||||||
| Office | |||||||||||
| Data Centers | |||||||||||
| Hospitality | |||||||||||
| Retail | |||||||||||
| Self Storage | |||||||||||
| Investments in Real Estate Debt and Real Estate Loans Held by Consolidated Securitization Vehicles, at Fair Value | |||||||||||
| Other (Corporate) | |||||||||||
| Total assets | $ | $ | |||||||||
F-48
The following table details the financial results by segment for the year ended December 31, 2023 ($ in thousands):
| Rental Housing | Industrial | Net Lease | Office | Data Centers | Hospitality | Retail | Self Storage | Investments in Real Estate Debt | Total | ||||||||||||||||||||||||||||||||||||||||||||||||||
| Revenues: | |||||||||||||||||||||||||||||||||||||||||||||||||||||||||||
| Rental revenue | $ | $ | $ | $ | $ | $ | $ | $ | $ | $ | |||||||||||||||||||||||||||||||||||||||||||||||||
| Hospitality revenue | |||||||||||||||||||||||||||||||||||||||||||||||||||||||||||
| Other revenue | |||||||||||||||||||||||||||||||||||||||||||||||||||||||||||
| Total revenues | |||||||||||||||||||||||||||||||||||||||||||||||||||||||||||
| Expenses: | |||||||||||||||||||||||||||||||||||||||||||||||||||||||||||
| Rental property operating | |||||||||||||||||||||||||||||||||||||||||||||||||||||||||||
| Hospitality operating | |||||||||||||||||||||||||||||||||||||||||||||||||||||||||||
| Total expenses | |||||||||||||||||||||||||||||||||||||||||||||||||||||||||||
| (Loss) income from unconsolidated entities | ( | ( | ( | ( | ( | ||||||||||||||||||||||||||||||||||||||||||||||||||||||
| Income from investments in real estate debt | |||||||||||||||||||||||||||||||||||||||||||||||||||||||||||
| Changes in net assets of consolidated securitization vehicles | |||||||||||||||||||||||||||||||||||||||||||||||||||||||||||
Income from investments in equity securities(1) | |||||||||||||||||||||||||||||||||||||||||||||||||||||||||||
| Segment net operating income (loss) | $ | $ | $ | $ | $ | ( | $ | $ | $ | $ | $ | ||||||||||||||||||||||||||||||||||||||||||||||||
| Depreciation and amortization | $ | ( | $ | ( | $ | ( | $ | ( | $ | ( | $ | ( | $ | ( | $ | ( | $ | $ | ( | ||||||||||||||||||||||||||||||||||||||||
| General and administrative | ( | ||||||||||||||||||||||||||||||||||||||||||||||||||||||||||
| Management fee | ( | ||||||||||||||||||||||||||||||||||||||||||||||||||||||||||
| Impairment of investments in real estate | ( | ||||||||||||||||||||||||||||||||||||||||||||||||||||||||||
Loss from interest rate derivatives | ( | ||||||||||||||||||||||||||||||||||||||||||||||||||||||||||
| Net gain on dispositions of real estate | |||||||||||||||||||||||||||||||||||||||||||||||||||||||||||
Interest expense, net | ( | ||||||||||||||||||||||||||||||||||||||||||||||||||||||||||
| Loss on extinguishment of debt | ( | ||||||||||||||||||||||||||||||||||||||||||||||||||||||||||
Other expense(1) | ( | ||||||||||||||||||||||||||||||||||||||||||||||||||||||||||
Net loss | $ | ( | |||||||||||||||||||||||||||||||||||||||||||||||||||||||||
| Net loss attributable to non-controlling interests in third party joint ventures | $ | ||||||||||||||||||||||||||||||||||||||||||||||||||||||||||
Net loss attributable to non-controlling interests in BREIT OP | |||||||||||||||||||||||||||||||||||||||||||||||||||||||||||
Net loss attributable to BREIT stockholders | $ | ( | |||||||||||||||||||||||||||||||||||||||||||||||||||||||||
(1) Included within Other (expense) income on the Consolidated Statements of Operations is $37.9 million of net unrealized/realized gain related to equity securities.
F-49
The following table details the financial results by segment for the year ended December 31, 2022 ($ in thousands):
| Rental Housing | Industrial | Net Lease | Office | Data Centers | Hospitality | Retail | Self Storage | Investments in Real Estate Debt | Total | ||||||||||||||||||||||||||||||||||||||||||||||||||
| Revenues: | |||||||||||||||||||||||||||||||||||||||||||||||||||||||||||
| Rental revenue | $ | $ | $ | $ | $ | $ | $ | $ | $ | $ | |||||||||||||||||||||||||||||||||||||||||||||||||
| Hospitality revenue | |||||||||||||||||||||||||||||||||||||||||||||||||||||||||||
| Other revenue | |||||||||||||||||||||||||||||||||||||||||||||||||||||||||||
| Total revenues | |||||||||||||||||||||||||||||||||||||||||||||||||||||||||||
| Expenses: | |||||||||||||||||||||||||||||||||||||||||||||||||||||||||||
| Rental property operating | |||||||||||||||||||||||||||||||||||||||||||||||||||||||||||
| Hospitality operating | |||||||||||||||||||||||||||||||||||||||||||||||||||||||||||
| Total expenses | |||||||||||||||||||||||||||||||||||||||||||||||||||||||||||
| (Loss) Income from unconsolidated entities | ( | ( | ( | ||||||||||||||||||||||||||||||||||||||||||||||||||||||||
| Loss from investments in real estate debt | ( | ( | |||||||||||||||||||||||||||||||||||||||||||||||||||||||||
| Changes in net assets of consolidated securitization vehicles | ( | ( | |||||||||||||||||||||||||||||||||||||||||||||||||||||||||
(Loss) income from investments in equity securities(1) | ( | ( | ( | ( | |||||||||||||||||||||||||||||||||||||||||||||||||||||||
| Segment net operating income (loss) | $ | $ | $ | $ | $ | ( | $ | $ | $ | $ | ( | $ | |||||||||||||||||||||||||||||||||||||||||||||||
| Depreciation and amortization | $ | ( | $ | ( | $ | ( | $ | ( | $ | ( | $ | ( | $ | ( | $ | ( | $ | $ | ( | ||||||||||||||||||||||||||||||||||||||||
| General and administrative | ( | ||||||||||||||||||||||||||||||||||||||||||||||||||||||||||
| Management fee | ( | ||||||||||||||||||||||||||||||||||||||||||||||||||||||||||
| Performance participation allocation | ( | ||||||||||||||||||||||||||||||||||||||||||||||||||||||||||
Income from interest rate derivatives | |||||||||||||||||||||||||||||||||||||||||||||||||||||||||||
| Impairment of investments in real estate | ( | ||||||||||||||||||||||||||||||||||||||||||||||||||||||||||
| Net gain on dispositions of real estate | |||||||||||||||||||||||||||||||||||||||||||||||||||||||||||
Interest expense, net | ( | ||||||||||||||||||||||||||||||||||||||||||||||||||||||||||
Loss on extinguishment of debt | ( | ||||||||||||||||||||||||||||||||||||||||||||||||||||||||||
Other expense(1) | ( | ||||||||||||||||||||||||||||||||||||||||||||||||||||||||||
| Net loss | $ | ( | |||||||||||||||||||||||||||||||||||||||||||||||||||||||||
| Net loss attributable to non-controlling interests in third party joint ventures | $ | ||||||||||||||||||||||||||||||||||||||||||||||||||||||||||
Net loss attributable to non-controlling interests in BREIT OP | |||||||||||||||||||||||||||||||||||||||||||||||||||||||||||
| Net loss attributable to BREIT stockholders | $ | ( | |||||||||||||||||||||||||||||||||||||||||||||||||||||||||
(1) Included within Other (expense) income on the Consolidated Statements of Operations is $520.8 million of net unrealized/realized loss related to equity securities.
F-50
The following table details the financial results by segment for the year ended December 31, 2021 ($ in thousands):
| Rental Housing | Industrial | Net Lease | Hospitality | Office | Data Centers | Retail | Self Storage | Investments in Real Estate Debt | Total | ||||||||||||||||||||||||||||||||||||||||||||||||||
| Revenues: | |||||||||||||||||||||||||||||||||||||||||||||||||||||||||||
| Rental revenue | $ | $ | $ | $ | $ | $ | $ | $ | $ | $ | |||||||||||||||||||||||||||||||||||||||||||||||||
| Hospitality revenue | |||||||||||||||||||||||||||||||||||||||||||||||||||||||||||
| Other revenue | |||||||||||||||||||||||||||||||||||||||||||||||||||||||||||
| Total revenues | |||||||||||||||||||||||||||||||||||||||||||||||||||||||||||
| Expenses: | |||||||||||||||||||||||||||||||||||||||||||||||||||||||||||
| Rental property operating | |||||||||||||||||||||||||||||||||||||||||||||||||||||||||||
| Hospitality operating | |||||||||||||||||||||||||||||||||||||||||||||||||||||||||||
| Total expenses | |||||||||||||||||||||||||||||||||||||||||||||||||||||||||||
| (Loss) income from unconsolidated entities | ( | ( | |||||||||||||||||||||||||||||||||||||||||||||||||||||||||
| Income from investments in real estate debt | |||||||||||||||||||||||||||||||||||||||||||||||||||||||||||
| Change in net assets of consolidated securitization vehicles | |||||||||||||||||||||||||||||||||||||||||||||||||||||||||||
Income from investments in equity securities(1) | |||||||||||||||||||||||||||||||||||||||||||||||||||||||||||
| Segment net operating income | $ | $ | $ | $ | $ | $ | ( | $ | $ | $ | $ | ||||||||||||||||||||||||||||||||||||||||||||||||
| Depreciation and amortization | $ | ( | $ | ( | $ | ( | $ | ( | $ | ( | $ | ( | $ | ( | $ | ( | $ | $ | ( | ||||||||||||||||||||||||||||||||||||||||
| General and administrative | ( | ||||||||||||||||||||||||||||||||||||||||||||||||||||||||||
| Management fee | ( | ||||||||||||||||||||||||||||||||||||||||||||||||||||||||||
| Performance participation allocation | ( | ||||||||||||||||||||||||||||||||||||||||||||||||||||||||||
| Income from interest rate derivatives | |||||||||||||||||||||||||||||||||||||||||||||||||||||||||||
| Net gain on dispositions of real estate | |||||||||||||||||||||||||||||||||||||||||||||||||||||||||||
Interest expense, net | ( | ||||||||||||||||||||||||||||||||||||||||||||||||||||||||||
| Loss on extinguishment of debt | ( | ||||||||||||||||||||||||||||||||||||||||||||||||||||||||||
Other income(1) | |||||||||||||||||||||||||||||||||||||||||||||||||||||||||||
| Net loss | $ | ( | |||||||||||||||||||||||||||||||||||||||||||||||||||||||||
| Net loss attributable to non-controlling interests in third party joint ventures | $ | ||||||||||||||||||||||||||||||||||||||||||||||||||||||||||
| Net loss attributable to non-controlling interests in BREIT OP | |||||||||||||||||||||||||||||||||||||||||||||||||||||||||||
| Net loss attributable to BREIT stockholders | $ | ( | |||||||||||||||||||||||||||||||||||||||||||||||||||||||||
(1) Included within Other (expense) income on the Consolidated Statements of Operations is $848.2 million net unrealized gain related to such equity securities.
17. Commitments and Contingencies
Litigation
From time to time, the Company may be involved in various claims and legal actions arising in the ordinary course of business. As of December 31, 2023 and December 31, 2022, the Company was not involved in any material legal proceedings.
F-51
Schedule III—Real Estate and Accumulated Depreciation as of December 31, 2023 ($ in thousands)
| Initial Cost | Costs Capitalized Subsequent to Acquisition | Gross Amounts at which Carried at the Close of Period(1) | ||||||||||||||||||||||||||||||||||||||||||||||||||||||||||||||||||||||||
| Description | Location | Number of Properties | Encumbrances (2) | Land and Land Improvements | Building and Building Improvements | Land and Land Improvements | Building and Building Improvements | Land and Land Improvements | Building and Building Improvements | Total | Accumulated Depreciation(3) | Year Acquired | ||||||||||||||||||||||||||||||||||||||||||||||||||||||||||||||
| Rental Housing Properties: | ||||||||||||||||||||||||||||||||||||||||||||||||||||||||||||||||||||||||||
| Multifamily Properties | ||||||||||||||||||||||||||||||||||||||||||||||||||||||||||||||||||||||||||
| Atlanta, GA | $ | $ | $ | $ | $ | $ | $ | $ | $ | ( | 2017-2022 | |||||||||||||||||||||||||||||||||||||||||||||||||||||||||||||||
| Austin, TX | ( | 2019-2022 | ||||||||||||||||||||||||||||||||||||||||||||||||||||||||||||||||||||||||
| Beaumont, TX | ( | 2022 | ||||||||||||||||||||||||||||||||||||||||||||||||||||||||||||||||||||||||
| Birmingham, AL | ( | 2022 | ||||||||||||||||||||||||||||||||||||||||||||||||||||||||||||||||||||||||
| Boston, MA | ( | 2021-2022 | ||||||||||||||||||||||||||||||||||||||||||||||||||||||||||||||||||||||||
| Boulder, CO | ( | 2022 | ||||||||||||||||||||||||||||||||||||||||||||||||||||||||||||||||||||||||
| Charleston, SC | ( | 2022 | ||||||||||||||||||||||||||||||||||||||||||||||||||||||||||||||||||||||||
| Charlotte, NC | ( | 2019-2022 | ||||||||||||||||||||||||||||||||||||||||||||||||||||||||||||||||||||||||
| Chicago, IL | ( | 2017-2022 | ||||||||||||||||||||||||||||||||||||||||||||||||||||||||||||||||||||||||
| Columbus, OH | ( | 2020-2021 | ||||||||||||||||||||||||||||||||||||||||||||||||||||||||||||||||||||||||
| Dallas, TX | ( | 2019-2022 | ||||||||||||||||||||||||||||||||||||||||||||||||||||||||||||||||||||||||
| Denver, CO | ( | 2017-2022 | ||||||||||||||||||||||||||||||||||||||||||||||||||||||||||||||||||||||||
| Durham, NC | ( | 2020-2022 | ||||||||||||||||||||||||||||||||||||||||||||||||||||||||||||||||||||||||
| Greenville, SC | ( | 2021 | ||||||||||||||||||||||||||||||||||||||||||||||||||||||||||||||||||||||||
| Houston, TX | ( | 2021-2022 | ||||||||||||||||||||||||||||||||||||||||||||||||||||||||||||||||||||||||
| Jacksonville, FL | ( | 2017-2022 | ||||||||||||||||||||||||||||||||||||||||||||||||||||||||||||||||||||||||
| Kansas City, MO | ( | 2020-2022 | ||||||||||||||||||||||||||||||||||||||||||||||||||||||||||||||||||||||||
| Lakeland, FL | ( | 2019-2022 | ||||||||||||||||||||||||||||||||||||||||||||||||||||||||||||||||||||||||
| Las Vegas, NV | ( | 2017-2022 | ||||||||||||||||||||||||||||||||||||||||||||||||||||||||||||||||||||||||
| Los Angeles, CA | ( | 2019 | ||||||||||||||||||||||||||||||||||||||||||||||||||||||||||||||||||||||||
| Louisville, KY | ( | 2017-2022 | ||||||||||||||||||||||||||||||||||||||||||||||||||||||||||||||||||||||||
| Miami, FL | ( | 2017-2021 | ||||||||||||||||||||||||||||||||||||||||||||||||||||||||||||||||||||||||
| Minneapolis, MN | ( | 2021-2022 | ||||||||||||||||||||||||||||||||||||||||||||||||||||||||||||||||||||||||
| Modesto, CA | ( | 2017-2018 | ||||||||||||||||||||||||||||||||||||||||||||||||||||||||||||||||||||||||
| Naples, FL | ( | 2022 | ||||||||||||||||||||||||||||||||||||||||||||||||||||||||||||||||||||||||
| Nashville, TN | ( | 2021-2022 | ||||||||||||||||||||||||||||||||||||||||||||||||||||||||||||||||||||||||
| New York, NY | ( | 2022 | ||||||||||||||||||||||||||||||||||||||||||||||||||||||||||||||||||||||||
| North Port, FL | ( | 2021-2022 | ||||||||||||||||||||||||||||||||||||||||||||||||||||||||||||||||||||||||
| Olympia, WA | ( | 2017-2018 | ||||||||||||||||||||||||||||||||||||||||||||||||||||||||||||||||||||||||
| Orlando, FL | ( | 2019-2022 | ||||||||||||||||||||||||||||||||||||||||||||||||||||||||||||||||||||||||
| Palm Bay, FL | ( | 2022 | ||||||||||||||||||||||||||||||||||||||||||||||||||||||||||||||||||||||||
| Panama City, FL | ( | 2022 | ||||||||||||||||||||||||||||||||||||||||||||||||||||||||||||||||||||||||
| Philadelphia, PA | ( | 2022 | ||||||||||||||||||||||||||||||||||||||||||||||||||||||||||||||||||||||||
| Phoenix, AZ | ( | 2017-2022 | ||||||||||||||||||||||||||||||||||||||||||||||||||||||||||||||||||||||||
| Pittsburgh, PA | ( | 2022 | ||||||||||||||||||||||||||||||||||||||||||||||||||||||||||||||||||||||||
| Portland, OR | ( | 2017-2022 | ||||||||||||||||||||||||||||||||||||||||||||||||||||||||||||||||||||||||
| Raleigh, NC | ( | 2019-2022 | ||||||||||||||||||||||||||||||||||||||||||||||||||||||||||||||||||||||||
| Richmond, VA | ( | 2022 | ||||||||||||||||||||||||||||||||||||||||||||||||||||||||||||||||||||||||
| Riverside, CA | ( | 2019-2021 | ||||||||||||||||||||||||||||||||||||||||||||||||||||||||||||||||||||||||
| Sacramento, CA | ( | 2018-2019 | ||||||||||||||||||||||||||||||||||||||||||||||||||||||||||||||||||||||||
F-52
| Initial Cost | Costs Capitalized Subsequent to Acquisition | Gross Amounts at which Carried at the Close of Period(1) | ||||||||||||||||||||||||||||||||||||||||||||||||||||||||||||||||||||||||
| Description | Location | Number of Properties | Encumbrances (2) | Land and Land Improvements | Building and Building Improvements | Land and Land Improvements | Building and Building Improvements | Land and Land Improvements | Building and Building Improvements | Total | Accumulated Depreciation(3) | Year Acquired | ||||||||||||||||||||||||||||||||||||||||||||||||||||||||||||||
| San Antonio, TX | $ | $ | $ | $ | $ | $ | $ | $ | $ | ( | 2017-2021 | |||||||||||||||||||||||||||||||||||||||||||||||||||||||||||||||
| San Diego, CA | ( | 2022 | ||||||||||||||||||||||||||||||||||||||||||||||||||||||||||||||||||||||||
| Savannah, GA | ( | 2019 | ||||||||||||||||||||||||||||||||||||||||||||||||||||||||||||||||||||||||
| Seattle, WA | ( | 2018-2021 | ||||||||||||||||||||||||||||||||||||||||||||||||||||||||||||||||||||||||
| Stockton, CA | ( | 2022 | ||||||||||||||||||||||||||||||||||||||||||||||||||||||||||||||||||||||||
| Tampa, FL | ( | 2019-2022 | ||||||||||||||||||||||||||||||||||||||||||||||||||||||||||||||||||||||||
| Urban Honolulu, HI | ( | 2021 | ||||||||||||||||||||||||||||||||||||||||||||||||||||||||||||||||||||||||
| Virginia Beach, VA | ( | 2022 | ||||||||||||||||||||||||||||||||||||||||||||||||||||||||||||||||||||||||
| Washington, DC | ( | 2022 | ||||||||||||||||||||||||||||||||||||||||||||||||||||||||||||||||||||||||
| Wilmington, NC | 2022 | |||||||||||||||||||||||||||||||||||||||||||||||||||||||||||||||||||||||||
| Manufactured Housing | ||||||||||||||||||||||||||||||||||||||||||||||||||||||||||||||||||||||||||
| Arcadia, FL | ( | 2020 | ||||||||||||||||||||||||||||||||||||||||||||||||||||||||||||||||||||||||
| Atlanta, GA | ( | 2020 | ||||||||||||||||||||||||||||||||||||||||||||||||||||||||||||||||||||||||
| Cape Coral, FL | ( | 2020 | ||||||||||||||||||||||||||||||||||||||||||||||||||||||||||||||||||||||||
| Cincinnati, OH | ( | 2020 | ||||||||||||||||||||||||||||||||||||||||||||||||||||||||||||||||||||||||
| Clewiston, FL | ( | 2020 | ||||||||||||||||||||||||||||||||||||||||||||||||||||||||||||||||||||||||
| Lakeland, FL | ( | 2019-2020 | ||||||||||||||||||||||||||||||||||||||||||||||||||||||||||||||||||||||||
| Los Angeles, CA | ( | 2021 | ||||||||||||||||||||||||||||||||||||||||||||||||||||||||||||||||||||||||
| Miami, FL | ( | 2020-2021 | ||||||||||||||||||||||||||||||||||||||||||||||||||||||||||||||||||||||||
| Naples, FL | ( | 2019 | ||||||||||||||||||||||||||||||||||||||||||||||||||||||||||||||||||||||||
| Orlando, FL | ( | 2018-2020 | ||||||||||||||||||||||||||||||||||||||||||||||||||||||||||||||||||||||||
| Palm Bay, FL | ( | 2020 | ||||||||||||||||||||||||||||||||||||||||||||||||||||||||||||||||||||||||
| Phoenix, AZ | ( | 2018-2020 | ||||||||||||||||||||||||||||||||||||||||||||||||||||||||||||||||||||||||
| Prescott Valley, AZ | ( | 2018-2020 | ||||||||||||||||||||||||||||||||||||||||||||||||||||||||||||||||||||||||
| Riverside, CA | ( | 2018 | ||||||||||||||||||||||||||||||||||||||||||||||||||||||||||||||||||||||||
| San Diego, CA | ( | 2018 | ||||||||||||||||||||||||||||||||||||||||||||||||||||||||||||||||||||||||
| Santa Rosa, CA | ( | 2020-2021 | ||||||||||||||||||||||||||||||||||||||||||||||||||||||||||||||||||||||||
| Seattle, WA | ( | 2020 | ||||||||||||||||||||||||||||||||||||||||||||||||||||||||||||||||||||||||
| Sebastian, FL | ( | 2020 | ||||||||||||||||||||||||||||||||||||||||||||||||||||||||||||||||||||||||
| Tampa, FL | ( | 2019-2020 | ||||||||||||||||||||||||||||||||||||||||||||||||||||||||||||||||||||||||
| The Villages, FL | ( | 2020 | ||||||||||||||||||||||||||||||||||||||||||||||||||||||||||||||||||||||||
| Tucson, AZ | ( | 2020 | ||||||||||||||||||||||||||||||||||||||||||||||||||||||||||||||||||||||||
| Student Housing | ||||||||||||||||||||||||||||||||||||||||||||||||||||||||||||||||||||||||||
| Akron, OH | ( | 2018-2022 | ||||||||||||||||||||||||||||||||||||||||||||||||||||||||||||||||||||||||
| Albuquerque, NM | ( | 2022 | ||||||||||||||||||||||||||||||||||||||||||||||||||||||||||||||||||||||||
| Ames, IA | ( | 2022 | ||||||||||||||||||||||||||||||||||||||||||||||||||||||||||||||||||||||||
| Ann Arbor, MI | ( | 2022 | ||||||||||||||||||||||||||||||||||||||||||||||||||||||||||||||||||||||||
| Athens, GA | ( | 2018-2022 | ||||||||||||||||||||||||||||||||||||||||||||||||||||||||||||||||||||||||
| Atlanta, GA | ( | 2021-2022 | ||||||||||||||||||||||||||||||||||||||||||||||||||||||||||||||||||||||||
| Auburn, AL | ( | 2018-2022 | ||||||||||||||||||||||||||||||||||||||||||||||||||||||||||||||||||||||||
| Austin, TX | ( | 2022 | ||||||||||||||||||||||||||||||||||||||||||||||||||||||||||||||||||||||||
| Baton Rouge, LA | ( | 2022 | ||||||||||||||||||||||||||||||||||||||||||||||||||||||||||||||||||||||||
| Binghamton, NY | ( | 2022 | ||||||||||||||||||||||||||||||||||||||||||||||||||||||||||||||||||||||||
| Blacksburg, CA | 2022 | |||||||||||||||||||||||||||||||||||||||||||||||||||||||||||||||||||||||||
F-53
| Initial Cost | Costs Capitalized Subsequent to Acquisition | Gross Amounts at which Carried at the Close of Period(1) | ||||||||||||||||||||||||||||||||||||||||||||||||||||||||||||||||||||||||
| Description | Location | Number of Properties | Encumbrances (2) | Land and Land Improvements | Building and Building Improvements | Land and Land Improvements | Building and Building Improvements | Land and Land Improvements | Building and Building Improvements | Total | Accumulated Depreciation(3) | Year Acquired | ||||||||||||||||||||||||||||||||||||||||||||||||||||||||||||||
| Blacksburg, VA | $ | $ | $ | $ | $ | $ | $ | $ | $ | ( | 2018 | |||||||||||||||||||||||||||||||||||||||||||||||||||||||||||||||
| Boone, NC | ( | 2021 | ||||||||||||||||||||||||||||||||||||||||||||||||||||||||||||||||||||||||
| Boston, MA | ( | 2022 | ||||||||||||||||||||||||||||||||||||||||||||||||||||||||||||||||||||||||
| Boulder, CO | ( | 2018-2022 | ||||||||||||||||||||||||||||||||||||||||||||||||||||||||||||||||||||||||
| Buffalo, NY | ( | 2021-2022 | ||||||||||||||||||||||||||||||||||||||||||||||||||||||||||||||||||||||||
| Carbondale, IL | 2022 | |||||||||||||||||||||||||||||||||||||||||||||||||||||||||||||||||||||||||
| Champaign, IL | ( | 2022 | ||||||||||||||||||||||||||||||||||||||||||||||||||||||||||||||||||||||||
| Charlotte, NC | ( | 2022 | ||||||||||||||||||||||||||||||||||||||||||||||||||||||||||||||||||||||||
| Charlottesville, VA | ( | 2018 | ||||||||||||||||||||||||||||||||||||||||||||||||||||||||||||||||||||||||
| College Station, TX | ( | 2022 | ||||||||||||||||||||||||||||||||||||||||||||||||||||||||||||||||||||||||
| Columbia, MO | ( | 2022 | ||||||||||||||||||||||||||||||||||||||||||||||||||||||||||||||||||||||||
| Columbia, SC | ( | 2022 | ||||||||||||||||||||||||||||||||||||||||||||||||||||||||||||||||||||||||
| Columbus, OH | 2022 | |||||||||||||||||||||||||||||||||||||||||||||||||||||||||||||||||||||||||
| Corvallis, OR | ( | 2022 | ||||||||||||||||||||||||||||||||||||||||||||||||||||||||||||||||||||||||
| Dallas, TX | ( | 2022 | ||||||||||||||||||||||||||||||||||||||||||||||||||||||||||||||||||||||||
| Eugene, OR | ( | 2022 | ||||||||||||||||||||||||||||||||||||||||||||||||||||||||||||||||||||||||
| Fayetteville, AR | ( | 2022 | ||||||||||||||||||||||||||||||||||||||||||||||||||||||||||||||||||||||||
| Flagstaff, AZ | ( | 2022 | ||||||||||||||||||||||||||||||||||||||||||||||||||||||||||||||||||||||||
| Fort Collins, CO | ( | 2021-2022 | ||||||||||||||||||||||||||||||||||||||||||||||||||||||||||||||||||||||||
| Fresno, CA | ( | 2022 | ||||||||||||||||||||||||||||||||||||||||||||||||||||||||||||||||||||||||
| Gainesville, FL | ( | 2022 | ||||||||||||||||||||||||||||||||||||||||||||||||||||||||||||||||||||||||
| Greensboro, NC | ( | 2022 | ||||||||||||||||||||||||||||||||||||||||||||||||||||||||||||||||||||||||
| Greenville, NC | ( | 2018 | ||||||||||||||||||||||||||||||||||||||||||||||||||||||||||||||||||||||||
| Greenville, SC | ( | 2022 | ||||||||||||||||||||||||||||||||||||||||||||||||||||||||||||||||||||||||
| Houston, TX | ( | 2022 | ||||||||||||||||||||||||||||||||||||||||||||||||||||||||||||||||||||||||
| Huntington, WV | ( | 2022 | ||||||||||||||||||||||||||||||||||||||||||||||||||||||||||||||||||||||||
| Huntsville, TX | ( | 2022 | ||||||||||||||||||||||||||||||||||||||||||||||||||||||||||||||||||||||||
| Indianapolis, IN | ( | 2022 | ||||||||||||||||||||||||||||||||||||||||||||||||||||||||||||||||||||||||
| Knoxville, TN | ( | 2021-2022 | ||||||||||||||||||||||||||||||||||||||||||||||||||||||||||||||||||||||||
| Lafayette, IN | ( | 2022 | ||||||||||||||||||||||||||||||||||||||||||||||||||||||||||||||||||||||||
| Lansing, MI | ( | 2022 | ||||||||||||||||||||||||||||||||||||||||||||||||||||||||||||||||||||||||
| Lexington, KY | ( | 2022 | ||||||||||||||||||||||||||||||||||||||||||||||||||||||||||||||||||||||||
| Los Angeles, CA | ( | 2022 | ||||||||||||||||||||||||||||||||||||||||||||||||||||||||||||||||||||||||
| Louisville, KY | ( | 2018-2022 | ||||||||||||||||||||||||||||||||||||||||||||||||||||||||||||||||||||||||
| Lubbock, TX | ( | 2022 | ||||||||||||||||||||||||||||||||||||||||||||||||||||||||||||||||||||||||
| Madison, WI | ( | 2022 | ||||||||||||||||||||||||||||||||||||||||||||||||||||||||||||||||||||||||
| Mankato, MN | ( | 2022 | ||||||||||||||||||||||||||||||||||||||||||||||||||||||||||||||||||||||||
| Minneapolis, MN | ( | 2022 | ||||||||||||||||||||||||||||||||||||||||||||||||||||||||||||||||||||||||
| Morgantown, WV | ( | 2022 | ||||||||||||||||||||||||||||||||||||||||||||||||||||||||||||||||||||||||
| Nashville, TN | 2022 | |||||||||||||||||||||||||||||||||||||||||||||||||||||||||||||||||||||||||
| New York, NY | ( | 2022 | ||||||||||||||||||||||||||||||||||||||||||||||||||||||||||||||||||||||||
| Oklahoma City, OK | ( | 2022 | ||||||||||||||||||||||||||||||||||||||||||||||||||||||||||||||||||||||||
| Orlando, FL | ( | 2018-2022 | ||||||||||||||||||||||||||||||||||||||||||||||||||||||||||||||||||||||||
| Oxford, MS | ( | 2022 | ||||||||||||||||||||||||||||||||||||||||||||||||||||||||||||||||||||||||
F-54
| Initial Cost | Costs Capitalized Subsequent to Acquisition | Gross Amounts at which Carried at the Close of Period(1) | ||||||||||||||||||||||||||||||||||||||||||||||||||||||||||||||||||||||||
| Description | Location | Number of Properties | Encumbrances (2) | Land and Land Improvements | Building and Building Improvements | Land and Land Improvements | Building and Building Improvements | Land and Land Improvements | Building and Building Improvements | Total | Accumulated Depreciation(3) | Year Acquired | ||||||||||||||||||||||||||||||||||||||||||||||||||||||||||||||
| Philadelphia, PA | $ | $ | $ | $ | $ | $ | $ | $ | $ | ( | 2022 | |||||||||||||||||||||||||||||||||||||||||||||||||||||||||||||||
| Phoenix, AZ | ( | 2018-2022 | ||||||||||||||||||||||||||||||||||||||||||||||||||||||||||||||||||||||||
| Portland, OR | ( | 2022 | ||||||||||||||||||||||||||||||||||||||||||||||||||||||||||||||||||||||||
| Pullman, WA | ( | 2021 | ||||||||||||||||||||||||||||||||||||||||||||||||||||||||||||||||||||||||
| Raleigh, NC | ( | 2022 | ||||||||||||||||||||||||||||||||||||||||||||||||||||||||||||||||||||||||
| Reno, NV | ( | 2021 | ||||||||||||||||||||||||||||||||||||||||||||||||||||||||||||||||||||||||
| Richmond, VA | ( | 2022 | ||||||||||||||||||||||||||||||||||||||||||||||||||||||||||||||||||||||||
| Riverside, CA | ( | 2018 | ||||||||||||||||||||||||||||||||||||||||||||||||||||||||||||||||||||||||
| Rochester, NY | ( | 2022 | ||||||||||||||||||||||||||||||||||||||||||||||||||||||||||||||||||||||||
| San Antonio, TX | ( | 2022 | ||||||||||||||||||||||||||||||||||||||||||||||||||||||||||||||||||||||||
| San Diego, CA | ( | 2022 | ||||||||||||||||||||||||||||||||||||||||||||||||||||||||||||||||||||||||
| San Francisco, CA | ( | 2018-2022 | ||||||||||||||||||||||||||||||||||||||||||||||||||||||||||||||||||||||||
| Seattle, WA | ( | 2022 | ||||||||||||||||||||||||||||||||||||||||||||||||||||||||||||||||||||||||
| Starkville, MS | ( | 2022 | ||||||||||||||||||||||||||||||||||||||||||||||||||||||||||||||||||||||||
| State College, PA | ( | 2018-2021 | ||||||||||||||||||||||||||||||||||||||||||||||||||||||||||||||||||||||||
| Syracuse, NY | ( | 2022 | ||||||||||||||||||||||||||||||||||||||||||||||||||||||||||||||||||||||||
| Tallahassee, FL | ( | 2021-2022 | ||||||||||||||||||||||||||||||||||||||||||||||||||||||||||||||||||||||||
| Tampa, FL | ( | 2022 | ||||||||||||||||||||||||||||||||||||||||||||||||||||||||||||||||||||||||
| Toledo, OH | ( | 2022 | ||||||||||||||||||||||||||||||||||||||||||||||||||||||||||||||||||||||||
| Trenton, NJ | ( | 2022 | ||||||||||||||||||||||||||||||||||||||||||||||||||||||||||||||||||||||||
| Tucson, AZ | ( | 2018-2022 | ||||||||||||||||||||||||||||||||||||||||||||||||||||||||||||||||||||||||
| Tuscaloosa, AL | ( | 2018-2022 | ||||||||||||||||||||||||||||||||||||||||||||||||||||||||||||||||||||||||
| Waco, TX | ( | 2022 | ||||||||||||||||||||||||||||||||||||||||||||||||||||||||||||||||||||||||
| Single Family Rental | ||||||||||||||||||||||||||||||||||||||||||||||||||||||||||||||||||||||||||
| Albuquerque, NM | ( | 2022 | ||||||||||||||||||||||||||||||||||||||||||||||||||||||||||||||||||||||||
| Athens, GA | ( | 2021-2022 | ||||||||||||||||||||||||||||||||||||||||||||||||||||||||||||||||||||||||
| Atlanta, GA | ( | 2014-2023 | ||||||||||||||||||||||||||||||||||||||||||||||||||||||||||||||||||||||||
| Augusta, GA | ( | 2021-2022 | ||||||||||||||||||||||||||||||||||||||||||||||||||||||||||||||||||||||||
| Austin, TX | ( | 2015-2022 | ||||||||||||||||||||||||||||||||||||||||||||||||||||||||||||||||||||||||
| Baltimore, MD | ( | 2015-2022 | ||||||||||||||||||||||||||||||||||||||||||||||||||||||||||||||||||||||||
| Bellingham, WA | ( | 2015 | ||||||||||||||||||||||||||||||||||||||||||||||||||||||||||||||||||||||||
| Boulder, CO | ( | 2015-2020 | ||||||||||||||||||||||||||||||||||||||||||||||||||||||||||||||||||||||||
| Bremerton, WA | ( | 2018-2022 | ||||||||||||||||||||||||||||||||||||||||||||||||||||||||||||||||||||||||
| Cape Coral, FL | ( | 2014-2023 | ||||||||||||||||||||||||||||||||||||||||||||||||||||||||||||||||||||||||
| Charleston, SC | ( | 2022 | ||||||||||||||||||||||||||||||||||||||||||||||||||||||||||||||||||||||||
| Charlotte, NC | ( | 2015-2023 | ||||||||||||||||||||||||||||||||||||||||||||||||||||||||||||||||||||||||
| Chicago, IL | ( | 2012-2023 | ||||||||||||||||||||||||||||||||||||||||||||||||||||||||||||||||||||||||
| Colorado Springs, CO | ( | 2014-2023 | ||||||||||||||||||||||||||||||||||||||||||||||||||||||||||||||||||||||||
| Columbia, SC | ( | 2017-2023 | ||||||||||||||||||||||||||||||||||||||||||||||||||||||||||||||||||||||||
| Dallas, TX | ( | 2013-2023 | ||||||||||||||||||||||||||||||||||||||||||||||||||||||||||||||||||||||||
| Deltona, FL | ( | 2022 | ||||||||||||||||||||||||||||||||||||||||||||||||||||||||||||||||||||||||
| Denver, CO | ( | 2013-2023 | ||||||||||||||||||||||||||||||||||||||||||||||||||||||||||||||||||||||||
| Durham, NC | ( | 2016-2022 | ||||||||||||||||||||||||||||||||||||||||||||||||||||||||||||||||||||||||
| Fort Collins, CO | ( | 2013-2022 | ||||||||||||||||||||||||||||||||||||||||||||||||||||||||||||||||||||||||
F-55
| Initial Cost | Costs Capitalized Subsequent to Acquisition | Gross Amounts at which Carried at the Close of Period(1) | ||||||||||||||||||||||||||||||||||||||||||||||||||||||||||||||||||||||||
| Description | Location | Number of Properties | Encumbrances (2) | Land and Land Improvements | Building and Building Improvements | Land and Land Improvements | Building and Building Improvements | Land and Land Improvements | Building and Building Improvements | Total | Accumulated Depreciation(3) | Year Acquired | ||||||||||||||||||||||||||||||||||||||||||||||||||||||||||||||
| Gainesville, GA | $ | $ | $ | $ | $ | $ | $ | $ | $ | ( | 2015-2018 | |||||||||||||||||||||||||||||||||||||||||||||||||||||||||||||||
| Greeley, CO | ( | 2013-2023 | ||||||||||||||||||||||||||||||||||||||||||||||||||||||||||||||||||||||||
| Greensboro, NC | ( | 2015-2022 | ||||||||||||||||||||||||||||||||||||||||||||||||||||||||||||||||||||||||
| Greenville, SC | ( | 2021-2022 | ||||||||||||||||||||||||||||||||||||||||||||||||||||||||||||||||||||||||
| Houston, TX | ( | 2013-2023 | ||||||||||||||||||||||||||||||||||||||||||||||||||||||||||||||||||||||||
| Indianapolis, IN | ( | 2015-2022 | ||||||||||||||||||||||||||||||||||||||||||||||||||||||||||||||||||||||||
| Jacksonville, FL | ( | 2014-2022 | ||||||||||||||||||||||||||||||||||||||||||||||||||||||||||||||||||||||||
| Kansas City, MO | ( | 2015-2022 | ||||||||||||||||||||||||||||||||||||||||||||||||||||||||||||||||||||||||
| Lakeland, FL | ( | 2021 | ||||||||||||||||||||||||||||||||||||||||||||||||||||||||||||||||||||||||
| Las Vegas, NV | ( | 2021-2023 | ||||||||||||||||||||||||||||||||||||||||||||||||||||||||||||||||||||||||
| Los Angeles, CA | ( | 2015-2022 | ||||||||||||||||||||||||||||||||||||||||||||||||||||||||||||||||||||||||
| Louisville, KY | ( | 2022 | ||||||||||||||||||||||||||||||||||||||||||||||||||||||||||||||||||||||||
| Miami, FL | ( | 2014-2023 | ||||||||||||||||||||||||||||||||||||||||||||||||||||||||||||||||||||||||
| Minneapolis, MN | ( | 2015-2022 | ||||||||||||||||||||||||||||||||||||||||||||||||||||||||||||||||||||||||
| Modesto, CA | ( | 2015-2019 | ||||||||||||||||||||||||||||||||||||||||||||||||||||||||||||||||||||||||
| Mount Vernon, WA | ( | 2015-2016 | ||||||||||||||||||||||||||||||||||||||||||||||||||||||||||||||||||||||||
| Myrtle Beach, SC | ( | 2022 | ||||||||||||||||||||||||||||||||||||||||||||||||||||||||||||||||||||||||
| Naples, FL | ( | 2014-2017 | ||||||||||||||||||||||||||||||||||||||||||||||||||||||||||||||||||||||||
| Nashville, TN | ( | 2017-2023 | ||||||||||||||||||||||||||||||||||||||||||||||||||||||||||||||||||||||||
| North Port, FL | ( | 2014-2022 | ||||||||||||||||||||||||||||||||||||||||||||||||||||||||||||||||||||||||
| Ogden, UT | ( | 2017-2023 | ||||||||||||||||||||||||||||||||||||||||||||||||||||||||||||||||||||||||
| Oklahoma City, OK | ( | 2014-2022 | ||||||||||||||||||||||||||||||||||||||||||||||||||||||||||||||||||||||||
| Olympia, WA | ( | 2015-2022 | ||||||||||||||||||||||||||||||||||||||||||||||||||||||||||||||||||||||||
| Orlando, FL | ( | 2014-2023 | ||||||||||||||||||||||||||||||||||||||||||||||||||||||||||||||||||||||||
| Oxnard, CA | ( | 2015 | ||||||||||||||||||||||||||||||||||||||||||||||||||||||||||||||||||||||||
| Palm Bay, FL | ( | 2016-2022 | ||||||||||||||||||||||||||||||||||||||||||||||||||||||||||||||||||||||||
| Philadelphia, PA | ( | 2016-2022 | ||||||||||||||||||||||||||||||||||||||||||||||||||||||||||||||||||||||||
| Phoenix, AZ | ( | 2020-2023 | ||||||||||||||||||||||||||||||||||||||||||||||||||||||||||||||||||||||||
| Pittsburgh, PA | ( | 2016-2022 | ||||||||||||||||||||||||||||||||||||||||||||||||||||||||||||||||||||||||
| Port St. Lucie, FL | ( | 2015-2022 | ||||||||||||||||||||||||||||||||||||||||||||||||||||||||||||||||||||||||
| Portland, OR | ( | 2015-2023 | ||||||||||||||||||||||||||||||||||||||||||||||||||||||||||||||||||||||||
| Provo, UT | ( | 2018-2023 | ||||||||||||||||||||||||||||||||||||||||||||||||||||||||||||||||||||||||
| Punta Gorda, FL | ( | 2015-2018 | ||||||||||||||||||||||||||||||||||||||||||||||||||||||||||||||||||||||||
| Raleigh, NC | ( | 2015-2023 | ||||||||||||||||||||||||||||||||||||||||||||||||||||||||||||||||||||||||
| Richmond, VA | ( | 2015-2022 | ||||||||||||||||||||||||||||||||||||||||||||||||||||||||||||||||||||||||
| Riverside, CA | ( | 2014-2023 | ||||||||||||||||||||||||||||||||||||||||||||||||||||||||||||||||||||||||
| Sacramento, CA | ( | 2015-2022 | ||||||||||||||||||||||||||||||||||||||||||||||||||||||||||||||||||||||||
| Salt Lake City, UT | ( | 2016-2023 | ||||||||||||||||||||||||||||||||||||||||||||||||||||||||||||||||||||||||
| San Antonio, TX | ( | 2014-2023 | ||||||||||||||||||||||||||||||||||||||||||||||||||||||||||||||||||||||||
| San Diego, CA | ( | 2015-2018 | ||||||||||||||||||||||||||||||||||||||||||||||||||||||||||||||||||||||||
| Sanford, NC | ( | 2021-2022 | ||||||||||||||||||||||||||||||||||||||||||||||||||||||||||||||||||||||||
| Seattle, WA | ( | 2014-2023 | ||||||||||||||||||||||||||||||||||||||||||||||||||||||||||||||||||||||||
| St. Louis, MO | ( | 2016-2023 | ||||||||||||||||||||||||||||||||||||||||||||||||||||||||||||||||||||||||
| Stockton, CA | ( | 2015-2021 | ||||||||||||||||||||||||||||||||||||||||||||||||||||||||||||||||||||||||
F-56
| Initial Cost | Costs Capitalized Subsequent to Acquisition | Gross Amounts at which Carried at the Close of Period(1) | ||||||||||||||||||||||||||||||||||||||||||||||||||||||||||||||||||||||||
| Description | Location | Number of Properties | Encumbrances (2) | Land and Land Improvements | Building and Building Improvements | Land and Land Improvements | Building and Building Improvements | Land and Land Improvements | Building and Building Improvements | Total | Accumulated Depreciation(3) | Year Acquired | ||||||||||||||||||||||||||||||||||||||||||||||||||||||||||||||
| Tampa, FL | $ | $ | $ | $ | $ | $ | $ | $ | $ | ( | 2014-2023 | |||||||||||||||||||||||||||||||||||||||||||||||||||||||||||||||
| Tulsa, OK | ( | 2014-2022 | ||||||||||||||||||||||||||||||||||||||||||||||||||||||||||||||||||||||||
| Washington, DC | ( | 2015-2023 | ||||||||||||||||||||||||||||||||||||||||||||||||||||||||||||||||||||||||
| Winston, NC | ( | 2015-2022 | ||||||||||||||||||||||||||||||||||||||||||||||||||||||||||||||||||||||||
| Senior Housing | ||||||||||||||||||||||||||||||||||||||||||||||||||||||||||||||||||||||||||
| Quebec, Canada | ( | 2021-2022 | ||||||||||||||||||||||||||||||||||||||||||||||||||||||||||||||||||||||||
Affordable Housing(4) | ||||||||||||||||||||||||||||||||||||||||||||||||||||||||||||||||||||||||||
| Adrian, MI | ( | 2021 | ||||||||||||||||||||||||||||||||||||||||||||||||||||||||||||||||||||||||
| Albuquerque, NM | ( | 2021 | ||||||||||||||||||||||||||||||||||||||||||||||||||||||||||||||||||||||||
| Ann Arbor, MI | ( | 2021 | ||||||||||||||||||||||||||||||||||||||||||||||||||||||||||||||||||||||||
| Atlanta, GA | ( | 2021 | ||||||||||||||||||||||||||||||||||||||||||||||||||||||||||||||||||||||||
| Austin, TX | ( | 2021 | ||||||||||||||||||||||||||||||||||||||||||||||||||||||||||||||||||||||||
| Bakersfield, CA | ( | 2021 | ||||||||||||||||||||||||||||||||||||||||||||||||||||||||||||||||||||||||
| Baltimore, MD | ( | 2021 | ||||||||||||||||||||||||||||||||||||||||||||||||||||||||||||||||||||||||
| Battle Creek, MI | ( | 2021 | ||||||||||||||||||||||||||||||||||||||||||||||||||||||||||||||||||||||||
| Beaumont, TX | ( | 2021 | ||||||||||||||||||||||||||||||||||||||||||||||||||||||||||||||||||||||||
| Birmingham, AL | ( | 2021 | ||||||||||||||||||||||||||||||||||||||||||||||||||||||||||||||||||||||||
| Bloomington, IN | ( | 2021 | ||||||||||||||||||||||||||||||||||||||||||||||||||||||||||||||||||||||||
| Boston, MA | ( | 2021 | ||||||||||||||||||||||||||||||||||||||||||||||||||||||||||||||||||||||||
| Boulder, CO | ( | 2021 | ||||||||||||||||||||||||||||||||||||||||||||||||||||||||||||||||||||||||
| Brownsville, TN | ( | 2021 | ||||||||||||||||||||||||||||||||||||||||||||||||||||||||||||||||||||||||
| Brownsville, TX | 2021 | |||||||||||||||||||||||||||||||||||||||||||||||||||||||||||||||||||||||||
| Canton, OH | ( | 2021 | ||||||||||||||||||||||||||||||||||||||||||||||||||||||||||||||||||||||||
| Cape Coral, FL | ( | 2021 | ||||||||||||||||||||||||||||||||||||||||||||||||||||||||||||||||||||||||
| Charlotte, NC | ( | 2021 | ||||||||||||||||||||||||||||||||||||||||||||||||||||||||||||||||||||||||
| Charlottesville, VA | ( | 2021 | ||||||||||||||||||||||||||||||||||||||||||||||||||||||||||||||||||||||||
| Cheyenne, WY | ( | 2021 | ||||||||||||||||||||||||||||||||||||||||||||||||||||||||||||||||||||||||
| Chicago, IL | ( | 2021 | ||||||||||||||||||||||||||||||||||||||||||||||||||||||||||||||||||||||||
| Cincinnati, OH | ( | 2021 | ||||||||||||||||||||||||||||||||||||||||||||||||||||||||||||||||||||||||
| Clearlake, CA | ( | 2021 | ||||||||||||||||||||||||||||||||||||||||||||||||||||||||||||||||||||||||
| Cleveland, MS | ( | 2021 | ||||||||||||||||||||||||||||||||||||||||||||||||||||||||||||||||||||||||
| Cleveland, OH | ( | 2021 | ||||||||||||||||||||||||||||||||||||||||||||||||||||||||||||||||||||||||
| College Station, TX | ( | 2021 | ||||||||||||||||||||||||||||||||||||||||||||||||||||||||||||||||||||||||
| Columbus, OH | ( | 2021 | ||||||||||||||||||||||||||||||||||||||||||||||||||||||||||||||||||||||||
| Crestview, FL | ( | 2021 | ||||||||||||||||||||||||||||||||||||||||||||||||||||||||||||||||||||||||
| Dallas, TX | ( | 2021 | ||||||||||||||||||||||||||||||||||||||||||||||||||||||||||||||||||||||||
| Decatur, IL | ( | 2021 | ||||||||||||||||||||||||||||||||||||||||||||||||||||||||||||||||||||||||
| Deltona, FL | ( | 2021 | ||||||||||||||||||||||||||||||||||||||||||||||||||||||||||||||||||||||||
| Denver, CO | ( | 2021 | ||||||||||||||||||||||||||||||||||||||||||||||||||||||||||||||||||||||||
| Detroit, MI | ( | 2021 | ||||||||||||||||||||||||||||||||||||||||||||||||||||||||||||||||||||||||
| Douglas, GA | ( | 2021 | ||||||||||||||||||||||||||||||||||||||||||||||||||||||||||||||||||||||||
| Duluth, MN | ( | 2021 | ||||||||||||||||||||||||||||||||||||||||||||||||||||||||||||||||||||||||
F-57
| Initial Cost | Costs Capitalized Subsequent to Acquisition | Gross Amounts at which Carried at the Close of Period(1) | ||||||||||||||||||||||||||||||||||||||||||||||||||||||||||||||||||||||||
| Description | Location | Number of Properties | Encumbrances (2) | Land and Land Improvements | Building and Building Improvements | Land and Land Improvements | Building and Building Improvements | Land and Land Improvements | Building and Building Improvements | Total | Accumulated Depreciation(3) | Year Acquired | ||||||||||||||||||||||||||||||||||||||||||||||||||||||||||||||
| Durant, OK | $ | $ | $ | $ | $ | $ | $ | $ | $ | ( | 2021 | |||||||||||||||||||||||||||||||||||||||||||||||||||||||||||||||
| Durham, NC | ( | 2021 | ||||||||||||||||||||||||||||||||||||||||||||||||||||||||||||||||||||||||
| El Centro, CA | ( | 2021 | ||||||||||||||||||||||||||||||||||||||||||||||||||||||||||||||||||||||||
| El Paso, TX | ( | 2021 | ||||||||||||||||||||||||||||||||||||||||||||||||||||||||||||||||||||||||
| Enterprise, AL | ( | 2021 | ||||||||||||||||||||||||||||||||||||||||||||||||||||||||||||||||||||||||
| Evansville, IN | ( | 2021 | ||||||||||||||||||||||||||||||||||||||||||||||||||||||||||||||||||||||||
| Fort Collins, CO | ( | 2021 | ||||||||||||||||||||||||||||||||||||||||||||||||||||||||||||||||||||||||
| Fresno, CA | ( | 2021 | ||||||||||||||||||||||||||||||||||||||||||||||||||||||||||||||||||||||||
| Gillette, WY | 2021 | |||||||||||||||||||||||||||||||||||||||||||||||||||||||||||||||||||||||||
| Grand Rapids, MI | ( | 2021 | ||||||||||||||||||||||||||||||||||||||||||||||||||||||||||||||||||||||||
| Greeley, CO | ( | 2021 | ||||||||||||||||||||||||||||||||||||||||||||||||||||||||||||||||||||||||
| Greenville, MS | ( | 2021 | ||||||||||||||||||||||||||||||||||||||||||||||||||||||||||||||||||||||||
| Greenville, SC | ( | 2021 | ||||||||||||||||||||||||||||||||||||||||||||||||||||||||||||||||||||||||
| Gulfport, MS | ( | 2021 | ||||||||||||||||||||||||||||||||||||||||||||||||||||||||||||||||||||||||
| Hammond, LA | ( | 2021 | ||||||||||||||||||||||||||||||||||||||||||||||||||||||||||||||||||||||||
| Hanford, CA | ( | 2021 | ||||||||||||||||||||||||||||||||||||||||||||||||||||||||||||||||||||||||
| Harrisburg, PA | ( | 2021 | ||||||||||||||||||||||||||||||||||||||||||||||||||||||||||||||||||||||||
| Hartford, CT | ( | 2021 | ||||||||||||||||||||||||||||||||||||||||||||||||||||||||||||||||||||||||
| Heber, UT | ( | 2021 | ||||||||||||||||||||||||||||||||||||||||||||||||||||||||||||||||||||||||
| Houston, TX | ( | 2021 | ||||||||||||||||||||||||||||||||||||||||||||||||||||||||||||||||||||||||
| Indianapolis, IN | ( | 2021 | ||||||||||||||||||||||||||||||||||||||||||||||||||||||||||||||||||||||||
| Jackson, MS | ( | 2021 | ||||||||||||||||||||||||||||||||||||||||||||||||||||||||||||||||||||||||
| Jacksonville, FL | ( | 2021 | ||||||||||||||||||||||||||||||||||||||||||||||||||||||||||||||||||||||||
| Kahului, HI | 2021 | |||||||||||||||||||||||||||||||||||||||||||||||||||||||||||||||||||||||||
| Kansas City, MO | ( | 2021 | ||||||||||||||||||||||||||||||||||||||||||||||||||||||||||||||||||||||||
| Killeen, TX | ( | 2021 | ||||||||||||||||||||||||||||||||||||||||||||||||||||||||||||||||||||||||
| La Crosse, WI | ( | 2021 | ||||||||||||||||||||||||||||||||||||||||||||||||||||||||||||||||||||||||
| Lake Havasu City, AZ | ( | 2021 | ||||||||||||||||||||||||||||||||||||||||||||||||||||||||||||||||||||||||
| Lakeland, FL | ( | 2021 | ||||||||||||||||||||||||||||||||||||||||||||||||||||||||||||||||||||||||
| Lancaster, PA | ( | 2021 | ||||||||||||||||||||||||||||||||||||||||||||||||||||||||||||||||||||||||
| Las Cruces, NM | ( | 2021 | ||||||||||||||||||||||||||||||||||||||||||||||||||||||||||||||||||||||||
| Las Vegas, NV | ( | 2021 | ||||||||||||||||||||||||||||||||||||||||||||||||||||||||||||||||||||||||
| Lincoln, IL | ( | 2021 | ||||||||||||||||||||||||||||||||||||||||||||||||||||||||||||||||||||||||
| Lincoln, NE | ( | 2021 | ||||||||||||||||||||||||||||||||||||||||||||||||||||||||||||||||||||||||
| Longview, TX | ( | 2021 | ||||||||||||||||||||||||||||||||||||||||||||||||||||||||||||||||||||||||
| Los Angeles, CA | ( | 2021 | ||||||||||||||||||||||||||||||||||||||||||||||||||||||||||||||||||||||||
| Lynchburg, VA | ( | 2021 | ||||||||||||||||||||||||||||||||||||||||||||||||||||||||||||||||||||||||
| Macomb, IL | ( | 2021 | ||||||||||||||||||||||||||||||||||||||||||||||||||||||||||||||||||||||||
| Madera, CA | ( | 2021 | ||||||||||||||||||||||||||||||||||||||||||||||||||||||||||||||||||||||||
| McAllen, TX | ( | 2021 | ||||||||||||||||||||||||||||||||||||||||||||||||||||||||||||||||||||||||
| Memphis, TN | ( | 2021 | ||||||||||||||||||||||||||||||||||||||||||||||||||||||||||||||||||||||||
| Miami, FL | ( | 2021-2022 | ||||||||||||||||||||||||||||||||||||||||||||||||||||||||||||||||||||||||
| Midland, TX | ( | 2021 | ||||||||||||||||||||||||||||||||||||||||||||||||||||||||||||||||||||||||
| Milwaukee, WI | ( | 2021 | ||||||||||||||||||||||||||||||||||||||||||||||||||||||||||||||||||||||||
F-58
| Initial Cost | Costs Capitalized Subsequent to Acquisition | Gross Amounts at which Carried at the Close of Period(1) | ||||||||||||||||||||||||||||||||||||||||||||||||||||||||||||||||||||||||
| Description | Location | Number of Properties | Encumbrances (2) | Land and Land Improvements | Building and Building Improvements | Land and Land Improvements | Building and Building Improvements | Land and Land Improvements | Building and Building Improvements | Total | Accumulated Depreciation(3) | Year Acquired | ||||||||||||||||||||||||||||||||||||||||||||||||||||||||||||||
| Modesto, CA | $ | $ | $ | $ | $ | $ | $ | $ | $ | ( | 2021 | |||||||||||||||||||||||||||||||||||||||||||||||||||||||||||||||
| Morristown, TN | 2021 | |||||||||||||||||||||||||||||||||||||||||||||||||||||||||||||||||||||||||
| Muskegon, MI | ( | 2021 | ||||||||||||||||||||||||||||||||||||||||||||||||||||||||||||||||||||||||
| Muskogee, OK | ( | 2021 | ||||||||||||||||||||||||||||||||||||||||||||||||||||||||||||||||||||||||
| Nashville, TN | ( | 2021 | ||||||||||||||||||||||||||||||||||||||||||||||||||||||||||||||||||||||||
| New Orleans, LA | ( | 2021 | ||||||||||||||||||||||||||||||||||||||||||||||||||||||||||||||||||||||||
| New York, NY | ( | 2021 | ||||||||||||||||||||||||||||||||||||||||||||||||||||||||||||||||||||||||
| Ogden, UT | ( | 2021 | ||||||||||||||||||||||||||||||||||||||||||||||||||||||||||||||||||||||||
| Oklahoma City, OK | ( | 2021 | ||||||||||||||||||||||||||||||||||||||||||||||||||||||||||||||||||||||||
| Omaha, NE | ( | 2021 | ||||||||||||||||||||||||||||||||||||||||||||||||||||||||||||||||||||||||
| Orlando, FL | ( | 2021 | ||||||||||||||||||||||||||||||||||||||||||||||||||||||||||||||||||||||||
| Other U.S. | ( | 2021 | ||||||||||||||||||||||||||||||||||||||||||||||||||||||||||||||||||||||||
| Oxnard, CA | ( | 2021 | ||||||||||||||||||||||||||||||||||||||||||||||||||||||||||||||||||||||||
| Palm Bay, FL | ( | 2021 | ||||||||||||||||||||||||||||||||||||||||||||||||||||||||||||||||||||||||
| Pensacola, FL | ( | 2021 | ||||||||||||||||||||||||||||||||||||||||||||||||||||||||||||||||||||||||
| Phoenix, AZ | ( | 2021 | ||||||||||||||||||||||||||||||||||||||||||||||||||||||||||||||||||||||||
| Plymouth, IN | ( | 2021 | ||||||||||||||||||||||||||||||||||||||||||||||||||||||||||||||||||||||||
| Raleigh, NC | ( | 2021 | ||||||||||||||||||||||||||||||||||||||||||||||||||||||||||||||||||||||||
| Rapid City, SD | ( | 2021 | ||||||||||||||||||||||||||||||||||||||||||||||||||||||||||||||||||||||||
| Red Bluff, CA | ( | 2021 | ||||||||||||||||||||||||||||||||||||||||||||||||||||||||||||||||||||||||
| Reno, NV | ( | 2021 | ||||||||||||||||||||||||||||||||||||||||||||||||||||||||||||||||||||||||
| Richmond, VA | ( | 2021 | ||||||||||||||||||||||||||||||||||||||||||||||||||||||||||||||||||||||||
| Riverside, CA | ( | 2021 | ||||||||||||||||||||||||||||||||||||||||||||||||||||||||||||||||||||||||
| Sacramento, CA | ( | 2021 | ||||||||||||||||||||||||||||||||||||||||||||||||||||||||||||||||||||||||
| Salinas, CA | ( | 2021 | ||||||||||||||||||||||||||||||||||||||||||||||||||||||||||||||||||||||||
| Salisbury, MD | ( | 2021 | ||||||||||||||||||||||||||||||||||||||||||||||||||||||||||||||||||||||||
| Salt Lake City, UT | ( | 2021-2022 | ||||||||||||||||||||||||||||||||||||||||||||||||||||||||||||||||||||||||
| San Antonio, TX | ( | 2021 | ||||||||||||||||||||||||||||||||||||||||||||||||||||||||||||||||||||||||
| San Diego, CA | ( | 2021-2022 | ||||||||||||||||||||||||||||||||||||||||||||||||||||||||||||||||||||||||
| San Francisco, CA | ( | 2021 | ||||||||||||||||||||||||||||||||||||||||||||||||||||||||||||||||||||||||
| San Jose, CA | ( | 2021 | ||||||||||||||||||||||||||||||||||||||||||||||||||||||||||||||||||||||||
| San Luis Obispo, CA | ( | 2021 | ||||||||||||||||||||||||||||||||||||||||||||||||||||||||||||||||||||||||
| Santa Fe, NM | ( | 2021 | ||||||||||||||||||||||||||||||||||||||||||||||||||||||||||||||||||||||||
| Santa Maria, CA | ( | 2021 | ||||||||||||||||||||||||||||||||||||||||||||||||||||||||||||||||||||||||
| Santa Rosa, CA | ( | 2021 | ||||||||||||||||||||||||||||||||||||||||||||||||||||||||||||||||||||||||
| Seattle, WA | ( | 2021 | ||||||||||||||||||||||||||||||||||||||||||||||||||||||||||||||||||||||||
| Sebastian, FL | ( | 2021 | ||||||||||||||||||||||||||||||||||||||||||||||||||||||||||||||||||||||||
| Shawnee, OK | ( | 2021 | ||||||||||||||||||||||||||||||||||||||||||||||||||||||||||||||||||||||||
| Sheridan, WY | ( | 2021 | ||||||||||||||||||||||||||||||||||||||||||||||||||||||||||||||||||||||||
| Sherman, TX | ( | 2021 | ||||||||||||||||||||||||||||||||||||||||||||||||||||||||||||||||||||||||
| Show Low, AZ | ( | 2021 | ||||||||||||||||||||||||||||||||||||||||||||||||||||||||||||||||||||||||
| Sierra Vista, AZ | ( | 2021 | ||||||||||||||||||||||||||||||||||||||||||||||||||||||||||||||||||||||||
| Spartanburg, SC | ( | 2021 | ||||||||||||||||||||||||||||||||||||||||||||||||||||||||||||||||||||||||
F-59
| Initial Cost | Costs Capitalized Subsequent to Acquisition | Gross Amounts at which Carried at the Close of Period(1) | ||||||||||||||||||||||||||||||||||||||||||||||||||||||||||||||||||||||||
| Description | Location | Number of Properties | Encumbrances(2) | Land and Land Improvements | Building and Building Improvements | Land and Land Improvements | Building and Building Improvements | Land and Land Improvements | Building and Building Improvements | Total | Accumulated Depreciation(3) | Year Acquired | ||||||||||||||||||||||||||||||||||||||||||||||||||||||||||||||
| St. Louis, MO | $ | $ | $ | $ | $ | $ | $ | $ | $ | ( | 2021 | |||||||||||||||||||||||||||||||||||||||||||||||||||||||||||||||
| Sterling, CO | ( | 2021 | ||||||||||||||||||||||||||||||||||||||||||||||||||||||||||||||||||||||||
| Stockton, CA | ( | 2021 | ||||||||||||||||||||||||||||||||||||||||||||||||||||||||||||||||||||||||
| Tampa, FL | ( | 2021-2022 | ||||||||||||||||||||||||||||||||||||||||||||||||||||||||||||||||||||||||
| Trenton, NJ | ( | 2021 | ||||||||||||||||||||||||||||||||||||||||||||||||||||||||||||||||||||||||
| Tyler, TX | ( | 2021 | ||||||||||||||||||||||||||||||||||||||||||||||||||||||||||||||||||||||||
| Vidalia, GA | ( | 2021 | ||||||||||||||||||||||||||||||||||||||||||||||||||||||||||||||||||||||||
| Vineland, NJ | ( | 2021 | ||||||||||||||||||||||||||||||||||||||||||||||||||||||||||||||||||||||||
| Virginia Beach, VA | ( | 2021 | ||||||||||||||||||||||||||||||||||||||||||||||||||||||||||||||||||||||||
| Visalia, CA | ( | 2021 | ||||||||||||||||||||||||||||||||||||||||||||||||||||||||||||||||||||||||
| Waco, TX | ( | 2021 | ||||||||||||||||||||||||||||||||||||||||||||||||||||||||||||||||||||||||
| Washington, DC | ( | 2021 | ||||||||||||||||||||||||||||||||||||||||||||||||||||||||||||||||||||||||
| Wilson, NC | ( | 2021 | ||||||||||||||||||||||||||||||||||||||||||||||||||||||||||||||||||||||||
| Worcester, MA | ( | 2021 | ||||||||||||||||||||||||||||||||||||||||||||||||||||||||||||||||||||||||
| Yuba City, CA | ( | 2021 | ||||||||||||||||||||||||||||||||||||||||||||||||||||||||||||||||||||||||
| Total Rental Housing Properties: | ( | |||||||||||||||||||||||||||||||||||||||||||||||||||||||||||||||||||||||||
| Industrial Properties: | ||||||||||||||||||||||||||||||||||||||||||||||||||||||||||||||||||||||||||
| Cold Storage Warehouse | ||||||||||||||||||||||||||||||||||||||||||||||||||||||||||||||||||||||||||
| Atlanta, GA | ( | 2018 | ||||||||||||||||||||||||||||||||||||||||||||||||||||||||||||||||||||||||
| Austin, TX | ( | 2018 | ||||||||||||||||||||||||||||||||||||||||||||||||||||||||||||||||||||||||
| Baltimore, MD | ( | 2018 | ||||||||||||||||||||||||||||||||||||||||||||||||||||||||||||||||||||||||
| San Francisco, CA | ( | 2018 | ||||||||||||||||||||||||||||||||||||||||||||||||||||||||||||||||||||||||
| Stockton, CA | ( | 2018 | ||||||||||||||||||||||||||||||||||||||||||||||||||||||||||||||||||||||||
| Industrial | ||||||||||||||||||||||||||||||||||||||||||||||||||||||||||||||||||||||||||
| Allentown, PA | ( | 2020-2021 | ||||||||||||||||||||||||||||||||||||||||||||||||||||||||||||||||||||||||
| Atlanta, GA | ( | 2017-2022 | ||||||||||||||||||||||||||||||||||||||||||||||||||||||||||||||||||||||||
| Austin, TX | ( | 2019-2021 | ||||||||||||||||||||||||||||||||||||||||||||||||||||||||||||||||||||||||
| Baltimore, MD | ( | 2018-2021 | ||||||||||||||||||||||||||||||||||||||||||||||||||||||||||||||||||||||||
| Baton Rouge, LA | ( | 2021 | ||||||||||||||||||||||||||||||||||||||||||||||||||||||||||||||||||||||||
| Boston, MA | 2021 | |||||||||||||||||||||||||||||||||||||||||||||||||||||||||||||||||||||||||
| Charlotte, NC | ( | 2018-2021 | ||||||||||||||||||||||||||||||||||||||||||||||||||||||||||||||||||||||||
| Chicago, IL | ( | 2017-2022 | ||||||||||||||||||||||||||||||||||||||||||||||||||||||||||||||||||||||||
| Cincinnati, OH | ( | 2018-2021 | ||||||||||||||||||||||||||||||||||||||||||||||||||||||||||||||||||||||||
| Columbus, OH | ( | 2018-2021 | ||||||||||||||||||||||||||||||||||||||||||||||||||||||||||||||||||||||||
| Dallas, TX | ( | 2017-2021 | ||||||||||||||||||||||||||||||||||||||||||||||||||||||||||||||||||||||||
| Davenport, IA | ( | 2021 | ||||||||||||||||||||||||||||||||||||||||||||||||||||||||||||||||||||||||
| Deltona, FL | ( | 2021 | ||||||||||||||||||||||||||||||||||||||||||||||||||||||||||||||||||||||||
| Denver, CO | ( | 2018-2021 | ||||||||||||||||||||||||||||||||||||||||||||||||||||||||||||||||||||||||
| Durham, NC | ( | 2019-2022 | ||||||||||||||||||||||||||||||||||||||||||||||||||||||||||||||||||||||||
| El Paso, TX | ( | 2019-2021 | ||||||||||||||||||||||||||||||||||||||||||||||||||||||||||||||||||||||||
| Fond du Lac, WI | ( | 2021 | ||||||||||||||||||||||||||||||||||||||||||||||||||||||||||||||||||||||||
| Greensboro, NC | ( | 2020-2021 | ||||||||||||||||||||||||||||||||||||||||||||||||||||||||||||||||||||||||
| Greenville, SC | ( | 2018 | ||||||||||||||||||||||||||||||||||||||||||||||||||||||||||||||||||||||||
F-60
| Initial Cost | Costs Capitalized Subsequent to Acquisition | Gross Amounts at which Carried at the Close of Period(1) | ||||||||||||||||||||||||||||||||||||||||||||||||||||||||||||||||||||||||
| Description | Location | Number of Properties | Encumbrances(2) | Land and Land Improvements | Building and Building Improvements | Land and Land Improvements | Building and Building Improvements | Land and Land Improvements | Building and Building Improvements | Total | Accumulated Depreciation(3) | Year Acquired | ||||||||||||||||||||||||||||||||||||||||||||||||||||||||||||||
| Harrisburg, PA | $ | $ | $ | $ | $ | $ | $ | $ | $ | ( | 2017-2019 | |||||||||||||||||||||||||||||||||||||||||||||||||||||||||||||||
| Hickory, NC | ( | 2021 | ||||||||||||||||||||||||||||||||||||||||||||||||||||||||||||||||||||||||
| Houston, TX | ( | 2017-2021 | ||||||||||||||||||||||||||||||||||||||||||||||||||||||||||||||||||||||||
| Indianapolis, IN | ( | 2018-2021 | ||||||||||||||||||||||||||||||||||||||||||||||||||||||||||||||||||||||||
| Jacksonville, FL | ( | 2017-2021 | ||||||||||||||||||||||||||||||||||||||||||||||||||||||||||||||||||||||||
| Jefferson, GA | ( | 2019-2021 | ||||||||||||||||||||||||||||||||||||||||||||||||||||||||||||||||||||||||
| Kansas City, MO | ( | 2019 | ||||||||||||||||||||||||||||||||||||||||||||||||||||||||||||||||||||||||
| Lakeland, FL | ( | 2018-2021 | ||||||||||||||||||||||||||||||||||||||||||||||||||||||||||||||||||||||||
| Lancaster, PA | ( | 2021 | ||||||||||||||||||||||||||||||||||||||||||||||||||||||||||||||||||||||||
| Las Vegas, NV | ( | 2019-2021 | ||||||||||||||||||||||||||||||||||||||||||||||||||||||||||||||||||||||||
| Los Angeles, CA | ( | 2018-2021 | ||||||||||||||||||||||||||||||||||||||||||||||||||||||||||||||||||||||||
| Louisville, KY | ( | 2018-2021 | ||||||||||||||||||||||||||||||||||||||||||||||||||||||||||||||||||||||||
| Memphis, TN | ( | 2018-2021 | ||||||||||||||||||||||||||||||||||||||||||||||||||||||||||||||||||||||||
| Miami, FL | ( | 2018-2021 | ||||||||||||||||||||||||||||||||||||||||||||||||||||||||||||||||||||||||
| Milwaukee, WI | ( | 2019-2021 | ||||||||||||||||||||||||||||||||||||||||||||||||||||||||||||||||||||||||
| Minneapolis, MN | ( | 2019-2021 | ||||||||||||||||||||||||||||||||||||||||||||||||||||||||||||||||||||||||
| Nashville, TN | ( | 2017-2021 | ||||||||||||||||||||||||||||||||||||||||||||||||||||||||||||||||||||||||
| New York, NY | ( | 2017-2021 | ||||||||||||||||||||||||||||||||||||||||||||||||||||||||||||||||||||||||
| Orlando, FL | ( | 2017-2021 | ||||||||||||||||||||||||||||||||||||||||||||||||||||||||||||||||||||||||
| Oxnard, CA | ( | 2018-2021 | ||||||||||||||||||||||||||||||||||||||||||||||||||||||||||||||||||||||||
| Philadelphia, PA | ( | 2018-2021 | ||||||||||||||||||||||||||||||||||||||||||||||||||||||||||||||||||||||||
| Phoenix, AZ | ( | 2018-2021 | ||||||||||||||||||||||||||||||||||||||||||||||||||||||||||||||||||||||||
| Portland, OR | ( | 2021 | ||||||||||||||||||||||||||||||||||||||||||||||||||||||||||||||||||||||||
| Racine, WI | ( | 2020 | ||||||||||||||||||||||||||||||||||||||||||||||||||||||||||||||||||||||||
| Raleigh, NC | ( | 2018 | ||||||||||||||||||||||||||||||||||||||||||||||||||||||||||||||||||||||||
| Reading, PA | ( | 2019 | ||||||||||||||||||||||||||||||||||||||||||||||||||||||||||||||||||||||||
| Reno, NV | ( | 2019-2021 | ||||||||||||||||||||||||||||||||||||||||||||||||||||||||||||||||||||||||
| Richmond, VA | ( | 2018-2019 | ||||||||||||||||||||||||||||||||||||||||||||||||||||||||||||||||||||||||
| Riverside, CA | ( | 2018-2021 | ||||||||||||||||||||||||||||||||||||||||||||||||||||||||||||||||||||||||
| Sacramento, CA | ( | 2020 | ||||||||||||||||||||||||||||||||||||||||||||||||||||||||||||||||||||||||
| Salt Lake City, UT | ( | 2021 | ||||||||||||||||||||||||||||||||||||||||||||||||||||||||||||||||||||||||
| San Antonio, TX | ( | 2019-2021 | ||||||||||||||||||||||||||||||||||||||||||||||||||||||||||||||||||||||||
| San Diego, CA | ( | 2018-2021 | ||||||||||||||||||||||||||||||||||||||||||||||||||||||||||||||||||||||||
| San Francisco, CA | ( | 2020-2021 | ||||||||||||||||||||||||||||||||||||||||||||||||||||||||||||||||||||||||
| Savannah, GA | ( | 2018 | ||||||||||||||||||||||||||||||||||||||||||||||||||||||||||||||||||||||||
| Scranton, PA | ( | 2019-2021 | ||||||||||||||||||||||||||||||||||||||||||||||||||||||||||||||||||||||||
| Seattle, WA | ( | 2018-2021 | ||||||||||||||||||||||||||||||||||||||||||||||||||||||||||||||||||||||||
| Stockton, CA | ( | 2020 | ||||||||||||||||||||||||||||||||||||||||||||||||||||||||||||||||||||||||
| Tampa, FL | ( | 2018-2021 | ||||||||||||||||||||||||||||||||||||||||||||||||||||||||||||||||||||||||
| Vallejo, CA | ( | 2019-2020 | ||||||||||||||||||||||||||||||||||||||||||||||||||||||||||||||||||||||||
| Virginia Beach, VA | ( | 2018-2019 | ||||||||||||||||||||||||||||||||||||||||||||||||||||||||||||||||||||||||
| Washington, DC | ( | 2018-2021 | ||||||||||||||||||||||||||||||||||||||||||||||||||||||||||||||||||||||||
| Wausau, WI | ( | 2021 | ||||||||||||||||||||||||||||||||||||||||||||||||||||||||||||||||||||||||
| Winchester, VA | ( | 2018 | ||||||||||||||||||||||||||||||||||||||||||||||||||||||||||||||||||||||||
F-61
| Initial Cost | Costs Capitalized Subsequent to Acquisition | Gross Amounts at which Carried at the Close of Period(1) | ||||||||||||||||||||||||||||||||||||||||||||||||||||||||||||||||||||||||
| Description | Location | Number of Properties | Encumbrances(2) | Land and Land Improvements | Building and Building Improvements | Land and Land Improvements | Building and Building Improvements | Land and Land Improvements | Building and Building Improvements | Total | Accumulated Depreciation(3) | Year Acquired | ||||||||||||||||||||||||||||||||||||||||||||||||||||||||||||||
| Winston-Salem, NC | $ | $ | $ | $ | $ | $ | $ | $ | $ | ( | 2018-2021 | |||||||||||||||||||||||||||||||||||||||||||||||||||||||||||||||
| Worcester, MA | ( | 2018-2021 | ||||||||||||||||||||||||||||||||||||||||||||||||||||||||||||||||||||||||
| York, PA | ( | 2018 | ||||||||||||||||||||||||||||||||||||||||||||||||||||||||||||||||||||||||
| Total Industrial Properties: | ( | |||||||||||||||||||||||||||||||||||||||||||||||||||||||||||||||||||||||||
| Net Lease Properties: | ||||||||||||||||||||||||||||||||||||||||||||||||||||||||||||||||||||||||||
| Las Vegas, NV | ( | 2019-2022 | ||||||||||||||||||||||||||||||||||||||||||||||||||||||||||||||||||||||||
| Total Net Lease Properties: | ( | |||||||||||||||||||||||||||||||||||||||||||||||||||||||||||||||||||||||||
| Data Center Properties: | ||||||||||||||||||||||||||||||||||||||||||||||||||||||||||||||||||||||||||
| Washington, DC | ( | 2019-2022 | ||||||||||||||||||||||||||||||||||||||||||||||||||||||||||||||||||||||||
| Total Data Center Properties: | ( | |||||||||||||||||||||||||||||||||||||||||||||||||||||||||||||||||||||||||
| Hospitality Properties: | ||||||||||||||||||||||||||||||||||||||||||||||||||||||||||||||||||||||||||
| Full Service Hotels | ||||||||||||||||||||||||||||||||||||||||||||||||||||||||||||||||||||||||||
| Atlanta, GA | ( | 2019 | ||||||||||||||||||||||||||||||||||||||||||||||||||||||||||||||||||||||||
| Select Service Hotels | ||||||||||||||||||||||||||||||||||||||||||||||||||||||||||||||||||||||||||
| Atlanta, GA | ( | 2017-2021 | ||||||||||||||||||||||||||||||||||||||||||||||||||||||||||||||||||||||||
| Austin, TX | ( | 2019-2021 | ||||||||||||||||||||||||||||||||||||||||||||||||||||||||||||||||||||||||
| Bloomington, IN | ( | 2019 | ||||||||||||||||||||||||||||||||||||||||||||||||||||||||||||||||||||||||
| Boston, MA | ( | 2017-2022 | ||||||||||||||||||||||||||||||||||||||||||||||||||||||||||||||||||||||||
| Boulder, CO | ( | 2019 | ||||||||||||||||||||||||||||||||||||||||||||||||||||||||||||||||||||||||
| Chicago, IL | ( | 2019 | ||||||||||||||||||||||||||||||||||||||||||||||||||||||||||||||||||||||||
| Colorado Springs, CO | ( | 2019 | ||||||||||||||||||||||||||||||||||||||||||||||||||||||||||||||||||||||||
| Crestview, FL | ( | 2019 | ||||||||||||||||||||||||||||||||||||||||||||||||||||||||||||||||||||||||
| Denver, CO | ( | 2019 | ||||||||||||||||||||||||||||||||||||||||||||||||||||||||||||||||||||||||
| Detroit, MI | ( | 2019 | ||||||||||||||||||||||||||||||||||||||||||||||||||||||||||||||||||||||||
| Hilo, HI | ( | 2019 | ||||||||||||||||||||||||||||||||||||||||||||||||||||||||||||||||||||||||
| Key West, FL | ( | 2021 | ||||||||||||||||||||||||||||||||||||||||||||||||||||||||||||||||||||||||
| Las Vegas, NV | ( | 2018 | ||||||||||||||||||||||||||||||||||||||||||||||||||||||||||||||||||||||||
| Los Angeles, CA | ( | 2022 | ||||||||||||||||||||||||||||||||||||||||||||||||||||||||||||||||||||||||
| Miami, FL | ( | 2019 | ||||||||||||||||||||||||||||||||||||||||||||||||||||||||||||||||||||||||
| Nashville, TN | ( | 2021 | ||||||||||||||||||||||||||||||||||||||||||||||||||||||||||||||||||||||||
| Orlando, FL | ( | 2018 | ||||||||||||||||||||||||||||||||||||||||||||||||||||||||||||||||||||||||
| Philadelphia, PA | ( | 2022 | ||||||||||||||||||||||||||||||||||||||||||||||||||||||||||||||||||||||||
| Sacramento, CA | ( | 2017 | ||||||||||||||||||||||||||||||||||||||||||||||||||||||||||||||||||||||||
| Salt Lake City, UT | ( | 2018-2019 | ||||||||||||||||||||||||||||||||||||||||||||||||||||||||||||||||||||||||
| San Jose, CA | ( | 2017-2022 | ||||||||||||||||||||||||||||||||||||||||||||||||||||||||||||||||||||||||
| Santa Rosa, CA | ( | 2018 | ||||||||||||||||||||||||||||||||||||||||||||||||||||||||||||||||||||||||
| Seattle, WA | ( | 2018 | ||||||||||||||||||||||||||||||||||||||||||||||||||||||||||||||||||||||||
| Tampa, FL | ( | 2017 | ||||||||||||||||||||||||||||||||||||||||||||||||||||||||||||||||||||||||
| Washington, DC | ( | 2019-2022 | ||||||||||||||||||||||||||||||||||||||||||||||||||||||||||||||||||||||||
| Worcester, MA | ( | 2017 | ||||||||||||||||||||||||||||||||||||||||||||||||||||||||||||||||||||||||
| Total Hospitality: | ( | |||||||||||||||||||||||||||||||||||||||||||||||||||||||||||||||||||||||||
F-62
| Initial Cost | Costs Capitalized Subsequent to Acquisition | Gross Amounts at which Carried at the Close of Period(1) | ||||||||||||||||||||||||||||||||||||||||||||||||||||||||||||||||||||||||
| Description | Location | Number of Properties | Encumbrances(2) | Land and Land Improvements | Building and Building Improvements | Land and Land Improvements | Building and Building Improvements | Land and Land Improvements | Building and Building Improvements | Total | Accumulated Depreciation(3) | Year Acquired | ||||||||||||||||||||||||||||||||||||||||||||||||||||||||||||||
| Self Storage Properties: | ||||||||||||||||||||||||||||||||||||||||||||||||||||||||||||||||||||||||||
| Akron, OH | $ | $ | $ | $ | $ | $ | $ | $ | $ | ( | 2020-2022 | |||||||||||||||||||||||||||||||||||||||||||||||||||||||||||||||
| Austin, TX | ( | 2022 | ||||||||||||||||||||||||||||||||||||||||||||||||||||||||||||||||||||||||
| Baltimore, MD | ( | 2019 | ||||||||||||||||||||||||||||||||||||||||||||||||||||||||||||||||||||||||
| Cape Coral, FL | ( | 2019 | ||||||||||||||||||||||||||||||||||||||||||||||||||||||||||||||||||||||||
| Charleston, SC | ( | 2019 | ||||||||||||||||||||||||||||||||||||||||||||||||||||||||||||||||||||||||
| Chattanooga, TN | ( | 2019 | ||||||||||||||||||||||||||||||||||||||||||||||||||||||||||||||||||||||||
| Cleveland, OH | ( | 2020-2022 | ||||||||||||||||||||||||||||||||||||||||||||||||||||||||||||||||||||||||
| College Station, TX | ( | 2021 | ||||||||||||||||||||||||||||||||||||||||||||||||||||||||||||||||||||||||
| Colorado Springs, CO | ( | 2022 | ||||||||||||||||||||||||||||||||||||||||||||||||||||||||||||||||||||||||
| Corpus Christi, TX | ( | 2020-2021 | ||||||||||||||||||||||||||||||||||||||||||||||||||||||||||||||||||||||||
| Dallas, TX | ( | 2020-2022 | ||||||||||||||||||||||||||||||||||||||||||||||||||||||||||||||||||||||||
| Denver, CO | ( | 2022 | ||||||||||||||||||||||||||||||||||||||||||||||||||||||||||||||||||||||||
| Detroit, MI | ( | 2020-2021 | ||||||||||||||||||||||||||||||||||||||||||||||||||||||||||||||||||||||||
| Fayetteville, NC | ( | 2019-2022 | ||||||||||||||||||||||||||||||||||||||||||||||||||||||||||||||||||||||||
| Fresno, CA | ( | 2020 | ||||||||||||||||||||||||||||||||||||||||||||||||||||||||||||||||||||||||
| Gulfport, MS | ( | 2022 | ||||||||||||||||||||||||||||||||||||||||||||||||||||||||||||||||||||||||
| Houston, TX | ( | 2020-2022 | ||||||||||||||||||||||||||||||||||||||||||||||||||||||||||||||||||||||||
| Kingsville, TX | ( | 2022 | ||||||||||||||||||||||||||||||||||||||||||||||||||||||||||||||||||||||||
| Knoxville, TN | ( | 2020 | ||||||||||||||||||||||||||||||||||||||||||||||||||||||||||||||||||||||||
| Lakeland, FL | ( | 2019-2022 | ||||||||||||||||||||||||||||||||||||||||||||||||||||||||||||||||||||||||
| Los Angeles, CA | ( | 2022 | ||||||||||||||||||||||||||||||||||||||||||||||||||||||||||||||||||||||||
| Miami, FL | ( | 2019-2022 | ||||||||||||||||||||||||||||||||||||||||||||||||||||||||||||||||||||||||
| Nashville, TN | ( | 2022 | ||||||||||||||||||||||||||||||||||||||||||||||||||||||||||||||||||||||||
| New York, NY | ( | 2019 | ||||||||||||||||||||||||||||||||||||||||||||||||||||||||||||||||||||||||
| North Port, FL | ( | 2020 | ||||||||||||||||||||||||||||||||||||||||||||||||||||||||||||||||||||||||
| Orlando, FL | ( | 2020-2021 | ||||||||||||||||||||||||||||||||||||||||||||||||||||||||||||||||||||||||
| Palm Bay, FL | ( | 2020-2022 | ||||||||||||||||||||||||||||||||||||||||||||||||||||||||||||||||||||||||
| Pensacola, FL | ( | 2019-2022 | ||||||||||||||||||||||||||||||||||||||||||||||||||||||||||||||||||||||||
| Phoenix, AZ | ( | 2020 | ||||||||||||||||||||||||||||||||||||||||||||||||||||||||||||||||||||||||
| Port St. Lucie, FL | ( | 2019 | ||||||||||||||||||||||||||||||||||||||||||||||||||||||||||||||||||||||||
| Raleigh, NC | ( | 2019 | ||||||||||||||||||||||||||||||||||||||||||||||||||||||||||||||||||||||||
| Roanoke, VA | ( | 2019-2022 | ||||||||||||||||||||||||||||||||||||||||||||||||||||||||||||||||||||||||
| San Antonio, TX | ( | 2020 | ||||||||||||||||||||||||||||||||||||||||||||||||||||||||||||||||||||||||
| San Diego, CA | ( | 2020 | ||||||||||||||||||||||||||||||||||||||||||||||||||||||||||||||||||||||||
| Savannah, GA | ( | 2022 | ||||||||||||||||||||||||||||||||||||||||||||||||||||||||||||||||||||||||
| Stockton, CA | ( | 2020 | ||||||||||||||||||||||||||||||||||||||||||||||||||||||||||||||||||||||||
| Tallahassee, FL | ( | 2019 | ||||||||||||||||||||||||||||||||||||||||||||||||||||||||||||||||||||||||
| Tampa, FL | ( | 2022 | ||||||||||||||||||||||||||||||||||||||||||||||||||||||||||||||||||||||||
| Tucson, AZ | ( | 2020 | ||||||||||||||||||||||||||||||||||||||||||||||||||||||||||||||||||||||||
| Total Self Storage Properties: | ( | |||||||||||||||||||||||||||||||||||||||||||||||||||||||||||||||||||||||||
F-63
| Initial Cost | Costs Capitalized Subsequent to Acquisition | Gross Amounts at which Carried at the Close of Period(1) | ||||||||||||||||||||||||||||||||||||||||||||||||||||||||||||||||||||||||
| Description | Location | Number of Properties | Encumbrances(2) | Land and Land Improvements | Building and Building Improvements | Land and Land Improvements | Building and Building Improvements | Land and Land Improvements | Building and Building Improvements | Total | Accumulated Depreciation(3) | Year Acquired | ||||||||||||||||||||||||||||||||||||||||||||||||||||||||||||||
| Retail Properties: | ||||||||||||||||||||||||||||||||||||||||||||||||||||||||||||||||||||||||||
| Atlanta, GA | $ | $ | $ | $ | $ | $ | $ | $ | $ | ( | 2021-2022 | |||||||||||||||||||||||||||||||||||||||||||||||||||||||||||||||
| Augusta, GA | ( | 2022 | ||||||||||||||||||||||||||||||||||||||||||||||||||||||||||||||||||||||||
| Austin, TX | ( | 2021 | ||||||||||||||||||||||||||||||||||||||||||||||||||||||||||||||||||||||||
| Birmingham, AL | ( | 2022 | ||||||||||||||||||||||||||||||||||||||||||||||||||||||||||||||||||||||||
| Charlotte, NC | ( | 2021-2022 | ||||||||||||||||||||||||||||||||||||||||||||||||||||||||||||||||||||||||
| Charlottesville, VA | ( | 2022 | ||||||||||||||||||||||||||||||||||||||||||||||||||||||||||||||||||||||||
| Chattanooga, TN | ( | 2022 | ||||||||||||||||||||||||||||||||||||||||||||||||||||||||||||||||||||||||
| Chicago, IL | ( | 2021 | ||||||||||||||||||||||||||||||||||||||||||||||||||||||||||||||||||||||||
| Columbia, SC | ( | 2022 | ||||||||||||||||||||||||||||||||||||||||||||||||||||||||||||||||||||||||
| Columbus, GA | ( | 2022 | ||||||||||||||||||||||||||||||||||||||||||||||||||||||||||||||||||||||||
| Dallas, TX | ( | 2022 | ||||||||||||||||||||||||||||||||||||||||||||||||||||||||||||||||||||||||
| Deltona, FL | ( | 2022 | ||||||||||||||||||||||||||||||||||||||||||||||||||||||||||||||||||||||||
| Gainesville, GA | ( | 2022 | ||||||||||||||||||||||||||||||||||||||||||||||||||||||||||||||||||||||||
| Greenville, SC | ( | 2022 | ||||||||||||||||||||||||||||||||||||||||||||||||||||||||||||||||||||||||
| Houston, TX | ( | 2021-2022 | ||||||||||||||||||||||||||||||||||||||||||||||||||||||||||||||||||||||||
| Lakeland, FL | ( | 2022 | ||||||||||||||||||||||||||||||||||||||||||||||||||||||||||||||||||||||||
| Los Angeles, CA | ( | 2019-2021 | ||||||||||||||||||||||||||||||||||||||||||||||||||||||||||||||||||||||||
| Miami, FL | ( | 2018-2022 | ||||||||||||||||||||||||||||||||||||||||||||||||||||||||||||||||||||||||
| Naples, FL | ( | 2022 | ||||||||||||||||||||||||||||||||||||||||||||||||||||||||||||||||||||||||
| Nashville, TN | ( | 2022 | ||||||||||||||||||||||||||||||||||||||||||||||||||||||||||||||||||||||||
| New York, NY | ( | 2019-2021 | ||||||||||||||||||||||||||||||||||||||||||||||||||||||||||||||||||||||||
| Orlando, FL | ( | 2022 | ||||||||||||||||||||||||||||||||||||||||||||||||||||||||||||||||||||||||
| Oxnard, CA | ( | 2019 | ||||||||||||||||||||||||||||||||||||||||||||||||||||||||||||||||||||||||
| Philadelphia, PA | ( | 2017-2021 | ||||||||||||||||||||||||||||||||||||||||||||||||||||||||||||||||||||||||
| Raleigh, NC | ( | 2022 | ||||||||||||||||||||||||||||||||||||||||||||||||||||||||||||||||||||||||
| Richmond, VA | ( | 2022 | ||||||||||||||||||||||||||||||||||||||||||||||||||||||||||||||||||||||||
| Riverside, CA | ( | 2017 | ||||||||||||||||||||||||||||||||||||||||||||||||||||||||||||||||||||||||
| San Antonio, TX | ( | 2022 | ||||||||||||||||||||||||||||||||||||||||||||||||||||||||||||||||||||||||
| Seattle, WA | ( | 2021 | ||||||||||||||||||||||||||||||||||||||||||||||||||||||||||||||||||||||||
| Tampa, FL | ( | 2022 | ||||||||||||||||||||||||||||||||||||||||||||||||||||||||||||||||||||||||
| Virginia Beach, VA | ( | 2022 | ||||||||||||||||||||||||||||||||||||||||||||||||||||||||||||||||||||||||
| Washington, DC | ( | 2022 | ||||||||||||||||||||||||||||||||||||||||||||||||||||||||||||||||||||||||
| Wilmington, NC | ( | 2022 | ||||||||||||||||||||||||||||||||||||||||||||||||||||||||||||||||||||||||
| Total Retail Properties: | ( | |||||||||||||||||||||||||||||||||||||||||||||||||||||||||||||||||||||||||
| Office Properties: | ||||||||||||||||||||||||||||||||||||||||||||||||||||||||||||||||||||||||||
| Atlanta, GA | ( | 2021-2022 | ||||||||||||||||||||||||||||||||||||||||||||||||||||||||||||||||||||||||
| Charlotte, NC | 2022 | |||||||||||||||||||||||||||||||||||||||||||||||||||||||||||||||||||||||||
| Los Angeles, CA | ( | 2022 | ||||||||||||||||||||||||||||||||||||||||||||||||||||||||||||||||||||||||
| Ontario, Canada | ( | 2021 | ||||||||||||||||||||||||||||||||||||||||||||||||||||||||||||||||||||||||
| San Antonio, TX | ( | 2022 | ||||||||||||||||||||||||||||||||||||||||||||||||||||||||||||||||||||||||
| San Francisco, CA | ( | 2019 | ||||||||||||||||||||||||||||||||||||||||||||||||||||||||||||||||||||||||
| San Jose, CA | ( | 2020 | ||||||||||||||||||||||||||||||||||||||||||||||||||||||||||||||||||||||||
F-64
| Initial Cost | Costs Capitalized Subsequent to Acquisition | Gross Amounts at which Carried at the Close of Period(1) | ||||||||||||||||||||||||||||||||||||||||||||||||||||||||||||||||||||||||
| Description | Location | Number of Properties | Encumbrances(2) | Land and Land Improvements | Building and Building Improvements | Land and Land Improvements | Building and Building Improvements | Land and Land Improvements | Building and Building Improvements | Total | Accumulated Depreciation(3) | Year Acquired | ||||||||||||||||||||||||||||||||||||||||||||||||||||||||||||||
| Westmont, Canada | $ | $ | $ | $ | $ | $ | $ | $ | $ | ( | 2022 | |||||||||||||||||||||||||||||||||||||||||||||||||||||||||||||||
| Montreal, Canada | ( | 2022 | ||||||||||||||||||||||||||||||||||||||||||||||||||||||||||||||||||||||||
| Dublin, Ireland | ( | 2022 | ||||||||||||||||||||||||||||||||||||||||||||||||||||||||||||||||||||||||
| Total Office Properties: | ( | |||||||||||||||||||||||||||||||||||||||||||||||||||||||||||||||||||||||||
| Portfolio Total | $ | $ | $ | $ | $ | $ | $ | $ | $ | ( | ||||||||||||||||||||||||||||||||||||||||||||||||||||||||||||||||
(1)As of December 31, 2023, the aggregate tax basis of the portfolio was $85.1 billion.
(2)Encumbrances excludes $3.5 billion outstanding on variable rate warehouse facilities as of December 31, 2023, which are not allocable to specific properties.
(3)Refer to Note 2 to our consolidated financial statements for details of depreciable lives.
(4)Certain of the Company’s investment in joint ventures with ownership interests in affordable housing properties collateralize a term loan and secured notes totaling $1.3 billion. As of December 31, 2023, such term loan and secured notes had a total outstanding balance of $1.3 billion.
F-65
The total included on Schedule III does not include Furniture, Fixtures and Equipment totaling $2.4 billion. Accumulated Depreciation does not include $757.5 million of accumulated depreciation related to Furniture, Fixtures and Equipment.
The following table summarizes activity for real estate and accumulated depreciation for the years ended December 31, 2023 and 2022 ($ in thousands):
| December 31, 2023 | December 31, 2022 | |||||||||||||
| Real Estate: | ||||||||||||||
| Balance at the beginning of year | $ | $ | ||||||||||||
| Additions during the year: | ||||||||||||||
| Land and land improvements | ||||||||||||||
| Building and building improvements | ||||||||||||||
| Dispositions during the year: | ||||||||||||||
| Land and land improvements | ( | ( | ||||||||||||
| Building and building improvements | ( | ( | ||||||||||||
| Impairment of investments in real estate | ( | |||||||||||||
| Assets held-for-sale | ( | ( | ||||||||||||
| Balance at the end of the year | $ | $ | ||||||||||||
| Accumulated Depreciation: | ||||||||||||||
| Balance at the beginning of year | $ | ( | $ | ( | ||||||||||
| Accumulated depreciation | ( | ( | ||||||||||||
| Dispositions | ||||||||||||||
| Assets held-for-sale | ||||||||||||||
| Balance at the end of the year | $ | ( | $ | ( | ||||||||||
F-66