UNITED STATES
SECURITIES AND EXCHANGE COMMISSION
WASHINGTON, D.C. 20549
FORM 20-F
(Mark One)
OR
For the fiscal year ended December 31 , 2023
OR
OR
Date of event requiring this shell company report
For the transition period from to
Commission file number 001-38159
(Exact name of Registrant as specified in its charter)
(Translation of Registrant’s name into English)
(Jurisdiction of incorporation or organization)
(Address of principal executive offices)
Fax: +44 (0)20 7240 0555
(Name, Telephone, E-mail and/or Facsimile number and Address of Company Contact Person)
Securities registered or to be registered pursuant to Section 12(b) of the Act.
| Title of each class | Trading symbol(s) | Name of each exchange on which registered | ||||||
| each representing one ordinary share | ||||||||
* Listed, not for trading, but only in connection with the listing of the applicable Registrant’s American Depositary Shares issued in respect thereof.
Securities registered or to be registered pursuant to Section 12(g) of the Act.
None
Securities for which there is a reporting obligation pursuant to Section 15(d) of the Act.
None
Indicate the number of outstanding shares of each of the issuer’s classes of capital or common stock as of the close of the period covered by the Annual Report.
Indicate by check mark if the registrant is a well-known seasoned issuer, as defined in Rule 405 of the Securities Act. ☒ Yes ☐ No
If this report is an annual or transition report, indicate by check mark if the registrant is not required to file reports pursuant to Section 13 or 15(d) of the Securities Exchange Act of 1934. ☐ Yes ☒ No
Note – Checking the box above will not relieve any registrant required to file reports pursuant to Section 13 or 15(d) of the Securities Exchange Act of 1934 from their obligations under those Sections.
Indicate by check mark whether the registrant (1) has filed all reports required to be filed by Section 13 or 15(d) of the Securities Exchange Act of 1934 during the preceding 12 months (or for such shorter period that the registrant was required to file such reports), and (2) has been subject to such filing requirements for the past 90 days. ☒ Yes ☐ No
Indicate by check mark whether the registrant has submitted electronically every Interactive Data File required to be submitted pursuant to Rule 405 of Regulation S-T (§232.405 of this chapter) during the preceding 12 months (or for such shorter period that the registrant was required to submit such files). ☒ Yes ☐ No
Indicate by check mark whether the registrant is a large accelerated filer, an accelerated filer, a non-accelerated filer, or an emerging growth company. See definition of “large accelerated filer,” “accelerated filer,” and “emerging growth company” in Rule 12b-2 of the Exchange Act.
| ☒ | Accelerated filer | ☐ | |||||||||
| Non-accelerated filer | ☐ | Emerging growth company | |||||||||
If an emerging growth company that prepares its financial statements in accordance with US GAAP, indicate by check mark if the registrant has elected not to use the extended transition period for complying with any new or revised financial accounting standards† provided pursuant to Section 13(a) of the Exchange Act. ☐
† The term “new or revised financial accounting standard” refers to any update issued by the Financial Accounting Standards Board to its Accounting Standards Codification after April 5, 2012.
Indicate by check mark whether the registrant has filed a report on and attestation to its management’s assessment of the effectiveness of its internal control over financial reporting under Section 404(b) of the Sarbanes-Oxley Act (15 U.S.C. 7262(b)) by the registered public accounting firm that prepared or issued its audit report. ☒
If securities are registered pursuant to Section 12(b) of the Act, indicate by check mark whether the financial statements of the registrant included in the filing reflect the correction of an error to previously issued financial statements. ☐
Indicate by check mark whether any of those error corrections are restatements that required a recovery analysis of incentive based compensation received by any of the registrant’s executive officers during the relevant recovery period pursuant to §240.10D-1(b). ☐
Indicate by check mark which basis of accounting the registrant has used to prepare the financial statements included in this filing:
| US GAAP | Other ☐ | |||||||||||||
| ☐ | International Accounting Standards Board ☒ | |||||||||||||
If “Other” has been checked in response to the previous question, indicate by check mark which financial statement item the registrant has elected to follow. ☐ Item 17 ☐ Item 18
If this is an annual report, indicate by check mark whether the registrant is a shell company (as defined in Rule 12b-2 of the Exchange Act). ☐ Yes ☒ No
| Name of the auditor’s firm | |||||
| Auditors’ firm ID/ PCAOB issued Audit Firm Identifier | |||||
| Auditors’ Location – City, State/Province, Country | |||||
This Annual Report and Accounts on Form 20-F contains forward-looking non-GAAP measures used by management to monitor the Group’s performance. For the non-GAAP information contained in this Annual Report and Accounts on Form 20-F, no comparable GAAP or IFRS information is available on a forward-looking basis and our forward-looking revenue and other components of the Group’s results, including the revenue generated from combustibles, cannot be estimated with reasonable certainty due to, among other things, the impact of foreign exchange, pricing and volume, which could be significant, are highly variable. As such, no reconciliations for this forward-looking non-GAAP information are available.

1
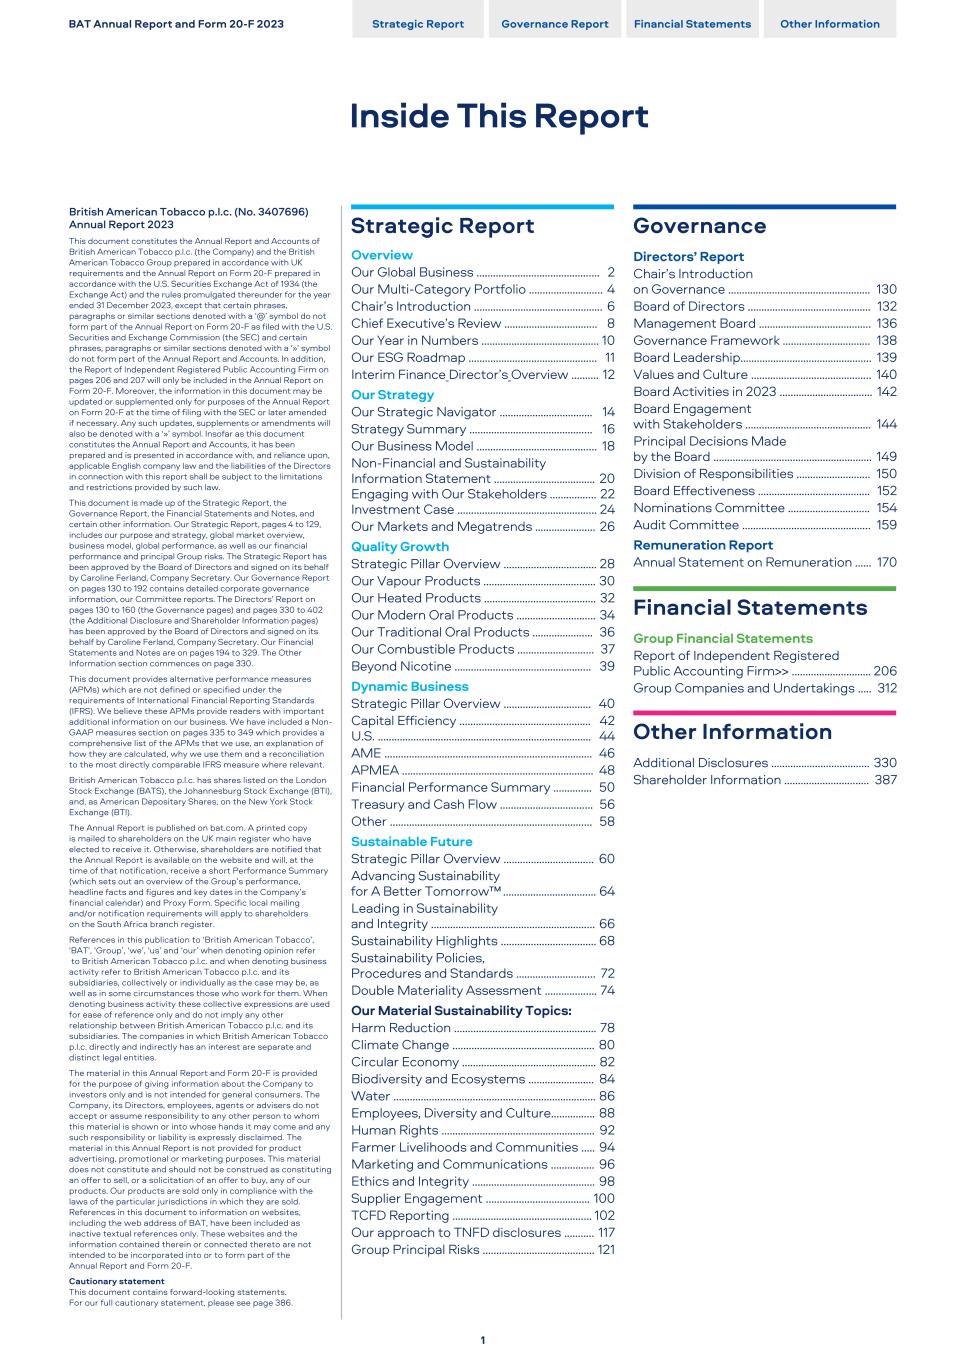
British American Tobacco p.l.c. (No. 3407696) Annual Report 2023 This document constitutes the Annual Report and Accounts of British American Tobacco p.l.c. (the Company) and the British American Tobacco Group prepared in accordance with UK requirements and the Annual Report on Form 20-F prepared in accordance with the U.S. Securities Exchange Act of 1934 (the Exchange Act) and the rules promulgated thereunder for the year ended 31 December 2023, except that certain phrases, paragraphs or similar sections denoted with a ‘@’ symbol do not form part of the Annual Report on Form 20-F as filed with the U.S. Securities and Exchange Commission (the SEC) and certain phrases, paragraphs or similar sections denoted with a ‘»’ symbol do not form part of the Annual Report and Accounts. In addition, the Report of Independent Registered Public Accounting Firm on pages 206 and 207 will only be included in the Annual Report on Form 20-F. Moreover, the information in this document may be updated or supplemented only for purposes of the Annual Report on Form 20-F at the time of filing with the SEC or later amended if necessary. Any such updates, supplements or amendments will also be denoted with a ‘»’ symbol. Insofar as this document constitutes the Annual Report and Accounts, it has been prepared and is presented in accordance with, and reliance upon, applicable English company law and the liabilities of the Directors in connection with this report shall be subject to the limitations and restrictions provided by such law. This document is made up of the Strategic Report, the Governance Report, the Financial Statements and Notes, and certain other information. Our Strategic Report, pages 4 to 129, includes our purpose and strategy, global market overview, business model, global performance, as well as our financial performance and principal Group risks. The Strategic Report has been approved by the Board of Directors and signed on its behalf by Caroline Ferland, Company Secretary. Our Governance Report on pages 130 to 192 contains detailed corporate governance information, our Committee reports. The Directors’ Report on pages 130 to 160 (the Governance pages) and pages 330 to 402 (the Additional Disclosure and Shareholder Information pages) has been approved by the Board of Directors and signed on its behalf by Caroline Ferland, Company Secretary. Our Financial Statements and Notes are on pages 194 to 329. The Other Information section commences on page 330. This document provides alternative performance measures (APMs) which are not defined or specified under the requirements of International Financial Reporting Standards (IFRS). We believe these APMs provide readers with important additional information on our business. We have included a Non- GAAP measures section on pages 335 to 349 which provides a comprehensive list of the APMs that we use, an explanation of how they are calculated, why we use them and a reconciliation to the most directly comparable IFRS measure where relevant. British American Tobacco p.l.c. has shares listed on the London Stock Exchange (BATS), the Johannesburg Stock Exchange (BTI), and, as American Depositary Shares, on the New York Stock Exchange (BTI). The Annual Report is published on bat.com. A printed copy is mailed to shareholders on the UK main register who have elected to receive it. Otherwise, shareholders are notified that the Annual Report is available on the website and will, at the time of that notification, receive a short Performance Summary (which sets out an overview of the Group’s performance, headline facts and figures and key dates in the Company’s financial calendar) and Proxy Form. Specific local mailing and/or notification requirements will apply to shareholders on the South Africa branch register. References in this publication to ‘British American Tobacco’, ‘BAT’, ‘Group’, ‘we’, ‘us’ and ‘our’ when denoting opinion refer to British American Tobacco p.l.c. and when denoting business activity refer to British American Tobacco p.l.c. and its subsidiaries, collectively or individually as the case may be, as well as in some circumstances those who work for them. When denoting business activity these collective expressions are used for ease of reference only and do not imply any other relationship between British American Tobacco p.l.c. and its subsidiaries. The companies in which British American Tobacco p.l.c. directly and indirectly has an interest are separate and distinct legal entities. The material in this Annual Report and Form 20-F is provided for the purpose of giving information about the Company to investors only and is not intended for general consumers. The Company, its Directors, employees, agents or advisers do not accept or assume responsibility to any other person to whom this material is shown or into whose hands it may come and any such responsibility or liability is expressly disclaimed. The material in this Annual Report is not provided for product advertising, promotional or marketing purposes. This material does not constitute and should not be construed as constituting an offer to sell, or a solicitation of an offer to buy, any of our products. Our products are sold only in compliance with the laws of the particular jurisdictions in which they are sold. References in this document to information on websites, including the web address of BAT, have been included as inactive textual references only. These websites and the information contained therein or connected thereto are not intended to be incorporated into or to form part of the Annual Report and Form 20-F. Cautionary statement This document contains forward-looking statements. For our full cautionary statement, please see page 386. Strategic Report Overview Our Global Business ........................................….. 2 Our Multi-Category Portfolio ........................… 4 Chair’s Introduction .................................…........... 6 Chief Executive’s Review ..............................…. 8 Our Year in Numbers .......................................…. 10 Our ESG Roadmap ...........................................…. 11 Interim Finance Director’s Overview .......... 12 Our Strategy Our Strategic Navigator .................................. 14 Strategy Summary .........................................…. 16 Our Business Model ........................................…. 18 Non-Financial and Sustainability Information Statement ..................................... 20 Engaging with Our Stakeholders .............…. 22 Investment Case ...............................................…. 24 Our Markets and Megatrends ..................…. 26 Quality Growth Strategic Pillar Overview ..........................…..... 28 Our Vapour Products ..................................….... 30 Our Heated Products ......................................... 32 Our Modern Oral Products .........................…. 34 Our Traditional Oral Products .................….. 36 Our Combustible Products ........................…. 37 Beyond Nicotine ..............................................…. 39 Dynamic Business Strategic Pillar Overview ................................ 40 Capital Efficiency ..............…............................... 42 U.S. ...........................................…................................ 44 AME .........................................…................................ 46 APMEA ...................................…................................ 48 Financial Performance Summary ........…... 50 Treasury and Cash Flow .............................….. 56 Other .....................................................................….. 58 Sustainable Future Strategic Pillar Overview .............................…. 60 Advancing Sustainability for A Better Tomorrow™ .............................….. 64 Leading in Sustainability and Integrity ........................................................…. 66 Sustainability Highlights ................................... 68 Sustainability Policies, Procedures and Standards .........................…. 72 Double Materiality Assessment ..............….. 74 Our Material Sustainability Topics: Harm Reduction ................…................................. 78 Climate Change .................…................................ 80 Circular Economy .............…................................. 82 Biodiversity and Ecosystems ........................ 84 Water ......................................…................................. 86 Employees, Diversity and Culture............…. 88 Human Rights ......................…............................... 92 Farmer Livelihoods
and Communities ..... 94 Marketing and Communications ................ 96 Ethics and Integrity ............................................. 98 Supplier Engagement ....…............................... 100 TCFD Reporting ..............................................….. 102 Our approach to TNFD disclosures ........... 117 Group Principal Risks ......................................... 121 Governance Directors’ Report Chair’s Introduction on Governance .................................................... 130 Board of Directors ............................................. 132 Management Board ......................................… 136 Governance Framework .............................… 138 Board Leadership.............................................… 139 Values and Culture .........................................… 140 Board Activities in 2023 .................................. 142 Board Engagement with Stakeholders .............................................. 144 Principal Decisions Made by the Board .......................................................... 149 Division of Responsibilities ........................… 150 Board Effectiveness ......................................... 152 Nominations Committee .............................. 154 Audit Committee ............................................… 159 Remuneration Report Annual Statement on Remuneration ...... 170 Financial Statements Group Financial Statements Report of Independent Registered Public Accounting Firm>> ............................. 206 Group Companies and Undertakings ..... 312 Other Information Additional Disclosures .................................... 330 Shareholder Information ........................….... 387 BAT Annual Report and Form 20-F 2023 Strategic Report Governance Report Financial Statements Other Information Inside This Report 1
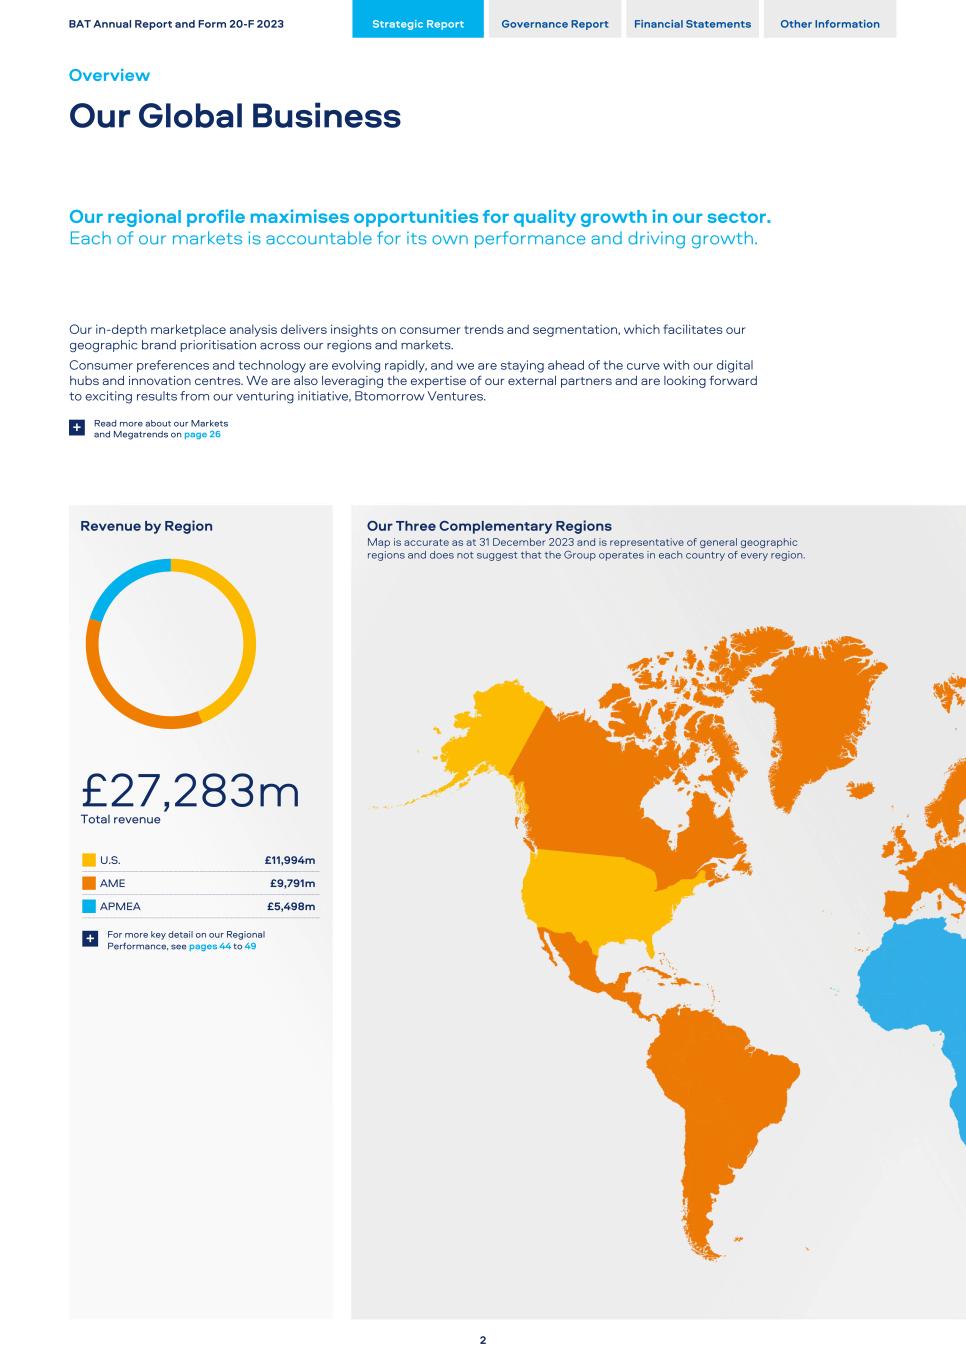
Our regional profile maximises opportunities for quality growth in our sector. Each of our markets is accountable for its own performance and driving growth. Our in-depth marketplace analysis delivers insights on consumer trends and segmentation, which facilitates our geographic brand prioritisation across our regions and markets. Consumer preferences and technology are evolving rapidly, and we are staying ahead of the curve with our digital hubs and innovation centres. We are also leveraging the expertise of our external partners and are looking forward to exciting results from our venturing initiative, Btomorrow Ventures. Read more about our Markets and Megatrends on page 26+ Revenue by Region £27,283m Total revenue U.S. £11,994m AME £9,791m APMEA £5,498m For more key detail on our Regional Performance, see pages 44 to 49+ Our Three Complementary Regions Map is accurate as at 31 December 2023 and is representative of general geographic regions and does not suggest that the Group operates in each country of every region. BAT Annual Report and Form 20-F 2023 Strategic Report Governance Report Financial Statements Other Information Overview Our Global Business 2
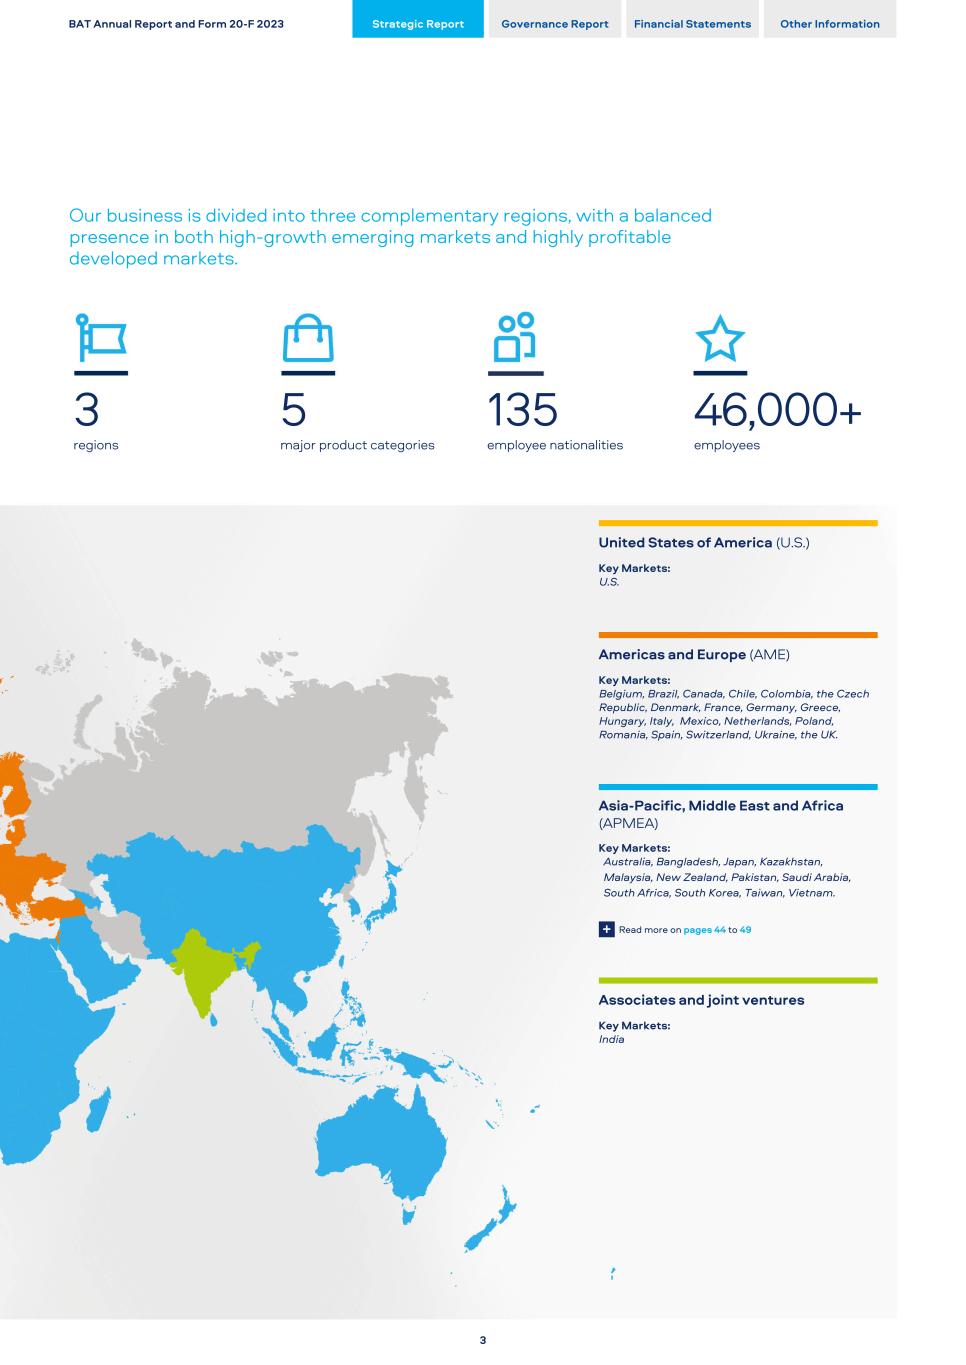
Our business is divided into three complementary regions, with a balanced presence in both high-growth emerging markets and highly profitable developed markets. 3 5 135 46,000+ regions major product categories employee nationalities employees United States of America (U.S.) Key Markets: U.S. Americas and Europe (AME) Key Markets: Belgium, Brazil, Canada, Chile, Colombia, the Czech Republic, Denmark, France, Germany, Greece, Hungary, Italy, Mexico, Netherlands, Poland, Romania, Spain, Switzerland, Ukraine, the UK. Asia-Pacific, Middle East and Africa (APMEA) Key Markets: Australia, Bangladesh, Japan, Kazakhstan, Malaysia, New Zealand, Pakistan, Saudi Arabia, South Africa, South Korea, Taiwan, Vietnam. + Read more on pages 44 to 49 Associates and joint ventures Key Markets: India BAT Annual Report and Form 20-F 2023 Strategic Report Governance Report Financial Statements Other Information 3
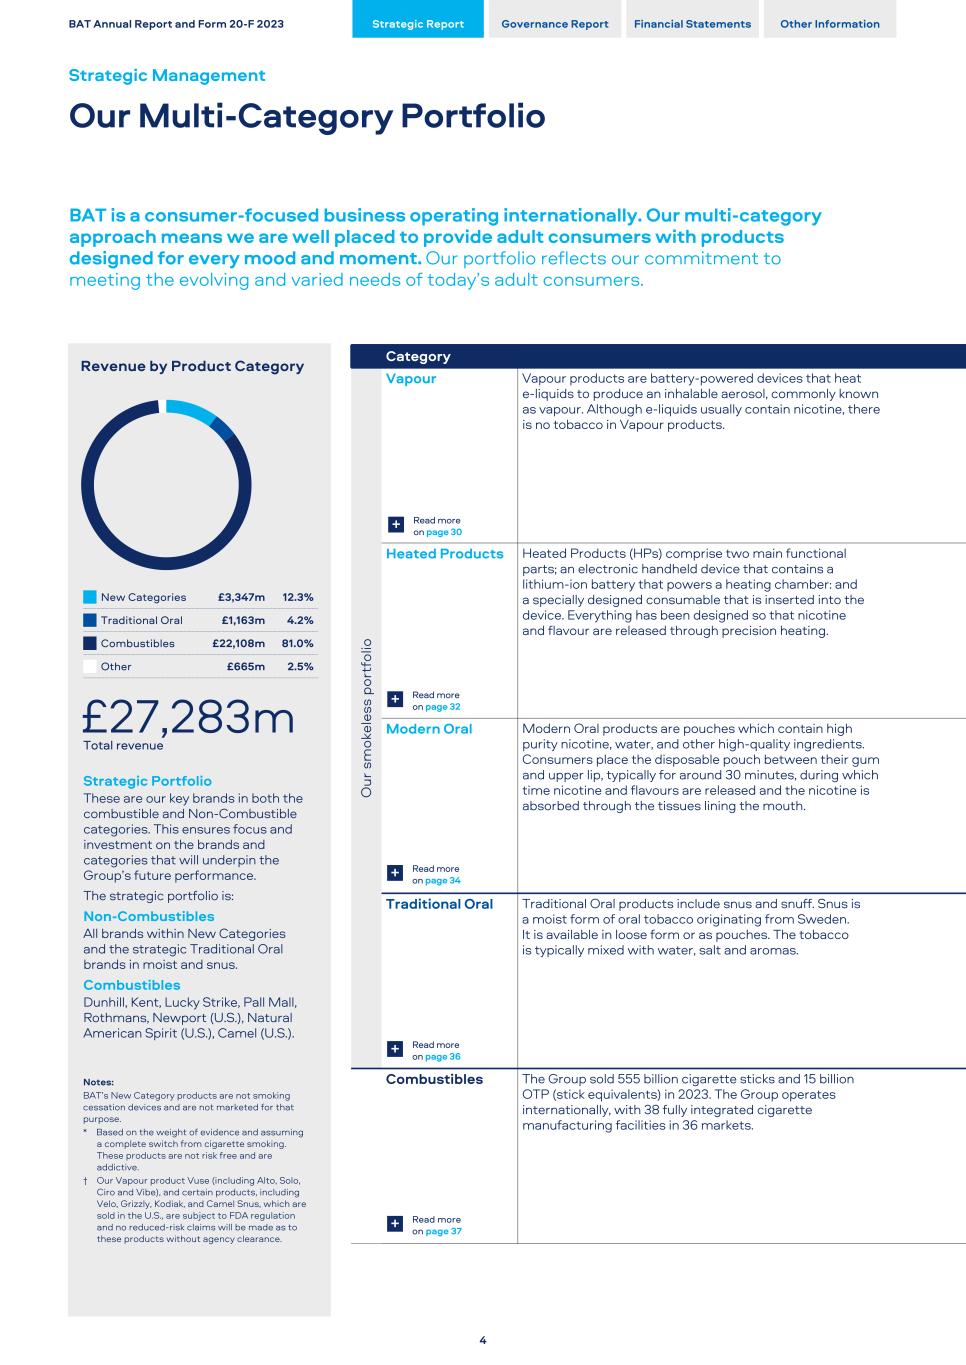
Revenue by Product Category New Categories £3,347m 12.3% Traditional Oral £1,163m 4.2% Combustibles £22,108m 81.0% Other £665m 2.5% £27,283m Total revenue Strategic Portfolio These are our key brands in both the combustible and Non-Combustible categories. This ensures focus and investment on the brands and categories that will underpin the Group’s future performance. The strategic portfolio is: Non-Combustibles All brands within New Categories and the strategic Traditional Oral brands in moist and snus. Combustibles Dunhill, Kent, Lucky Strike, Pall Mall, Rothmans, Newport (U.S.), Natural American Spirit (U.S.), Camel (U.S.). Notes: BAT’s New Category products are not smoking cessation devices and are not marketed for that purpose. * Based on the weight of evidence and assuming a complete switch from cigarette smoking. These products are not risk free and are addictive. † Our Vapour product Vuse (including Alto, Solo, Ciro and Vibe), and certain products, including Velo, Grizzly, Kodiak, and Camel Snus, which are sold in the U.S., are subject to FDA regulation and no reduced-risk claims will be made as to these products without agency clearance. Category O ur s m ok el es s po rt fo lio Vapour Vapour products are battery-powered devices that heat e-liquids to produce an inhalable aerosol, commonly known as vapour. Although e-liquids usually contain nicotine, there is no tobacco in Vapour products. Heated Products Heated Products (HPs) comprise two main functional parts; an electronic handheld device that contains a lithium-ion battery that powers a heating chamber: and a specially designed consumable that is inserted into the device. Everything has been designed so that nicotine and flavour are released through precision heating. Modern Oral Modern Oral products are pouches which contain high purity nicotine, water, and other high-quality ingredients. Consumers place the disposable pouch between their gum and upper lip, typically for around 30 minutes, during which time nicotine and flavours are released and the nicotine is absorbed through the tissues lining the mouth. Traditional Oral Traditional Oral products include snus and snuff. Snus is a moist form of oral tobacco originating from Sweden. It is available in loose form or as pouches. The tobacco is typically mixed with water, salt and aromas. Combustibles The Group sold 555 billion cigarette sticks and 15 billion OTP (stick equivalents) in 2023. The Group operates internationally, with 38 fully integrated cigarette manufacturing facilities in 36 markets. BAT Annual Report and Form 20-F 2023 Strategic Report Governance Report Financial Statements Other Information Strategic Management Our Multi-Category Portfolio BAT is a consumer-focused business operating internationally. Our multi-category approach means we are well placed to provide adult consumers with products designed for every mood and moment. Our portfolio reflects our commitment to meeting the evolving and varied needs of today’s adult consumers. 4 Read more on page 30+ Read more on page 32+ Read more on page 34+ Read more on page 36+ Read more on page 37+
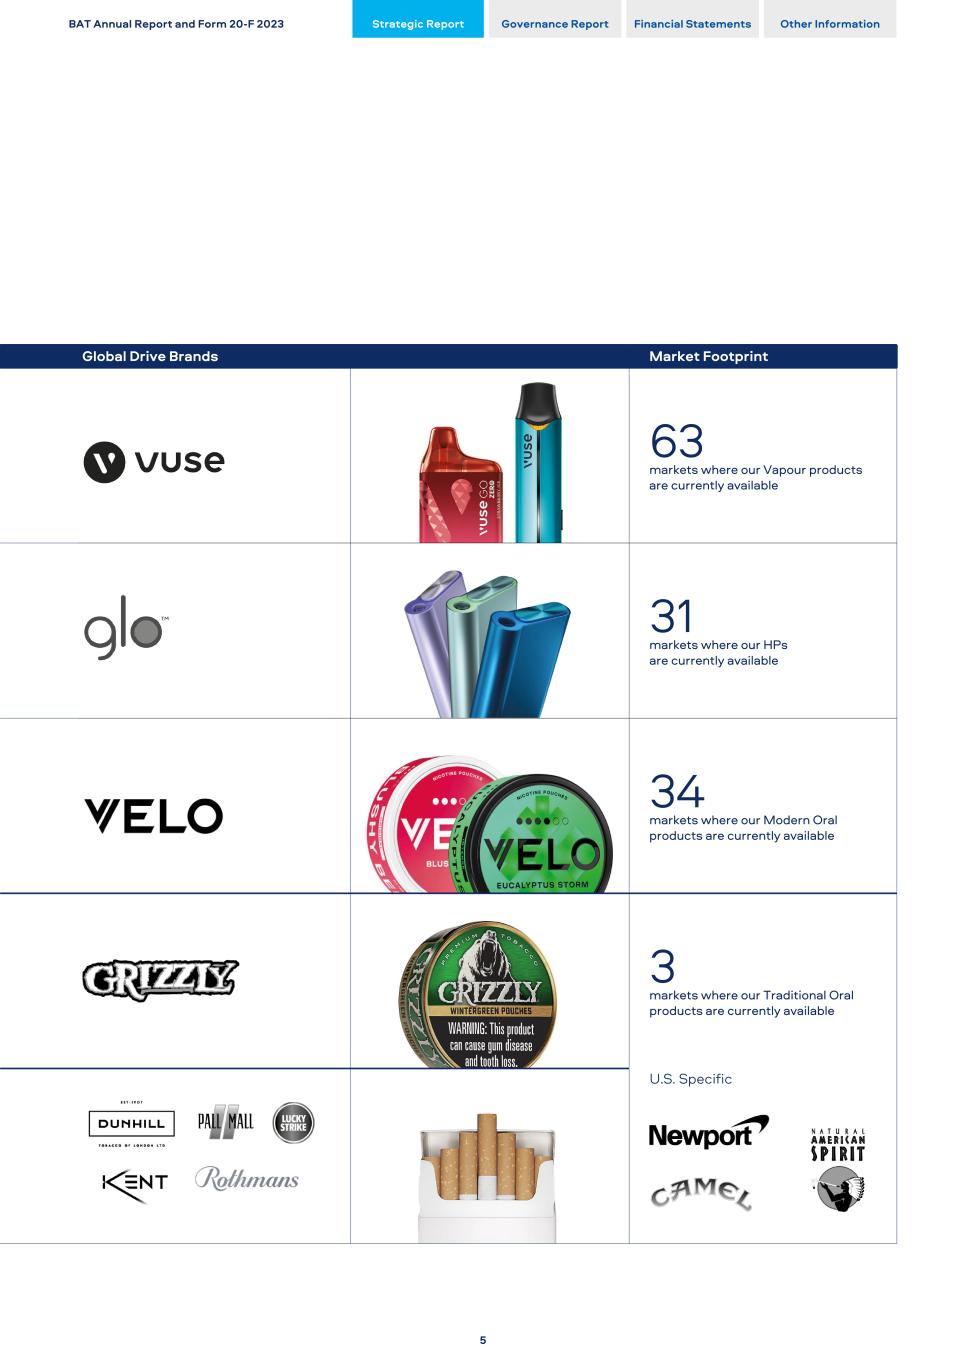
Global Drive Brands Market Footprint 63 markets where our Vapour products are currently available 31 markets where our HPs are currently available 34 markets where our Modern Oral products are currently available 3 markets where our Traditional Oral products are currently available U.S. Specific BAT Annual Report and Form 20-F 2023 Strategic Report Governance Report Financial Statements Other Information 5
Our strategy and purpose were discussed extensively during 2023. The result of these discussions was the decision to provide greater clarity on what we mean by A Better Tomorrow™. It means we are committed to Building a Smokeless World. Luc Jobin Chair Dear Fellow Shareholders, During 2023, the world continued to experience a period of extensive and prolonged uncertainty. The global economy has entered an era of upheaval, as geopolitical tensions continue to destabilise economies and societies. Cost-of-living pressures are being compounded by inflation, and this represents a significant challenge for major economies. This has resulted in re-adjustments in work habits and in consumer behaviour. Ambiguity and uncertainty have long occupied discussions in boardrooms, but I cannot recall a time when this was so pronounced. As always, my colleagues around the world have responded to the operating environment with resilience and resourcefulness. I would like to thank them, on behalf of the Board, for their ongoing dedication and diligence. Leadership for the Future In May 2023, the Board announced a change in the leadership of BAT, with Tadeu Marroco appointed as Chief Executive. With 30 years of experience across the entire business, Tadeu was the outstanding choice to lead BAT into the next chapter of its history. With his track record of delivering transformation, building strong teams and ensuring financial discipline, Tadeu is well placed to build on our A Better Tomorrow™ strategy that was first articulated in 2020. Following his appointment, in June 2023 Tadeu reshaped his Management Board to support a greater focus on improved execution and operational excellence. Having also appointed a new Chief People Officer and with a new Chief Financial Officer due to join us from 1 May 2024, the Board believes the management team at BAT is well placed to execute on the strategy of the business to deliver long-term value for stakeholders. Refining our Strategy and Purpose In the context of a rapidly changing world, it is important that shareholders have a holistic view of BAT and our place in it. This is the second year that we have embedded our sustainability data into our Annual Report. Our Combined Annual and Sustainability Report again represents the fullest depiction of BAT’s business strategy and performance. Our strategy and purpose were discussed extensively during 2023. The result of these discussions was the decision to provide greater clarity on what we mean by A Better Tomorrow™. It means we are committed to Building a Smokeless World. This is a commitment to migrate our cigarette consumers actively, sustainably and responsibly to reduced risk*†, smokeless alternatives. In so doing, BAT will deliver for consumers, investors and society, while employees will benefit from a purpose-driven business that they can feel excited about. Built around the three pillars of Quality Growth, Sustainable Future and Dynamic Business the Board believes this refined strategy is right for the long-term success of BAT. Tadeu discusses this in more detail on page 8 and further information on the refined strategy can be found on page 14. The refined strategy is a natural extension of the foundations that were laid in 2020 and provides clarity on what BAT intends to focus on in the years to come. The Board has been engaged in much discussion during the year about 'what' the business should deliver in the future. It is, of course, important for shareholders to understand 'how' we have delivered this year and how we think success should be measured against the refined strategy going forward. Our Combined Annual and Sustainability Report seeks to do that, while honing our non-financial disclosures towards the reporting requirements of the EU Corporate Sustainability Reporting Directive (CSRD). Our Values and Culture A strategy is little without the right culture instilled across the organisation to deliver it. A truly dynamic business is one where the people within it understand the strategic aims and the expected behaviours to achieve them. Values are an important facet of continuing to be an exciting and winning company. It is why the Board was pleased to see a set of rearticulated values being developed in parallel with the refined strategy. Long-Term View of the Business Despite an increasingly turbulent external environment, the fundamentals of the tobacco and nicotine sector remain attractive, and the Board believes BAT is in a strong position to realise its potential. The growth of adult smokers seeking smokeless alternatives is a long-term, sectoral trend. There remain more than one billion adult smokers in the world and there are many jurisdictions which, with the right regulatory approach, could see smoking rates decline faster through greater acceptance of smokeless products. With our multi-category portfolio, BAT is well placed to capitalise on this consumer shift to smokeless products while continuing to manage the combustible cigarette business in a responsible manner. BAT Annual Report and Form 20-F 2023 Strategic Report Governance Report Financial Statements Other Information Overview Chair’s Introduction Transformation in Action 6
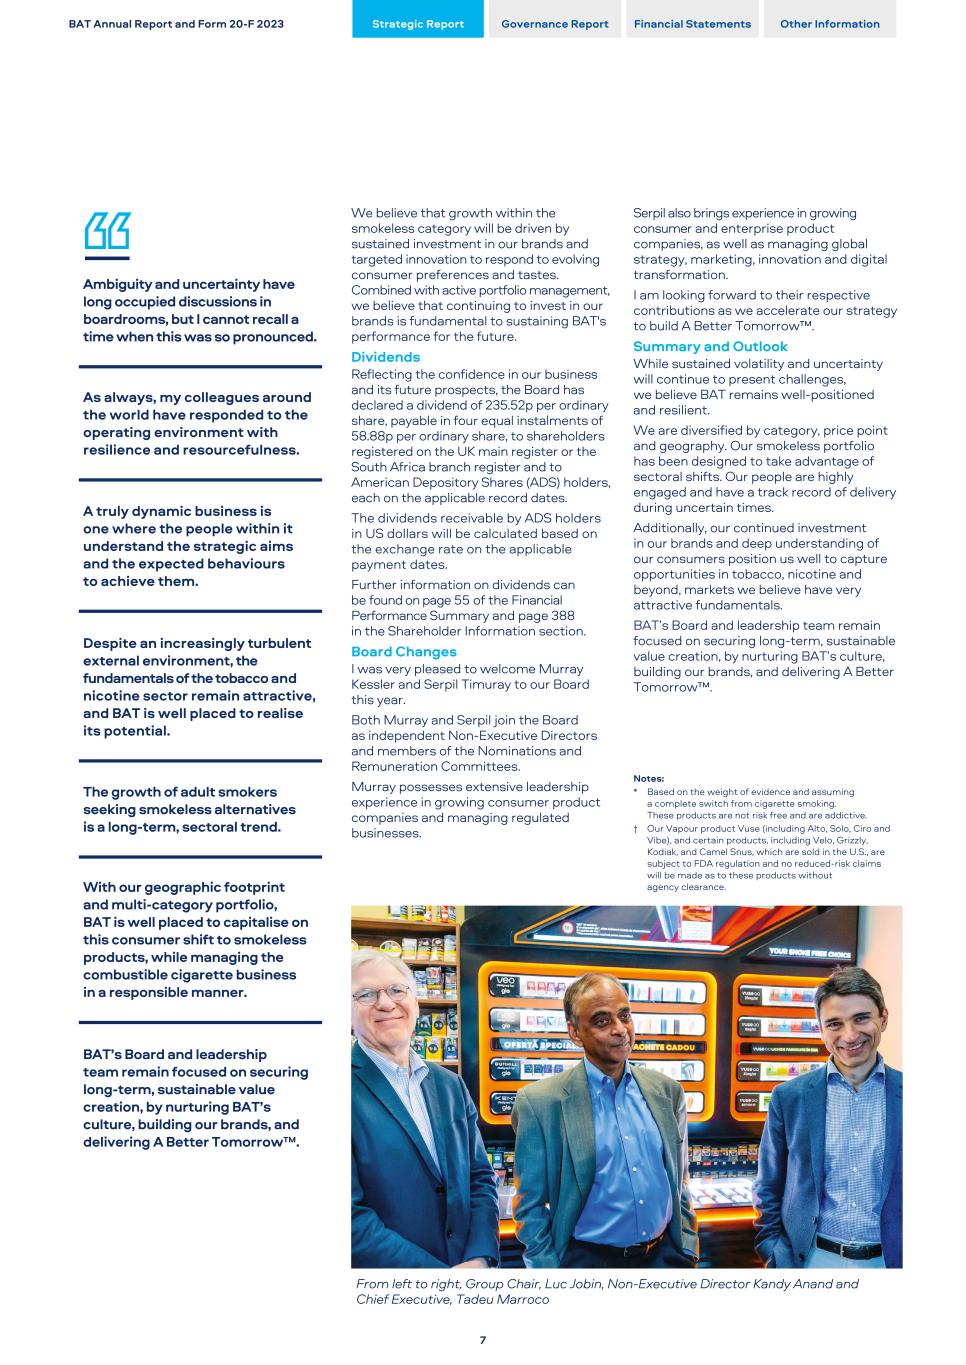
Ambiguity and uncertainty have long occupied discussions in boardrooms, but I cannot recall a time when this was so pronounced. As always, my colleagues around the world have responded to the operating environment with resilience and resourcefulness. A truly dynamic business is one where the people within it understand the strategic aims and the expected behaviours to achieve them. Despite an increasingly turbulent external environment, the fundamentals of the tobacco and nicotine sector remain attractive, and BAT is well placed to realise its potential. The growth of adult smokers seeking smokeless alternatives is a long-term, sectoral trend. With our geographic footprint and multi-category portfolio, BAT is well placed to capitalise on this consumer shift to smokeless products, while managing the combustible cigarette business in a responsible manner. BAT’s Board and leadership team remain focused on securing long-term, sustainable value creation, by nurturing BAT’s culture, building our brands, and delivering A Better Tomorrow™. We believe that growth within the smokeless category will be driven by sustained investment in our brands and targeted innovation to respond to evolving consumer preferences and tastes. Combined with active portfolio management, we believe that continuing to invest in our brands is fundamental to sustaining BAT's performance for the future. Dividends Reflecting the confidence in our business and its future prospects, the Board has declared a dividend of 235.52p per ordinary share, payable in four equal instalments of 58.88p per ordinary share, to shareholders registered on the UK main register or the South Africa branch register and to American Depository Shares (ADS) holders, each on the applicable record dates. The dividends receivable by ADS holders in US dollars will be calculated based on the exchange rate on the applicable payment dates. Further information on dividends can be found on page 55 of the Financial Performance Summary and page 388 in the Shareholder Information section. Board Changes I was very pleased to welcome Murray Kessler and Serpil Timuray to our Board this year. Both Murray and Serpil join the Board as independent Non-Executive Directors and members of the Nominations and Remuneration Committees. Murray possesses extensive leadership experience in growing consumer product companies and managing regulated businesses. From left to right, Group Chair, Luc Jobin, Non-Executive Director Kandy Anand and Chief Executive, Tadeu Marroco Serpil also brings experience in growing consumer and enterprise product companies, as well as managing global strategy, marketing, innovation and digital transformation. I am looking forward to their respective contributions as we accelerate our strategy to build A Better Tomorrow™. Summary and Outlook While sustained volatility and uncertainty will continue to present challenges, we believe BAT remains well-positioned and resilient. We are diversified by category, price point and geography. Our smokeless portfolio has been designed to take advantage of sectoral shifts. Our people are highly engaged and have a track record of delivery during uncertain times. Additionally, our continued investment in our brands and deep understanding of our consumers position us well to capture opportunities in tobacco, nicotine and beyond, markets we believe have very attractive fundamentals. BAT’s Board and leadership team remain focused on securing long-term, sustainable value creation, by nurturing BAT’s culture, building our brands, and delivering A Better Tomorrow™. Notes: * Based on the weight of evidence and assuming a complete switch from cigarette smoking. These products are not risk free and are addictive. † Our Vapour product Vuse (including Alto, Solo, Ciro and Vibe), and certain products, including Velo, Grizzly, Kodiak, and Camel Snus, which are sold in the U.S., are subject to FDA regulation and no reduced-risk claims will be made as to these products without agency clearance. BAT Annual Report and Form 20-F 2023 Strategic Report Governance Report Financial Statements Other Information 7
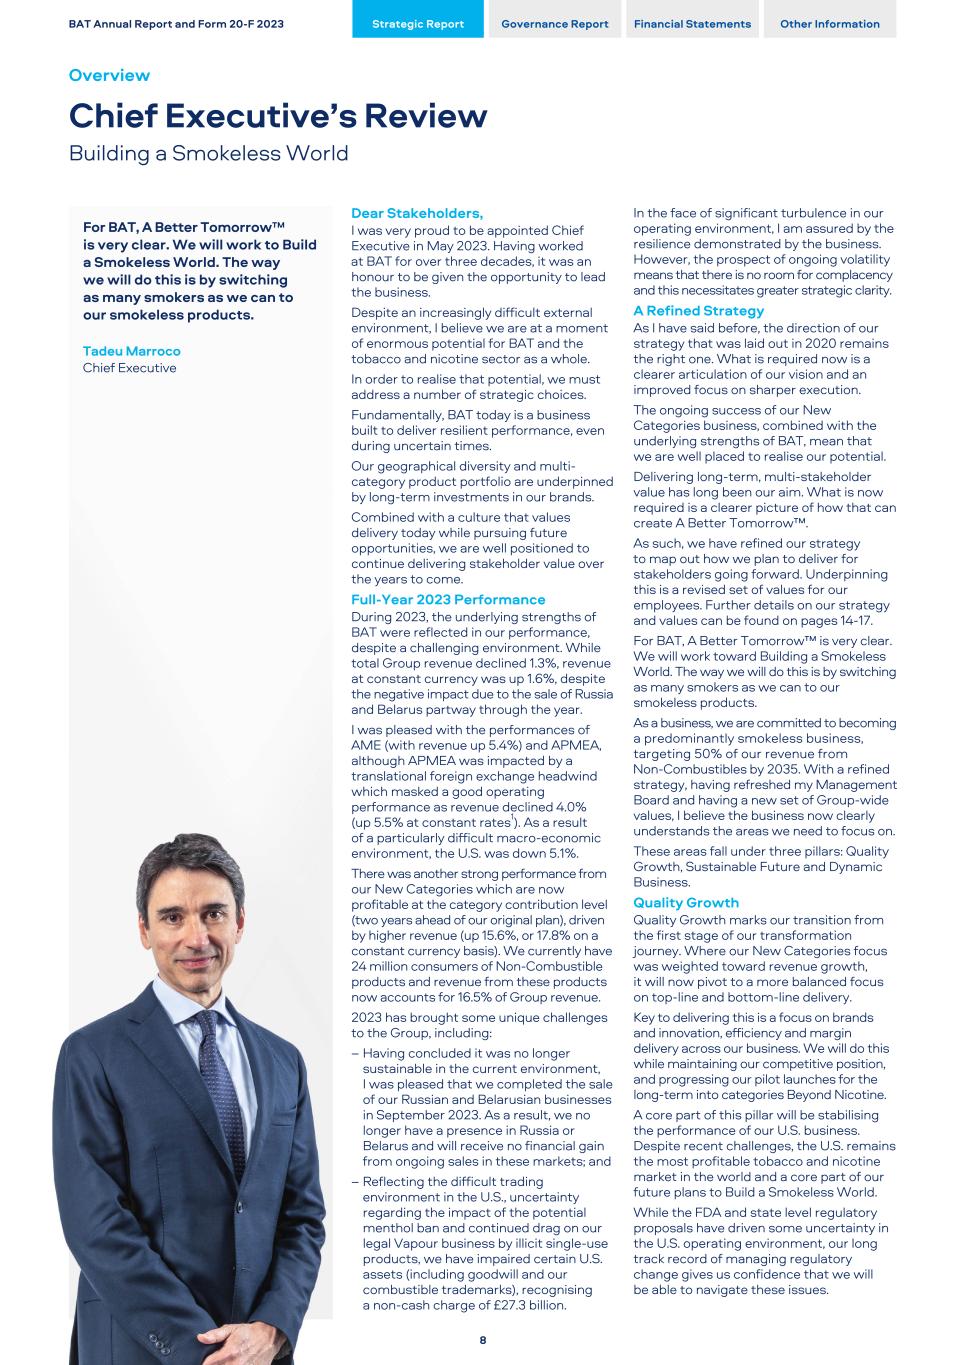
For BAT, A Better Tomorrow™ is very clear. We will work to Build a Smokeless World. The way we will do this is by switching as many smokers as we can to our smokeless products. Tadeu Marroco Chief Executive Dear Stakeholders, I was very proud to be appointed Chief Executive in May 2023. Having worked at BAT for over three decades, it was an honour to be given the opportunity to lead the business. Despite an increasingly difficult external environment, I believe we are at a moment of enormous potential for BAT and the tobacco and nicotine sector as a whole. In order to realise that potential, we must address a number of strategic choices. Fundamentally, BAT today is a business built to deliver resilient performance, even during uncertain times. Our geographical diversity and multi- category product portfolio are underpinned by long-term investments in our brands. Combined with a culture that values delivery today while pursuing future opportunities, we are well positioned to continue delivering stakeholder value over the years to come. Full-Year 2023 Performance During 2023, the underlying strengths of BAT were reflected in our performance, despite a challenging environment. While total Group revenue declined 1.3%, revenue at constant currency was up 1.6%, despite the negative impact due to the sale of Russia and Belarus partway through the year. I was pleased with the performances of AME (with revenue up 5.4%) and APMEA, although APMEA was impacted by a translational foreign exchange headwind which masked a good operating performance as revenue declined 4.0% (up 5.5% at constant rates1). As a result of a particularly difficult macro-economic environment, the U.S. was down 5.1%. There was another strong performance from our New Categories which are now profitable at the category contribution level (two years ahead of our original plan), driven by higher revenue (up 15.6%, or 17.8% on a constant currency basis). We currently have 24 million consumers of Non-Combustible products and revenue from these products now accounts for 16.5% of Group revenue. 2023 has brought some unique challenges to the Group, including: – Having concluded it was no longer sustainable in the current environment, I was pleased that we completed the sale of our Russian and Belarusian businesses in September 2023. As a result, we no longer have a presence in Russia or Belarus and will receive no financial gain from ongoing sales in these markets; and – Reflecting the difficult trading environment in the U.S., uncertainty regarding the impact of the potential menthol ban and continued drag on our legal Vapour business by illicit single-use products, we have impaired certain U.S. assets (including goodwill and our combustible trademarks), recognising a non-cash charge of £27.3 billion. In the face of significant turbulence in our operating environment, I am assured by the resilience demonstrated by the business. However, the prospect of ongoing volatility means that there is no room for complacency and this necessitates greater strategic clarity. A Refined Strategy As I have said before, the direction of our strategy that was laid out in 2020 remains the right one. What is required now is a clearer articulation of our vision and an improved focus on sharper execution. The ongoing success of our New Categories business, combined with the underlying strengths of BAT, mean that we are well placed to realise our potential. Delivering long-term, multi-stakeholder value has long been our aim. What is now required is a clearer picture of how that can create A Better Tomorrow™. As such, we have refined our strategy to map out how we plan to deliver for stakeholders going forward. Underpinning this is a revised set of values for our employees. Further details on our strategy and values can be found on pages 14-17. For BAT, A Better Tomorrow™ is very clear. We will work toward Building a Smokeless World. The way we will do this is by switching as many smokers as we can to our smokeless products. As a business, we are committed to becoming a predominantly smokeless business, targeting 50% of our revenue from Non-Combustibles by 2035. With a refined strategy, having refreshed my Management Board and having a new set of Group-wide values, I believe the business now clearly understands the areas we need to focus on. These areas fall under three pillars: Quality Growth, Sustainable Future and Dynamic Business. Quality Growth Quality Growth marks our transition from the first stage of our transformation journey. Where our New Categories focus was weighted toward revenue growth, it will now pivot to a more balanced focus on top-line and bottom-line delivery. Key to delivering this is a focus on brands and innovation, efficiency and margin delivery across our business. We will do this while maintaining our competitive position, and progressing our pilot launches for the long-term into categories Beyond Nicotine. A core part of this pillar will be stabilising the performance of our U.S. business. Despite recent challenges, the U.S. remains the most profitable tobacco and nicotine market in the world and a core part of our future plans to Build a Smokeless World. While the FDA and state level regulatory proposals have driven some uncertainty in the U.S. operating environment, our long track record of managing regulatory change gives us confidence that we will be able to navigate these issues. BAT Annual Report and Form 20-F 2023 Strategic Report Governance Report Financial Statements Other Information Overview Chief Executive’s Review Building a Smokeless World 8
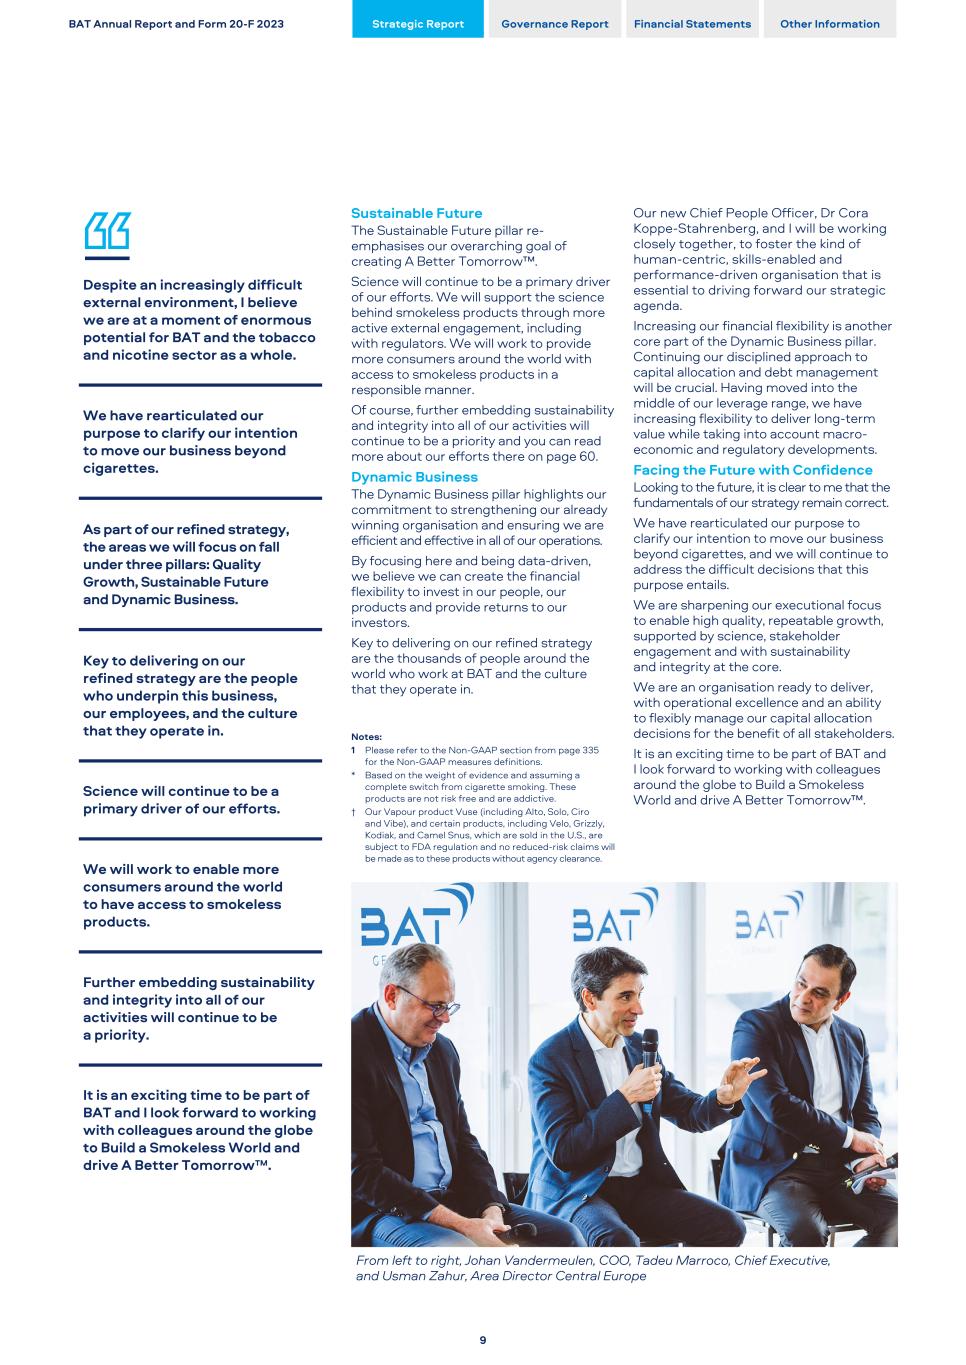
Despite an increasingly difficult external environment, I believe we are at a moment of enormous potential for BAT and the tobacco and nicotine sector as a whole. We have rearticulated our purpose to clarify our intention to move our business beyond cigarettes. As part of our refined strategy, the areas we will focus on fall under three pillars: Quality Growth, Sustainable Future and Dynamic Business. Key to delivering on our refined strategy are the people who underpin this business, our employees, and the culture that they operate in. Science will continue to be a primary driver of our efforts. We will work to enable more consumers around the world to have access to smokeless products. Further embedding sustainability and integrity into all of our activities will continue to be a priority. It is an exciting time to be part of BAT and I look forward to working with colleagues around the globe to Build a Smokeless World and drive A Better Tomorrow™. Sustainable Future The Sustainable Future pillar re- emphasises our overarching goal of creating A Better Tomorrow™. Science will continue to be a primary driver of our efforts. We will support the science behind smokeless products through more active external engagement, including with regulators. We will work to provide more consumers around the world with access to smokeless products in a responsible manner. Of course, further embedding sustainability and integrity into all of our activities will continue to be a priority and you can read more about our efforts there on page 60. Dynamic Business The Dynamic Business pillar highlights our commitment to strengthening our already winning organisation and ensuring we are efficient and effective in all of our operations. By focusing here and being data-driven, we believe we can create the financial flexibility to invest in our people, our products and provide returns to our investors. Key to delivering on our refined strategy are the thousands of people around the world who work at BAT and the culture that they operate in. Notes: 1 Please refer to the Non-GAAP section from page 335 for the Non-GAAP measures definitions. * Based on the weight of evidence and assuming a complete switch from cigarette smoking. These products are not risk free and are addictive. † Our Vapour product Vuse (including Alto, Solo, Ciro and Vibe), and certain products, including Velo, Grizzly, Kodiak, and Camel Snus, which are sold in the U.S., are subject to FDA regulation and no reduced-risk claims will be made as to these products without agency clearance. From left to right, Johan Vandermeulen, COO, Tadeu Marroco, Chief Executive, and Usman Zahur, Area Director Central Europe Our new Chief People Officer, Dr Cora Koppe-Stahrenberg, and I will be working closely together, to foster the kind of human-centric, skills-enabled and performance-driven organisation that is essential to driving forward our strategic agenda. Increasing our financial flexibility is another core part of the Dynamic Business pillar. Continuing our disciplined approach to capital allocation and debt management will be crucial. Having moved into the middle of our leverage range, we have increasing flexibility to deliver long-term value while taking into account macro- economic and regulatory developments. Facing the Future with Confidence Looking to the future, it is clear to me that the fundamentals of our strategy remain correct. We have rearticulated our purpose to clarify our intention to move our business beyond cigarettes, and we will continue to address the difficult decisions that this purpose entails. We are sharpening our executional focus to enable high quality, repeatable growth, supported by science, stakeholder engagement and with sustainability and integrity at the core. We are an organisation ready to deliver, with operational excellence and an ability to flexibly manage our capital allocation decisions for the benefit of all stakeholders. It is an exciting time to be part of BAT and I look forward to working with colleagues around the globe to Build a Smokeless World and drive A Better Tomorrow™. BAT Annual Report and Form 20-F 2023 Strategic Report Governance Report Financial Statements Other Information 9
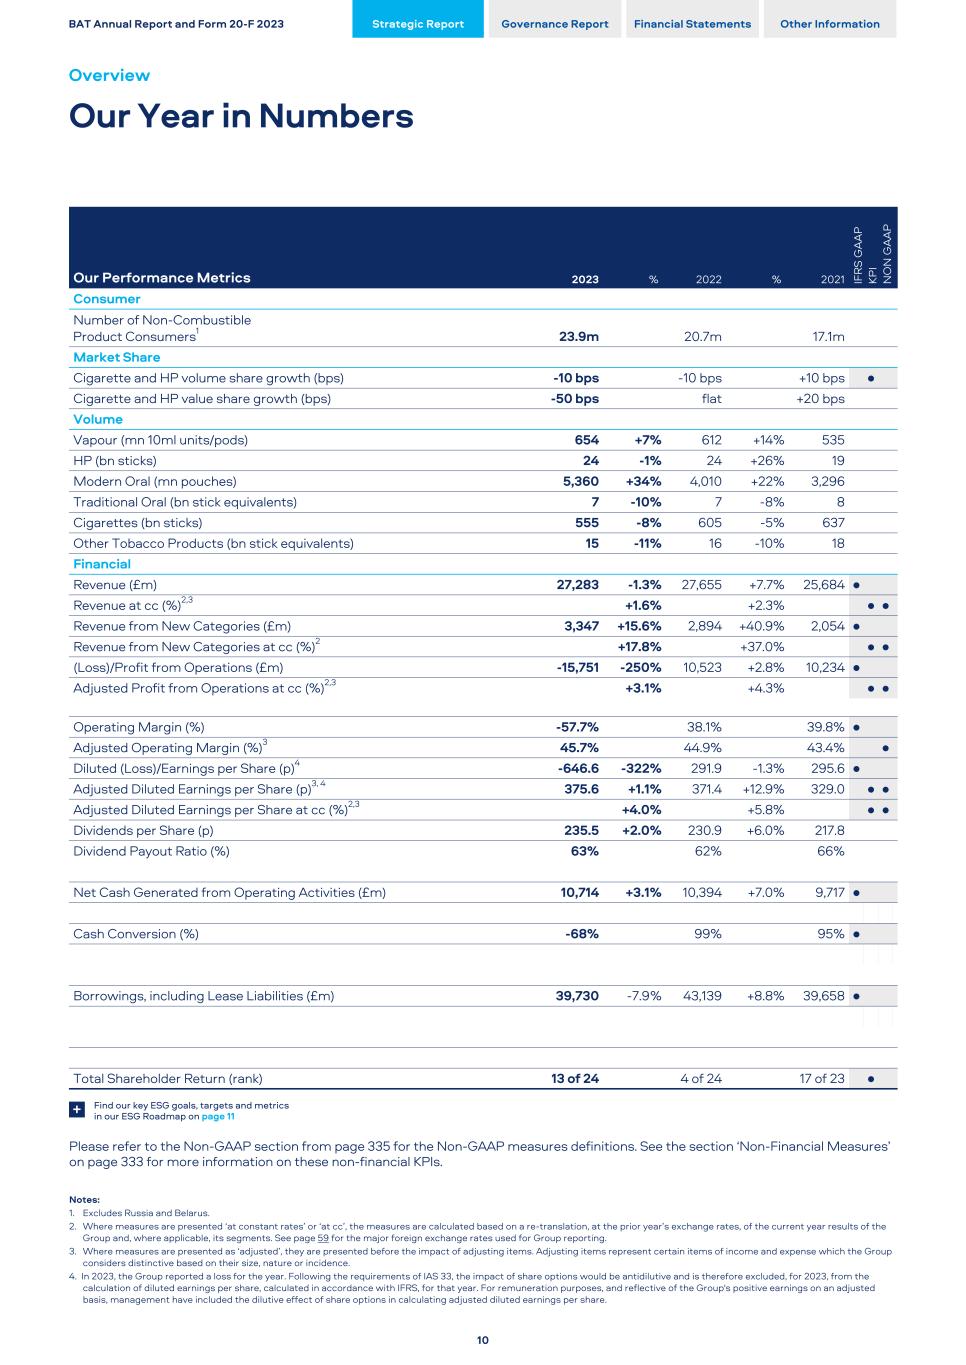
Our Performance Metrics 2023 % 2022 % 2021 IF R S G A A P KP I N O N G A A P Consumer Number of Non-Combustible Product Consumers1 23.9m 20.7m 17.1m Market Share Cigarette and HP volume share growth (bps) -10 bps -10 bps +10 bps • Cigarette and HP value share growth (bps) -50 bps flat +20 bps Volume Vapour (mn 10ml units/pods) 654 +7 % 612 +14 % 535 HP (bn sticks) 24 -1 % 24 +26 % 19 Modern Oral (mn pouches) 5,360 +34 % 4,010 +22 % 3,296 Traditional Oral (bn stick equivalents) 7 -10 % 7 -8 % 8 Cigarettes (bn sticks) 555 -8 % 605 -5 % 637 Other Tobacco Products (bn stick equivalents) 15 -11 % 16 -10 % 18 Financial Revenue (£m) 27,283 -1.3 % 27,655 +7.7 % 25,684 • Revenue at cc (%)2,3 +1.6 % +2.3 % • • Revenue from New Categories (£m) 3,347 +15.6 % 2,894 +40.9 % 2,054 • Revenue from New Categories at cc (%)2 +17.8 % +37.0 % • • (Loss)/Profit from Operations (£m) -15,751 -250 % 10,523 +2.8 % 10,234 • Adjusted Profit from Operations at cc (%)2,3 +3.1 % +4.3 % • • Operating Margin (%) -57.7% 38.1% 39.8% • Adjusted Operating Margin (%)3 45.7% 44.9% 43.4% • Diluted (Loss)/Earnings per Share (p)4 -646.6 -322 % 291.9 -1.3 % 295.6 • Adjusted Diluted Earnings per Share (p)3, 4 375.6 +1.1 % 371.4 +12.9 % 329.0 • • Adjusted Diluted Earnings per Share at cc (%)2,3 +4.0 % +5.8 % • • Dividends per Share (p) 235.5 +2.0 % 230.9 +6.0 % 217.8 Dividend Payout Ratio (%) 63% 62% 66% Net Cash Generated from Operating Activities (£m) 10,714 +3.1 % 10,394 +7.0 % 9,717 • Cash Conversion (%) -68% 99% 95% • Borrowings, including Lease Liabilities (£m) 39,730 -7.9 % 43,139 +8.8 % 39,658 • Total Shareholder Return (rank) 13 of 24 4 of 24 17 of 23 • Find our key ESG goals, targets and metrics in our ESG Roadmap on page 11+ Please refer to the Non-GAAP section from page 335 for the Non-GAAP measures definitions. See the section ‘Non-Financial Measures’ on page 333 for more information on these non-financial KPIs. Notes: 1. Excludes Russia and Belarus. 2. Where measures are presented ‘at constant rates’ or ‘at cc’, the measures are calculated based on a re-translation, at the prior year’s exchange rates, of the current year results of the Group and, where applicable, its segments. See page 59 for the major foreign exchange rates used for Group reporting. 3. Where measures are presented as ‘adjusted’, they are presented before the impact of adjusting items. Adjusting items represent certain items of income and expense which the Group considers distinctive based on their size, nature or incidence. 4. In 2023, the Group reported a loss for the year. Following the requirements of IAS 33, the impact of share options would be antidilutive and is therefore excluded, for 2023, from the calculation of diluted earnings per share, calculated in accordance with IFRS, for that year. For remuneration purposes, and reflective of the Group's positive earnings on an adjusted basis, management have included the dilutive effect of share options in calculating adjusted diluted earnings per share. BAT Annual Report and Form 20-F 2023 Strategic Report Governance Report Financial Statements Other Information Overview Our Year in Numbers 10
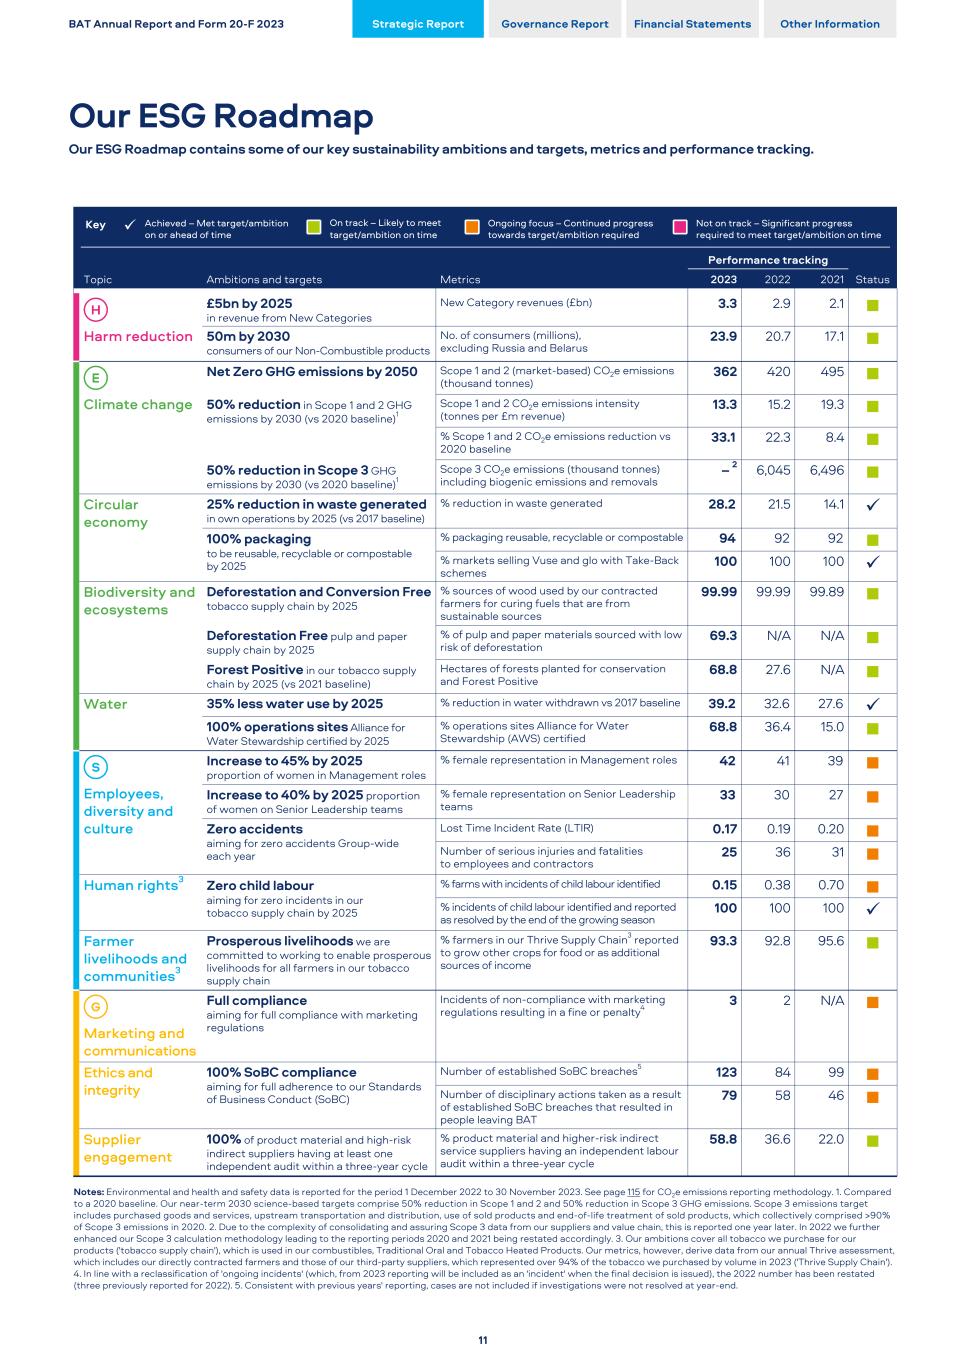
Ambitions and targets Metrics Performance tracking Topic 2023 2022 2021 Status Harm reduction £5bn by 2025 in revenue from New Categories New Category revenues (£bn) 3.3 2.9 2.1 n 50m by 2030 consumers of our Non-Combustible products No. of consumers (millions), excluding Russia and Belarus 23.9 20.7 17.1 n Climate change Net Zero GHG emissions by 2050 Scope 1 and 2 (market-based) CO2e emissions (thousand tonnes) 362 420 495 n 50% reduction in Scope 1 and 2 GHG emissions by 2030 (vs 2020 baseline)1 Scope 1 and 2 CO2e emissions intensity (tonnes per £m revenue) 13.3 15.2 19.3 n % Scope 1 and 2 CO2e emissions reduction vs 2020 baseline 33.1 22.3 8.4 n 50% reduction in Scope 3 GHG emissions by 2030 (vs 2020 baseline)1 Scope 3 CO2e emissions (thousand tonnes) including biogenic emissions and removals – 2 6,045 6,496 n Circular economy 25% reduction in waste generated in own operations by 2025 (vs 2017 baseline) % reduction in waste generated 28.2 21.5 14.1 ü 100% packaging to be reusable, recyclable or compostable by 2025 % packaging reusable, recyclable or compostable 94 92 92 n % markets selling Vuse and glo with Take-Back schemes 100 100 100 ü Biodiversity and ecosystems Deforestation and Conversion Free tobacco supply chain by 2025 % sources of wood used by our contracted farmers for curing fuels that are from sustainable sources 99.99 99.99 99.89 n Deforestation Free pulp and paper supply chain by 2025 % of pulp and paper materials sourced with low risk of deforestation 69.3 N/A N/A n Forest Positive in our tobacco supply chain by 2025 (vs 2021 baseline) Hectares of forests planted for conservation and Forest Positive 68.8 27.6 N/A n Water 35% less water use by 2025 % reduction in water withdrawn vs 2017 baseline 39.2 32.6 27.6 ü 100% operations sites Alliance for Water Stewardship certified by 2025 % operations sites Alliance for Water Stewardship (AWS) certified 68.8 36.4 15.0 n Employees, diversity and culture Increase to 45% by 2025 proportion of women in Management roles % female representation in Management roles 42 41 39 n Increase to 40% by 2025 proportion of women on Senior Leadership teams % female representation on Senior Leadership teams 33 30 27 n Zero accidents aiming for zero accidents Group-wide each year Lost Time Incident Rate (LTIR) 0.17 0.19 0.20 n Number of serious injuries and fatalities to employees and contractors 25 36 31 n Human rights3 Zero child labour aiming for zero incidents in our tobacco supply chain by 2025 % farms with incidents of child labour identified 0.15 0.38 0.70 n % incidents of child labour identified and reported as resolved by the end of the growing season 100 100 100 ü Farmer livelihoods and communities3 Prosperous livelihoods we are committed to working to enable prosperous livelihoods for all farmers in our tobacco supply chain % farmers in our Thrive Supply Chain3 reported to grow other crops for food or as additional sources of income 93.3 92.8 95.6 n Marketing and communications Full compliance aiming for full compliance with marketing regulations Incidents of non-compliance with marketing regulations resulting in a fine or penalty4 3 2 N/A n Ethics and integrity 100% SoBC compliance aiming for full adherence to our Standards of Business Conduct (SoBC) Number of established SoBC breaches5 123 84 99 n Number of disciplinary actions taken as a result of established SoBC breaches that resulted in people leaving BAT 79 58 46 n Supplier engagement 100% of product material and high-risk indirect suppliers having at least one independent audit within a three-year cycle % product material and higher-risk indirect service suppliers having an independent labour audit within a three-year cycle 58.8 36.6 22.0 n Notes: Environmental and health and safety data is reported for the period 1 December 2022 to 30 November 2023. See page 115 for CO2e emissions reporting methodology. 1. Compared to a 2020 baseline. Our near-term 2030 science-based targets comprise 50% reduction in Scope 1 and 2 and 50% reduction in Scope 3 GHG emissions. Scope 3 emissions target includes purchased goods and services, upstream transportation and distribution, use of sold products and end-of-life treatment of sold products, which collectively comprised >90% of Scope 3 emissions in 2020. 2. Due to the complexity of consolidating and assuring Scope 3 data from our suppliers and value chain, this is reported one year later. In 2022 we further enhanced our Scope 3 calculation methodology leading to the reporting periods 2020 and 2021 being restated accordingly. 3. Our ambitions cover all tobacco we purchase for our products ('tobacco supply chain'), which is used in our combustibles, Traditional Oral and Tobacco Heated Products. Our metrics, however, derive data from our annual Thrive assessment, which includes our directly contracted farmers and those of our third-party suppliers, which represented over 94% of the tobacco we purchased by volume in 2023 ('Thrive Supply Chain'). 4. In line with a reclassification of 'ongoing incidents' (which, from 2023 reporting will be included as an 'incident' when the final decision is issued), the 2022 number has been restated (three previously reported for 2022). 5. Consistent with previous years' reporting, cases are not included if investigations were not resolved at year-end. BAT Annual Report and Form 20-F 2023 Strategic Report Governance Report Financial Statements Other Information Our ESG Roadmap Our ESG Roadmap contains some of our key sustainability ambitions and targets, metrics and performance tracking. 11 Key ü Achieved – Met target/ambition on or ahead of time On track – Likely to meet target/ambition on time Ongoing focus – Continued progress towards target/ambition required Not on track – Significant progress required to meet target/ambition on time
Despite the U.S. impairment negatively impacting our reported results, the Group's operational financial performance demonstrates the resilience of the business. We are highly cash generative and remain committed to our capital allocation framework. Javed Iqbal Interim Finance Director 2023 has been a challenging year as we navigated a number of issues in our performance. Our New Categories business is already profitable (at the category contribution level), two years earlier than our original plan, while our global footprint allows us to deliver on our financial priorities despite a challenging U.S. environment. We remain highly cash generative, allowing us to balance investment in the future while rewarding shareholders with a further increase in dividends (up 2.0% to 235.5p, being 25 years of annual dividend increases). The sale of our businesses in Russia and Belarus was completed in September 2023, and due to the timing of the transaction partway through the year, this was a headwind on our comparative performance as 2023 does not include a full year's performance from those markets. Combined with a lower underlying performance in Russia as we reduced investment and focus, the comparative impact on revenue was £456 million. During 2023, we have observed an acceleration of the decline rates in cigarette volume in the U.S., after a period of instability in market trends driven by the COVID-19 pandemic. In response to these increased decline rates, we have revised our forecast performance for the U.S. market, reflecting the ongoing difficult macro-economic environment, uncertainty regarding the impact of the potential menthol ban and continued drag on our legal Vapour business by the illicit single-use products. Accordingly, we have recognised a non-cash impairment charge of £27.3 billion, of which £4.3 billion is in respect of goodwill. The balance of £23.0 billion mainly relates to the acquired U.S. combustibles brands of Newport, Camel, Natural American Spirit and Pall Mall which are now considered to have a useful economic life not exceeding 30 years, rather than into perpetuity, aligned with our strategy to Build a Smokeless World. We will, therefore, be commencing amortisation of the U.S. cigarette brands (previously recognised for accounting purposes as indefinite-lived) from 1 January 2024. This non-cash charge of £1.4 billion per annum will be treated as an adjusting item. Total Group revenue declined 1.3% to £27,283 million in 2023 (having grown 7.7% in 2022 to £27,655 million). However, excluding foreign exchange movements (which were a headwind of 2.9% in 2023 and a tailwind of 5.4% in 2022) on a constant currency basis, revenue was up 1.6% in 2023 and 2.3% in 2022. This was driven by: – New Categories revenue, up 17.8% in 2023 and 37.0% in 2022; and – continued combustibles pricing, with Group price/mix of 7.5% in 2023 (4.6% in 2022); and partly offset by: – the impact of the sale of the Russian and Belarusian businesses; and – lower combustibles volume (down 8.3% in 2023) largely due to the difficult trading in the U.S. where volume was 11.3% lower. Profit from operations declined 250% to be a loss of £15,751 million, compared to a profit of £10,523 million in 2022, an increase of 2.8%. The decline in 2023 was due to the impairment charges referred to earlier in respect of the U.S. (goodwill and brands). 2022 was negatively impacted by a number of other adjusting charges which did not repeat or were substantially lower in 2023. These include the previously disclosed charges in respect of: – The sale of the Russian (and Belarusian) business (2023: £353 million, 2022: £612 million); – Restructuring and integration programmes, including Quantum, being a release in 2023 of £2 million from the previously recognised provision, which was a charge of £771 million in 2022; – The agreement with the United States Department of Justice (DOJ) and the United States Department of the Treasury’s Office of Foreign Assets Control (OFAC) to resolve historical breaches of sanctions (2023: £75 million, 2022: £450 million); and – A charge in 2022 of £79 million related to the conclusion of the investigation into alleged violations of the Nigerian Competition and Consumer Protection Act and National Tobacco Control Act. These charges were partly offset by a net credit of £167 million (2022: £460 million) in Brazil as the Group revised the calculation of VAT and excise on social contributions in prior periods following updated guidance and the conclusion of litigation. Our operating margin was consequently 95.8 ppts lower at -57.7% in 2023 (2022: down 170 bps to 38.1%). BAT Annual Report and Form 20-F 2023 Strategic Report Governance Report Financial Statements Other Information Overview Interim Finance Director’s Overview 12
We aim to continue to reward shareholders and our financial performance allows us to further increase our dividend by 2.0% - marking 25 years of annual dividend increases. Strong, sustainable, cash flow generation underpins confidence in the future. Profit from operations was down -250% (2022: up 2.8%), impacted by the impairment charges largely in respect of the U.S. goodwill and brands. Strong cash generation has enabled us to return £5.1 billion of cash to shareholders in 2023, while still deleveraging. Excluding these significant adjusting items, and a translational foreign exchange headwind of 2.6%, on an adjusted constant currency basis (which we believe reflects the operational performance of the Group) profit from operations grew by 3.1% (2022: up 4.3%), due to the continued reduction in losses from New Categories, which are now profitable at a category contribution level- two years ahead of our original plan. Adjusted operating margin (at current rates) increased 80 bps to 45.7% (2022: up 150 bps to 44.9%) driven by the reduction in New Categories losses in both years, combined with the impact of the disposal of the Group's businesses in Russia and Belarus, as the margins of those businesses were lower than the Group average. EPS Impacted by U.S. Impairment, Offsetting Resilient Operating Performance On a reported basis, basic EPS was down 320% at -646.6p (2022: down 1.2% at 293.3p) with diluted EPS 322% lower at -646.6p (2022: down 1.3% to 291.9p), as 2023 was impacted by the impairment charges recognised in respect of the U.S. Excluding both the adjusting items (discussed on pages 52 and 53) and the effect of foreign exchange on the Group’s results, adjusted diluted earnings per share, at constant rates, increased by 4.0% to 386.4p, building on the 5.8% growth in 2022. The performance in 2023 was also impacted by the timing of the sale of the Group's businesses in Russia and Belarus during the year, a negative headwind on the performance of 1.2%. Active Capital Allocation Framework Ensures Deleverage, Investment and Investor Returns We remain committed to our active capital allocation framework, which we expect will deliver long-term value to our shareholders, driven by our cash flow generation and deleverage plans. These include: – Continuing to grow the dividend; – Maintaining our target leverage corridor; – Potential bolt-on M&A opportunities; and – Share buy-backs to enhance shareholder returns. The Group remains highly cash generative, realising £10.7 billion (2022: £10.4 billion) of net cash generated from operating activities. This allowed for a net repayment of borrowings in the year, with total borrowings (including lease liabilities) down from £43,139 million in 2022 to £39,730 million in 2023. Consequently, our leverage ratio has improved towards the middle of our range. Our liquidity profile remains strong, with average debt maturity close to 10.5 years and maximum debt maturities in any one calendar year of around £4 billion, with a current rating of Baa2 (positive outlook), BBB+ (negative outlook), BBB (positive outlook) from Moody's, S&P and Fitch*, respectively. In August 2023, the Group completed a tender offer to repurchase sterling- equivalent £3,133 million of bonds, including £43 million of accrued interest, reducing future refinancing risk. The Group has debt maturities of around £3.2 billion annually in the next two years. Due to higher interest rates, net finance costs are expected to increase as debts are refinanced. 25 Years of Consistent Dividend Growth We are extremely proud of our long history of dividend growth. 2023 marks the 25th consecutive year of sterling dividend increases, with a further increase of 2.0% to 235.52p (with a dividend payout ratio of 62.7%). Facing the Future with Increasing Confidence Our business is well placed for the future. With a diversified geographic and product portfolio, and a track record of delivering robust and consistent cash generation, we believe the Group is well positioned to continue to invest for future growth while navigating the near-term macro-economic uncertainties and challenges. Notes: * A credit rating is not a recommendation to buy, sell or hold securities. A credit rating may be subject to withdrawal or revision at any time. Each rating should be evaluated separately of any other rating. BAT Annual Report and Form 20-F 2023 Strategic Report Governance Report Financial Statements Other Information 13
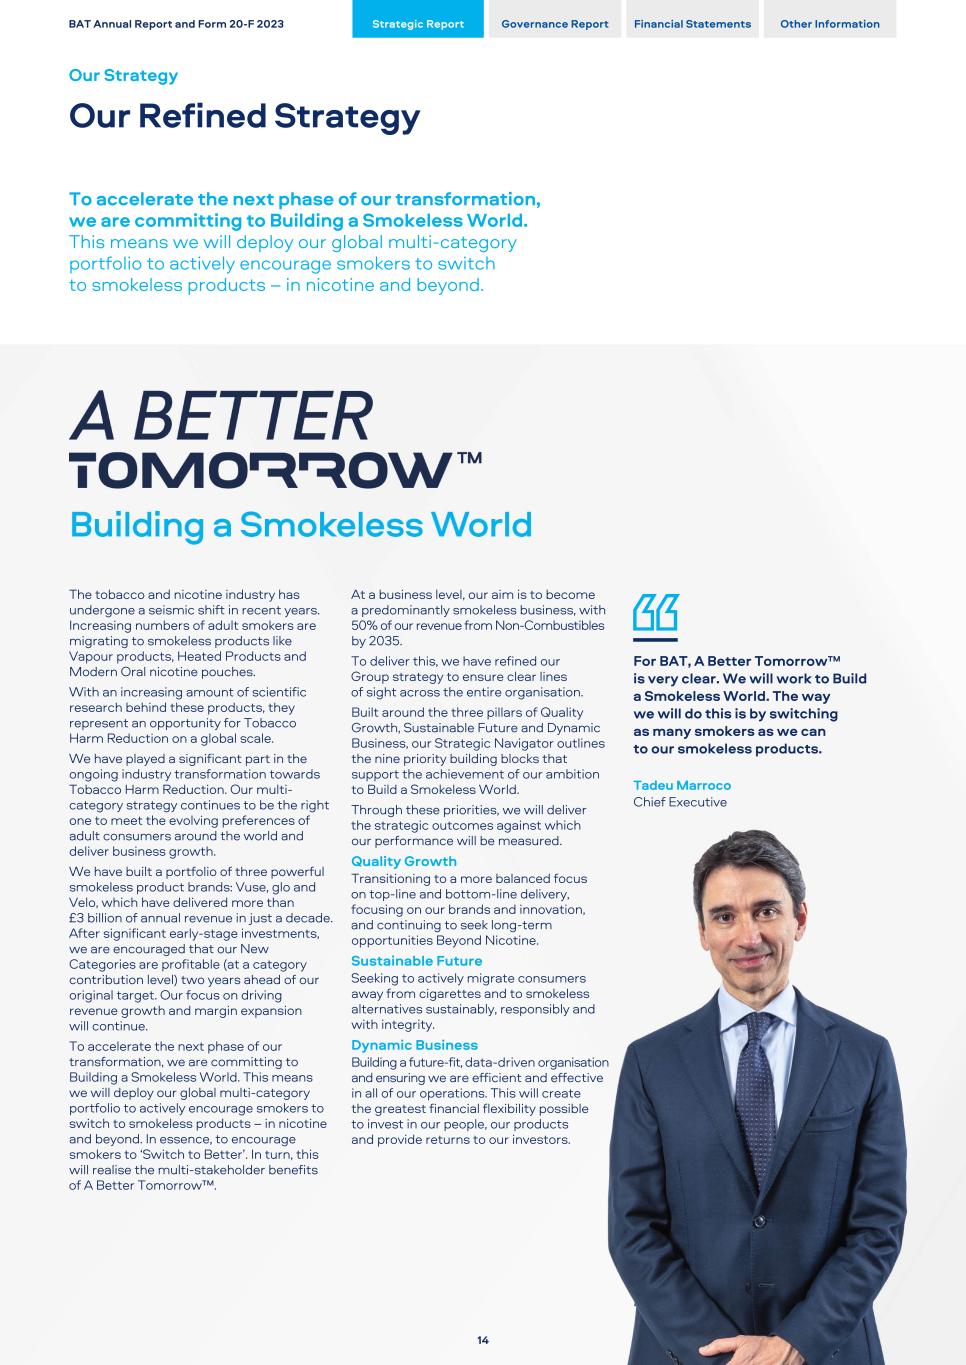
The tobacco and nicotine industry has undergone a seismic shift in recent years. Increasing numbers of adult smokers are migrating to smokeless products like Vapour products, Heated Products and Modern Oral nicotine pouches. With an increasing amount of scientific research behind these products, they represent an opportunity for Tobacco Harm Reduction on a global scale. We have played a significant part in the ongoing industry transformation towards Tobacco Harm Reduction. Our multi- category strategy continues to be the right one to meet the evolving preferences of adult consumers around the world and deliver business growth. We have built a portfolio of three powerful smokeless product brands: Vuse, glo and Velo, which have delivered more than £3 billion of annual revenue in just a decade. After significant early-stage investments, we are encouraged that our New Categories are profitable (at a category contribution level) two years ahead of our original target. Our focus on driving revenue growth and margin expansion will continue. To accelerate the next phase of our transformation, we are committing to Building a Smokeless World. This means we will deploy our global multi-category portfolio to actively encourage smokers to switch to smokeless products – in nicotine and beyond. In essence, to encourage smokers to ‘Switch to Better’. In turn, this will realise the multi-stakeholder benefits of A Better Tomorrow™. At a business level, our aim is to become a predominantly smokeless business, with 50% of our revenue from Non-Combustibles by 2035. To deliver this, we have refined our Group strategy to ensure clear lines of sight across the entire organisation. Built around the three pillars of Quality Growth, Sustainable Future and Dynamic Business, our Strategic Navigator outlines the nine priority building blocks that support the achievement of our ambition to Build a Smokeless World. Through these priorities, we will deliver the strategic outcomes against which our performance will be measured. Quality Growth Transitioning to a more balanced focus on top-line and bottom-line delivery, focusing on our brands and innovation, and continuing to seek long-term opportunities Beyond Nicotine. Sustainable Future Seeking to actively migrate consumers away from cigarettes and to smokeless alternatives sustainably, responsibly and with integrity. Dynamic Business Building a future-fit, data-driven organisation and ensuring we are efficient and effective in all of our operations. This will create the greatest financial flexibility possible to invest in our people, our products and provide returns to our investors. For BAT, A Better Tomorrow™ is very clear. We will work to Build a Smokeless World. The way we will do this is by switching as many smokers as we can to our smokeless products. Tadeu Marroco Chief Executive BAT Annual Report and Form 20-F 2023 Strategic Report Governance Report Financial Statements Other Information Our Strategy Our Refined Strategy To accelerate the next phase of our transformation, we are committing to Building a Smokeless World. This means we will deploy our global multi-category portfolio to actively encourage smokers to switch to smokeless products – in nicotine and beyond. 14
BAT Annual Report and Form 20-F 2023 Strategic Report Governance Report Financial Statements Other Information Our Strategic Navigator 15
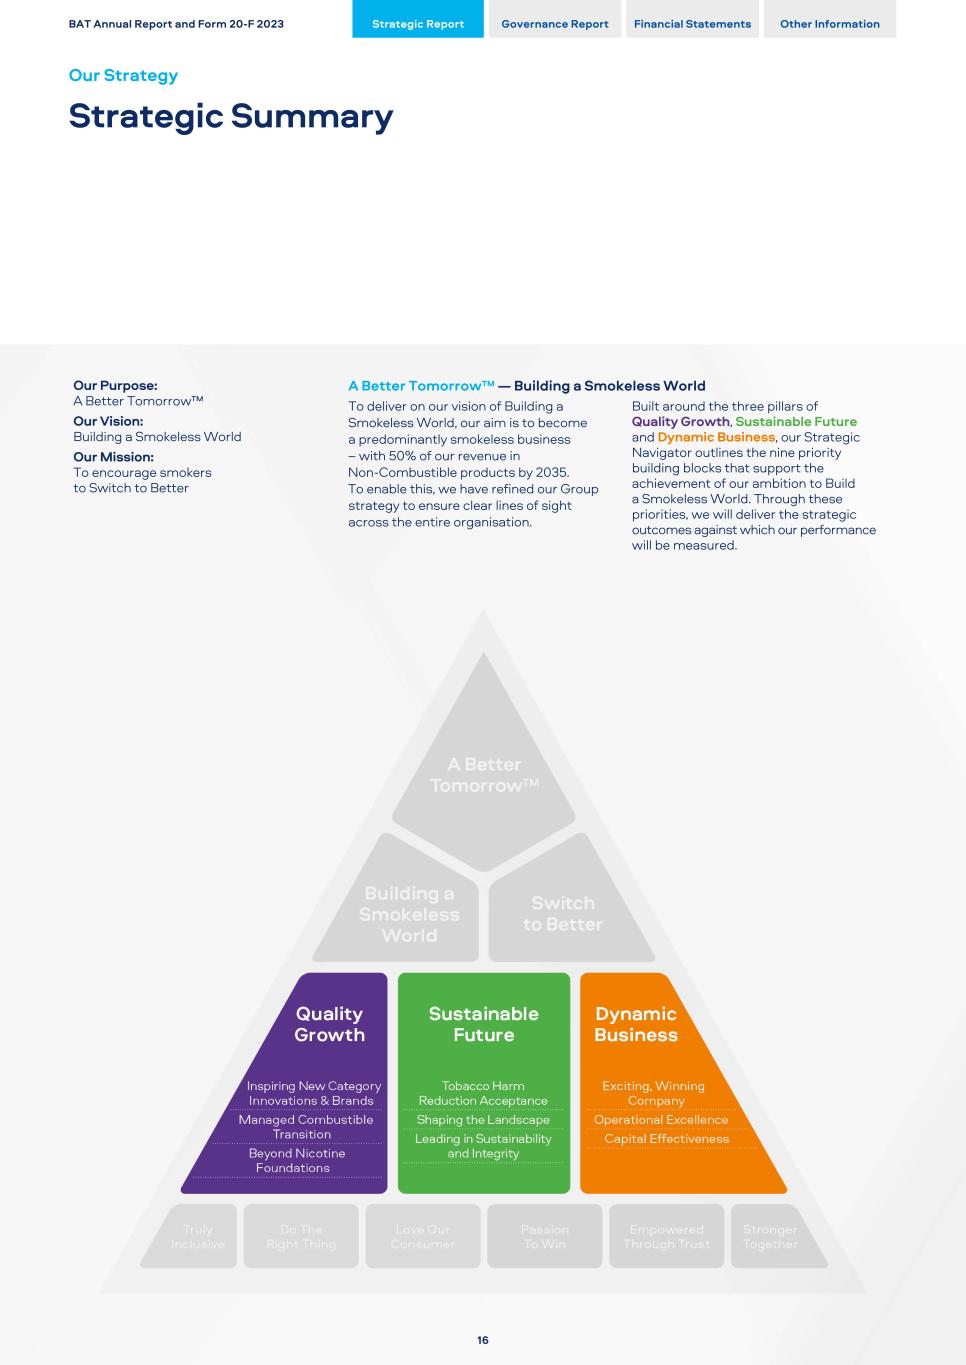
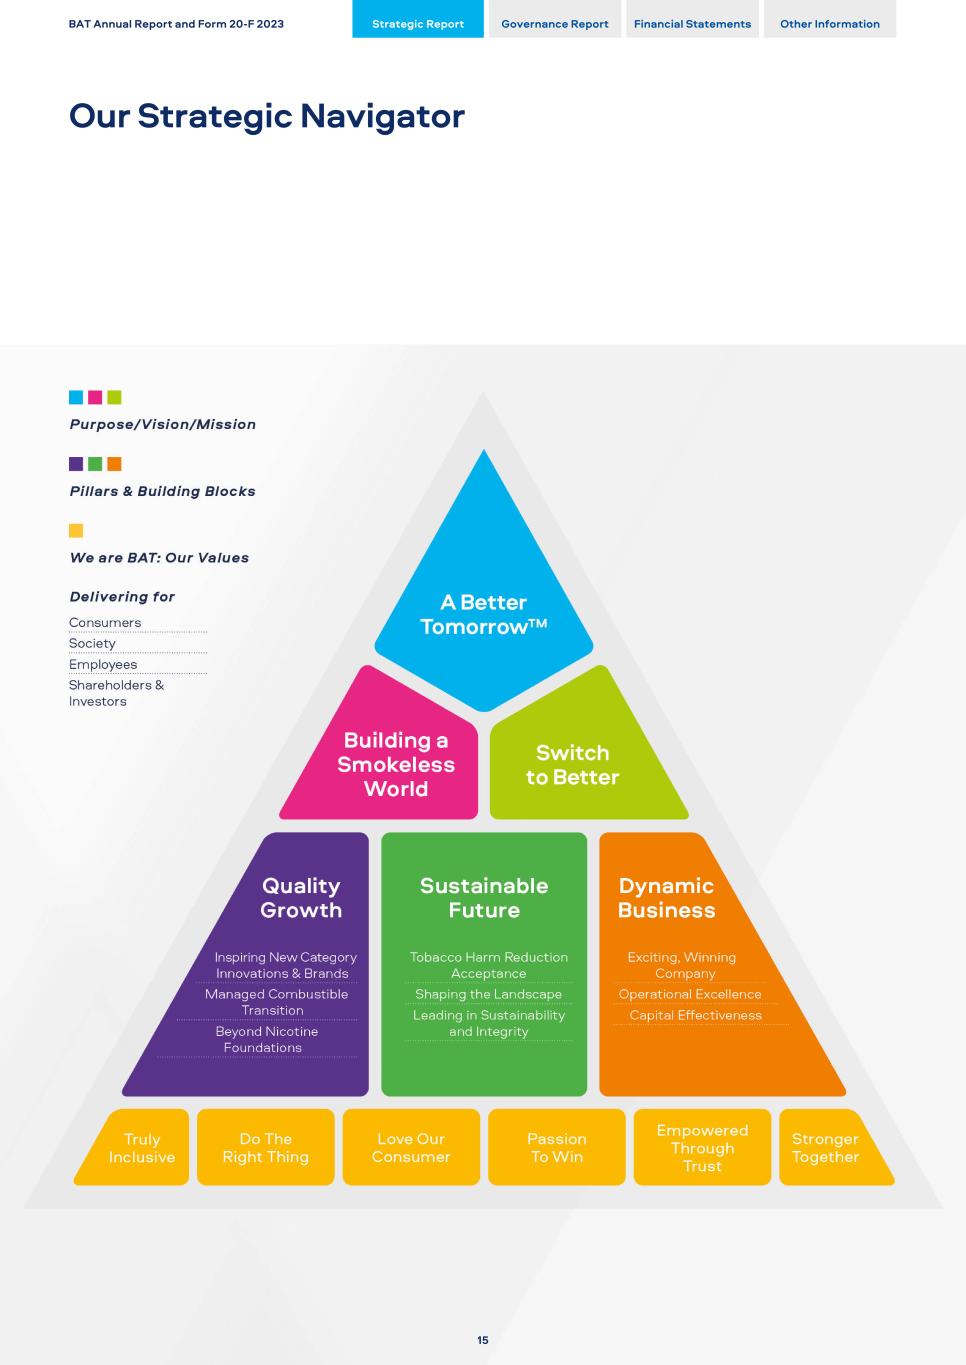
Our Purpose: A Better Tomorrow™ Our Vision: Building a Smokeless World Our Mission: To encourage smokers to Switch to Better A Better Tomorrow™ — Building a Smokeless World To deliver on our vision of Building a Smokeless World, our aim is to become a predominantly smokeless business – with 50% of our revenue in Non-Combustible products by 2035. To enable this, we have refined our Group strategy to ensure clear lines of sight across the entire organisation. Built around the three pillars of Quality Growth, Sustainable Future and Dynamic Business, our Strategic Navigator outlines the nine priority building blocks that support the achievement of our ambition to Build a Smokeless World. Through these priorities, we will deliver the strategic outcomes against which our performance will be measured. BAT Annual Report and Form 20-F 2023 Strategic Report Governance Report Financial Statements Other Information Our Strategy Strategic Summary 16
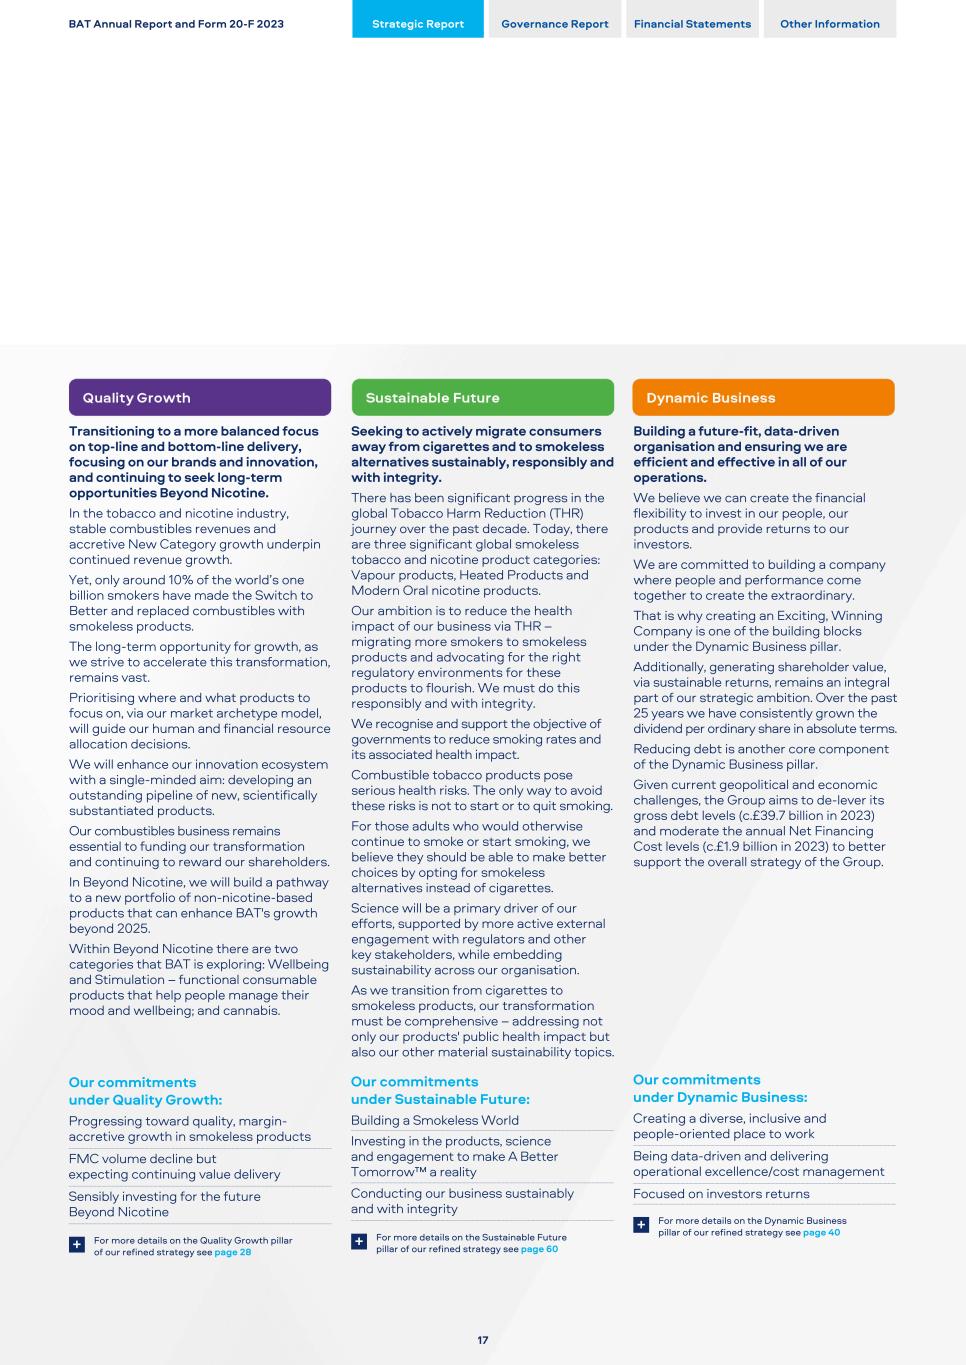
Transitioning to a more balanced focus on top-line and bottom-line delivery, focusing on our brands and innovation, and continuing to seek long-term opportunities Beyond Nicotine. In the tobacco and nicotine industry, stable combustibles revenues and accretive New Category growth underpin continued revenue growth. Yet, only around 10% of the world’s one billion smokers have made the Switch to Better and replaced combustibles with smokeless products. The long-term opportunity for growth, as we strive to accelerate this transformation, remains vast. Prioritising where and what products to focus on, via our market archetype model, will guide our human and financial resource allocation decisions. We will enhance our innovation ecosystem with a single-minded aim: developing an outstanding pipeline of new, scientifically substantiated products. Our combustibles business remains essential to funding our transformation and continuing to reward our shareholders. In Beyond Nicotine, we will build a pathway to a new portfolio of non-nicotine-based products that can enhance BAT's growth beyond 2025. Within Beyond Nicotine there are two categories that BAT is exploring: Wellbeing and Stimulation – functional consumable products that help people manage their mood and wellbeing; and cannabis. Our commitments under Quality Growth: Progressing toward quality, margin- accretive growth in smokeless products FMC volume decline but expecting continuing value delivery Sensibly investing for the future Beyond Nicotine For more details on the Quality Growth pillar of our refined strategy,see page 28+ Seeking to actively migrate consumers away from cigarettes and to smokeless alternatives sustainably, responsibly and with integrity. There has been significant progress in the global Tobacco Harm Reduction (THR) journey over the past decade. Today, there are three significant global smokeless tobacco and nicotine product categories: Vapour products, Heated Products and Modern Oral nicotine products. Our ambition is to reduce the health impact of our business via THR – migrating more smokers to smokeless products and advocating for the right regulatory environments for these products to flourish. We must do this responsibly and with integrity. We recognise and support the objective of governments to reduce smoking rates and its associated health impact. Combustible tobacco products pose serious health risks. The only way to avoid these risks is not to start or to quit smoking. For those adults who would otherwise continue to smoke or start smoking, we believe they should be able to make better choices by opting for smokeless alternatives instead of cigarettes. Science will be a primary driver of our efforts, supported by more active external engagement with regulators and other key stakeholders, while embedding sustainability across our organisation. As we transition from cigarettes to smokeless products, our transformation must be comprehensive – addressing not only our products' public health impact but also our other material sustainability topics. Our commitments under Sustainable Future: Building a Smokeless World Investing in the products, science and engagement to make A Better Tomorrow™ a reality Conducting our business sustainably and with integrity For more details on the Sustainable Future pillar of our refined strategy see page 60+ Building a future-fit, data-driven organisation and ensuring we are efficient and effective in all of our operations. We believe we can create the financial flexibility to invest in our people, our products and provide returns to our investors. We are committed to building a company where people and performance come together to create the extraordinary. That is why creating an Exciting, Winning Company is one of the building blocks under the Dynamic Business pillar. Additionally, generating shareholder value, via sustainable returns, remains an integral part of our strategic ambition. Over the past 25 years we have consistently grown the dividend per ordinary share in absolute terms. Reducing debt is another core component of the Dynamic Business pillar. Given current geopolitical and economic challenges, the Group aims to de-lever its gross debt levels (c.£39.7 billion in 2023) and moderate the annual Net Financing Cost levels (c.£1.9 billion in 2023) to better support the overall strategy of the Group. Our commitments under Dynamic Business: Creating a diverse, inclusive and people-oriented place to work Being data-driven and delivering operational excellence/cost management Focused on investors returns For more details on the Dynamic Business pillar of our refined strategy,see page 40+ BAT Annual Report and Form 20-F 2023 Strategic Report Governance Report Financial Statements Other Information 17
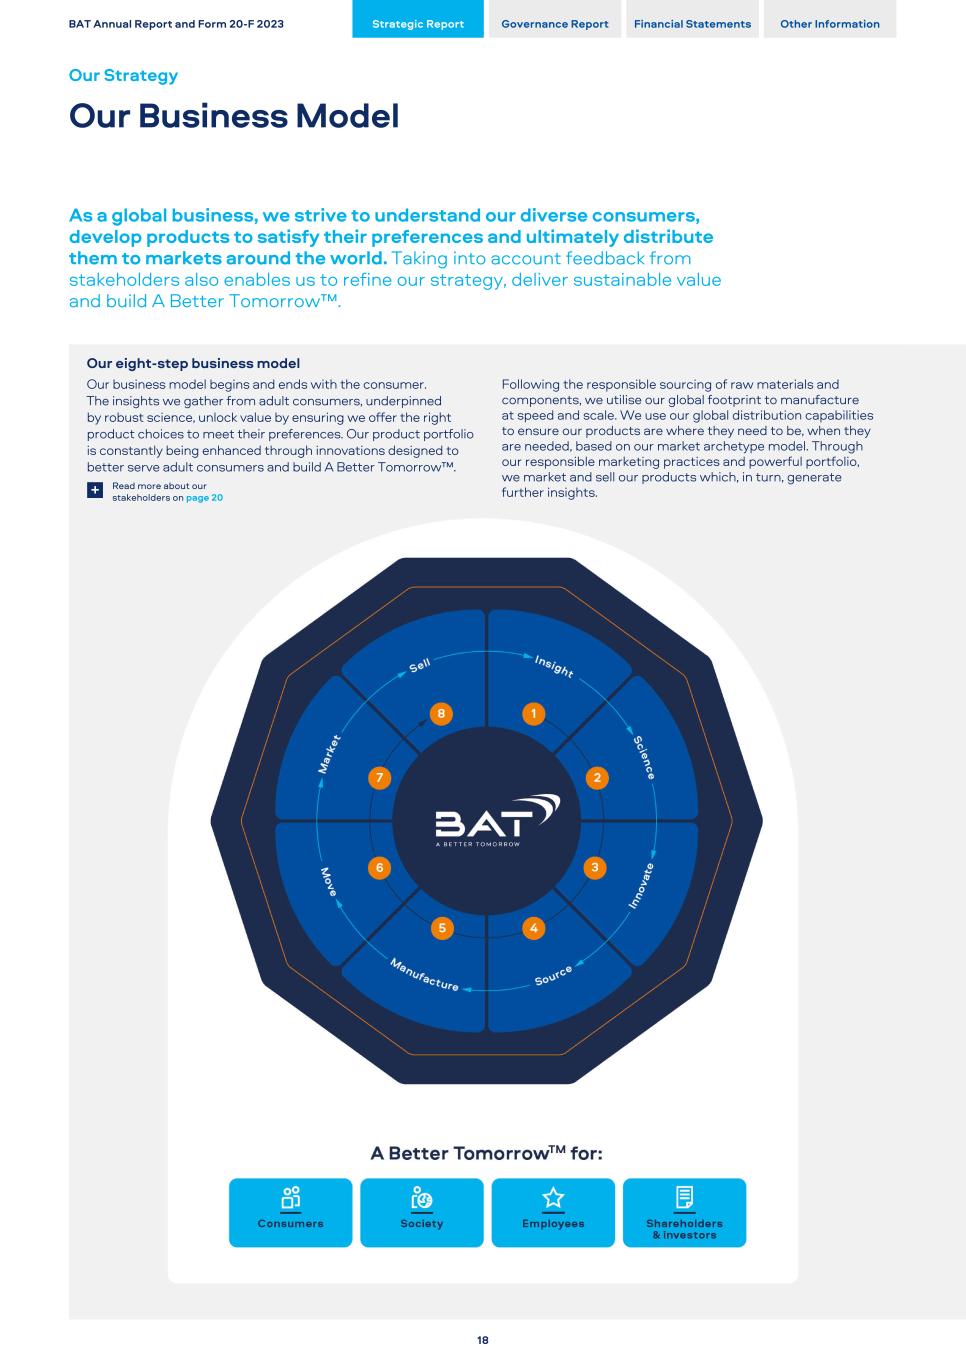
Our eight-step business model Our business model begins and ends with the consumer. The insights we gather from adult consumers, underpinned by robust science, unlock value by ensuring we offer the right product choices to meet their preferences. Our product portfolio is constantly being enhanced through innovations designed to better serve adult consumers and build A Better Tomorrow™. Following the responsible sourcing of raw materials and components, we utilise our global footprint to manufacture at speed and scale. We use our global distribution capabilities to ensure our products are where they need to be, when they are needed, based on our market archetype model. Through our responsible marketing practices and powerful portfolio, we market and sell our products which, in turn, generate further insights.Read more about our stakeholders on page 20+ BAT Annual Report and Form 20-F 2023 Strategic Report Governance Report Financial Statements Other Information Our Strategy Our Business Model As a global business, we strive to understand our diverse consumers, develop products to satisfy their preferences and ultimately distribute them to markets around the world. Taking into account feedback from stakeholders also enables us to refine our strategy, deliver sustainable value and build A Better Tomorrow™. 18
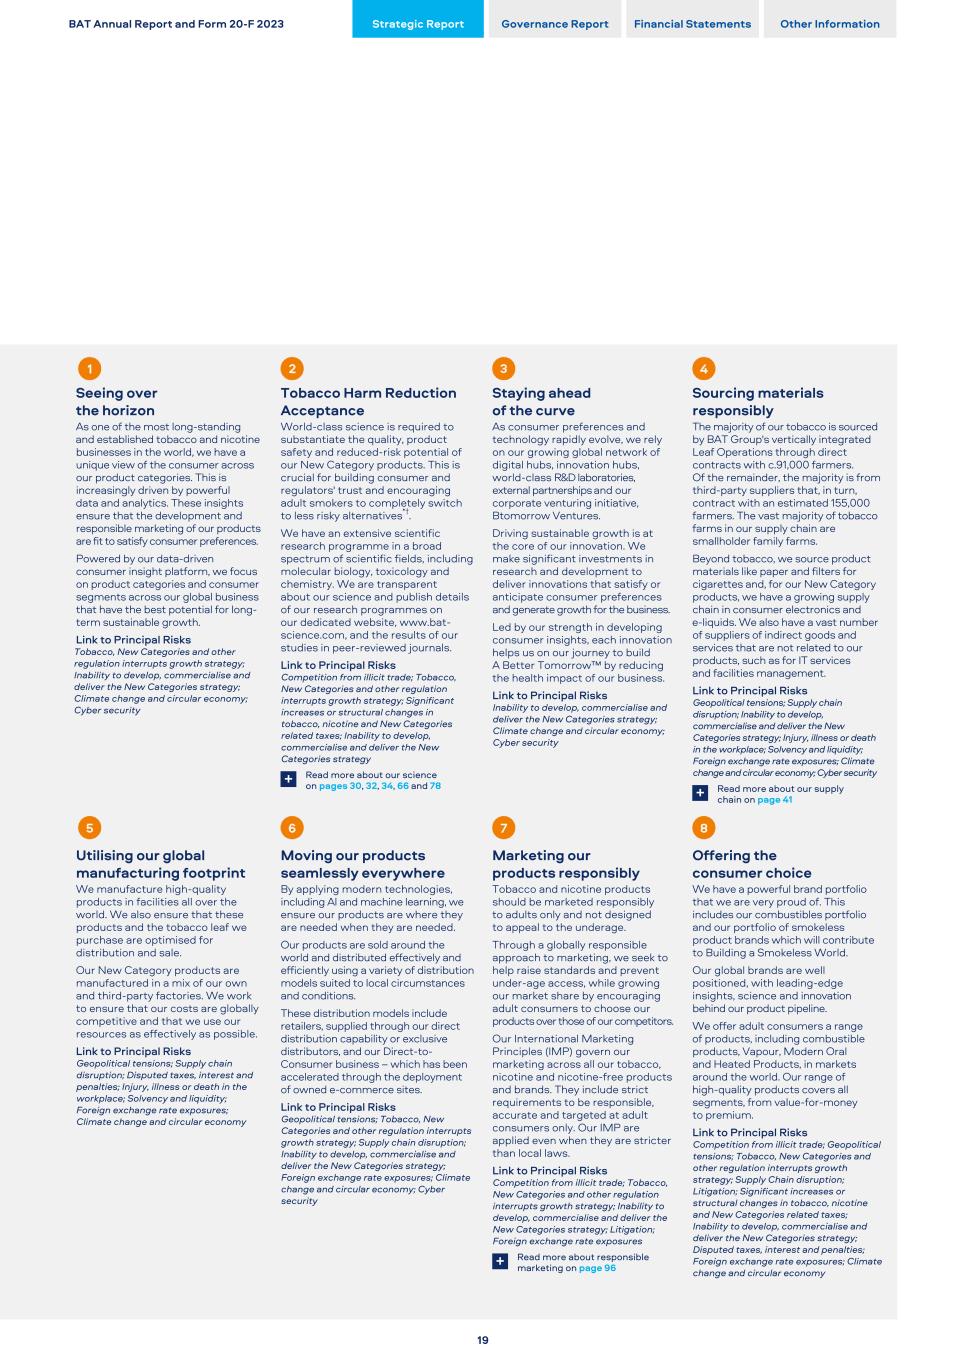
Seeing over the horizon As one of the most long-standing and established tobacco and nicotine businesses in the world, we have a unique view of the consumer across our product categories. This is increasingly driven by powerful data and analytics. These insights ensure that the development and responsible marketing of our products are fit to satisfy consumer preferences. Powered by our data-driven consumer insight platform, we focus on product categories and consumer segments across our global business that have the best potential for long- term sustainable growth. Link to Principal Risks Tobacco, New Categories and other regulation interrupts growth strategy; Inability to develop, commercialise and deliver the New Categories strategy; Climate change and circular economy; Cyber security Tobacco Harm Reduction Acceptance World-class science is required to substantiate the quality, product safety and reduced-risk potential of our New Category products. This is crucial for building consumer and regulators' trust and encouraging adult smokers to completely switch to less risky alternatives*†. We have an extensive scientific research programme in a broad spectrum of scientific fields, including molecular biology, toxicology and chemistry. We are transparent about our science and publish details of our research programmes on our dedicated website, www.bat- science.com, and the results of our studies in peer-reviewed journals. Link to Principal Risks Competition from illicit trade; Tobacco, New Categories and other regulation interrupts growth strategy; Significant increases or structural changes in tobacco, nicotine and New Categories related taxes; Inability to develop, commercialise and deliver the New Categories strategy Read more about our science on pages 30, 32, 34, 66 and 78+ Staying ahead of the curve As consumer preferences and technology rapidly evolve, we rely on our growing global network of digital hubs, innovation hubs, world-class R&D laboratories, external partnerships and our corporate venturing initiative, Btomorrow Ventures. Driving sustainable growth is at the core of our innovation. We make significant investments in research and development to deliver innovations that satisfy or anticipate consumer preferences and generate growth for the business. Led by our strength in developing consumer insights, each innovation helps us on our journey to build A Better Tomorrow™ by reducing the health impact of our business. Link to Principal Risks Inability to develop, commercialise and deliver the New Categories strategy; Climate change and circular economy; Cyber security Sourcing materials responsibly The majority of our tobacco is sourced by BAT Group's vertically integrated Leaf Operations through direct contracts with c.91,000 farmers. Of the remainder, the majority is from third-party suppliers that, in turn, contract with an estimated 155,000 farmers. The vast majority of tobacco farms in our supply chain are smallholder family farms. Beyond tobacco, we source product materials like paper and filters for cigarettes and, for our New Category products, we have a growing supply chain in consumer electronics and e-liquids. We also have a vast number of suppliers of indirect goods and services that are not related to our products, such as for IT services and facilities management. Link to Principal Risks Geopolitical tensions; Supply chain disruption; Inability to develop, commercialise and deliver the New Categories strategy; Injury, illness or death in the workplace; Solvency and liquidity; Foreign exchange rate exposures; Climate change and circular economy; Cyber security Read more about our supply chain on page 41+ Utilising our global manufacturing footprint We manufacture high-quality products in facilities all over the world. We also ensure that these products and the tobacco leaf we purchase are optimised for distribution and sale. Our New Category products are manufactured in a mix of our own and third-party factories. We work to ensure that our costs are globally competitive and that we use our resources as effectively as possible. Link to Principal Risks Geopolitical tensions; Supply chain disruption; Disputed taxes, interest and penalties; Injury, illness or death in the workplace; Solvency and liquidity; Foreign exchange rate exposures; Climate change and circular economy Moving our products seamlessly everywhere By applying modern technologies, including AI and machine learning, we ensure our products are where they are needed when they are needed. Our products are sold around the world and distributed effectively and efficiently using a variety of distribution models suited to local circumstances and conditions. These distribution models include retailers, supplied through our direct distribution capability or exclusive distributors, and our Direct-to- Consumer business – which has been accelerated through the deployment of owned e-commerce sites. Link to Principal Risks Geopolitical tensions; Tobacco, New Categories and other regulation interrupts growth strategy; Supply chain disruption; Inability to develop, commercialise and deliver the New Categories strategy; Foreign exchange rate exposures; Climate change and circular economy; Cyber security Marketing our products responsibly Tobacco and nicotine products should be marketed responsibly to adults only and not designed to appeal to the underage. Through a globally responsible approach to marketing, we seek to help raise standards and prevent under-age access, while growing our market share by encouraging adult consumers to choose our products over those of our competitors. Our International Marketing Principles (IMP) govern our marketing across all our tobacco, nicotine and nicotine-free products and brands. They include strict requirements to be responsible, accurate and targeted at adult consumers only. Our IMP are applied even when they are stricter than local laws. Link to Principal Risks Competition from illicit trade; Tobacco, New Categories and other regulation interrupts growth strategy; Inability to develop, commercialise and deliver the New Categories strategy; Litigation; Foreign exchange rate exposures Read more about responsible marketing on page 96+ Offering the consumer choice We have a powerful brand portfolio that we are very proud of. This includes our combustibles portfolio and our portfolio of smokeless product brands which will contribute to Building a Smokeless World. Our global brands are well positioned, with leading-edge insights, science and innovation behind our product pipeline. We offer adult consumers a range of products, including combustible products, Vapour, Modern Oral and Heated Products, in markets around the world. Our range of high-quality products covers all segments, from value-for-money to premium. Link to Principal Risks Competition from illicit trade; Geopolitical tensions; Tobacco, New Categories and other regulation interrupts growth strategy; Supply Chain disruption; Litigation; Significant increases or structural changes in tobacco, nicotine and New Categories related taxes; Inability to develop, commercialise and deliver the New Categories strategy; Disputed taxes, interest and penalties; Foreign exchange rate exposures; Climate change and circular economy BAT Annual Report and Form 20-F 2023 Strategic Report Governance Report Financial Statements Other Information 19
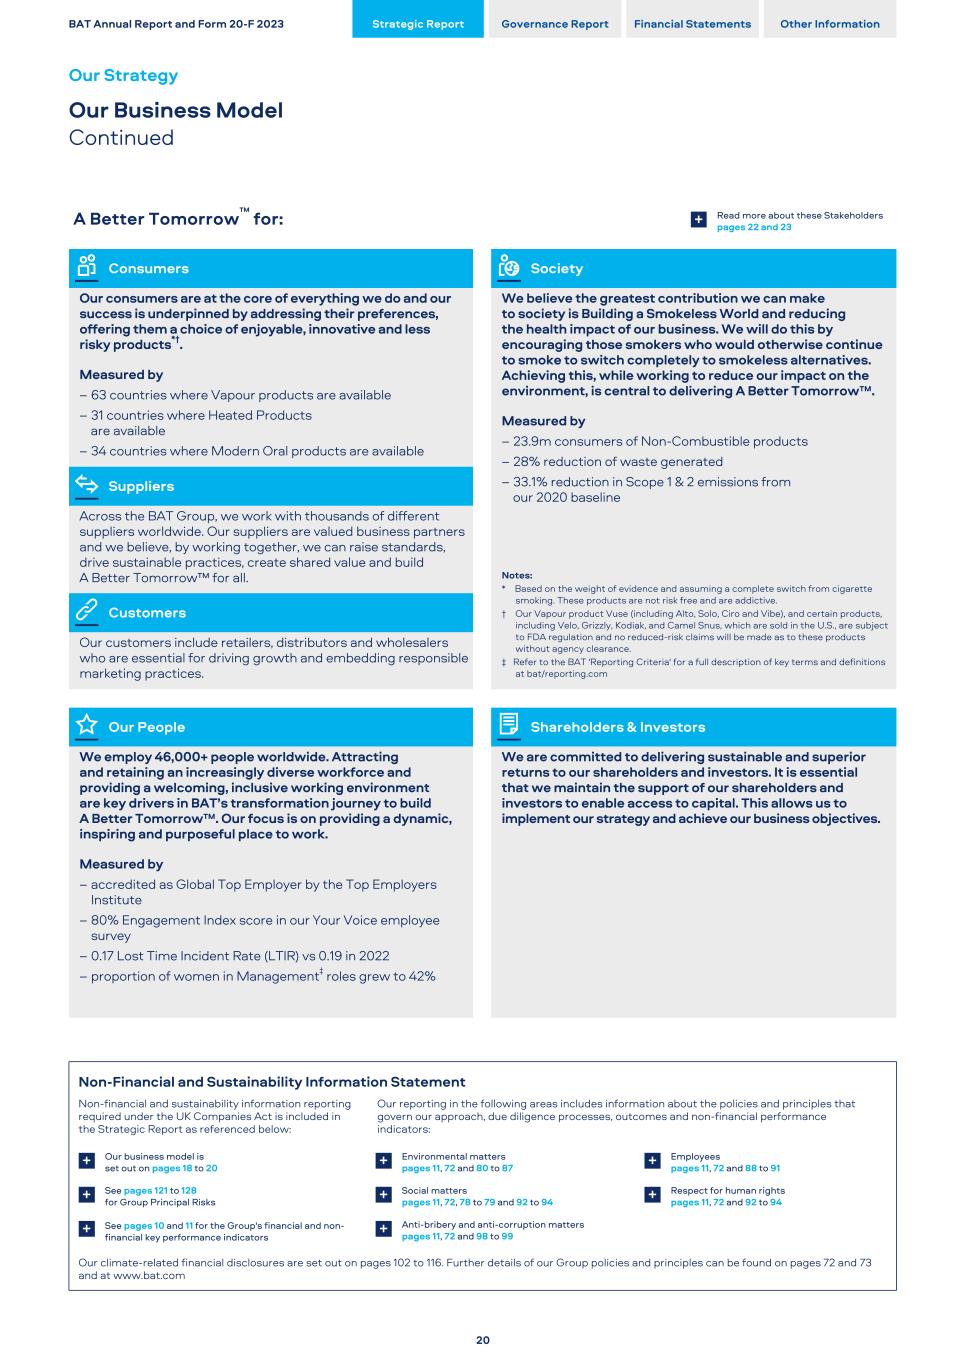
A Better Tomorrow™ for: Read more about these Stakeholders pages 22 and 23+ Consumers Society Our consumers are at the core of everything we do and our success is underpinned by addressing their preferences, offering them a choice of enjoyable, innovative and less risky products*†. Measured by – 63 countries where Vapour products are available – 31 countries where Heated Products are available – 34 countries where Modern Oral products are available We believe the greatest contribution we can make to society is Building a Smokeless World and reducing the health impact of our business. We will do this by encouraging those smokers who would otherwise continue to smoke to switch completely to smokeless alternatives. Achieving this, while working to reduce our impact on the environment, is central to delivering A Better Tomorrow™. Measured by – 23.9m consumers of Non-Combustible products – 28% reduction of waste generated – 33.1% reduction in Scope 1 & 2 emissions from our 2020 baseline Notes: * Based on the weight of evidence and assuming a complete switch from cigarette smoking. These products are not risk free and are addictive. † Our Vapour product Vuse (including Alto, Solo, Ciro and Vibe), and certain products, including Velo, Grizzly, Kodiak, and Camel Snus, which are sold in the U.S., are subject to FDA regulation and no reduced-risk claims will be made as to these products without agency clearance. ‡ Refer to the BAT 'Reporting Criteria' for a full description of key terms and definitions at bat/reporting.com Suppliers Across the BAT Group, we work with thousands of different suppliers worldwide. Our suppliers are valued business partners and we believe, by working together, we can raise standards, drive sustainable practices, create shared value and build A Better Tomorrow™ for all. Customers Our customers include retailers, distributors and wholesalers who are essential for driving growth and embedding responsible marketing practices. Our People Shareholders & Investors We employ 46,000+ people worldwide. Attracting and retaining an increasingly diverse workforce and providing a welcoming, inclusive working environment are key drivers in BAT’s transformation journey to build A Better Tomorrow™. Our focus is on providing a dynamic, inspiring and purposeful place to work. Measured by – accredited as Global Top Employer by the Top Employers Institute – 80% Engagement Index score in our Your Voice employee survey – 0.17 Lost Time Incident Rate (LTIR) vs 0.19 in 2022 – proportion of women in Management‡ roles grew to 42% We are committed to delivering sustainable and superior returns to our shareholders and investors. It is essential that we maintain the support of our shareholders and investors to enable access to capital. This allows us to implement our strategy and achieve our business objectives. Non-Financial and Sustainability Information Statement Non-financial and sustainability information reporting required under the UK Companies Act is included in the Strategic Report as referenced below: Our reporting in the following areas includes information about the policies and principles that govern our approach, due diligence processes, outcomes and non-financial performance indicators: Our business model is set out on pages 18 to 20 Environmental matters pages 11, 72 and 80 to 87 Employees pages 11, 72 and 88 to 91+ + + See pages 121 to 128 for Group Principal Risks Social matters pages 11, 72, 78 to 79 and 92 to 94 Respect for human rights pages 11, 72 and 92 to 94+ + + See pages 10 and 11 for the Group's financial and non- financial key performance indicators Anti-bribery and anti-corruption matters pages 11, 72 and 98 to 99+ + Our climate-related financial disclosures are set out on pages 102 to 116. Further details of our Group policies and principles can be found on pages 72 and 73 and at www.bat.com BAT Annual Report and Form 20-F 2023 Strategic Report Governance Report Financial Statements Other Information Our Strategy Our Business Model Continued 20

BAT Annual Report and Form 20-F 2023 Strategic Report Governance Report Financial Statements Other Information 21
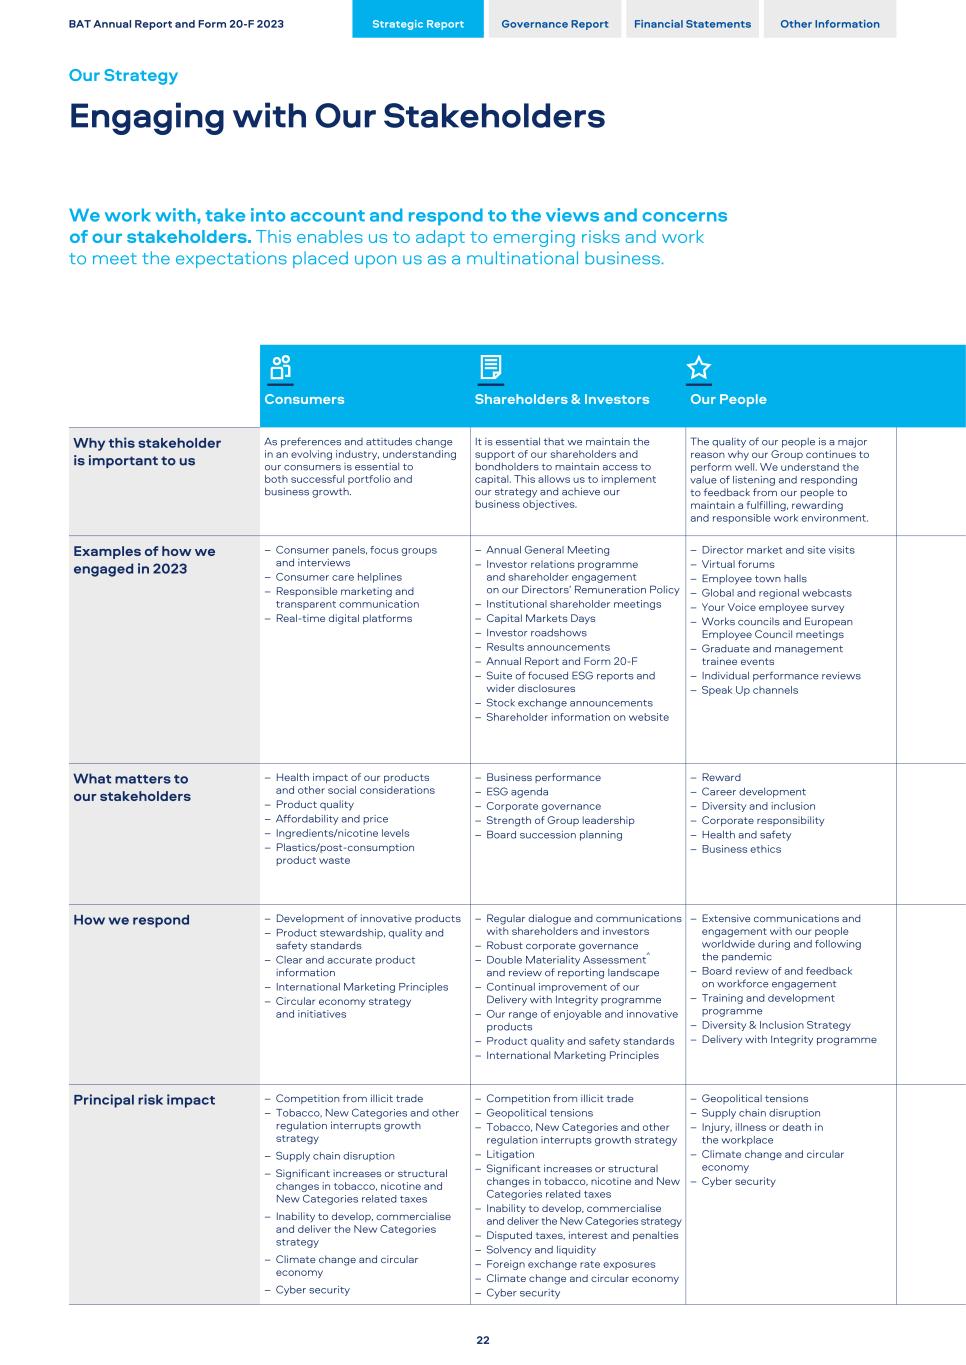
Consumers Shareholders & Investors Our People Why this stakeholder is important to us As preferences and attitudes change in an evolving industry, understanding our consumers is essential to both successful portfolio and business growth. It is essential that we maintain the support of our shareholders and bondholders to maintain access to capital. This allows us to implement our strategy and achieve our business objectives. The quality of our people is a major reason why our Group continues to perform well. We understand the value of listening and responding to feedback from our people to maintain a fulfilling, rewarding and responsible work environment. Examples of how we engaged in 2023 – Consumer panels, focus groups and interviews – Consumer care helplines – Responsible marketing and transparent communication – Real-time digital platforms – Annual General Meeting – Investor relations programme and shareholder engagement on our Directors’ Remuneration Policy – Institutional shareholder meetings – Capital Markets Days – Investor roadshows – Results announcements – Annual Report and Form 20-F – Suite of focused ESG reports and wider disclosures – Stock exchange announcements – Shareholder information on website – Director market and site visits – Virtual forums – Employee town halls – Global and regional webcasts – Your Voice employee survey – Works councils and European Employee Council meetings – Graduate and management trainee events – Individual performance reviews – Speak Up channels What matters to our stakeholders – Health impact of our products and other social considerations – Product quality – Affordability and price – Ingredients/nicotine levels – Plastics/post-consumption product waste – Business performance – ESG agenda – Corporate governance – Strength of Group leadership – Board succession planning – Reward – Career development – Diversity and inclusion – Corporate responsibility – Health and safety – Business ethics How we respond – Development of innovative products – Product stewardship, quality and safety standards – Clear and accurate product information – International Marketing Principles – Circular economy strategy and initiatives – Regular dialogue and communications with shareholders and investors – Robust corporate governance – Double Materiality Assessment^ and review of reporting landscape – Continual improvement of our Delivery with Integrity programme – Our range of enjoyable and innovative products – Product quality and safety standards – International Marketing Principles – Extensive communications and engagement with our people worldwide during and following the pandemic – Board review of and feedback on workforce engagement – Training and development programme – Diversity & Inclusion Strategy – Delivery with Integrity programme Principal risk impact – Competition from illicit trade – Tobacco, New Categories and other regulation interrupts growth strategy – Supply chain disruption – Significant increases or structural changes in tobacco, nicotine and New Categories related taxes – Inability to develop, commercialise and deliver the New Categories strategy – Climate change and circular economy – Cyber security – Competition from illicit trade – Geopolitical tensions – Tobacco, New Categories and other regulation interrupts growth strategy – Litigation – Significant increases or structural changes in tobacco, nicotine and New Categories related taxes – Inability to develop, commercialise and deliver the New Categories strategy – Disputed taxes, interest and penalties – Solvency and liquidity – Foreign exchange rate exposures – Climate change and circular economy – Cyber security – Geopolitical tensions – Supply chain disruption – Injury, illness or death in the workplace – Climate change and circular economy – Cyber security BAT Annual Report and Form 20-F 2023 Strategic Report Governance Report Financial Statements Other Information Our Strategy Engaging with Our Stakeholders We work with, take into account and respond to the views and concerns of our stakeholders. This enables us to adapt to emerging risks and work to meet the expectations placed upon us as a multinational business. 22
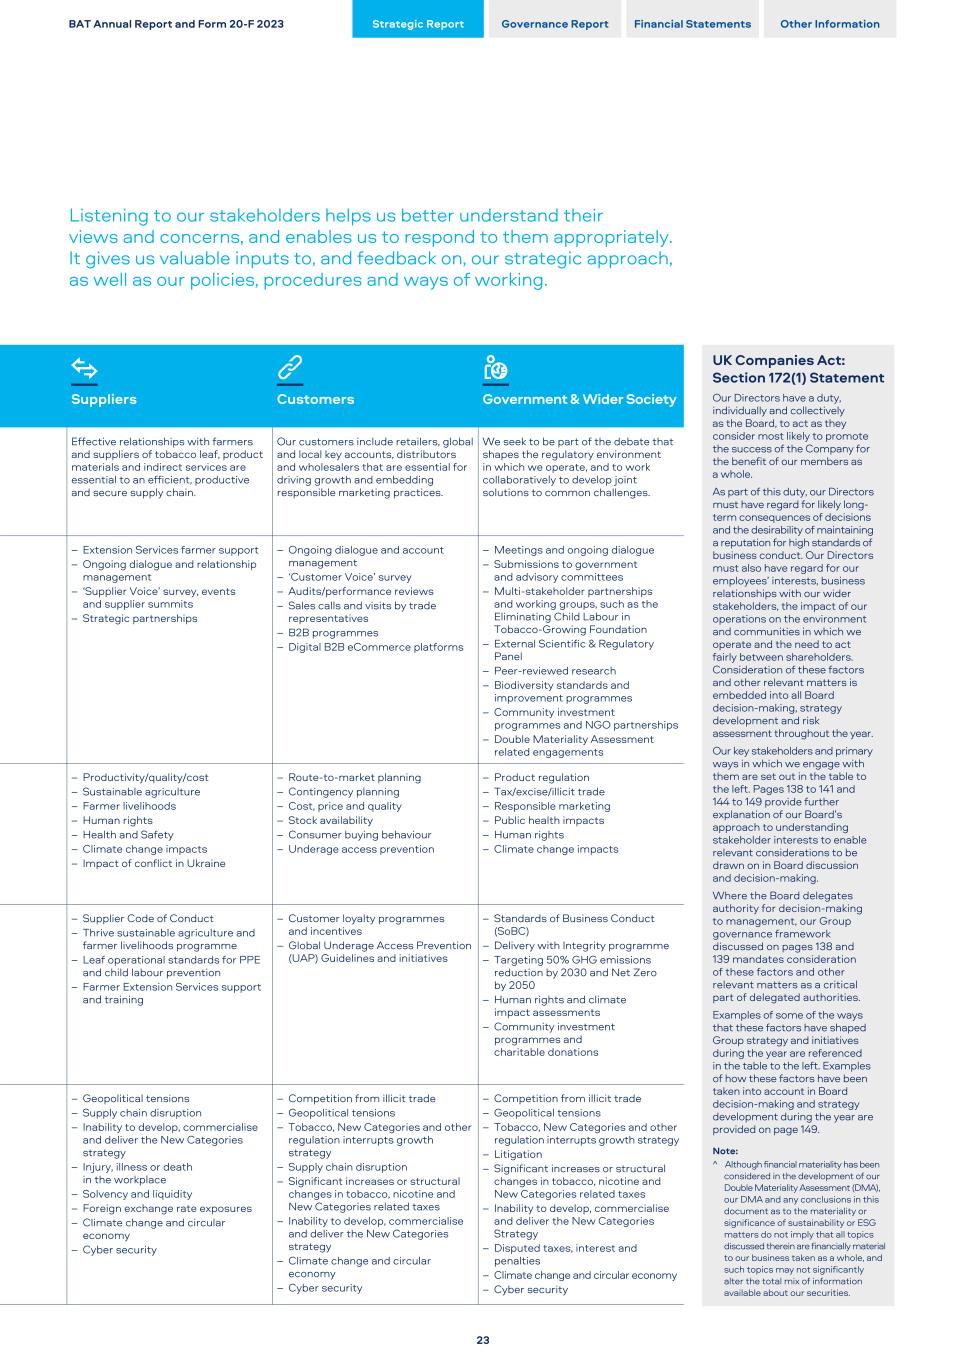
UK Companies Act: Section 172(1) Statement Suppliers Customers Government & Wider Society Our Directors have a duty, individually and collectively as the Board, to act as they consider most likely to promote the success of the Company for the benefit of our members as a whole. As part of this duty, our Directors must have regard for likely long- term consequences of decisions and the desirability of maintaining a reputation for high standards of business conduct. Our Directors must also have regard for our employees’ interests, business relationships with our wider stakeholders, the impact of our operations on the environment and communities in which we operate and the need to act fairly between shareholders. Consideration of these factors and other relevant matters is embedded into all Board decision-making, strategy development and risk assessment throughout the year. Our key stakeholders and primary ways in which we engage with them are set out in the table to the left. Pages 138 to 141 and 144 to 149 provide further explanation of our Board’s approach to understanding stakeholder interests to enable relevant considerations to be drawn on in Board discussion and decision-making. Where the Board delegates authority for decision-making to management, our Group governance framework discussed on pages 138 and 139 mandates consideration of these factors and other relevant matters as a critical part of delegated authorities. Examples of some of the ways that these factors have shaped Group strategy and initiatives during the year are referenced in the table to the left. Examples of how these factors have been taken into account in Board decision-making and strategy development during the year are provided on page 149. Note: ^ Although financial materiality has been considered in the development of our Double Materiality Assessment (DMA), our DMA and any conclusions in this document as to the materiality or significance of sustainability or ESG matters do not imply that all topics discussed therein are financially material to our business taken as a whole, and such topics may not significantly alter the total mix of information available about our securities. Effective relationships with farmers and suppliers of tobacco leaf, product materials and indirect services are essential to an efficient, productive and secure supply chain. Our customers include retailers, global and local key accounts, distributors and wholesalers that are essential for driving growth and embedding responsible marketing practices. We seek to be part of the debate that shapes the regulatory environment in which we operate, and to work collaboratively to develop joint solutions to common challenges. – Extension Services farmer support – Ongoing dialogue and relationship management – ‘Supplier Voice’ survey, events and supplier summits – Strategic partnerships – Ongoing dialogue and account management – ‘Customer Voice’ survey – Audits/performance reviews – Sales calls and visits by trade representatives – B2B programmes – Digital B2B eCommerce platforms – Meetings and ongoing dialogue – Submissions to government and advisory committees – Multi-stakeholder partnerships and working groups, such as the Eliminating Child Labour in Tobacco-Growing Foundation – External Scientific & Regulatory Panel – Peer-reviewed research – Biodiversity standards and improvement programmes – Community investment programmes and NGO partnerships – Double Materiality Assessment related engagements • Digital B2B eCommerce platforms– Productivity/quality/cost – Sustainable agriculture – Farmer livelihoods – Human rights – Health and Safety – Climate change impacts – Impact of conflict in Ukraine – Route-to-market planning – Contingency planning – Cost, price and quality – Stock availability – Consumer buying behaviour – Underage access prevention – Product regulation – Tax/excise/illicit trade – Responsible marketing – Public health impacts – Human rights – Climate change impacts – Supplier Code of Conduct – Thrive sustainable agriculture and farmer livelihoods programme – Leaf operational standards for PPE and child labour prevention – Farmer Extension Services support and training – Customer loyalty programmes and incentives – Global Underage Access Prevention (UAP) Guidelines and initiatives – Standards of Business Conduct (SoBC) – Delivery with Integrity programme – Targeting 50% GHG emissions reduction by 2030 and Net Zero by 2050 – Human rights and climate impact assessments – Community investment programmes and charitable donations – Geopolitical tensions – Supply chain disruption – Inability to develop, commercialise and deliver the New Categories strategy – Injury, illness or death in the workplace – Solvency and liquidity – Foreign exchange rate exposures – Climate change and circular economy – Cyber security – Competition from illicit trade – Geopolitical tensions – Tobacco, New Categories and other regulation interrupts growth strategy – Supply chain disruption – Significant increases or structural changes in tobacco, nicotine and New Categories related taxes – Inability to develop, commercialise and deliver the New Categories strategy – Climate change and circular economy – Cyber security – Competition from illicit trade – Geopolitical tensions – Tobacco, New Categories and other regulation interrupts growth strategy – Litigation – Significant increases or structural changes in tobacco, nicotine and New Categories related taxes – Inability to develop, commercialise and deliver the New Categories Strategy – Disputed taxes, interest and penalties – Climate change and circular economy – Cyber security BAT Annual Report and Form 20-F 2023 Strategic Report Governance Report Financial Statements Other Information Listening to our stakeholders helps us better understand their views and concerns, and enables us to respond to them appropriately. It gives us valuable inputs to, and feedback on, our strategic approach, as well as our policies, procedures and ways of working. 23
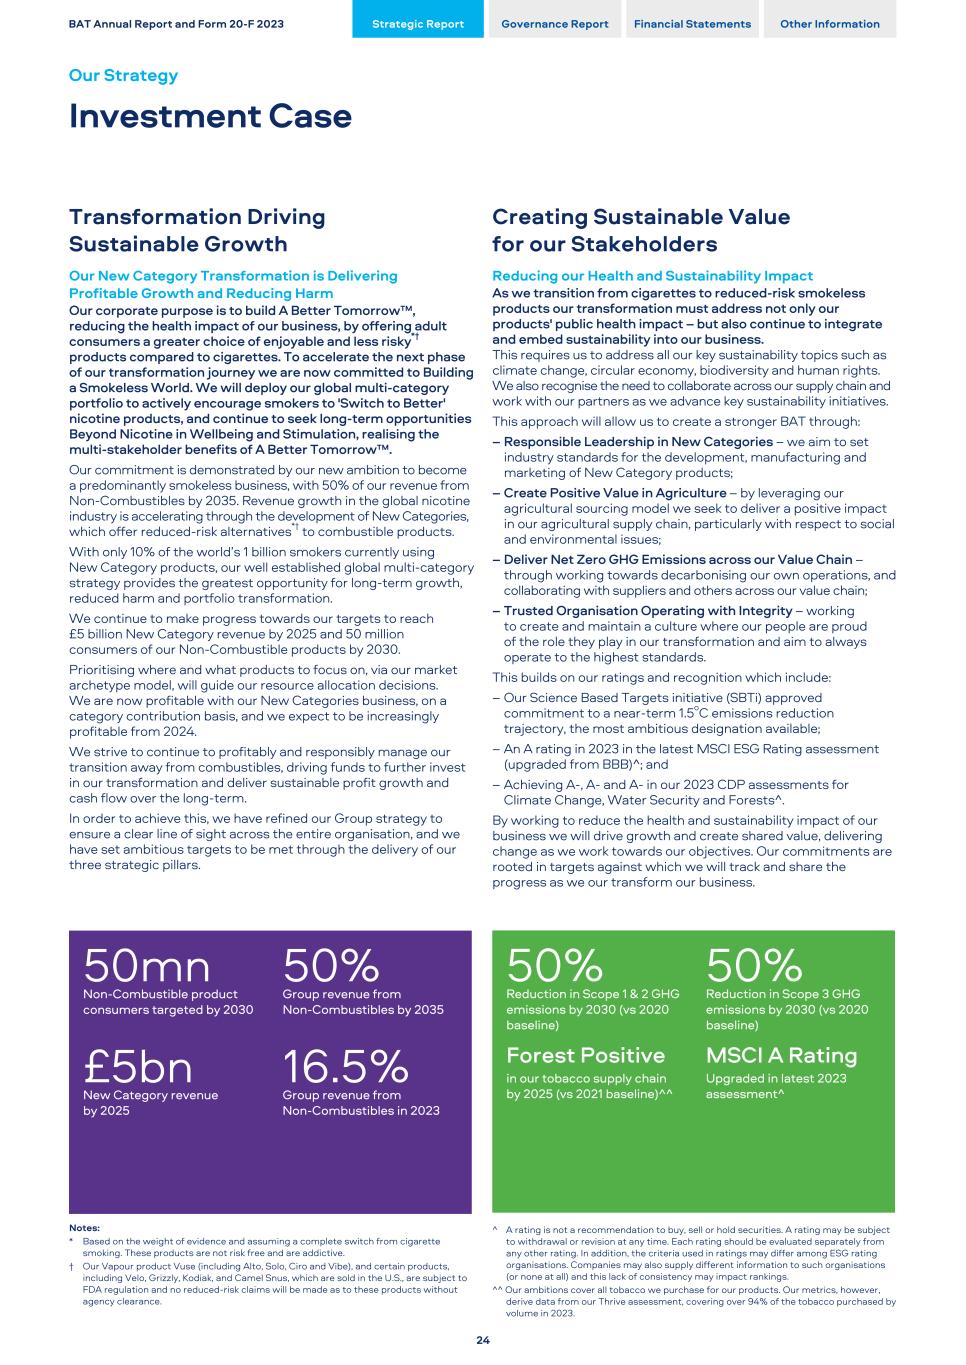
Transformation Driving Sustainable Growth Our New Category Transformation is Delivering Profitable Growth and Reducing Harm Our corporate purpose is to build A Better Tomorrow™, reducing the health impact of our business, by offering adult consumers a greater choice of enjoyable and less risky*† products compared to cigarettes. To accelerate the next phase of our transformation journey we are now committed to Building a Smokeless World. We will deploy our global multi-category portfolio to actively encourage smokers to 'Switch to Better' nicotine products, and continue to seek long-term opportunities Beyond Nicotine in Wellbeing and Stimulation, realising the multi-stakeholder benefits of A Better Tomorrow™. Our commitment is demonstrated by our new ambition to become a predominantly smokeless business, with 50% of our revenue from Non-Combustibles by 2035. Revenue growth in the global nicotine industry is accelerating through the development of New Categories, which offer reduced-risk alternatives*† to combustible products. With only 10% of the world’s 1 billion smokers currently using New Category products, our well established global multi-category strategy provides the greatest opportunity for long-term growth, reduced harm and portfolio transformation. We continue to make progress towards our targets to reach £5 billion New Category revenue by 2025 and 50 million consumers of our Non-Combustible products by 2030. Prioritising where and what products to focus on, via our market archetype model, will guide our resource allocation decisions. We are now profitable with our New Categories business, on a category contribution basis, and we expect to be increasingly profitable from 2024. We strive to continue to profitably and responsibly manage our transition away from combustibles, driving funds to further invest in our transformation and deliver sustainable profit growth and cash flow over the long-term. In order to achieve this, we have refined our Group strategy to ensure a clear line of sight across the entire organisation, and we have set ambitious targets to be met through the delivery of our three strategic pillars. 50mn Non-Combustible product consumers targeted by 2030 50% Group revenue from Non-Combustibles by 2035 £5bn New Category revenue by 2025 16.5% Group revenue from Non-Combustibles in 2023 Notes: * Based on the weight of evidence and assuming a complete switch from cigarette smoking. These products are not risk free and are addictive. † Our Vapour product Vuse (including Alto, Solo, Ciro and Vibe), and certain products, including Velo, Grizzly, Kodiak, and Camel Snus, which are sold in the U.S., are subject to FDA regulation and no reduced-risk claims will be made as to these products without agency clearance. Creating Sustainable Value for our Stakeholders Reducing our Health and Sustainability Impact As we transition from cigarettes to reduced-risk smokeless products our transformation must address not only our products' public health impact – but also continue to integrate and embed sustainability into our business. This requires us to address all our key sustainability topics such as climate change, circular economy, biodiversity and human rights. We also recognise the need to collaborate across our supply chain and work with our partners as we advance key sustainability initiatives. This approach will allow us to create a stronger BAT through: – Responsible Leadership in New Categories – we aim to set industry standards for the development, manufacturing and marketing of New Category products; – Create Positive Value in Agriculture – by leveraging our agricultural sourcing model we seek to deliver a positive impact in our agricultural supply chain, particularly with respect to social and environmental issues; – Deliver Net Zero GHG Emissions across our Value Chain – through working towards decarbonising our own operations, and collaborating with suppliers and others across our value chain; – Trusted Organisation Operating with Integrity – working to create and maintain a culture where our people are proud of the role they play in our transformation and aim to always operate to the highest standards. This builds on our ratings and recognition which include: – Our Science Based Targets initiative (SBTi) approved commitment to a near-term 1.5oC emissions reduction trajectory, the most ambitious designation available; – An A rating in 2023 in the latest MSCI ESG Rating assessment (upgraded from BBB)^; and – Achieving A-, A- and A- in our 2023 CDP assessments for Climate Change, Water Security and Forests^. By working to reduce the health and sustainability impact of our business we will drive growth and create shared value, delivering change as we work towards our objectives. Our commitments are rooted in targets against which we will track and share the progress as we our transform our business. 50% Reduction in Scope 1 & 2 GHG emissions by 2030 (vs 2020 baseline) 50% Reduction in Scope 3 GHG emissions by 2030 (vs 2020 baseline) Forest Positive in our tobacco supply chain by 2025 (vs 2021 baseline)^^ MSCI A Rating Upgraded in latest 2023 assessment^ ^ A rating is not a recommendation to buy, sell or hold securities. A rating may be subject to withdrawal or revision at any time. Each rating should be evaluated separately from any other rating. In addition, the criteria used in ratings may differ among ESG rating organisations. Companies may also supply different information to such organisations (or none at all) and this lack of consistency may impact rankings. ^^ Our ambitions cover all tobacco we purchase for our products. Our metrics, however, derive data from our Thrive assessment, covering over 94% of the tobacco purchased by volume in 2023. BAT Annual Report and Form 20-F 2023 Strategic Report Governance Report Financial Statements Other Information Our Strategy Investment Case 24
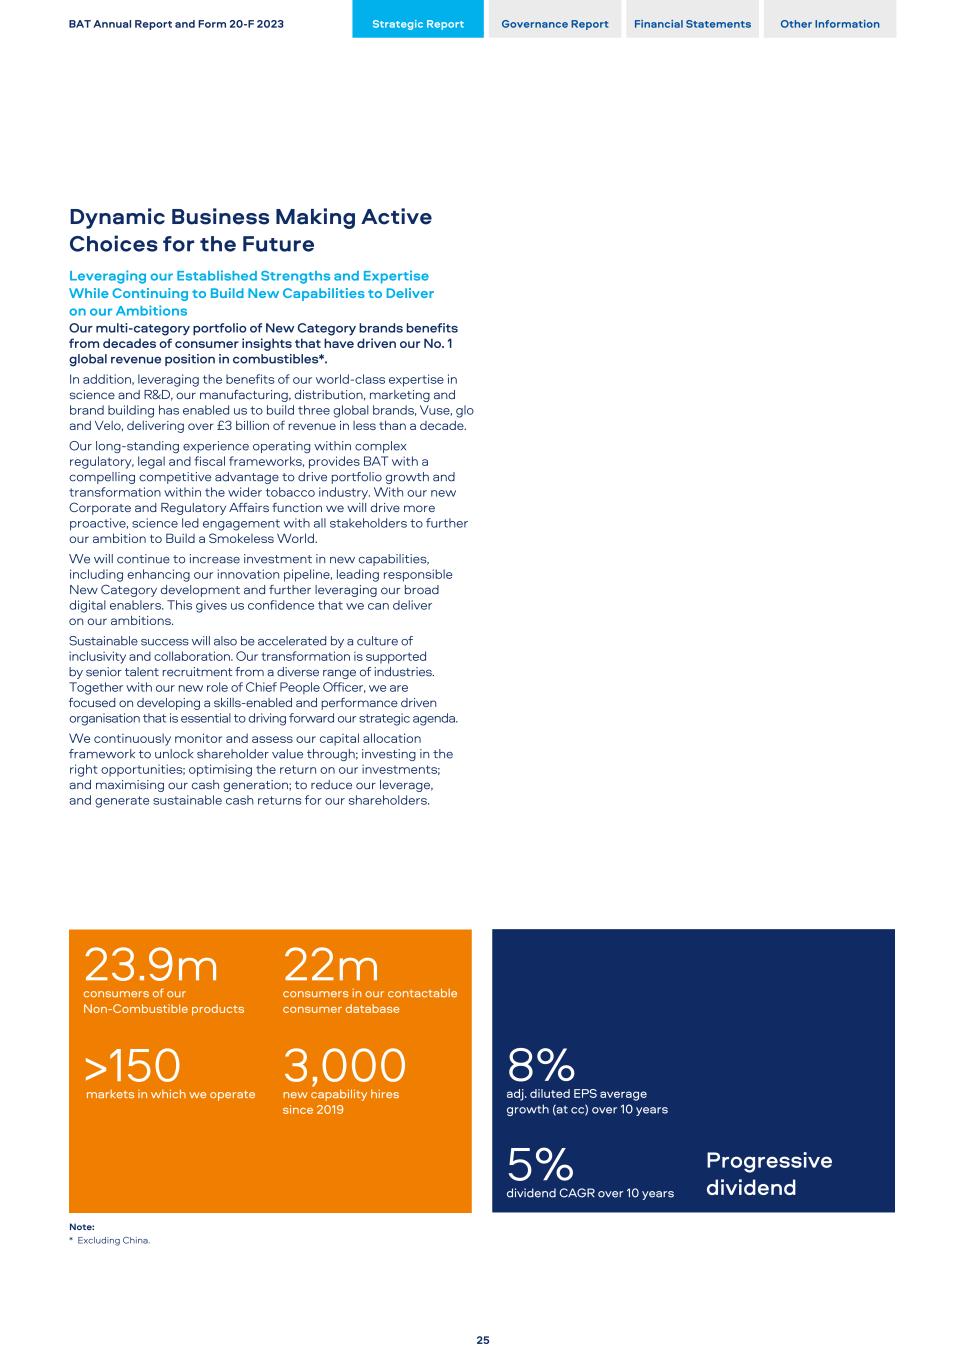
Dynamic Business Making Active Choices for the Future Leveraging our Established Strengths and Expertise While Continuing to Build New Capabilities to Deliver on our Ambitions Our multi-category portfolio of New Category brands benefits from decades of consumer insights that have driven our No. 1 global revenue position in combustibles*. In addition, leveraging the benefits of our world-class expertise in science and R&D, our manufacturing, distribution, marketing and brand building has enabled us to build three global brands, Vuse, glo and Velo, delivering over £3 billion of revenue in less than a decade. Our long-standing experience operating within complex regulatory, legal and fiscal frameworks, provides BAT with a compelling competitive advantage to drive portfolio growth and transformation within the wider tobacco industry. With our new Corporate and Regulatory Affairs function we will drive more proactive, science led engagement with all stakeholders to further our ambition to Build a Smokeless World. We will continue to increase investment in new capabilities, including enhancing our innovation pipeline, leading responsible New Category development and further leveraging our broad digital enablers. This gives us confidence that we can deliver on our ambitions. Sustainable success will also be accelerated by a culture of inclusivity and collaboration. Our transformation is supported by senior talent recruitment from a diverse range of industries. Together with our new role of Chief People Officer, we are focused on developing a skills-enabled and performance driven organisation that is essential to driving forward our strategic agenda. We continuously monitor and assess our capital allocation framework to unlock shareholder value through; investing in the right opportunities; optimising the return on our investments; and maximising our cash generation; to reduce our leverage, and generate sustainable cash returns for our shareholders. 23.9m consumers of our Non-Combustible products 22m consumers in our contactable consumer database >150 markets in which we operate 3,000 new capability hires since 2019 Note: * Excluding China. 8% adj. diluted EPS average growth (at cc) over 10 years 5% dividend CAGR over 10 years Progressive dividend BAT Annual Report and Form 20-F 2023 Strategic Report Governance Report Financial Statements Other Information 25
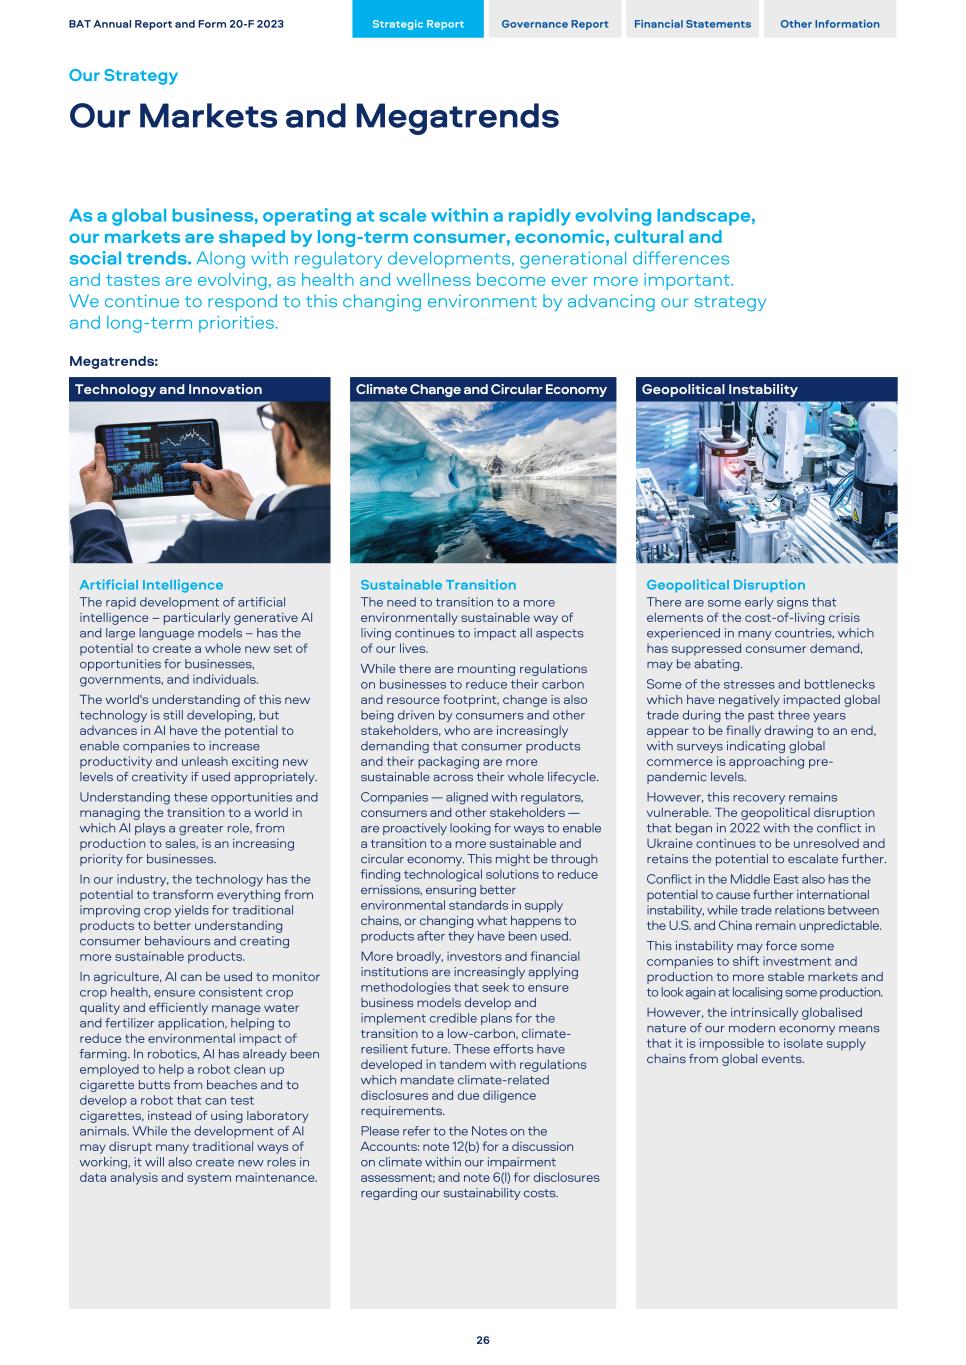
As a global business, operating at scale within a rapidly evolving landscape, our markets are shaped by long-term consumer, economic, cultural and social trends. Along with regulatory developments, generational differences and tastes are evolving, as health and wellness become ever more important. We continue to respond to this changing environment by advancing our strategy and long-term priorities. Megatrends: Technology and Innovation Climate Change and Circular Economy Geopolitical Instability Artificial Intelligence The rapid development of artificial intelligence – particularly generative AI and large language models – has the potential to create a whole new set of opportunities for businesses, governments, and individuals. The world's understanding of this new technology is still developing, but advances in AI have the potential to enable companies to increase productivity and unleash exciting new levels of creativity if used appropriately. Understanding these opportunities and managing the transition to a world in which AI plays a greater role, from production to sales, is an increasing priority for businesses. In our industry, the technology has the potential to transform everything from improving crop yields for traditional products to better understanding consumer behaviours and creating more sustainable products. In agriculture, AI can be used to monitor crop health, ensure consistent crop quality and efficiently manage water and fertilizer application, helping to reduce the environmental impact of farming. In robotics, AI has already been employed to help a robot clean up cigarette butts from beaches and to develop a robot that can test cigarettes, instead of using laboratory animals. While the development of AI may disrupt many traditional ways of working, it will also create new roles in data analysis and system maintenance. Sustainable Transition The need to transition to a more environmentally sustainable way of living continues to impact all aspects of our lives. While there are mounting regulations on businesses to reduce their carbon and resource footprint, change is also being driven by consumers and other stakeholders, who are increasingly demanding that consumer products and their packaging are more sustainable across their whole lifecycle. Companies — aligned with regulators, consumers and other stakeholders — are proactively looking for ways to enable a transition to a more sustainable and circular economy. This might be through finding technological solutions to reduce emissions, ensuring better environmental standards in supply chains, or changing what happens to products after they have been used. More broadly, investors and financial institutions are increasingly applying methodologies that seek to ensure business models develop and implement credible plans for the transition to a low-carbon, climate- resilient future. These efforts have developed in tandem with regulations which mandate climate-related disclosures and due diligence requirements. Please refer to the Notes on the Accounts: note 12(b) for a discussion on climate within our impairment assessment; and note 6(l) for disclosures regarding our sustainability costs. Geopolitical Disruption There are some early signs that elements of the cost-of-living crisis experienced in many countries, which has suppressed consumer demand, may be abating. Some of the stresses and bottlenecks which have negatively impacted global trade during the past three years appear to be finally drawing to an end, with surveys indicating global commerce is approaching pre- pandemic levels. However, this recovery remains vulnerable. The geopolitical disruption that began in 2022 with the conflict in Ukraine continues to be unresolved and retains the potential to escalate further. Conflict in the Middle East also has the potential to cause further international instability, while trade relations between the U.S. and China remain unpredictable. This instability may force some companies to shift investment and production to more stable markets and to look again at localising some production. However, the intrinsically globalised nature of our modern economy means that it is impossible to isolate supply chains from global events. BAT Annual Report and Form 20-F 2023 Strategic Report Governance Report Financial Statements Other Information Our Strategy Our Markets and Megatrends 26
Overview The modern tobacco and nicotine market is continuing to evolve at a rapid rate. New and less risky nicotine products*† are being developed and launched each year which, alongside traditional tobacco products, meet the needs of more than a billion consumers worldwide. Global Market for Combustibles and Non-Combustibles The most recent sales data for the legal global tobacco and nicotine market indicated that it was worth approximately US$935 billion. Combustible cigarettes remained the largest product category within the market, with a global value of US$779 billion (excl. China), representing 84% of the total value of tobacco and nicotine product sales worldwide. Roughly 2.8 trillion cigarettes were sold in 2022. The value of the global Non-Combustible products market continues to grow, standing at US$68 billion. Furthermore, despite combustibles being one of the most highly regulated products in the world, roughly 17% of the world’s adult population (including China) continue to choose to smoke. This very sizable group is likely to continue to smoke unless they are offered suitable Non- Combustible alternatives. The illicit market The illicit tobacco market has continued to increase in the years after the pandemic, reaching just under 12% of total global volume in 2022 (excl. China), up from 11.4% in 2021. Exacerbated by the recent increased cost of living in many countries, overall illicit volumes are expected to approach an unprecedented 14% of all sales by 2027. Illicit trade exists in all regions of the world, but its growth is forecast to worsen in the Middle East and Africa, Australasia and Asia Pacific. Global combustible regulation Combustible tobacco products are among the most highly regulated consumer products in the world. In recent decades, legislators have focused on demand-side measures, such as plain packaging, product-specific regulations, tougher restrictions on smoking in public places, bans on shops displaying tobacco products at the point of sale and restrictions on flavourings in tobacco. More recently, countries have begun committing to smoke-free targets and policies, setting a date by which they expect to reduce or contain the prevalence of tobacco use to less than 5%. See pages 121 to 128 to read more about our Group Principal Risks+ For further discussion regarding the regulation of our business, please see pages 375 to 379+ The European Union has set a target of a 'Tobacco-free Generation' by 2040, for example. A small number of countries have also examined stronger prohibitionist approaches to stop smoking among younger generations. For example, the UK has begun examining proposals to ban sales of cigarettes to anyone born after 2008. New Zealand passed legislation last year (the first of its kind) to implement such a proposal, however this proposal is now likely to be discontinued after the election of a new Government. The Malaysian Government had also considered similar plans before concluding they could be unconstitutional. Significantly, in most cases, end-game measures have focused on combustible tobacco, excluding reduced-risk nicotine products. Lastly, environmental concerns have led to an increased number of policy initiatives aimed at combustibles. The EU’s Single-Use Plastics legislation requires Member States to introduce extended producer responsibility schemes for, amongst other things, cigarette filters. The United Nations is also examining a potential world-first global Plastics Treaty, which certain stakeholders are arguing should contain targets for Member States to eliminate waste from cigarettes (as well as from single-use vapour product consumption). Global New Categories Market Technology and innovation continue to revolutionise the nicotine market. Smokeless alternatives offer consumers less risky*† but satisfying alternatives to cigarettes by delivering nicotine without the process of combusting tobacco. These products are increasingly popular among smokers who do not want to give up nicotine consumption but desire alternatives to smoking. This year, we have added herbal heated products to our offering, providing adult nicotine users and smokers with another reduced-risk*† option which is also tobacco-free. Cigarettes are projected to see a total volume decline of 8% over the 2022-2027 period. Alongside societal changes in attitudes to smoking, this decrease is driven by consumer preferences shifting to reduced- risk products*† (RRPs), which are forecast to make up an increasing percentage of revenue for the nicotine market. The most recent external estimates value the Vapour product market at US$19 billion, with THPs valued at US$32 billion. Closed- system vapour products have become rapidly popular among consumers, owing to their ease of use. Nicotine pouches, which are one of the newer innovations in RRPs*†, currently have a global value of US$8.4 billion in 2022 (led by the U.S.), which is projected to grow to just under US$16 billion by 2027. New Categories regulations Globally, though these products are becoming established in many markets, there remains considerable divergence between countries on how to regulate RRPs*†. The positive role they can play in reducing the harms of smoking has been embraced by regulators in the UK, New Zealand and Canada, which have sought to communicate to consumers that RRPs are better alternatives*† to smoking and have regulated these products accordingly, while at the same time being mindful of the need to prevent usage by youth. Other markets are yet to be convinced of the potential public health benefits of RRPs*† and have sought instead to limit access to them, for example Australia and India, where sales of RRPs*† are effectively banned. Some markets have also inadvertently confused nicotine consumers by regulating RRPs in a similar way to combustibles. An example of this was the European Union’s recent extension of a ban on characterising flavours originally intended for cigarettes to encompass Tobacco Heated Products. Concerns have been raised about youth use of certain RRPs*† in some countries; these can be addressed without denying them to potential quitters by using on- device technology and better enforcement of existing measures to ensure the products are accessible only to adults. It is increasingly important that this debate is better understood, particularly in influential international forums, so that large numbers of smokers are not discouraged from switching to these products. Beyond Nicotine The Wellbeing & Stimulation category, covering products for consumers that are seeking products that help them manage their daily wellbeing, is expected to grow to £495 billion by 2030, from around £296 billion today. The adult-use cannabis market has also grown to an estimated US$21 billion. Though this growth is predominantly concentrated in the U.S., the market is expected to grow further internationally as more countries, such as Germany and the Czech Republic, re-examine the merits of maintaining their current prohibitionist stances on cannabis. Notes: All data sources on this page are from Euromonitor International research published in 2023 and based on 2022 data (the latest full year available), unless otherwise stated. * Based on the weight of evidence and assuming a complete switch from cigarette smoking. These products are not risk free and are addictive. † Our Vapour product Vuse (including Alto, Solo, Ciro and Vibe), and certain products including Velo, Grizzly, Kodiak, and Camel Snus, which are sold in the U.S., are subject to FDA regulation and no reduced-risk claims will be made as to these products without agency clearance. BAT Annual Report and Form 20-F 2023 Strategic Report Governance Report Financial Statements Other Information 27
Quality Growth Delivering Quality Growth emphasises the transition to a more balanced focus on top-line and bottom- line delivery, centred around our brands and innovation, and continuing to seek long-term opportunities Beyond Nicotine. The key building blocks of the Quality Growth pillar are: Inspiring New Category Innovations & Brands Managed Combustibles Transition Beyond Nicotine Foundations Our commitments under Quality Growth: Progressing toward quality, margin- accretive growth in smokeless FMC volume decline but expecting continued value delivery Sensibly investing for the future Beyond Nicotine Inspiring New Category Innovations & Brands We have established an important New Categories ‘bridgehead’ which underpins our transformation. We have built a fast- growing New Categories business of smokeless products in a short period of time with New Categories annual revenue now exceeding £3.3 billion. Greater scale and related focus on cost of goods sold (COGS) has enabled significant reduction in New Categories losses in 2022 and 2023 and our New Categories are profitable (at a category contribution level) two years ahead of our original target. Our focus on driving revenue growth and margin expansion will continue. Building on our deep cross-category consumer insights, we will deliver an enhanced innovation pipeline, by further investing in our people, our science, our IP and our capabilities, driving an innovation-focused culture. We will further leverage our centres of excellence in Southampton, Trieste and Shenzhen to access wider internal and external strategic partnerships focused on developing consumer-relevant premium propositions. Three New Category product types underpin our efforts to Build A Smokeless World: Vapour Our global Vapour brand, Vuse, plays a major role in providing smokers with the opportunity to Switch to Better. In 2023, consumer acquisition was up 1.5 million, reaching 11.5 million. Vuse is the #1 brand in the Vapour category and, in 2023, delivered £1.8 billion of revenue. The successful launch of our single-use Vapour product, Vuse Go, enabled Vuse to maintain leadership of the Vapour category and achieve 26.2% revenue growth in 2023. For more information on our Vapour Products see page 30+ Heated Products Our Heated Product brand, glo, saw consumer acquisition increase by 0.8 million. In 2023, reaching 8.0 million. It has also been a contributor to New Categories revenue growth. However, its growth momentum has been impacted by competitor innovation and intensified activity in the below-weighted average price segment. While glo's performance has not met our expectations, we are strengthening the glo innovation pipeline. Hyper Pro will enable a comprehensive system upgrade and veo, our non-tobacco heated platform consumables, is ready for a post-flavour ban environment in Europe. For more information on our Heated Products see page 32+ Modern Oral Modern Oral products are different from inhalable products like Vapour or Heated Products. Modern Oral products come in the form of tobacco-free nicotine pouches that are placed under the lip so that nicotine can be effectively absorbed. There are exciting opportunities for these products in markets with established oral nicotine consumption and beyond, including in emerging markets. In 2023, Velo maintained its leadership outside of the U.S. despite intensified competition in the Nordics and delivered total Group revenue growth of 35%. For more information on our Modern Oral products see page 34+ Driving progress To drive quality growth and transform faster, we will focus our resources on combining powerful innovations and world-leading brands. To deliver an ‘innovation step change’, we will continue to utilise powerful consumer foresights and their application to leap-frog innovation thinking to drive innovations that appeal to adult consumers. We will further strengthen and differentiate our New Categories brands to profitably accelerate our New Categories business and achieve significant scale in order to help Build a Smokeless World. Global Patent Settlement with PMI As previously announced, BAT has reached a global settlement with Philip Morris International Inc. (PMI) that resolves all ongoing patent infringement litigation between the parties related to our HP and Vapour products. For more information, please see page 380. Managed Combustibles Transition We are committed to becoming a predominantly smokeless business, with a target to reach 50% of our revenue from Non-Combustibles by 2035. The best choice any adult smoker can make will always be quitting combustible tobacco products completely. Yet many do not. With only 10% of the world’s one billion smokers currently using New Category products, the long-term opportunity for growth as we deliver on our transformation is vast. The continued performance of our combustibles business is key to delivering Quality Growth and generating the funds necessary to invest in New Categories and Build a Smokeless World. Our aim is for the combustibles business to deliver sustainable revenue, gross margin and category contribution growth. Sustainable pricing, digital integration and Revenue Growth Management play a key role in delivering revenue growth. A product transformation programme is underway to enable a simpler and rationalised product portfolio to enable gross margin growth. BAT Annual Report and Form 20-F 2023 Strategic Report Governance Report Financial Statements Other Information Quality Growth Strategic Pillar Overview 28
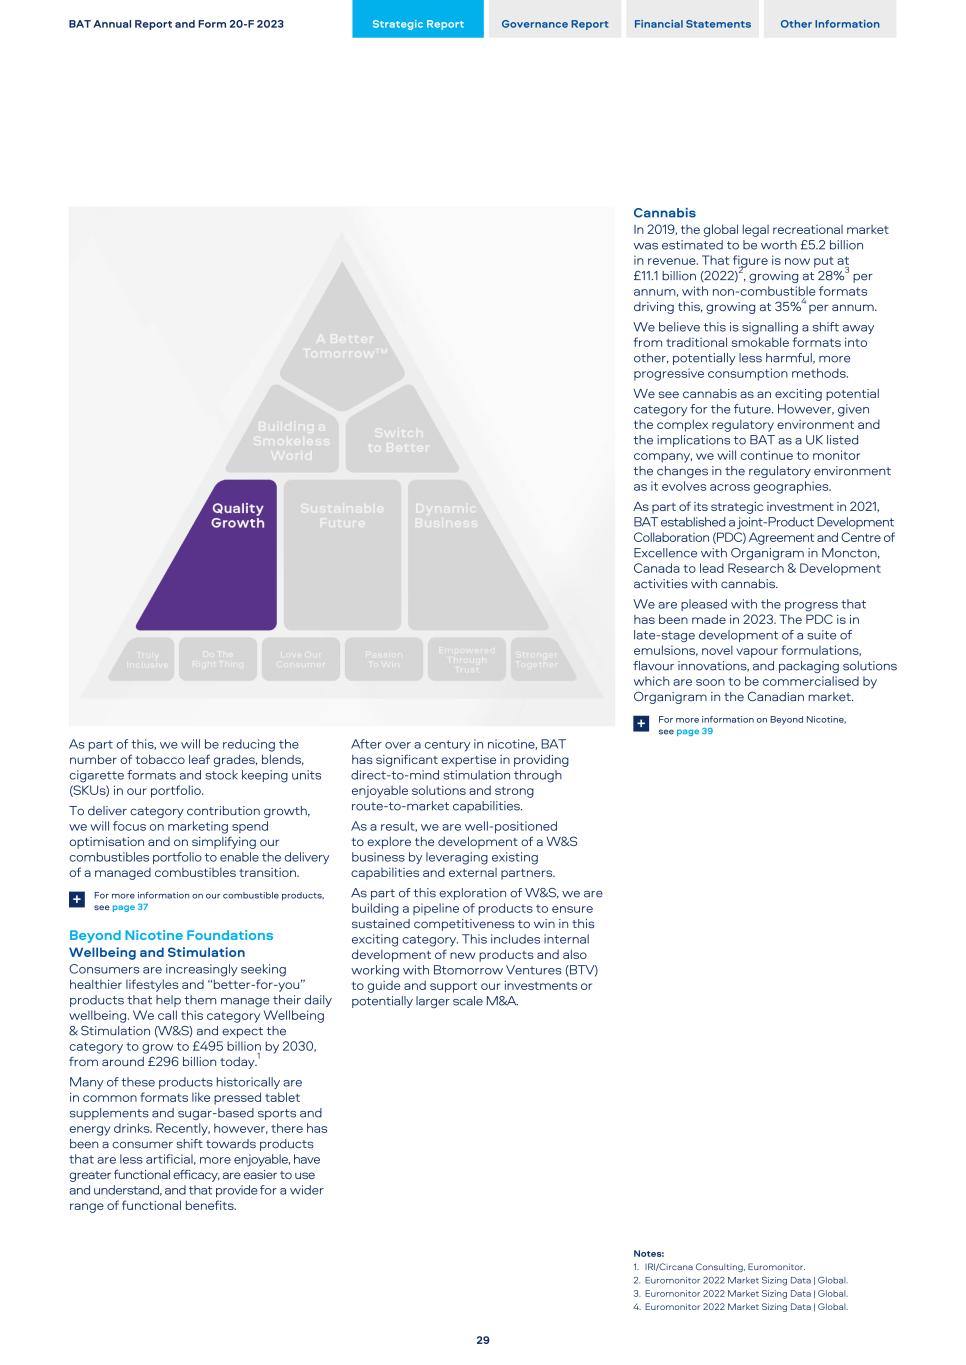
As part of this, we will be reducing the number of tobacco leaf grades, blends, cigarette formats and stock keeping units (SKUs) in our portfolio. To deliver category contribution growth, we will focus on marketing spend optimisation and on simplifying our combustibles portfolio to enable the delivery of a managed combustibles transition. For more information on our combustible products, see page 37+ Beyond Nicotine Foundations Wellbeing and Stimulation Consumers are increasingly seeking healthier lifestyles and “better-for-you” products that help them manage their daily wellbeing. We call this category Wellbeing & Stimulation (W&S) and expect the category to grow to £495 billion by 2030, from around £296 billion today.1 Many of these products historically are in common formats like pressed tablet supplements and sugar-based sports and energy drinks. Recently, however, there has been a consumer shift towards products that are less artificial, more enjoyable, have greater functional efficacy, are easier to use and understand, and that provide for a wider range of functional benefits. After over a century in nicotine, BAT has significant expertise in providing direct-to-mind stimulation through enjoyable solutions and strong route-to-market capabilities. As a result, we are well-positioned to explore the development of a W&S business by leveraging existing capabilities and external partners. As part of this exploration of W&S, we are building a pipeline of products to ensure sustained competitiveness to win in this exciting category. This includes internal development of new products and also working with Btomorrow Ventures (BTV) to guide and support our investments or potentially larger scale M&A. Cannabis In 2019, the global legal recreational market was estimated to be worth £5.2 billion in revenue. That figure is now put at £11.1 billion (2022)2, growing at 28%3 per annum, with non-combustible formats driving this, growing at 35%4 per annum. We believe this is signalling a shift away from traditional smokable formats into other, potentially less harmful, more progressive consumption methods. We see cannabis as an exciting potential category for the future. However, given the complex regulatory environment and the implications to BAT as a UK listed company, we will continue to monitor the changes in the regulatory environment as it evolves across geographies. As part of its strategic investment in 2021, BAT established a joint-Product Development Collaboration (PDC) Agreement and Centre of Excellence with Organigram in Moncton, Canada to lead Research & Development activities with cannabis. We are pleased with the progress that has been made in 2023. The PDC is in late-stage development of a suite of emulsions, novel vapour formulations, flavour innovations, and packaging solutions which are soon to be commercialised by Organigram in the Canadian market. For more information on Beyond Nicotine, see page 39+ Notes: 1. IRI/Circana Consulting, Euromonitor. 2. Euromonitor 2022 Market Sizing Data | Global. 3. Euromonitor 2022 Market Sizing Data | Global. 4. Euromonitor 2022 Market Sizing Data | Global. BAT Annual Report and Form 20-F 2023 Strategic Report Governance Report Financial Statements Other Information 29
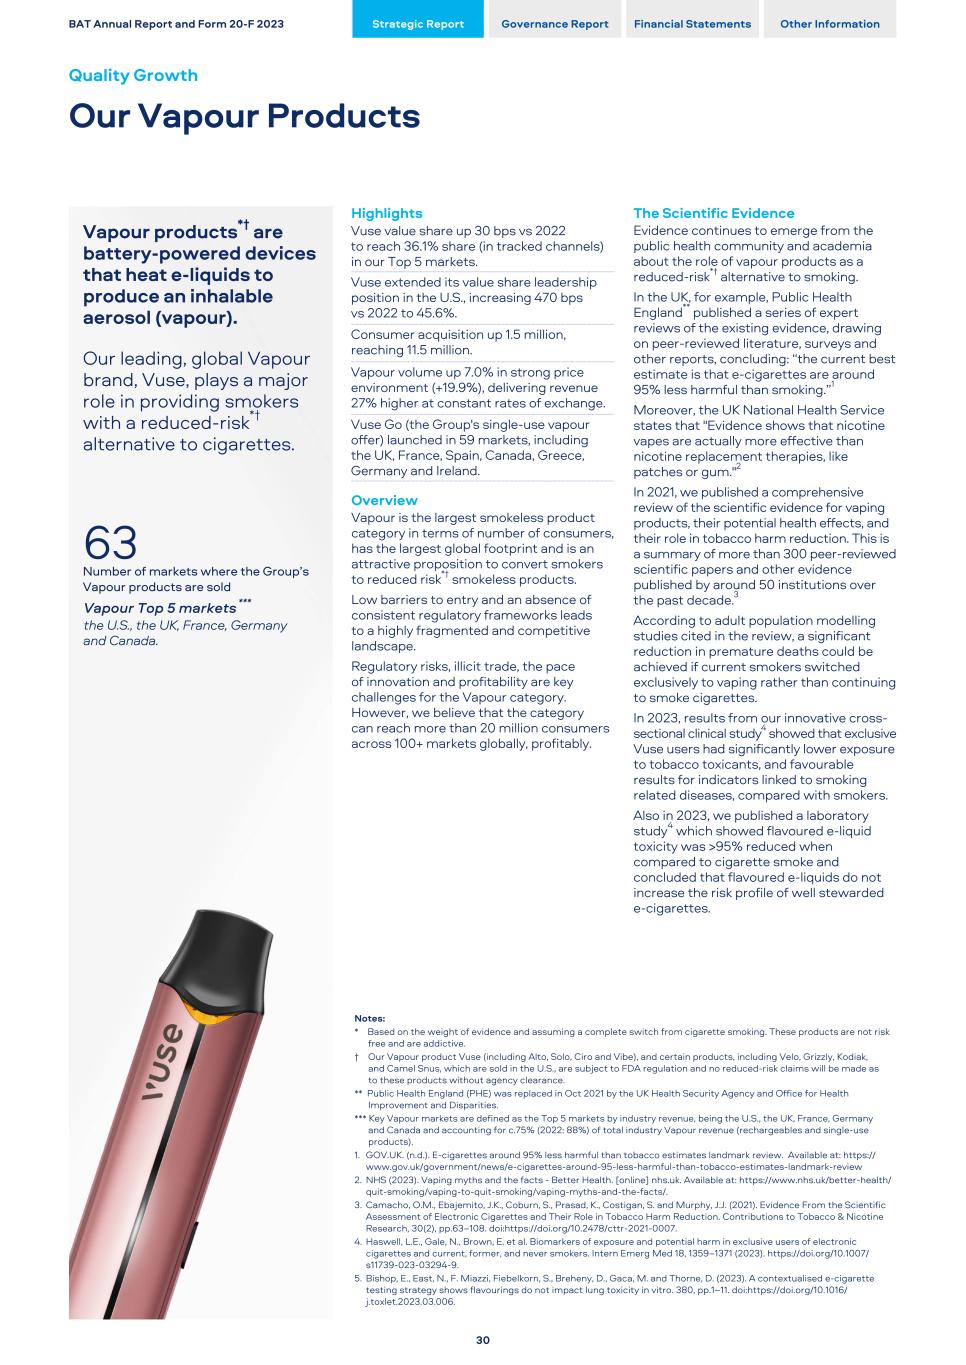
Vapour products*† are battery-powered devices that heat e-liquids to produce an inhalable aerosol (vapour). Our leading, global Vapour brand, Vuse, plays a major role in providing smokers with a reduced-risk*† alternative to cigarettes. 63 Number of markets where the Group’s Vapour products are sold Vapour Top 5 markets *** the U.S., the UK, France, Germany and Canada. Highlights Vuse value share up 30 bps vs 2022 to reach 36.1% share (in tracked channels) in our Top 5 markets. Vuse extended its value share leadership position in the U.S., increasing 470 bps vs 2022 to 45.6%. Consumer acquisition up 1.5 million, reaching 11.5 million. Vapour volume up 7.0% in strong price environment (+19.9%), delivering revenue 27% higher at constant rates of exchange. Vuse Go (the Group's single-use vapour offer) launched in 59 markets, including the UK, France, Spain, Canada, Greece, Germany and Ireland. Overview Vapour is the largest smokeless product category in terms of number of consumers, has the largest global footprint and is an attractive proposition to convert smokers to reduced risk*† smokeless products. Low barriers to entry and an absence of consistent regulatory frameworks leads to a highly fragmented and competitive landscape. Regulatory risks, illicit trade, the pace of innovation and profitability are key challenges for the Vapour category. However, we believe that the category can reach more than 20 million consumers across 100+ markets globally, profitably. The Scientific Evidence Evidence continues to emerge from the public health community and academia about the role of vapour products as a reduced-risk*† alternative to smoking. In the UK, for example, Public Health England** published a series of expert reviews of the existing evidence, drawing on peer-reviewed literature, surveys and other reports, concluding: “the current best estimate is that e-cigarettes are around 95% less harmful than smoking.”1 Moreover, the UK National Health Service states that "Evidence shows that nicotine vapes are actually more effective than nicotine replacement therapies, like patches or gum."2 In 2021, we published a comprehensive review of the scientific evidence for vaping products, their potential health effects, and their role in tobacco harm reduction. This is a summary of more than 300 peer-reviewed scientific papers and other evidence published by around 50 institutions over the past decade.3 According to adult population modelling studies cited in the review, a significant reduction in premature deaths could be achieved if current smokers switched exclusively to vaping rather than continuing to smoke cigarettes. In 2023, results from our innovative cross- sectional clinical study4 showed that exclusive Vuse users had significantly lower exposure to tobacco toxicants, and favourable results for indicators linked to smoking related diseases, compared with smokers. Also in 2023, we published a laboratory study4 which showed flavoured e-liquid toxicity was >95% reduced when compared to cigarette smoke and concluded that flavoured e-liquids do not increase the risk profile of well stewarded e-cigarettes. Notes: * Based on the weight of evidence and assuming a complete switch from cigarette smoking. These products are not risk free and are addictive. † Our Vapour product Vuse (including Alto, Solo, Ciro and Vibe), and certain products, including Velo, Grizzly, Kodiak, and Camel Snus, which are sold in the U.S., are subject to FDA regulation and no reduced-risk claims will be made as to these products without agency clearance. ** Public Health England (PHE) was replaced in Oct 2021 by the UK Health Security Agency and Office for Health Improvement and Disparities. *** Key Vapour markets are defined as the Top 5 markets by industry revenue, being the U.S., the UK, France, Germany and Canada and accounting for c.75% (2022: 88%) of total industry Vapour revenue (rechargeables and single-use products). 1. GOV.UK. (n.d.). E-cigarettes around 95% less harmful than tobacco estimates landmark review. Available at: https:// www.gov.uk/government/news/e-cigarettes-around-95-less-harmful-than-tobacco-estimates-landmark-review 2. NHS (2023). Vaping myths and the facts - Better Health. [online] nhs.uk. Available at: https://www.nhs.uk/better-health/ quit-smoking/vaping-to-quit-smoking/vaping-myths-and-the-facts/. 3. Camacho, O.M., Ebajemito, J.K., Coburn, S., Prasad, K., Costigan, S. and Murphy, J.J. (2021). Evidence From the Scientific Assessment of Electronic Cigarettes and Their Role in Tobacco Harm Reduction. Contributions to Tobacco & Nicotine Research, 30(2), pp.63–108. doi:https://doi.org/10.2478/cttr-2021-0007. 4. Haswell, L.E., Gale, N., Brown, E. et al. Biomarkers of exposure and potential harm in exclusive users of electronic cigarettes and current, former, and never smokers. Intern Emerg Med 18, 1359–1371 (2023). https://doi.org/10.1007/ s11739-023-03294-9. 5. Bishop, E., East, N., F. Miazzi, Fiebelkorn, S., Breheny, D., Gaca, M. and Thorne, D. (2023). A contextualised e-cigarette testing strategy shows flavourings do not impact lung toxicity in vitro. 380, pp.1–11. doi:https://doi.org/10.1016/ j.toxlet.2023.03.006. BAT Annual Report and Form 20-F 2023 Strategic Report Governance Report Financial Statements Other Information Quality Growth Our Vapour Products 30
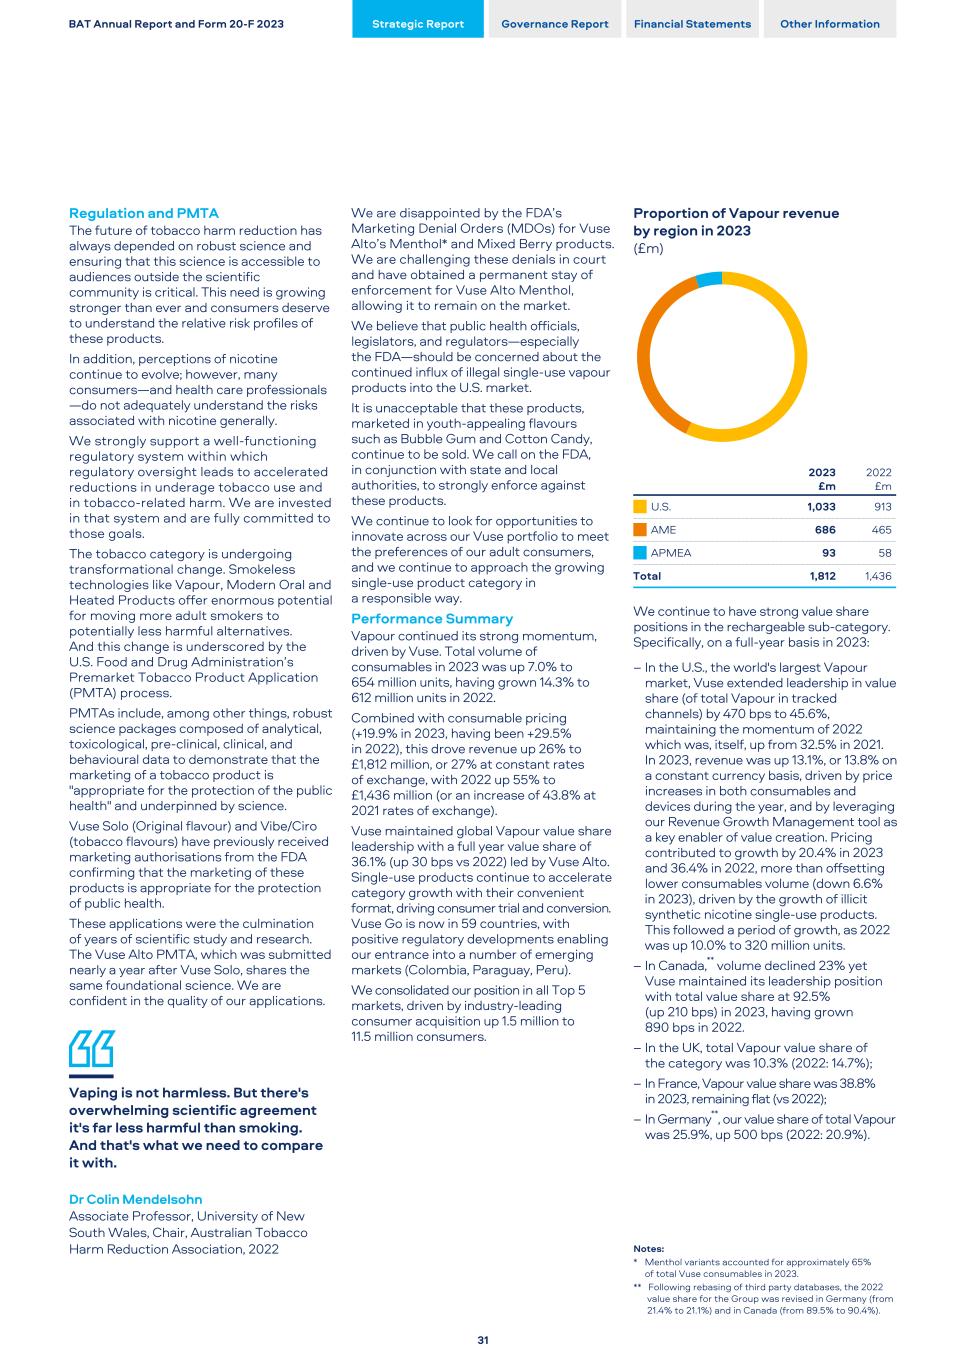
Regulation and PMTA The future of tobacco harm reduction has always depended on robust science and ensuring that this science is accessible to audiences outside the scientific community is critical. This need is growing stronger than ever and consumers deserve to understand the relative risk profiles of these products. In addition, perceptions of nicotine continue to evolve; however, many consumers—and health care professionals —do not adequately understand the risks associated with nicotine generally. We strongly support a well-functioning regulatory system within which regulatory oversight leads to accelerated reductions in underage tobacco use and in tobacco-related harm. We are invested in that system and are fully committed to those goals. The tobacco category is undergoing transformational change. Smokeless technologies like Vapour, Modern Oral and Heated Products offer enormous potential for moving more adult smokers to potentially less harmful alternatives. And this change is underscored by the U.S. Food and Drug Administration’s Premarket Tobacco Product Application (PMTA) process. PMTAs include, among other things, robust science packages composed of analytical, toxicological, pre-clinical, clinical, and behavioural data to demonstrate that the marketing of a tobacco product is "appropriate for the protection of the public health" and underpinned by science. Vuse Solo (Original flavour) and Vibe/Ciro (tobacco flavours) have previously received marketing authorisations from the FDA confirming that the marketing of these products is appropriate for the protection of public health. These applications were the culmination of years of scientific study and research. The Vuse Alto PMTA, which was submitted nearly a year after Vuse Solo, shares the same foundational science. We are confident in the quality of our applications. Vaping is not harmless. But there's overwhelming scientific agreement it's far less harmful than smoking. And that's what we need to compare it with. Dr Colin Mendelsohn Associate Professor, University of New South Wales, Chair, Australian Tobacco Harm Reduction Association, 2022 We are disappointed by the FDA’s Marketing Denial Orders (MDOs) for Vuse Alto’s Menthol* and Mixed Berry products. We are challenging these denials in court and have obtained a permanent stay of enforcement for Vuse Alto Menthol, allowing it to remain on the market. We believe that public health officials, legislators, and regulators—especially the FDA—should be concerned about the continued influx of illegal single-use vapour products into the U.S. market. It is unacceptable that these products, marketed in youth-appealing flavours such as Bubble Gum and Cotton Candy, continue to be sold. We call on the FDA, in conjunction with state and local authorities, to strongly enforce against these products. We continue to look for opportunities to innovate across our Vuse portfolio to meet the preferences of our adult consumers, and we continue to approach the growing single-use product category in a responsible way. Performance Summary Vapour continued its strong momentum, driven by Vuse. Total volume of consumables in 2023 was up 7.0% to 654 million units, having grown 14.3% to 612 million units in 2022. Combined with consumable pricing (+19.9% in 2023, having been +29.5% in 2022), this drove revenue up 26% to £1,812 million, or 27% at constant rates of exchange, with 2022 up 55% to £1,436 million (or an increase of 43.8% at 2021 rates of exchange). Vuse maintained global Vapour value share leadership with a full year value share of 36.1% (up 30 bps vs 2022) led by Vuse Alto. Single-use products continue to accelerate category growth with their convenient format, driving consumer trial and conversion. Vuse Go is now in 59 countries, with positive regulatory developments enabling our entrance into a number of emerging markets (Colombia, Paraguay, Peru). We consolidated our position in all Top 5 markets, driven by industry-leading consumer acquisition up 1.5 million to 11.5 million consumers. Proportion of Vapour revenue by region in 2023 (£m) 2023 £m 2022 £m U.S. 1,033 913 AME 686 465 APMEA 93 58 Total 1,812 1,436 We continue to have strong value share positions in the rechargeable sub-category. Specifically, on a full-year basis in 2023: – In the U.S., the world's largest Vapour market, Vuse extended leadership in value share (of total Vapour in tracked channels) by 470 bps to 45.6%, maintaining the momentum of 2022 which was, itself, up from 32.5% in 2021. In 2023, revenue was up 13.1%, or 13.8% on a constant currency basis, driven by price increases in both consumables and devices during the year, and by leveraging our Revenue Growth Management tool as a key enabler of value creation. Pricing contributed to growth by 20.4% in 2023 and 36.4% in 2022, more than offsetting lower consumables volume (down 6.6% in 2023), driven by the growth of illicit synthetic nicotine single-use products. This followed a period of growth, as 2022 was up 10.0% to 320 million units. – In Canada,** volume declined 23% yet Vuse maintained its leadership position with total value share at 92.5% (up 210 bps) in 2023, having grown 890 bps in 2022. – In the UK, total Vapour value share of the category was 10.3% (2022: 14.7%); – In France, Vapour value share was 38.8% in 2023, remaining flat (vs 2022); – In Germany**, our value share of total Vapour was 25.9%, up 500 bps (2022: 20.9%). Notes: * Menthol variants accounted for approximately 65% of total Vuse consumables in 2023. ** Following rebasing of third party databases, the 2022 value share for the Group was revised in Germany (from 21.4% to 21.1%) and in Canada (from 89.5% to 90.4%). BAT Annual Report and Form 20-F 2023 Strategic Report Governance Report Financial Statements Other Information 31
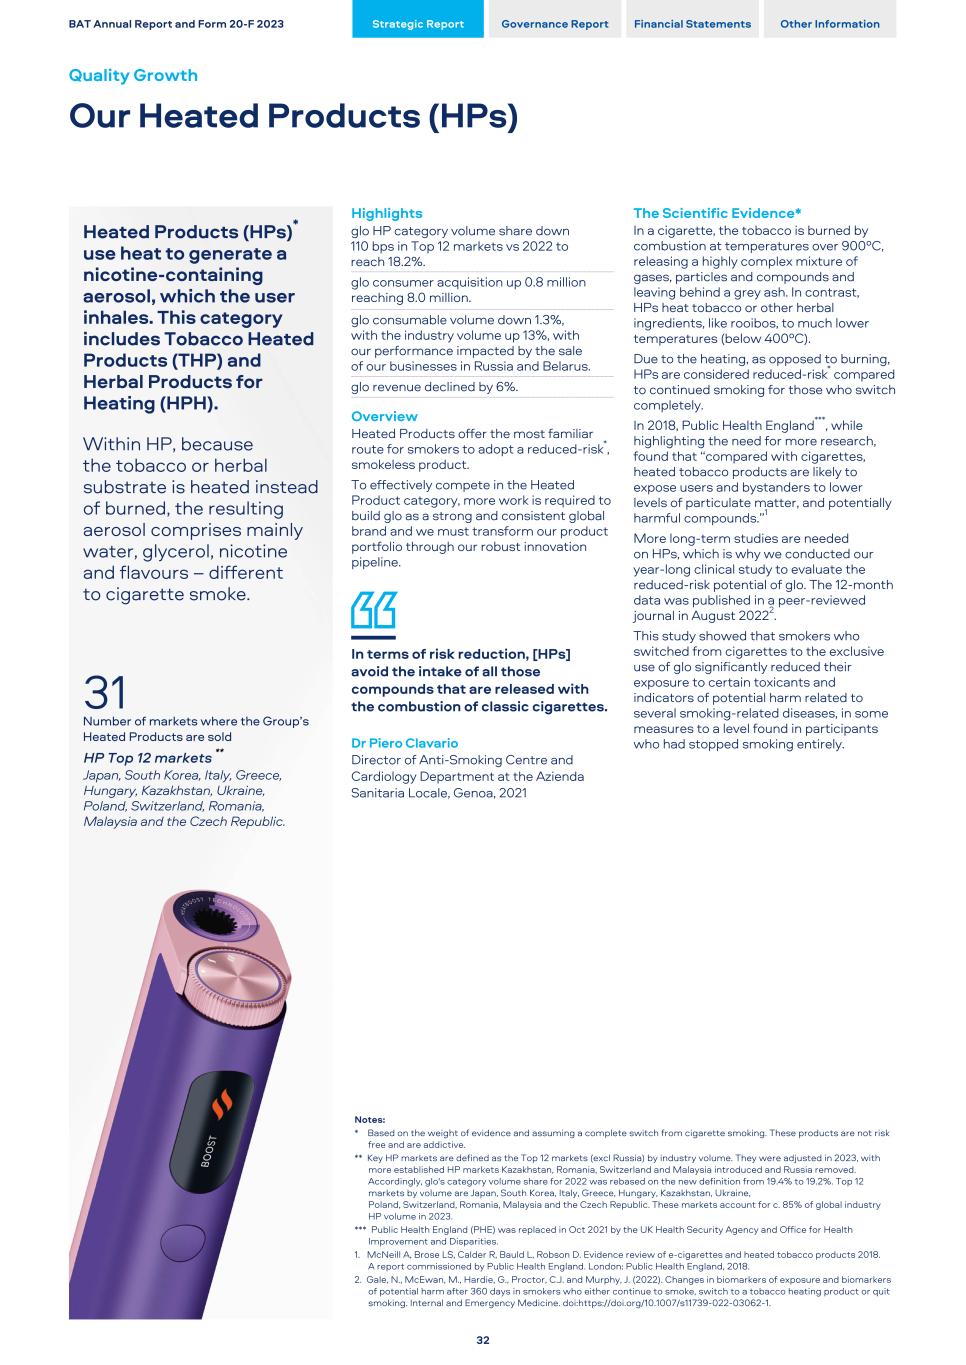
Heated Products (HPs)* use heat to generate a nicotine-containing aerosol, which the user inhales. This category includes Tobacco Heated Products (THP) and Herbal Products for Heating (HPH). Within HP, because the tobacco or herbal substrate is heated instead of burned, the resulting aerosol comprises mainly water, glycerol, nicotine and flavours – different to cigarette smoke. 31 Number of markets where the Group’s Heated Products are sold HP Top 12 markets ** Japan, South Korea, Italy, Greece, Hungary, Kazakhstan, Ukraine, Poland, Switzerland, Romania, Malaysia and the Czech Republic. Highlights glo HP category volume share down 110 bps in Top 12 markets vs 2022 to reach 18.2%. glo consumer acquisition up 0.8 million reaching 8.0 million. glo consumable volume down 1.3%, with the industry volume up 13%, with our performance impacted by the sale of our businesses in Russia and Belarus. glo revenue declined by 6%. Overview Heated Products offer the most familiar route for smokers to adopt a reduced-risk*, smokeless product. To effectively compete in the Heated Product category, more work is required to build glo as a strong and consistent global brand and we must transform our product portfolio through our robust innovation pipeline. In terms of risk reduction, [HPs] avoid the intake of all those compounds that are released with the combustion of classic cigarettes. Dr Piero Clavario Director of Anti-Smoking Centre and Cardiology Department at the Azienda Sanitaria Locale, Genoa, 2021 The Scientific Evidence* In a cigarette, the tobacco is burned by combustion at temperatures over 900ºC, releasing a highly complex mixture of gases, particles and compounds and leaving behind a grey ash. In contrast, HPs heat tobacco or other herbal ingredients, like rooibos, to much lower temperatures (below 400ºC). Due to the heating, as opposed to burning, HPs are considered reduced-risk* compared to continued smoking for those who switch completely. In 2018, Public Health England***, while highlighting the need for more research, found that “compared with cigarettes, heated tobacco products are likely to expose users and bystanders to lower levels of particulate matter, and potentially harmful compounds.”1 More long-term studies are needed on HPs, which is why we conducted our year-long clinical study to evaluate the reduced-risk potential of glo. The 12-month data was published in a peer-reviewed journal in August 20222. This study showed that smokers who switched from cigarettes to the exclusive use of glo significantly reduced their exposure to certain toxicants and indicators of potential harm related to several smoking-related diseases, in some measures to a level found in participants who had stopped smoking entirely. Notes: * Based on the weight of evidence and assuming a complete switch from cigarette smoking. These products are not risk free and are addictive. ** Key HP markets are defined as the Top 12 markets (excl Russia) by industry volume. They were adjusted in 2023, with more established HP markets Kazakhstan, Romania, Switzerland and Malaysia introduced and Russia removed. Accordingly, glo's category volume share for 2022 was rebased on the new definition from 19.4% to 19.2%. Top 12 markets by volume are Japan, South Korea, Italy, Greece, Hungary, Kazakhstan, Ukraine, Poland, Switzerland, Romania, Malaysia and the Czech Republic. These markets account for c. 85% of global industry HP volume in 2023. *** Public Health England (PHE) was replaced in Oct 2021 by the UK Health Security Agency and Office for Health Improvement and Disparities. 1. McNeill A, Brose LS, Calder R, Bauld L, Robson D. Evidence review of e-cigarettes and heated tobacco products 2018. A report commissioned by Public Health England. London: Public Health England, 2018. 2. Gale, N., McEwan, M., Hardie, G., Proctor, C.J. and Murphy, J. (2022). Changes in biomarkers of exposure and biomarkers of potential harm after 360 days in smokers who either continue to smoke, switch to a tobacco heating product or quit smoking. Internal and Emergency Medicine. doi:https://doi.org/10.1007/s11739-022-03062-1. BAT Annual Report and Form 20-F 2023 Strategic Report Governance Report Financial Statements Other Information Quality Growth Our Heated Products (HPs) 32
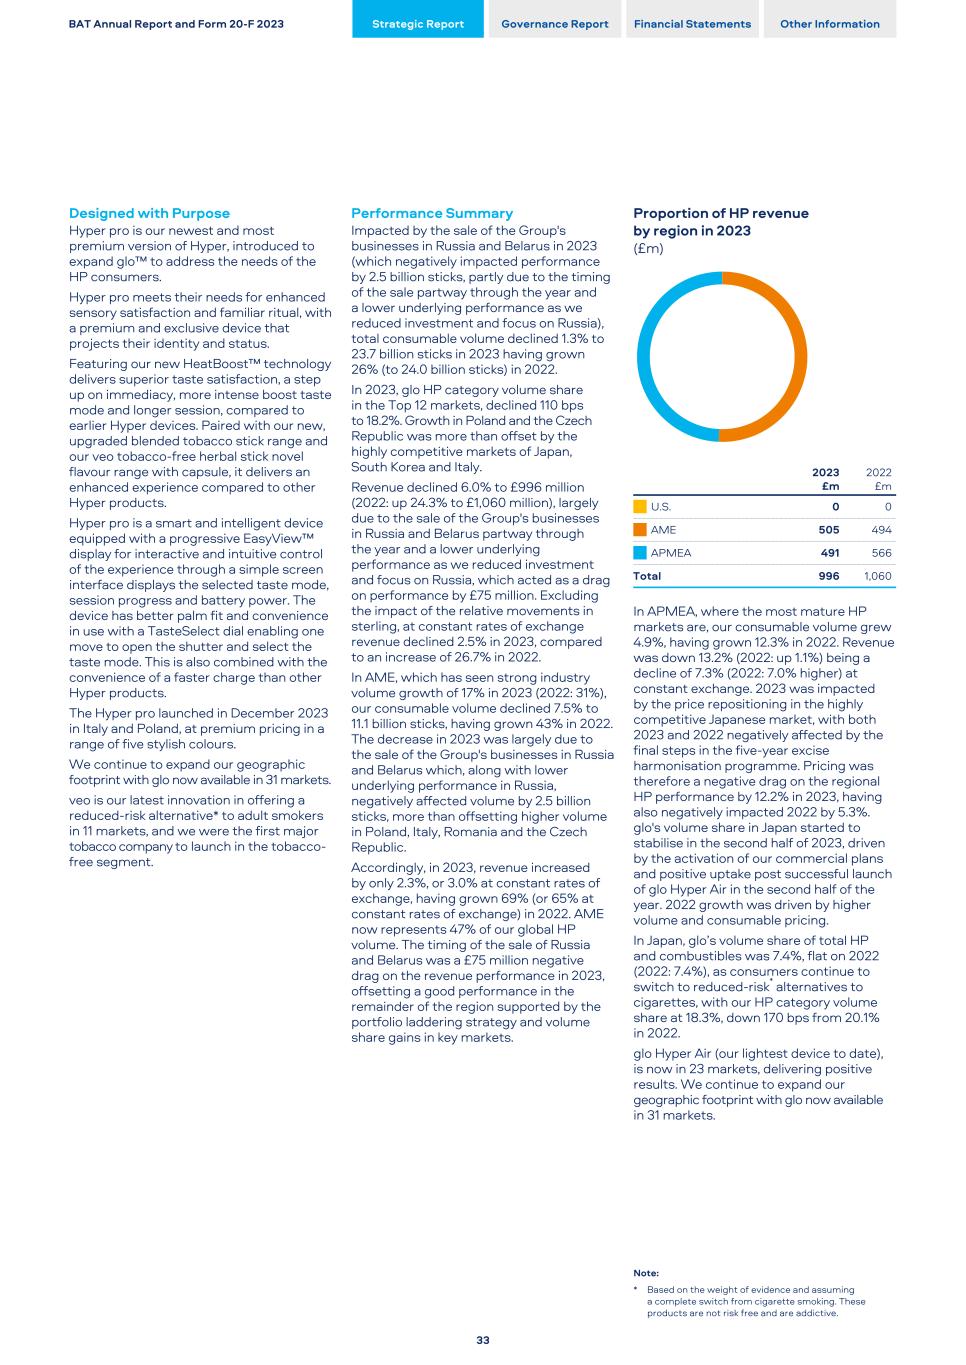
Designed with Purpose Hyper pro is our newest and most premium version of Hyper, introduced to expand glo™ to address the needs of the HP consumers. Hyper pro meets their needs for enhanced sensory satisfaction and familiar ritual, with a premium and exclusive device that projects their identity and status. Featuring our new HeatBoost™ technology delivers superior taste satisfaction, a step up on immediacy, more intense boost taste mode and longer session, compared to earlier Hyper devices. Paired with our new, upgraded blended tobacco stick range and our veo tobacco-free herbal stick novel flavour range with capsule, it delivers an enhanced experience compared to other Hyper products. Hyper pro is a smart and intelligent device equipped with a progressive EasyView™ display for interactive and intuitive control of the experience through a simple screen interface displays the selected taste mode, session progress and battery power. The device has better palm fit and convenience in use with a TasteSelect dial enabling one move to open the shutter and select the taste mode. This is also combined with the convenience of a faster charge than other Hyper products. The Hyper pro launched in December 2023 in Italy and Poland, at premium pricing in a range of five stylish colours. We continue to expand our geographic footprint with glo now available in 31 markets. veo is our latest innovation in offering a reduced-risk alternative* to adult smokers in 11 markets, and we were the first major tobacco company to launch in the tobacco- free segment. Performance Summary Impacted by the sale of the Group's businesses in Russia and Belarus in 2023 (which negatively impacted performance by 2.5 billion sticks, partly due to the timing of the sale partway through the year and a lower underlying performance as we reduced investment and focus on Russia), total consumable volume declined 1.3% to 23.7 billion sticks in 2023 having grown 26% (to 24.0 billion sticks) in 2022. In 2023, glo HP category volume share in the Top 12 markets, declined 110 bps to 18.2%. Growth in Poland and the Czech Republic was more than offset by the highly competitive markets of Japan, South Korea and Italy. Revenue declined 6.0% to £996 million (2022: up 24.3% to £1,060 million), largely due to the sale of the Group's businesses in Russia and Belarus partway through the year and a lower underlying performance as we reduced investment and focus on Russia, which acted as a drag on performance by £75 million. Excluding the impact of the relative movements in sterling, at constant rates of exchange revenue declined 2.5% in 2023, compared to an increase of 26.7% in 2022. In AME, which has seen strong industry volume growth of 17% in 2023 (2022: 31%), our consumable volume declined 7.5% to 11.1 billion sticks, having grown 43% in 2022. The decrease in 2023 was largely due to the sale of the Group's businesses in Russia and Belarus which, along with lower underlying performance in Russia, negatively affected volume by 2.5 billion sticks, more than offsetting higher volume in Poland, Italy, Romania and the Czech Republic. Accordingly, in 2023, revenue increased by only 2.3%, or 3.0% at constant rates of exchange, having grown 69% (or 65% at constant rates of exchange) in 2022. AME now represents 47% of our global HP volume. The timing of the sale of Russia and Belarus was a £75 million negative drag on the revenue performance in 2023, offsetting a good performance in the remainder of the region supported by the portfolio laddering strategy and volume share gains in key markets. Proportion of HP revenue by region in 2023 (£m) 2023 £m 2022 £m U.S. 0 0 AME 505 494 APMEA 491 566 Total 996 1,060 In APMEA, where the most mature HP markets are, our consumable volume grew 4.9%, having grown 12.3% in 2022. Revenue was down 13.2% (2022: up 1.1%) being a decline of 7.3% (2022: 7.0% higher) at constant exchange. 2023 was impacted by the price repositioning in the highly competitive Japanese market, with both 2023 and 2022 negatively affected by the final steps in the five-year excise harmonisation programme. Pricing was therefore a negative drag on the regional HP performance by 12.2% in 2023, having also negatively impacted 2022 by 5.3%. glo's volume share in Japan started to stabilise in the second half of 2023, driven by the activation of our commercial plans and positive uptake post successful launch of glo Hyper Air in the second half of the year. 2022 growth was driven by higher volume and consumable pricing. In Japan, glo’s volume share of total HP and combustibles was 7.4%, flat on 2022 (2022: 7.4%), as consumers continue to switch to reduced-risk* alternatives to cigarettes, with our HP category volume share at 18.3%, down 170 bps from 20.1% in 2022. glo Hyper Air (our lightest device to date), is now in 23 markets, delivering positive results. We continue to expand our geographic footprint with glo now available in 31 markets. Note: * Based on the weight of evidence and assuming a complete switch from cigarette smoking. These products are not risk free and are addictive. BAT Annual Report and Form 20-F 2023 Strategic Report Governance Report Financial Statements Other Information 33
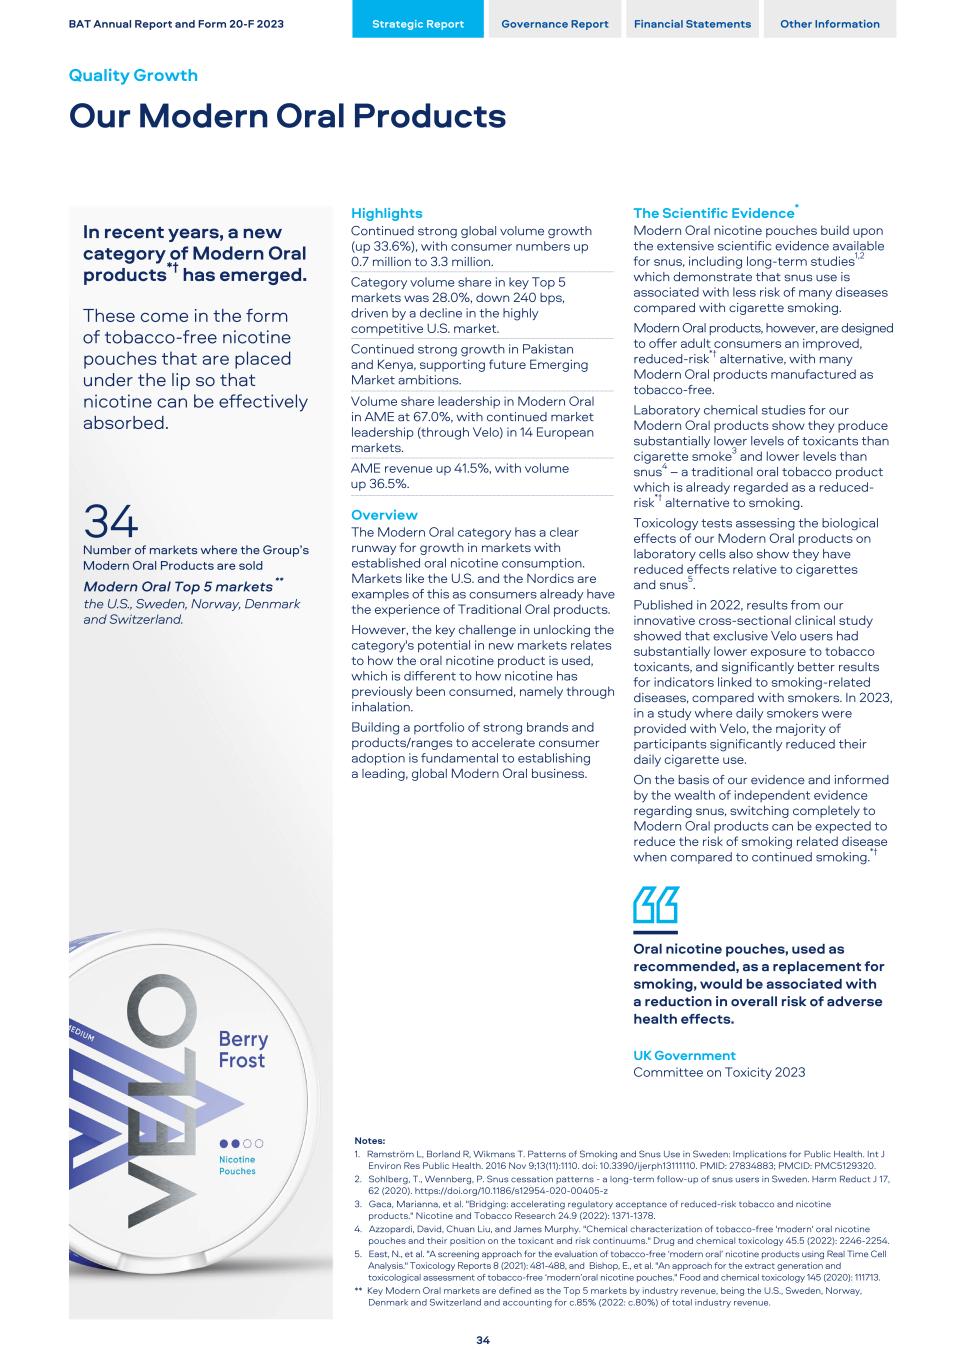
In recent years, a new category of Modern Oral products*† has emerged. These come in the form of tobacco-free nicotine pouches that are placed under the lip so that nicotine can be effectively absorbed. 34 Number of markets where the Group’s Modern Oral Products are sold Modern Oral Top 5 markets ** the U.S., Sweden, Norway, Denmark and Switzerland. Highlights Continued strong global volume growth (up 33.6%), with consumer numbers up 0.7 million to 3.3 million. Category volume share in key Top 5 markets was 28.0%, down 240 bps, driven by a decline in the highly competitive U.S. market. Continued strong growth in Pakistan and Kenya, supporting future Emerging Market ambitions. Volume share leadership in Modern Oral in AME at 67.0%, with continued market leadership (through Velo) in 14 European markets. AME revenue up 41.5%, with volume up 36.5%. Overview The Modern Oral category has a clear runway for growth in markets with established oral nicotine consumption. Markets like the U.S. and the Nordics are examples of this as consumers already have the experience of Traditional Oral products. However, the key challenge in unlocking the category's potential in new markets relates to how the oral nicotine product is used, which is different to how nicotine has previously been consumed, namely through inhalation. Building a portfolio of strong brands and products/ranges to accelerate consumer adoption is fundamental to establishing a leading, global Modern Oral business. The Scientific Evidence* Modern Oral nicotine pouches build upon the extensive scientific evidence available for snus, including long-term studies1,2 which demonstrate that snus use is associated with less risk of many diseases compared with cigarette smoking. Modern Oral products, however, are designed to offer adult consumers an improved, reduced-risk*† alternative, with many Modern Oral products manufactured as tobacco-free. Laboratory chemical studies for our Modern Oral products show they produce substantially lower levels of toxicants than cigarette smoke3 and lower levels than snus4 – a traditional oral tobacco product which is already regarded as a reduced- risk*† alternative to smoking. Toxicology tests assessing the biological effects of our Modern Oral products on laboratory cells also show they have reduced effects relative to cigarettes and snus5. Published in 2022, results from our innovative cross-sectional clinical study showed that exclusive Velo users had substantially lower exposure to tobacco toxicants, and significantly better results for indicators linked to smoking-related diseases, compared with smokers. In 2023, in a study where daily smokers were provided with Velo, the majority of participants significantly reduced their daily cigarette use. On the basis of our evidence and informed by the wealth of independent evidence regarding snus, switching completely to Modern Oral products can be expected to reduce the risk of smoking related disease when compared to continued smoking.*† Oral nicotine pouches, used as recommended, as a replacement for smoking, would be associated with a reduction in overall risk of adverse health effects. UK Government Committee on Toxicity 2023 Notes: 1. Ramström L, Borland R, Wikmans T. Patterns of Smoking and Snus Use in Sweden: Implications for Public Health. Int J Environ Res Public Health. 2016 Nov 9;13(11):1110. doi: 10.3390/ijerph13111110. PMID: 27834883; PMCID: PMC5129320. 2. Sohlberg, T., Wennberg, P. Snus cessation patterns - a long-term follow-up of snus users in Sweden. Harm Reduct J 17, 62 (2020). https://doi.org/10.1186/s12954-020-00405-z 3. Gaca, Marianna, et al. "Bridging: accelerating regulatory acceptance of reduced-risk tobacco and nicotine products." Nicotine and Tobacco Research 24.9 (2022): 1371-1378. 4. Azzopardi, David, Chuan Liu, and James Murphy. "Chemical characterization of tobacco-free 'modern' oral nicotine pouches and their position on the toxicant and risk continuums." Drug and chemical toxicology 45.5 (2022): 2246-2254. 5. East, N., et al. "A screening approach for the evaluation of tobacco-free ‘modern oral’ nicotine products using Real Time Cell Analysis." Toxicology Reports 8 (2021): 481-488, and Bishop, E., et al. "An approach for the extract generation and toxicological assessment of tobacco-free ‘modern’oral nicotine pouches." Food and chemical toxicology 145 (2020): 111713. ** Key Modern Oral markets are defined as the Top 5 markets by industry revenue, being the U.S., Sweden, Norway, Denmark and Switzerland and accounting for c.85% (2022: c.80%) of total industry revenue. BAT Annual Report and Form 20-F 2023 Strategic Report Governance Report Financial Statements Other Information Quality Growth Our Modern Oral Products 34
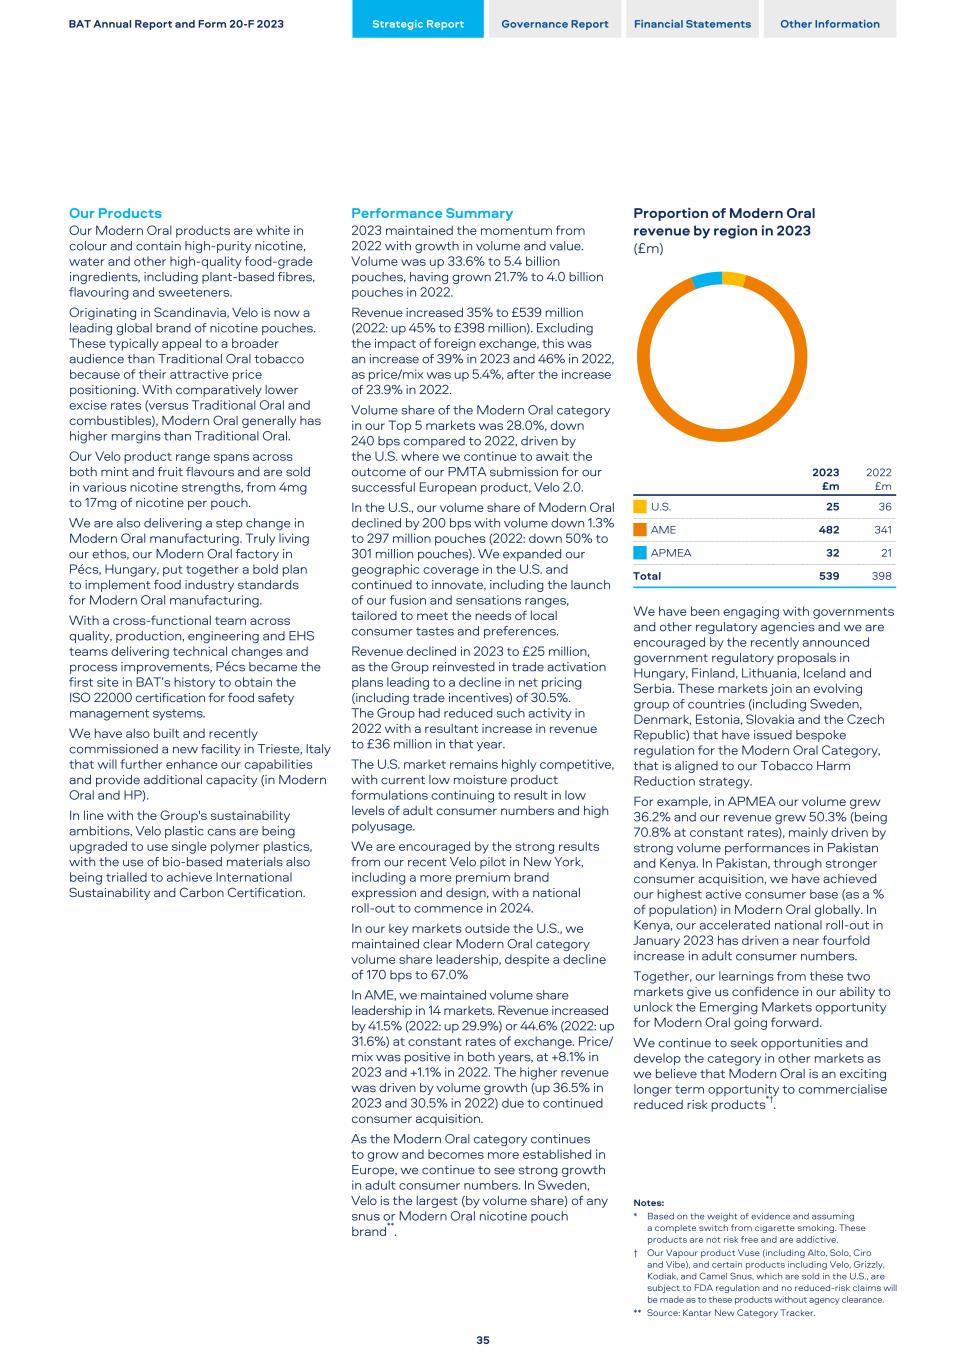
Our Products Our Modern Oral products are white in colour and contain high-purity nicotine, water and other high-quality food-grade ingredients, including plant-based fibres, flavouring and sweeteners. Originating in Scandinavia, Velo is now a leading global brand of nicotine pouches. These typically appeal to a broader audience than Traditional Oral tobacco because of their attractive price positioning. With comparatively lower excise rates (versus Traditional Oral and combustibles), Modern Oral generally has higher margins than Traditional Oral. Our Velo product range spans across both mint and fruit flavours and are sold in various nicotine strengths, from 4mg to 17mg of nicotine per pouch. We are also delivering a step change in Modern Oral manufacturing. Truly living our ethos, our Modern Oral factory in Pécs, Hungary, put together a bold plan to implement food industry standards for Modern Oral manufacturing. With a cross-functional team across quality, production, engineering and EHS teams delivering technical changes and process improvements, Pécs became the first site in BAT’s history to obtain the ISO 22000 certification for food safety management systems. We have also built and recently commissioned a new facility in Trieste, Italy that will further enhance our capabilities and provide additional capacity (in Modern Oral and HP). In line with the Group's sustainability ambitions, Velo plastic cans are being upgraded to use single polymer plastics, with the use of bio-based materials also being trialled to achieve International Sustainability and Carbon Certification. Performance Summary 2023 maintained the momentum from 2022 with growth in volume and value. Volume was up 33.6% to 5.4 billion pouches, having grown 21.7% to 4.0 billion pouches in 2022. Revenue increased 35% to £539 million (2022: up 45% to £398 million). Excluding the impact of foreign exchange, this was an increase of 39% in 2023 and 46% in 2022, as price/mix was up 5.4%, after the increase of 23.9% in 2022. Volume share of the Modern Oral category in our Top 5 markets was 28.0%, down 240 bps compared to 2022, driven by the U.S. where we continue to await the outcome of our PMTA submission for our successful European product, Velo 2.0. In the U.S., our volume share of Modern Oral declined by 200 bps with volume down 1.3% to 297 million pouches (2022: down 50% to 301 million pouches). We expanded our geographic coverage in the U.S. and continued to innovate, including the launch of our fusion and sensations ranges, tailored to meet the needs of local consumer tastes and preferences. Revenue declined in 2023 to £25 million, as the Group reinvested in trade activation plans leading to a decline in net pricing (including trade incentives) of 30.5%. The Group had reduced such activity in 2022 with a resultant increase in revenue to £36 million in that year. The U.S. market remains highly competitive, with current low moisture product formulations continuing to result in low levels of adult consumer numbers and high polyusage. We are encouraged by the strong results from our recent Velo pilot in New York, including a more premium brand expression and design, with a national roll-out to commence in 2024. In our key markets outside the U.S., we maintained clear Modern Oral category volume share leadership, despite a decline of 170 bps to 67.0% In AME, we maintained volume share leadership in 14 markets. Revenue increased by 41.5% (2022: up 29.9%) or 44.6% (2022: up 31.6%) at constant rates of exchange. Price/ mix was positive in both years, at +8.1% in 2023 and +1.1% in 2022. The higher revenue was driven by volume growth (up 36.5% in 2023 and 30.5% in 2022) due to continued consumer acquisition. As the Modern Oral category continues to grow and becomes more established in Europe, we continue to see strong growth in adult consumer numbers. In Sweden, Velo is the largest (by volume share) of any snus or Modern Oral nicotine pouch brand**. Proportion of Modern Oral revenue by region in 2023 (£m) 2023 £m 2022 £m U.S. 25 36 AME 482 341 APMEA 32 21 Total 539 398 We have been engaging with governments and other regulatory agencies and we are encouraged by the recently announced government regulatory proposals in Hungary, Finland, Lithuania, Iceland and Serbia. These markets join an evolving group of countries (including Sweden, Denmark, Estonia, Slovakia and the Czech Republic) that have issued bespoke regulation for the Modern Oral Category, that is aligned to our Tobacco Harm Reduction strategy. For example, in APMEA our volume grew 36.2% and our revenue grew 50.3% (being 70.8% at constant rates), mainly driven by strong volume performances in Pakistan and Kenya. In Pakistan, through stronger consumer acquisition, we have achieved our highest active consumer base (as a % of population) in Modern Oral globally. In Kenya, our accelerated national roll-out in January 2023 has driven a near fourfold increase in adult consumer numbers. Together, our learnings from these two markets give us confidence in our ability to unlock the Emerging Markets opportunity for Modern Oral going forward. We continue to seek opportunities and develop the category in other markets as we believe that Modern Oral is an exciting longer term opportunity to commercialise reduced risk products*†. Notes: * Based on the weight of evidence and assuming a complete switch from cigarette smoking. These products are not risk free and are addictive. † Our Vapour product Vuse (including Alto, Solo, Ciro and Vibe), and certain products including Velo, Grizzly, Kodiak, and Camel Snus, which are sold in the U.S., are subject to FDA regulation and no reduced-risk claims will be made as to these products without agency clearance. ** Source: Kantar New Category Tracker. BAT Annual Report and Form 20-F 2023 Strategic Report Governance Report Financial Statements Other Information 35
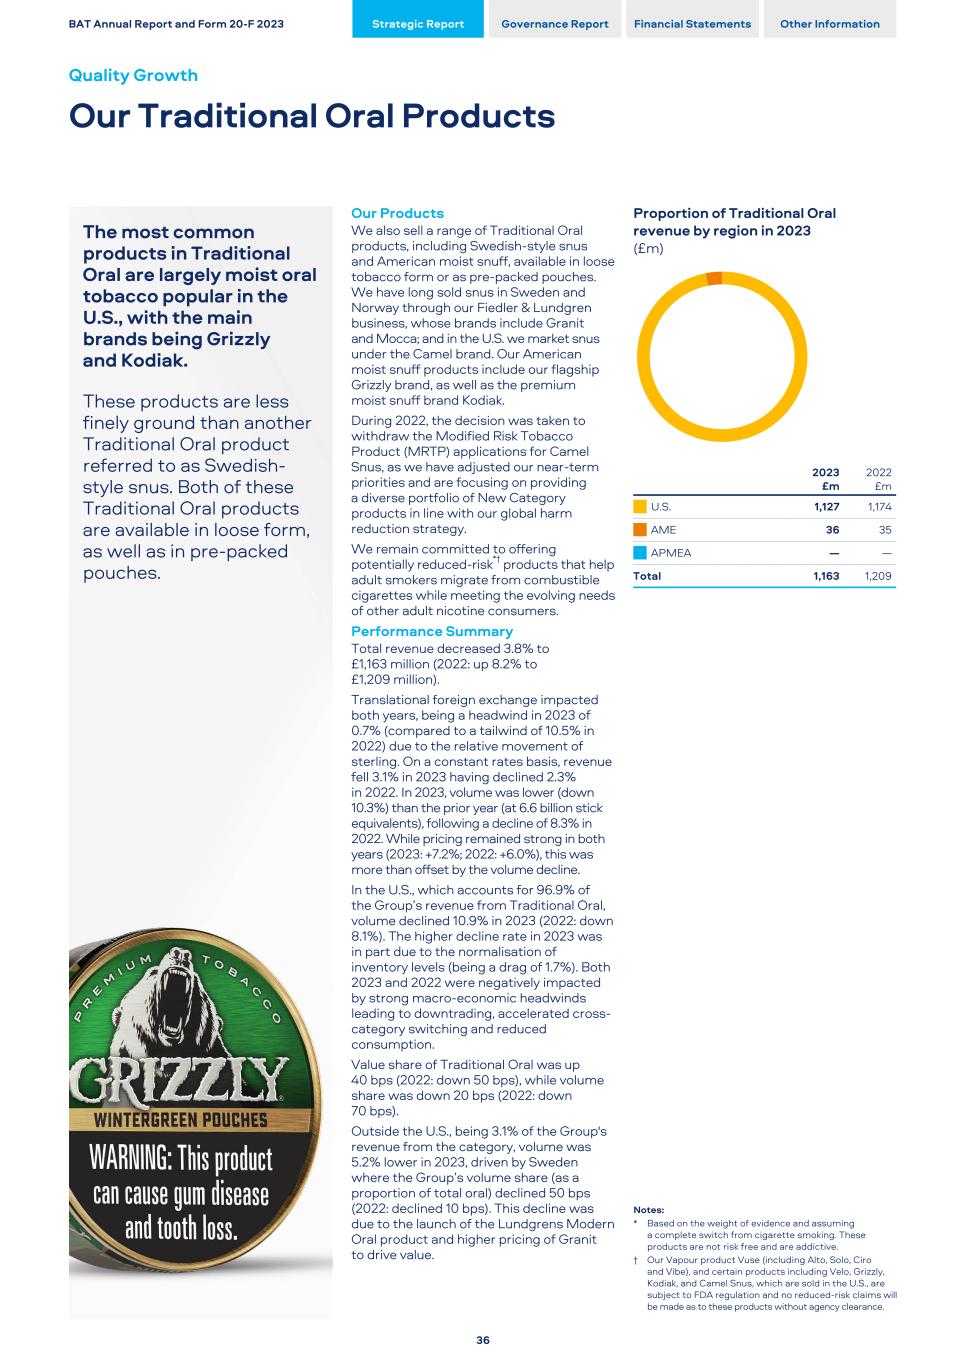
The most common products in Traditional Oral are largely moist oral tobacco popular in the U.S., with the main brands being Grizzly and Kodiak. These products are less finely ground than another Traditional Oral product referred to as Swedish- style snus. Both of these Traditional Oral products are available in loose form, as well as in pre-packed pouches. Our Products We also sell a range of Traditional Oral products, including Swedish-style snus and American moist snuff, available in loose tobacco form or as pre-packed pouches. We have long sold snus in Sweden and Norway through our Fiedler & Lundgren business, whose brands include Granit and Mocca; and in the U.S. we market snus under the Camel brand. Our American moist snuff products include our flagship Grizzly brand, as well as the premium moist snuff brand Kodiak. During 2022, the decision was taken to withdraw the Modified Risk Tobacco Product (MRTP) applications for Camel Snus, as we have adjusted our near-term priorities and are focusing on providing a diverse portfolio of New Category products in line with our global harm reduction strategy. We remain committed to offering potentially reduced-risk*† products that help adult smokers migrate from combustible cigarettes while meeting the evolving needs of other adult nicotine consumers. Performance Summary Total revenue decreased 3.8% to £1,163 million (2022: up 8.2% to £1,209 million). Translational foreign exchange impacted both years, being a headwind in 2023 of 0.7% (compared to a tailwind of 10.5% in 2022) due to the relative movement of sterling. On a constant rates basis, revenue fell 3.1% in 2023 having declined 2.3% in 2022. In 2023, volume was lower (down 10.3%) than the prior year (at 6.6 billion stick equivalents), following a decline of 8.3% in 2022. While pricing remained strong in both years (2023: +7.2%; 2022: +6.0%), this was more than offset by the volume decline. In the U.S., which accounts for 96.9% of the Group’s revenue from Traditional Oral, volume declined 10.9% in 2023 (2022: down 8.1%). The higher decline rate in 2023 was in part due to the normalisation of inventory levels (being a drag of 1.7%). Both 2023 and 2022 were negatively impacted by strong macro-economic headwinds leading to downtrading, accelerated cross- category switching and reduced consumption. Value share of Traditional Oral was up 40 bps (2022: down 50 bps), while volume share was down 20 bps (2022: down 70 bps). Outside the U.S., being 3.1% of the Group's revenue from the category, volume was 5.2% lower in 2023, driven by Sweden where the Group’s volume share (as a proportion of total oral) declined 50 bps (2022: declined 10 bps). This decline was due to the launch of the Lundgrens Modern Oral product and higher pricing of Granit to drive value. Proportion of Traditional Oral revenue by region in 2023 (£m) 2023 £m 2022 £m U.S. 1,127 1,174 AME 36 35 APMEA — — Total 1,163 1,209 Notes: * Based on the weight of evidence and assuming a complete switch from cigarette smoking. These products are not risk free and are addictive. † Our Vapour product Vuse (including Alto, Solo, Ciro and Vibe), and certain products including Velo, Grizzly, Kodiak, and Camel Snus, which are sold in the U.S., are subject to FDA regulation and no reduced-risk claims will be made as to these products without agency clearance. BAT Annual Report and Form 20-F 2023 Strategic Report Governance Report Financial Statements Other Information Quality Growth Our Traditional Oral Products 36
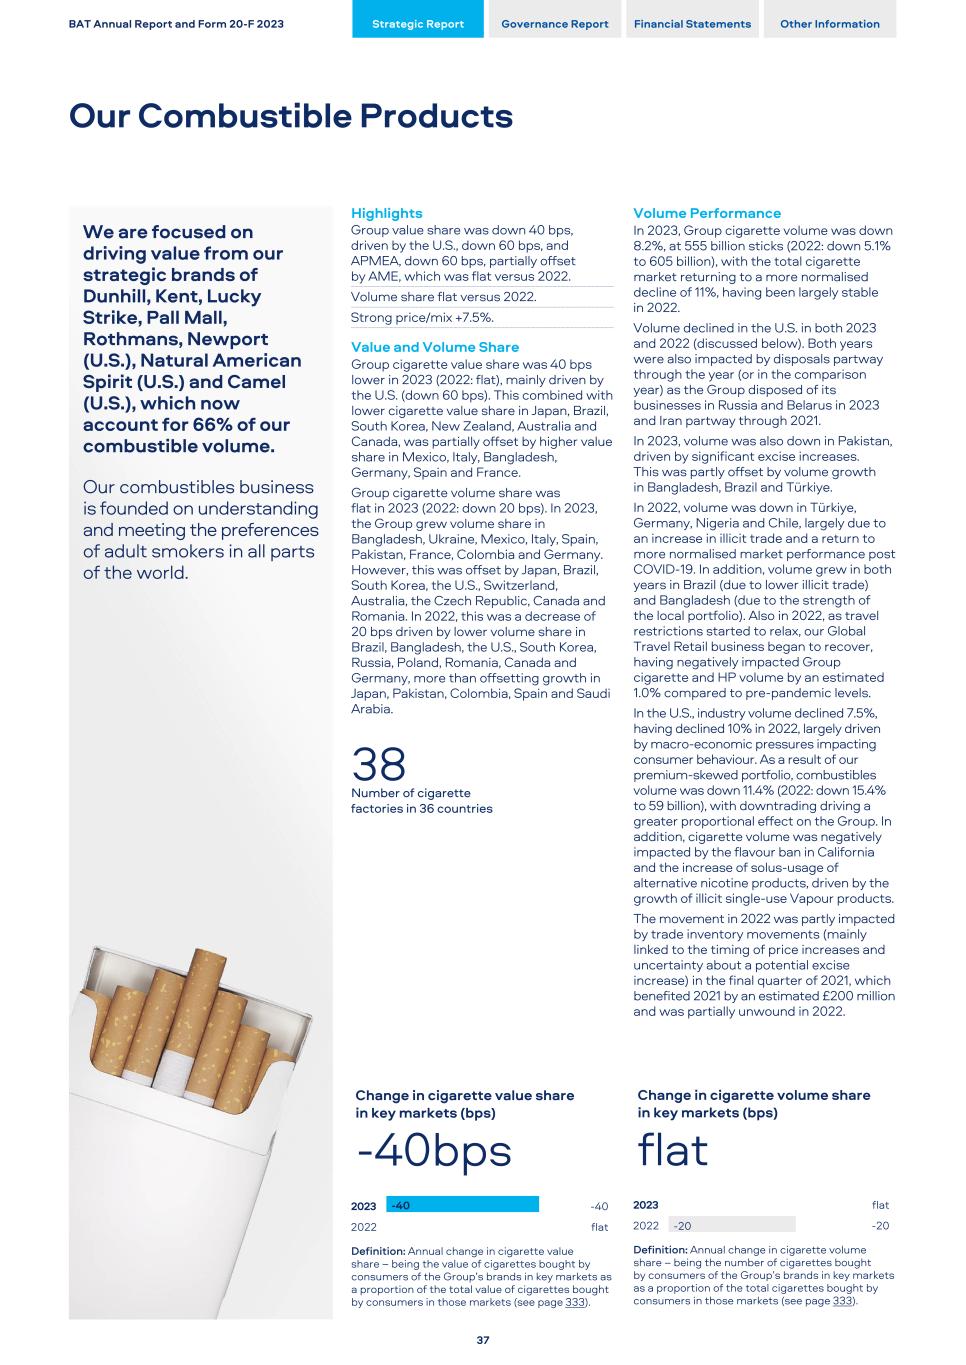
We are focused on driving value from our strategic brands of Dunhill, Kent, Lucky Strike, Pall Mall, Rothmans, Newport (U.S.), Natural American Spirit (U.S.) and Camel (U.S.), which now account for 66% of our combustible volume. Our combustibles business is founded on understanding and meeting the preferences of adult smokers in all parts of the world. Highlights Group value share was down 40 bps, driven by the U.S., down 60 bps, and APMEA, down 60 bps, partially offset by AME, which was flat versus 2022. Volume share flat versus 2022. Strong price/mix +7.5%. Value and Volume Share Group cigarette value share was 40 bps lower in 2023 (2022: flat), mainly driven by the U.S. (down 60 bps). This combined with lower cigarette value share in Japan, Brazil, South Korea, New Zealand, Australia and Canada, was partially offset by higher value share in Mexico, Italy, Bangladesh, Germany, Spain and France. Group cigarette volume share was flat in 2023 (2022: down 20 bps). In 2023, the Group grew volume share in Bangladesh, Ukraine, Mexico, Italy, Spain, Pakistan, France, Colombia and Germany. However, this was offset by Japan, Brazil, South Korea, the U.S., Switzerland, Australia, the Czech Republic, Canada and Romania. In 2022, this was a decrease of 20 bps driven by lower volume share in Brazil, Bangladesh, the U.S., South Korea, Russia, Poland, Romania, Canada and Germany, more than offsetting growth in Japan, Pakistan, Colombia, Spain and Saudi Arabia. 38 Number of cigarette factories in 36 countries Change in cigarette value share in key markets (bps) -40bps 2023 2022 -40 -40 flat Definition: Annual change in cigarette value share – being the value of cigarettes bought by consumers of the Group’s brands in key markets as a proportion of the total value of cigarettes bought by consumers in those markets (see page 333). Volume Performance In 2023, Group cigarette volume was down 8.2%, at 555 billion sticks (2022: down 5.1% to 605 billion), with the total cigarette market returning to a more normalised decline of 11%, having been largely stable in 2022. Volume declined in the U.S. in both 2023 and 2022 (discussed below). Both years were also impacted by disposals partway through the year (or in the comparison year) as the Group disposed of its businesses in Russia and Belarus in 2023 and Iran partway through 2021. In 2023, volume was also down in Pakistan, driven by significant excise increases. This was partly offset by volume growth in Bangladesh, Brazil and Türkiye. In 2022, volume was down in Türkiye, Germany, Nigeria and Chile, largely due to an increase in illicit trade and a return to more normalised market performance post COVID-19. In addition, volume grew in both years in Brazil (due to lower illicit trade) and Bangladesh (due to the strength of the local portfolio). Also in 2022, as travel restrictions started to relax, our Global Travel Retail business began to recover, having negatively impacted Group cigarette and HP volume by an estimated 1.0% compared to pre-pandemic levels. In the U.S., industry volume declined 7.5%, having declined 10% in 2022, largely driven by macro-economic pressures impacting consumer behaviour. As a result of our premium-skewed portfolio, combustibles volume was down 11.4% (2022: down 15.4% to 59 billion), with downtrading driving a greater proportional effect on the Group. In addition, cigarette volume was negatively impacted by the flavour ban in California and the increase of solus-usage of alternative nicotine products, driven by the growth of illicit single-use Vapour products. The movement in 2022 was partly impacted by trade inventory movements (mainly linked to the timing of price increases and uncertainty about a potential excise increase) in the final quarter of 2021, which benefited 2021 by an estimated £200 million and was partially unwound in 2022. Change in cigarette volume share in key markets (bps) flat 2023 2022 -20 flat -20 Definition: Annual change in cigarette volume share – being the number of cigarettes bought by consumers of the Group’s brands in key markets as a proportion of the total cigarettes bought by consumers in those markets (see page 333). BAT Annual Report and Form 20-F 2023 Strategic Report Governance Report Financial Statements Other Information Our Combustible Products 37
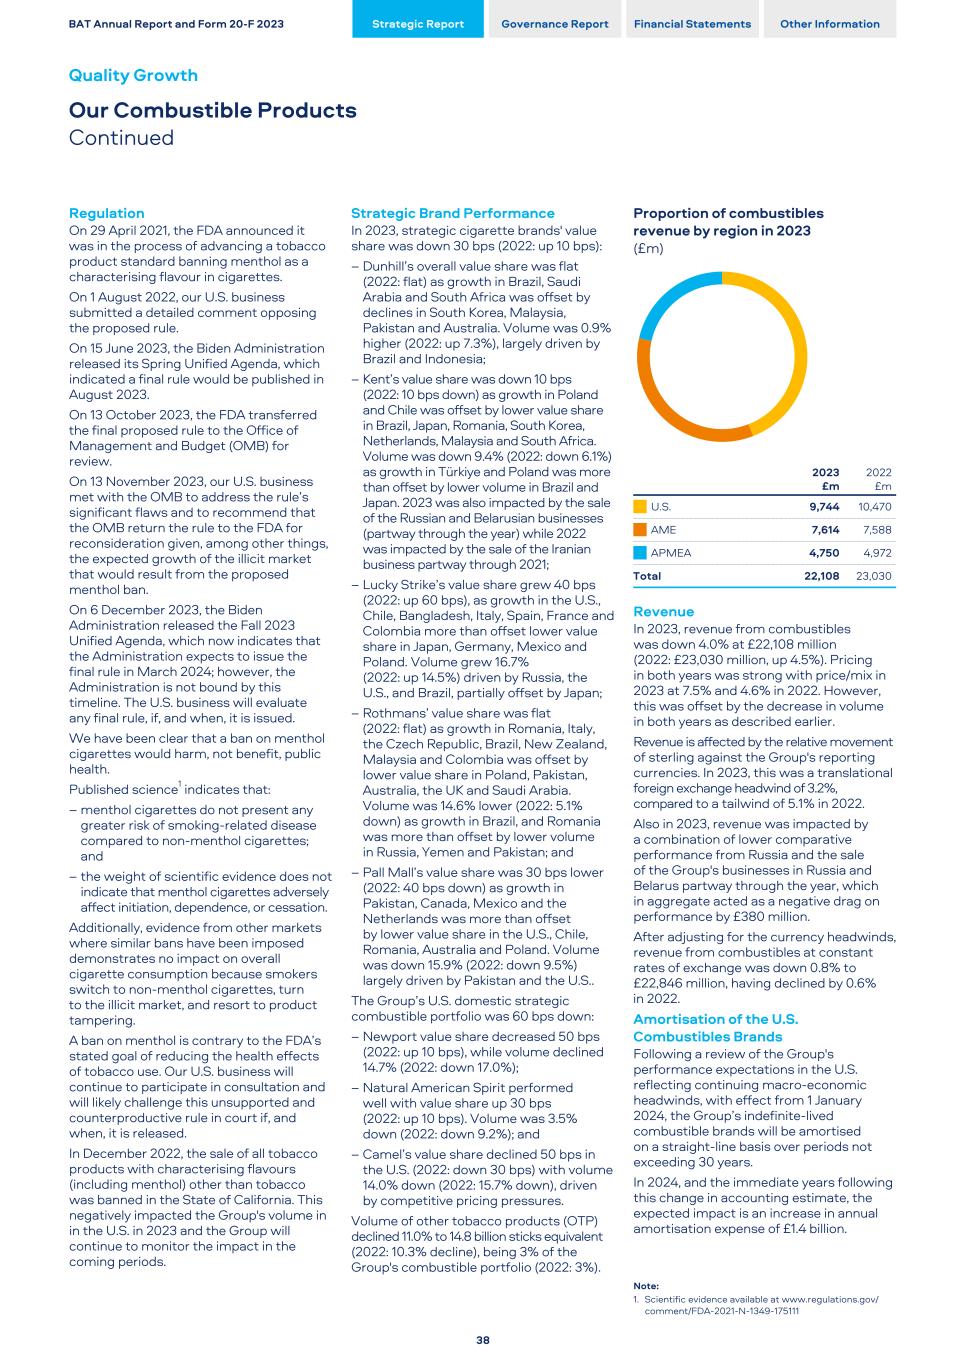
Regulation On 29 April 2021, the FDA announced it was in the process of advancing a tobacco product standard banning menthol as a characterising flavour in cigarettes. On 1 August 2022, our U.S. business submitted a detailed comment opposing the proposed rule. On 15 June 2023, the Biden Administration released its Spring Unified Agenda, which indicated a final rule would be published in August 2023. On 13 October 2023, the FDA transferred the final proposed rule to the Office of Management and Budget (OMB) for review. On 13 November 2023, our U.S. business met with the OMB to address the rule’s significant flaws and to recommend that the OMB return the rule to the FDA for reconsideration given, among other things, the expected growth of the illicit market that would result from the proposed menthol ban. On 6 December 2023, the Biden Administration released the Fall 2023 Unified Agenda, which now indicates that the Administration expects to issue the final rule in March 2024; however, the Administration is not bound by this timeline. The U.S. business will evaluate any final rule, if, and when, it is issued. We have been clear that a ban on menthol cigarettes would harm, not benefit, public health. Published science1 indicates that: – menthol cigarettes do not present any greater risk of smoking-related disease compared to non-menthol cigarettes; and – the weight of scientific evidence does not indicate that menthol cigarettes adversely affect initiation, dependence, or cessation. Additionally, evidence from other markets where similar bans have been imposed demonstrates no impact on overall cigarette consumption because smokers switch to non-menthol cigarettes, turn to the illicit market, and resort to product tampering. A ban on menthol is contrary to the FDA’s stated goal of reducing the health effects of tobacco use. Our U.S. business will continue to participate in consultation and will likely challenge this unsupported and counterproductive rule in court if, and when, it is released. In December 2022, the sale of all tobacco products with characterising flavours (including menthol) other than tobacco was banned in the State of California. This negatively impacted the Group's volume in in the U.S. in 2023 and the Group will continue to monitor the impact in the coming periods. Strategic Brand Performance In 2023, strategic cigarette brands' value share was down 30 bps (2022: up 10 bps): – Dunhill’s overall value share was flat (2022: flat) as growth in Brazil, Saudi Arabia and South Africa was offset by declines in South Korea, Malaysia, Pakistan and Australia. Volume was 0.9% higher (2022: up 7.3%), largely driven by Brazil and Indonesia; – Kent’s value share was down 10 bps (2022: 10 bps down) as growth in Poland and Chile was offset by lower value share in Brazil, Japan, Romania, South Korea, Netherlands, Malaysia and South Africa. Volume was down 9.4% (2022: down 6.1%) as growth in Türkiye and Poland was more than offset by lower volume in Brazil and Japan. 2023 was also impacted by the sale of the Russian and Belarusian businesses (partway through the year) while 2022 was impacted by the sale of the Iranian business partway through 2021; – Lucky Strike’s value share grew 40 bps (2022: up 60 bps), as growth in the U.S., Chile, Bangladesh, Italy, Spain, France and Colombia more than offset lower value share in Japan, Germany, Mexico and Poland.. Volume grew 16.7% (2022: up 14.5%) driven by Russia, the U.S., and Brazil, partially offset by Japan; – Rothmans’ value share was flat (2022: flat) as growth in Romania, Italy, the Czech Republic, Brazil, New Zealand, Malaysia and Colombia was offset by lower value share in Poland, Pakistan, Australia, the UK and Saudi Arabia. Volume was 14.6% lower (2022: 5.1% down) as growth in Brazil, and Romania was more than offset by lower volume in Russia, Yemen and Pakistan; and – Pall Mall’s value share was 30 bps lower (2022: 40 bps down) as growth in Pakistan, Canada, Mexico and the Netherlands was more than offset by lower value share in the U.S., Chile, Romania, Australia and Poland. Volume was down 15.9% (2022: down 9.5%) largely driven by Pakistan and the U.S.. The Group’s U.S. domestic strategic combustible portfolio was 60 bps down: – Newport value share decreased 50 bps (2022: up 10 bps), while volume declined 14.7% (2022: down 17.0%); – Natural American Spirit performed well with value share up 30 bps (2022: up 10 bps). Volume was 3.5% down (2022: down 9.2%); and – Camel’s value share declined 50 bps in the U.S. (2022: down 30 bps) with volume 14.0% down (2022: 15.7% down), driven by competitive pricing pressures. Volume of other tobacco products (OTP) declined 11.0% to 14.8 billion sticks equivalent (2022: 10.3% decline), being 3% of the Group's combustible portfolio (2022: 3%). Proportion of combustibles revenue by region in 2023 (£m) 2023 £m 2022 £m U.S. 9,744 10,470 AME 7,614 7,588 APMEA 4,750 4,972 Total 22,108 23,030 Revenue In 2023, revenue from combustibles was down 4.0% at £22,108 million (2022: £23,030 million, up 4.5%). Pricing in both years was strong with price/mix in 2023 at 7.5% and 4.6% in 2022. However, this was offset by the decrease in volume in both years as described earlier. Revenue is affected by the relative movement of sterling against the Group's reporting currencies. In 2023, this was a translational foreign exchange headwind of 3.2%, compared to a tailwind of 5.1% in 2022. Also in 2023, revenue was impacted by a combination of lower comparative performance from Russia and the sale of the Group's businesses in Russia and Belarus partway through the year, which in aggregate acted as a negative drag on performance by £380 million. After adjusting for the currency headwinds, revenue from combustibles at constant rates of exchange was down 0.8% to £22,846 million, having declined by 0.6% in 2022. Amortisation of the U.S. Combustibles Brands Following a review of the Group's performance expectations in the U.S. reflecting continuing macro-economic headwinds, with effect from 1 January 2024, the Group’s indefinite-lived combustible brands will be amortised on a straight-line basis over periods not exceeding 30 years. In 2024, and the immediate years following this change in accounting estimate, the expected impact is an increase in annual amortisation expense of £1.4 billion. Note: 1. Scientific evidence available at www.regulations.gov/ comment/FDA-2021-N-1349-175111 BAT Annual Report and Form 20-F 2023 Strategic Report Governance Report Financial Statements Other Information Quality Growth Our Combustible Products Continued 38
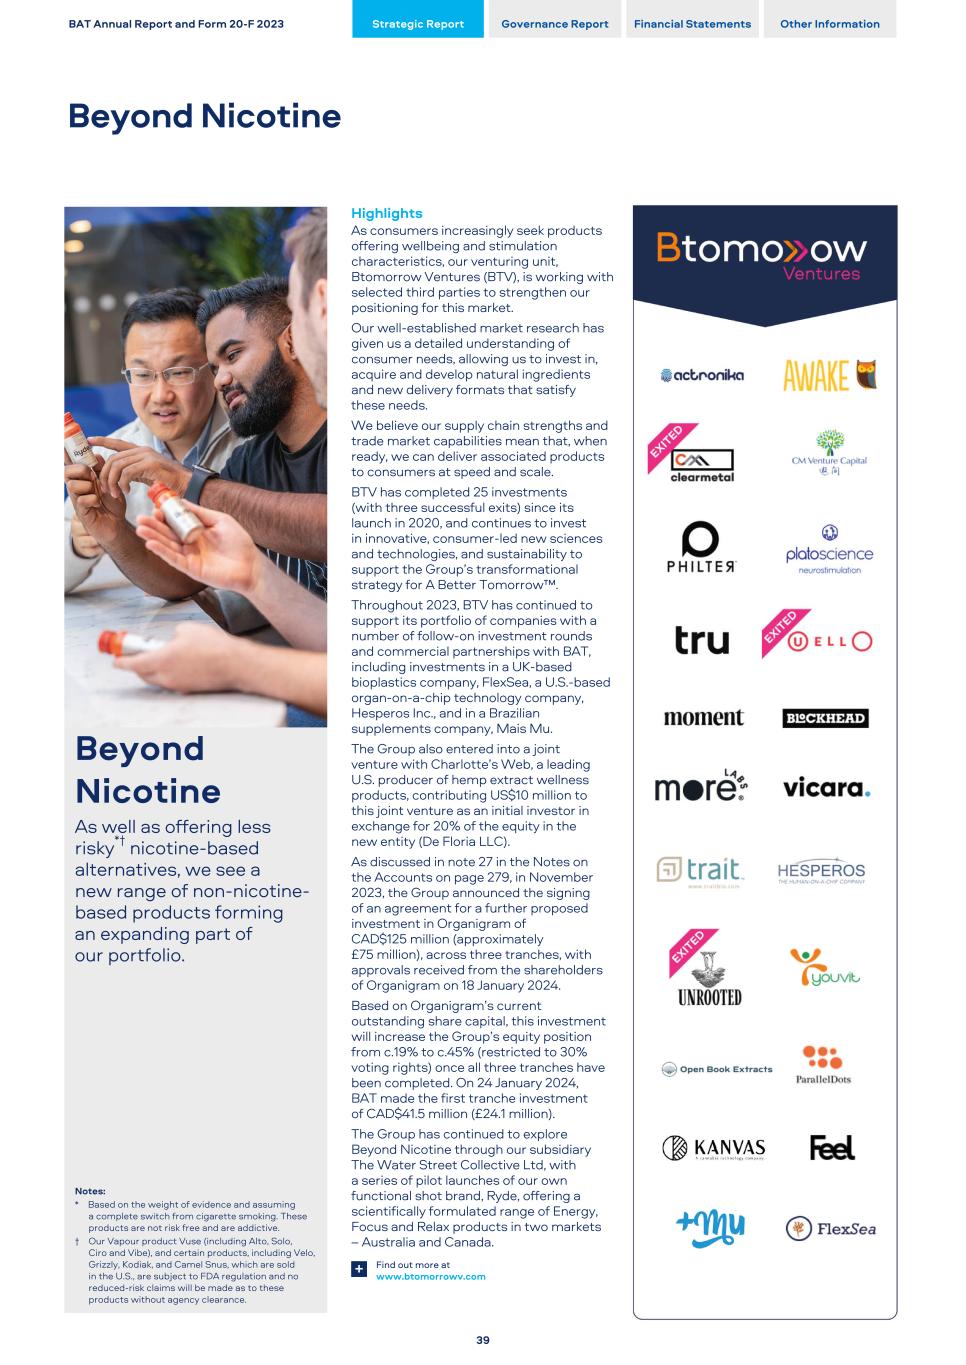
Beyond Nicotine As well as offering less risky*† nicotine-based alternatives, we see a new range of non-nicotine- based products forming an expanding part of our portfolio. Notes: * Based on the weight of evidence and assuming a complete switch from cigarette smoking. These products are not risk free and are addictive. † Our Vapour product Vuse (including Alto, Solo, Ciro and Vibe), and certain products, including Velo, Grizzly, Kodiak, and Camel Snus, which are sold in the U.S., are subject to FDA regulation and no reduced-risk claims will be made as to these products without agency clearance. Highlights As consumers increasingly seek products offering wellbeing and stimulation characteristics, our venturing unit, Btomorrow Ventures (BTV), is working with selected third parties to strengthen our positioning for this market. Our well-established market research has given us a detailed understanding of consumer needs, allowing us to invest in, acquire and develop natural ingredients and new delivery formats that satisfy these needs. We believe our supply chain strengths and trade market capabilities mean that, when ready, we can deliver associated products to consumers at speed and scale. BTV has completed 25 investments (with three successful exits) since its launch in 2020, and continues to invest in innovative, consumer-led new sciences and technologies, and sustainability to support the Group’s transformational strategy for A Better Tomorrow™. Throughout 2023, BTV has continued to support its portfolio of companies with a number of follow-on investment rounds and commercial partnerships with BAT, including investments in a UK-based bioplastics company, FlexSea, a U.S.-based organ-on-a-chip technology company, Hesperos Inc., and in a Brazilian supplements company, Mais Mu. The Group also entered into a joint venture with Charlotte’s Web, a leading U.S. producer of hemp extract wellness products, contributing US$10 million to this joint venture as an initial investor in exchange for 20% of the equity in the new entity (De Floria LLC). As discussed in note 27 in the Notes on the Accounts on page 279, in November 2023, the Group announced the signing of an agreement for a further proposed investment in Organigram of CAD$125 million (approximately £75 million), across three tranches, with approvals received from the shareholders of Organigram on 18 January 2024. Based on Organigram’s current outstanding share capital, this investment will increase the Group’s equity position from c.19% to c.45% (restricted to 30% voting rights) once all three tranches have been completed. On 24 January 2024, BAT made the first tranche investment of CAD$41.5 million (£24.1 million). The Group has continued to explore Beyond Nicotine through our subsidiary The Water Street Collective Ltd, with a series of pilot launches of our own functional shot brand, Ryde, offering a scientifically formulated range of Energy, Focus and Relax products in two markets – Australia and Canada. Find out more at www.btomorrowv.com+ BAT Annual Report and Form 20-F 2023 Strategic Report Governance Report Financial Statements Other Information Beyond Nicotine 39
Dynamic Business The Dynamic Business pillar envisages a future-fit, data-driven organisation; ensuring we are efficient and effective in all of our operations. This will ensure that we deliver financial flexibility to invest in our business, people and products to win in a fast changing environment and deliver superior returns to our investors. The key building blocks of the Dynamic Business pillar are: Exciting, Winning Company Operational Excellence Capital Effectiveness Our commitments under Dynamic Business: Creating a diverse, inclusive and people-oriented place to work Being data-driven and delivering operational excellence/cost management Focused on investors returns An Exciting and Winning Company A Better Tomorrow™ Delivering our refined corporate strategy requires a renewed people strategy, one that is human-centric, enables high performance and accelerates the building of skills and capabilities for multi-category growth. Recognising that it is our people who will deliver our refined strategy, we took the opportunity during 2023 to revise our corporate values. Six 'values' now replace our ethos and will be embedded across the Group to ensure all our people understand what is expected of them to help us Build a Smokeless World. The six 'values' are: – Truly inclusive – Empowered through trust – Stronger together – Love our consumer – Passion to win – Do the right thing Employer brand Our focused efforts in the past years have helped us build a compelling talent brand, attracting 1.5 million LinkedIn followers and being recognised for the sixth consecutive year as a Global Top Employer by the Top Employers Institute. As a result, since 2019, we have onboarded around 3,000 hires with new capabilities critical to delivering our business strategy. We will continue: – Building an exceptional talent brand that attracts broad talent pools; – Delivering desirable experience for hiring managers, recruiters, and candidates, by accelerating our adoption of smarter technology solutions; – Improving hiring capabilities to fit an ever-changing external talent landscape; and – Ensuring data-driven decision making and expanding our external partnership reach to meet our hiring needs. High performance and reward Our reward agenda has been developed to be globally aligned yet locally relevant across our business. This ensures there is a singular focus and line of sight between our executive team and colleagues in all our End Markets. Looking ahead, we will also focus on: – Redefining our definition of employee “Performance”, pivoting to recognise and reward both high impact results and leadership behaviours; – The design of our variable pay programmes, ensuring they continue to be contemporary and attractive and enable the delivery of our refined strategy; and – Further strengthening our employee health and wellbeing propositions, in support of our D&I and sustainability goals. Capabilities and learning Since 2020, we have seen significant growth in learning across BAT. The average number of hours spent learning by each BAT manager has doubled and the amount invested in learning for all our employees has increased by a third. In parallel to this, we have continued to refresh and grow our leadership and functional L&D programmes, increasing the size of our portfolio by 25% since 2020. The focus of the next few years will be on: – Defining the skills profile of the organisation and analysing skills gaps, to facilitate skills-oriented workforce planning, including role based learning solutions; – Capability development in advanced multi-category skills & Transformational leadership capabilities; and – Using technology such as AI and enhancements in Learning Experience Platforms and Learning Management Systems to innovate our employee learning experience, delivery channels and learning content. Inclusion and diversity At BAT, we are proud to be a diverse global organisation that encourages our people to value their differences. In 2020, BAT set new global 2025 Diversity & Inclusion ambitions focused on gender representation at both Senior Leadership and Management levels, diversity of experiences and nationality representation within the Senior Leadership teams. While we have made progress, we need to embrace a wider focus on championing inclusion and achieving equity within our workplace and beyond. A comprehensive and structured framework to further enhance inclusion, diversity and equity will be put in place, focusing on four key areas: – Revised global ambition and KPIs moving towards a broader framework of equity and inclusion with the aim of increasing gender and ethnically diverse representation in our Management teams as well as our Senior Leadership populations; – Policies, practices, and enablers which are best in class and holistic, addressing diverse life-stage and employee needs; – Enhanced approach to building Inclusive Leadership focused on sponsorship, role modelling and walking the talk; and – Our holistic D&I agenda which goes beyond the workplace and into the communities we serve, and partners we work with. For more information on our Employees, Diversity and Culture, see page 88+ BAT Annual Report and Form 20-F 2023 Strategic Report Governance Report Financial Statements Other Information Dynamic Business Strategic Pillar Overview 40
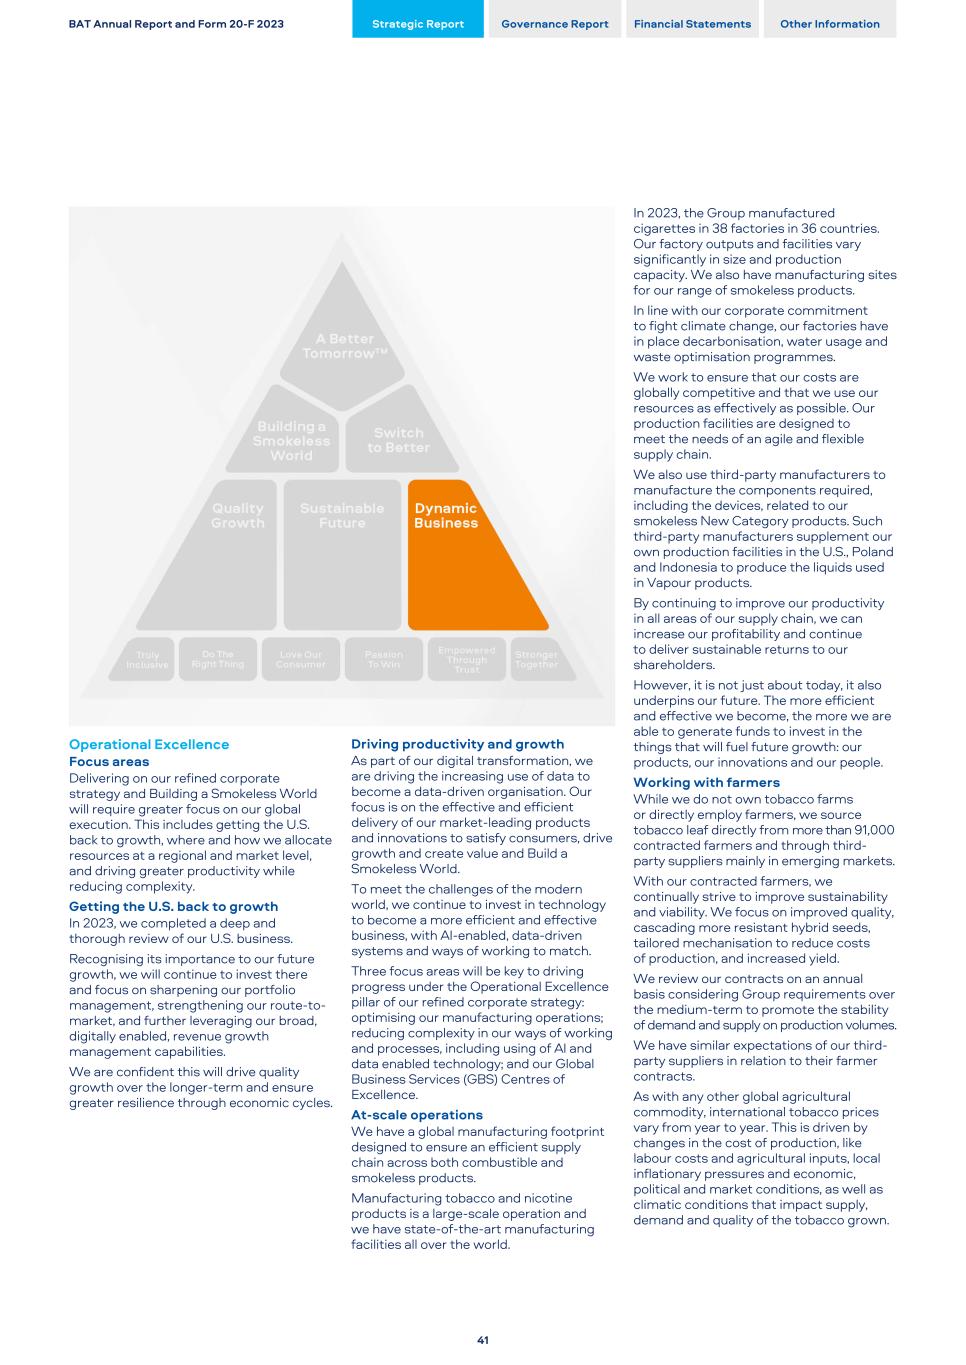
Operational Excellence Focus areas Delivering on our refined corporate strategy and Building a Smokeless World will require greater focus on our global execution. This includes getting the U.S. back to growth, where and how we allocate resources at a regional and market level, and driving greater productivity while reducing complexity. Getting the U.S. back to growth In 2023, we completed a deep and thorough review of our U.S. business. Recognising its importance to our future growth, we will continue to invest there and focus on sharpening our portfolio management, strengthening our route-to- market, and further leveraging our broad, digitally enabled, revenue growth management capabilities. We are confident this will drive quality growth over the longer-term and ensure greater resilience through economic cycles. Driving productivity and growth As part of our digital transformation, we are driving the increasing use of data to become a data-driven organisation. Our focus is on the effective and efficient delivery of our market-leading products and innovations to satisfy consumers, drive growth and create value and Build a Smokeless World. To meet the challenges of the modern world, we continue to invest in technology to become a more efficient and effective business, with AI-enabled, data-driven systems and ways of working to match. Three focus areas will be key to driving progress under the Operational Excellence pillar of our refined corporate strategy: optimising our manufacturing operations; reducing complexity in our ways of working and processes, including using of AI and data enabled technology; and our Global Business Services (GBS) Centres of Excellence. At-scale operations We have a global manufacturing footprint designed to ensure an efficient supply chain across both combustible and smokeless products. Manufacturing tobacco and nicotine products is a large-scale operation and we have state-of-the-art manufacturing facilities all over the world. In 2023, the Group manufactured cigarettes in 38 factories in 36 countries. Our factory outputs and facilities vary significantly in size and production capacity. We also have manufacturing sites for our range of smokeless products. In line with our corporate commitment to fight climate change, our factories have in place decarbonisation, water usage and waste optimisation programmes. We work to ensure that our costs are globally competitive and that we use our resources as effectively as possible. Our production facilities are designed to meet the needs of an agile and flexible supply chain. We also use third-party manufacturers to manufacture the components required, including the devices, related to our smokeless New Category products. Such third-party manufacturers supplement our own production facilities in the U.S., Poland and Indonesia to produce the liquids used in Vapour products. By continuing to improve our productivity in all areas of our supply chain, we can increase our profitability and continue to deliver sustainable returns to our shareholders. However, it is not just about today, it also underpins our future. The more efficient and effective we become, the more we are able to generate funds to invest in the things that will fuel future growth: our products, our innovations and our people. Working with farmers While we do not own tobacco farms or directly employ farmers, we source tobacco leaf directly from more than 91,000 contracted farmers and through third- party suppliers mainly in emerging markets. With our contracted farmers, we continually strive to improve sustainability and viability. We focus on improved quality, cascading more resistant hybrid seeds, tailored mechanisation to reduce costs of production, and increased yield. We review our contracts on an annual basis considering Group requirements over the medium-term to promote the stability of demand and supply on production volumes. We have similar expectations of our third- party suppliers in relation to their farmer contracts. As with any other global agricultural commodity, international tobacco prices vary from year to year. This is driven by changes in the cost of production, like labour costs and agricultural inputs, local inflationary pressures and economic, political and market conditions, as well as climatic conditions that impact supply, demand and quality of the tobacco grown. BAT Annual Report and Form 20-F 2023 Strategic Report Governance Report Financial Statements Other Information 41
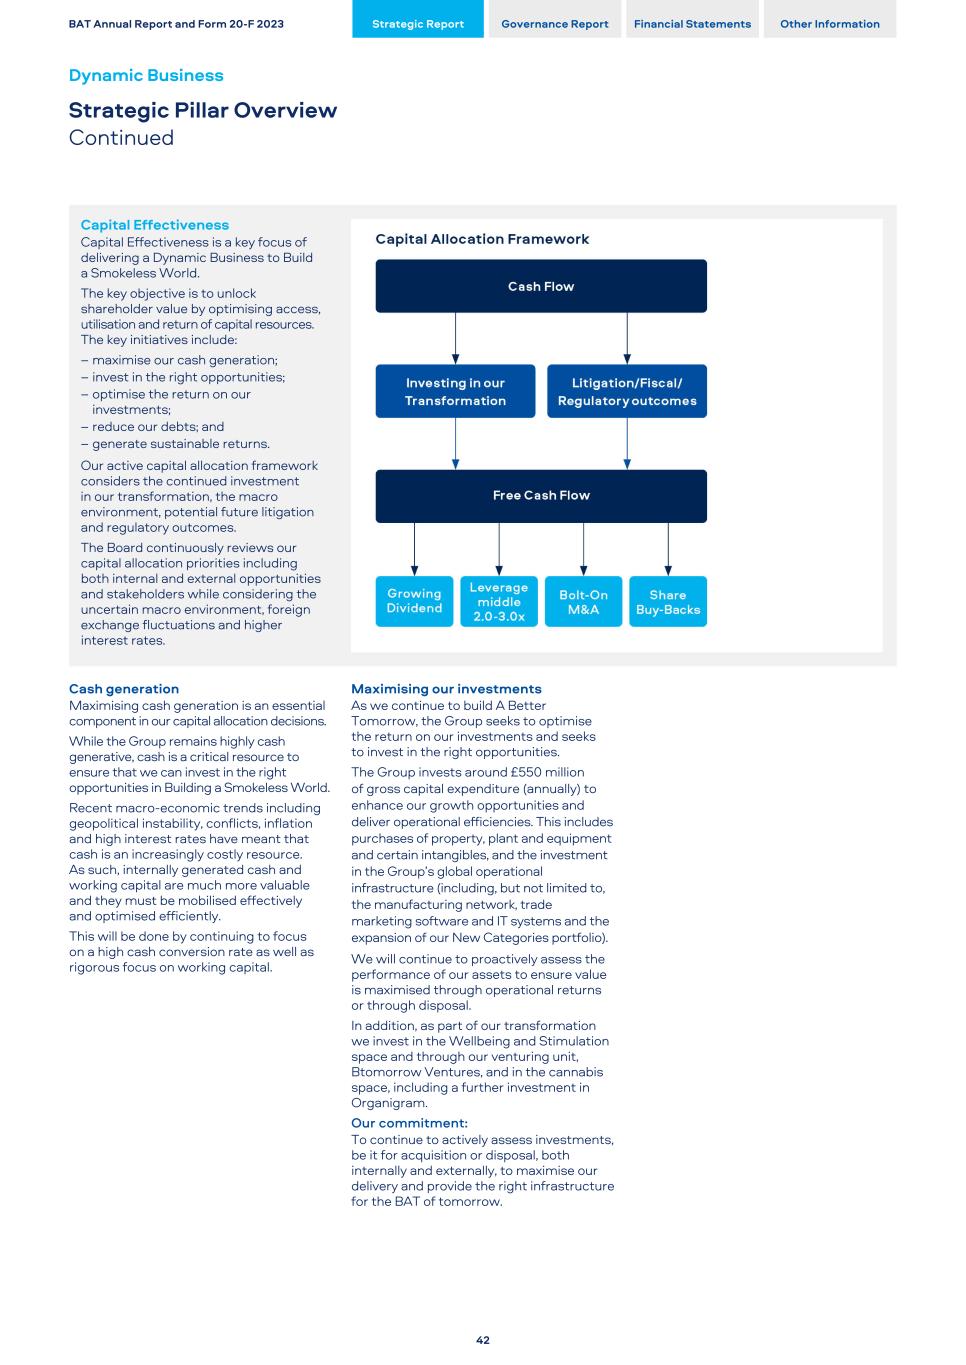
Cash generation Maximising cash generation is an essential component in our capital allocation decisions. While the Group remains highly cash generative, cash is a critical resource to ensure that we can invest in the right opportunities in Building a Smokeless World. Recent macro-economic trends including geopolitical instability, conflicts, inflation and high interest rates have meant that cash is an increasingly costly resource. As such, internally generated cash and working capital are much more valuable and they must be mobilised effectively and optimised efficiently. This will be done by continuing to focus on a high cash conversion rate as well as rigorous focus on working capital. Maximising our investments As we continue to build A Better Tomorrow, the Group seeks to optimise the return on our investments and seeks to invest in the right opportunities. The Group invests around £550 million of gross capital expenditure (annually) to enhance our growth opportunities and deliver operational efficiencies. This includes purchases of property, plant and equipment and certain intangibles, and the investment in the Group’s global operational infrastructure (including, but not limited to, the manufacturing network, trade marketing software and IT systems and the expansion of our New Categories portfolio). We will continue to proactively assess the performance of our assets to ensure value is maximised through operational returns or through disposal. In addition, as part of our transformation we invest in the Wellbeing and Stimulation space and through our venturing unit, Btomorrow Ventures, and in the cannabis space, including a further investment in Organigram. Our commitment: To continue to actively assess investments, be it for acquisition or disposal, both internally and externally, to maximise our delivery and provide the right infrastructure for the BAT of tomorrow. BAT Annual Report and Form 20-F 2023 Strategic Report Governance Report Financial Statements Other Information Dynamic Business Strategic Pillar Overview Continued 42 Capital Effectiveness Capital Effectiveness is a key focus of delivering a Dynamic Business to Build a Smokeless World. The key objective is to unlock shareholder value by optimising access, utilisation and return of capital resources. The key initiatives include: – maximise our cash generation; – invest in the right opportunities; – optimise the return on our investments; – reduce our debts; and – generate sustainable returns. Our active capital allocation framework considers the continued investment in our transformation, the macro environment, potential future litigation and regulatory outcomes. The Board continuously reviews our capital allocation priorities including both internal and external opportunities and stakeholders while considering the uncertain macro environment, foreign exchange fluctuations and higher interest rates.
Reducing debt Total borrowings (which includes lease liabilities) decreased to £39,730 million in 2023 (2022: £43,139 million). Total borrowings include £700 million (31 December 2022: £798 million) in respect of purchase price adjustments related to the acquisition of Reynolds American Inc. As discussed on page 56, the Group remains confident about its ability to access the debt capital markets successfully and reviews its options on a continuing basis. We have a debt rating of Baa2 (positive outlook), BBB+ (negative outlook), BBB (positive outlook) by Moody's, S&P and Fitch. Given current geopolitical and economic challenges, the Group aims to: – de-lever our gross debt levels (from £39.7 billion in 2023); and – moderate the annual Net Financing Cost levels (which were £1.9 billion in 2023) to support the overall strategy of the Group. This will deliver a resilient balance sheet, able to withstand future uncertainties, while providing increased flexibility for the Group to be able to invest in future growth opportunities and, when our leverage target is reached, sustainably return excess cash to shareholders. This will also de-risk the future solvency and liquidity risk as referred to on page 126, whereby the Group's ability to refinance debt as it matures will be enhanced. Our commitment: To retire debt in a sustainable manner, reducing our risk of refinancing and net finance cost exposures. Our record: Since the acquisition of Reynolds American Inc. in 2017, we have consistently reduced our borrowings from £49.1 billion to £39.7 billion at 31 December 2023. Generate sustainable returns Generating shareholder value, via sustainable returns, is an integral part of our strategic ambition. Over the past 25 years we have consistently grown the dividend per ordinary share on absolute terms. On 8 February 2024, the Company announced that the Board had declared an interim dividend of 235.52p per ordinary share of 25p, payable in four equal quarterly instalments of 58.88p per ordinary share in May 2024, August 2024, November 2024 and February 2025. This represents an increase of 2.0% on 2022 (2022: 230.90p per share, up 1.0%). In 2023, the Board prioritised strengthening the balance sheet to provide greater business reliance during an uncertain macro-economic environment, whilst aiming to reduce leverage more quickly. As such, there were no share buy-backs in 2023. However, we strongly believe that share buy-backs have an important role to play within our capital allocation framework. Our commitment: Progressive increase in dividend – in £ terms, by reference to the Group’s dividend policy which is to pay dividends of 65% of long-term sustainable earnings. Please refer to the dividend policy on page 388. Buy-back shares in a sustainable programme, once the leverage ratio reaches our target leverage range. Our record: In the last three years, we have returned: – £5.1 billion (2022: £4.9 billion; 2021: £4.9 billion) via dividends; and – £2.0 billion via share buy-backs in 2022. Since 2019, we have returned a total of £26.2 billion to shareholders. BAT Annual Report and Form 20-F 2023 Strategic Report Governance Report Financial Statements Other Information 43
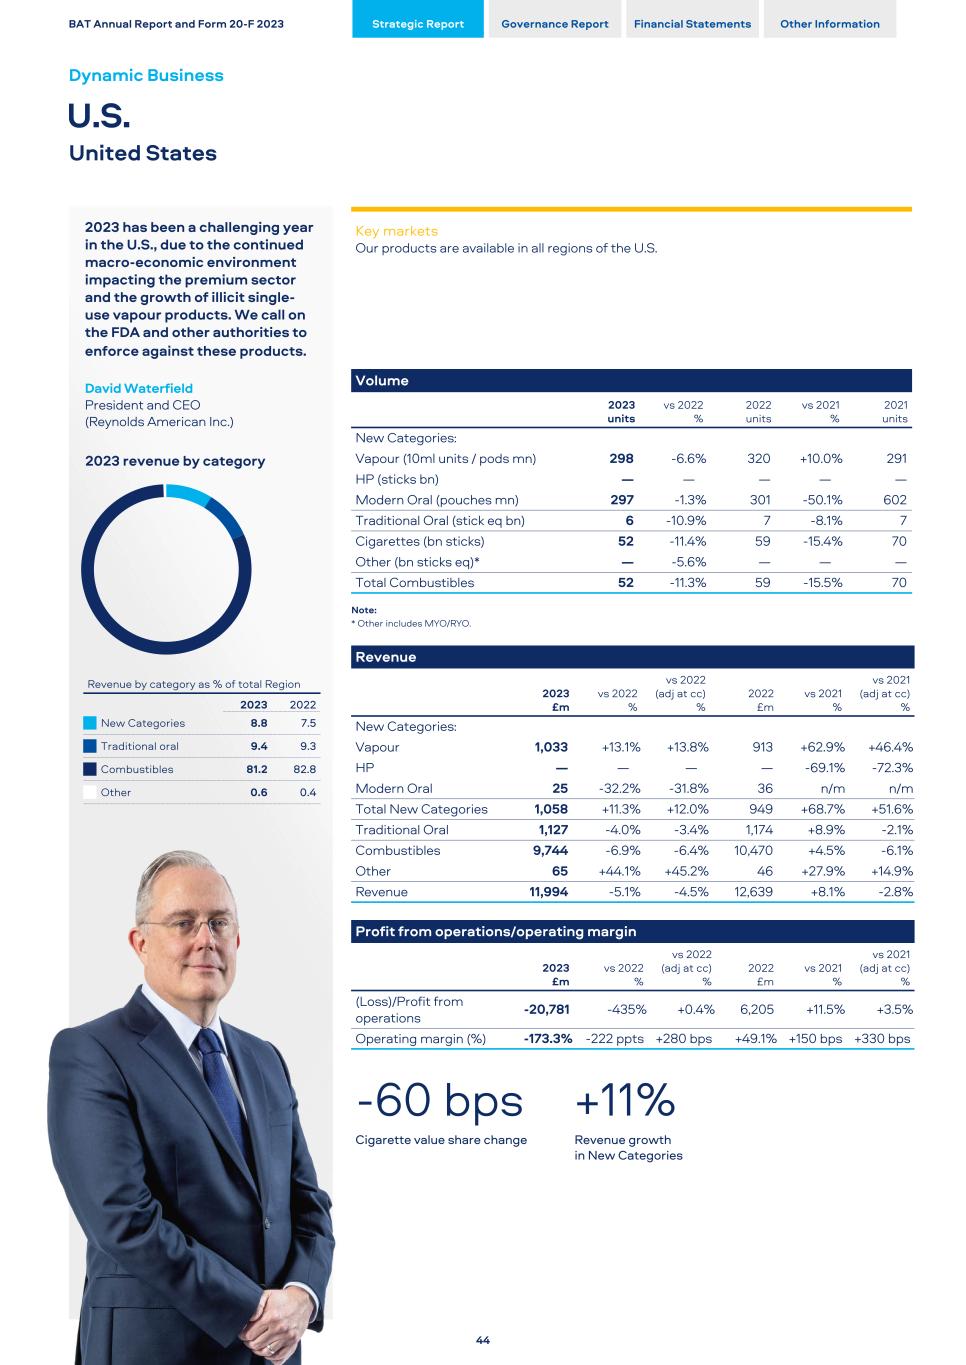
2023 has been a challenging year in the U.S., due to the continued macro-economic environment impacting the premium sector and the growth of illicit single- use vapour products. We call on the FDA and other authorities to enforce against these products. David Waterfield President and CEO (Reynolds American Inc.) 2023 revenue by category Revenue by category as % of total Region 2023 2022 New Categories 8.8 7.5 Traditional oral 9.4 9.3 Combustibles 81.2 82.8 Other 0.6 0.4 Key markets Our products are available in all regions of the U.S. Volume 2023 units vs 2022 % 2022 units vs 2021 % 2021 units New Categories: Vapour (10ml units / pods mn) 298 -6.6 % 320 +10.0 % 291 HP (sticks bn) — — — — — Modern Oral (pouches mn) 297 -1.3 % 301 -50.1 % 602 Traditional Oral (stick eq bn) 6 -10.9 % 7 -8.1 % 7 Cigarettes (bn sticks) 52 -11.4 % 59 -15.4 % 70 Other (bn sticks eq)* — -5.6 % — — — Total Combustibles 52 -11.3 % 59 -15.5 % 70 Note: * Other includes MYO/RYO. Revenue 2023 £m vs 2022 % vs 2022 (adj at cc) % 2022 £m vs 2021 % vs 2021 (adj at cc) % New Categories: Vapour 1,033 +13.1 % +13.8 % 913 +62.9 % +46.4 % HP — — — — -69.1 % -72.3 % Modern Oral 25 -32.2 % -31.8 % 36 n/m n/m Total New Categories 1,058 +11.3 % +12.0 % 949 +68.7 % +51.6 % Traditional Oral 1,127 -4.0 % -3.4 % 1,174 +8.9 % -2.1 % Combustibles 9,744 -6.9 % -6.4 % 10,470 +4.5 % -6.1 % Other 65 +44.1 % +45.2 % 46 +27.9 % +14.9 % Revenue 11,994 -5.1 % -4.5 % 12,639 +8.1 % -2.8 % Profit from operations/operating margin 2023 £m vs 2022 % vs 2022 (adj at cc) % 2022 £m vs 2021 % vs 2021 (adj at cc) % (Loss)/Profit from operations -20,781 -435 % +0.4 % 6,205 +11.5 % +3.5 % Operating margin (%) -173.3 % -222 ppts +280 bps +49.1 % +150 bps +330 bps -60 bps +11% Cigarette value share change Revenue growth in New Categories BAT Annual Report and Form 20-F 2023 Strategic Report Governance Report Financial Statements Other Information Dynamic Business U.S. United States 44
Revenue and Profit from Operations In 2023, reported revenue declined 5.1% to £11,994 million, with 2022 up 8.1% to £12,639 million. Excluding the impact of translational foreign exchange, this was a decline of 4.5% in 2023 (2022: down 2.8%). Continued growth in New Categories and pricing in combustibles in both years was more than offset by lower combustibles volume (down 11.3% in 2023 and 15.5% in 2022). 2023 was negatively impacted by the continued pressure of macro-economic headwinds, squeezing consumer affordability (which particularly impacted the Group's premium skewed portfolio) and the impact of the flavour ban in California (which particularly impacted Newport and Camel) and growth in illicit single-use vapour products. 2022 was negatively impacted by the unwind of trade inventory movements in 2021. Reported profit from operations declined 435% to a loss of £20,781 million in 2023 (2022: up 11.5% to a profit of £6,205 million). The movement in 2023 was largely due to the £4.3 billion impairment of goodwill and £23.0 billion impairment largely in respect of the carrying value of some of the Group's acquired U.S. combustibles brands. 2022 was negatively impacted by adjusting charges that were largely in respect of our restructuring programme (Quantum), including the factory rationalisation, which did not repeat in 2023. Translational foreign exchange was a headwind of 0.6% in 2023 (2022: 12.9% tailwind). Also in 2023, an extreme weather event caused the destruction of a warehouse and stock of tobacco leaf, the impact of which was a charge of £9 million. Excluding the adjusting items and the impact of translational foreign exchange, adjusted profit from operations increased by 0.4% (2022: 3.5% increase) on a constant currency basis. Following a review of the Group's expectations from the U.S. combustibles market reflecting continuing macro- economic headwinds, from 1 January 2024, the Group will commence amortising the remaining U.S. combustible brands (Newport, Camel, Natural American Spirit and Pall Mall) over a period not exceeding 30 years. The non-cash charge is estimated to be £1.4 billion per year and will be treated as an adjusting item. Please refer to note 12 in the notes on the accounts. New Categories The U.S. is the world's largest Vapour market. In 2023, Vuse continued to perform well, building on the momentum from 2022 with a continued improvement in financial performance. Having become the market leader by Vapour value share in 2022, Vuse extended leadership in value share (of total Vapour in tracked channels) by 470 bps to 45.6%, (having increased 840 bps to 40.9 in 2022). Revenue was up 13.1% to £1,033 million (2022: up 62.9% to £913 million) being an increase of 13.8% (2022: increase of 46.4%) at constant rates of exchange. This growth was driven by pricing in both years (2023: +20.4%; 2022: +36.4%), more than offsetting a decrease in Vapour consumable volume of 6.6% in 2023 (2022: up 10%) which was driven by the growth of illicit single-use nicotine products which we estimate to be more than 60% of the total Vapour market. The single-use nicotine Vapour category grew driven by the availability of flavours. These products, including synthetic single- use nicotine Vapour products, are subject to the FDA's jurisdiction and are required to receive PMTA authorisation to remain on the market. We welcome the recent actions from the FDA with regards to the illicit single-use Vapour products in the U.S. and we continue to engage with stakeholders to facilitate the removal of unauthorised products. We believe that public health officials, legislators, and regulators — especially the FDA — should be concerned about the continued influx of illegal single-use vapour products, particularly into the U.S. market. It is unacceptable that these products, marketed in youth-appealing flavours such as Bubble Gum and Cotton Candy, continue to be sold. We call on the FDA, in conjunction with state and local authorities, to strongly enforce against these products. We are disappointed by the FDA’s Marketing Denial Orders (MDOs) for Vuse Alto’s Menthol** and Mixed Berry products. We are challenging these denials and have obtained a permanent stay of enforcement allowing Vuse Alto Menthol to remain on the market. We remain confident in our PMTA submission for Vuse Alto and we continue to innovate across our Vuse portfolio to meet the needs of our adult consumers. In Modern Oral, volume decreased by 1.3% (2022: down 50%) with volume share down 200 bps in 2023, having declined 580 bps in 2022. Modern Oral revenue declined to £25 million (2022: £36 million), as we reinvested in trade activation plans through trade investment (leading to a reduction in net pricing of 30.5% in 2023) while we continue to await the outcome of our PMTA submission for our successful European product, Velo 2.0. We are encouraged by the strong results from our recent Velo pilot in New York, including a more premium brand expression and design, with a national roll-out to commence in 2024. Combustibles Combustibles revenue was 6.9% lower in 2023 at £9,744 million (2022: up 4.5% to £10,470 million). Excluding a marginal translational foreign exchange headwind of 0.5% in 2023 (2022: 10.6% tailwind), this was a decrease of 6.4% (2022: down 6.1%). In response to the macro-economic pressures impacting consumer affordability, the positive impact from pricing was more moderate in 2023 at +4.9% (2022: +9.4%) and was more than offset by a decline in volume of 11.3% to 52 billion sticks in 2023, having declined 15.5% (to 59 billion) in 2022. Both years were negatively impacted by the continued pressure of macro-economic headwinds and, in 2023, the impact of the flavour ban in California (which particularly impacted Newport and Camel) and growth of illicit single-use vapour products as consumers increased polyusage. Accordingly, industry volume was down 7% (2022: down 10%), with the Group underperforming the market due to the premium skewed portfolio and the higher exposure to the menthol category. The performance in 2022 was impacted by the 2021 movements in trade inventory (mainly linked to the timing of price increases and uncertainty about a potential excise increase), which benefited 2021 by an estimated £200 million and was partially unwound in 2022. Total volume share declined 10 bps (2022: 30 bps decrease). Value share of cigarettes declined 60 bps (2022: up 10 bps), largely due to the premium portfolio. In December 2022, the sale of all tobacco products with characterising flavours (including menthol) other than tobacco were banned in the State of California. We continue to monitor the proposed tobacco product standards regarding menthol in cigarettes. Please see page 38 for a discussion on the developments during 2023. Also, as stated on page 38, based upon the published science, we believe that a ban on menthol cigarettes would negatively affect, not benefit, public health. We believe a ban on menthol is contrary to the FDA’s stated goal of reducing the health effects of tobacco use. Traditional Oral Traditional Oral revenue declined 4.0% (2022: up 8.9%), being a decline of 3.4% (2022: 2.1% lower) at constant rates of exchange, as pricing in both years was more than offset by the lower volume, down 10.9% in 2023 and 8.1% in 2022, with higher decline in volume in 2023 due to the normalisation of inventory levels (being a drag of 1.7%). Both 2023 and 2022 were negatively impacted by strong macro-economic headwinds leading to downtrading, accelerated cross-category switching and reduced consumption. Value share of Traditional Oral was up 40 bps (2022: down 50 bps*), while volume share was down 20 bps (2022: down 70 bps). The decline in 2023 was driven by strong macro-economic headwinds leading to consumer changing behaviour, impacting our premium skewed portfolio. Notes: * U.S. industry Traditional Oral growth was rebased in 2023, leading to a revision to the growth previously reported for 2022, from +60 bps to +50 bps. ** Menthol variants accounted for approximately 65% of total Vuse consumables in 2023. BAT Annual Report and Form 20-F 2023 Strategic Report Governance Report Financial Statements Other Information 45
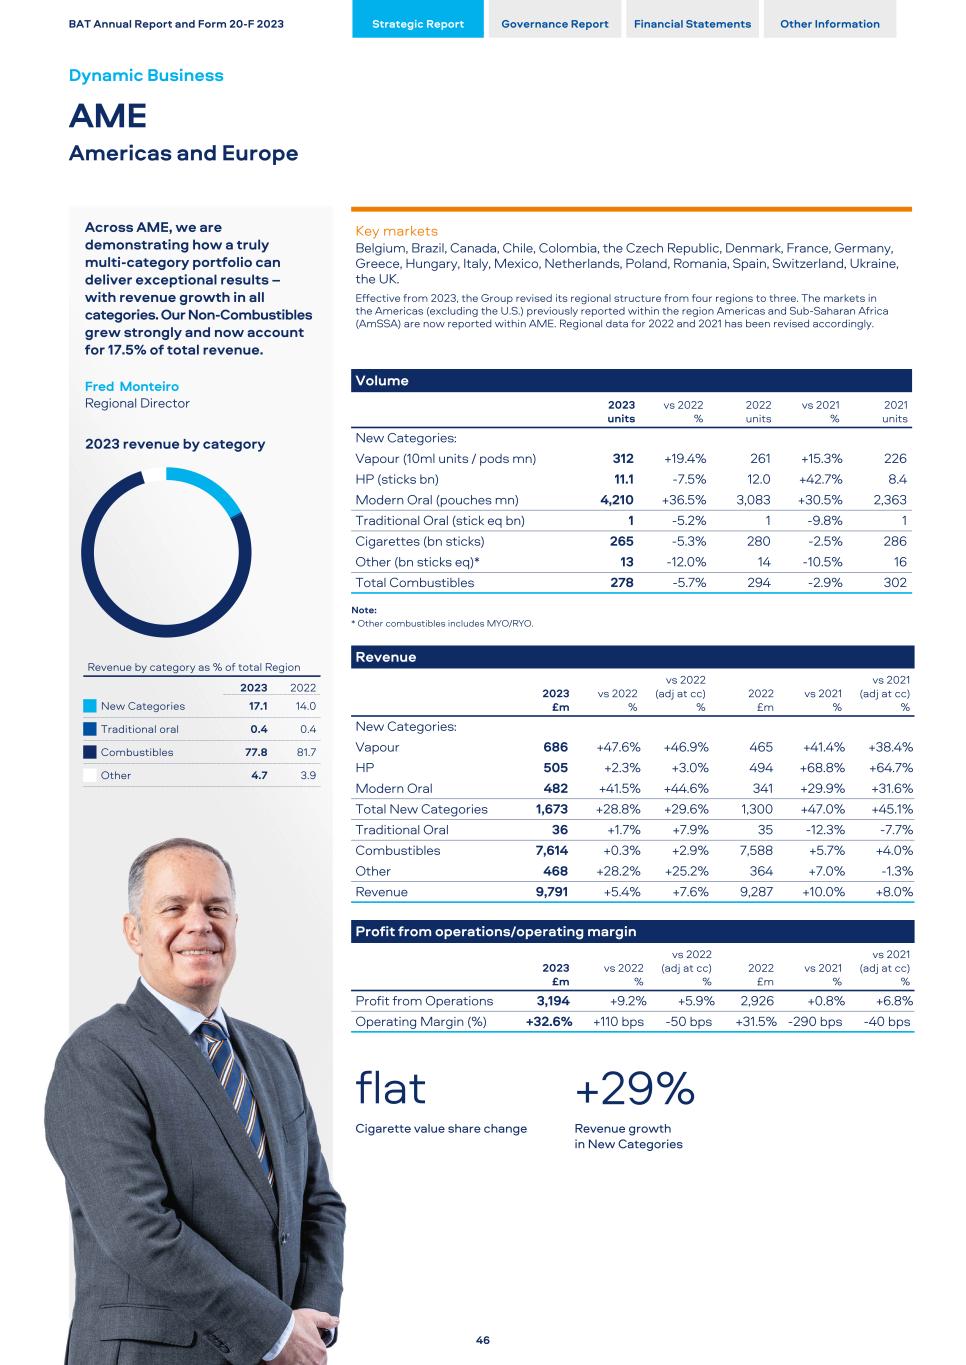
Across AME, we are demonstrating how a truly multi-category portfolio can deliver exceptional results – with revenue growth in all categories. Our Non-Combustibles grew strongly and now account for 17.5% of total revenue. Fred Monteiro Regional Director 2023 revenue by category Revenue by category as % of total Region 2023 2022 New Categories 17.1 14.0 Traditional oral 0.4 0.4 Combustibles 77.8 81.7 Other 4.7 3.9 Key markets Belgium, Brazil, Canada, Chile, Colombia, the Czech Republic, Denmark, France, Germany, Greece, Hungary, Italy, Mexico, Netherlands, Poland, Romania, Spain, Switzerland, Ukraine, the UK. Effective from 2023, the Group revised its regional structure from four regions to three. The markets in the Americas (excluding the U.S.) previously reported within the region Americas and Sub-Saharan Africa (AmSSA) are now reported within AME. Regional data for 2022 and 2021 has been revised accordingly. Volume 2023 units vs 2022 % 2022 units vs 2021 % 2021 units New Categories: Vapour (10ml units / pods mn) 312 +19.4 % 261 +15.3 % 226 HP (sticks bn) 11.1 -7.5 % 12.0 +42.7 % 8.4 Modern Oral (pouches mn) 4,210 +36.5 % 3,083 +30.5 % 2,363 Traditional Oral (stick eq bn) 1 -5.2 % 1 -9.8 % 1 Cigarettes (bn sticks) 265 -5.3 % 280 -2.5 % 286 Other (bn sticks eq)* 13 -12.0 % 14 -10.5 % 16 Total Combustibles 278 -5.7 % 294 -2.9 % 302 Note: * Other combustibles includes MYO/RYO. Revenue 2023 £m vs 2022 % vs 2022 (adj at cc) % 2022 £m vs 2021 % vs 2021 (adj at cc) % New Categories: Vapour 686 +47.6 % +46.9 % 465 +41.4 % +38.4 % HP 505 +2.3 % +3.0 % 494 +68.8 % +64.7 % Modern Oral 482 +41.5 % +44.6 % 341 +29.9 % +31.6 % Total New Categories 1,673 +28.8 % +29.6 % 1,300 +47.0 % +45.1 % Traditional Oral 36 +1.7 % +7.9 % 35 -12.3 % -7.7 % Combustibles 7,614 +0.3 % +2.9 % 7,588 +5.7 % +4.0 % Other 468 +28.2 % +25.2 % 364 +7.0 % -1.3 % Revenue 9,791 +5.4 % +7.6 % 9,287 +10.0 % +8.0 % Profit from operations/operating margin 2023 £m vs 2022 % vs 2022 (adj at cc) % 2022 £m vs 2021 % vs 2021 (adj at cc) % Profit from Operations 3,194 +9.2 % +5.9 % 2,926 +0.8 % +6.8 % Operating Margin (%) +32.6 % +110 bps -50 bps +31.5 % -290 bps -40 bps flat +29% Cigarette value share change Revenue growth in New Categories BAT Annual Report and Form 20-F 2023 Strategic Report Governance Report Financial Statements Other Information Dynamic Business AME Americas and Europe 46
Revenue and Profit from Operations Reported revenue in 2023 was 5.4% higher than 2022 (2022: up 10.0%) driven by price/ mix in combustibles (of 8.6% in 2023 and 6.9% in 2022) and the continued growth in New Categories revenue (2023: up 29%, 2022: up 47%). This was, in both years, partly offset by lower combustible volume (down 5.7% in 2023 and 2.9% lower in 2022). 2023 was impacted by a £456 million negative drag on the regional performance which comprises the combined impact of a lower performance from Russia compared to 2022 and the timing of the sale of the Group's businesses in Russia and Belarus partway through the year. Translational foreign exchange was a headwind in 2023 of 2.2%, compared to a tailwind of 2.0% in 2022. Excluding the impact of currency, revenue grew 7.6% on a constant rates basis (2022: up 8.0%), driven by higher revenue in Germany, Türkiye, Poland and Brazil. Reported profit from operations increased by 9.2% to £3,194 million in 2023, having grown 0.8% to £2,926 million in 2022. Both years were affected by a number of adjusting items. These were, in aggregate, charges of £266 million in 2023 compared to charges of £422 million in 2022. In summary these were: – charges of £353 million in 2023, including the reclassification of foreign exchange reserves, related to the sale of the Group's businesses in Russia and Belarus. These businesses were classified as held- for-sale at 31 December 2022 with a charge of £612 million in 2022 - please refer to note 6 in the Notes on the Accounts; and – income of £167 million in 2023 (2022: £460 million income) in respect of the recognition of credits regarding the calculation of VAT and excise tax claims in prior periods (as the Group's litigation was successfully concluded in 2022). In 2022, the Group also incurred charges of £202 million in respect of Quantum and the factory rationalisation programme. Excluding the impact of currency and adjusting items (described above), the regional performance was driven by: – Germany and Türkiye (where the combustibles portfolio performed well with higher pricing and volume); – Poland, Sweden and the Czech Republic, which all improved their New Category financial performance; and – Ukraine, where the Group had temporarily suspended operations in the first six months of 2022; partly offset by: – the timing of the sale, partway through the year, of the Group's businesses in Russia and Belarus, which, combined with a lower comparative operational performance, was a negative drag of £126 million. At constant rates of exchange, adjusted profit from operations was up 5.9% in 2023 (2022: up 6.8%). New Categories Revenue from Vapour was up 47.6% in 2023, maintaining the momentum after having grown 41.4% in 2022. This was driven by higher volume (up 19.4% in 2023 and 15.3% in 2022) and strong pricing (higher by 27.5% in 2023 and 23.1% in 2022). Positive regulatory developments enabled our entrance into a number of emerging markets (Colombia, Paraguay, Peru), and the roll-out of Vuse Go in a number of markets (including Italy, Germany, Poland, the Czech Republic, Switzerland and Romania). We continue to approach the growing modern single-use product category in a responsible way (through Underage Access Prevention programmes and enhanced product Take- Back schemes). However, the growth of the single-use segment in 2022 and 2023 has impacted our value share of total Vapour across a number of markets. For example: – In France, we maintained value share leadership, with value share flat at 38.8%; – In Germany, we lost value share leadership despite an increase of 500 bps to 25.9%*; – In the UK, our value share declined 440 bps to 10.3%. In Canada, volume declined 23%, yet Vuse maintained its leadership position with total value share at 92.5% (up 210 bps*) in 2023, having grown 890 bps in2022. In 2023, HP volume declined by 7.5% (2022: up 43%), with revenue 2.3% higher at £505 million (2022: up 68.8% to £494 million). The region now represents 46.7% of our global HP volume. In 2023, our HP performance was negatively impacted by the timing of the sale of the Group's businesses in Russia and Belarus, which offset the performance in Italy, the Czech Republic, Poland and Romania. Our aggregate category volume share in key HP markets (excluding Russia as that market has ceased to be a key market for the Group), reached 18.2%, down 30 bps*. In 2023, the HP portfolio was extended with the launch of veo across key European markets (such as Poland, Romania, Germany, the Czech Republic and Greece). In 2023, Modern Oral revenue grew 41.5% (2022: up 29.9%), led by 36.5% volume growth (2022: 30.5% increase). During 2023, we increased our geographic footprint with expansion of Modern Oral into Finland, Italy and France. We remain the clear market leaders (by volume share) in 14 Modern Oral markets. From a high base, volume share was marginally lower at 67.0%, down 170 bps. As the Modern Oral category continues to grow and becomes more established in Europe, we continue to see strong growth in adult consumer numbers. In Sweden, Velo is the largest (by volume share) of any snus or Modern Oral nicotine pouch brand**. Combustibles In 2023, revenue was 0.3% higher, compared to an increase of 5.7% in 2022. Favourable price/mix in both years (of 8.6% in 2023 and 6.9% in 2022) was offset by the impact of lower combustible volume, down 5.7% in 2023 and 2.9% in 2022. Excluding the impact of translational foreign exchange, at constant rates of exchange, revenue increased 2.9% (2022: 4.0%). The decrease in combustible volume in 2023 was driven by the sale of the Group's businesses in Russia and Belarus partway through the year and lower volume in Canada, Chile and Romania. These more than offset a recovery in Türkiye and Germany (having been a contributing factor in the regional volume decline in 2022), the continued improvement in volume in Brazil, which benefited from lower illicit trade in both years, and higher volume in Mexico and Italy. Cigarette value share was flat in 2023. Higher value share in Mexico, Italy, Germany, Spain, France and Colombia was offset by lower value share in Brazil, the UK, Canada, the Czech Republic and Denmark, while 2022 was down 30 bps. Cigarette volume share grew 10 bps (2022: down 30 bps) with volume share up in Ukraine, Mexico, Italy, Spain, France, Colombia and Germany, partially offset by reductions in Brazil, Switzerland, Belgium, Romania, the Czech Republic, Canada, the UK, Greece and Poland. Notes: * Following rebasing of third party databases, the 2022 value share for the Group was revised in Germany (from 21.4% to 21.1%) and in Canada (from 89.5% to 90.4%). This impacted the Group's total HP value share in 2022, lowering the 2022 value share from 18.7% to 18.5%. ** Source: Kantar New Category Tracker. BAT Annual Report and Form 20-F 2023 Strategic Report Governance Report Financial Statements Other Information 47
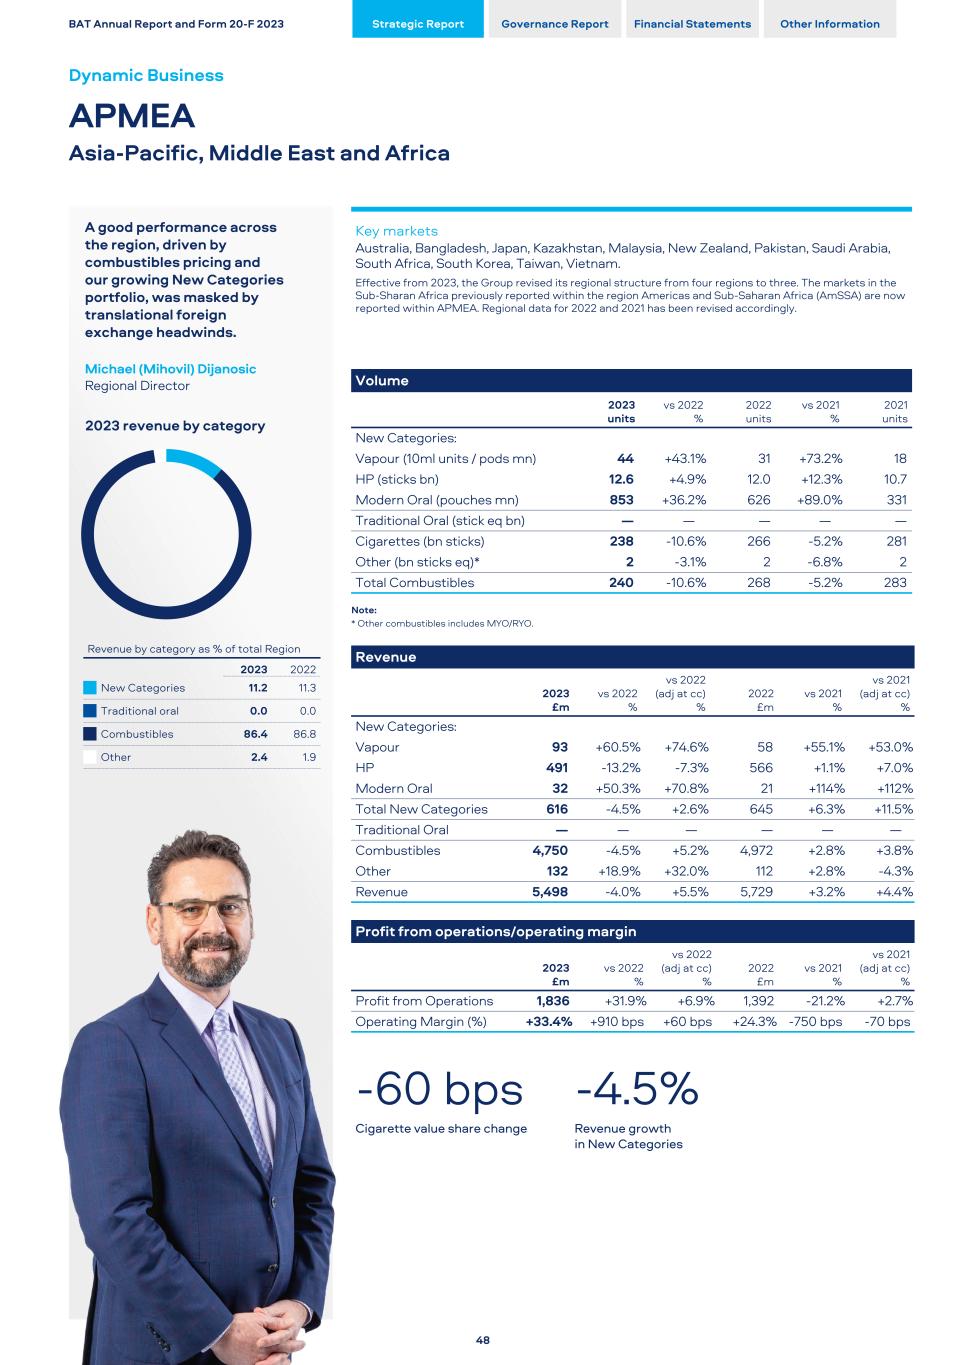
A good performance across the region, driven by combustibles pricing and our growing New Categories portfolio, was masked by translational foreign exchange headwinds. Michael (Mihovil) Dijanosic Regional Director 2023 revenue by category Revenue by category as % of total Region 2023 2022 New Categories 11.2 11.3 Traditional oral 0.0 0.0 Combustibles 86.4 86.8 Other 2.4 1.9 Key markets Australia, Bangladesh, Japan, Kazakhstan, Malaysia, New Zealand, Pakistan, Saudi Arabia, South Africa, South Korea, Taiwan, Vietnam. Effective from 2023, the Group revised its regional structure from four regions to three. The markets in the Sub-Sharan Africa previously reported within the region Americas and Sub-Saharan Africa (AmSSA) are now reported within APMEA. Regional data for 2022 and 2021 has been revised accordingly. Volume 2023 units vs 2022 % 2022 units vs 2021 % 2021 units New Categories: Vapour (10ml units / pods mn) 44 +43.1 % 31 +73.2 % 18 HP (sticks bn) 12.6 +4.9 % 12.0 +12.3 % 10.7 Modern Oral (pouches mn) 853 +36.2 % 626 +89.0 % 331 Traditional Oral (stick eq bn) — — — — — Cigarettes (bn sticks) 238 -10.6 % 266 -5.2 % 281 Other (bn sticks eq)* 2 -3.1 % 2 -6.8 % 2 Total Combustibles 240 -10.6 % 268 -5.2 % 283 Note: * Other combustibles includes MYO/RYO. Revenue 2023 £m vs 2022 % vs 2022 (adj at cc) % 2022 £m vs 2021 % vs 2021 (adj at cc) % New Categories: Vapour 93 +60.5 % +74.6 % 58 +55.1 % +53.0 % HP 491 -13.2 % -7.3 % 566 +1.1 % +7.0 % Modern Oral 32 +50.3 % +70.8 % 21 +114 % +112 % Total New Categories 616 -4.5 % +2.6 % 645 +6.3 % +11.5 % Traditional Oral — — — — — — Combustibles 4,750 -4.5 % +5.2 % 4,972 +2.8 % +3.8 % Other 132 +18.9 % +32.0 % 112 +2.8 % -4.3 % Revenue 5,498 -4.0 % +5.5 % 5,729 +3.2 % +4.4 % Profit from operations/operating margin 2023 £m vs 2022 % vs 2022 (adj at cc) % 2022 £m vs 2021 % vs 2021 (adj at cc) % Profit from Operations 1,836 +31.9 % +6.9 % 1,392 -21.2 % +2.7 % Operating Margin (%) +33.4 % +910 bps +60 bps +24.3 % -750 bps -70 bps -60 bps -4.5% Cigarette value share change Revenue growth in New Categories BAT Annual Report and Form 20-F 2023 Strategic Report Governance Report Financial Statements Other Information Dynamic Business APMEA Asia-Pacific, Middle East and Africa 48
Revenue and Profit from Operations Reported revenue declined 4.0% to £5,498 million (2022: increased 3.2% to £5,729 million). Our reported performance is affected by translational foreign exchange, which was a headwind in both years. Excluding the impact of this translational foreign exchange, revenue was up 5.5% against 2022, itself an increase of 4.4% compared to 2021, at constant rates. The performance in both 2023 and 2022 was driven by the continued growth in New Categories and favourable pricing in combustibles (2023: 15.8%; 2022: 9.0%). These more than offset lower combustibles volume (down 10.6% in 2023 and 5.2% in 2022). In 2022, volume benefited (compared to 2021) from the emerging market recovery from COVID-19, although this was partly offset by the sale of the Group's Iranian business midway through 2021. Reported profit from operations increased 31.9% to £1,836 million, while 2022 was down 21.2% to £1,392 million. In 2022, the Group recognised a number of charges that impacted the reported performance in that year and, because they did not repeat to the scale of the prior year, led to a commensurate increase in performance in 2023. These included: – charges related to the allegation of historical breaches of sanctions (of which £450 million was recognised in 2022, with a further £75 million recognised in 2023, as described on page 52 and in note 6(h) in the Notes on the Accounts on page 227); – the exit from Egypt (£118 million); and – a charge of £79 million (related to the conclusion of the investigation into alleged violations of the Nigerian Competition and Consumer Protection Act and National Tobacco Control Act). Excluding adjusting items and the translational foreign exchange headwind, the performance was driven by: – Pakistan where pricing more than offset a reduction in combustibles volume; – Sri Lanka, largely due to pricing in combustibles as macro-economic stability returned; – Uzbekistan, driven by combustibles pricing; and – Asset sales in West Africa related to various market exits. These more than offset a decline in Japan, largely due to the highly competitive pricing environment in combustibles and HP (including the final step in the five-year excise harmonisation programme). Adjusted profit from operations at constant rates of exchange increased 6.9% in 2023, having increased 2.7% in 2022. The growth in 2022 was negatively impacted by the sale of the Iranian business, due to its timing midway through 2021. New Categories Total revenue from New Categories declined 4.5% to £616 million (2022: increased 6.3% to £645 million), as the translational foreign exchange headwinds more than offset (in 2023) the operating performance in the markets. On a constant currency basis, revenue from New Categories increased 2.6% in 2023 and 11.5% in 2022. Excluding translational foreign exchange, which we believe reflects the operational performance, this was driven by: – Vapour, with revenue up 74.6% in 2023 (2022: up 53.0%) driven by a combination of higher volume (up 43.1% in 2023 and 73.2% in 2022) and price/mix in 2023 of +31.5% led by South Africa, New Zealand, Malaysia and Indonesia. In 2022, price mix was a negative drag of 20.2% due to discounting in New Zealand in response to a competitive pricing environment; and – Modern Oral, as revenue grew 70.8% in 2023, led by higher volume (up 36.2%) and price/mix of 34.6%. In 2022, revenue increased by 112%, driven by volume (up 89.0%) and price/mix (up 22.9%). This was mainly driven by strong volume performances in Pakistan and Kenya. In Pakistan, through stronger consumer acquisition, we have achieved our highest active consumer base (as a % of population) in Modern Oral globally. In Kenya, our accelerated national roll-out in January 2023 has driven a near fourfold increase in adult consumer numbers. However, HP revenue declined 7.3% in 2023, after a period of growth (2022: up 7.0%). The decline in 2023 was despite a further increase in consumable volume (up 4.9% to 12.6 billion sticks), as this was more than offset by the competitive pricing environment in Japan which included the final step in the five-year excise harmonisation programme, leading to a decline in regional price/mix of 12.2%. In Japan, the largest HP market in the world, glo performed well. glo's volume share in Japan started to stabilise in Q3 2023, driven by the activation of our commercial plans. Combustibles Revenue from combustibles declined by 4.5% to £4,750 million (2022: up 2.8% to £4,972 million), with both years impacted by the translational foreign exchange headwind. At constant rates of exchange, revenue increased 5.2% in 2023 and by 3.8% in 2022. In 2023, this was driven by combustibles pricing of 15.8%, notably in Pakistan, which more than offset a decrease in total combustible volume of 10.6%, as lower volume in Pakistan more than outweighed higher volume in Bangladesh. This compares to 2022, when the revenue growth was driven by improved pricing (up 9.0%) and a partial recovery of GTR following the COVID-19 restrictions of 2020 and 2021, which more than offset the negative impact of the sale of the Group's Iranian business midway through 2021. In 2023, value share decreased 60 bps (2022: up 10 bps), with volume share down 20 bps (2022: flat), as volume share gains in Bangladesh and Pakistan were offset by losses in Japan, South Korea, Australia, New Zealand, South Africa and Malaysia. BAT Annual Report and Form 20-F 2023 Strategic Report Governance Report Financial Statements Other Information 49
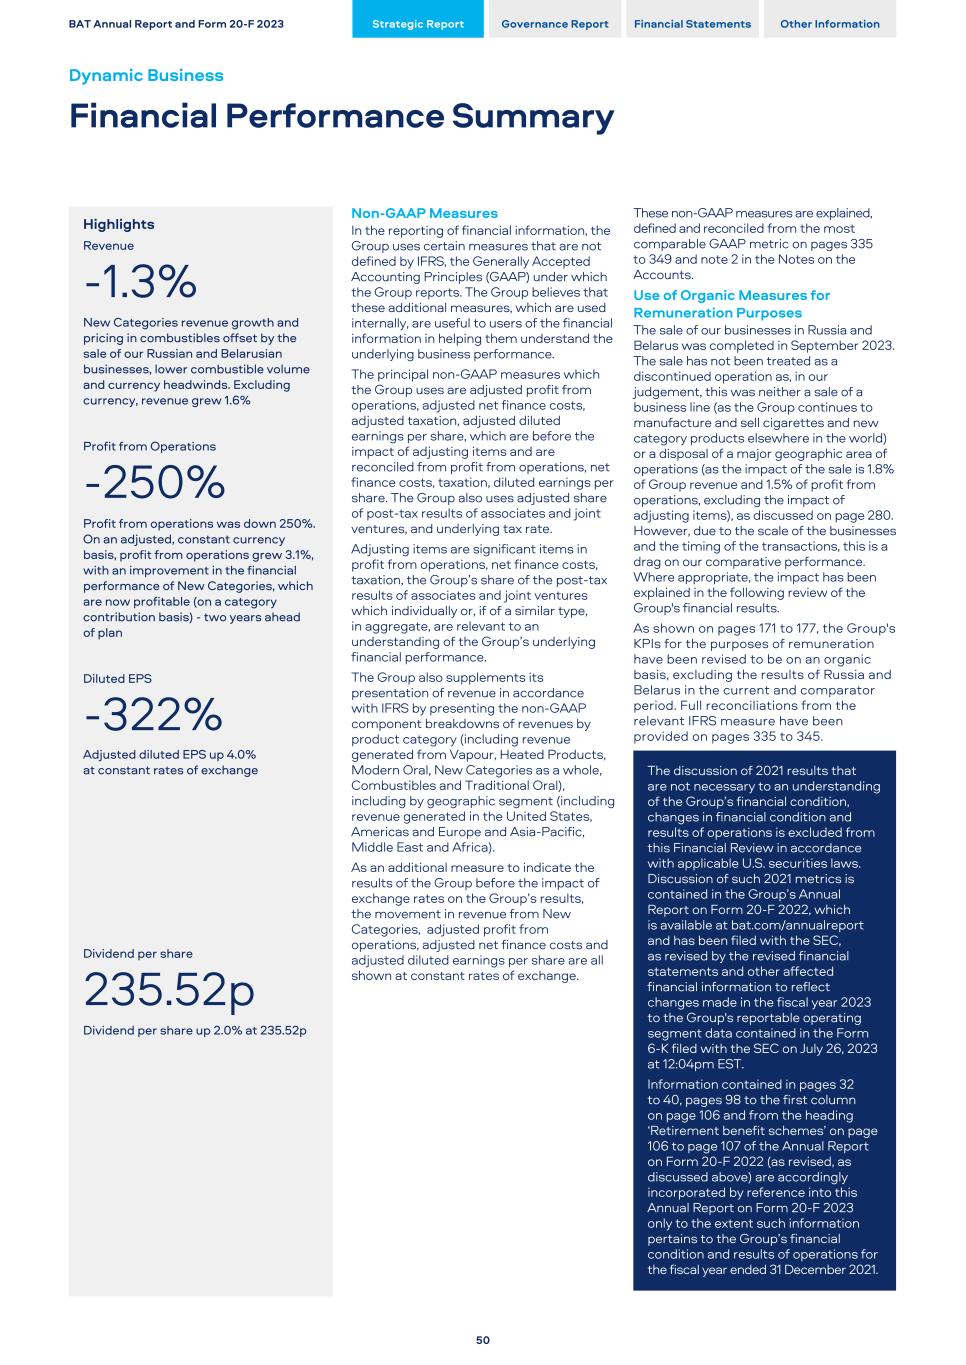
Highlights Revenue -1.3% New Categories revenue growth and pricing in combustibles offset by the sale of our Russian and Belarusian businesses, lower combustible volume and currency headwinds. Excluding currency, revenue grew 1.6% Profit from Operations -250% Profit from operations was down 250%. On an adjusted, constant currency basis, profit from operations grew 3.1%, with an improvement in the financial performance of New Categories, which are now profitable (on a category contribution basis) - two years ahead of plan Diluted EPS -322% Adjusted diluted EPS up 4.0% at constant rates of exchange Dividend per share 235.52p Dividend per share up 2.0% at 235.52p Non-GAAP Measures In the reporting of financial information, the Group uses certain measures that are not defined by IFRS, the Generally Accepted Accounting Principles (GAAP) under which the Group reports. The Group believes that these additional measures, which are used internally, are useful to users of the financial information in helping them understand the underlying business performance. The principal non-GAAP measures which the Group uses are adjusted profit from operations, adjusted net finance costs, adjusted taxation, adjusted diluted earnings per share, which are before the impact of adjusting items and are reconciled from profit from operations, net finance costs, taxation, diluted earnings per share. The Group also uses adjusted share of post-tax results of associates and joint ventures, and underlying tax rate. Adjusting items are significant items in profit from operations, net finance costs, taxation, the Group’s share of the post-tax results of associates and joint ventures which individually or, if of a similar type, in aggregate, are relevant to an understanding of the Group’s underlying financial performance. The Group also supplements its presentation of revenue in accordance with IFRS by presenting the non-GAAP component breakdowns of revenues by product category (including revenue generated from Vapour, Heated Products, Modern Oral, New Categories as a whole, Combustibles and Traditional Oral), including by geographic segment (including revenue generated in the United States, Americas and Europe and Asia-Pacific, Middle East and Africa). As an additional measure to indicate the results of the Group before the impact of exchange rates on the Group’s results, the movement in revenue from New Categories, adjusted profit from operations, adjusted net finance costs and adjusted diluted earnings per share are all shown at constant rates of exchange. These non-GAAP measures are explained, defined and reconciled from the most comparable GAAP metric on pages 335 to 349 and note 2 in the Notes on the Accounts. Use of Organic Measures for Remuneration Purposes The sale of our businesses in Russia and Belarus was completed in September 2023. The sale has not been treated as a discontinued operation as, in our judgement, this was neither a sale of a business line (as the Group continues to manufacture and sell cigarettes and new category products elsewhere in the world) or a disposal of a major geographic area of operations (as the impact of the sale is 1.8% of Group revenue and 1.5% of profit from operations, excluding the impact of adjusting items), as discussed on page 280. However, due to the scale of the businesses and the timing of the transactions, this is a drag on our comparative performance. Where appropriate, the impact has been explained in the following review of the Group's financial results. As shown on pages 171 to 177, the Group's KPIs for the purposes of remuneration have been revised to be on an organic basis, excluding the results of Russia and Belarus in the current and comparator period. Full reconciliations from the relevant IFRS measure have been provided on pages 335 to 345. The discussion of 2021 results that are not necessary to an understanding of the Group’s financial condition, changes in financial condition and results of operations is excluded from this Financial Review in accordance with applicable U.S. securities laws. Discussion of such 2021 metrics is contained in the Group’s Annual Report on Form 20-F 2022, which is available at bat.com/annualreport and has been filed with the SEC, as revised by the revised financial statements and other affected financial information to reflect changes made in the fiscal year 2023 to the Group's reportable operating segment data contained in the Form 6-K filed with the SEC on July 26, 2023 at 12:04pm EST. Information contained in pages 32 to 40, pages 98 to the first column on page 106 and from the heading ‘Retirement benefit schemes’ on page 106 to page 107 of the Annual Report on Form 20-F 2022 (as revised, as discussed above) are accordingly incorporated by reference into this Annual Report on Form 20-F 2023 only to the extent such information pertains to the Group’s financial condition and results of operations for the fiscal year ended 31 December 2021. BAT Annual Report and Form 20-F 2023 Strategic Report Governance Report Financial Statements Other Information Dynamic Business Financial Performance Summary 50
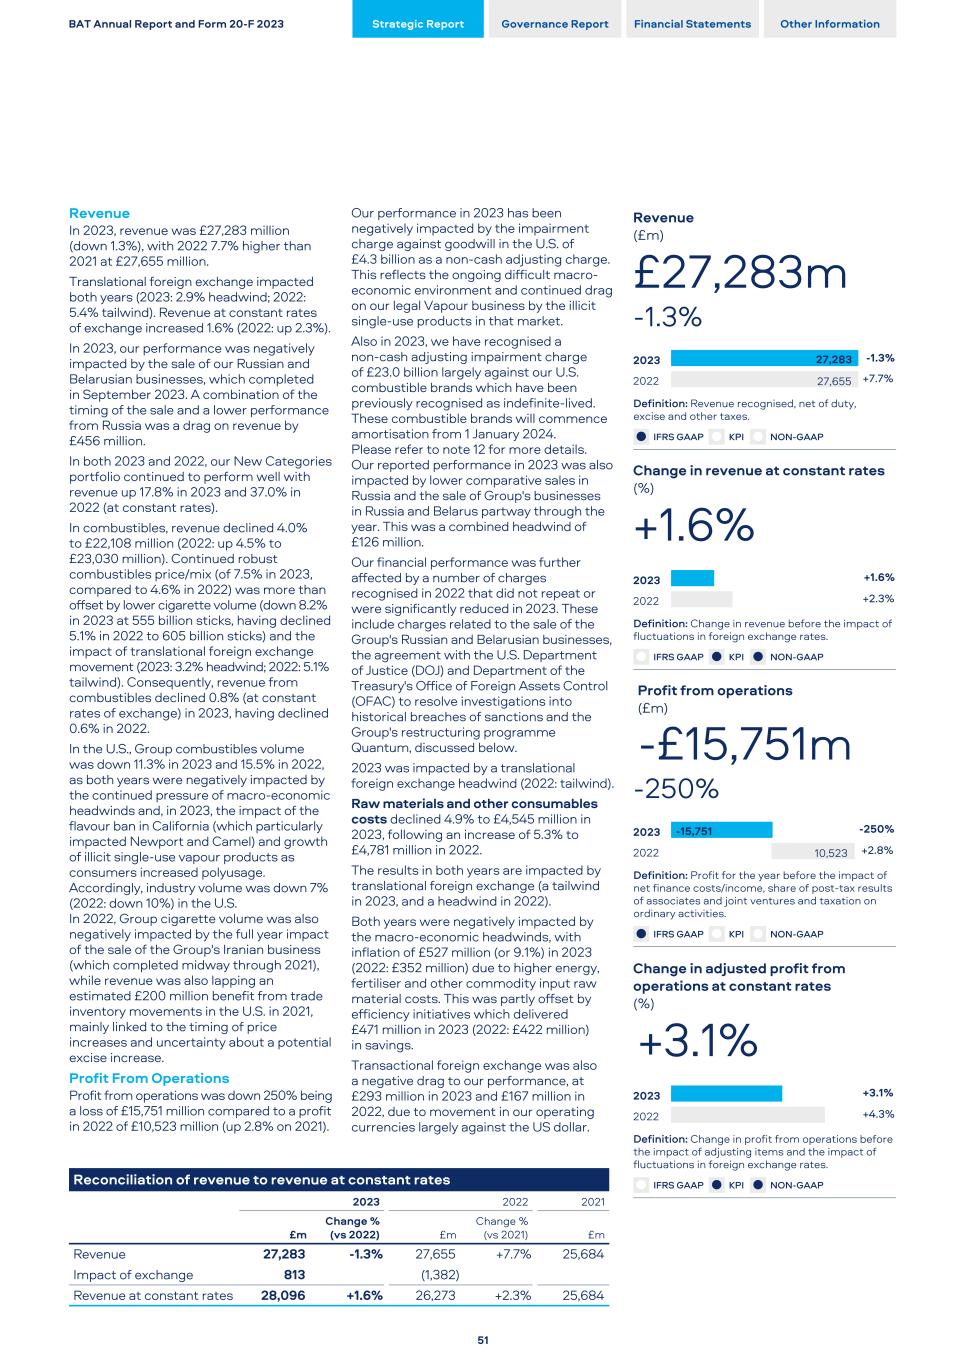
Revenue In 2023, revenue was £27,283 million (down 1.3%), with 2022 7.7% higher than 2021 at £27,655 million. Translational foreign exchange impacted both years (2023: 2.9% headwind; 2022: 5.4% tailwind). Revenue at constant rates of exchange increased 1.6% (2022: up 2.3%). In 2023, our performance was negatively impacted by the sale of our Russian and Belarusian businesses, which completed in September 2023. A combination of the timing of the sale and a lower performance from Russia was a drag on revenue by £456 million. In both 2023 and 2022, our New Categories portfolio continued to perform well with revenue up 17.8% in 2023 and 37.0% in 2022 (at constant rates). In combustibles, revenue declined 4.0% to £22,108 million (2022: up 4.5% to £23,030 million). Continued robust combustibles price/mix (of 7.5% in 2023, compared to 4.6% in 2022) was more than offset by lower cigarette volume (down 8.2% in 2023 at 555 billion sticks, having declined 5.1% in 2022 to 605 billion sticks) and the impact of translational foreign exchange movement (2023: 3.2% headwind; 2022: 5.1% tailwind). Consequently, revenue from combustibles declined 0.8% (at constant rates of exchange) in 2023, having declined 0.6% in 2022. In the U.S., Group combustibles volume was down 11.3% in 2023 and 15.5% in 2022, as both years were negatively impacted by the continued pressure of macro-economic headwinds and, in 2023, the impact of the flavour ban in California (which particularly impacted Newport and Camel) and growth of illicit single-use vapour products as consumers increased polyusage. Accordingly, industry volume was down 7% (2022: down 10%) in the U.S. In 2022, Group cigarette volume was also negatively impacted by the full year impact of the sale of the Group's Iranian business (which completed midway through 2021), while revenue was also lapping an estimated £200 million benefit from trade inventory movements in the U.S. in 2021, mainly linked to the timing of price increases and uncertainty about a potential excise increase. Profit From Operations Profit from operations was down 250% being a loss of £15,751 million compared to a profit in 2022 of £10,523 million (up 2.8% on 2021). Reconciliation of revenue to revenue at constant rates 2023 2022 2021 £m Change % (vs 2022) £m Change % (vs 2021) £m Revenue 27,283 -1.3 % 27,655 +7.7 % 25,684 Impact of exchange 813 (1,382) Revenue at constant rates 28,096 +1.6 % 26,273 +2.3 % 25,684 Our performance in 2023 has been negatively impacted by the impairment charge against goodwill in the U.S. of £4.3 billion as a non-cash adjusting charge. This reflects the ongoing difficult macro- economic environment and continued drag on our legal Vapour business by the illicit single-use products in that market. Also in 2023, we have recognised a non-cash adjusting impairment charge of £23.0 billion largely against our U.S. combustible brands which have been previously recognised as indefinite-lived. These combustible brands will commence amortisation from 1 January 2024. Please refer to note 12 for more details. Our reported performance in 2023 was also impacted by lower comparative sales in Russia and the sale of Group's businesses in Russia and Belarus partway through the year. This was a combined headwind of £126 million. Our financial performance was further affected by a number of charges recognised in 2022 that did not repeat or were significantly reduced in 2023. These include charges related to the sale of the Group's Russian and Belarusian businesses, the agreement with the U.S. Department of Justice (DOJ) and Department of the Treasury's Office of Foreign Assets Control (OFAC) to resolve investigations into historical breaches of sanctions and the Group's restructuring programme Quantum, discussed below. 2023 was impacted by a translational foreign exchange headwind (2022: tailwind). Raw materials and other consumables costs declined 4.9% to £4,545 million in 2023, following an increase of 5.3% to £4,781 million in 2022. The results in both years are impacted by translational foreign exchange (a tailwind in 2023, and a headwind in 2022). Both years were negatively impacted by the macro-economic headwinds, with inflation of £527 million (or 9.1%) in 2023 (2022: £352 million) due to higher energy, fertiliser and other commodity input raw material costs. This was partly offset by efficiency initiatives which delivered £471 million in 2023 (2022: £422 million) in savings. Transactional foreign exchange was also a negative drag to our performance, at £293 million in 2023 and £167 million in 2022, due to movement in our operating currencies largely against the US dollar. Revenue (£m) £27,283m -1.3% 2023 2022 27,283 27,655 -1.3% +7.7% Definition: Revenue recognised, net of duty, excise and other taxes. l IFRS GAAP l KPI l NON-GAAP Change in revenue at constant rates (%) +1.6% 2023 2022 +1.6 % +2.3% Definition: Change in revenue before the impact of fluctuations in foreign exchange rates. l IFRS GAAP l KPI l NON-GAAP Profit from operations (£m) -£15,751m -250% 2023 2022 -15,751 10,523 -250% +2.8% Definition: Profit for the year before the impact of net finance costs/income, share of post-tax results of associates and joint ventures and taxation on ordinary activities. l IFRS GAAP l KPI l NON-GAAP Change in adjusted profit from operations at constant rates (%) +3.1% 2023 2022 +3.1% +4.3% Definition: Change in profit from operations before the impact of adjusting items and the impact of fluctuations in foreign exchange rates. l IFRS GAAP l KPI l NON-GAAP BAT Annual Report and Form 20-F 2023 Strategic Report Governance Report Financial Statements Other Information 51
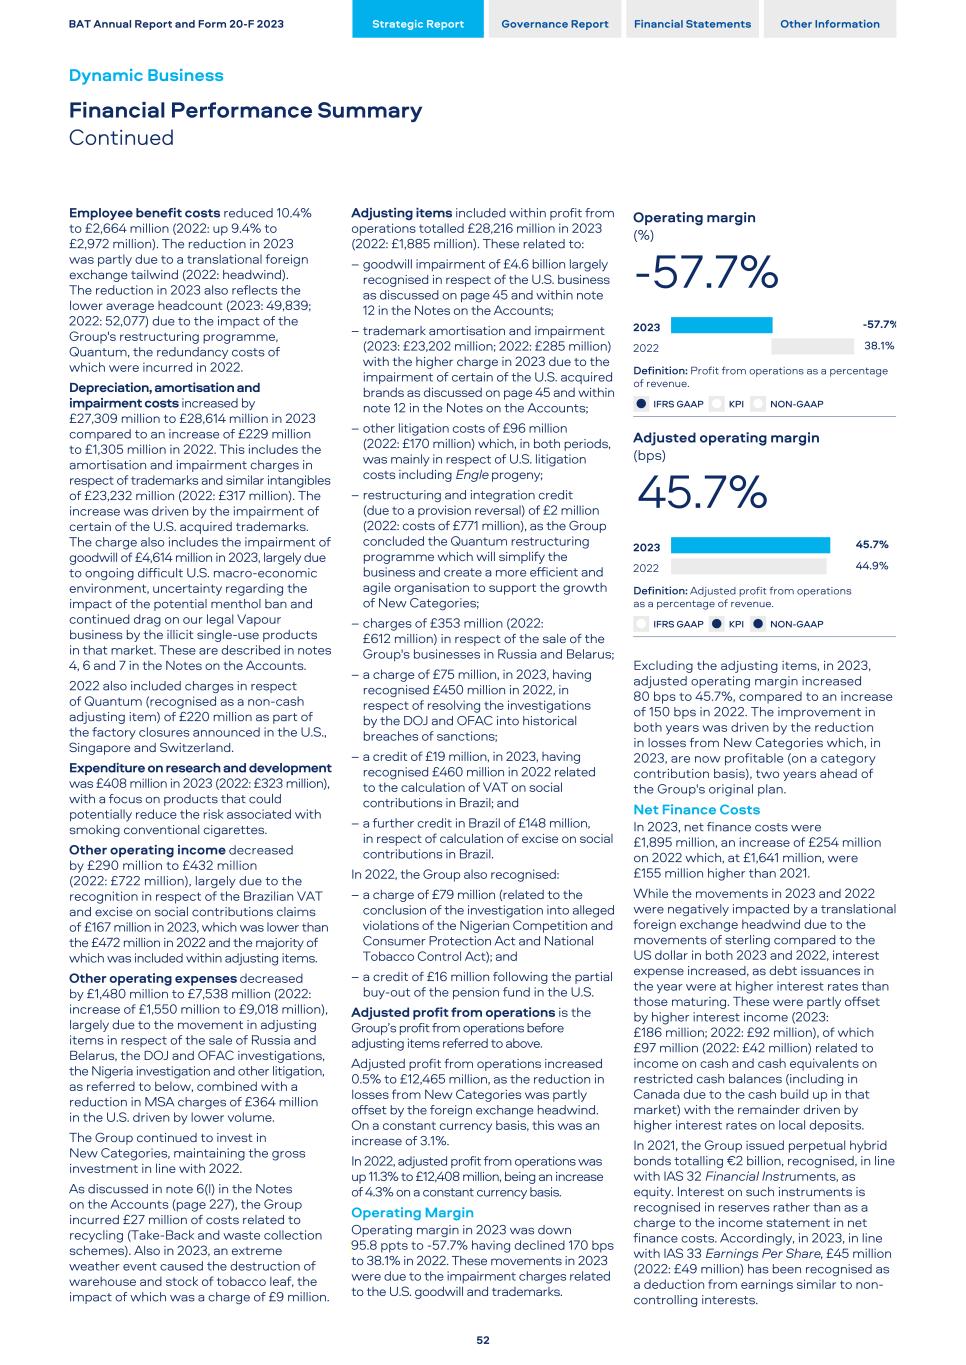
Employee benefit costs reduced 10.4% to £2,664 million (2022: up 9.4% to £2,972 million). The reduction in 2023 was partly due to a translational foreign exchange tailwind (2022: headwind). The reduction in 2023 also reflects the lower average headcount (2023: 49,839; 2022: 52,077) due to the impact of the Group's restructuring programme, Quantum, the redundancy costs of which were incurred in 2022. Depreciation, amortisation and impairment costs increased by £27,309 million to £28,614 million in 2023 compared to an increase of £229 million to £1,305 million in 2022. This includes the amortisation and impairment charges in respect of trademarks and similar intangibles of £23,232 million (2022: £317 million). The increase was driven by the impairment of certain of the U.S. acquired trademarks. The charge also includes the impairment of goodwill of £4,614 million in 2023, largely due to ongoing difficult U.S. macro-economic environment, uncertainty regarding the impact of the potential menthol ban and continued drag on our legal Vapour business by the illicit single-use products in that market. These are described in notes 4, 6 and 7 in the Notes on the Accounts. 2022 also included charges in respect of Quantum (recognised as a non-cash adjusting item) of £220 million as part of the factory closures announced in the U.S., Singapore and Switzerland. Expenditure on research and development was £408 million in 2023 (2022: £323 million), with a focus on products that could potentially reduce the risk associated with smoking conventional cigarettes. Other operating income decreased by £290 million to £432 million (2022: £722 million), largely due to the recognition in respect of the Brazilian VAT and excise on social contributions claims of £167 million in 2023, which was lower than the £472 million in 2022 and the majority of which was included within adjusting items. Other operating expenses decreased by £1,480 million to £7,538 million (2022: increase of £1,550 million to £9,018 million), largely due to the movement in adjusting items in respect of the sale of Russia and Belarus, the DOJ and OFAC investigations, the Nigeria investigation and other litigation, as referred to below, combined with a reduction in MSA charges of £364 million in the U.S. driven by lower volume. The Group continued to invest in New Categories, maintaining the gross investment in line with 2022. As discussed in note 6(l) in the Notes on the Accounts (page 227), the Group incurred £27 million of costs related to recycling (Take-Back and waste collection schemes). Also in 2023, an extreme weather event caused the destruction of warehouse and stock of tobacco leaf, the impact of which was a charge of £9 million. Adjusting items included within profit from operations totalled £28,216 million in 2023 (2022: £1,885 million). These related to: – goodwill impairment of £4.6 billion largely recognised in respect of the U.S. business as discussed on page 45 and within note 12 in the Notes on the Accounts; – trademark amortisation and impairment (2023: £23,202 million; 2022: £285 million) with the higher charge in 2023 due to the impairment of certain of the U.S. acquired brands as discussed on page 45 and within note 12 in the Notes on the Accounts; – other litigation costs of £96 million (2022: £170 million) which, in both periods, was mainly in respect of U.S. litigation costs including Engle progeny; – restructuring and integration credit (due to a provision reversal) of £2 million (2022: costs of £771 million), as the Group concluded the Quantum restructuring programme which will simplify the business and create a more efficient and agile organisation to support the growth of New Categories; – charges of £353 million (2022: £612 million) in respect of the sale of the Group's businesses in Russia and Belarus; – a charge of £75 million, in 2023, having recognised £450 million in 2022, in respect of resolving the investigations by the DOJ and OFAC into historical breaches of sanctions; – a credit of £19 million, in 2023, having recognised £460 million in 2022 related to the calculation of VAT on social contributions in Brazil; and – a further credit in Brazil of £148 million, in respect of calculation of excise on social contributions in Brazil. In 2022, the Group also recognised: – a charge of £79 million (related to the conclusion of the investigation into alleged violations of the Nigerian Competition and Consumer Protection Act and National Tobacco Control Act); and – a credit of £16 million following the partial buy-out of the pension fund in the U.S. Adjusted profit from operations is the Group’s profit from operations before adjusting items referred to above. Adjusted profit from operations increased 0.5% to £12,465 million, as the reduction in losses from New Categories was partly offset by the foreign exchange headwind. On a constant currency basis, this was an increase of 3.1%. In 2022, adjusted profit from operations was up 11.3% to £12,408 million, being an increase of 4.3% on a constant currency basis. Operating Margin Operating margin in 2023 was down 95.8 ppts to -57.7% having declined 170 bps to 38.1% in 2022. These movements in 2023 were due to the impairment charges related to the U.S. goodwill and trademarks. Operating margin (%) -57.7% 2023 2022 -57.7% 38.1% Definition: Profit from operations as a percentage of revenue. l IFRS GAAP l KPI l NON-GAAP Adjusted operating margin (bps) 45.7% 2023 2022 45.7% 44.9% Definition: Adjusted profit from operations as a percentage of revenue. l IFRS GAAP l KPI l NON-GAAP Excluding the adjusting items, in 2023, adjusted operating margin increased 80 bps to 45.7%, compared to an increase of 150 bps in 2022. The improvement in both years was driven by the reduction in losses from New Categories which, in 2023, are now profitable (on a category contribution basis), two years ahead of the Group's original plan. Net Finance Costs In 2023, net finance costs were £1,895 million, an increase of £254 million on 2022 which, at £1,641 million, were £155 million higher than 2021. While the movements in 2023 and 2022 were negatively impacted by a translational foreign exchange headwind due to the movements of sterling compared to the US dollar in both 2023 and 2022, interest expense increased, as debt issuances in the year were at higher interest rates than those maturing. These were partly offset by higher interest income (2023: £186 million; 2022: £92 million), of which £97 million (2022: £42 million) related to income on cash and cash equivalents on restricted cash balances (including in Canada due to the cash build up in that market) with the remainder driven by higher interest rates on local deposits. In 2021, the Group issued perpetual hybrid bonds totalling €2 billion, recognised, in line with IAS 32 Financial Instruments, as equity. Interest on such instruments is recognised in reserves rather than as a charge to the income statement in net finance costs. Accordingly, in 2023, in line with IAS 33 Earnings Per Share, £45 million (2022: £49 million) has been recognised as a deduction from earnings similar to non- controlling interests. BAT Annual Report and Form 20-F 2023 Strategic Report Governance Report Financial Statements Other Information Dynamic Business Financial Performance Summary Continued 52
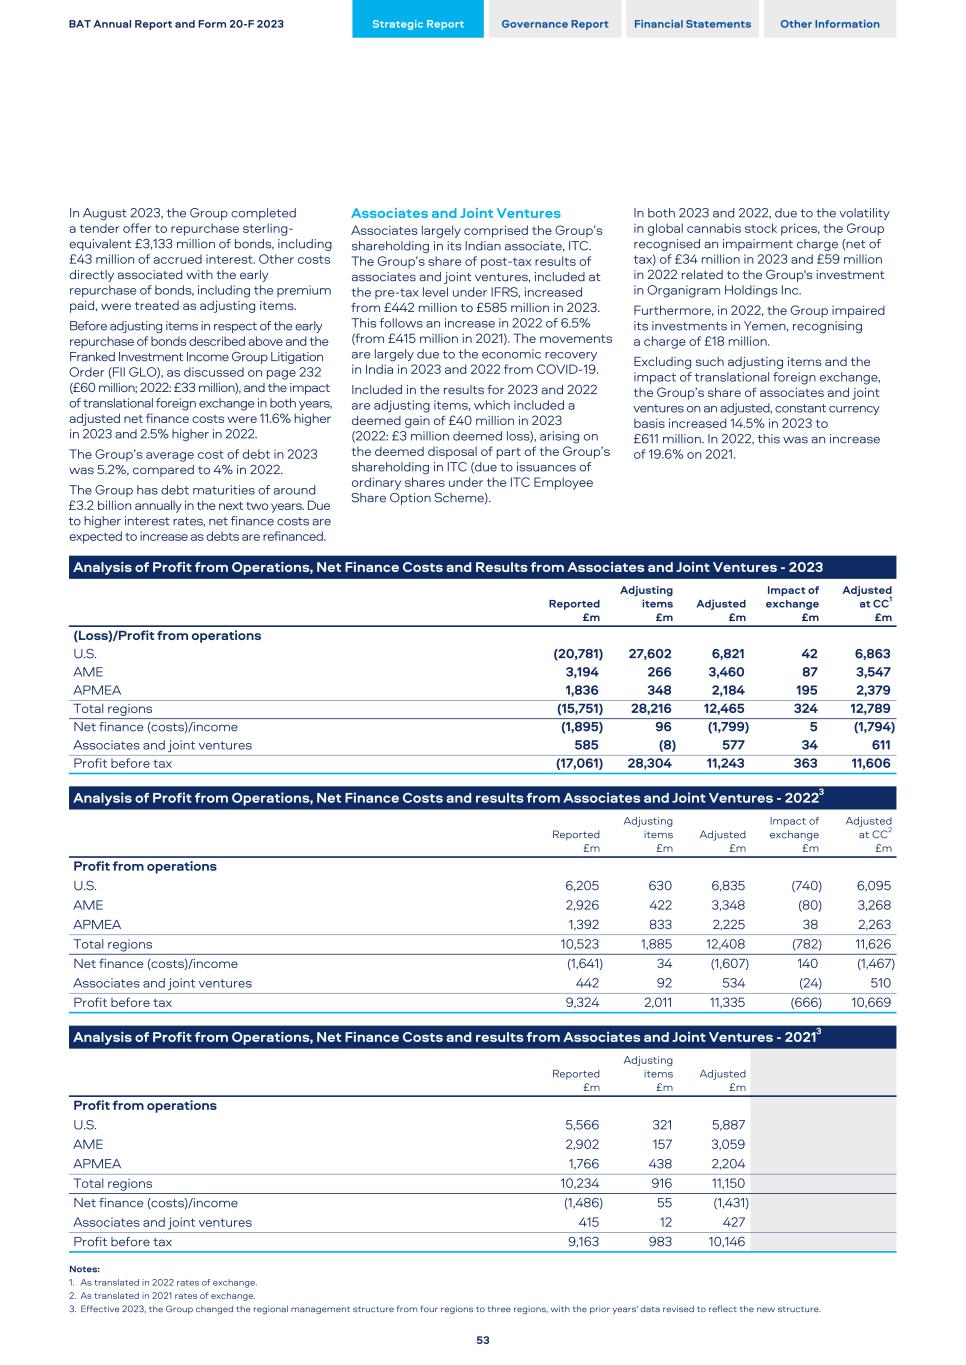
In August 2023, the Group completed a tender offer to repurchase sterling- equivalent £3,133 million of bonds, including £43 million of accrued interest. Other costs directly associated with the early repurchase of bonds, including the premium paid, were treated as adjusting items. Before adjusting items in respect of the early repurchase of bonds described above and the Franked Investment Income Group Litigation Order (FII GLO), as discussed on page 232 (£60 million; 2022: £33 million), and the impact of translational foreign exchange in both years, adjusted net finance costs were 11.6% higher in 2023 and 2.5% higher in 2022. The Group’s average cost of debt in 2023 was 5.2%, compared to 4% in 2022. The Group has debt maturities of around £3.2 billion annually in the next two years. Due to higher interest rates, net finance costs are expected to increase as debts are refinanced. Associates and Joint Ventures Associates largely comprised the Group’s shareholding in its Indian associate, ITC. The Group’s share of post-tax results of associates and joint ventures, included at the pre-tax level under IFRS, increased from £442 million to £585 million in 2023. This follows an increase in 2022 of 6.5% (from £415 million in 2021). The movements are largely due to the economic recovery in India in 2023 and 2022 from COVID-19. Included in the results for 2023 and 2022 are adjusting items, which included a deemed gain of £40 million in 2023 (2022: £3 million deemed loss), arising on the deemed disposal of part of the Group’s shareholding in ITC (due to issuances of ordinary shares under the ITC Employee Share Option Scheme). In both 2023 and 2022, due to the volatility in global cannabis stock prices, the Group recognised an impairment charge (net of tax) of £34 million in 2023 and £59 million in 2022 related to the Group's investment in Organigram Holdings Inc. Furthermore, in 2022, the Group impaired its investments in Yemen, recognising a charge of £18 million. Excluding such adjusting items and the impact of translational foreign exchange, the Group’s share of associates and joint ventures on an adjusted, constant currency basis increased 14.5% in 2023 to £611 million. In 2022, this was an increase of 19.6% on 2021. Analysis of Profit from Operations, Net Finance Costs and Results from Associates and Joint Ventures - 2023 Reported £m Adjusting items £m Adjusted £m Impact of exchange £m Adjusted at CC1 £m (Loss)/Profit from operations U.S. (20,781) 27,602 6,821 42 6,863 AME 3,194 266 3,460 87 3,547 APMEA 1,836 348 2,184 195 2,379 Total regions (15,751) 28,216 12,465 324 12,789 Net finance (costs)/income (1,895) 96 (1,799) 5 (1,794) Associates and joint ventures 585 (8) 577 34 611 Profit before tax (17,061) 28,304 11,243 363 11,606 Analysis of Profit from Operations, Net Finance Costs and results from Associates and Joint Ventures - 20223 Reported £m Adjusting items £m Adjusted £m Impact of exchange £m Adjusted at CC2 £m Profit from operations U.S. 6,205 630 6,835 (740) 6,095 AME 2,926 422 3,348 (80) 3,268 APMEA 1,392 833 2,225 38 2,263 Total regions 10,523 1,885 12,408 (782) 11,626 Net finance (costs)/income (1,641) 34 (1,607) 140 (1,467) Associates and joint ventures 442 92 534 (24) 510 Profit before tax 9,324 2,011 11,335 (666) 10,669 Analysis of Profit from Operations, Net Finance Costs and results from Associates and Joint Ventures - 20213 Reported £m Adjusting items £m Adjusted £m Profit from operations U.S. 5,566 321 5,887 AME 2,902 157 3,059 APMEA 1,766 438 2,204 Total regions 10,234 916 11,150 Net finance (costs)/income (1,486) 55 (1,431) Associates and joint ventures 415 12 427 Profit before tax 9,163 983 10,146 Notes: 1. As translated in 2022 rates of exchange. 2. As translated in 2021 rates of exchange. 3. Effective 2023, the Group changed the regional management structure from four regions to three regions, with the prior years' data revised to reflect the new structure. BAT Annual Report and Form 20-F 2023 Strategic Report Governance Report Financial Statements Other Information 53
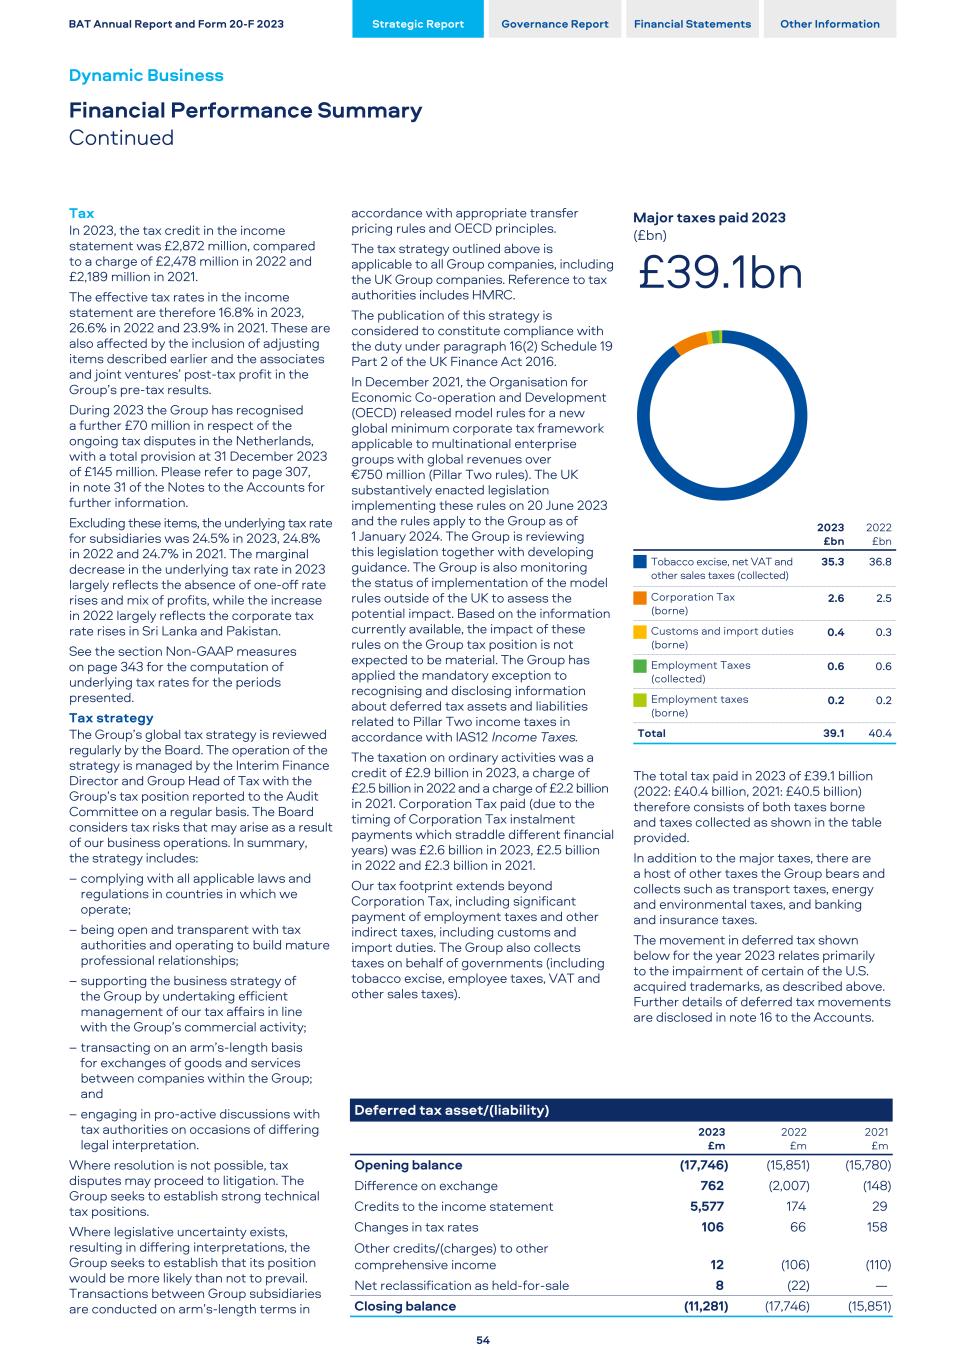
Tax In 2023, the tax credit in the income statement was £2,872 million, compared to a charge of £2,478 million in 2022 and £2,189 million in 2021. The effective tax rates in the income statement are therefore 16.8% in 2023, 26.6% in 2022 and 23.9% in 2021. These are also affected by the inclusion of adjusting items described earlier and the associates and joint ventures’ post-tax profit in the Group’s pre-tax results. During 2023 the Group has recognised a further £70 million in respect of the ongoing tax disputes in the Netherlands, with a total provision at 31 December 2023 of £145 million. Please refer to page 307, in note 31 of the Notes to the Accounts for further information. Excluding these items, the underlying tax rate for subsidiaries was 24.5% in 2023, 24.8% in 2022 and 24.7% in 2021. The marginal decrease in the underlying tax rate in 2023 largely reflects the absence of one-off rate rises and mix of profits, while the increase in 2022 largely reflects the corporate tax rate rises in Sri Lanka and Pakistan. See the section Non-GAAP measures on page 343 for the computation of underlying tax rates for the periods presented. Tax strategy The Group’s global tax strategy is reviewed regularly by the Board. The operation of the strategy is managed by the Interim Finance Director and Group Head of Tax with the Group’s tax position reported to the Audit Committee on a regular basis. The Board considers tax risks that may arise as a result of our business operations. In summary, the strategy includes: – complying with all applicable laws and regulations in countries in which we operate; – being open and transparent with tax authorities and operating to build mature professional relationships; – supporting the business strategy of the Group by undertaking efficient management of our tax affairs in line with the Group’s commercial activity; – transacting on an arm’s-length basis for exchanges of goods and services between companies within the Group; and – engaging in pro-active discussions with tax authorities on occasions of differing legal interpretation. Where resolution is not possible, tax disputes may proceed to litigation. The Group seeks to establish strong technical tax positions. Where legislative uncertainty exists, resulting in differing interpretations, the Group seeks to establish that its position would be more likely than not to prevail. Transactions between Group subsidiaries are conducted on arm’s-length terms in accordance with appropriate transfer pricing rules and OECD principles. The tax strategy outlined above is applicable to all Group companies, including the UK Group companies. Reference to tax authorities includes HMRC. The publication of this strategy is considered to constitute compliance with the duty under paragraph 16(2) Schedule 19 Part 2 of the UK Finance Act 2016. In December 2021, the Organisation for Economic Co-operation and Development (OECD) released model rules for a new global minimum corporate tax framework applicable to multinational enterprise groups with global revenues over €750 million (Pillar Two rules). The UK substantively enacted legislation implementing these rules on 20 June 2023 and the rules apply to the Group as of 1 January 2024. The Group is reviewing this legislation together with developing guidance. The Group is also monitoring the status of implementation of the model rules outside of the UK to assess the potential impact. Based on the information currently available, the impact of these rules on the Group tax position is not expected to be material. The Group has applied the mandatory exception to recognising and disclosing information about deferred tax assets and liabilities related to Pillar Two income taxes in accordance with IAS12 Income Taxes. The taxation on ordinary activities was a credit of £2.9 billion in 2023, a charge of £2.5 billion in 2022 and a charge of £2.2 billion in 2021. Corporation Tax paid (due to the timing of Corporation Tax instalment payments which straddle different financial years) was £2.6 billion in 2023, £2.5 billion in 2022 and £2.3 billion in 2021. Our tax footprint extends beyond Corporation Tax, including significant payment of employment taxes and other indirect taxes, including customs and import duties. The Group also collects taxes on behalf of governments (including tobacco excise, employee taxes, VAT and other sales taxes). Major taxes paid 2023 (£bn) £39.1bn 2023 £bn 2022 £bn Tobacco excise, net VAT and other sales taxes (collected) 35.3 36.8 Corporation Tax (borne) 2.6 2.5 Customs and import duties (borne) 0.4 0.3 Employment Taxes (collected) 0.6 0.6 Employment taxes (borne) 0.2 0.2 Total 39.1 40.4 The total tax paid in 2023 of £39.1 billion (2022: £40.4 billion, 2021: £40.5 billion) therefore consists of both taxes borne and taxes collected as shown in the table provided. In addition to the major taxes, there are a host of other taxes the Group bears and collects such as transport taxes, energy and environmental taxes, and banking and insurance taxes. The movement in deferred tax shown below for the year 2023 relates primarily to the impairment of certain of the U.S. acquired trademarks, as described above. Further details of deferred tax movements are disclosed in note 16 to the Accounts. BAT Annual Report and Form 20-F 2023 Strategic Report Governance Report Financial Statements Other Information Dynamic Business Financial Performance Summary Continued 54 Deferred tax asset/(liability) 2023 £m 2022 £m 2021 £m Opening balance (17,746) (15,851) (15,780) Difference on exchange 762 (2,007) (148) Credits to the income statement 5,577 174 29 Changes in tax rates 106 66 158 Other credits/(charges) to other comprehensive income 12 (106) (110) Net reclassification as held-for-sale 8 (22) — Closing balance (11,281) (17,746) (15,851)
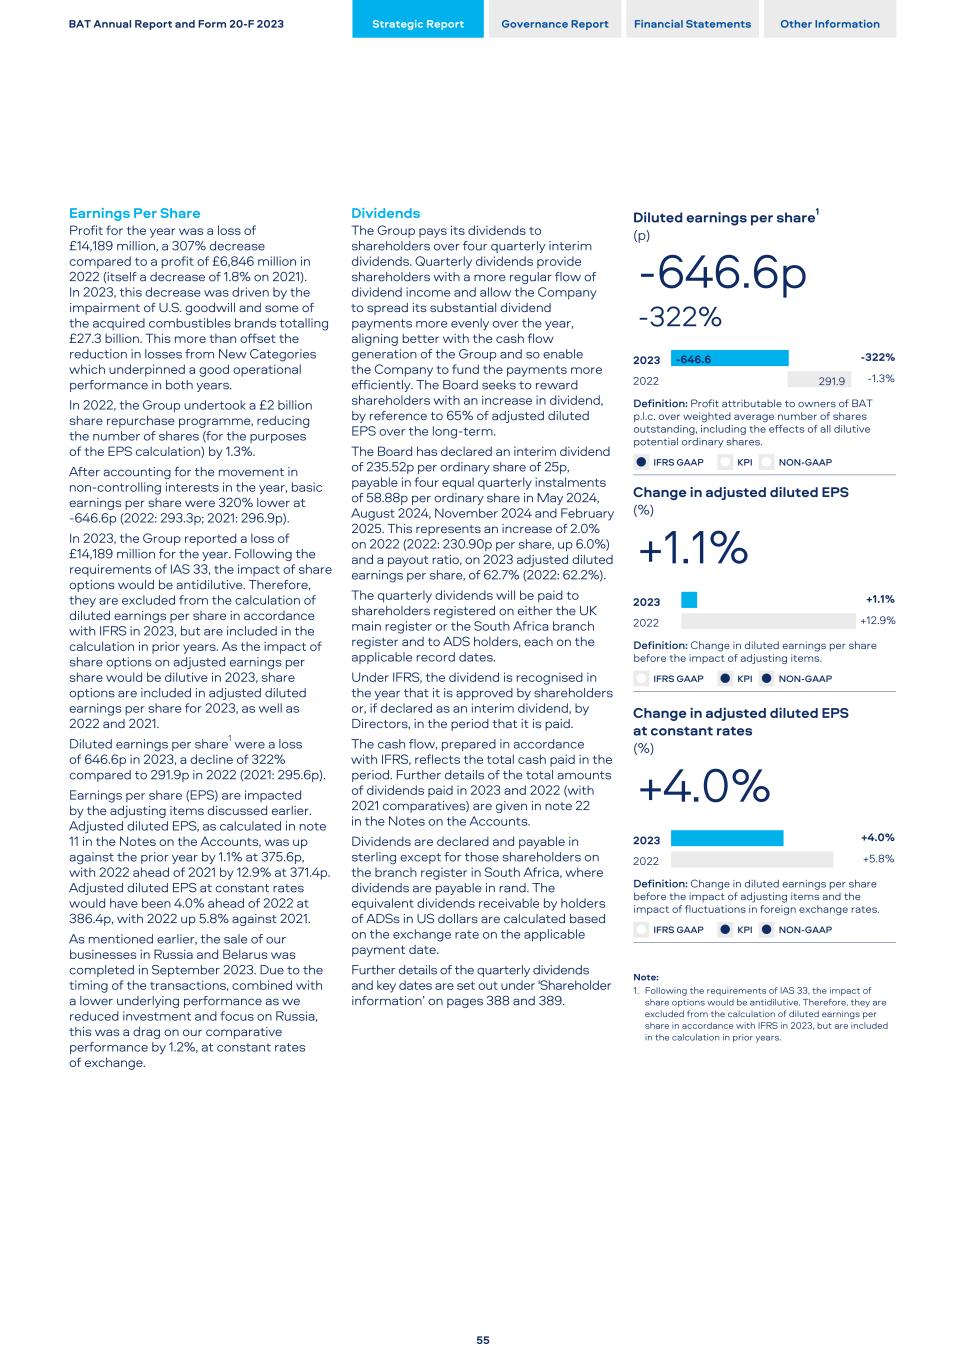
Earnings Per Share Profit for the year was a loss of £14,189 million, a 307% decrease compared to a profit of £6,846 million in 2022 (itself a decrease of 1.8% on 2021). In 2023, this decrease was driven by the impairment of U.S. goodwill and some of the acquired combustibles brands totalling £27.3 billion. This more than offset the reduction in losses from New Categories which underpinned a good operational performance in both years. In 2022, the Group undertook a £2 billion share repurchase programme, reducing the number of shares (for the purposes of the EPS calculation) by 1.3%. After accounting for the movement in non-controlling interests in the year, basic earnings per share were 320% lower at -646.6p (2022: 293.3p; 2021: 296.9p). In 2023, the Group reported a loss of £14,189 million for the year. Following the requirements of IAS 33, the impact of share options would be antidilutive. Therefore, they are excluded from the calculation of diluted earnings per share in accordance with IFRS in 2023, but are included in the calculation in prior years. As the impact of share options on adjusted earnings per share would be dilutive in 2023, share options are included in adjusted diluted earnings per share for 2023, as well as 2022 and 2021. Diluted earnings per share1 were a loss of 646.6p in 2023, a decline of 322% compared to 291.9p in 2022 (2021: 295.6p). Earnings per share (EPS) are impacted by the adjusting items discussed earlier. Adjusted diluted EPS, as calculated in note 11 in the Notes on the Accounts, was up against the prior year by 1.1% at 375.6p, with 2022 ahead of 2021 by 12.9% at 371.4p. Adjusted diluted EPS at constant rates would have been 4.0% ahead of 2022 at 386.4p, with 2022 up 5.8% against 2021. As mentioned earlier, the sale of our businesses in Russia and Belarus was completed in September 2023. Due to the timing of the transactions, combined with a lower underlying performance as we reduced investment and focus on Russia, this was a drag on our comparative performance by 1.2%, at constant rates of exchange. Dividends The Group pays its dividends to shareholders over four quarterly interim dividends. Quarterly dividends provide shareholders with a more regular flow of dividend income and allow the Company to spread its substantial dividend payments more evenly over the year, aligning better with the cash flow generation of the Group and so enable the Company to fund the payments more efficiently. The Board seeks to reward shareholders with an increase in dividend, by reference to 65% of adjusted diluted EPS over the long-term. The Board has declared an interim dividend of 235.52p per ordinary share of 25p, payable in four equal quarterly instalments of 58.88p per ordinary share in May 2024, August 2024, November 2024 and February 2025. This represents an increase of 2.0% on 2022 (2022: 230.90p per share, up 6.0%) and a payout ratio, on 2023 adjusted diluted earnings per share, of 62.7% (2022: 62.2%). The quarterly dividends will be paid to shareholders registered on either the UK main register or the South Africa branch register and to ADS holders, each on the applicable record dates. Under IFRS, the dividend is recognised in the year that it is approved by shareholders or, if declared as an interim dividend, by Directors, in the period that it is paid. The cash flow, prepared in accordance with IFRS, reflects the total cash paid in the period. Further details of the total amounts of dividends paid in 2023 and 2022 (with 2021 comparatives) are given in note 22 in the Notes on the Accounts. Dividends are declared and payable in sterling except for those shareholders on the branch register in South Africa, where dividends are payable in rand. The equivalent dividends receivable by holders of ADSs in US dollars are calculated based on the exchange rate on the applicable payment date. Further details of the quarterly dividends and key dates are set out under 'Shareholder information’ on pages 388 and 389. Diluted earnings per share1 (p) -646.6p -322% 2023 2022 -646.6 291.9 -322% -1.3% Definition: Profit attributable to owners of BAT p.l.c. over weighted average number of shares outstanding, including the effects of all dilutive potential ordinary shares. l IFRS GAAP l KPI l NON-GAAP Change in adjusted diluted EPS (%) +1.1% 2023 2022 +1.1% +12.9% Definition: Change in diluted earnings per share before the impact of adjusting items. l IFRS GAAP l KPI l NON-GAAP Change in adjusted diluted EPS at constant rates (%) +4.0% 2023 2022 +4.0% +5.8% Definition: Change in diluted earnings per share before the impact of adjusting items and the impact of fluctuations in foreign exchange rates. l IFRS GAAP l KPI l NON-GAAP Note: 1. Following the requirements of IAS 33, the impact of share options would be antidilutive. Therefore, they are excluded from the calculation of diluted earnings per share in accordance with IFRS in 2023, but are included in the calculation in prior years. BAT Annual Report and Form 20-F 2023 Strategic Report Governance Report Financial Statements Other Information 55
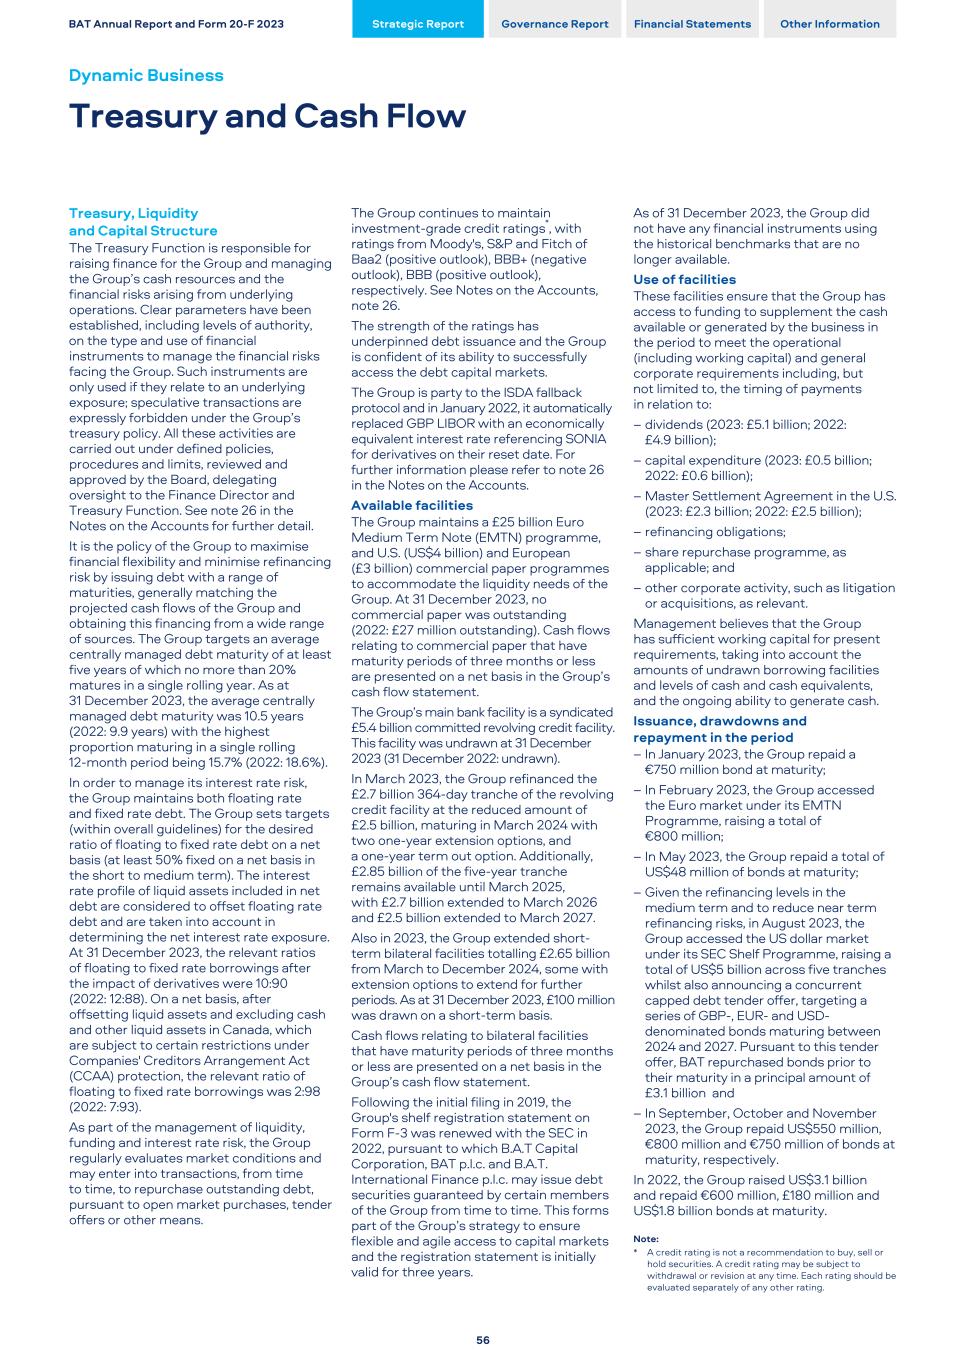
Treasury, Liquidity and Capital Structure The Treasury Function is responsible for raising finance for the Group and managing the Group’s cash resources and the financial risks arising from underlying operations. Clear parameters have been established, including levels of authority, on the type and use of financial instruments to manage the financial risks facing the Group. Such instruments are only used if they relate to an underlying exposure; speculative transactions are expressly forbidden under the Group’s treasury policy. All these activities are carried out under defined policies, procedures and limits, reviewed and approved by the Board, delegating oversight to the Finance Director and Treasury Function. See note 26 in the Notes on the Accounts for further detail. It is the policy of the Group to maximise financial flexibility and minimise refinancing risk by issuing debt with a range of maturities, generally matching the projected cash flows of the Group and obtaining this financing from a wide range of sources. The Group targets an average centrally managed debt maturity of at least five years of which no more than 20% matures in a single rolling year. As at 31 December 2023, the average centrally managed debt maturity was 10.5 years (2022: 9.9 years) with the highest proportion maturing in a single rolling 12-month period being 15.7% (2022: 18.6%). In order to manage its interest rate risk, the Group maintains both floating rate and fixed rate debt. The Group sets targets (within overall guidelines) for the desired ratio of floating to fixed rate debt on a net basis (at least 50% fixed on a net basis in the short to medium term). The interest rate profile of liquid assets included in net debt are considered to offset floating rate debt and are taken into account in determining the net interest rate exposure. At 31 December 2023, the relevant ratios of floating to fixed rate borrowings after the impact of derivatives were 10:90 (2022: 12:88). On a net basis, after offsetting liquid assets and excluding cash and other liquid assets in Canada, which are subject to certain restrictions under Companies' Creditors Arrangement Act (CCAA) protection, the relevant ratio of floating to fixed rate borrowings was 2:98 (2022: 7:93). As part of the management of liquidity, funding and interest rate risk, the Group regularly evaluates market conditions and may enter into transactions, from time to time, to repurchase outstanding debt, pursuant to open market purchases, tender offers or other means. The Group continues to maintain investment‑grade credit ratings*, with ratings from Moody's, S&P and Fitch of Baa2 (positive outlook), BBB+ (negative outlook), BBB (positive outlook), respectively. See Notes on the Accounts, note 26. The strength of the ratings has underpinned debt issuance and the Group is confident of its ability to successfully access the debt capital markets. The Group is party to the ISDA fallback protocol and in January 2022, it automatically replaced GBP LIBOR with an economically equivalent interest rate referencing SONIA for derivatives on their reset date. For further information please refer to note 26 in the Notes on the Accounts. Available facilities The Group maintains a £25 billion Euro Medium Term Note (EMTN) programme, and U.S. (US$4 billion) and European (£3 billion) commercial paper programmes to accommodate the liquidity needs of the Group. At 31 December 2023, no commercial paper was outstanding (2022: £27 million outstanding). Cash flows relating to commercial paper that have maturity periods of three months or less are presented on a net basis in the Group’s cash flow statement. The Group’s main bank facility is a syndicated £5.4 billion committed revolving credit facility. This facility was undrawn at 31 December 2023 (31 December 2022: undrawn). In March 2023, the Group refinanced the £2.7 billion 364-day tranche of the revolving credit facility at the reduced amount of £2.5 billion, maturing in March 2024 with two one-year extension options, and a one-year term out option. Additionally, £2.85 billion of the five-year tranche remains available until March 2025, with £2.7 billion extended to March 2026 and £2.5 billion extended to March 2027. Also in 2023, the Group extended short- term bilateral facilities totalling £2.65 billion from March to December 2024, some with extension options to extend for further periods. As at 31 December 2023, £100 million was drawn on a short-term basis. Cash flows relating to bilateral facilities that have maturity periods of three months or less are presented on a net basis in the Group’s cash flow statement. Following the initial filing in 2019, the Group's shelf registration statement on Form F-3 was renewed with the SEC in 2022, pursuant to which B.A.T Capital Corporation, BAT p.l.c. and B.A.T. International Finance p.l.c. may issue debt securities guaranteed by certain members of the Group from time to time. This forms part of the Group’s strategy to ensure flexible and agile access to capital markets and the registration statement is initially valid for three years. As of 31 December 2023, the Group did not have any financial instruments using the historical benchmarks that are no longer available. Use of facilities These facilities ensure that the Group has access to funding to supplement the cash available or generated by the business in the period to meet the operational (including working capital) and general corporate requirements including, but not limited to, the timing of payments in relation to: – dividends (2023: £5.1 billion; 2022: £4.9 billion); – capital expenditure (2023: £0.5 billion; 2022: £0.6 billion); – Master Settlement Agreement in the U.S. (2023: £2.3 billion; 2022: £2.5 billion); – refinancing obligations; – share repurchase programme, as applicable; and – other corporate activity, such as litigation or acquisitions, as relevant. Management believes that the Group has sufficient working capital for present requirements, taking into account the amounts of undrawn borrowing facilities and levels of cash and cash equivalents, and the ongoing ability to generate cash. Issuance, drawdowns and repayment in the period – In January 2023, the Group repaid a €750 million bond at maturity; – In February 2023, the Group accessed the Euro market under its EMTN Programme, raising a total of €800 million; – In May 2023, the Group repaid a total of US$48 million of bonds at maturity; – Given the refinancing levels in the medium term and to reduce near term refinancing risks, in August 2023, the Group accessed the US dollar market under its SEC Shelf Programme, raising a total of US$5 billion across five tranches whilst also announcing a concurrent capped debt tender offer, targeting a series of GBP-, EUR- and USD- denominated bonds maturing between 2024 and 2027. Pursuant to this tender offer, BAT repurchased bonds prior to their maturity in a principal amount of £3.1 billion and – In September, October and November 2023, the Group repaid US$550 million, €800 million and €750 million of bonds at maturity, respectively. In 2022, the Group raised US$3.1 billion and repaid €600 million, £180 million and US$1.8 billion bonds at maturity. Note: * A credit rating is not a recommendation to buy, sell or hold securities. A credit rating may be subject to withdrawal or revision at any time. Each rating should be evaluated separately of any other rating. BAT Annual Report and Form 20-F 2023 Strategic Report Governance Report Financial Statements Other Information Dynamic Business Treasury and Cash Flow 56
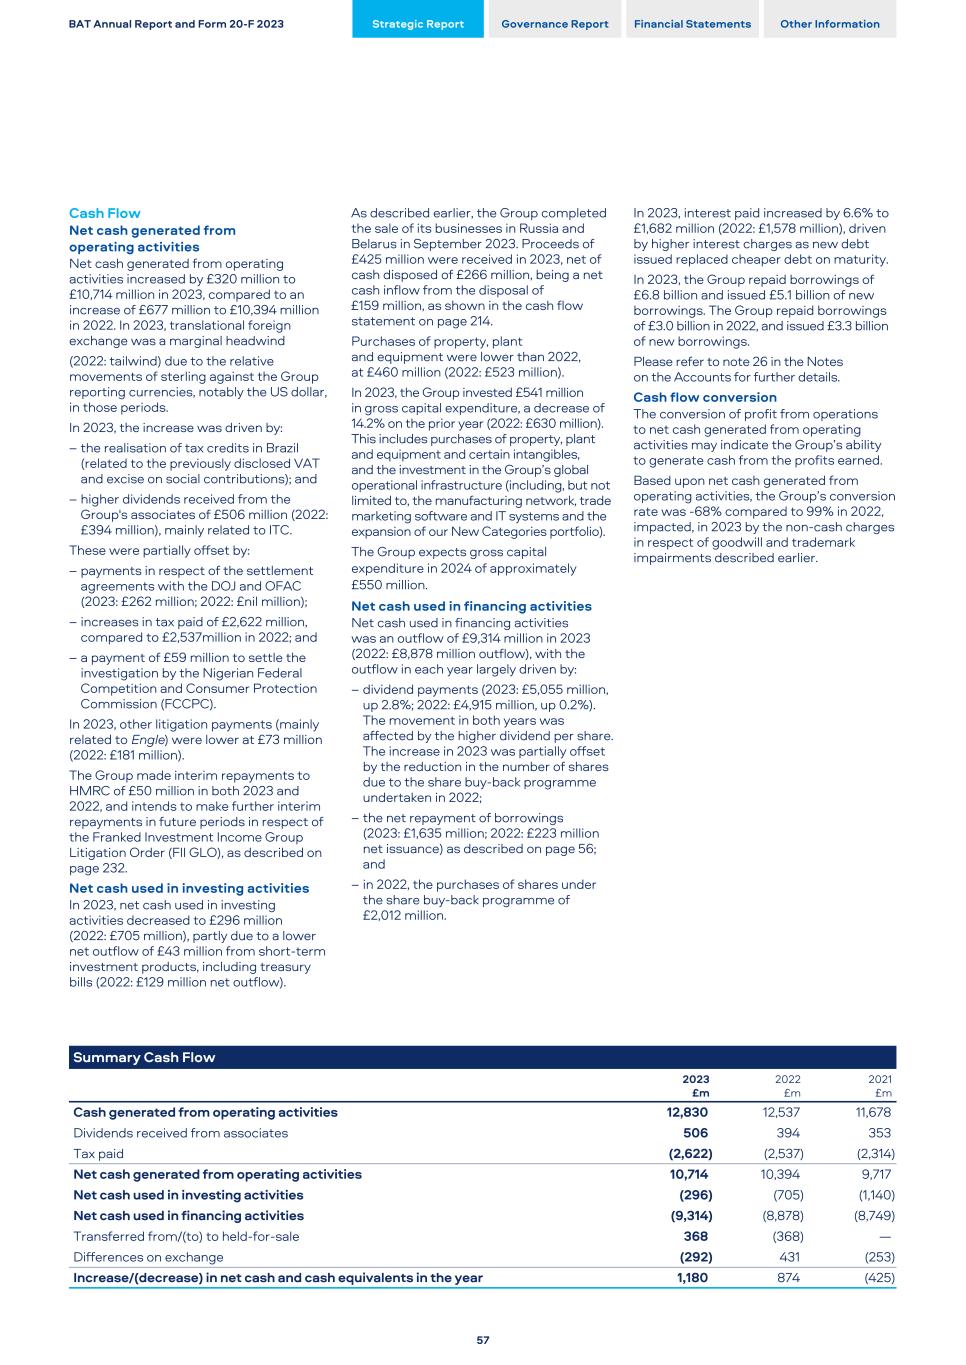
Cash Flow Net cash generated from operating activities Net cash generated from operating activities increased by £320 million to £10,714 million in 2023, compared to an increase of £677 million to £10,394 million in 2022. In 2023, translational foreign exchange was a marginal headwind (2022: tailwind) due to the relative movements of sterling against the Group reporting currencies, notably the US dollar, in those periods. In 2023, the increase was driven by: – the realisation of tax credits in Brazil (related to the previously disclosed VAT and excise on social contributions); and – higher dividends received from the Group's associates of £506 million (2022: £394 million), mainly related to ITC. These were partially offset by: – payments in respect of the settlement agreements with the DOJ and OFAC (2023: £262 million; 2022: £nil million); – increases in tax paid of £2,622 million, compared to £2,537million in 2022; and – a payment of £59 million to settle the investigation by the Nigerian Federal Competition and Consumer Protection Commission (FCCPC). In 2023, other litigation payments (mainly related to Engle) were lower at £73 million (2022: £181 million). The Group made interim repayments to HMRC of £50 million in both 2023 and 2022, and intends to make further interim repayments in future periods in respect of the Franked Investment Income Group Litigation Order (FII GLO), as described on page 232. Net cash used in investing activities In 2023, net cash used in investing activities decreased to £296 million (2022: £705 million), partly due to a lower net outflow of £43 million from short-term investment products, including treasury bills (2022: £129 million net outflow). Summary Cash Flow 2023 £m 2022 £m 2021 £m Cash generated from operating activities 12,830 12,537 11,678 Dividends received from associates 506 394 353 Tax paid (2,622) (2,537) (2,314) Net cash generated from operating activities 10,714 10,394 9,717 Net cash used in investing activities (296) (705) (1,140) Net cash used in financing activities (9,314) (8,878) (8,749) Transferred from/(to) to held-for-sale 368 (368) — Differences on exchange (292) 431 (253) Increase/(decrease) in net cash and cash equivalents in the year 1,180 874 (425) As described earlier, the Group completed the sale of its businesses in Russia and Belarus in September 2023. Proceeds of £425 million were received in 2023, net of cash disposed of £266 million, being a net cash inflow from the disposal of £159 million, as shown in the cash flow statement on page 214. Purchases of property, plant and equipment were lower than 2022, at £460 million (2022: £523 million). In 2023, the Group invested £541 million in gross capital expenditure, a decrease of 14.2% on the prior year (2022: £630 million). This includes purchases of property, plant and equipment and certain intangibles, and the investment in the Group’s global operational infrastructure (including, but not limited to, the manufacturing network, trade marketing software and IT systems and the expansion of our New Categories portfolio). The Group expects gross capital expenditure in 2024 of approximately £550 million. Net cash used in financing activities Net cash used in financing activities was an outflow of £9,314 million in 2023 (2022: £8,878 million outflow), with the outflow in each year largely driven by: – dividend payments (2023: £5,055 million, up 2.8%; 2022: £4,915 million, up 0.2%). The movement in both years was affected by the higher dividend per share. The increase in 2023 was partially offset by the reduction in the number of shares due to the share buy-back programme undertaken in 2022; – the net repayment of borrowings (2023: £1,635 million; 2022: £223 million net issuance) as described on page 56; and – in 2022, the purchases of shares under the share buy-back programme of £2,012 million. In 2023, interest paid increased by 6.6% to £1,682 million (2022: £1,578 million), driven by higher interest charges as new debt issued replaced cheaper debt on maturity. In 2023, the Group repaid borrowings of £6.8 billion and issued £5.1 billion of new borrowings. The Group repaid borrowings of £3.0 billion in 2022, and issued £3.3 billion of new borrowings. Please refer to note 26 in the Notes on the Accounts for further details. Cash flow conversion The conversion of profit from operations to net cash generated from operating activities may indicate the Group’s ability to generate cash from the profits earned. Based upon net cash generated from operating activities, the Group’s conversion rate was -68% compared to 99% in 2022, impacted, in 2023 by the non-cash charges in respect of goodwill and trademark impairments described earlier. BAT Annual Report and Form 20-F 2023 Strategic Report Governance Report Financial Statements Other Information 57
Restricted cash Cash and cash equivalents include restricted amounts of £1,904 million (2022: £1,411 million) due to subsidiaries in CCAA protection (note 32 in the Notes on the Accounts) as well as £392 million (2022: £324 million) principally due to exchange control restrictions. Borrowings and Net Debt Total borrowings (which includes lease liabilities) decreased to £39,730 million in 2023 (2022: £43,139 million) impacted by the relative movement of sterling against other currencies, particularly the US dollar and the euro. In 2023, this was a tailwind of £1,981 million (2022: £3,911 million headwind). The movement in borrowings is impacted by the net issuance and repayment of bonds, as discussed on page 56 including the tender offer and subsequent repayment of £3.1 billion (equivalent) of bonds. Total borrowings include £700 million (31 December 2022: £798 million) in respect of the purchase price adjustments related to the acquisition of Reynolds American Inc. As discussed on page 56, the Group remains confident about its ability to access the debt capital markets successfully and reviews its options on a continuing basis. Net debt is a non-GAAP measure and is defined as total borrowings (including related derivatives and lease liabilities) less cash and cash equivalents and current investments held at fair value. Net debt, at 31 December 2023, was £34,640 million (2022: £39,281 million; 2021: £36,302 million), with the movement in net debt largely due to the relative movement of sterling against other currencies, particularly the US dollar and the euro, which was a tailwind of £1,338 million in 2023 (2022: £3,030 million headwind) and the net repayment in borrowings described on page 56. Retirement Benefit Schemes The Group’s subsidiary undertakings operate defined benefit schemes, including pension and post-retirement healthcare schemes, and defined contribution schemes. The most significant arrangements are in the U.S., the UK, Canada, Germany, Switzerland and the Netherlands. Together, schemes in these territories account for over 90% of the total underlying obligations of the Group’s defined benefit arrangements and over 70% of the current service cost. Benefits provided through defined contribution schemes are charged as an expense as payments fall due. The liabilities arising in respect of defined benefit schemes are determined in accordance with the advice of independent, professionally qualified actuaries, using the projected unit credit method. It is Group policy that all schemes are formally valued at least every three years. Contributions to the defined benefit schemes are determined after consultation with the respective trustees and actuaries of the individual externally funded schemes, taking into account regulatory environments. The present total value of funded scheme liabilities as at 31 December 2023 was £6,417 million (2022: £6,515 million), while unfunded scheme liabilities amounted to £785 million (2022: £797 million). The schemes’ assets decreased to £7,317 million from £7,424 million in 2022, itself a decrease from £10,816 million in 2021. The overall position for all pension and healthcare schemes in Group subsidiaries amounted to a net asset of £75 million at the end of 2023, compared to a net asset of £51 million at the end of 2022. In addition, during 2022, the risk profiles and values of amounts relating to retirement benefit arrangements were impacted by a partial buy-out in the U.S. Litigation and Settlements As discussed in note 31 in the Notes on the Accounts, various legal proceedings or claims are pending or may be instituted against the Group. Government Activity The marketing, sale, taxation and use of tobacco products have been subject to substantial regulation by government and health officials for many years. For information about the risks related to regulation, see page 123 and pages 361 to 369. BAT Annual Report and Form 20-F 2023 Strategic Report Governance Report Financial Statements Other Information Dynamic Business Other 58
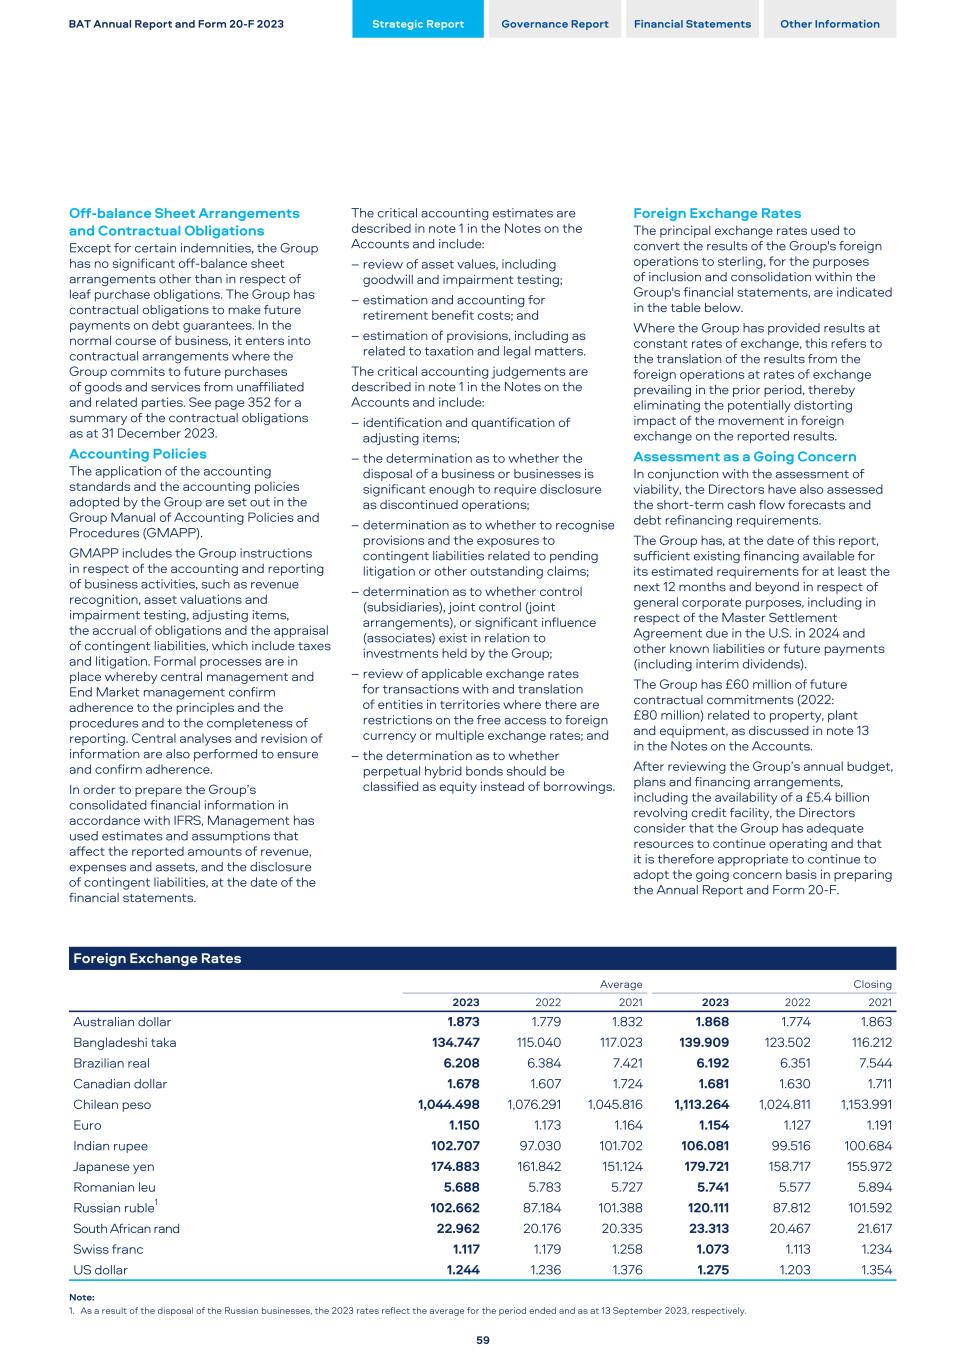
Off-balance Sheet Arrangements and Contractual Obligations Except for certain indemnities, the Group has no significant off-balance sheet arrangements other than in respect of leaf purchase obligations. The Group has contractual obligations to make future payments on debt guarantees. In the normal course of business, it enters into contractual arrangements where the Group commits to future purchases of goods and services from unaffiliated and related parties. See page 352 for a summary of the contractual obligations as at 31 December 2023. Accounting Policies The application of the accounting standards and the accounting policies adopted by the Group are set out in the Group Manual of Accounting Policies and Procedures (GMAPP). GMAPP includes the Group instructions in respect of the accounting and reporting of business activities, such as revenue recognition, asset valuations and impairment testing, adjusting items, the accrual of obligations and the appraisal of contingent liabilities, which include taxes and litigation. Formal processes are in place whereby central management and End Market management confirm adherence to the principles and the procedures and to the completeness of reporting. Central analyses and revision of information are also performed to ensure and confirm adherence. In order to prepare the Group’s consolidated financial information in accordance with IFRS, Management has used estimates and assumptions that affect the reported amounts of revenue, expenses and assets, and the disclosure of contingent liabilities, at the date of the financial statements. The critical accounting estimates are described in note 1 in the Notes on the Accounts and include: – review of asset values, including goodwill and impairment testing; – estimation and accounting for retirement benefit costs; and – estimation of provisions, including as related to taxation and legal matters. The critical accounting judgements are described in note 1 in the Notes on the Accounts and include: – identification and quantification of adjusting items; – the determination as to whether the disposal of a business or businesses is significant enough to require disclosure as discontinued operations; – determination as to whether to recognise provisions and the exposures to contingent liabilities related to pending litigation or other outstanding claims; – determination as to whether control (subsidiaries), joint control (joint arrangements), or significant influence (associates) exist in relation to investments held by the Group; – review of applicable exchange rates for transactions with and translation of entities in territories where there are restrictions on the free access to foreign currency or multiple exchange rates; and – the determination as to whether perpetual hybrid bonds should be classified as equity instead of borrowings. Foreign Exchange Rates The principal exchange rates used to convert the results of the Group's foreign operations to sterling, for the purposes of inclusion and consolidation within the Group's financial statements, are indicated in the table below. Where the Group has provided results at constant rates of exchange, this refers to the translation of the results from the foreign operations at rates of exchange prevailing in the prior period, thereby eliminating the potentially distorting impact of the movement in foreign exchange on the reported results. Assessment as a Going Concern In conjunction with the assessment of viability, the Directors have also assessed the short-term cash flow forecasts and debt refinancing requirements. The Group has, at the date of this report, sufficient existing financing available for its estimated requirements for at least the next 12 months and beyond in respect of general corporate purposes, including in respect of the Master Settlement Agreement due in the U.S. in 2024 and other known liabilities or future payments (including interim dividends). The Group has £60 million of future contractual commitments (2022: £80 million) related to property, plant and equipment, as discussed in note 13 in the Notes on the Accounts. After reviewing the Group’s annual budget, plans and financing arrangements, including the availability of a £5.4 billion revolving credit facility, the Directors consider that the Group has adequate resources to continue operating and that it is therefore appropriate to continue to adopt the going concern basis in preparing the Annual Report and Form 20‑F. Foreign Exchange Rates Average Closing 2023 2022 2021 2023 2022 2021 Australian dollar 1.873 1.779 1.832 1.868 1.774 1.863 Bangladeshi taka 134.747 115.040 117.023 139.909 123.502 116.212 Brazilian real 6.208 6.384 7.421 6.192 6.351 7.544 Canadian dollar 1.678 1.607 1.724 1.681 1.630 1.711 Chilean peso 1,044.498 1,076.291 1,045.816 1,113.264 1,024.811 1,153.991 Euro 1.150 1.173 1.164 1.154 1.127 1.191 Indian rupee 102.707 97.030 101.702 106.081 99.516 100.684 Japanese yen 174.883 161.842 151.124 179.721 158.717 155.972 Romanian leu 5.688 5.783 5.727 5.741 5.577 5.894 Russian ruble1 102.662 87.184 101.388 120.111 87.812 101.592 South African rand 22.962 20.176 20.335 23.313 20.467 21.617 Swiss franc 1.117 1.179 1.258 1.073 1.113 1.234 US dollar 1.244 1.236 1.376 1.275 1.203 1.354 Note: 1. As a result of the disposal of the Russian businesses, the 2023 rates reflect the average for the period ended and as at 13 September 2023, respectively. BAT Annual Report and Form 20-F 2023 Strategic Report Governance Report Financial Statements Other Information 59
Sustainable Future Building a Sustainable Future is about seeking to actively migrate consumers away from cigarettes and to smokeless alternatives sustainably, responsibly and with integrity. Science will be a primary driver of our efforts, supported by more active external engagement and regulatory focus, while embedding sustainability across our organisation. The key building blocks of the Sustainable Future pillar are: Tobacco Harm Reduction Acceptance Shaping the Landscape Leading in Sustainability & Integrity Our commitments under Sustainable Future: Building a Smokeless World Investing in the products, science and engagement to make A Better TomorrowTM a reality Conducting our business sustainably and with integrity Tobacco Harm Reduction Acceptance A Better Tomorrow™ through THR The best choice any adult smoker can make will always be quitting combustible tobacco products completely. Yet many do not. Our ambition for A Better Tomorrow™ is to reduce the health impact of our business via Tobacco Harm Reduction (THR) to help Build a Smokeless World. We know that stakeholders increasingly expect us to demonstrate that we are a purpose-driven enterprise, and that we are committed to a future where, ultimately, we move away from combustible cigarettes. This is why, for several years now, we have been transforming. We have created a multi-category portfolio of scientifically- substantiated, reduced-risk*† alternatives, tested to meet or exceed industry-leading standards. THR underpins our purpose and, as such, is a vital part of our transformation. Ultimately, our THR ambition will be quantified by improved health outcomes (decrease of morbidity and mortality) at both individual and population levels relative to the scenario of a world with only combustible cigarettes. Why THR matters We know combustible cigarettes pose serious health risks. The only way to avoid those risks is not to start smoking or to quit. However, more than one billion people today continue to smoke, and, according to the World Health Organization, it is estimated that smoking-related diseases cause more than eight million deaths globally each year. THR is a well recognised public health strategy that aims to minimise the harm caused by smoking. This is done by encouraging adult smokers, who would otherwise continue to smoke, to switch completely to reduced-risk*†, smokeless alternatives. There has been significant progress in the global THR journey over the past decade. Today, there are three significant global smokeless categories: Vapour, Heated Products and Modern Oral. The global adoption of these smokeless product categories over the last decade has been significant. The latest estimate of the global number of vapers alone is 82 million.1 For those adult consumers who would otherwise continue to smoke, we encourage making the switch to smokeless products. We provide adult consumers with a range of scientifically-substantiated, smokeless alternatives to smoking. Our aim is to provide products that deliver comparable satisfaction in nicotine delivery, use, and sensorial aspects. For example, some studies suggest that Vapour products are more successful than nicotine replacement therapy in helping people stop smoking2, by providing a satisfactory alternative to cigarettes despite not being smoking cessation products or marketed as such. World-class science World-class science is crucial to providing a robust evidence base to substantiate the role of New Category products in THR. We use a wide range of analytical and pre-clinical techniques, specialised laboratory technology and expertise to test our products and aim to ensure they meet high quality standards. This is supplemented by collaborations with an ecosystem of global external researchers, and clinical research organisations, who bring independent and specialist expertise that enhance our internal capabilities. THR substantiation: Our nine-step risk assessment framework Most smokeless alternatives are still relatively new to the market. As a consequence, in most cases, there is a lack of long-term epidemiological data needed to demonstrate the overall impact on public health. That is why it is necessary to take a ‘weight of evidence’ approach. Drawing on work by the U.S. Institute of Medicine, we utilise our nine-step risk assessment framework. This evaluates the emissions, exposure and risk profile of our New Category products and compares them to smoking cigarettes or other comparators, such as nicotine replacement therapy. In terms of THR scientific substantiation, our Heated Products, Vapour, and Modern Oral products have been reported in peer-reviewed pre-clinical, clinical, and population level research publications and journals, summarising significant reductions in emissions, exposure and risk reduction versus smoking. Looking ahead, we are working on delivering the next horizon of science to demonstrate that our Non-Combustible products not only reduce risk, but quantitatively reduce disease-relevant harm. We aim to follow best practice and adhere to high standards of governance and ethics in all our scientific research. Regardless of the results of such research, we are committed to sharing the outcomes. Our scientists have published more than 198 scientific papers to date about our New Category products. For more information on Tobacco Harm reduction, see page 78+ BAT Annual Report and Form 20-F 2023 Strategic Report Governance Report Financial Statements Other Information Sustainable Future Strategic Pillar Overview 60
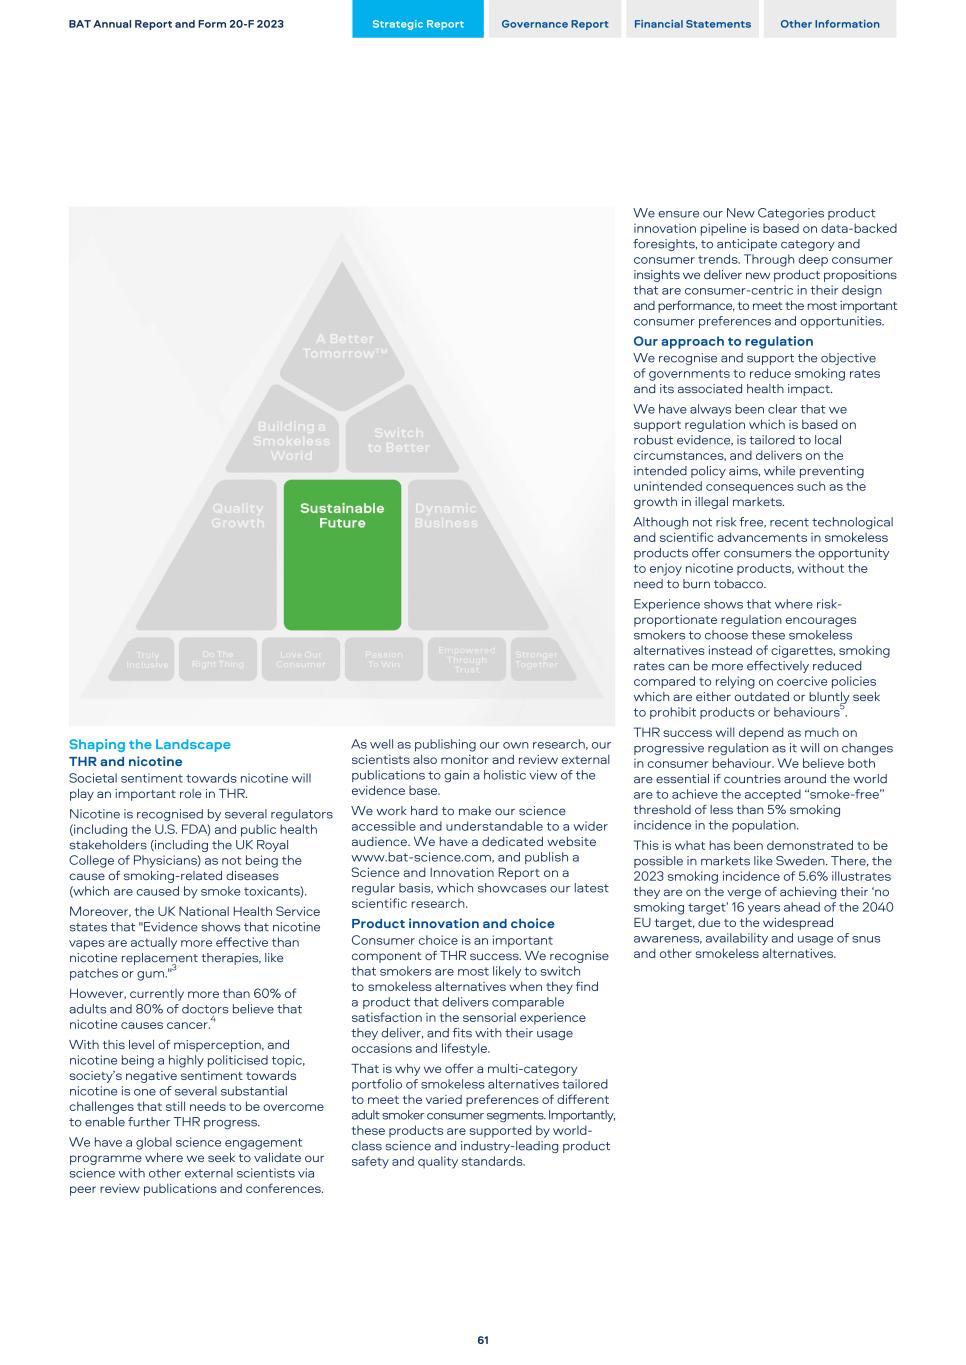
Shaping the Landscape THR and nicotine Societal sentiment towards nicotine will play an important role in THR. Nicotine is recognised by several regulators (including the U.S. FDA) and public health stakeholders (including the UK Royal College of Physicians) as not being the cause of smoking-related diseases (which are caused by smoke toxicants). Moreover, the UK National Health Service states that "Evidence shows that nicotine vapes are actually more effective than nicotine replacement therapies, like patches or gum."3 However, currently more than 60% of adults and 80% of doctors believe that nicotine causes cancer.4 With this level of misperception, and nicotine being a highly politicised topic, society’s negative sentiment towards nicotine is one of several substantial challenges that still needs to be overcome to enable further THR progress. We have a global science engagement programme where we seek to validate our science with other external scientists via peer review publications and conferences. As well as publishing our own research, our scientists also monitor and review external publications to gain a holistic view of the evidence base. We work hard to make our science accessible and understandable to a wider audience. We have a dedicated website www.bat-science.com, and publish a Science and Innovation Report on a regular basis, which showcases our latest scientific research. Product innovation and choice Consumer choice is an important component of THR success. We recognise that smokers are most likely to switch to smokeless alternatives when they find a product that delivers comparable satisfaction in the sensorial experience they deliver, and fits with their usage occasions and lifestyle. That is why we offer a multi-category portfolio of smokeless alternatives tailored to meet the varied preferences of different adult smoker consumer segments. Importantly, these products are supported by world- class science and industry-leading product safety and quality standards. We ensure our New Categories product innovation pipeline is based on data-backed foresights, to anticipate category and consumer trends. Through deep consumer insights we deliver new product propositions that are consumer-centric in their design and performance, to meet the most important consumer preferences and opportunities. Our approach to regulation We recognise and support the objective of governments to reduce smoking rates and its associated health impact. We have always been clear that we support regulation which is based on robust evidence, is tailored to local circumstances, and delivers on the intended policy aims, while preventing unintended consequences such as the growth in illegal markets. Although not risk free, recent technological and scientific advancements in smokeless products offer consumers the opportunity to enjoy nicotine products, without the need to burn tobacco. Experience shows that where risk- proportionate regulation encourages smokers to choose these smokeless alternatives instead of cigarettes, smoking rates can be more effectively reduced compared to relying on coercive policies which are either outdated or bluntly seek to prohibit products or behaviours5. THR success will depend as much on progressive regulation as it will on changes in consumer behaviour. We believe both are essential if countries around the world are to achieve the accepted “smoke-free” threshold of less than 5% smoking incidence in the population. This is what has been demonstrated to be possible in markets like Sweden. There, the 2023 smoking incidence of 5.6% illustrates they are on the verge of achieving their ‘no smoking target’ 16 years ahead of the 2040 EU target, due to the widespread awareness, availability and usage of snus and other smokeless alternatives. BAT Annual Report and Form 20-F 2023 Strategic Report Governance Report Financial Statements Other Information 61
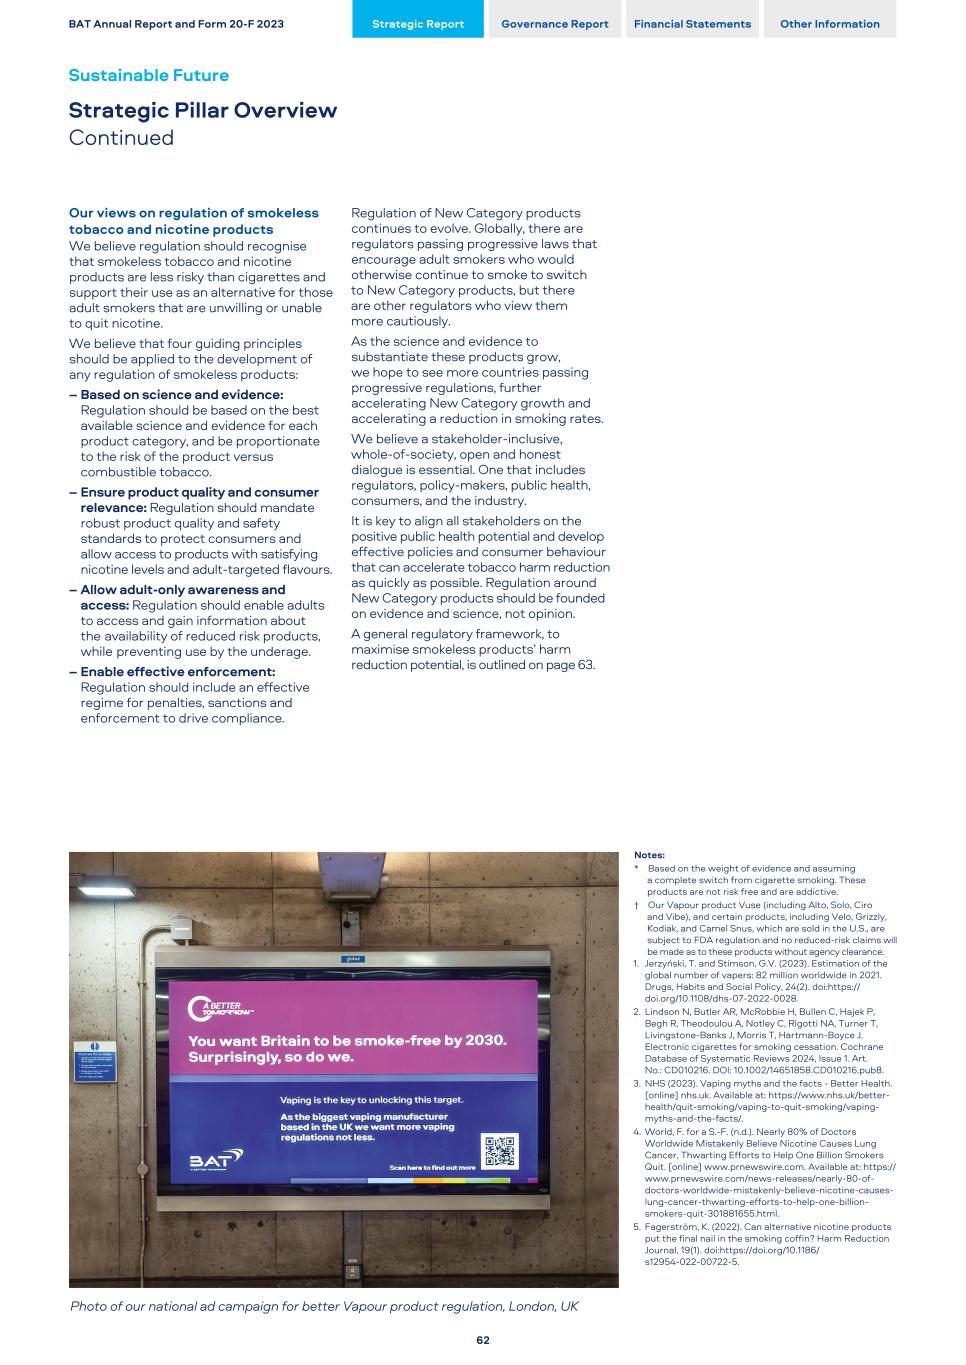
Our views on regulation of smokeless tobacco and nicotine products We believe regulation should recognise that smokeless tobacco and nicotine products are less risky than cigarettes and support their use as an alternative for those adult smokers that are unwilling or unable to quit nicotine. We believe that four guiding principles should be applied to the development of any regulation of smokeless products: – Based on science and evidence: Regulation should be based on the best available science and evidence for each product category, and be proportionate to the risk of the product versus combustible tobacco. – Ensure product quality and consumer relevance: Regulation should mandate robust product quality and safety standards to protect consumers and allow access to products with satisfying nicotine levels and adult-targeted flavours. – Allow adult-only awareness and access: Regulation should enable adults to access and gain information about the availability of reduced risk products, while preventing use by the underage. – Enable effective enforcement: Regulation should include an effective regime for penalties, sanctions and enforcement to drive compliance. Regulation of New Category products continues to evolve. Globally, there are regulators passing progressive laws that encourage adult smokers who would otherwise continue to smoke to switch to New Category products, but there are other regulators who view them more cautiously. As the science and evidence to substantiate these products grow, we hope to see more countries passing progressive regulations, further accelerating New Category growth and accelerating a reduction in smoking rates. We believe a stakeholder-inclusive, whole-of-society, open and honest dialogue is essential. One that includes regulators, policy-makers, public health, consumers, and the industry. It is key to align all stakeholders on the positive public health potential and develop effective policies and consumer behaviour that can accelerate tobacco harm reduction as quickly as possible. Regulation around New Category products should be founded on evidence and science, not opinion. A general regulatory framework, to maximise smokeless products’ harm reduction potential, is outlined on page 63. Notes: * Based on the weight of evidence and assuming a complete switch from cigarette smoking. These products are not risk free and are addictive. † Our Vapour product Vuse (including Alto, Solo, Ciro and Vibe), and certain products, including Velo, Grizzly, Kodiak, and Camel Snus, which are sold in the U.S., are subject to FDA regulation and no reduced-risk claims will be made as to these products without agency clearance. 1. Jerzyński, T. and Stimson, G.V. (2023). Estimation of the global number of vapers: 82 million worldwide in 2021. Drugs, Habits and Social Policy, 24(2). doi:https:// doi.org/10.1108/dhs-07-2022-0028. 2. Lindson N, Butler AR, McRobbie H, Bullen C, Hajek P, Begh R, Theodoulou A, Notley C, Rigotti NA, Turner T, Livingstone-Banks J, Morris T, Hartmann-Boyce J. Electronic cigarettes for smoking cessation. Cochrane Database of Systematic Reviews 2024, Issue 1. Art. No.: CD010216. DOI: 10.1002/14651858.CD010216.pub8. 3. NHS (2023). Vaping myths and the facts - Better Health. [online] nhs.uk. Available at: https://www.nhs.uk/better- health/quit-smoking/vaping-to-quit-smoking/vaping- myths-and-the-facts/. 4. World, F. for a S.-F. (n.d.). Nearly 80% of Doctors Worldwide Mistakenly Believe Nicotine Causes Lung Cancer, Thwarting Efforts to Help One Billion Smokers Quit. [online] www.prnewswire.com. Available at: https:// www.prnewswire.com/news-releases/nearly-80-of- doctors-worldwide-mistakenly-believe-nicotine-causes- lung-cancer-thwarting-efforts-to-help-one-billion- smokers-quit-301881655.html. 5. Fagerström, K. (2022). Can alternative nicotine products put the final nail in the smoking coffin? Harm Reduction Journal, 19(1). doi:https://doi.org/10.1186/ s12954-022-00722-5. BAT Annual Report and Form 20-F 2023 Strategic Report Governance Report Financial Statements Other Information Sustainable Future Strategic Pillar Overview Continued 62 Photo of our national ad campaign for better Vapour product regulation, London, UK
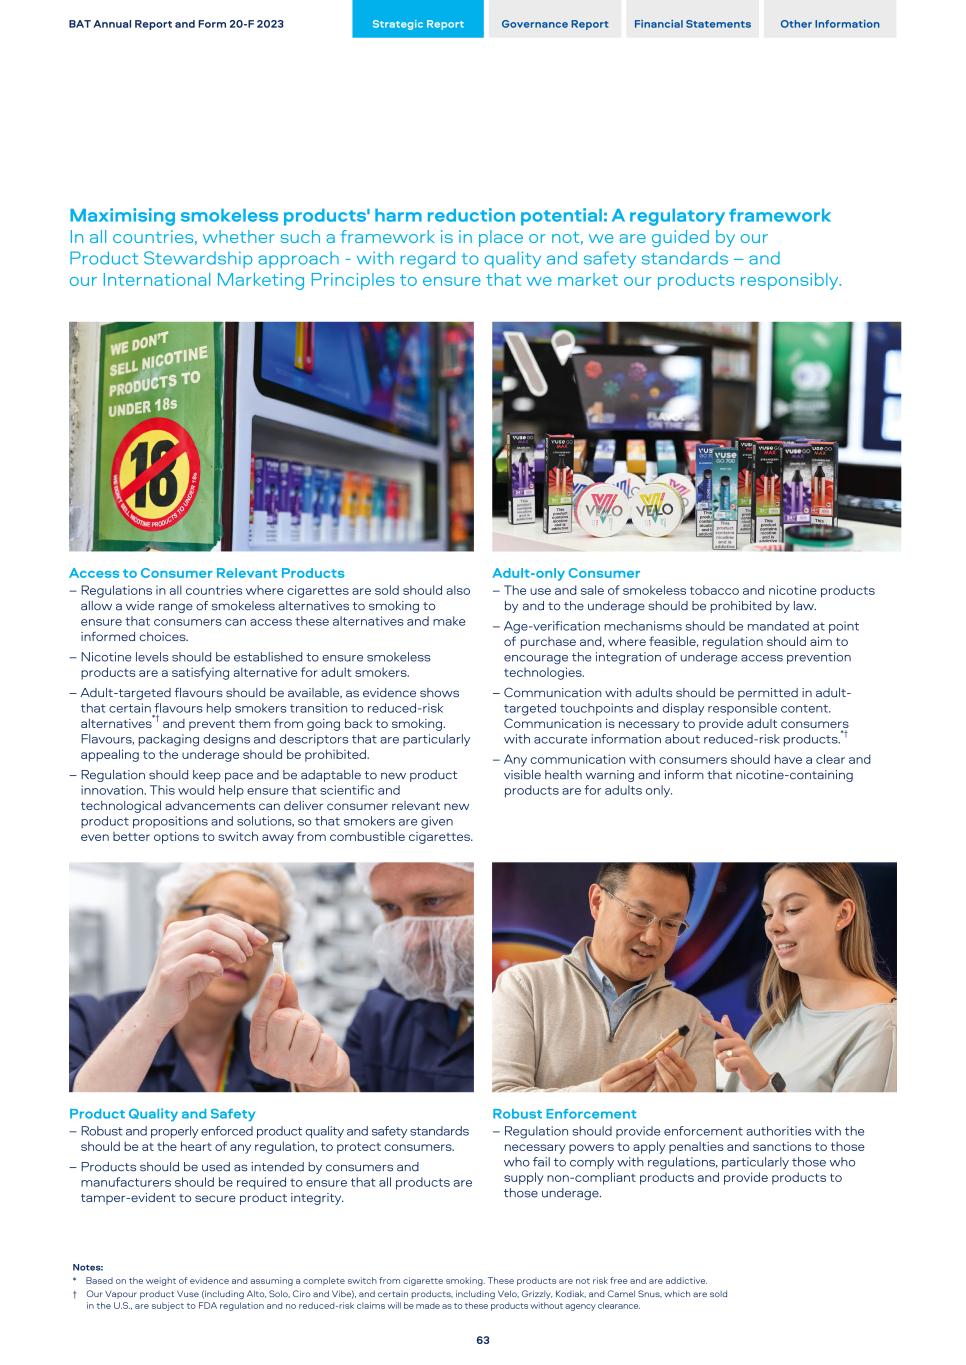
Maximising smokeless products' harm reduction potential: A regulatory framework In all countries, whether such a framework is in place or not, we are guided by our Product Stewardship approach - with regard to quality and safety standards – and our International Marketing Principles to ensure that we market our products responsibly. Access to Consumer Relevant Products – Regulations in all countries where cigarettes are sold should also allow a wide range of smokeless alternatives to smoking to ensure that consumers can access these alternatives and make informed choices. – Nicotine levels should be established to ensure smokeless products are a satisfying alternative for adult smokers. – Adult-targeted flavours should be available, as evidence shows that certain flavours help smokers transition to reduced-risk alternatives*† and prevent them from going back to smoking. Flavours, packaging designs and descriptors that are particularly appealing to the underage should be prohibited. – Regulation should keep pace and be adaptable to new product innovation. This would help ensure that scientific and technological advancements can deliver consumer relevant new product propositions and solutions, so that smokers are given even better options to switch away from combustible cigarettes. Product Quality and Safety – Robust and properly enforced product quality and safety standards should be at the heart of any regulation, to protect consumers. – Products should be used as intended by consumers and manufacturers should be required to ensure that all products are tamper-evident to secure product integrity. Adult-only Consumer – The use and sale of smokeless tobacco and nicotine products by and to the underage should be prohibited by law. – Age-verification mechanisms should be mandated at point of purchase and, where feasible, regulation should aim to encourage the integration of underage access prevention technologies. – Communication with adults should be permitted in adult- targeted touchpoints and display responsible content. Communication is necessary to provide adult consumers with accurate information about reduced-risk products.*† – Any communication with consumers should have a clear and visible health warning and inform that nicotine-containing products are for adults only. Robust Enforcement – Regulation should provide enforcement authorities with the necessary powers to apply penalties and sanctions to those who fail to comply with regulations, particularly those who supply non-compliant products and provide products to those underage. BAT Annual Report and Form 20-F 2023 Strategic Report Governance Report Financial Statements Other Information 63 Notes: * Based on the weight of evidence and assuming a complete switch from cigarette smoking. These products are not risk free and are addictive. † Our Vapour product Vuse (including Alto, Solo, Ciro and Vibe), and certain products, including Velo, Grizzly, Kodiak, and Camel Snus, which are sold in the U.S., are subject to FDA regulation and no reduced-risk claims will be made as to these products without agency clearance.
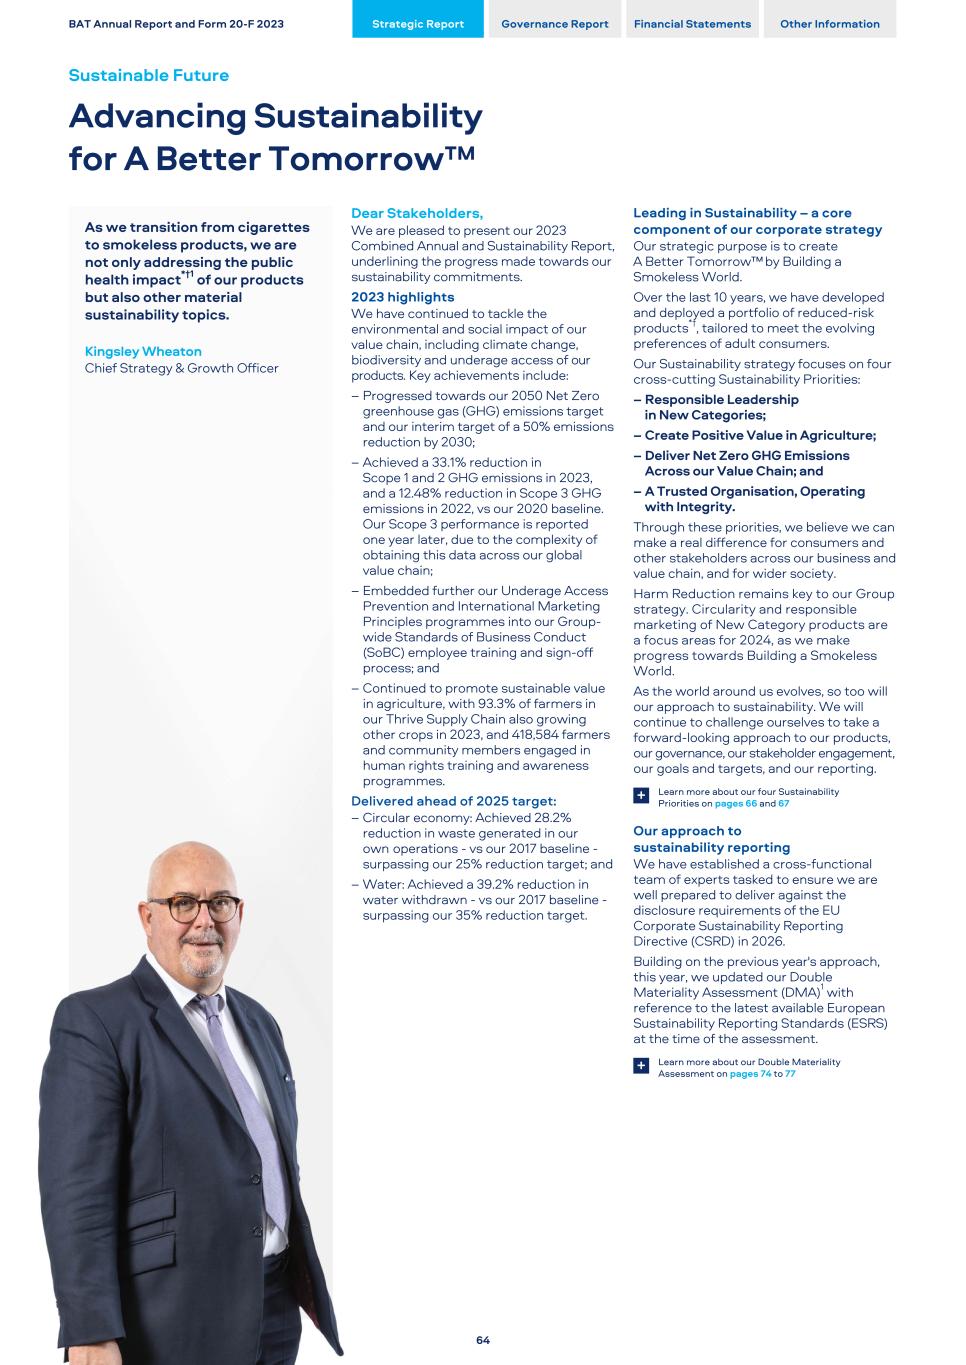
As we transition from cigarettes to smokeless products, we are not only addressing the public health impact*†1 of our products but also other material sustainability topics. Kingsley Wheaton Chief Strategy & Growth Officer Dear Stakeholders, We are pleased to present our 2023 Combined Annual and Sustainability Report, underlining the progress made towards our sustainability commitments. 2023 highlights We have continued to tackle the environmental and social impact of our value chain, including climate change, biodiversity and underage access of our products. Key achievements include: – Progressed towards our 2050 Net Zero greenhouse gas (GHG) emissions target and our interim target of a 50% emissions reduction by 2030; – Achieved a 33.1% reduction in Scope 1 and 2 GHG emissions in 2023, and a 12.48% reduction in Scope 3 GHG emissions in 2022, vs our 2020 baseline. Our Scope 3 performance is reported one year later, due to the complexity of obtaining this data across our global value chain; – Embedded further our Underage Access Prevention and International Marketing Principles programmes into our Group- wide Standards of Business Conduct (SoBC) employee training and sign-off process; and – Continued to promote sustainable value in agriculture, with 93.3% of farmers in our Thrive Supply Chain also growing other crops in 2023, and 418,584 farmers and community members engaged in human rights training and awareness programmes. Delivered ahead of 2025 target: – Circular economy: Achieved 28.2% reduction in waste generated in our own operations - vs our 2017 baseline - surpassing our 25% reduction target; and – Water: Achieved a 39.2% reduction in water withdrawn - vs our 2017 baseline - surpassing our 35% reduction target. Leading in Sustainability – a core component of our corporate strategy Our strategic purpose is to create A Better Tomorrow™ by Building a Smokeless World. Over the last 10 years, we have developed and deployed a portfolio of reduced-risk products*†, tailored to meet the evolving preferences of adult consumers. Our Sustainability strategy focuses on four cross-cutting Sustainability Priorities: – Responsible Leadership in New Categories; – Create Positive Value in Agriculture; – Deliver Net Zero GHG Emissions Across our Value Chain; and – A Trusted Organisation, Operating with Integrity. Through these priorities, we believe we can make a real difference for consumers and other stakeholders across our business and value chain, and for wider society. Harm Reduction remains key to our Group strategy. Circularity and responsible marketing of New Category products are a focus areas for 2024, as we make progress towards Building a Smokeless World. As the world around us evolves, so too will our approach to sustainability. We will continue to challenge ourselves to take a forward-looking approach to our products, our governance, our stakeholder engagement, our goals and targets, and our reporting. Learn more about our four Sustainability Priorities on pages 66 and 67+ Our approach to sustainability reporting We have established a cross-functional team of experts tasked to ensure we are well prepared to deliver against the disclosure requirements of the EU Corporate Sustainability Reporting Directive (CSRD) in 2026. Building on the previous year's approach, this year, we updated our Double Materiality Assessment (DMA)1 with reference to the latest available European Sustainability Reporting Standards (ESRS) at the time of the assessment. Learn more about our Double Materiality Assessment on pages 74 to 77+ BAT Annual Report and Form 20-F 2023 Strategic Report Governance Report Financial Statements Other Information Sustainable Future Advancing Sustainability for A Better Tomorrow™ 64
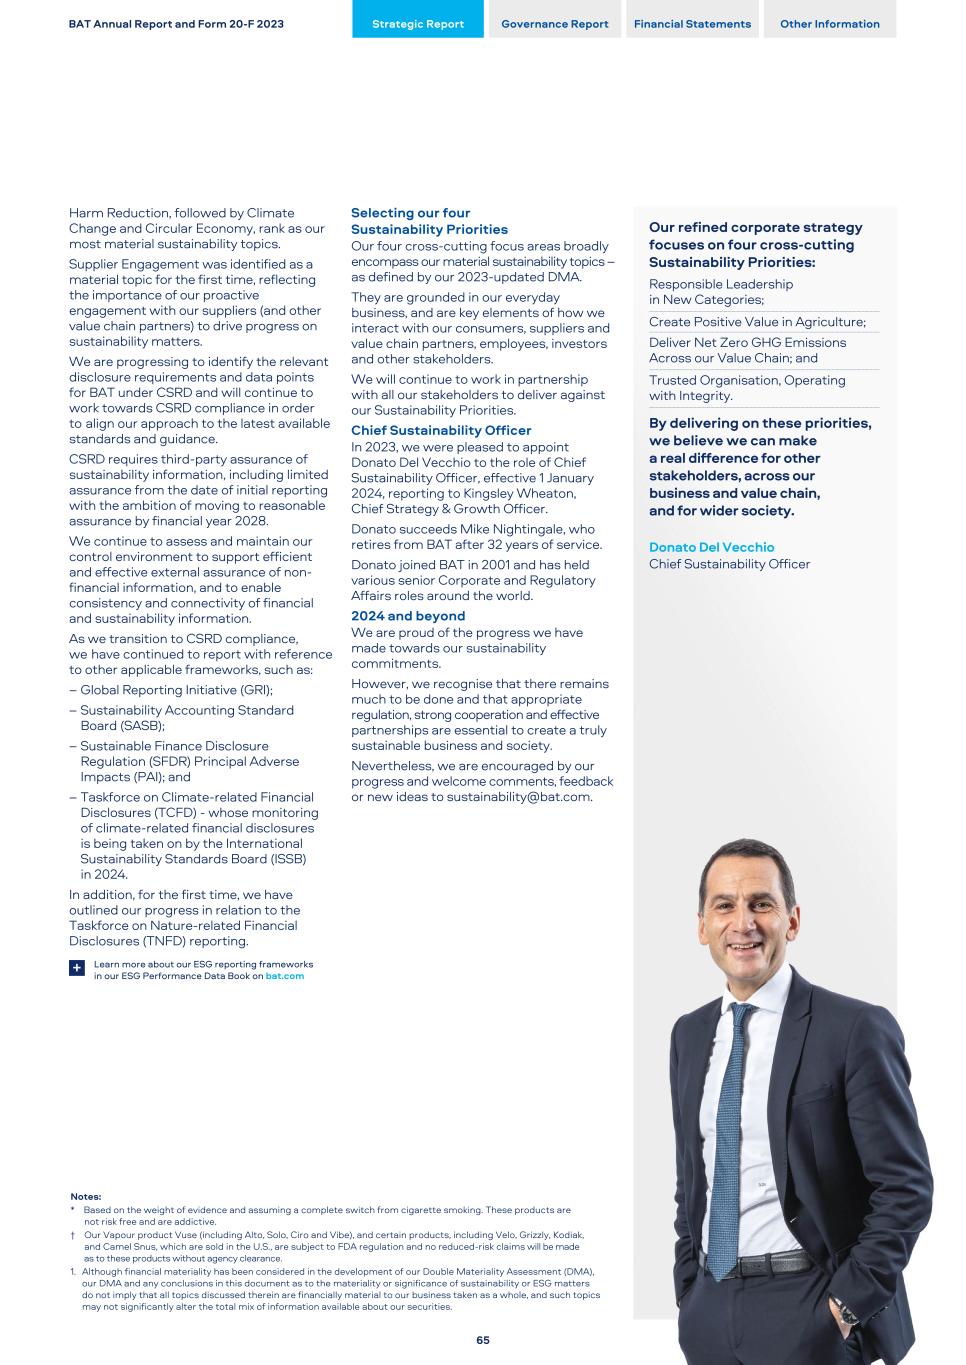
Harm Reduction, followed by Climate Change and Circular Economy, rank as our most material sustainability topics. Supplier Engagement was identified as a material topic for the first time, reflecting the importance of our proactive engagement with our suppliers (and other value chain partners) to drive progress on sustainability matters. We are progressing to identify the relevant disclosure requirements and data points for BAT under CSRD and will continue to work towards CSRD compliance in order to align our approach to the latest available standards and guidance. CSRD requires third-party assurance of sustainability information, including limited assurance from the date of initial reporting with the ambition of moving to reasonable assurance by financial year 2028. We continue to assess and maintain our control environment to support efficient and effective external assurance of non- financial information, and to enable consistency and connectivity of financial and sustainability information. As we transition to CSRD compliance, we have continued to report with reference to other applicable frameworks, such as: – Global Reporting Initiative (GRI); – Sustainability Accounting Standard Board (SASB); – Sustainable Finance Disclosure Regulation (SFDR) Principal Adverse Impacts (PAI); and – Taskforce on Climate-related Financial Disclosures (TCFD) - whose monitoring of climate-related financial disclosures is being taken on by the International Sustainability Standards Board (ISSB) in 2024. In addition, for the first time, we have outlined our progress in relation to the Taskforce on Nature-related Financial Disclosures (TNFD) reporting. Learn more about our ESG reporting frameworks in our ESG Performance Data Book on bat.com+ Selecting our four Sustainability Priorities Our four cross-cutting focus areas broadly encompass our material sustainability topics – as defined by our 2023-updated DMA. They are grounded in our everyday business, and are key elements of how we interact with our consumers, suppliers and value chain partners, employees, investors and other stakeholders. We will continue to work in partnership with all our stakeholders to deliver against our Sustainability Priorities. Chief Sustainability Officer In 2023, we were pleased to appoint Donato Del Vecchio to the role of Chief Sustainability Officer, effective 1 January 2024, reporting to Kingsley Wheaton, Chief Strategy & Growth Officer. Donato succeeds Mike Nightingale, who retires from BAT after 32 years of service. Donato joined BAT in 2001 and has held various senior Corporate and Regulatory Affairs roles around the world. 2024 and beyond We are proud of the progress we have made towards our sustainability commitments. However, we recognise that there remains much to be done and that appropriate regulation, strong cooperation and effective partnerships are essential to create a truly sustainable business and society. Nevertheless, we are encouraged by our progress and welcome comments, feedback or new ideas to sustainability@bat.com. Our refined corporate strategy focuses on four cross-cutting Sustainability Priorities: Responsible Leadership in New Categories; Create Positive Value in Agriculture; Deliver Net Zero GHG Emissions Across our Value Chain; and Trusted Organisation, Operating with Integrity. By delivering on these priorities, we believe we can make a real difference for other stakeholders, across our business and value chain, and for wider society. Donato Del Vecchio Chief Sustainability Officer BAT Annual Report and Form 20-F 2023 Strategic Report Governance Report Financial Statements Other Information 65 Notes: * Based on the weight of evidence and assuming a complete switch from cigarette smoking. These products are not risk free and are addictive. † Our Vapour product Vuse (including Alto, Solo, Ciro and Vibe), and certain products, including Velo, Grizzly, Kodiak, and Camel Snus, which are sold in the U.S., are subject to FDA regulation and no reduced-risk claims will be made as to these products without agency clearance. 1. Although financial materiality has been considered in the development of our Double Materiality Assessment (DMA), our DMA and any conclusions in this document as to the materiality or significance of sustainability or ESG matters do not imply that all topics discussed therein are financially material to our business taken as a whole, and such topics may not significantly alter the total mix of information available about our securities.
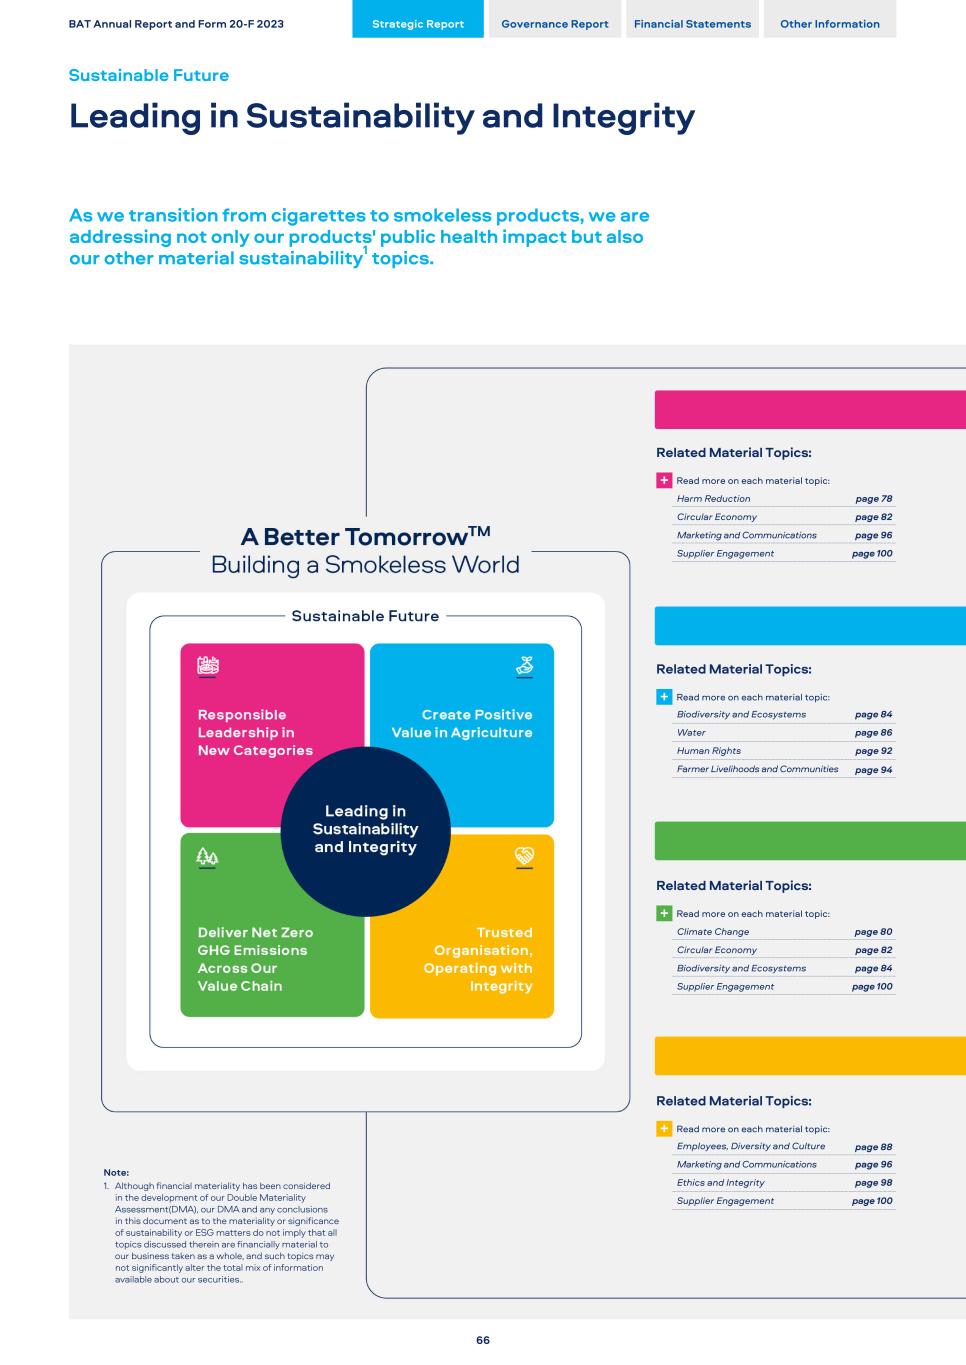
Related Material Topics: + Read more on each material topic: Harm Reduction page 78 Circular Economy page 82 Marketing and Communications page 96 Supplier Engagement page 100 Related Material Topics: + Read more on each material topic: Biodiversity and Ecosystems page 84 Water page 86 Human Rights page 92 Farmer Livelihoods and Communities page 94 Related Material Topics: + Read more on each material topic: Climate Change page 80 Circular Economy page 82 Biodiversity and Ecosystems page 84 Supplier Engagement page 100 Related Material Topics: + Read more on each material topic: Employees, Diversity and Culture page 88 Marketing and Communications page 96 Ethics and Integrity page 98 Supplier Engagement page 100 BAT Annual Report and Form 20-F 2023 Strategic Report Governance Report Financial Statements Other Information Sustainable Future Leading in Sustainability and Integrity As we transition from cigarettes to smokeless products, we are addressing not only our products' public health impact but also our other material sustainability1 topics. 66 Note: 1. Although financial materiality has been considered in the development of our Double Materiality Assessment(DMA), our DMA and any conclusions in this document as to the materiality or significance of sustainability or ESG matters do not imply that all topics discussed therein are financially material to our business taken as a whole, and such topics may not significantly alter the total mix of information available about our securities..
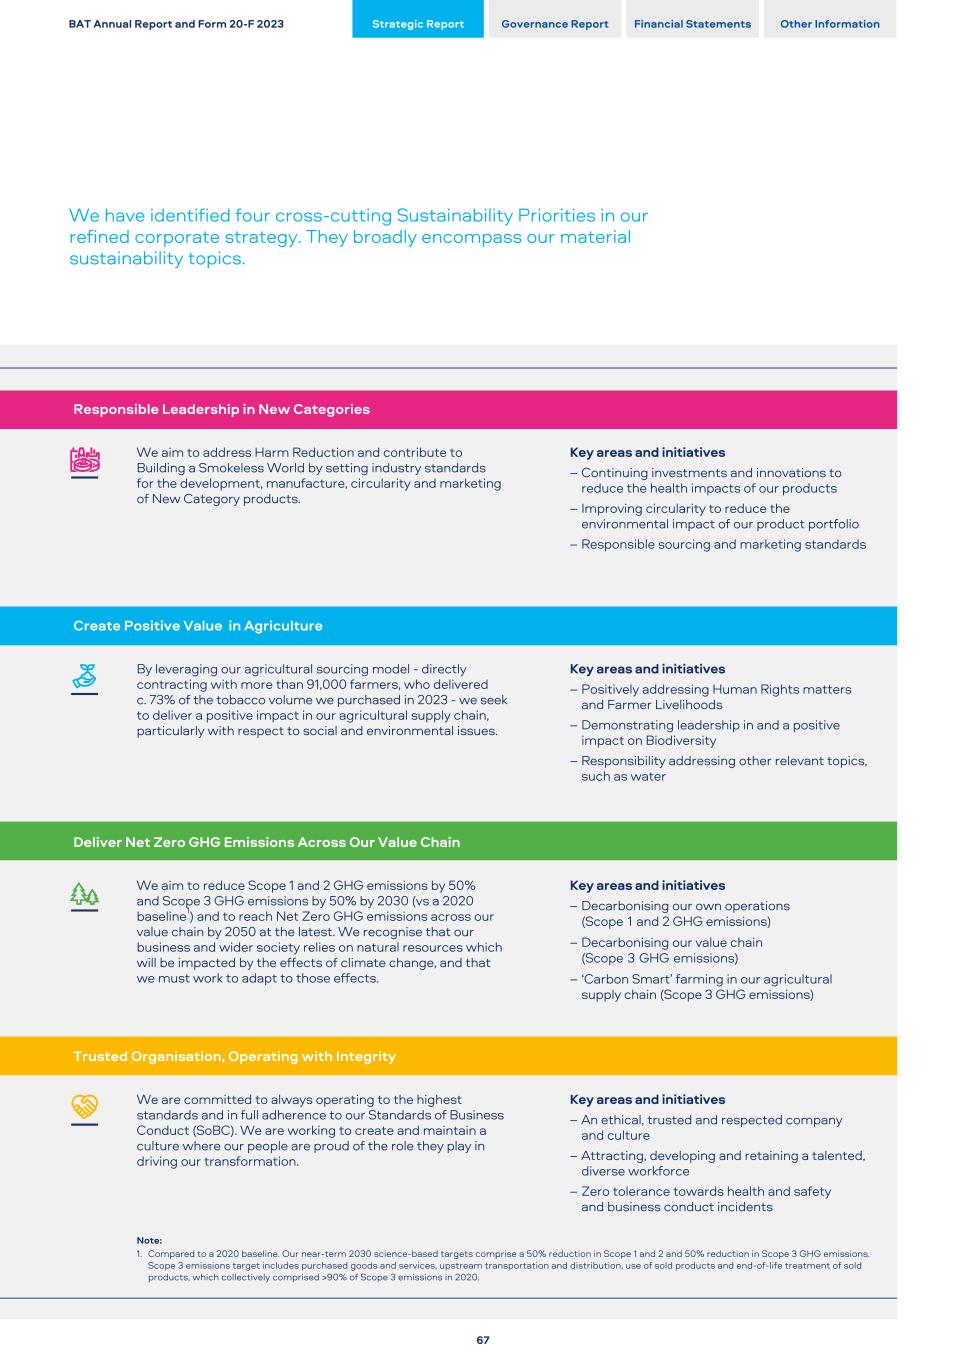
Responsible Leadership in New Categories We aim to address Harm Reduction and contribute to Building a Smokeless World by setting industry standards for the development, manufacture, circularity and marketing of New Category products. Key areas and initiatives – Continuing investments and innovations to reduce the health impacts of our products – Improving circularity to reduce the environmental impact of our product portfolio – Responsible sourcing and marketing standards Create Positive Value in Agriculture By leveraging our agricultural sourcing model - directly contracting with more than 91,000 farmers, who delivered c. 73% of the tobacco volume we purchased in 2023 - we seek to deliver a positive impact in our agricultural supply chain, particularly with respect to social and environmental issues. Key areas and initiatives – Positively addressing Human Rights matters and Farmer Livelihoods – Demonstrating leadership in and a positive impact on Biodiversity – Responsibility addressing other relevant topics, such as water Deliver Net Zero GHG Emissions Across Our Value Chain We aim to reduce Scope 1 and 2 GHG emissions by 50% and Scope 3 GHG emissions by 50% by 2030 (vs a 2020 baseline1) and to reach Net Zero GHG emissions across our value chain by 2050 at the latest. We recognise that our business and wider society relies on natural resources which will be impacted by the effects of climate change, and that we must work to adapt to those effects. Key areas and initiatives – Decarbonising our own operations (Scope 1 and 2 GHG emissions) – Decarbonising our value chain (Scope 3 GHG emissions) – ‘Carbon Smart’ farming in our agricultural supply chain (Scope 3 GHG emissions) Trusted Organisation, Operating with Integrity We are committed to always operating to the highest standards and in full adherence to our Standards of Business Conduct (SoBC). We are working to create and maintain a culture where our people are proud of the role they play in driving our transformation. Key areas and initiatives – An ethical, trusted and respected company and culture – Attracting, developing and retaining a talented, diverse workforce – Zero tolerance towards health and safety and business conduct incidents Note: 1. Compared to a 2020 baseline. Our near-term 2030 science-based targets comprise a 50% reduction in Scope 1 and 2 and 50% reduction in Scope 3 GHG emissions. Scope 3 emissions target includes purchased goods and services, upstream transportation and distribution, use of sold products and end-of-life treatment of sold products, which collectively comprised >90% of Scope 3 emissions in 2020. BAT Annual Report and Form 20-F 2023 Strategic Report Governance Report Financial Statements Other Information We have identified four cross-cutting Sustainability Priorities in our refined corporate strategy. They broadly encompass our material sustainability topics. 67
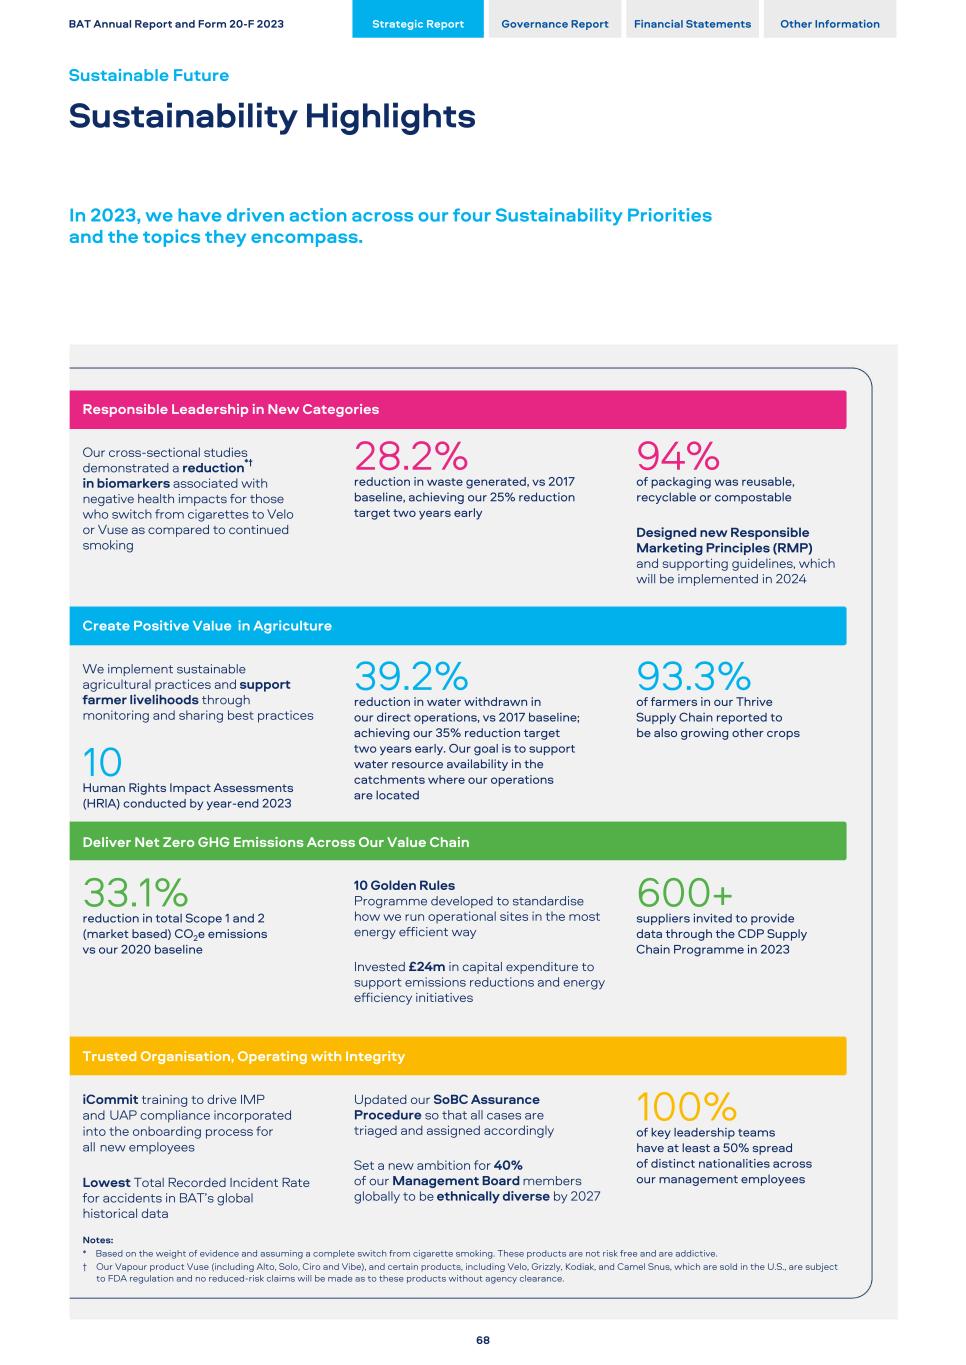
Responsible Leadership in New Categories 28.2% reduction in waste generated, vs 2017 baseline, achieving our 25% reduction target two years early 94% of packaging was reusable, recyclable or compostable Designed new Responsible Marketing Principles (RMP) and supporting guidelines, which will be implemented in 2024 Our cross-sectional studies demonstrated a reduction*† in biomarkers associated with negative health impacts for those who switch from cigarettes to Velo or Vuse as compared to continued smoking Create Positive Value in Agriculture 39.2% reduction in water withdrawn in our direct operations, vs 2017 baseline; achieving our 35% reduction target two years early. Our goal is to support water resource availability in the catchments where our operations are located 93.3% of farmers in our Thrive Supply Chain reported to be also growing other crops We implement sustainable agricultural practices and support farmer livelihoods through monitoring and sharing best practices 10 Human Rights Impact Assessments (HRIA) conducted by year-end 2023 Deliver Net Zero GHG Emissions Across Our Value Chain 33.1% reduction in total Scope 1 and 2 (market based) CO2e emissions vs our 2020 baseline 600+ suppliers invited to provide data through the CDP Supply Chain Programme in 2023 10 Golden Rules Programme developed to standardise how we run operational sites in the most energy efficient way Invested £24m in capital expenditure to support emissions reductions and energy efficiency initiatives Trusted Organisation, Operating with Integrity 100% of key leadership teams have at least a 50% spread of distinct nationalities across our management employees iCommit training to drive IMP and UAP compliance incorporated into the onboarding process for all new employees Lowest Total Recorded Incident Rate for accidents in BAT’s global historical data Updated our SoBC Assurance Procedure so that all cases are triaged and assigned accordingly Set a new ambition for 40% of our Management Board members globally to be ethnically diverse by 2027 Notes: * Based on the weight of evidence and assuming a complete switch from cigarette smoking. These products are not risk free and are addictive. † Our Vapour product Vuse (including Alto, Solo, Ciro and Vibe), and certain products, including Velo, Grizzly, Kodiak, and Camel Snus, which are sold in the U.S., are subject to FDA regulation and no reduced-risk claims will be made as to these products without agency clearance. BAT Annual Report and Form 20-F 2023 Strategic Report Governance Report Financial Statements Other Information Sustainable Future Sustainability Highlights In 2023, we have driven action across our four Sustainability Priorities and the topics they encompass. 68
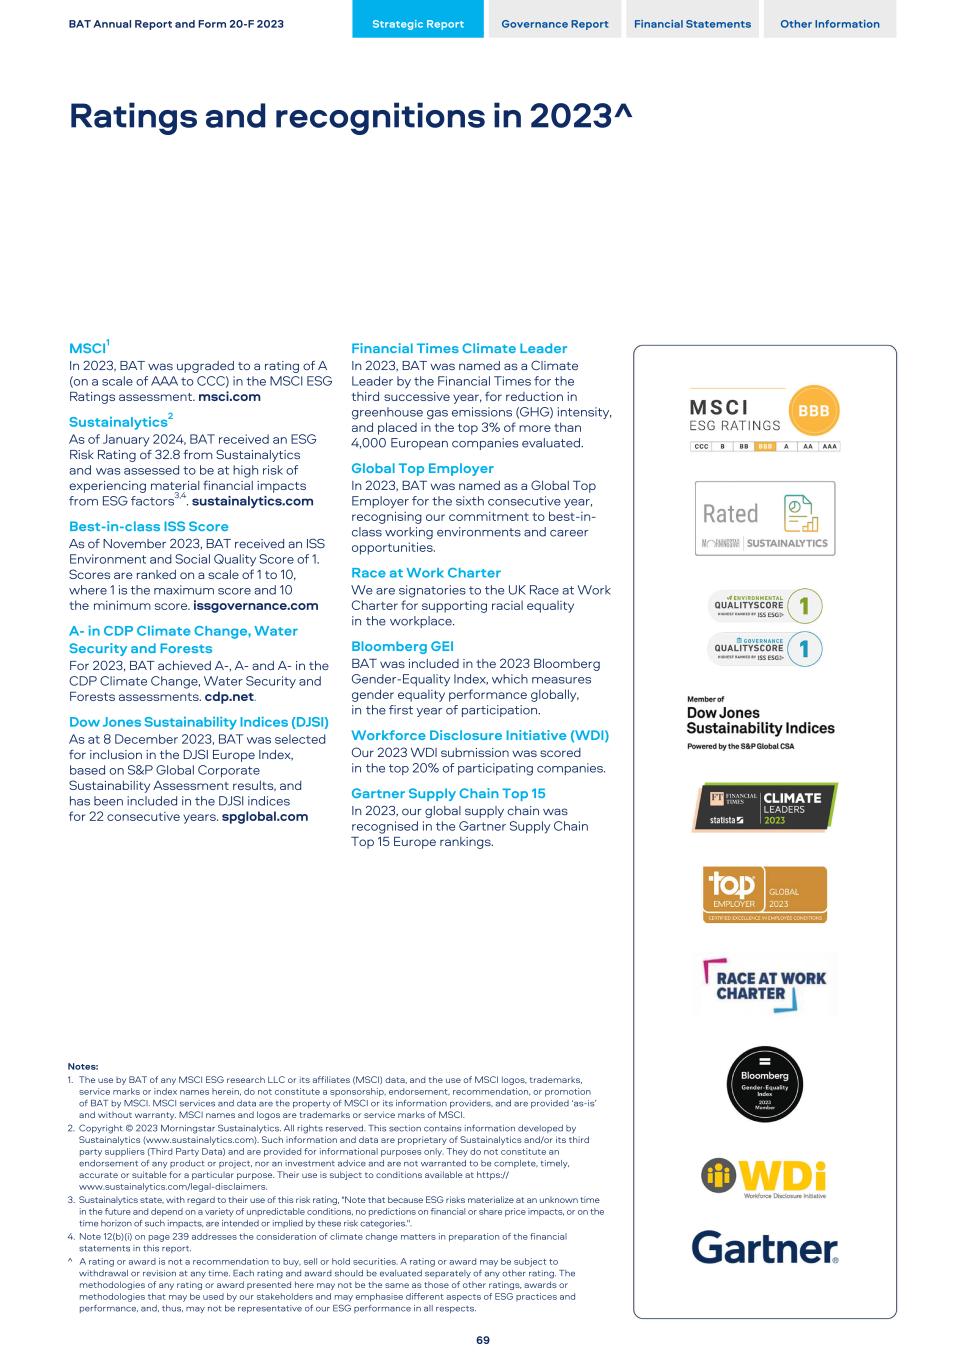
MSCI1 In 2023, BAT was upgraded to a rating of A (on a scale of AAA to CCC) in the MSCI ESG Ratings assessment. msci.com Sustainalytics2 As of January 2024, BAT received an ESG Risk Rating of 32.8 from Sustainalytics and was assessed to be at high risk of experiencing material financial impacts from ESG factors3,4. sustainalytics.com Best-in-class ISS Score As of November 2023, BAT received an ISS Environment and Social Quality Score of 1. Scores are ranked on a scale of 1 to 10, where 1 is the maximum score and 10 the minimum score. issgovernance.com A- in CDP Climate Change, Water Security and Forests For 2023, BAT achieved A-, A- and A- in the CDP Climate Change, Water Security and Forests assessments. cdp.net. Dow Jones Sustainability Indices (DJSI) As at 8 December 2023, BAT was selected for inclusion in the DJSI Europe Index, based on S&P Global Corporate Sustainability Assessment results, and has been included in the DJSI indices for 22 consecutive years. spglobal.com Financial Times Climate Leader In 2023, BAT was named as a Climate Leader by the Financial Times for the third successive year, for reduction in greenhouse gas emissions (GHG) intensity, and placed in the top 3% of more than 4,000 European companies evaluated. Global Top Employer In 2023, BAT was named as a Global Top Employer for the sixth consecutive year, recognising our commitment to best-in- class working environments and career opportunities. Race at Work Charter We are signatories to the UK Race at Work Charter for supporting racial equality in the workplace. Bloomberg GEI BAT was included in the 2023 Bloomberg Gender-Equality Index, which measures gender equality performance globally, in the first year of participation. Workforce Disclosure Initiative (WDI) Our 2023 WDI submission was scored in the top 20% of participating companies. Gartner Supply Chain Top 15 In 2023, our global supply chain was recognised in the Gartner Supply Chain Top 15 Europe rankings. BAT Annual Report and Form 20-F 2023 Strategic Report Governance Report Financial Statements Other Information Ratings and recognitions in 2023^ 69 Notes: 1. The use by BAT of any MSCI ESG research LLC or its affiliates (MSCI) data, and the use of MSCI logos, trademarks, service marks or index names herein, do not constitute a sponsorship, endorsement, recommendation, or promotion of BAT by MSCI. MSCI services and data are the property of MSCI or its information providers, and are provided ‘as-is’ and without warranty. MSCI names and logos are trademarks or service marks of MSCI. 2. Copyright © 2023 Morningstar Sustainalytics. All rights reserved. This section contains information developed by Sustainalytics (www.sustainalytics.com). Such information and data are proprietary of Sustainalytics and/or its third party suppliers (Third Party Data) and are provided for informational purposes only. They do not constitute an endorsement of any product or project, nor an investment advice and are not warranted to be complete, timely, accurate or suitable for a particular purpose. Their use is subject to conditions available at https:// www.sustainalytics.com/legal-disclaimers. 3. Sustainalytics state, with regard to their use of this risk rating, "Note that because ESG risks materialize at an unknown time in the future and depend on a variety of unpredictable conditions, no predictions on financial or share price impacts, or on the time horizon of such impacts, are intended or implied by these risk categories.". 4. Note 12(b)(i) on page 239 addresses the consideration of climate change matters in preparation of the financial statements in this report. ^ A rating or award is not a recommendation to buy, sell or hold securities. A rating or award may be subject to withdrawal or revision at any time. Each rating and award should be evaluated separately of any other rating. The methodologies of any rating or award presented here may not be the same as those of other ratings, awards or methodologies that may be used by our stakeholders and may emphasise different aspects of ESG practices and performance, and, thus, may not be representative of our ESG performance in all respects.
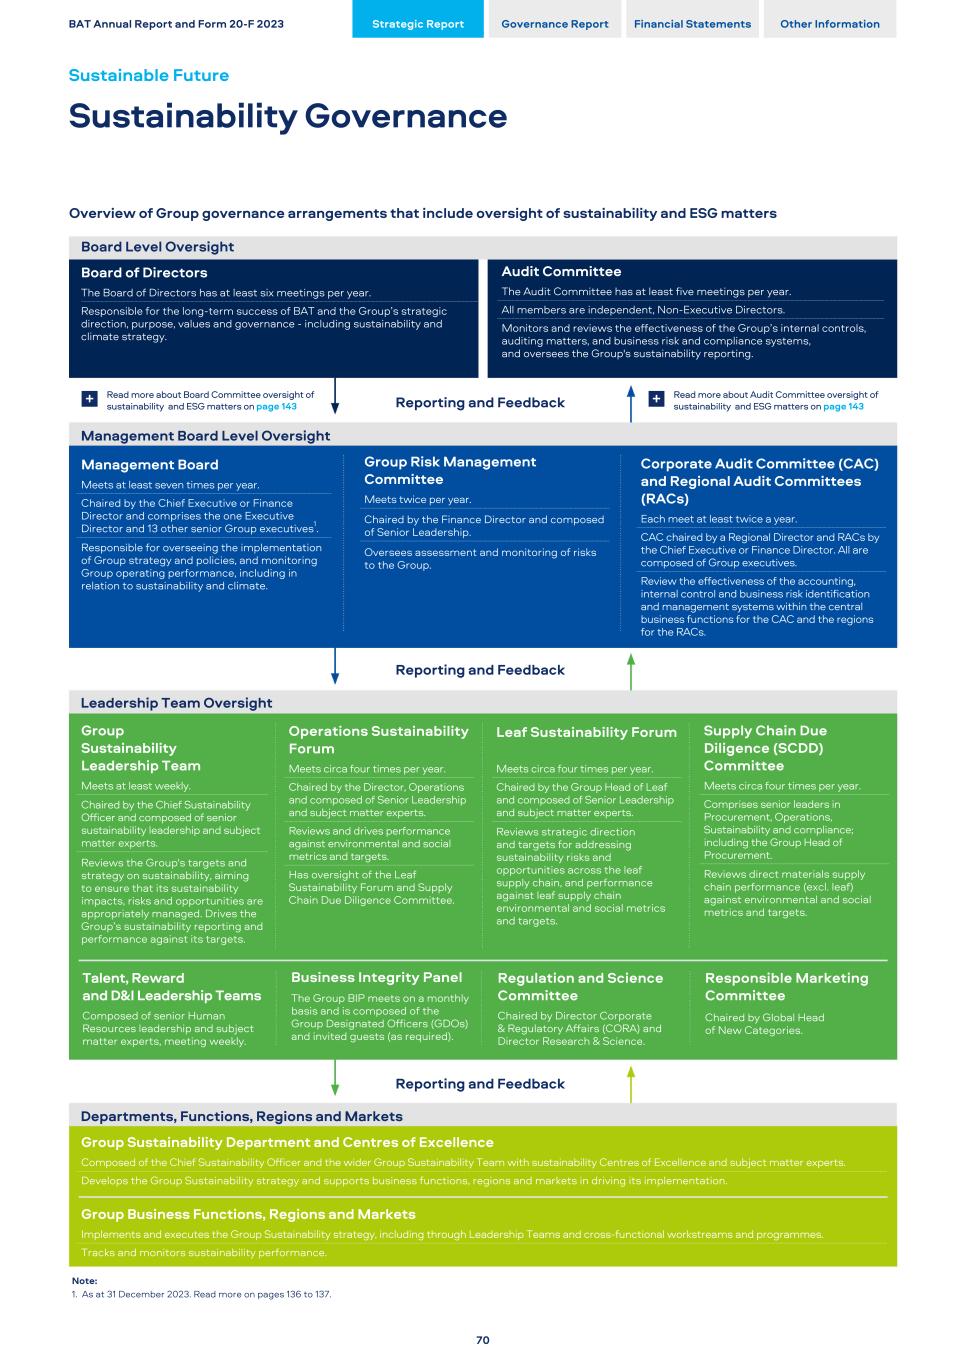
Overview of Group governance arrangements that include oversight of sustainability and ESG matters BAT Annual Report and Form 20-F 2023 Strategic Report Governance Report Financial Statements Other Information Sustainable Future Sustainability Governance 70 Board Level Oversight Board of Directors The Board of Directors has at least six meetings per year. Responsible for the long-term success of BAT and the Group’s strategic direction, purpose, values and governance - including sustainability and climate strategy. Audit Committee The Audit Committee has at least five meetings per year. All members are independent, Non-Executive Directors. Monitors and reviews the effectiveness of the Group’s internal controls, auditing matters, and business risk and compliance systems, and oversees the Group's sustainability reporting. Reporting and Feedback Management Board Level Oversight Reporting and Feedback Reporting and Feedback Management Board Meets at least seven times per year. Chaired by the Chief Executive or Finance Director and comprises the one Executive Director and 13 other senior Group executives1. Responsible for overseeing the implementation of Group strategy and policies, and monitoring Group operating performance, including in relation to sustainability and climate. Group Risk Management Committee Meets twice per year. Chaired by the Finance Director and composed of Senior Leadership. Oversees assessment and monitoring of risks to the Group. Corporate Audit Committee (CAC) and Regional Audit Committees (RACs) Each meet at least twice a year. CAC chaired by a Regional Director and RACs by the Chief Executive or Finance Director. All are composed of Group executives. Review the effectiveness of the accounting, internal control and business risk identification and management systems within the central business functions for the CAC and the regions for the RACs. Leadership Team Oversight Group Sustainability Leadership Team Meets at least weekly. Chaired by the Chief Sustainability Officer and composed of senior sustainability leadership and subject matter experts. Reviews the Group's targets and strategy on sustainability, aiming to ensure that its sustainability impacts, risks and opportunities are appropriately managed. Drives the Group’s sustainability reporting and performance against its targets. Operations Sustainability Forum Meets circa four times per year. Chaired by the Director, Operations and composed of Senior Leadership and subject matter experts. Reviews and drives performance against environmental and social metrics and targets. Has oversight of the Leaf Sustainability Forum and Supply Chain Due Diligence Committee. Leaf Sustainability Forum Meets circa four times per year. Chaired by the Group Head of Leaf and composed of Senior Leadership and subject matter experts. Reviews strategic direction and targets for addressing sustainability risks and opportunities across the leaf supply chain, and performance against leaf supply chain environmental and social metrics and targets. Supply Chain Due Diligence (SCDD) Committee Meets circa four times per year. Comprises senior leaders in Procurement, Operations, Sustainability and compliance; including the Group Head of Procurement. Reviews direct materials supply chain performance (excl. leaf) against environmental and social metrics and targets. Talent, Reward and D&I Leadership Teams Composed of senior Human Resources leadership and subject matter experts, meeting weekly. Business Integrity Panel The Group BIP meets on a monthly basis and is composed of the Group Designated Officers (GDOs) and invited guests (as required). Regulation and Science Committee Chaired by Director Corporate & Regulatory Affairs (CORA) and Director Research & Science. Responsible Marketing Committee Chaired by Global Head of New Categories. Departments, Functions, Regions and Markets Group Sustainability Department and Centres of Excellence Composed of the Chief Sustainability Officer and the wider Group Sustainability Team with sustainability Centres of Excellence and subject matter experts. Develops the Group Sustainability strategy and supports business functions, regions and markets in driving its implementation. Group Business Functions, Regions and Markets Implements and executes the Group Sustainability strategy, including through Leadership Teams and cross-functional workstreams and programmes. Tracks and monitors sustainability performance. Note: 1. As at 31 December 2023. Read more on pages 136 to 137. Read more about Board Committee oversight of sustainability and ESG matters on page 143+ Read more about Audit Committee oversight of sustainability and ESG matters on page 143+
Our Approach Regulations and expectations continue to evolve. Having appropriate governance is key to delivering on our sustainability commitments. In particular, effective oversight and management of sustainability-related risks and opportunities are essential to BAT’s ability to deliver A Better Tomorrow™ and achieve long-term sustainable growth. Frameworks GRI 2-9 to 2-21 TCFD Governance TNFD Governance Recommendations A and B Board Oversight The Board is collectively responsible for the long-term success of the Company and the Group’s strategic direction, purpose, values and governance. This includes responsibility for the Group's strategy and ensuring that resources are allocated appropriately to meet the objectives and to manage risks, including internal controls. Our Board has strategic oversight of our sustainability matters and takes climate- related considerations into account where applicable when making strategic decisions, including in relation to budgeting, risk management and overseeing capital expenditure. During 2023, the Board reviewed and approved a revised version of the Group Environment Policy, and new Responsible Marketing Principles which will be implemented in 2024. Read more about our Climate and Circular Economy risk in the Group Principal Risks on page 121 and in the Group Risk Factors on page 354 + The Audit Committee receives reports from the Group’s Regional Audit Committees and Corporate Audit Committee, which monitor the effectiveness of business risk management and internal controls across regions and central functions. The Audit Committee also has oversight of the external assurance of ESG-related information. Management's Role Our Management Board, chaired by our Chief Executive, is responsible for overseeing the implementation of the Group’s strategy and policies set by the Board, including those relating to sustainability and ESG, and for creating the framework for the day-to-day operation of the Group’s subsidiaries. Members of the Management Board are responsible for delivery against targets under their individual remit with respect to sustainability and ESG targets, including those relating to harm reduction. They are supported by their respective teams who, in turn, work with other functions and markets to make progress towards the Group’s targets. Management of sustainability and ESG priorities is embedded across relevant business areas at the Group, regional and local market levels. This approach provides channels for appropriate flow of information, monitoring and oversight of sustainability issues across the Group. Embedding Sustainability Expertise at the Executive Level Our Board members have international experience that includes a wide range of leadership expertise in industries such as fast-moving consumer goods, infrastructure, food, beverage and tobacco, among others. To varying degrees, their experience includes the oversight of companies impacted by a range of environmental and social issues. Non-Executive Directors, as well as the Audit Committee, and the Remuneration Committee, receive regular briefings on legal and regulatory developments, including those in the ESG landscape. For example, in 2023, the Audit Committee received an update on key regulatory developments in relation to ESG reporting regimes, including the Sustainable Finance Disclosure Regulation (SFDR), the Corporate Sustainability Reporting Directive (CSRD), the Task Force on Climate-Related Financial Disclosures (TCFD) and the UK and EU Taxonomy Regulations. Integrating Sustainability Considerations Into Remuneration Where relevant, employees from the Management Board (including the Director, Operations) to local management have individual performance objectives that form part of their responsibilities and are linked to their remuneration, including delivery against ESG and climate-related priorities and metrics. Delivery against individual performance objectives is a key consideration in determining employee performance ratings, which in turn have a direct impact on compensation as they are used to determine salary adjustments. In addition, the Group retains the discretion to make downward adjustments to individual bonus payments in the event of persistent underperformance against performance objectives. The ESG objectives within the remuneration of Tadeu Marroco, Chief Executive, and Javed Iqbal, Interim Finance Director, are focused on Tobacco Harm Reduction. We intend to keep further integration of ESG metrics in Management Board remuneration under active review.	 Read more about our approach to Remuneration for directors and employees on pages 170 to 181+ Board Composition and Diversity Overview Our Board Diversity & Inclusion Policy sets the Board's commitment to considering all aspects of diversity when reviewing the composition of, and succession planning for, the Board, its Committees and the Management Board. The Nominations Committee is responsible for reviewing the composition of the Board, its Committees and Management Board to ensure they have an appropriate balance of skills, expertise and knowledge, and that all appointments are made on merit against objective criteria and with due regard for the benefits of diversity. The Nominations Committee also has an oversight of the development of a pipeline of diverse, high-performing potential Executive Directors, Management Board members and other senior managers. Sustainability Due Diligence We have a range of due diligence processes in place which aim to address the actual and potential impacts and risks associated with our own operations and in our upstream and downstream supply chain. Our approach to human rights is aligned with UNGP and OECD Guidelines, includes engagement with rights holders, and results in actions plans and remediation, as appropriate. Read more about our sustainability due diligence on pages 92 and 100+ Governing our Material Impacts To manage our material sustainability impacts we have set up topic-specific Centres of Excellence at the middle management level. These include Climate Change, Circular Economy, Nature and Social Centres of Excellence. In addition, individual business functions, such as Legal, Corporate & Regulatory Affairs and HR, manage material issues relevant to their areas. The management of material sustainability topics is also discussed in various Committees and Forums, such as: – Group Sustainability Leadership Team, – Environmental Sustainability Committee, – Operations Sustainability Committee, – Leaf Sustainability Forum, – Supply Chain Due Diligence Committee, – IMP Steering Committee, – Regulation and Science Committee, – Business Integrity Panel, and – Talent Reward and D&I Leadership Teams. Issues considered in these Forums are raised, where appropriate, at Management Board level or with the Audit Committee. BAT Annual Report and Form 20-F 2023 Strategic Report Governance Report Financial Statements Other Information 71
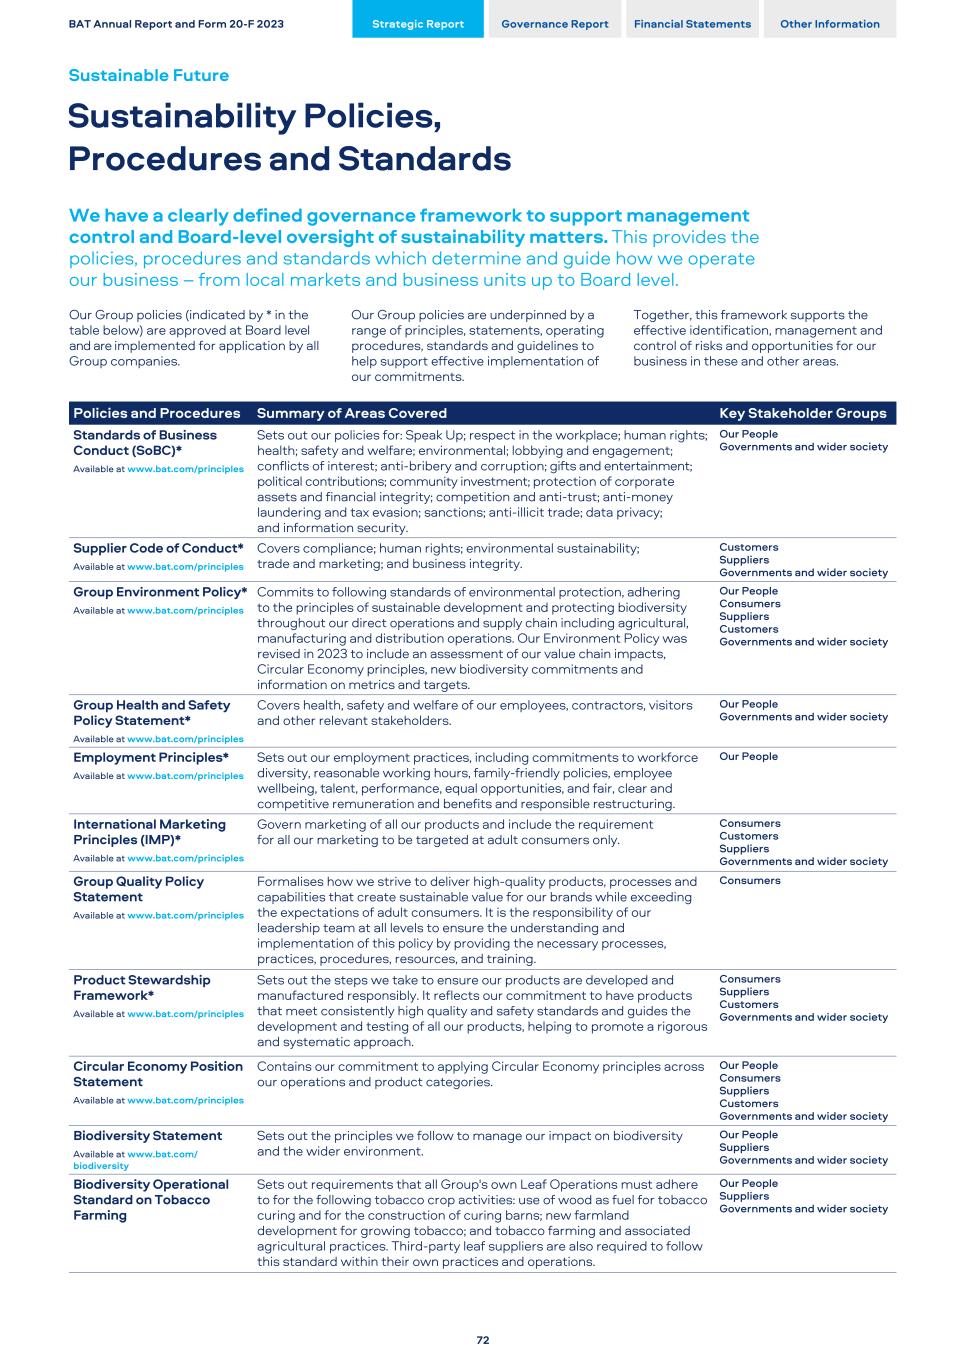
We have a clearly defined governance framework to support management control and Board-level oversight of sustainability matters. This provides the policies, procedures and standards which determine and guide how we operate our business – from local markets and business units up to Board level. Our Group policies (indicated by * in the table below) are approved at Board level and are implemented for application by all Group companies. Our Group policies are underpinned by a range of principles, statements, operating procedures, standards and guidelines to help support effective implementation of our commitments. Together, this framework supports the effective identification, management and control of risks and opportunities for our business in these and other areas. Policies and Procedures Summary of Areas Covered Key Stakeholder Groups Standards of Business Conduct (SoBC)* Available at www.bat.com/principles Sets out our policies for: Speak Up; respect in the workplace; human rights; health; safety and welfare; environmental; lobbying and engagement; conflicts of interest; anti-bribery and corruption; gifts and entertainment; political contributions; community investment; protection of corporate assets and financial integrity; competition and anti-trust; anti-money laundering and tax evasion; sanctions; anti-illicit trade; data privacy; and information security. Our People Governments and wider society Supplier Code of Conduct* Available at www.bat.com/principles Covers compliance; human rights; environmental sustainability; trade and marketing; and business integrity. Customers Suppliers Governments and wider society Group Environment Policy* Available at www.bat.com/principles Commits to following standards of environmental protection, adhering to the principles of sustainable development and protecting biodiversity throughout our direct operations and supply chain including agricultural, manufacturing and distribution operations. Our Environment Policy was revised in 2023 to include an assessment of our value chain impacts, Circular Economy principles, new biodiversity commitments and information on metrics and targets. Our People Consumers Suppliers Customers Governments and wider society Group Health and Safety Policy Statement* Available at www.bat.com/principles Covers health, safety and welfare of our employees, contractors, visitors and other relevant stakeholders. Our People Governments and wider society Employment Principles* Available at www.bat.com/principles Sets out our employment practices, including commitments to workforce diversity, reasonable working hours, family-friendly policies, employee wellbeing, talent, performance, equal opportunities, and fair, clear and competitive remuneration and benefits and responsible restructuring. Our People International Marketing Principles (IMP)* Available at www.bat.com/principles Govern marketing of all our products and include the requirement for all our marketing to be targeted at adult consumers only. Consumers Customers Suppliers Governments and wider society Group Quality Policy Statement Available at www.bat.com/principles Formalises how we strive to deliver high-quality products, processes and capabilities that create sustainable value for our brands while exceeding the expectations of adult consumers. It is the responsibility of our leadership team at all levels to ensure the understanding and implementation of this policy by providing the necessary processes, practices, procedures, resources, and training. Consumers Product Stewardship Framework* Available at www.bat.com/principles Sets out the steps we take to ensure our products are developed and manufactured responsibly. It reflects our commitment to have products that meet consistently high quality and safety standards and guides the development and testing of all our products, helping to promote a rigorous and systematic approach. Consumers Suppliers Customers Governments and wider society Circular Economy Position Statement Available at www.bat.com/principles Contains our commitment to applying Circular Economy principles across our operations and product categories. Our People Consumers Suppliers Customers Governments and wider society Biodiversity Statement Available at www.bat.com/ biodiversity Sets out the principles we follow to manage our impact on biodiversity and the wider environment. Our People Suppliers Governments and wider society Biodiversity Operational Standard on Tobacco Farming Sets out requirements that all Group's own Leaf Operations must adhere to for the following tobacco crop activities: use of wood as fuel for tobacco curing and for the construction of curing barns; new farmland development for growing tobacco; and tobacco farming and associated agricultural practices. Third-party leaf suppliers are also required to follow this standard within their own practices and operations. Our People Suppliers Governments and wider society BAT Annual Report and Form 20-F 2023 Strategic Report Governance Report Financial Statements Other Information Sustainable Future Sustainability Policies, Procedures and Standards 72
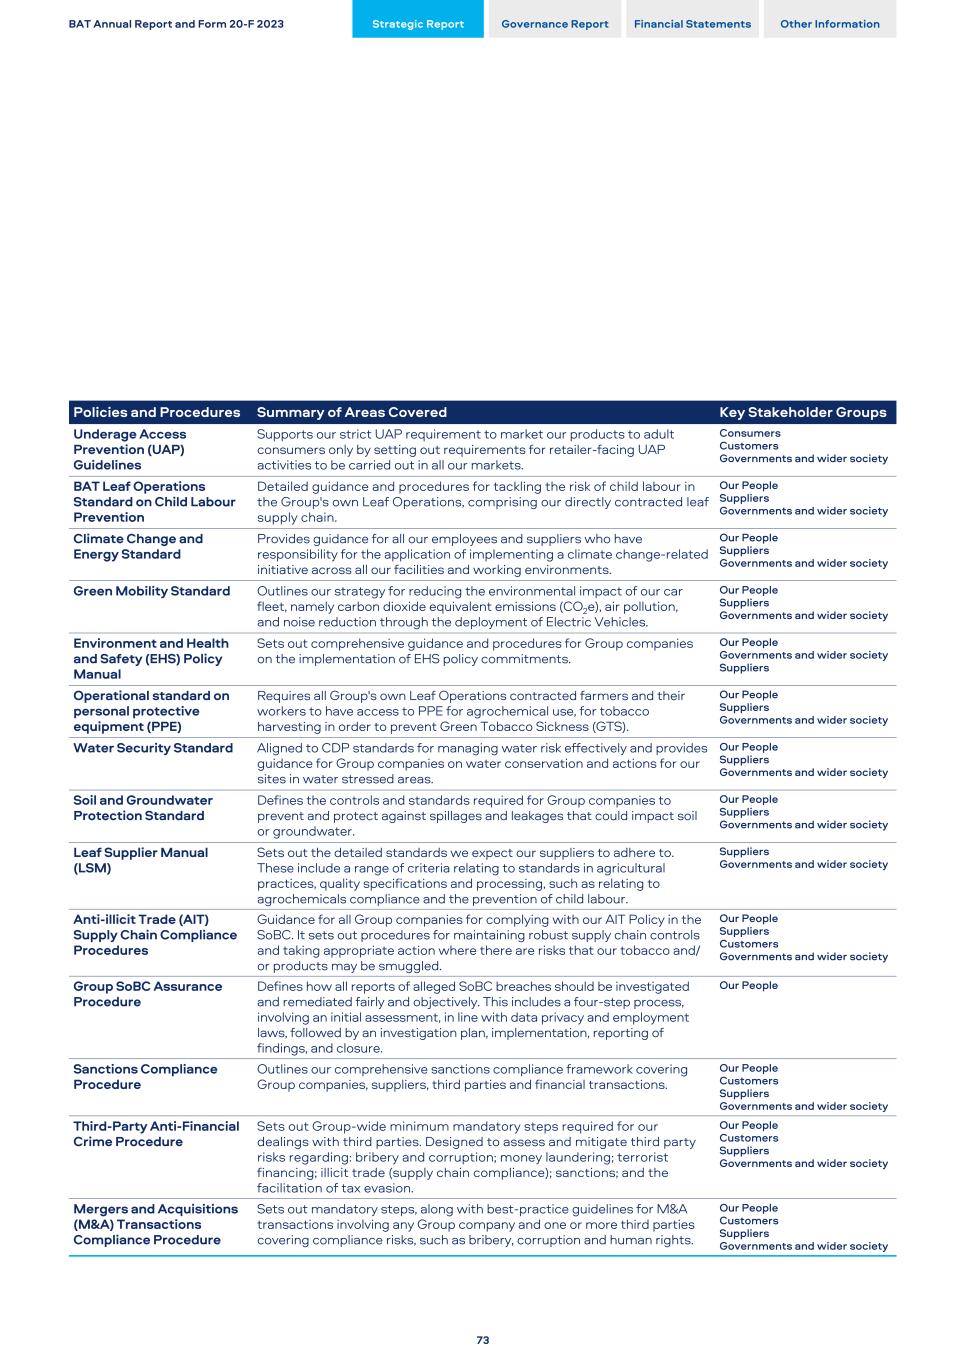
Policies and Procedures Summary of Areas Covered Key Stakeholder Groups Underage Access Prevention (UAP) Guidelines Supports our strict UAP requirement to market our products to adult consumers only by setting out requirements for retailer-facing UAP activities to be carried out in all our markets. Consumers Customers Governments and wider society BAT Leaf Operations Standard on Child Labour Prevention Detailed guidance and procedures for tackling the risk of child labour in the Group's own Leaf Operations, comprising our directly contracted leaf supply chain. Our People Suppliers Governments and wider society Climate Change and Energy Standard Provides guidance for all our employees and suppliers who have responsibility for the application of implementing a climate change-related initiative across all our facilities and working environments. Our People Suppliers Governments and wider society Green Mobility Standard Outlines our strategy for reducing the environmental impact of our car fleet, namely carbon dioxide equivalent emissions (CO2e), air pollution, and noise reduction through the deployment of Electric Vehicles. Our People Suppliers Governments and wider society Environment and Health and Safety (EHS) Policy Manual Sets out comprehensive guidance and procedures for Group companies on the implementation of EHS policy commitments. Our People Governments and wider society Suppliers Operational standard on personal protective equipment (PPE) Requires all Group's own Leaf Operations contracted farmers and their workers to have access to PPE for agrochemical use, for tobacco harvesting in order to prevent Green Tobacco Sickness (GTS). Our People Suppliers Governments and wider society Water Security Standard Aligned to CDP standards for managing water risk effectively and provides guidance for Group companies on water conservation and actions for our sites in water stressed areas. Our People Suppliers Governments and wider society Soil and Groundwater Protection Standard Defines the controls and standards required for Group companies to prevent and protect against spillages and leakages that could impact soil or groundwater. Our People Suppliers Governments and wider society Leaf Supplier Manual (LSM) Sets out the detailed standards we expect our suppliers to adhere to. These include a range of criteria relating to standards in agricultural practices, quality specifications and processing, such as relating to agrochemicals compliance and the prevention of child labour. Suppliers Governments and wider society Anti-illicit Trade (AIT) Supply Chain Compliance Procedures Guidance for all Group companies for complying with our AIT Policy in the SoBC. It sets out procedures for maintaining robust supply chain controls and taking appropriate action where there are risks that our tobacco and/ or products may be smuggled. Our People Suppliers Customers Governments and wider society Group SoBC Assurance Procedure Defines how all reports of alleged SoBC breaches should be investigated and remediated fairly and objectively. This includes a four-step process, involving an initial assessment, in line with data privacy and employment laws, followed by an investigation plan, implementation, reporting of findings, and closure. Our People Sanctions Compliance Procedure Outlines our comprehensive sanctions compliance framework covering Group companies, suppliers, third parties and financial transactions. Our People Customers Suppliers Governments and wider society Third-Party Anti-Financial Crime Procedure Sets out Group-wide minimum mandatory steps required for our dealings with third parties. Designed to assess and mitigate third party risks regarding: bribery and corruption; money laundering; terrorist financing; illicit trade (supply chain compliance); sanctions; and the facilitation of tax evasion. Our People Customers Suppliers Governments and wider society Mergers and Acquisitions (M&A) Transactions Compliance Procedure Sets out mandatory steps, along with best-practice guidelines for M&A transactions involving any Group company and one or more third parties covering compliance risks, such as bribery, corruption and human rights. Our People Customers Suppliers Governments and wider society BAT Annual Report and Form 20-F 2023 Strategic Report Governance Report Financial Statements Other Information 73
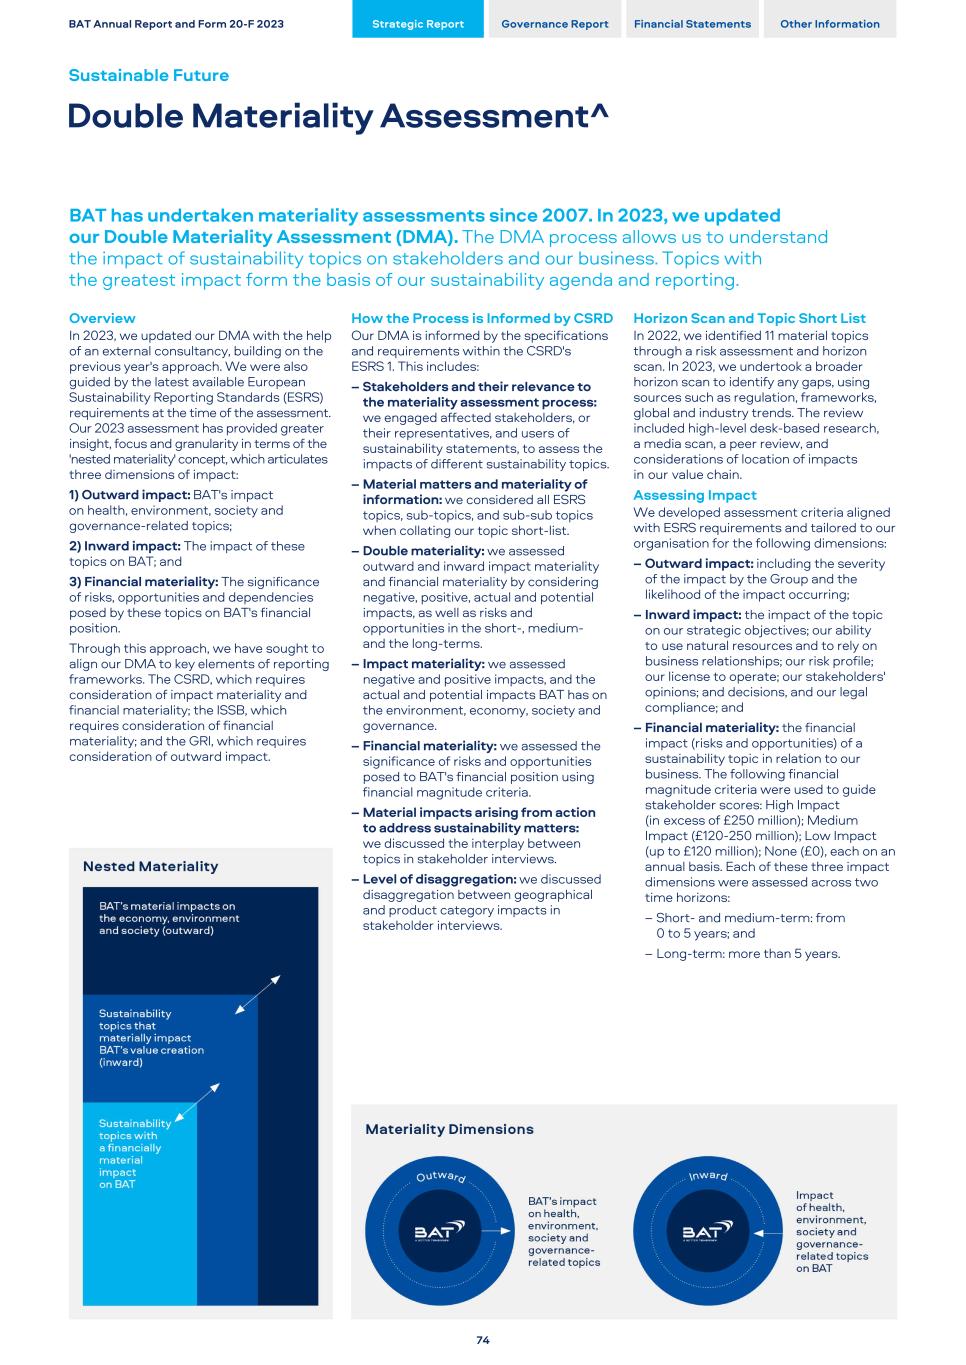
BAT has undertaken materiality assessments since 2007. In 2023, we updated our Double Materiality Assessment (DMA). The DMA process allows us to understand the impact of sustainability topics on stakeholders and our business. Topics with the greatest impact form the basis of our sustainability agenda and reporting. Overview In 2023, we updated our DMA with the help of an external consultancy, building on the previous year's approach. We were also guided by the latest available European Sustainability Reporting Standards (ESRS) requirements at the time of the assessment. Our 2023 assessment has provided greater insight, focus and granularity in terms of the 'nested materiality' concept, which articulates three dimensions of impact: 1) Outward impact: BAT's impact on health, environment, society and governance-related topics; 2) Inward impact: The impact of these topics on BAT; and 3) Financial materiality: The significance of risks, opportunities and dependencies posed by these topics on BAT's financial position. Through this approach, we have sought to align our DMA to key elements of reporting frameworks. The CSRD, which requires consideration of impact materiality and financial materiality; the ISSB, which requires consideration of financial materiality; and the GRI, which requires consideration of outward impact. How the Process is Informed by CSRD Our DMA is informed by the specifications and requirements within the CSRD's ESRS 1. This includes: – Stakeholders and their relevance to the materiality assessment process: we engaged affected stakeholders, or their representatives, and users of sustainability statements, to assess the impacts of different sustainability topics. – Material matters and materiality of information: we considered all ESRS topics, sub-topics, and sub-sub topics when collating our topic short-list. – Double materiality: we assessed outward and inward impact materiality and financial materiality by considering negative, positive, actual and potential impacts, as well as risks and opportunities in the short-, medium- and the long-terms. – Impact materiality: we assessed negative and positive impacts, and the actual and potential impacts BAT has on the environment, economy, society and governance. – Financial materiality: we assessed the significance of risks and opportunities posed to BAT's financial position using financial magnitude criteria. – Material impacts arising from action to address sustainability matters: we discussed the interplay between topics in stakeholder interviews. – Level of disaggregation: we discussed disaggregation between geographical and product category impacts in stakeholder interviews. Horizon Scan and Topic Short List In 2022, we identified 11 material topics through a risk assessment and horizon scan. In 2023, we undertook a broader horizon scan to identify any gaps, using sources such as regulation, frameworks, global and industry trends. The review included high-level desk-based research, a media scan, a peer review, and considerations of location of impacts in our value chain. Assessing Impact We developed assessment criteria aligned with ESRS requirements and tailored to our organisation for the following dimensions: – Outward impact: including the severity of the impact by the Group and the likelihood of the impact occurring; – Inward impact: the impact of the topic on our strategic objectives; our ability to use natural resources and to rely on business relationships; our risk profile; our license to operate; our stakeholders' opinions; and decisions, and our legal compliance; and – Financial materiality: the financial impact (risks and opportunities) of a sustainability topic in relation to our business. The following financial magnitude criteria were used to guide stakeholder scores: High Impact (in excess of £250 million); Medium Impact (£120-250 million); Low Impact (up to £120 million); None (£0), each on an annual basis. Each of these three impact dimensions were assessed across two time horizons: – Short- and medium-term: from 0 to 5 years; and – Long-term: more than 5 years. BAT Annual Report and Form 20-F 2023 Strategic Report Governance Report Financial Statements Other Information Sustainable Future Double Materiality Assessment^ 74
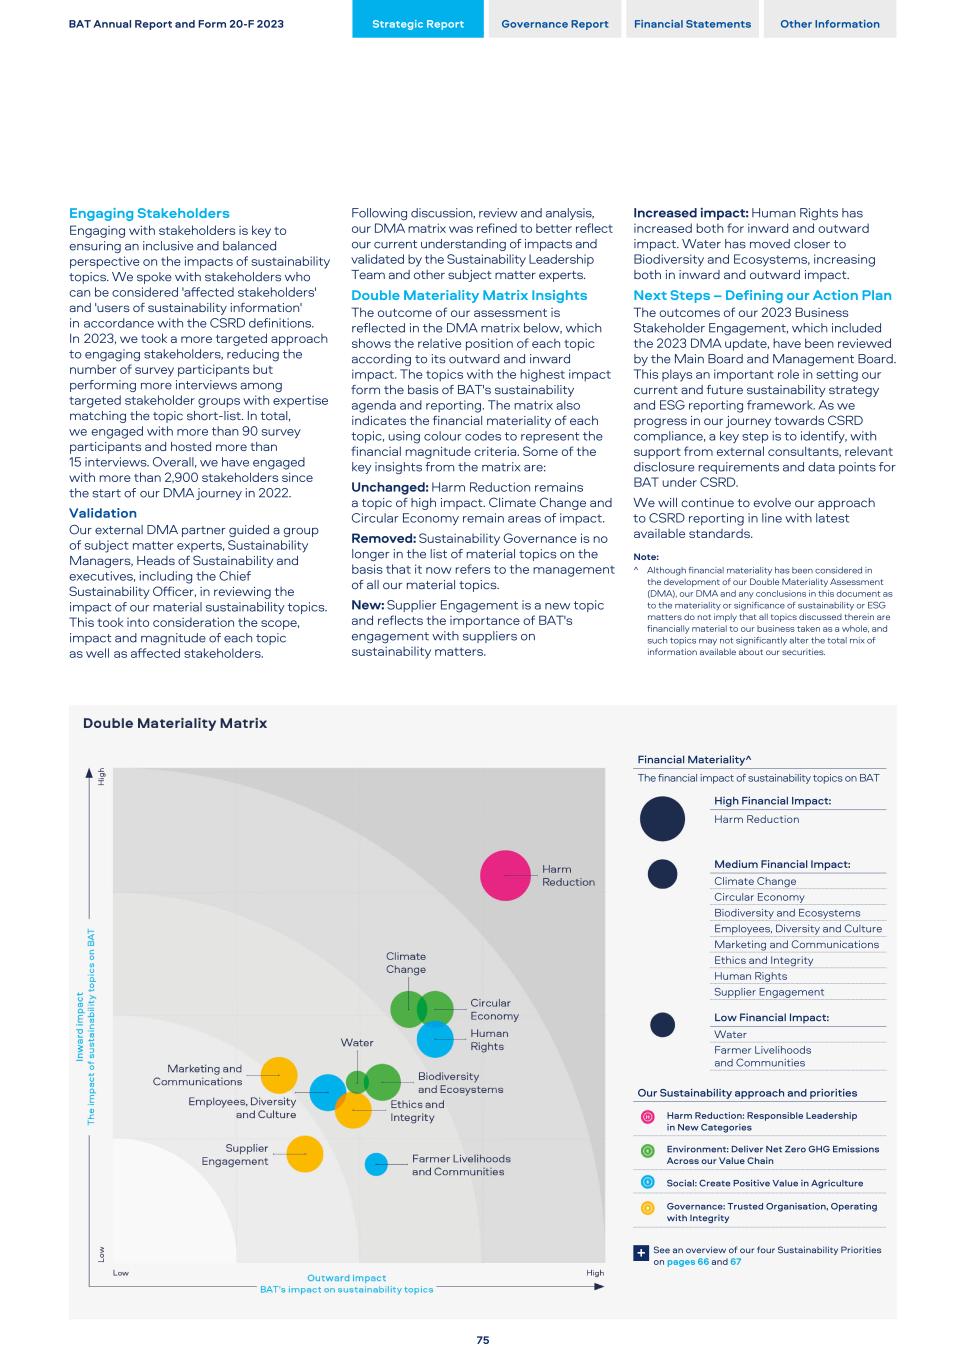
Engaging Stakeholders Engaging with stakeholders is key to ensuring an inclusive and balanced perspective on the impacts of sustainability topics. We spoke with stakeholders who can be considered 'affected stakeholders' and 'users of sustainability information' in accordance with the CSRD definitions. In 2023, we took a more targeted approach to engaging stakeholders, reducing the number of survey participants but performing more interviews among targeted stakeholder groups with expertise matching the topic short-list. In total, we engaged with more than 90 survey participants and hosted more than 15 interviews. Overall, we have engaged with more than 2,900 stakeholders since the start of our DMA journey in 2022.  Validation Our external DMA partner guided a group of subject matter experts, Sustainability Managers, Heads of Sustainability and executives, including the Chief Sustainability Officer, in reviewing the impact of our material sustainability topics. This took into consideration the scope, impact and magnitude of each topic as well as affected stakeholders. Following discussion, review and analysis, our DMA matrix was refined to better reflect our current understanding of impacts and validated by the Sustainability Leadership Team and other subject matter experts. Double Materiality Matrix Insights The outcome of our assessment is reflected in the DMA matrix below, which shows the relative position of each topic according to its outward and inward impact. The topics with the highest impact form the basis of BAT's sustainability agenda and reporting. The matrix also indicates the financial materiality of each topic, using colour codes to represent the financial magnitude criteria. Some of the key insights from the matrix are: Unchanged: Harm Reduction remains a topic of high impact. Climate Change and Circular Economy remain areas of impact. Removed: Sustainability Governance is no longer in the list of material topics on the basis that it now refers to the management of all our material topics. New: Supplier Engagement is a new topic and reflects the importance of BAT's engagement with suppliers on sustainability matters. Increased impact: Human Rights has increased both for inward and outward impact. Water has moved closer to Biodiversity and Ecosystems, increasing both in inward and outward impact. Next Steps – Defining our Action Plan The outcomes of our 2023 Business Stakeholder Engagement, which included the 2023 DMA update, have been reviewed by the Main Board and Management Board. This plays an important role in setting our current and future sustainability strategy and ESG reporting framework. As we progress in our journey towards CSRD compliance, a key step is to identify, with support from external consultants, relevant disclosure requirements and data points for BAT under CSRD. We will continue to evolve our approach to CSRD reporting in line with latest available standards. Note: ^ Although financial materiality has been considered in the development of our Double Materiality Assessment (DMA), our DMA and any conclusions in this document as to the materiality or significance of sustainability or ESG matters do not imply that all topics discussed therein are financially material to our business taken as a whole, and such topics may not significantly alter the total mix of information available about our securities. Financial Materiality^ The financial impact of sustainability topics on BAT High Financial Impact: Harm Reduction Medium Financial Impact: Climate Change Circular Economy Biodiversity and Ecosystems Employees, Diversity and Culture Marketing and Communications Ethics and Integrity Human Rights Supplier Engagement Low Financial Impact: Water Farmer Livelihoods and Communities Our Sustainability approach and priorities Harm Reduction: Responsible Leadership in New Categories Environment: Deliver Net Zero GHG Emissions Across our Value Chain Social: Create Positive Value in Agriculture Governance: Trusted Organisation, Operating with Integrity See an overview of our four Sustainability Priorities on pages 66 and 67+ BAT Annual Report and Form 20-F 2023 Strategic Report Governance Report Financial Statements Other Information 75
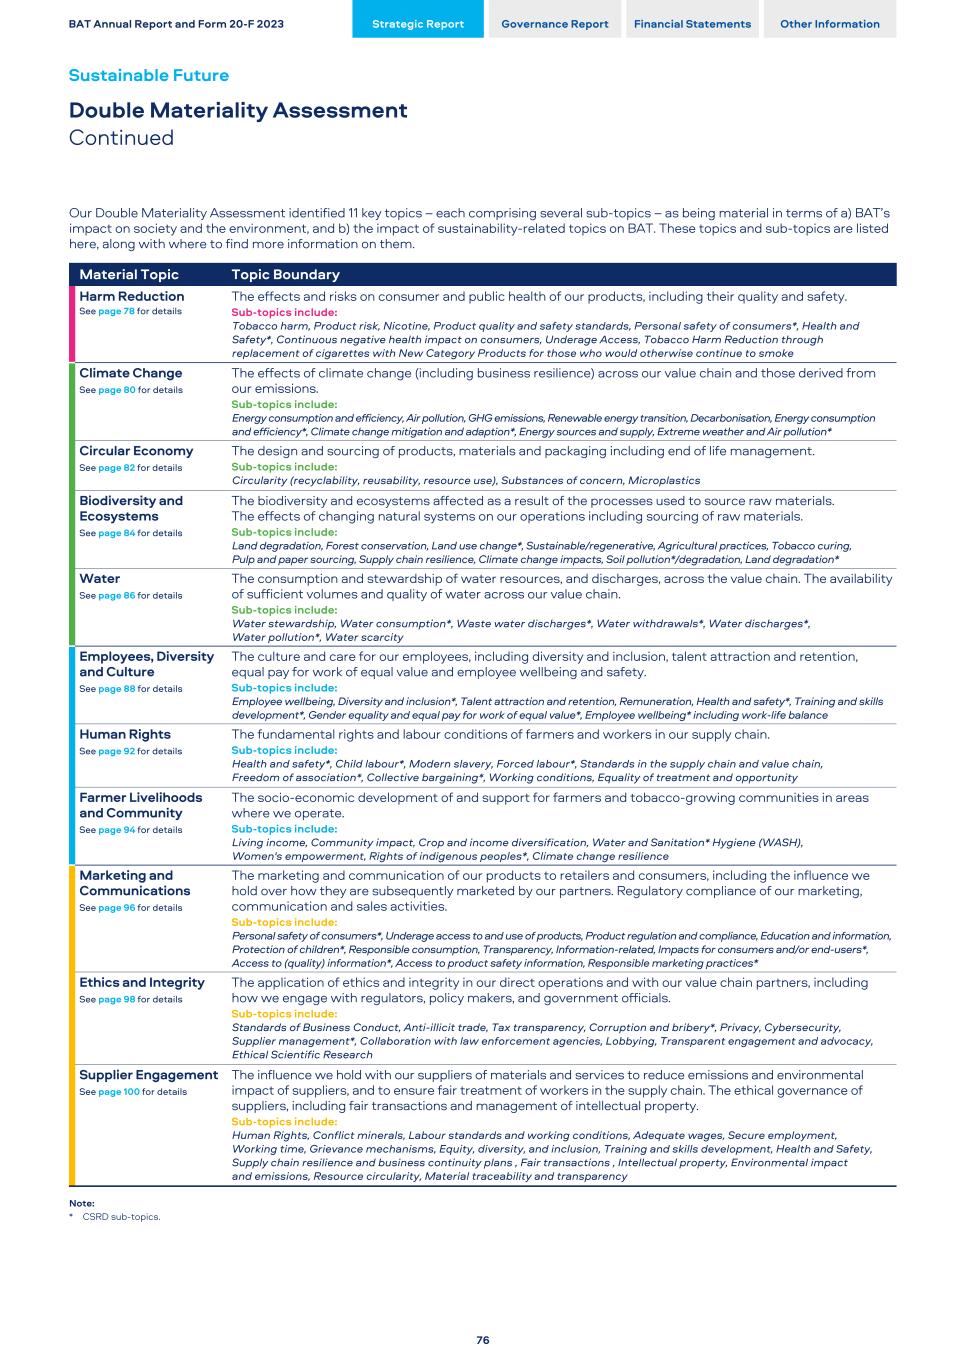
Our Double Materiality Assessment identified 11 key topics – each comprising several sub-topics – as being material in terms of a) BAT’s impact on society and the environment, and b) the impact of sustainability-related topics on BAT. These topics and sub-topics are listed here, along with where to find more information on them. Material Topic Topic Boundary Harm Reduction See page 78 for details The effects and risks on consumer and public health of our products, including their quality and safety. Sub-topics include: Tobacco harm, Product risk, Nicotine, Product quality and safety standards, Personal safety of consumers*, Health and Safety*, Continuous negative health impact on consumers, Underage Access, Tobacco Harm Reduction through replacement of cigarettes with New Category Products for those who would otherwise continue to smoke Climate Change See page 80 for details The effects of climate change (including business resilience) across our value chain and those derived from our emissions. Sub-topics include: Energy consumption and efficiency, Air pollution, GHG emissions, Renewable energy transition, Decarbonisation, Energy consumption and efficiency*, Climate change mitigation and adaption*, Energy sources and supply, Extreme weather and Air pollution* Circular Economy See page 82 for details The design and sourcing of products, materials and packaging including end of life management. Sub-topics include: Circularity (recyclability, reusability, resource use), Substances of concern, Microplastics Biodiversity and Ecosystems See page 84 for details The biodiversity and ecosystems affected as a result of the processes used to source raw materials. The effects of changing natural systems on our operations including sourcing of raw materials. Sub-topics include: Land degradation, Forest conservation, Land use change*, Sustainable/regenerative, Agricultural practices, Tobacco curing, Pulp and paper sourcing, Supply chain resilience, Climate change impacts, Soil pollution*/degradation, Land degradation* Water See page 86 for details The consumption and stewardship of water resources, and discharges, across the value chain. The availability of sufficient volumes and quality of water across our value chain. Sub-topics include: Water stewardship, Water consumption*, Waste water discharges*, Water withdrawals*, Water discharges*, Water pollution*, Water scarcity Employees, Diversity and Culture See page 88 for details The culture and care for our employees, including diversity and inclusion, talent attraction and retention, equal pay for work of equal value and employee wellbeing and safety. Sub-topics include: Employee wellbeing, Diversity and inclusion*, Talent attraction and retention, Remuneration, Health and safety*, Training and skills development*, Gender equality and equal pay for work of equal value*, Employee wellbeing* including work-life balance Human Rights See page 92 for details The fundamental rights and labour conditions of farmers and workers in our supply chain. Sub-topics include: Health and safety*, Child labour*, Modern slavery, Forced labour*, Standards in the supply chain and value chain, Freedom of association*, Collective bargaining*, Working conditions, Equality of treatment and opportunity Farmer Livelihoods and Community See page 94 for details The socio-economic development of and support for farmers and tobacco-growing communities in areas where we operate. Sub-topics include: Living income, Community impact, Crop and income diversification, Water and Sanitation* Hygiene (WASH), Women's empowerment, Rights of indigenous peoples*, Climate change resilience Marketing and Communications See page 96 for details The marketing and communication of our products to retailers and consumers, including the influence we hold over how they are subsequently marketed by our partners. Regulatory compliance of our marketing, communication and sales activities. Sub-topics include: Personal safety of consumers*, Underage access to and use of products, Product regulation and compliance, Education and information, Protection of children*, Responsible consumption, Transparency, Information-related, Impacts for consumers and/or end-users*, Access to (quality) information*, Access to product safety information, Responsible marketing practices* Ethics and Integrity See page 98 for details The application of ethics and integrity in our direct operations and with our value chain partners, including how we engage with regulators, policy makers, and government officials. Sub-topics include: Standards of Business Conduct, Anti-illicit trade, Tax transparency, Corruption and bribery*, Privacy, Cybersecurity, Supplier management*, Collaboration with law enforcement agencies, Lobbying, Transparent engagement and advocacy, Ethical Scientific Research Supplier Engagement See page 100 for details The influence we hold with our suppliers of materials and services to reduce emissions and environmental impact of suppliers, and to ensure fair treatment of workers in the supply chain. The ethical governance of suppliers, including fair transactions and management of intellectual property. Sub-topics include: Human Rights, Conflict minerals, Labour standards and working conditions, Adequate wages, Secure employment, Working time, Grievance mechanisms, Equity, diversity, and inclusion, Training and skills development, Health and Safety, Supply chain resilience and business continuity plans , Fair transactions , Intellectual property, Environmental impact and emissions, Resource circularity, Material traceability and transparency Note: * CSRD sub-topics. BAT Annual Report and Form 20-F 2023 Strategic Report Governance Report Financial Statements Other Information Sustainable Future Double Materiality Assessment Continued 76
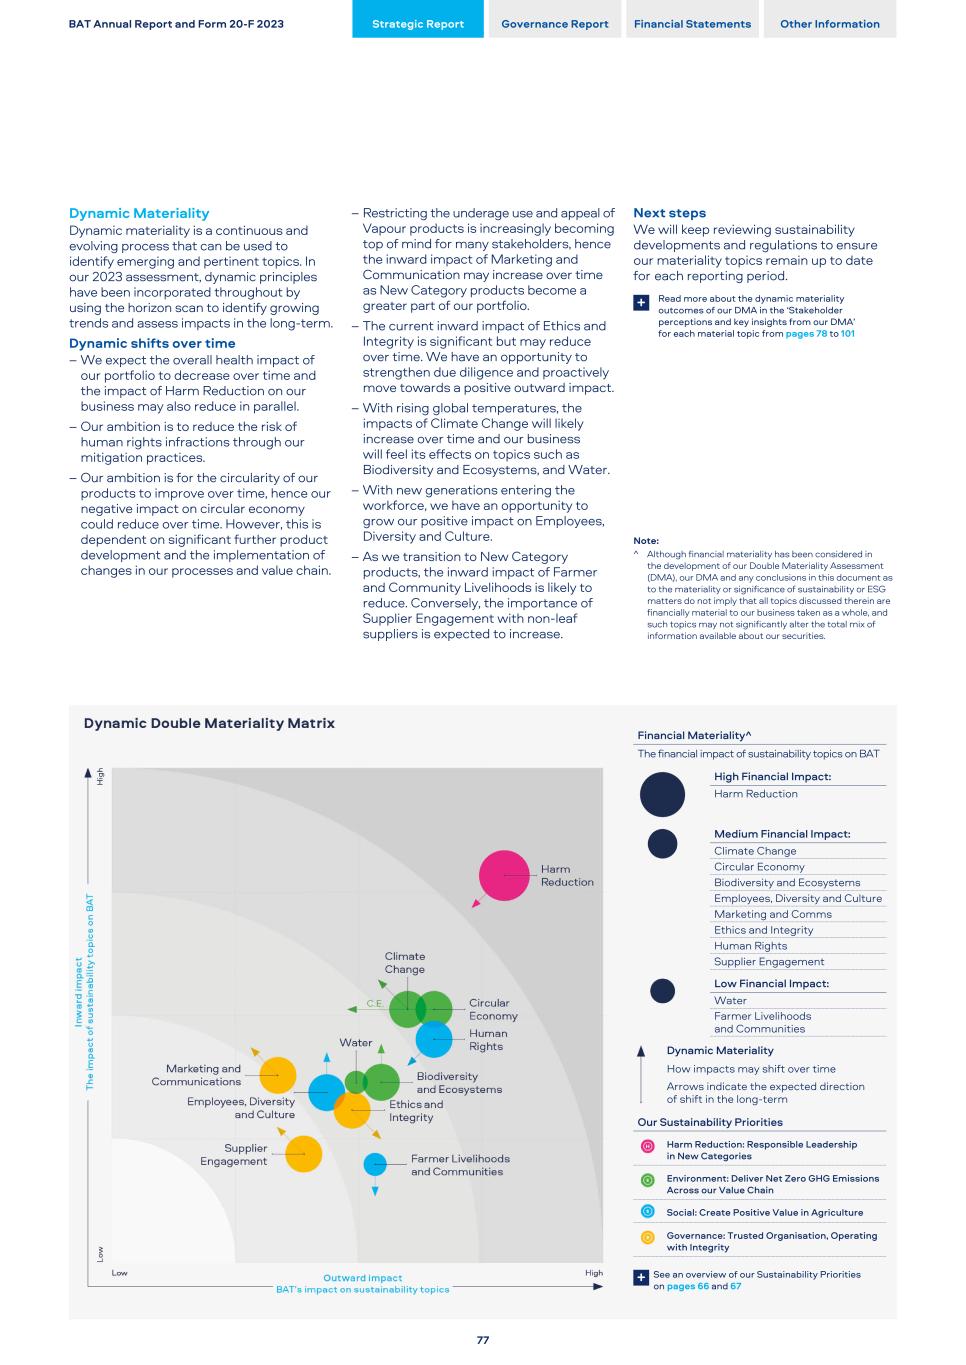
Dynamic Materiality Dynamic materiality is a continuous and evolving process that can be used to identify emerging and pertinent topics. In our 2023 assessment, dynamic principles have been incorporated throughout by using the horizon scan to identify growing trends and assess impacts in the long-term. Dynamic shifts over time – We expect the overall health impact of our portfolio to decrease over time and the impact of Harm Reduction on our business may also reduce in parallel. – Our ambition is to reduce the risk of human rights infractions through our mitigation practices. – Our ambition is for the circularity of our products to improve over time, hence our negative impact on circular economy could reduce over time. However, this is dependent on significant further product development and the implementation of changes in our processes and value chain. – Restricting the underage use and appeal of Vapour products is increasingly becoming top of mind for many stakeholders, hence the inward impact of Marketing and Communication may increase over time as New Category products become a greater part of our portfolio. – The current inward impact of Ethics and Integrity is significant but may reduce over time. We have an opportunity to strengthen due diligence and proactively move towards a positive outward impact. – With rising global temperatures, the impacts of Climate Change will likely increase over time and our business will feel its effects on topics such as Biodiversity and Ecosystems, and Water. – With new generations entering the workforce, we have an opportunity to grow our positive impact on Employees, Diversity and Culture. – As we transition to New Category products, the inward impact of Farmer and Community Livelihoods is likely to reduce. Conversely, the importance of Supplier Engagement with non-leaf suppliers is expected to increase. Next steps We will keep reviewing sustainability developments and regulations to ensure our materiality topics remain up to date for each reporting period. Read more about the dynamic materiality outcomes of our DMA in the ‘Stakeholder perceptions and key insights from our DMA’ for each material topic from pages 78 to 101 + Note: ^ Although financial materiality has been considered in the development of our Double Materiality Assessment (DMA), our DMA and any conclusions in this document as to the materiality or significance of sustainability or ESG matters do not imply that all topics discussed therein are financially material to our business taken as a whole, and such topics may not significantly alter the total mix of information available about our securities. Financial Materiality^ The financial impact of sustainability topics on BAT High Financial Impact: Harm Reduction Medium Financial Impact: Climate Change Circular Economy Biodiversity and Ecosystems Employees, Diversity and Culture Marketing and Comms Ethics and Integrity Human Rights Supplier Engagement Low Financial Impact: Water Farmer Livelihoods and Communities Dynamic Materiality How impacts may shift over time Arrows indicate the expected direction of shift in the long-term Our Sustainability Priorities Harm Reduction: Responsible Leadership in New Categories Environment: Deliver Net Zero GHG Emissions Across our Value Chain Social: Create Positive Value in Agriculture Governance: Trusted Organisation, Operating with Integrity See an overview of our Sustainability Priorities on pages 66 and 67+ BAT Annual Report and Form 20-F 2023 Strategic Report Governance Report Financial Statements Other Information 77
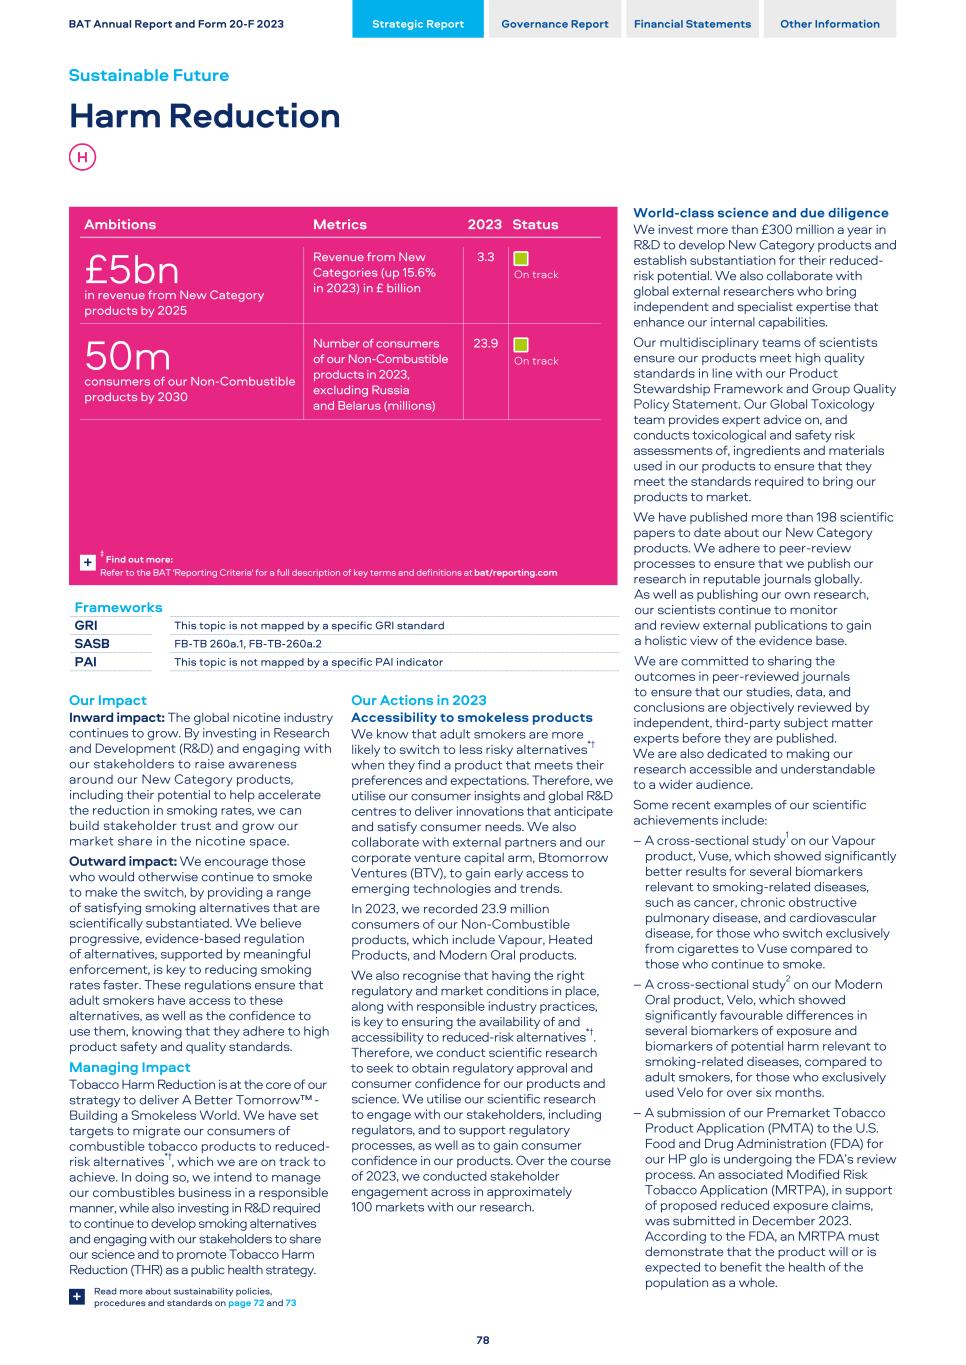
Our Impact Inward impact: The global nicotine industry continues to grow. By investing in Research and Development (R&D) and engaging with our stakeholders to raise awareness around our New Category products, including their potential to help accelerate the reduction in smoking rates, we can build stakeholder trust and grow our market share in the nicotine space. Outward impact: We encourage those who would otherwise continue to smoke to make the switch, by providing a range of satisfying smoking alternatives that are scientifically substantiated. We believe progressive, evidence-based regulation of alternatives, supported by meaningful enforcement, is key to reducing smoking rates faster. These regulations ensure that adult smokers have access to these alternatives, as well as the confidence to use them, knowing that they adhere to high product safety and quality standards. Managing Impact Tobacco Harm Reduction is at the core of our strategy to deliver A Better Tomorrow™ - Building a Smokeless World. We have set targets to migrate our consumers of combustible tobacco products to reduced- risk alternatives*†, which we are on track to achieve. In doing so, we intend to manage our combustibles business in a responsible manner, while also investing in R&D required to continue to develop smoking alternatives and engaging with our stakeholders to share our science and to promote Tobacco Harm Reduction (THR) as a public health strategy. Read more about sustainability policies, procedures and standards on page 72 and 73+ Our Actions in 2023 Accessibility to smokeless products We know that adult smokers are more likely to switch to less risky alternatives*† when they find a product that meets their preferences and expectations. Therefore, we utilise our consumer insights and global R&D centres to deliver innovations that anticipate and satisfy consumer needs. We also collaborate with external partners and our corporate venture capital arm, Btomorrow Ventures (BTV), to gain early access to emerging technologies and trends. In 2023, we recorded 23.9 million consumers of our Non-Combustible products, which include Vapour, Heated Products, and Modern Oral products. We also recognise that having the right regulatory and market conditions in place, along with responsible industry practices, is key to ensuring the availability of and accessibility to reduced-risk alternatives*†. Therefore, we conduct scientific research to seek to obtain regulatory approval and consumer confidence for our products and science. We utilise our scientific research to engage with our stakeholders, including regulators, and to support regulatory processes, as well as to gain consumer confidence in our products. Over the course of 2023, we conducted stakeholder engagement across in approximately 100 markets with our research. World-class science and due diligence We invest more than £300 million a year in R&D to develop New Category products and establish substantiation for their reduced- risk potential. We also collaborate with global external researchers who bring independent and specialist expertise that enhance our internal capabilities. Our multidisciplinary teams of scientists ensure our products meet high quality standards in line with our Product Stewardship Framework and Group Quality Policy Statement. Our Global Toxicology team provides expert advice on, and conducts toxicological and safety risk assessments of, ingredients and materials used in our products to ensure that they meet the standards required to bring our products to market. We have published more than 198 scientific papers to date about our New Category products. We adhere to peer-review processes to ensure that we publish our research in reputable journals globally. As well as publishing our own research, our scientists continue to monitor and review external publications to gain a holistic view of the evidence base. We are committed to sharing the outcomes in peer-reviewed journals to ensure that our studies, data, and conclusions are objectively reviewed by independent, third-party subject matter experts before they are published. We are also dedicated to making our research accessible and understandable to a wider audience. Some recent examples of our scientific achievements include: – A cross-sectional study1 on our Vapour product, Vuse, which showed significantly better results for several biomarkers relevant to smoking-related diseases, such as cancer, chronic obstructive pulmonary disease, and cardiovascular disease, for those who switch exclusively from cigarettes to Vuse compared to those who continue to smoke. – A cross-sectional study2 on our Modern Oral product, Velo, which showed significantly favourable differences in several biomarkers of exposure and biomarkers of potential harm relevant to smoking-related diseases, compared to adult smokers, for those who exclusively used Velo for over six months. – A submission of our Premarket Tobacco Product Application (PMTA) to the U.S. Food and Drug Administration (FDA) for our HP glo is undergoing the FDA’s review process. An associated Modified Risk Tobacco Application (MRTPA), in support of proposed reduced exposure claims, was submitted in December 2023. According to the FDA, an MRTPA must demonstrate that the product will or is expected to benefit the health of the population as a whole. BAT Annual Report and Form 20-F 2023 Strategic Report Governance Report Financial Statements Other Information Sustainable Future Harm Reduction 78 Frameworks GRI This topic is not mapped by a specific GRI standard SASB FB-TB 260a.1, FB-TB-260a.2 PAI This topic is not mapped by a specific PAI indicator Ambitions Metrics 2023 Status £5bn in revenue from New Category products by 2025 Revenue from New Categories (up 15.6% in 2023) in £ billion 3.3 On track 50m consumers of our Non-Combustible products by 2030 Number of consumers of our Non-Combustible products in 2023, excluding Russia and Belarus (millions) 23.9 On track ‡ Find out more: Refer to the BAT 'Reporting Criteria' for a full description of key terms and definitions at bat/reporting.com +
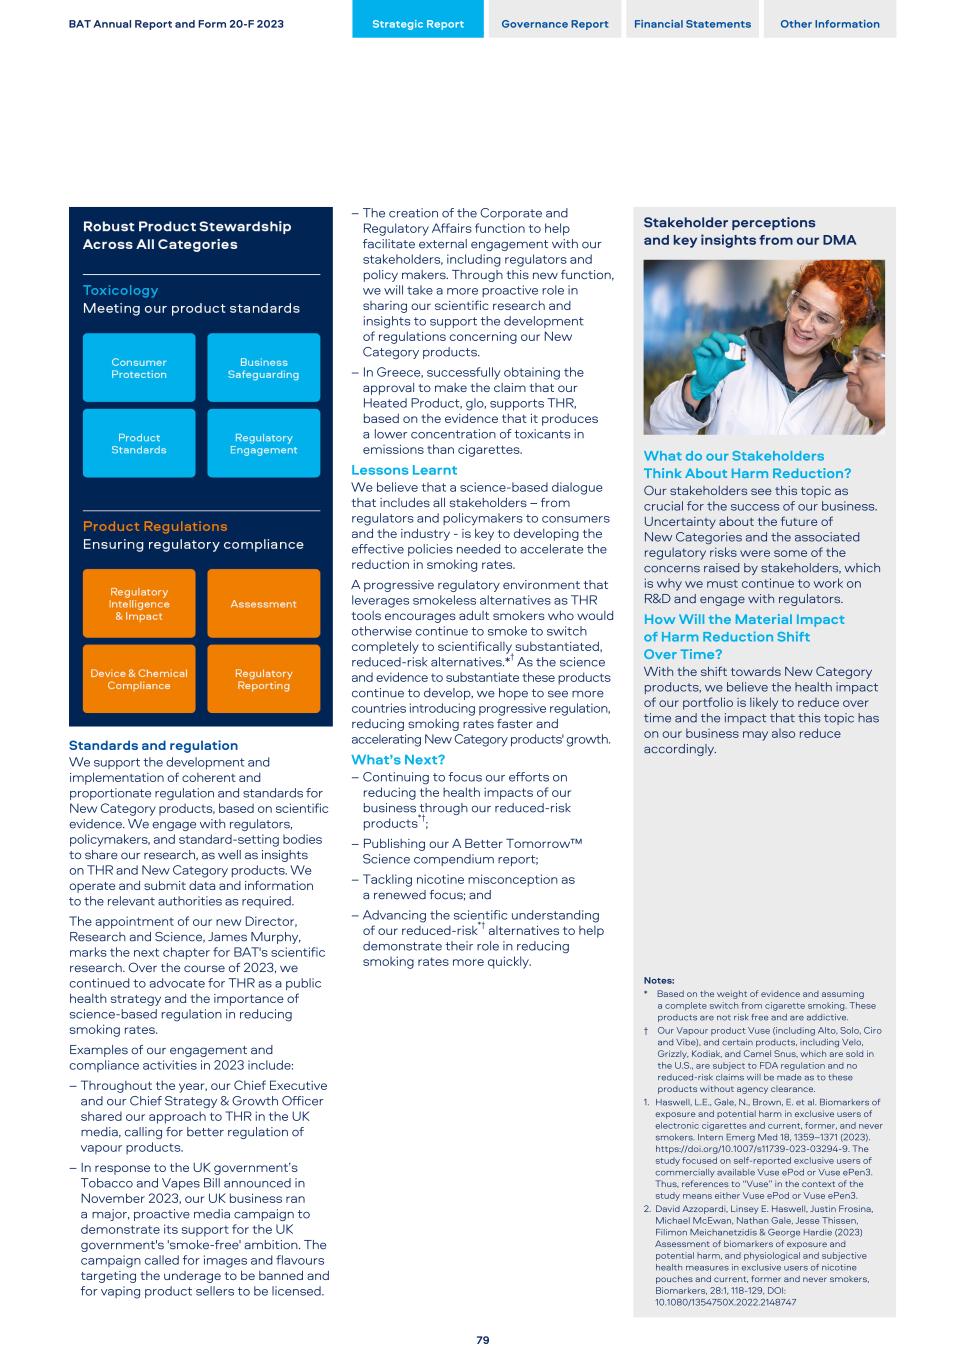
Standards and regulation We support the development and implementation of coherent and proportionate regulation and standards for New Category products, based on scientific evidence. We engage with regulators, policymakers, and standard-setting bodies to share our research, as well as insights on THR and New Category products. We operate and submit data and information to the relevant authorities as required. The appointment of our new Director, Research and Science, James Murphy, marks the next chapter for BAT's scientific research. Over the course of 2023, we continued to advocate for THR as a public health strategy and the importance of science-based regulation in reducing smoking rates. Examples of our engagement and compliance activities in 2023 include: – Throughout the year, our Chief Executive and our Chief Strategy & Growth Officer shared our approach to THR in the UK media, calling for better regulation of vapour products. – In response to the UK government’s Tobacco and Vapes Bill announced in November 2023, our UK business ran a major, proactive media campaign to demonstrate its support for the UK government's 'smoke-free' ambition. The campaign called for images and flavours targeting the underage to be banned and for vaping product sellers to be licensed. – The creation of the Corporate and Regulatory Affairs function to help facilitate external engagement with our stakeholders, including regulators and policy makers. Through this new function, we will take a more proactive role in sharing our scientific research and insights to support the development of regulations concerning our New Category products. – In Greece, successfully obtaining the approval to make the claim that our Heated Product, glo, supports THR, based on the evidence that it produces a lower concentration of toxicants in emissions than cigarettes. Lessons Learnt We believe that a science-based dialogue that includes all stakeholders – from regulators and policymakers to consumers and the industry - is key to developing the effective policies needed to accelerate the reduction in smoking rates. A progressive regulatory environment that leverages smokeless alternatives as THR tools encourages adult smokers who would otherwise continue to smoke to switch completely to scientifically substantiated, reduced-risk alternatives.*† As the science and evidence to substantiate these products continue to develop, we hope to see more countries introducing progressive regulation, reducing smoking rates faster and accelerating New Category products' growth. What’s Next? – Continuing to focus our efforts on reducing the health impacts of our business through our reduced-risk products*†; – Publishing our A Better Tomorrow™ Science compendium report; – Tackling nicotine misconception as a renewed focus; and – Advancing the scientific understanding of our reduced-risk*† alternatives to help demonstrate their role in reducing smoking rates more quickly. Stakeholder perceptions and key insights from our DMA What do our Stakeholders Think About Harm Reduction? Our stakeholders see this topic as crucial for the success of our business. Uncertainty about the future of New Categories and the associated regulatory risks were some of the concerns raised by stakeholders, which is why we must continue to work on R&D and engage with regulators. How Will the Material Impact of Harm Reduction Shift Over Time? With the shift towards New Category products, we believe the health impact of our portfolio is likely to reduce over time and the impact that this topic has on our business may also reduce accordingly. Notes: * Based on the weight of evidence and assuming a complete switch from cigarette smoking. These products are not risk free and are addictive. † Our Vapour product Vuse (including Alto, Solo, Ciro and Vibe), and certain products, including Velo, Grizzly, Kodiak, and Camel Snus, which are sold in the U.S., are subject to FDA regulation and no reduced-risk claims will be made as to these products without agency clearance. 1. Haswell, L.E., Gale, N., Brown, E. et al. Biomarkers of exposure and potential harm in exclusive users of electronic cigarettes and current, former, and never smokers. Intern Emerg Med 18, 1359–1371 (2023). https://doi.org/10.1007/s11739-023-03294-9. The study focused on self-reported exclusive users of commercially available Vuse ePod or Vuse ePen3. Thus, references to “Vuse” in the context of the study means either Vuse ePod or Vuse ePen3. 2. David Azzopardi, Linsey E. Haswell, Justin Frosina, Michael McEwan, Nathan Gale, Jesse Thissen, Filimon Meichanetzidis & George Hardie (2023) Assessment of biomarkers of exposure and potential harm, and physiological and subjective health measures in exclusive users of nicotine pouches and current, former and never smokers, Biomarkers, 28:1, 118-129, DOI: 10.1080/1354750X.2022.2148747 BAT Annual Report and Form 20-F 2023 Strategic Report Governance Report Financial Statements Other Information 79
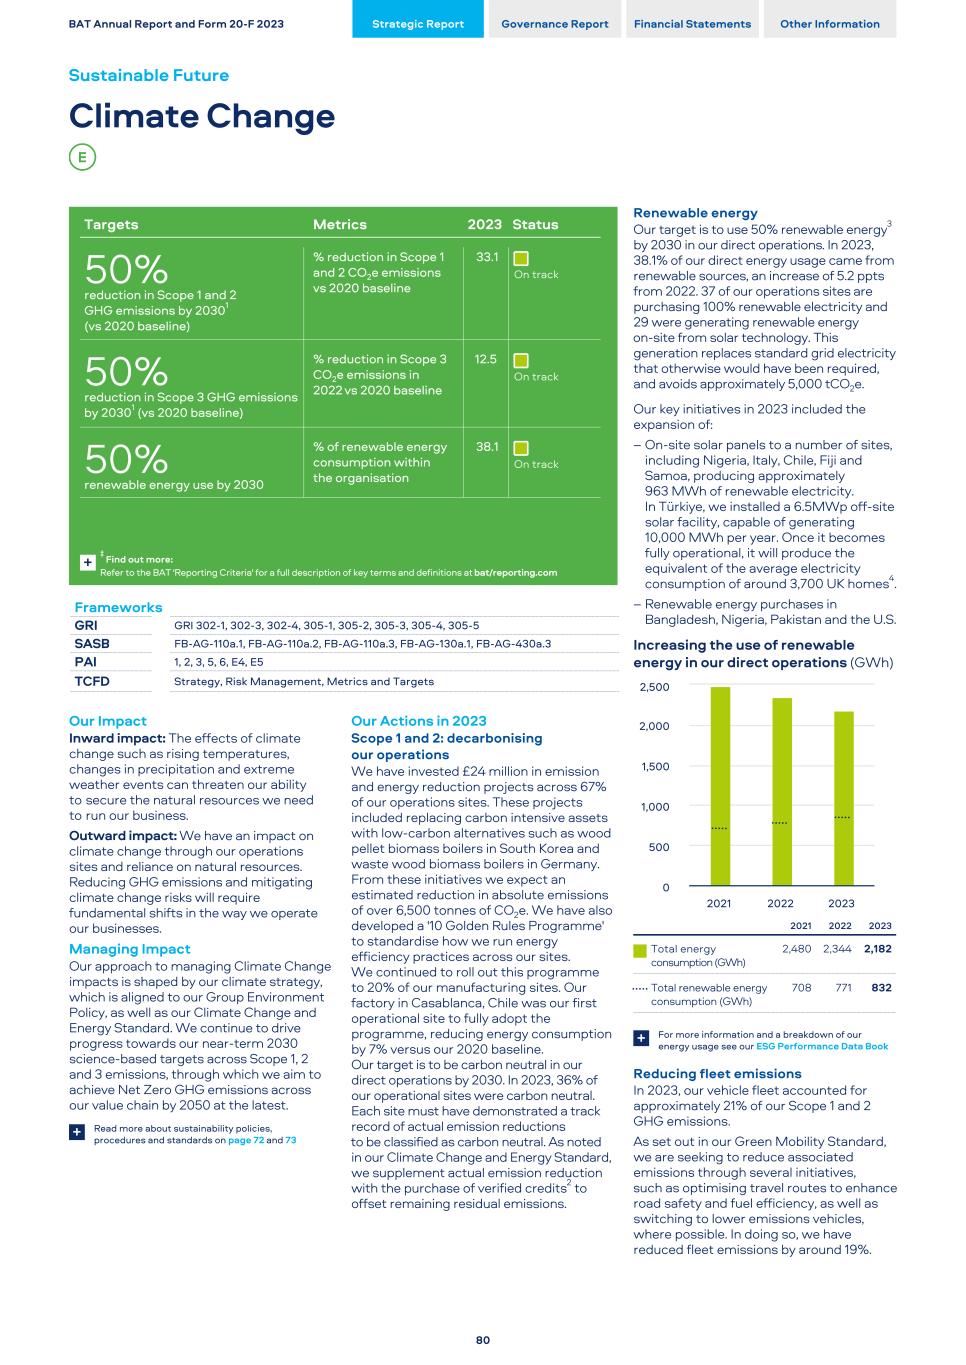
Our Impact Inward impact: The effects of climate change such as rising temperatures, changes in precipitation and extreme weather events can threaten our ability to secure the natural resources we need to run our business. Outward impact: We have an impact on climate change through our operations sites and reliance on natural resources. Reducing GHG emissions and mitigating climate change risks will require fundamental shifts in the way we operate our businesses. Managing Impact Our approach to managing Climate Change impacts is shaped by our climate strategy, which is aligned to our Group Environment Policy, as well as our Climate Change and Energy Standard. We continue to drive progress towards our near-term 2030 science-based targets across Scope 1, 2 and 3 emissions, through which we aim to achieve Net Zero GHG emissions across our value chain by 2050 at the latest. Read more about sustainability policies, procedures and standards on page 72 and 73+ Our Actions in 2023 Scope 1 and 2: decarbonising our operations We have invested £24 million in emission and energy reduction projects across 67% of our operations sites. These projects included replacing carbon intensive assets with low-carbon alternatives such as wood pellet biomass boilers in South Korea and waste wood biomass boilers in Germany. From these initiatives we expect an estimated reduction in absolute emissions of over 6,500 tonnes of CO2e. We have also developed a '10 Golden Rules Programme' to standardise how we run energy efficiency practices across our sites. We continued to roll out this programme to 20% of our manufacturing sites. Our factory in Casablanca, Chile was our first operational site to fully adopt the programme, reducing energy consumption by 7% versus our 2020 baseline. Our target is to be carbon neutral in our direct operations by 2030. In 2023, 36% of our operational sites were carbon neutral. Each site must have demonstrated a track record of actual emission reductions to be classified as carbon neutral. As noted in our Climate Change and Energy Standard, we supplement actual emission reduction with the purchase of verified credits2 to offset remaining residual emissions. Renewable energy Our target is to use 50% renewable energy3 by 2030 in our direct operations. In 2023, 38.1% of our direct energy usage came from renewable sources, an increase of 5.2 ppts from 2022. 37 of our operations sites are purchasing 100% renewable electricity and 29 were generating renewable energy on-site from solar technology. This generation replaces standard grid electricity that otherwise would have been required, and avoids approximately 5,000 tCO2e. Our key initiatives in 2023 included the expansion of: – On-site solar panels to a number of sites, including Nigeria, Italy, Chile, Fiji and Samoa, producing approximately 963 MWh of renewable electricity. In Türkiye, we installed a 6.5MWp off-site solar facility, capable of generating 10,000 MWh per year. Once it becomes fully operational, it will produce the equivalent of the average electricity consumption of around 3,700 UK homes4. – Renewable energy purchases in Bangladesh, Nigeria, Pakistan and the U.S. Increasing the use of renewable energy in our direct operations (GWh) 2021 2022 2023 0 500 1,000 1,500 2,000 2,500 2021 2022 2023 Total energy consumption (GWh) 2,480 2,344 2,182 Total renewable energy consumption (GWh) 708 771 832 For more information and a breakdown of our energy usage see our ESG Performance Data Book+ Reducing fleet emissions In 2023, our vehicle fleet accounted for approximately 21% of our Scope 1 and 2 GHG emissions. As set out in our Green Mobility Standard, we are seeking to reduce associated emissions through several initiatives, such as optimising travel routes to enhance road safety and fuel efficiency, as well as switching to lower emissions vehicles, where possible. In doing so, we have reduced fleet emissions by around 19%. BAT Annual Report and Form 20-F 2023 Strategic Report Governance Report Financial Statements Other Information Sustainable Future Climate Change 80 Frameworks GRI GRI 302-1, 302-3, 302-4, 305-1, 305-2, 305-3, 305-4, 305-5 SASB FB-AG-110a.1, FB-AG-110a.2, FB-AG-110a.3, FB-AG-130a.1, FB-AG-430a.3 PAI 1, 2, 3, 5, 6, E4, E5 TCFD Strategy, Risk Management, Metrics and Targets Targets Metrics 2023 Status 50% reduction in Scope 1 and 2 GHG emissions by 20301 (vs 2020 baseline) % reduction in Scope 1 and 2 CO2e emissions vs 2020 baseline 33.1 On track 50% reduction in Scope 3 GHG emissions by 20301 (vs 2020 baseline) % reduction in Scope 3 CO2e emissions in 2022 vs 2020 baseline 12.5 On track 50% renewable energy use by 2030 % of renewable energy consumption within the organisation 38.1 On track ‡ Find out more: Refer to the BAT 'Reporting Criteria' for a full description of key terms and definitions at bat/reporting.com +
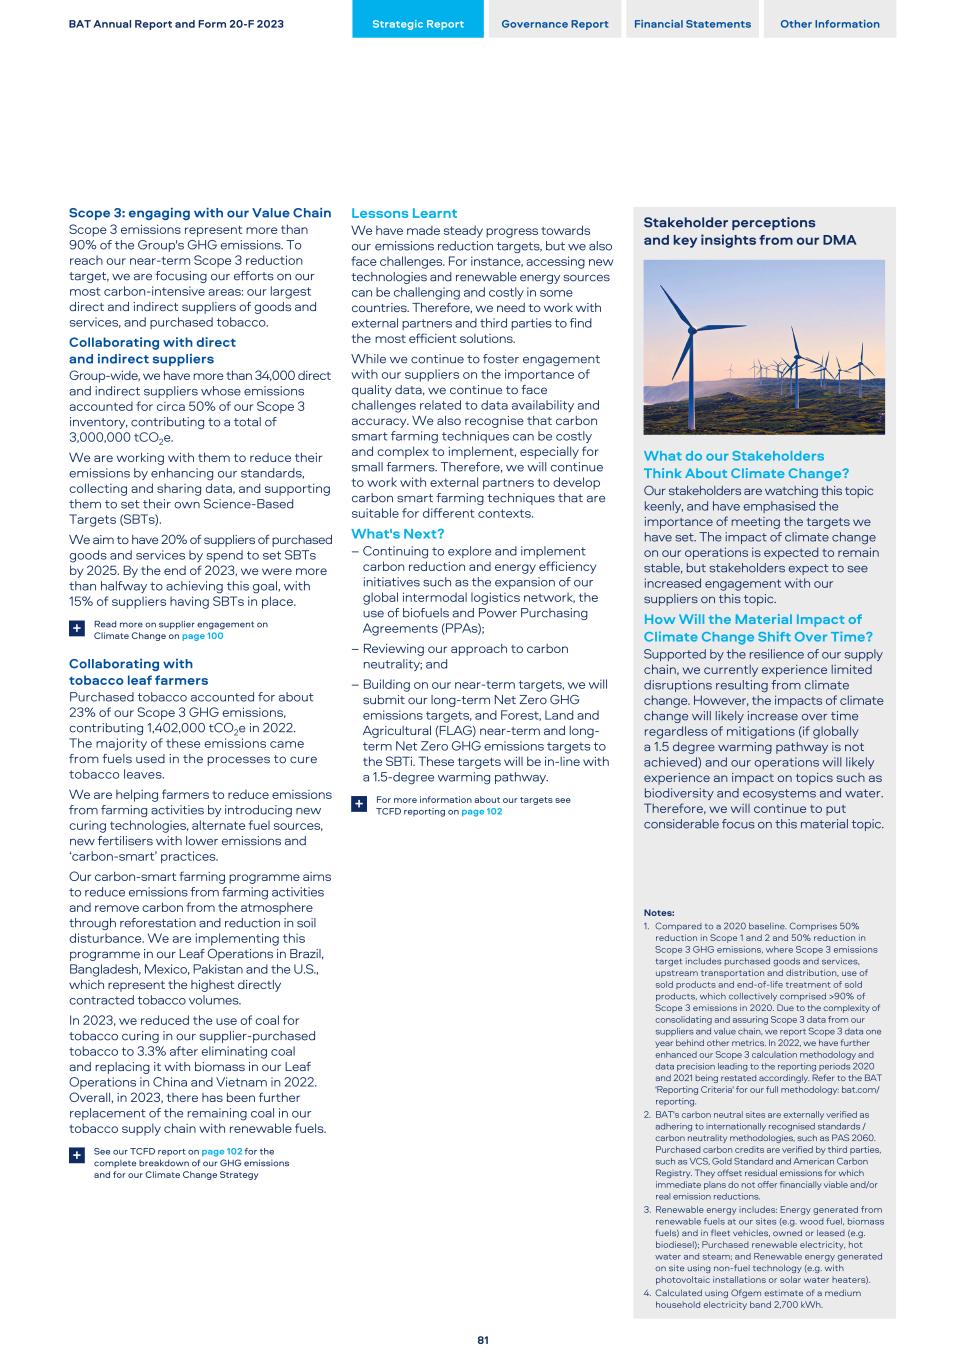
Scope 3: engaging with our Value Chain Scope 3 emissions represent more than 90% of the Group's GHG emissions. To reach our near-term Scope 3 reduction target, we are focusing our efforts on our most carbon-intensive areas: our largest direct and indirect suppliers of goods and services, and purchased tobacco. Collaborating with direct and indirect suppliers Group-wide, we have more than 34,000 direct and indirect suppliers whose emissions accounted for circa 50% of our Scope 3 inventory, contributing to a total of 3,000,000 tCO2e. We are working with them to reduce their emissions by enhancing our standards, collecting and sharing data, and supporting them to set their own Science-Based Targets (SBTs). We aim to have 20% of suppliers of purchased goods and services by spend to set SBTs by 2025. By the end of 2023, we were more than halfway to achieving this goal, with 15% of suppliers having SBTs in place. Read more on supplier engagement on Climate Change on page 100+ Collaborating with tobacco leaf farmers Purchased tobacco accounted for about 23% of our Scope 3 GHG emissions, contributing 1,402,000 tCO2e in 2022. The majority of these emissions came from fuels used in the processes to cure tobacco leaves. We are helping farmers to reduce emissions from farming activities by introducing new curing technologies, alternate fuel sources, new fertilisers with lower emissions and ‘carbon-smart’ practices. Our carbon-smart farming programme aims to reduce emissions from farming activities and remove carbon from the atmosphere through reforestation and reduction in soil disturbance. We are implementing this programme in our Leaf Operations in Brazil, Bangladesh, Mexico, Pakistan and the U.S., which represent the highest directly contracted tobacco volumes. In 2023, we reduced the use of coal for tobacco curing in our supplier-purchased tobacco to 3.3% after eliminating coal and replacing it with biomass in our Leaf Operations in China and Vietnam in 2022. Overall, in 2023, there has been further replacement of the remaining coal in our tobacco supply chain with renewable fuels. See our TCFD report on page 102 for the complete breakdown of our GHG emissions and for our Climate Change Strategy + Lessons Learnt We have made steady progress towards our emissions reduction targets, but we also face challenges. For instance, accessing new technologies and renewable energy sources can be challenging and costly in some countries. Therefore, we need to work with external partners and third parties to find the most efficient solutions. While we continue to foster engagement with our suppliers on the importance of quality data, we continue to face challenges related to data availability and accuracy. We also recognise that carbon smart farming techniques can be costly and complex to implement, especially for small farmers. Therefore, we will continue to work with external partners to develop carbon smart farming techniques that are suitable for different contexts. What's Next? – Continuing to explore and implement carbon reduction and energy efficiency initiatives such as the expansion of our global intermodal logistics network, the use of biofuels and Power Purchasing Agreements (PPAs); – Reviewing our approach to carbon neutrality; and – Building on our near-term targets, we will submit our long-term Net Zero GHG emissions targets, and Forest, Land and Agricultural (FLAG) near-term and long- term Net Zero GHG emissions targets to the SBTi. These targets will be in-line with a 1.5-degree warming pathway. For more information about our targets see TCFD reporting on page 102+ Stakeholder perceptions and key insights from our DMA What do our Stakeholders Think About Climate Change? Our stakeholders are watching this topic keenly, and have emphasised the importance of meeting the targets we have set. The impact of climate change on our operations is expected to remain stable, but stakeholders expect to see increased engagement with our suppliers on this topic. How Will the Material Impact of Climate Change Shift Over Time? Supported by the resilience of our supply chain, we currently experience limited disruptions resulting from climate change. However, the impacts of climate change will likely increase over time regardless of mitigations (if globally a 1.5 degree warming pathway is not achieved) and our operations will likely experience an impact on topics such as biodiversity and ecosystems and water. Therefore, we will continue to put considerable focus on this material topic. Notes: 1. Compared to a 2020 baseline. Comprises 50% reduction in Scope 1 and 2 and 50% reduction in Scope 3 GHG emissions, where Scope 3 emissions target includes purchased goods and services, upstream transportation and distribution, use of sold products and end-of-life treatment of sold products, which collectively comprised >90% of Scope 3 emissions in 2020. Due to the complexity of consolidating and assuring Scope 3 data from our suppliers and value chain, we report Scope 3 data one year behind other metrics. In 2022, we have further enhanced our Scope 3 calculation methodology and data precision leading to the reporting periods 2020 and 2021 being restated accordingly. Refer to the BAT 'Reporting Criteria' for our full methodology: bat.com/ reporting. 2. BAT's carbon neutral sites are externally verified as adhering to internationally recognised standards / carbon neutrality methodologies, such as PAS 2060. Purchased carbon credits are verified by third parties, such as VCS, Gold Standard and American Carbon Registry. They offset residual emissions for which immediate plans do not offer financially viable and/or real emission reductions. 3. Renewable energy includes: Energy generated from renewable fuels at our sites (e.g. wood fuel, biomass fuels) and in fleet vehicles, owned or leased (e.g. biodiesel); Purchased renewable electricity, hot water and steam; and Renewable energy generated on site using non-fuel technology (e.g. with photovoltaic installations or solar water heaters). 4. Calculated using Ofgem estimate of a medium household electricity band 2,700 kWh. BAT Annual Report and Form 20-F 2023 Strategic Report Governance Report Financial Statements Other Information 81
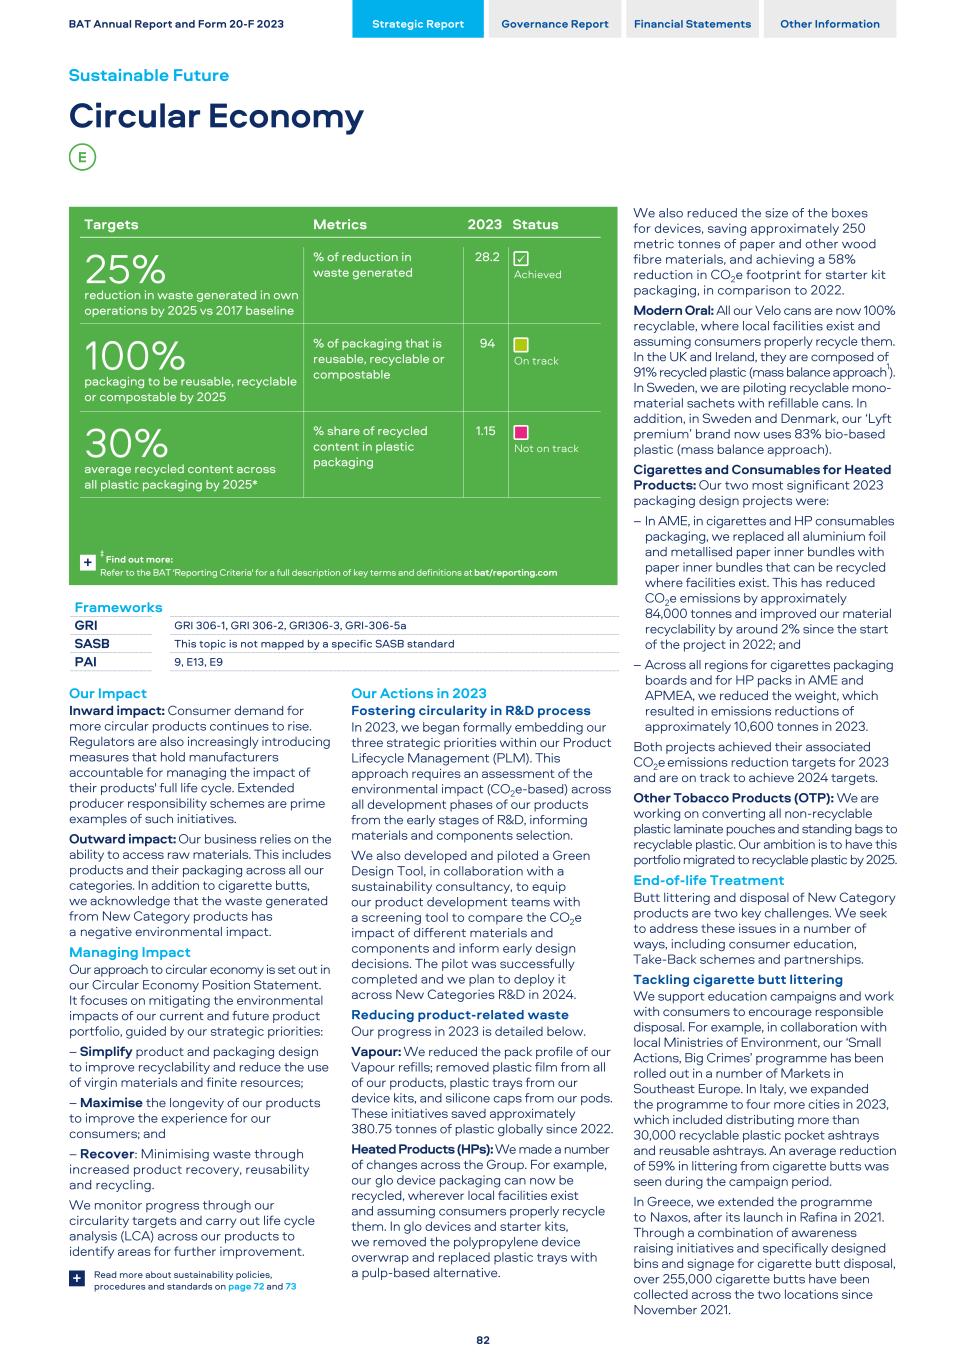
Our Impact Inward impact: Consumer demand for more circular products continues to rise. Regulators are also increasingly introducing measures that hold manufacturers accountable for managing the impact of their products' full life cycle. Extended producer responsibility schemes are prime examples of such initiatives. Outward impact: Our business relies on the ability to access raw materials. This includes products and their packaging across all our categories. In addition to cigarette butts, we acknowledge that the waste generated from New Category products has a negative environmental impact. Managing Impact Our approach to circular economy is set out in our Circular Economy Position Statement. It focuses on mitigating the environmental impacts of our current and future product portfolio, guided by our strategic priorities: – Simplify product and packaging design to improve recyclability and reduce the use of virgin materials and finite resources; – Maximise the longevity of our products to improve the experience for our consumers; and – Recover: Minimising waste through increased product recovery, reusability and recycling. We monitor progress through our circularity targets and carry out life cycle analysis (LCA) across our products to identify areas for further improvement. Read more about sustainability policies, procedures and standards on page 72 and 73+ Our Actions in 2023 Fostering circularity in R&D process In 2023, we began formally embedding our three strategic priorities within our Product Lifecycle Management (PLM). This approach requires an assessment of the environmental impact (CO2e-based) across all development phases of our products from the early stages of R&D, informing materials and components selection. We also developed and piloted a Green Design Tool, in collaboration with a sustainability consultancy, to equip our product development teams with a screening tool to compare the CO2e impact of different materials and components and inform early design decisions. The pilot was successfully completed and we plan to deploy it across New Categories R&D in 2024. Reducing product-related waste Our progress in 2023 is detailed below. Vapour: We reduced the pack profile of our Vapour refills; removed plastic film from all of our products, plastic trays from our device kits, and silicone caps from our pods. These initiatives saved approximately 380.75 tonnes of plastic globally since 2022. Heated Products (HPs): We made a number of changes across the Group. For example, our glo device packaging can now be recycled, wherever local facilities exist and assuming consumers properly recycle them. In glo devices and starter kits, we removed the polypropylene device overwrap and replaced plastic trays with a pulp-based alternative. We also reduced the size of the boxes for devices, saving approximately 250 metric tonnes of paper and other wood fibre materials, and achieving a 58% reduction in CO2e footprint for starter kit packaging, in comparison to 2022. Modern Oral: All our Velo cans are now 100% recyclable, where local facilities exist and assuming consumers properly recycle them. In the UK and Ireland, they are composed of 91% recycled plastic (mass balance approach1). In Sweden, we are piloting recyclable mono- material sachets with refillable cans. In addition, in Sweden and Denmark, our ‘Lyft premium’ brand now uses 83% bio-based plastic (mass balance approach). Cigarettes and Consumables for Heated Products: Our two most significant 2023 packaging design projects were: – In AME, in cigarettes and HP consumables packaging, we replaced all aluminium foil and metallised paper inner bundles with paper inner bundles that can be recycled where facilities exist. This has reduced CO2e emissions by approximately 84,000 tonnes and improved our material recyclability by around 2% since the start of the project in 2022; and – Across all regions for cigarettes packaging boards and for HP packs in AME and APMEA, we reduced the weight, which resulted in emissions reductions of approximately 10,600 tonnes in 2023. Both projects achieved their associated CO2e emissions reduction targets for 2023 and are on track to achieve 2024 targets. Other Tobacco Products (OTP): We are working on converting all non-recyclable plastic laminate pouches and standing bags to recyclable plastic. Our ambition is to have this portfolio migrated to recyclable plastic by 2025. End-of-life Treatment Butt littering and disposal of New Category products are two key challenges. We seek to address these issues in a number of ways, including consumer education, Take-Back schemes and partnerships. Tackling cigarette butt littering We support education campaigns and work with consumers to encourage responsible disposal. For example, in collaboration with local Ministries of Environment, our ‘Small Actions, Big Crimes’ programme has been rolled out in a number of Markets in Southeast Europe. In Italy, we expanded the programme to four more cities in 2023, which included distributing more than 30,000 recyclable plastic pocket ashtrays and reusable ashtrays. An average reduction of 59% in littering from cigarette butts was seen during the campaign period. In Greece, we extended the programme to Naxos, after its launch in Rafina in 2021. Through a combination of awareness raising initiatives and specifically designed bins and signage for cigarette butt disposal, over 255,000 cigarette butts have been collected across the two locations since November 2021. BAT Annual Report and Form 20-F 2023 Strategic Report Governance Report Financial Statements Other Information Sustainable Future Circular Economy 82 Frameworks GRI GRI 306-1, GRI 306-2, GRI306-3, GRI-306-5a SASB This topic is not mapped by a specific SASB standard PAI 9, E13, E9 Targets Metrics 2023 Status 25% reduction in waste generated in own operations by 2025 vs 2017 baseline % of reduction in waste generated 28.2 ü Achieved 100% packaging to be reusable, recyclable or compostable by 2025 % of packaging that is reusable, recyclable or compostable 94 On track 30% average recycled content across all plastic packaging by 2025* % share of recycled content in plastic packaging 1.15 Not on track ‡ Find out more: Refer to the BAT 'Reporting Criteria' for a full description of key terms and definitions at bat/reporting.com +
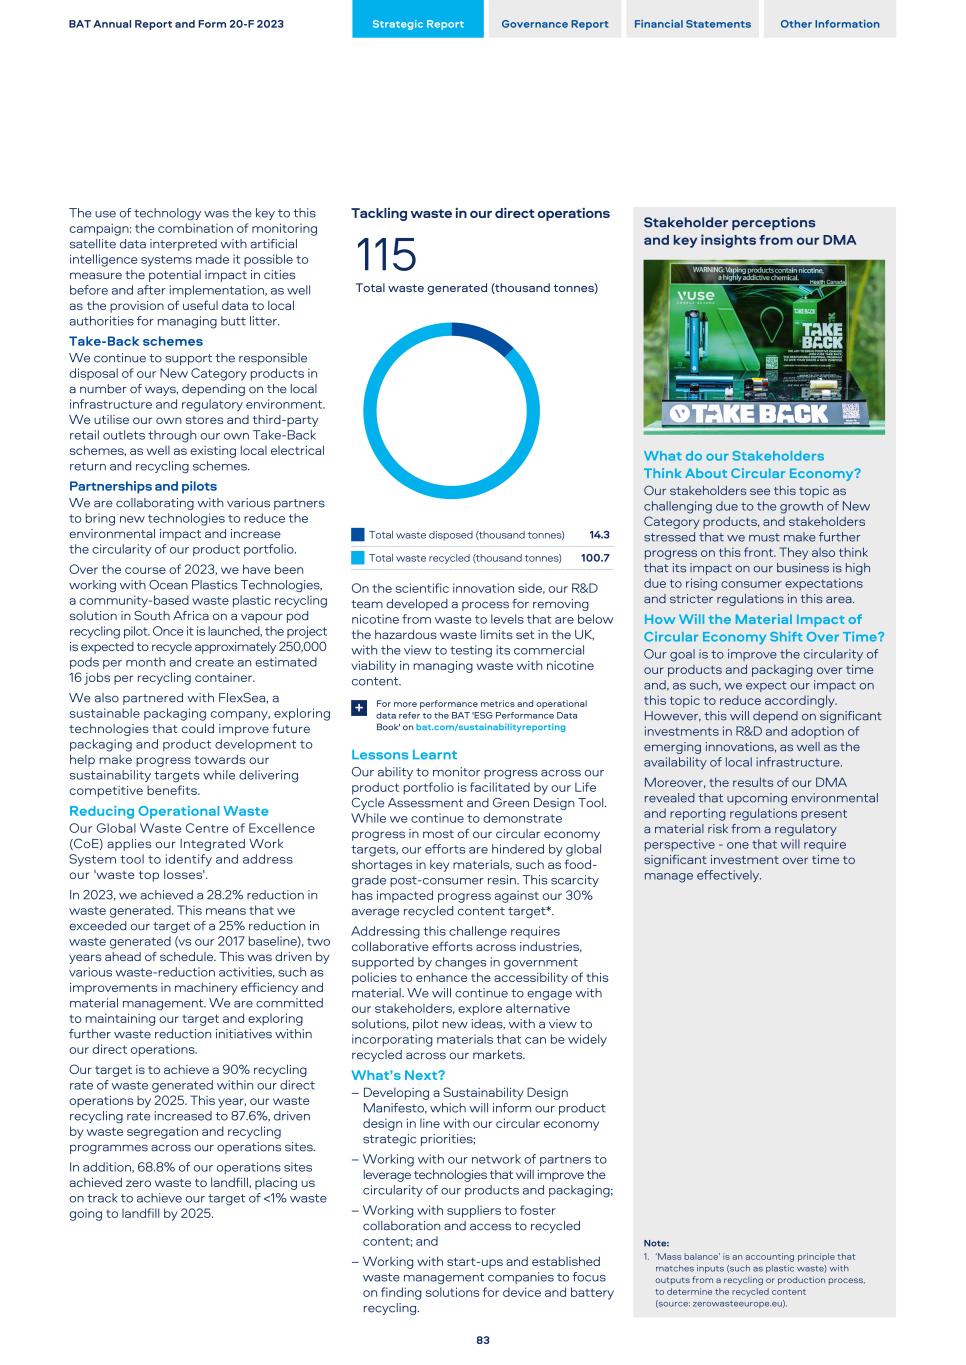
The use of technology was the key to this campaign: the combination of monitoring satellite data interpreted with artificial intelligence systems made it possible to measure the potential impact in cities before and after implementation, as well as the provision of useful data to local authorities for managing butt litter. Take-Back schemes We continue to support the responsible disposal of our New Category products in a number of ways, depending on the local infrastructure and regulatory environment. We utilise our own stores and third-party retail outlets through our own Take-Back schemes, as well as existing local electrical return and recycling schemes. Partnerships and pilots We are collaborating with various partners to bring new technologies to reduce the environmental impact and increase the circularity of our product portfolio. Over the course of 2023, we have been working with Ocean Plastics Technologies, a community-based waste plastic recycling solution in South Africa on a vapour pod recycling pilot. Once it is launched, the project is expected to recycle approximately 250,000 pods per month and create an estimated 16 jobs per recycling container. We also partnered with FlexSea, a sustainable packaging company, exploring technologies that could improve future packaging and product development to help make progress towards our sustainability targets while delivering competitive benefits. Reducing Operational Waste Our Global Waste Centre of Excellence (CoE) applies our Integrated Work System tool to identify and address our 'waste top losses'. In 2023, we achieved a 28.2% reduction in waste generated. This means that we exceeded our target of a 25% reduction in waste generated (vs our 2017 baseline), two years ahead of schedule. This was driven by various waste-reduction activities, such as improvements in machinery efficiency and material management. We are committed to maintaining our target and exploring further waste reduction initiatives within our direct operations. Our target is to achieve a 90% recycling rate of waste generated within our direct operations by 2025. This year, our waste recycling rate increased to 87.6%, driven by waste segregation and recycling programmes across our operations sites. In addition, 68.8% of our operations sites achieved zero waste to landfill, placing us on track to achieve our target of <1% waste going to landfill by 2025. Tackling waste in our direct operations 115 Total waste generated (thousand tonnes) Total waste disposed (thousand tonnes) 14.3 Total waste recycled (thousand tonnes) 100.7 On the scientific innovation side, our R&D team developed a process for removing nicotine from waste to levels that are below the hazardous waste limits set in the UK, with the view to testing its commercial viability in managing waste with nicotine content. For more performance metrics and operational data refer to the BAT 'ESG Performance Data Book' on bat.com/sustainabilityreporting + Lessons Learnt Our ability to monitor progress across our product portfolio is facilitated by our Life Cycle Assessment and Green Design Tool. While we continue to demonstrate progress in most of our circular economy targets, our efforts are hindered by global shortages in key materials, such as food- grade post-consumer resin. This scarcity has impacted progress against our 30% average recycled content target*. Addressing this challenge requires collaborative efforts across industries, supported by changes in government policies to enhance the accessibility of this material. We will continue to engage with our stakeholders, explore alternative solutions, pilot new ideas, with a view to incorporating materials that can be widely recycled across our markets. What’s Next? – Developing a Sustainability Design Manifesto, which will inform our product design in line with our circular economy strategic priorities; – Working with our network of partners to leverage technologies that will improve the circularity of our products and packaging; – Working with suppliers to foster collaboration and access to recycled content; and – Working with start-ups and established waste management companies to focus on finding solutions for device and battery recycling. Stakeholder perceptions and key insights from our DMA What do our Stakeholders Think About Circular Economy? Our stakeholders see this topic as challenging due to the growth of New Category products, and stakeholders stressed that we must make further progress on this front. They also think that its impact on our business is high due to rising consumer expectations and stricter regulations in this area. How Will the Material Impact of Circular Economy Shift Over Time? Our goal is to improve the circularity of our products and packaging over time and, as such, we expect our impact on this topic to reduce accordingly. However, this will depend on significant investments in R&D and adoption of emerging innovations, as well as the availability of local infrastructure. Moreover, the results of our DMA revealed that upcoming environmental and reporting regulations present a material risk from a regulatory perspective - one that will require significant investment over time to manage effectively. Note: 1. ‘Mass balance’ is an accounting principle that matches inputs (such as plastic waste) with outputs from a recycling or production process, to determine the recycled content (source: zerowasteeurope.eu). BAT Annual Report and Form 20-F 2023 Strategic Report Governance Report Financial Statements Other Information 83
Our Impact Inward impact: Deforestation, soil pollution and biodiversity loss can cause environmental disruptions and increase production costs. Outward impact: Our business operations, including conventional agricultural practices, rely on the use of natural resources, such as forest products, soil and water. Failure to preserve and protect the biodiversity where we operate could negatively impact ecosystems, as well as farmers and communities. Managing Impact Our approach to protecting biodiversity and ecosystems is embedded in our Group Environment Policy and Biodiversity Statement. These set out our principles for minimising and mitigating our environmental impacts. Further, we manage the impacts from our activities and sites through our Soil and Groundwater Protection Standard, which sets out requirements for preventing and handling contamination issues. Our target is to have Deforestation Free tobacco, pulp and paper supply chains by 2025. In our tobacco supply chain, we aim to make a net positive impact on forests by 2025 by planting more hectares of forests than we use. In our direct operations, following the geospatial Biodiversity Risk Assessment (BRA) we conducted in 2023, we aim to have Biodiversity Management Plans (BMPs) in high-risk manufacturing sites identified by 2025, with the view to reducing and mitigating the impacts of our continued operations on the land and the surrounding areas. Read more about sustainability policies, procedures and standards on page 72 and 73+ Our Actions in 2023 Managing biodiversity in our direct operations In 2023, with the aid of a specialist consultancy, we expanded the scope of our BRA to assess our direct operations against the nine biodiversity risk indicators and identified 22 high priority sites. In 2024, we will be rolling out training to all sites and implementing BMPs to high priority sites to mitigate risks they pose. For more information, including our high priority sites, see TNFD report on page 117 and our 2023 Biodiversity Risk Assessment at bat.com/biodiversity + Working towards positive impact Working towards a net positive impact on forests is a key component of our approach to biodiversity. In 2023, the Group's own Leaf Operations and strategic third-party suppliers delivered training through farm visits, online training and communication materials. In line with the Science Based Targets Network (SBTN)-recommended AR3T mitigation hierarchy framework, we seek to reduce current and avoid future impacts as a first step to preserving natural capital. In order to do so, we aim to have 100% of the wood used in our tobacco supply chain to be Deforestation and Conversion free. Managing compliance through our Biodiversity Operational Standard: We launched a Biodiversity Operational Standard for Tobacco Farming (BOS) in 2023 which sets operational requirements for the Group's own Leaf Operations and provides guidance to our third-party leaf suppliers. It covers forest and biodiversity management, natural ecosystems conversion, agrochemical use, and soil and water management. More than 1590 people, including 100% of our field technicians, were trained on our biodiversity standard in 2023. Here are some key actions and procedures that we undertake to help ensure all farmers in our tobacco supply chain are complying with the BOS. Managing primary native forests: We support our directly contracted farmers through training and provide them with tree saplings to use as part of their sustainable fuel sources for tobacco curing. Such sources include other alternative fuels and methods like biomass, sun and air curing. We ask our third-party suppliers to do the same. In 2023, 47% of our contracted farmers used alternative biomass fuels for tobacco curing. Protecting forests in partnership with farmers and suppliers: We conduct regular and unannounced farm visits in our directly contracted farmers and undertake due diligence before contracting with a new farmer. Remediation is put in place in case of any deforestation or conversion case and we ask our third-party suppliers to take equivalent steps. We monitored 100% of our directly contracted farmers in 2023 for deforestation and natural ecosystems conversion. We also trained our farmers and Field Technicians on best practices for resource preservation, such as the use of sustainable wood for tobacco curing, forest conservation, biodiversity, integrated pest management and soil and water management. In 2023, 458,017 attendees were reported to have received this training. Additionally, we deployed BMPs to mitigate risks in farms identified as high risk from our BRA. Out of the eight Leaf Operations assessed, more than 500 farmers in six Leaf Operations were required to have BMPs implemented. We also partnered with universities to conduct third-party assessments on the sustainability and traceability of the wood used in Brazil and the presence of biodiversity risk in Mexico. Supporting biodiversity and natural capital: Our Global Leaf Agronomy Development Centre continues to work on integrated pest management strategies, which are then adopted for local implementation by our Field Technicians who deploy them to local farmers. Ongoing developments include selecting disease- resistant tobacco varieties and using biological control strategies that can lead to a reduction in the use of agrochemicals. Reducing agrochemical usage: We only use locally approved agrochemicals with the lowest possible toxicity according to the World Health Organization (WHO) classification, avoiding any highly hazardous pesticides. We monitor adherence to our agrochemical standard from crop planning to the final packed leaf. BAT Annual Report and Form 20-F 2023 Strategic Report Governance Report Financial Statements Other Information Sustainable Future Biodiversity and Ecosystems 84 Frameworks GRI GRI 304-1, 304-2 SASB FB-AG-430a.3, FB-AG-430b.1, FB-AG-440a.1 PAI 7, E15 TNFD Strategy, Risk Management, Metrics and Targets Targets1 Metrics 2023 Status Deforestation and Conversion Free tobacco supply chain by 2025 (vs 2021 baseline) % of wood used in Thrive Supply Chain1 with Deforestation and Conversion Free (DCF) status 96.5 On track Deforestation Free pulp and paper supply chain by 2025 % of pulp and paper materials sourced with low risk of deforestation 69.3 On track Forest Positive in our tobacco supply chain by 2025 (vs 2021 baseline) Hectares of forests planted for conservation and for Forest Positive 68.8 On track ‡ Find out more: Refer to the BAT 'Reporting Criteria' for a full description of key terms and definitions at bat/reporting.com +
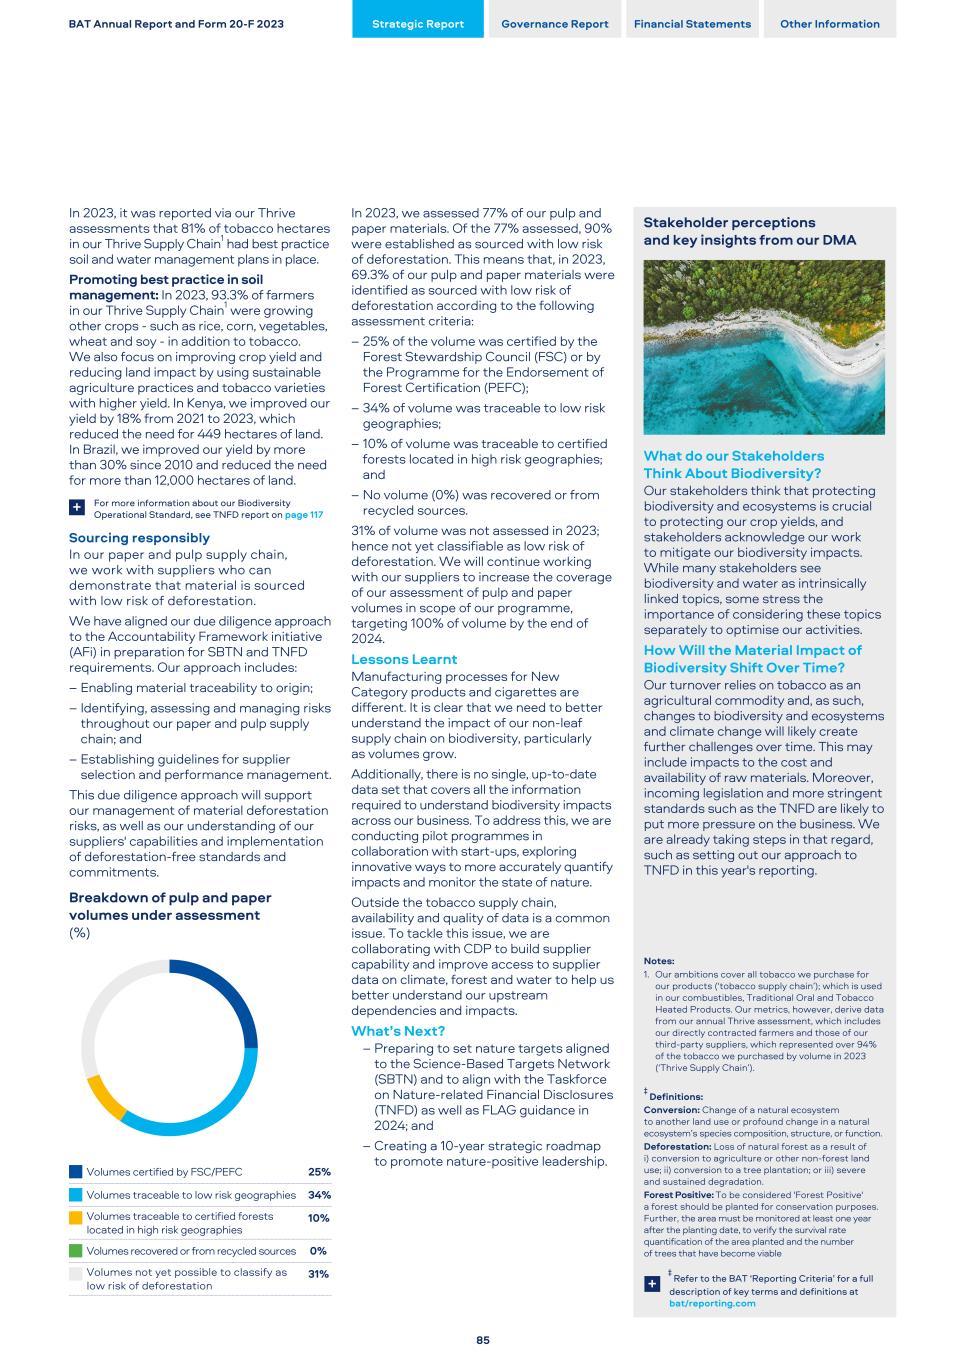
In 2023, it was reported via our Thrive assessments that 81% of tobacco hectares in our Thrive Supply Chain1 had best practice soil and water management plans in place. Promoting best practice in soil management: In 2023, 93.3% of farmers in our Thrive Supply Chain1 were growing other crops - such as rice, corn, vegetables, wheat and soy - in addition to tobacco. We also focus on improving crop yield and reducing land impact by using sustainable agriculture practices and tobacco varieties with higher yield. In Kenya, we improved our yield by 18% from 2021 to 2023, which reduced the need for 449 hectares of land. In Brazil, we improved our yield by more than 30% since 2010 and reduced the need for more than 12,000 hectares of land. For more information about our Biodiversity Operational Standard, see TNFD report on page 117+ Sourcing responsibly In our paper and pulp supply chain, we work with suppliers who can demonstrate that material is sourced with low risk of deforestation. We have aligned our due diligence approach to the Accountability Framework initiative (AFi) in preparation for SBTN and TNFD requirements. Our approach includes: – Enabling material traceability to origin; – Identifying, assessing and managing risks throughout our paper and pulp supply chain; and – Establishing guidelines for supplier selection and performance management. This due diligence approach will support our management of material deforestation risks, as well as our understanding of our suppliers' capabilities and implementation of deforestation-free standards and commitments. Breakdown of pulp and paper volumes under assessment (%) Volumes certified by FSC/PEFC 25% Volumes traceable to low risk geographies 34% Volumes traceable to certified forests located in high risk geographies 10% Volumes recovered or from recycled sources 0% Volumes not yet possible to classify as low risk of deforestation 31% In 2023, we assessed 77% of our pulp and paper materials. Of the 77% assessed, 90% were established as sourced with low risk of deforestation. This means that, in 2023, 69.3% of our pulp and paper materials were identified as sourced with low risk of deforestation according to the following assessment criteria: – 25% of the volume was certified by the Forest Stewardship Council (FSC) or by the Programme for the Endorsement of Forest Certification (PEFC); – 34% of volume was traceable to low risk geographies; – 10% of volume was traceable to certified forests located in high risk geographies; and – No volume (0%) was recovered or from recycled sources. 31% of volume was not assessed in 2023; hence not yet classifiable as low risk of deforestation. We will continue working with our suppliers to increase the coverage of our assessment of pulp and paper volumes in scope of our programme, targeting 100% of volume by the end of 2024. Lessons Learnt Manufacturing processes for New Category products and cigarettes are different. It is clear that we need to better understand the impact of our non-leaf supply chain on biodiversity, particularly as volumes grow. Additionally, there is no single, up-to-date data set that covers all the information required to understand biodiversity impacts across our business. To address this, we are conducting pilot programmes in collaboration with start-ups, exploring innovative ways to more accurately quantify impacts and monitor the state of nature. Outside the tobacco supply chain, availability and quality of data is a common issue. To tackle this issue, we are collaborating with CDP to build supplier capability and improve access to supplier data on climate, forest and water to help us better understand our upstream dependencies and impacts. What’s Next? – Preparing to set nature targets aligned to the Science-Based Targets Network (SBTN) and to align with the Taskforce on Nature-related Financial Disclosures (TNFD) as well as FLAG guidance in 2024; and – Creating a 10-year strategic roadmap to promote nature-positive leadership. Stakeholder perceptions and key insights from our DMA What do our Stakeholders Think About Biodiversity? Our stakeholders think that protecting biodiversity and ecosystems is crucial to protecting our crop yields, and stakeholders acknowledge our work to mitigate our biodiversity impacts. While many stakeholders see biodiversity and water as intrinsically linked topics, some stress the importance of considering these topics separately to optimise our activities. How Will the Material Impact of Biodiversity Shift Over Time? Our turnover relies on tobacco as an agricultural commodity and, as such, changes to biodiversity and ecosystems and climate change will likely create further challenges over time. This may include impacts to the cost and availability of raw materials. Moreover, incoming legislation and more stringent standards such as the TNFD are likely to put more pressure on the business. We are already taking steps in that regard, such as setting out our approach to TNFD in this year's reporting. Notes: 1. Our ambitions cover all tobacco we purchase for our products (‘tobacco supply chain’); which is used in our combustibles, Traditional Oral and Tobacco Heated Products. Our metrics, however, derive data from our annual Thrive assessment, which includes our directly contracted farmers and those of our third-party suppliers, which represented over 94% of the tobacco we purchased by volume in 2023 (‘Thrive Supply Chain’). ‡ Definitions: Conversion: Change of a natural ecosystem to another land use or profound change in a natural ecosystem’s species composition, structure, or function. Deforestation: Loss of natural forest as a result of i) conversion to agriculture or other non-forest land use; ii) conversion to a tree plantation; or iii) severe and sustained degradation. Forest Positive: To be considered 'Forest Positive' a forest should be planted for conservation purposes. Further, the area must be monitored at least one year after the planting date, to verify the survival rate quantification of the area planted and the number of trees that have become viable ‡ Refer to the BAT ‘Reporting Criteria’ for a full description of key terms and definitions at bat/reporting.com + BAT Annual Report and Form 20-F 2023 Strategic Report Governance Report Financial Statements Other Information 85
Our Impact Inward impact: The impact of climate change on freshwater, as well as industrial water usage, is endangering the healthy functioning of water ecosystems. Outward impact: Water is vital both for our direct manufacturing processes and for our tobacco crops. While taking into account the investments we have made in our direct operations and tobacco crops, we recognise that our business activities generate emissions to water, which can threaten biodiversity and ecosystems. By using water more efficiently, we can reduce negative ecological impacts while protecting community access to water. For more performance metrics and operational data refer to the BAT 'ESG Performance Data Book': at bat.com/sustainability reporting + Managing Impact Our approach to managing water impacts in our direct operations is outlined in our Group Environment Policy, which is complemented by our Water Security Standard, and our Soil and Groundwater Protection Standard, as well as our water recycling and reduction targets for our direct operations. For our tobacco supply chain, our Supplier Code of Conduct (SCoC) is complemented by our Leaf Supplier Manual (LSM), which includes requirements for water protection planning and water extraction for irrigation. Read more about sustainability policies, procedures and standards on page 72 and 73+ Our Actions in 2023 Assessing our water risks Our direct operations: In 2023, we used a total of 86% of water in our operations sites and 14% in our offices, retail, R&D and other sites. We operate in some water- stressed locations such as Mexico and Uzbekistan, where optimising water use is critical. This year, following the World Resources Institute (WRI) AQUEDUCT Water Atlas, we have reassessed our operational exposure to water stress risks. The tool identified 24 operations sites in water stressed areas (2022: 16), making up 45.6% of our water withdrawn in 2023. For these sites, we have more stringent standards for on-site water management and recycling rates. Local markets are responsible for ensuring that they have appropriate water policies in place to fulfill such requirements. We also conducted a Water Risk Assessment to identify sites near important marine habitats, such as coral reefs, mangroves and seagrass beds. We have incorporated our findings into our Biodiversity Risk Assessment and implemented Biodiversity Management plans for sites in high-risk areas. Tobacco supply chain: A number of the locations where we source tobacco are located in ‘water stress’ areas. We use the WRI Aqueduct Tool to monitor the proportion of tobacco crops in these areas and map supplier locations. In 2023, some of our tobacco sourcing areas in 18 countries - including India, Chile and Türkiye - which are located in water-stressed areas, estimated 18.5% of the tobacco we purchased in 2023 came from these areas, where we seek to work with farmers to optimise and reduce crop water usage. Water stewardship across our direct operations We aim to ensure all our sites comply with our water withdrawal and discharge guidelines and follow our Water Roadmap, which links to the Alliance for Water Stewardship (AWS) process. We continue to invest in water efficiency and recycling projects to eliminate water losses, reduce water withdrawn and replace fresh water with recycled water, where possible. For example, by replacing water-cooling systems with more efficient dry coolers in our factory in Samsun, Türkiye, we reduced our withdrawn water by approximately 20,000m3 annually. We also invest in water treatment technologies to improve the quality of our water discharged and increase water recycling. Through these initiatives, we achieved a 39.2% reduction in water withdrawn (vs 2017 baseline), surpassing our 2025 target of 35% two years ahead of schedule. 70% of our operations sites reduced water withdrawn by recycling water on site to date. In addition, 34% of our operations sites implemented both water efficiency and recycling activities, investing £2.8 million in capital expenditure. We expect an estimated 140,000 m3 of savings in water withdrawn over the course of 2024 (vs 2017 baseline). We also achieved 24.4% of total water recycled in 2023, with our top performing sites being in Chile, South Korea, Croatia, and Pakistan. As members of the AWS, we committed to 100% of our operations sites being certified against the AWS Standard by 2025. In 2023, 22 more operations sites became AWS certified, bringing the total number of AWS certified sites to 44 or 68.75% of our operations sites. Our AWS certified sites have performed a wide range of stakeholder engagement throughout the year, such as: – Involvement in advisory committees at water basin level to promote collaboration; – Awareness sessions for stakeholders and communities on water risks and stewardship; and – The construction of infrastructure to enable access to potable water and WASH facilities for local communities. BAT Annual Report and Form 20-F 2023 Strategic Report Governance Report Financial Statements Other Information Sustainable Future Water 86 Frameworks GRI GRI 3, 303-1, 303-2, 303-3, 303-4, 303-5 SASB FB-AG-140a.1, 140a.2, 140a.3, FB-AG-430a.3, FB-AG-440a.2 PAI 8, E6, E7, E8 Targets Metrics 2023 Status 35% reduction in water withdrawn by 2025 vs 2017 baseline % reduction in water withdrawn vs 2017 baseline 39.2 ü Achieved 100% operation sites Alliance for Water Stewardship certified by 2025 % operations sites Alliance for Water Stewardship (AWS) certified 68.8 On track 30% of water recycled by 2025 % of water recycled 24.4 On track ‡ Find out more: Refer to the BAT 'Reporting Criteria' for a full description of key terms and definitions at bat/reporting.com +
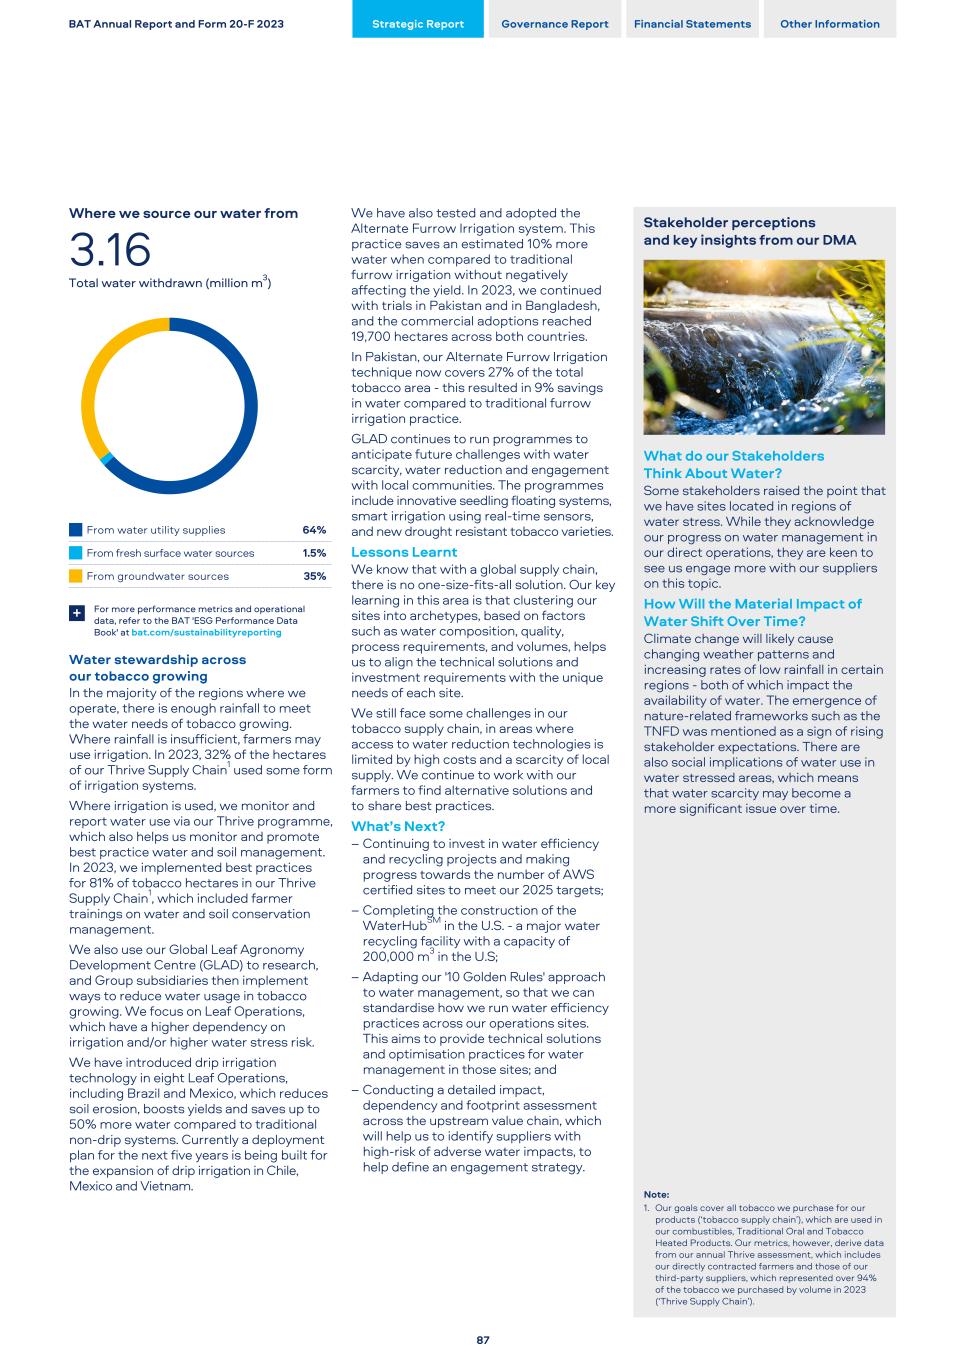
Where we source our water from 3.16 Total water withdrawn (million m3) From water utility supplies 64% From fresh surface water sources 1.5% From groundwater sources 35% For more performance metrics and operational data, refer to the BAT 'ESG Performance Data Book' at bat.com/sustainabilityreporting + Water stewardship across our tobacco growing In the majority of the regions where we operate, there is enough rainfall to meet the water needs of tobacco growing. Where rainfall is insufficient, farmers may use irrigation. In 2023, 32% of the hectares of our Thrive Supply Chain1 used some form of irrigation systems. Where irrigation is used, we monitor and report water use via our Thrive programme, which also helps us monitor and promote best practice water and soil management. In 2023, we implemented best practices for 81% of tobacco hectares in our Thrive Supply Chain1, which included farmer trainings on water and soil conservation management. We also use our Global Leaf Agronomy Development Centre (GLAD) to research, and Group subsidiaries then implement ways to reduce water usage in tobacco growing. We focus on Leaf Operations, which have a higher dependency on irrigation and/or higher water stress risk. We have introduced drip irrigation technology in eight Leaf Operations, including Brazil and Mexico, which reduces soil erosion, boosts yields and saves up to 50% more water compared to traditional non-drip systems. Currently a deployment plan for the next five years is being built for the expansion of drip irrigation in Chile, Mexico and Vietnam. We have also tested and adopted the Alternate Furrow Irrigation system. This practice saves an estimated 10% more water when compared to traditional furrow irrigation without negatively affecting the yield. In 2023, we continued with trials in Pakistan and in Bangladesh, and the commercial adoptions reached 19,700 hectares across both countries. In Pakistan, our Alternate Furrow Irrigation technique now covers 27% of the total tobacco area - this resulted in 9% savings in water compared to traditional furrow irrigation practice. GLAD continues to run programmes to anticipate future challenges with water scarcity, water reduction and engagement with local communities. The programmes include innovative seedling floating systems, smart irrigation using real-time sensors, and new drought resistant tobacco varieties. Lessons Learnt We know that with a global supply chain, there is no one-size-fits-all solution. Our key learning in this area is that clustering our sites into archetypes, based on factors such as water composition, quality, process requirements, and volumes, helps us to align the technical solutions and investment requirements with the unique needs of each site. We still face some challenges in our tobacco supply chain, in areas where access to water reduction technologies is limited by high costs and a scarcity of local supply. We continue to work with our farmers to find alternative solutions and to share best practices. What’s Next? – Continuing to invest in water efficiency and recycling projects and making progress towards the number of AWS certified sites to meet our 2025 targets; – Completing the construction of the WaterHubSM in the U.S. - a major water recycling facility with a capacity of 200,000 m3 in the U.S; – Adapting our '10 Golden Rules' approach to water management, so that we can standardise how we run water efficiency practices across our operations sites. This aims to provide technical solutions and optimisation practices for water management in those sites; and – Conducting a detailed impact, dependency and footprint assessment across the upstream value chain, which will help us to identify suppliers with high-risk of adverse water impacts, to help define an engagement strategy. Stakeholder perceptions and key insights from our DMA What do our Stakeholders Think About Water? Some stakeholders raised the point that we have sites located in regions of water stress. While they acknowledge our progress on water management in our direct operations, they are keen to see us engage more with our suppliers on this topic. How Will the Material Impact of Water Shift Over Time? Climate change will likely cause changing weather patterns and increasing rates of low rainfall in certain regions - both of which impact the availability of water. The emergence of nature-related frameworks such as the TNFD was mentioned as a sign of rising stakeholder expectations. There are also social implications of water use in water stressed areas, which means that water scarcity may become a more significant issue over time. Note: 1. Our goals cover all tobacco we purchase for our products (‘tobacco supply chain’), which are used in our combustibles, Traditional Oral and Tobacco Heated Products. Our metrics, however, derive data from our annual Thrive assessment, which includes our directly contracted farmers and those of our third-party suppliers, which represented over 94% of the tobacco we purchased by volume in 2023 (‘Thrive Supply Chain’). BAT Annual Report and Form 20-F 2023 Strategic Report Governance Report Financial Statements Other Information 87
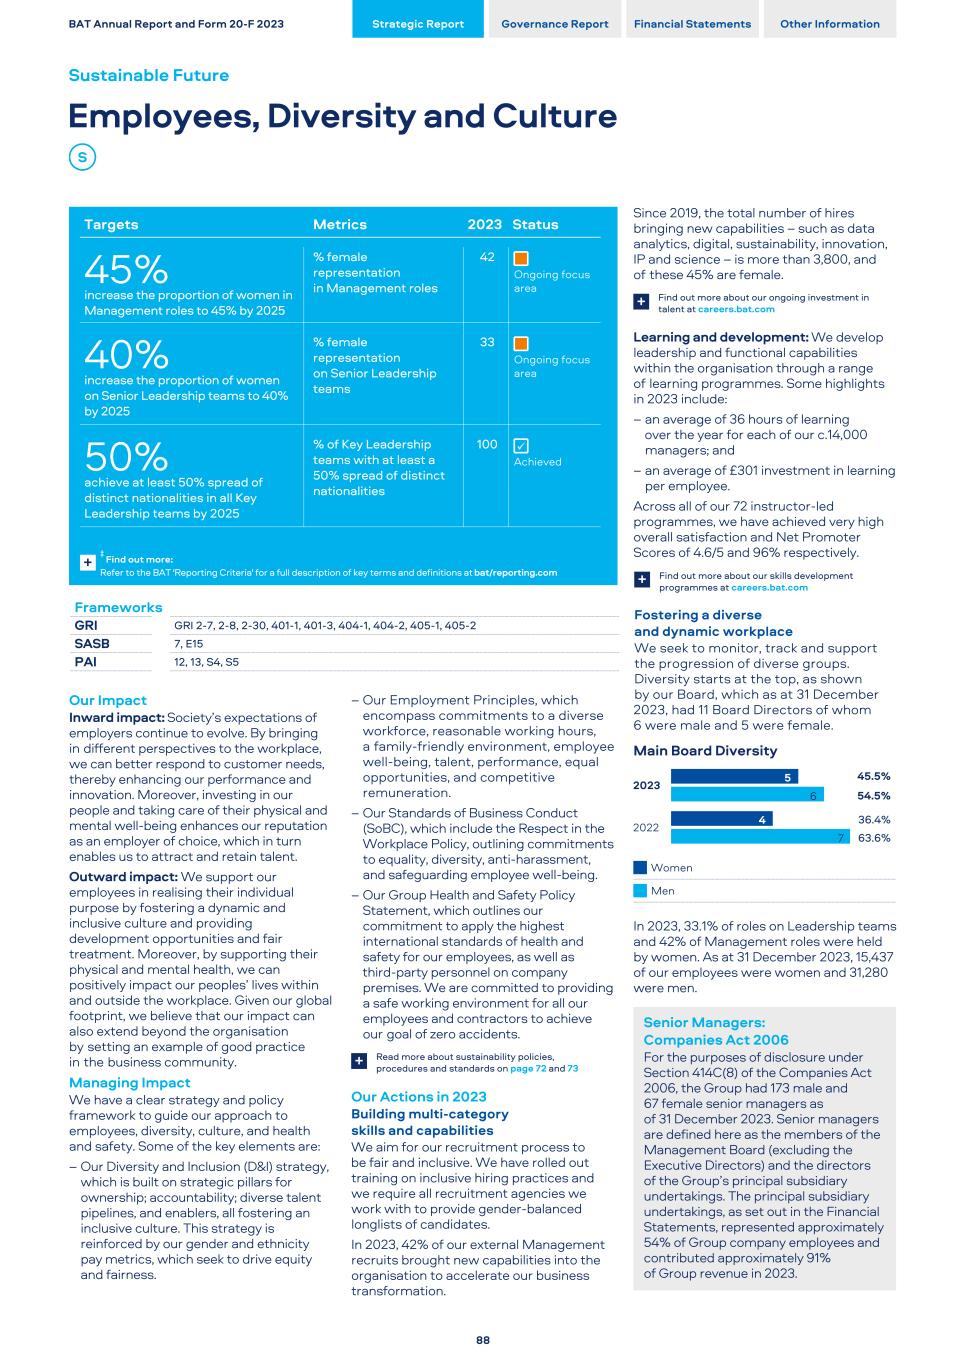
Our Impact Inward impact: Society’s expectations of employers continue to evolve. By bringing in different perspectives to the workplace, we can better respond to customer needs, thereby enhancing our performance and innovation. Moreover, investing in our people and taking care of their physical and mental well-being enhances our reputation as an employer of choice, which in turn enables us to attract and retain talent. Outward impact: We support our employees in realising their individual purpose by fostering a dynamic and inclusive culture and providing development opportunities and fair treatment. Moreover, by supporting their physical and mental health, we can positively impact our peoples’ lives within and outside the workplace. Given our global footprint, we believe that our impact can also extend beyond the organisation by setting an example of good practice in the business community. Managing Impact We have a clear strategy and policy framework to guide our approach to employees, diversity, culture, and health and safety. Some of the key elements are: – Our Diversity and Inclusion (D&I) strategy, which is built on strategic pillars for ownership; accountability; diverse talent pipelines, and enablers, all fostering an inclusive culture. This strategy is reinforced by our gender and ethnicity pay metrics, which seek to drive equity and fairness. – Our Employment Principles, which encompass commitments to a diverse workforce, reasonable working hours, a family-friendly environment, employee well-being, talent, performance, equal opportunities, and competitive remuneration. – Our Standards of Business Conduct (SoBC), which include the Respect in the Workplace Policy, outlining commitments to equality, diversity, anti-harassment, and safeguarding employee well-being. – Our Group Health and Safety Policy Statement, which outlines our commitment to apply the highest international standards of health and safety for our employees, as well as third-party personnel on company premises. We are committed to providing a safe working environment for all our employees and contractors to achieve our goal of zero accidents. Read more about sustainability policies, procedures and standards on page 72 and 73+ Our Actions in 2023 Building multi-category skills and capabilities We aim for our recruitment process to be fair and inclusive. We have rolled out training on inclusive hiring practices and we require all recruitment agencies we work with to provide gender-balanced longlists of candidates. In 2023, 42% of our external Management recruits brought new capabilities into the organisation to accelerate our business transformation. Since 2019, the total number of hires bringing new capabilities – such as data analytics, digital, sustainability, innovation, IP and science – is more than 3,800, and of these 45% are female. Find out more about our ongoing investment in talent at careers.bat.com+ Learning and development: We develop leadership and functional capabilities within the organisation through a range of learning programmes. Some highlights in 2023 include: – an average of 36 hours of learning over the year for each of our c.14,000 managers; and – an average of £301 investment in learning per employee. Across all of our 72 instructor-led programmes, we have achieved very high overall satisfaction and Net Promoter Scores of 4.6/5 and 96% respectively. Find out more about our skills development programmes at careers.bat.com+ Fostering a diverse and dynamic workplace We seek to monitor, track and support the progression of diverse groups. Diversity starts at the top, as shown by our Board, which as at 31 December 2023, had 11 Board Directors of whom 6 were male and 5 were female. Main Board Diversity 2023 5 6 45.5% 54.5% 2022 4 7 36.4% 63.6% Women Men In 2023, 33.1% of roles on Leadership teams and 42% of Management roles were held by women. As at 31 December 2023, 15,437 of our employees were women and 31,280 were men. Senior Managers: Companies Act 2006 For the purposes of disclosure under Section 414C(8) of the Companies Act 2006, the Group had 173 male and 67 female senior managers as of 31 December 2023. Senior managers are defined here as the members of the Management Board (excluding the Executive Directors) and the directors of the Group’s principal subsidiary undertakings. The principal subsidiary undertakings, as set out in the Financial Statements, represented approximately 54% of Group company employees and contributed approximately 91% of Group revenue in 2023. BAT Annual Report and Form 20-F 2023 Strategic Report Governance Report Financial Statements Other Information Sustainable Future Employees, Diversity and Culture 88 Frameworks GRI GRI 2-7, 2-8, 2-30, 401-1, 401-3, 404-1, 404-2, 405-1, 405-2 SASB 7, E15 PAI 12, 13, S4, S5 Targets Metrics 2023 Status 45% increase the proportion of women in Management roles to 45% by 2025 % female representation in Management roles 42 Ongoing focus area 40% increase the proportion of women on Senior Leadership teams to 40% by 2025 % female representation on Senior Leadership teams 33 Ongoing focus area 50% achieve at least 50% spread of distinct nationalities in all Key Leadership teams by 2025 % of Key Leadership teams with at least a 50% spread of distinct nationalities 100 ü Achieved ‡ Find out more: Refer to the BAT 'Reporting Criteria' for a full description of key terms and definitions at bat/reporting.com +
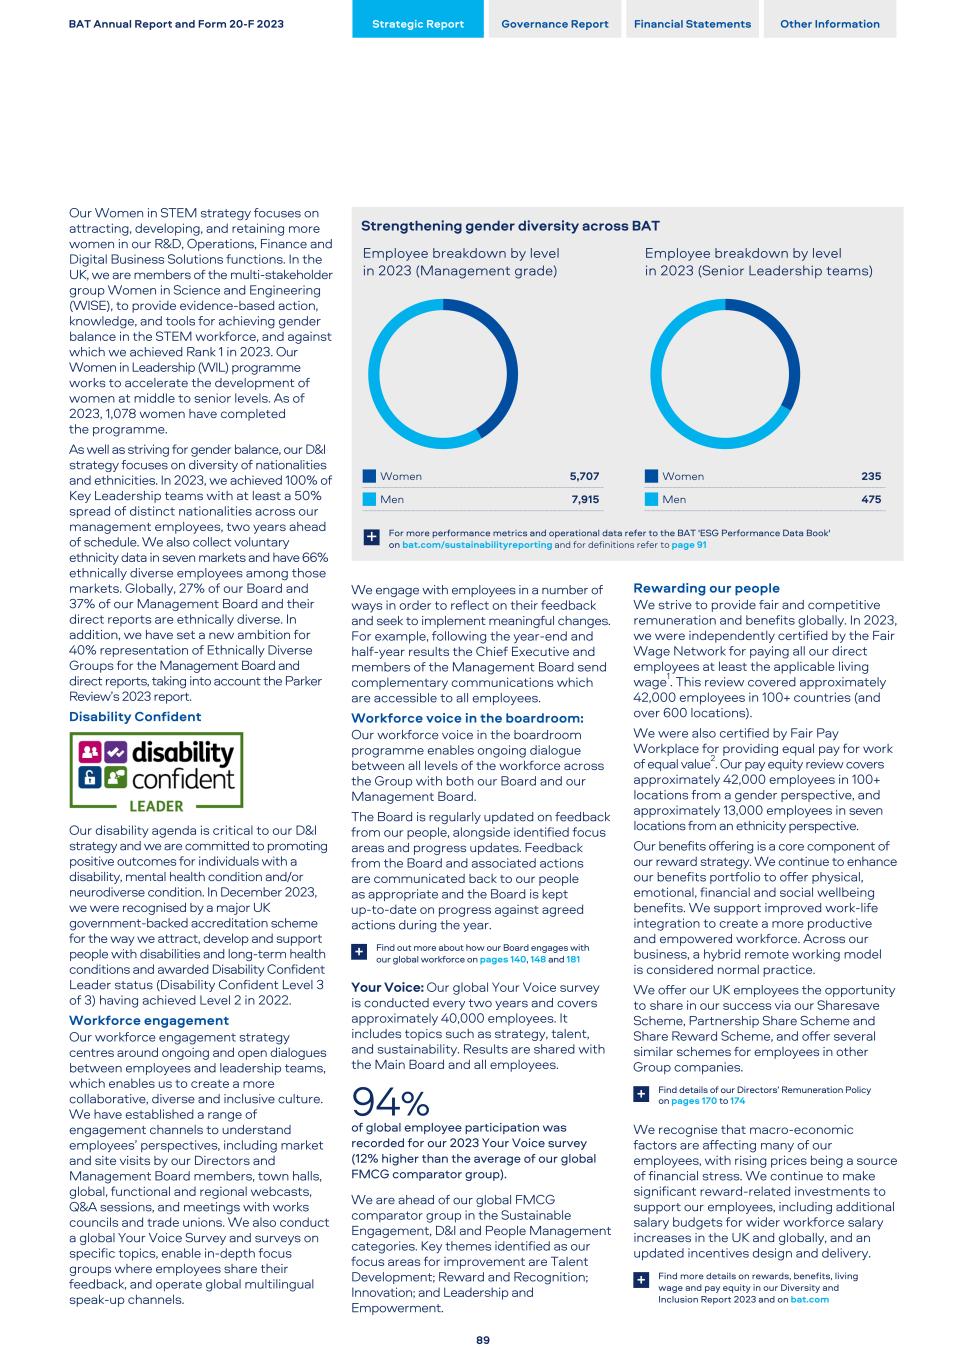
Our Women in STEM strategy focuses on attracting, developing, and retaining more women in our R&D, Operations, Finance and Digital Business Solutions functions. In the UK, we are members of the multi-stakeholder group Women in Science and Engineering (WISE), to provide evidence-based action, knowledge, and tools for achieving gender balance in the STEM workforce, and against which we achieved Rank 1 in 2023. Our Women in Leadership (WIL) programme works to accelerate the development of women at middle to senior levels. As of 2023, 1,078 women have completed the programme. As well as striving for gender balance, our D&I strategy focuses on diversity of nationalities and ethnicities. In 2023, we achieved 100% of Key Leadership teams with at least a 50% spread of distinct nationalities across our management employees, two years ahead of schedule. We also collect voluntary ethnicity data in seven markets and have 66% ethnically diverse employees among those markets. Globally, 27% of our Board and 37% of our Management Board and their direct reports are ethnically diverse. In addition, we have set a new ambition for 40% representation of Ethnically Diverse Groups for the Management Board and direct reports, taking into account the Parker Review’s 2023 report. Disability Confident Our disability agenda is critical to our D&I strategy and we are committed to promoting positive outcomes for individuals with a disability, mental health condition and/or neurodiverse condition. In December 2023, we were recognised by a major UK government-backed accreditation scheme for the way we attract, develop and support people with disabilities and long-term health conditions and awarded Disability Confident Leader status (Disability Confident Level 3 of 3) having achieved Level 2 in 2022. Workforce engagement Our workforce engagement strategy centres around ongoing and open dialogues between employees and leadership teams, which enables us to create a more collaborative, diverse and inclusive culture. We have established a range of engagement channels to understand employees’ perspectives, including market and site visits by our Directors and Management Board members, town halls, global, functional and regional webcasts, Q&A sessions, and meetings with works councils and trade unions. We also conduct a global Your Voice Survey and surveys on specific topics, enable in-depth focus groups where employees share their feedback, and operate global multilingual speak-up channels. Employee breakdown by level in 2023 (Management grade) Women 5,707 Men 7,915 We engage with employees in a number of ways in order to reflect on their feedback and seek to implement meaningful changes. For example, following the year-end and half-year results the Chief Executive and members of the Management Board send complementary communications which are accessible to all employees. Workforce voice in the boardroom: Our workforce voice in the boardroom programme enables ongoing dialogue between all levels of the workforce across the Group with both our Board and our Management Board. The Board is regularly updated on feedback from our people, alongside identified focus areas and progress updates. Feedback from the Board and associated actions are communicated back to our people as appropriate and the Board is kept up-to-date on progress against agreed actions during the year. Find out more about how our Board engages with our global workforce on pages 140, 148 and 181+ Your Voice: Our global Your Voice survey is conducted every two years and covers approximately 40,000 employees. It includes topics such as strategy, talent, and sustainability. Results are shared with the Main Board and all employees. 94% of global employee participation was recorded for our 2023 Your Voice survey (12% higher than the average of our global FMCG comparator group). We are ahead of our global FMCG comparator group in the Sustainable Engagement, D&I and People Management categories. Key themes identified as our focus areas for improvement are Talent Development; Reward and Recognition; Innovation; and Leadership and Empowerment. Employee breakdown by level in 2023 (Senior Leadership teams) Women 235 Men 475 Rewarding our people We strive to provide fair and competitive remuneration and benefits globally. In 2023, we were independently certified by the Fair Wage Network for paying all our direct employees at least the applicable living wage1. This review covered approximately 42,000 employees in 100+ countries (and over 600 locations). We were also certified by Fair Pay Workplace for providing equal pay for work of equal value2. Our pay equity review covers approximately 42,000 employees in 100+ locations from a gender perspective, and approximately 13,000 employees in seven locations from an ethnicity perspective. Our benefits offering is a core component of our reward strategy. We continue to enhance our benefits portfolio to offer physical, emotional, financial and social wellbeing benefits. We support improved work-life integration to create a more productive and empowered workforce. Across our business, a hybrid remote working model is considered normal practice. We offer our UK employees the opportunity to share in our success via our Sharesave Scheme, Partnership Share Scheme and Share Reward Scheme, and offer several similar schemes for employees in other Group companies. Find details of our Directors’ Remuneration Policy on pages 170 to 174+ We recognise that macro-economic factors are affecting many of our employees, with rising prices being a source of financial stress. We continue to make significant reward-related investments to support our employees, including additional salary budgets for wider workforce salary increases in the UK and globally, and an updated incentives design and delivery. Find more details on rewards, benefits, living wage and pay equity in our Diversity and Inclusion Report 2023 and on bat.com + BAT Annual Report and Form 20-F 2023 Strategic Report Governance Report Financial Statements Other Information 89 Strengthening gender diversity across BAT For more performance metrics and operational data refer to the BAT 'ESG Performance Data Book' on bat.com/sustainabilityreporting and for definitions refer to page 91+
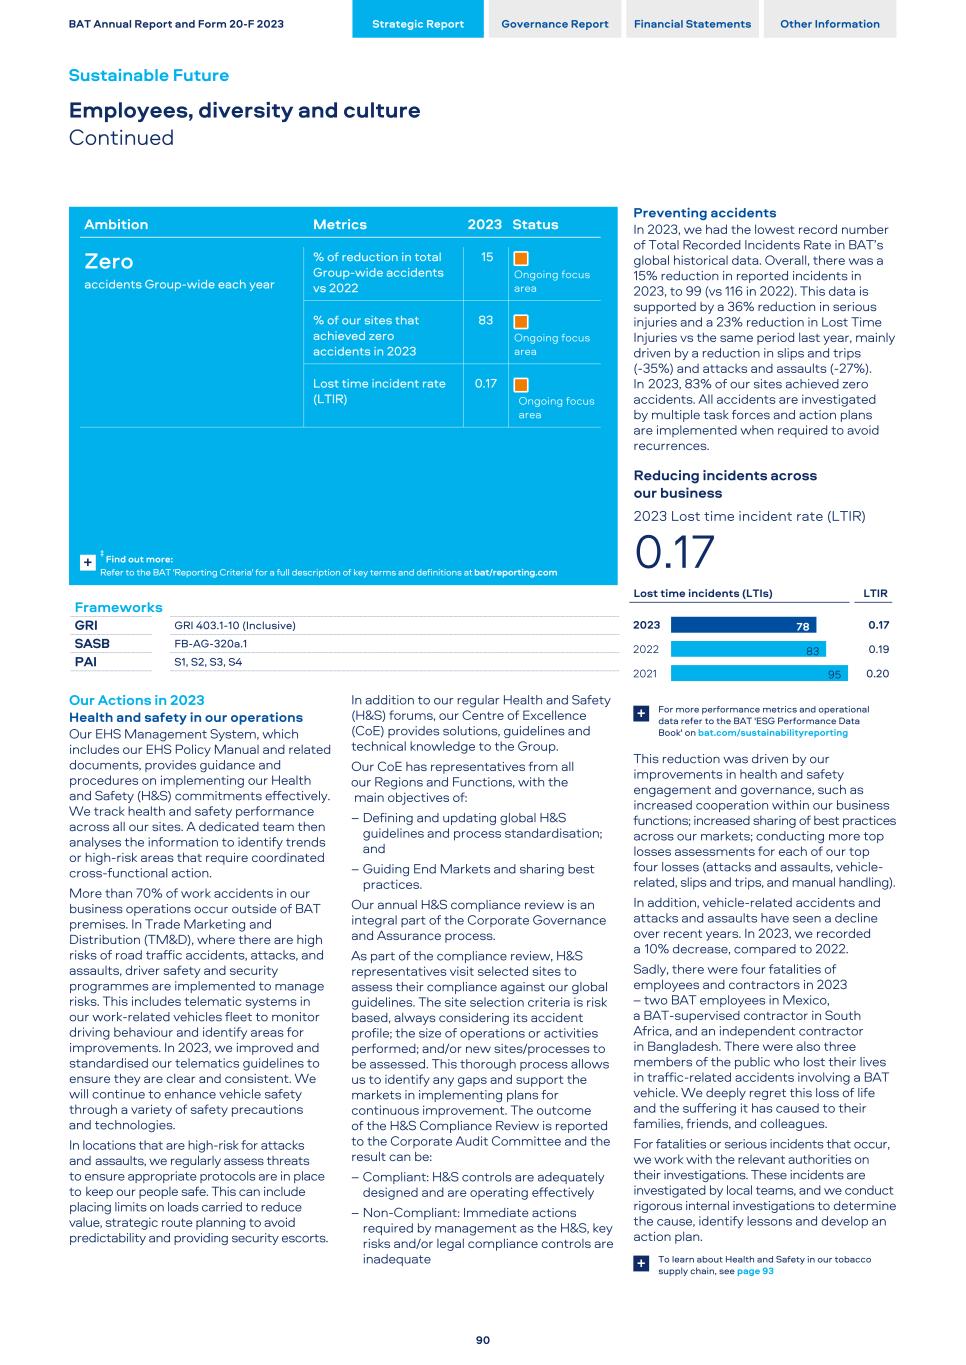
Our Actions in 2023 Health and safety in our operations Our EHS Management System, which includes our EHS Policy Manual and related documents, provides guidance and procedures on implementing our Health and Safety (H&S) commitments effectively. We track health and safety performance across all our sites. A dedicated team then analyses the information to identify trends or high-risk areas that require coordinated cross-functional action. More than 70% of work accidents in our business operations occur outside of BAT premises. In Trade Marketing and Distribution (TM&D), where there are high risks of road traffic accidents, attacks, and assaults, driver safety and security programmes are implemented to manage risks. This includes telematic systems in our work-related vehicles fleet to monitor driving behaviour and identify areas for improvements. In 2023, we improved and standardised our telematics guidelines to ensure they are clear and consistent. We will continue to enhance vehicle safety through a variety of safety precautions and technologies. In locations that are high-risk for attacks and assaults, we regularly assess threats to ensure appropriate protocols are in place to keep our people safe. This can include placing limits on loads carried to reduce value, strategic route planning to avoid predictability and providing security escorts. In addition to our regular Health and Safety (H&S) forums, our Centre of Excellence (CoE) provides solutions, guidelines and technical knowledge to the Group. Our CoE has representatives from all our Regions and Functions, with the main objectives of: – Defining and updating global H&S guidelines and process standardisation; and – Guiding End Markets and sharing best practices. Our annual H&S compliance review is an integral part of the Corporate Governance and Assurance process. As part of the compliance review, H&S representatives visit selected sites to assess their compliance against our global guidelines. The site selection criteria is risk based, always considering its accident profile; the size of operations or activities performed; and/or new sites/processes to be assessed. This thorough process allows us to identify any gaps and support the markets in implementing plans for continuous improvement. The outcome of the H&S Compliance Review is reported to the Corporate Audit Committee and the result can be: – Compliant: H&S controls are adequately designed and are operating effectively – Non-Compliant: Immediate actions required by management as the H&S, key risks and/or legal compliance controls are inadequate Preventing accidents In 2023, we had the lowest record number of Total Recorded Incidents Rate in BAT’s global historical data. Overall, there was a 15% reduction in reported incidents in 2023, to 99 (vs 116 in 2022). This data is supported by a 36% reduction in serious injuries and a 23% reduction in Lost Time Injuries vs the same period last year, mainly driven by a reduction in slips and trips (-35%) and attacks and assaults (-27%). In 2023, 83% of our sites achieved zero accidents. All accidents are investigated by multiple task forces and action plans are implemented when required to avoid recurrences. Reducing incidents across our business 2023 Lost time incident rate (LTIR) 0.17 Lost time incidents (LTIs) LTIR 2023 2022 2021 78 83 95 0.17 0.19 0.20 For more performance metrics and operational data refer to the BAT 'ESG Performance Data Book' on bat.com/sustainabilityreporting + This reduction was driven by our improvements in health and safety engagement and governance, such as increased cooperation within our business functions; increased sharing of best practices across our markets; conducting more top losses assessments for each of our top four losses (attacks and assaults, vehicle- related, slips and trips, and manual handling). In addition, vehicle-related accidents and attacks and assaults have seen a decline over recent years. In 2023, we recorded a 10% decrease, compared to 2022. Sadly, there were four fatalities of employees and contractors in 2023 – two BAT employees in Mexico, a BAT-supervised contractor in South Africa, and an independent contractor in Bangladesh. There were also three members of the public who lost their lives in traffic-related accidents involving a BAT vehicle. We deeply regret this loss of life and the suffering it has caused to their families, friends, and colleagues. For fatalities or serious incidents that occur, we work with the relevant authorities on their investigations. These incidents are investigated by local teams, and we conduct rigorous internal investigations to determine the cause, identify lessons and develop an action plan. To learn about Health and Safety in our tobacco supply chain, see page 93+ BAT Annual Report and Form 20-F 2023 Strategic Report Governance Report Financial Statements Other Information Sustainable Future Employees, diversity and culture Continued 90 Frameworks GRI GRI 403.1-10 (Inclusive) SASB FB-AG-320a.1 PAI S1, S2, S3, S4 Ambition Metrics 2023 Status Zero accidents Group-wide each year % of reduction in total Group-wide accidents vs 2022 15 Ongoing focus area % of our sites that achieved zero accidents in 2023 83 Ongoing focus area Lost time incident rate (LTIR) 0.17 Ongoing focus area ‡ Find out more: Refer to the BAT 'Reporting Criteria' for a full description of key terms and definitions at bat/reporting.com +
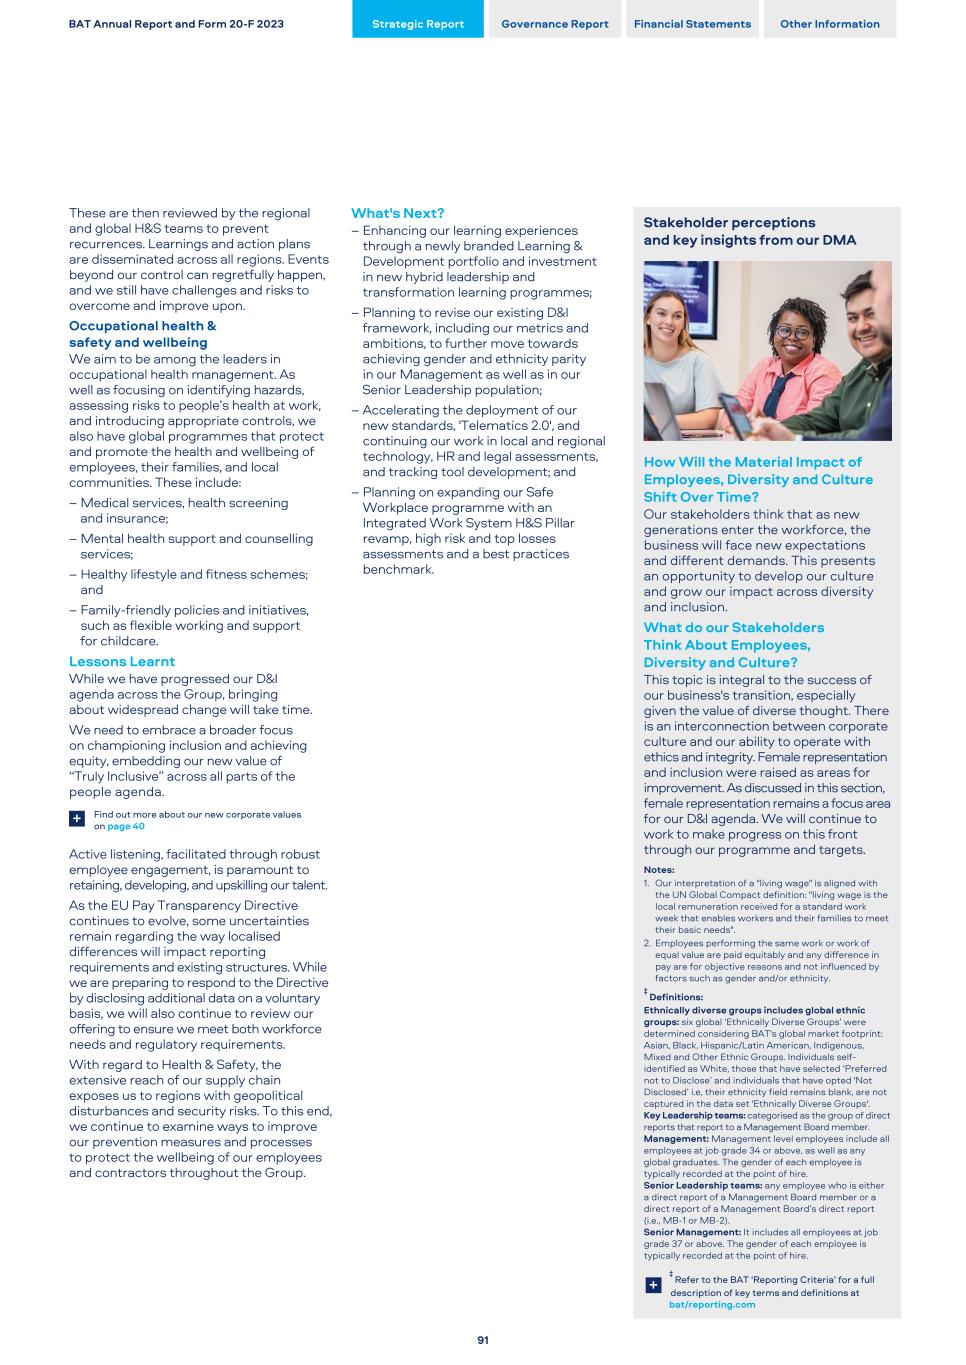
These are then reviewed by the regional and global H&S teams to prevent recurrences. Learnings and action plans are disseminated across all regions. Events beyond our control can regretfully happen, and we still have challenges and risks to overcome and improve upon. Occupational health & safety and wellbeing We aim to be among the leaders in occupational health management. As well as focusing on identifying hazards, assessing risks to people’s health at work, and introducing appropriate controls, we also have global programmes that protect and promote the health and wellbeing of employees, their families, and local communities. These include: – Medical services, health screening and insurance; – Mental health support and counselling services; – Healthy lifestyle and fitness schemes; and – Family-friendly policies and initiatives, such as flexible working and support for childcare. Lessons Learnt While we have progressed our D&I agenda across the Group, bringing about widespread change will take time. We need to embrace a broader focus on championing inclusion and achieving equity, embedding our new value of “Truly Inclusive” across all parts of the people agenda. Find out more about our new corporate values on page 40+ Active listening, facilitated through robust employee engagement, is paramount to retaining, developing, and upskilling our talent. As the EU Pay Transparency Directive continues to evolve, some uncertainties remain regarding the way localised differences will impact reporting requirements and existing structures. While we are preparing to respond to the Directive by disclosing additional data on a voluntary basis, we will also continue to review our offering to ensure we meet both workforce needs and regulatory requirements. With regard to Health & Safety, the extensive reach of our supply chain exposes us to regions with geopolitical disturbances and security risks. To this end, we continue to examine ways to improve our prevention measures and processes to protect the wellbeing of our employees and contractors throughout the Group. What's Next? – Enhancing our learning experiences through a newly branded Learning & Development portfolio and investment in new hybrid leadership and transformation learning programmes; – Planning to revise our existing D&I framework, including our metrics and ambitions, to further move towards achieving gender and ethnicity parity in our Management as well as in our Senior Leadership population; – Accelerating the deployment of our new standards, 'Telematics 2.0', and continuing our work in local and regional technology, HR and legal assessments, and tracking tool development; and – Planning on expanding our Safe Workplace programme with an Integrated Work System H&S Pillar revamp, high risk and top losses assessments and a best practices benchmark. Stakeholder perceptions and key insights from our DMA How Will the Material Impact of Employees, Diversity and Culture Shift Over Time? Our stakeholders think that as new generations enter the workforce, the business will face new expectations and different demands. This presents an opportunity to develop our culture and grow our impact across diversity and inclusion. What do our Stakeholders Think About Employees, Diversity and Culture? This topic is integral to the success of our business's transition, especially given the value of diverse thought. There is an interconnection between corporate culture and our ability to operate with ethics and integrity. Female representation and inclusion were raised as areas for improvement. As discussed in this section, female representation remains a focus area for our D&I agenda. We will continue to work to make progress on this front through our programme and targets. Notes: 1. Our interpretation of a "living wage" is aligned with the UN Global Compact definition: "living wage is the local remuneration received for a standard work week that enables workers and their families to meet their basic needs". 2. Employees performing the same work or work of equal value are paid equitably and any difference in pay are for objective reasons and not influenced by factors such as gender and/or ethnicity. ‡ Definitions: Ethnically diverse groups includes global ethnic groups: six global ‘Ethnically Diverse Groups’ were determined considering BAT's global market footprint: Asian, Black, Hispanic/Latin American, Indigenous, Mixed and Other Ethnic Groups. Individuals self- identified as White, those that have selected ‘Preferred not to Disclose’ and individuals that have opted 'Not Disclosed’ i.e, their ethnicity field remains blank, are not captured in the data set 'Ethnically Diverse Groups'. Key Leadership teams: categorised as the group of direct reports that report to a Management Board member. Management: Management level employees include all employees at job grade 34 or above, as well as any global graduates. The gender of each employee is typically recorded at the point of hire. Senior Leadership teams: any employee who is either a direct report of a Management Board member or a direct report of a Management Board’s direct report (i.e., MB-1 or MB-2). Senior Management: It includes all employees at job grade 37 or above. The gender of each employee is typically recorded at the point of hire. ‡ Refer to the BAT ‘Reporting Criteria’ for a full description of key terms and definitions at bat/reporting.com + BAT Annual Report and Form 20-F 2023 Strategic Report Governance Report Financial Statements Other Information 91
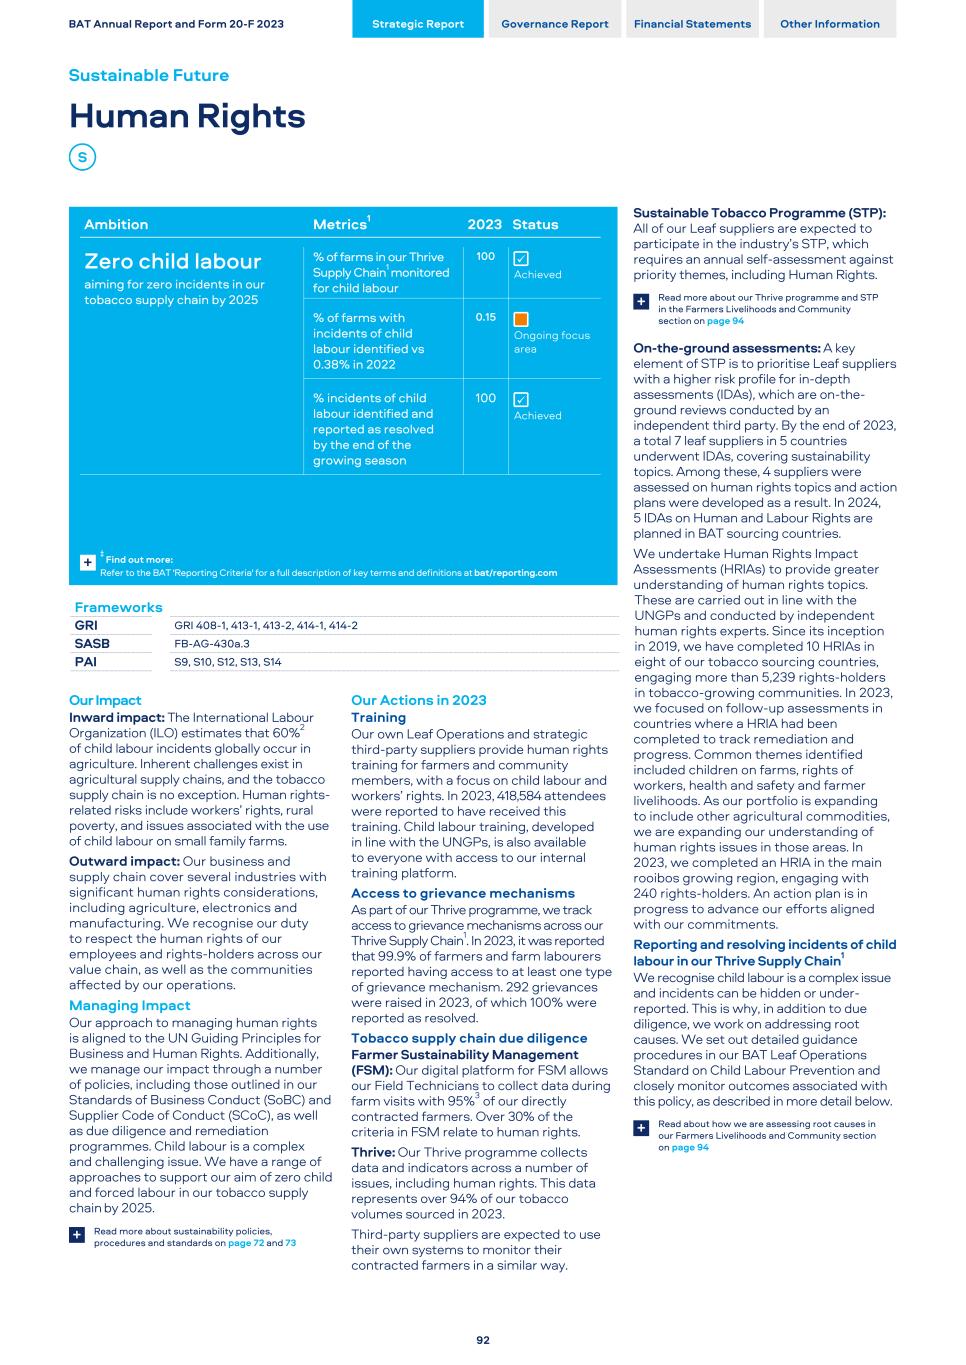
Our Impact Inward impact: The International Labour Organization (ILO) estimates that 60%2 of child labour incidents globally occur in agriculture. Inherent challenges exist in agricultural supply chains, and the tobacco supply chain is no exception. Human rights- related risks include workers’ rights, rural poverty, and issues associated with the use of child labour on small family farms. Outward impact: Our business and supply chain cover several industries with significant human rights considerations, including agriculture, electronics and manufacturing. We recognise our duty to respect the human rights of our employees and rights-holders across our value chain, as well as the communities affected by our operations. Managing Impact Our approach to managing human rights is aligned to the UN Guiding Principles for Business and Human Rights. Additionally, we manage our impact through a number of policies, including those outlined in our Standards of Business Conduct (SoBC) and Supplier Code of Conduct (SCoC), as well as due diligence and remediation programmes. Child labour is a complex and challenging issue. We have a range of approaches to support our aim of zero child and forced labour in our tobacco supply chain by 2025. Read more about sustainability policies, procedures and standards on page 72 and 73+ Our Actions in 2023 Training Our own Leaf Operations and strategic third-party suppliers provide human rights training for farmers and community members, with a focus on child labour and workers’ rights. In 2023, 418,584 attendees were reported to have received this training. Child labour training, developed in line with the UNGPs, is also available to everyone with access to our internal training platform. Access to grievance mechanisms As part of our Thrive programme, we track access to grievance mechanisms across our Thrive Supply Chain1. In 2023, it was reported that 99.9% of farmers and farm labourers reported having access to at least one type of grievance mechanism. 292 grievances were raised in 2023, of which 100% were reported as resolved. Tobacco supply chain due diligence Farmer Sustainability Management (FSM): Our digital platform for FSM allows our Field Technicians to collect data during farm visits with 95%3 of our directly contracted farmers. Over 30% of the criteria in FSM relate to human rights. Thrive: Our Thrive programme collects data and indicators across a number of issues, including human rights. This data represents over 94% of our tobacco volumes sourced in 2023. Third-party suppliers are expected to use their own systems to monitor their contracted farmers in a similar way. Sustainable Tobacco Programme (STP): All of our Leaf suppliers are expected to participate in the industry’s STP, which requires an annual self-assessment against priority themes, including Human Rights. Read more about our Thrive programme and STP in the Farmers Livelihoods and Community section on page 94 + On-the-ground assessments: A key element of STP is to prioritise Leaf suppliers with a higher risk profile for in-depth assessments (IDAs), which are on-the- ground reviews conducted by an independent third party. By the end of 2023, a total 7 leaf suppliers in 5 countries underwent IDAs, covering sustainability topics. Among these, 4 suppliers were assessed on human rights topics and action plans were developed as a result. In 2024, 5 IDAs on Human and Labour Rights are planned in BAT sourcing countries. We undertake Human Rights Impact Assessments (HRIAs) to provide greater understanding of human rights topics. These are carried out in line with the UNGPs and conducted by independent human rights experts. Since its inception in 2019, we have completed 10 HRIAs in eight of our tobacco sourcing countries, engaging more than 5,239 rights-holders in tobacco-growing communities. In 2023, we focused on follow-up assessments in countries where a HRIA had been completed to track remediation and progress. Common themes identified included children on farms, rights of workers, health and safety and farmer livelihoods. As our portfolio is expanding to include other agricultural commodities, we are expanding our understanding of human rights issues in those areas. In 2023, we completed an HRIA in the main rooibos growing region, engaging with 240 rights-holders. An action plan is in progress to advance our efforts aligned with our commitments. Reporting and resolving incidents of child labour in our Thrive Supply Chain1 We recognise child labour is a complex issue and incidents can be hidden or under- reported. This is why, in addition to due diligence, we work on addressing root causes. We set out detailed guidance procedures in our BAT Leaf Operations Standard on Child Labour Prevention and closely monitor outcomes associated with this policy, as described in more detail below. Read about how we are assessing root causes in our Farmers Livelihoods and Community section on page 94 + BAT Annual Report and Form 20-F 2023 Strategic Report Governance Report Financial Statements Other Information Sustainable Future Human Rights 92 Frameworks GRI GRI 408-1, 413-1, 413-2, 414-1, 414-2 SASB FB-AG-430a.3 PAI S9, S10, S12, S13, S14 Ambition Metrics1 2023 Status Zero child labour aiming for zero incidents in our tobacco supply chain by 2025 % of farms in our Thrive Supply Chain1 monitored for child labour 100 ü Achieved % of farms with incidents of child labour identified vs 0.38% in 2022 0.15 Ongoing focus area % incidents of child labour identified and reported as resolved by the end of the growing season 100 ü Achieved ‡ Find out more: Refer to the BAT 'Reporting Criteria' for a full description of key terms and definitions at bat/reporting.com +
Our aim is to have zero child labour in our tobacco supply chain by 2025. In 2023, 359 incidents (2022: 942) of child labour were reported on 0.15% (2022: 0.38%) of farms in our Thrive Supply Chain1, with the majority of incidents relating to harvesting. 100% of incidents were reported as resolved during the growing season. In cases of recurring non-compliance, the farmer’s contract is not renewed for the next growing season. 18 contracts were not renewed in 2023 due to child labour incidents identified. We also continued to build on traceability, leading to a better mapping of the number of farmers supplying tobacco specifically to BAT (rather than our suppliers' total farmer base). We analyse root causes to identify an appropriate approach to remediation and we monitor 100% of our directly contracted farmers on child labour risk and prevention. For example, in Brazil, the school enrolment of farmers' children is a prerequisite for entering into a crop contract with the BAT entity in Brazil. In Pakistan, we have collaborated with an NGO since 2018 to establish 30 summer camps as summer holidays can be a high risk period for child labour. In 2023, 1,800 children were involved. Forced labour in our leaf supply chain Forced labour is also a complex issue that is often hidden and, therefore, often difficult to detect. Our aim is to have zero forced labour incidents in our tobacco supply chain by 2025. There were no forced labour-related non-compliances reported in our Thrive Supply Chain in 2023. Health and safety in the tobacco supply chain Our Operational Standard for personal protective equipment (PPE) in tobacco farming applies to all 91,196 farmers directly contracted by the Group's own Leaf Operations. It outlines the mandatory requirements for PPE for all farmers and their workers. We expect third-parties to adopt similar standards. The PPE must be suitable for agrochemical use and harvesting, Green Tobacco Sickness (GTS) prevention and for different climates and conditions. The document also specifies the training and monitoring requirements for PPE for agrochemical use and GTS prevention. In 2023, 99.99% of our directly contracted farmers and those supplying our strategic third-party suppliers were reported to have sufficient PPE for agrochemical use and 99.7% for use when harvesting. Training sessions on the correct and safe use, storage and disposal of agrochemicals and GTS prevention reached 384,157 attendants. Product material supply chain Before we approve any new suppliers for our non-leaf product materials supply chain, they must undergo an independent due diligence audit aligned to ILO standards. Details of our independent due diligence audits are outlined on pages 100 and 101 within our Supplier Engagement section. + By 2025, we aim for all our product materials and higher-risk indirect suppliers (e.g. machinery and point of sale materials) to have undergone at least one independent labour audit within a three-year cycle. By the end of 2023, this had been achieved for 58.8% of in-scope suppliers. Managing human rights in our direct operations We use Verisk Maplecroft’s human rights indices, including its Modern Slavery Index, to assess the risk level of BAT's direct operations. The outcomes are noted by the Group Corporate Committee and Audit Committee, and by the relevant Regional Audit & Corporate Social Responsibility Committees (RACCs), including actions for any areas for improvement identified. In 2023, 24 countries within BAT's direct operations were identified as higher risk and underwent additional assessments. Human rights in our workplace In 2023, we received 216 reports of alleged SoBC breaches relating to our Respect in the Workplace and Human Rights Policy. Upon investigation, breaches were found to have occurred in 69 cases and actions were taken, including disciplinary actions that resulted in 33 people leaving BAT. In 73 cases, no evidence of wrongdoing was found, and the remaining cases were still under investigation at the end of 2023. Lessons Learnt Given the human rights risks in agricultural supply chains, instances of child and forced labour may arise despite the multi-faceted approach and due diligence processes we have in place. A recent examination of the root causes of child and forced labour has helped us identify best practices and controls. These insights allow us to better address root causes, and contribute to the ongoing efforts to reduce child and forced labour in our supply chain. What's Next? – Undertaking an external review of our due diligence processes and policies across our value chain by independent human rights experts; and – Seeking new opportunities in 2024 to advocate for positive, lasting change with a continued focus on addressing root causes. Stakeholder perceptions and key insights from our DMA What do our Stakeholders Think about Human Rights? While our stakeholders acknowledge our mitigation practices, this topic is seen as an inherent risk and one with potentially significant implications. Key human rights concerns cited include child labour, worker health and safety, and equality. Hence we must strive for continuous improvement and communicate clearly on these topics. How Will the Material Impact of Human Rights Shift Over Time? Incoming human rights regulation is seeking to raise the standards for corporations' actions in this area. Over time, we must continue to strengthen our due diligence processes, remediation procedures and engagement activities to manage our risks effectively and to also ensure compliance with relevant regulations. Notes: 1. Our ambitions cover all tobacco we purchase for our products ('tobacco supply chain'), which is used in our combustibles, traditional oral and Tobacco Heated Products. Our metrics, however, derive data from our annual Thrive assessment, which includes our directly contracted farmers and those of our third-party suppliers, which represented over 94% of the tobacco purchased by volume in 2023 ('Thrive Supply Chain'). 2. International Labour Office and United Nations Children’s Fund, Child Labour: Global estimates 2020, trends and the road forward, ILO and UNICEF, New York, 2021. License: CC BY 4.0. 3. 95% of our contracted farmers are covered by FSM. The remaining 5% are monitored through local monitoring systems. ‡ Definitions: Child Labour: The definition of child labour used to identify child labour incidents is aligned to the International Labour Organization's definition of child labour. ‡ Refer to the BAT ‘Reporting Criteria’ for a full description of key terms and definitions at bat/reporting.com + BAT Annual Report and Form 20-F 2023 Strategic Report Governance Report Financial Statements Other Information 93
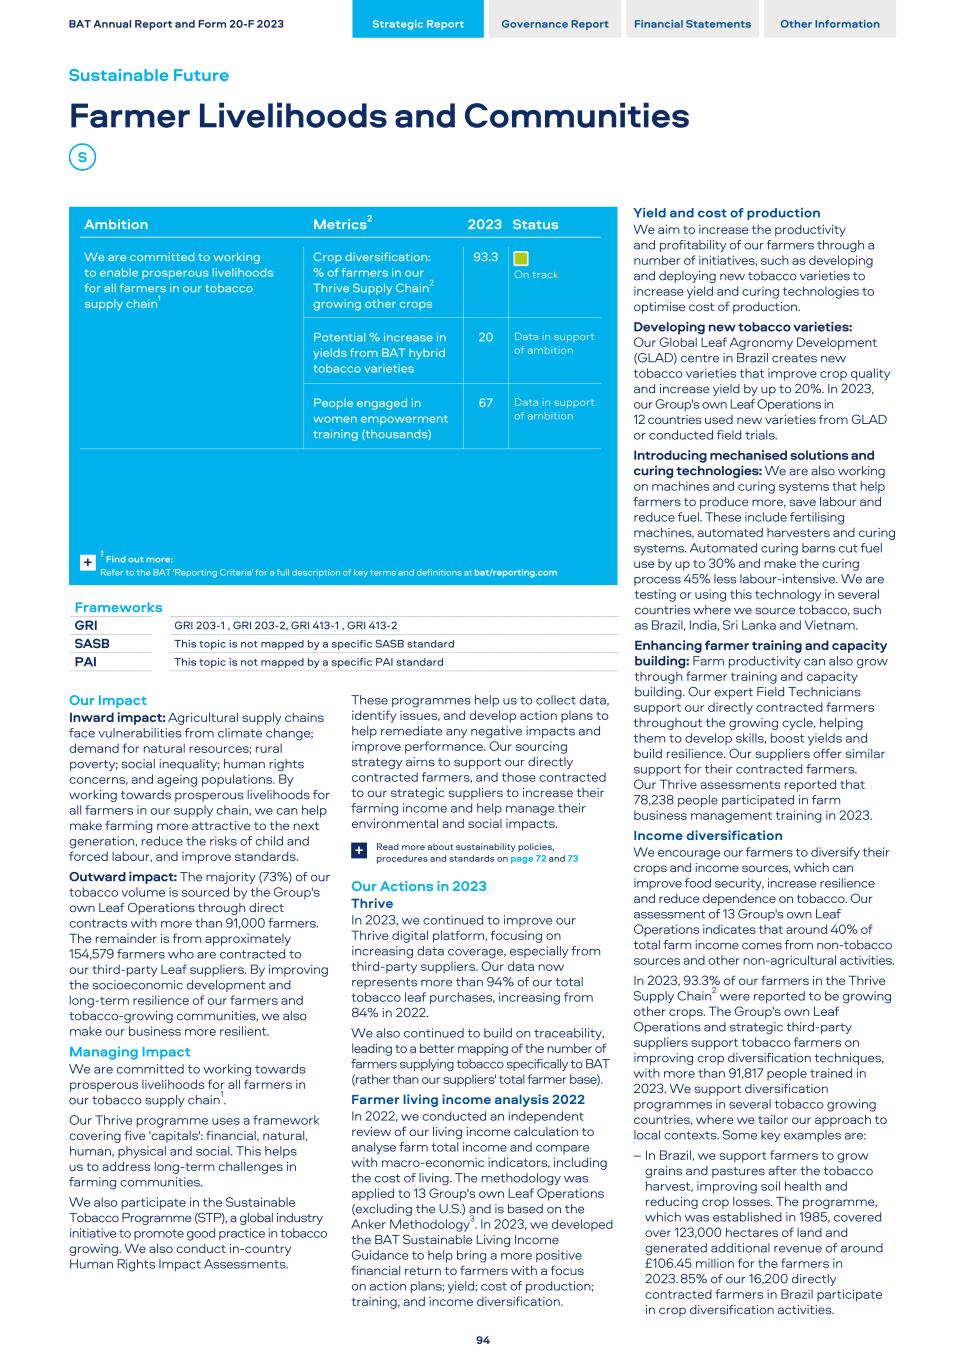
Our Impact Inward impact: Agricultural supply chains face vulnerabilities from climate change; demand for natural resources; rural poverty; social inequality; human rights concerns, and ageing populations. By working towards prosperous livelihoods for all farmers in our supply chain, we can help make farming more attractive to the next generation, reduce the risks of child and forced labour, and improve standards. Outward impact: The majority (73%) of our tobacco volume is sourced by the Group's own Leaf Operations through direct contracts with more than 91,000 farmers. The remainder is from approximately 154,579 farmers who are contracted to our third-party Leaf suppliers. By improving the socioeconomic development and long-term resilience of our farmers and tobacco-growing communities, we also make our business more resilient. Managing Impact We are committed to working towards prosperous livelihoods for all farmers in our tobacco supply chain1. Our Thrive programme uses a framework covering five 'capitals': financial, natural, human, physical and social. This helps us to address long-term challenges in farming communities. We also participate in the Sustainable Tobacco Programme (STP), a global industry initiative to promote good practice in tobacco growing. We also conduct in-country Human Rights Impact Assessments. These programmes help us to collect data, identify issues, and develop action plans to help remediate any negative impacts and improve performance. Our sourcing strategy aims to support our directly contracted farmers, and those contracted to our strategic suppliers to increase their farming income and help manage their environmental and social impacts. Read more about sustainability policies, procedures and standards on page 72 and 73+ Our Actions in 2023 Thrive In 2023, we continued to improve our Thrive digital platform, focusing on increasing data coverage, especially from third-party suppliers. Our data now represents more than 94% of our total tobacco leaf purchases, increasing from 84% in 2022. We also continued to build on traceability, leading to a better mapping of the number of farmers supplying tobacco specifically to BAT (rather than our suppliers' total farmer base). Farmer living income analysis 2022 In 2022, we conducted an independent review of our living income calculation to analyse farm total income and compare with macro-economic indicators, including the cost of living. The methodology was applied to 13 Group's own Leaf Operations (excluding the U.S.) and is based on the Anker Methodology3. In 2023, we developed the BAT Sustainable Living Income Guidance to help bring a more positive financial return to farmers with a focus on action plans; yield; cost of production; training, and income diversification. Yield and cost of production We aim to increase the productivity and profitability of our farmers through a number of initiatives, such as developing and deploying new tobacco varieties to increase yield and curing technologies to optimise cost of production. Developing new tobacco varieties: Our Global Leaf Agronomy Development (GLAD) centre in Brazil creates new tobacco varieties that improve crop quality and increase yield by up to 20%. In 2023, our Group's own Leaf Operations in 12 countries used new varieties from GLAD or conducted field trials. Introducing mechanised solutions and curing technologies: We are also working on machines and curing systems that help farmers to produce more, save labour and reduce fuel. These include fertilising machines, automated harvesters and curing systems. Automated curing barns cut fuel use by up to 30% and make the curing process 45% less labour-intensive. We are testing or using this technology in several countries where we source tobacco, such as Brazil, India, Sri Lanka and Vietnam. Enhancing farmer training and capacity building: Farm productivity can also grow through farmer training and capacity building. Our expert Field Technicians support our directly contracted farmers throughout the growing cycle, helping them to develop skills, boost yields and build resilience. Our suppliers offer similar support for their contracted farmers. Our Thrive assessments reported that 78,238 people participated in farm business management training in 2023. Income diversification We encourage our farmers to diversify their crops and income sources, which can improve food security, increase resilience and reduce dependence on tobacco. Our assessment of 13 Group's own Leaf Operations indicates that around 40% of total farm income comes from non-tobacco sources and other non-agricultural activities. In 2023, 93.3% of our farmers in the Thrive Supply Chain2 were reported to be growing other crops. The Group's own Leaf Operations and strategic third-party suppliers support tobacco farmers on improving crop diversification techniques, with more than 91,817 people trained in 2023. We support diversification programmes in several tobacco growing countries, where we tailor our approach to local contexts. Some key examples are: – In Brazil, we support farmers to grow grains and pastures after the tobacco harvest, improving soil health and reducing crop losses. The programme, which was established in 1985, covered over 123,000 hectares of land and generated additional revenue of around £106.45 million for the farmers in 2023. 85% of our 16,200 directly contracted farmers in Brazil participate in crop diversification activities. BAT Annual Report and Form 20-F 2023 Strategic Report Governance Report Financial Statements Other Information Sustainable Future Farmer Livelihoods and Communities 94 Frameworks GRI GRI 203-1 , GRI 203-2, GRI 413-1 , GRI 413-2 SASB This topic is not mapped by a specific SASB standard PAI This topic is not mapped by a specific PAI standard Ambition Metrics2 2023 Status We are committed to working to enable prosperous livelihoods for all farmers in our tobacco supply chain1 Crop diversification: % of farmers in our Thrive Supply Chain2 growing other crops 93.3 On track Potential % increase in yields from BAT hybrid tobacco varieties 20 Data in support of ambition People engaged in women empowerment training (thousands) 67 Data in support of ambition ‡ Find out more: Refer to the BAT 'Reporting Criteria' for a full description of key terms and definitions at bat/reporting.com +
– In Kenya, we aim to promote farmer food security and reduce dependency on tobacco. In 2023, 100% of the farmers directly contracted by BAT Kenya participated in diversification activities, such as growing avocados in regions with sufficient rainfall, which can provide a significant additional future income.  – In Sri Lanka, we provide free seeds of cereals and vegetables to contracted farmers and community members, enabling them to grow their own food and earn extra money. The programme benefited 5,020 people in 2023 and generated an additional income of US$ 490,361. Building community resilience Our community programmes cover issues ranging from women’s empowerment and rural development to providing access to healthcare, clean water and sanitation. For example, our mobile doctor units in Pakistan, operational since 1985, provided healthcare services to more than 100,000 people in remote tobacco-growing communities to date. In Bangladesh, we installed 119 water filtration plants since 2009, providing more than 595,000 litres of safe drinking water per day to more than 290,000 people. This included 7,000 new beneficiaries in 2023. Our Women Empowerment Programme Lack of women’s empowerment in rural communities is one of the root causes of child and forced labour. As reported in Thrive, women's empowerment training reached more than 67,186 people in 2023. Below are some examples of achievements in 2023. – The Women Empowerment Programme in Pakistan trained 11,387 rural women to boost their family income. 100% of the contracted farmers had at least one female family member trained (wives, daughters, sisters or mothers), an increase from 77% in 2022. – Women's empowerment training programmes by 17 Thrive suppliers. In 2023, we reviewed our existing approach and developed a Women’s Empowerment Framework, which we will continue to build and implement. This includes: – Women’s and girls’ welfare and health; capacity building; – Creating opportunities to improve livelihoods; and – Addressing cultural barriers and more. Read about our women empowerment programmes at bat.com/womenempowerment+ Lessons Learnt BAT has worked with farming communities for many years and through our Thrive assessments, and other programmes, we have learnt that a long-term, collaborative approach that accounts for local conditions and impacts, can be the most challenging but is also the most successful in improving farmer livelihoods. We are learning more about the interconnectivity of environmental issues and human rights, working in areas such as climate change and biodiversity, in order to increase environmental and economic resilience for farmers and rural communities. What's Next? – Continuing to focus on living income action plans, diversification and ongoing training for directly contracted farmers; – Addressing the systemic issues that impact the communities by taking a holistic approach to advance gender equality through our new Women’s Empowerment Framework; – Continuing to explore new partnerships to positively impact farmer livelihoods and build community resilience. Stakeholder perceptions and key insights from our DMA What do our Stakeholders Think About Farmer Livelihoods? While this topic remains highly important to BAT, the inward and outward impact of this issue is seen to be lower than other topics in relative terms. As we still very much rely on tobacco growing, stakeholders expect our efforts to have a positive impact on the socio-economic wellbeing of farmers and affected communities. How Will the Material Impact of Farmer Livelihoods Shift Over Time? The transition to New Category products and the associated decrease in tobacco demand will undeniably impact farmers over time. As the number of contracted farmers decreases, we must continue to strengthen our mitigation measures to minimise negative impacts on the livelihoods of farmers and affected communities, and allow for a sustainable transition. Notes: 1. This is our ambition, which covers all tobacco we purchase for our products (‘tobacco supply chain’); which is used in our combustibles, Traditional Oral and Tobacco Heated Products. 2. Our metrics derive data from our annual Thrive assessment, which includes our directly contracted farmers and those of our third-party suppliers, which represented over 94% of the tobacco we purchased by volume in 2023 (‘Thrive Supply Chain’). 3. https://www.living-income.com/measurement- living-income. BAT Annual Report and Form 20-F 2023 Strategic Report Governance Report Financial Statements Other Information 95
Our Impact Inward impact: Marketing freedoms with respect to our New Category products are critical for our ability to deliver on Tobacco Harm Reduction (THR). Through communicating and raising awareness around reduced-risk products*†, we can support the acceleration in reduction in smoking rates and, in turn, smoking- related diseases. Outward impact: We can only achieve sustainable, long-term growth as a business through responsible marketing of our products. We communicate that tobacco and nicotine products are for adults only. We recognise concerns regarding underage consumption, particularly with respect to Vapour products. We emphasise the need for clear and meaningful product information, while also focusing on preventing underage access. Managing Impact Our approach to responsible marketing is governed by our International Marketing Principles (IMP), which apply to all BAT entities and marketing suppliers. These principles emphasise responsible, accurate, and adult-targeted marketing. They apply even when they are stricter than local legal standards. During 2023, the Board reviewed and approved new Responsible Marketing Principles which will be implemented in 2024. A crucial aspect of responsible marketing is underage access prevention (UAP), supported by guidelines and toolkits in all our markets, including third-party distribution channels. All our marketing suppliers are held to the same standards. Their compliance with the IMP is explicitly required in our contracts, as well as through the Supplier Code of Conduct (SCoC). Read more about sustainability policies, procedures and standards on page 72 and 73+ Our Actions in 2023 Reporting and resolving incidents of non-compliance In 2023, we identified 3 incidents of non- compliance with marketing regulations resulting in a fine or penalty and 0 incidents of non-compliance with regulations resulting in a regulatory warning. Any allegations of non-compliance are managed and escalated by the relevant market. Regional Heads of Legal who report any relevant findings to the Regional Audit Committee and remediation actions are implemented, as appropriate. Evolving our approach to responsible marketing We regularly review our marketing practices to ensure they remain fit for purpose and reflect developments in marketing, our product portfolio, technology, evolving regulatory developments and stakeholder expectations. In 2023, we initiated a project to review and refresh our IMP and supporting frameworks. In 2024, we plan to launch refreshed principles and publish the supporting frameworks, providing transparency on our standards and commitments to responsible marketing and UAP. Our ongoing iCommit training programme iCommit is our training programme for responsible marketing, covering key measures for ensuring IMP and UAP compliance across all channels. In 2023, we incorporated iCommit into the onboarding process for all new employees and the key components into the Standards of Business Conduct (SoBC) mandatory annual sign-off, to provide a refresher for all employees. All new employees to our partner marketing agencies are also asked to complete the training as part of onboarding. In 2023, we achieved 100% iCommit completion rate. For more information about our SoBC sign-off, please see page 98+ Setting standards for retailers Our UAP Guidelines mandate that each market has a UAP programme in place. We conduct engagement activities with physical and e-commerce third-party retail customers and distributors to uphold BAT's responsible marketing standards. Examples of engagement include providing training and signage with UAP messaging to retailers. Marketing in a digital age Our e-commerce and social media channels play an important role in digitising our business. We seek to approach these channels in a responsible way and in accordance with our responsible marketing standards and processes, including those relating to UAP. We do not use open social media for our combustibles brands. We only use social media sites where the majority of users are adults. Our social media accounts, and our paid content on these platforms, are only visible to users who have confirmed they are adults. Where we use social media partnerships to promote New Category products, we select third party partners where their audience is predominately adult. Our Digital Marketing Hub continues to provide guidance on how to achieve long-term consumer satisfaction and product awareness in a responsible way. In our own e-commerce channels, we implemented digital age-verification solutions. For instance, in the UK, France and Ireland, we use a privacy-focused facial age estimation technology to age-verify customers in our own e-commerce channels. We also have pilots in place in some of our physical stores in the UK and Norway using the same technology. In the U.S., we sponsor TrueAge™, a digital ID check solution that enhances the accuracy of age-verification when purchasing age-restricted products in stores. BAT Annual Report and Form 20-F 2023 Strategic Report Governance Report Financial Statements Other Information Sustainable Future Marketing and Communications 96 Frameworks GRI GRI 417-2, GRI 417-3 SASB FB-TB-270.a.1, FB-TB-270.a.2 PAI This topic is not mapped by a specific PAI indicator Ambition Metrics 2023 Status Full compliance with marketing regulations Incidents of non- compliance with regulations resulting in regulatory warning1 0 Ongoing focus area Incidents of non- compliance with regulations resulting in a fine or penalty1,2 3 Ongoing focus area ‡ Find out more: Refer to the BAT 'Reporting Criteria' for a full description of key terms and definitions at bat/reporting.com +
Monitoring social media marketing The Digital Confidence Unit (DCU) is dedicated to monitoring social media content 24/7 for compliance and reputational management purposes. To provide central oversight of our social media posts, the team reviews our social media posts to check for compliance with our IMP and UAP guidelines. The DCU engages with markets, as appropriate, to ensure swift remediation of any incidents identified. Committed to communicating transparently We continue to strive for our communication and marketing initiatives to be responsible across all channels, paying close attention to how, what and with whom we communicate. This approach also extends to the quality of our data and associated disclosures in relation to sustainability. Any claims and statements in our communications undergo an established review and sign-off process that involves representatives from all relevant functions, including the Legal function. For example, in order to improve the accuracy of and to help substantiate the sustainability claims for our products, we work closely with our suppliers to obtain information regarding the materials and processes used, and carry out checks to verify the accuracy of the contents. Lessons Learnt In recent years, concerns have been raised by our stakeholders, including regulators, regarding certain marketing practices of others within the tobacco and nicotine industry, such as marketing that appears to target the underage and the sale of non-compliant products through unregulated channels. We are committed to marketing our products responsibly. We strive to elevate industry standards through our responsible marketing and underage access prevention practices. We have sought to proactively engage with relevant authorities to address irresponsible marketing practices. While we impose high standards on our retailers through our SCoC, our ability to directly control their impacts is constrained. For retailers, non-compliance cases are handled locally and involve measures such as training, warnings and penalties. We will continue to work with our customers and retailers to raise awareness on the importance of underage access prevention. What's Next? – Planning to launch our refreshed Responsible Marketing Principles and Responsible Marketing Code. The rollout will include training for all employees and third parties involved in the development, marketing and sales of our products (see Our Responsible Marketing Strategy at page 96); – Planning to strengthen underage access prevention measures, as well as engaging further with regulators and retailers across our markets to support education, engagement and enforcement to prevent underage access to tobacco and nicotine products; and – Continuing to invest in innovative third- party technologies to mitigate risks relating to underage access, such as computer vision and artificial intelligence (AI) to strengthen the age verification process across our e-commerce channels and retail stores. Stakeholder perceptions and key insights from our DMA What do our Stakeholders Think About Marketing and Communications? Our stakeholders believe that not managing marketing and communications responsibly will have a high impact on our social license to operate. They also acknowledge that regulatory restrictions can limit our ability to inform adult smokers about our products. How Will the Material Impact of Marketing and Communications Shift Over Time? Limitations imposed by regulatory restrictions on tobacco and nicotine products could present a competitive disadvantage for our business over time. Moreover, underage access of New Category products was raised as an issue of increasing severity, and it is a topic that stakeholders, regulators and the media are watching keenly. We discuss our actions to tackle this issue in the Our Actions in 2023 and What's Next sections above. Notes: 1. Incidents of non-compliance with regulations that result in warning or in fine or penalty are dealt with at End Market level. To collect the 'Incidents of non- compliance with regulations resulting in warning/ fine or penalty' compliance data, the local teams are asked to report any instances or potential instances of breach, which may include allegations of inappropriate marketing, or investigations regarding marketing non-compliance that they are aware of in their market. 2. In line with a reclassification of 'ongoing incidents' (which, from 2023 reporting will be included as an 'incident' when the final decision is issued). The 2022 number has been restated (three previously reported for 2022). * Based on the weight of evidence and assuming a complete switch from cigarette smoking. These products are not risk free and are addictive. † Our Vapour product Vuse (including Alto, Solo, Ciro and Vibe), and certain products, including Velo, Grizzly, Kodiak, and Camel Snus, which are sold in the U.S., are subject to FDA regulation and no reduced- risk claims will be made as to these products without agency clearance. BAT Annual Report and Form 20-F 2023 Strategic Report Governance Report Financial Statements Other Information 97
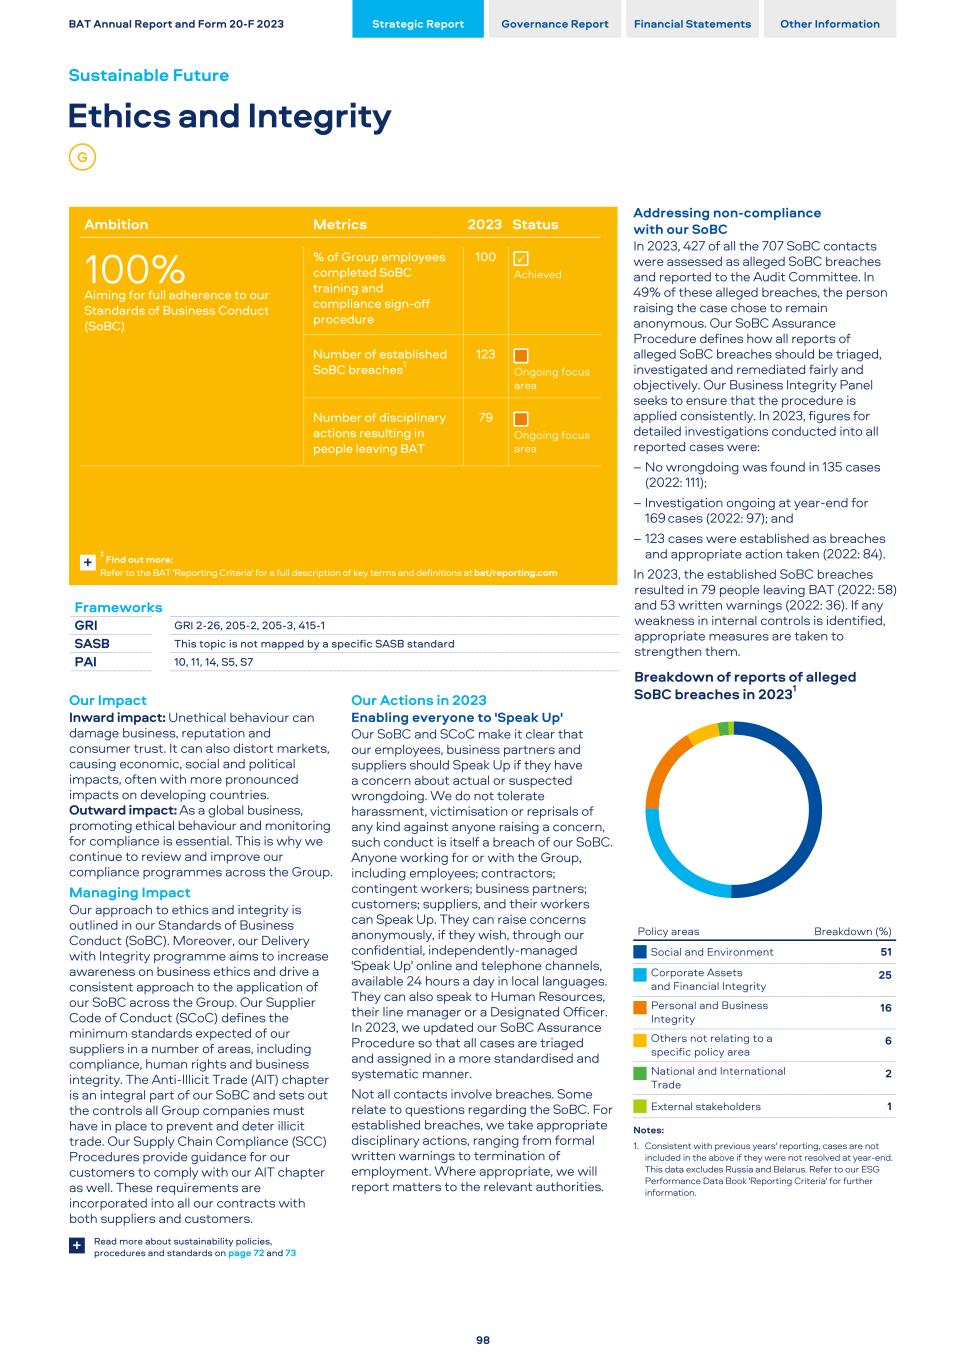
Our Impact Inward impact: Unethical behaviour can damage business, reputation and consumer trust. It can also distort markets, causing economic, social and political impacts, often with more pronounced impacts on developing countries. Outward impact: As a global business, promoting ethical behaviour and monitoring for compliance is essential. This is why we continue to review and improve our compliance programmes across the Group. Managing Impact Our approach to ethics and integrity is outlined in our Standards of Business Conduct (SoBC). Moreover, our Delivery with Integrity programme aims to increase awareness on business ethics and drive a consistent approach to the application of our SoBC across the Group. Our Supplier Code of Conduct (SCoC) defines the minimum standards expected of our suppliers in a number of areas, including compliance, human rights and business integrity. The Anti-Illicit Trade (AIT) chapter is an integral part of our SoBC and sets out the controls all Group companies must have in place to prevent and deter illicit trade. Our Supply Chain Compliance (SCC) Procedures provide guidance for our customers to comply with our AIT chapter as well. These requirements are incorporated into all our contracts with both suppliers and customers. Read more about sustainability policies, procedures and standards on page 72 and 73+ Our Actions in 2023 Enabling everyone to 'Speak Up' Our SoBC and SCoC make it clear that our employees, business partners and suppliers should Speak Up if they have a concern about actual or suspected wrongdoing. We do not tolerate harassment, victimisation or reprisals of any kind against anyone raising a concern, such conduct is itself a breach of our SoBC. Anyone working for or with the Group, including employees; contractors; contingent workers; business partners; customers; suppliers, and their workers can Speak Up. They can raise concerns anonymously, if they wish, through our confidential, independently-managed 'Speak Up' online and telephone channels, available 24 hours a day in local languages. They can also speak to Human Resources, their line manager or a Designated Officer. In 2023, we updated our SoBC Assurance Procedure so that all cases are triaged and assigned in a more standardised and systematic manner. Not all contacts involve breaches. Some relate to questions regarding the SoBC. For established breaches, we take appropriate disciplinary actions, ranging from formal written warnings to termination of employment. Where appropriate, we will report matters to the relevant authorities. Addressing non-compliance with our SoBC In 2023, 427 of all the 707 SoBC contacts were assessed as alleged SoBC breaches and reported to the Audit Committee. In 49% of these alleged breaches, the person raising the case chose to remain anonymous. Our SoBC Assurance Procedure defines how all reports of alleged SoBC breaches should be triaged, investigated and remediated fairly and objectively. Our Business Integrity Panel seeks to ensure that the procedure is applied consistently. In 2023, figures for detailed investigations conducted into all reported cases were: – No wrongdoing was found in 135 cases (2022: 111); – Investigation ongoing at year-end for 169 cases (2022: 97); and – 123 cases were established as breaches and appropriate action taken (2022: 84). In 2023, the established SoBC breaches resulted in 79 people leaving BAT (2022: 58) and 53 written warnings (2022: 36). If any weakness in internal controls is identified, appropriate measures are taken to strengthen them. Breakdown of reports of alleged SoBC breaches in 20231 Policy areas Breakdown (%) Social and Environment 51 Corporate Assets and Financial Integrity 25 Personal and Business Integrity 16 Others not relating to a specific policy area 6 National and International Trade 2 External stakeholders 1 Notes: 1. Consistent with previous years' reporting, cases are not included in the above if they were not resolved at year-end. This data excludes Russia and Belarus. Refer to our ESG Performance Data Book 'Reporting Criteria' for further information. BAT Annual Report and Form 20-F 2023 Strategic Report Governance Report Financial Statements Other Information Sustainable Future Ethics and Integrity 98 Frameworks GRI GRI 2-26, 205-2, 205-3, 415-1 SASB This topic is not mapped by a specific SASB standard PAI 10, 11, 14, S5, S7 Ambition Metrics 2023 Status 100% Aiming for full adherence to our Standards of Business Conduct (SoBC) % of Group employees completed SoBC training and compliance sign-off procedure 100 ü Achieved Number of established SoBC breaches1 123 Ongoing focus area Number of disciplinary actions resulting in people leaving BAT 79 Ongoing focus area ‡ Find out more: Refer to the BAT 'Reporting Criteria' for a full description of key terms and definitions at bat/reporting.com +
Preventing non-compliance Our Sanctions Compliance Procedure and Third-Party Anti-Financial Crime Procedure create a comprehensive framework to promote compliance with a range of legal and regulatory requirements applicable to the Group. In 2023, our Global Sanctions e-learning programme was completed by approximately 22,000 employees. It is designed to support employees to build confidence in identifying key sanctions compliance risks. In addition, we have updated our employee onboarding protocol by including a requirement to complete an e-Induction on our SoBC within four weeks of commencing employment. We have also updated our retailers’ onboarding protocol and framework to enable the detection of retailers’ potential exposure to sanctions and risks. With this new protocol, customers (e.g. retailers and distributors) are screened before onboarding to allow for better risk management. As set out in our M&A Transactions Compliance Procedure, our due diligence procedures for mergers, acquisitions and corporate ventures include human rights and modern slavery checks. If risks are identified, mitigation steps are taken as appropriate. Further, we invested in technology-driven solutions to refine our compliance platforms. For example, we enhanced our Delivery with Integrity programme by implementing continuous real-time screening for all business partners. Preventing and tackling illicit trade in tobacco products Focusing and maintaining controls to prevent diversion of our products is a key component in our fight against illicit trade. We have a dedicated Forensic and Compliance Team (FaCT) that analyse seized products, determine counterfeits and identify illicit machinery used in their production. In addition, they maintain supply chain controls through a seizure management process tailored to satisfy our contractual and regulatory obligations. The team is also instrumental in conducting Empty Pack Survey (EPS), a global anti-illicit trade research programme that provides insight into illicit trade incidences. Last year, more than 40 markets participated in approximately 80 surveys. We continue to strengthen our AIT approach by reviewing our existing obligations followed by regular updates of our Policies and Procedures. This year, we launched the SCC Procedures App, which seeks to ensure that a consistent approach is taken across all BAT operating companies. We also streamlined the AIT self-risk assessment process to allow for evaluation of our supply chain risks globally as well as in individual markets. Amongst other supply chain controls, we roll out a dedicated eLearning programme to all relevant employees every year. The completion rate for the 2023 SCC Procedures eLearning was above 99% across the Group. Regulation and engagement 'Lobbying and Engagement' and 'Political Contributions' are chapters of our SoBC, which is implemented by all Group companies and applicable to all our employees. These policies require all our engagement activities with external stakeholders to be conducted with transparency, openness and integrity. For global regulatory priorities, the views we advocate are the same as those we publish on our website, and we have long supported the OECD’s Principles for Transparency and Integrity in Lobbying. We also respect the call for transparent and accountable interaction between governments and relevant stakeholders, including the tobacco industry, established in Article 5.3 of the World Health Organization’s Framework Convention on Tobacco Control. We are open about what we think, and always try to offer constructive solutions that will best meet the objectives of regulation, while minimising any negative unintended consequences. Regulatory engagement by our businesses is monitored throughout the year by our Regional Audit and CSR Committees. Lessons Learnt In recent years, the evolving stakeholder expectations and regulations have made it imperative for businesses to embrace heightened transparency across all facets of their operations. As a company navigating diverse jurisdictions, the call for transparency and integrity becomes even more important. To remain a trusted organisation, we recognise the need to champion transparency. What's Next? – Continuing to refine our Speak Up system to increase employees' trust in the system; and – Innovating on our compliance monitoring through technology that enables us to analyse data from our systems and generate insights and foresights. Find details of our other governance priorities, including data privacy and cyber security on pages ## and ## + Stakeholder perceptions and key insights from our DMA What do our Stakeholders Think About Ethics and Integrity? Stakeholders considered that this presented important risks for our business, as well as opportunities. They acknowledged and applauded the mitigation measures that we have put in place, but also noted the need to remain vigilant and refresh our mitigation measures as appropriate. How Will the Material Impact of Ethics and Integrity Shift Over Time? The current inward impact of this topic on our business is significant. While Ethics and Integrity remains crucial to our license to operate and corporate culture, its inward impact may reduce over time as we continue to improve upon and leverage due diligence processes we have put in place. BAT Annual Report and Form 20-F 2023 Strategic Report Governance Report Financial Statements Other Information 99
Our Impact Inward impact: We have a relationship with 1,300 direct and 32,500 indirect product material suppliers. Our suppliers’ environmental and social performance is critical to meeting our own social and environmental targets. Proactively engaging with our suppliers and working with them to build capability contributes to the Group’s overall success. Outward impact: We strive to be a positive influence on how our suppliers approach sustainability, including how they manage environmental, human rights and health and safety risks. As valued business partners, it is crucial to listen to and engage with our suppliers to build trust and drive progress. Managing our Impact Our approach to Supplier Engagement is set out in our Supplier Code of Conduct (SCoC). It defines the minimum standards we expect from our suppliers in supplying goods or services to BAT or its Group companies and complements our Standards of Business Conduct (SoBC). To meet our sustainability goals, we particularly focus our supplier engagements on human rights and climate change, and we have set our Supplier Engagement targets in these areas. Read more about sustainability policies, procedures and standards on pages 72 and 73+ Our Actions in 2023 Engaging with direct and indirect suppliers on climate change We continue to make progress on our SBTi supplier engagement goal, which is for 20% of suppliers of purchased goods and services by spend, to set Science- Based Targets (SBTs) by 2025. This year, we are more than halfway to achieving this goal, with 15% of such suppliers having SBTs in place. We continued to invest in our supplier enablement programme, which helps our suppliers to improve their environmental performance and data quality. Examples of our achievements include: – Working with our top 60 CO2e emitting suppliers to share best practices and insights on reducing their carbon footprint, based on our own carbon reduction programme. – Providing one-to-one training on renewable energy in our New Category supply chain, which has led to an increase in our suppliers' procuring renewable energy, backed by iREC certificates. – Holding sustainability-focused supplier events in Bangladesh and Pakistan to help our suppliers build the capabilities to manage local challenges in these key geographies. Our efforts have resulted in suppliers implementing their own low carbon initiatives such as lower carbon generation, setting emission baselines, and reporting and tracking emissions – many of them did it for the first time in 2023. Additionally, we invited more than 600 suppliers representing 92% of our purchased goods and services emissions, to respond to the CDP Supply Chain programme. The data we collect from our suppliers through the programme enables us to better understand our wider environmental impact and set targets. We recorded a 92%1 response rate, which is above the average industry response rate of 59%. This level of engagement is almost a threefold increase in comparison to 2022 (over 200 suppliers) and builds upon our recognition as a Supply Chain Engagement Leader by CDP in 2022. Throughout the disclosure cycle, we invited our suppliers to multiple capability building webinars. Details of our carbon reduction programme can be found in our Low Carbon Transition Plan+ Human rights programme and capability In 2023, we developed a tracking and monitoring tool, which allows BAT’s procurement teams to have greater visibility of our Social Due Diligence programme. We also provided training to our procurement teams on the tool, raising social awareness and building capability in our value chain. Sharing our learnings beyond our supply chain As a member of The Sustainable Procurement Pledge, we joined other professionals, academics and practitioners to share and learn best practice in responsible sourcing practices; and in partnership with Gartner (one of the leading sustainability consultancies), we took part in their Supply Chain podcast series, sharing our insights on how to drive organisational success. Social due diligence in our product material supply chain Adherence to the SCoC is mandatory in all sourcing processes and sets the guidelines and standards for all our suppliers to conduct their operations in a responsible and ethical manner. Any new product materials supply chain suppliers must undergo an independent due diligence audit aligned to ILO standards and achieve a score of 70% to qualify. Existing suppliers are assessed using a risk-based approach, depending on their category and risk level. All New Category and high-risk direct material suppliers undergo on-site audits by Intertek. The assessment criteria include labour, wages and hours, health and safety, environment and management systems. All other suppliers undertake self-assessments by EcoVadis to evaluate their performance in areas such as environment, labour and human rights, and ethics. All New Category Tier 1 suppliers are audited on a annual basis. BAT Annual Report and Form 20-F 2023 Strategic Report Governance Report Financial Statements Other Information Sustainable Future Supplier Engagement 100 Frameworks GRI GRI 308-1, 414-1, 414-2 SASB FB-AG-430a.2 PAI S4 Targets Metrics 2023 Status 100% of product materials and high-risk indirect suppliers to have undergone at least one independent labour audit within a three-year cycle by 2025 % of product materials and high-risk indirect suppliers to have undergone at least one independent labour audit within a three- year cycle 58.8 On track 20% of suppliers of purchased goods and services by spend, to set Science-Based Targets (SBTs) by 2025 % of suppliers of purchased goods and services by spend to set Science-Based Targets (SBTs) by 2025 15 On track ‡ Find out more: Refer to the BAT 'Reporting Criteria' for a full description of key terms and definitions at bat/reporting.com +
In 2023, 623 social assessments of suppliers in 55 countries were conducted through our external audit partners, Intertek and EcoVadis: – Tier 1 product materials suppliers: 478; – Lower-tier product materials suppliers: 50; and – Indirect suppliers: 95. Out of the 623 assessments, 167 were re-audits from previous years and 186 were new audits. We require further cycles of audits based on our suppliers' previous audit score. The number of second cycle of audits was 144 and 34% of those re-audited improved their audit performance from the first audit. Of the issues identified, 83% were classified as 'moderate' and 17% as 'major'. 'Major' non-compliances included: – Labour Standards/Human Rights 75% – Environmental issues 25% 51% of corrective actions identified were completed and verified by year-end 2023, with the remainder on track to close by the end of Q2 2024. We have joined the Responsible Business Alliance (RBA) as a Supporter Member and the Supplier Ethical Data Exchange (Sedex) to expand the coverage of audits globally and to improve our own social due diligence and those of our suppliers, particularly in the electronics supply chain. Responsible mineral sourcing Our electronics supply chain for our New Category products can have many layers of suppliers between the raw materials and the final product. This complexity can increase risks for both the security of the supply chain and human rights. Therefore, we focus on mapping our supply chain and continue to drive our key suppliers to manage sustainability issues in their supply chains by holding them accountable for their progress in this area. Our commitment to responsible mineral sourcing is outlined in our SCoC. This includes, but is not limited to, working with our suppliers to: – Exercise appropriate due diligence; and – Identify the origin of ‘conflict minerals’ in our New Category products, with reference to the OECD’s internationally recognised guidelines for responsible mineral supply chains. We report on our findings annually in our Conflict Minerals Report. In 2022, we obtained membership to the Responsible Minerals Initiative (‘RMI’ – formerly the Conflict-Free Sourcing Initiative). As members of the RMI, we participate in cross-industry efforts to support responsible minerals sourcing, and by utilising the resources that are available to RMI members, we seek to further enhance our minerals supply chain due diligence process. Lessons Learnt Navigating the complexities of our supply chain and adapting to local contexts are key to successful collaborations with our global supplier base. Over the years, we have refined our engagement with suppliers, fostering a more collaborative and continuous approach, complemented by targeted training initiatives. We understand the need to adapt our engagement approach to suppliers' needs and to leverage our interactions to support their progress in reducing their carbon footprint. What's Next? – Expanding our Supplier Enablement Programme to cover both global and local strategic suppliers and drive capability within our non-leaf supply chain; and – Continuing to engage with our non-leaf suppliers to improve the visibility and traceability of our supply chain and prepare for upcoming legislation on supply chain transparency. Stakeholder perceptions and key insights from our DMA What do our Stakeholders Think About Supplier Engagement? While farmer relationships are well understood, stakeholders noted that the awareness of our impact on other suppliers is less mature. As we further transition to New Categories, more attention is needed on this topic. Engaging with this supplier group will be critical to our work on human rights and climate change, in particular. How Will the Material Impact of Supplier Engagement Shift Over Time? The impacts of this topic may become more significant over time as our business transforms. Further, the level of maturity of our New Categories supply chain means that new risks may emerge, for example, in its resiliency. It is crucial that we continue our work on supplier engagement to better manage and mitigate those risks. Note: 1. Excluding Russia and Belarus. More details about changes to the Group related to Russia and Belarus are available on page 280 of this document. ‡ Definitions: Tier 1 suppliers: Direct suppliers of final products or materials. Lower-tier suppliers: Suppliers, with whom we have a commercial relationship, who supply materials or products to our Tier 1 Suppliers. ‡ Refer to the BAT ‘Reporting Criteria’ for a full description of key terms and definitions at bat/reporting.com + BAT Annual Report and Form 20-F 2023 Strategic Report Governance Report Financial Statements Other Information 101
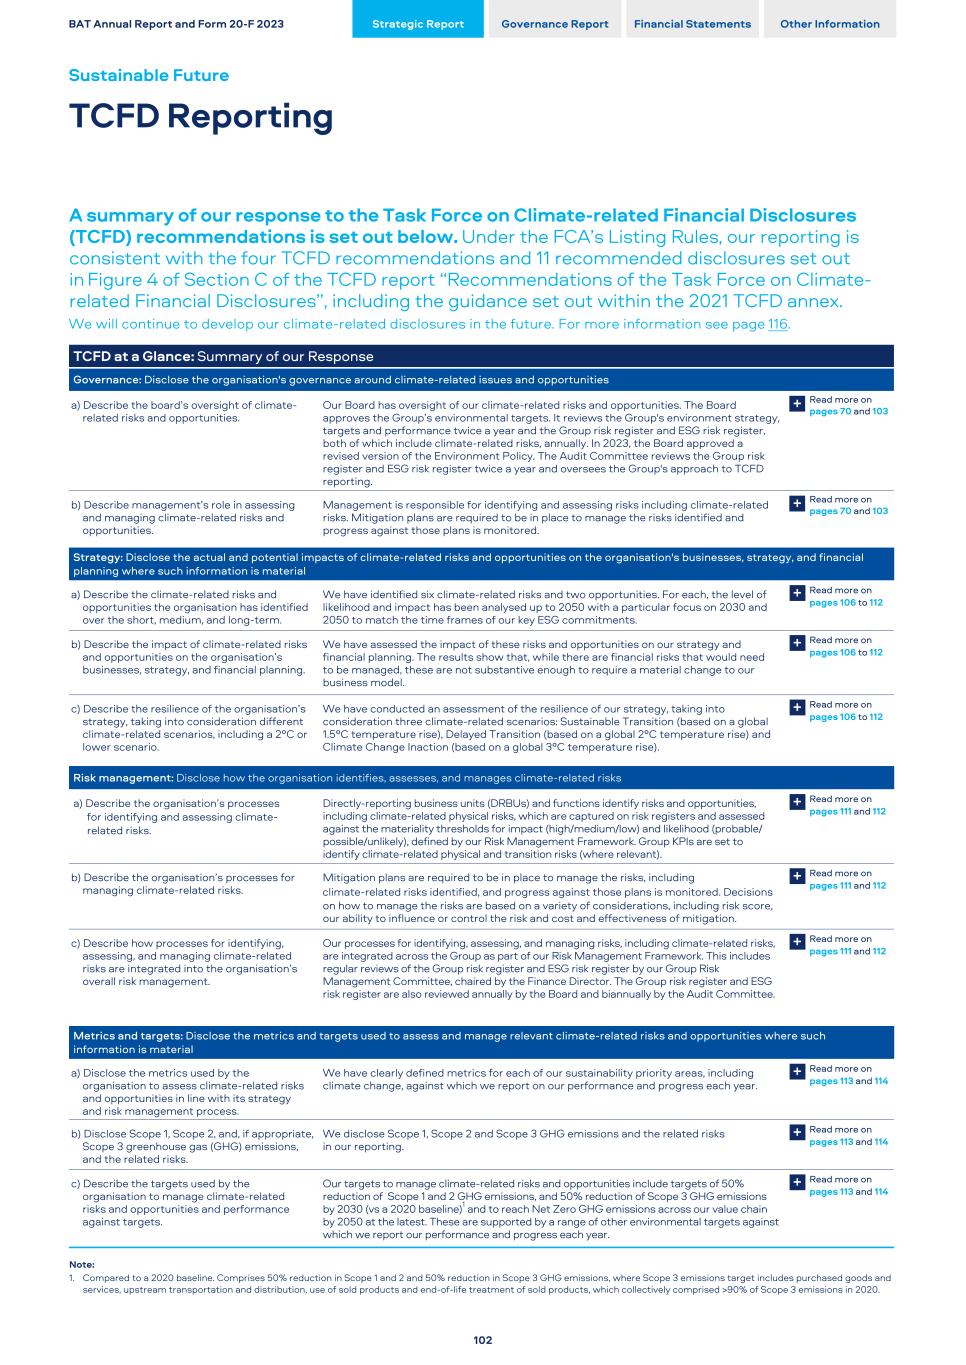
TCFD at a Glance: Summary of our Response Governance: Disclose the organisation's governance around climate-related issues and opportunities Read more on pages 70 and 103a) Describe the board’s oversight of climate- related risks and opportunities. Our Board has oversight of our climate-related risks and opportunities. The Board approves the Group’s environmental targets. It reviews the Group's environment strategy, targets and performance twice a year and the Group risk register and ESG risk register, both of which include climate-related risks, annually. In 2023, the Board approved a revised version of the Environment Policy. The Audit Committee reviews the Group risk register and ESG risk register twice a year and oversees the Group's approach to TCFD reporting. + Read more on pages 70 and 103b) Describe management’s role in assessing and managing climate-related risks and opportunities. Management is responsible for identifying and assessing risks including climate-related risks. Mitigation plans are required to be in place to manage the risks identified and progress against those plans is monitored. + Strategy: Disclose the actual and potential impacts of climate-related risks and opportunities on the organisation's businesses, strategy, and financial planning where such information is material Read more on pages 106 to 112 a) Describe the climate-related risks and opportunities the organisation has identified over the short, medium, and long-term. We have identified six climate-related risks and two opportunities. For each, the level of likelihood and impact has been analysed up to 2050 with a particular focus on 2030 and 2050 to match the time frames of our key ESG commitments. + Read more on pages 106 to 112 b) Describe the impact of climate-related risks and opportunities on the organisation’s businesses, strategy, and financial planning. We have assessed the impact of these risks and opportunities on our strategy and financial planning. The results show that, while there are financial risks that would need to be managed, these are not substantive enough to require a material change to our business model. + Read more on pages 106 to 112 c) Describe the resilience of the organisation’s strategy, taking into consideration different climate-related scenarios, including a 2°C or lower scenario. We have conducted an assessment of the resilience of our strategy, taking into consideration three climate-related scenarios: Sustainable Transition (based on a global 1.5°C temperature rise), Delayed Transition (based on a global 2°C temperature rise) and Climate Change Inaction (based on a global 3°C temperature rise). + Risk management: Disclose how the organisation identifies, assesses, and manages climate-related risks Read more on pages 111 and 112 a) Describe the organisation’s processes for identifying and assessing climate- related risks. Directly-reporting business units (DRBUs) and functions identify risks and opportunities, including climate-related physical risks, which are captured on risk registers and assessed against the materiality thresholds for impact (high/medium/low) and likelihood (probable/ possible/unlikely), defined by our Risk Management Framework. Group KPIs are set to identify climate-related physical and transition risks (where relevant). + Read more on pages 111 and 112 b) Describe the organisation’s processes for managing climate-related risks. Mitigation plans are required to be in place to manage the risks, including climate-related risks identified, and progress against those plans is monitored. Decisions on how to manage the risks are based on a variety of considerations, including risk score, our ability to influence or control the risk and cost and effectiveness of mitigation. + Read more on pages 111 and 112 c) Describe how processes for identifying, assessing, and managing climate-related risks are integrated into the organisation’s overall risk management. Our processes for identifying, assessing, and managing risks, including climate-related risks, are integrated across the Group as part of our Risk Management Framework. This includes regular reviews of the Group risk register and ESG risk register by our Group Risk Management Committee, chaired by the Finance Director. The Group risk register and ESG risk register are also reviewed annually by the Board and biannually by the Audit Committee. + Metrics and targets: Disclose the metrics and targets used to assess and manage relevant climate-related risks and opportunities where such information is material Read more on pages 113 and 114 a) Disclose the metrics used by the organisation to assess climate-related risks and opportunities in line with its strategy and risk management process. We have clearly defined metrics for each of our sustainability priority areas, including climate change, against which we report on our performance and progress each year. + Read more on pages 113 and 114 b) Disclose Scope 1, Scope 2, and, if appropriate, Scope 3 greenhouse gas (GHG) emissions, and the related risks. We disclose Scope 1, Scope 2 and Scope 3 GHG emissions and the related risks in our reporting. + Read more on pages 113 and 114 c) Describe the targets used by the organisation to manage climate-related risks and opportunities and performance against targets. Our targets to manage climate-related risks and opportunities include targets of 50% reduction of Scope 1 and 2 GHG emissions, and 50% reduction of Scope 3 GHG emissions by 2030 (vs a 2020 baseline)1 and to reach Net Zero GHG emissions across our value chain by 2050 at the latest. These are supported by a range of other environmental targets against which we report our performance and progress each year. + Note: 1. Compared to a 2020 baseline. Comprises 50% reduction in Scope 1 and 2 and 50% reduction in Scope 3 GHG emissions, where Scope 3 emissions target includes purchased goods and services, upstream transportation and distribution, use of sold products and end-of-life treatment of sold products, which collectively comprised >90% of Scope 3 emissions in 2020. BAT Annual Report and Form 20-F 2023 Strategic Report Governance Report Financial Statements Other Information Sustainable Future TCFD Reporting A summary of our response to the Task Force on Climate-related Financial Disclosures (TCFD) recommendations is set out below. Under the FCA’s Listing Rules, our reporting is consistent with the four TCFD recommendations and 11 recommended disclosures set out in Figure 4 of Section C of the TCFD report “Recommendations of the Task Force on Climate- related Financial Disclosures”, including the guidance set out within the 2021 TCFD annex. We will continue to develop our climate-related disclosures in the future. For more information see page 116. 102
Governance Board oversight The Board is collectively responsible for the sustainable, long-term success of the Company's and the Group’s strategic direction, purpose, values and governance. This includes responsibility for the Group's strategy and ensuring that resources are in place for the Group to meet its business objectives within a framework of internal controls. Our Board has strategic oversight of our sustainability agenda and takes climate- related considerations into account where applicable when making strategic decisions, including in relation to budgeting, risk management and overseeing capital expenditure. The Board has approved all Group environmental targets (including for GHG emissions) and receives an update on performance twice a year from the Director, Operations. The Board reviews the Group risk register and ESG risk register, both of which incorporate climate-related risks, on an annual basis. In addition, the Board reviews the Group budget which takes into account capital allocation to deliver the Group’s sustainability agenda and associated targets. Read more about our Climate Change and Circular Economy risk in the Group Principal Risks on page 121 and in the Group Risk Factors on page 354 + In 2023, the Board approved a revised version of the Group's Environment Policy, effective from July 2023, and the introduction of updated versions of our SoBC and SCoC (from 1 January 2024), both of which include environmental management requirements. In 2023, the Board also received an in-depth briefing on developments in sustainability regulations, including TCFD requirements. The Board has delegated certain responsibilities to the Audit Committee, which is responsible for reviewing the effectiveness of the Group’s risk management and internal controls systems, including those relating to climate change. The Audit Committee reviews the Group risk register and the ESG risk register twice a year and regularly reviews the Group’s progress against sustainability targets, including emission targets that address climate-related issues (see targets on page 113). The Audit Committee also receives reports from the Group’s Regional Audit Committees and Corporate Audit Committee, which monitor the effectiveness of business risk management and internal controls across regions and central functions. In 2023, the Audit Committee continued to oversee developments in our approach to reporting in alignment with the TCFD framework, including the introduction of additional climate scenario analysis in our risk assessments. The Chair of the Audit Committee provides a full briefing to the Board following each Audit Committee meeting, including decisions taken and key topics discussed by the Audit Committee. Management’s role The assessment and management of climate-related risks is embedded across relevant business areas at Group, regional and local levels, with appropriate management oversight at each level, as shown on the chart on page 70. Our approach provides a flexible channel for the structured flow of information, monitoring and oversight of climate-related risks and environmental matters at the level and format best suited to the context. Our Management Board, chaired by our Chief Executive, is responsible for overseeing the implementation of Group strategy and policies, and monitoring Group operating performance, including in relation to sustainability and climate. The Chief Executive and other Management Board members then report on performance to the Board. Management Board members are regularly updated on material risks and development of strategic plans, including those relating to climate change, along with associated risk mitigation plans, by risk owners, risk managers and their respective teams. This includes regular monitoring by the Group Risk Management Committee, chaired by the Finance Director. The Chief Strategy & Growth Officer has overall responsibility for the delivery of the Group Sustainability Agenda, supported by the Sustainability team, including our Chief Sustainability Officer, Head of Corporate Sustainability and sustainability subject-matter experts across the Group. The Director, Operations has overall responsibility for delivery of the Group’s climate strategy and environmental targets, supported by the Group Head of Operations Development and Sustainability, the Operations Sustainability team, the Group Sustainability team and regional sustainability managers. Each reporting unit reports on a monthly basis. Monitoring and reporting of consolidated Group performance and metrics is completed quarterly by the Group Operations Sustainability team. Each directly-reporting business unit of the Group (DRBU) has an Environment, Health & Safety (EHS) Steering Committee, with overall responsibility to deliver environmental targets at site level held by the General Manager or site manager. EHS is also a standing agenda item for management meetings and governance committees at area, regional and global levels. These local management meetings and committees report into the Operations Sustainability Forum, chaired by the Director, Operations. This acts as a conduit to track delivery of environmental targets and gain visibility of new and emerging risks posed by climate change. The Operations Sustainability Forum oversees business plans to mitigate risks identified, reviews performance and tracks progress of our regions and business units in delivering the Group’s environmental targets. Summary of Climate-related Matters Reviewed by the Board in 2023: – Group risk register and ESG risk register (annually) – Environmental performance (twice a year) – Approval of the ARA and 20-F in February/March 2023 – In-depth review of sustainability reporting regulations in April 2023 – Approval of the revised Group Environment Policy effective from July 2023 – Review of business stakeholder engagement in October 2023, which included an update on the refreshed Double Materiality Assessment – 2024 Budget Review (including Operations sustainability budget) in December 2023 – Approval of an updated version of the SoBC and SCoC, effective from 1 January 2024 BAT Annual Report and Form 20-F 2023 Strategic Report Governance Report Financial Statements Other Information 103
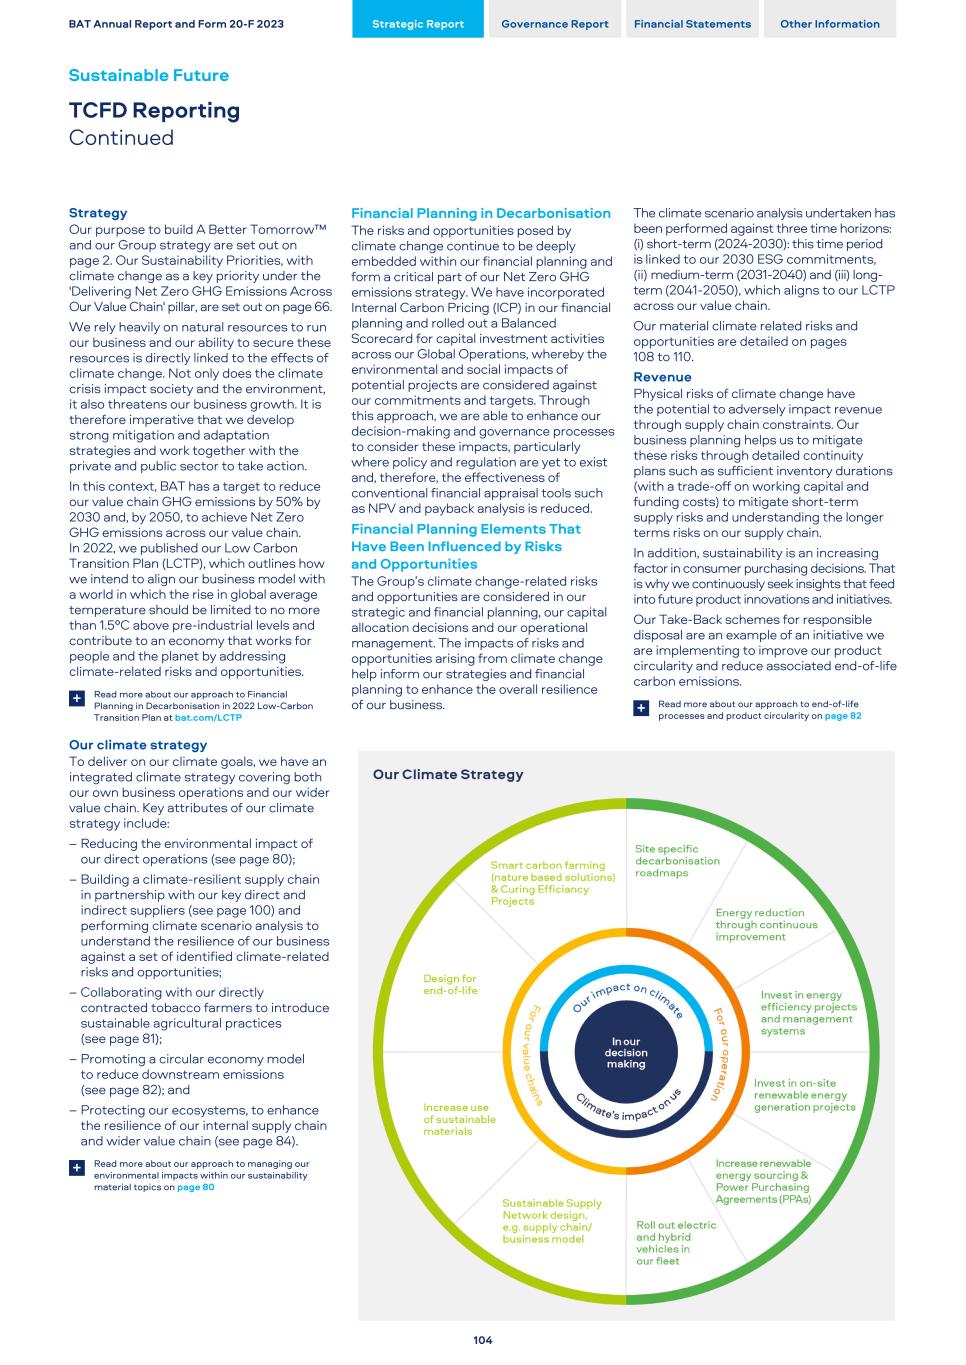
Strategy Our purpose to build A Better Tomorrow™ and our Group strategy are set out on page 2. Our Sustainability Priorities, with climate change as a key priority under the 'Delivering Net Zero GHG Emissions Across Our Value Chain' pillar, are set out on page 66. We rely heavily on natural resources to run our business and our ability to secure these resources is directly linked to the effects of climate change. Not only does the climate crisis impact society and the environment, it also threatens our business growth. It is therefore imperative that we develop strong mitigation and adaptation strategies and work together with the private and public sector to take action. In this context, BAT has a target to reduce our value chain GHG emissions by 50% by 2030 and, by 2050, to achieve Net Zero GHG emissions across our value chain. In 2022, we published our Low Carbon Transition Plan (LCTP), which outlines how we intend to align our business model with a world in which the rise in global average temperature should be limited to no more than 1.5°C above pre-industrial levels and contribute to an economy that works for people and the planet by addressing climate-related risks and opportunities. Read more about our approach to Financial Planning in Decarbonisation in 2022 Low-Carbon Transition Plan at bat.com/LCTP + Our climate strategy To deliver on our climate goals, we have an integrated climate strategy covering both our own business operations and our wider value chain. Key attributes of our climate strategy include: – Reducing the environmental impact of our direct operations (see page 80); – Building a climate-resilient supply chain in partnership with our key direct and indirect suppliers (see page 100) and performing climate scenario analysis to understand the resilience of our business against a set of identified climate-related risks and opportunities; – Collaborating with our directly contracted tobacco farmers to introduce sustainable agricultural practices (see page 81); – Promoting a circular economy model to reduce downstream emissions (see page 82); and – Protecting our ecosystems, to enhance the resilience of our internal supply chain and wider value chain (see page 84). Read more about our approach to managing our environmental impacts within our sustainability material topics on page 80 + Financial Planning in Decarbonisation The risks and opportunities posed by climate change continue to be deeply embedded within our financial planning and form a critical part of our Net Zero GHG emissions strategy. We have incorporated Internal Carbon Pricing (ICP) in our financial planning and rolled out a Balanced Scorecard for capital investment activities across our Global Operations, whereby the environmental and social impacts of potential projects are considered against our commitments and targets. Through this approach, we are able to enhance our decision-making and governance processes to consider these impacts, particularly where policy and regulation are yet to exist and, therefore, the effectiveness of conventional financial appraisal tools such as NPV and payback analysis is reduced. Financial Planning Elements That Have Been Influenced by Risks and Opportunities The Group’s climate change-related risks and opportunities are considered in our strategic and financial planning, our capital allocation decisions and our operational management. The impacts of risks and opportunities arising from climate change help inform our strategies and financial planning to enhance the overall resilience of our business. The climate scenario analysis undertaken has been performed against three time horizons: (i) short-term (2024-2030): this time period is linked to our 2030 ESG commitments, (ii) medium-term (2031-2040) and (iii) long- term (2041-2050), which aligns to our LCTP across our value chain. Our material climate related risks and opportunities are detailed on pages 108 to 110. Revenue Physical risks of climate change have the potential to adversely impact revenue through supply chain constraints. Our business planning helps us to mitigate these risks through detailed continuity plans such as sufficient inventory durations (with a trade-off on working capital and funding costs) to mitigate short-term supply risks and understanding the longer terms risks on our supply chain. In addition, sustainability is an increasing factor in consumer purchasing decisions. That is why we continuously seek insights that feed into future product innovations and initiatives. Our Take-Back schemes for responsible disposal are an example of an initiative we are implementing to improve our product circularity and reduce associated end-of-life carbon emissions. Read more about our approach to end-of-life processes and product circularity on page 82+ BAT Annual Report and Form 20-F 2023 Strategic Report Governance Report Financial Statements Other Information Sustainable Future TCFD Reporting Continued 104
Direct operating costs Ways in which climate change considerations can impact cost of sales and, as such, are considered as part of our financial planning include: – Tobacco leaf cost increases due to potential supply constraints caused by chronic or extreme weather events; – Raw materials and innovation cost increases due to raw material shortages and enhancements to our product designs to reduce waste and increase recyclability; and – The cost of emerging regulation, as well as taxes on carbon emissions and potential increases to the cost of energy impacting our direct operations and wider value chain as we transition to a low-carbon model. Capital allocation As part of our financial planning, we require that significant capital investments must include carbon emissions impact calculations which are priced into cash flow projections using Internal Carbon Pricing (ICP), as well as marginal abatement cost, and most recently, balanced scorecard appraisal tools. The level of ICP is reviewed annually, following benchmarking of external metrics and was set at £67 tCO2e in 2023 and is forecasted to rise incrementally year-on- year to £120 tCO2e by 2030. Capital investment We fund a dedicated capital expenditure budget that is used to progress the delivery of our ESG commitments. In 2023, this amounted to £34 million with investments in energy efficiency and renewable energy generation, water recycling and efficiency projects, waste reduction, and product innovation-led specification improvements to drive recyclability. Assets and liabilities The impact of climate change is considered in the estimates of future cash flows used in impairment assessments, as detailed in note 12 of the financial statements. Read more about the impact of climate change as part of our impairment disclosure on page 239+ Access to capital Climate risks and opportunities may impact BAT’s financing in multiple ways, for example (1) climate change may impact the business financially through potentially higher costs and/or our consumers' ability to buy our products which, if they materialised, could impact our profitability and credit ratings; and (2) perception of our investors towards our ESG progress which could reduce their willingness to invest in BAT or restrict our access to capital, should BAT fail to achieve, or be perceived as having failed to achieve, sufficient progress. By having clear visibility of climate-related risks and opportunities and mitigating these where possible, the Group expects to have continued access to capital and to be able to undertake acquisitions or divestments, as needed. The process of managing these risks is embedded in our financing principles which are reported on to the Board. Operationally, funding is also discussed at the Corporate Finance Committee (chaired by our Finance Director). We also have a Treasury Risk Committee that meets monthly and monitors climate- related risks in the context of the Group's financing needs. In terms of metrics, we have an established medium-term target credit rating which seeks to achieve a balance between balance sheet requirements and access to capital as well as various other metrics. In addition, the Corporate Treasury team is embedded in key discussions on sustainability, as well as dialogues through debt investor engagement to understand the dynamics of ESG impact on funding and capital markets. The Corporate Treasury team takes appropriate actions to mitigate any potential impact on our access to capital due to ESG factors. BAT Annual Report and Form 20-F 2023 Strategic Report Governance Report Financial Statements Other Information 105
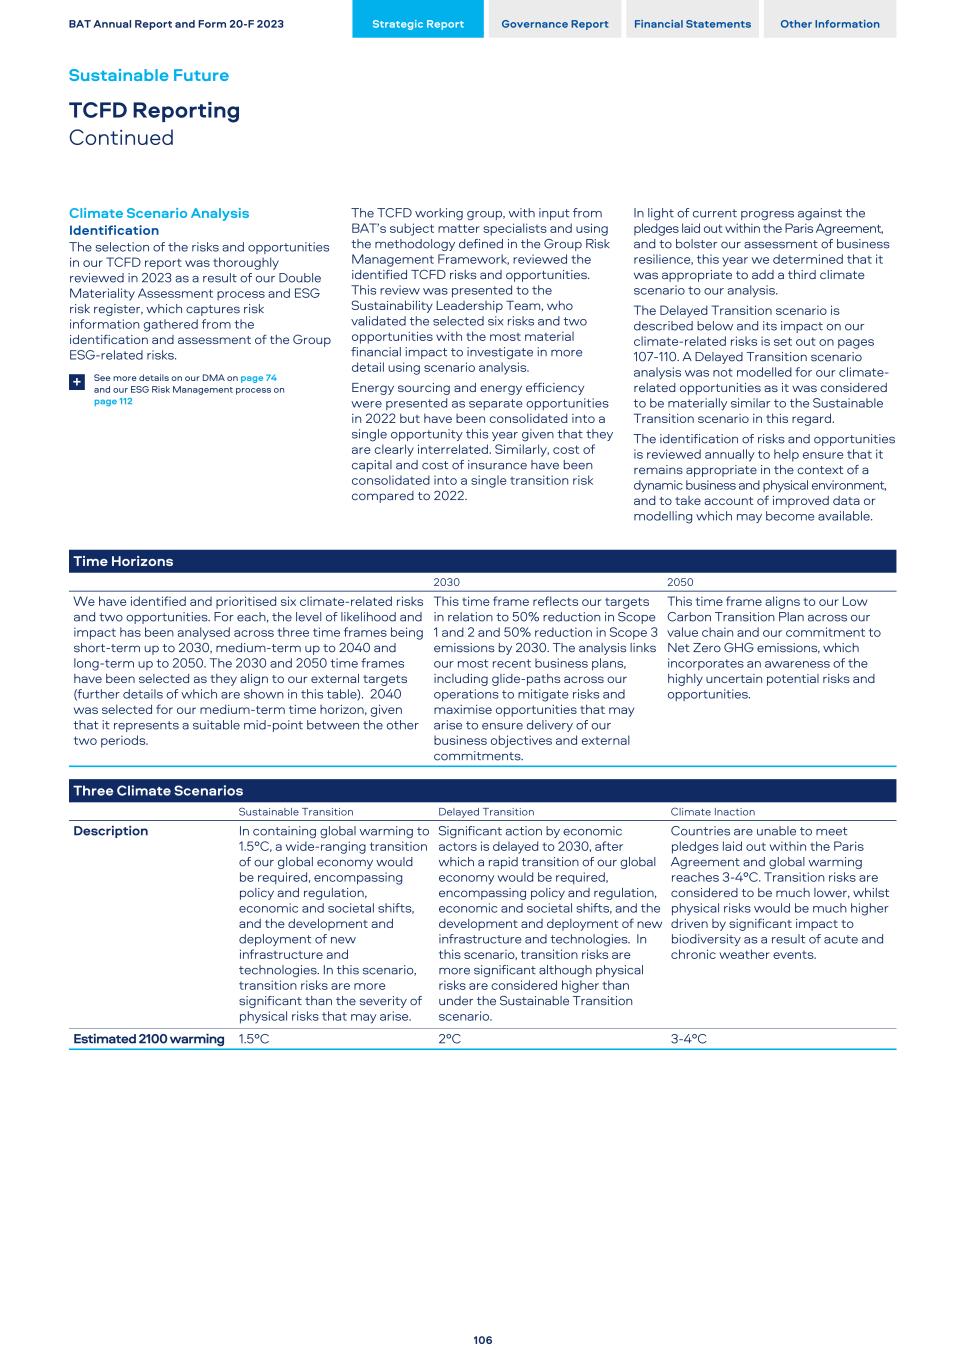
Climate Scenario Analysis Identification The selection of the risks and opportunities in our TCFD report was thoroughly reviewed in 2023 as a result of our Double Materiality Assessment process and ESG risk register, which captures risk information gathered from the identification and assessment of the Group ESG-related risks. See more details on our DMA on page 74 and our ESG Risk Management process on page 112 + The TCFD working group, with input from BAT’s subject matter specialists and using the methodology defined in the Group Risk Management Framework, reviewed the identified TCFD risks and opportunities. This review was presented to the Sustainability Leadership Team, who validated the selected six risks and two opportunities with the most material financial impact to investigate in more detail using scenario analysis. Energy sourcing and energy efficiency were presented as separate opportunities in 2022 but have been consolidated into a single opportunity this year given that they are clearly interrelated. Similarly, cost of capital and cost of insurance have been consolidated into a single transition risk compared to 2022. In light of current progress against the pledges laid out within the Paris Agreement, and to bolster our assessment of business resilience, this year we determined that it was appropriate to add a third climate scenario to our analysis. The Delayed Transition scenario is described below and its impact on our climate-related risks is set out on pages 107-110. A Delayed Transition scenario analysis was not modelled for our climate- related opportunities as it was considered to be materially similar to the Sustainable Transition scenario in this regard. The identification of risks and opportunities is reviewed annually to help ensure that it remains appropriate in the context of a dynamic business and physical environment, and to take account of improved data or modelling which may become available. Time Horizons 2030 2050 We have identified and prioritised six climate-related risks and two opportunities. For each, the level of likelihood and impact has been analysed across three time frames being short-term up to 2030, medium-term up to 2040 and long-term up to 2050. The 2030 and 2050 time frames have been selected as they align to our external targets (further details of which are shown in this table). 2040 was selected for our medium-term time horizon, given that it represents a suitable mid-point between the other two periods. This time frame reflects our targets in relation to 50% reduction in Scope 1 and 2 and 50% reduction in Scope 3 emissions by 2030. The analysis links our most recent business plans, including glide-paths across our operations to mitigate risks and maximise opportunities that may arise to ensure delivery of our business objectives and external commitments. This time frame aligns to our Low Carbon Transition Plan across our value chain and our commitment to Net Zero GHG emissions, which incorporates an awareness of the highly uncertain potential risks and opportunities. Three Climate Scenarios Sustainable Transition Delayed Transition Climate Inaction Description In containing global warming to 1.5°C, a wide-ranging transition of our global economy would be required, encompassing policy and regulation, economic and societal shifts, and the development and deployment of new infrastructure and technologies. In this scenario, transition risks are more significant than the severity of physical risks that may arise. Significant action by economic actors is delayed to 2030, after which a rapid transition of our global economy would be required, encompassing policy and regulation, economic and societal shifts, and the development and deployment of new infrastructure and technologies. In this scenario, transition risks are more significant although physical risks are considered higher than under the Sustainable Transition scenario. Countries are unable to meet pledges laid out within the Paris Agreement and global warming reaches 3-4°C. Transition risks are considered to be much lower, whilst physical risks would be much higher driven by significant impact to biodiversity as a result of acute and chronic weather events. Estimated 2100 warming 1.5°C 2°C 3-4°C BAT Annual Report and Form 20-F 2023 Strategic Report Governance Report Financial Statements Other Information Sustainable Future TCFD Reporting Continued 106
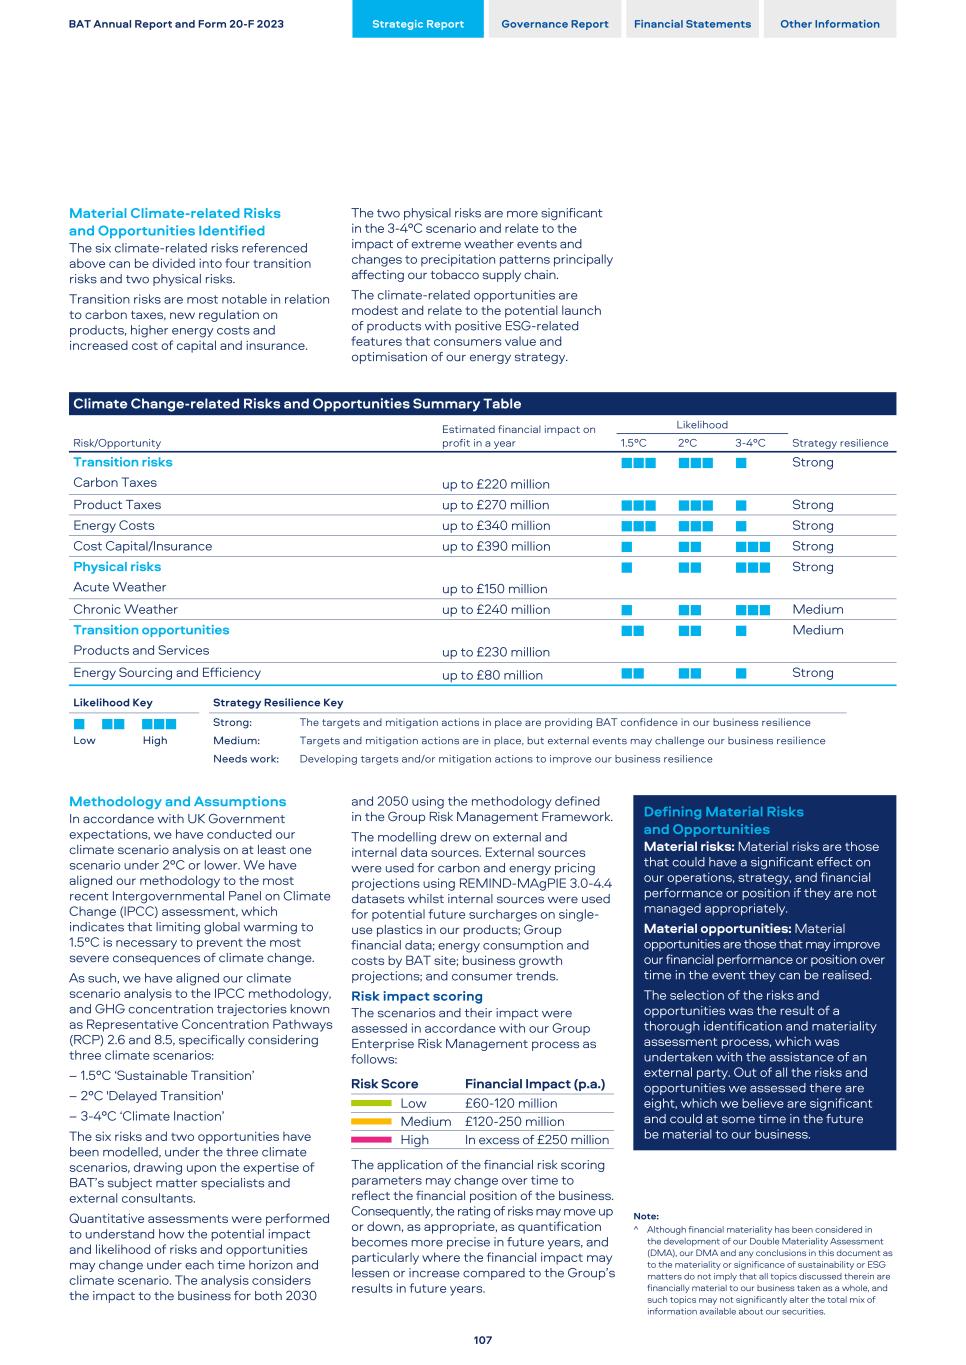
Material Climate-related Risks and Opportunities Identified The six climate-related risks referenced above can be divided into four transition risks and two physical risks. Transition risks are most notable in relation to carbon taxes, new regulation on products, higher energy costs and increased cost of capital and insurance. The two physical risks are more significant in the 3-4°C scenario and relate to the impact of extreme weather events and changes to precipitation patterns principally affecting our tobacco supply chain. The climate-related opportunities are modest and relate to the potential launch of products with positive ESG-related features that consumers value and optimisation of our energy strategy. Climate Change-related Risks and Opportunities Summary Table Risk/Opportunity Estimated financial impact on profit in a year Likelihood Strategy resilience 1.5°C 2°C 3-4°C Transition risks Carbon Taxes up to £220 million ■■■ ■■■ ■ Strong Product Taxes up to £270 million ■■■ ■■■ ■ Strong Energy Costs up to £340 million ■■■ ■■■ ■ Strong Cost Capital/Insurance up to £390 million ■ ■■ ■■■ Strong Physical risks Acute Weather up to £150 million ■ ■■ ■■■ Strong Chronic Weather up to £240 million ■ ■■ ■■■ Medium Transition opportunities Products and Services up to £230 million ■■ ■■ ■ Medium Energy Sourcing and Efficiency up to £80 million ■■ ■■ ■ Strong Likelihood Key Strategy Resilience Key ■	■■	■■■ Strong: The targets and mitigation actions in place are providing BAT confidence in our business resilience Low High Medium: Targets and mitigation actions are in place, but external events may challenge our business resilience Needs work: Developing targets and/or mitigation actions to improve our business resilience Methodology and Assumptions In accordance with UK Government expectations, we have conducted our climate scenario analysis on at least one scenario under 2°C or lower. We have aligned our methodology to the most recent Intergovernmental Panel on Climate Change (IPCC) assessment, which indicates that limiting global warming to 1.5°C is necessary to prevent the most severe consequences of climate change. As such, we have aligned our climate scenario analysis to the IPCC methodology, and GHG concentration trajectories known as Representative Concentration Pathways (RCP) 2.6 and 8.5, specifically considering three climate scenarios: – 1.5°C ‘Sustainable Transition’ – 2°C 'Delayed Transition' – 3-4°C ‘Climate Inaction’ The six risks and two opportunities have been modelled, under the three climate scenarios, drawing upon the expertise of BAT’s subject matter specialists and external consultants. Quantitative assessments were performed to understand how the potential impact and likelihood of risks and opportunities may change under each time horizon and climate scenario. The analysis considers the impact to the business for both 2030 and 2050 using the methodology defined in the Group Risk Management Framework. The modelling drew on external and internal data sources. External sources were used for carbon and energy pricing projections using REMIND-MAgPIE 3.0-4.4 datasets whilst internal sources were used for potential future surcharges on single- use plastics in our products; Group financial data; energy consumption and costs by BAT site; business growth projections; and consumer trends. Risk impact scoring The scenarios and their impact were assessed in accordance with our Group Enterprise Risk Management process as follows: Risk Score Financial Impact (p.a.) Low £60-120 million Medium £120-250 million High In excess of £250 million The application of the financial risk scoring parameters may change over time to reflect the financial position of the business. Consequently, the rating of risks may move up or down, as appropriate, as quantification becomes more precise in future years, and particularly where the financial impact may lessen or increase compared to the Group’s results in future years. Defining Material Risks and Opportunities Material risks: Material risks are those that could have a significant effect on our operations, strategy, and financial performance or position if they are not managed appropriately. Material opportunities: Material opportunities are those that may improve our financial performance or position over time in the event they can be realised. The selection of the risks and opportunities was the result of a thorough identification and materiality assessment process, which was undertaken with the assistance of an external party. Out of all the risks and opportunities we assessed there are eight, which we believe are significant and could at some time in the future be material to our business. Note: ^ Although financial materiality has been considered in the development of our Double Materiality Assessment (DMA), our DMA and any conclusions in this document as to the materiality or significance of sustainability or ESG matters do not imply that all topics discussed therein are financially material to our business taken as a whole, and such topics may not significantly alter the total mix of information available about our securities. BAT Annual Report and Form 20-F 2023 Strategic Report Governance Report Financial Statements Other Information 107
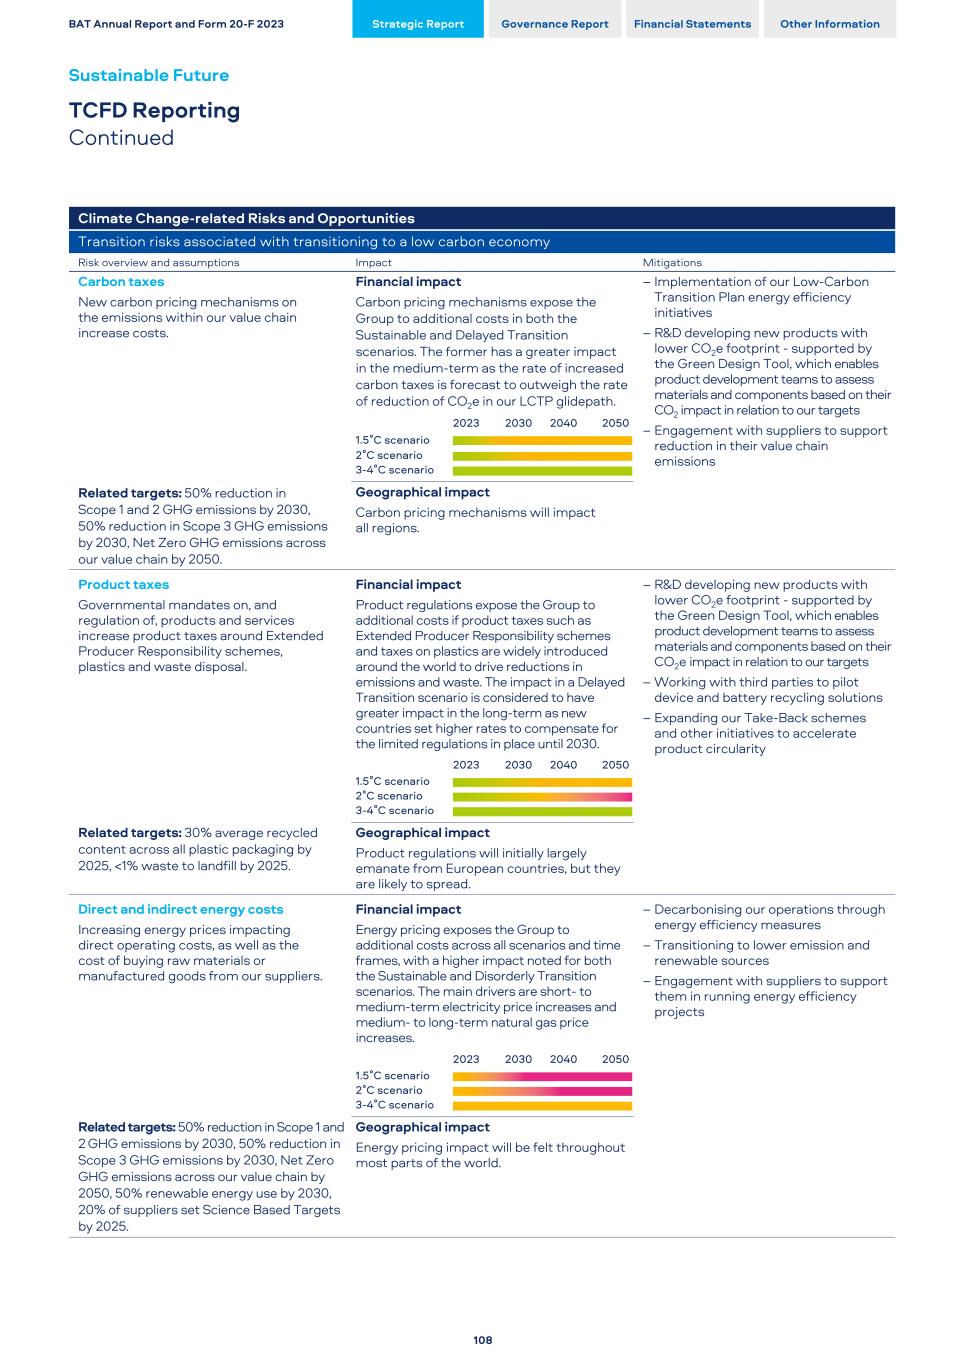
Climate Change-related Risks and Opportunities Transition risks associated with transitioning to a low carbon economy Risk overview and assumptions Impact Mitigations Carbon taxes New carbon pricing mechanisms on the emissions within our value chain increase costs. Financial impact Carbon pricing mechanisms expose the Group to additional costs in both the Sustainable and Delayed Transition scenarios. The former has a greater impact in the medium-term as the rate of increased carbon taxes is forecast to outweigh the rate of reduction of CO2e in our LCTP glidepath. – Implementation of our Low-Carbon Transition Plan energy efficiency initiatives – R&D developing new products with lower CO2e footprint - supported by the Green Design Tool, which enables product development teams to assess materials and components based on their CO2 impact in relation to our targets – Engagement with suppliers to support reduction in their value chain emissions 2023 2030 2040 2050 1.5˚C scenario 2˚C scenario 3-4˚C scenario Related targets: 50% reduction in Scope 1 and 2 GHG emissions by 2030, 50% reduction in Scope 3 GHG emissions by 2030, Net Zero GHG emissions across our value chain by 2050. Geographical impact Carbon pricing mechanisms will impact all regions. Product taxes Governmental mandates on, and regulation of, products and services increase product taxes around Extended Producer Responsibility schemes, plastics and waste disposal. Financial impact Product regulations expose the Group to additional costs if product taxes such as Extended Producer Responsibility schemes and taxes on plastics are widely introduced around the world to drive reductions in emissions and waste. The impact in a Delayed Transition scenario is considered to have greater impact in the long-term as new countries set higher rates to compensate for the limited regulations in place until 2030. – R&D developing new products with lower CO2e footprint - supported by the Green Design Tool, which enables product development teams to assess materials and components based on their CO2e impact in relation to our targets – Working with third parties to pilot device and battery recycling solutions – Expanding our Take-Back schemes and other initiatives to accelerate product circularity 2023 2030 2040 2050 1.5˚C scenario 2˚C scenario 3-4˚C scenario Related targets: 30% average recycled content across all plastic packaging by 2025, <1% waste to landfill by 2025. Geographical impact Product regulations will initially largely emanate from European countries, but they are likely to spread. Direct and indirect energy costs Increasing energy prices impacting direct operating costs, as well as the cost of buying raw materials or manufactured goods from our suppliers. Financial impact Energy pricing exposes the Group to additional costs across all scenarios and time frames, with a higher impact noted for both the Sustainable and Disorderly Transition scenarios. The main drivers are short- to medium-term electricity price increases and medium- to long-term natural gas price increases. – Decarbonising our operations through energy efficiency measures – Transitioning to lower emission and renewable sources – Engagement with suppliers to support them in running energy efficiency projects 2023 2030 2040 2050 1.5˚C scenario 2˚C scenario 3-4˚C scenario Related targets: 50% reduction in Scope 1 and 2 GHG emissions by 2030, 50% reduction in Scope 3 GHG emissions by 2030, Net Zero GHG emissions across our value chain by 2050, 50% renewable energy use by 2030, 20% of suppliers set Science Based Targets by 2025. Geographical impact Energy pricing impact will be felt throughout most parts of the world. BAT Annual Report and Form 20-F 2023 Strategic Report Governance Report Financial Statements Other Information Sustainable Future TCFD Reporting Continued 108
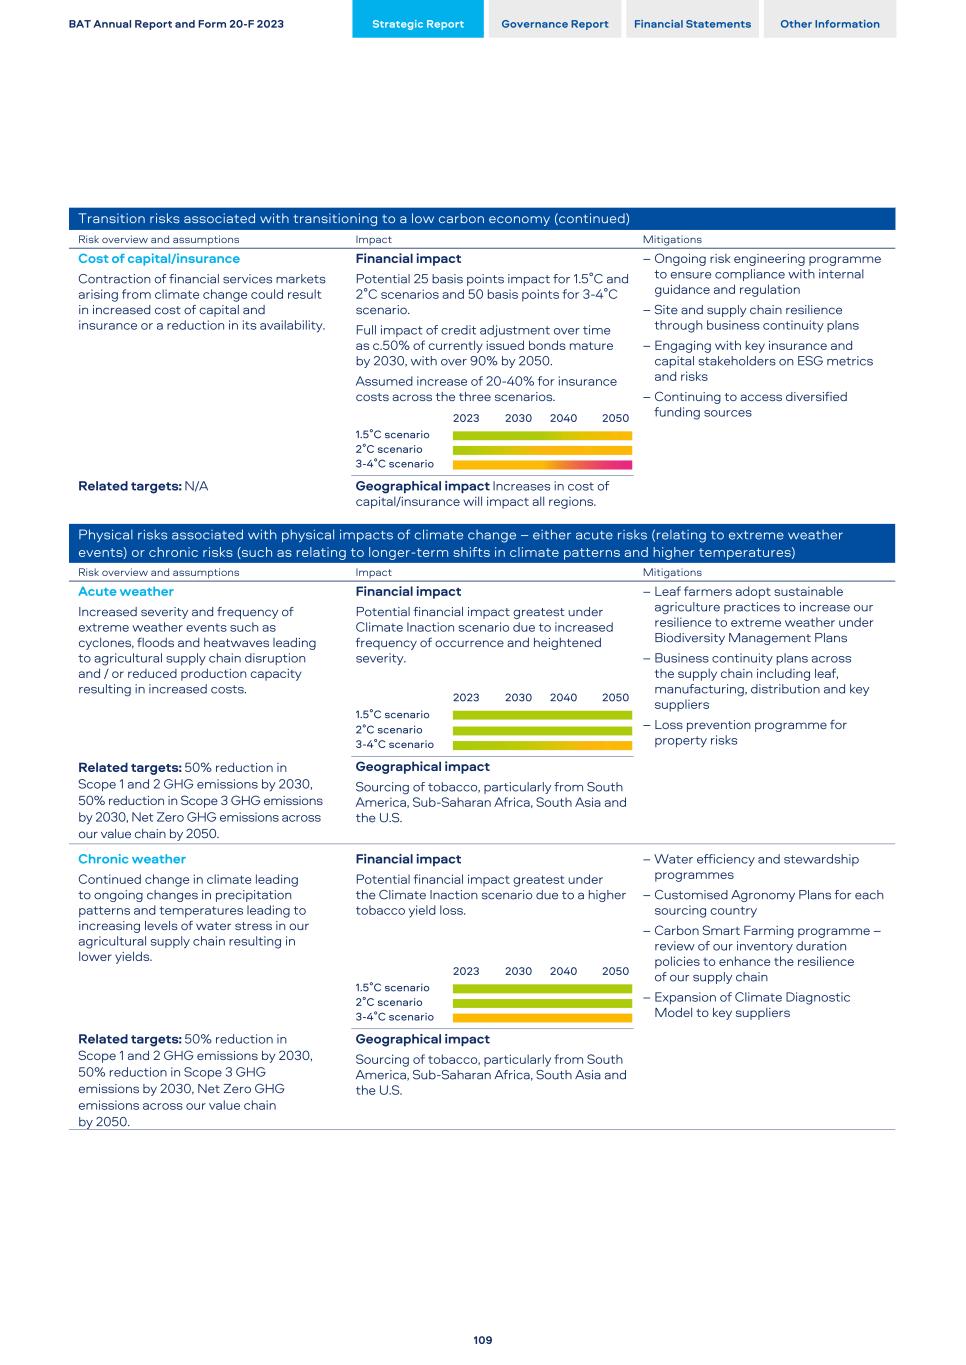
Transition risks associated with transitioning to a low carbon economy (continued) Risk overview and assumptions Impact Mitigations Cost of capital/insurance Contraction of financial services markets arising from climate change could result in increased cost of capital and insurance or a reduction in its availability. Financial impact Potential 25 basis points impact for 1.5˚C and 2˚C scenarios and 50 basis points for 3-4˚C scenario. Full impact of credit adjustment over time as c.50% of currently issued bonds mature by 2030, with over 90% by 2050. Assumed increase of 20-40% for insurance costs across the three scenarios. – Ongoing risk engineering programme to ensure compliance with internal guidance and regulation – Site and supply chain resilience through business continuity plans – Engaging with key insurance and capital stakeholders on ESG metrics and risks – Continuing to access diversified funding sources2023 2030 2040 2050 1.5˚C scenario 2˚C scenario 3-4˚C scenario Related targets: N/A Geographical impact Increases in cost of capital/insurance will impact all regions. Physical risks associated with physical impacts of climate change – either acute risks (relating to extreme weather events) or chronic risks (such as relating to longer-term shifts in climate patterns and higher temperatures) Risk overview and assumptions Impact Mitigations Acute weather Increased severity and frequency of extreme weather events such as cyclones, floods and heatwaves leading to agricultural supply chain disruption and / or reduced production capacity resulting in increased costs. Financial impact Potential financial impact greatest under Climate Inaction scenario due to increased frequency of occurrence and heightened severity. – Leaf farmers adopt sustainable agriculture practices to increase our resilience to extreme weather under Biodiversity Management Plans – Business continuity plans across the supply chain including leaf, manufacturing, distribution and key suppliers – Loss prevention programme for property risks 2023 2030 2040 2050 1.5˚C scenario 2˚C scenario 3-4˚C scenario Related targets: 50% reduction in Scope 1 and 2 GHG emissions by 2030, 50% reduction in Scope 3 GHG emissions by 2030, Net Zero GHG emissions across our value chain by 2050. Geographical impact Sourcing of tobacco, particularly from South America, Sub-Saharan Africa, South Asia and the U.S. Chronic weather Continued change in climate leading to ongoing changes in precipitation patterns and temperatures leading to increasing levels of water stress in our agricultural supply chain resulting in lower yields. Financial impact Potential financial impact greatest under the Climate Inaction scenario due to a higher tobacco yield loss. – Water efficiency and stewardship programmes – Customised Agronomy Plans for each sourcing country – Carbon Smart Farming programme – review of our inventory duration policies to enhance the resilience of our supply chain – Expansion of Climate Diagnostic Model to key suppliers 2023 2030 2040 2050 1.5˚C scenario 2˚C scenario 3-4˚C scenario Related targets: 50% reduction in Scope 1 and 2 GHG emissions by 2030, 50% reduction in Scope 3 GHG emissions by 2030, Net Zero GHG emissions across our value chain by 2050. Geographical impact Sourcing of tobacco, particularly from South America, Sub-Saharan Africa, South Asia and the U.S. BAT Annual Report and Form 20-F 2023 Strategic Report Governance Report Financial Statements Other Information 109
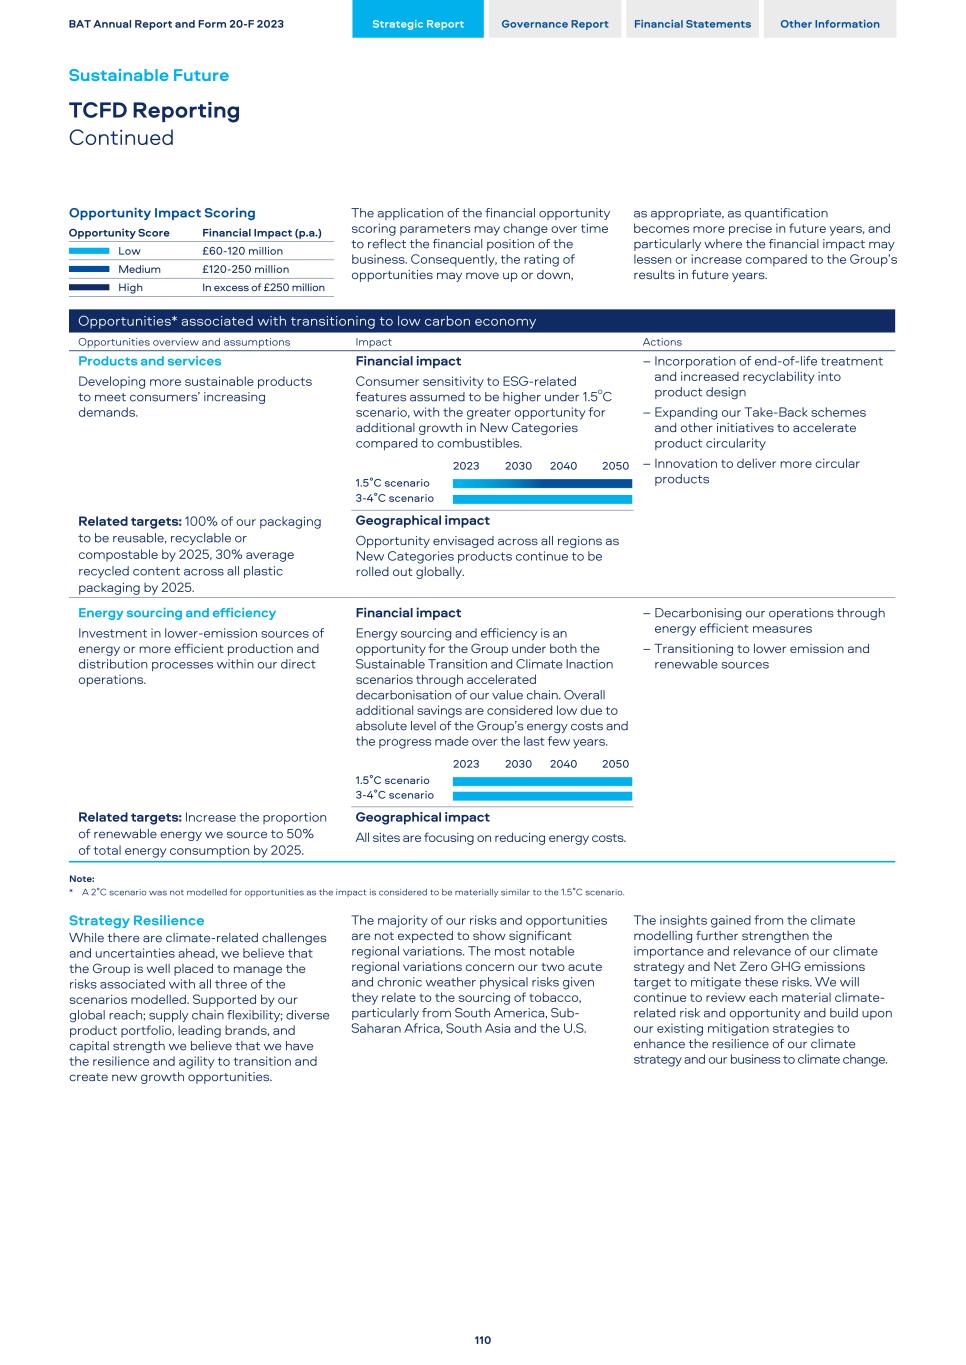
Opportunity Impact Scoring Opportunity Score Financial Impact (p.a.) Low £60-120 million Medium £120-250 million High In excess of £250 million The application of the financial opportunity scoring parameters may change over time to reflect the financial position of the business. Consequently, the rating of opportunities may move up or down, as appropriate, as quantification becomes more precise in future years, and particularly where the financial impact may lessen or increase compared to the Group’s results in future years. Opportunities* associated with transitioning to low carbon economy Opportunities overview and assumptions Impact Actions Products and services Developing more sustainable products to meet consumers’ increasing demands. Financial impact Consumer sensitivity to ESG-related features assumed to be higher under 1.5oC scenario, with the greater opportunity for additional growth in New Categories compared to combustibles. – Incorporation of end-of-life treatment and increased recyclability into product design – Expanding our Take-Back schemes and other initiatives to accelerate product circularity – Innovation to deliver more circular products 2023 2030 2040 2050 1.5˚C scenario 3-4˚C scenario Related targets: 100% of our packaging to be reusable, recyclable or compostable by 2025, 30% average recycled content across all plastic packaging by 2025. Geographical impact Opportunity envisaged across all regions as New Categories products continue to be rolled out globally. Energy sourcing and efficiency Investment in lower-emission sources of energy or more efficient production and distribution processes within our direct operations. Financial impact Energy sourcing and efficiency is an opportunity for the Group under both the Sustainable Transition and Climate Inaction scenarios through accelerated decarbonisation of our value chain. Overall additional savings are considered low due to absolute level of the Group’s energy costs and the progress made over the last few years. – Decarbonising our operations through energy efficient measures – Transitioning to lower emission and renewable sources 2023 2030 2040 2050 1.5˚C scenario 3-4˚C scenario Related targets: Increase the proportion of renewable energy we source to 50% of total energy consumption by 2025. Geographical impact All sites are focusing on reducing energy costs. Note: * A 2˚C scenario was not modelled for opportunities as the impact is considered to be materially similar to the 1.5˚C scenario. Strategy Resilience While there are climate-related challenges and uncertainties ahead, we believe that the Group is well placed to manage the risks associated with all three of the scenarios modelled. Supported by our global reach; supply chain flexibility; diverse product portfolio, leading brands, and capital strength we believe that we have the resilience and agility to transition and create new growth opportunities. The majority of our risks and opportunities are not expected to show significant regional variations. The most notable regional variations concern our two acute and chronic weather physical risks given they relate to the sourcing of tobacco, particularly from South America, Sub- Saharan Africa, South Asia and the U.S. The insights gained from the climate modelling further strengthen the importance and relevance of our climate strategy and Net Zero GHG emissions target to mitigate these risks. We will continue to review each material climate- related risk and opportunity and build upon our existing mitigation strategies to enhance the resilience of our climate strategy and our business to climate change. BAT Annual Report and Form 20-F 2023 Strategic Report Governance Report Financial Statements Other Information Sustainable Future TCFD Reporting Continued 110
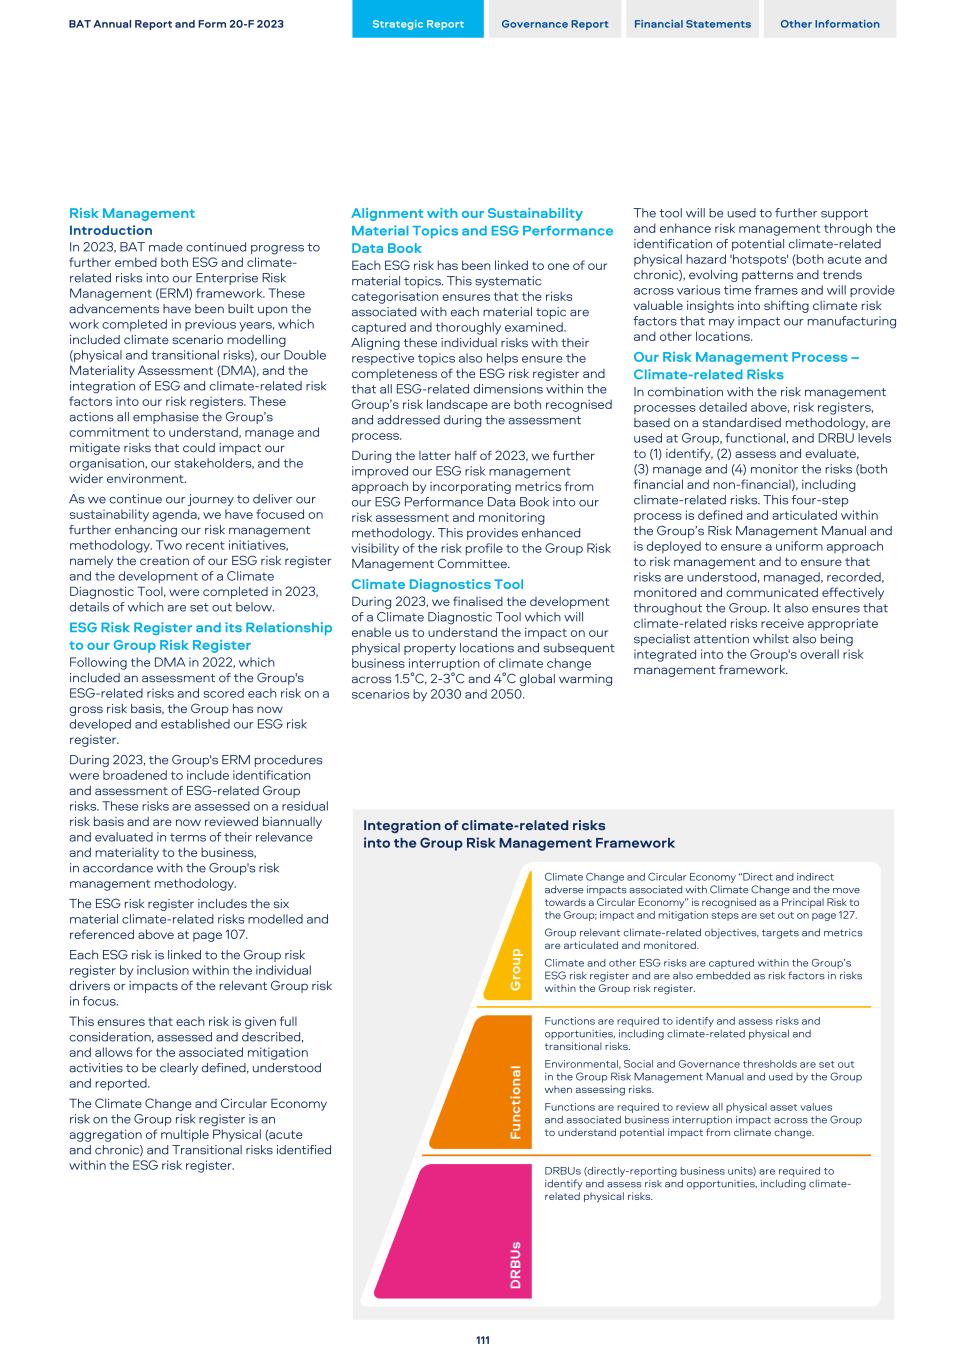
Risk Management Introduction In 2023, BAT made continued progress to further embed both ESG and climate- related risks into our Enterprise Risk Management (ERM) framework. These advancements have been built upon the work completed in previous years, which included climate scenario modelling (physical and transitional risks), our Double Materiality Assessment (DMA), and the integration of ESG and climate-related risk factors into our risk registers. These actions all emphasise the Group’s commitment to understand, manage and mitigate risks that could impact our organisation, our stakeholders, and the wider environment. As we continue our journey to deliver our sustainability agenda, we have focused on further enhancing our risk management methodology. Two recent initiatives, namely the creation of our ESG risk register and the development of a Climate Diagnostic Tool, were completed in 2023, details of which are set out below. ESG Risk Register and its Relationship to our Group Risk Register Following the DMA in 2022, which included an assessment of the Group's ESG-related risks and scored each risk on a gross risk basis, the Group has now developed and established our ESG risk register. During 2023, the Group's ERM procedures were broadened to include identification and assessment of ESG-related Group risks. These risks are assessed on a residual risk basis and are now reviewed biannually and evaluated in terms of their relevance and materiality to the business, in accordance with the Group's risk management methodology. The ESG risk register includes the six material climate-related risks modelled and referenced above at page 107. Each ESG risk is linked to the Group risk register by inclusion within the individual drivers or impacts of the relevant Group risk in focus. This ensures that each risk is given full consideration, assessed and described, and allows for the associated mitigation activities to be clearly defined, understood and reported. The Climate Change and Circular Economy risk on the Group risk register is an aggregation of multiple Physical (acute and chronic) and Transitional risks identified within the ESG risk register. Alignment with our Sustainability Material Topics and ESG Performance Data Book Each ESG risk has been linked to one of our material topics. This systematic categorisation ensures that the risks associated with each material topic are captured and thoroughly examined. Aligning these individual risks with their respective topics also helps ensure the completeness of the ESG risk register and that all ESG-related dimensions within the Group’s risk landscape are both recognised and addressed during the assessment process. During the latter half of 2023, we further improved our ESG risk management approach by incorporating metrics from our ESG Performance Data Book into our risk assessment and monitoring methodology. This provides enhanced visibility of the risk profile to the Group Risk Management Committee. Climate Diagnostics Tool During 2023, we finalised the development of a Climate Diagnostic Tool which will enable us to understand the impact on our physical property locations and subsequent business interruption of climate change across 1.5˚C, 2-3˚C and 4˚C global warming scenarios by 2030 and 2050. The tool will be used to further support and enhance risk management through the identification of potential climate-related physical hazard 'hotspots' (both acute and chronic), evolving patterns and trends across various time frames and will provide valuable insights into shifting climate risk factors that may impact our manufacturing and other locations. Our Risk Management Process – Climate-related Risks In combination with the risk management processes detailed above, risk registers, based on a standardised methodology, are used at Group, functional, and DRBU levels to (1) identify, (2) assess and evaluate, (3) manage and (4) monitor the risks (both financial and non-financial), including climate-related risks. This four-step process is defined and articulated within the Group’s Risk Management Manual and is deployed to ensure a uniform approach to risk management and to ensure that risks are understood, managed, recorded, monitored and communicated effectively throughout the Group. It also ensures that climate-related risks receive appropriate specialist attention whilst also being integrated into the Group's overall risk management framework. BAT Annual Report and Form 20-F 2023 Strategic Report Governance Report Financial Statements Other Information 111 Integration of climate-related risks into the Group Risk Management Framework Climate Change and Circular Economy “Direct and indirect adverse impacts associated with Climate Change and the move towards a Circular Economy” is recognised as a Principal Risk to the Group; impact and mitigation steps are set out on page 127. Group relevant climate-related objectives, targets and metrics are articulated and monitored. Climate and other ESG risks are captured within the Group’s ESG risk register and are also embedded as risk factors in risks within the Group risk register. Functions are required to identify and assess risks and opportunities, including climate-related physical and transitional risks. Environmental, Social and Governance thresholds are set out in the Group Risk Management Manual and used by the Group when assessing risks. Functions are required to review all physical asset values and associated business interruption impact across the Group to understand potential impact from climate change. DRBUs (directly-reporting business units) are required to identify and assess risk and opportunities, including climate- related physical risks.
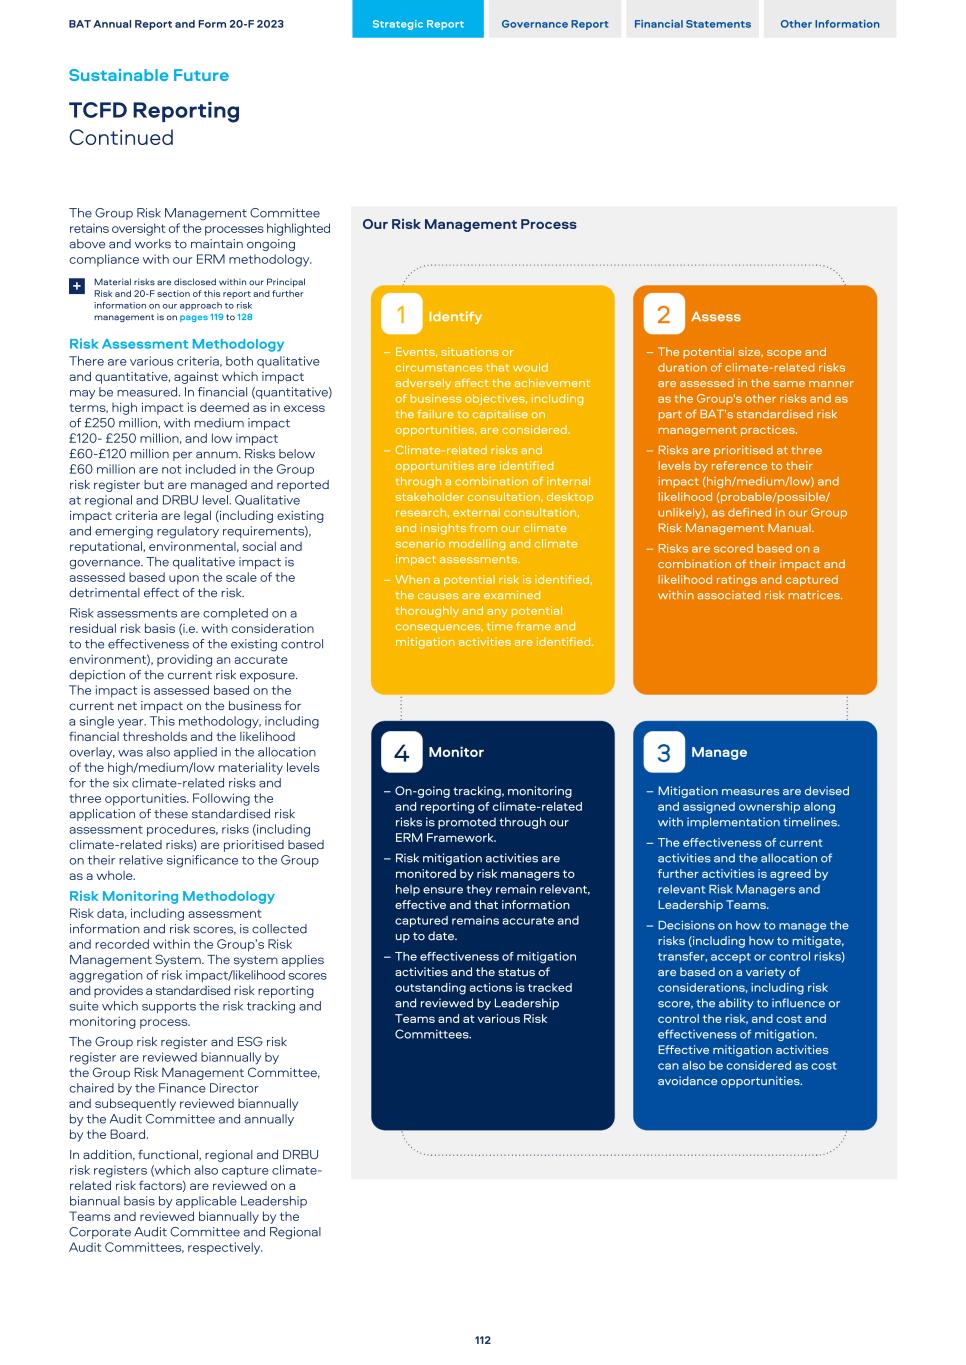
The Group Risk Management Committee retains oversight of the processes highlighted above and works to maintain ongoing compliance with our ERM methodology. Material risks are disclosed within our Principal Risk and 20-F section of this report and further information on our approach to risk management is on pages 119 to 128 + Risk Assessment Methodology There are various criteria, both qualitative and quantitative, against which impact may be measured. In financial (quantitative) terms, high impact is deemed as in excess of £250 million, with medium impact £120- £250 million, and low impact £60-£120 million per annum. Risks below £60 million are not included in the Group risk register but are managed and reported at regional and DRBU level. Qualitative impact criteria are legal (including existing and emerging regulatory requirements), reputational, environmental, social and governance. The qualitative impact is assessed based upon the scale of the detrimental effect of the risk. Risk assessments are completed on a residual risk basis (i.e. with consideration to the effectiveness of the existing control environment), providing an accurate depiction of the current risk exposure. The impact is assessed based on the current net impact on the business for a single year. This methodology, including financial thresholds and the likelihood overlay, was also applied in the allocation of the high/medium/low materiality levels for the six climate-related risks and three opportunities. Following the application of these standardised risk assessment procedures, risks (including climate-related risks) are prioritised based on their relative significance to the Group as a whole. Risk Monitoring Methodology Risk data, including assessment information and risk scores, is collected and recorded within the Group’s Risk Management System. The system applies aggregation of risk impact/likelihood scores and provides a standardised risk reporting suite which supports the risk tracking and monitoring process. The Group risk register and ESG risk register are reviewed biannually by the Group Risk Management Committee, chaired by the Finance Director and subsequently reviewed biannually by the Audit Committee and annually by the Board. In addition, functional, regional and DRBU risk registers (which also capture climate- related risk factors) are reviewed on a biannual basis by applicable Leadership Teams and reviewed biannually by the Corporate Audit Committee and Regional Audit Committees, respectively. Our Risk Management Process Identify – Events, situations or circumstances that would adversely affect the achievement of business objectives, including the failure to capitalise on opportunities, are considered. – Climate-related risks and opportunities are identified through a combination of internal stakeholder consultation, desktop research, external consultation, and insights from our climate scenario modelling and climate impact assessments. – When a potential risk is identified, the causes are examined thoroughly and any potential consequences, time frame and mitigation activities are identified. Monitor – On-going tracking, monitoring and reporting of climate-related risks is promoted through our ERM Framework. – Risk mitigation activities are monitored by risk managers to help ensure they remain relevant, effective and that information captured remains accurate and up to date. – The effectiveness of mitigation activities and the status of outstanding actions is tracked and reviewed by Leadership Teams and at various Risk Committees. Assess – The potential size, scope and duration of climate-related risks are assessed in the same manner as the Group's other risks and as part of BAT’s standardised risk management practices. – Risks are prioritised at three levels by reference to their impact (high/medium/low) and likelihood (probable/possible/ unlikely), as defined in our Group Risk Management Manual. – Risks are scored based on a combination of their impact and likelihood ratings and captured within associated risk matrices. Manage – Mitigation measures are devised and assigned ownership along with implementation timelines. – The effectiveness of current activities and the allocation of further activities is agreed by relevant Risk Managers and Leadership Teams. – Decisions on how to manage the risks (including how to mitigate, transfer, accept or control risks) are based on a variety of considerations, including risk score, the ability to influence or control the risk, and cost and effectiveness of mitigation. Effective mitigation activities can also be considered as cost avoidance opportunities. BAT Annual Report and Form 20-F 2023 Strategic Report Governance Report Financial Statements Other Information Sustainable Future TCFD Reporting Continued 112
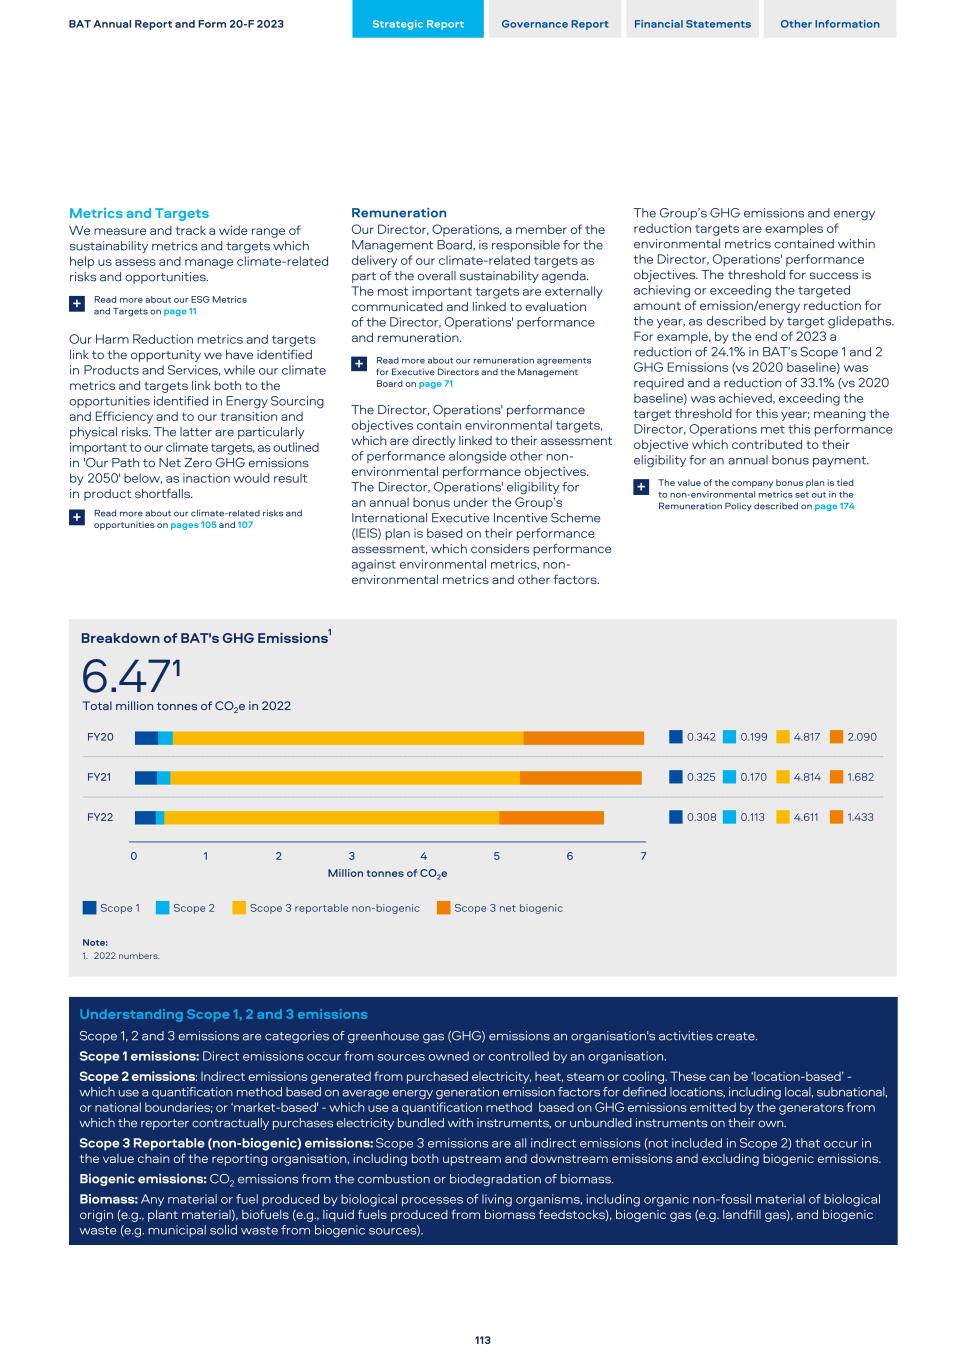
Metrics and Targets We measure and track a wide range of sustainability metrics and targets which help us assess and manage climate-related risks and opportunities. Read more about our ESG Metrics and Targets on page 11+ Our Harm Reduction metrics and targets link to the opportunity we have identified in Products and Services, while our climate metrics and targets link both to the opportunities identified in Energy Sourcing and Efficiency and to our transition and physical risks. The latter are particularly important to our climate targets, as outlined in 'Our Path to Net Zero GHG emissions by 2050' below, as inaction would result in product shortfalls. Read more about our climate-related risks and opportunities on pages 105 and 107+ Remuneration Our Director, Operations, a member of the Management Board, is responsible for the delivery of our climate-related targets as part of the overall sustainability agenda. The most important targets are externally communicated and linked to evaluation of the Director, Operations' performance and remuneration. Read more about our remuneration agreements for Executive Directors and the Management Board on page 71 + The Director, Operations' performance objectives contain environmental targets, which are directly linked to their assessment of performance alongside other non- environmental performance objectives. The Director, Operations' eligibility for an annual bonus under the Group’s International Executive Incentive Scheme (IEIS) plan is based on their performance assessment, which considers performance against environmental metrics, non- environmental metrics and other factors. The Group’s GHG emissions and energy reduction targets are examples of environmental metrics contained within the Director, Operations' performance objectives. The threshold for success is achieving or exceeding the targeted amount of emission/energy reduction for the year, as described by target glidepaths. For example, by the end of 2023 a reduction of 24.1% in BAT’s Scope 1 and 2 GHG Emissions (vs 2020 baseline) was required and a reduction of 33.1% (vs 2020 baseline) was achieved, exceeding the target threshold for this year; meaning the Director, Operations met this performance objective which contributed to their eligibility for an annual bonus payment. The value of the company bonus plan is tied to non-environmental metrics set out in the Remuneration Policy described on page 174 + BAT Annual Report and Form 20-F 2023 Strategic Report Governance Report Financial Statements Other Information 113 6.47¹ Total million tonnes of CO2e in 2022 FY20 0.342 0.199 4.817 2.090 FY21 0.325 0.170 4.814 1.682 FY22 0.308 0.113 4.611 1.433 Million tonnes of CO2e 0 1 2 3 4 5 6 7 Breakdown of BAT's GHG Emissions1 Scope 1 Scope 2 Scope 3 reportable non-biogenic Scope 3 net biogenic Understanding Scope 1, 2 and 3 emissions Scope 1, 2 and 3 emissions are categories of greenhouse gas (GHG) emissions an organisation's activities create. Scope 1 emissions: Direct emissions occur from sources owned or controlled by an organisation. Scope 2 emissions: Indirect emissions generated from purchased electricity, heat, steam or cooling. These can be ‘location-based’ - which use a quantification method based on average energy generation emission factors for defined locations, including local, subnational, or national boundaries; or ‘market-based' - which use a quantification method based on GHG emissions emitted by the generators from which the reporter contractually purchases electricity bundled with instruments, or unbundled instruments on their own. Scope 3 Reportable (non-biogenic) emissions: Scope 3 emissions are all indirect emissions (not included in Scope 2) that occur in the value chain of the reporting organisation, including both upstream and downstream emissions and excluding biogenic emissions. Biogenic emissions: CO2 emissions from the combustion or biodegradation of biomass. Biomass: Any material or fuel produced by biological processes of living organisms, including organic non-fossil material of biological origin (e.g., plant material), biofuels (e.g., liquid fuels produced from biomass feedstocks), biogenic gas (e.g. landfill gas), and biogenic waste (e.g. municipal solid waste from biogenic sources). Note: 1. 2022 numbers.
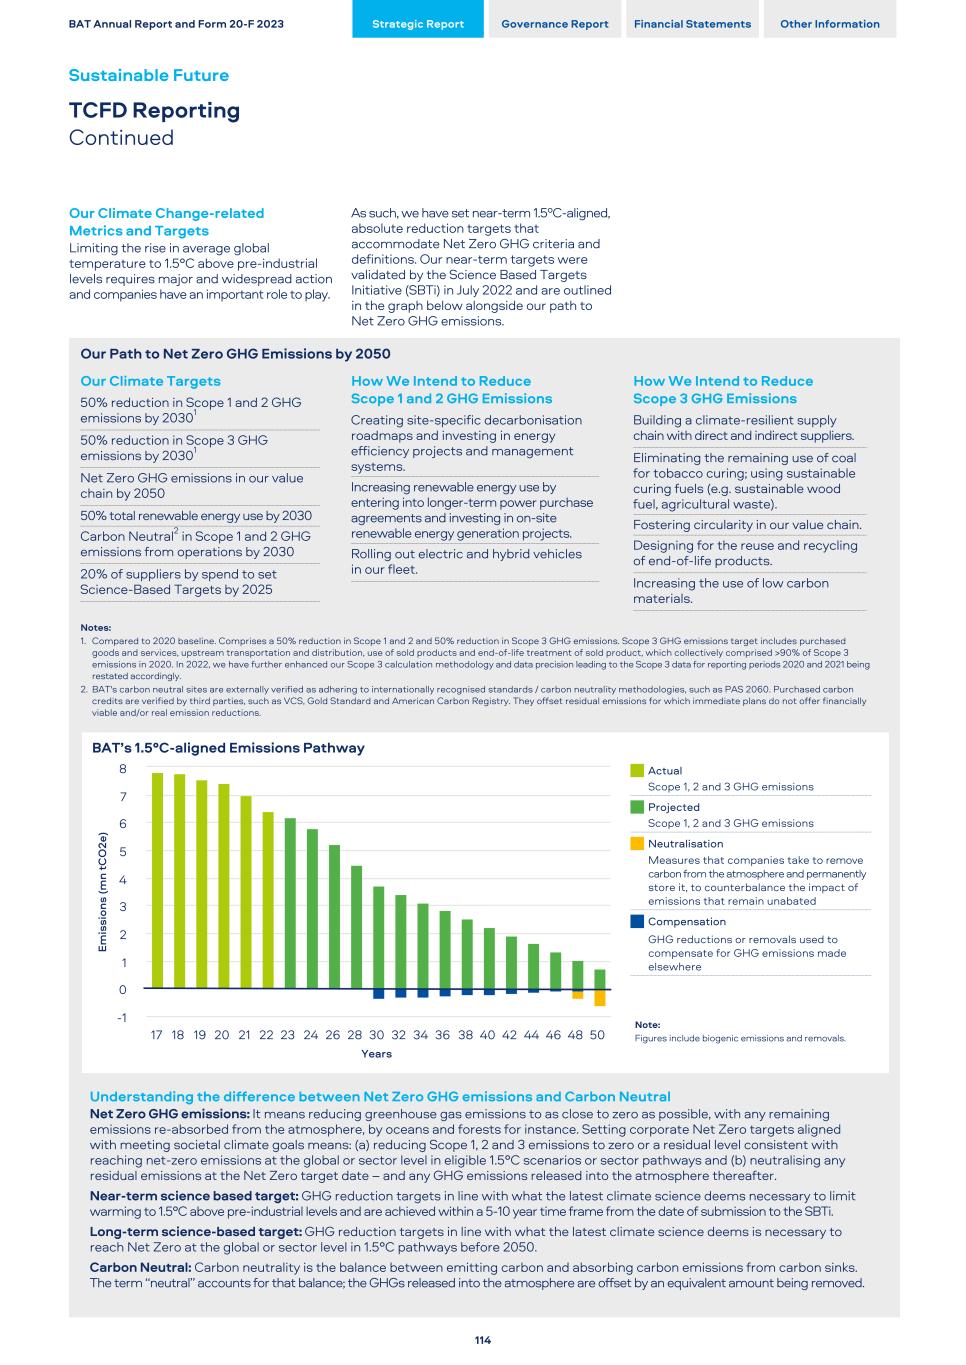
Our Climate Change-related Metrics and Targets Limiting the rise in average global temperature to 1.5°C above pre-industrial levels requires major and widespread action and companies have an important role to play. As such, we have set near-term 1.5ºC-aligned, absolute reduction targets that accommodate Net Zero GHG criteria and definitions. Our near-term targets were validated by the Science Based Targets Initiative (SBTi) in July 2022 and are outlined in the graph below alongside our path to Net Zero GHG emissions. Our Path to Net Zero GHG Emissions by 2050 Our Climate Targets 50% reduction in Scope 1 and 2 GHG emissions by 20301 50% reduction in Scope 3 GHG emissions by 20301 Net Zero GHG emissions in our value chain by 2050 50% total renewable energy use by 2030 Carbon Neutral2 in Scope 1 and 2 GHG emissions from operations by 2030 20% of suppliers by spend to set Science-Based Targets by 2025 How We Intend to Reduce Scope 1 and 2 GHG Emissions Creating site-specific decarbonisation roadmaps and investing in energy efficiency projects and management systems. Increasing renewable energy use by entering into longer-term power purchase agreements and investing in on-site renewable energy generation projects. Rolling out electric and hybrid vehicles in our fleet. How We Intend to Reduce Scope 3 GHG Emissions Building a climate-resilient supply chain with direct and indirect suppliers. Eliminating the remaining use of coal for tobacco curing; using sustainable curing fuels (e.g. sustainable wood fuel, agricultural waste). Fostering circularity in our value chain. Designing for the reuse and recycling of end-of-life products. Increasing the use of low carbon materials. Notes: 1. Compared to 2020 baseline. Comprises a 50% reduction in Scope 1 and 2 and 50% reduction in Scope 3 GHG emissions. Scope 3 GHG emissions target includes purchased goods and services, upstream transportation and distribution, use of sold products and end-of-life treatment of sold product, which collectively comprised >90% of Scope 3 emissions in 2020. In 2022, we have further enhanced our Scope 3 calculation methodology and data precision leading to the Scope 3 data for reporting periods 2020 and 2021 being restated accordingly. 2. BAT's carbon neutral sites are externally verified as adhering to internationally recognised standards / carbon neutrality methodologies, such as PAS 2060. Purchased carbon credits are verified by third parties, such as VCS, Gold Standard and American Carbon Registry. They offset residual emissions for which immediate plans do not offer financially viable and/or real emission reductions. BAT’s 1.5°C-aligned Emissions Pathway Actual Scope 1, 2 and 3 GHG emissions Projected Scope 1, 2 and 3 GHG emissions Neutralisation Measures that companies take to remove carbon from the atmosphere and permanently store it, to counterbalance the impact of emissions that remain unabated Compensation GHG reductions or removals used to compensate for GHG emissions made elsewhere Note: Figures include biogenic emissions and removals. Understanding the difference between Net Zero GHG emissions and Carbon Neutral Net Zero GHG emissions: It means reducing greenhouse gas emissions to as close to zero as possible, with any remaining emissions re-absorbed from the atmosphere, by oceans and forests for instance. Setting corporate Net Zero targets aligned with meeting societal climate goals means: (a) reducing Scope 1, 2 and 3 emissions to zero or a residual level consistent with reaching net-zero emissions at the global or sector level in eligible 1.5°C scenarios or sector pathways and (b) neutralising any residual emissions at the Net Zero target date – and any GHG emissions released into the atmosphere thereafter. Near-term science based target: GHG reduction targets in line with what the latest climate science deems necessary to limit warming to 1.5°C above pre-industrial levels and are achieved within a 5-10 year time frame from the date of submission to the SBTi. Long-term science-based target: GHG reduction targets in line with what the latest climate science deems is necessary to reach Net Zero at the global or sector level in 1.5°C pathways before 2050. Carbon Neutral: Carbon neutrality is the balance between emitting carbon and absorbing carbon emissions from carbon sinks. The term “neutral” accounts for that balance; the GHGs released into the atmosphere are offset by an equivalent amount being removed. BAT Annual Report and Form 20-F 2023 Strategic Report Governance Report Financial Statements Other Information Sustainable Future TCFD Reporting Continued 114 Years Em is si on s (m n tC O 2e ) 17 18 19 20 21 22 23 24 26 28 30 32 34 36 38 40 42 44 46 48 50 -1 0 1 2 3 4 5 6 7 8
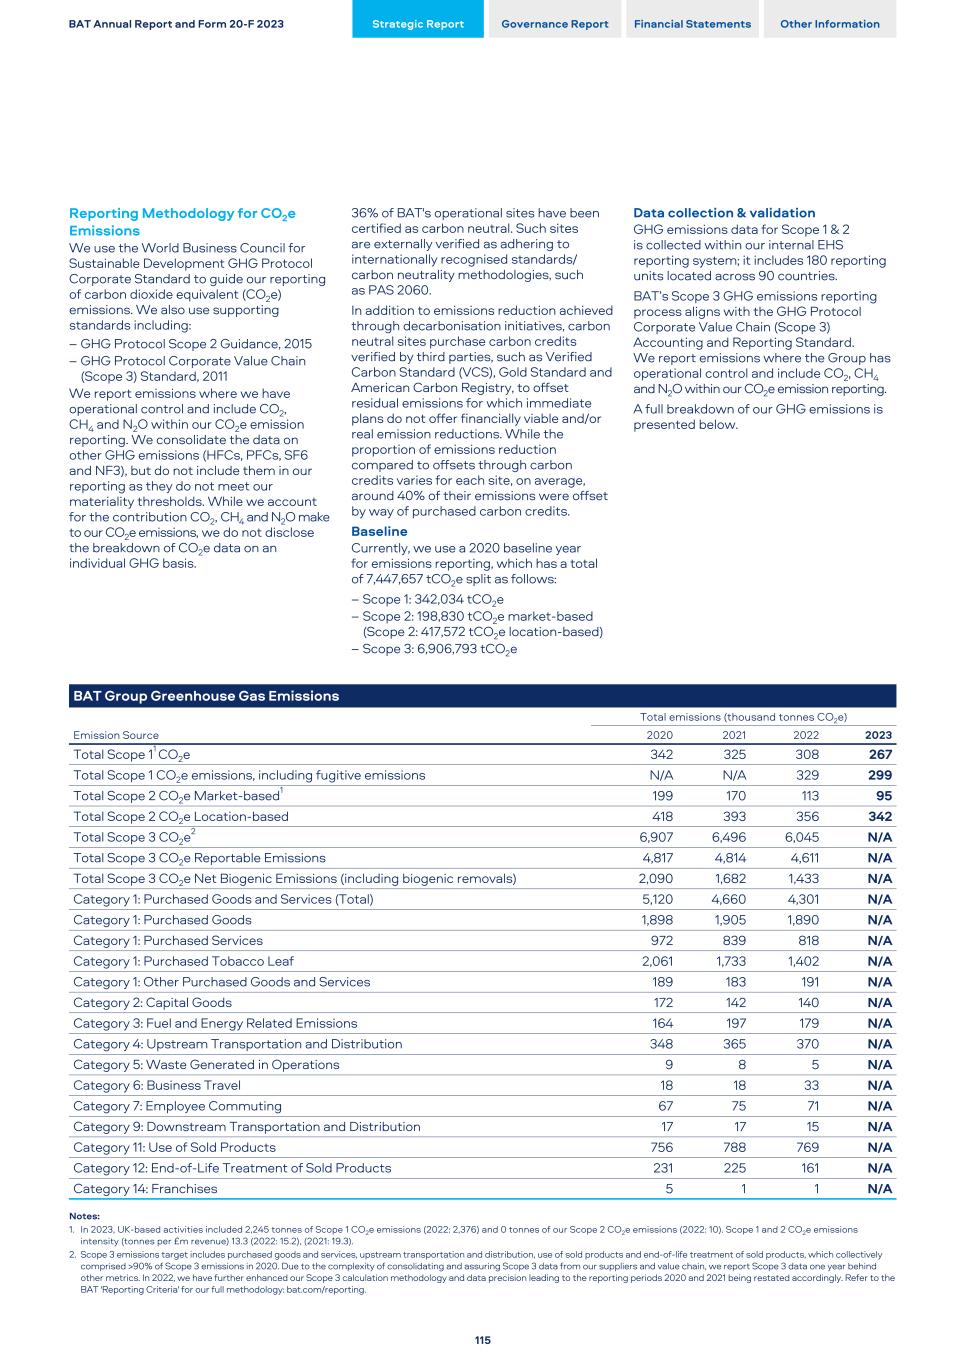
Reporting Methodology for CO2e Emissions We use the World Business Council for Sustainable Development GHG Protocol Corporate Standard to guide our reporting of carbon dioxide equivalent (CO2e) emissions. We also use supporting standards including: – GHG Protocol Scope 2 Guidance, 2015 – GHG Protocol Corporate Value Chain (Scope 3) Standard, 2011 We report emissions where we have operational control and include CO2, CH4 and N2O within our CO2e emission reporting. We consolidate the data on other GHG emissions (HFCs, PFCs, SF6 and NF3), but do not include them in our reporting as they do not meet our materiality thresholds. While we account for the contribution CO2, CH4 and N2O make to our CO2e emissions, we do not disclose the breakdown of CO2e data on an individual GHG basis. 36% of BAT's operational sites have been certified as carbon neutral. Such sites are externally verified as adhering to internationally recognised standards/ carbon neutrality methodologies, such as PAS 2060. In addition to emissions reduction achieved through decarbonisation initiatives, carbon neutral sites purchase carbon credits verified by third parties, such as Verified Carbon Standard (VCS), Gold Standard and American Carbon Registry, to offset residual emissions for which immediate plans do not offer financially viable and/or real emission reductions. While the proportion of emissions reduction compared to offsets through carbon credits varies for each site, on average, around 40% of their emissions were offset by way of purchased carbon credits. Baseline Currently, we use a 2020 baseline year for emissions reporting, which has a total of 7,447,657 tCO2e split as follows: – Scope 1: 342,034 tCO2e – Scope 2: 198,830 tCO2e market-based (Scope 2: 417,572 tCO2e location-based) – Scope 3: 6,906,793 tCO2e Data collection & validation GHG emissions data for Scope 1 & 2 is collected within our internal EHS reporting system; it includes 180 reporting units located across 90 countries. BAT’s Scope 3 GHG emissions reporting process aligns with the GHG Protocol Corporate Value Chain (Scope 3) Accounting and Reporting Standard. We report emissions where the Group has operational control and include CO2, CH4 and N2O within our CO2e emission reporting. A full breakdown of our GHG emissions is presented below. BAT Group Greenhouse Gas Emissions Total emissions (thousand tonnes CO2e) Emission Source 2020 2021 2022 2023 Total Scope 11 CO2e 342 325 308 267 Total Scope 1 CO2e emissions, including fugitive emissions N/A N/A 329 299 Total Scope 2 CO2e Market-based1 199 170 113 95 Total Scope 2 CO2e Location-based 418 393 356 342 Total Scope 3 CO2e2 6,907 6,496 6,045 N/A Total Scope 3 CO2e Reportable Emissions 4,817 4,814 4,611 N/A Total Scope 3 CO2e Net Biogenic Emissions (including biogenic removals) 2,090 1,682 1,433 N/A Category 1: Purchased Goods and Services (Total) 5,120 4,660 4,301 N/A Category 1: Purchased Goods 1,898 1,905 1,890 N/A Category 1: Purchased Services 972 839 818 N/A Category 1: Purchased Tobacco Leaf 2,061 1,733 1,402 N/A Category 1: Other Purchased Goods and Services 189 183 191 N/A Category 2: Capital Goods 172 142 140 N/A Category 3: Fuel and Energy Related Emissions 164 197 179 N/A Category 4: Upstream Transportation and Distribution 348 365 370 N/A Category 5: Waste Generated in Operations 9 8 5 N/A Category 6: Business Travel 18 18 33 N/A Category 7: Employee Commuting 67 75 71 N/A Category 9: Downstream Transportation and Distribution 17 17 15 N/A Category 11: Use of Sold Products 756 788 769 N/A Category 12: End-of-Life Treatment of Sold Products 231 225 161 N/A Category 14: Franchises 5 1 1 N/A Notes: 1. In 2023, UK-based activities included 2,245 tonnes of Scope 1 CO2e emissions (2022: 2,376) and 0 tonnes of our Scope 2 CO2e emissions (2022: 10). Scope 1 and 2 CO2e emissions intensity (tonnes per £m revenue) 13.3 (2022: 15.2), (2021: 19.3). 2. Scope 3 emissions target includes purchased goods and services, upstream transportation and distribution, use of sold products and end-of-life treatment of sold products, which collectively comprised >90% of Scope 3 emissions in 2020. Due to the complexity of consolidating and assuring Scope 3 data from our suppliers and value chain, we report Scope 3 data one year behind other metrics. In 2022, we have further enhanced our Scope 3 calculation methodology and data precision leading to the reporting periods 2020 and 2021 being restated accordingly. Refer to the BAT 'Reporting Criteria' for our full methodology: bat.com/reporting. BAT Annual Report and Form 20-F 2023 Strategic Report Governance Report Financial Statements Other Information 115
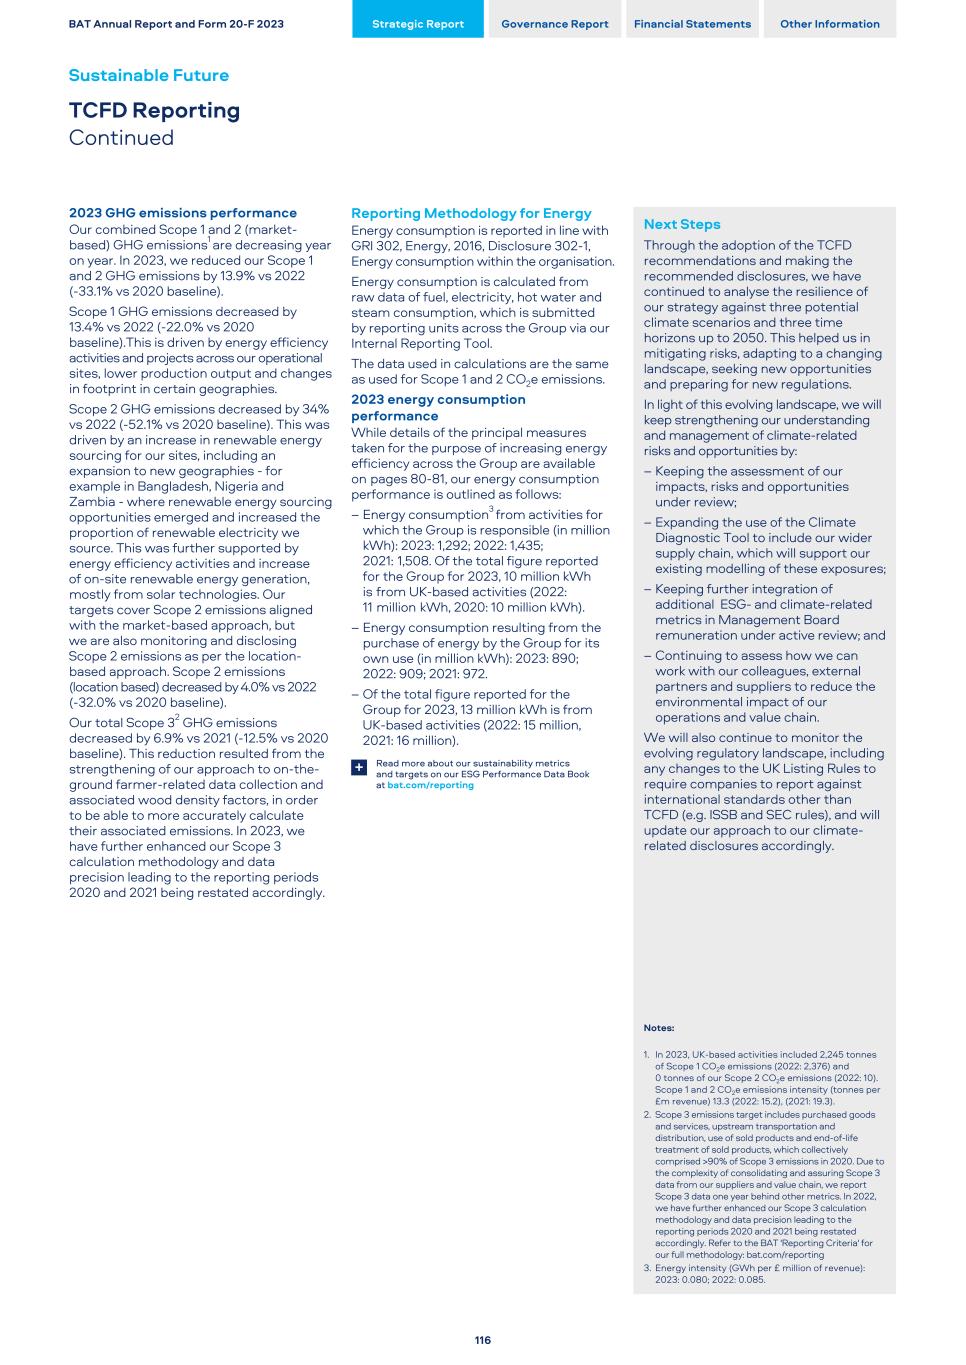
2023 GHG emissions performance Our combined Scope 1 and 2 (market- based) GHG emissions1 are decreasing year on year. In 2023, we reduced our Scope 1 and 2 GHG emissions by 13.9% vs 2022 (-33.1% vs 2020 baseline). Scope 1 GHG emissions decreased by 13.4% vs 2022 (-22.0% vs 2020 baseline).This is driven by energy efficiency activities and projects across our operational sites, lower production output and changes in footprint in certain geographies. Scope 2 GHG emissions decreased by 34% vs 2022 (-52.1% vs 2020 baseline). This was driven by an increase in renewable energy sourcing for our sites, including an expansion to new geographies - for example in Bangladesh, Nigeria and Zambia - where renewable energy sourcing opportunities emerged and increased the proportion of renewable electricity we source. This was further supported by energy efficiency activities and increase of on-site renewable energy generation, mostly from solar technologies. Our targets cover Scope 2 emissions aligned with the market-based approach, but we are also monitoring and disclosing Scope 2 emissions as per the location- based approach. Scope 2 emissions (location based) decreased by 4.0% vs 2022 (-32.0% vs 2020 baseline). Our total Scope 32 GHG emissions decreased by 6.9% vs 2021 (-12.5% vs 2020 baseline). This reduction resulted from the strengthening of our approach to on-the- ground farmer-related data collection and associated wood density factors, in order to be able to more accurately calculate their associated emissions. In 2023, we have further enhanced our Scope 3 calculation methodology and data precision leading to the reporting periods 2020 and 2021 being restated accordingly. Reporting Methodology for Energy Energy consumption is reported in line with GRI 302, Energy, 2016, Disclosure 302-1, Energy consumption within the organisation. Energy consumption is calculated from raw data of fuel, electricity, hot water and steam consumption, which is submitted by reporting units across the Group via our Internal Reporting Tool. The data used in calculations are the same as used for Scope 1 and 2 CO2e emissions. 2023 energy consumption performance While details of the principal measures taken for the purpose of increasing energy efficiency across the Group are available on pages 80-81, our energy consumption performance is outlined as follows: – Energy consumption3 from activities for which the Group is responsible (in million kWh): 2023: 1,292; 2022: 1,435; 2021: 1,508. Of the total figure reported for the Group for 2023, 10 million kWh is from UK-based activities (2022: 11 million kWh, 2020: 10 million kWh). – Energy consumption resulting from the purchase of energy by the Group for its own use (in million kWh): 2023: 890; 2022: 909; 2021: 972. – Of the total figure reported for the Group for 2023, 13 million kWh is from UK-based activities (2022: 15 million, 2021: 16 million). Read more about our sustainability metrics and targets on our ESG Performance Data Book at bat.com/reporting + Next Steps Through the adoption of the TCFD recommendations and making the recommended disclosures, we have continued to analyse the resilience of our strategy against three potential climate scenarios and three time horizons up to 2050. This helped us in mitigating risks, adapting to a changing landscape, seeking new opportunities and preparing for new regulations. In light of this evolving landscape, we will keep strengthening our understanding and management of climate-related risks and opportunities by: – Keeping the assessment of our impacts, risks and opportunities under review; – Expanding the use of the Climate Diagnostic Tool to include our wider supply chain, which will support our existing modelling of these exposures; – Keeping further integration of additional ESG- and climate-related metrics in Management Board remuneration under active review; and – Continuing to assess how we can work with our colleagues, external partners and suppliers to reduce the environmental impact of our operations and value chain. We will also continue to monitor the evolving regulatory landscape, including any changes to the UK Listing Rules to require companies to report against international standards other than TCFD (e.g. ISSB and SEC rules), and will update our approach to our climate- related disclosures accordingly. Notes: 1. In 2023, UK-based activities included 2,245 tonnes of Scope 1 CO2e emissions (2022: 2,376) and 0 tonnes of our Scope 2 CO2e emissions (2022: 10). Scope 1 and 2 CO2e emissions intensity (tonnes per £m revenue) 13.3 (2022: 15.2), (2021: 19.3). 2. Scope 3 emissions target includes purchased goods and services, upstream transportation and distribution, use of sold products and end-of-life treatment of sold products, which collectively comprised >90% of Scope 3 emissions in 2020. Due to the complexity of consolidating and assuring Scope 3 data from our suppliers and value chain, we report Scope 3 data one year behind other metrics. In 2022, we have further enhanced our Scope 3 calculation methodology and data precision leading to the reporting periods 2020 and 2021 being restated accordingly. Refer to the BAT 'Reporting Criteria' for our full methodology: bat.com/reporting 3. Energy intensity (GWh per £ million of revenue): 2023: 0.080; 2022: 0.085. BAT Annual Report and Form 20-F 2023 Strategic Report Governance Report Financial Statements Other Information Sustainable Future TCFD Reporting Continued 116
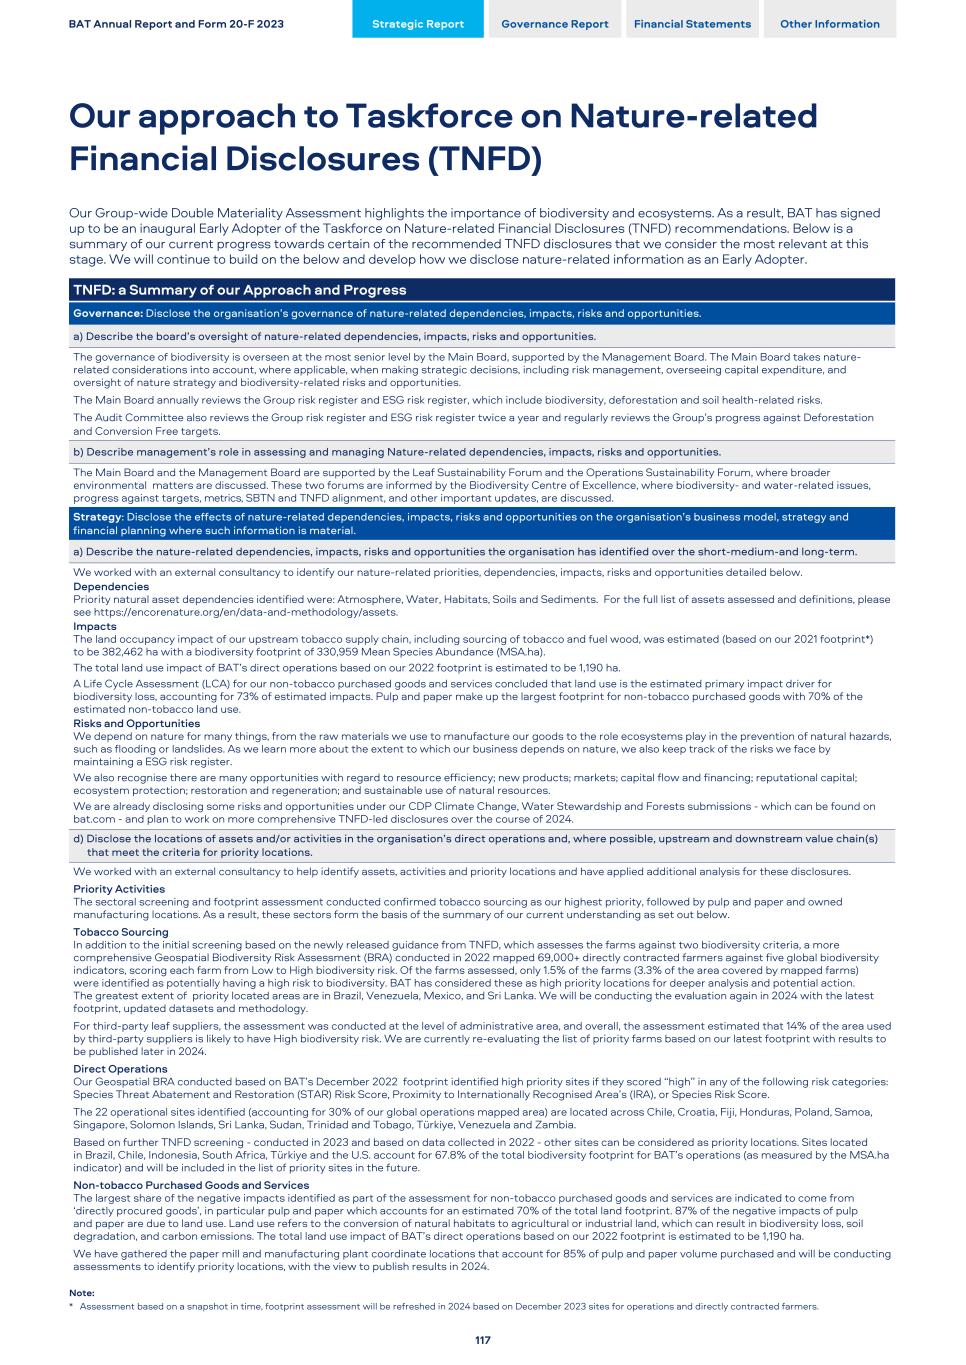
Our Group-wide Double Materiality Assessment highlights the importance of biodiversity and ecosystems. As a result, BAT has signed up to be an inaugural Early Adopter of the Taskforce on Nature-related Financial Disclosures (TNFD) recommendations. Below is a summary of our current progress towards certain of the recommended TNFD disclosures that we consider the most relevant at this stage. We will continue to build on the below and develop how we disclose nature-related information as an Early Adopter. TNFD: a Summary of our Approach and Progress Governance: Disclose the organisation’s governance of nature-related dependencies, impacts, risks and opportunities. a) Describe the board’s oversight of nature-related dependencies, impacts, risks and opportunities. The governance of biodiversity is overseen at the most senior level by the Main Board, supported by the Management Board. The Main Board takes nature- related considerations into account, where applicable, when making strategic decisions, including risk management, overseeing capital expenditure, and oversight of nature strategy and biodiversity-related risks and opportunities. The Main Board annually reviews the Group risk register and ESG risk register, which include biodiversity, deforestation and soil health-related risks. The Audit Committee also reviews the Group risk register and ESG risk register twice a year and regularly reviews the Group’s progress against Deforestation and Conversion Free targets. b) Describe management’s role in assessing and managing Nature-related dependencies, impacts, risks and opportunities. The Main Board and the Management Board are supported by the Leaf Sustainability Forum and the Operations Sustainability Forum, where broader environmental matters are discussed. These two forums are informed by the Biodiversity Centre of Excellence, where biodiversity- and water-related issues, progress against targets, metrics, SBTN and TNFD alignment, and other important updates, are discussed. Strategy: Disclose the effects of nature-related dependencies, impacts, risks and opportunities on the organisation’s business model, strategy and financial planning where such information is material. a) Describe the nature-related dependencies, impacts, risks and opportunities the organisation has identified over the short-medium-and long-term. We worked with an external consultancy to identify our nature-related priorities, dependencies, impacts, risks and opportunities detailed below. Dependencies Priority natural asset dependencies identified were: Atmosphere, Water, Habitats, Soils and Sediments. For the full list of assets assessed and definitions, please see https://encorenature.org/en/data-and-methodology/assets. Impacts The land occupancy impact of our upstream tobacco supply chain, including sourcing of tobacco and fuel wood, was estimated (based on our 2021 footprint*) to be 382,462 ha with a biodiversity footprint of 330,959 Mean Species Abundance (MSA.ha). The total land use impact of BAT’s direct operations based on our 2022 footprint is estimated to be 1,190 ha. A Life Cycle Assessment (LCA) for our non-tobacco purchased goods and services concluded that land use is the estimated primary impact driver for biodiversity loss, accounting for 73% of estimated impacts. Pulp and paper make up the largest footprint for non-tobacco purchased goods with 70% of the estimated non-tobacco land use. Risks and Opportunities We depend on nature for many things, from the raw materials we use to manufacture our goods to the role ecosystems play in the prevention of natural hazards, such as flooding or landslides. As we learn more about the extent to which our business depends on nature, we also keep track of the risks we face by maintaining a ESG risk register. We also recognise there are many opportunities with regard to resource efficiency; new products; markets; capital flow and financing; reputational capital; ecosystem protection; restoration and regeneration; and sustainable use of natural resources. We are already disclosing some risks and opportunities under our CDP Climate Change, Water Stewardship and Forests submissions - which can be found on bat.com - and plan to work on more comprehensive TNFD-led disclosures over the course of 2024. d) Disclose the locations of assets and/or activities in the organisation’s direct operations and, where possible, upstream and downstream value chain(s) that meet the criteria for priority locations. We worked with an external consultancy to help identify assets, activities and priority locations and have applied additional analysis for these disclosures. Priority Activities The sectoral screening and footprint assessment conducted confirmed tobacco sourcing as our highest priority, followed by pulp and paper and owned manufacturing locations. As a result, these sectors form the basis of the summary of our current understanding as set out below. Tobacco Sourcing In addition to the initial screening based on the newly released guidance from TNFD, which assesses the farms against two biodiversity criteria, a more comprehensive Geospatial Biodiversity Risk Assessment (BRA) conducted in 2022 mapped 69,000+ directly contracted farmers against five global biodiversity indicators, scoring each farm from Low to High biodiversity risk. Of the farms assessed, only 1.5% of the farms (3.3% of the area covered by mapped farms) were identified as potentially having a high risk to biodiversity. BAT has considered these as high priority locations for deeper analysis and potential action. The greatest extent of priority located areas are in Brazil, Venezuela, Mexico, and Sri Lanka. We will be conducting the evaluation again in 2024 with the latest footprint, updated datasets and methodology. For third-party leaf suppliers, the assessment was conducted at the level of administrative area, and overall, the assessment estimated that 14% of the area used by third-party suppliers is likely to have High biodiversity risk. We are currently re-evaluating the list of priority farms based on our latest footprint with results to be published later in 2024. Direct Operations Our Geospatial BRA conducted based on BAT’s December 2022 footprint identified high priority sites if they scored “high” in any of the following risk categories: Species Threat Abatement and Restoration (STAR) Risk Score, Proximity to Internationally Recognised Area’s (IRA), or Species Risk Score. The 22 operational sites identified (accounting for 30% of our global operations mapped area) are located across Chile, Croatia, Fiji, Honduras, Poland, Samoa, Singapore, Solomon Islands, Sri Lanka, Sudan, Trinidad and Tobago, Türkiye, Venezuela and Zambia. Based on further TNFD screening - conducted in 2023 and based on data collected in 2022 - other sites can be considered as priority locations. Sites located in Brazil, Chile, Indonesia, South Africa, Türkiye and the U.S. account for 67.8% of the total biodiversity footprint for BAT’s operations (as measured by the MSA.ha indicator) and will be included in the list of priority sites in the future. Non-tobacco Purchased Goods and Services The largest share of the negative impacts identified as part of the assessment for non-tobacco purchased goods and services are indicated to come from ‘directly procured goods’, in particular pulp and paper which accounts for an estimated 70% of the total land footprint. 87% of the negative impacts of pulp and paper are due to land use. Land use refers to the conversion of natural habitats to agricultural or industrial land, which can result in biodiversity loss, soil degradation, and carbon emissions. The total land use impact of BAT’s direct operations based on our 2022 footprint is estimated to be 1,190 ha. We have gathered the paper mill and manufacturing plant coordinate locations that account for 85% of pulp and paper volume purchased and will be conducting assessments to identify priority locations, with the view to publish results in 2024. Note: * Assessment based on a snapshot in time, footprint assessment will be refreshed in 2024 based on December 2023 sites for operations and directly contracted farmers. BAT Annual Report and Form 20-F 2023 Strategic Report Governance Report Financial Statements Other Information Our approach to Taskforce on Nature-related Financial Disclosures (TNFD) 117
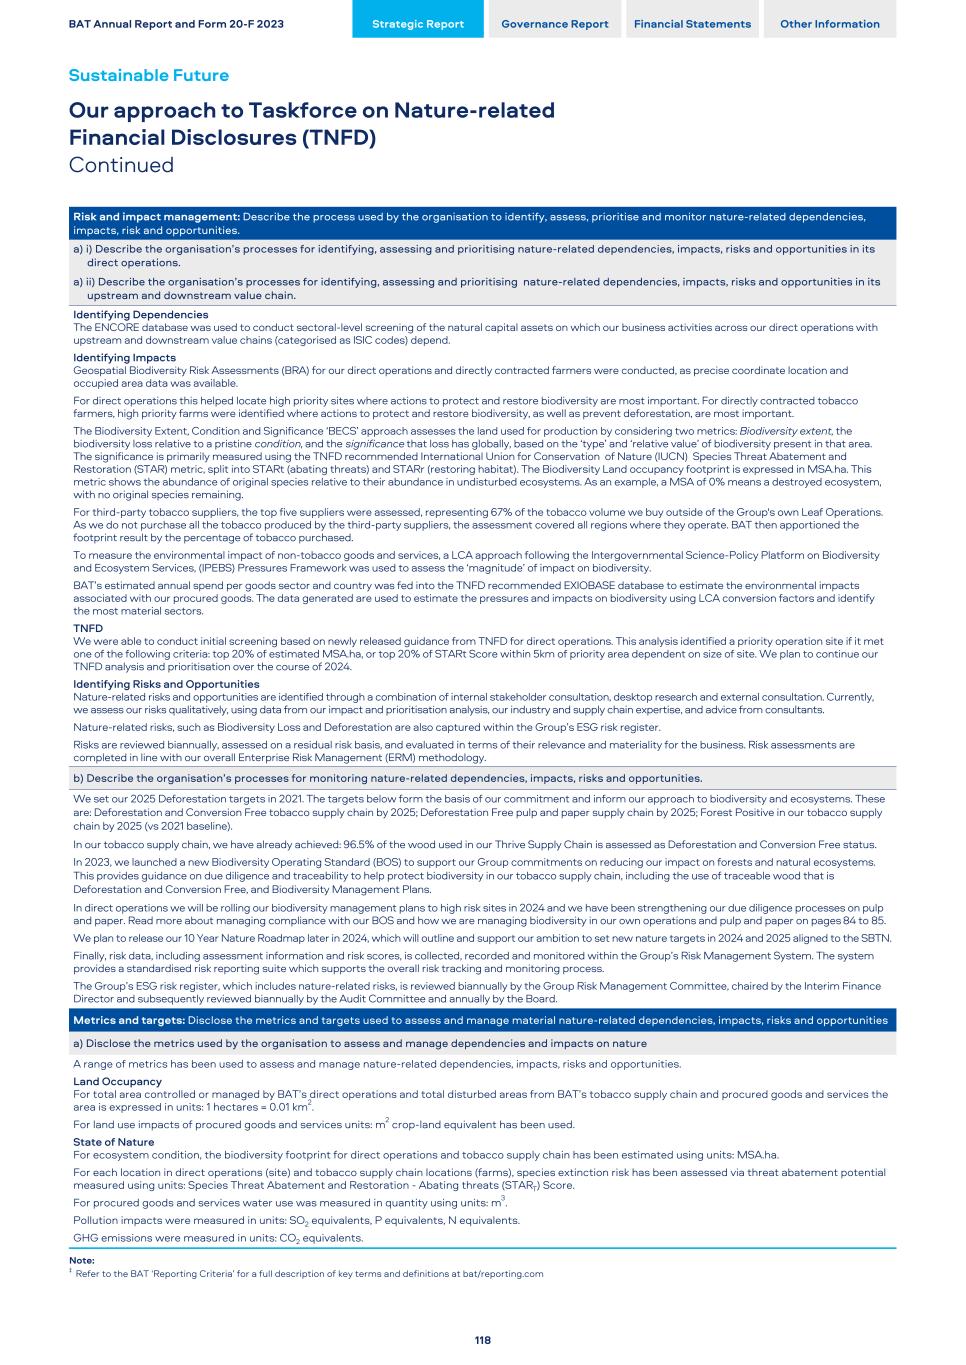
Risk and impact management: Describe the process used by the organisation to identify, assess, prioritise and monitor nature-related dependencies, impacts, risk and opportunities. a) i) Describe the organisation’s processes for identifying, assessing and prioritising nature-related dependencies, impacts, risks and opportunities in its direct operations. a) ii) Describe the organisation’s processes for identifying, assessing and prioritising nature-related dependencies, impacts, risks and opportunities in its upstream and downstream value chain. Identifying Dependencies The ENCORE database was used to conduct sectoral-level screening of the natural capital assets on which our business activities across our direct operations with upstream and downstream value chains (categorised as ISIC codes) depend. Identifying Impacts Geospatial Biodiversity Risk Assessments (BRA) for our direct operations and directly contracted farmers were conducted, as precise coordinate location and occupied area data was available. For direct operations this helped locate high priority sites where actions to protect and restore biodiversity are most important. For directly contracted tobacco farmers, high priority farms were identified where actions to protect and restore biodiversity, as well as prevent deforestation, are most important. The Biodiversity Extent, Condition and Significance ‘BECS’ approach assesses the land used for production by considering two metrics: Biodiversity extent, the biodiversity loss relative to a pristine condition, and the significance that loss has globally, based on the ‘type’ and ‘relative value’ of biodiversity present in that area. The significance is primarily measured using the TNFD recommended International Union for Conservation of Nature (IUCN) Species Threat Abatement and Restoration (STAR) metric, split into STARt (abating threats) and STARr (restoring habitat). The Biodiversity Land occupancy footprint is expressed in MSA.ha. This metric shows the abundance of original species relative to their abundance in undisturbed ecosystems. As an example, a MSA of 0% means a destroyed ecosystem, with no original species remaining. For third-party tobacco suppliers, the top five suppliers were assessed, representing 67% of the tobacco volume we buy outside of the Group's own Leaf Operations. As we do not purchase all the tobacco produced by the third-party suppliers, the assessment covered all regions where they operate. BAT then apportioned the footprint result by the percentage of tobacco purchased. To measure the environmental impact of non-tobacco goods and services, a LCA approach following the Intergovernmental Science-Policy Platform on Biodiversity and Ecosystem Services, (IPEBS) Pressures Framework was used to assess the ‘magnitude’ of impact on biodiversity. BAT’s estimated annual spend per goods sector and country was fed into the TNFD recommended EXIOBASE database to estimate the environmental impacts associated with our procured goods. The data generated are used to estimate the pressures and impacts on biodiversity using LCA conversion factors and identify the most material sectors. TNFD We were able to conduct initial screening based on newly released guidance from TNFD for direct operations. This analysis identified a priority operation site if it met one of the following criteria: top 20% of estimated MSA.ha, or top 20% of STARt Score within 5km of priority area dependent on size of site. We plan to continue our TNFD analysis and prioritisation over the course of 2024. Identifying Risks and Opportunities Nature-related risks and opportunities are identified through a combination of internal stakeholder consultation, desktop research and external consultation. Currently, we assess our risks qualitatively, using data from our impact and prioritisation analysis, our industry and supply chain expertise, and advice from consultants. Nature-related risks, such as Biodiversity Loss and Deforestation are also captured within the Group’s ESG risk register. Risks are reviewed biannually, assessed on a residual risk basis, and evaluated in terms of their relevance and materiality for the business. Risk assessments are completed in line with our overall Enterprise Risk Management (ERM) methodology. b) Describe the organisation’s processes for monitoring nature-related dependencies, impacts, risks and opportunities. We set our 2025 Deforestation targets in 2021. The targets below form the basis of our commitment and inform our approach to biodiversity and ecosystems. These are: Deforestation and Conversion Free tobacco supply chain by 2025; Deforestation Free pulp and paper supply chain by 2025; Forest Positive in our tobacco supply chain by 2025 (vs 2021 baseline). In our tobacco supply chain, we have already achieved: 96.5% of the wood used in our Thrive Supply Chain is assessed as Deforestation and Conversion Free status. In 2023, we launched a new Biodiversity Operating Standard (BOS) to support our Group commitments on reducing our impact on forests and natural ecosystems. This provides guidance on due diligence and traceability to help protect biodiversity in our tobacco supply chain, including the use of traceable wood that is Deforestation and Conversion Free, and Biodiversity Management Plans. In direct operations we will be rolling our biodiversity management plans to high risk sites in 2024 and we have been strengthening our due diligence processes on pulp and paper. Read more about managing compliance with our BOS and how we are managing biodiversity in our own operations and pulp and paper on pages 84 to 85. We plan to release our 10 Year Nature Roadmap later in 2024, which will outline and support our ambition to set new nature targets in 2024 and 2025 aligned to the SBTN. Finally, risk data, including assessment information and risk scores, is collected, recorded and monitored within the Group’s Risk Management System. The system provides a standardised risk reporting suite which supports the overall risk tracking and monitoring process. The Group’s ESG risk register, which includes nature-related risks, is reviewed biannually by the Group Risk Management Committee, chaired by the Interim Finance Director and subsequently reviewed biannually by the Audit Committee and annually by the Board. Metrics and targets: Disclose the metrics and targets used to assess and manage material nature-related dependencies, impacts, risks and opportunities a) Disclose the metrics used by the organisation to assess and manage dependencies and impacts on nature A range of metrics has been used to assess and manage nature-related dependencies, impacts, risks and opportunities. Land Occupancy For total area controlled or managed by BAT’s direct operations and total disturbed areas from BAT’s tobacco supply chain and procured goods and services the area is expressed in units: 1 hectares = 0.01 km2. For land use impacts of procured goods and services units: m2 crop-land equivalent has been used. State of Nature For ecosystem condition, the biodiversity footprint for direct operations and tobacco supply chain has been estimated using units: MSA.ha. For each location in direct operations (site) and tobacco supply chain locations (farms), species extinction risk has been assessed via threat abatement potential measured using units: Species Threat Abatement and Restoration - Abating threats (START) Score. For procured goods and services water use was measured in quantity using units: m3. Pollution impacts were measured in units: SO2 equivalents, P equivalents, N equivalents. GHG emissions were measured in units: CO2 equivalents. Note: ‡ Refer to the BAT ‘Reporting Criteria’ for a full description of key terms and definitions at bat/reporting.com BAT Annual Report and Form 20-F 2023 Strategic Report Governance Report Financial Statements Other Information Sustainable Future Our approach to Taskforce on Nature-related Financial Disclosures (TNFD) Continued 118

This page is intentionally left blank BAT Annual Report and Form 20-F 2023 Strategic Report Governance Report Financial Statements Other Information 119

This page is intentionally left blank BAT Annual Report and Form 20-F 2023 Strategic Report Governance Report Financial Statements Other Information 120
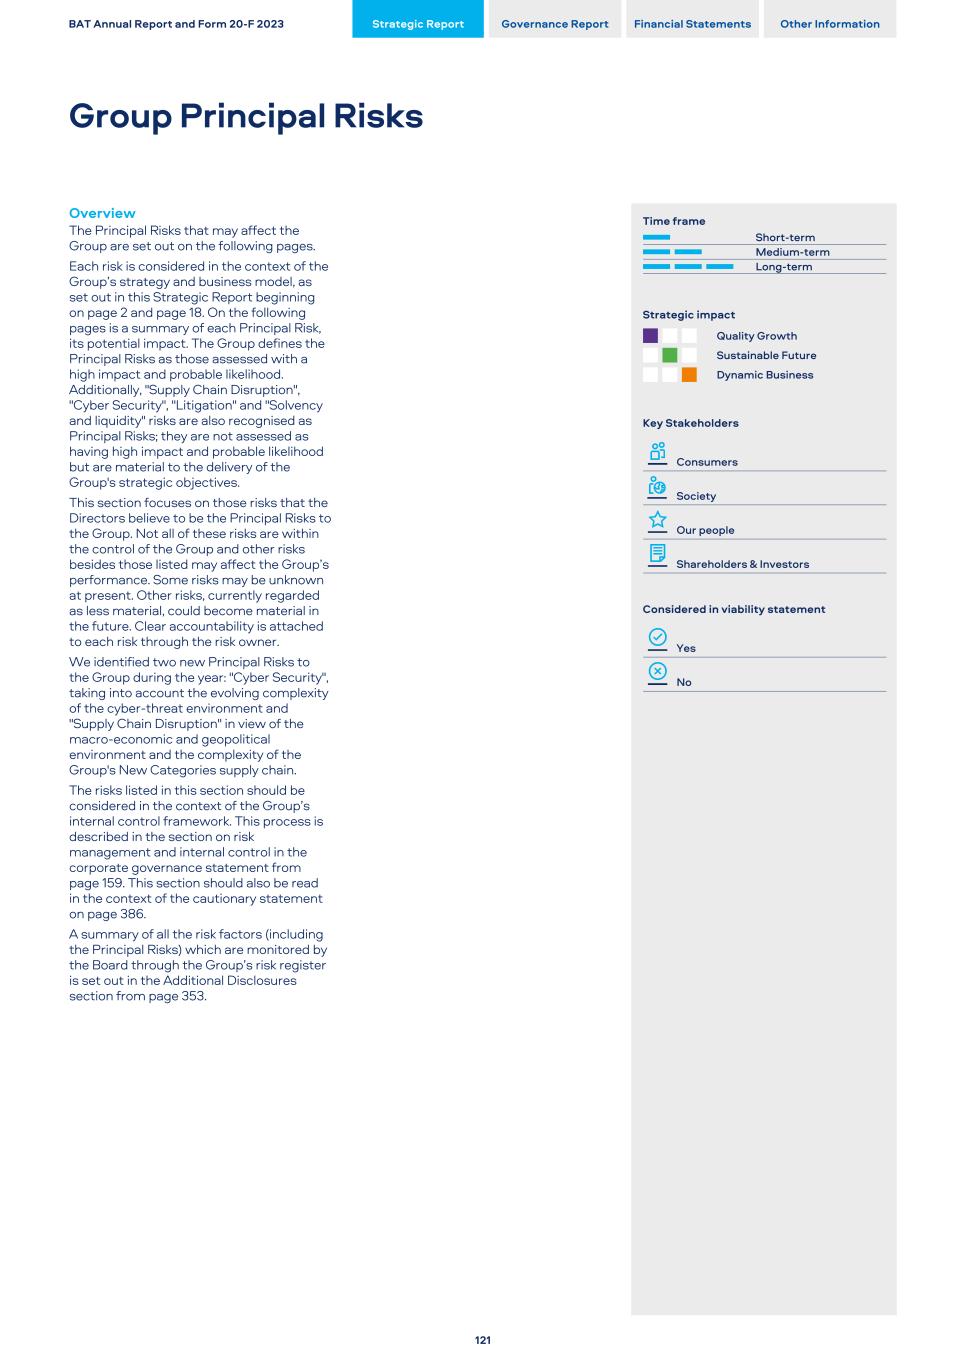
Overview The Principal Risks that may affect the Group are set out on the following pages. Each risk is considered in the context of the Group’s strategy and business model, as set out in this Strategic Report beginning on page 2 and page 18. On the following pages is a summary of each Principal Risk, its potential impact. The Group defines the Principal Risks as those assessed with a high impact and probable likelihood. Additionally, "Supply Chain Disruption", "Cyber Security", "Litigation" and "Solvency and liquidity" risks are also recognised as Principal Risks; they are not assessed as having high impact and probable likelihood but are material to the delivery of the Group's strategic objectives. This section focuses on those risks that the Directors believe to be the Principal Risks to the Group. Not all of these risks are within the control of the Group and other risks besides those listed may affect the Group’s performance. Some risks may be unknown at present. Other risks, currently regarded as less material, could become material in the future. Clear accountability is attached to each risk through the risk owner. We identified two new Principal Risks to the Group during the year: "Cyber Security", taking into account the evolving complexity of the cyber-threat environment and "Supply Chain Disruption" in view of the macro-economic and geopolitical environment and the complexity of the Group's New Categories supply chain. The risks listed in this section should be considered in the context of the Group’s internal control framework. This process is described in the section on risk management and internal control in the corporate governance statement from page 159. This section should also be read in the context of the cautionary statement on page 386. A summary of all the risk factors (including the Principal Risks) which are monitored by the Board through the Group’s risk register is set out in the Additional Disclosures section from page 353. Time frame Short-term Medium-term Long-term Strategic impact Quality Growth Sustainable Future Dynamic Business Key Stakeholders Consumers Society Our people Shareholders & Investors Considered in viability statement Yes No BAT Annual Report and Form 20-F 2023 Strategic Report Governance Report Financial Statements Other Information Group Principal Risks 121
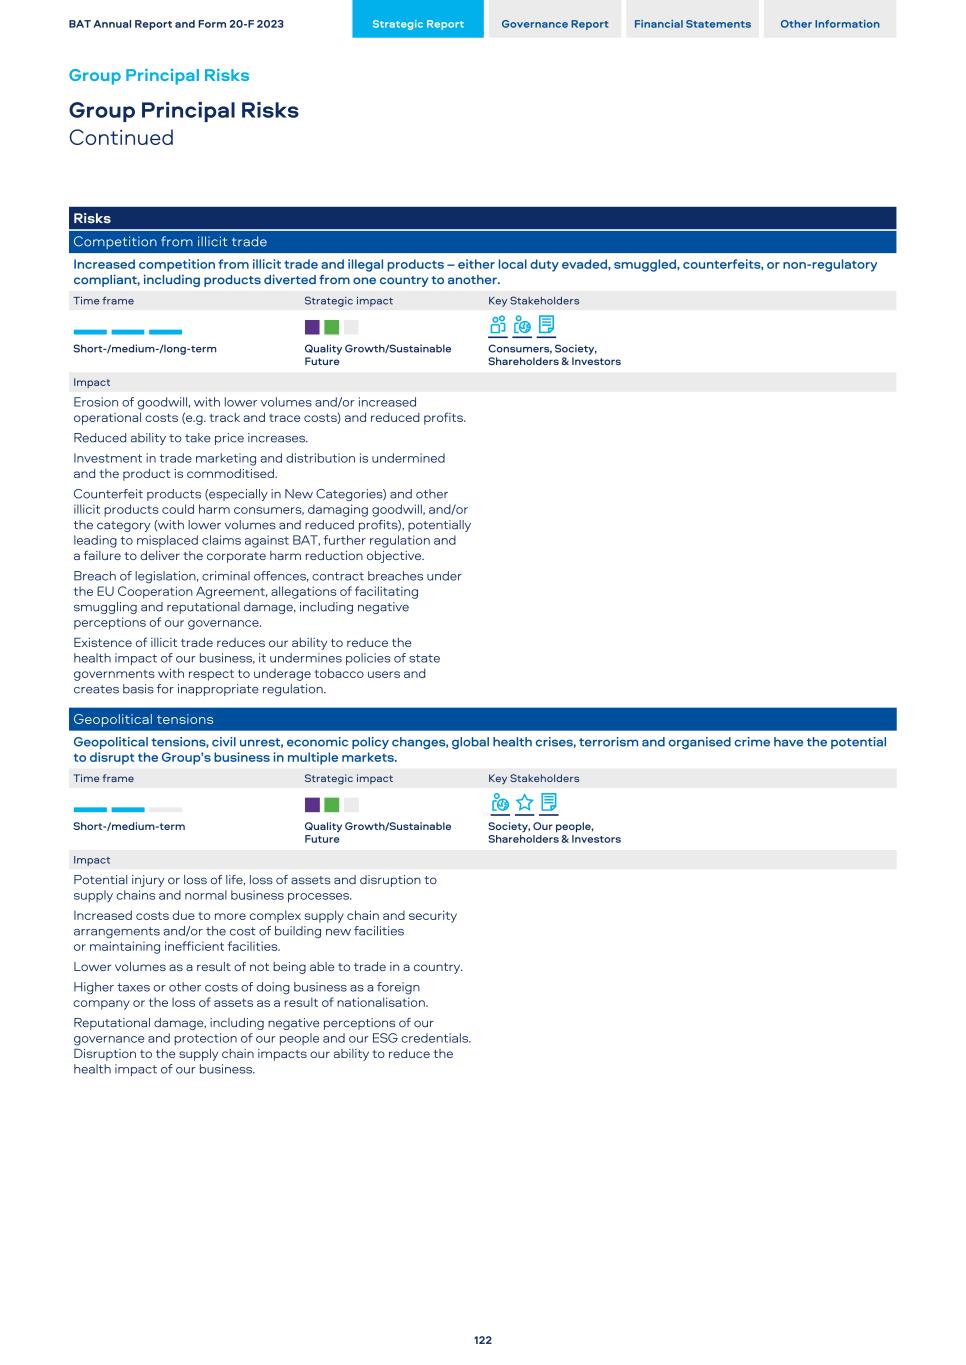
Risks Competition from illicit trade Increased competition from illicit trade and illegal products – either local duty evaded, smuggled, counterfeits, or non-regulatory compliant, including products diverted from one country to another. Time frame Strategic impact Key Stakeholders Short-/medium-/long-term Quality Growth/Sustainable Future Consumers, Society, Shareholders & Investors Impact Erosion of goodwill, with lower volumes and/or increased operational costs (e.g. track and trace costs) and reduced profits. Reduced ability to take price increases. Investment in trade marketing and distribution is undermined and the product is commoditised. Counterfeit products (especially in New Categories) and other illicit products could harm consumers, damaging goodwill, and/or the category (with lower volumes and reduced profits), potentially leading to misplaced claims against BAT, further regulation and a failure to deliver the corporate harm reduction objective. Breach of legislation, criminal offences, contract breaches under the EU Cooperation Agreement, allegations of facilitating smuggling and reputational damage, including negative perceptions of our governance. Existence of illicit trade reduces our ability to reduce the health impact of our business, it undermines policies of state governments with respect to underage tobacco users and creates basis for inappropriate regulation. Geopolitical tensions Geopolitical tensions, civil unrest, economic policy changes, global health crises, terrorism and organised crime have the potential to disrupt the Group’s business in multiple markets. Time frame Strategic impact Key Stakeholders Short-/medium-term Quality Growth/Sustainable Future Society, Our people, Shareholders & Investors Impact Potential injury or loss of life, loss of assets and disruption to supply chains and normal business processes. Increased costs due to more complex supply chain and security arrangements and/or the cost of building new facilities or maintaining inefficient facilities. Lower volumes as a result of not being able to trade in a country. Higher taxes or other costs of doing business as a foreign company or the loss of assets as a result of nationalisation. Reputational damage, including negative perceptions of our governance and protection of our people and our ESG credentials. Disruption to the supply chain impacts our ability to reduce the health impact of our business. BAT Annual Report and Form 20-F 2023 Strategic Report Governance Report Financial Statements Other Information Group Principal Risks Group Principal Risks Continued 122
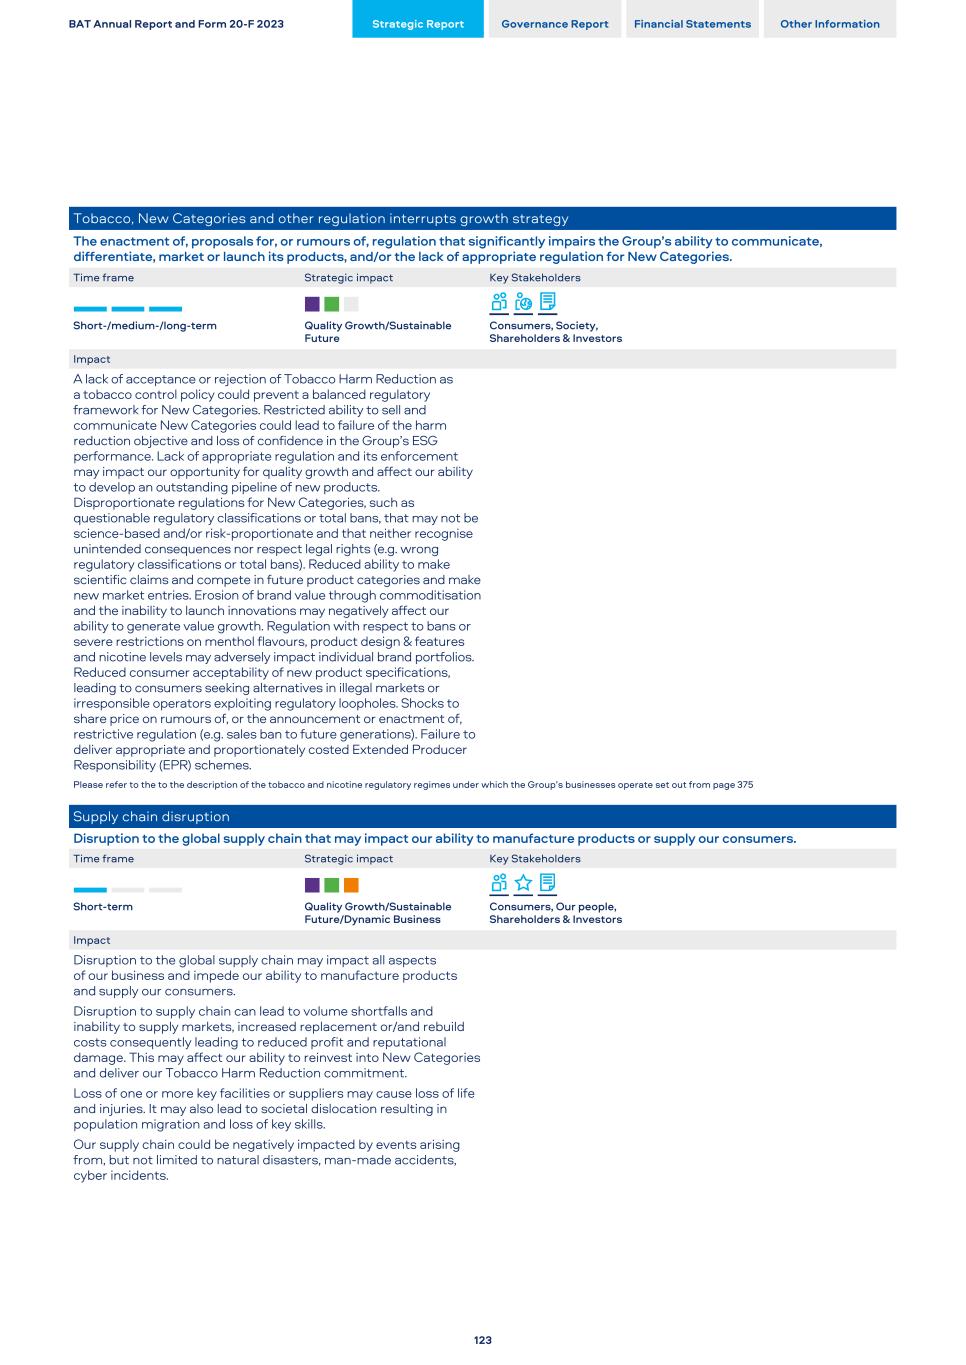
Tobacco, New Categories and other regulation interrupts growth strategy The enactment of, proposals for, or rumours of, regulation that significantly impairs the Group’s ability to communicate, differentiate, market or launch its products, and/or the lack of appropriate regulation for New Categories. Time frame Strategic impact Key Stakeholders Short-/medium-/long-term Quality Growth/Sustainable Future Consumers, Society, Shareholders & Investors Impact A lack of acceptance or rejection of Tobacco Harm Reduction as a tobacco control policy could prevent a balanced regulatory framework for New Categories. Restricted ability to sell and communicate New Categories could lead to failure of the harm reduction objective and loss of confidence in the Group’s ESG performance. Lack of appropriate regulation and its enforcement may impact our opportunity for quality growth and affect our ability to develop an outstanding pipeline of new products. Disproportionate regulations for New Categories, such as questionable regulatory classifications or total bans, that may not be science-based and/or risk-proportionate and that neither recognise unintended consequences nor respect legal rights (e.g. wrong regulatory classifications or total bans). Reduced ability to make scientific claims and compete in future product categories and make new market entries. Erosion of brand value through commoditisation and the inability to launch innovations may negatively affect our ability to generate value growth. Regulation with respect to bans or severe restrictions on menthol flavours, product design & features and nicotine levels may adversely impact individual brand portfolios. Reduced consumer acceptability of new product specifications, leading to consumers seeking alternatives in illegal markets or irresponsible operators exploiting regulatory loopholes. Shocks to share price on rumours of, or the announcement or enactment of, restrictive regulation (e.g. sales ban to future generations). Failure to deliver appropriate and proportionately costed Extended Producer Responsibility (EPR) schemes. Please refer to the to the description of the tobacco and nicotine regulatory regimes under which the Group’s businesses operate set out from page 375 Supply chain disruption Disruption to the global supply chain that may impact our ability to manufacture products or supply our consumers. Time frame Strategic impact Key Stakeholders Short-term Quality Growth/Sustainable Future/Dynamic Business Consumers, Our people, Shareholders & Investors Impact Disruption to the global supply chain may impact all aspects of our business and impede our ability to manufacture products and supply our consumers. Disruption to supply chain can lead to volume shortfalls and inability to supply markets, increased replacement or/and rebuild costs consequently leading to reduced profit and reputational damage. This may affect our ability to reinvest into New Categories and deliver our Tobacco Harm Reduction commitment. Loss of one or more key facilities or suppliers may cause loss of life and injuries. It may also lead to societal dislocation resulting in population migration and loss of key skills. Our supply chain could be negatively impacted by events arising from, but not limited to natural disasters, man-made accidents, cyber incidents. BAT Annual Report and Form 20-F 2023 Strategic Report Governance Report Financial Statements Other Information 123
Risks continued Litigation Product liability, regulatory or other significant cases (including investigations) may be lost or settled resulting in a material loss or other consequence. Time frame Strategic impact Key Stakeholders Short-/medium-/long-term Quality Growth/Sustainable future Shareholders & Investors Impact Damages and fines, negative impact on reputation (including ESG credentials), disruption and loss of focus on the business. Consolidated results of operations, cash flows and financial position could be materially affected by an unfavourable outcome or settlement of pending or future litigation, criminal prosecution or other contentious action, or by the costs associated with bringing proceedings or defending claims. Inability to sell products as a result of an injunction arising out of a patent infringement action against the Group may restrict growth plans and competitiveness. Potential share price impact. Sustainability-related litigation could also result in a reduction in the investor base due to sustainability and sustainability-related concerns. Please refer to note 31 on page 286 in the Notes on the Accounts for details of contingent liabilities applicable to the Group. Significant increases or structural changes in tobacco, nicotine and New Categories related taxes The Group is exposed to unexpected and/or significant increases or structural changes in tobacco, nicotine and New Categories related taxes in key markets. Time frame Strategic impact Key Stakeholders Short-/medium-/long-term Quality Growth/Sustainable Future Consumers, Society, Shareholders & Investors Impact Consumers reject the Group’s legitimate tax-paid products for products from illicit sources or cheaper alternatives. Reduced legal industry volumes. Reduced sales volume and/or portfolio erosion leading to inability to invest in, develop, commercialise and deliver New Category products. Partial absorption of excise increases leading to lower profitability. BAT Annual Report and Form 20-F 2023 Strategic Report Governance Report Financial Statements Other Information Group Principal Risks Group Principal Risks Continued 124
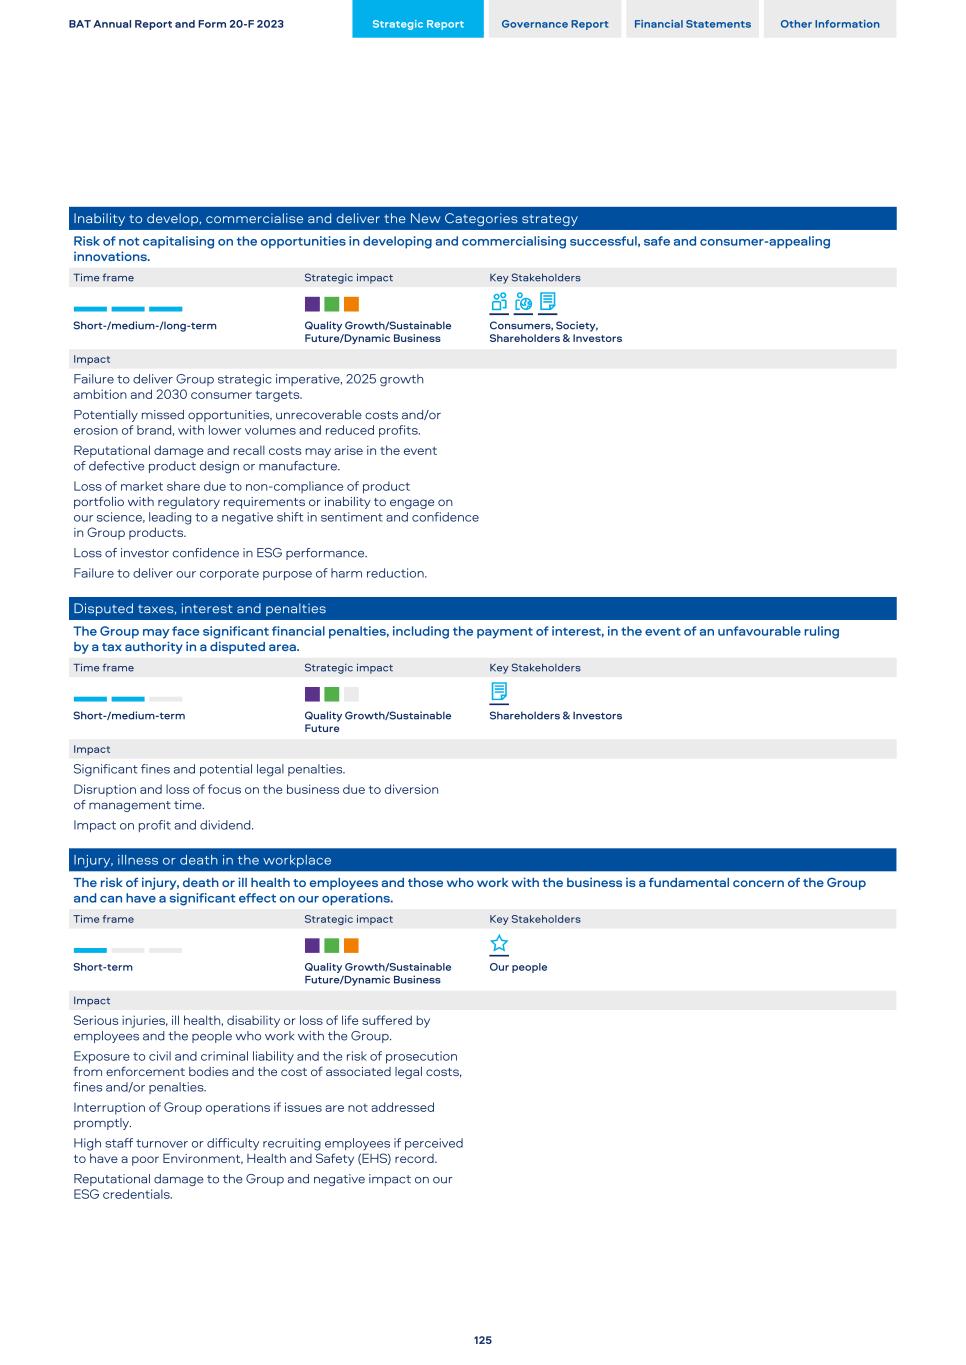
Inability to develop, commercialise and deliver the New Categories strategy Risk of not capitalising on the opportunities in developing and commercialising successful, safe and consumer-appealing innovations. Time frame Strategic impact Key Stakeholders Short-/medium-/long-term Quality Growth/Sustainable Future/Dynamic Business Consumers, Society, Shareholders & Investors Impact Failure to deliver Group strategic imperative, 2025 growth ambition and 2030 consumer targets. Potentially missed opportunities, unrecoverable costs and/or erosion of brand, with lower volumes and reduced profits. Reputational damage and recall costs may arise in the event of defective product design or manufacture. Loss of market share due to non-compliance of product portfolio with regulatory requirements or inability to engage on our science, leading to a negative shift in sentiment and confidence in Group products. Loss of investor confidence in ESG performance. Failure to deliver our corporate purpose of harm reduction. Disputed taxes, interest and penalties The Group may face significant financial penalties, including the payment of interest, in the event of an unfavourable ruling by a tax authority in a disputed area. Time frame Strategic impact Key Stakeholders Short-/medium-term Quality Growth/Sustainable Future Shareholders & Investors Impact Significant fines and potential legal penalties. Disruption and loss of focus on the business due to diversion of management time. Impact on profit and dividend. Injury, illness or death in the workplace The risk of injury, death or ill health to employees and those who work with the business is a fundamental concern of the Group and can have a significant effect on our operations. Time frame Strategic impact Key Stakeholders Short-term Quality Growth/Sustainable Future/Dynamic Business Our people Impact Serious injuries, ill health, disability or loss of life suffered by employees and the people who work with the Group. Exposure to civil and criminal liability and the risk of prosecution from enforcement bodies and the cost of associated legal costs, fines and/or penalties. Interruption of Group operations if issues are not addressed promptly. High staff turnover or difficulty recruiting employees if perceived to have a poor Environment, Health and Safety (EHS) record. Reputational damage to the Group and negative impact on our ESG credentials. BAT Annual Report and Form 20-F 2023 Strategic Report Governance Report Financial Statements Other Information 125
Risks continued Solvency and liquidity Liquidity (access to cash and sources of finance) is essential to maintaining the Group as a going concern in the short-term (liquidity) and medium-term (solvency). Time frame Strategic impact Key Stakeholders Short-/medium-term Quality Growth/Sustainable Future/Dynamic Business Shareholders & Investors Impact Inability to access the Group’s cash resources and to fund the business under the current capital structure resulting in missed strategic opportunities or inability to respond to threats. Decline in our creditworthiness and increased funding costs for the Group. Requirement to issue equity or seek new sources of capital. Reputational risk of failure to manage the financial risk profile of the business, resulting in an erosion of shareholder value reflected in an underperforming share price. Inability to mitigate accounting and economic exposures. Economic loss as a result of devaluation/revaluation of assets (including cash) valued or held in local currency, and additional costs as a result of paying premiums to obtain hard currency. Failure to appropriately engage with investors’ and lenders’ sustainability criteria and concerns may impact BAT’s counterparty availability, credit ratings, access to funding, or may result in an increase in the cost of funding. Exposure to the cannabis sector may lead to regulatory and legal risk, reputation and compliance issues restricting bank and/or investor access. Foreign exchange rates exposures The Group faces translational and transactional foreign exchange (FX) rate exposure for earnings/cash flows from its global businesses. Time frame Strategic impact Key Stakeholders Short-/medium-term Quality Growth/Dynamic Business Shareholders & Investors Impact Fluctuations in FX rates of key currencies against sterling introduce volatility in reported earnings per share (EPS), cash flow and the balance sheet driven by translation into sterling of our financial results and these exposures are not normally hedged. The dividend may be impacted if the payout ratio is not adjusted. Differences in translation between earnings and net debt may affect key ratios used by credit rating agencies. Volatility and/or increased costs in our business, due to transactional FX, may adversely impact financial performance. BAT Annual Report and Form 20-F 2023 Strategic Report Governance Report Financial Statements Other Information Group Principal Risks Group Principal Risks Continued 126
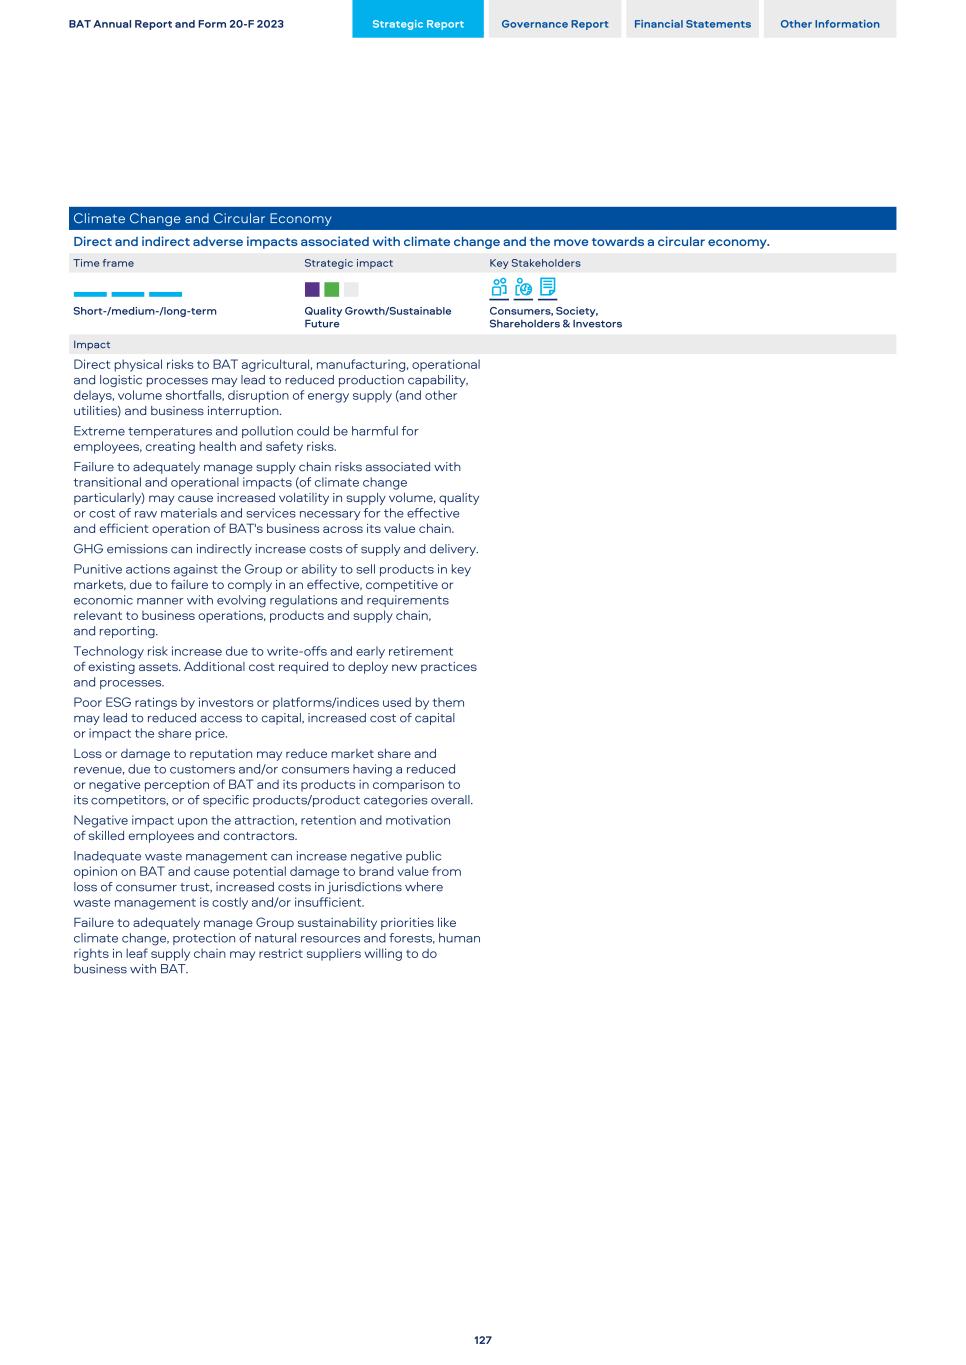
Climate Change and Circular Economy Direct and indirect adverse impacts associated with climate change and the move towards a circular economy. Time frame Strategic impact Key Stakeholders Short-/medium-/long-term Quality Growth/Sustainable Future Consumers, Society, Shareholders & Investors Impact Direct physical risks to BAT agricultural, manufacturing, operational and logistic processes may lead to reduced production capability, delays, volume shortfalls, disruption of energy supply (and other utilities) and business interruption. Extreme temperatures and pollution could be harmful for employees, creating health and safety risks. Failure to adequately manage supply chain risks associated with transitional and operational impacts (of climate change particularly) may cause increased volatility in supply volume, quality or cost of raw materials and services necessary for the effective and efficient operation of BAT's business across its value chain. GHG emissions can indirectly increase costs of supply and delivery. Punitive actions against the Group or ability to sell products in key markets, due to failure to comply in an effective, competitive or economic manner with evolving regulations and requirements relevant to business operations, products and supply chain, and reporting. Technology risk increase due to write-offs and early retirement of existing assets. Additional cost required to deploy new practices and processes. Poor ESG ratings by investors or platforms/indices used by them may lead to reduced access to capital, increased cost of capital or impact the share price. Loss or damage to reputation may reduce market share and revenue, due to customers and/or consumers having a reduced or negative perception of BAT and its products in comparison to its competitors, or of specific products/product categories overall. Negative impact upon the attraction, retention and motivation of skilled employees and contractors. Inadequate waste management can increase negative public opinion on BAT and cause potential damage to brand value from loss of consumer trust, increased costs in jurisdictions where waste management is costly and/or insufficient. Failure to adequately manage Group sustainability priorities like climate change, protection of natural resources and forests, human rights in leaf supply chain may restrict suppliers willing to do business with BAT. BAT Annual Report and Form 20-F 2023 Strategic Report Governance Report Financial Statements Other Information 127
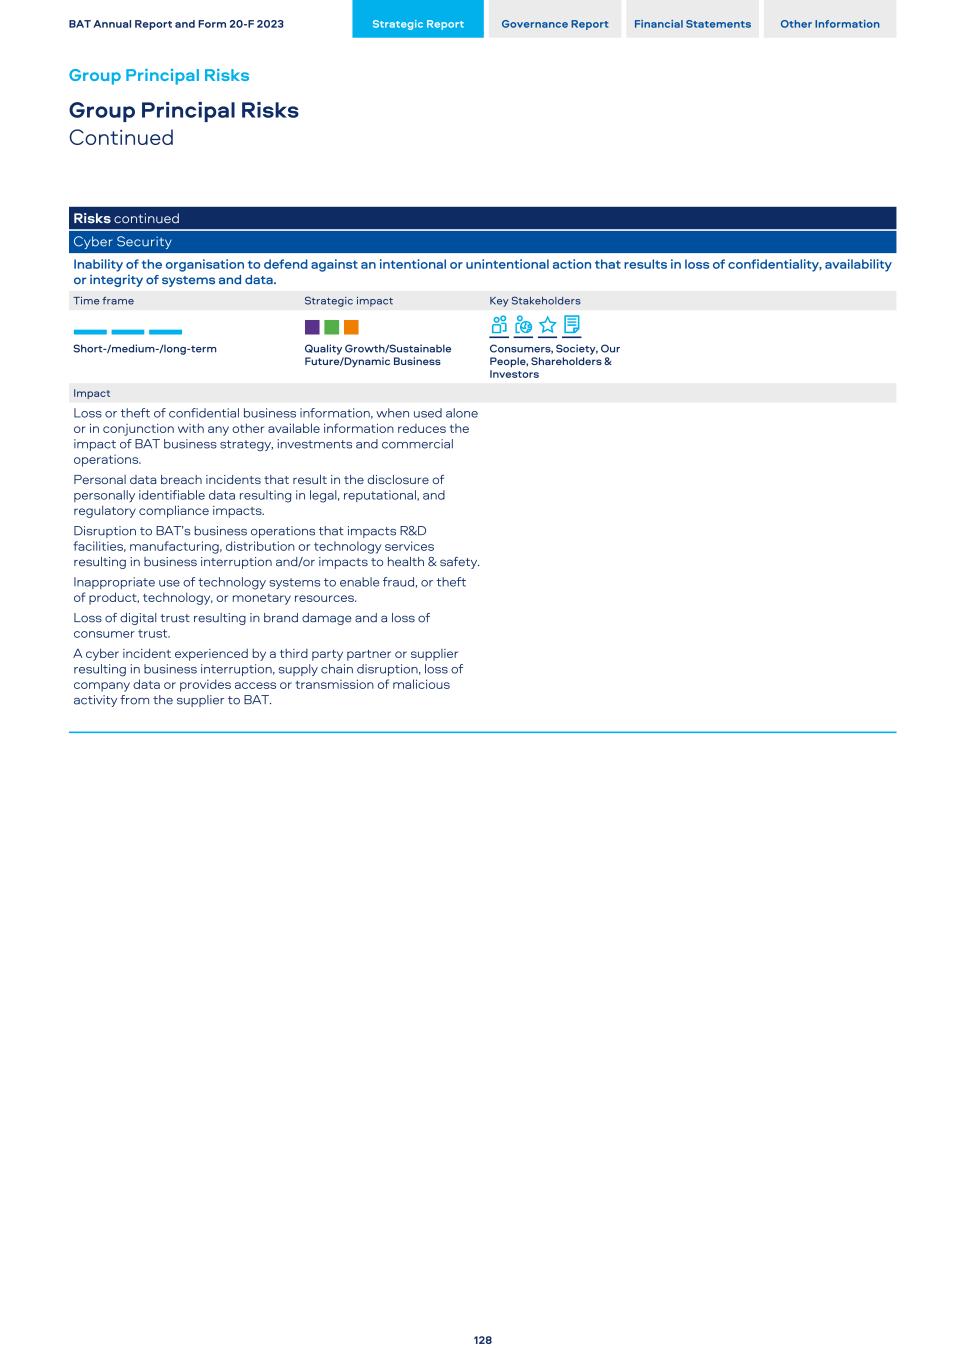
Risks continued Cyber Security Inability of the organisation to defend against an intentional or unintentional action that results in loss of confidentiality, availability or integrity of systems and data. Time frame Strategic impact Key Stakeholders Short-/medium-/long-term Quality Growth/Sustainable Future/Dynamic Business Consumers, Society, Our People, Shareholders & Investors Impact Loss or theft of confidential business information, when used alone or in conjunction with any other available information reduces the impact of BAT business strategy, investments and commercial operations. Personal data breach incidents that result in the disclosure of personally identifiable data resulting in legal, reputational, and regulatory compliance impacts. Disruption to BAT’s business operations that impacts R&D facilities, manufacturing, distribution or technology services resulting in business interruption and/or impacts to health & safety. Inappropriate use of technology systems to enable fraud, or theft of product, technology, or monetary resources. Loss of digital trust resulting in brand damage and a loss of consumer trust. A cyber incident experienced by a third party partner or supplier resulting in business interruption, supply chain disruption, loss of company data or provides access or transmission of malicious activity from the supplier to BAT. BAT Annual Report and Form 20-F 2023 Strategic Report Governance Report Financial Statements Other Information Group Principal Risks Group Principal Risks Continued 128

This page is intentionally left blank BAT Annual Report and Form 20-F 2023 Strategic Report Governance Report Financial Statements Other Information 129 The Strategic Report was approved by the Board of Directors on 07 February 2024 and signed on its behalf by Caroline Ferland, Company Secretary.
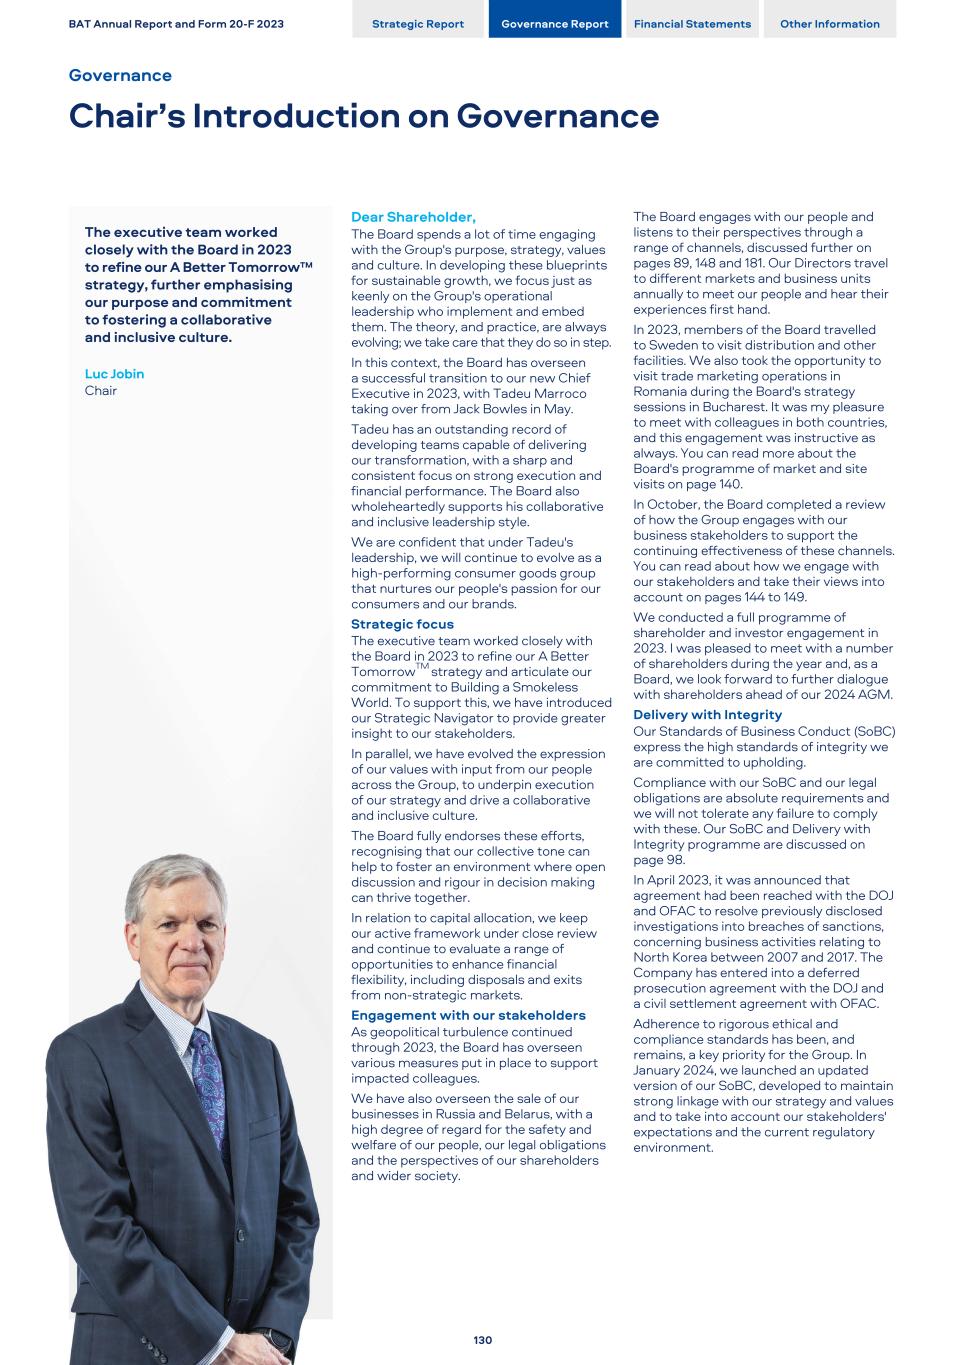
The executive team worked closely with the Board in 2023 to refine our A Better Tomorrow™ strategy, further emphasising our purpose and commitment to fostering a collaborative and inclusive culture. Luc Jobin Chair Dear Shareholder, The Board spends a lot of time engaging with the Group's purpose, strategy, values and culture. In developing these blueprints for sustainable growth, we focus just as keenly on the Group's operational leadership who implement and embed them. The theory, and practice, are always evolving; we take care that they do so in step. In this context, the Board has overseen a successful transition to our new Chief Executive in 2023, with Tadeu Marroco taking over from Jack Bowles in May. Tadeu has an outstanding record of developing teams capable of delivering our transformation, with a sharp and consistent focus on strong execution and financial performance. The Board also wholeheartedly supports his collaborative and inclusive leadership style. We are confident that under Tadeu's leadership, we will continue to evolve as a high-performing consumer goods group that nurtures our people's passion for our consumers and our brands. Strategic focus The executive team worked closely with the Board in 2023 to refine our A Better TomorrowTM strategy and articulate our commitment to Building a Smokeless World. To support this, we have introduced our Strategic Navigator to provide greater insight to our stakeholders. In parallel, we have evolved the expression of our values with input from our people across the Group, to underpin execution of our strategy and drive a collaborative and inclusive culture. The Board fully endorses these efforts, recognising that our collective tone can help to foster an environment where open discussion and rigour in decision making can thrive together. In relation to capital allocation, we keep our active framework under close review and continue to evaluate a range of opportunities to enhance financial flexibility, including disposals and exits from non-strategic markets. Engagement with our stakeholders As geopolitical turbulence continued through 2023, the Board has overseen various measures put in place to support impacted colleagues. We have also overseen the sale of our businesses in Russia and Belarus, with a high degree of regard for the safety and welfare of our people, our legal obligations and the perspectives of our shareholders and wider society. The Board engages with our people and listens to their perspectives through a range of channels, discussed further on pages 89, 148 and 181. Our Directors travel to different markets and business units annually to meet our people and hear their experiences first hand. In 2023, members of the Board travelled to Sweden to visit distribution and other facilities. We also took the opportunity to visit trade marketing operations in Romania during the Board's strategy sessions in Bucharest. It was my pleasure to meet with colleagues in both countries, and this engagement was instructive as always. You can read more about the Board's programme of market and site visits on page 140. In October, the Board completed a review of how the Group engages with our business stakeholders to support the continuing effectiveness of these channels. You can read about how we engage with our stakeholders and take their views into account on pages 144 to 149. We conducted a full programme of shareholder and investor engagement in 2023. I was pleased to meet with a number of shareholders during the year and, as a Board, we look forward to further dialogue with shareholders ahead of our 2024 AGM. Delivery with Integrity Our Standards of Business Conduct (SoBC) express the high standards of integrity we are committed to upholding. Compliance with our SoBC and our legal obligations are absolute requirements and we will not tolerate any failure to comply with these. Our SoBC and Delivery with Integrity programme are discussed on page 98. In April 2023, it was announced that agreement had been reached with the DOJ and OFAC to resolve previously disclosed investigations into breaches of sanctions, concerning business activities relating to North Korea between 2007 and 2017. The Company has entered into a deferred prosecution agreement with the DOJ and a civil settlement agreement with OFAC. Adherence to rigorous ethical and compliance standards has been, and remains, a key priority for the Group. In January 2024, we launched an updated version of our SoBC, developed to maintain strong linkage with our strategy and values and to take into account our stakeholders' expectations and the current regulatory environment. BAT Annual Report and Form 20-F 2023 Strategic Report Governance Report Financial Statements Other Information Governance Chair’s Introduction on Governance 130
Board efficacy Effective oversight of executive transition is a critical part of our long-term success. The Board has given thorough consideration to the restructuring of our Management Board in 2023 to ensure we have the right capabilities to drive our strategy. Having overseen the transition to our new executive management structure, the Nominations Committee turned its focus to succession planning for Non-Executive Directors. We were delighted to welcome Murray Kessler and Serpil Timuray to the Board in Q4 2023. Their experience in growing consumer product companies will augment our existing expertise. Our Board composition will be further enhanced with the appointment of Soraya Benchikh as Chief Financial Officer from 1 May 2024. Soraya will bring a wealth of financial and commercial expertise to the executive team and I look forward to her joining us. Reviewing the overall diversity of our Board, I am pleased to report that women currently represent 45% of the Board, and 27% of our Directors are from an ethnic minority background. Promoting diversity in our executive management team and senior management pipeline remains a key focus area for the Board. We are encouraged by the diversity already present in our senior management, particularly increasing strength in representation of ethnic diversity. However, we are keenly aware that we have more to do, and will continue to strive to further improve our gender balance. As a Board, we review our effectiveness every year. This year, I led an internal review of the Board, its Committees and the Directors. Having discussed the outcomes of this exercise, the Board considers that it continues to function effectively. We also identified some areas in which we can further develop our effectiveness and plan to implement these in 2024. You can read about our review process and its outcomes in detail on pages 152 and 153. Sue Farr and Dimitri Panayotopoulos will step down from the Board at the close of the 2024 AGM. I would like to thank them for their extensive contributions to the Board over their tenures. From the close of the 2024 AGM, Holly Keller Koeppel will be appointed as Senior Independent Director, Darrell Thomas will succeed Holly as Chair of the Audit Committee and Kandy Anand will succeed Dimitri as the Chair of the Remuneration Committee (subject to re-election at the 2024 AGM). On behalf of the Board, I confirm that we consider that this Annual Report and Form 20-F is fair, balanced and understandable, and presents the information necessary to assess the Company’s position, performance, business model and strategy. Luc Jobin Chair Throughout the year ended 31 December 2023, we applied the Principles of the UK Corporate Governance Code 2018. The Company was compliant with all provisions of the Code during the year. The Board considers that this Annual Report and Form 20-F, and notably this Governance section, provides the information shareholders need to evaluate how we have complied with our obligations under the Code. Pages noted opposite refer to particular discussion on the application of Principles of the Code in this Annual Report and Form 20-F. Disclosure guidance and transparency rules We comply with the Disclosure Guidance and Transparency Rules requirements for corporate governance statements by virtue of the information included in this section, together with the information contained in the Other Information section. The UK Corporate Governance Code 2018 is available at frc.org.uk. U.S. corporate governance As a result of the listing of the Company’s American Depositary Shares (ADSs) on the NYSE, the Company is required to meet certain NYSE requirements relating to corporate governance matters. Certain exceptions to these requirements apply to the Company as a foreign private issuer. For details of the significant differences between the NYSE requirements and the Company’s practices, please see page 383 Board Leadership and Company Purpose Principle A. Long-Term Sustainable Success pages 2 to 120 and 130 to 153 B. Purpose, Values and Culture pages 6 to 9, 14 to 17, 88 to 91, 139, 140 to 143, 148, 149, 153 and 156 to 157 C. Resources and Control Framework pages 2 to 20, 121 to 129, 138, 139, 143, 153 and 159 to 169 D. Shareholder and Stakeholder Engagement pages 22 to 23, 89, 144 to 148 and 170 to 181 E. Workforce Engagement, Policies, Practices pages 72, 88 to 89, 98 to 99, 139, 140 to 141, 148, 178 to 181 Division of Responsibilities Principle F. Leadership of the Board pages 130 to 153 G. Board Composition and Division of Responsibilities pages 131 to 135 and 150 to 151 H. Role and Commitment of Non-Executive Directors pages 132 to 135, 150 to 151 and 155 to 156 I. Board Support pages 150 to 152 Composition, Succession, Evaluation Principle J. Board Appointments, Succession and Diversity pages 131 to 135, 142 and 154 to 158 K. Board Skills and Experience pages 132 to 135 and 154 to 155 L. Board Evaluation pages 152 to 153 Audit, Risk, Internal Control Principle M. Internal and External Audit Functions pages 162 to 169 N. Fair, Balanced and Understandable Assessment pages 168 and 193 O. Risk Management and Internal Controls pages 121 to 129, 142 to 143, 159 to 169 and 384 Remuneration Principle P. Remuneration Policies and Practices pages 170 to 192 Q. Development of Policy on Remuneration pages 170 to 192 R. Judgement and Discretion pages 170 to 192 For reference, we prepare a separate voluntary annual compliance report by reference to each Principle and Provision of the Code, available at bat.com/governance + BAT Annual Report and Form 20-F 2023 Strategic Report Governance Report Financial Statements Other Information 131
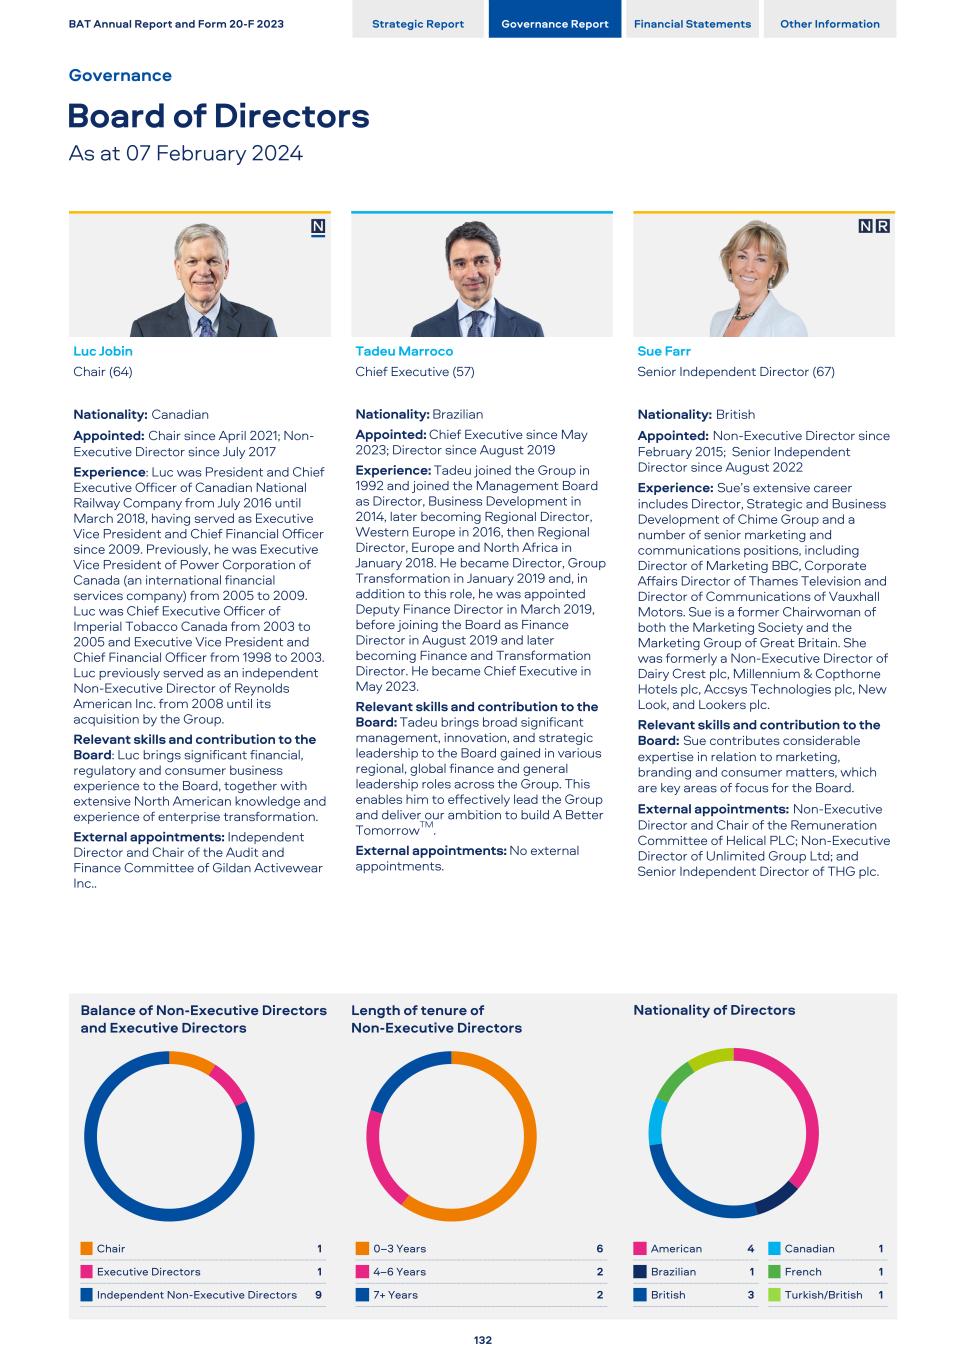
Luc Jobin Chair (64) Nationality: Canadian Appointed: Chair since April 2021; Non- Executive Director since July 2017 Experience: Luc was President and Chief Executive Officer of Canadian National Railway Company from July 2016 until March 2018, having served as Executive Vice President and Chief Financial Officer since 2009. Previously, he was Executive Vice President of Power Corporation of Canada (an international financial services company) from 2005 to 2009. Luc was Chief Executive Officer of Imperial Tobacco Canada from 2003 to 2005 and Executive Vice President and Chief Financial Officer from 1998 to 2003. Luc previously served as an independent Non-Executive Director of Reynolds American Inc. from 2008 until its acquisition by the Group. Relevant skills and contribution to the Board: Luc brings significant financial, regulatory and consumer business experience to the Board, together with extensive North American knowledge and experience of enterprise transformation. External appointments: Independent Director and Chair of the Audit and Finance Committee of Gildan Activewear Inc.. Balance of Non-Executive Directors and Executive Directors Chair 1 Executive Directors 1 Independent Non-Executive Directors 9 Tadeu Marroco Chief Executive (57) Nationality: Brazilian Appointed: Chief Executive since May 2023; Director since August 2019 Experience: Tadeu joined the Group in 1992 and joined the Management Board as Director, Business Development in 2014, later becoming Regional Director, Western Europe in 2016, then Regional Director, Europe and North Africa in January 2018. He became Director, Group Transformation in January 2019 and, in addition to this role, he was appointed Deputy Finance Director in March 2019, before joining the Board as Finance Director in August 2019 and later becoming Finance and Transformation Director. He became Chief Executive in May 2023. Relevant skills and contribution to the Board: Tadeu brings broad significant management, innovation, and strategic leadership to the Board gained in various regional, global finance and general leadership roles across the Group. This enables him to effectively lead the Group and deliver our ambition to build A Better TomorrowTM. External appointments: No external appointments. Length of tenure of Non-Executive Directors 0–3 Years 6 4–6 Years 2 7+ Years 2 Sue Farr Senior Independent Director (67) Nationality: British Appointed: Non-Executive Director since February 2015; Senior Independent Director since August 2022 Experience: Sue’s extensive career includes Director, Strategic and Business Development of Chime Group and a number of senior marketing and communications positions, including Director of Marketing BBC, Corporate Affairs Director of Thames Television and Director of Communications of Vauxhall Motors. Sue is a former Chairwoman of both the Marketing Society and the Marketing Group of Great Britain. She was formerly a Non-Executive Director of Dairy Crest plc, Millennium & Copthorne Hotels plc, Accsys Technologies plc, New Look, and Lookers plc. Relevant skills and contribution to the Board: Sue contributes considerable expertise in relation to marketing, branding and consumer matters, which are key areas of focus for the Board. External appointments: Non-Executive Director and Chair of the Remuneration Committee of Helical PLC; Non-Executive Director of Unlimited Group Ltd; and Senior Independent Director of THG plc. Nationality of Directors American 4 Canadian 1 Brazilian 1 French 1 British 3 Turkish/British 1 BAT Annual Report and Form 20-F 2023 Strategic Report Governance Report Financial Statements Other Information Governance Board of Directors As at 07 February 2024 132
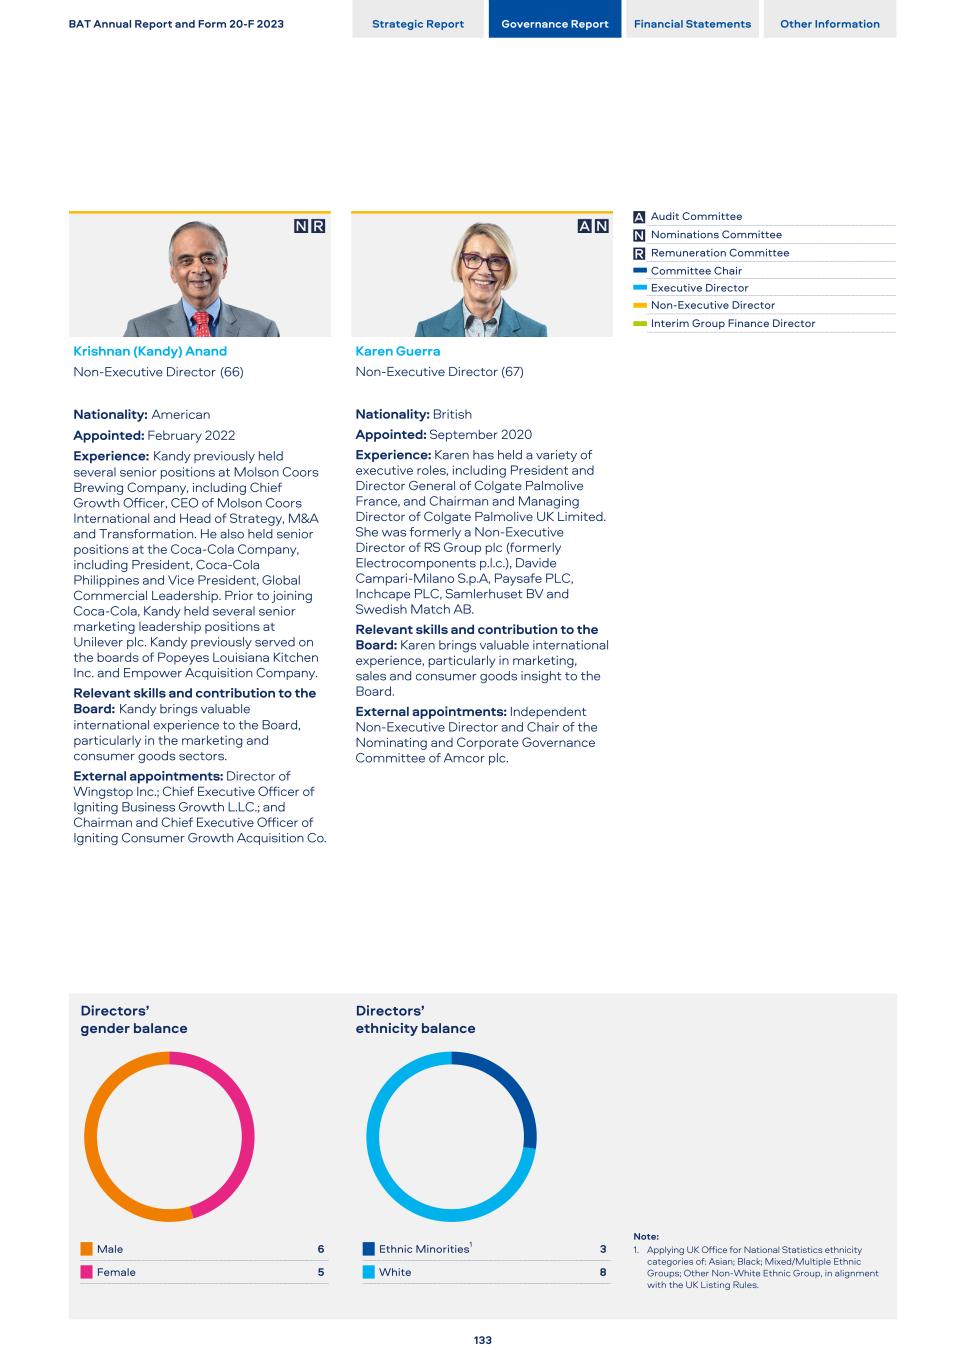
Krishnan (Kandy) Anand Non-Executive Director (66) Nationality: American Appointed: February 2022 Experience: Kandy previously held several senior positions at Molson Coors Brewing Company, including Chief Growth Officer, CEO of Molson Coors International and Head of Strategy, M&A and Transformation. He also held senior positions at the Coca-Cola Company, including President, Coca-Cola Philippines and Vice President, Global Commercial Leadership. Prior to joining Coca-Cola, Kandy held several senior marketing leadership positions at Unilever plc. Kandy previously served on the boards of Popeyes Louisiana Kitchen Inc. and Empower Acquisition Company. Relevant skills and contribution to the Board: Kandy brings valuable international experience to the Board, particularly in the marketing and consumer goods sectors. External appointments: Director of Wingstop Inc.; Chief Executive Officer of Igniting Business Growth L.LC.; and Chairman and Chief Executive Officer of Igniting Consumer Growth Acquisition Co. Directors’ gender balance Male 6 Female 5 Karen Guerra Non-Executive Director (67) Nationality: British Appointed: September 2020 Experience: Karen has held a variety of executive roles, including President and Director General of Colgate Palmolive France, and Chairman and Managing Director of Colgate Palmolive UK Limited. She was formerly a Non-Executive Director of RS Group plc (formerly Electrocomponents p.l.c.), Davide Campari-Milano S.p.A, Paysafe PLC, Inchcape PLC, Samlerhuset BV and Swedish Match AB. Relevant skills and contribution to the Board: Karen brings valuable international experience, particularly in marketing, sales and consumer goods insight to the Board. External appointments: Independent Non-Executive Director and Chair of the Nominating and Corporate Governance Committee of Amcor plc. Directors’ ethnicity balance Ethnic Minorities1 3 White 8 Audit Committee Nominations Committee Remuneration Committee Committee Chair Executive Director Non-Executive Director Interim Group Finance Director Note: 1. Applying UK Office for National Statistics ethnicity categories of: Asian; Black; Mixed/Multiple Ethnic Groups; Other Non-White Ethnic Group, in alignment with the UK Listing Rules. BAT Annual Report and Form 20-F 2023 Strategic Report Governance Report Financial Statements Other Information 133
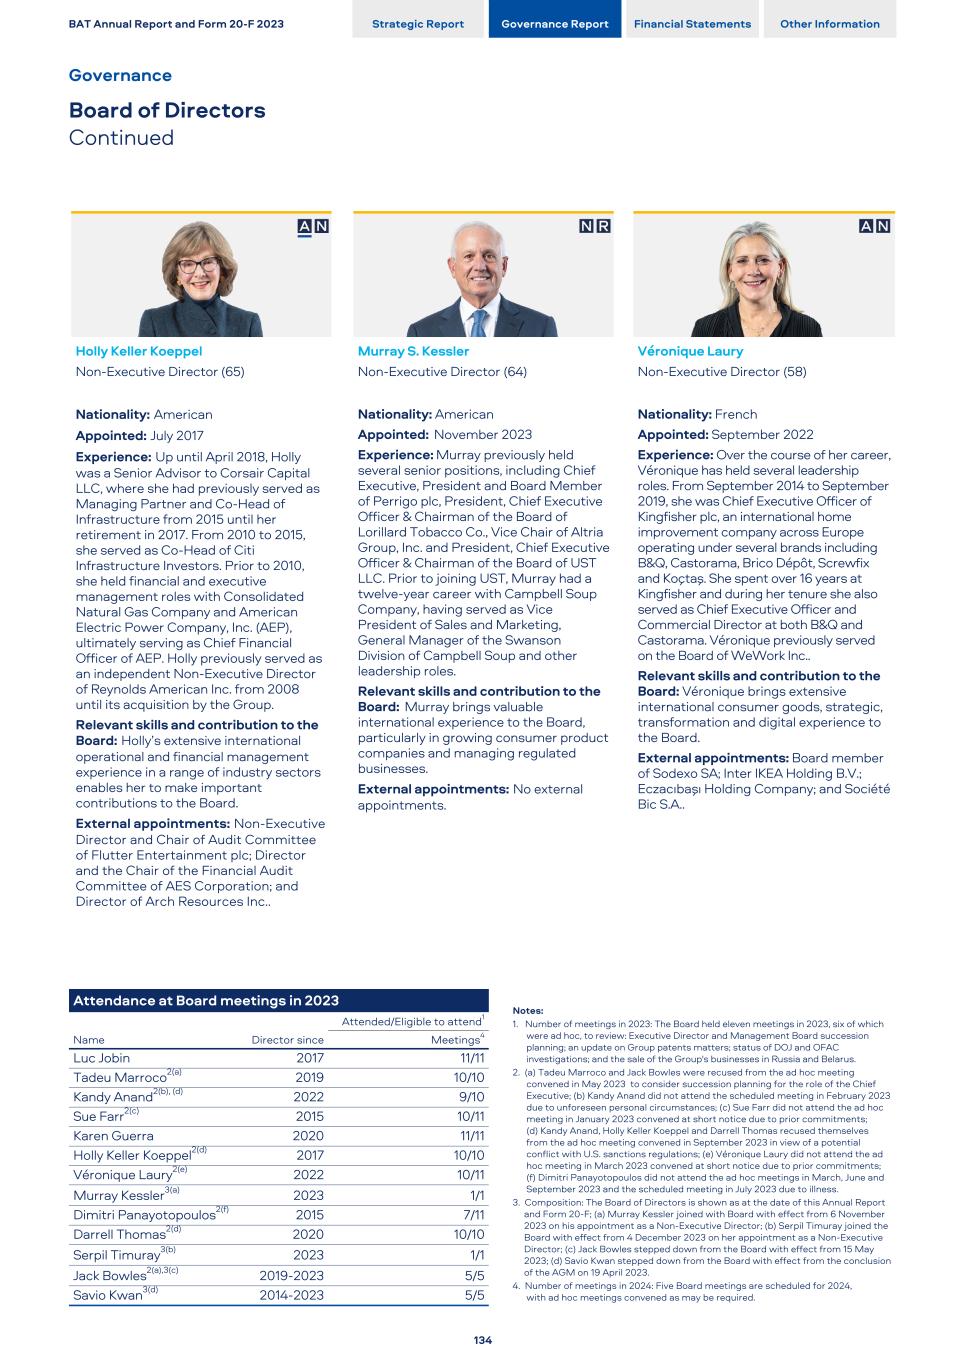
Holly Keller Koeppel Non-Executive Director (65) Nationality: American Appointed: July 2017 Experience: Up until April 2018, Holly was a Senior Advisor to Corsair Capital LLC, where she had previously served as Managing Partner and Co-Head of Infrastructure from 2015 until her retirement in 2017. From 2010 to 2015, she served as Co-Head of Citi Infrastructure Investors. Prior to 2010, she held financial and executive management roles with Consolidated Natural Gas Company and American Electric Power Company, Inc. (AEP), ultimately serving as Chief Financial Officer of AEP. Holly previously served as an independent Non-Executive Director of Reynolds American Inc. from 2008 until its acquisition by the Group. Relevant skills and contribution to the Board: Holly’s extensive international operational and financial management experience in a range of industry sectors enables her to make important contributions to the Board. External appointments: Non-Executive Director and Chair of Audit Committee of Flutter Entertainment plc; Director and the Chair of the Financial Audit Committee of AES Corporation; and Director of Arch Resources Inc.. Attendance at Board meetings in 2023 Notes: 1. Number of meetings in 2023: The Board held eleven meetings in 2023, six of which were ad hoc, to review: Executive Director and Management Board succession planning; an update on Group patents matters; status of DOJ and OFAC investigations; and the sale of the Group's businesses in Russia and Belarus. 2. (a) Tadeu Marroco and Jack Bowles were recused from the ad hoc meeting convened in May 2023 to consider succession planning for the role of the Chief Executive; (b) Kandy Anand did not attend the scheduled meeting in February 2023 due to unforeseen personal circumstances; (c) Sue Farr did not attend the ad hoc meeting in January 2023 convened at short notice due to prior commitments; (d) Kandy Anand, Holly Keller Koeppel and Darrell Thomas recused themselves from the ad hoc meeting convened in September 2023 in view of a potential conflict with U.S. sanctions regulations; (e) Véronique Laury did not attend the ad hoc meeting in March 2023 convened at short notice due to prior commitments; (f) Dimitri Panayotopoulos did not attend the ad hoc meetings in March, June and September 2023 and the scheduled meeting in July 2023 due to illness. 3. Composition: The Board of Directors is shown as at the date of this Annual Report and Form 20-F; (a) Murray Kessler joined with Board with effect from 6 November 2023 on his appointment as a Non-Executive Director; (b) Serpil Timuray joined the Board with effect from 4 December 2023 on her appointment as a Non-Executive Director; (c) Jack Bowles stepped down from the Board with effect from 15 May 2023; (d) Savio Kwan stepped down from the Board with effect from the conclusion of the AGM on 19 April 2023. 4. Number of meetings in 2024: Five Board meetings are scheduled for 2024, with ad hoc meetings convened as may be required. Attended/Eligible to attend1 Name Director since Meetings4 Luc Jobin 2017 11/11 Tadeu Marroco2(a) 2019 10/10 Kandy Anand2(b), (d) 2022 9/10 Sue Farr2(c) 2015 10/11 Karen Guerra 2020 11/11 Holly Keller Koeppel2(d) 2017 10/10 Véronique Laury2(e) 2022 10/11 Murray Kessler3(a) 2023 1/1 Dimitri Panayotopoulos2(f) 2015 7/11 Darrell Thomas2(d) 2020 10/10 Serpil Timuray3(b) 2023 1/1 Jack Bowles2(a),3(c) 2019-2023 5/5 Savio Kwan3(d) 2014-2023 5/5 Murray S. Kessler Non-Executive Director (64) Nationality: American Appointed: November 2023 Experience: Murray previously held several senior positions, including Chief Executive, President and Board Member of Perrigo plc, President, Chief Executive Officer & Chairman of the Board of Lorillard Tobacco Co., Vice Chair of Altria Group, Inc. and President, Chief Executive Officer & Chairman of the Board of UST LLC. Prior to joining UST, Murray had a twelve-year career with Campbell Soup Company, having served as Vice President of Sales and Marketing, General Manager of the Swanson Division of Campbell Soup and other leadership roles. Relevant skills and contribution to the Board: Murray brings valuable international experience to the Board, particularly in growing consumer product companies and managing regulated businesses. External appointments: No external appointments. Véronique Laury Non-Executive Director (58) Nationality: French Appointed: September 2022 Experience: Over the course of her career, Véronique has held several leadership roles. From September 2014 to September 2019, she was Chief Executive Officer of Kingfisher plc, an international home improvement company across Europe operating under several brands including B&Q, Castorama, Brico Dépôt, Screwfix and Koçtaş. She spent over 16 years at Kingfisher and during her tenure she also served as Chief Executive Officer and Commercial Director at both B&Q and Castorama. Véronique previously served on the Board of WeWork Inc.. Relevant skills and contribution to the Board: Véronique brings extensive international consumer goods, strategic, transformation and digital experience to the Board. External appointments: Board member of Sodexo SA; Inter IKEA Holding B.V.; Eczacıbaşı Holding Company; and Société Bic S.A.. BAT Annual Report and Form 20-F 2023 Strategic Report Governance Report Financial Statements Other Information Governance Board of Directors Continued 134
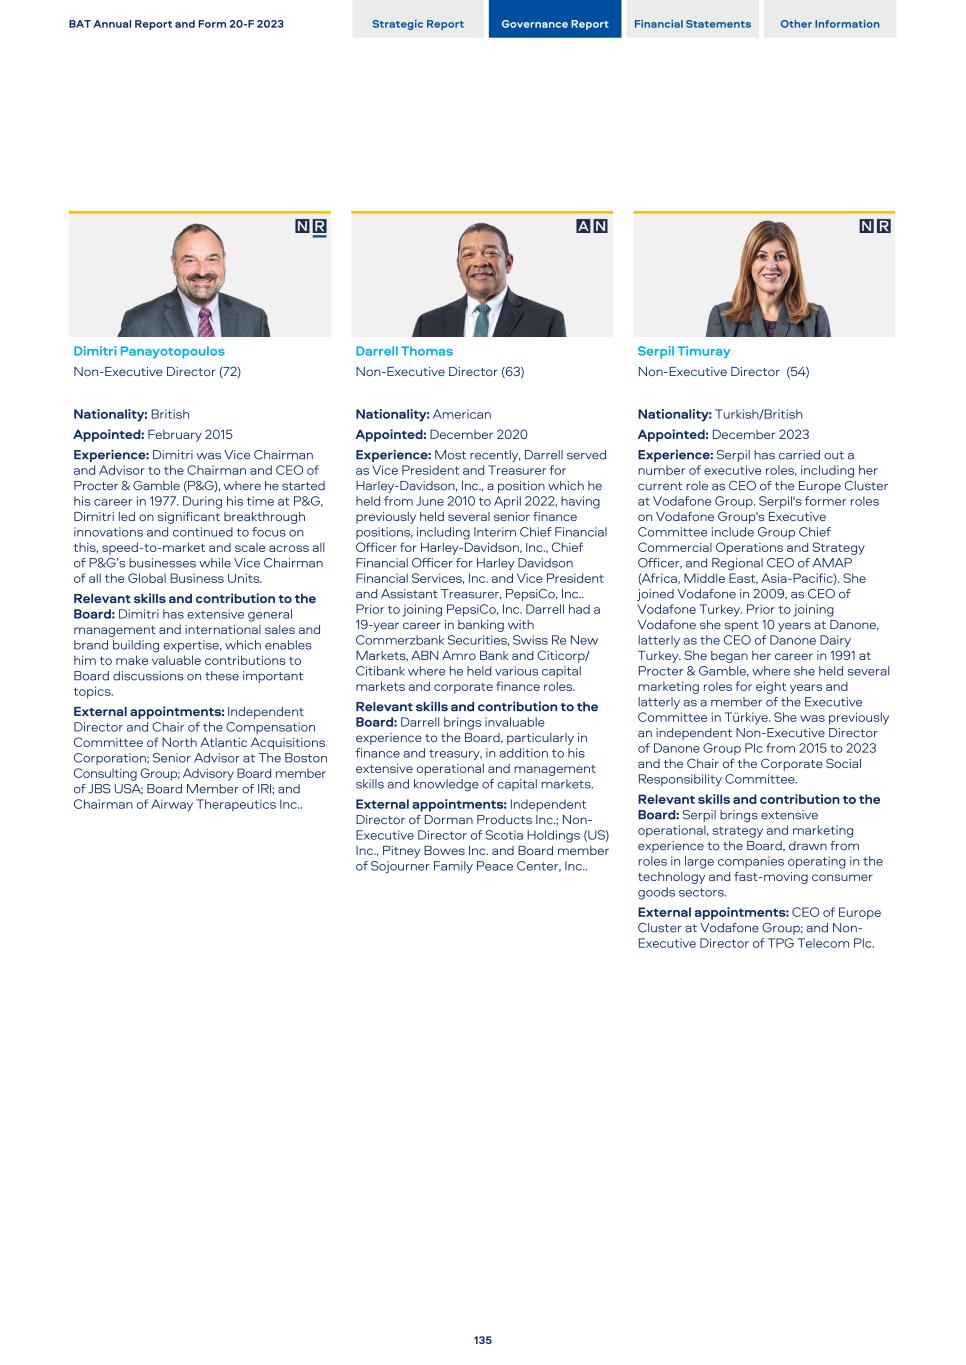
Dimitri Panayotopoulos Non-Executive Director (72) Nationality: British Appointed: February 2015 Experience: Dimitri was Vice Chairman and Advisor to the Chairman and CEO of Procter & Gamble (P&G), where he started his career in 1977. During his time at P&G, Dimitri led on significant breakthrough innovations and continued to focus on this, speed-to-market and scale across all of P&G’s businesses while Vice Chairman of all the Global Business Units. Relevant skills and contribution to the Board: Dimitri has extensive general management and international sales and brand building expertise, which enables him to make valuable contributions to Board discussions on these important topics. External appointments: Independent Director and Chair of the Compensation Committee of North Atlantic Acquisitions Corporation; Senior Advisor at The Boston Consulting Group; Advisory Board member of JBS USA; Board Member of IRI; and Chairman of Airway Therapeutics Inc.. Darrell Thomas Non-Executive Director (63) Nationality: American Appointed: December 2020 Experience: Most recently, Darrell served as Vice President and Treasurer for Harley-Davidson, Inc., a position which he held from June 2010 to April 2022, having previously held several senior finance positions, including Interim Chief Financial Officer for Harley-Davidson, Inc., Chief Financial Officer for Harley Davidson Financial Services, Inc. and Vice President and Assistant Treasurer, PepsiCo, Inc.. Prior to joining PepsiCo, Inc. Darrell had a 19-year career in banking with Commerzbank Securities, Swiss Re New Markets, ABN Amro Bank and Citicorp/ Citibank where he held various capital markets and corporate finance roles. Relevant skills and contribution to the Board: Darrell brings invaluable experience to the Board, particularly in finance and treasury, in addition to his extensive operational and management skills and knowledge of capital markets. External appointments: Independent Director of Dorman Products Inc.; Non- Executive Director of Scotia Holdings (US) Inc., Pitney Bowes Inc. and Board member of Sojourner Family Peace Center, Inc.. Serpil Timuray Non-Executive Director (54) Nationality: Turkish/British Appointed: December 2023 Experience: Serpil has carried out a number of executive roles, including her current role as CEO of the Europe Cluster at Vodafone Group. Serpil's former roles on Vodafone Group's Executive Committee include Group Chief Commercial Operations and Strategy Officer, and Regional CEO of AMAP (Africa, Middle East, Asia-Pacific). She joined Vodafone in 2009, as CEO of Vodafone Turkey. Prior to joining Vodafone she spent 10 years at Danone, latterly as the CEO of Danone Dairy Turkey. She began her career in 1991 at Procter & Gamble, where she held several marketing roles for eight years and latterly as a member of the Executive Committee in Türkiye. She was previously an independent Non-Executive Director of Danone Group Plc from 2015 to 2023 and the Chair of the Corporate Social Responsibility Committee. Relevant skills and contribution to the Board: Serpil brings extensive operational, strategy and marketing experience to the Board, drawn from roles in large companies operating in the technology and fast-moving consumer goods sectors. External appointments: CEO of Europe Cluster at Vodafone Group; and Non- Executive Director of TPG Telecom Plc. BAT Annual Report and Form 20-F 2023 Strategic Report Governance Report Financial Statements Other Information 135

Tadeu Marroco Chief Executive (57) Nationality: Brazilian Tadeu joined the Group in 1992 and joined the Management Board as Director, Business Development in 2014, later becoming Regional Director, Western Europe in 2016, then Regional Director, Europe and North Africa in January 2018. He became Director, Group Transformation in January 2019 and, in addition to this role, he was appointed Deputy Finance Director in March 2019, before joining the Board as Finance Director in August 2019 and later becoming Finance and Transformation Director. He became Chief Executive in May 2023. + Read more on page 132 Javed Iqbal Interim Finance Director, and Director, Digital and Information (51) Nationality: Pakistani Javed joined the Management Board as Director, Digital and Information in April 2022 and was appointed Interim Finance Director on 15 May 2023. He joined the Group as a Management Trainee, Finance in 1996 having previously held a number of senior roles, most recently as the Area Director for Middle East, South Asia and North Africa. Luciano Comin Marketing Director, Combustibles & New Categories (54) Nationality: Italian/Argentinian Luciano became Marketing Director, Combustibles & New Categories in July 2023, having joined the Management Board as Regional Director, Americas and Sub-Saharan Africa in January 2019. He joined the Group in 1992 and has held a wide range of roles, including Marketing Director in Venezuela, Marketing Director in Mexico and General Manager of BAT Mexico. Luciano was also Regional Marketing Manager for Western Europe and then Regional Head of Marketing, Americas and Sub-Saharan Africa before his appointment to the Management Board. Jerome Abelman Director, Legal and General Counsel (60) Nationality: American Jerome was appointed Director, Legal Affairs and General Counsel in September 2023, after joining the Management Board as Director, Corporate and Regulatory Affairs in January 2015. In May 2015, he became General Counsel and Director, Legal & External Affairs. He served as a Director on the Board of Reynolds American Inc. from February 2016 until July 2017. Michael Dijanosic Regional Director, Asia- Pacific, Middle East and Africa (52) Nationality: Australian Michael became Regional Director, Asia-Pacific, Middle East and Africa in April 2023, having joined the Management Board on 1 September 2020 in the role of Regional Director, Asia-Pacific and Middle East. Previously, he was Area Director for Asia-Pacific and Global Travel Retail. Michael joined the Group in 1999 and has held several senior roles in the Group including General Manager (Papua New Guinea and Cambodia) and Regional Manager, Asia-Pacific. James Barrett Director, Business Development (49) Nationality: British James joined the Management Board as Director, Business Development on 1 September 2023. He has been with BAT since 1996, having joined as a Management Trainee and has taken various senior roles in finance, including a number of finance directorships globally, Group Finance Controller, Head of M&A and most recently as Consumer Director, Beyond Nicotine. Zafar Khan Director, Operations (51) Nationality: Pakistani Zafar was appointed Director, Operations in February 2021 and became a member of the Management Board at the same time. Previously, he was Group Head of New Categories Operations. Zafar joined BAT in 1996 and has held several senior roles in the Group, including Regional Head of Operations Asia Pacific & Middle East, Group Head of Plan, Service & Logistics, Regional Head of Plan and Service for Western Europe and Head of Operations, Bangladesh. BAT Annual Report and Form 20-F 2023 Strategic Report Governance Report Financial Statements Other Information Governance Management Board As at 07 February 2024 136
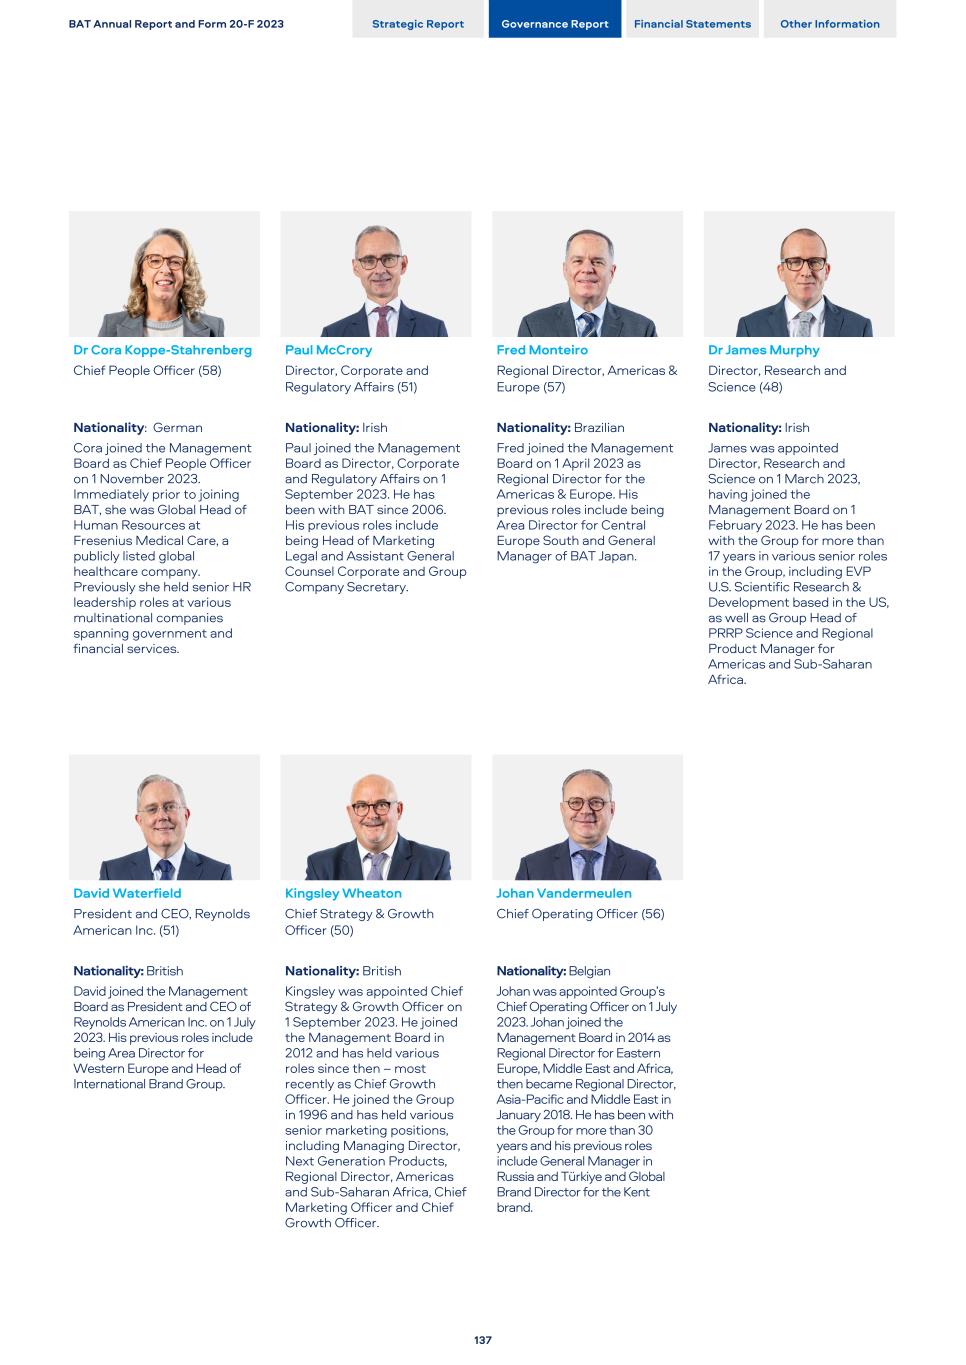
Dr Cora Koppe-Stahrenberg Chief People Officer (58) Nationality: German Cora joined the Management Board as Chief People Officer on 1 November 2023. Immediately prior to joining BAT, she was Global Head of Human Resources at Fresenius Medical Care, a publicly listed global healthcare company. Previously she held senior HR leadership roles at various multinational companies spanning government and financial services. David Waterfield President and CEO, Reynolds American Inc. (51) Nationality: British David joined the Management Board as President and CEO of Reynolds American Inc. on 1 July 2023. His previous roles include being Area Director for Western Europe and Head of International Brand Group. Paul McCrory Director, Corporate and Regulatory Affairs (51) Nationality: Irish Paul joined the Management Board as Director, Corporate and Regulatory Affairs on 1 September 2023. He has been with BAT since 2006. His previous roles include being Head of Marketing Legal and Assistant General Counsel Corporate and Group Company Secretary. Kingsley Wheaton Chief Strategy & Growth Officer (50) Nationality: British Kingsley was appointed Chief Strategy & Growth Officer on 1 September 2023. He joined the Management Board in 2012 and has held various roles since then – most recently as Chief Growth Officer. He joined the Group in 1996 and has held various senior marketing positions, including Managing Director, Next Generation Products, Regional Director, Americas and Sub-Saharan Africa, Chief Marketing Officer and Chief Growth Officer. Fred Monteiro Regional Director, Americas & Europe (57) Nationality: Brazilian Fred joined the Management Board on 1 April 2023 as Regional Director for the Americas & Europe. His previous roles include being Area Director for Central Europe South and General Manager of BAT Japan. Johan Vandermeulen Chief Operating Officer (56) Nationality: Belgian Johan was appointed Group’s Chief Operating Officer on 1 July 2023. Johan joined the Management Board in 2014 as Regional Director for Eastern Europe, Middle East and Africa, then became Regional Director, Asia-Pacific and Middle East in January 2018. He has been with the Group for more than 30 years and his previous roles include General Manager in Russia and Türkiye and Global Brand Director for the Kent brand. Dr James Murphy Director, Research and Science (48) Nationality: Irish James was appointed Director, Research and Science on 1 March 2023, having joined the Management Board on 1 February 2023. He has been with the Group for more than 17 years in various senior roles in the Group, including EVP U.S. Scientific Research & Development based in the US, as well as Group Head of PRRP Science and Regional Product Manager for Americas and Sub-Saharan Africa. BAT Annual Report and Form 20-F 2023 Strategic Report Governance Report Financial Statements Other Information 137
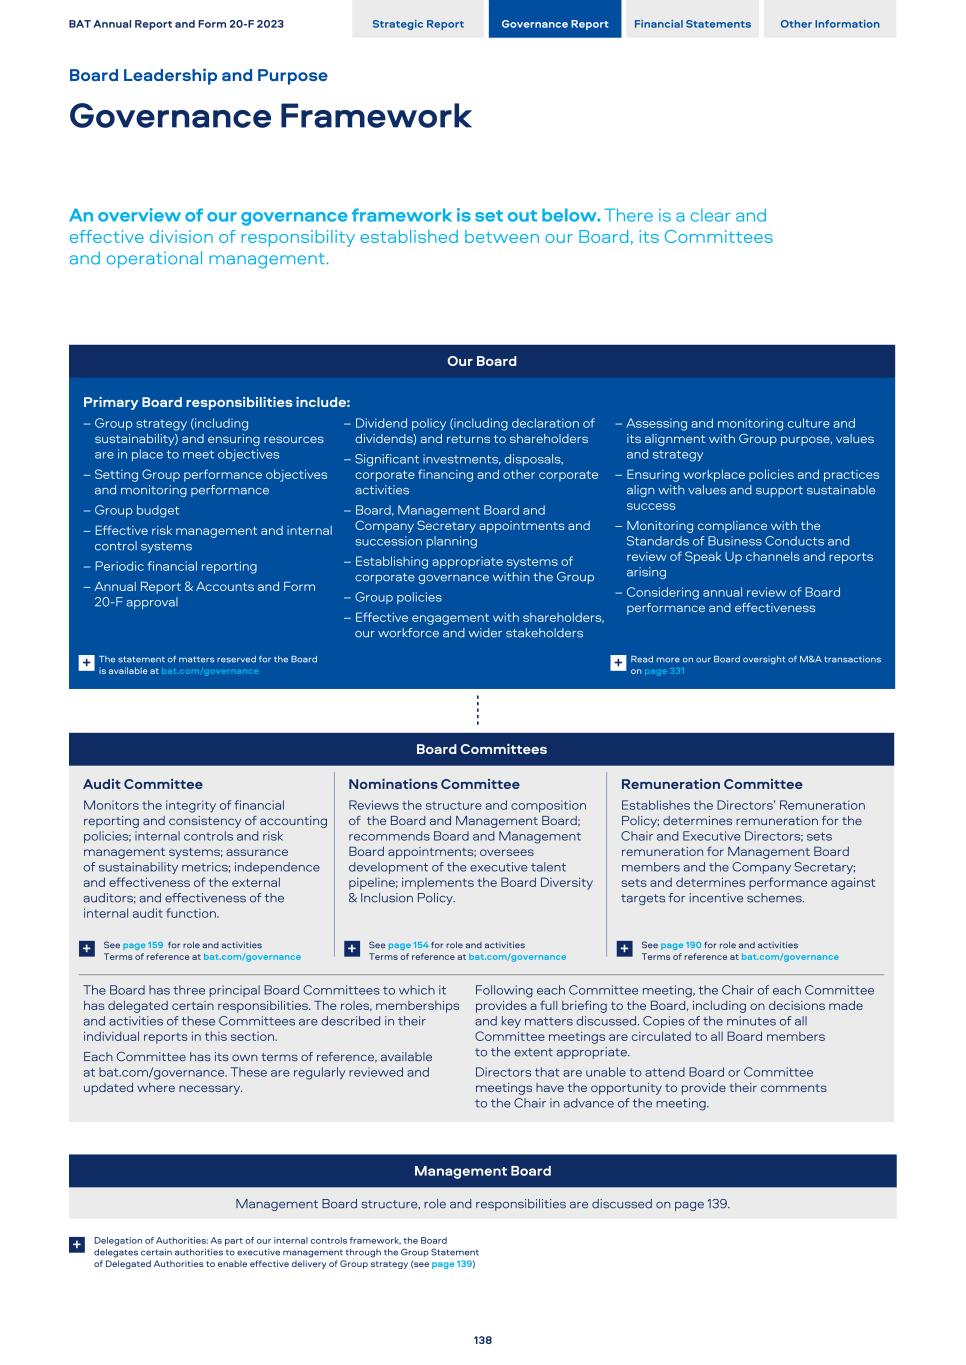
Our Board Primary Board responsibilities include: – Group strategy (including sustainability) and ensuring resources are in place to meet objectives – Setting Group performance objectives and monitoring performance – Group budget – Effective risk management and internal control systems – Periodic financial reporting – Annual Report & Accounts and Form 20-F approval – Dividend policy (including declaration of dividends) and returns to shareholders – Significant investments, disposals, corporate financing and other corporate activities – Board, Management Board and Company Secretary appointments and succession planning – Establishing appropriate systems of corporate governance within the Group – Group policies – Effective engagement with shareholders, our workforce and wider stakeholders – Assessing and monitoring culture and its alignment with Group purpose, values and strategy – Ensuring workplace policies and practices align with values and support sustainable success – Monitoring compliance with the Standards of Business Conducts and review of Speak Up channels and reports arising – Considering annual review of Board performance and effectiveness The statement of matters reserved for the Board is available at bat.com/governance Read more on our Board oversight of M&A transactions on page 331+ + Board Committees Audit Committee Nominations Committee Remuneration Committee Monitors the integrity of financial reporting and consistency of accounting policies; internal controls and risk management systems; assurance of sustainability metrics; independence and effectiveness of the external auditors; and effectiveness of the internal audit function. Reviews the structure and composition of the Board and Management Board; recommends Board and Management Board appointments; oversees development of the executive talent pipeline; implements the Board Diversity & Inclusion Policy. Establishes the Directors’ Remuneration Policy; determines remuneration for the Chair and Executive Directors; sets remuneration for Management Board members and the Company Secretary; sets and determines performance against targets for incentive schemes. See page 159 for role and activities Terms of reference at bat.com/governance See page 154 for role and activities Terms of reference at bat.com/governance See page 190 for role and activities Terms of reference at bat.com/governance+ + + The Board has three principal Board Committees to which it has delegated certain responsibilities. The roles, memberships and activities of these Committees are described in their individual reports in this section. Each Committee has its own terms of reference, available at bat.com/governance. These are regularly reviewed and updated where necessary. Following each Committee meeting, the Chair of each Committee provides a full briefing to the Board, including on decisions made and key matters discussed. Copies of the minutes of all Committee meetings are circulated to all Board members to the extent appropriate. Directors that are unable to attend Board or Committee meetings have the opportunity to provide their comments to the Chair in advance of the meeting. Management Board Management Board structure, role and responsibilities are discussed on page 139. Delegation of Authorities: As part of our internal controls framework, the Board delegates certain authorities to executive management through the Group Statement of Delegated Authorities to enable effective delivery of Group strategy (see page 139) + BAT Annual Report and Form 20-F 2023 Strategic Report Governance Report Financial Statements Other Information Board Leadership and Purpose Governance Framework An overview of our governance framework is set out below. There is a clear and effective division of responsibility established between our Board, its Committees and operational management. 138
Board Leadership The Board is collectively responsible to our shareholders for the long-term sustainable success of the Company and for the Group’s strategic direction, purpose, values and governance. The Board provides the leadership necessary for the Group to meet its business objectives within a robust framework of internal controls, and is also responsible for ensuring the Group has an effective executive leadership team in place to execute the Group's strategy. The Board maintains oversight of the Group's operations, performance, governance and compliance with regulatory obligations. The Board’s primary responsibilities are summarised on page 138. Matters reserved to the Board bat.com/governance+ Board activities The Board has a comprehensive annual programme of meetings to review the Group’s strategy and monitor performance across all elements of the Group’s business model. The Board’s strategic priorities for 2023 are identified within the key performance indicators set out on page 10. Its key activities during the year are set out on pages 142 to 143. The Chair sets structured meeting agendas in consultation with the Chief Executive and the Company Secretary. As part of the Board meeting in October 2023 convened in Romania, the Board held strategy sessions over four days with members of executive management to assess the Group's strategy and long-term growth opportunities, strategic priorities, progress on key initiatives, and key challenges, risks and mitigation plans. The Board's consideration of stakeholder interests and environmental and societal factors is fully embedded into Board decision-making, strategy development and risk assessment on an ongoing basis. Examples of principal decisions made by the Board during the year, and consideration given to the long- term consequences of decisions, stakeholder interests, the impact of operations on the environment and corporate reputation in those contexts, are discussed on page 149. The continued impact of the conflict in Ukraine remained an important focus for the Board in 2023 and the Board closely oversaw the process towards the sale of the Group's businesses in Russia and Belarus, which was completed and announced in September 2023 (see page 280). Throughout this process, the Board gave careful attention to measures deployed to support the safety and welfare of our people in the region, the impact of the conflict on other stakeholders and the Group's supply chain, compliance with international sanctions and other applicable regulations, and reputational considerations in the context of the transaction and the Group’s broader operations in the region. How our governance framework supports our strategy An overview of our governance framework, including the structure of the Board and its principal Committees, is set out on page 138. Certain key decisions and matters are reserved for the Board and are not delegated to any Committees or executive management. In 2023, the Board adopted a refreshed internal governance framework, including revised terms of reference for its Committees, to reflect the Group's new executive management structure and to maintain alignment with evolving market practice. As part of our internal controls framework, the Board has delegated certain authorities to executive management through the Group Statement of Delegated Authorities (SoDA) to enable effective delivery of our strategy. Revisions to the SoDA were introduced in 2023 to support implementation of the Group's new regional and executive management structures. Our SoDA is designed to empower management at the right level of our organisation and promote accountability and ownership. Overseeing the implementation of the Group strategy through our SoDA is one of the ways that the Board promotes robust corporate governance, risk management and internal controls across the Group. Our SoDA also supports our Board members in managing their responsibility for promoting the success of the Company, in accordance with their directors’ duties. Management Board The Management Board is responsible for overseeing the implementation of Group strategy and policies set by the Board, and creating the framework for Group subsidiaries’ day-to-day operations. Primary responsibilities of the Management Board include: – Developing Group strategy for the Group’s product portfolio for approval by the Board. – Monitoring Group operating performance. – Ensuring Group, regional and functional strategies and resources are effective and aligned. – Managing the central functions. – Overseeing the management and development of Group talent. Management Board structure The Management Board is chaired by the Chief Executive and comprises the Chief Executive and 13 senior executives whose names and roles are described on pages 136 to 137. A series of changes to the structure and composition of the Management Board were announced during 2023, including to reflect the Group's new regional structures that took effect on 1 April 2023, and to sharpen focus on improved execution and operational excellence and enhance key capabilities. Subsequent to the changes summarised in the Company's Half Year Report for the six months ended 30 June 2023, Cora Koppe- Stahrenberg was appointed to the Management Board as Chief People Officer reporting to the Chief Executive, with effect from 1 November 2023. Soraya Benchikh will join the Management Board on her appointment as Chief Financial Officer from 1 May 2024. BAT Annual Report and Form 20-F 2023 Strategic Report Governance Report Financial Statements Other Information Board Leadership 139
Our Purpose and Values Our purpose, for A Better TomorrowTM: Building a Smokeless World, is underpinned by our values. These build on the strong foundations of the BAT ethos and are designed to act as a clear and authentic guide for our culture and behaviours. In the context of evolution of Group strategy, the Board conducted a thorough assessment of our corporate values and approach to their development to maintain a clear connection to our strategy and purpose, with focus on diversity and inclusion; empowerment and collaboration; and organisational agility. The Board has endorsed a refreshed statement of our values, taking into account a broad range of feedback from across our workforce, including from a balanced cross-section of employee groups. More than one thousand colleagues across the Group participated in focus sessions to contribute their views on developing our values. Through our values, we strive to empower our people and foster an exciting, rewarding workplace, emphasising inclusivity and collaboration to deliver sustainable growth. + Read more about our values on page 40 + Read more about our purpose on page 16 Delivery with integrity How we execute our strategy is as important as its delivery. Our values emphasise acting with integrity, taking care about our impact on society, and thoughtfulness in decision making. It is critical to the Group’s long-term, sustainable success that all our people act with high standards of behaviour. We articulate this through our Group Standards of Business Conduct (SoBC). Compliance with our SoBC, in letter and spirit, is mandatory for all our people worldwide. Our SoBC is regularly reviewed and updated. A revised edition of our SoBC was introduced in January 2024 (discussed on page 149), supported by an extensive awareness campaign across the organisation with emphasis on the role of everyone in the organisation to act as a first line of defence against any conduct that does not meet our standards. Our SoBC includes our Lobbying and Engagement policy, reinforcing our position that all our engagement activities with governments, regulators and other external stakeholders must be conducted with transparency, openness and integrity. It also includes our Speak Up policy, reflecting the Speak Up channels for raising any concerns in confidence (anonymously if preferred) and without fear of reprisal. The Audit Committee monitors SoBC allegations reported during the year, and reports to the Board to enable Board oversight of any behaviour falling short of our standards and corrective actions taken. Read more about our commitment to delivery with integrity and our Group Standards of Business Conduct on pages 98 to 99+ Shaping and Overseeing Culture The Board oversees and monitors our culture to enable the Board to be satisfied that it aligns with the Group's purpose, values and strategy, and is reflected consistently in our workplace policies and practices. The Board supports our executive management team in promoting our values in every area of our business. The Board has considered the Group’s culture in a range of contexts throughout the year, including through workforce engagement. Primary indicators used by the Board to gauge organisational culture and key examples of the Board’s oversight in 2023 are set out below. The effectiveness of the Board's oversight of culture is considered as part of the annual review of Board effectiveness (see pages 152 to 153). Connecting directly with our people Our Directors participate in visits to markets and operations sites during the year, spanning trade marketing and distribution operations, R&D and manufacturing facilities. These opportunities provide an important lens through which Directors can assess organisational culture in context. Visits are structured to enable informal opportunities for Directors to hear directly from colleagues at different levels of the business and take an on-the-ground pulse check of our corporate culture. Kandy Anand and Karen Guerra viewing Modern Oral product innovations at the Innovations Lab in Stockholm, Sweden. In September 2023, Luc Jobin, Kandy Anand, Karen Guerra and Darrell Thomas toured Group operations in Sweden, including a visit to retail locations in Stockholm to understand local distribution capabilities, a virtual tour of modern oral manufacturing at our facilities in Malmö, and an immersive event with members of our Nordics innovation team to see how our Modern Oral product developers work directly with consumers to develop our product pipeline. Their visit concluded with participation in a townhall and Q&A session, attended by more than 300 colleagues from our Western Europe operations. In October 2023, the Directors1 attended a market visit in Romania as part of the Board's strategy sessions. The Directors visited retail outlets in Bucharest to see local trade marketing and distribution operations and how our local marketing representatives engage with retailers to promote responsible marketing and age verification. Since becoming Chief Executive in May 2023, Tadeu Marroco has engaged with colleagues across the regions, visiting the U.S., Germany and Poland in our Central Europe area, and Japan and China in our North Asia-Pacific area, to discuss their views and his insights on priorities for business transformation, including through town hall sessions. The Directors' workforce engagement programme is discussed further at page 148. Note: 1. All Directors attended this market visit other than Dimitri Panayotopoulos. Mr Panayotopoulos attended the Board strategy meetings in October 2023 via videoconference. BAT Annual Report and Form 20-F 2023 Strategic Report Governance Report Financial Statements Other Information Board Leadership and Purpose Values and Culture 140
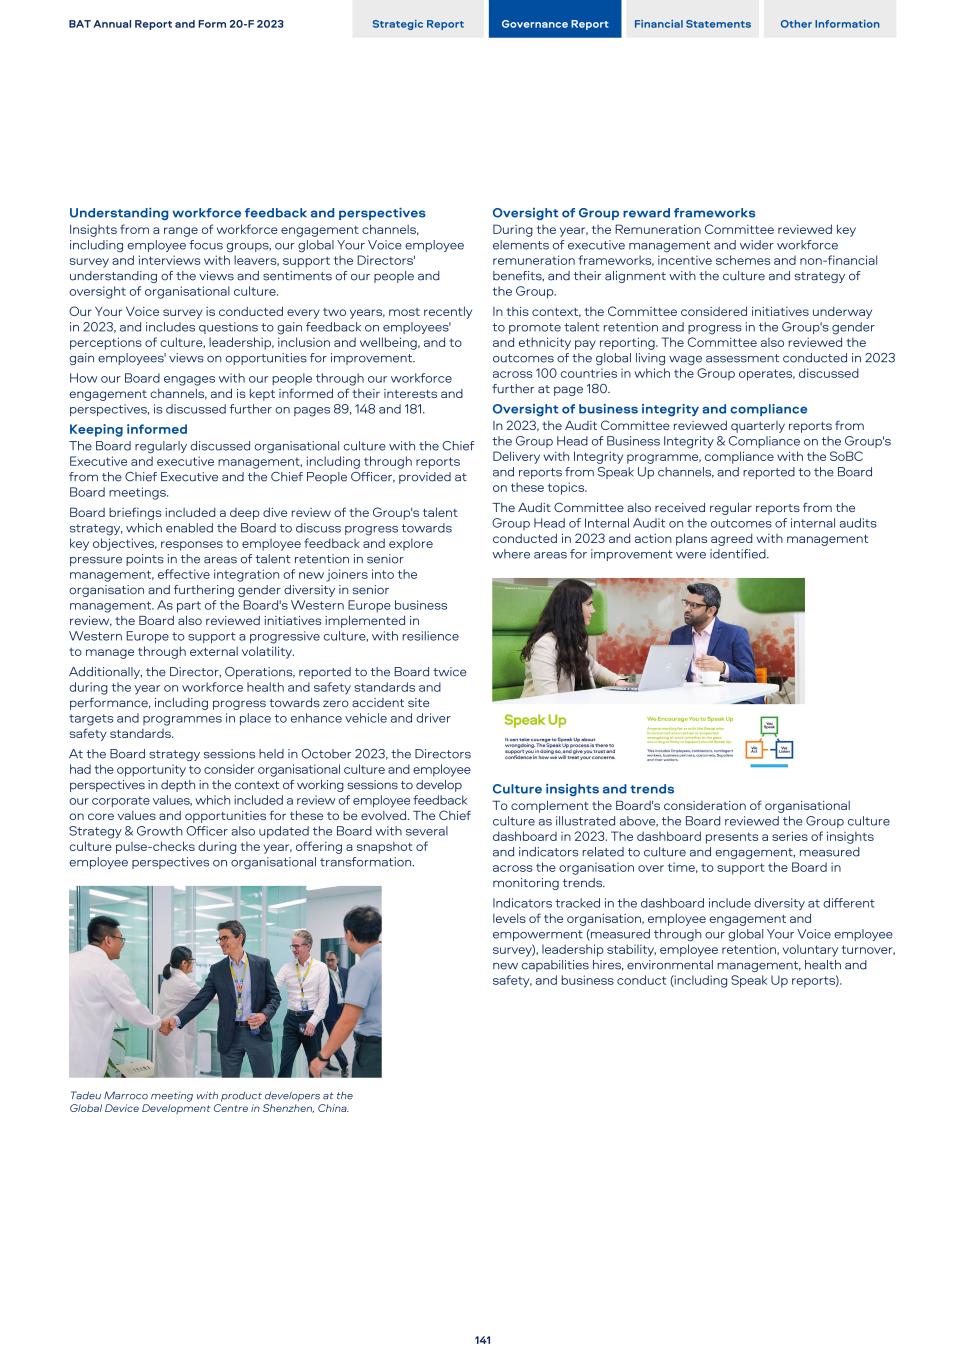
Understanding workforce feedback and perspectives Insights from a range of workforce engagement channels, including employee focus groups, our global Your Voice employee survey and interviews with leavers, support the Directors' understanding of the views and sentiments of our people and oversight of organisational culture. Our Your Voice survey is conducted every two years, most recently in 2023, and includes questions to gain feedback on employees' perceptions of culture, leadership, inclusion and wellbeing, and to gain employees' views on opportunities for improvement. How our Board engages with our people through our workforce engagement channels, and is kept informed of their interests and perspectives, is discussed further on pages 89, 148 and 181. Keeping informed The Board regularly discussed organisational culture with the Chief Executive and executive management, including through reports from the Chief Executive and the Chief People Officer, provided at Board meetings. Board briefings included a deep dive review of the Group's talent strategy, which enabled the Board to discuss progress towards key objectives, responses to employee feedback and explore pressure points in the areas of talent retention in senior management, effective integration of new joiners into the organisation and furthering gender diversity in senior management. As part of the Board's Western Europe business review, the Board also reviewed initiatives implemented in Western Europe to support a progressive culture, with resilience to manage through external volatility. Additionally, the Director, Operations, reported to the Board twice during the year on workforce health and safety standards and performance, including progress towards zero accident site targets and programmes in place to enhance vehicle and driver safety standards. At the Board strategy sessions held in October 2023, the Directors had the opportunity to consider organisational culture and employee perspectives in depth in the context of working sessions to develop our corporate values, which included a review of employee feedback on core values and opportunities for these to be evolved. The Chief Strategy & Growth Officer also updated the Board with several culture pulse-checks during the year, offering a snapshot of employee perspectives on organisational transformation. Tadeu Marroco meeting with product developers at the Global Device Development Centre in Shenzhen, China. Oversight of Group reward frameworks During the year, the Remuneration Committee reviewed key elements of executive management and wider workforce remuneration frameworks, incentive schemes and non-financial benefits, and their alignment with the culture and strategy of the Group. In this context, the Committee considered initiatives underway to promote talent retention and progress in the Group's gender and ethnicity pay reporting. The Committee also reviewed the outcomes of the global living wage assessment conducted in 2023 across 100 countries in which the Group operates, discussed further at page 180. Oversight of business integrity and compliance In 2023, the Audit Committee reviewed quarterly reports from the Group Head of Business Integrity & Compliance on the Group's Delivery with Integrity programme, compliance with the SoBC and reports from Speak Up channels, and reported to the Board on these topics. The Audit Committee also received regular reports from the Group Head of Internal Audit on the outcomes of internal audits conducted in 2023 and action plans agreed with management where areas for improvement were identified. Culture insights and trends To complement the Board's consideration of organisational culture as illustrated above, the Board reviewed the Group culture dashboard in 2023. The dashboard presents a series of insights and indicators related to culture and engagement, measured across the organisation over time, to support the Board in monitoring trends. Indicators tracked in the dashboard include diversity at different levels of the organisation, employee engagement and empowerment (measured through our global Your Voice employee survey), leadership stability, employee retention, voluntary turnover, new capabilities hires, environmental management, health and safety, and business conduct (including Speak Up reports). BAT Annual Report and Form 20-F 2023 Strategic Report Governance Report Financial Statements Other Information 141
Inspiring New Categories Innovations & Brands – reviewing New Categories performance at Group, regional and key market levels against strategy and key performance indicators, including New Categories revenue, contribution and market share; – reviewing the outlook for New Categories performance for the Group, regions and the wider industry, consumer product adoption and developments in the competitor landscape; – reviewing the approach to investment in New Categories and developments in the innovation pipeline across the Vuse, glo and Velo product portfolios; – reviewing geographic expansion plans for New Categories products in the context of market archetypes and developing regulations; and – overseeing the Group's New Categories patents portfolio, approach to IP management and ongoing patent litigation. Managed Combustible Transition – reviewing combustibles performance at Group, regional and key market levels against strategy and key performance indicators, including revenue and value share growth; – reviewing combustibles industry outlook, trading environment and competitor landscape from global and regional perspectives; and – reviewing application of market archetypes to drive value from combustibles to fund New Categories investment and efficient resource allocation, and portfolio complexity reduction, revenue growth management and marketing spend efficiency initiatives. Beyond Nicotine Foundations – overseeing strategy to develop opportunities for the Group beyond nicotine in the wellbeing and stimulation category; – reviewing plans to launch Ryde, a new functional wellness and stimulation brand, in pilot markets, including approach to product stewardship, outcomes of total offer testing and route to market strategy; – assessing Btomorrow Ventures’ performance as a corporate venture capital fund, scope of strategic mandate and approach to maturing its venturing capabilities; and – overseeing progress in the product development collaboration with Organigram Holdings, Inc. Exciting, Winning Company – overseeing the transition of the role of Chief Executive and approving the appointment of Tadeu Marroco as Chief Executive and Javed Iqbal as Interim Finance Director with effect from May 2023, on the recommendation of the Nominations Committee; – approving the appointment of Soraya Benchikh as Chief Financial Officer and as an Executive Director with effect from May 2024; – approving the appointments of Murray Kessler and Serpil Timuray as Non- Executive Directors and members of the Remuneration and Nominations Committees, on the recommendation of the Nominations Committee; – succession planning for the role of Senior Independent Director and for the Audit and Remuneration Committee Chairs; – approving changes to the structure and composition of the Management Board, on the recommendations of the Nominations Committee; – determining the independence of Non- Executive Directors prior to proposing them for appointment at the Company’s AGM; – approving revisions to Non-Executive Director fees; – shaping the development and endorsing a refreshed statement of the Group's corporate values; – monitoring corporate culture and its alignment with the Group’s purpose, values and strategy; – reviewing the Group’s talent strategy, diversity and inclusion agenda, and progress against objectives; – reviewing feedback from the Group’s workforce engagement channels; – reviewing health and safety performance for the preceding year, outcomes of Environment, Health & Safety roadmap assessments, targets for the coming year and action plans; – reviewing the outcomes of the internal review of the effectiveness of the Board, its Committees and Directors in 2023; – reviewing the funding positions relating to the Group’s post-employment benefit schemes; and – approving the introduction of additional malus and clawback arrangements for applicable senior executives, in alignment with U.S. SEC regulation and NYSE rules. Operational Excellence – reviewing U.S. business operations and approach to resetting the strategy for our U.S. business, including macro- economic and structural challenges, sharpening portfolio management, and strengthening route-to-market and digital executional excellence to drive quality growth; – overseeing the implementation of the new regional, business unit structures and organisational design structures across the Group; – reviewing the Group risk register, and risk appetite in the context of strategic objectives and emerging risks, with focus on emerging cyber security threats, risks related to supply chain disruption and the impact of continued conflict between Russia and Ukraine and the broader geopolitical environment; – reviewing the development of the Group's strategic market footprint and opportunities for reduction of geographic and supply chain complexities; – reviewing plans for further complexity reduction programmes, including product portfolio rationalisation and leaf sourcing optimisation strategies; – assessing the application of the market archetypes framework to drive effective resource allocation; – reviewing plans for strategic partnerships to optimise the Group's operational network and asset footprint; – reviewing opportunities to further leverage the Group's Global Business Solutions organisation to drive above- market synergies and embed new capabilities; – reviewing the Group's information and digital technology (IDT) transformation programme and initiatives underway to drive productivity through enhanced use of technology and automation, improve data capabilities and simplify the Group's technology landscape; and – approving revisions to the Group's corporate governance framework and Statement of Delegated Authorities. BAT Annual Report and Form 20-F 2023 Strategic Report Governance Report Financial Statements Other Information Board Leadership and Purpose Board Activities in 2023 142
Capital Effectiveness – approving the Group budget, reviewing the application of the Group's capital allocation strategy, and oversight of resource allocation activities to support strategy execution; – reviewing Group financial performance against key performance metrics, current outlook, challenges and opportunities for growth in each region, and FX impacts; – assessing capital efficiency in the context of cash generation and cash flow performance, access to financing, capacity, cost of debt and investments; – reviewing Group half-year results, trading updates, year-end results and the Annual Report and Form 20-F; – approving interim dividend proposals and assessing distributable reserves of the Company prior to authorising dividend payments; – determining Group viability, taking into account current position and principal risks; – reviewing compliance with Group financing principles, including liquidity, capital allocation and net debt/EBITDA; – reviewing the Group’s revolving credit facilities, refinancings, the Euro hybrid bond issuance, and debt issuance programmes; – assessing the impact of macro-economic trends on Group performance, outlook and operations due to geopolitical instability and continued inflationary pressures; – reviewing share price performance and investor and broker perspectives; – reviewing status of litigation involving Group companies, including updates on the Companies' Creditors Arrangement Act (CCAA) process in relation to Imperial Tobacco Canada; – reviewing Group insurance coverage; and – reviewing investments in associates of the Group and their financial performance. Tobacco Harm Reduction Acceptance – reviewing strategic focus, initiatives and capabilities in relation to tobacco harm reduction science and advocacy in the context of our ambition to reduce the health impact of our business; – reviewing the Group's approach to scientific product stewardship underpinning the development of sustainable products; – reviewing the scope of engagement with scientific and public health stakeholders on tobacco harm reduction science and research, including the role of the External Scientific & Regulatory Panel (see page 147); and – understanding the digital resources made available to consumers about tobacco harm reduction and New Categories to help consumers make informed product decisions. Shaping the Landscape – reviewing strategy for the Corporate & Regulatory Affairs function and approach to proactive engagement with regulators and other external stakeholders; – reviewing the regulatory landscape in New Categories across key markets, with in-depth insights on regulatory engagement initiatives to progress tobacco harm reduction recognition in Western Europe and regulatory engagement with the U.S. FDA; – understanding the impact of growth in illicit products, partnerships with stakeholders to help combat illicit trade and regulatory enforcement activities, in the context of combustible products and New Categories; – reviewing developments in the regulation of single-use vapour products and the impact of regulatory enforcement against illicit single-use vapour products; – reviewing evolving regulation applicable to combustible products, with focus on the regulation of menthol and flavours in the U.S.; and – reviewing the impact of evolving tax regimes, including excise tax developments in various markets. Sustainability & Integrity – overseeing the Group's sustainability strategy, including climate-related issues, opportunities and risks for the Group, and reviewing performance against the Group's sustainability metrics; – reviewing environmental performance for the prior year and progress towards achieving the Group’s environmental targets, including climate targets aligned to net zero emissions by 2050, renewable energy, water stewardship, waste and recycling, and priorities for the Group's sustainability agenda; – approving a revised version of the Group Environment Policy effective from July 2023; – overseeing progress towards the sale of the Group's businesses in Russia and Belarus which completed in September 2023, taking into account the safety and welfare of Group company personnel in the region, impact on other stakeholders and the supply chain, regulatory compliance and reputational considerations; – approving new Responsible Marketing Principles, to be implemented in 2024; – reviewing the perspectives of the Group’s key stakeholders, the Group’s response to stakeholder perspectives, and the effectiveness of engagement mechanisms; – overseeing the refreshed Sustainability Double Materiality Assessment conducted in 2023, building on the extensive assessment conducted in 2022; – approving the annual Modern Slavery Act statement and annual Conflict Minerals Report; – approving updated versions of the Group's Standards of Business Conduct and Supplier Code of Conduct (SCoC), effective from January 2024; – reviewing the effectiveness of Speak Up channels; – reviewing updates on compliance matters, including allegations of misconduct, reports from Speak Up channels and investigations, and the Group’s Delivery with Integrity programme initiatives; and – overseeing the agreement reached with the DOJ and OFAC to resolve investigations into historical business activities, as set out on page 227. BAT Annual Report and Form 20-F 2023 Strategic Report Governance Report Financial Statements Other Information 143
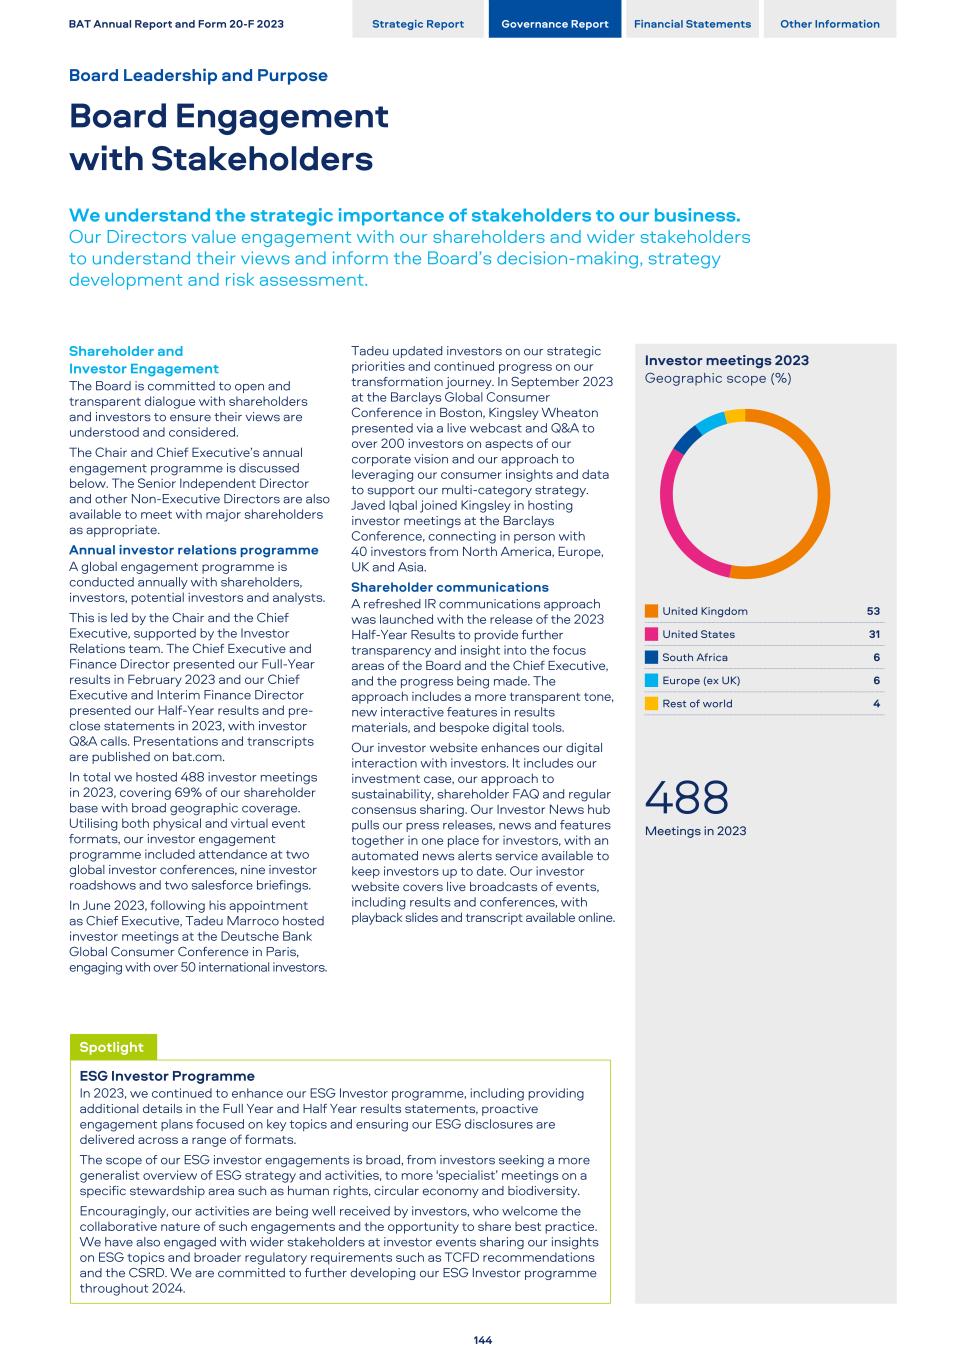
Shareholder and Investor Engagement The Board is committed to open and transparent dialogue with shareholders and investors to ensure their views are understood and considered. The Chair and Chief Executive’s annual engagement programme is discussed below. The Senior Independent Director and other Non-Executive Directors are also available to meet with major shareholders as appropriate. Annual investor relations programme A global engagement programme is conducted annually with shareholders, investors, potential investors and analysts. This is led by the Chair and the Chief Executive, supported by the Investor Relations team. The Chief Executive and Finance Director presented our Full-Year results in February 2023 and our Chief Executive and Interim Finance Director presented our Half-Year results and pre- close statements in 2023, with investor Q&A calls. Presentations and transcripts are published on bat.com. In total we hosted 488 investor meetings in 2023, covering 69% of our shareholder base with broad geographic coverage. Utilising both physical and virtual event formats, our investor engagement programme included attendance at two global investor conferences, nine investor roadshows and two salesforce briefings. In June 2023, following his appointment as Chief Executive, Tadeu Marroco hosted investor meetings at the Deutsche Bank Global Consumer Conference in Paris, engaging with over 50 international investors. Tadeu updated investors on our strategic priorities and continued progress on our transformation journey. In September 2023 at the Barclays Global Consumer Conference in Boston, Kingsley Wheaton presented via a live webcast and Q&A to over 200 investors on aspects of our corporate vision and our approach to leveraging our consumer insights and data to support our multi-category strategy. Javed Iqbal joined Kingsley in hosting investor meetings at the Barclays Conference, connecting in person with 40 investors from North America, Europe, UK and Asia. Shareholder communications A refreshed IR communications approach was launched with the release of the 2023 Half-Year Results to provide further transparency and insight into the focus areas of the Board and the Chief Executive, and the progress being made. The approach includes a more transparent tone, new interactive features in results materials, and bespoke digital tools. Our investor website enhances our digital interaction with investors. It includes our investment case, our approach to sustainability, shareholder FAQ and regular consensus sharing. Our Investor News hub pulls our press releases, news and features together in one place for investors, with an automated news alerts service available to keep investors up to date. Our investor website covers live broadcasts of events, including results and conferences, with playback slides and transcript available online. Investor meetings 2023 Geographic scope (%) United Kingdom 53 United States 31 South Africa 6 Europe (ex UK) 6 Rest of world 4 488 Meetings in 2023 BAT Annual Report and Form 20-F 2023 Strategic Report Governance Report Financial Statements Other Information Board Leadership and Purpose Board Engagement with Stakeholders We understand the strategic importance of stakeholders to our business. Our Directors value engagement with our shareholders and wider stakeholders to understand their views and inform the Board’s decision-making, strategy development and risk assessment. 144 Spotlight ESG Investor Programme In 2023, we continued to enhance our ESG Investor programme, including providing additional details in the Full Year and Half Year results statements, proactive engagement plans focused on key topics and ensuring our ESG disclosures are delivered across a range of formats. The scope of our ESG investor engagements is broad, from investors seeking a more generalist overview of ESG strategy and activities, to more 'specialist’ meetings on a specific stewardship area such as human rights, circular economy and biodiversity. Encouragingly, our activities are being well received by investors, who welcome the collaborative nature of such engagements and the opportunity to share best practice. We have also engaged with wider stakeholders at investor events sharing our insights on ESG topics and broader regulatory requirements such as TCFD recommendations and the CSRD. We are committed to further developing our ESG Investor programme throughout 2024.
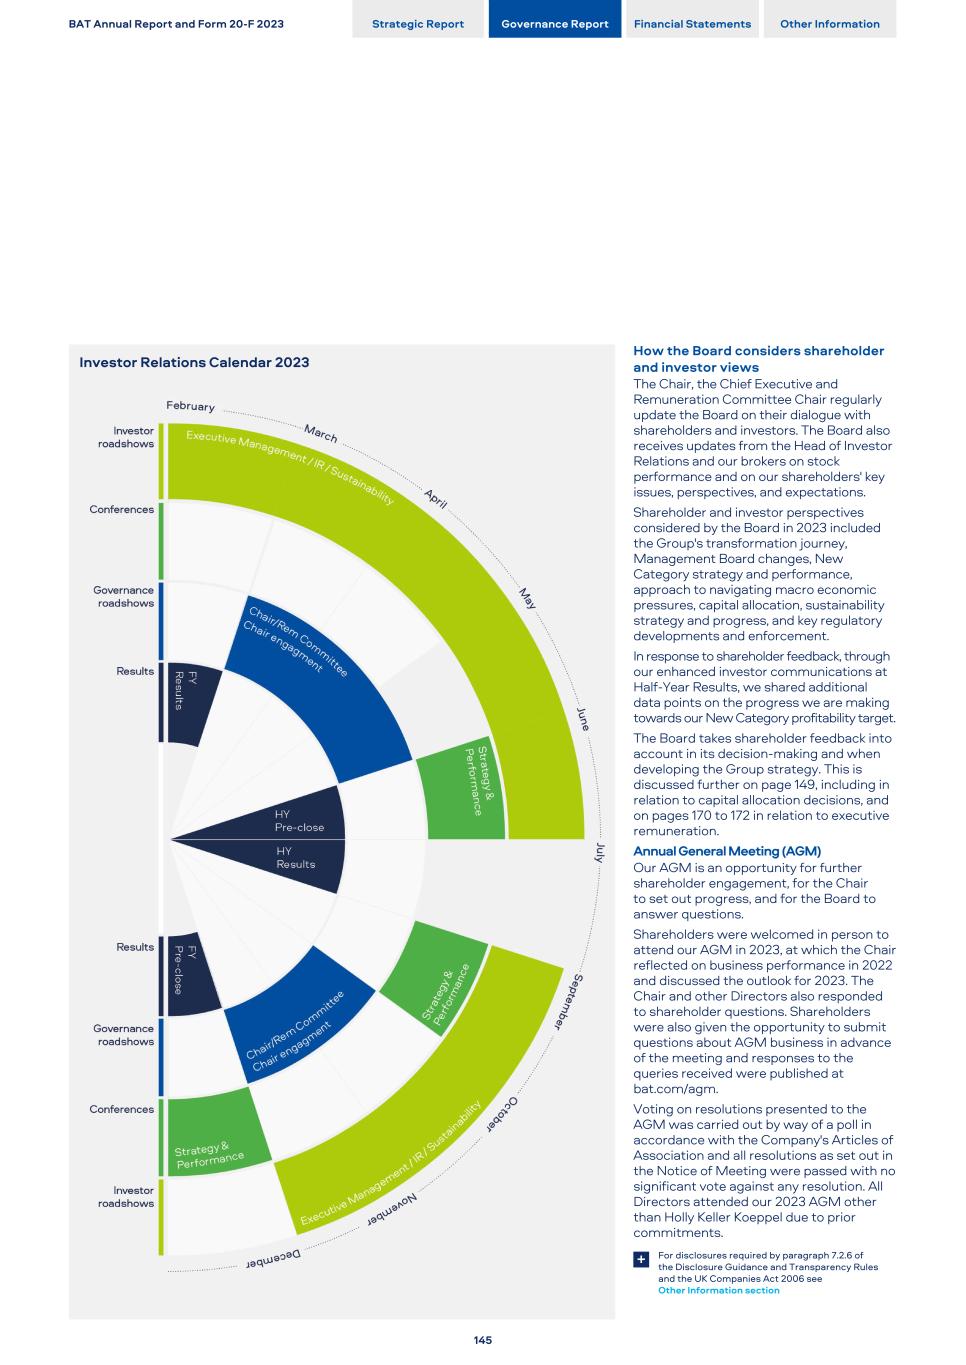
Investor Relations Calendar 2023 How the Board considers shareholder and investor views The Chair, the Chief Executive and Remuneration Committee Chair regularly update the Board on their dialogue with shareholders and investors. The Board also receives updates from the Head of Investor Relations and our brokers on stock performance and on our shareholders' key issues, perspectives, and expectations. Shareholder and investor perspectives considered by the Board in 2023 included the Group's transformation journey, Management Board changes, New Category strategy and performance, approach to navigating macro economic pressures, capital allocation, sustainability strategy and progress, and key regulatory developments and enforcement. In response to shareholder feedback, through our enhanced investor communications at Half-Year Results, we shared additional data points on the progress we are making towards our New Category profitability target. The Board takes shareholder feedback into account in its decision-making and when developing the Group strategy. This is discussed further on page 149, including in relation to capital allocation decisions, and on pages 170 to 172 in relation to executive remuneration. Annual General Meeting (AGM) Our AGM is an opportunity for further shareholder engagement, for the Chair to set out progress, and for the Board to answer questions. Shareholders were welcomed in person to attend our AGM in 2023, at which the Chair reflected on business performance in 2022 and discussed the outlook for 2023. The Chair and other Directors also responded to shareholder questions. Shareholders were also given the opportunity to submit questions about AGM business in advance of the meeting and responses to the queries received were published at bat.com/agm. Voting on resolutions presented to the AGM was carried out by way of a poll in accordance with the Company's Articles of Association and all resolutions as set out in the Notice of Meeting were passed with no significant vote against any resolution. All Directors attended our 2023 AGM other than Holly Keller Koeppel due to prior commitments. For disclosures required by paragraph 7.2.6 of the Disclosure Guidance and Transparency Rules and the UK Companies Act 2006 see Other Information section + BAT Annual Report and Form 20-F 2023 Strategic Report Governance Report Financial Statements Other Information 145
Wider Stakeholder Engagement A broad range of stakeholders are important to the Group at local, regional and functional levels. Key stakeholders are strategically important to our business and essential to our ability to generate long-term, sustainable value. We identify them by applying an established stakeholder engagement framework, which takes into account strategic objectives and risks to the Group. The Board's assessment of key stakeholders is further informed by the outcomes of the Group's Sustainability Double Materiality Assessment conducted in 2022 and updated in 2023 (discussed further on pages 74 to 77 and 147). Our key stakeholders are referenced in our business model on page 20, with an overview of their importance, what matters to them, and how we engage and respond to them on pages 22 to 23. The imperative of transparency of engagement is built into relevant Group policies, such as our SoBC and specific frameworks for stakeholder engagement. The Board conducted a review of key stakeholders in 2023. This included how engagement is carried out across the Group, stakeholders’ perspectives, and how the Board is kept informed of those perspectives where engagement is not at Board level. Following its review, the Board remains satisfied that there is well- established and effective engagement with the Group’s key stakeholders, enabling the Board to understand their perspectives. The Board will continue to monitor the ongoing effectiveness of stakeholder engagement. Where the Board does not engage directly with our stakeholders, it is kept updated by reports from management so Directors maintain an effective understanding of what matters to them and can draw on these perspectives, including in Board decision- making and strategy development. An overview of how the Board engaged with wider stakeholders and maintained its understanding of their interests during the year is set out below. Consumers Suppliers Our consumers are our judge and at the core of everything we do. Consumer-led innovation and product development are central to achieving our purpose and we believe that our multi- category approach is the most effective way to appeal to the diverse preferences of adult consumers worldwide. Our marketing teams lead our engagement with consumers and we engage through extensive consumer market research and sales and marketing interactions. On a market visit to Stockholm in September 2023, several of our Directors had the opportunity to experience this first hand at a live co-creation session with consumers and members of our Nordics innovation team which explored the role of 'sweet territory' in flavours for modern oral products. The Board is regularly briefed by the Chief Executive and senior management on product performance across all portfolio categories, on our product development pipeline and how product innovation is focused on satisfying adult consumer preferences and directed by consumer insights and foresights. In 2023, the Board was updated on a range of consumer insights and how we respond to feedback, for example, feedback from nicotine consumers that more information on the role of New Categories products in tobacco harm reduction is needed to help them make informed product choices and the digital resources we make available to consumers to support this; and how we address the environmental impacts of our products and initiatives in place such as Take-Back schemes, reduction in plastic packaging and other measures to reduce the carbon footprint of our products. The Board was also briefed on consumer expectations for responsible marketing practices and restrictions on underage access and the governance and controls in place to support marketing practices. In 2023, the Board approved the introduction of new Responsible Marketing Principles applicable to the Group's nicotine products and brands, to be implemented in 2024. Our Responsible Marketing Principles take account of consumer expectations in relation to responsible marketing practices and underage access prevention, with implementation supported by the introduction of a new Responsible Marketing Code. Our relationships with leaf suppliers, contracted farmers and suppliers of direct materials and indirect services are managed day-to-day by the Group’s Operations function and at local market level. The Board oversees the Group’s supply chain strategies and progress on sustainable agriculture and farmer livelihoods programmes, through briefings and strategic reviews provided by the Chief Operating Officer, the Director, Operations and other members of senior management. In the context of leaf supply, the Board was briefed on perspectives of suppliers and contracted farmers and how we respond to feedback, including how we address Scope 3 supply chain carbon emissions and initiatives such as the Carbon Smart Farming Programme to reduce emissions in tobacco farming; how we address the risk of child labour in our supply chains and the impact assessments and other activities we undertake in leaf sourcing countries towards eliminating child labour; and the steps we take to protect biodiversity and the implementation of our Biodiversity Operating Standard in 2023. In the context of direct materials and indirect services, the Board was briefed on a range of supplier perspectives and how we respond, such as how we can innovate in our engagement, the roll-out of our 'Be Supplier' programme (an initiative to introduce new supplier solutions to address business challenges) and supplier innovation workshops at our Global Device Development Centre in China; how we address supply chain carbon emissions and conduct responsible water stewardship; and progress in our CDP Supply Chain Programme to support reduction in Scope 3 GHG emissions. The Board was also updated on engagement with suppliers at the Supplier ESG conference held in Bangladesh in July 2023, which enabled suppliers to contribute to the development of our sustainability agenda and participate in discussion panels on local ESG challenges. The Board approved a revised version of our Supplier Code of Conduct (discussed on page 149) and reviewed our annual Modern Slavery Statement (available at www.bat.com/msa) which reports on our progress to ensure that our operations are free from labour exploitation, and on human rights impact assessments and monitoring programmes conducted in support of this commitment. The Board also reviewed the annual conflict minerals statement and continuous improvement efforts implemented with our New Categories material suppliers to mitigate supply chain risks. Read more about our approach to engaging with consumers Pages 19 to 22, 60 to 63 and 96 to 97 Read more about our approach to engaging with suppliers Pages 19 to 23 and 100 to 101+ + BAT Annual Report and Form 20-F 2023 Strategic Report Governance Report Financial Statements Other Information Board Leadership and Purpose Board Engagement with Stakeholders Continued 146
Customers Retailer, wholesaler and distributor relationships and customer engagement programmes are managed at local market and business unit levels. The Board is regularly updated through reports from the Chief Executive and other Management Board members on the global retail environment and the promotion of responsible marketing practices. During the year, the Board was also briefed on improvements made to customer engagement models, e-commerce platforms and other digital services in response to customer feedback and collaborations with customers to help combat illicit trade. In 2023, Directors also had the opportunity to visit retail outlets in Stockholm and Bucharest to see local trade marketing interactions. The Audit Committee oversees compliance with the Group’s responsible marketing and youth access prevention procedures and initiatives to reinforce associated governance and controls. Read more about customers and our approach to responsible marketing Pages 19 to 23 and 96 to 97+ Spotlight Sustainability Double Materiality Assessment^ (DMA) With the support of a specialist external consultancy firm, in 2023, we reviewed and updated our DMA conducted in 2022 so that it continues to inform our sustainability programmes and business strategy effectively. Our updated DMA builds on the extensive stakeholder engagement and sustainability topic mapping completed in 2022 and aligns our DMA process with the methodology of the CSRD and ESRS. The scope of the 2023 refresh of the DMA conducted in 2022 is outlined on pages 74 to 77, with key developments summarised below. 100+ In depth, structured stakeholder dialogues conducted in 2023, covering outward and inward impact materiality and financial materiality in line with CSRD and ESRS requirements. These dialogues enhanced the insights gained from engagement with more than 2,600 internal and external stakeholders in 2022. Horizon scan & topic review Our 2023 horizon scan and cross-industry benchmark focused on recent and emerging developments in sustainability matters and we reviewed and updated our sustainability topic shortlist. Robust assessment criteria Applying the DMA methodology of the July 2023 ESRS, we have introduced additional structure to our impact materiality and financial materiality assessment criteria. Note: ^ Although financial materiality has been considered in the development of our Double Materiality Assessment (DMA), our DMA and any related conclusions in this document as to the materiality or significance of sustainability or ESG matters do not imply that all topics discussed therein are financially material to our business taken as a whole, and such topics may not significantly alter the total mix of information available about our securities. Society We recognise our responsibility to wider society to reduce the health, environmental and social impacts of our business and seek to play a positive role in debates that shape the regulatory environment in which we operate. Across the Group, we engage with a wide variety of stakeholders in scientific and public health communities, governments and regulators, non-governmental organisations (NGOs) and local communities, with engagement managed by local market, business unit and functional teams, including legal, regulatory affairs and scientific research. The Board is briefed on engagement with scientific communities, regulators and public health bodies. During the year, this included briefings on the impact of engagement relating to the regulation of New Categories in Western Europe, engagement with public health advocates at forums such as the Global Tobacco and Nicotine Forum and the Tobacco Science Research Conference, published scientific research on flavours in New Categories products, and the role of the External Scientific & Regulatory Panel, formed of external experts offering strategic input on our scientific product stewardship programme. The Board regularly reviews updates from the legal and corporate and regulatory affairs teams, covering engagement with governments and regulators and anti-illicit trade collaborations. For example, in 2023 updates were provided on our contribution to local standards authorities in various markets to develop industry safety standards for New Categories products and our participation in public consultations and other processes through which we submit our views on the regulation of vapour products and other New Categories. The Board also considered how the Group responds to stakeholder feedback on the environmental impact of our operations and products. Examples in 2023 included continued progress against our science-based emissions reduction targets (building on our Low Carbon Transition Plan published in 2022), a refresh of the Sustainability Double Materiality Assessment conducted in 2022 and reporting on Principal Adverse Impact indicators under the EU Sustainable Finance Disclosure Regulation (initiated in 2022). The Board is kept informed on engagement initiatives with local communities. For example in 2023, the Board was briefed on engagement with farmers and wider rural communities through multi-stakeholder partnerships; community investment projects in relation to afforestation programmes and child labour prevention projects in collaboration with the industry, local governments and NGOs; and community support offered following the earthquake in Türkiye. Non-Executive Directors regularly attend the Corporate Audit Committee and Regional Audit Committees, where societal and community perspectives at regional and local levels are discussed, and the Audit Committee reviews feedback from these Committees. The Audit Committee is also regularly updated on our engagement with tax authorities on material Group tax matters and has oversight of political contributions in the U.S. Read more about our engagement with governments and wider society Pages 19 to 23 and 60 to 118 + UK Companies Act: Business relationships This section summarises how the Directors have regard to the need to foster business relationships with customers, suppliers and other external stakeholders. Further information is provided on pages 19 to 23 and 149, including information about the effect of that regard. BAT Annual Report and Form 20-F 2023 Strategic Report Governance Report Financial Statements Other Information 147
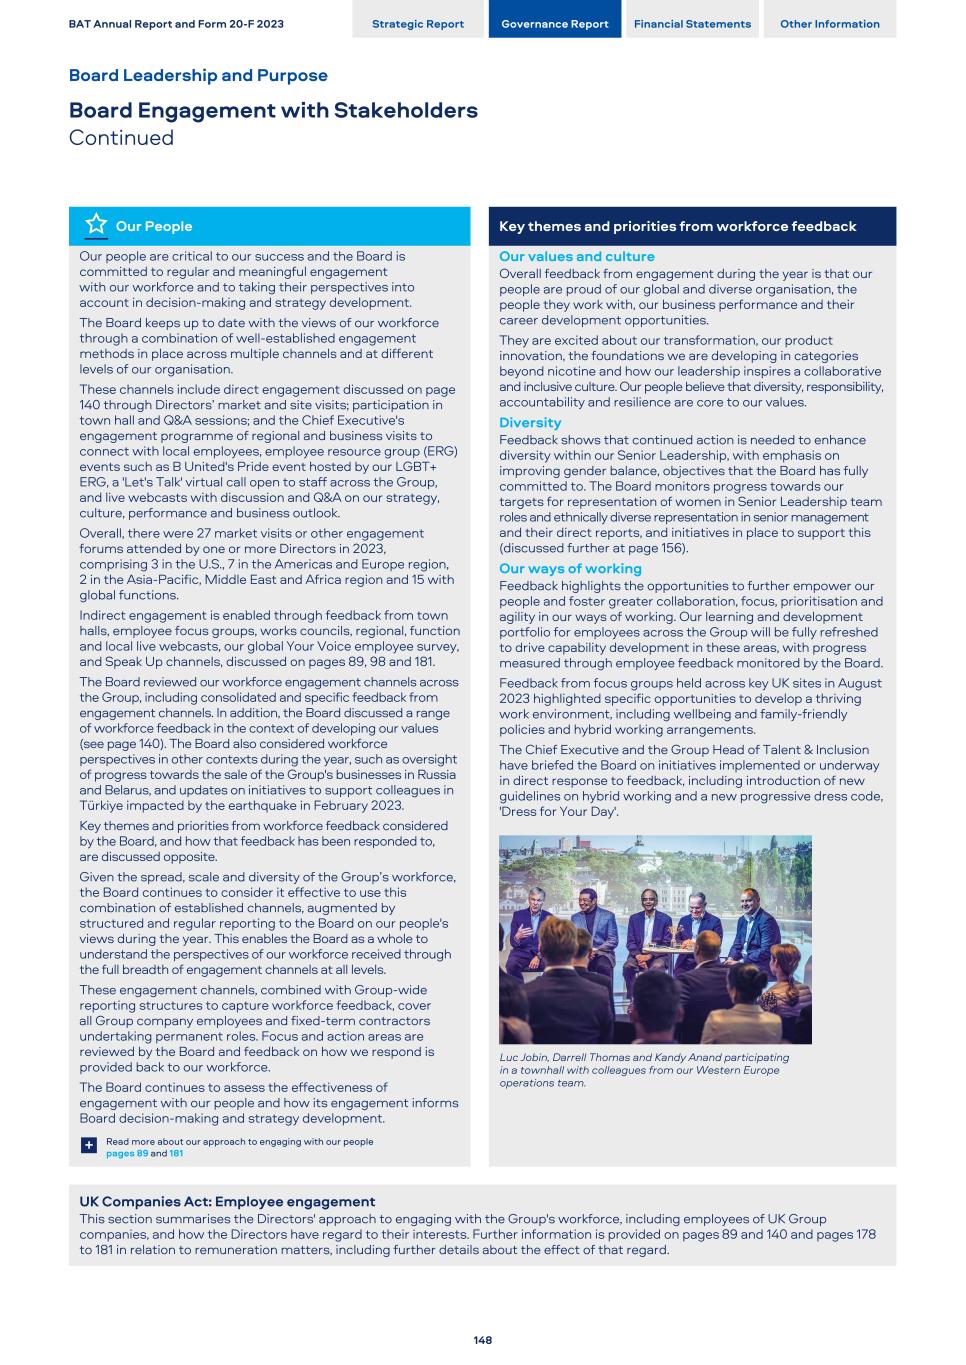
Our People Key themes and priorities from workforce feedback Our people are critical to our success and the Board is committed to regular and meaningful engagement with our workforce and to taking their perspectives into account in decision-making and strategy development. The Board keeps up to date with the views of our workforce through a combination of well-established engagement methods in place across multiple channels and at different levels of our organisation. These channels include direct engagement discussed on page 140 through Directors’ market and site visits; participation in town hall and Q&A sessions; and the Chief Executive's engagement programme of regional and business visits to connect with local employees, employee resource group (ERG) events such as B United's Pride event hosted by our LGBT+ ERG, a 'Let's Talk' virtual call open to staff across the Group, and live webcasts with discussion and Q&A on our strategy, culture, performance and business outlook. Overall, there were 27 market visits or other engagement forums attended by one or more Directors in 2023, comprising 3 in the U.S., 7 in the Americas and Europe region, 2 in the Asia-Pacific, Middle East and Africa region and 15 with global functions. Indirect engagement is enabled through feedback from town halls, employee focus groups, works councils, regional, function and local live webcasts, our global Your Voice employee survey, and Speak Up channels, discussed on pages 89, 98 and 181. The Board reviewed our workforce engagement channels across the Group, including consolidated and specific feedback from engagement channels. In addition, the Board discussed a range of workforce feedback in the context of developing our values (see page 140). The Board also considered workforce perspectives in other contexts during the year, such as oversight of progress towards the sale of the Group's businesses in Russia and Belarus, and updates on initiatives to support colleagues in Türkiye impacted by the earthquake in February 2023. Key themes and priorities from workforce feedback considered by the Board, and how that feedback has been responded to, are discussed opposite. Given the spread, scale and diversity of the Group’s workforce, the Board continues to consider it effective to use this combination of established channels, augmented by structured and regular reporting to the Board on our people's views during the year. This enables the Board as a whole to understand the perspectives of our workforce received through the full breadth of engagement channels at all levels. These engagement channels, combined with Group-wide reporting structures to capture workforce feedback, cover all Group company employees and fixed-term contractors undertaking permanent roles. Focus and action areas are reviewed by the Board and feedback on how we respond is provided back to our workforce. The Board continues to assess the effectiveness of engagement with our people and how its engagement informs Board decision-making and strategy development. Our values and culture Overall feedback from engagement during the year is that our people are proud of our global and diverse organisation, the people they work with, our business performance and their career development opportunities. They are excited about our transformation, our product innovation, the foundations we are developing in categories beyond nicotine and how our leadership inspires a collaborative and inclusive culture. Our people believe that diversity, responsibility, accountability and resilience are core to our values. Diversity Feedback shows that continued action is needed to enhance diversity within our Senior Leadership, with emphasis on improving gender balance, objectives that the Board has fully committed to. The Board monitors progress towards our targets for representation of women in Senior Leadership team roles and ethnically diverse representation in senior management and their direct reports, and initiatives in place to support this (discussed further at page 156). Our ways of working Feedback highlights the opportunities to further empower our people and foster greater collaboration, focus, prioritisation and agility in our ways of working. Our learning and development portfolio for employees across the Group will be fully refreshed to drive capability development in these areas, with progress measured through employee feedback monitored by the Board. Feedback from focus groups held across key UK sites in August 2023 highlighted specific opportunities to develop a thriving work environment, including wellbeing and family-friendly policies and hybrid working arrangements. The Chief Executive and the Group Head of Talent & Inclusion have briefed the Board on initiatives implemented or underway in direct response to feedback, including introduction of new guidelines on hybrid working and a new progressive dress code, 'Dress for Your Day'. Luc Jobin, Darrell Thomas and Kandy Anand participating in a townhall with colleagues from our Western Europe operations team. Read more about our approach to engaging with our people pages 89 and 181+ UK Companies Act: Employee engagement This section summarises the Directors' approach to engaging with the Group's workforce, including employees of UK Group companies, and how the Directors have regard to their interests. Further information is provided on pages 89 and 140 and pages 178 to 181 in relation to remuneration matters, including further details about the effect of that regard. BAT Annual Report and Form 20-F 2023 Strategic Report Governance Report Financial Statements Other Information Board Leadership and Purpose Board Engagement with Stakeholders Continued 148
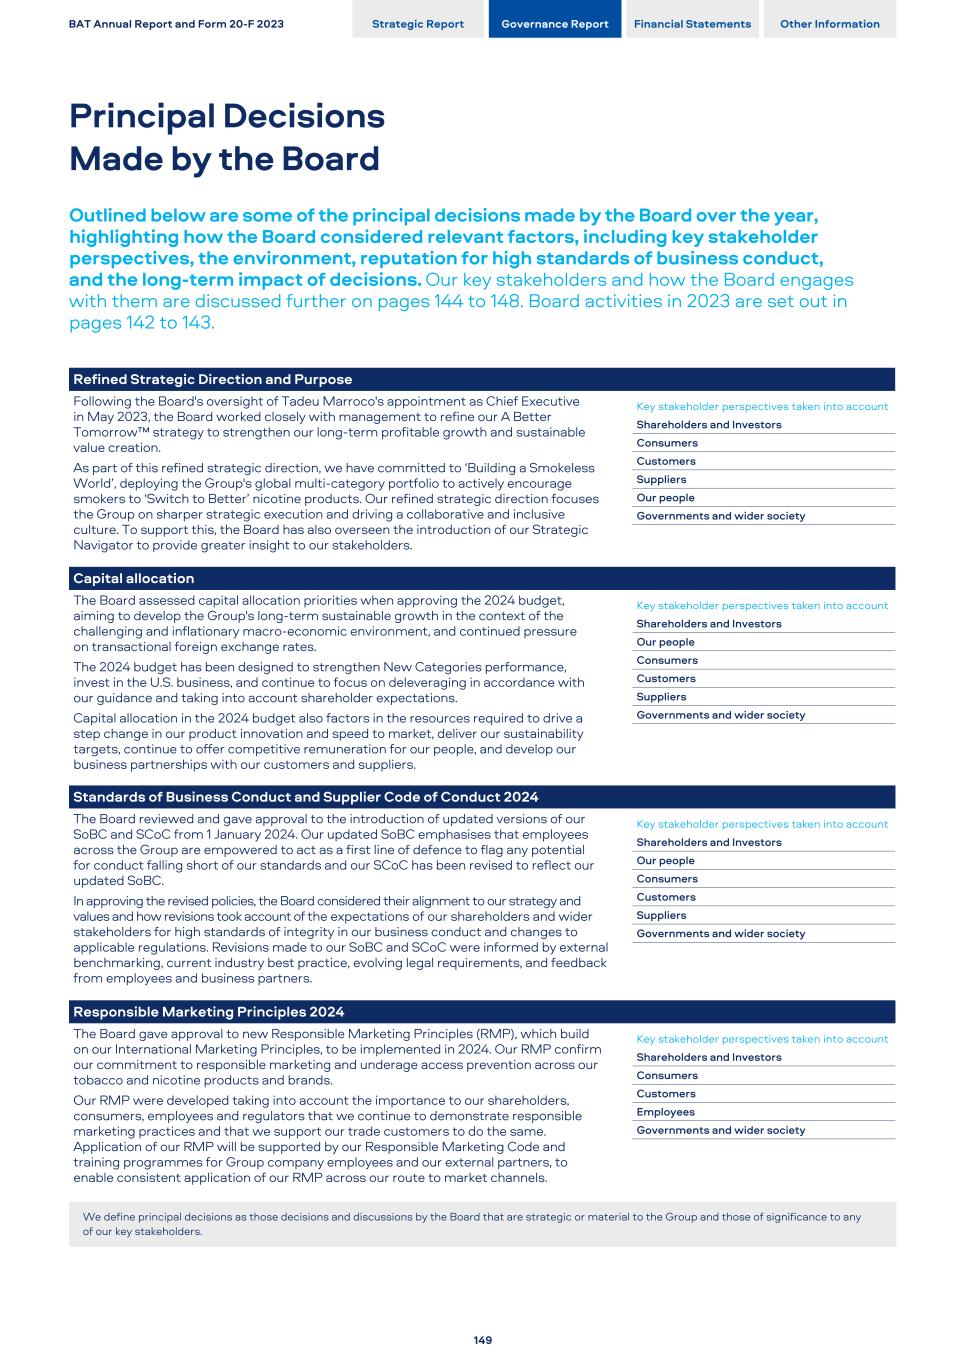
Refined Strategic Direction and Purpose Following the Board's oversight of Tadeu Marroco's appointment as Chief Executive in May 2023, the Board worked closely with management to refine our A Better Tomorrow™ strategy to strengthen our long-term profitable growth and sustainable value creation. As part of this refined strategic direction, we have committed to ‘Building a Smokeless World’, deploying the Group's global multi-category portfolio to actively encourage smokers to ‘Switch to Better’ nicotine products. Our refined strategic direction focuses the Group on sharper strategic execution and driving a collaborative and inclusive culture. To support this, the Board has also overseen the introduction of our Strategic Navigator to provide greater insight to our stakeholders. Key stakeholder perspectives taken into account Shareholders and Investors Consumers Customers Suppliers Our people Governments and wider society Capital allocation The Board assessed capital allocation priorities when approving the 2024 budget, aiming to develop the Group's long-term sustainable growth in the context of the challenging and inflationary macro-economic environment, and continued pressure on transactional foreign exchange rates. The 2024 budget has been designed to strengthen New Categories performance, invest in the U.S. business, and continue to focus on deleveraging in accordance with our guidance and taking into account shareholder expectations. Capital allocation in the 2024 budget also factors in the resources required to drive a step change in our product innovation and speed to market, deliver our sustainability targets, continue to offer competitive remuneration for our people, and develop our business partnerships with our customers and suppliers. Key stakeholder perspectives taken into account Shareholders and Investors Our people Consumers Customers Suppliers Governments and wider society Standards of Business Conduct and Supplier Code of Conduct 2024 The Board reviewed and gave approval to the introduction of updated versions of our SoBC and SCoC from 1 January 2024. Our updated SoBC emphasises that employees across the Group are empowered to act as a first line of defence to flag any potential for conduct falling short of our standards and our SCoC has been revised to reflect our updated SoBC. In approving the revised policies, the Board considered their alignment to our strategy and values and how revisions took account of the expectations of our shareholders and wider stakeholders for high standards of integrity in our business conduct and changes to applicable regulations. Revisions made to our SoBC and SCoC were informed by external benchmarking, current industry best practice, evolving legal requirements, and feedback from employees and business partners. Key stakeholder perspectives taken into account Shareholders and Investors Our people Consumers Customers Suppliers Governments and wider society Responsible Marketing Principles 2024 The Board gave approval to new Responsible Marketing Principles (RMP), which build on our International Marketing Principles, to be implemented in 2024. Our RMP confirm our commitment to responsible marketing and underage access prevention across our tobacco and nicotine products and brands. Our RMP were developed taking into account the importance to our shareholders, consumers, employees and regulators that we continue to demonstrate responsible marketing practices and that we support our trade customers to do the same. Application of our RMP will be supported by our Responsible Marketing Code and training programmes for Group company employees and our external partners, to enable consistent application of our RMP across our route to market channels. Key stakeholder perspectives taken into account Shareholders and Investors Consumers Customers Employees Governments and wider society We define principal decisions as those decisions and discussions by the Board that are strategic or material to the Group and those of significance to any of our key stakeholders. BAT Annual Report and Form 20-F 2023 Strategic Report Governance Report Financial Statements Other Information Principal Decisions Made by the Board Outlined below are some of the principal decisions made by the Board over the year, highlighting how the Board considered relevant factors, including key stakeholder perspectives, the environment, reputation for high standards of business conduct, and the long-term impact of decisions. Our key stakeholders and how the Board engages with them are discussed further on pages 144 to 148. Board activities in 2023 are set out in pages 142 to 143. 149
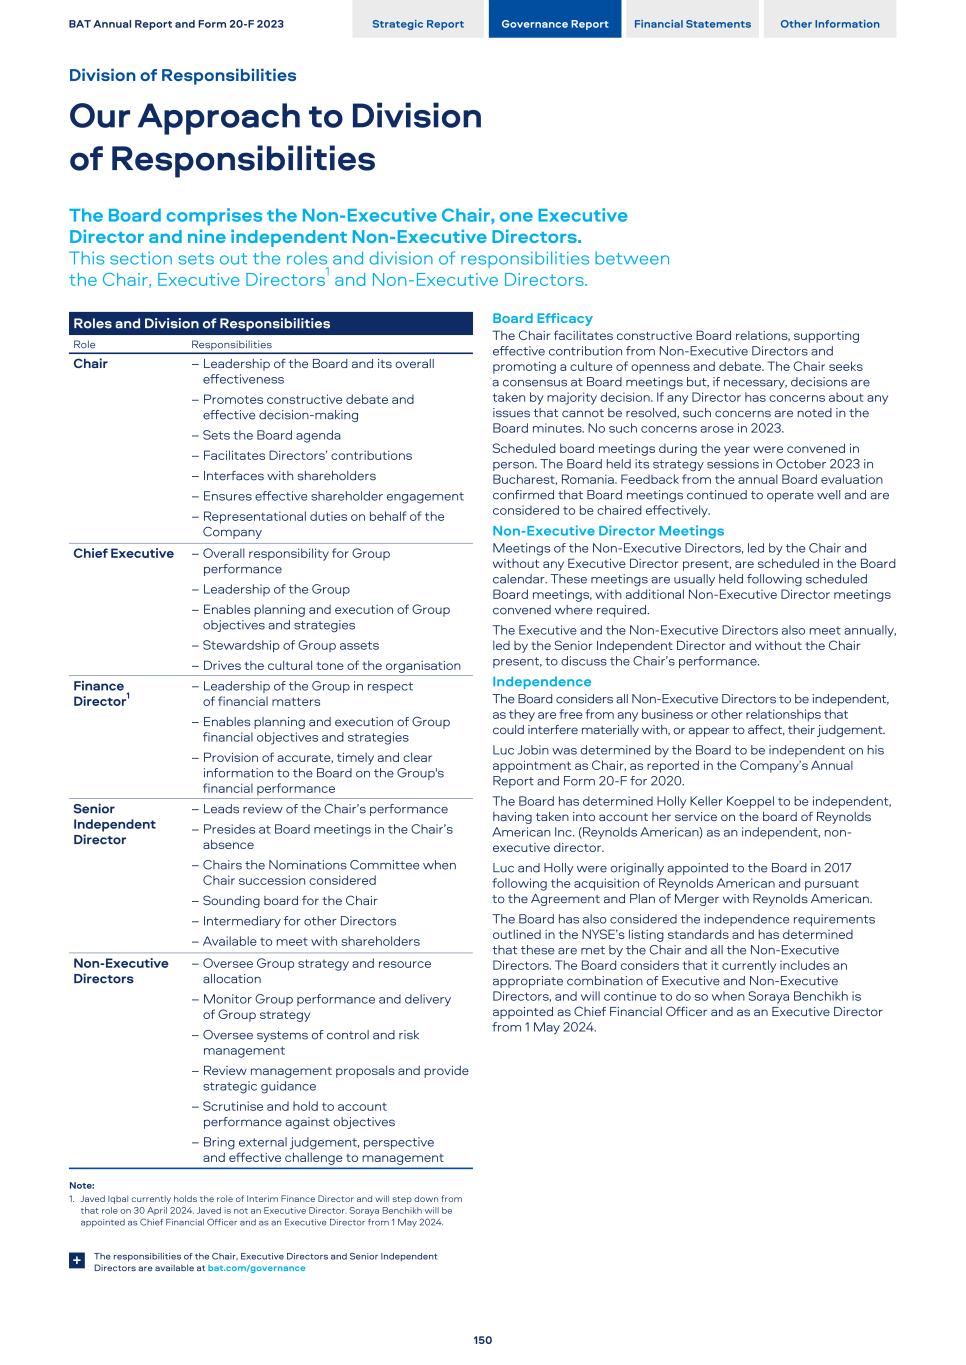
The Board comprises the Non-Executive Chair, one Executive Director and nine independent Non-Executive Directors. This section sets out the roles and division of responsibilities between the Chair, Executive Directors1 and Non-Executive Directors. Roles and Division of Responsibilities Role Responsibilities Chair – Leadership of the Board and its overall effectiveness – Promotes constructive debate and effective decision-making – Sets the Board agenda – Facilitates Directors’ contributions – Interfaces with shareholders – Ensures effective shareholder engagement – Representational duties on behalf of the Company Chief Executive – Overall responsibility for Group performance – Leadership of the Group – Enables planning and execution of Group objectives and strategies – Stewardship of Group assets – Drives the cultural tone of the organisation Finance Director1 – Leadership of the Group in respect of financial matters – Enables planning and execution of Group financial objectives and strategies – Provision of accurate, timely and clear information to the Board on the Group's financial performance Senior Independent Director – Leads review of the Chair’s performance – Presides at Board meetings in the Chair’s absence – Chairs the Nominations Committee when Chair succession considered – Sounding board for the Chair – Intermediary for other Directors – Available to meet with shareholders Non-Executive Directors – Oversee Group strategy and resource allocation – Monitor Group performance and delivery of Group strategy – Oversee systems of control and risk management – Review management proposals and provide strategic guidance – Scrutinise and hold to account performance against objectives – Bring external judgement, perspective and effective challenge to management Note: 1. Javed Iqbal currently holds the role of Interim Finance Director and will step down from that role on 30 April 2024. Javed is not an Executive Director. Soraya Benchikh will be appointed as Chief Financial Officer and as an Executive Director from 1 May 2024. The responsibilities of the Chair, Executive Directors and Senior Independent Directors are available at bat.com/governance+ Board Efficacy The Chair facilitates constructive Board relations, supporting effective contribution from Non-Executive Directors and promoting a culture of openness and debate. The Chair seeks a consensus at Board meetings but, if necessary, decisions are taken by majority decision. If any Director has concerns about any issues that cannot be resolved, such concerns are noted in the Board minutes. No such concerns arose in 2023. Scheduled board meetings during the year were convened in person. The Board held its strategy sessions in October 2023 in Bucharest, Romania. Feedback from the annual Board evaluation confirmed that Board meetings continued to operate well and are considered to be chaired effectively. Non-Executive Director Meetings Meetings of the Non-Executive Directors, led by the Chair and without any Executive Director present, are scheduled in the Board calendar. These meetings are usually held following scheduled Board meetings, with additional Non-Executive Director meetings convened where required. The Executive and the Non-Executive Directors also meet annually, led by the Senior Independent Director and without the Chair present, to discuss the Chair’s performance. Independence The Board considers all Non-Executive Directors to be independent, as they are free from any business or other relationships that could interfere materially with, or appear to affect, their judgement. Luc Jobin was determined by the Board to be independent on his appointment as Chair, as reported in the Company’s Annual Report and Form 20-F for 2020. The Board has determined Holly Keller Koeppel to be independent, having taken into account her service on the board of Reynolds American Inc. (Reynolds American) as an independent, non- executive director. Luc and Holly were originally appointed to the Board in 2017 following the acquisition of Reynolds American and pursuant to the Agreement and Plan of Merger with Reynolds American. The Board has also considered the independence requirements outlined in the NYSE’s listing standards and has determined that these are met by the Chair and all the Non-Executive Directors. The Board considers that it currently includes an appropriate combination of Executive and Non-Executive Directors, and will continue to do so when Soraya Benchikh is appointed as Chief Financial Officer and as an Executive Director from 1 May 2024. BAT Annual Report and Form 20-F 2023 Strategic Report Governance Report Financial Statements Other Information Division of Responsibilities Our Approach to Division of Responsibilities 150
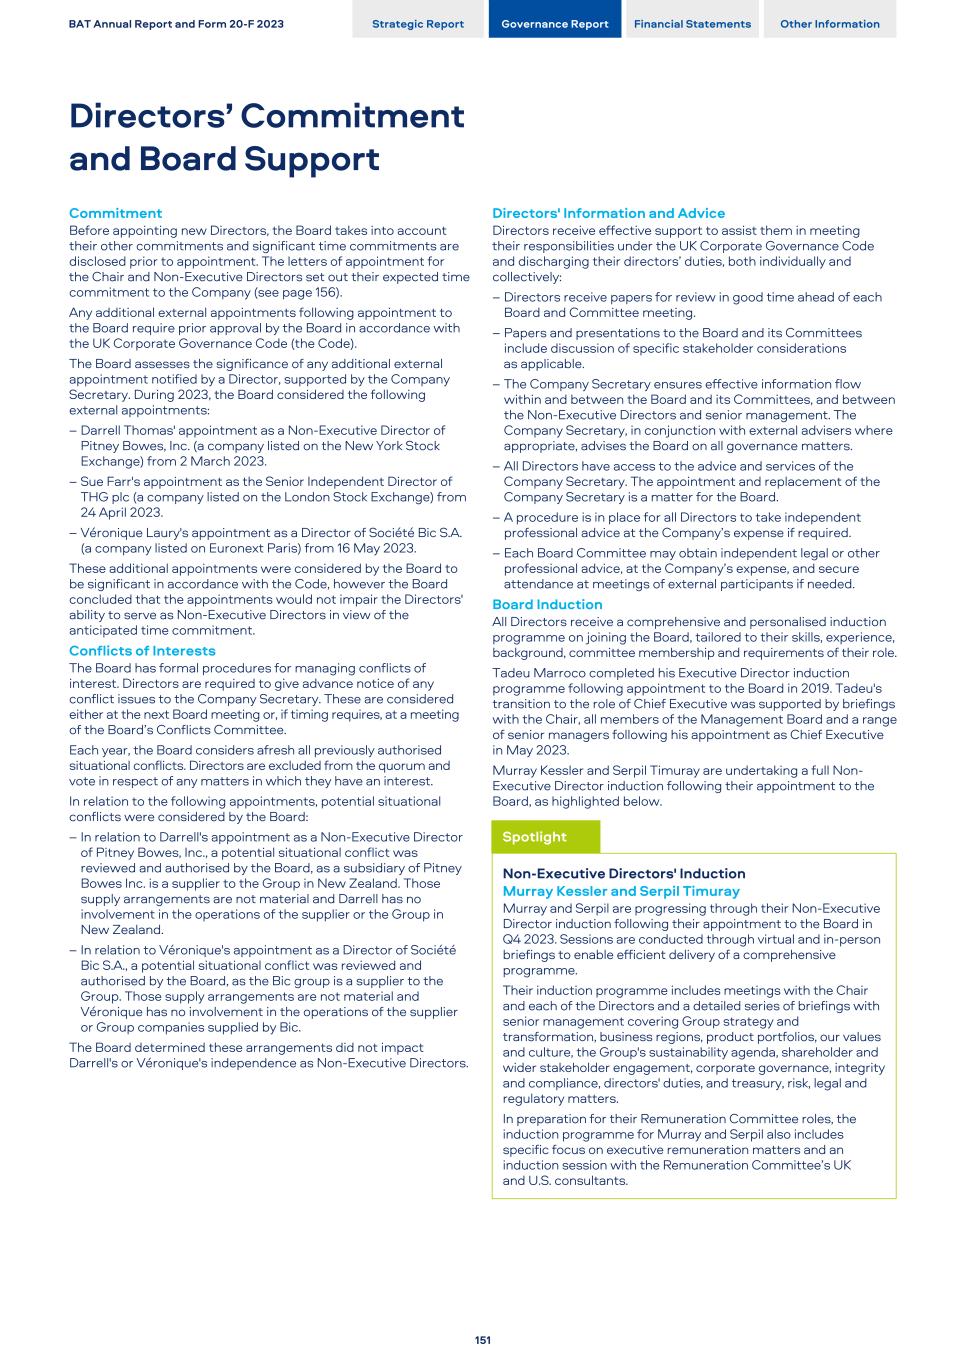
Commitment Before appointing new Directors, the Board takes into account their other commitments and significant time commitments are disclosed prior to appointment. The letters of appointment for the Chair and Non-Executive Directors set out their expected time commitment to the Company (see page 156). Any additional external appointments following appointment to the Board require prior approval by the Board in accordance with the UK Corporate Governance Code (the Code). The Board assesses the significance of any additional external appointment notified by a Director, supported by the Company Secretary. During 2023, the Board considered the following external appointments: – Darrell Thomas' appointment as a Non-Executive Director of Pitney Bowes, Inc. (a company listed on the New York Stock Exchange) from 2 March 2023. – Sue Farr's appointment as the Senior Independent Director of THG plc (a company listed on the London Stock Exchange) from 24 April 2023. – Véronique Laury's appointment as a Director of Société Bic S.A. (a company listed on Euronext Paris) from 16 May 2023. These additional appointments were considered by the Board to be significant in accordance with the Code, however the Board concluded that the appointments would not impair the Directors' ability to serve as Non-Executive Directors in view of the anticipated time commitment. Conflicts of Interests The Board has formal procedures for managing conflicts of interest. Directors are required to give advance notice of any conflict issues to the Company Secretary. These are considered either at the next Board meeting or, if timing requires, at a meeting of the Board’s Conflicts Committee. Each year, the Board considers afresh all previously authorised situational conflicts. Directors are excluded from the quorum and vote in respect of any matters in which they have an interest. In relation to the following appointments, potential situational conflicts were considered by the Board: – In relation to Darrell's appointment as a Non-Executive Director of Pitney Bowes, Inc., a potential situational conflict was reviewed and authorised by the Board, as a subsidiary of Pitney Bowes Inc. is a supplier to the Group in New Zealand. Those supply arrangements are not material and Darrell has no involvement in the operations of the supplier or the Group in New Zealand. – In relation to Véronique's appointment as a Director of Société Bic S.A., a potential situational conflict was reviewed and authorised by the Board, as the Bic group is a supplier to the Group. Those supply arrangements are not material and Véronique has no involvement in the operations of the supplier or Group companies supplied by Bic. The Board determined these arrangements did not impact Darrell's or Véronique's independence as Non-Executive Directors. Directors' Information and Advice Directors receive effective support to assist them in meeting their responsibilities under the UK Corporate Governance Code and discharging their directors’ duties, both individually and collectively: – Directors receive papers for review in good time ahead of each Board and Committee meeting. – Papers and presentations to the Board and its Committees include discussion of specific stakeholder considerations as applicable. – The Company Secretary ensures effective information flow within and between the Board and its Committees, and between the Non-Executive Directors and senior management. The Company Secretary, in conjunction with external advisers where appropriate, advises the Board on all governance matters. – All Directors have access to the advice and services of the Company Secretary. The appointment and replacement of the Company Secretary is a matter for the Board. – A procedure is in place for all Directors to take independent professional advice at the Company’s expense if required. – Each Board Committee may obtain independent legal or other professional advice, at the Company’s expense, and secure attendance at meetings of external participants if needed. Board Induction All Directors receive a comprehensive and personalised induction programme on joining the Board, tailored to their skills, experience, background, committee membership and requirements of their role. Tadeu Marroco completed his Executive Director induction programme following appointment to the Board in 2019. Tadeu's transition to the role of Chief Executive was supported by briefings with the Chair, all members of the Management Board and a range of senior managers following his appointment as Chief Executive in May 2023. Murray Kessler and Serpil Timuray are undertaking a full Non- Executive Director induction following their appointment to the Board, as highlighted below. Spotlight Non-Executive Directors' Induction Murray Kessler and Serpil Timuray Murray and Serpil are progressing through their Non-Executive Director induction following their appointment to the Board in Q4 2023. Sessions are conducted through virtual and in-person briefings to enable efficient delivery of a comprehensive programme. Their induction programme includes meetings with the Chair and each of the Directors and a detailed series of briefings with senior management covering Group strategy and transformation, business regions, product portfolios, our values and culture, the Group's sustainability agenda, shareholder and wider stakeholder engagement, corporate governance, integrity and compliance, directors' duties, and treasury, risk, legal and regulatory matters. In preparation for their Remuneration Committee roles, the induction programme for Murray and Serpil also includes specific focus on executive remuneration matters and an induction session with the Remuneration Committee’s UK and U.S. consultants. BAT Annual Report and Form 20-F 2023 Strategic Report Governance Report Financial Statements Other Information Directors’ Commitment and Board Support 151
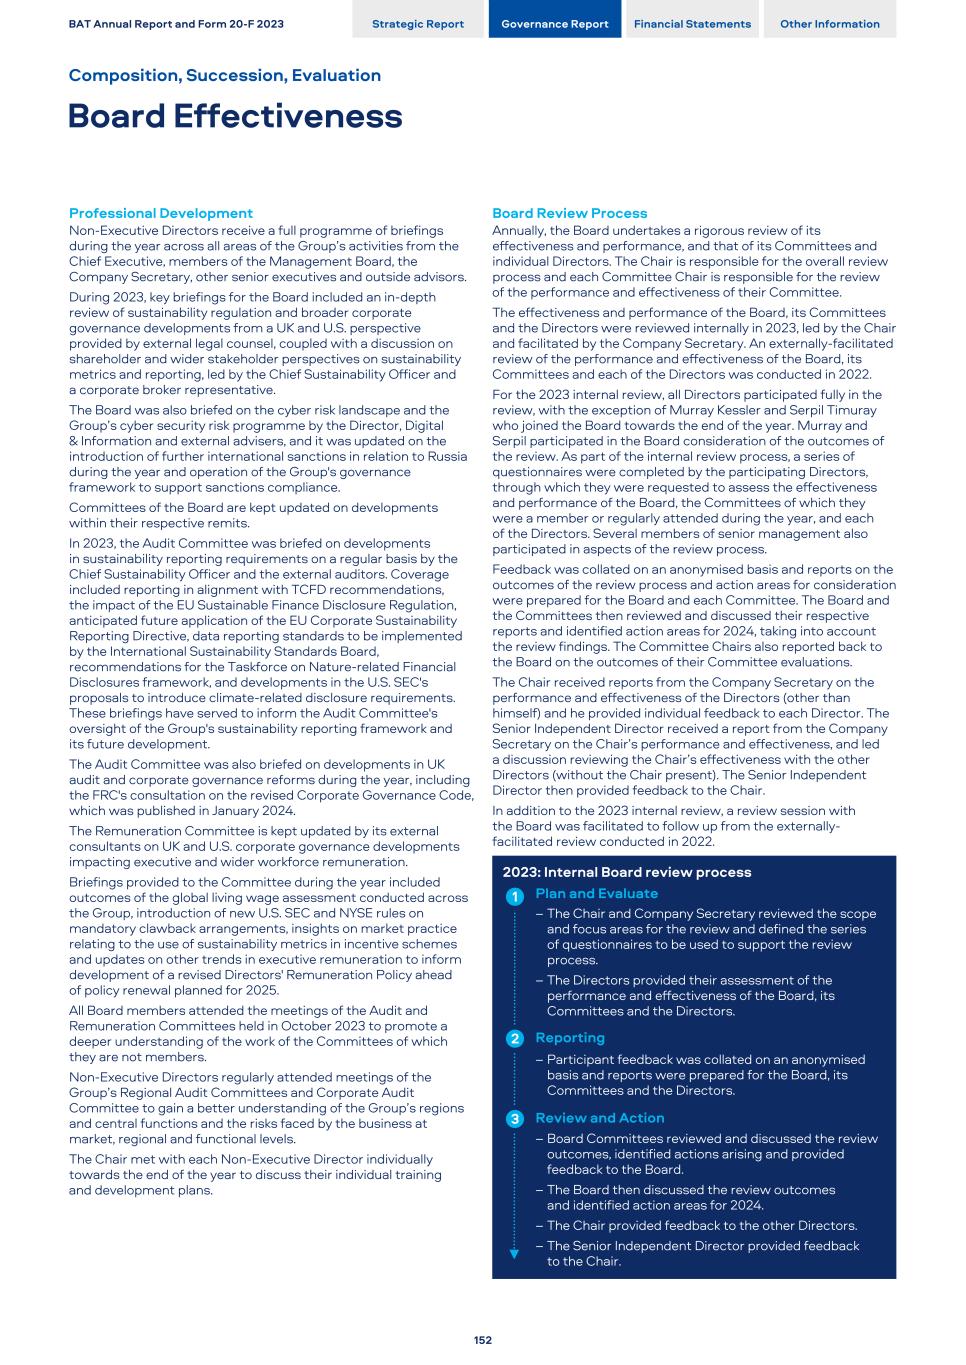
Professional Development Non-Executive Directors receive a full programme of briefings during the year across all areas of the Group’s activities from the Chief Executive, members of the Management Board, the Company Secretary, other senior executives and outside advisors. During 2023, key briefings for the Board included an in-depth review of sustainability regulation and broader corporate governance developments from a UK and U.S. perspective provided by external legal counsel, coupled with a discussion on shareholder and wider stakeholder perspectives on sustainability metrics and reporting, led by the Chief Sustainability Officer and a corporate broker representative. The Board was also briefed on the cyber risk landscape and the Group’s cyber security risk programme by the Director, Digital & Information and external advisers, and it was updated on the introduction of further international sanctions in relation to Russia during the year and operation of the Group's governance framework to support sanctions compliance. Committees of the Board are kept updated on developments within their respective remits. In 2023, the Audit Committee was briefed on developments in sustainability reporting requirements on a regular basis by the Chief Sustainability Officer and the external auditors. Coverage included reporting in alignment with TCFD recommendations, the impact of the EU Sustainable Finance Disclosure Regulation, anticipated future application of the EU Corporate Sustainability Reporting Directive, data reporting standards to be implemented by the International Sustainability Standards Board, recommendations for the Taskforce on Nature-related Financial Disclosures framework, and developments in the U.S. SEC's proposals to introduce climate-related disclosure requirements. These briefings have served to inform the Audit Committee's oversight of the Group's sustainability reporting framework and its future development. The Audit Committee was also briefed on developments in UK audit and corporate governance reforms during the year, including the FRC's consultation on the revised Corporate Governance Code, which was published in January 2024. The Remuneration Committee is kept updated by its external consultants on UK and U.S. corporate governance developments impacting executive and wider workforce remuneration. Briefings provided to the Committee during the year included outcomes of the global living wage assessment conducted across the Group, introduction of new U.S. SEC and NYSE rules on mandatory clawback arrangements, insights on market practice relating to the use of sustainability metrics in incentive schemes and updates on other trends in executive remuneration to inform development of a revised Directors' Remuneration Policy ahead of policy renewal planned for 2025. All Board members attended the meetings of the Audit and Remuneration Committees held in October 2023 to promote a deeper understanding of the work of the Committees of which they are not members. Non-Executive Directors regularly attended meetings of the Group’s Regional Audit Committees and Corporate Audit Committee to gain a better understanding of the Group’s regions and central functions and the risks faced by the business at market, regional and functional levels. The Chair met with each Non-Executive Director individually towards the end of the year to discuss their individual training and development plans. Board Review Process Annually, the Board undertakes a rigorous review of its effectiveness and performance, and that of its Committees and individual Directors. The Chair is responsible for the overall review process and each Committee Chair is responsible for the review of the performance and effectiveness of their Committee. The effectiveness and performance of the Board, its Committees and the Directors were reviewed internally in 2023, led by the Chair and facilitated by the Company Secretary. An externally-facilitated review of the performance and effectiveness of the Board, its Committees and each of the Directors was conducted in 2022. For the 2023 internal review, all Directors participated fully in the review, with the exception of Murray Kessler and Serpil Timuray who joined the Board towards the end of the year. Murray and Serpil participated in the Board consideration of the outcomes of the review. As part of the internal review process, a series of questionnaires were completed by the participating Directors, through which they were requested to assess the effectiveness and performance of the Board, the Committees of which they were a member or regularly attended during the year, and each of the Directors. Several members of senior management also participated in aspects of the review process. Feedback was collated on an anonymised basis and reports on the outcomes of the review process and action areas for consideration were prepared for the Board and each Committee. The Board and the Committees then reviewed and discussed their respective reports and identified action areas for 2024, taking into account the review findings. The Committee Chairs also reported back to the Board on the outcomes of their Committee evaluations. The Chair received reports from the Company Secretary on the performance and effectiveness of the Directors (other than himself) and he provided individual feedback to each Director. The Senior Independent Director received a report from the Company Secretary on the Chair’s performance and effectiveness, and led a discussion reviewing the Chair’s effectiveness with the other Directors (without the Chair present). The Senior Independent Director then provided feedback to the Chair. In addition to the 2023 internal review, a review session with the Board was facilitated to follow up from the externally- facilitated review conducted in 2022. 2023: Internal Board review process Plan and Evaluate – The Chair and Company Secretary reviewed the scope and focus areas for the review and defined the series of questionnaires to be used to support the review process. – The Directors provided their assessment of the performance and effectiveness of the Board, its Committees and the Directors. Reporting – Participant feedback was collated on an anonymised basis and reports were prepared for the Board, its Committees and the Directors. Review and Action – Board Committees reviewed and discussed the review outcomes, identified actions arising and provided feedback to the Board. – The Board then discussed the review outcomes and identified action areas for 2024. – The Chair provided feedback to the other Directors. – The Senior Independent Director provided feedback to the Chair. BAT Annual Report and Form 20-F 2023 Strategic Report Governance Report Financial Statements Other Information Composition, Succession, Evaluation Board Effectiveness 152 1 2 3
Spotlight 2023 Board review Overview of Outcomes The outcomes of the internal review support the overall conclusion that the Board is effective and maintains a sound working relationship with its Committees. The review found the composition of the Board to be well- balanced, including in relation to diversity and Directors' skills and experience. The working relationships and communication between the Non-Executive Directors, and between the Non-Executive Directors, Chief Executive and wider executive management team, are well-regarded and support open discussion in the boardroom. The Board's focus during the year was generally found to be appropriately balanced across the elements of the Group's strategy, with due attention to risk, control and compliance matters. The Board's approach to monitoring corporate culture is considered to be effective, with feedback demonstrating that the enhanced programme of workforce engagement led by the Chief Executive in 2023 was well-received. The value of market and operational site visits was highlighted by the Board as an important way in which to monitor workforce sentiment. Board and Committee meetings are considered to be chaired, managed and supported effectively to enable decision-making, with Committee Chairs providing thorough and efficient reporting to the Board. Progress against key action areas identified for 2023 Strategy: The Board's agenda for the year maintained focus on strategic discussion and development, supported by reviews of the competitive environment, with the Board leading the refinement of the Group's A Better TomorrowTM strategy discussed further on page 149. Board leadership: Feedback from the internal review demonstrated effective working relationships between the Directors, enhanced through a blend of formal and informal meetings and site visits. Feedback also acknowledged further improvements in information flows between the Board and management, with some additional opportunities identified for continuous improvement. Risk management: During 2023, the Board's programme of risk management oversight was supplemented with focused briefings on risk management topics, including sustainability regulations and the cyber security risk landscape. The Audit Committee also received a range of briefings relevant to risk management oversight of the Group's sustainability agenda. These briefings are discussed further on page 152. People and culture: The Board recognised the effectiveness of the Nominations Committee during the year through its significant focus on Chief Executive transition planning, and Chief Financial Officer and Non-Executive Director succession planning. Maintaining momentum on longer-term Non- Executive Director succession planning, and oversight of the development of a diverse pipeline for Management Board and senior management succession, was identified as a continuing priority for 2024. Key Actions for 2024 Following the internal review conducted in 2023, the Board and its Committees plan to implement forward-focused actions in the following key areas: Strategy – Following introduction of the Group's refined strategic direction, support management with execution of Group strategy and oversee progress against strategic key performance indicators. – In view of developing regulatory frameworks, maintain emphasis on the Board's oversight of the Group's sustainability strategy as part of the Board agenda, supported by structured briefings for Directors, including external stakeholder perspectives. Board leadership – Taking into account changes in the composition of the Board during the year, refresh the Board's assessment of skills requirements to support the Group's strategy. – Develop the Directors' programme for market and operational site visits in 2024, including a range of opportunities for informal workforce engagement. Risk management – Recognising the evolving nature of risks relating to cyber security and supply chain management, maintain appropriate time on the Board and Audit Committee agendas for review and discussion of these risks and mitigation activities, alongside other existing and emerging risks to the Group. – Maintain Audit Committee focus on business controls and sustainability reporting, particularly in the context of evolving regulatory frameworks, and on cyber security risk management oversight, with those priorities reflected in the Internal Audit Plan for 2024. People and culture – Continue to focus on succession planning for Non-Executive Directors to retain an appropriate balance of diversity, skills and expertise in the longer-term. – Promote the development of broader diversity in the Management Board and senior management, with continued attention to improving gender diversity at those levels. – Implement a comprehensive induction programme for the new Chief Financial Officer following her appointment in May 2024. – For the Remuneration Committee, focus on development of the revised Directors’ Remuneration Policy in readiness for presentation to shareholders at the AGM in 2025 and completion of a thorough induction on executive remuneration for new Committee members. BAT Annual Report and Form 20-F 2023 Strategic Report Governance Report Financial Statements Other Information 153
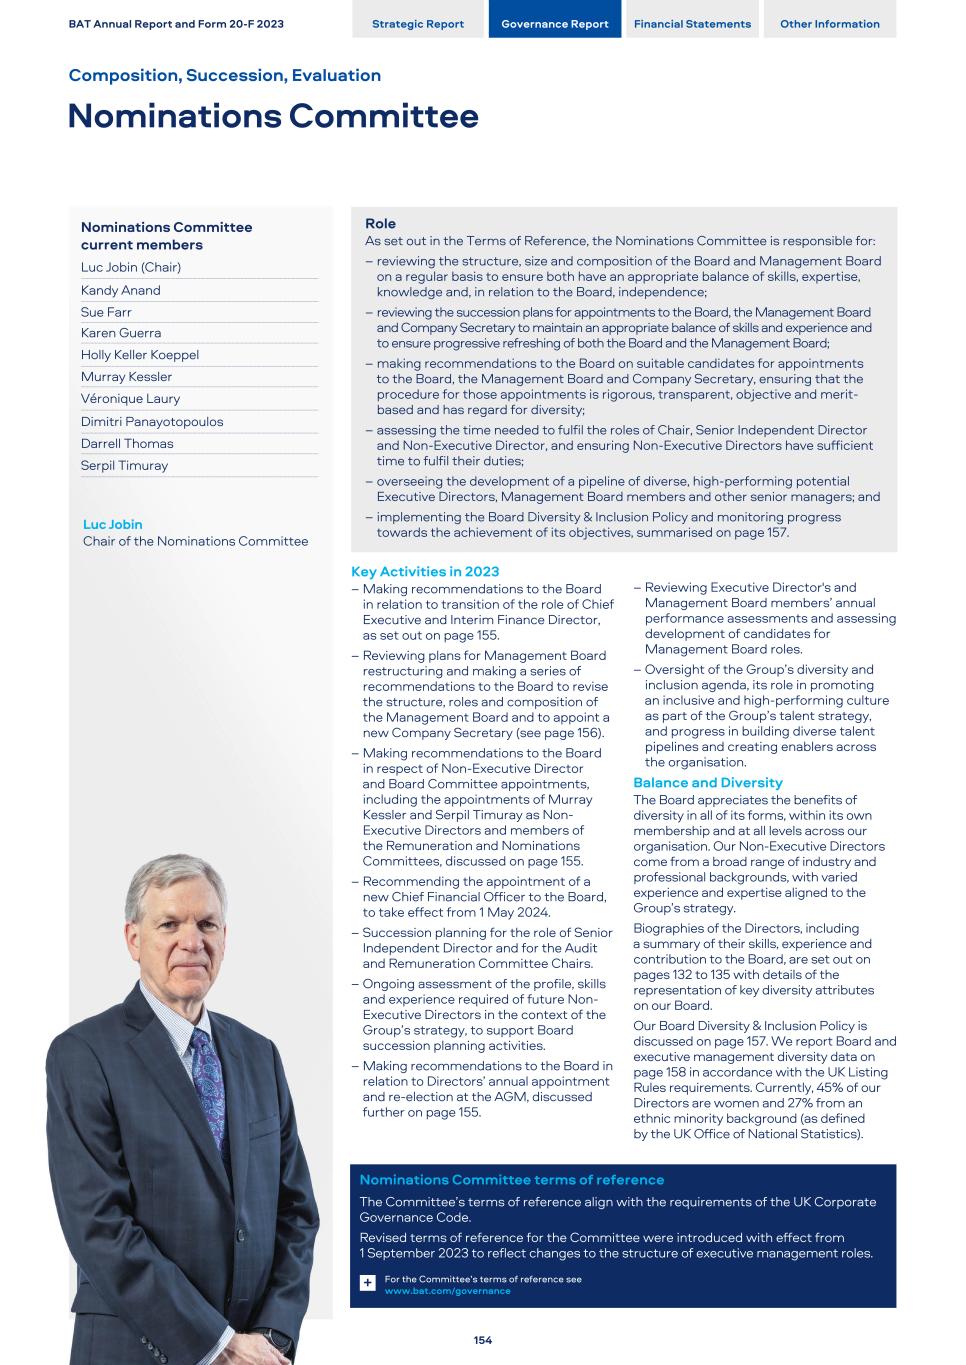
Nominations Committee current members Luc Jobin (Chair) Kandy Anand Sue Farr Karen Guerra Holly Keller Koeppel Murray Kessler Véronique Laury Dimitri Panayotopoulos Darrell Thomas Serpil Timuray Luc Jobin Chair of the Nominations Committee Role As set out in the Terms of Reference, the Nominations Committee is responsible for: – reviewing the structure, size and composition of the Board and Management Board on a regular basis to ensure both have an appropriate balance of skills, expertise, knowledge and, in relation to the Board, independence; – reviewing the succession plans for appointments to the Board, the Management Board and Company Secretary to maintain an appropriate balance of skills and experience and to ensure progressive refreshing of both the Board and the Management Board; – making recommendations to the Board on suitable candidates for appointments to the Board, the Management Board and Company Secretary, ensuring that the procedure for those appointments is rigorous, transparent, objective and merit- based and has regard for diversity; – assessing the time needed to fulfil the roles of Chair, Senior Independent Director and Non-Executive Director, and ensuring Non-Executive Directors have sufficient time to fulfil their duties; – overseeing the development of a pipeline of diverse, high-performing potential Executive Directors, Management Board members and other senior managers; and – implementing the Board Diversity & Inclusion Policy and monitoring progress towards the achievement of its objectives, summarised on page 157. Key Activities in 2023 – Making recommendations to the Board in relation to transition of the role of Chief Executive and Interim Finance Director, as set out on page 155. – Reviewing plans for Management Board restructuring and making a series of recommendations to the Board to revise the structure, roles and composition of the Management Board and to appoint a new Company Secretary (see page 156). – Making recommendations to the Board in respect of Non-Executive Director and Board Committee appointments, including the appointments of Murray Kessler and Serpil Timuray as Non- Executive Directors and members of the Remuneration and Nominations Committees, discussed on page 155. – Recommending the appointment of a new Chief Financial Officer to the Board, to take effect from 1 May 2024. – Succession planning for the role of Senior Independent Director and for the Audit and Remuneration Committee Chairs. – Ongoing assessment of the profile, skills and experience required of future Non- Executive Directors in the context of the Group’s strategy, to support Board succession planning activities. – Making recommendations to the Board in relation to Directors’ annual appointment and re-election at the AGM, discussed further on page 155. – Reviewing Executive Director's and Management Board members’ annual performance assessments and assessing development of candidates for Management Board roles. – Oversight of the Group’s diversity and inclusion agenda, its role in promoting an inclusive and high-performing culture as part of the Group’s talent strategy, and progress in building diverse talent pipelines and creating enablers across the organisation. Balance and Diversity The Board appreciates the benefits of diversity in all of its forms, within its own membership and at all levels across our organisation. Our Non-Executive Directors come from a broad range of industry and professional backgrounds, with varied experience and expertise aligned to the Group’s strategy. Biographies of the Directors, including a summary of their skills, experience and contribution to the Board, are set out on pages 132 to 135 with details of the representation of key diversity attributes on our Board. Our Board Diversity & Inclusion Policy is discussed on page 157. We report Board and executive management diversity data on page 158 in accordance with the UK Listing Rules requirements. Currently, 45% of our Directors are women and 27% from an ethnic minority background (as defined by the UK Office of National Statistics). Nominations Committee terms of reference The Committee’s terms of reference align with the requirements of the UK Corporate Governance Code. Revised terms of reference for the Committee were introduced with effect from 1 September 2023 to reflect changes to the structure of executive management roles. For the Committee’s terms of reference see www.bat.com/governance+ BAT Annual Report and Form 20-F 2023 Strategic Report Governance Report Financial Statements Other Information Composition, Succession, Evaluation Nominations Committee 154
The Senior Independent Director is currently Sue Farr. From close of the 2024 AGM, Holly Keller Koeppel will succeed Sue as Senior Independent Director (subject to re-election). Soraya Benchikh will be appointed as Chief Financial Officer from 1 May 2024. At the close of the 2024 AGM, it is anticipated that representation of women on the Board will be 45% and representation of Directors from ethnic minority backgrounds will be 33%. The Board remains committed to enhancing its diversity and the Nominations Committee continues to actively progress Non- Executive Director succession supported by our Board Diversity & Inclusion Policy. Board Succession Planning The Board considers the length of service of Board members as a whole and the need for Board membership to be refreshed progressively over time. The Committee is responsible for regularly reviewing the composition of the Board and the Management Board to ensure both have an appropriate balance of skills, expertise and experience. The Committee is also responsible for identifying candidates for Board positions and ensuring that all appointments are made on merit, against objective criteria, and with due regard for our Board Diversity & Inclusion Policy. This process includes interviews with a range of candidates and full evaluation of candidates’ experience and attributes and how these would augment the Board’s mix of skills, expertise and knowledge. Executive Director succession In 2023, the Committee led the process to identify a new Chief Executive to further drive the Group's transformation in a fast-changing environment. The Committee gave thorough consideration to a range of candidates, their relative experience, skills and other attributes, and ability to fulfil the role criteria with emphasis on a demonstrated track record for developing collaborative teams capable of delivering transformation and strength in execution. Attendance at meetings in 20232(a), 3(a) Meeting attendance4 Name Member since Attended/Eligible to attend Luc Jobin 2017 7/7 Kandy Anand2(b) 2022 6/7 Sue Farr2(c) 2015 6/7 Karen Guerra 2020 7/7 Holly Keller Koeppel 2017 7/7 Murray Kessler3(b) 2023 1/1 Véronique Laury 2022 7/7 Dimitri Panayotopoulos2(d) 2015 5/7 Darrell Thomas 2020 7/7 Serpil Timuray3(c) 2023 0/0 Savio Kwan3(d) 2014 - 2022 2/2 Following this process, the Committee recommended to the Board the appointment of Tadeu Marroco as Chief Executive to succeed Jack Bowles. Jack had served as Chief Executive since 2019 and stepped down from the Board with effect from 15 May 2023. In the context of succession planning for the Chief Executive, the Committee also gave full consideration to a range of candidates for appointment as Finance Director. Taking into account the candidates' skills, experience and broader attributes and longer-term succession planning for the composition of the Board, the Committee recommended to the Board that Javed Iqbal be appointed as Finance Director on an interim basis, alongside his existing role of Director, Digital & Information (Javed was not appointed as an Executive Director in the interim). Subsequently, the Committee led a comprehensive search process resulting in the Committee recommending to the Board the appointment of Soraya Benchikh as Chief Financial Officer and as an Executive Director. Soraya's appointment will take effect from 1 May 2024 and the process leading to her appointment will be reported in the Annual Report and Form 20-F for 2024. Non- Executive Director succession In 2023, the Committee recommended to the Board the appointments of Murray Kessler and Serpil Timuray as Non- Executive Directors. Heidrick & Struggles1 supported the selection process leading to these appointments. As part of these appointment processes, specific candidate selection criteria were developed to reflect the Board's requirements, including for business transformation, consumer products and digital technology experience. For each appointment, a short list of candidates was presented to the Committee and preferred candidates were interviewed by members of the Board, who reported their feedback on candidates to the Committee. Careful consideration was given to candidates' skills, experience, diversity of attributes and their fit with the role criteria for each appointment. The Committee then recommended the preferred candidate for appointment to the Board. Murray and Serpil each bring a range of extensive transformation, technology and consumer products expertise to the Board. Their biographies are set out on pages 134 and 135. Board Retirements Savio Kwan stepped down from the Board with effect from the conclusion of the Company’s AGM on 19 April 2023 and Jack Bowles stepped down from the Board with effect from 15 May 2023. Sue Farr and Dimitri Panayotopoulos will step down from the Board with effect from the conclusion of the Company's AGM on 24 April 2024. Annual General Meeting 2024 With the exception of Sue Farr and Dimitri Panayotopoulos, the Company will submit all eligible Directors for re-election and, in the case of Murray Kessler and Serpil Timuray, election for the first time. Prior to making recommendations to the Board in respect of Directors’ submissions for re-election, the Committee carried out an assessment of each Director, including their performance, contribution to the long-term sustainable success of the Company and, in respect of each of the Non-Executive Directors, their continued independence and ability to devote sufficient time to their role (discussed on pages 150 and 151). The Chair’s letter accompanying the 2024 AGM Notice confirms that all Non- Executive Directors being proposed for re-election are effective and that they continue to demonstrate commitment to their roles. Notes: 1. Heidrick & Struggles International, Inc. is an independent executive search firm, which applies the Standard and Enhanced Codes of Conduct for Executive Search Firms. The firm has no connections with the Company or its Directors other than in respect of the provision of executive search services. 2. Number of meetings in 2023: (a) the Committee held seven meetings, four of which were ad hoc. Three meetings of the Committee are scheduled for 2024; (b) Kandy Anand did not attend the scheduled meeting in February 2023 due to unforeseen personal circumstances; (c) Sue Farr did not attend the ad hoc meeting in January 2023 convened at short notice due to prior commitments; (d) Dimitri Panayotopoulos did not attend the ad hoc meeting in June 2023 and the scheduled meeting in July 2023 due to illness. 3. Membership: (a) all members of the Committee are independent Non-Executive Directors in accordance with UK Corporate Governance Code 2018 Provisions 10 and 17, applicable U.S. federal securities laws and NYSE listing standards; (b) Murray Kessler joined the Committee on 6 November 2023 on his appointment to the Board; (c) Serpil Timuray joined the Committee on 4 December 2023 on her appointment to the Board; (d) Savio Kwan ceased to be a member of the Committee on stepping down from the Board at the conclusion of the AGM on 19 April 2023. 4. Other attendees: the Chief Executive and the Chief People Officer attend meetings by invitation but not as members. BAT Annual Report and Form 20-F 2023 Strategic Report Governance Report Financial Statements Other Information 155
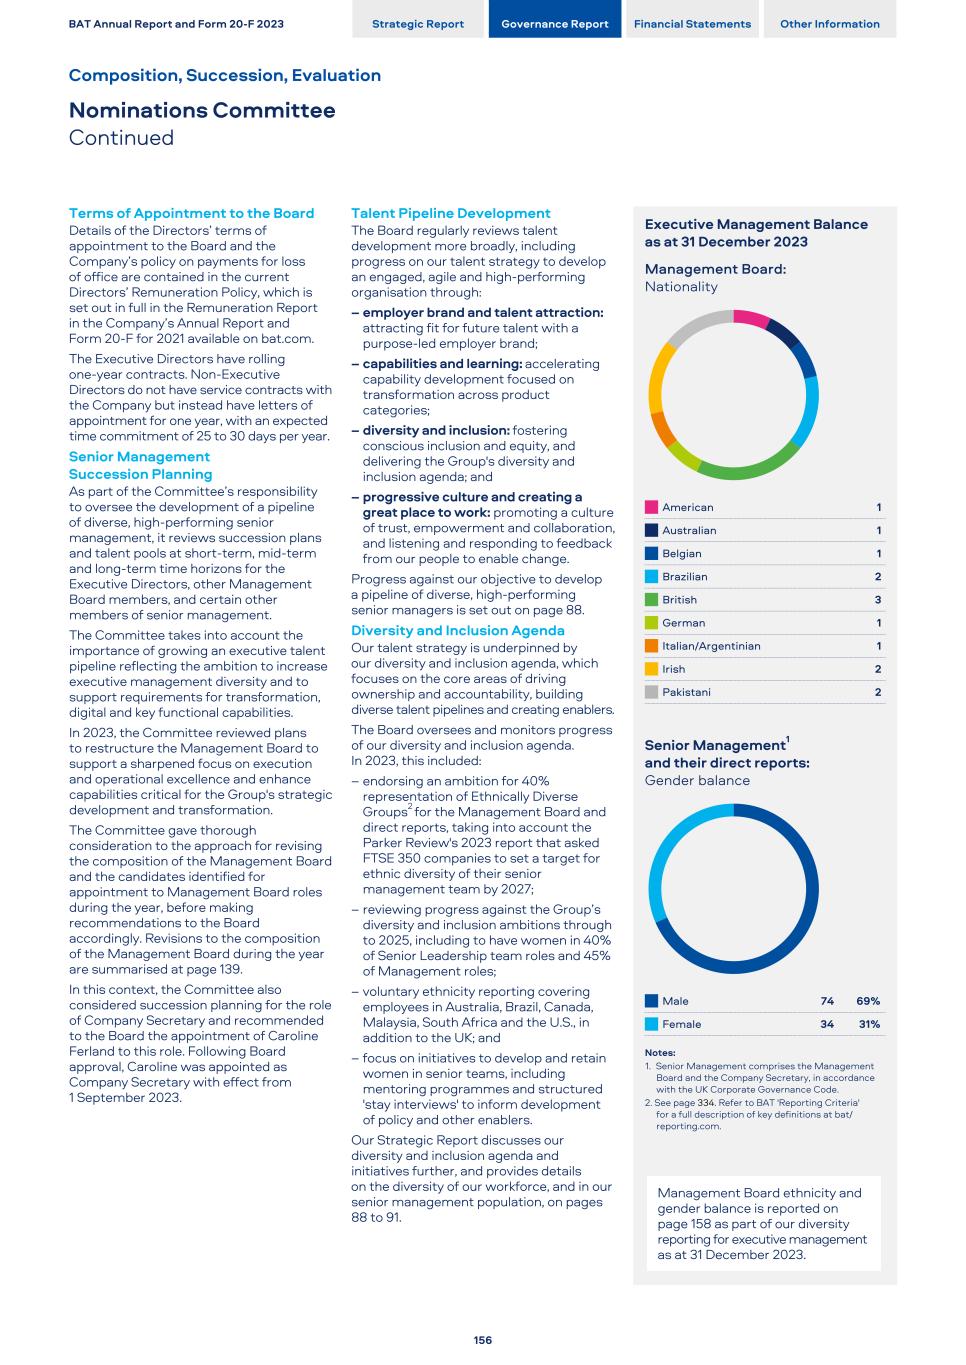
Terms of Appointment to the Board Details of the Directors’ terms of appointment to the Board and the Company’s policy on payments for loss of office are contained in the current Directors’ Remuneration Policy, which is set out in full in the Remuneration Report in the Company’s Annual Report and Form 20-F for 2021 available on bat.com. The Executive Directors have rolling one-year contracts. Non-Executive Directors do not have service contracts with the Company but instead have letters of appointment for one year, with an expected time commitment of 25 to 30 days per year. Senior Management Succession Planning As part of the Committee’s responsibility to oversee the development of a pipeline of diverse, high-performing senior management, it reviews succession plans and talent pools at short-term, mid-term and long-term time horizons for the Executive Directors, other Management Board members, and certain other members of senior management. The Committee takes into account the importance of growing an executive talent pipeline reflecting the ambition to increase executive management diversity and to support requirements for transformation, digital and key functional capabilities. In 2023, the Committee reviewed plans to restructure the Management Board to support a sharpened focus on execution and operational excellence and enhance capabilities critical for the Group's strategic development and transformation. The Committee gave thorough consideration to the approach for revising the composition of the Management Board and the candidates identified for appointment to Management Board roles during the year, before making recommendations to the Board accordingly. Revisions to the composition of the Management Board during the year are summarised at page 139. In this context, the Committee also considered succession planning for the role of Company Secretary and recommended to the Board the appointment of Caroline Ferland to this role. Following Board approval, Caroline was appointed as Company Secretary with effect from 1 September 2023. Talent Pipeline Development The Board regularly reviews talent development more broadly, including progress on our talent strategy to develop an engaged, agile and high-performing organisation through: – employer brand and talent attraction: attracting fit for future talent with a purpose-led employer brand; – capabilities and learning: accelerating capability development focused on transformation across product categories; – diversity and inclusion: fostering conscious inclusion and equity, and delivering the Group's diversity and inclusion agenda; and – progressive culture and creating a great place to work: promoting a culture of trust, empowerment and collaboration, and listening and responding to feedback from our people to enable change. Progress against our objective to develop a pipeline of diverse, high-performing senior managers is set out on page 88. Diversity and Inclusion Agenda Our talent strategy is underpinned by our diversity and inclusion agenda, which focuses on the core areas of driving ownership and accountability, building diverse talent pipelines and creating enablers. The Board oversees and monitors progress of our diversity and inclusion agenda. In 2023, this included: – endorsing an ambition for 40% representation of Ethnically Diverse Groups2 for the Management Board and direct reports, taking into account the Parker Review's 2023 report that asked FTSE 350 companies to set a target for ethnic diversity of their senior management team by 2027; – reviewing progress against the Group’s diversity and inclusion ambitions through to 2025, including to have women in 40% of Senior Leadership team roles and 45% of Management roles; – voluntary ethnicity reporting covering employees in Australia, Brazil, Canada, Malaysia, South Africa and the U.S., in addition to the UK; and – focus on initiatives to develop and retain women in senior teams, including mentoring programmes and structured 'stay interviews' to inform development of policy and other enablers. Our Strategic Report discusses our diversity and inclusion agenda and initiatives further, and provides details on the diversity of our workforce, and in our senior management population, on pages 88 to 91. Executive Management Balance as at 31 December 2023 Management Board: Nationality American 1 Australian 1 Belgian 1 Brazilian 2 British 3 German 1 Italian/Argentinian 1 Irish 2 Pakistani 2 Senior Management1 and their direct reports: Gender balance Male 74 69% Female 34 31% Notes: 1. Senior Management comprises the Management Board and the Company Secretary, in accordance with the UK Corporate Governance Code. 2. See page 334. Refer to BAT 'Reporting Criteria' for a full description of key definitions at bat/ reporting.com. Management Board ethnicity and gender balance is reported on page 158 as part of our diversity reporting for executive management as at 31 December 2023. BAT Annual Report and Form 20-F 2023 Strategic Report Governance Report Financial Statements Other Information Composition, Succession, Evaluation Nominations Committee Continued 156
Our Board Diversity & Inclusion Policy A revised Board Diversity & Inclusion Policy was approved by the Board and took effect from 7 February 2024 to reflect the refreshed statement of our values. At BAT, we are proud to be a diverse and inclusive global organisation that encourages our people to value their differences and bring their authentic selves to work. Our ongoing commitment to fostering a progressive culture is underpinned clearly by our values: “Truly Inclusive”. Our commitment to diversity and inclusion across BAT is also embedded through our Group Standards of Business Conduct, applicable to all employees of the Group. Our Board Diversity & Inclusion Policy sets out our approach to diversity applicable to the Board, its Committees1 and the Management Board2. This policy is intended to support the Board, through the activities of its Nominations Committee, in maintaining the effectiveness and balance of the Board, its Committees and the Management Board. Diversity and inclusion are key principles of our values. We think of diversity in its widest sense, as those attributes that make each of us unique. These include our race, ethnicity, cultural and social backgrounds, geographical origin, nationality, gender, age, any disability, sexual orientation, religion, skills, experience, education, socio-economic and professional background, perspectives and thinking styles. We recognise that diversity is a critical component of board effectiveness and we are committed to promoting diversity in the composition of the Board, its Committees and the Management Board. The Nominations Committee is responsible for regularly reviewing the composition of the Board, its Committees and the Management Board to ensure these have an appropriate balance of skills, expertise, and knowledge, and for ensuring that all appointments are made on merit against objective criteria and with due regard for the benefits of diversity. This includes our Board Diversity & Inclusion Policy objectives set out below. The Nominations Committee is responsible for implementing this policy and monitoring progress against its objectives. This policy and progress against its objectives is reviewed annually by the Nominations Committee, in addition to other BAT initiatives that promote diversity in all its forms across BAT. As part of the annual evaluation of the effectiveness of the Board, consideration is given to the balance of experience, skills, knowledge, independence and all attributes of diversity of the Board. Board Diversity Objectives and Progress Updates The objectives of our Board Diversity & Inclusion Policy and progress against these objectives in the year are set out below. Considering all aspects of diversity when reviewing the composition of, and succession planning for, the Board, its Committees1 and the Management Board2 The Nominations Committee has regard to diversity in its widest sense, including attributes such as gender, race, ethnicity, cultural and social backgrounds, and other personal attributes referred to in our Board Diversity & Inclusion Policy above, when undertaking these activities. Considering a wide and gender-balanced pool of candidates for appointment to the Board Executive search firms are engaged to support Board and Management Board succession planning where applicable and are required to provide gender-balanced shortlists of candidates. Succession planning for Executive Directors and Management Board members takes into account potential internal candidates from across the Group and potential external candidates. Maintain at least 40% representation of women on the Board The representation of women on the Board was 45% as at 31 December 2023 (2022: 36%). At the close of the 2024 AGM, it is anticipated that women will represent 45% of the Board, increasing to 50% from 1 May 2024. At least one of the following senior positions on the Board to be held by a woman: Chair; Senior Independent Director; Chief Executive; Chief Financial Officer The role of Senior Independent Director is currently held by Sue Farr. Sue was appointed as Senior Independent Director with effect from 1 August 2022. At the close of the 2024 AGM, Holly Keller Koeppel will be appointed as Senior Independent Director (subject to re-election). Other senior positions on the Board are held by Luc Jobin (Chair) and Tadeu Marroco (Chief Executive). Javed Iqbal currently holds the role of Interim Finance Director but is not a member of the Board. From 1 May 2024, the senior Board position of Chief Financial Officer will be held by Soraya Benchikh, accordingly it is anticipated that a total of two of the four senior positions on the Board will be held by women from 1 May 2024. At least one Director of a minority ethnic background on the Board3 As at 31 December 2023, the representation of ethnic minority backgrounds on the Board was 27% (2022: 27%). At the close of the 2024 AGM, it is anticipated that the representation of ethnic minority backgrounds on the Board will be 33%. The Board complies with the recommendations on ethnic diversity made by the UK Parker Review. Giving preference, where appropriate, to engagement of executive search firms accredited under the Standard and Enhanced Code of Conduct for Executive Search Firms Where executive search firms are engaged to provide executive search services to support Board succession planning, preference is given to those that are accredited under the Standard and Enhanced Code of Conduct for Executive Search Firms. Oversight of the development of a pipeline of diverse, high-performing potential Executive Directors, Management Board members and other senior managers. The representation of women on the Management Board was 7% as at 31 December 2023 (2022: 7%), anticipated to increase to 13% from 1 May 2024, following the appointment of Soraya Benchikh as Chief Financial Officer. Management Board succession planning takes into account the ambition to progress towards improved gender diversity. Emphasis is placed on building diverse talent pools at all levels of the organisation through recruiting, developing and retaining diverse and high-performing talent. In 2023, 50% of the Group’s external management recruits were women (2022: 47%) and women comprised 62% of our new graduate intake in 2023 (2022: 57%). Further information about the Group’s diversity and inclusion agenda is set out on pages 88 to 91. Notes on Board Diversity & Inclusion Policy Objectives: 1. The principal committees of the Board comprise the Audit, Remuneration and Nominations Committees. 2. The Management Board is the executive level committee of the Group. 3. Applying UK Office for National Statistics ethnicity categories of: Asian; Black; Mixed/Multiple Ethnic Groups; Other Ethnic Group, in alignment with the UK Listing Rules. BAT Annual Report and Form 20-F 2023 Strategic Report Governance Report Financial Statements Other Information 157
Reporting in alignment with UK Listing Rules provisions on diversity and inclusion We report our Board and executive management diversity data as at 31 December 2023 in accordance with the UK Listing Rules disclosure requirements and our progress in meeting the UK Listing Rules board diversity targets. As at 31 December 2023, one of the three senior positions on the Board was held by a woman, Directors from an ethnic minority background represented 27% of the Board and the representation of women on the Board was 45% (this remains the case as at the date of this Annual Report and Form 20-F). The representation of women on the Board currently meets the UK Listing Rules target of 40%. It is anticipated that the representation of women on the Board will remain at 45% at the close of the 2024 AGM (following Sue Farr and Dimitri Panayotopoulos stepping down from the Board) and will increase to 50% from 1 May 2024 following the appointment of Soraya Benchikh as Chief Financial Officer. It is further anticipated that a total of two of the four senior positions on the Board will be held by women from 1 May 2024. The Board is committed to continued enhancement of its diversity, supported by the succession planning activities conducted by the Nominations Committee, discussed on pages 155 to 156. Gender Representation: Board & Executive Management as at 31 December 2023 Number of Board members Percentage of the Board Number of senior positions on the Board (CEO, CFO1, SID and Chair) Number in executive management2 Percentage of executive management2 Men 6 55 % 2 13 87 % Women 5 45 % 1 2 13 % Not specified/prefer not to say — — — — — Ethnic Background: Board & Executive Management as at 31 December 2023 Number of Board members Percentage of the Board Number of senior positions on the Board (CEO, CFO1, SID and Chair) Number in executive management2 Percentage of executive management2 White British or other White (including minority-white groups) 8 73 % 2 10 67 % Mixed/Multiple Ethnic Groups — — — — — Asian/Asian British 1 9 % — 2 13 % Black/African/Caribbean/Black British 1 9 % — — — Other ethnic group, including Arab 1 9 % 1 3 20 % Not specified/prefer not to say — — — — — Notes: 1. The role of Interim Finance Director (equivalent to CFO) is not currently an Executive Director role on the Board. 2. Executive management includes the Management Board (most senior executive body below the Board) and the Company Secretary, excluding administrative and support staff, as defined by the UK Listing Rules. Approach to data collection Gender and ethnicity data relating to the Board, Management Board and Company Secretary is collected on an annual basis applying a standardised process managed by the Company Secretary. Each Board member, Management Board member and the Company Secretary is requested to complete a standard form questionnaire on a strictly confidential and voluntary basis, through which the individual self-reports their ethnicity and gender identity (or specifies they do not wish to report such data). Consent is provided for data collection and processing of that data in accordance with the applicable privacy notice set out in the questionnaire and in accordance with the Group Data Privacy Procedure. The criteria of the standard form questionnaire are fully aligned to the definitions specified in the UK Listing Rules, with individuals requested to specify: (1) Self-reported gender identity. Selection from [a] male; [b] female]; [c] other category/please specify; [d] not specified (due to local data privacy laws); or [e] prefer not to say. (2) Self-reported ethnic background (classifications as designated by the UK Office of National Statistics). Selection from: [a] White British or other White; [b] Mixed or Multiple Ethnic Groups; [c] Asian or Asian British; [d] Black; [e] Other Ethic Group/please specify [f] not specified (due to local data privacy laws); or [g] prefer not to say. For the 2023 data collection process, the standard form questionnaire included further guidance to participants in respect of the category 'Other Ethnic Group' following publication of the 2021 census ethnicity data by the UK Office of National Statistics. This approach to data collection is consistently applied across all members of the Board, Management Board and Company Secretary in relation to the collection and reporting of their gender and ethnicity data in this Annual Report and Form 20-F. BAT Annual Report and Form 20-F 2023 Strategic Report Governance Report Financial Statements Other Information Composition, Succession, Evaluation Nominations Committee Continued 158
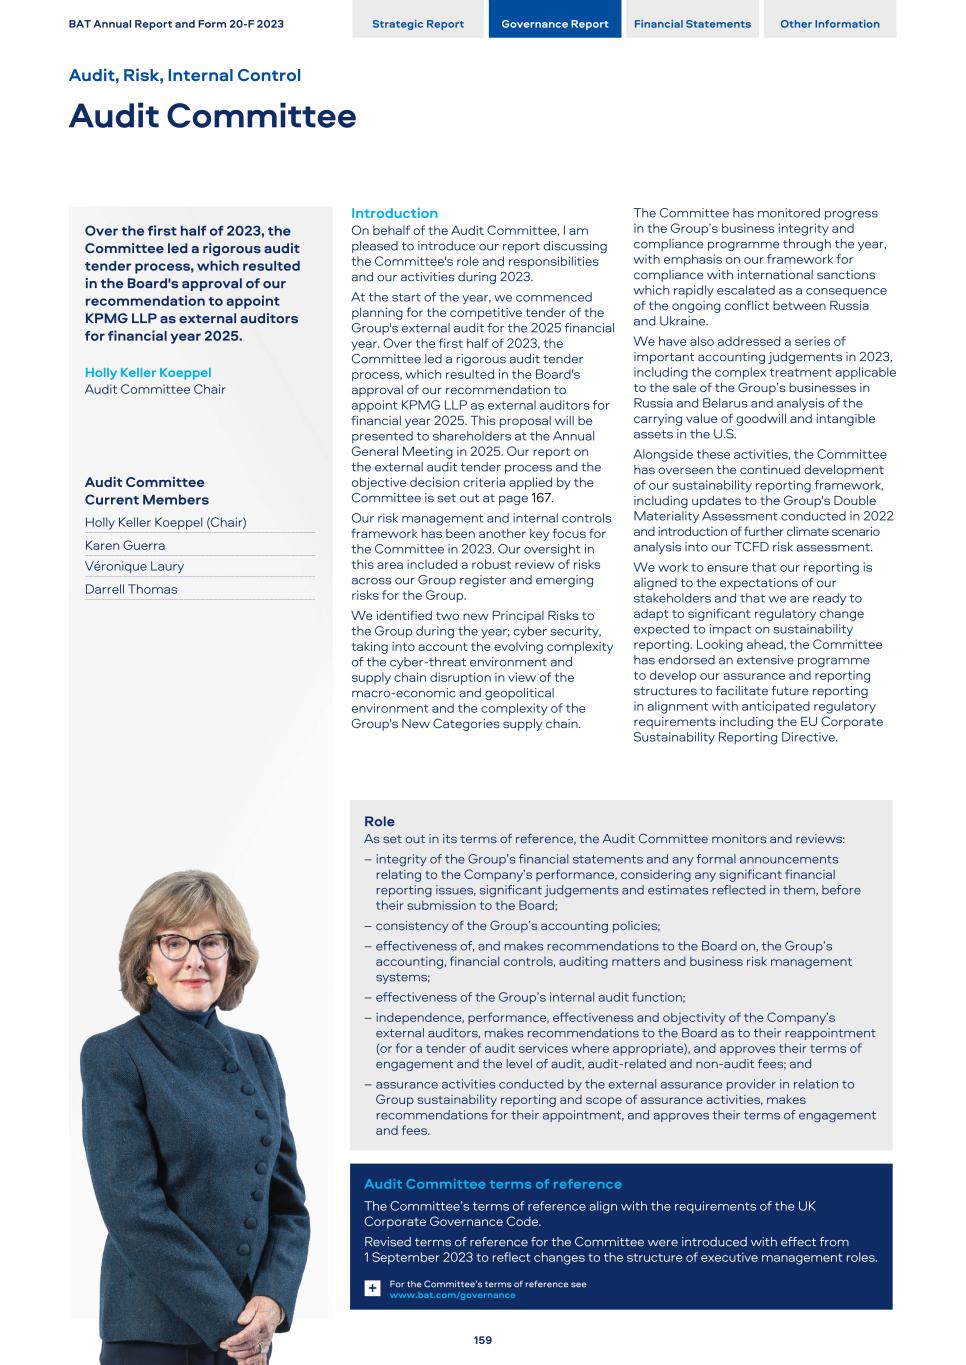
Over the first half of 2023, the Committee led a rigorous audit tender process, which resulted in the Board's approval of our recommendation to appoint KPMG LLP as external auditors for financial year 2025. Holly Keller Koeppel Audit Committee Chair Audit Committee Current Members Holly Keller Koeppel (Chair) Karen Guerra Véronique Laury Darrell Thomas Introduction On behalf of the Audit Committee, I am pleased to introduce our report discussing the Committee's role and responsibilities and our activities during 2023. At the start of the year, we commenced planning for the competitive tender of the Group's external audit for the 2025 financial year. Over the first half of 2023, the Committee led a rigorous audit tender process, which resulted in the Board's approval of our recommendation to appoint KPMG LLP as external auditors for financial year 2025. This proposal will be presented to shareholders at the Annual General Meeting in 2025. Our report on the external audit tender process and the objective decision criteria applied by the Committee is set out at page 167. Our risk management and internal controls framework has been another key focus for the Committee in 2023. Our oversight in this area included a robust review of risks across our Group register and emerging risks for the Group. We identified two new Principal Risks to the Group during the year; cyber security, taking into account the evolving complexity of the cyber-threat environment and supply chain disruption in view of the macro-economic and geopolitical environment and the complexity of the Group's New Categories supply chain. The Committee has monitored progress in the Group’s business integrity and compliance programme through the year, with emphasis on our framework for compliance with international sanctions which rapidly escalated as a consequence of the ongoing conflict between Russia and Ukraine. We have also addressed a series of important accounting judgements in 2023, including the complex treatment applicable to the sale of the Group’s businesses in Russia and Belarus and analysis of the carrying value of goodwill and intangible assets in the U.S. Alongside these activities, the Committee has overseen the continued development of our sustainability reporting framework, including updates to the Group's Double Materiality Assessment conducted in 2022 and introduction of further climate scenario analysis into our TCFD risk assessment. We work to ensure that our reporting is aligned to the expectations of our stakeholders and that we are ready to adapt to significant regulatory change expected to impact on sustainability reporting. Looking ahead, the Committee has endorsed an extensive programme to develop our assurance and reporting structures to facilitate future reporting in alignment with anticipated regulatory requirements including the EU Corporate Sustainability Reporting Directive. Role As set out in its terms of reference, the Audit Committee monitors and reviews: – integrity of the Group’s financial statements and any formal announcements relating to the Company’s performance, considering any significant financial reporting issues, significant judgements and estimates reflected in them, before their submission to the Board; – consistency of the Group’s accounting policies; – effectiveness of, and makes recommendations to the Board on, the Group’s accounting, financial controls, auditing matters and business risk management systems; – effectiveness of the Group’s internal audit function; – independence, performance, effectiveness and objectivity of the Company’s external auditors, makes recommendations to the Board as to their reappointment (or for a tender of audit services where appropriate), and approves their terms of engagement and the level of audit, audit-related and non-audit fees; and – assurance activities conducted by the external assurance provider in relation to Group sustainability reporting and scope of assurance activities, makes recommendations for their appointment, and approves their terms of engagement and fees. Audit Committee terms of reference The Committee’s terms of reference align with the requirements of the UK Corporate Governance Code. Revised terms of reference for the Committee were introduced with effect from 1 September 2023 to reflect changes to the structure of executive management roles. For the Committee’s terms of reference see www.bat.com/governance+ BAT Annual Report and Form 20-F 2023 Strategic Report Governance Report Financial Statements Other Information Audit, Risk, Internal Control Audit Committee 159
Key Activities in 2023 Regular work programme includes reviewing: – the Group’s annual results, half-year results, the application of accounting standards and the external auditors’ reports where results are audited; – the Group’s external auditors’ year-end audit, including the key audit matters, critical audit matters, assessments of materiality and the Group’s control environment, and confirming the independence of the Group’s external auditors; – the basis of preparation and accounting judgements; – adjusting items, applicable accounting treatments and the use of alternative performance measures; – the annual programme of assessment of goodwill and intangibles impairment; – the steps taken to validate the Group’s ‘going concern’ assessment at half-year and year-end and agreeing on the process and steps taken to determine the Group’s viability statement at year-end; – the Group’s liquidity position, including current facilities and financing needs; – the assessment of Group viability, taking into account its current position and Principal Risks and associated stress- testing analysis, prior to review by the Board; – significant tax matters for the Group, including rate of taxation and external developments that may impact the Group's tax position; – the accounting applicable to post-employment benefits liabilities and assets; – the internal processes followed for the preparation of the Annual Report and Form 20-F and confirming that the processes appropriately facilitated the preparation of an Annual Report and Form 20-F that is ‘fair, balanced and understandable’; – risks to the Group, including the Group risk register, prioritisation and categorisation of Group risks, relevant mitigating factors and emerging risks to the Group (discussed on pages 121 to 128 and 162); – oversight of management’s activities to ensure ongoing compliance with the U.S. Sarbanes-Oxley Act of 2002 (SOx) (discussed on page 168); – the Company’s status as a Foreign Private Issuer for the purposes of U.S. securities laws; – regular reports from the Group Head of Internal Audit on the internal audits of markets, business units, processes, operations and major change initiatives, management responses to internal audit findings and action plans put in place to address any issues raised; – progress against the internal audit plan for 2023 and design of the 2024 internal audit plan; – annual and interim reports on the Group’s Delivery with Integrity compliance programme (discussed on pages 98 to 99), monitoring compliance with the SoBC, and monitoring SoBC incident reporting and the effectiveness of Speak Up channels prior to review by the Board; – the Group’s sustainability performance on an annual basis, including performance against the Group’s sustainability targets, the Group’s responsible marketing and youth access prevention activities (discussed on pages 96 and 97); – external assurance activities conducted in respect of defined sustainability metrics and related information conducted by the external assurance provider and assessing the outcomes of assurance with the external provider; – the outcomes of human rights assessments for countries in which Group companies operate that are identified to have a higher degree of exposure to human rights risks in 2023, including local compliance with Group policies, standards and controls and local measures in place to enhance human rights risk management; – periodic reports from the Group’s Corporate Audit Committee and Regional Audit and Corporate Social Responsibility Committees; – the annual report from the Group Head of Security on security risks, losses and fraud arising during the preceding year; – half-year and year-end reports on the Group’s political contributions (discussed on page 169); and – the Committee's effectiveness, following the annual review of the Committee's performance (discussed on pages 152 to 153). Further specific matters considered by the Committee in relation to the financial statements: – Introduction of organic adjusted diluted EPS as a new non- GAAP measure for remuneration purposes: Following completion of the sale of the Group's businesses in Russia and Belarus, the Committee assessed the impact of non-adjusting events on adjusted diluted EPS and approved the introduction of organic adjusted diluted EPS as a new non-GAAP measure for remuneration purposes (see page 173). Attendance at meetings in 20231 Meeting attendance3,4 Name Member since Attended/Eligible to attend Holly Keller Koeppel2(a),(b) 2017 6/6 Karen Guerra2(a) 2021 6/6 Véronique Laury2(a) 2022 6/6 Darrell Thomas2(a),(b) 2020 6/6 Notes: 1. Meetings: the Committee held six meetings in 2023. Five meetings of the Committee are scheduled for 2024. Additional meetings are convened on an ad hoc basis as required during the year. In June 2023, there was one ad hoc meeting of the Committee to review proposals from candidate firms tendering to conduct the external audit for the 2025 financial year. 2. Membership: (a) all members of the Committee are independent Non-Executive Directors in accordance with the UK Corporate Governance Code 2018 Provisions 10 and 24 and applicable U.S. federal securities laws and NYSE listing standards. The Board has determined each Committee member to meet the financial literacy requirements applicable under NYSE listing standards. Each member of the Committee has recent and relevant financial experience in accordance with the UK Corporate Governance Code 2018. The Committee members as a whole have competence relevant to the sectors the Group operates in; (b) Holly Keller Koeppel and Darrell Thomas are each designated as an audit committee financial expert in accordance with applicable U.S. federal securities laws and NYSE listing standards. 3. The Finance Director attends all Committee meetings but is not a member. Other Directors may attend by invitation. The Director, Legal & General Counsel, the Group Head of Internal Audit and the external auditors generally attend all meetings of the Committee. 4. The Committee meets alone with the external auditors, and, separately with the Group Head of Internal Audit, at the end of every Committee meeting (except for the ad hoc meeting convened in June 2023 to review external audit tender proposals). The Committee also meets periodically with management. BAT Annual Report and Form 20-F 2023 Strategic Report Governance Report Financial Statements Other Information Audit, Risk, Internal Control Audit Committee Continued 160
Significant accounting judgements and estimates considered in relation to the 2023 financial statements: The significant accounting judgements and estimates considered by the Committee in relation to the financial statements for the year ended 31 December 2023 are summarised below. – Changes in the Group - sale of the Group’s businesses in Russia and Belarus: The Committee assessed the accounting treatment applicable to completion of the sale of the Group’s businesses in Russia and Belarus, including the basis for deconsolidation of those businesses from the Group financial statements on completion of the sale, the treatment of the sale as not a discontinued operation and the recognition of impairment charges, foreign exchange charges and associated costs as non-cash adjusting items (see note 6(j) in the Notes on the Accounts). – Significant tax exposures for the Group: The Committee reviewed updates on corporate tax matters and reports from the Group Head of Tax on the status of the Franked Investment Income Group Litigation Order (FII GLO) and developments in various markets, including tax disputes in the Netherlands. The Committee concurred with management’s assessments and disclosures in respect of these tax exposures (see note 10 and note 31, respectively, in the Notes on the Accounts). – Contingent liabilities, provisions and deposits in connection with ongoing litigation: Imperial Tobacco Canada (ITCAN): The Committee continued to monitor the status of the Canadian Companies’ Creditors Arrangement Act (CCAA) proceedings under which Group subsidiary ITCAN filed for protection in 2019 following the judgment of the Quebec Court of Appeal in the Quebec Class Action lawsuits, with stays currently in place until March 2024. The Committee determined it continued to be appropriate to consolidate ITCAN’s financial results in the Group financial statements whilst ITCAN continues to be subject to the CCAA proceedings. The Committee also reassessed the accounting treatment applicable to other ongoing tobacco-related litigation to which ITCAN is a defendant and confirmed that it remained appropriate to make no provision in respect of that litigation, as it is not possible to reasonably estimate the amount of any potential settlement (see note 31 in the Notes on the Accounts). Fox and Kalamazoo Rivers: The Committee reassessed the provision in respect of the Fox River clean-up costs and related legal expenses and confirmed that the provision would continue to be retained at the prior year level, although inherent uncertainties remain (see note 24 in the Notes on the Accounts). The Committee reviewed the position in respect of the Kalamazoo River claim and assessed that no provision should be recognised on the basis set out at note 31 in the Notes on the Accounts. Reynolds American Companies: The Committee endorsed management’s approach to accounting for the Master Settlement Agreement and the Engle class-action and progeny cases as consistent with the prior year (see note 31 in the Notes on the Accounts). DOJ Deferred Prosecution Agreement/OFAC civil settlement agreement: Following the agreement reached with the DOJ and OFAC in April 2023 to resolve previously disclosed investigations into suspicions of sanctions breaches, the Committee assessed recognition of an additional charge to reflect the total amounts payable to U.S. authorities under the settlement arrangements, having previously approved the recognition of a provision in the interim financial statements to 30 June 2022 (see note 31 in the Notes on the Accounts). – Income and receivables related to VAT on social contributions in Brazil: Following the conclusion of claims made by a Group subsidiary related to the calculation of VAT on social contributions made in Brazil, the Committee assessed the accounting treatment applicable to the recovery of tax credits during 2023. The Committee also considered the accounting treatment applicable to further claims relating to the calculation of tobacco excise within social contributions in Brazil and considered it appropriate to recognise the impact of those claims within adjusted income and normal operating profit (see note 17 in the Notes on the Accounts). – Foreign exchange and hyperinflation: As the Group has operations in certain jurisdictions with severe currency restrictions where foreign currency is not readily available, including in hyperinflationary territories such as Venezuela, the Committee reviewed management’s approach to applicable accounting treatment and confirmed that methodologies used to determine relevant exchange rates for accounting purposes were appropriate (see note 1 in the Notes on the Accounts). – Goodwill and intangibles impairment review: The Committee reviewed management’s assessments of the carrying value of intangibles including goodwill (see note 12 in the Notes on the Accounts), with particular focus on: U.S. Business: Following a review of the U.S. combustibles market that recognised the post-COVID-19 performance projections, assumptions related to the potential menthol ban, growth of illicit single-use vapour products and continued macro-economic headwinds, the Committee concluded that it was appropriate to recognise an impairment charge of £23.0 billion in 2023 and to commence amortisation of the U.S. combustibles brands from 1 January 2024, over a period of between 20 and 30 years. The Committee agreed with Management that it was appropriate to assess the future value in use of the combustibles brands over the useful economic lives noted above, as compared to the indefinite- lived perpetuity calculation used in prior periods. The Committee also concluded that, due to the macro-economic headwinds and revised forecasts, an impairment charge to goodwill of £4.3 billion would also be recognised in 2023. Imperial Tobacco Canada (ITCAN): The Committee concluded that in respect of Group subsidiary ITCAN, there was no indication of impairment to goodwill, taking into account the status of ongoing proceedings (including the CCAA process in respect of which there had been no significant developments during the year). South Africa: The Committee concluded that in respect of the Group's South African operation, an impairment charge of £291 million was appropriate due to the lower forecast cash flows as the market has been negatively impacted by higher illicit trade and increased regulation. – Investments in Associates - Organigram Holdings, Inc. (OGI): Following recognition of an impairment charge against the carrying value of the Group’s investment in OGI in 2022, the Committee concluded it was appropriate to recognise an additional impairment against the investment carrying value as a result of further reduction in OGI's market capitalisation. – Adjusting items: The Committee conducted a thorough review of all adjusting items, including amortisation of certain brands, charges related to the completion of the sale of the Group's businesses in Russia and Belarus, the recognition of an additional charge in respect of the settlement arrangements agreed with the DOJ and OFAC and the recognition of a tobacco excise-related social contributions credit in Brazil (see note 7 in the Notes on the Accounts). BAT Annual Report and Form 20-F 2023 Strategic Report Governance Report Financial Statements Other Information 161
Specific risk topics considered by the Committee included: – current and emerging risks in relation to the Group’s digital strategy and technology architecture and data management, with particular focus on digital transformation, cyber security, protection of the Group’s information systems and data, and the approach to managing those risks (discussed further at pages 128 and 163 to 164); – climate change risks and their impact on the Group, including oversight of processes in place to manage physical and transitional climate change risks, and annual reporting on the identification, assessment and management of those risks, in alignment with the TCFD framework (discussed further at pages 102 to 116 and 127); – risks related to ESG and continued integration of ESG risks into the Group’s risk register, complemented by a ESG risk register (discussed below) to ensure appropriate mechanisms are in place for longer-term identification, assessment and continued monitoring of ESG risks and to support the development of sustainability reporting in alignment with the EU Corporate Sustainability Reporting Directive (CSRD) and other recognised international standards; – risks associated with continued exposure to interest rate changes on net finance costs arising from existing, new and refinanced debt and restricted cash in the Group and actions to mitigate those risks (discussed on page 126); – review of the Group's Principal Risks, including identification of cyber security and supply chain disruption as new Principal Risks, and the report on the effectiveness of the Company’s risk management system prior to Board assessment; – revisions to the Group’s risk appetite framework as it relates to the Group’s strategic objectives, and review of emerging risks to the Group twice per year, prior to Board consideration; and – regulatory developments in relation to international sanctions and trade restrictions and updates on the Group's Anti- Financial Crime Procedures, sanctions and supply chain controls and compliance programme. For further information please refer to the Group Principal Risks on pages 121 to 128 and the Group risk factors on pages 353 to 374 + Risk Management and Internal Control Overview The Company maintains its system of risk management and internal control with a view to safeguarding shareholders’ investment and the Company’s assets. It is designed to identify, evaluate and manage risks that may impede the Company’s objectives. It cannot, and is not designed to, eliminate them entirely. This system provides a reasonable, not absolute, assurance against material misstatement or loss. The main features of the risk management processes and system of internal control operated within the Group are described below. These have been in place throughout the year under review and remain in place to date. These do not cover associates of the Group. Risk management Risk registers, based on a standardised methodology, are used as appropriate at Group, functional, above-market, directly-reporting business unit (DRBU) and individual market levels to identify, assess and monitor the risks (both financial and non-financial) faced by the business at each level. Risks are assessed and prioritised at three levels by reference to their residual impact (high/medium/low) and likelihood (probable/possible/unlikely). Mitigation plans are required to be in place to manage the risks identified, and progress against those plans is monitored. The risk registers are reviewed on a regular basis. The SAP Enterprise Risk Management module is used across the Group to record and track risk management activity. This system is subject to ongoing management review to identify opportunities for increased efficiency and effectiveness. Functional and regional risk registers are reviewed biannually by the relevant Regional Audit Committee or the Corporate Audit Committee, as appropriate. DRBU risk registers are reviewed as part of DRBU Risk and Controls meetings. At the Group level, specific responsibility for managing each identified risk is allocated to a member of the Management Board. The Group risk register is reviewed twice yearly by the Group Risk Management Committee, a committee of senior managers chaired by the Finance Director. In addition, it is reviewed annually by the Board and twice yearly by the Committee. The Board and the Committee review changes in the status of identified risks and assess the changes in impact and likelihood. Any delayed mitigations are also presented to the Committee. In addition, the Committee conducts detailed reviews on selected risks, with discussion of those risks at a more granular level with senior managers responsible for managing and mitigating them. Board oversight During the year, the Board considered the nature and extent of Group risks (irrespective of their impact or likelihood) which are material to the Group and the delivery of its strategic objectives (its ‘risk appetite’), and the Group's framework for maintaining sound risk management and internal control systems. As part of the Board's assessment of risks faced by the Group, the Board considered the material climate-related risks and opportunities for the Group (discussed in the context of our TCFD reporting on pages 102 to 116). Climate change and circular economy is maintained as a Principal Risk to the Group, recognising the Group's existing commitments in relation to climate change and circular economy matters and mitigation of associated risks. In 2023, two new risks were identified as Principal Risks to the Group; cyber security, reflecting the heightened risks presented by an evolving cyber-threat environment, increased digital interaction with consumers and changes to the regulatory landscape; and supply chain disruption, taking into account the macro-economic and geopolitical environment and complex nature of the New Categories supply chain. Risk appetite is reviewed annually by the Board to ensure that it is appropriate. Alongside a robust assessment of the Principal Risks and uncertainties facing the Group (including those that would threaten its business model, future performance, solvency, liquidity and viability), the Board also considers emerging risks which may challenge the Group’s ability to achieve its strategic objectives in the future. Each emerging risk is assessed by the Board on its potential impact and likelihood and, where applicable, incorporated into the Group’s risk register with appropriate mitigating activities. Emerging risks are reviewed regularly by the Committee, prior to Board assessment. During the year, the Board maintained close oversight of the Group’s response to critical external uncertainties arising, including the impact of the ongoing conflict in Ukraine. Risks are actively assessed and mitigated at Group, functional, DRBU and market levels, in compliance with international sanctions. The Board and the Committee have monitored the continued integration of ESG-related risks and associated mitigation activities into the Group's risk management framework over the year. ESG-related risks identified through the double materiality assessment conducted in 2022 were mapped and consolidated into a specific ESG risk register, to support consistent management and mitigation of ESG-related risks. The ESG risk register follows the Group's standardised risk methodology, this ensures that each risk is fully assessed and that associated mitigation activities are clearly understood, defined, recorded and reported. ESG-related risks, when rolled up to the Group risk register, form individual drivers and/or impacts to the relevant Group risk in focus. The ESG risk register also supports the business with its sustainability reporting requirements and supports the longer-term quantification of ESG risks. BAT Annual Report and Form 20-F 2023 Strategic Report Governance Report Financial Statements Other Information Audit, Risk, Internal Control Audit Committee Continued 162
With the support of the Committee, the Board conducts an annual review of the effectiveness of the Group’s risk management and internal control systems. This review covers all material controls including financial, operational and compliance controls and risk management systems, with the Committee continuing to have a strong focus on cyber security, sanctions compliance and ESG- related risks. In conducting the oversight responsibilities of the Board and the Committee, both forums meet with senior management during the year to assess key judgements applied. Refer to the Group Principal Risks on pages 121 to 128 and Group risk factors on pages 353 to 379 + Internal controls Group operating companies and other business units are annually required to complete a controls self-assessment, called Control Navigator, of the key controls that they are expected to have in place. Its purpose is to enable them to self-assess their internal control environment, assist them in identifying any controls that may need strengthening and support them in implementing and monitoring action plans to address control weaknesses. The Control Navigator assessment is reviewed annually to ensure that it remains relevant to the business and covers all applicable key controls. In addition, at each year-end, Group operating companies and other business units are required to: – review their system of internal control, confirm whether it remains effective, and report on any specific control deficiencies and the action being taken to address them; and – review and confirm that policies and procedures to promote compliance with the SoBC are fully embedded and identify any material instances of non-compliance. The results of these reviews are reported to the relevant Regional Audit Committees or to the Corporate Audit Committee, and to the Audit Committee, to ensure that appropriate remedial action has been, or will be, taken where necessary. They are also considered by the SOx Steering Committee and the Disclosure Committee in determining management’s opinion on the internal controls over financial reporting (ICFR). Cyber Security Risk Management and Internal Controls Risk management and strategy Cyber security is a critical aspect of the Group’s business operations, as the Group relies on IDT systems and networks to conduct core activities, such as manufacturing, distribution, marketing, customer service, R&D and financial and management reporting, amongst other core activities. The Board recognises that cyber security threats could pose significant risks to the Group’s business, reputation, financial condition and competitive position, and to the safety and privacy of our consumers, employees and other stakeholders. Processes are implemented by the Group to identify, assess and manage material risks from cyber security threats. Cyber security risk assessment and identification processes are integrated into the Group’s overall risk management systems and processes, which are overseen by the Board and implemented by management. The Group implements various processes to manage and mitigate the material risks from cyber security threats, including: – implementing appropriate technical and organisational security measures, such as defensive technologies, encryption, authentication, and backup and recovery systems, to protect the confidentiality, integrity and availability of IDT systems and networks, and the data stored on or transmitted through them; – providing regular training and awareness programmes to Group company employees and contractors on cyber security best practices and procedures, adherence to our SoBC (including cyber security and information security requirements) and other relevant standards; – establishing and enforcing vendor management processes such as due diligence and contractual obligations to ensure that third- party service providers with access to Group IDT systems and networks, or that process or store Group data, adhere to our cyber security requirements and standards; – developing, maintaining and testing thorough incident response and business continuity procedures to ensure that the Group can promptly detect, contain, analyse, report and recover from any potential or actual incidents and minimise their impact on our operations and stakeholders, which procedures would be triggered, as applicable, if any incident were to arise; – engaging external assessors, consultants, auditors and other third parties as appropriate, to support cyber security risk assessment, identification and management processes and to provide independent assurance and recommendations; and – engaging with relevant internal and external stakeholders, such as regulators, law enforcement authorities, customers and other industry stakeholders, on cyber security matters and being prepared to disclose any material cyber security risks or incidents in a timely and transparent manner, in accordance with applicable regulations if such issues were to arise. The Group’s cyber security risk assessment, identification and management processes are regularly reviewed and updated to ensure these remain effective and aligned with our business objectives, regulatory obligations and industry standards. Where applicable, feedback and lessons learned from internal and external audits, assessments and any incidents are taken into account in developing the Group’s cyber security resilience. Cyber security risk management is integrated into, and follows, the Group’s processes for identification of risks to the business as set out on page 162. Risks relating to cyber security are integrated into the Group risk register and are assessed according to the Group’s defined impact and likelihood categories, as described on page 162. Risks to the Group associated with cyber security threats are discussed on pages 128 and 355. Governance and oversight The Board is responsible for the Group's strategy, including oversight of the Group’s IDT and cyber security strategy, and for reviewing the effectiveness of its risk management and internal control systems. On an annual basis, the Board reviews the Group risk register, which incorporates cyber security risks (discussed on pages 128, 162 and 355). In 2023, the Board approved the updated versions of our SoBC and SCoC from 1 January 2024, which both include requirements in relation to cyber security risk management. For more information about the application of the SoBC, see page 98, and page 100 for the application of the SCoC. During the year, the Board also reviewed the Group’s IDT strategy and was briefed on the cyber risk landscape by the Director, Digital & Information and external advisers. Through the Audit Committee’s terms of reference, the Board has delegated certain responsibilities to the Audit Committee, including reviewing the effectiveness of the Group's internal controls and business risk systems to ensure there is due process for the identification and management of key business risks and for monitoring the effectiveness of operational controls, reviewing the Group risk register and emerging risks, and monitoring procedures and controls for safeguarding assets including cyber security controls. The Audit Committee reviews the Group risk register twice a year and is briefed periodically on the cyber risk landscape and Group cyber resilience by the Group Chief Information Security Officer (CISO) (reporting to the Director, Digital & Information). The Audit Committee receives reports from the Corporate Audit Committee, which monitors the effectiveness of risk management and internal controls across the Group’s functions and oversees the Group’s cyber security risk management framework. The Corporate Audit Committee receives quarterly reports from the Group CISO on current and emerging cyber security threats to the Group, measures taken to prevent, detect and respond to those threats and efficacy of cyber security controls and incident response plans. BAT Annual Report and Form 20-F 2023 Strategic Report Governance Report Financial Statements Other Information 163
The Group maintains a dedicated cyber security team, led by the Group CISO, responsible for developing and implementing the Group’s cyber security strategy, standards and procedures, including to address any material incident that might arise. The Group's cyber security team has appropriate professional expertise, knowledge and experience in the field, including to identify, assess and manage cyber security risks, maintain appropriate security monitoring, incident response and business continuity procedures, and to implement those should an incident arise. All senior members of the cyber security team, including the Group CISO, hold industry certifications relevant for their roles and responsibilities, for example CISSP (Certified Information Systems Security Professional) or CISM (Certified Information Security Manager), relevant SANS certifications in cyber defence teams (such as Certified Incident Handler, Continuous Monitoring Certification, Certified Forensic Analyst), CRISC (Certified in Risk and Information Systems Control), CISA (Certified Information Systems Auditor) and/or CGEIT in governance, risk and compliance teams (Certified in the Governance of Enterprise IT). All members of the cyber security team have prior industry experience relevant to their current position. The Group CISO has over 20 years of information security experience having held multiple roles in industry, most recently as CISO for GSK’s Pharmaceutical, Supply Chain and R&D divisions prior to joining the Group. The Group's cyber security team monitors and evaluates the evolving cyber security threat landscape and conducts periodic assessments of the Group’s IDT systems and networks, using various tools including vulnerability scans, penetration tests and audits, to identify and prioritise potential cyber security risks and vulnerabilities. Key outcomes of assessments and incident summaries are reported to the Director, Digital & Information, and periodically to the Audit Committee, along with recommendations for mitigating or remedying any identified risks. Any material cyber security incidents would also be reported to the Audit Committee in accordance with the Group’s incident response procedures, should any such incident arise. Internal Audit function The Group’s Internal Audit function is responsible for carrying out risk-based audits of Group companies, business units, factories, global processes and major change initiatives. A separate Business Controls Team provides advice and guidance on controls to the Group’s business units. The purpose, authority and responsibilities of the Group’s Internal Audit function are defined by the Committee through the Group’s Internal Audit Charter, which is reviewed by the Committee and refreshed on a three-year cycle. The Committee reviews the effectiveness of the Group’s internal audit function annually, supported by an effectiveness review conducted periodically by an independent third party (with the last external effectiveness review conducted in 2019). The Committee considers the Internal Audit function to be effective and to have the necessary resources to fulfil its mandate. 2023 Internal Audit Plan The Group’s Internal Audit function works to a rolling audit plan, prioritising risk areas aligned to the Group’s risk register. During 2023, progress against the Internal Audit plan was regularly reviewed with the Committee to enable monitoring of the ongoing effectiveness of audit work, with flexibility to augment coverage of internal audits in response to emerging risks where appropriate. In 2023, internal audits covered various markets and business units, manufacturing facilities and Leaf Operations in a range of locations and a balanced cross-section of other business activities mapped to the Group risk register, including digital infrastructure and cyber security threat detection; supply chain, route to market and IT efficiency programmes; responsible marketing and data privacy controls; and sanctions compliance procedures. Audits were conducted through balanced use of on-site and remote auditing, combining the benefits of local fieldwork and full scope coverage. Enhanced use of data analytics was embedded into audit assignments during the year to optimise efficiency, effectiveness and coverage of audits, and to deliver more insightful assurance to business units. The Committee reviews regular summary reports provided by the Group Head of Internal Audit in respect of internal audits conducted during the year and findings from those audits, together with management feedback and agreed action plans established where areas for improvement are identified. The scope of each internal audit is assessed for SOx impact and audit of applicable SOx controls is included where relevant. Reviews of SOx controls and their effectiveness are primarily conducted by the Group’s Business Controls Team. Assurance is also undertaken by the Group’s external auditors, as referred to on page 168. 2024 Internal Audit Plan The Committee has approved the 2024 Internal Audit plan and assessed its alignment with the Group’s risk register to ensure robust coverage of Group risks and balanced coverage of Group activities (measured by value and volume). The design of the 2024 Internal Audit plan anticipates broader use of Internal Audit's catalogue of data analytics developed in 2023 and retains an appropriate combination of remote fieldwork and focused site visits. The plan also takes account of assurance provided by second line of defence functions, including the Group's Business Controls, Security and Business Integrity & Compliance teams. The scope of the 2024 Internal Audit plan continues to be risk- focused, reflecting the Group’s risk register and identified emerging risks. Emphasis will be placed on cyber security infrastructure, sustainability data management, sanctions and other regulatory compliance procedures and responsible marketing controls, alongside thorough coverage of core business activities, lines of defence and IT infrastructure and controls. Regional and Corporate Audit Committee framework The Group’s Regional Audit Committee framework underpins the Audit Committee. It provides a flexible channel for the structured flow of information through the Group, with committees for each of the Group's regions and for locally-listed Group entities and specific markets where appropriate. The Regional Audit Committees are supported by Risk and Control Committees established at business unit level, and within certain Group functions where applicable. This framework ensures that significant financial, social, environmental, governance and reputational risks faced by the Group are appropriately managed and that any failings or weaknesses are identified so that remedial action may be taken. The Group’s Regional Audit Committees are chaired by the Chief Executive or the Finance Director, comprise members of the Management Board and regularly attended by one or more Non-Executive Directors. The Corporate Audit Committee focuses on the Group’s risks and control environment that fall outside the regional committees’ remit, such as central functions, and global programmes, processes and projects. It comprises members of the Management Board and is chaired by a Regional Director. One or more of the Non‑Executive Directors also regularly attend meetings of the Corporate Audit Committee. External and internal auditors attend meetings of these committees and have private audiences with members of the committees after meetings as needed. Additionally, central, regional and individual market management, along with Internal Audit, support the Board in its role of ensuring a sound control environment. Annual review The Financial Reporting Council’s ‘Guidance on Risk Management, Internal Control and Related Financial and Business Reporting’ provides guidance in relation to issues of risk and internal control management and related reporting. The Group's risk management and internal control processes, and the reports these give rise to, enable the Board and the Audit Committee to monitor risk and internal control management on a continuing basis throughout the year and to review its effectiveness at the year-end. The Board, with advice from the Committee, has completed its annual review of the effectiveness of that system for 2023.The Board is satisfied that the Group's system of risk and internal control management accords
with the UK Corporate Governance Code and satisfies the requirements for internal controls over financial reporting. BAT Annual Report and Form 20-F 2023 Strategic Report Governance Report Financial Statements Other Information Audit, Risk, Internal Control Audit Committee Continued 164
External Auditors The Committee, on behalf of the Board, is responsible for the relationship with the external auditors. KPMG LLP (KPMG) were appointed as the Company’s auditors with effect from 23 March 2015, following a competitive tender process carried out in 2015. During 2023, the Committee conducted a formal tender process in respect of the external audit for the 2025 financial year, this is discussed further on pages 159 and 167. The external auditors report to the Committee in depth on the work programme, scope and outcomes of the annual audit, including their procedures in relation to internal controls over financial reporting. There is regular and open communication between the Committee and the external auditors and with management. The Committee reviews and discusses the external audit plan and the external auditors’ assessments of management's proposed treatment of significant transactions and accounting judgements, inviting challenge and giving due consideration to points raised by the external auditors. During the year, the Committee also met independently with the external audit partner after every Committee meeting (with the exception of the ad hoc meeting convened in June 2023 to review the external audit tender proposals from candidate firms). Outside of Committee meetings, the Committee Chair, the Finance Director, the Director, Legal & General Counsel, the Group Head of Internal Audit and the Company Secretary all meet with the external auditors regularly throughout the year to discuss relevant issues and the progress of the external audit. Any significant issues are also included on the Committee’s agenda. More broadly, access to personnel and records across the Group is facilitated as required to enable the external auditors to conduct the external audit. External auditor effectiveness The Committee carries out an annual assessment of the external auditors, including their expertise, qualification and resources, their objectivity and independence, and the quality and effectiveness of the audit process. This assessment takes into account the Committee’s interactions with, and observations of, the external auditors and a range of other factors, including: – experience and expertise of the external auditors in their communications with the Committee; – their mindset, objectivity and approach to challenging management’s assumptions and judgements where necessary; – the effectiveness and efficiency of the external auditors in completing the agreed external audit plan and whether that plan has been met; – their approach to handling significant audit and accounting judgements; – content, quality and robustness of the external auditors’ reports; – the Committee's review of the content of the external auditors' management letter, and other communications with the Committee, to assess their understanding of the business and whether recommendations have been acted on (or if not, the reasons why not acted on); – provision by the external auditors of non-audit services, discussed below, and other matters that may impact on their independence; and – relevant reviews and reports issued by external regulatory bodies, including the FRC and the PCAOB. The Committee’s assessment is further informed by feedback from the Group's Internal Audit function and from a survey completed by members of the Group’s senior management to obtain their perspectives on the effectiveness and quality of the external auditors’ work. Audit Committees and the External Audit Minimum Standard The Company and its Audit Committee apply the 'Audit Committees and the External Audit: Minimum Standard' (Standard), published by the FRC in May 2023. This Annual Report and Form 20-F, and particularly this Audit Committee report, sets out how the Standard has been applied during the year. Pages noted below refer to specific discussion relevant to the application of the Standard in this Annual Report and Form 20-F. Responsibilities The Committee's responsibilities are set out in its terms of reference, available at www.bat.com/governance. An overview of the Committee's responsibilities is provided at page 159 and the Committee's work programme for the year is discussed at page 160. The Chair of the Committee provides a briefing to the Board following each Committee meeting covering the Committee's activities, including how it has undertaken its responsibilities in relation to the external audit. The annual investor engagement programme provides a range of opportunities for shareholders to engage with the Company on governance topics, including the scope of the external audit. The Chair and other members of the Committee are available to meet with major shareholders on request. There were no requests from shareholders in 2023 for any specific matters to be covered in the audit. Tendering How the Committee has carried out its responsibilities in relation to the external audit tender process for the 2025 financial year is discussed on page 167, with details of the criteria used to make the selection and the process followed. All members of the Committee were involved throughout the external audit tender process conducted during the year. Oversight of auditors and audit The Committee is responsible for overseeing and assessing the external audit and the external auditors. The Committee's approach to reviewing the effectiveness of the external audit process and the external auditors' independence and objectivity is discussed at page 165. The Group maintains an Auditor Independence Policy set out at page 166 and its application is overseen by the Committee. The Committee has reviewed the FRC's audit quality inspection and supervision report issued in respect of KPMG in July 2023 and has discussed the findings of that report with the External Audit Partner. Reporting The work of the Committee during the year is set out in the Audit Committee's report, including significant issues that the Committee considered in relation to the financial statements at page 161. An explanation of the application of the Group's accounting policies is provided in the Notes on the Accounts at pages 215 to 219. Information about the FRC's review of the Company's Annual Report and Accounts to 31 December 2022 is set out on page 168. There were no other regulatory inspections in relation to the Company's financial statements or audit for financial year 2022. Information about the limited scope review of the Company's Annual Report and Accounts to 31 December 2021 conducted by the FRC is provided in the Annual Report and Form 20-F for 2022. The external auditors provided certain non-audit services to the Group during the year and information on how auditor independence and objectivity are safeguarded is provided on pages 165 and 166. BAT Annual Report and Form 20-F 2023 Strategic Report Governance Report Financial Statements Other Information 165
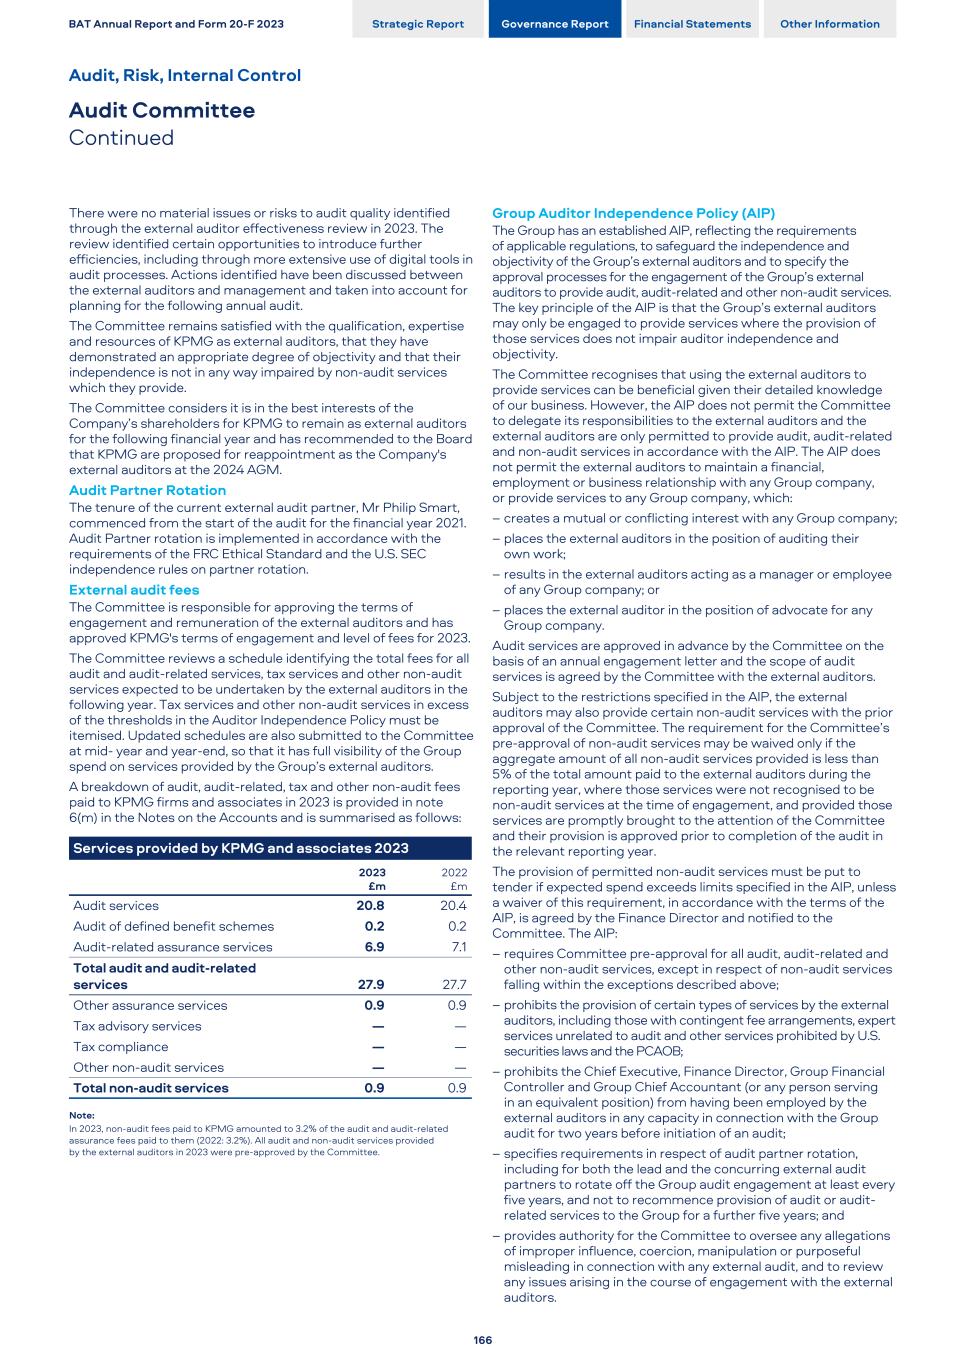
There were no material issues or risks to audit quality identified through the external auditor effectiveness review in 2023. The review identified certain opportunities to introduce further efficiencies, including through more extensive use of digital tools in audit processes. Actions identified have been discussed between the external auditors and management and taken into account for planning for the following annual audit. The Committee remains satisfied with the qualification, expertise and resources of KPMG as external auditors, that they have demonstrated an appropriate degree of objectivity and that their independence is not in any way impaired by non-audit services which they provide. The Committee considers it is in the best interests of the Company’s shareholders for KPMG to remain as external auditors for the following financial year and has recommended to the Board that KPMG are proposed for reappointment as the Company's external auditors at the 2024 AGM. Audit Partner Rotation The tenure of the current external audit partner, Mr Philip Smart, commenced from the start of the audit for the financial year 2021. Audit Partner rotation is implemented in accordance with the requirements of the FRC Ethical Standard and the U.S. SEC independence rules on partner rotation. External audit fees The Committee is responsible for approving the terms of engagement and remuneration of the external auditors and has approved KPMG's terms of engagement and level of fees for 2023. The Committee reviews a schedule identifying the total fees for all audit and audit-related services, tax services and other non-audit services expected to be undertaken by the external auditors in the following year. Tax services and other non-audit services in excess of the thresholds in the Auditor Independence Policy must be itemised. Updated schedules are also submitted to the Committee at mid- year and year-end, so that it has full visibility of the Group spend on services provided by the Group’s external auditors. A breakdown of audit, audit-related, tax and other non-audit fees paid to KPMG firms and associates in 2023 is provided in note 6(m) in the Notes on the Accounts and is summarised as follows: Services provided by KPMG and associates 2023 2023 £m 2022 £m Audit services 20.8 20.4 Audit of defined benefit schemes 0.2 0.2 Audit-related assurance services 6.9 7.1 Total audit and audit-related services 27.9 27.7 Other assurance services 0.9 0.9 Tax advisory services — — Tax compliance — — Other non-audit services — — Total non-audit services 0.9 0.9 Note: In 2023, non-audit fees paid to KPMG amounted to 3.2% of the audit and audit‑related assurance fees paid to them (2022: 3.2%). All audit and non-audit services provided by the external auditors in 2023 were pre-approved by the Committee. Group Auditor Independence Policy (AIP) The Group has an established AIP, reflecting the requirements of applicable regulations, to safeguard the independence and objectivity of the Group’s external auditors and to specify the approval processes for the engagement of the Group’s external auditors to provide audit, audit-related and other non-audit services. The key principle of the AIP is that the Group’s external auditors may only be engaged to provide services where the provision of those services does not impair auditor independence and objectivity. The Committee recognises that using the external auditors to provide services can be beneficial given their detailed knowledge of our business. However, the AIP does not permit the Committee to delegate its responsibilities to the external auditors and the external auditors are only permitted to provide audit, audit-related and non-audit services in accordance with the AIP. The AIP does not permit the external auditors to maintain a financial, employment or business relationship with any Group company, or provide services to any Group company, which: – creates a mutual or conflicting interest with any Group company; – places the external auditors in the position of auditing their own work; – results in the external auditors acting as a manager or employee of any Group company; or – places the external auditor in the position of advocate for any Group company. Audit services are approved in advance by the Committee on the basis of an annual engagement letter and the scope of audit services is agreed by the Committee with the external auditors. Subject to the restrictions specified in the AIP, the external auditors may also provide certain non-audit services with the prior approval of the Committee. The requirement for the Committee’s pre-approval of non-audit services may be waived only if the aggregate amount of all non-audit services provided is less than 5% of the total amount paid to the external auditors during the reporting year, where those services were not recognised to be non-audit services at the time of engagement, and provided those services are promptly brought to the attention of the Committee and their provision is approved prior to completion of the audit in the relevant reporting year. The provision of permitted non-audit services must be put to tender if expected spend exceeds limits specified in the AIP, unless a waiver of this requirement, in accordance with the terms of the AIP, is agreed by the Finance Director and notified to the Committee. The AIP: – requires Committee pre-approval for all audit, audit-related and other non-audit services, except in respect of non-audit services falling within the exceptions described above; – prohibits the provision of certain types of services by the external auditors, including those with contingent fee arrangements, expert services unrelated to audit and other services prohibited by U.S. securities laws and the PCAOB; – prohibits the Chief Executive, Finance Director, Group Financial Controller and Group Chief Accountant (or any person serving in an equivalent position) from having been employed by the external auditors in any capacity in connection with the Group audit for two years before initiation of an audit; – specifies requirements in respect of audit partner rotation, including for both the lead and the concurring external audit partners to rotate off the Group audit engagement at least every five years, and not to recommence provision of audit or audit- related services to the Group for a further five years; and – provides authority for the Committee to oversee any allegations of improper influence, coercion, manipulation or purposeful misleading in connection with any external audit, and to review any issues arising in the course of engagement with the external auditors. BAT Annual Report and Form 20-F 2023 Strategic Report Governance Report Financial Statements Other Information Audit, Risk, Internal Control Audit Committee Continued 166
Spotlight External auditor tender for financial year 2025 As part of the Company’s Full-Year 2022 Preliminary Announcement issued in February 2023, it was announced that the Committee had commenced planning for a competitive tender process in respect of the external audit for the 2025 financial year, in compliance with applicable regulations. In 2023, the Committee led a thorough competitive tender process, supported by the Group Head of Internal Audit and other members of senior management, taking into account the FRC’s guidelines on audit tenders throughout the process. The timetable for the tender process was designed to permit sufficient time to enable any new auditor firm to fully prepare to assume responsibility for a complex, international audit across the Group and to plan for an orderly transition of non-audit services if there were to be a change of auditor. This approach facilitated engagement with the widest available range of potential candidate firms. The overarching objective of the tender process was to appoint the firm that would provide the highest quality, most effective and efficient audit. Objective decision criteria were set by the Committee, designed to support this overarching objective. Overview: Qualitative decision criteria Audit quality – Technical expertise, experience and effectiveness of the firm and proposed team, including geographical coverage and capabilities; quality methodology; approach to SOx procedures. – Approach to achieving (where applicable) and maintaining independence. – Future capability to deliver the external audit in the context of evolving regulatory frameworks, particularly in relation to internal controls, sustainability and cyber security. – Audit quality indicators, auditor quality record, regulator findings and actions taken in response. Audit effectiveness – Capabilities in areas of the audit requiring the exercise of judgement. – Audit methodology, review processes and approach to interactions with technical review teams. – Approach to effective use of technology and data analytics in the audit. – Experience in transitioning comparable audits. Audit efficiency – Experience of driving audit efficiencies, including through the use of technology and data analytics. – Knowledge sharing capabilities within the firm and across financial years. – Approach to evolving the scope, process and efficiency of the audit over a projected 10-year plan. Fees – Whilst not a significant aspect of the decision criteria, audit fee proposals formed part of the request for proposal, including transparency of cost drivers and opportunities for cost efficiencies. Selection process The Committee gave careful consideration to the potential candidate firms that would be invited to tender. As part of this initial stage of the process, the Committee Chair held meetings with a range of Audit Partners from potential candidate firms, supported by the Finance Director and the Group Head of Internal Audit, to assess interest and capability to tender for the audit with focus on geographical coverage, capability and resources to conduct a complex and international audit. At this stage in the process, due consideration was given to the capabilities of mid-tier firms to conduct the external audit. Following review, the Committee gave approval for a request for proposal to be issued to the shortlisted candidate firms that were eligible to tender. The request for proposal was issued to candidate firms in March 2023, including full details of the objective selection criteria to be applied by the Committee. To ensure that every candidate firm received sufficient information about the Group to adequately inform their tender proposal, each firm then attended a series of meetings, including with members of the Committee and with representatives of senior management, to discuss key topics and markets. To supplement these briefing meetings, the firms were provided with equal access to a broad range of information about the Group and the scope of its audit requirements through a data room. The Committee reviewed the tender proposals from each of the candidate firms and considered the findings of recent FRC reports on audit quality and quality indicators in respect of each candidate firm. The Committee met in June 2023 to receive presentations from each firm, led by the proposed Audit Partner. All members of the Committee attended that meeting, all other members of the Board were also invited to attend. Committee recommendation Following thorough review of each of the candidate firms’ proposals and presentations, the Committee was satisfied that each firm had fully participated in the tender process, had demonstrated the capability, geographical reach and capacity to act as the external auditor and, where applicable, would be able to demonstrate independence within required timeframes if selected. Accordingly, the Committee made its selection on the basis of its assessment of the relative abilities of each of the candidate firms to deliver against the objective decision criteria. At the Board meeting in July 2023 the Committee recommended two of the candidate firms to the Board, with the Committee’s preference to appoint KPMG and supporting justifications. The Committee’s recommendation was accepted by the Board and a resolution proposing the appointment of KPMG as the external auditor for financial year 2025 will be put forward to shareholders for approval at the 2025 AGM, as previously announced in the Company's Half-Year report to 30 June 2023. UK Competition and Markets Authority Audit Order The Company has complied with the Statutory Audit Services Order issued by the UK Competition and Markets Authority for the financial year ended 31 December 2023. BAT Annual Report and Form 20-F 2023 Strategic Report Governance Report Financial Statements Other Information 167
Financial reporting controls The Group maintains a series of policies, practices and controls in relation to the financial reporting and consolidation process, designed to address key financial reporting risks, including risks arising from changes in the business or accounting standards and to provide assurance of the completeness and accuracy of the Annual Report and Form 20-F. A key area of focus is to assess whether the Annual Report and Form 20-F and financial statements are ‘fair, balanced and understandable’ in accordance with the UK Corporate Governance Code, with particular regard to: – Fair: Consistency of reporting between the financial statements and narrative reporting of Group performance and coverage of an overall picture of the Group’s performance; – Balanced: Consistency of narrative reporting of significant accounting judgements and key matters considered by the Committee with disclosures of material judgements and uncertainties noted in the financial statements; appropriate use, prominence and explanation of primary and adjusted performance measures; and – Understandable: Clarity and structure of the Annual Report and Form 20-F and financial statements, appropriate emphasis of key messages, and use of succinct and focused narrative with strong linkage throughout the report, to provide shareholders with the information needed to assess the Group’s business, performance, strategy and financial position. The Group Manual of Accounting Policies and Procedures sets out the Group accounting policies, its treatment of transactions and its internal reporting requirements. The internal reporting of financial information to prepare the Group’s annual and half-year financial statements is signed off by the heads of finance responsible for the Group’s markets and business units. The heads of finance responsible for the Group’s markets and all senior managers must also confirm annually that all information relevant to the Group audit has been provided to the Directors and that reasonable steps have been taken to ensure full disclosure in response to requests for information from the external auditors. The Committee Chair participated in the 2023 Annual Report and Form 20-F drafting and review processes, and engaged with the Finance Director and the Group Head of Internal Audit during the drafting process. FRC review of the Company's Annual Report and Accounts to 31 December 2022 The FRC carried out a review of the Company's Annual Report and Accounts for the year ended 31 December 2022. The FRC's correspondence with the Company in 2023 raised several queries in respect of goodwill impairment analysis, the approach to impairment of former Group businesses in Russia and Belarus and the presentation of derivatives cash flow. This review was concluded in 2023. The outcomes of the UK FRC's review were reviewed by the Committee and have been taken into account in the preparation of this Annual Report and Form 20-F for 2023, with a number of enhanced disclosures including in relation to the Group's viability statement to provide users with greater insight as to potential impacts on the Group's future operations. The review conducted by the FRC was based solely on the Company's Annual Report and Accounts to 31 December 2022. The FRC's review does not provide any assurance that the Company's Annual Report and Accounts to 31 December 2022 are correct in all material respects; the FRC's role is to consider compliance with reporting requirements, not to verify the information provided. SOx compliance oversight The Company is subject to certain rules and regulations of U.S. securities laws, including the U.S. Securities Exchange Act 1934 and SOx. SOx places specific responsibility on the Chief Executive and Finance Director to certify or disclose information applicable to the financial statements, disclosure controls and procedures (DCP) and internal controls over financial reporting (ICFR). This includes our Chief Executive and Finance Director giving attestations in respect of ICFR effectiveness under §404 of SOx. The Committee has oversight of processes established to ensure full and ongoing compliance with applicable U.S. securities laws, including SOx. Two committees provided assurance during 2023 with regard to applicable SOx certifications. The Disclosure Committee reviews the Company’s financial statements for appropriate disclosure, designs and maintains DCPs, and reports to, and is subject to the oversight of, the Chief Executive and the Finance Director. A sub-committee of the Disclosure Committee, the SOx Steering Committee, provides assurance that ICFR have been designed, and are being operated, implemented, evaluated and disclosed appropriately, in accordance with applicable requirements and subject to the oversight of the Chief Executive and Finance Director. The activities of this sub-committee are directly reported to the Disclosure Committee. The outputs from the Disclosure Committee and SOx Steering Committee were presented to and reviewed by the Committee. No material weaknesses were identified and the Committee is satisfied that, where areas for improvement were identified, processes are in place to ensure that remedial action is taken and progress is monitored. In 2023, the Committee also reviewed the scope of the external auditors’ SOx procedures, and received reports on their progress with their independent assessment of ICFR across the Group. BAT Annual Report and Form 20-F 2023 Strategic Report Governance Report Financial Statements Other Information Audit, Risk, Internal Control Audit Committee Continued 168
Group Standards of Business Conduct The SoBC requires all staff to act with a high degree of business integrity, comply with applicable laws and regulations, and ensure that standards are never compromised for the sake of results. All Group companies have adopted the SoBC or local equivalent. Every Group company and all staff worldwide, including senior management and the Board, are expected to adhere to the SoBC or local equivalent. The SoBC and the Group’s Delivery with Integrity compliance programme are discussed on pages 98 to 99. The Committee is responsible for monitoring compliance with the SoBC, and reports on this to the Board. Information on compliance with the SoBC is gathered at a regional and global level and reports of SoBC allegations, including details of the channels through which allegations are reported, are provided on a regular basis to the Regional Audit Committees, Corporate Audit Committee, and to the Committee. A breakdown of SoBC contacts and SoBC allegations reported across the Group in 2023 is set out on page 98. The SoBC and information on the total number of SoBC contacts and SoBC allegations reported in 2023 (including established breaches) is available at bat.com/sobc + Speak Up The Group maintains Speak Up channels which enable concerns regarding SoBC compliance matters, including concerns about possible improprieties in financial reporting, to be raised in confidence (and anonymously should an individual wish) without fear of reprisal. The SoBC includes the Group’s Speak Up policy, which is supplemented by local procedures throughout the Group that provide staff with further guidance on reporting matters and raising concerns, and the channels through which they can do so. The Board periodically reviews the Group’s Speak Up policy and reports arising from Speak Up channels. The Speak Up policy was revised with effect from 1 January 2024 and introduced as part of the revised SoBC (discussed on pages 98 and 148). The Board is satisfied that the Group’s Speak Up policy and procedures enable proportionate and independent investigation of matters raised, and ensure that appropriate follow-up action is taken. Read more about Speak Up channels and Speak Up reports on page 98 and 149+ Code of Ethics for the Chief Executive and Senior Financial Officers The Company has adopted a Code of Ethics applicable to the Chief Executive, the Finance Director, and other senior financial officers, as required by U.S. securities laws and NYSE listing standards. No waivers or exceptions to the Code of Ethics were granted in 2023. Political contributions The Group does not make contributions to UK political organisations or incur UK political expenditure. The total amount of political contributions made to non-UK political parties in 2023 was £6,044,775 (2022: £4,576,059) as follows: Reynolds American Companies reported political contributions totalling £6,044,775 (US$7,519,700) for the full year 2023 to U.S. political organisations and to non-federal-level political party and candidate committees in accordance with their contributions programme. No corporate contributions were made to federal candidates or party committees and all contributions were made in accordance with applicable laws. All political contributions made by Reynolds American Companies are assessed and approved in accordance with Reynolds American’s policies and procedures to ensure appropriate oversight and compliance with applicable laws. In accordance with the U.S. Federal Election Campaign Act, Reynolds American Companies continue to support an employee- operated Political Action Committee (PAC), a non-partisan committee registered with the U.S. Federal Election Commission that facilitates voluntary political donations by eligible employees of Reynolds American Companies. According to U.S. federal finance laws, the PAC is a separate segregated fund and is controlled by a governing board of individual employee-members of the PAC. In 2023, Reynolds American Companies incurred expenses, as authorised by U.S. law, in providing administrative support to the PAC. No other political contributions were reported. BAT Annual Report and Form 20-F 2023 Strategic Report Governance Report Financial Statements Other Information 169
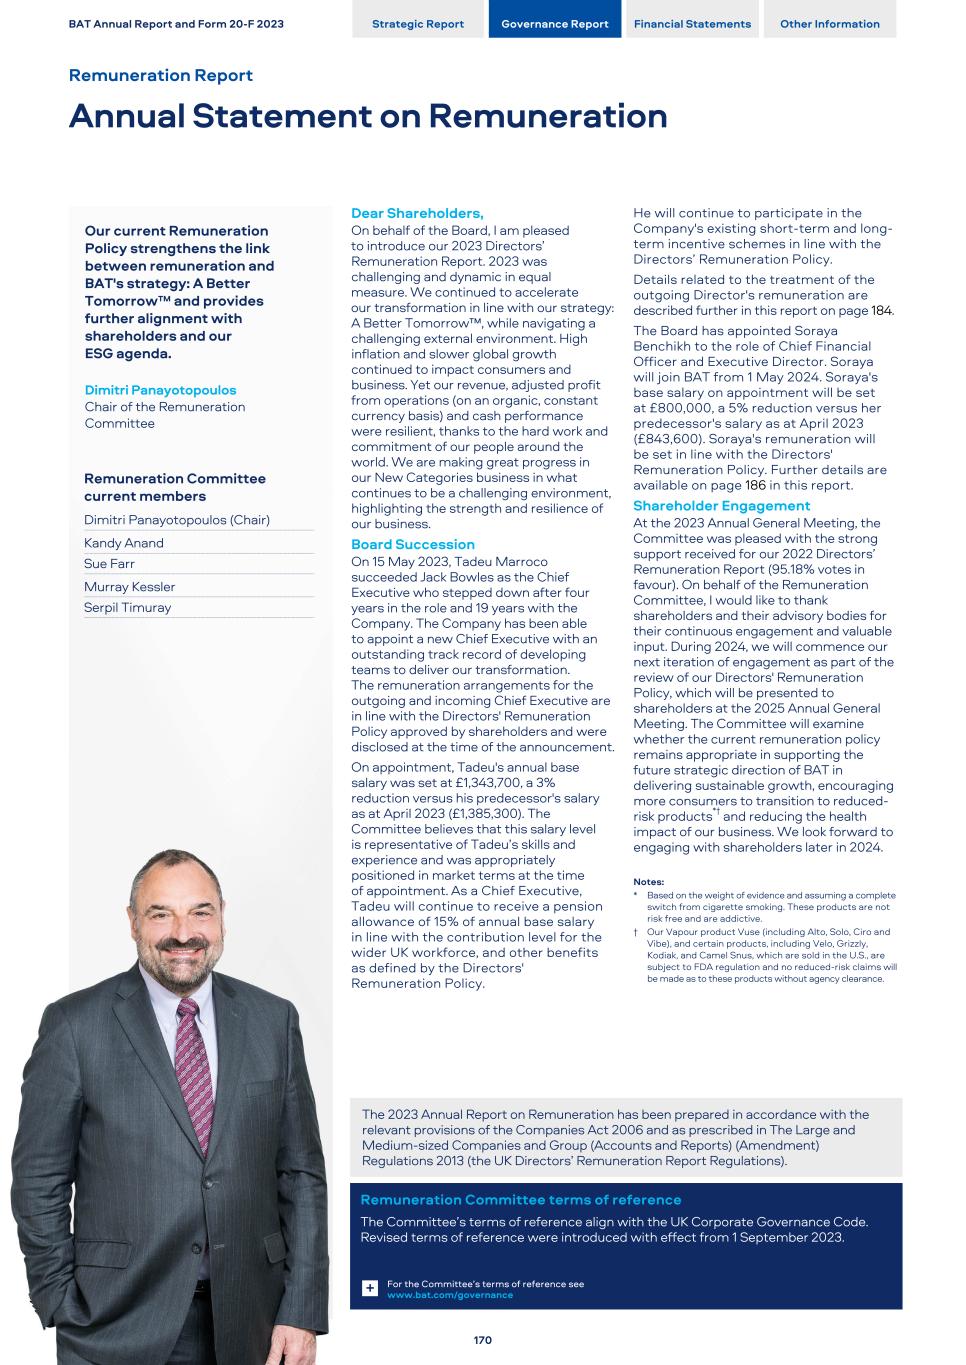
Our current Remuneration Policy strengthens the link between remuneration and BAT's strategy: A Better Tomorrow™ and provides further alignment with shareholders and our ESG agenda. Dimitri Panayotopoulos Chair of the Remuneration Committee Remuneration Committee current members Dimitri Panayotopoulos (Chair) Kandy Anand Sue Farr Murray Kessler Serpil Timuray Dear Shareholders, On behalf of the Board, I am pleased to introduce our 2023 Directors’ Remuneration Report. 2023 was challenging and dynamic in equal measure. We continued to accelerate our transformation in line with our strategy: A Better Tomorrow™, while navigating a challenging external environment. High inflation and slower global growth continued to impact consumers and business. Yet our revenue, adjusted profit from operations (on an organic, constant currency basis) and cash performance were resilient, thanks to the hard work and commitment of our people around the world. We are making great progress in our New Categories business in what continues to be a challenging environment, highlighting the strength and resilience of our business. Board Succession On 15 May 2023, Tadeu Marroco succeeded Jack Bowles as the Chief Executive who stepped down after four years in the role and 19 years with the Company. The Company has been able to appoint a new Chief Executive with an outstanding track record of developing teams to deliver our transformation. The remuneration arrangements for the outgoing and incoming Chief Executive are in line with the Directors' Remuneration Policy approved by shareholders and were disclosed at the time of the announcement. On appointment, Tadeu's annual base salary was set at £1,343,700, a 3% reduction versus his predecessor's salary as at April 2023 (£1,385,300). The Committee believes that this salary level is representative of Tadeu’s skills and experience and was appropriately positioned in market terms at the time of appointment. As a Chief Executive, Tadeu will continue to receive a pension allowance of 15% of annual base salary in line with the contribution level for the wider UK workforce, and other benefits as defined by the Directors' Remuneration Policy. He will continue to participate in the Company's existing short-term and long- term incentive schemes in line with the Directors’ Remuneration Policy. Details related to the treatment of the outgoing Director's remuneration are described further in this report on page 184. The Board has appointed Soraya Benchikh to the role of Chief Financial Officer and Executive Director. Soraya will join BAT from 1 May 2024. Soraya's base salary on appointment will be set at £800,000, a 5% reduction versus her predecessor's salary as at April 2023 (£843,600). Soraya's remuneration will be set in line with the Directors' Remuneration Policy. Further details are available on page 186 in this report. Shareholder Engagement At the 2023 Annual General Meeting, the Committee was pleased with the strong support received for our 2022 Directors’ Remuneration Report (95.18% votes in favour). On behalf of the Remuneration Committee, I would like to thank shareholders and their advisory bodies for their continuous engagement and valuable input. During 2024, we will commence our next iteration of engagement as part of the review of our Directors' Remuneration Policy, which will be presented to shareholders at the 2025 Annual General Meeting. The Committee will examine whether the current remuneration policy remains appropriate in supporting the future strategic direction of BAT in delivering sustainable growth, encouraging more consumers to transition to reduced- risk products*† and reducing the health impact of our business. We look forward to engaging with shareholders later in 2024. Notes: * Based on the weight of evidence and assuming a complete switch from cigarette smoking. These products are not risk free and are addictive. † Our Vapour product Vuse (including Alto, Solo, Ciro and Vibe), and certain products, including Velo, Grizzly, Kodiak, and Camel Snus, which are sold in the U.S., are subject to FDA regulation and no reduced-risk claims will be made as to these products without agency clearance. The 2023 Annual Report on Remuneration has been prepared in accordance with the relevant provisions of the Companies Act 2006 and as prescribed in The Large and Medium-sized Companies and Group (Accounts and Reports) (Amendment) Regulations 2013 (the UK Directors’ Remuneration Report Regulations). Remuneration Committee terms of reference The Committee’s terms of reference align with the UK Corporate Governance Code. Revised terms of reference were introduced with effect from 1 September 2023. For the Committee’s terms of reference see www.bat.com/governance+ BAT Annual Report and Form 20-F 2023 Strategic Report Governance Report Financial Statements Other Information Remuneration Report Annual Statement on Remuneration 170
Remuneration Policy and ESG Our Remuneration Policy has strong links with BAT's strategy, A Better Tomorrow™, providing close alignment with our ESG agenda and shareholders’ interests. We have put ESG at the heart of our strategy and corporate purpose by delivering sustainable growth, encouraging more consumers to transition to reduced-risk products*† and reducing the health impact of our business. Our current Directors’ Remuneration Policy firmly embeds ESG into our Executive Directors’ remuneration through New Category performance measures which directly support our strategic aim to Build a Smokeless World. Tobacco Harm Reduction is a key component of our ESG strategy and is identified in BAT’s 2023 Double Materiality Assessment (page 74) as having the greatest outward impact on society and the environment, the greatest inward impact on BAT, and the greatest financial materiality. Pay outcomes under the Short-Term Incentive (STI) and vesting outcomes from the Long-Term Incentive (LTI) awards granted from 2022 onwards provide a direct link between our strategy and ESG agenda and executive remuneration through the following measures: New Categories revenue growth and New Categories contribution. It is our intention to continue to review the alignment of executive pay with ESG and we will consider this as part of the Directors' Remuneration Policy review. Performance and Remuneration Outcomes for 2023 The “At a Glance” section provides an overview of our financial performance and how it translates into outcomes under the STI and LTI plans, with further details provided on pages 176 and 177. After reflecting on a range of considerations as described further in this report, the Committee was satisfied that the Remuneration Policy had operated as intended during the year and confirmed that no discretion has been exercised by the Committee. 2023 Target Setting The performance targets set by the Committee early in the year have remained unchanged throughout the 2023 performance period. 2023 target setting continued to focus on our ambition to reach £5 billion of New Category revenue and achieve New Category profitability, while delivering value through our combustibles business supported by strong cash flow generation to reduce leverage and provide flexibility to the Group. The New Categories revenue growth targets in both the STI and LTI emphasise the importance of New Categories growth in our long-term strategy and ESG agenda. The STI measure will continue to provide focus on in-year delivery, while the LTIP measure will focus on cumulative and sustained performance over a three-year period. In 2023, the Group finalised the sale of the Russian and Belarusian businesses. The 2023 STI targets were set excluding the Russian and Belarusian businesses, and the results were assessed on the same (organic) basis. The 2021 LTI performance measures and targets have remained unchanged during the three-year performance period. In assessing performance results for the 2021 LTI award against the targets set at the start of the performance period, performance has been assessed excluding the Russia and Belarusian businesses disposal impact from the 2023 results. Performance in the years of 2021 and 2022 will remain as previously reported. This approach provides a fair, balanced, and understandable measurement of the LTI outcomes by excluding material one- off events to ensure comparability period to period. 2023 Short-Term Incentive Our 2023 performance demonstrated our continued focus on delivery against our strategic priorities, with New Categories being a greater driver of Group performance and a key performance metric of the STI and the LTI. In 2023, organic revenue growth continued (at constant rates of exchange), led by pricing and organic New Category revenue growth which increased by 21.0% to £3,312 million (at constant rates of exchange). New Categories organic contribution, improved by £363 million through volume growth, strong pricing and cost of sales productivity savings. We have outperformed the 2023 targets for this measure, which were set in relation to the original 2025 ambition, enabling the Group to accelerate progress early in this critical area of our business. Adjusted organic profit from operations (at constant rates of exchange) improved by 3.9%, driven by accelerated growth in New Categories, strong pricing, optimised resource allocation, productivity savings, and further costs saving initiatives. Cash delivery continued to be strong realising over £7.9 billion of adjusted organic cash generated from operations. Group volume share (of cigarette and HP) in key markets reduced by over 10 bps. The above performance translates into a result of 61.3% of maximum opportunity. Further details of the performance against targets for the 2023 STI measures are set out on page 176. 2021 Long-Term Incentive In assessing performance results for the 2021 LTI award against the targets set at the start of the performance period, performance has been assessed on an organic basis for the 2023 results by excluding the Russian and Belarusian businesses disposal impact (where applicable) as described above. The outcomes are reflected below: – Total shareholder return (TSR) relative to peers (20%): Resulted in BAT TSR ranking 13th amongst our TSR peer group of 24 companies (page 177). – Adjusted diluted earnings per share (EPS) (40%): We measure adjusted diluted EPS at current and constant rates of exchange (equally weighted). The three-year adjusted diluted EPS compound annual growth rate (CAGR) was 4.7% and 5.9%, at current and constant rates, respectively. – Group revenue (20%): The three-year Group revenue CAGR was 4.1% at constant rates of exchange. – Operating cash flow conversion rate (20%): We have continued our strong track record of cash conversion delivery, resulting in a 101.6% operating cash flow conversion ratio at current rates measured over three years. The above performance translates into an outcome of 38.2% of maximum for the 2021 LTI. Following evaluation of the formulaic outcomes for both the STI plan and the LTI, the Committee considered the results against the underlying performance of the Group and the experience of our shareholders. The Committee concluded that the outcomes were a fair reflection of performance delivered in what continues to be challenging and volatile market conditions and no adjustments were required. In addition, share price fluctuations are reflected throughout the Chief Executive’s remuneration in the vesting and holding periods as well as individual shareholdings. The Committee also considered whether there were any potential windfall gains for the LTI award granted in March 2021 and concluded that an adjustment to the size of the awards was not warranted. More details are provided on page 177. Corporate governance As of 1 December 2023, the Remuneration Committee introduced a new Malus and Clawback Policy for Senior Executives that will apply to their current and future awards granted under the Company’s short-term incentive (including deferral) and long-term incentive plans. This followed the U.S. Securities and Exchange Commission’s adoption of final rules implementing the clawback provisions of the Dodd-Frank Act which required U.S. stock exchanges, including the NYSE, to require listed companies to adopt clawback policies that meet its requirements. This policy will operate in addition to the existing malus and clawback provisions already in place as part of the Directors’ Remuneration Policy. Further details are available on page 404. Notes: * Based on the weight of evidence and assuming a complete switch from cigarette smoking. These products are not risk free and are addictive. † Our Vapour product Vuse (including Alto, Solo, Ciro and Vibe), and certain products including Velo, Grizzly, Kodiak, and Camel Snus, which are sold in the U.S., are subject to FDA regulation and no reduced-risk claims will be made as to these products without agency clearance. BAT Annual Report and Form 20-F 2023 Strategic Report Governance Report Financial Statements Other Information 171
Wider Workforce Context We recognise that macro-economic factors continue to affect many of our employees. In 2023, we continued to closely monitor the workforce initiatives designed to address the difficulties that the increasing cost of living has had for our employees and made significant reward- related investments, where appropriate, to support our people, including off-cycle salary increases, targeted increases to address non-management (lower-paid) employee groups and additional interventions to support employees in high inflationary environments (including salary increases, one-off cash payments, temporary fixed allowances). These initiatives covered eight markets with an overall spend of an additional £5.9 million across c.5,000 employees. Additional budgets have been allocated by the Group in 2024 for wider workforce annual salary increases in the UK and globally. The Committee keeps up to date with the views of our wider workforce drawing from a range of well-established engagement channels worldwide to ensure there is a robust understanding of the issues affecting the workforce globally. For more information on engagement with the wider workforce refer to page 181. The Committee considers executive pay in this broader context, ensuring the Remuneration Policy is implemented with the desired attributes of fairness, transparency, proportionality, and alignment to broader organisational culture and societal expectations. Living Wage Living Wage is an ongoing area of focus for BAT. In 2023, in partnership with the Fair Wage Network (FWN) we completed a living wage assessment across our global business, covering more than 42,000 employees, which is 100% of our direct employee population in approximately 100 markets (600+ locations), and received FWN independent accreditation for all the markets included in the scope of the review. We will continue to monitor global living wage references regularly to ensure that our fair and equitable principles for wage setting are upheld. Pay Equity In 2023, for the third year in succession, we received an independent accreditation from Fair Pay Workplace for all markets included in the scope, demonstrating our commitment to pay equity in order to create a more equitable and inclusive workplace. Our pay equity review covers approximately 42,000 employees in more than 100 markets from a gender perspective, and approximately 13,000 employees in 7 markets from an ethnicity perspective (approximately 30% of our global workforce). The Group results show that men and women are paid within 1% of each other, and ethnically diverse and non-ethnically diverse groups are paid within 1% of one another for doing the same work or work of equal value. This demonstrates that our pay practices are founded on fair and consistent drivers of pay. Further information about the Group’s approach to Pay Equality is described in the Diversity and Inclusion Report. 2024 salary changes In determining the 2024 salary increase for the Chief Executive, the Remuneration Committee noted that in the UK, salary increases for the majority of employees are expected to be around 6% on average. In addition, the Remuneration Committee also considered the underlying Company performance for the financial year and the individual contribution of the Chief Executive. Since his appointment, Tadeu has brought tremendous focus to the review and refinement of the Group's strategy, including the re-articulation of the Group’s values which will be central to the delivery of our ambitions. The Management Board structure has been refreshed and an additional two key appointments, the Chief People Officer and the Chief Financial Officer, were confirmed. The long-standing commitment to sell the Russian and Belarusian businesses has been completed and the Group’s transformation has continued to progress in what has been an increasingly difficult external environment. The Committee also reviewed the market data provided by external consultants to reference the competitive positioning of the Chief Executive's total remuneration in relation to our pay comparator group and wider market. The Remuneration Committee also reviewed the impact of salary adjustments on total remuneration of the Chief Executive to ensure the overall potential quantum remains reasonable. Taking the above points into account, the Remuneration Committee decided to approve a salary increase of 3% for the Chief Executive, which is below the average level of the wider UK workforce. Looking Ahead to 2024 The Remuneration Committee have reviewed the targets for the 2024 LTI. The Group’s LTI structure and performance ranges have remained relatively stable over time, with some performance ranges such as for the EPS measures, being in place since 2013, when the combustibles business was the dominant source of Group revenue and profit performance. The Committee discussed the importance of ensuring the performance ranges are appropriately calibrated to the Group’s business model and future outlook and remain stretching for participants. We have carefully considered internal forecasts, external market expectations for future growth, and the sensitivities attached to target ranges and decided to make some changes for the 2024 LTI compared to previous awards. While the measures remain unchanged, we have set the targets considering our internal forecasts and external market expectations for future growth, as well as the current business environment in which the Group is operating. Targets under the New Categories revenue growth and adjusted EPS growth (at constant and current rates) measures have been set lower than the targets set for the 2023 LTI to recognise the challenging environment over the forthcoming period, and targets for the adjusted operating cash flow conversion ratio have been set higher. Targets for Group revenue growth and relative TSR will remain the same as for the 2023 LTI. The Committee is confident that the targets remain suitably stretching and incentivising for participants, ensuring only maximum payout for exceptional performance. In addition, we will review the grant price of the 2024 LTI award, taking into account previous grant prices, and review both on grant and on vesting whether there is or has been any potential for windfall gains. The Committee retains discretion to determine whether the formulaic outcome of the 2024 LTI at vesting is a fair reflection of underlying business performance and consistent with the shareholder experience over the performance period, and if not, to adjust the outcome accordingly. Further details are available on page 185. In 2023, we continued to accelerate our transformation journey towards A Better Tomorrow™ and create value for all stakeholders. Our current Remuneration Policy drives pay for performance and provides strong alignment with the Group strategy and our ESG agenda. In 2024, we will commence our next iteration of engagement as part of the review of our Remuneration Policy, which will be presented to shareholders at the 2025 Annual General Meeting. We hope you find this report informative. We continue to maintain an open dialogue on remuneration matters and welcome your further comments and feedback and respectfully ask for your support at the forthcoming Annual General Meeting. Dimitri Panayotopoulos Chair, Remuneration Committee 7 February 2024 BAT Annual Report and Form 20-F 2023 Strategic Report Governance Report Financial Statements Other Information Remuneration Report Annual Statement on Remuneration Continued 172
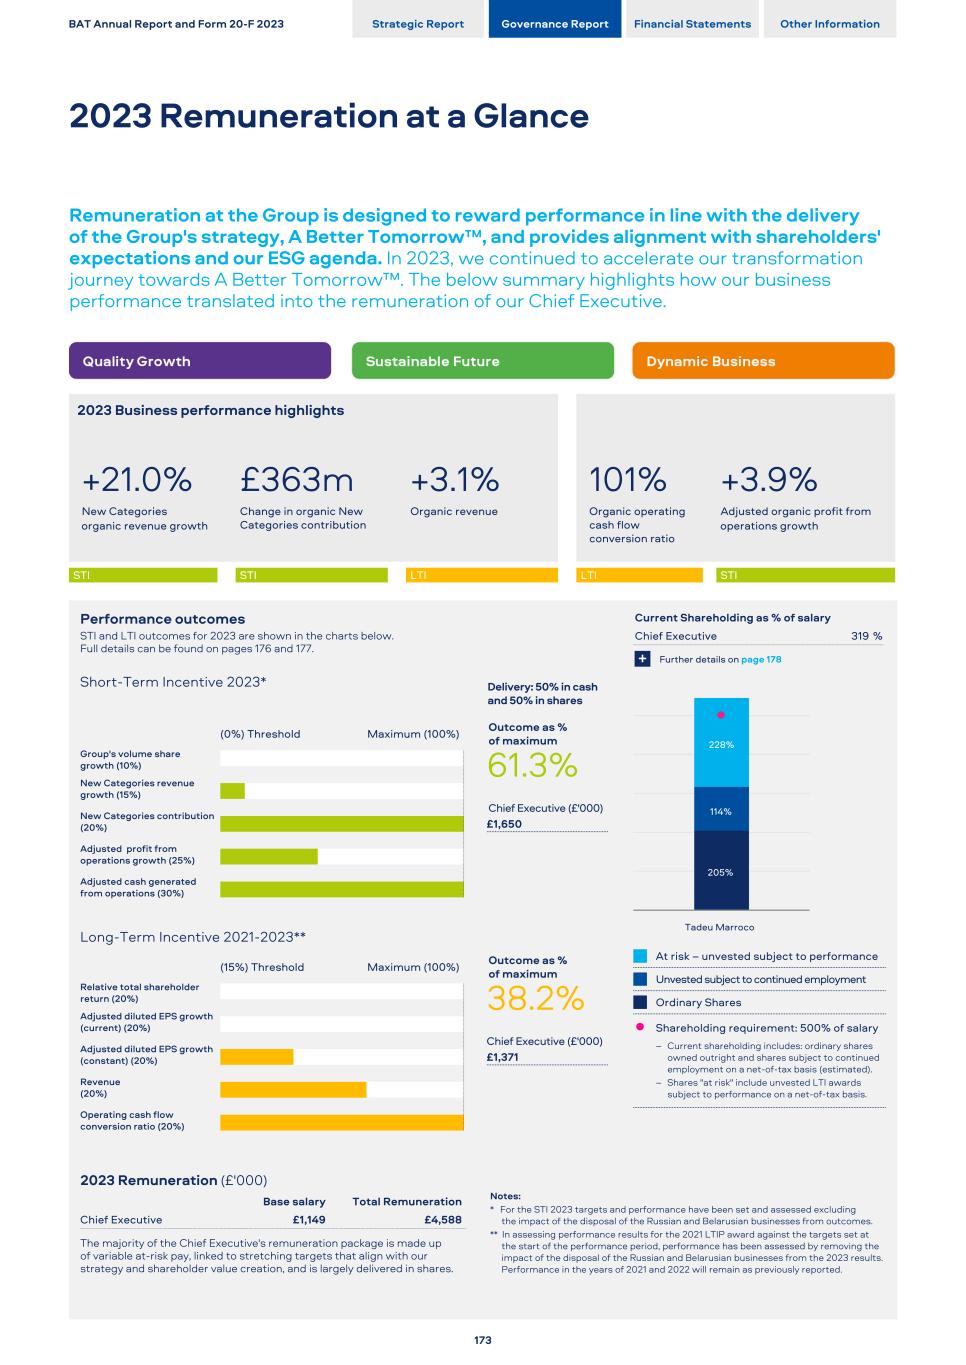
2023 Business performance highlights +21.0% £363m +3.1% 101% +3.9% New Categories organic revenue growth Change in organic New Categories contribution Organic revenue Organic operating cash flow conversion ratio Adjusted organic profit from operations growth STI STI LTI LTI STI Performance outcomes STI and LTI outcomes for 2023 are shown in the charts below. Full details can be found on pages 176 and 177. Short-Term Incentive 2023* Delivery: 50% in cash and 50% in shares (0%) Threshold Maximum (100%) Outcome as % of maximum Group's volume share growth (10%) 61.3% New Categories revenue growth (15%) Chief Executive (£'000) New Categories contribution (20%) £1,650 Adjusted profit from operations growth (25%) Adjusted cash generated from operations (30%) Long-Term Incentive 2021-2023** (15%) Threshold Maximum (100%) Outcome as % of maximum Relative total shareholder return (20%) 38.2% Adjusted diluted EPS growth (current) (20%) Chief Executive (£'000) Adjusted diluted EPS growth (constant) (20%) £1,371 Revenue (20%) Operating cash flow conversion ratio (20%) Current Shareholding as % of salary Chief Executive 319 % 205% 114% 228% Tadeu Marroco At risk – unvested subject to performance Unvested subject to continued employment Ordinary Shares l Shareholding requirement: 500% of salary – Current shareholding includes: ordinary shares owned outright and shares subject to continued employment on a net-of-tax basis (estimated). – Shares "at risk" include unvested LTI awards subject to performance on a net-of-tax basis. 2023 Remuneration (£'000) Notes: * For the STI 2023 targets and performance have been set and assessed excluding the impact of the disposal of the Russian and Belarusian businesses from outcomes. ** In assessing performance results for the 2021 LTIP award against the targets set at the start of the performance period, performance has been assessed by removing the impact of the disposal of the Russian and Belarusian businesses from the 2023 results. Performance in the years of 2021 and 2022 will remain as previously reported. Base salary Total Remuneration Chief Executive £1,149 £4,588 The majority of the Chief Executive's remuneration package is made up of variable at-risk pay, linked to stretching targets that align with our strategy and shareholder value creation, and is largely delivered in shares. BAT Annual Report and Form 20-F 2023 Strategic Report Governance Report Financial Statements Other Information 2023 Remuneration at a Glance Remuneration at the Group is designed to reward performance in line with the delivery of the Group's strategy, A Better Tomorrow™, and provides alignment with shareholders' expectations and our ESG agenda. In 2023, we continued to accelerate our transformation journey towards A Better Tomorrow™. The below summary highlights how our business performance translated into the remuneration of our Chief Executive. 173 + Further details on page 178
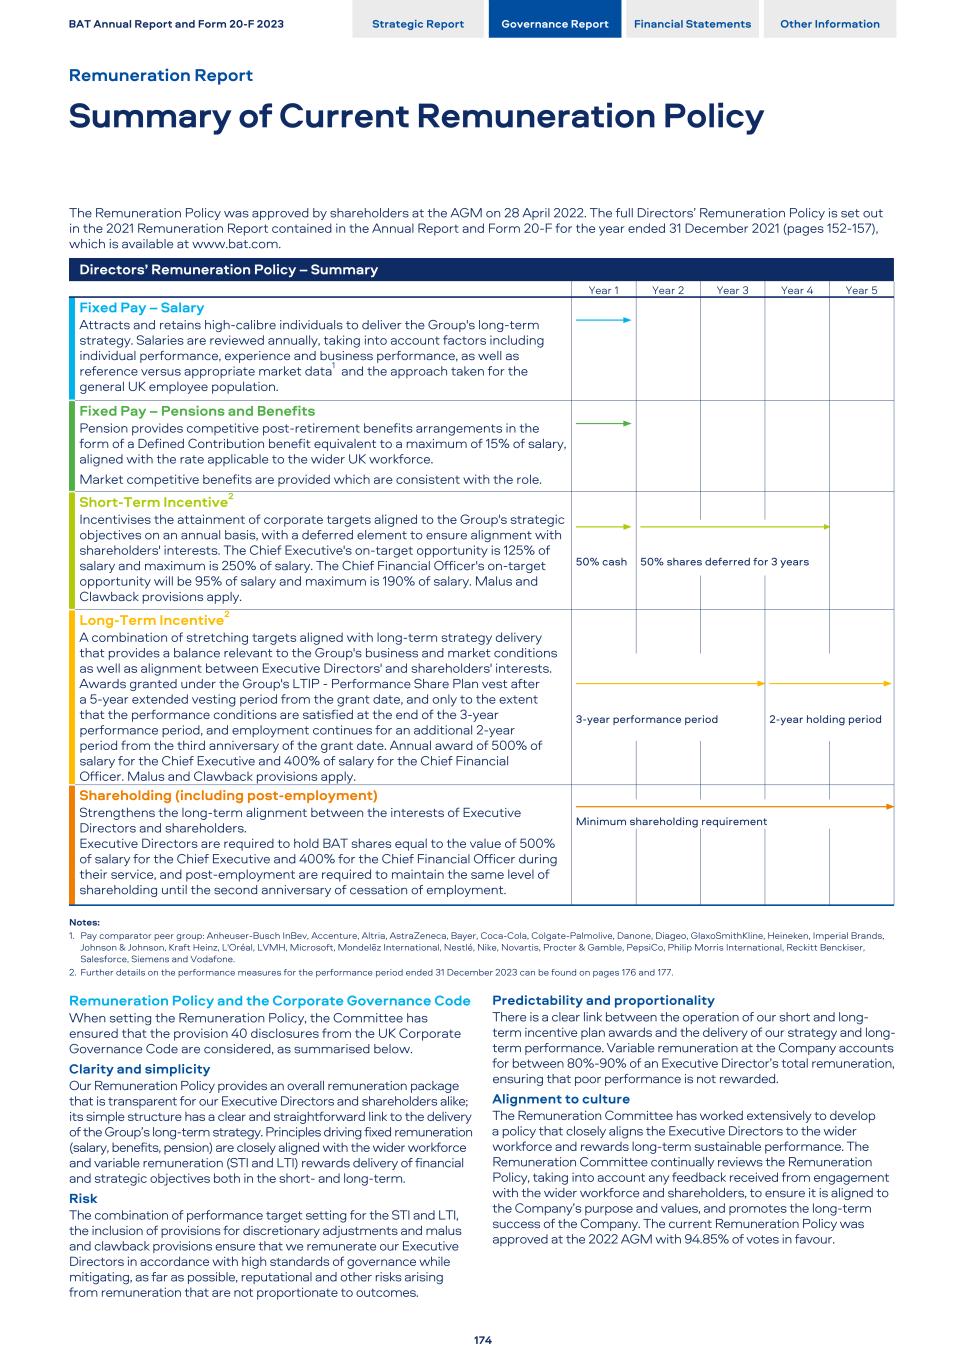
The Remuneration Policy was approved by shareholders at the AGM on 28 April 2022. The full Directors’ Remuneration Policy is set out in the 2021 Remuneration Report contained in the Annual Report and Form 20-F for the year ended 31 December 2021 (pages 152-157), which is available at www.bat.com. Directors’ Remuneration Policy – Summary Year 1 Year 2 Year 3 Year 4 Year 5 Fixed Pay – Salary Attracts and retains high-calibre individuals to deliver the Group's long-term strategy. Salaries are reviewed annually, taking into account factors including individual performance, experience and business performance, as well as reference versus appropriate market data1 and the approach taken for the general UK employee population. Fixed Pay – Pensions and Benefits Pension provides competitive post-retirement benefits arrangements in the form of a Defined Contribution benefit equivalent to a maximum of 15% of salary, aligned with the rate applicable to the wider UK workforce. Market competitive benefits are provided which are consistent with the role. Short-Term Incentive2 Incentivises the attainment of corporate targets aligned to the Group's strategic objectives on an annual basis, with a deferred element to ensure alignment with shareholders' interests. The Chief Executive's on-target opportunity is 125% of salary and maximum is 250% of salary. The Chief Financial Officer's on-target opportunity will be 95% of salary and maximum is 190% of salary. Malus and Clawback provisions apply. 50% cash 50% shares deferred for 3 years Long-Term Incentive2 A combination of stretching targets aligned with long-term strategy delivery that provides a balance relevant to the Group's business and market conditions as well as alignment between Executive Directors' and shareholders' interests. Awards granted under the Group's LTIP - Performance Share Plan vest after a 5-year extended vesting period from the grant date, and only to the extent that the performance conditions are satisfied at the end of the 3-year performance period, and employment continues for an additional 2-year period from the third anniversary of the grant date. Annual award of 500% of salary for the Chief Executive and 400% of salary for the Chief Financial Officer. Malus and Clawback provisions apply. 3-year performance period 2-year holding period Shareholding (including post-employment) Strengthens the long-term alignment between the interests of Executive Directors and shareholders. Executive Directors are required to hold BAT shares equal to the value of 500% of salary for the Chief Executive and 400% for the Chief Financial Officer during their service, and post-employment are required to maintain the same level of shareholding until the second anniversary of cessation of employment. Minimum shareholding requirement Notes: 1. Pay comparator peer group: Anheuser-Busch InBev, Accenture, Altria, AstraZeneca, Bayer, Coca-Cola, Colgate-Palmolive, Danone, Diageo, GlaxoSmithKline, Heineken, Imperial Brands, Johnson & Johnson, Kraft Heinz, L'Oréal, LVMH, Microsoft, Mondelēz International, Nestlé, Nike, Novartis, Procter & Gamble, PepsiCo, Philip Morris International, Reckitt Benckiser, Salesforce, Siemens and Vodafone. 2. Further details on the performance measures for the performance period ended 31 December 2023 can be found on pages 176 and 177. Remuneration Policy and the Corporate Governance Code When setting the Remuneration Policy, the Committee has ensured that the provision 40 disclosures from the UK Corporate Governance Code are considered, as summarised below. Clarity and simplicity Our Remuneration Policy provides an overall remuneration package that is transparent for our Executive Directors and shareholders alike; its simple structure has a clear and straightforward link to the delivery of the Group’s long-term strategy. Principles driving fixed remuneration (salary, benefits, pension) are closely aligned with the wider workforce and variable remuneration (STI and LTI) rewards delivery of financial and strategic objectives both in the short- and long-term. Risk The combination of performance target setting for the STI and LTI, the inclusion of provisions for discretionary adjustments and malus and clawback provisions ensure that we remunerate our Executive Directors in accordance with high standards of governance while mitigating, as far as possible, reputational and other risks arising from remuneration that are not proportionate to outcomes. Predictability and proportionality There is a clear link between the operation of our short and long- term incentive plan awards and the delivery of our strategy and long- term performance. Variable remuneration at the Company accounts for between 80%-90% of an Executive Director’s total remuneration, ensuring that poor performance is not rewarded. Alignment to culture The Remuneration Committee has worked extensively to develop a policy that closely aligns the Executive Directors to the wider workforce and rewards long-term sustainable performance. The Remuneration Committee continually reviews the Remuneration Policy, taking into account any feedback received from engagement with the wider workforce and shareholders, to ensure it is aligned to the Company’s purpose and values, and promotes the long-term success of the Company. The current Remuneration Policy was approved at the 2022 AGM with 94.85% of votes in favour. BAT Annual Report and Form 20-F 2023 Strategic Report Governance Report Financial Statements Other Information Remuneration Report Summary of Current Remuneration Policy 174
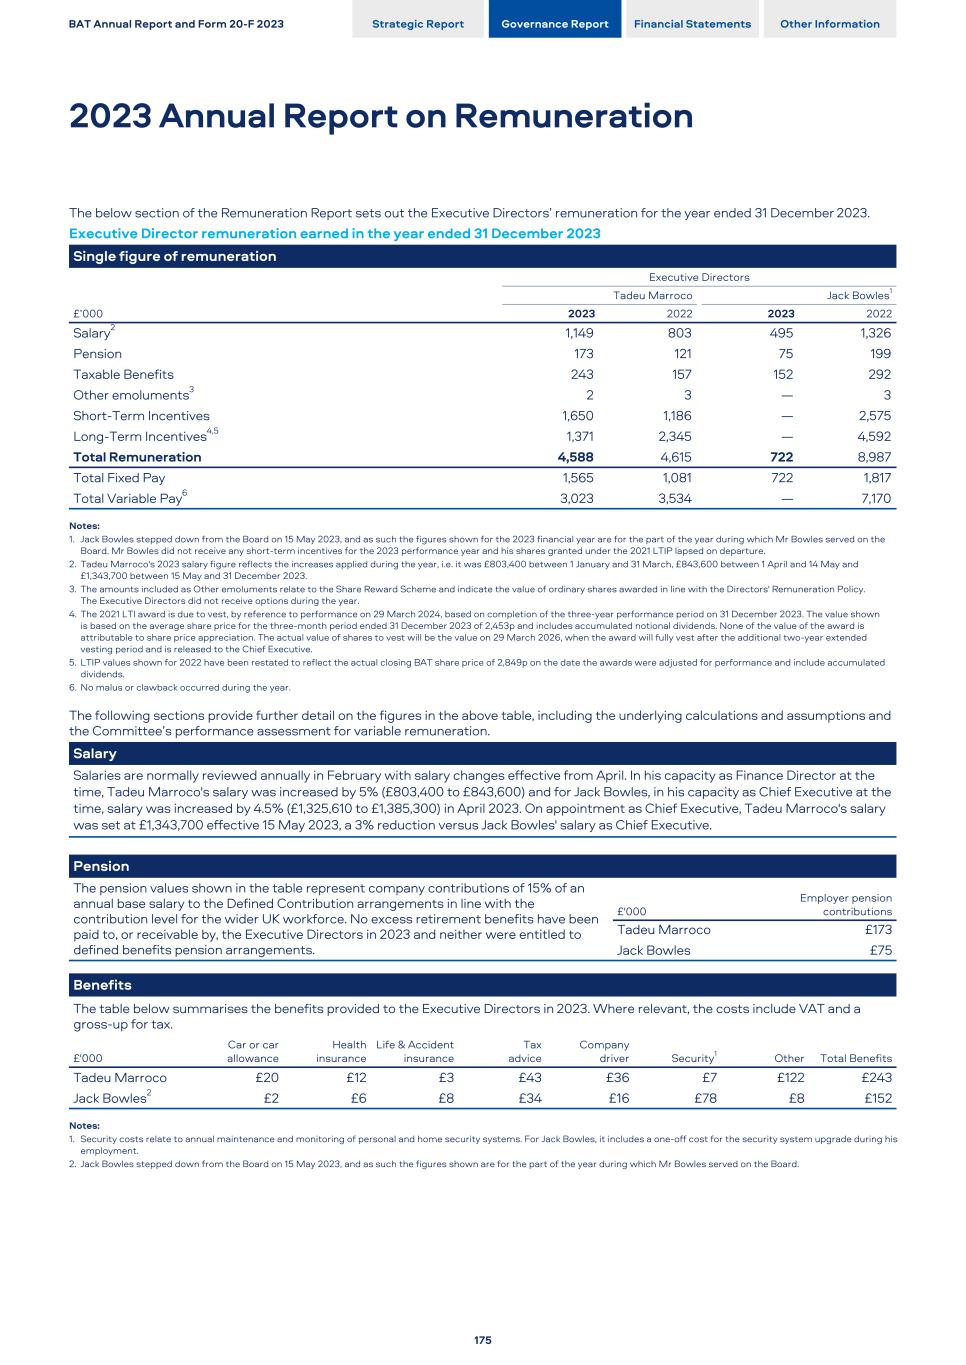
The below section of the Remuneration Report sets out the Executive Directors’ remuneration for the year ended 31 December 2023. Executive Director remuneration earned in the year ended 31 December 2023 Single figure of remuneration Executive Directors Tadeu Marroco Jack Bowles1 £’000 2023 2022 2023 2022 Salary2 1,149 803 495 1,326 Pension 173 121 75 199 Taxable Benefits 243 157 152 292 Other emoluments3 2 3 — 3 Short-Term Incentives 1,650 1,186 — 2,575 Long-Term Incentives4,5 1,371 2,345 — 4,592 Total Remuneration 4,588 4,615 722 8,987 Total Fixed Pay 1,565 1,081 722 1,817 Total Variable Pay6 3,023 3,534 — 7,170 Notes: 1. Jack Bowles stepped down from the Board on 15 May 2023, and as such the figures shown for the 2023 financial year are for the part of the year during which Mr Bowles served on the Board. Mr Bowles did not receive any short-term incentives for the 2023 performance year and his shares granted under the 2021 LTIP lapsed on departure. 2. Tadeu Marroco's 2023 salary figure reflects the increases applied during the year, i.e. it was £803,400 between 1 January and 31 March, £843,600 between 1 April and 14 May and £1,343,700 between 15 May and 31 December 2023. 3. The amounts included as Other emoluments relate to the Share Reward Scheme and indicate the value of ordinary shares awarded in line with the Directors' Remuneration Policy. The Executive Directors did not receive options during the year. 4. The 2021 LTI award is due to vest, by reference to performance on 29 March 2024, based on completion of the three-year performance period on 31 December 2023. The value shown is based on the average share price for the three-month period ended 31 December 2023 of 2,453p and includes accumulated notional dividends. None of the value of the award is attributable to share price appreciation. The actual value of shares to vest will be the value on 29 March 2026, when the award will fully vest after the additional two-year extended vesting period and is released to the Chief Executive. 5. LTIP values shown for 2022 have been restated to reflect the actual closing BAT share price of 2,849p on the date the awards were adjusted for performance and include accumulated dividends. 6. No malus or clawback occurred during the year. The following sections provide further detail on the figures in the above table, including the underlying calculations and assumptions and the Committee’s performance assessment for variable remuneration. Salary Salaries are normally reviewed annually in February with salary changes effective from April. In his capacity as Finance Director at the time, Tadeu Marroco's salary was increased by 5% (£803,400 to £843,600) and for Jack Bowles, in his capacity as Chief Executive at the time, salary was increased by 4.5% (£1,325,610 to £1,385,300) in April 2023. On appointment as Chief Executive, Tadeu Marroco's salary was set at £1,343,700 effective 15 May 2023, a 3% reduction versus Jack Bowles' salary as Chief Executive. Pension The pension values shown in the table represent company contributions of 15% of an annual base salary to the Defined Contribution arrangements in line with the contribution level for the wider UK workforce. No excess retirement benefits have been paid to, or receivable by, the Executive Directors in 2023 and neither were entitled to defined benefits pension arrangements. £'000 Employer pension contributions Tadeu Marroco £173 Jack Bowles £75 Benefits The table below summarises the benefits provided to the Executive Directors in 2023. Where relevant, the costs include VAT and a gross-up for tax. £'000 Car or car allowance Health insurance Life & Accident insurance Tax advice Company driver Security1 Other Total Benefits Tadeu Marroco £20 £12 £3 £43 £36 £7 £122 £243 Jack Bowles2 £2 £6 £8 £34 £16 £78 £8 £152 Notes: 1. Security costs relate to annual maintenance and monitoring of personal and home security systems. For Jack Bowles, it includes a one-off cost for the security system upgrade during his employment. 2. Jack Bowles stepped down from the Board on 15 May 2023, and as such the figures shown are for the part of the year during which Mr Bowles served on the Board. BAT Annual Report and Form 20-F 2023 Strategic Report Governance Report Financial Statements Other Information 2023 Annual Report on Remuneration 175
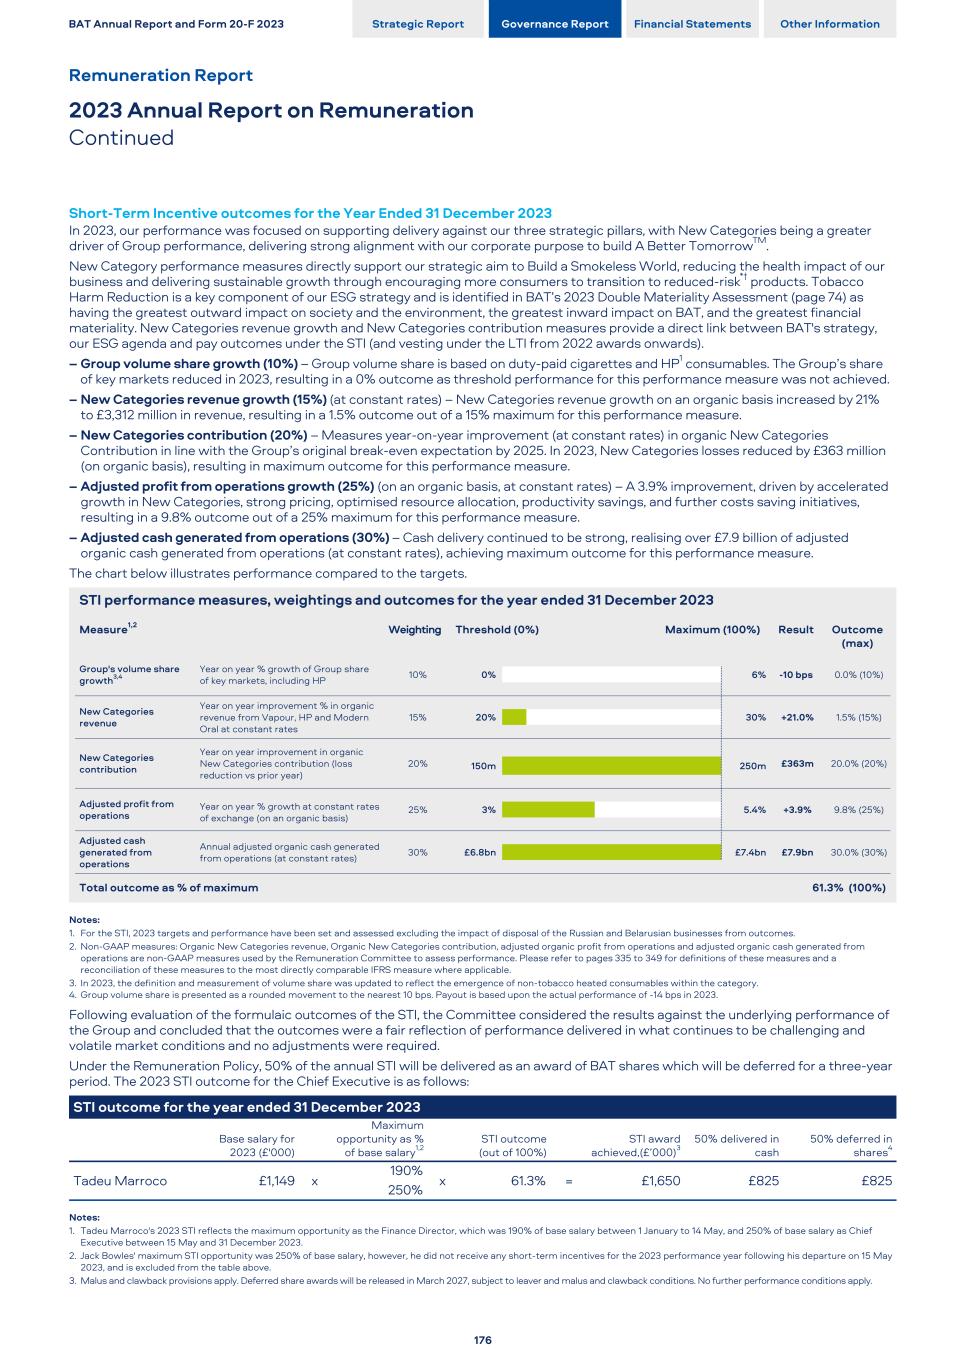
Short-Term Incentive outcomes for the Year Ended 31 December 2023 In 2023, our performance was focused on supporting delivery against our three strategic pillars, with New Categories being a greater driver of Group performance, delivering strong alignment with our corporate purpose to build A Better TomorrowTM. New Category performance measures directly support our strategic aim to Build a Smokeless World, reducing the health impact of our business and delivering sustainable growth through encouraging more consumers to transition to reduced-risk*† products. Tobacco Harm Reduction is a key component of our ESG strategy and is identified in BAT’s 2023 Double Materiality Assessment (page 74) as having the greatest outward impact on society and the environment, the greatest inward impact on BAT, and the greatest financial materiality. New Categories revenue growth and New Categories contribution measures provide a direct link between BAT's strategy, our ESG agenda and pay outcomes under the STI (and vesting under the LTI from 2022 awards onwards). – Group volume share growth (10%) – Group volume share is based on duty-paid cigarettes and HP1 consumables. The Group’s share of key markets reduced in 2023, resulting in a 0% outcome as threshold performance for this performance measure was not achieved. – New Categories revenue growth (15%) (at constant rates) – New Categories revenue growth on an organic basis increased by 21% to £3,312 million in revenue, resulting in a 1.5% outcome out of a 15% maximum for this performance measure. – New Categories contribution (20%) – Measures year-on-year improvement (at constant rates) in organic New Categories Contribution in line with the Group’s original break-even expectation by 2025. In 2023, New Categories losses reduced by £363 million (on organic basis), resulting in maximum outcome for this performance measure. – Adjusted profit from operations growth (25%) (on an organic basis, at constant rates) – A 3.9% improvement, driven by accelerated growth in New Categories, strong pricing, optimised resource allocation, productivity savings, and further costs saving initiatives, resulting in a 9.8% outcome out of a 25% maximum for this performance measure. – Adjusted cash generated from operations (30%) – Cash delivery continued to be strong, realising over £7.9 billion of adjusted organic cash generated from operations (at constant rates), achieving maximum outcome for this performance measure. The chart below illustrates performance compared to the targets. STI performance measures, weightings and outcomes for the year ended 31 December 2023 Measure1,2 Weighting Threshold (0%) Maximum (100%) Result Outcome (max) Group's volume share growth3,4 Year on year % growth of Group share of key markets, including HP 10% -10 bps 0.0% (10%)0% 6% New Categories revenue Year on year improvement % in organic revenue from Vapour, HP and Modern Oral at constant rates 15% +21.0% 1.5% (15%)20% 30% New Categories contribution Year on year improvement in organic New Categories contribution (loss reduction vs prior year) 20% £363m 20.0% (20%)150m 250m Adjusted profit from operations Year on year % growth at constant rates of exchange (on an organic basis) 25% +3.9% 9.8% (25%)3% 5.4% Adjusted cash generated from operations Annual adjusted organic cash generated from operations (at constant rates) 30% £7.9bn 30.0% (30%)£6.8bn £7.4bn Total outcome as % of maximum 61.3% (100%) Notes: 1. For the STI, 2023 targets and performance have been set and assessed excluding the impact of disposal of the Russian and Belarusian businesses from outcomes. 2. Non-GAAP measures: Organic New Categories revenue, Organic New Categories contribution, adjusted organic profit from operations and adjusted organic cash generated from operations are non-GAAP measures used by the Remuneration Committee to assess performance. Please refer to pages 335 to 349 for definitions of these measures and a reconciliation of these measures to the most directly comparable IFRS measure where applicable. 3. In 2023, the definition and measurement of volume share was updated to reflect the emergence of non-tobacco heated consumables within the category. 4. Group volume share is presented as a rounded movement to the nearest 10 bps. Payout is based upon the actual performance of -14 bps in 2023. Following evaluation of the formulaic outcomes of the STI, the Committee considered the results against the underlying performance of the Group and concluded that the outcomes were a fair reflection of performance delivered in what continues to be challenging and volatile market conditions and no adjustments were required. Under the Remuneration Policy, 50% of the annual STI will be delivered as an award of BAT shares which will be deferred for a three-year period. The 2023 STI outcome for the Chief Executive is as follows: STI outcome for the year ended 31 December 2023 Base salary for 2023 (£'000) Maximum opportunity as % of base salary1,2 STI outcome (out of 100%) STI award achieved,(£’000)3 50% delivered in cash 50% deferred in shares4 Tadeu Marroco £1,149 x 190% x 61.3% = £1,650 £825 £825 250% Notes: 1. Tadeu Marroco's 2023 STI reflects the maximum opportunity as the Finance Director, which was 190% of base salary between 1 January to 14 May, and 250% of base salary as Chief Executive between 15 May and 31 December 2023. 2. Jack Bowles' maximum STI opportunity was 250% of base salary, however, he did not receive any short-term incentives for the 2023 performance year following his departure on 15 May 2023, and is excluded from the table above. 3. Malus and clawback provisions apply. Deferred share awards will be released in March 2027, subject to leaver and malus and clawback conditions. No further performance conditions apply. BAT Annual Report and Form 20-F 2023 Strategic Report Governance Report Financial Statements Other Information Remuneration Report 2023 Annual Report on Remuneration Continued 176
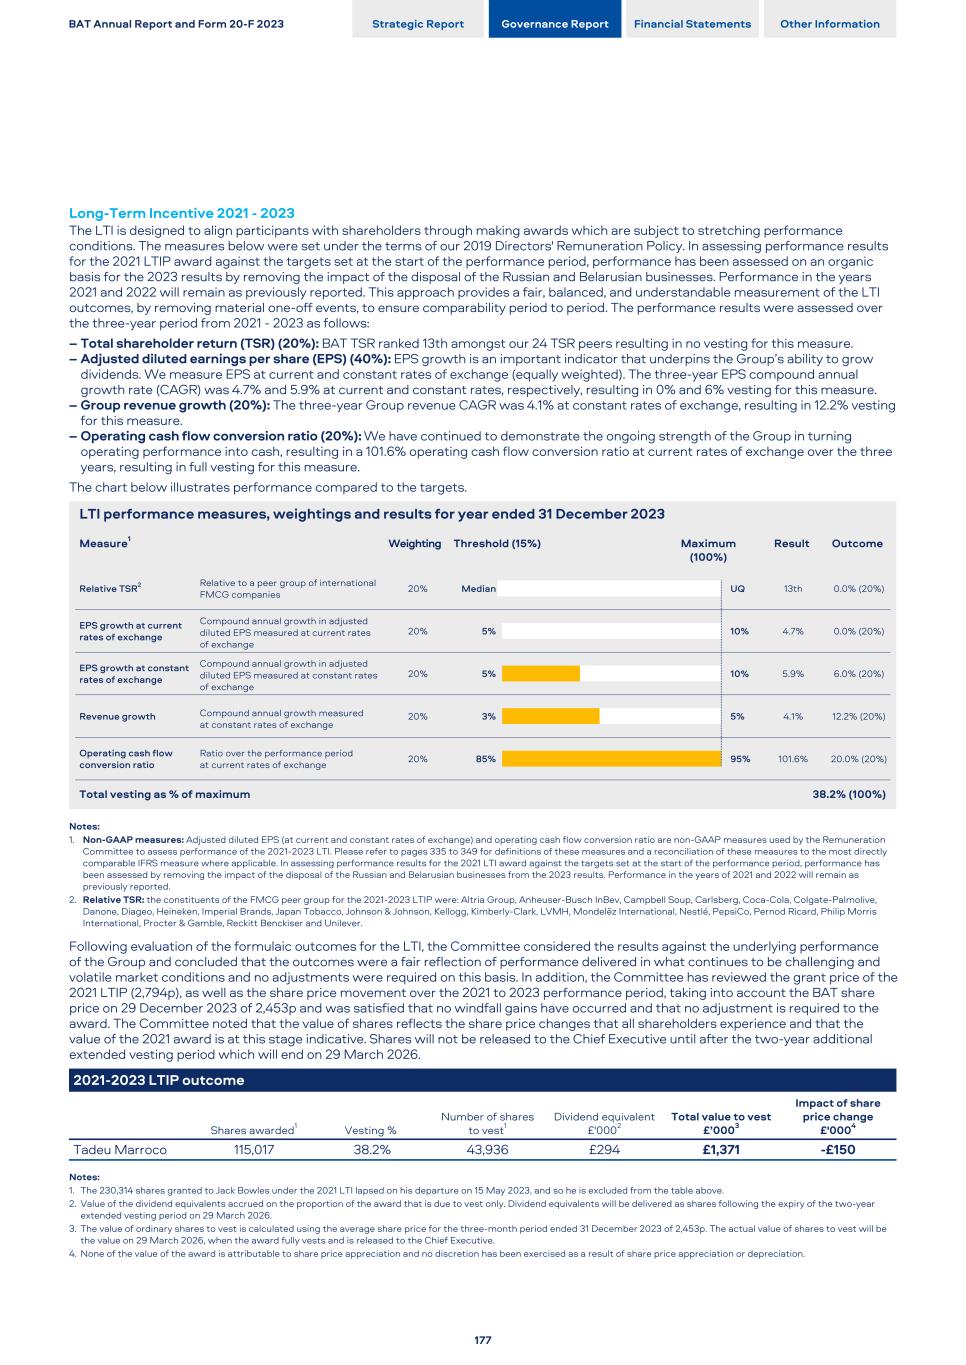
Long-Term Incentive 2021 - 2023 The LTI is designed to align participants with shareholders through making awards which are subject to stretching performance conditions. The measures below were set under the terms of our 2019 Directors' Remuneration Policy. In assessing performance results for the 2021 LTIP award against the targets set at the start of the performance period, performance has been assessed on an organic basis for the 2023 results by removing the impact of the disposal of the Russian and Belarusian businesses. Performance in the years 2021 and 2022 will remain as previously reported. This approach provides a fair, balanced, and understandable measurement of the LTI outcomes, by removing material one-off events, to ensure comparability period to period. The performance results were assessed over the three-year period from 2021 - 2023 as follows: – Total shareholder return (TSR) (20%): BAT TSR ranked 13th amongst our 24 TSR peers resulting in no vesting for this measure. – Adjusted diluted earnings per share (EPS) (40%): EPS growth is an important indicator that underpins the Group’s ability to grow dividends. We measure EPS at current and constant rates of exchange (equally weighted). The three-year EPS compound annual growth rate (CAGR) was 4.7% and 5.9% at current and constant rates, respectively, resulting in 0% and 6% vesting for this measure. – Group revenue growth (20%): The three-year Group revenue CAGR was 4.1% at constant rates of exchange, resulting in 12.2% vesting for this measure. – Operating cash flow conversion ratio (20%): We have continued to demonstrate the ongoing strength of the Group in turning operating performance into cash, resulting in a 101.6% operating cash flow conversion ratio at current rates of exchange over the three years, resulting in full vesting for this measure. The chart below illustrates performance compared to the targets. LTI performance measures, weightings and results for year ended 31 December 2023 Measure1 Weighting Threshold (15%) Maximum (100%) Result Outcome Relative TSR2 Relative to a peer group of international FMCG companies 20% 13th 0.0% (20%)Median UQ EPS growth at current rates of exchange Compound annual growth in adjusted diluted EPS measured at current rates of exchange 20% 4.7% 0.0% (20%)5% 10% EPS growth at constant rates of exchange Compound annual growth in adjusted diluted EPS measured at constant rates of exchange 20% 5.9% 6.0% (20%)5% 10% Revenue growth Compound annual growth measured at constant rates of exchange 20% 4.1% 12.2% (20%)3% 5% Operating cash flow conversion ratio Ratio over the performance period at current rates of exchange 20% 101.6% 20.0% (20%)85% 95% Total vesting as % of maximum 38.2% (100%) Notes: 1. Non-GAAP measures: Adjusted diluted EPS (at current and constant rates of exchange) and operating cash flow conversion ratio are non-GAAP measures used by the Remuneration Committee to assess performance of the 2021-2023 LTI. Please refer to pages 335 to 349 for definitions of these measures and a reconciliation of these measures to the most directly comparable IFRS measure where applicable. In assessing performance results for the 2021 LTI award against the targets set at the start of the performance period, performance has been assessed by removing the impact of the disposal of the Russian and Belarusian businesses from the 2023 results. Performance in the years of 2021 and 2022 will remain as previously reported. 2. Relative TSR: the constituents of the FMCG peer group for the 2021-2023 LTIP were: Altria Group, Anheuser-Busch InBev, Campbell Soup, Carlsberg, Coca-Cola, Colgate-Palmolive, Danone, Diageo, Heineken, Imperial Brands, Japan Tobacco, Johnson & Johnson, Kellogg, Kimberly-Clark, LVMH, Mondelēz International, Nestlé, PepsiCo, Pernod Ricard, Philip Morris International, Procter & Gamble, Reckitt Benckiser and Unilever. Following evaluation of the formulaic outcomes for the LTI, the Committee considered the results against the underlying performance of the Group and concluded that the outcomes were a fair reflection of performance delivered in what continues to be challenging and volatile market conditions and no adjustments were required on this basis. In addition, the Committee has reviewed the grant price of the 2021 LTIP (2,794p), as well as the share price movement over the 2021 to 2023 performance period, taking into account the BAT share price on 29 December 2023 of 2,453p and was satisfied that no windfall gains have occurred and that no adjustment is required to the award. The Committee noted that the value of shares reflects the share price changes that all shareholders experience and that the value of the 2021 award is at this stage indicative. Shares will not be released to the Chief Executive until after the two-year additional extended vesting period which will end on 29 March 2026. 2021-2023 LTIP outcome Shares awarded1 Vesting % Number of shares to vest1 Dividend equivalent £'0002 Total value to vest £’0003 Impact of share price change £'0004 Tadeu Marroco 115,017 38.2% 43,936 £294 £1,371 -£150 Notes: 1. The 230,314 shares granted to Jack Bowles under the 2021 LTI lapsed on his departure on 15 May 2023, and so he is excluded from the table above. 2. Value of the dividend equivalents accrued on the proportion of the award that is due to vest only. Dividend equivalents will be delivered as shares following the expiry of the two-year extended vesting period on 29 March 2026. 3. The value of ordinary shares to vest is calculated using the average share price for the three-month period ended 31 December 2023 of 2,453p. The actual value of shares to vest will be the value on 29 March 2026, when the award fully vests and is released to the Chief Executive. 4. None of the value of the award is attributable to share price appreciation and no discretion has been exercised as a result of share price appreciation or depreciation. BAT Annual Report and Form 20-F 2023 Strategic Report Governance Report Financial Statements Other Information 177
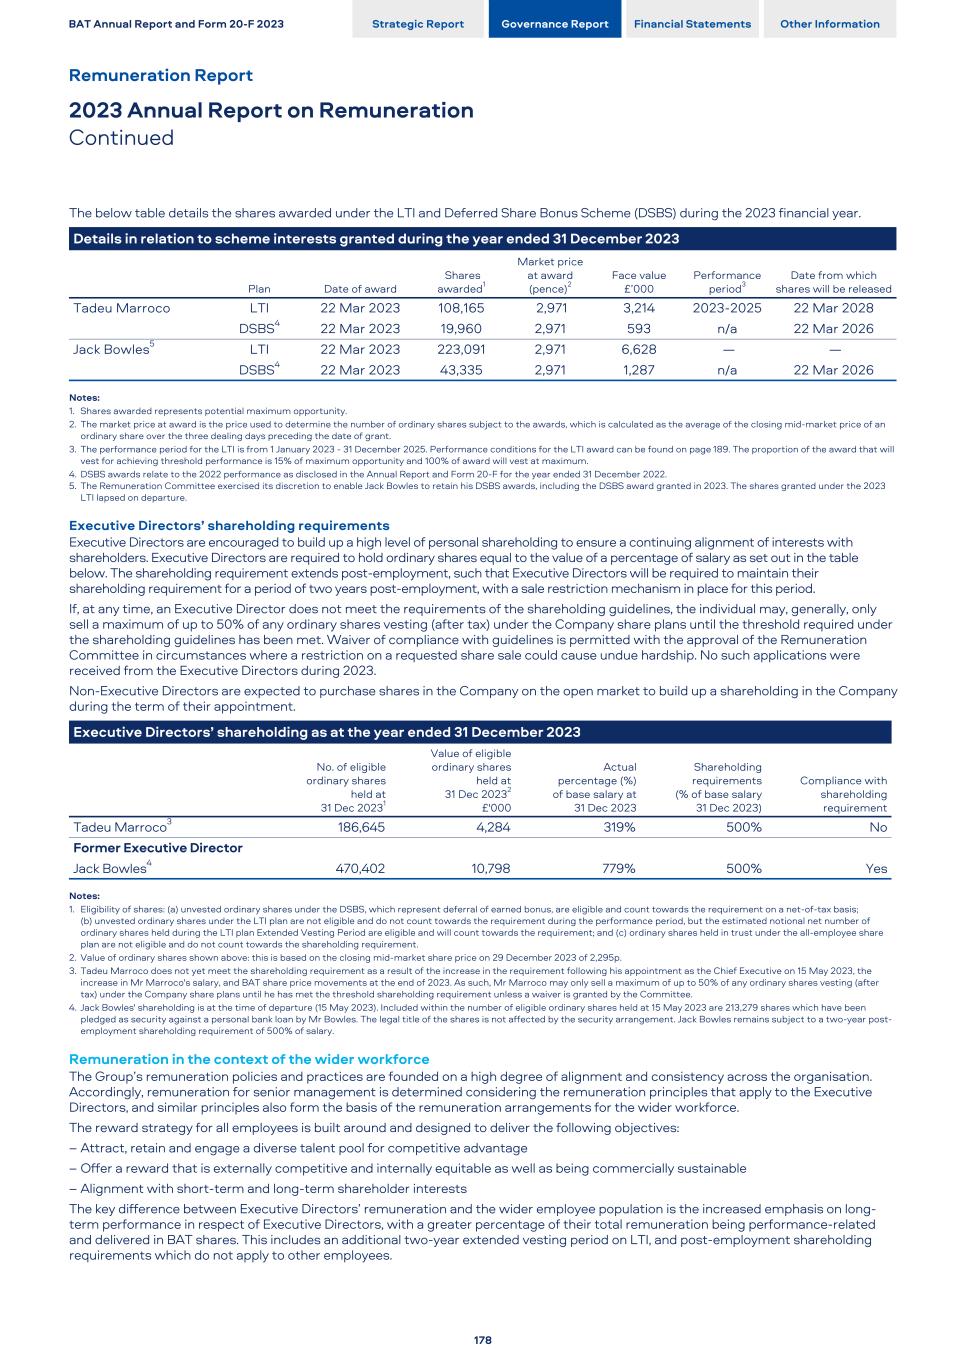
The below table details the shares awarded under the LTI and Deferred Share Bonus Scheme (DSBS) during the 2023 financial year. Details in relation to scheme interests granted during the year ended 31 December 2023 Plan Date of award Shares awarded1 Market price at award (pence)2 Face value £’000 Performance period3 Date from which shares will be released Tadeu Marroco LTI 22 Mar 2023 108,165 2,971 3,214 2023-2025 22 Mar 2028 DSBS4 22 Mar 2023 19,960 2,971 593 n/a 22 Mar 2026 Jack Bowles5 LTI 22 Mar 2023 223,091 2,971 6,628 — — DSBS4 22 Mar 2023 43,335 2,971 1,287 n/a 22 Mar 2026 Notes: 1. Shares awarded represents potential maximum opportunity. 2. The market price at award is the price used to determine the number of ordinary shares subject to the awards, which is calculated as the average of the closing mid-market price of an ordinary share over the three dealing days preceding the date of grant. 3. The performance period for the LTI is from 1 January 2023 - 31 December 2025. Performance conditions for the LTI award can be found on page 189. The proportion of the award that will vest for achieving threshold performance is 15% of maximum opportunity and 100% of award will vest at maximum. 4. DSBS awards relate to the 2022 performance as disclosed in the Annual Report and Form 20-F for the year ended 31 December 2022. 5. The Remuneration Committee exercised its discretion to enable Jack Bowles to retain his DSBS awards, including the DSBS award granted in 2023. The shares granted under the 2023 LTI lapsed on departure. Executive Directors’ shareholding requirements Executive Directors are encouraged to build up a high level of personal shareholding to ensure a continuing alignment of interests with shareholders. Executive Directors are required to hold ordinary shares equal to the value of a percentage of salary as set out in the table below. The shareholding requirement extends post-employment, such that Executive Directors will be required to maintain their shareholding requirement for a period of two years post-employment, with a sale restriction mechanism in place for this period. If, at any time, an Executive Director does not meet the requirements of the shareholding guidelines, the individual may, generally, only sell a maximum of up to 50% of any ordinary shares vesting (after tax) under the Company share plans until the threshold required under the shareholding guidelines has been met. Waiver of compliance with guidelines is permitted with the approval of the Remuneration Committee in circumstances where a restriction on a requested share sale could cause undue hardship. No such applications were received from the Executive Directors during 2023. Non-Executive Directors are expected to purchase shares in the Company on the open market to build up a shareholding in the Company during the term of their appointment. Executive Directors’ shareholding as at the year ended 31 December 2023 No. of eligible ordinary shares held at 31 Dec 20231 Value of eligible ordinary shares held at 31 Dec 20232 £'000 Actual percentage (%) of base salary at 31 Dec 2023 Shareholding requirements (% of base salary 31 Dec 2023) Compliance with shareholding requirement Tadeu Marroco3 186,645 4,284 319% 500% No Former Executive Director Jack Bowles4 470,402 10,798 779% 500% Yes Notes: 1. Eligibility of shares: (a) unvested ordinary shares under the DSBS, which represent deferral of earned bonus, are eligible and count towards the requirement on a net-of-tax basis; (b) unvested ordinary shares under the LTI plan are not eligible and do not count towards the requirement during the performance period, but the estimated notional net number of ordinary shares held during the LTI plan Extended Vesting Period are eligible and will count towards the requirement; and (c) ordinary shares held in trust under the all-employee share plan are not eligible and do not count towards the shareholding requirement. 2. Value of ordinary shares shown above: this is based on the closing mid-market share price on 29 December 2023 of 2,295p. 3. Tadeu Marroco does not yet meet the shareholding requirement as a result of the increase in the requirement following his appointment as the Chief Executive on 15 May 2023, the increase in Mr Marroco's salary, and BAT share price movements at the end of 2023. As such, Mr Marroco may only sell a maximum of up to 50% of any ordinary shares vesting (after tax) under the Company share plans until he has met the threshold shareholding requirement unless a waiver is granted by the Committee. 4. Jack Bowles' shareholding is at the time of departure (15 May 2023). Included within the number of eligible ordinary shares held at 15 May 2023 are 213,279 shares which have been pledged as security against a personal bank loan by Mr Bowles. The legal title of the shares is not affected by the security arrangement. Jack Bowles remains subject to a two-year post- employment shareholding requirement of 500% of salary. Remuneration in the context of the wider workforce The Group’s remuneration policies and practices are founded on a high degree of alignment and consistency across the organisation. Accordingly, remuneration for senior management is determined considering the remuneration principles that apply to the Executive Directors, and similar principles also form the basis of the remuneration arrangements for the wider workforce. The reward strategy for all employees is built around and designed to deliver the following objectives: – Attract, retain and engage a diverse talent pool for competitive advantage – Offer a reward that is externally competitive and internally equitable as well as being commercially sustainable – Alignment with short-term and long-term shareholder interests The key difference between Executive Directors’ remuneration and the wider employee population is the increased emphasis on long- term performance in respect of Executive Directors, with a greater percentage of their total remuneration being performance-related and delivered in BAT shares. This includes an additional two-year extended vesting period on LTI, and post-employment shareholding requirements which do not apply to other employees. BAT Annual Report and Form 20-F 2023 Strategic Report Governance Report Financial Statements Other Information Remuneration Report 2023 Annual Report on Remuneration Continued 178
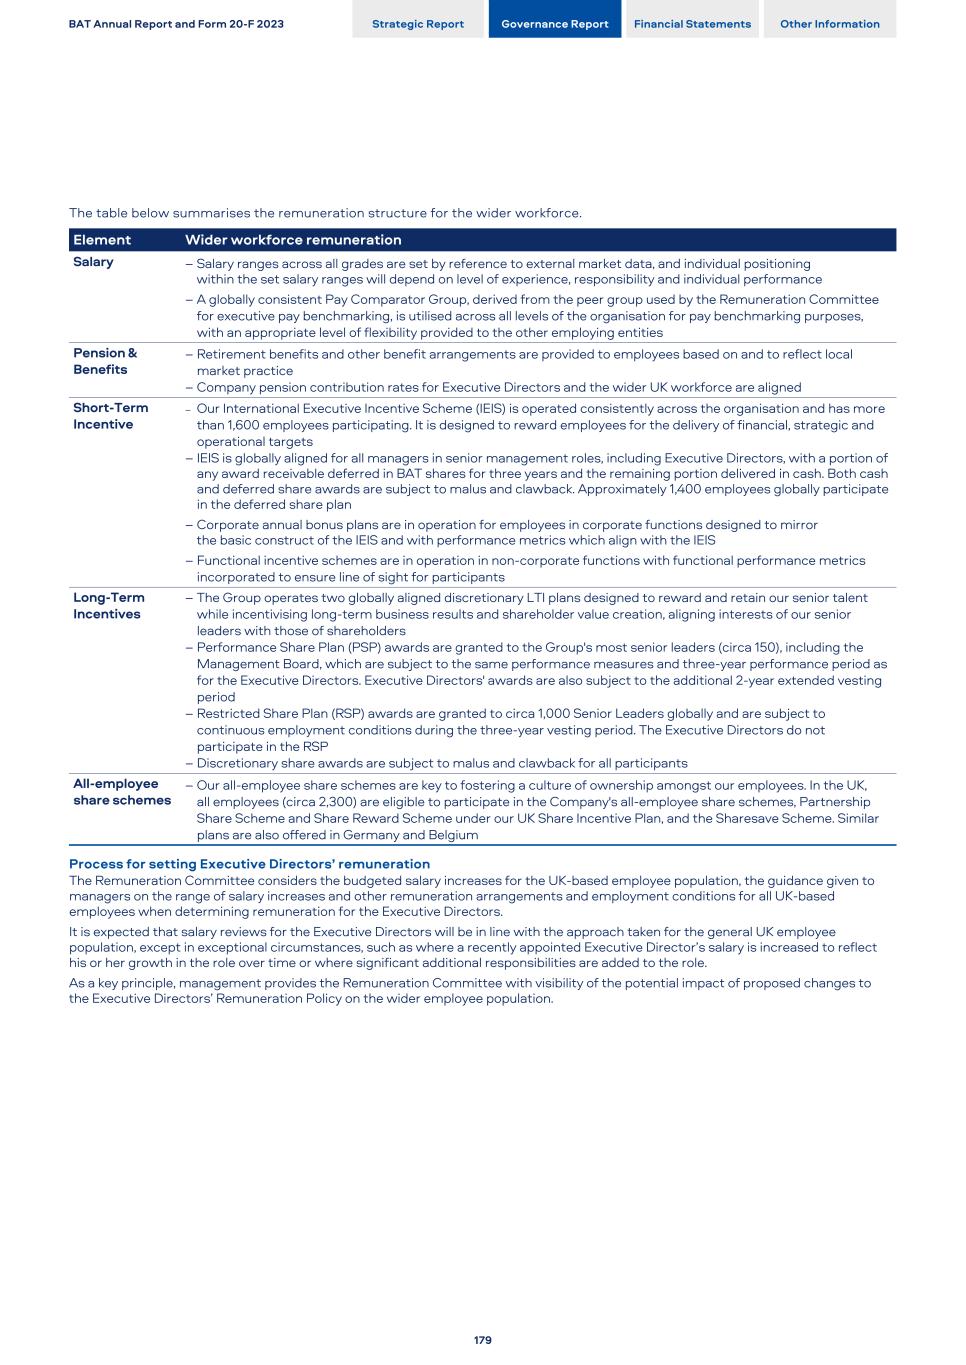
The table below summarises the remuneration structure for the wider workforce. Element Wider workforce remuneration Salary – Salary ranges across all grades are set by reference to external market data, and individual positioning within the set salary ranges will depend on level of experience, responsibility and individual performance – A globally consistent Pay Comparator Group, derived from the peer group used by the Remuneration Committee for executive pay benchmarking, is utilised across all levels of the organisation for pay benchmarking purposes, with an appropriate level of flexibility provided to the other employing entities Pension & Benefits – Retirement benefits and other benefit arrangements are provided to employees based on and to reflect local market practice – Company pension contribution rates for Executive Directors and the wider UK workforce are aligned Short-Term Incentive – Our International Executive Incentive Scheme (IEIS) is operated consistently across the organisation and has more than 1,600 employees participating. It is designed to reward employees for the delivery of financial, strategic and operational targets – IEIS is globally aligned for all managers in senior management roles, including Executive Directors, with a portion of any award receivable deferred in BAT shares for three years and the remaining portion delivered in cash. Both cash and deferred share awards are subject to malus and clawback. Approximately 1,400 employees globally participate in the deferred share plan – Corporate annual bonus plans are in operation for employees in corporate functions designed to mirror the basic construct of the IEIS and with performance metrics which align with the IEIS – Functional incentive schemes are in operation in non-corporate functions with functional performance metrics incorporated to ensure line of sight for participants Long-Term Incentives – The Group operates two globally aligned discretionary LTI plans designed to reward and retain our senior talent while incentivising long-term business results and shareholder value creation, aligning interests of our senior leaders with those of shareholders – Performance Share Plan (PSP) awards are granted to the Group's most senior leaders (circa 150), including the Management Board, which are subject to the same performance measures and three-year performance period as for the Executive Directors. Executive Directors' awards are also subject to the additional 2-year extended vesting period – Restricted Share Plan (RSP) awards are granted to circa 1,000 Senior Leaders globally and are subject to continuous employment conditions during the three-year vesting period. The Executive Directors do not participate in the RSP – Discretionary share awards are subject to malus and clawback for all participants All-employee share schemes – Our all-employee share schemes are key to fostering a culture of ownership amongst our employees. In the UK, all employees (circa 2,300) are eligible to participate in the Company's all-employee share schemes, Partnership Share Scheme and Share Reward Scheme under our UK Share Incentive Plan, and the Sharesave Scheme. Similar plans are also offered in Germany and Belgium Process for setting Executive Directors’ remuneration The Remuneration Committee considers the budgeted salary increases for the UK-based employee population, the guidance given to managers on the range of salary increases and other remuneration arrangements and employment conditions for all UK-based employees when determining remuneration for the Executive Directors. It is expected that salary reviews for the Executive Directors will be in line with the approach taken for the general UK employee population, except in exceptional circumstances, such as where a recently appointed Executive Director’s salary is increased to reflect his or her growth in the role over time or where significant additional responsibilities are added to the role. As a key principle, management provides the Remuneration Committee with visibility of the potential impact of proposed changes to the Executive Directors’ Remuneration Policy on the wider employee population. BAT Annual Report and Form 20-F 2023 Strategic Report Governance Report Financial Statements Other Information 179
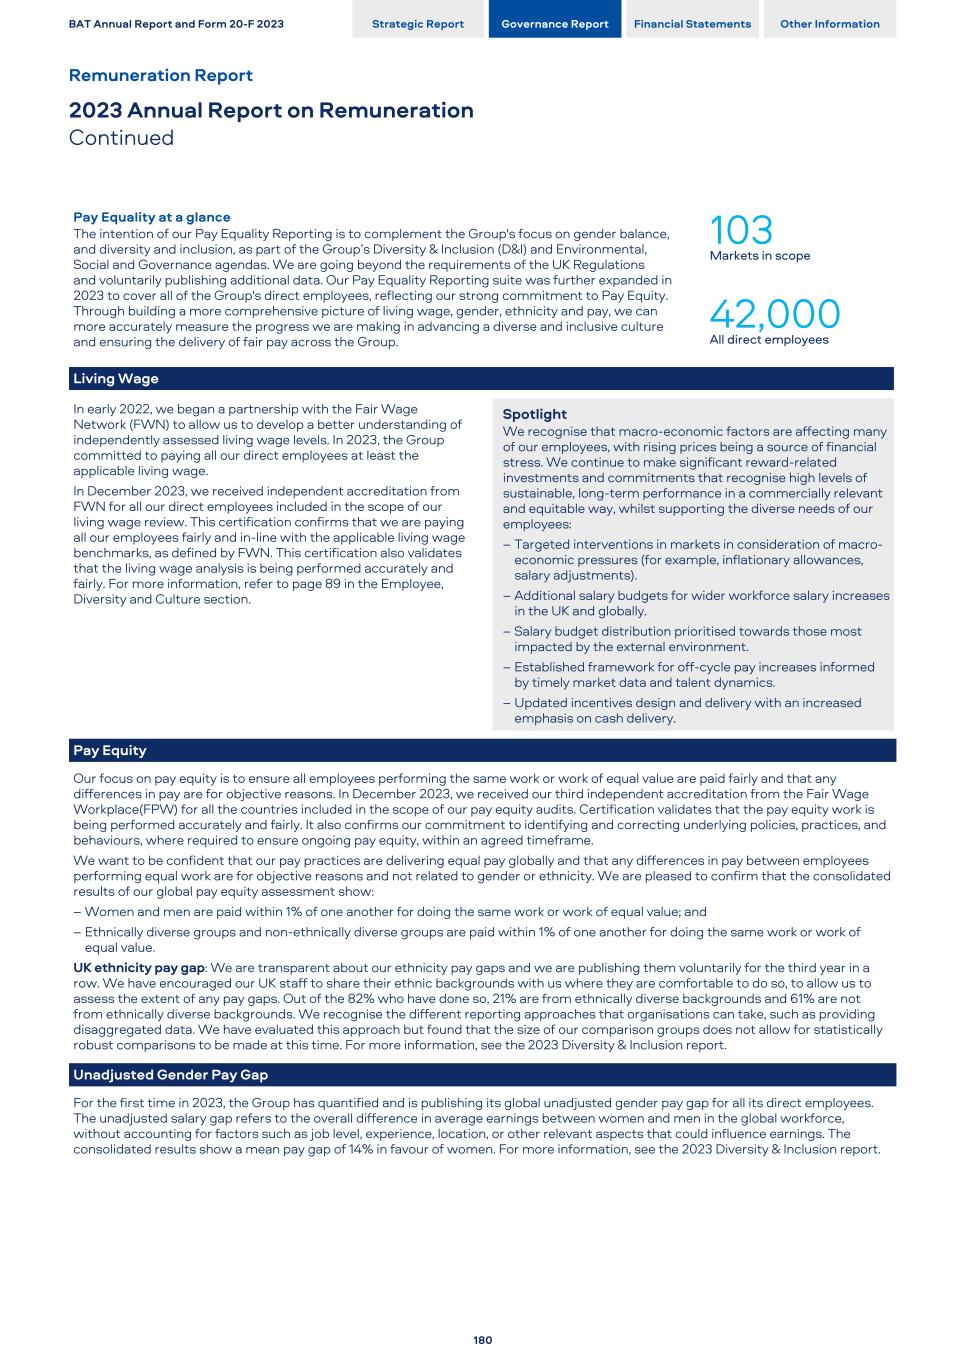
Pay Equality at a glance The intention of our Pay Equality Reporting is to complement the Group's focus on gender balance, and diversity and inclusion, as part of the Group’s Diversity & Inclusion (D&I) and Environmental, Social and Governance agendas. We are going beyond the requirements of the UK Regulations and voluntarily publishing additional data. Our Pay Equality Reporting suite was further expanded in 2023 to cover all of the Group's direct employees, reflecting our strong commitment to Pay Equity. Through building a more comprehensive picture of living wage, gender, ethnicity and pay, we can more accurately measure the progress we are making in advancing a diverse and inclusive culture and ensuring the delivery of fair pay across the Group. 103 Markets in scope 42,000 All direct employees Living Wage In early 2022, we began a partnership with the Fair Wage Network (FWN) to allow us to develop a better understanding of independently assessed living wage levels. In 2023, the Group committed to paying all our direct employees at least the applicable living wage. In December 2023, we received independent accreditation from FWN for all our direct employees included in the scope of our living wage review. This certification confirms that we are paying all our employees fairly and in-line with the applicable living wage benchmarks, as defined by FWN. This certification also validates that the living wage analysis is being performed accurately and fairly. For more information, refer to page 89 in the Employee, Diversity and Culture section. Spotlight We recognise that macro-economic factors are affecting many of our employees, with rising prices being a source of financial stress. We continue to make significant reward-related investments and commitments that recognise high levels of sustainable, long-term performance in a commercially relevant and equitable way, whilst supporting the diverse needs of our employees: – Targeted interventions in markets in consideration of macro- economic pressures (for example, inflationary allowances, salary adjustments). – Additional salary budgets for wider workforce salary increases in the UK and globally. – Salary budget distribution prioritised towards those most impacted by the external environment. – Established framework for off-cycle pay increases informed by timely market data and talent dynamics. – Updated incentives design and delivery with an increased emphasis on cash delivery. Pay Equity Our focus on pay equity is to ensure all employees performing the same work or work of equal value are paid fairly and that any differences in pay are for objective reasons. In December 2023, we received our third independent accreditation from the Fair Wage Workplace(FPW) for all the countries included in the scope of our pay equity audits. Certification validates that the pay equity work is being performed accurately and fairly. It also confirms our commitment to identifying and correcting underlying policies, practices, and behaviours, where required to ensure ongoing pay equity, within an agreed timeframe. We want to be confident that our pay practices are delivering equal pay globally and that any differences in pay between employees performing equal work are for objective reasons and not related to gender or ethnicity. We are pleased to confirm that the consolidated results of our global pay equity assessment show: – Women and men are paid within 1% of one another for doing the same work or work of equal value; and – Ethnically diverse groups and non-ethnically diverse groups are paid within 1% of one another for doing the same work or work of equal value. UK ethnicity pay gap: We are transparent about our ethnicity pay gaps and we are publishing them voluntarily for the third year in a row. We have encouraged our UK staff to share their ethnic backgrounds with us where they are comfortable to do so, to allow us to assess the extent of any pay gaps. Out of the 82% who have done so, 21% are from ethnically diverse backgrounds and 61% are not from ethnically diverse backgrounds. We recognise the different reporting approaches that organisations can take, such as providing disaggregated data. We have evaluated this approach but found that the size of our comparison groups does not allow for statistically robust comparisons to be made at this time. For more information, see the 2023 Diversity & Inclusion report. Unadjusted Gender Pay Gap For the first time in 2023, the Group has quantified and is publishing its global unadjusted gender pay gap for all its direct employees. The unadjusted salary gap refers to the overall difference in average earnings between women and men in the global workforce, without accounting for factors such as job level, experience, location, or other relevant aspects that could influence earnings. The consolidated results show a mean pay gap of 14% in favour of women. For more information, see the 2023 Diversity & Inclusion report. BAT Annual Report and Form 20-F 2023 Strategic Report Governance Report Financial Statements Other Information Remuneration Report 2023 Annual Report on Remuneration Continued 180
Workforce engagement The Board keeps up to date with the current views of our wider workforce and provides the workforce with information, including on how executive pay and the pay of the wider workforce are aligned, through a combination of engagement methods across multiple channels at different levels of our organisation. Let’s Talk – our all-employee virtual call In addition to the regular workforce engagement activities, in 2023, we conducted our all-employee biennial “Your Voice” survey and introduced new activities: – Your Voice 2023: we conducted our latest Your Voice global employee survey with the results of this survey serving as a factor in shaping the reward agenda of the organisation. The employees' views from the survey were collated and presented to the Board. – Values and Culture focus groups: we have run employee global focus groups, where the Chief Executive and the Management Board sought employees’ views about BAT's Core Values, what employees appreciated about our current culture and where it could be improved. – Let’s Talk: we have also introduced Let’s Talk, our new all-employee virtual call where employees can ask the Chief Executive and the Management Board any questions, offering an opportunity to talk freely with no scripts, no slides and no filters. These all- employee calls are designed to open a two-way, transparent dialogue directly with the Management Board and support our cultural transformation to drive a collaborative and empowering culture. Feedback from these channels is collected across the Group and is independently analysed to ascertain the priority themes. The consolidated feedback and themes are reviewed by our Board each year as part of our Workforce Voice in the Boardroom programme, which gives the Board an opportunity to understand the views of our workforce, review details of the key themes identified and evaluate how we have responded. The views of our workforce are a key consideration for the Remuneration Committee when reviewing the reward priorities of the organisation. Your Voice – our global employee survey Speak Up channels – Global and independently managed Employee Focus Groups Town Halls Works Councils Directors’ market and site visits There continues to be an ongoing dialogue with employees, through a variety of channels, about the Company’s pay practices. Through share ownership as a result of our all-employee share schemes, our employees are invited to vote on the Directors' Remuneration Policy and Report at our Annual General Meeting in the same way as our wider shareholders. In addition to the Workforce Voice in the Boardroom programme (discussed on page 148), the Main Board also receives updates from management on feedback received during the year where relevant to remuneration matters considered by the Remuneration Committee and takes feedback into account as applicable in determining executive remuneration. The Remuneration Committee is regularly updated on the pay principles and practices in operation across the Group and considers them in relation to the implementation of the Directors’ Remuneration Policy, and in ensuring there is an appropriate degree of alignment throughout the Group. Matters considered by the Committee during 2023 included the design of the Group's incentive plans as applicable to the wider management population, including incentive opportunity levels. BAT Annual Report and Form 20-F 2023 Strategic Report Governance Report Financial Statements Other Information 181
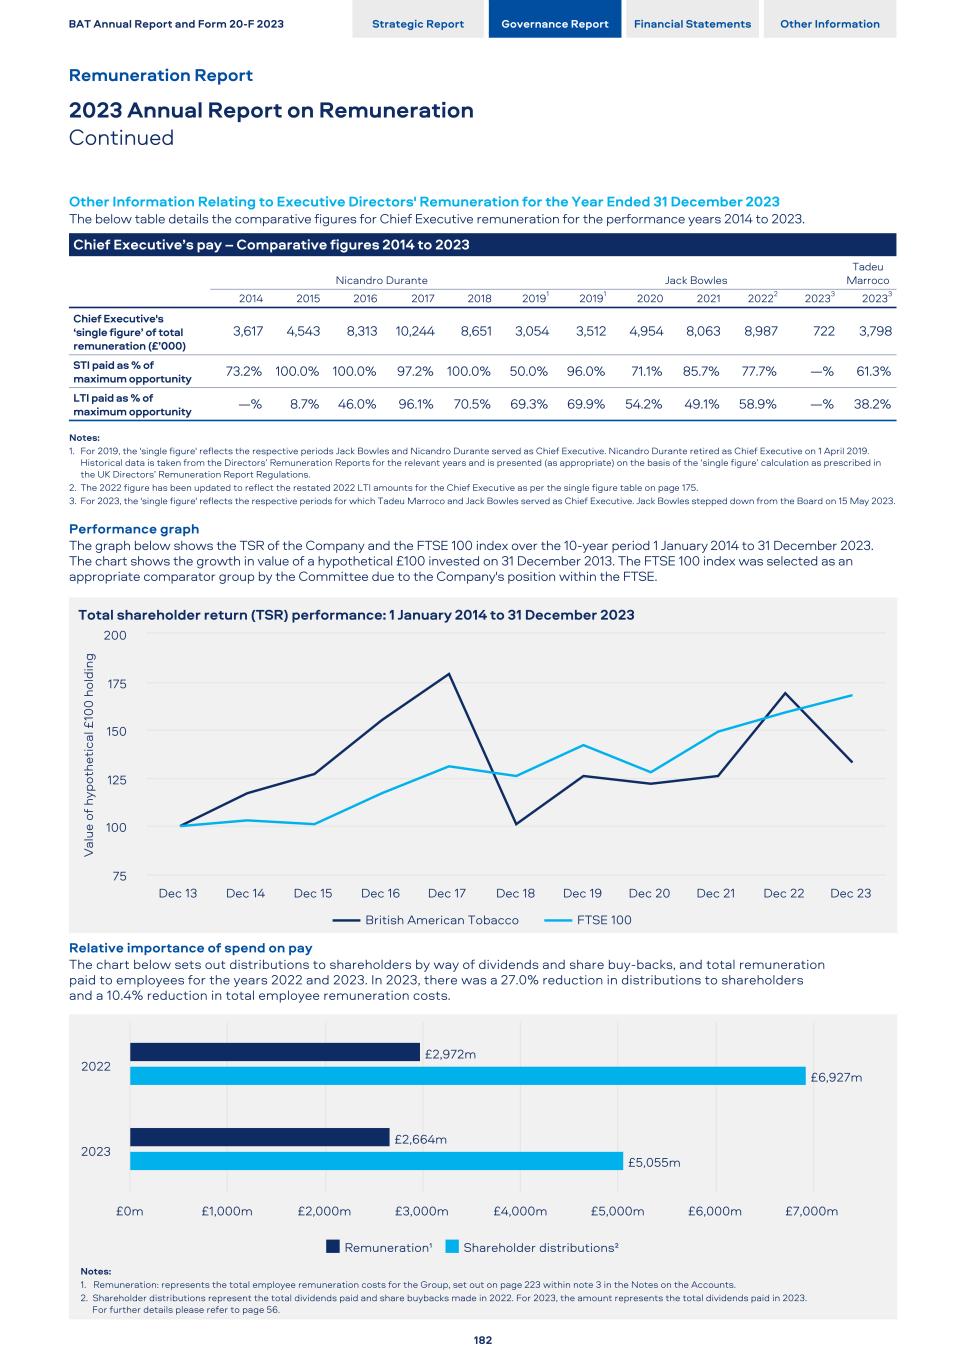
Other Information Relating to Executive Directors' Remuneration for the Year Ended 31 December 2023 The below table details the comparative figures for Chief Executive remuneration for the performance years 2014 to 2023. Chief Executive’s pay – Comparative figures 2014 to 2023 Nicandro Durante Jack Bowles Tadeu Marroco 2014 2015 2016 2017 2018 20191 20191 2020 2021 20222 20233 20233 Chief Executive's ‘single figure’ of total remuneration (£’000) 3,617 4,543 8,313 10,244 8,651 3,054 3,512 4,954 8,063 8,987 722 3,798 STI paid as % of maximum opportunity 73.2% 100.0% 100.0% 97.2% 100.0% 50.0% 96.0% 71.1% 85.7% 77.7% —% 61.3% LTI paid as % of maximum opportunity —% 8.7% 46.0% 96.1% 70.5% 69.3% 69.9% 54.2% 49.1% 58.9% —% 38.2% Notes: 1. For 2019, the 'single figure' reflects the respective periods Jack Bowles and Nicandro Durante served as Chief Executive. Nicandro Durante retired as Chief Executive on 1 April 2019. Historical data is taken from the Directors’ Remuneration Reports for the relevant years and is presented (as appropriate) on the basis of the ‘single figure’ calculation as prescribed in the UK Directors’ Remuneration Report Regulations. 2. The 2022 figure has been updated to reflect the restated 2022 LTI amounts for the Chief Executive as per the single figure table on page 175. 3. For 2023, the 'single figure' reflects the respective periods for which Tadeu Marroco and Jack Bowles served as Chief Executive. Jack Bowles stepped down from the Board on 15 May 2023. Performance graph The graph below shows the TSR of the Company and the FTSE 100 index over the 10-year period 1 January 2014 to 31 December 2023. The chart shows the growth in value of a hypothetical £100 invested on 31 December 2013. The FTSE 100 index was selected as an appropriate comparator group by the Committee due to the Company's position within the FTSE. Total shareholder return (TSR) performance: 1 January 2014 to 31 December 2023 V al ue o f h yp ot he ti ca l £ 10 0 h ol di ng British American Tobacco FTSE 100 Dec 13 Dec 14 Dec 15 Dec 16 Dec 17 Dec 18 Dec 19 Dec 20 Dec 21 Dec 22 Dec 23 75 100 125 150 175 200 Relative importance of spend on pay The chart below sets out distributions to shareholders by way of dividends and share buy-backs, and total remuneration paid to employees for the years 2022 and 2023. In 2023, there was a 27.0% reduction in distributions to shareholders and a 10.4% reduction in total employee remuneration costs. £2,972m £2,664m £6,927m £5,055m Remuneration¹ Shareholder distributions² 2022 2023 £0m £1,000m £2,000m £3,000m £4,000m £5,000m £6,000m £7,000m Notes: 1. Remuneration: represents the total employee remuneration costs for the Group, set out on page 223 within note 3 in the Notes on the Accounts. 2. Shareholder distributions represent the total dividends paid and share buybacks made in 2022. For 2023, the amount represents the total dividends paid in 2023. For further details please refer to page 56. BAT Annual Report and Form 20-F 2023 Strategic Report Governance Report Financial Statements Other Information Remuneration Report 2023 Annual Report on Remuneration Continued 182
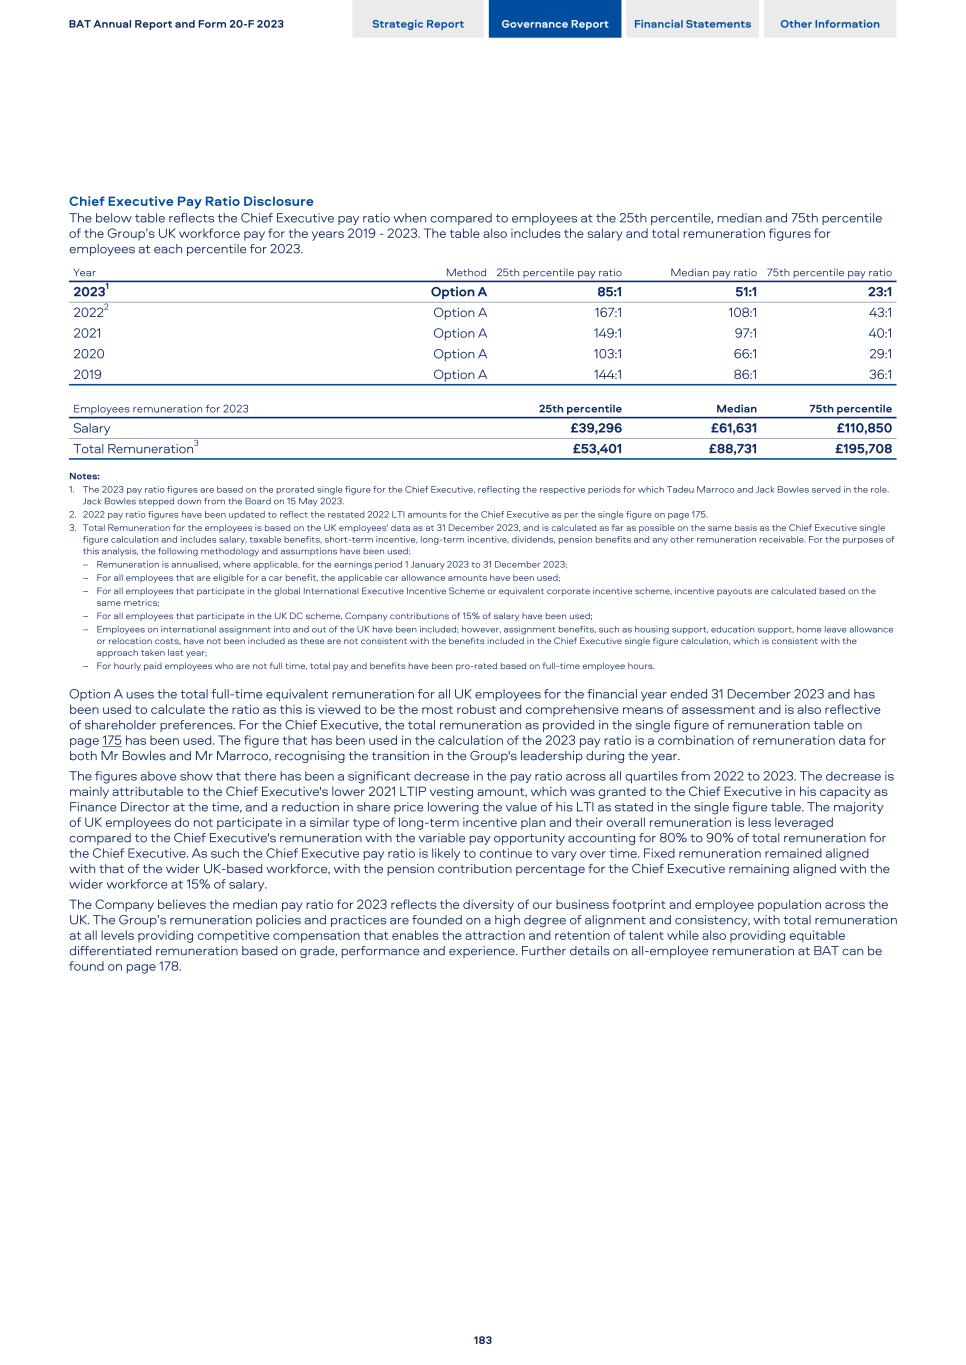
Chief Executive Pay Ratio Disclosure The below table reflects the Chief Executive pay ratio when compared to employees at the 25th percentile, median and 75th percentile of the Group’s UK workforce pay for the years 2019 - 2023. The table also includes the salary and total remuneration figures for employees at each percentile for 2023. Year Method 25th percentile pay ratio Median pay ratio 75th percentile pay ratio 20231 Option A 85:1 51:1 23:1 20222 Option A 167:1 108:1 43:1 2021 Option A 149:1 97:1 40:1 2020 Option A 103:1 66:1 29:1 2019 Option A 144:1 86:1 36:1 Employees remuneration for 2023 25th percentile Median 75th percentile Salary £39,296 £61,631 £110,850 Total Remuneration3 £53,401 £88,731 £195,708 Notes: 1. The 2023 pay ratio figures are based on the prorated single figure for the Chief Executive, reflecting the respective periods for which Tadeu Marroco and Jack Bowles served in the role. Jack Bowles stepped down from the Board on 15 May 2023. 2. 2022 pay ratio figures have been updated to reflect the restated 2022 LTI amounts for the Chief Executive as per the single figure on page 175. 3. Total Remuneration for the employees is based on the UK employees' data as at 31 December 2023, and is calculated as far as possible on the same basis as the Chief Executive single figure calculation and includes salary, taxable benefits, short-term incentive, long-term incentive, dividends, pension benefits and any other remuneration receivable. For the purposes of this analysis, the following methodology and assumptions have been used: – Remuneration is annualised, where applicable, for the earnings period 1 January 2023 to 31 December 2023; – For all employees that are eligible for a car benefit, the applicable car allowance amounts have been used; – For all employees that participate in the global International Executive Incentive Scheme or equivalent corporate incentive scheme, incentive payouts are calculated based on the same metrics; – For all employees that participate in the UK DC scheme, Company contributions of 15% of salary have been used; – Employees on international assignment into and out of the UK have been included; however, assignment benefits, such as housing support, education support, home leave allowance or relocation costs, have not been included as these are not consistent with the benefits included in the Chief Executive single figure calculation, which is consistent with the approach taken last year; – For hourly paid employees who are not full time, total pay and benefits have been pro-rated based on full-time employee hours. Option A uses the total full-time equivalent remuneration for all UK employees for the financial year ended 31 December 2023 and has been used to calculate the ratio as this is viewed to be the most robust and comprehensive means of assessment and is also reflective of shareholder preferences. For the Chief Executive, the total remuneration as provided in the single figure of remuneration table on page 175 has been used. The figure that has been used in the calculation of the 2023 pay ratio is a combination of remuneration data for both Mr Bowles and Mr Marroco, recognising the transition in the Group's leadership during the year. The figures above show that there has been a significant decrease in the pay ratio across all quartiles from 2022 to 2023. The decrease is mainly attributable to the Chief Executive's lower 2021 LTIP vesting amount, which was granted to the Chief Executive in his capacity as Finance Director at the time, and a reduction in share price lowering the value of his LTI as stated in the single figure table. The majority of UK employees do not participate in a similar type of long-term incentive plan and their overall remuneration is less leveraged compared to the Chief Executive's remuneration with the variable pay opportunity accounting for 80% to 90% of total remuneration for the Chief Executive. As such the Chief Executive pay ratio is likely to continue to vary over time. Fixed remuneration remained aligned with that of the wider UK-based workforce, with the pension contribution percentage for the Chief Executive remaining aligned with the wider workforce at 15% of salary. The Company believes the median pay ratio for 2023 reflects the diversity of our business footprint and employee population across the UK. The Group’s remuneration policies and practices are founded on a high degree of alignment and consistency, with total remuneration at all levels providing competitive compensation that enables the attraction and retention of talent while also providing equitable differentiated remuneration based on grade, performance and experience. Further details on all-employee remuneration at BAT can be found on page 178. BAT Annual Report and Form 20-F 2023 Strategic Report Governance Report Financial Statements Other Information 183
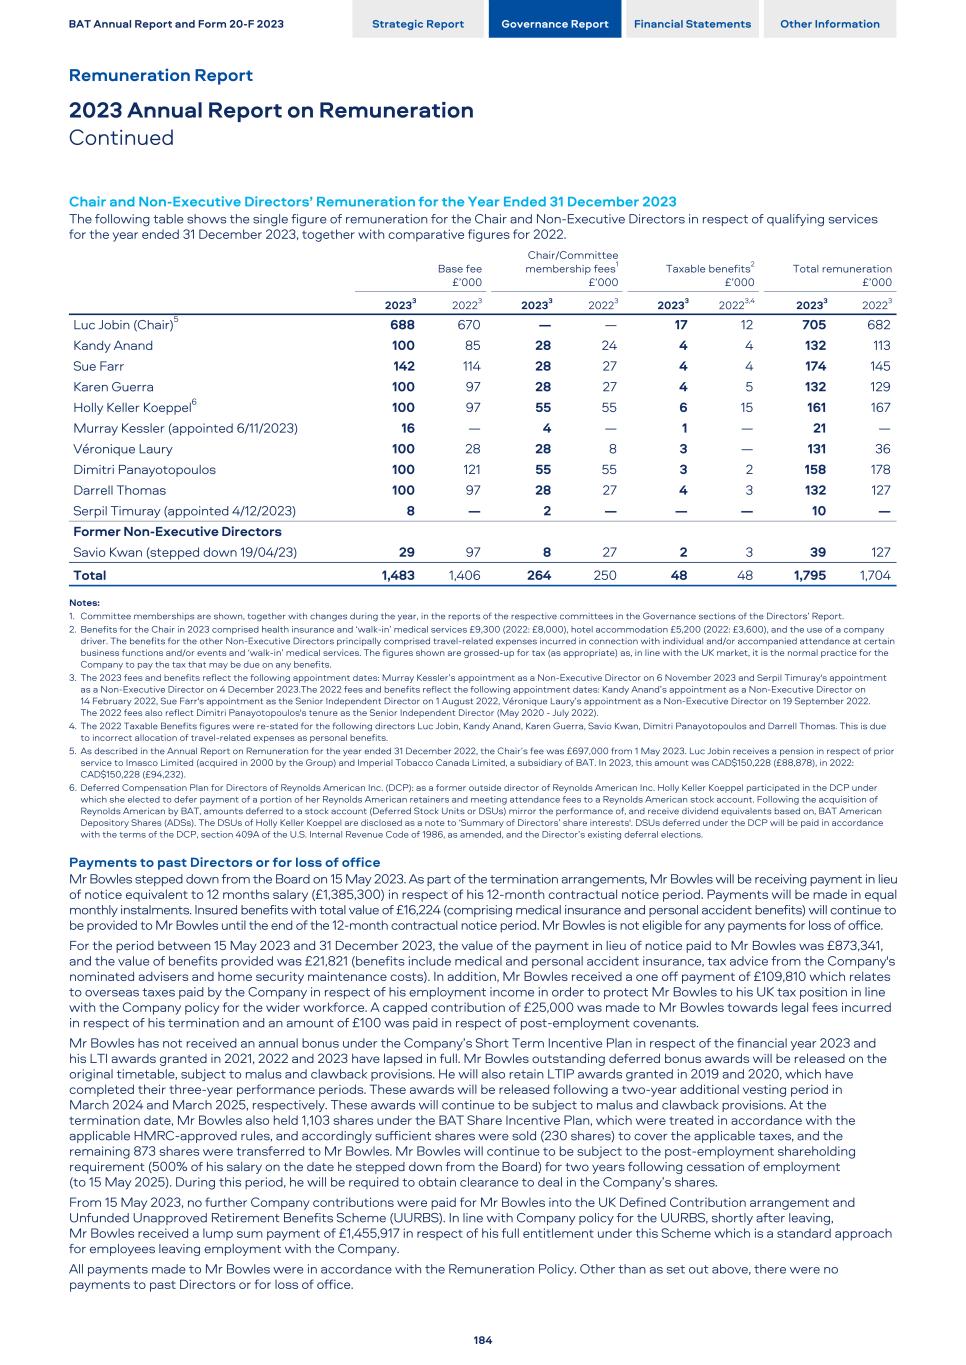
Chair and Non-Executive Directors’ Remuneration for the Year Ended 31 December 2023 The following table shows the single figure of remuneration for the Chair and Non-Executive Directors in respect of qualifying services for the year ended 31 December 2023, together with comparative figures for 2022. Base fee £’000 Chair/Committee membership fees1 £’000 Taxable benefits2 £’000 Total remuneration £’000 20233 20223 20233 20223 20233 20223,4 20233 20223 Luc Jobin (Chair)5 688 670 — — 17 12 705 682 Kandy Anand 100 85 28 24 4 4 132 113 Sue Farr 142 114 28 27 4 4 174 145 Karen Guerra 100 97 28 27 4 5 132 129 Holly Keller Koeppel6 100 97 55 55 6 15 161 167 Murray Kessler (appointed 6/11/2023) 16 — 4 — 1 — 21 — Véronique Laury 100 28 28 8 3 — 131 36 Dimitri Panayotopoulos 100 121 55 55 3 2 158 178 Darrell Thomas 100 97 28 27 4 3 132 127 Serpil Timuray (appointed 4/12/2023) 8 — 2 — — — — — 10 — Former Non-Executive Directors Savio Kwan (stepped down 19/04/23) 29 97 8 27 2 3 39 127 Total 1,483 1,406 264 250 48 48 1,795 1,704 Notes: 1. Committee memberships are shown, together with changes during the year, in the reports of the respective committees in the Governance sections of the Directors’ Report. 2. Benefits for the Chair in 2023 comprised health insurance and ‘walk-in’ medical services £9,300 (2022: £8,000), hotel accommodation £5,200 (2022: £3,600), and the use of a company driver. The benefits for the other Non-Executive Directors principally comprised travel-related expenses incurred in connection with individual and/or accompanied attendance at certain business functions and/or events and ‘walk-in’ medical services. The figures shown are grossed-up for tax (as appropriate) as, in line with the UK market, it is the normal practice for the Company to pay the tax that may be due on any benefits. 3. The 2023 fees and benefits reflect the following appointment dates: Murray Kessler’s appointment as a Non-Executive Director on 6 November 2023 and Serpil Timuray's appointment as a Non-Executive Director on 4 December 2023.The 2022 fees and benefits reflect the following appointment dates: Kandy Anand’s appointment as a Non-Executive Director on 14 February 2022, Sue Farr's appointment as the Senior Independent Director on 1 August 2022, Véronique Laury’s appointment as a Non-Executive Director on 19 September 2022. The 2022 fees also reflect Dimitri Panayotopoulos's tenure as the Senior Independent Director (May 2020 - July 2022). 4. The 2022 Taxable Benefits figures were re-stated for the following directors Luc Jobin, Kandy Anand, Karen Guerra, Savio Kwan, Dimitri Panayotopoulos and Darrell Thomas. This is due to incorrect allocation of travel-related expenses as personal benefits. 5. As described in the Annual Report on Remuneration for the year ended 31 December 2022, the Chair’s fee was £697,000 from 1 May 2023. Luc Jobin receives a pension in respect of prior service to Imasco Limited (acquired in 2000 by the Group) and Imperial Tobacco Canada Limited, a subsidiary of BAT. In 2023, this amount was CAD$150,228 (£88,878), in 2022: CAD$150,228 (£94,232). 6. Deferred Compensation Plan for Directors of Reynolds American Inc. (DCP): as a former outside director of Reynolds American Inc. Holly Keller Koeppel participated in the DCP under which she elected to defer payment of a portion of her Reynolds American retainers and meeting attendance fees to a Reynolds American stock account. Following the acquisition of Reynolds American by BAT, amounts deferred to a stock account (Deferred Stock Units or DSUs) mirror the performance of, and receive dividend equivalents based on, BAT American Depository Shares (ADSs). The DSUs of Holly Keller Koeppel are disclosed as a note to ‘Summary of Directors’ share interests'. DSUs deferred under the DCP will be paid in accordance with the terms of the DCP, section 409A of the U.S. Internal Revenue Code of 1986, as amended, and the Director’s existing deferral elections. Payments to past Directors or for loss of office Mr Bowles stepped down from the Board on 15 May 2023. As part of the termination arrangements, Mr Bowles will be receiving payment in lieu of notice equivalent to 12 months salary (£1,385,300) in respect of his 12-month contractual notice period. Payments will be made in equal monthly instalments. Insured benefits with total value of £16,224 (comprising medical insurance and personal accident benefits) will continue to be provided to Mr Bowles until the end of the 12-month contractual notice period. Mr Bowles is not eligible for any payments for loss of office. For the period between 15 May 2023 and 31 December 2023, the value of the payment in lieu of notice paid to Mr Bowles was £873,341, and the value of benefits provided was £21,821 (benefits include medical and personal accident insurance, tax advice from the Company's nominated advisers and home security maintenance costs). In addition, Mr Bowles received a one off payment of £109,810 which relates to overseas taxes paid by the Company in respect of his employment income in order to protect Mr Bowles to his UK tax position in line with the Company policy for the wider workforce. A capped contribution of £25,000 was made to Mr Bowles towards legal fees incurred in respect of his termination and an amount of £100 was paid in respect of post-employment covenants. Mr Bowles has not received an annual bonus under the Company’s Short Term Incentive Plan in respect of the financial year 2023 and his LTI awards granted in 2021, 2022 and 2023 have lapsed in full. Mr Bowles outstanding deferred bonus awards will be released on the original timetable, subject to malus and clawback provisions. He will also retain LTIP awards granted in 2019 and 2020, which have completed their three-year performance periods. These awards will be released following a two-year additional vesting period in March 2024 and March 2025, respectively. These awards will continue to be subject to malus and clawback provisions. At the termination date, Mr Bowles also held 1,103 shares under the BAT Share Incentive Plan, which were treated in accordance with the applicable HMRC-approved rules, and accordingly sufficient shares were sold (230 shares) to cover the applicable taxes, and the remaining 873 shares were transferred to Mr Bowles. Mr Bowles will continue to be subject to the post-employment shareholding requirement (500% of his salary on the date he stepped down from the Board) for two years following cessation of employment (to 15 May 2025). During this period, he will be required to obtain clearance to deal in the Company’s shares. From 15 May 2023, no further Company contributions were paid for Mr Bowles into the UK Defined Contribution arrangement and Unfunded Unapproved Retirement Benefits Scheme (UURBS). In line with Company policy for the UURBS, shortly after leaving, Mr Bowles received a lump sum payment of £1,455,917 in respect of his full entitlement under this Scheme which is a standard approach for employees leaving employment with the Company. All payments made to Mr Bowles were in accordance with the Remuneration Policy. Other than as set out above, there were no payments to past Directors or for loss of office. BAT Annual Report and Form 20-F 2023 Strategic Report Governance Report Financial Statements Other Information Remuneration Report 2023 Annual Report on Remuneration Continued 184
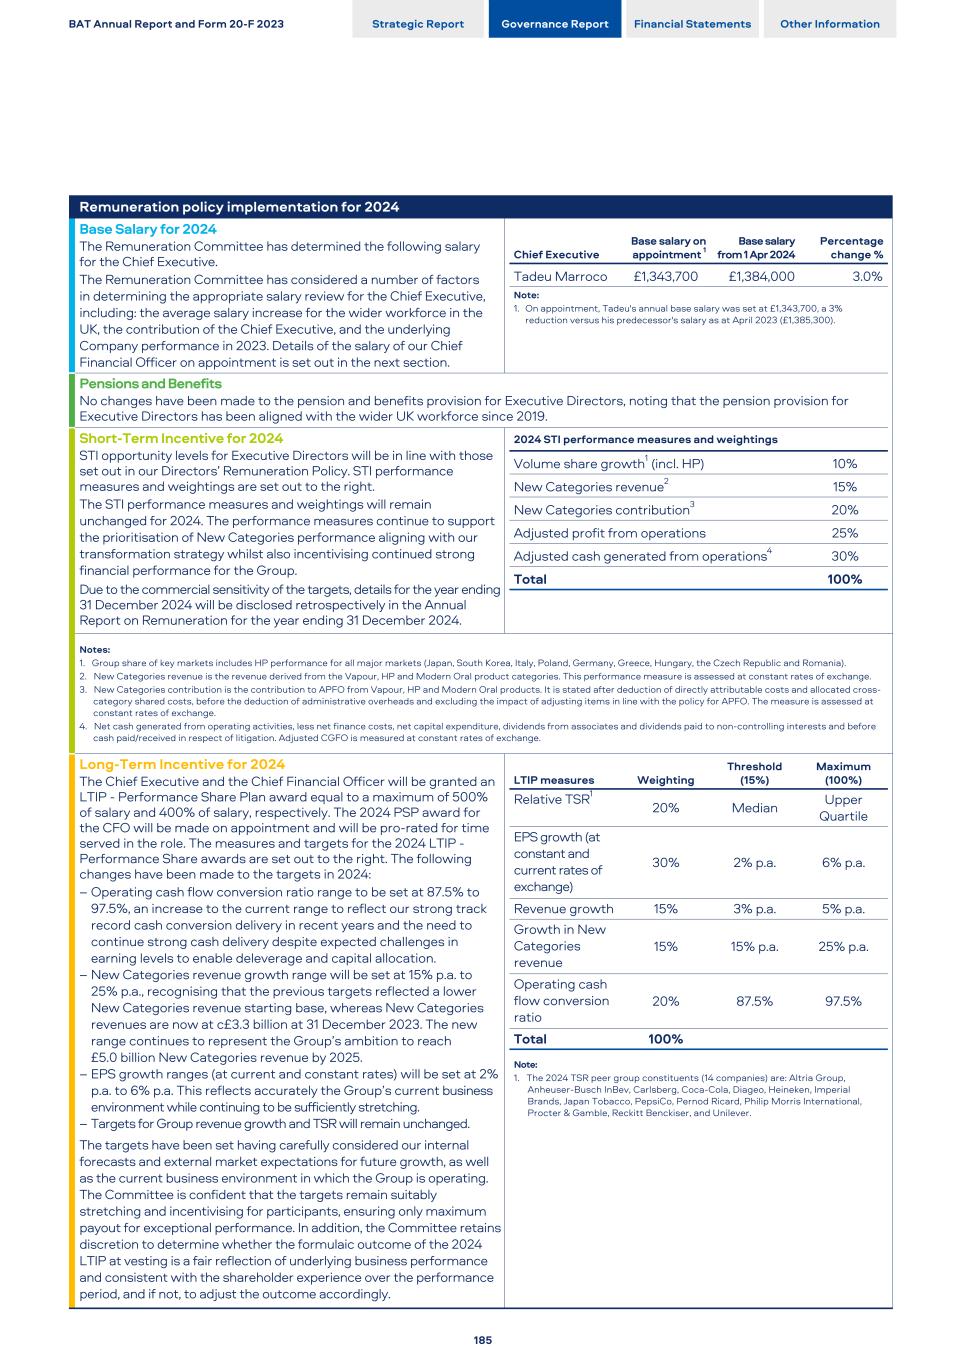
Remuneration policy implementation for 2024 Base Salary for 2024 The Remuneration Committee has determined the following salary for the Chief Executive. The Remuneration Committee has considered a number of factors in determining the appropriate salary review for the Chief Executive, including: the average salary increase for the wider workforce in the UK, the contribution of the Chief Executive, and the underlying Company performance in 2023. Details of the salary of our Chief Financial Officer on appointment is set out in the next section. Chief Executive Base salary on appointment 1 Base salary from 1 Apr 2024 Percentage change % Tadeu Marroco £1,343,700 £1,384,000 3.0% Note: 1. On appointment, Tadeu's annual base salary was set at £1,343,700, a 3% reduction versus his predecessor's salary as at April 2023 (£1,385,300). Pensions and Benefits No changes have been made to the pension and benefits provision for Executive Directors, noting that the pension provision for Executive Directors has been aligned with the wider UK workforce since 2019. Short-Term Incentive for 2024 STI opportunity levels for Executive Directors will be in line with those set out in our Directors’ Remuneration Policy. STI performance measures and weightings are set out to the right. The STI performance measures and weightings will remain unchanged for 2024. The performance measures continue to support the prioritisation of New Categories performance aligning with our transformation strategy whilst also incentivising continued strong financial performance for the Group. Due to the commercial sensitivity of the targets, details for the year ending 31 December 2024 will be disclosed retrospectively in the Annual Report on Remuneration for the year ending 31 December 2024. 2024 STI performance measures and weightings Volume share growth1 (incl. HP) 10% New Categories revenue2 15% New Categories contribution3 20% Adjusted profit from operations 25% Adjusted cash generated from operations4 30% Total 100% Notes: 1. Group share of key markets includes HP performance for all major markets (Japan, South Korea, Italy, Poland, Germany, Greece, Hungary, the Czech Republic and Romania). 2. New Categories revenue is the revenue derived from the Vapour, HP and Modern Oral product categories. This performance measure is assessed at constant rates of exchange. 3. New Categories contribution is the contribution to APFO from Vapour, HP and Modern Oral products. It is stated after deduction of directly attributable costs and allocated cross- category shared costs, before the deduction of administrative overheads and excluding the impact of adjusting items in line with the policy for APFO. The measure is assessed at constant rates of exchange. 4. Net cash generated from operating activities, less net finance costs, net capital expenditure, dividends from associates and dividends paid to non-controlling interests and before cash paid/received in respect of litigation. Adjusted CGFO is measured at constant rates of exchange. Long-Term Incentive for 2024 The Chief Executive and the Chief Financial Officer will be granted an LTIP - Performance Share Plan award equal to a maximum of 500% of salary and 400% of salary, respectively. The 2024 PSP award for the CFO will be made on appointment and will be pro-rated for time served in the role. The measures and targets for the 2024 LTIP - Performance Share awards are set out to the right. The following changes have been made to the targets in 2024: – Operating cash flow conversion ratio range to be set at 87.5% to 97.5%, an increase to the current range to reflect our strong track record cash conversion delivery in recent years and the need to continue strong cash delivery despite expected challenges in earning levels to enable deleverage and capital allocation. – New Categories revenue growth range will be set at 15% p.a. to 25% p.a., recognising that the previous targets reflected a lower New Categories revenue starting base, whereas New Categories revenues are now at c£3.3 billion at 31 December 2023. The new range continues to represent the Group’s ambition to reach £5.0 billion New Categories revenue by 2025. – EPS growth ranges (at current and constant rates) will be set at 2% p.a. to 6% p.a. This reflects accurately the Group’s current business environment while continuing to be sufficiently stretching. – Targets for Group revenue growth and TSR will remain unchanged. The targets have been set having carefully considered our internal forecasts and external market expectations for future growth, as well as the current business environment in which the Group is operating. The Committee is confident that the targets remain suitably stretching and incentivising for participants, ensuring only maximum payout for exceptional performance. In addition, the Committee retains discretion to determine whether the formulaic outcome of the 2024 LTIP at vesting is a fair reflection of underlying business performance and consistent with the shareholder experience over the performance period, and if not, to adjust the outcome accordingly. LTIP measures Weighting Threshold (15%) Maximum (100%) Relative TSR1 20% Median Upper Quartile EPS growth (at constant and current rates of exchange) 30% 2% p.a. 6% p.a. Revenue growth 15% 3% p.a. 5% p.a. Growth in New Categories revenue 15% 15% p.a. 25% p.a. Operating cash flow conversion ratio 20% 87.5% 97.5% Total 100% Note: 1. The 2024 TSR peer group constituents (14 companies) are: Altria Group, Anheuser-Busch InBev, Carlsberg, Coca-Cola, Diageo, Heineken, Imperial Brands, Japan Tobacco, PepsiCo, Pernod Ricard, Philip Morris International, Procter & Gamble, Reckitt Benckiser, and Unilever. BAT Annual Report and Form 20-F 2023 Strategic Report Governance Report Financial Statements Other Information 185
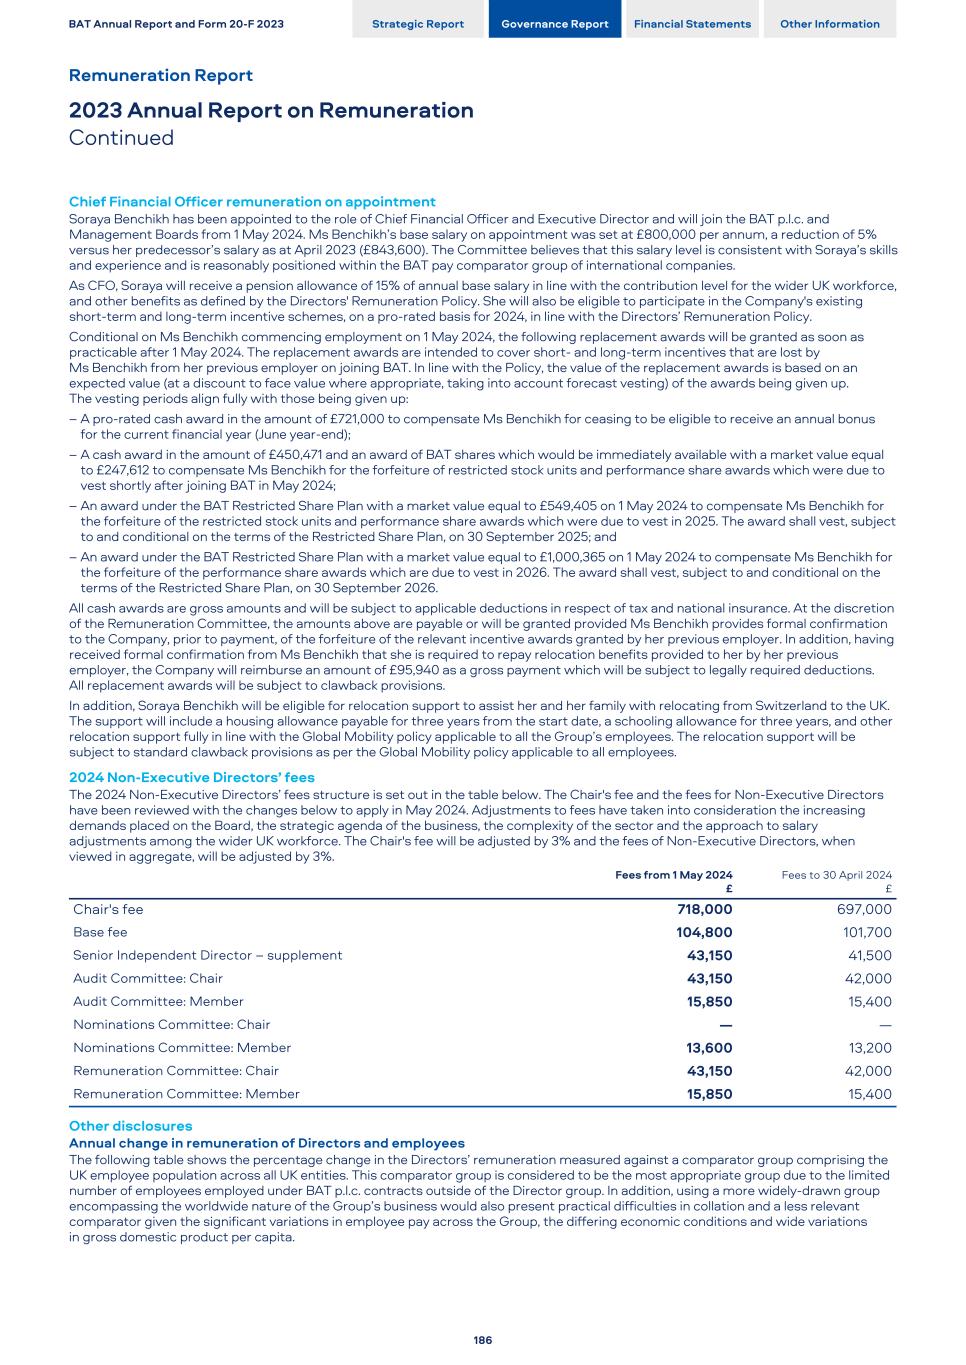
Chief Financial Officer remuneration on appointment Soraya Benchikh has been appointed to the role of Chief Financial Officer and Executive Director and will join the BAT p.l.c. and Management Boards from 1 May 2024. Ms Benchikh’s base salary on appointment was set at £800,000 per annum, a reduction of 5% versus her predecessor’s salary as at April 2023 (£843,600). The Committee believes that this salary level is consistent with Soraya’s skills and experience and is reasonably positioned within the BAT pay comparator group of international companies. As CFO, Soraya will receive a pension allowance of 15% of annual base salary in line with the contribution level for the wider UK workforce, and other benefits as defined by the Directors' Remuneration Policy. She will also be eligible to participate in the Company's existing short-term and long-term incentive schemes, on a pro-rated basis for 2024, in line with the Directors’ Remuneration Policy. Conditional on Ms Benchikh commencing employment on 1 May 2024, the following replacement awards will be granted as soon as practicable after 1 May 2024. The replacement awards are intended to cover short- and long-term incentives that are lost by Ms Benchikh from her previous employer on joining BAT. In line with the Policy, the value of the replacement awards is based on an expected value (at a discount to face value where appropriate, taking into account forecast vesting) of the awards being given up. The vesting periods align fully with those being given up: – A pro-rated cash award in the amount of £721,000 to compensate Ms Benchikh for ceasing to be eligible to receive an annual bonus for the current financial year (June year-end); – A cash award in the amount of £450,471 and an award of BAT shares which would be immediately available with a market value equal to £247,612 to compensate Ms Benchikh for the forfeiture of restricted stock units and performance share awards which were due to vest shortly after joining BAT in May 2024; – An award under the BAT Restricted Share Plan with a market value equal to £549,405 on 1 May 2024 to compensate Ms Benchikh for the forfeiture of the restricted stock units and performance share awards which were due to vest in 2025. The award shall vest, subject to and conditional on the terms of the Restricted Share Plan, on 30 September 2025; and – An award under the BAT Restricted Share Plan with a market value equal to £1,000,365 on 1 May 2024 to compensate Ms Benchikh for the forfeiture of the performance share awards which are due to vest in 2026. The award shall vest, subject to and conditional on the terms of the Restricted Share Plan, on 30 September 2026. All cash awards are gross amounts and will be subject to applicable deductions in respect of tax and national insurance. At the discretion of the Remuneration Committee, the amounts above are payable or will be granted provided Ms Benchikh provides formal confirmation to the Company, prior to payment, of the forfeiture of the relevant incentive awards granted by her previous employer. In addition, having received formal confirmation from Ms Benchikh that she is required to repay relocation benefits provided to her by her previous employer, the Company will reimburse an amount of £95,940 as a gross payment which will be subject to legally required deductions. All replacement awards will be subject to clawback provisions. In addition, Soraya Benchikh will be eligible for relocation support to assist her and her family with relocating from Switzerland to the UK. The support will include a housing allowance payable for three years from the start date, a schooling allowance for three years, and other relocation support fully in line with the Global Mobility policy applicable to all the Group’s employees. The relocation support will be subject to standard clawback provisions as per the Global Mobility policy applicable to all employees. 2024 Non-Executive Directors’ fees The 2024 Non-Executive Directors’ fees structure is set out in the table below. The Chair's fee and the fees for Non-Executive Directors have been reviewed with the changes below to apply in May 2024. Adjustments to fees have taken into consideration the increasing demands placed on the Board, the strategic agenda of the business, the complexity of the sector and the approach to salary adjustments among the wider UK workforce. The Chair's fee will be adjusted by 3% and the fees of Non-Executive Directors, when viewed in aggregate, will be adjusted by 3%. Fees from 1 May 2024 £ Fees to 30 April 2024 £ Chair's fee 718,000 697,000 Base fee 104,800 101,700 Senior Independent Director – supplement 43,150 41,500 Audit Committee: Chair 43,150 42,000 Audit Committee: Member 15,850 15,400 Nominations Committee: Chair — — Nominations Committee: Member 13,600 13,200 Remuneration Committee: Chair 43,150 42,000 Remuneration Committee: Member 15,850 15,400 Other disclosures Annual change in remuneration of Directors and employees The following table shows the percentage change in the Directors’ remuneration measured against a comparator group comprising the UK employee population across all UK entities. This comparator group is considered to be the most appropriate group due to the limited number of employees employed under BAT p.l.c. contracts outside of the Director group. In addition, using a more widely-drawn group encompassing the worldwide nature of the Group’s business would also present practical difficulties in collation and a less relevant comparator given the significant variations in employee pay across the Group, the differing economic conditions and wide variations in gross domestic product per capita. BAT Annual Report and Form 20-F 2023 Strategic Report Governance Report Financial Statements Other Information Remuneration Report 2023 Annual Report on Remuneration Continued 186
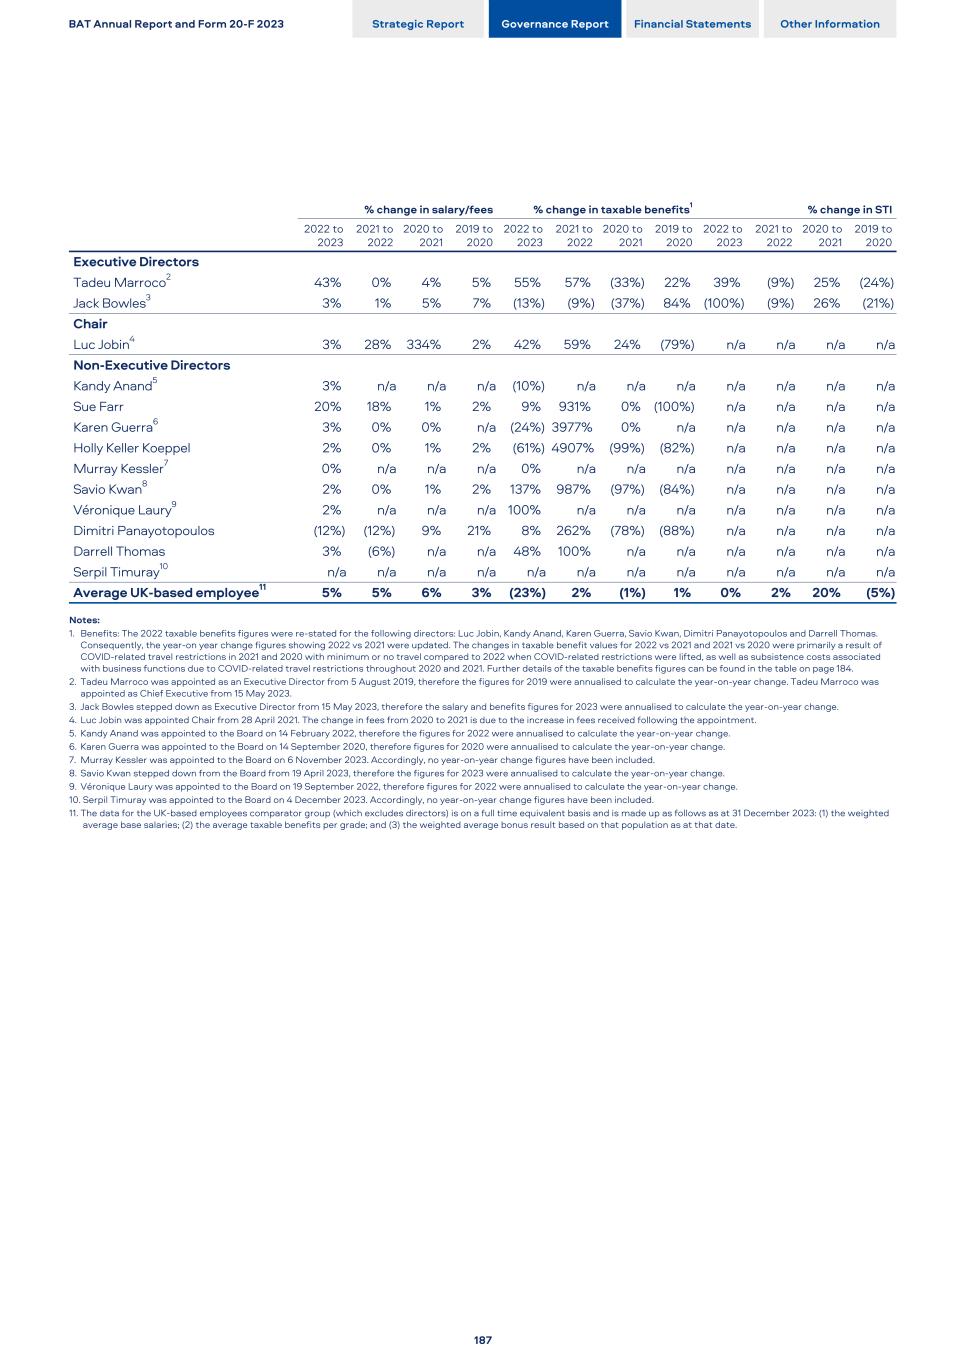
% change in salary/fees % change in taxable benefits1 % change in STI 2022 to 2023 2021 to 2022 2020 to 2021 2019 to 2020 2022 to 2023 2021 to 2022 2020 to 2021 2019 to 2020 2022 to 2023 2021 to 2022 2020 to 2021 2019 to 2020 Executive Directors Tadeu Marroco2 43% 0% 4% 5% 55% 57% (33%) 22% 39% (9%) 25% (24%) Jack Bowles3 3% 1% 5% 7% (13%) (9%) (37%) 84% (100%) (9%) 26% (21%) Chair Luc Jobin4 3% 28% 334% 2% 42% 59% 24% (79%) n/a n/a n/a n/a Non-Executive Directors Kandy Anand5 3% n/a n/a n/a (10%) n/a n/a n/a n/a n/a n/a n/a Sue Farr 20% 18% 1% 2% 9% 931% 0% (100%) n/a n/a n/a n/a Karen Guerra6 3% 0% 0% n/a (24%) 3977% 0% n/a n/a n/a n/a n/a Holly Keller Koeppel 2% 0% 1% 2% (61%) 4907% (99%) (82%) n/a n/a n/a n/a Murray Kessler7 0% n/a n/a n/a 0% n/a n/a n/a n/a n/a n/a n/a Savio Kwan8 2% 0% 1% 2% 137% 987% (97%) (84%) n/a n/a n/a n/a Véronique Laury9 2% n/a n/a n/a 100% n/a n/a n/a n/a n/a n/a n/a Dimitri Panayotopoulos (12%) (12%) 9% 21% 8% 262% (78%) (88%) n/a n/a n/a n/a Darrell Thomas 3% (6%) n/a n/a 48% 100% n/a n/a n/a n/a n/a n/a Serpil Timuray10 n/a n/a n/a n/a n/a n/a n/a n/a n/a n/a n/a n/a Average UK-based employee11 5% 5% 6% 3% (23%) 2% (1%) 1% 0% 2% 20% (5%) Notes: 1. Benefits: The 2022 taxable benefits figures were re-stated for the following directors: Luc Jobin, Kandy Anand, Karen Guerra, Savio Kwan, Dimitri Panayotopoulos and Darrell Thomas. Consequently, the year-on year change figures showing 2022 vs 2021 were updated. The changes in taxable benefit values for 2022 vs 2021 and 2021 vs 2020 were primarily a result of COVID-related travel restrictions in 2021 and 2020 with minimum or no travel compared to 2022 when COVID-related restrictions were lifted, as well as subsistence costs associated with business functions due to COVID-related travel restrictions throughout 2020 and 2021. Further details of the taxable benefits figures can be found in the table on page 184. 2. Tadeu Marroco was appointed as an Executive Director from 5 August 2019, therefore the figures for 2019 were annualised to calculate the year-on-year change. Tadeu Marroco was appointed as Chief Executive from 15 May 2023. 3. Jack Bowles stepped down as Executive Director from 15 May 2023, therefore the salary and benefits figures for 2023 were annualised to calculate the year-on-year change. 4. Luc Jobin was appointed Chair from 28 April 2021. The change in fees from 2020 to 2021 is due to the increase in fees received following the appointment. 5. Kandy Anand was appointed to the Board on 14 February 2022, therefore the figures for 2022 were annualised to calculate the year-on-year change. 6. Karen Guerra was appointed to the Board on 14 September 2020, therefore figures for 2020 were annualised to calculate the year-on-year change. 7. Murray Kessler was appointed to the Board on 6 November 2023. Accordingly, no year-on-year change figures have been included. 8. Savio Kwan stepped down from the Board from 19 April 2023, therefore the figures for 2023 were annualised to calculate the year-on-year change. 9. Véronique Laury was appointed to the Board on 19 September 2022, therefore figures for 2022 were annualised to calculate the year-on-year change. 10. Serpil Timuray was appointed to the Board on 4 December 2023. Accordingly, no year-on-year change figures have been included. 11. The data for the UK-based employees comparator group (which excludes directors) is on a full time equivalent basis and is made up as follows as at 31 December 2023: (1) the weighted average base salaries; (2) the average taxable benefits per grade; and (3) the weighted average bonus result based on that population as at that date. BAT Annual Report and Form 20-F 2023 Strategic Report Governance Report Financial Statements Other Information 187
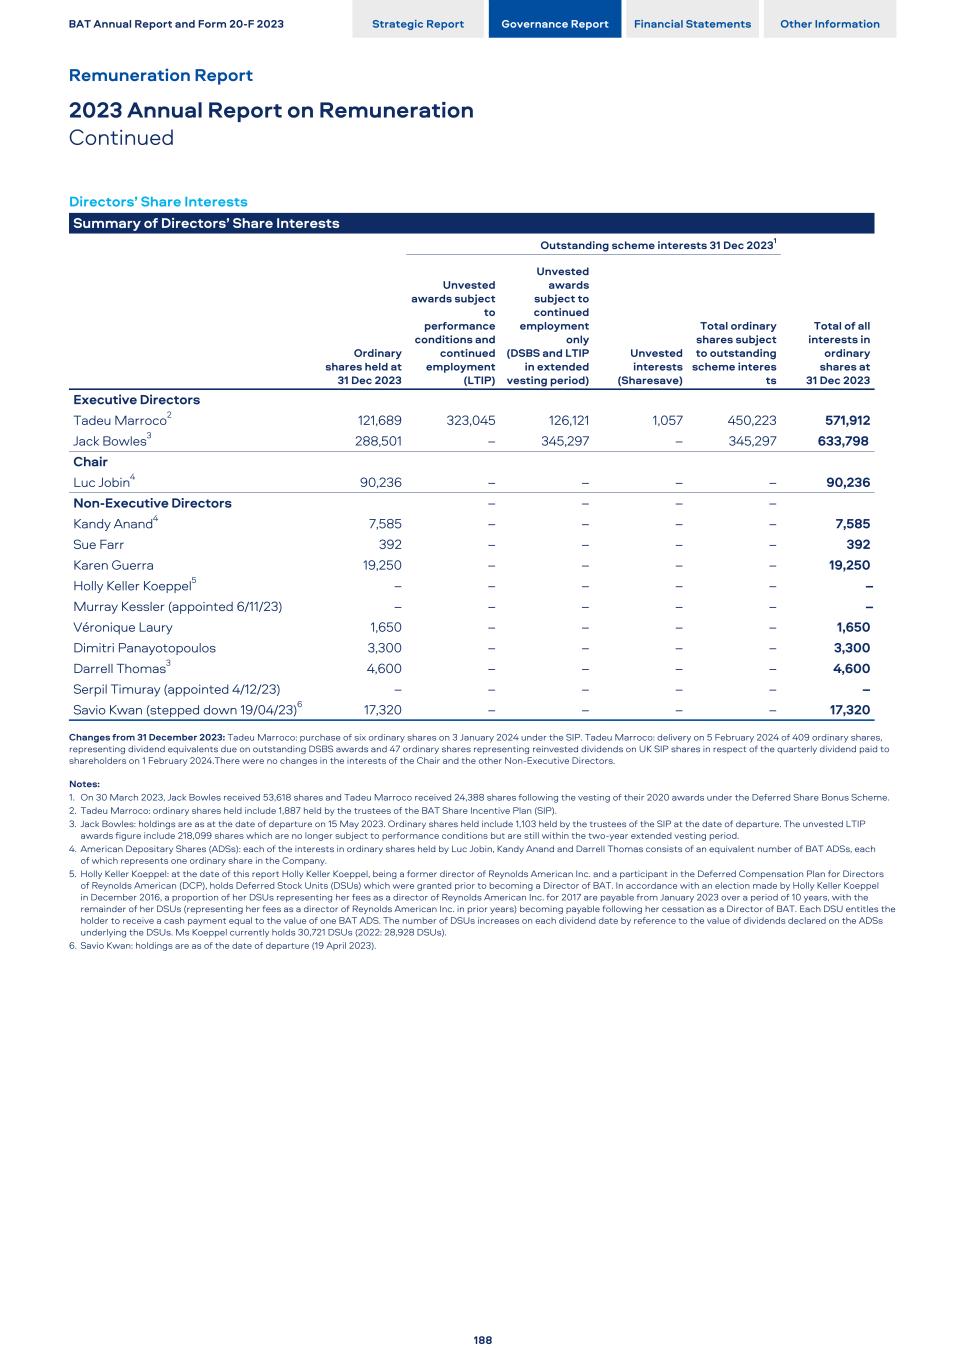
Directors’ Share Interests Summary of Directors’ Share Interests Ordinary shares held at 31 Dec 2023 Outstanding scheme interests 31 Dec 20231 Total of all interests in ordinary shares at 31 Dec 2023 Unvested awards subject to performance conditions and continued employment (LTIP) Unvested awards subject to continued employment only (DSBS and LTIP in extended vesting period) Unvested interests (Sharesave) Total ordinary shares subject to outstanding scheme interes ts Executive Directors Tadeu Marroco2 121,689 323,045 126,121 1,057 450,223 571,912 Jack Bowles3 288,501 – 345,297 – 345,297 633,798 Chair Luc Jobin4 90,236 – – – – 90,236 Non-Executive Directors – – – – Kandy Anand4 7,585 – – – – 7,585 Sue Farr 392 – – – – 392 Karen Guerra 19,250 – – – – 19,250 Holly Keller Koeppel5 – – – – – – Murray Kessler (appointed 6/11/23) – – – – – – Véronique Laury 1,650 – – – – 1,650 Dimitri Panayotopoulos 3,300 – – – – 3,300 Darrell Thomas3 4,600 – – – – 4,600 Serpil Timuray (appointed 4/12/23) – – – – – – Savio Kwan (stepped down 19/04/23)6 17,320 – – – – 17,320 Changes from 31 December 2023: Tadeu Marroco: purchase of six ordinary shares on 3 January 2024 under the SIP. Tadeu Marroco: delivery on 5 February 2024 of 409 ordinary shares, representing dividend equivalents due on outstanding DSBS awards and 47 ordinary shares representing reinvested dividends on UK SIP shares in respect of the quarterly dividend paid to shareholders on 1 February 2024.There were no changes in the interests of the Chair and the other Non-Executive Directors. Notes: 1. On 30 March 2023, Jack Bowles received 53,618 shares and Tadeu Marroco received 24,388 shares following the vesting of their 2020 awards under the Deferred Share Bonus Scheme. 2. Tadeu Marroco: ordinary shares held include 1,887 held by the trustees of the BAT Share Incentive Plan (SIP). 3. Jack Bowles: holdings are as at the date of departure on 15 May 2023. Ordinary shares held include 1,103 held by the trustees of the SIP at the date of departure. The unvested LTIP awards figure include 218,099 shares which are no longer subject to performance conditions but are still within the two-year extended vesting period. 4. American Depositary Shares (ADSs): each of the interests in ordinary shares held by Luc Jobin, Kandy Anand and Darrell Thomas consists of an equivalent number of BAT ADSs, each of which represents one ordinary share in the Company. 5. Holly Keller Koeppel: at the date of this report Holly Keller Koeppel, being a former director of Reynolds American Inc. and a participant in the Deferred Compensation Plan for Directors of Reynolds American (DCP), holds Deferred Stock Units (DSUs) which were granted prior to becoming a Director of BAT. In accordance with an election made by Holly Keller Koeppel in December 2016, a proportion of her DSUs representing her fees as a director of Reynolds American Inc. for 2017 are payable from January 2023 over a period of 10 years, with the remainder of her DSUs (representing her fees as a director of Reynolds American Inc. in prior years) becoming payable following her cessation as a Director of BAT. Each DSU entitles the holder to receive a cash payment equal to the value of one BAT ADS. The number of DSUs increases on each dividend date by reference to the value of dividends declared on the ADSs underlying the DSUs. Ms Koeppel currently holds 30,721 DSUs (2022: 28,928 DSUs). 6. Savio Kwan: holdings are as of the date of departure (19 April 2023). BAT Annual Report and Form 20-F 2023 Strategic Report Governance Report Financial Statements Other Information Remuneration Report 2023 Annual Report on Remuneration Continued 188
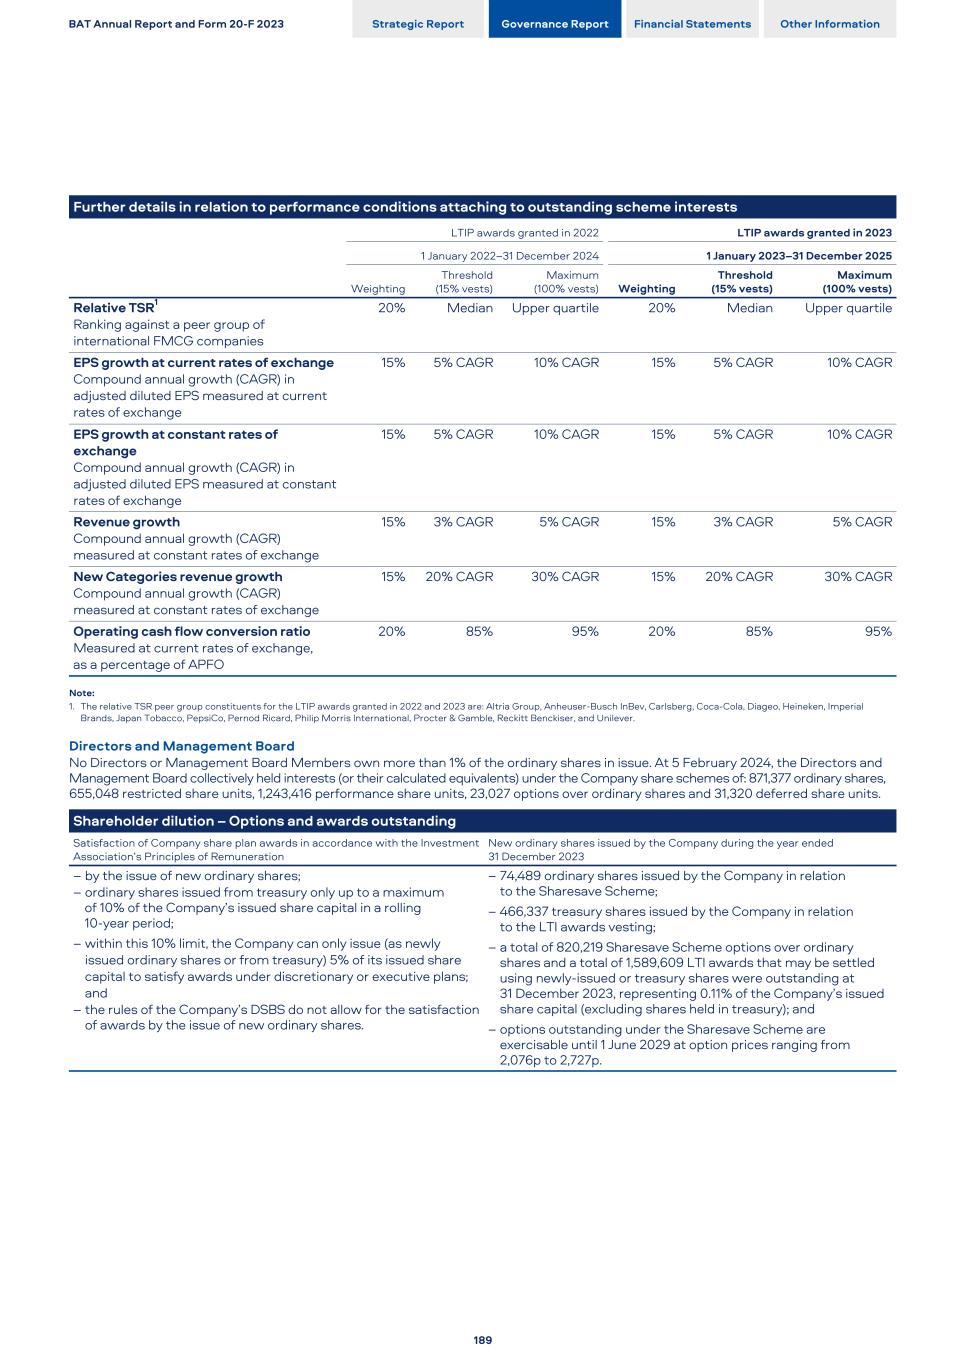
Further details in relation to performance conditions attaching to outstanding scheme interests LTIP awards granted in 2022 LTIP awards granted in 2023 1 January 2022–31 December 2024 1 January 2023–31 December 2025 Weighting Threshold (15% vests) Maximum (100% vests) Weighting Threshold (15% vests) Maximum (100% vests) Relative TSR1 Ranking against a peer group of international FMCG companies 20% Median Upper quartile 20% Median Upper quartile EPS growth at current rates of exchange Compound annual growth (CAGR) in adjusted diluted EPS measured at current rates of exchange 15% 5% CAGR 10% CAGR 15% 5% CAGR 10% CAGR EPS growth at constant rates of exchange Compound annual growth (CAGR) in adjusted diluted EPS measured at constant rates of exchange 15% 5% CAGR 10% CAGR 15% 5% CAGR 10% CAGR Revenue growth Compound annual growth (CAGR) measured at constant rates of exchange 15% 3% CAGR 5% CAGR 15% 3% CAGR 5% CAGR New Categories revenue growth Compound annual growth (CAGR) measured at constant rates of exchange 15% 20% CAGR 30% CAGR 15% 20% CAGR 30% CAGR Operating cash flow conversion ratio Measured at current rates of exchange, as a percentage of APFO 20% 85% 95% 20% 85% 95% Note: 1. The relative TSR peer group constituents for the LTIP awards granted in 2022 and 2023 are: Altria Group, Anheuser-Busch InBev, Carlsberg, Coca-Cola, Diageo, Heineken, Imperial Brands, Japan Tobacco, PepsiCo, Pernod Ricard, Philip Morris International, Procter & Gamble, Reckitt Benckiser, and Unilever. Directors and Management Board No Directors or Management Board Members own more than 1% of the ordinary shares in issue. At 5 February 2024, the Directors and Management Board collectively held interests (or their calculated equivalents) under the Company share schemes of: 871,377 ordinary shares, 655,048 restricted share units, 1,243,416 performance share units, 23,027 options over ordinary shares and 31,320 deferred share units. Shareholder dilution – Options and awards outstanding Satisfaction of Company share plan awards in accordance with the Investment Association’s Principles of Remuneration New ordinary shares issued by the Company during the year ended 31 December 2023 – by the issue of new ordinary shares; – ordinary shares issued from treasury only up to a maximum of 10% of the Company’s issued share capital in a rolling 10-year period; – within this 10% limit, the Company can only issue (as newly issued ordinary shares or from treasury) 5% of its issued share capital to satisfy awards under discretionary or executive plans; and – the rules of the Company’s DSBS do not allow for the satisfaction of awards by the issue of new ordinary shares. – 74,489 ordinary shares issued by the Company in relation to the Sharesave Scheme; – 466,337 treasury shares issued by the Company in relation to the LTI awards vesting; – a total of 820,219 Sharesave Scheme options over ordinary shares and a total of 1,589,609 LTI awards that may be settled using newly-issued or treasury shares were outstanding at 31 December 2023, representing 0.11% of the Company’s issued share capital (excluding shares held in treasury); and – options outstanding under the Sharesave Scheme are exercisable until 1 June 2029 at option prices ranging from 2,076p to 2,727p. BAT Annual Report and Form 20-F 2023 Strategic Report Governance Report Financial Statements Other Information 189
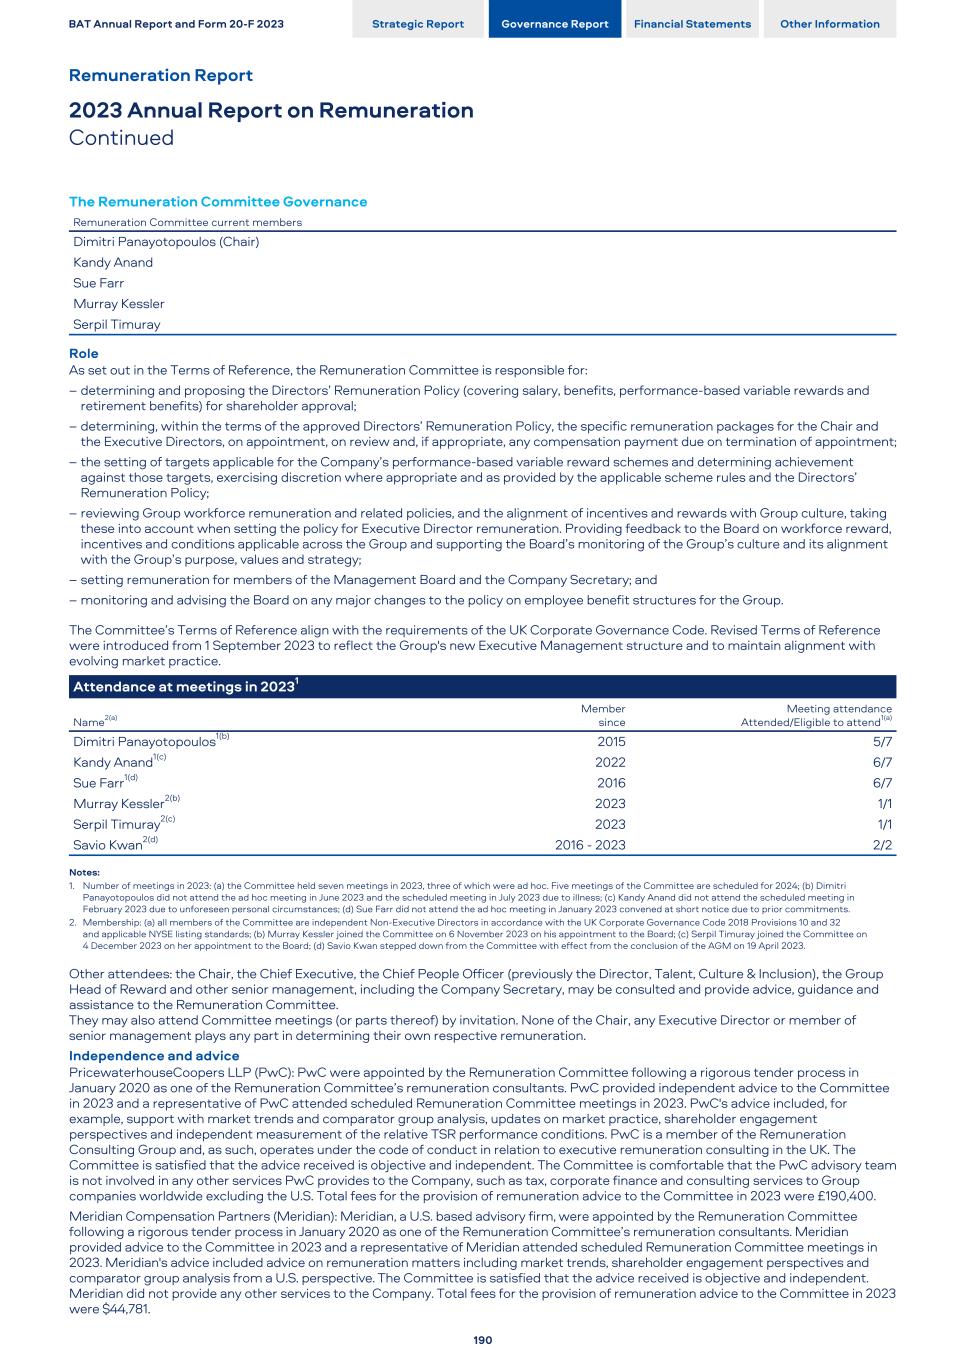
The Remuneration Committee Governance Remuneration Committee current members Dimitri Panayotopoulos (Chair) Kandy Anand Sue Farr Murray Kessler Serpil Timuray Role As set out in the Terms of Reference, the Remuneration Committee is responsible for: – determining and proposing the Directors’ Remuneration Policy (covering salary, benefits, performance-based variable rewards and retirement benefits) for shareholder approval; – determining, within the terms of the approved Directors’ Remuneration Policy, the specific remuneration packages for the Chair and the Executive Directors, on appointment, on review and, if appropriate, any compensation payment due on termination of appointment; – the setting of targets applicable for the Company’s performance-based variable reward schemes and determining achievement against those targets, exercising discretion where appropriate and as provided by the applicable scheme rules and the Directors’ Remuneration Policy; – reviewing Group workforce remuneration and related policies, and the alignment of incentives and rewards with Group culture, taking these into account when setting the policy for Executive Director remuneration. Providing feedback to the Board on workforce reward, incentives and conditions applicable across the Group and supporting the Board’s monitoring of the Group’s culture and its alignment with the Group’s purpose, values and strategy; – setting remuneration for members of the Management Board and the Company Secretary; and – monitoring and advising the Board on any major changes to the policy on employee benefit structures for the Group. The Committee’s Terms of Reference align with the requirements of the UK Corporate Governance Code. Revised Terms of Reference were introduced from 1 September 2023 to reflect the Group's new Executive Management structure and to maintain alignment with evolving market practice. Attendance at meetings in 20231 Name2(a) Member since Meeting attendance Attended/Eligible to attend1(a) Dimitri Panayotopoulos1(b) 2015 5/7 Kandy Anand1(c) 2022 6/7 Sue Farr1(d) 2016 6/7 Murray Kessler2(b) 2023 1/1 Serpil Timuray2(c) 2023 1/1 Savio Kwan2(d) 2016 - 2023 2/2 Notes: 1. Number of meetings in 2023: (a) the Committee held seven meetings in 2023, three of which were ad hoc. Five meetings of the Committee are scheduled for 2024; (b) Dimitri Panayotopoulos did not attend the ad hoc meeting in June 2023 and the scheduled meeting in July 2023 due to illness; (c) Kandy Anand did not attend the scheduled meeting in February 2023 due to unforeseen personal circumstances; (d) Sue Farr did not attend the ad hoc meeting in January 2023 convened at short notice due to prior commitments. 2. Membership: (a) all members of the Committee are independent Non-Executive Directors in accordance with the UK Corporate Governance Code 2018 Provisions 10 and 32 and applicable NYSE listing standards; (b) Murray Kessler joined the Committee on 6 November 2023 on his appointment to the Board; (c) Serpil Timuray joined the Committee on 4 December 2023 on her appointment to the Board; (d) Savio Kwan stepped down from the Committee with effect from the conclusion of the AGM on 19 April 2023. Other attendees: the Chair, the Chief Executive, the Chief People Officer (previously the Director, Talent, Culture & Inclusion), the Group Head of Reward and other senior management, including the Company Secretary, may be consulted and provide advice, guidance and assistance to the Remuneration Committee. They may also attend Committee meetings (or parts thereof) by invitation. None of the Chair, any Executive Director or member of senior management plays any part in determining their own respective remuneration. Independence and advice PricewaterhouseCoopers LLP (PwC): PwC were appointed by the Remuneration Committee following a rigorous tender process in January 2020 as one of the Remuneration Committee’s remuneration consultants. PwC provided independent advice to the Committee in 2023 and a representative of PwC attended scheduled Remuneration Committee meetings in 2023. PwC's advice included, for example, support with market trends and comparator group analysis, updates on market practice, shareholder engagement perspectives and independent measurement of the relative TSR performance conditions. PwC is a member of the Remuneration Consulting Group and, as such, operates under the code of conduct in relation to executive remuneration consulting in the UK. The Committee is satisfied that the advice received is objective and independent. The Committee is comfortable that the PwC advisory team is not involved in any other services PwC provides to the Company, such as tax, corporate finance and consulting services to Group companies worldwide excluding the U.S. Total fees for the provision of remuneration advice to the Committee in 2023 were £190,400. Meridian Compensation Partners (Meridian): Meridian, a U.S. based advisory firm, were appointed by the Remuneration Committee following a rigorous tender process in January 2020 as one of the Remuneration Committee’s remuneration consultants. Meridian provided advice to the Committee in 2023 and a representative of Meridian attended scheduled Remuneration Committee meetings in 2023. Meridian's advice included advice on remuneration matters including market trends, shareholder engagement perspectives and comparator group analysis from a U.S. perspective. The Committee is satisfied that the advice received is objective and independent. Meridian did not provide any other services to the Company. Total fees for the provision of remuneration advice to the Committee in 2023 were $44,781. BAT Annual Report and Form 20-F 2023 Strategic Report Governance Report Financial Statements Other Information Remuneration Report 2023 Annual Report on Remuneration Continued 190
Regular work programme 2023 The Remuneration Committee: – reviewed the Chair's fee from 1 May 2023, taking into account market positioning, the broader external environment and the level of salary increases awarded to UK employees; – reviewed salaries for the Executive Directors to take effect from 1 April 2023, taking into account market positioning, the external environment including stakeholder expectations and shareholder perspectives, and the level of salary increases awarded to UK employees; – reviewed salaries for members of the Management Board and the Company Secretary from 1 April 2023, taking into account market positioning, the external market environment and the level of salary increases awarded to UK employees; – assessed the achievement against the targets for the 2022 STI award and set the STI targets for 2023 (on an organic basis) to ensure an appropriate degree of stretch within the target ranges to drive performance in alignment with the Group's strategic objectives and shareholder interests; – reviewed updates on performance against the 2023 STI target measures and for outstanding LTI awards; – assessed the achievement against the performance conditions for the vesting of the 2020 LTIP award, determined the contingent level of LTI awards for March 2023 and reviewed the associated performance conditions; – assessed the achievement against the targets for the 2022 Share Reward Scheme and set the targets for the 2023 award; – reviewed the Annual Statement and the Annual Report on Remuneration for the year ended 31 December 2022 prior to its approval by the Board and subsequent proposal to shareholders at the Company’s AGM on 19 April 2023; – reviewed the 2023 AGM voting results relating to remuneration resolutions, market trends in the context of that annual general meeting season and corporate governance developments relating to executive remuneration and wider workforce remuneration in the UK and the U.S.; – monitored the continued application of the Company’s shareholding guidelines for the Executive Directors and members of the Management Board; and – reviewed the Committee’s effectiveness following the Board and Committees review process (discussed on pages 152 to 153). Other activities in 2023 The Remuneration Committee: – assessed and determined the remuneration applicable to the appointment of Tadeu Marroco as Chief Executive from 15 May 2023 and to the appointment of Soraya Benchikh as Chief Financial Officer with effect from 1 May 2024, in accordance with the Directors' Remuneration Policy, with specific consideration given to relative market positioning and the wider external environment, including shareholder and other stakeholder perspectives; – determined the remuneration payable to Jack Bowles on stepping down as Chief Executive, applying the Directors' Remuneration Policy including the exercise of discretion in respect of retention of awards under the Company’s performance-based variable reward schemes; – reviewed the terms of appointment and associated remuneration, and terms of termination of employment, in connection with Management Board roles and personnel changes during the year; – determined the terms of appointment and associated remuneration applicable to the appointment of Caroline Ferland as Company Secretary from 1 September 2023; – recommended to the Board that additional malus and clawback arrangements be introduced for senior executives, in alignment with U.S. SEC regulation and NYSE rules, which were subsequently approved by the Board; – assessed various aspects of the Group’s workforce remuneration strategy and alignment with Executive Directors’ remuneration, corporate culture and external market positioning, with specific focus on variable pay architecture for management grade employees across the Group; – approved changes to the methodology for calculating the share of market read for the STI volume share metric in several markets, based on the local market environment and reporting capabilities; – approved the exclusion of the impact of the disposal of the Russian and Belarusian businesses from the 2023 results in the assessment of performance for the 2021 LTI awards against the targets set at the start of the performance period; – reviewed the Group's pay equality data and associated reporting, including UK gender pay reporting for 2022 for applicable UK Group companies prior to publication in March 2023, and voluntary reporting on international gender pay and ethnicity pay; – reviewed the outcomes of the Group's global living wage assessment for 2023, approach to validation of living wage data with the external organisation Fair Wage Network, and evolving stakeholder expectations in relation to reporting on living wage analysis; – considered initiatives to enhance talent retention across the Group, including benefits and non-financial rewards, focused activities to promote the retention of women in senior management, and associated feedback from employees; and – reviewed the Committee's Terms of Reference and recommended revisions to those Terms of Reference be introduced from 1 September 2023, which were subsequently approved by the Board. BAT Annual Report and Form 20-F 2023 Strategic Report Governance Report Financial Statements Other Information 191
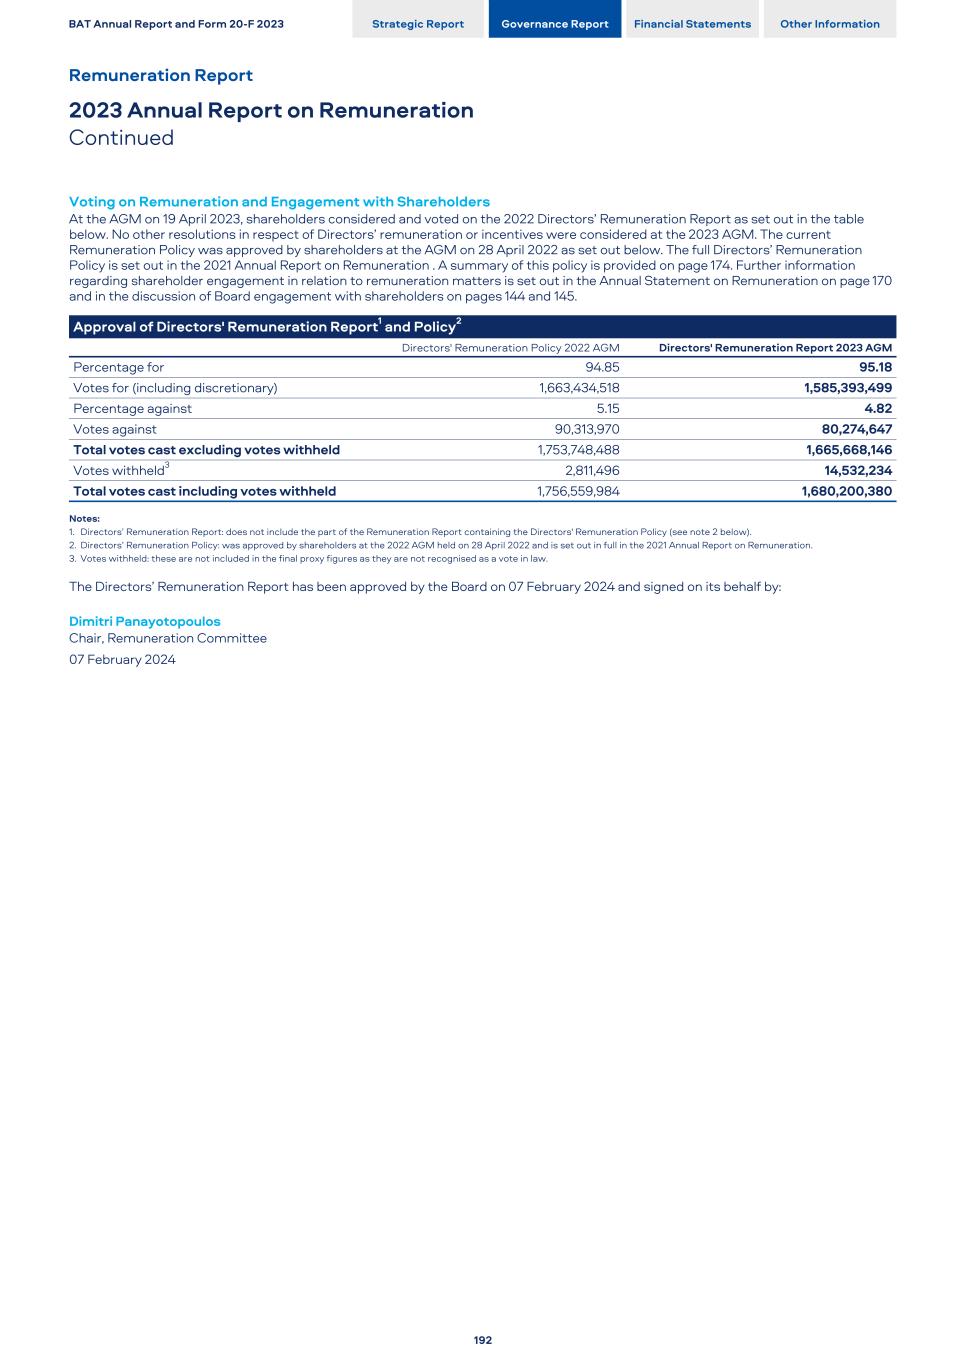
Voting on Remuneration and Engagement with Shareholders At the AGM on 19 April 2023, shareholders considered and voted on the 2022 Directors’ Remuneration Report as set out in the table below. No other resolutions in respect of Directors’ remuneration or incentives were considered at the 2023 AGM. The current Remuneration Policy was approved by shareholders at the AGM on 28 April 2022 as set out below. The full Directors’ Remuneration Policy is set out in the 2021 Annual Report on Remuneration . A summary of this policy is provided on page 174. Further information regarding shareholder engagement in relation to remuneration matters is set out in the Annual Statement on Remuneration on page 170 and in the discussion of Board engagement with shareholders on pages 144 and 145. Approval of Directors' Remuneration Report1 and Policy2 Directors' Remuneration Policy 2022 AGM Directors' Remuneration Report 2023 AGM Percentage for 94.85 95.18 Votes for (including discretionary) 1,663,434,518 1,585,393,499 Percentage against 5.15 4.82 Votes against 90,313,970 80,274,647 Total votes cast excluding votes withheld 1,753,748,488 1,665,668,146 Votes withheld3 2,811,496 14,532,234 Total votes cast including votes withheld 1,756,559,984 1,680,200,380 Notes: 1. Directors’ Remuneration Report: does not include the part of the Remuneration Report containing the Directors' Remuneration Policy (see note 2 below). 2. Directors’ Remuneration Policy: was approved by shareholders at the 2022 AGM held on 28 April 2022 and is set out in full in the 2021 Annual Report on Remuneration. 3. Votes withheld: these are not included in the final proxy figures as they are not recognised as a vote in law. The Directors’ Remuneration Report has been approved by the Board on 07 February 2024 and signed on its behalf by: Dimitri Panayotopoulos Chair, Remuneration Committee 07 February 2024 BAT Annual Report and Form 20-F 2023 Strategic Report Governance Report Financial Statements Other Information Remuneration Report 2023 Annual Report on Remuneration Continued 192

This page is intentionally left blank BAT Annual Report and Form 20-F 2023 Strategic Report Governance Report Financial Statements Other Information 193

This page is intentionally left blank BAT Annual Report and Form 20-F 2023 Strategic Report Governance Report Financial Statements Other Information 322

This page is intentionally left blank BAT Annual Report and Form 20-F 2023 Strategic Report Governance Report Financial Statements Other Information 323

This page is intentionally left blank BAT Annual Report and Form 20-F 2023 Strategic Report Governance Report Financial Statements Other Information 324

This page is intentionally left blank BAT Annual Report and Form 20-F 2023 Strategic Report Governance Report Financial Statements Other Information 325

This page is intentionally left blank BAT Annual Report and Form 20-F 2023 Strategic Report Governance Report Financial Statements Other Information 326

This page is intentionally left blank BAT Annual Report and Form 20-F 2023 Strategic Report Governance Report Financial Statements Other Information 327

This page is intentionally left blank BAT Annual Report and Form 20-F 2023 Strategic Report Governance Report Financial Statements Other Information 328

. This page is intentionally left blank BAT Annual Report and Form 20-F 2023 Strategic Report Governance Report Financial Statements Other Information 329
Additional Disclosures Information on the Group .......................................................................................................................................................................................................................…. 331 Selected Financial Information ............................................................................................................................................................................................................…. 332 Non-Financial Measures ...............................................................................................................................................................................................................….......…. 333 Non-GAAP Measures ...............................................................................................................................................................................................................….............…. 335 Employees ...............................................................................................................................................................................................................….............…......................... 350 Additional Disclosures on Liquidity and Capital Resources ..................................................................................................................................................... 351 Summary of Group Risk Factors .............................................................................................................................................................................................................. 353 Group Risk Factors ...............................................................................................................................................................................................................….............…....... 354 Regulation of the Group’s Business ...................................................................................................................................................................................................… 375 Material Contracts ...............................................................................................................................................................................................................….............…....... 380 Property, Plant and Equipment ............................................................................................................................................................................................................... 382 Raw Materials ...............................................................................................................................................................................................................….............…................. 382 U.S. Corporate Governance Practices .................................................................................................................................................................................................. 383 Controls and Procedures ...............................................................................................................................................................................................................…......…. 384 Statements Regarding Competitive Position ................................................................................................................................................................................. 384 Directors’ Report Information ...............................................................................................................................................................................................................… 385 Cautionary Statement ...............................................................................................................................................................................................................….............… 386 Shareholder Information Share Prices and Listings ...............................................................................................................................................................................................................….......... 387 Dividends ...............................................................................................................................................................................................................….............…............................ 388 Shareholder Taxation Information ......................................................................................................................................................................................................... 390 Share Capital and Security Ownership ............................................................................................................................................................................................... 394 Articles of Association ...............................................................................................................................................................................................................….............… 396 Purchase of Shares ...............................................................................................................................................................................................................….............…....... 399 Group Employee Trust ...............................................................................................................................................................................................................…................ 400 American Depositary Shares ...............................................................................................................................................................................................................….. 401 Shareholding Administration and Services ....................................................................................................................................................................................... 402 Exhibits ...............................................................................................................................................................................................................….............…................................ 403 Other Information Glossary ...............................................................................................................................................................................................................….............….............................. 406 Cross-Reference to Form-20F ............................................................................................................................................................................................................…. 407 BAT Annual Report and Form 20-F 2023 Strategic Report Governance Report Financial Statements Other Information Other Information Additional Disclosures 330
Overview British American Tobacco p.l.c. is the parent holding company of the Group, a leading multi-category consumer goods business that provides tobacco and nicotine products to millions of consumers around the world. The Group, excluding the Group’s associated undertakings, is organised into three regions: – the United States of America (Reynolds American Inc.); – Americas and Europe (AME); and – Asia-Pacific, the Middle East and Africa (APMEA). The Group’s range of combustible products covers all segments, from value-for-money to premium, with a portfolio of international, regional and local tobacco brands to meet a broad array of adult tobacco consumer preferences wherever the Group operates. The Group has also built a portfolio of smokeless tobacco and nicotine products – including Vapour products, Heated Products (HPs) and Modern Oral products, which are collectively termed the New Categories, as well as Traditional Oral products. The Group manages a globally-integrated supply chain and its products are distributed to retail outlets worldwide. History and development of BAT The Group has had a significant global presence in the tobacco industry for over 100 years. BAT Ltd. was incorporated in 1902, when the Imperial Tobacco Company and the American Tobacco Company agreed to form a joint venture company. BAT Ltd. inherited companies and quickly expanded into major markets, including India and Ceylon, Egypt, Malaya, Northern Europe and East Africa. In 1927, BAT Ltd. expanded into the U.S. market through its acquisition of B&W. During the 1960s, 1970s and 1980s, the Group diversified its business under the umbrella of B.A.T Industries p.l.c., with acquisitions in the paper, cosmetics, retail and financial services industries, among others. Various business reorganisations followed as the business was eventually refocused on the Group’s core cigarette, cigars and tobacco products businesses with BAT becoming a separately listed entity on the LSE in 1998. The following is a summary of the significant mergers, acquisitions and disposals undertaken since 1998: – 1999 – global merger with Rothmans International; – 2000 – acquisition of Imperial Tobacco Canada; – 2003 – acquisition of Ente Tabacchi Italiani S.p.A., Italy’s state- owned tobacco company, Tabacalera Nacional in Peru and Duvanska Industrija Vranje in Serbia; – 2004 - the U.S. assets, liabilities and operations, other than certain specified assets and liabilities, of BAT’s wholly-owned subsidiary, B&W, were combined with RJR Tobacco Company to form Reynolds American Inc. As a result of the B&W business combination, B&W acquired beneficial ownership of approximately 42% of the Reynolds American Inc. shares; – 2008 – acquisition of Tekel, the Turkish state-owned tobacco company and the cigarette and snus business of Skandinavisk Tobakskompagni A/S; – 2009 - acquisition of an effective 99% interest in Bentoel in Indonesia; – 2011 – acquisition of Protabaco in Colombia; – 2012 – acquisition of CN Creative Limited in the UK; – 2013 – entered into joint operations in China; – 2015 – acquisition of the shares not already owned by the Group in Souza Cruz in Brazil, the acquisition of the CHIC Group in Poland, the acquisition of TDR d.o.o., a cigarette manufacturer in Central Europe. Also in 2015, the Group increased its investment in Reynolds American Inc. by US$4.7 billion to maintain the Group’s approximate 42% equity position following Reynolds American Inc.’s purchase of Lorillard Inc.; – 2016 – acquisition of Ten Motives in the UK; – 2017 – acquisition of the remaining 57.8% of Reynolds American Inc. the Group did not already own. Following completion of the acquisition, Reynolds American Inc. became an indirect, wholly- owned subsidiary of BAT and is no longer a publicly-held corporation. In 2017, the Group also acquired certain tobacco assets from Bulgartabac Holding AD in Bulgaria and Fabrika Duhana Sarajevo (FDS) in Bosnia, acquired Winnington Holdings AB in Sweden and acquired certain assets from Must Have Limited in the UK, including the electronic cigarette brand ViP; – 2018 – acquisition of Quantus Beteiligungs-und Beratungsgesellschaft mbH in Germany; – 2019 – acquisition of Twisp Proprietary Limited in South Africa and 60% of VapeWild Holdings LLC in the U.S.; – 2020 – acquisition of the nicotine pouch product assets of Dryft Sciences, LLC (Dryft) in the U.S. and the acquisition of Eastern Tobacco Company for Trading in Saudi Arabia; – 2021 – entry into a strategic research and product development collaboration agreement with Organigram Inc., a licensed producer of cannabis and cannabis-derived products in Canada and a wholly-owned subsidiary of publicly-traded Organigram Holdings Inc. and acquisition of a 19.9% equity stake in Organigram Holdings Inc.. Also in 2021, the Group disposed of its Iranian subsidiary, BAT Pars Company PJSC; – 2022 – acquisition of a 16% equity stake in Sanity Group GmbH, a German cannabis company. In 2022, the Group also made an investment, via a convertible debenture in the amount of c.£48 million, into Charlotte’s Web Holdings, Inc., a U.S.-based hemp extract wellness products business; and – 2023 - disposal of the Group's businesses in Russia and Belarus. British American Tobacco p.l.c. was incorporated in July 1997 under the laws of England and Wales as a public limited company and is domiciled in the United Kingdom. Seasonality The Group’s business segments are not significantly affected by seasonality although in certain markets cigarette consumption trends rise during summer months due to longer daylight time and tourism. Patents and trademarks Our trademarks, which include the brand names under which our products are sold, are key assets which we consider, in the aggregate, to be important to the business as a whole. As well as protecting our brand names by way of trademark registration, we also protect our innovations by means of patents and designs in key global jurisdictions. Board oversight of M&A transactions The Company’s Board has strategic oversight of significant M&A transactions (determined by value or strategic nature of transaction), which are referred to it for noting under the Group Statement of Delegated Authorities (SoDA). Other M&A transactions are referred for strategic oversight to the Management Board or other applicable senior forum or persons, under the Group SoDA. Those referral requirements under the Group SoDA apply alongside any requirement for corporate approval of M&A transactions by or within a Group company. BAT Annual Report and Form 20-F 2023 Strategic Report Governance Report Financial Statements Other Information Information on the Group 331
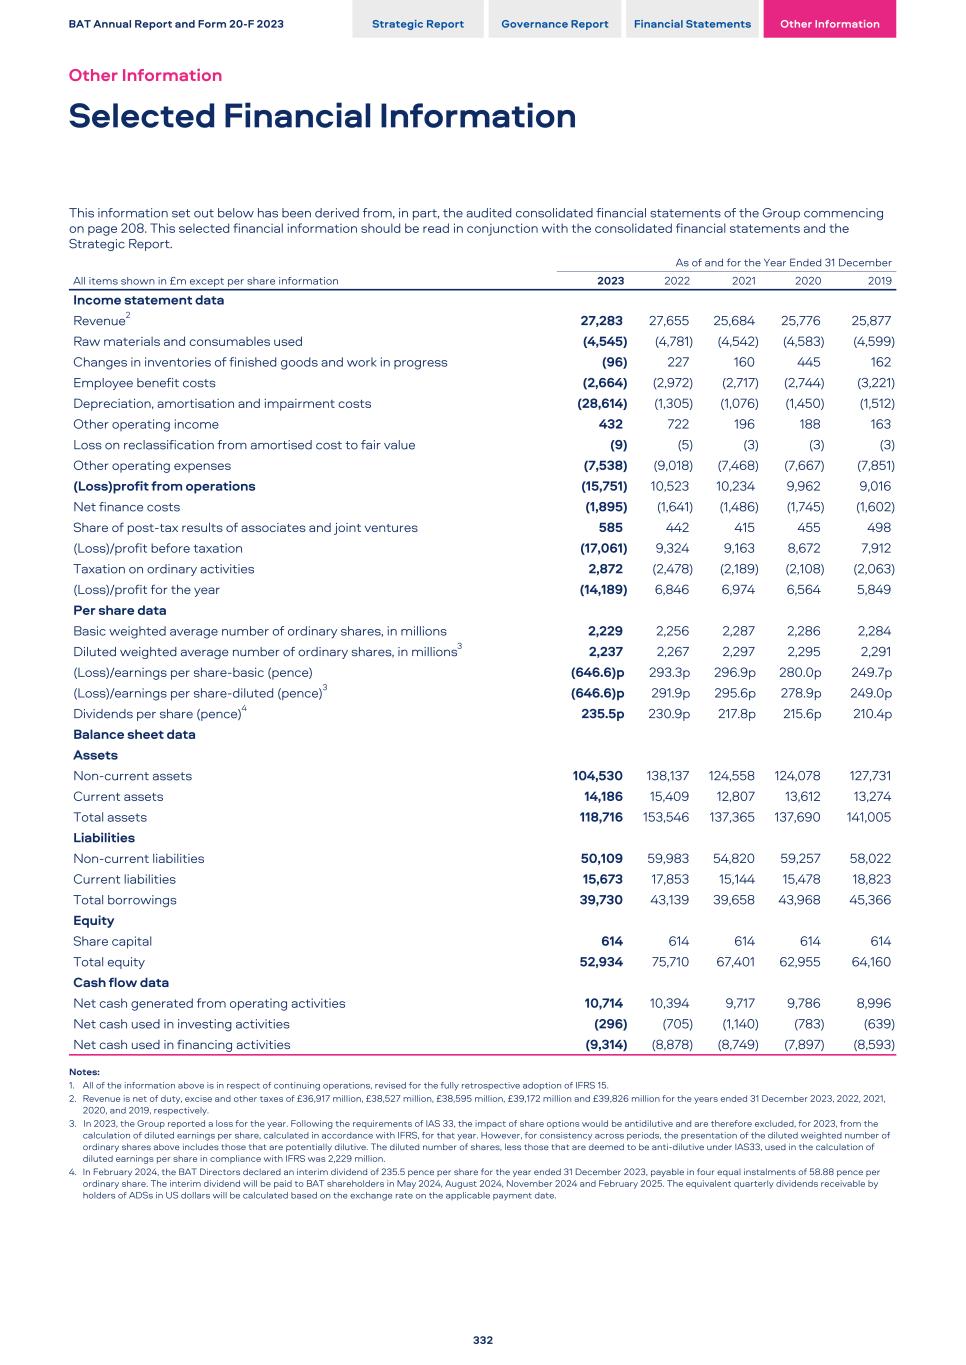
This information set out below has been derived from, in part, the audited consolidated financial statements of the Group commencing on page 208. This selected financial information should be read in conjunction with the consolidated financial statements and the Strategic Report. As of and for the Year Ended 31 December All items shown in £m except per share information 2023 2022 2021 2020 2019 Income statement data Revenue2 27,283 27,655 25,684 25,776 25,877 Raw materials and consumables used (4,545) (4,781) (4,542) (4,583) (4,599) Changes in inventories of finished goods and work in progress (96) 227 160 445 162 Employee benefit costs (2,664) (2,972) (2,717) (2,744) (3,221) Depreciation, amortisation and impairment costs (28,614) (1,305) (1,076) (1,450) (1,512) Other operating income 432 722 196 188 163 Loss on reclassification from amortised cost to fair value (9) (5) (3) (3) (3) Other operating expenses (7,538) (9,018) (7,468) (7,667) (7,851) (Loss)profit from operations (15,751) 10,523 10,234 9,962 9,016 Net finance costs (1,895) (1,641) (1,486) (1,745) (1,602) Share of post-tax results of associates and joint ventures 585 442 415 455 498 (Loss)/profit before taxation (17,061) 9,324 9,163 8,672 7,912 Taxation on ordinary activities 2,872 (2,478) (2,189) (2,108) (2,063) (Loss)/profit for the year (14,189) 6,846 6,974 6,564 5,849 Per share data Basic weighted average number of ordinary shares, in millions 2,229 2,256 2,287 2,286 2,284 Diluted weighted average number of ordinary shares, in millions3 2,237 2,267 2,297 2,295 2,291 (Loss)/earnings per share-basic (pence) (646.6)p 293.3p 296.9p 280.0p 249.7p (Loss)/earnings per share-diluted (pence)3 (646.6)p 291.9p 295.6p 278.9p 249.0p Dividends per share (pence)4 235.5p 230.9p 217.8p 215.6p 210.4p Balance sheet data Assets Non-current assets 104,530 138,137 124,558 124,078 127,731 Current assets 14,186 15,409 12,807 13,612 13,274 Total assets 118,716 153,546 137,365 137,690 141,005 Liabilities Non-current liabilities 50,109 59,983 54,820 59,257 58,022 Current liabilities 15,673 17,853 15,144 15,478 18,823 Total borrowings 39,730 43,139 39,658 43,968 45,366 Equity Share capital 614 614 614 614 614 Total equity 52,934 75,710 67,401 62,955 64,160 Cash flow data Net cash generated from operating activities 10,714 10,394 9,717 9,786 8,996 Net cash used in investing activities (296) (705) (1,140) (783) (639) Net cash used in financing activities (9,314) (8,878) (8,749) (7,897) (8,593) Notes: 1. All of the information above is in respect of continuing operations, revised for the fully retrospective adoption of IFRS 15. 2. Revenue is net of duty, excise and other taxes of £36,917 million, £38,527 million, £38,595 million, £39,172 million and £39,826 million for the years ended 31 December 2023, 2022, 2021, 2020, and 2019, respectively. 3. In 2023, the Group reported a loss for the year. Following the requirements of IAS 33, the impact of share options would be antidilutive and are therefore excluded, for 2023, from the calculation of diluted earnings per share, calculated in accordance with IFRS, for that year. However, for consistency across periods, the presentation of the diluted weighted number of ordinary shares above includes those that are potentially dilutive. The diluted number of shares, less those that are deemed to be anti-dilutive under IAS33, used in the calculation of diluted earnings per share in compliance with IFRS was 2,229 million. 4. In February 2024, the BAT Directors declared an interim dividend of 235.5 pence per share for the year ended 31 December 2023, payable in four equal instalments of 58.88 pence per ordinary share. The interim dividend will be paid to BAT shareholders in May 2024, August 2024, November 2024 and February 2025. The equivalent quarterly dividends receivable by holders of ADSs in US dollars will be calculated based on the exchange rate on the applicable payment date. BAT Annual Report and Form 20-F 2023 Strategic Report Governance Report Financial Statements Other Information Other Information Selected Financial Information 332
Volume Volume is defined as the number of units sold. Units may vary between categories. This can be summarised for the principal metrics as follows: – Factory-made cigarettes (FMC) – sticks, regardless of weight or dimensions; – Roll-Your-Own/Make-Your-Own – kilos, converted to a stick equivalent based upon 0.8 grams (per stick equivalent) for Roll-Your-Own and between 0.5 and 0.7 grams (per stick equivalent) for Make-Your-Own; – Traditional Oral – pouches (being 1:1 conversion to stick equivalent) and kilos, converted to a stick equivalent based upon 2.8 grams (per stick equivalent) for Moist Snuff, 2.0 grams (per stick equivalent) for Dry Snuff and 7.1 grams (per stick equivalent) for other oral; – Modern Oral – pouches, being 1:1 conversion to stick equivalent; – Heat/Heated sticks – sticks, being 1:1 conversion to stick equivalent; and – Vapour – pods and 10 millilitre bottles. There is no conversion to a stick equivalent. Volume is recognised in line with IFRS 15 Revenue from Contracts with Customers, based upon transfer of control. It is assumed that there is no material difference, in line with the Group’s recognition of revenue, between the transfer of control and shipment date. Volume is used by management and investors to assess the relative performance of the Group and its brands within categories, given volume is a principal determinant of revenue. Volume Share Volume share is the number of units bought by consumers of a specific brand or combination of brands, as a proportion of the total units bought by consumers in the industry, category or other sub-categorisation. Sub-categories include, but are not limited to, the HP category, Modern Oral, Vapour, Traditional Oral, Total Oral or Cigarette. Except when referencing particular markets, volume share is based on our key markets (representing around 60% of the Group’s cigarette and HP volume). Where possible, the Group utilises data provided by third-party organisations, including NielsenIQ, based upon retail audit of sales to consumers. In certain markets, where such data is not available, other measures are employed which assess volume share based upon other movements within the supply chain, such as sales to retailers. This may depend on the provision of data to the industry by the customers including distributors/wholesalers. Volume share is used by management to assess the relative performance to the Group and its brands against the performance of its competitors in the categories and geographies in which the Group operates. This measure is also useful to understand the Group’s performance when seeking to grow scale within a market or category from which future financial returns can be realised. The Group’s management believes that this measure is useful to investors to understand the relative performance of the Group and its brands against the performance of its competitors in the categories and geographies in which the Group operates. Volume share in each year compares the average volume share in the year with the average volume share in the prior year. This is a more robust measure of performance, removing short-term volatility that may arise at a point in time. However, in certain circumstances, in order to illustrate the latest performance, data may be provided as at the end of the period rather than the average in that period. In these instances, the Group indicates that these are at a specific date (for instance, December 2023). Value Share Value share is the retail value of units bought by consumers of a particular brand or combination of brands, as a proportion of the total retail value of units bought by consumers in the industry, category or other sub-categorisation in discussion. Except when referencing particular markets, value share is based on our key markets (representing around 85% of the Group’s cigarette and HP value). Where possible, the Group utilises data provided by third-party organisations, including NielsenIQ, based upon retail audit of sales to consumers. In certain markets, where such data is not available, other measures are employed which assess value share based upon other movements within the supply chain, such as sales to retailers. This may depend on the provision of data to the industry by the customers (including distributors and wholesalers). Value share is used by management to assess the relative performance of the Group and its brands against the performance of its competitors in the categories and geographies in which the Group operates, specifically indicating the Group’s ability to realise value relative to the market. The Group’s management believes that this measure is useful to investors to apprehend the relative performance of the Group and its brands against the performance of its competitors in the categories and geographies in which the Group operates, specifically indicating the Group’s ability to realise value relative to the market. Value share in each year compares the average value share in the year with the average value share in the prior period. This is a more robust measure of performance, removing short-term volatility that may arise at a point of time. However, in certain circumstances, in order to illustrate the latest performance, data may be provided that is as at the end of the period rather than the average in that period. In these instances the Group indicates that these are at a specific date (for instance, December 2023). BAT Annual Report and Form 20-F 2023 Strategic Report Governance Report Financial Statements Other Information 333
Price Mix Price mix is a term used by management and investors to explain the movement in revenue between periods. Revenue is affected by the volume (how many units are sold) and the value (how much is each unit sold for). Price mix is used to explain the value component of the sales as the Group sells each unit for a value (price) but may also achieve a movement in revenue due to the relative proportions of higher value volume sold compared to lower value volume sold (mix). This term is used to explain the Group’s relative performance between periods only. It is calculated as the difference between the movement in revenue (between periods) and volume (between periods). For instance, the decline in combustibles revenue (excluding translational foreign exchange movements) of 0.8% in 2023, with a decline in combustibles volume of 8.3% in 2023, leads to a price mix of 7.5% in 2023. No assumptions underlie this metric as it utilises the Group’s own data. Consumers of Non-Combustible Products The number of consumers of Non-Combustible products is defined as the estimated number of Legal Age (minimum 18 years) consumers of the Group’s Non-Combustible products. In markets where regular consumer tracking is in place, this estimate is obtained from adult consumer tracking studies conducted by third parties (including Kantar). In markets where regular consumer tracking is not in place, the number of consumers of Non-Combustible products is derived from volume sales of consumables and devices in such markets, using consumption patterns obtained from other similar markets with consumer tracking (utilising studies conducted by third parties, including Kantar). The number of Non-Combustible products consumers is used by management to assess the number of consumers regularly using the Group’s New Categories products as the increase in Non-Combustible products is a key pillar of the Group’s sustainability ambition and is integral to the sustainability of our business. The Group’s management believes that this measure is useful to investors given the Group’s sustainability ambition and alignment to the sustainability of the business with respect to the Non-Combustibles portfolio. % of farms monitored for child labour; % of farms with incidents of child labour identified; Number of child labour incidents identified; % reported as resolved by end of the growing season Our definition of child labour is aligned to how International Labour Organization (ILO) defines the term, namely that the work that deprives children of their childhood, their potential and their dignity, and that is harmful to their physical and mental development (https://www.ilo.org/ipec/facts/lang--en/index.htm). Reported via our Thrive annual reports covering all BAT-contracted farmers and farmers supplying our third-party suppliers, representing more than 94% of total tobacco grown or purchased by BAT in 2023. As tobacco-growing seasons vary around the world, data is based on the most recent crop cycle at the time of reporting, instead of the crop grown in the calendar year. Data in relation to our contracted farmers is collected by BAT field technicians (FTs) who visit our contracted farmers approximately once a month during the growing season. Details of each visit are recorded in our Farmer Sustainability Management (FSM) digital app by the FT and are formally acknowledged by the farmer. If any child labour case is identified, it is reported in the system and treated as a critical prompt action. For the case to be resolved, this is followed by an unannounced visit shortly after to observe whether this is repeated and a remediation plan agreed with the farmer. The remediation plan varies from case to case, considering the individual circumstances. Our third-party suppliers collect data for Thrive via their own FTs, in their own farm monitoring systems. Once the data is collected in the field, the country team analyse the data and approve it or reopen the questions for discussion with the farmers. After that, the data is reported in Thrive and made available to the Global Leaf ESG team. The data is also reviewed by an independent third party. Ethnically Diverse Group For the purposes of D&I Reporting, the following definitions are used. Ethnically diverse groups includes global ethnic groups Hispanic/ Latin American, Black, Asian, Indigenous, Mixed, Other (Arabs/Middle Eastern and Turkish). In 2022, we expanded the scope of our confidential voluntary ethnicity identity collection and reporting beyond the UK to six additional markets (Australia, Brazil, Canada, Malaysia, South Africa and the U.S.). Senior Leadership Teams Members of senior leadership teams are defined as any employee who is either a direct report of a Management Board member or a direct report of a Management Board’s direct report. Some MB-1 and MB-2 employees are double-counted in this calculation to account for those who feature on one or more senior leadership teams, given their dual accountability. % Women in Management Roles The number of female management-grade employees, as a percentage of the total number of management-grade employees. Management-grade employees include all global graduates and all employees at job grade 34 to grade 41, being the highest grade immediately prior to the Management Board. The gender of each employee is typically recorded at the point of hire. % of Key Leadership teams with at least a 50% spread of distinct nationalities: The number of Management Board members that have at least a 50% spread of nationalities within their Key Leadership teams (MB-1 members only), as a percentage of the total number of Management Board members. A Key Leadership team is categorised as the group of direct reports that report into a Management Board member. The 50% spread of distinct nationalities is satisfied if at least half of a given MB's Key Leadership team members are of distinct nationalities. The nationality of each employee is typically recorded at the point of hire. U.S. employees hired by Reynolds prior to its merger with BAT did not disclose nationality at point of hire and therefore these employees are excluded from the calculation. Some MB-1 Key Leadership team members are double-counted in this calculation to account for those who feature on one or more MB leadership teams, given their dual accountability. BAT Annual Report and Form 20-F 2023 Strategic Report Governance Report Financial Statements Other Information Other Information Non-Financial Measures 334
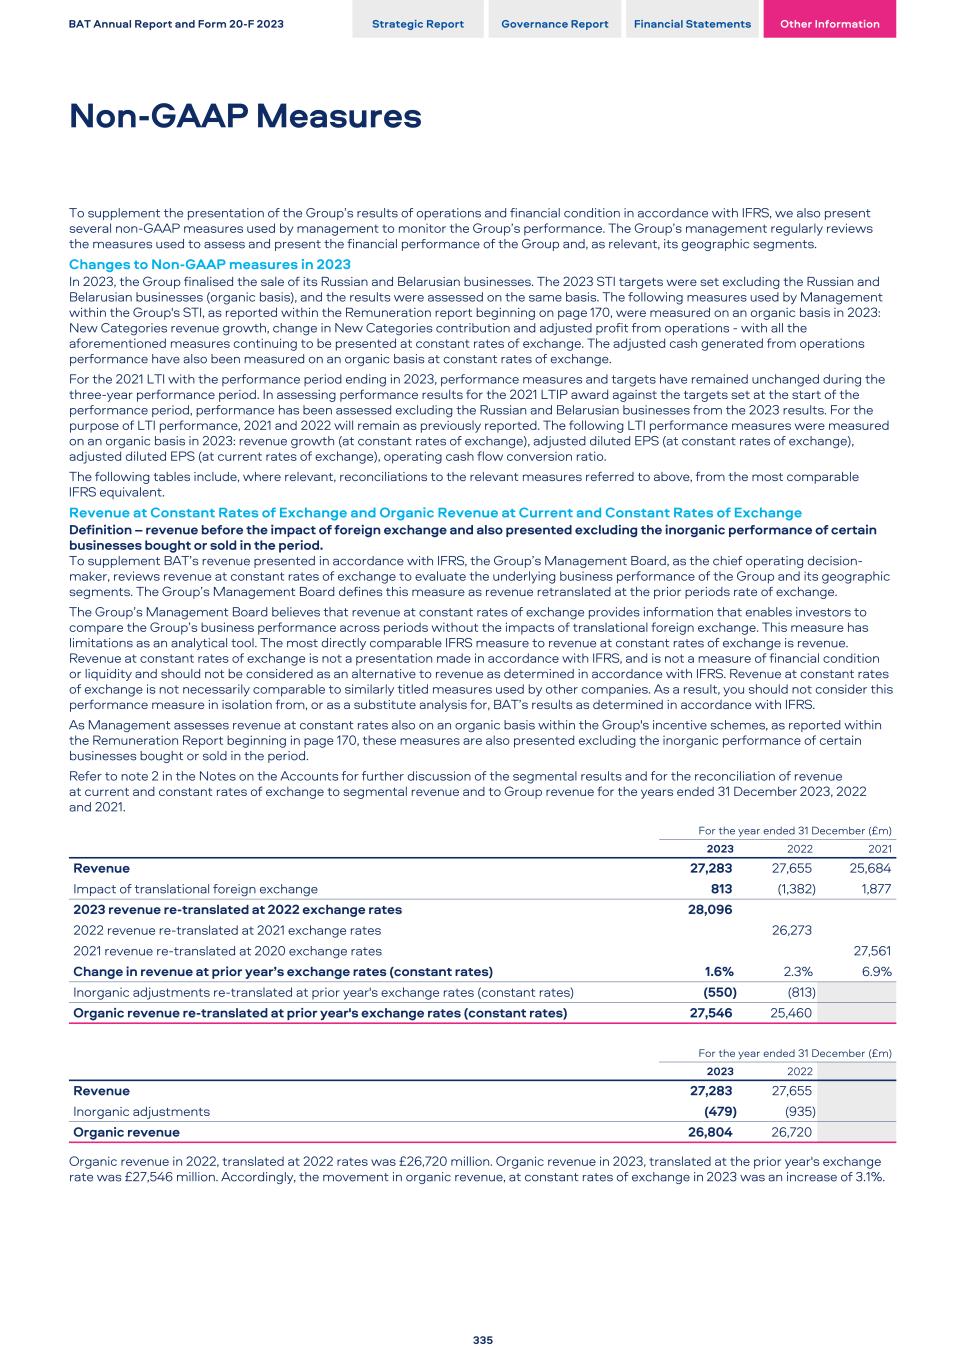
To supplement the presentation of the Group’s results of operations and financial condition in accordance with IFRS, we also present several non-GAAP measures used by management to monitor the Group’s performance. The Group’s management regularly reviews the measures used to assess and present the financial performance of the Group and, as relevant, its geographic segments. Changes to Non-GAAP measures in 2023 In 2023, the Group finalised the sale of its Russian and Belarusian businesses. The 2023 STI targets were set excluding the Russian and Belarusian businesses (organic basis), and the results were assessed on the same basis. The following measures used by Management within the Group's STI, as reported within the Remuneration report beginning on page 170, were measured on an organic basis in 2023: New Categories revenue growth, change in New Categories contribution and adjusted profit from operations - with all the aforementioned measures continuing to be presented at constant rates of exchange. The adjusted cash generated from operations performance have also been measured on an organic basis at constant rates of exchange. For the 2021 LTI with the performance period ending in 2023, performance measures and targets have remained unchanged during the three-year performance period. In assessing performance results for the 2021 LTIP award against the targets set at the start of the performance period, performance has been assessed excluding the Russian and Belarusian businesses from the 2023 results. For the purpose of LTI performance, 2021 and 2022 will remain as previously reported. The following LTI performance measures were measured on an organic basis in 2023: revenue growth (at constant rates of exchange), adjusted diluted EPS (at constant rates of exchange), adjusted diluted EPS (at current rates of exchange), operating cash flow conversion ratio. The following tables include, where relevant, reconciliations to the relevant measures referred to above, from the most comparable IFRS equivalent. Revenue at Constant Rates of Exchange and Organic Revenue at Current and Constant Rates of Exchange Definition – revenue before the impact of foreign exchange and also presented excluding the inorganic performance of certain businesses bought or sold in the period. To supplement BAT’s revenue presented in accordance with IFRS, the Group’s Management Board, as the chief operating decision- maker, reviews revenue at constant rates of exchange to evaluate the underlying business performance of the Group and its geographic segments. The Group’s Management Board defines this measure as revenue retranslated at the prior periods rate of exchange. The Group’s Management Board believes that revenue at constant rates of exchange provides information that enables investors to compare the Group’s business performance across periods without the impacts of translational foreign exchange. This measure has limitations as an analytical tool. The most directly comparable IFRS measure to revenue at constant rates of exchange is revenue. Revenue at constant rates of exchange is not a presentation made in accordance with IFRS, and is not a measure of financial condition or liquidity and should not be considered as an alternative to revenue as determined in accordance with IFRS. Revenue at constant rates of exchange is not necessarily comparable to similarly titled measures used by other companies. As a result, you should not consider this performance measure in isolation from, or as a substitute analysis for, BAT’s results as determined in accordance with IFRS. As Management assesses revenue at constant rates also on an organic basis within the Group's incentive schemes, as reported within the Remuneration Report beginning in page 170, these measures are also presented excluding the inorganic performance of certain businesses bought or sold in the period. Refer to note 2 in the Notes on the Accounts for further discussion of the segmental results and for the reconciliation of revenue at current and constant rates of exchange to segmental revenue and to Group revenue for the years ended 31 December 2023, 2022 and 2021. For the year ended 31 December (£m) 2023 2022 2021 Revenue 27,283 27,655 25,684 Impact of translational foreign exchange 813 (1,382) 1,877 2023 revenue re-translated at 2022 exchange rates 28,096 2022 revenue re-translated at 2021 exchange rates 26,273 2021 revenue re-translated at 2020 exchange rates 27,561 Change in revenue at prior year’s exchange rates (constant rates) 1.6% 2.3% 6.9% Inorganic adjustments re-translated at prior year's exchange rates (constant rates) (550) (813) Organic revenue re-translated at prior year's exchange rates (constant rates) 27,546 25,460 For the year ended 31 December (£m) 2023 2022 Revenue 27,283 27,655 Inorganic adjustments (479) (935) Organic revenue 26,804 26,720 Organic revenue in 2022, translated at 2022 rates was £26,720 million. Organic revenue in 2023, translated at the prior year's exchange rate was £27,546 million. Accordingly, the movement in organic revenue, at constant rates of exchange in 2023 was an increase of 3.1%. BAT Annual Report and Form 20-F 2023 Strategic Report Governance Report Financial Statements Other Information Non-GAAP Measures 335
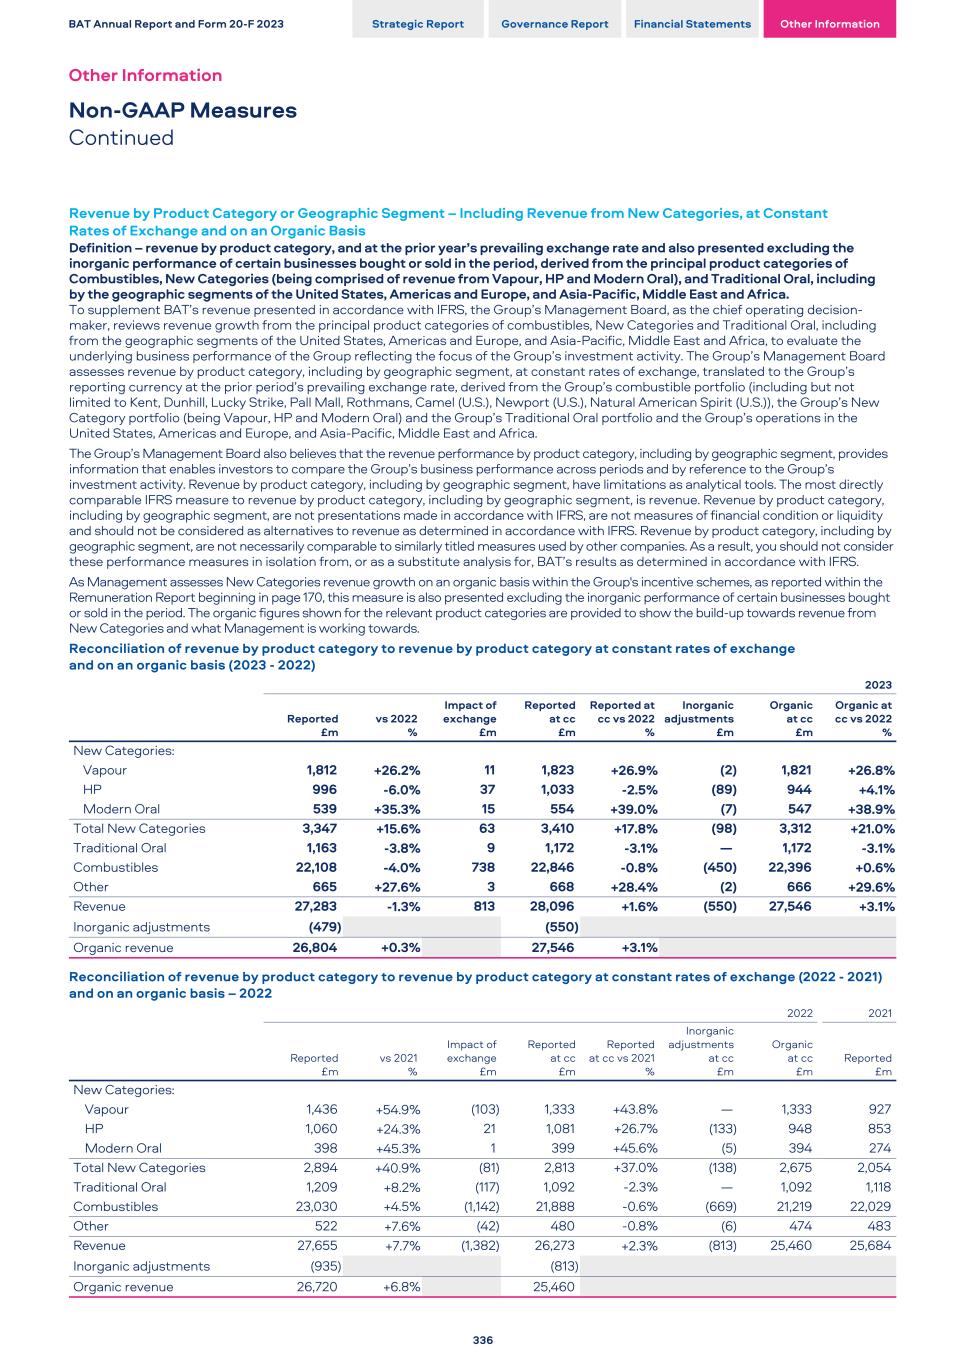
Revenue by Product Category or Geographic Segment – Including Revenue from New Categories, at Constant Rates of Exchange and on an Organic Basis Definition – revenue by product category, and at the prior year’s prevailing exchange rate and also presented excluding the inorganic performance of certain businesses bought or sold in the period, derived from the principal product categories of Combustibles, New Categories (being comprised of revenue from Vapour, HP and Modern Oral), and Traditional Oral, including by the geographic segments of the United States, Americas and Europe, and Asia-Pacific, Middle East and Africa. To supplement BAT’s revenue presented in accordance with IFRS, the Group’s Management Board, as the chief operating decision- maker, reviews revenue growth from the principal product categories of combustibles, New Categories and Traditional Oral, including from the geographic segments of the United States, Americas and Europe, and Asia-Pacific, Middle East and Africa, to evaluate the underlying business performance of the Group reflecting the focus of the Group’s investment activity. The Group’s Management Board assesses revenue by product category, including by geographic segment, at constant rates of exchange, translated to the Group’s reporting currency at the prior period’s prevailing exchange rate, derived from the Group’s combustible portfolio (including but not limited to Kent, Dunhill, Lucky Strike, Pall Mall, Rothmans, Camel (U.S.), Newport (U.S.), Natural American Spirit (U.S.)), the Group’s New Category portfolio (being Vapour, HP and Modern Oral) and the Group’s Traditional Oral portfolio and the Group’s operations in the United States, Americas and Europe, and Asia-Pacific, Middle East and Africa. The Group’s Management Board also believes that the revenue performance by product category, including by geographic segment, provides information that enables investors to compare the Group’s business performance across periods and by reference to the Group’s investment activity. Revenue by product category, including by geographic segment, have limitations as analytical tools. The most directly comparable IFRS measure to revenue by product category, including by geographic segment, is revenue. Revenue by product category, including by geographic segment, are not presentations made in accordance with IFRS, are not measures of financial condition or liquidity and should not be considered as alternatives to revenue as determined in accordance with IFRS. Revenue by product category, including by geographic segment, are not necessarily comparable to similarly titled measures used by other companies. As a result, you should not consider these performance measures in isolation from, or as a substitute analysis for, BAT’s results as determined in accordance with IFRS. As Management assesses New Categories revenue growth on an organic basis within the Group's incentive schemes, as reported within the Remuneration Report beginning in page 170, this measure is also presented excluding the inorganic performance of certain businesses bought or sold in the period. The organic figures shown for the relevant product categories are provided to show the build-up towards revenue from New Categories and what Management is working towards. Reconciliation of revenue by product category to revenue by product category at constant rates of exchange and on an organic basis (2023 - 2022) 2023 Reported £m vs 2022 % Impact of exchange £m Reported at cc £m Reported at cc vs 2022 % Inorganic adjustments £m Organic at cc £m Organic at cc vs 2022 % New Categories: Vapour 1,812 +26.2% 11 1,823 +26.9% (2) 1,821 +26.8% HP 996 -6.0% 37 1,033 -2.5% (89) 944 +4.1% Modern Oral 539 +35.3% 15 554 +39.0% (7) 547 +38.9% Total New Categories 3,347 +15.6% 63 3,410 +17.8% (98) 3,312 +21.0% Traditional Oral 1,163 -3.8% 9 1,172 -3.1% — 1,172 -3.1% Combustibles 22,108 -4.0% 738 22,846 -0.8% (450) 22,396 +0.6% Other 665 +27.6% 3 668 +28.4% (2) 666 +29.6% Revenue 27,283 -1.3% 813 28,096 +1.6% (550) 27,546 +3.1% Inorganic adjustments (479) (550) Organic revenue 26,804 +0.3% 27,546 +3.1% Reconciliation of revenue by product category to revenue by product category at constant rates of exchange (2022 - 2021) and on an organic basis – 2022 2022 2021 Reported £m vs 2021 % Impact of exchange £m Reported at cc £m Reported at cc vs 2021 % Inorganic adjustments at cc £m Organic at cc £m Reported £m New Categories: Vapour 1,436 +54.9% (103) 1,333 +43.8 % — 1,333 927 HP 1,060 +24.3% 21 1,081 +26.7 % (133) 948 853 Modern Oral 398 +45.3% 1 399 +45.6 % (5) 394 274 Total New Categories 2,894 +40.9% (81) 2,813 +37.0 % (138) 2,675 2,054 Traditional Oral 1,209 +8.2% (117) 1,092 -2.3 % — 1,092 1,118 Combustibles 23,030 +4.5 % (1,142) 21,888 -0.6 % (669) 21,219 22,029 Other 522 +7.6% (42) 480 -0.8 % (6) 474 483 Revenue 27,655 +7.7% (1,382) 26,273 +2.3 % (813) 25,460 25,684 Inorganic adjustments (935) (813) Organic revenue 26,720 +6.8% 25,460 BAT Annual Report and Form 20-F 2023 Strategic Report Governance Report Financial Statements Other Information Other Information Non-GAAP Measures Continued 336
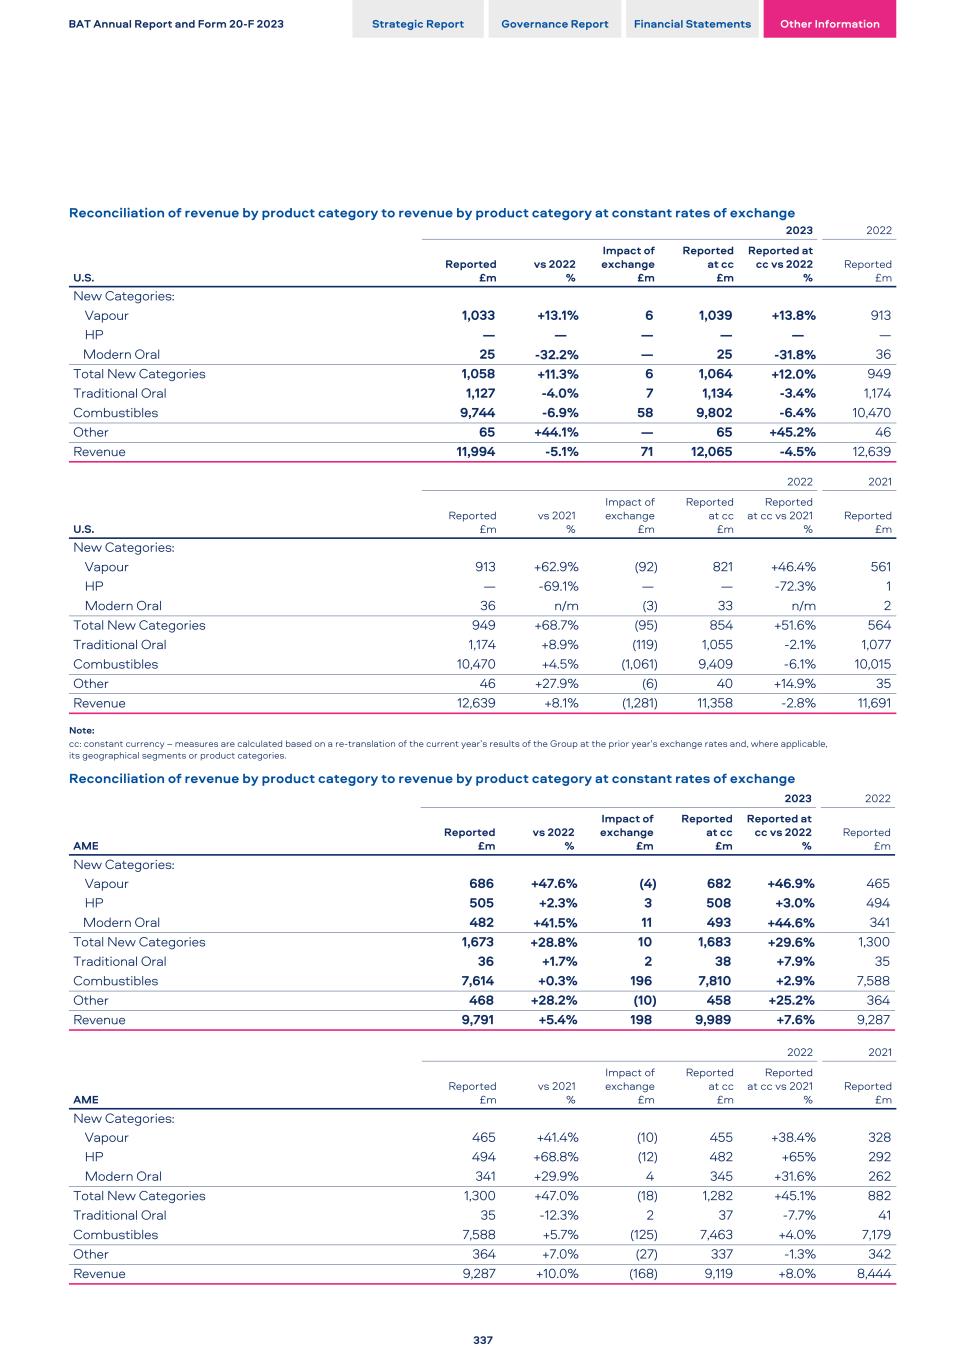
Reconciliation of revenue by product category to revenue by product category at constant rates of exchange 2023 2022 U.S. Reported £m vs 2022 % Impact of exchange £m Reported at cc £m Reported at cc vs 2022 % Reported £m New Categories: Vapour 1,033 +13.1 % 6 1,039 +13.8 % 913 HP — — — — — — Modern Oral 25 -32.2 % — 25 -31.8 % 36 Total New Categories 1,058 +11.3 % 6 1,064 +12.0 % 949 Traditional Oral 1,127 -4.0 % 7 1,134 -3.4 % 1,174 Combustibles 9,744 -6.9 % 58 9,802 -6.4 % 10,470 Other 65 +44.1 % — 65 +45.2 % 46 Revenue 11,994 -5.1 % 71 12,065 -4.5 % 12,639 2022 2021 U.S. Reported £m vs 2021 % Impact of exchange £m Reported at cc £m Reported at cc vs 2021 % Reported £m New Categories: Vapour 913 +62.9% (92) 821 +46.4 % 561 HP — -69.1% — — -72.3 % 1 Modern Oral 36 n/m (3) 33 n/m 2 Total New Categories 949 +68.7% (95) 854 +51.6 % 564 Traditional Oral 1,174 +8.9% (119) 1,055 -2.1 % 1,077 Combustibles 10,470 +4.5% (1,061) 9,409 -6.1 % 10,015 Other 46 +27.9% (6) 40 +14.9 % 35 Revenue 12,639 +8.1% (1,281) 11,358 -2.8 % 11,691 Note: cc: constant currency – measures are calculated based on a re-translation of the current year’s results of the Group at the prior year’s exchange rates and, where applicable, its geographical segments or product categories. Reconciliation of revenue by product category to revenue by product category at constant rates of exchange 2023 2022 AME Reported £m vs 2022 % Impact of exchange £m Reported at cc £m Reported at cc vs 2022 % Reported £m New Categories: Vapour 686 +47.6 % (4) 682 +46.9 % 465 HP 505 +2.3 % 3 508 +3.0 % 494 Modern Oral 482 +41.5 % 11 493 +44.6 % 341 Total New Categories 1,673 +28.8 % 10 1,683 +29.6 % 1,300 Traditional Oral 36 +1.7 % 2 38 +7.9 % 35 Combustibles 7,614 +0.3 % 196 7,810 +2.9 % 7,588 Other 468 +28.2 % (10) 458 +25.2 % 364 Revenue 9,791 +5.4 % 198 9,989 +7.6 % 9,287 2022 2021 AME Reported £m vs 2021 % Impact of exchange £m Reported at cc £m Reported at cc vs 2021 % Reported £m New Categories: Vapour 465 +41.4% (10) 455 +38.4 % 328 HP 494 +68.8% (12) 482 +65 % 292 Modern Oral 341 +29.9% 4 345 +31.6 % 262 Total New Categories 1,300 +47.0% (18) 1,282 +45.1 % 882 Traditional Oral 35 -12.3% 2 37 -7.7 % 41 Combustibles 7,588 +5.7% (125) 7,463 +4.0 % 7,179 Other 364 +7.0% (27) 337 -1.3 % 342 Revenue 9,287 +10.0% (168) 9,119 +8.0 % 8,444 BAT Annual Report and Form 20-F 2023 Strategic Report Governance Report Financial Statements Other Information 337
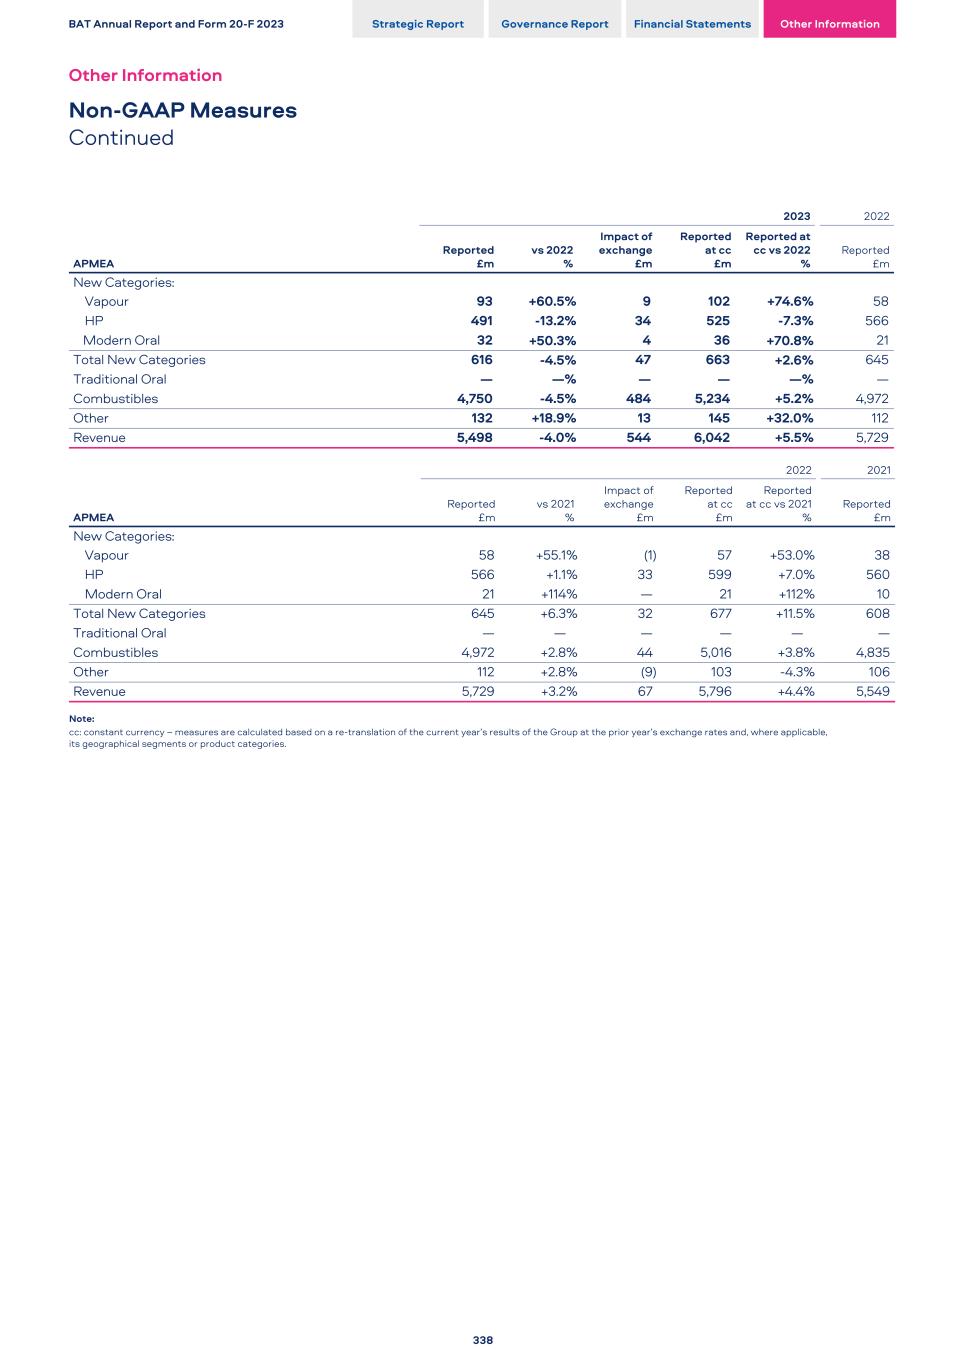
2023 2022 APMEA Reported £m vs 2022 % Impact of exchange £m Reported at cc £m Reported at cc vs 2022 % Reported £m New Categories: Vapour 93 +60.5 % 9 102 +74.6 % 58 HP 491 -13.2 % 34 525 -7.3 % 566 Modern Oral 32 +50.3 % 4 36 +70.8 % 21 Total New Categories 616 -4.5 % 47 663 +2.6 % 645 Traditional Oral — — % — — — % — Combustibles 4,750 -4.5 % 484 5,234 +5.2 % 4,972 Other 132 +18.9 % 13 145 +32.0 % 112 Revenue 5,498 -4.0 % 544 6,042 +5.5 % 5,729 2022 2021 APMEA Reported £m vs 2021 % Impact of exchange £m Reported at cc £m Reported at cc vs 2021 % Reported £m New Categories: Vapour 58 +55.1% (1) 57 +53.0 % 38 HP 566 +1.1% 33 599 +7.0 % 560 Modern Oral 21 +114% — 21 +112 % 10 Total New Categories 645 +6.3% 32 677 +11.5 % 608 Traditional Oral — — — — — — Combustibles 4,972 +2.8% 44 5,016 +3.8 % 4,835 Other 112 +2.8% (9) 103 -4.3 % 106 Revenue 5,729 +3.2% 67 5,796 +4.4 % 5,549 Note: cc: constant currency – measures are calculated based on a re-translation of the current year’s results of the Group at the prior year’s exchange rates and, where applicable, its geographical segments or product categories. BAT Annual Report and Form 20-F 2023 Strategic Report Governance Report Financial Statements Other Information Other Information Non-GAAP Measures Continued 338
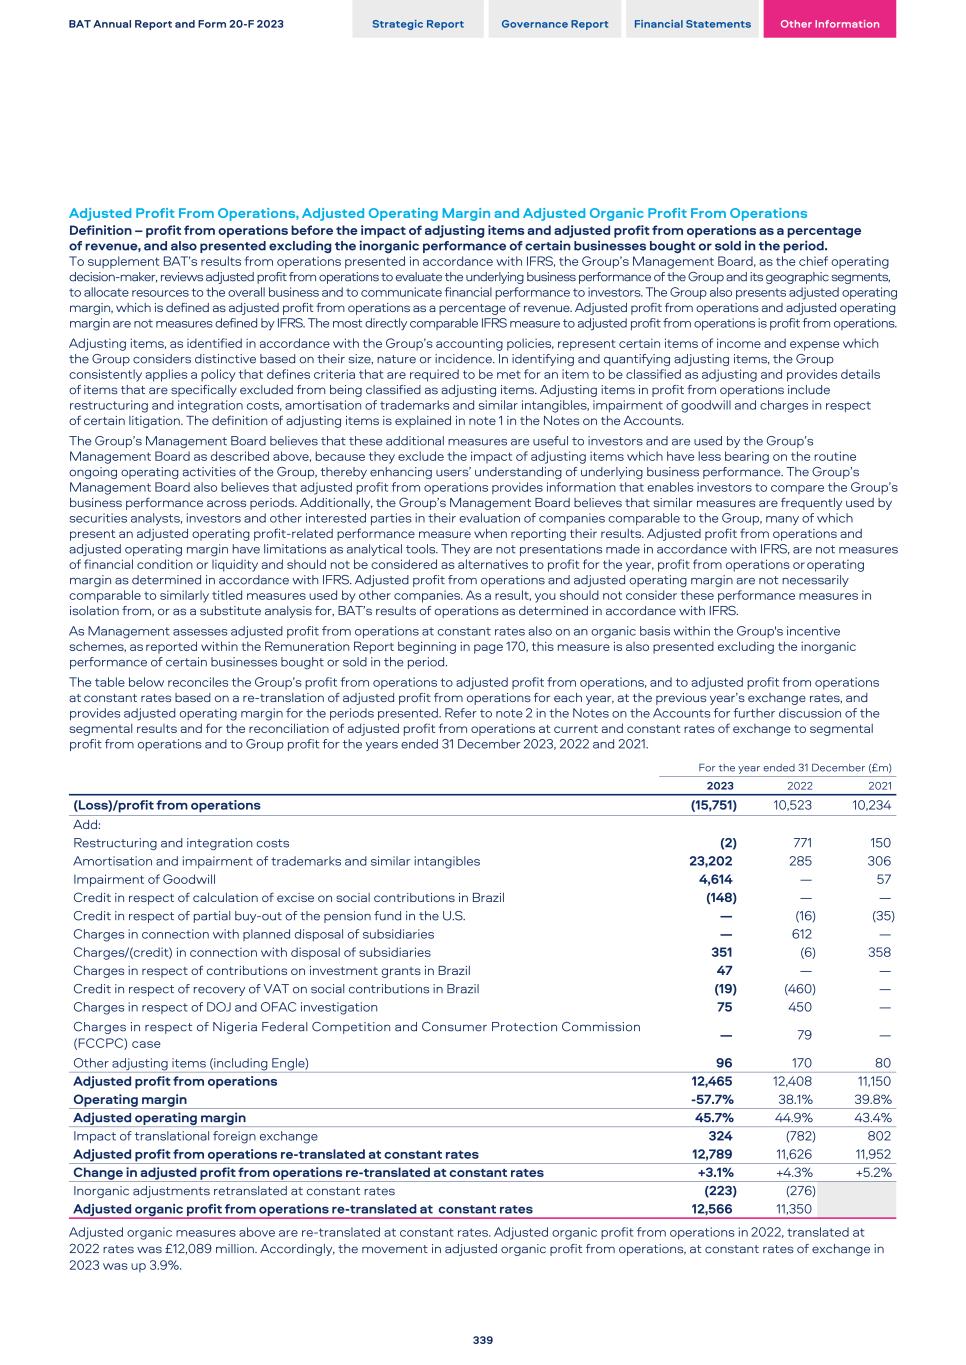
Adjusted Profit From Operations, Adjusted Operating Margin and Adjusted Organic Profit From Operations Definition – profit from operations before the impact of adjusting items and adjusted profit from operations as a percentage of revenue, and also presented excluding the inorganic performance of certain businesses bought or sold in the period. To supplement BAT’s results from operations presented in accordance with IFRS, the Group’s Management Board, as the chief operating decision‑maker, reviews adjusted profit from operations to evaluate the underlying business performance of the Group and its geographic segments, to allocate resources to the overall business and to communicate financial performance to investors. The Group also presents adjusted operating margin, which is defined as adjusted profit from operations as a percentage of revenue. Adjusted profit from operations and adjusted operating margin are not measures defined by IFRS. The most directly comparable IFRS measure to adjusted profit from operations is profit from operations. Adjusting items, as identified in accordance with the Group’s accounting policies, represent certain items of income and expense which the Group considers distinctive based on their size, nature or incidence. In identifying and quantifying adjusting items, the Group consistently applies a policy that defines criteria that are required to be met for an item to be classified as adjusting and provides details of items that are specifically excluded from being classified as adjusting items. Adjusting items in profit from operations include restructuring and integration costs, amortisation of trademarks and similar intangibles, impairment of goodwill and charges in respect of certain litigation. The definition of adjusting items is explained in note 1 in the Notes on the Accounts. The Group’s Management Board believes that these additional measures are useful to investors and are used by the Group’s Management Board as described above, because they exclude the impact of adjusting items which have less bearing on the routine ongoing operating activities of the Group, thereby enhancing users’ understanding of underlying business performance. The Group’s Management Board also believes that adjusted profit from operations provides information that enables investors to compare the Group’s business performance across periods. Additionally, the Group’s Management Board believes that similar measures are frequently used by securities analysts, investors and other interested parties in their evaluation of companies comparable to the Group, many of which present an adjusted operating profit-related performance measure when reporting their results. Adjusted profit from operations and adjusted operating margin have limitations as analytical tools. They are not presentations made in accordance with IFRS, are not measures of financial condition or liquidity and should not be considered as alternatives to profit for the year, profit from operations or operating margin as determined in accordance with IFRS. Adjusted profit from operations and adjusted operating margin are not necessarily comparable to similarly titled measures used by other companies. As a result, you should not consider these performance measures in isolation from, or as a substitute analysis for, BAT’s results of operations as determined in accordance with IFRS. As Management assesses adjusted profit from operations at constant rates also on an organic basis within the Group's incentive schemes, as reported within the Remuneration Report beginning in page 170, this measure is also presented excluding the inorganic performance of certain businesses bought or sold in the period. The table below reconciles the Group’s profit from operations to adjusted profit from operations, and to adjusted profit from operations at constant rates based on a re-translation of adjusted profit from operations for each year, at the previous year’s exchange rates, and provides adjusted operating margin for the periods presented. Refer to note 2 in the Notes on the Accounts for further discussion of the segmental results and for the reconciliation of adjusted profit from operations at current and constant rates of exchange to segmental profit from operations and to Group profit for the years ended 31 December 2023, 2022 and 2021. For the year ended 31 December (£m) 2023 2022 2021 (Loss)/profit from operations (15,751) 10,523 10,234 Add: Restructuring and integration costs (2) 771 150 Amortisation and impairment of trademarks and similar intangibles 23,202 285 306 Impairment of Goodwill 4,614 — 57 Credit in respect of calculation of excise on social contributions in Brazil (148) — — Credit in respect of partial buy-out of the pension fund in the U.S. — (16) (35) Charges in connection with planned disposal of subsidiaries — 612 — Charges/(credit) in connection with disposal of subsidiaries 351 (6) 358 Charges in respect of contributions on investment grants in Brazil 47 — — Credit in respect of recovery of VAT on social contributions in Brazil (19) (460) — Charges in respect of DOJ and OFAC investigation 75 450 — Charges in respect of Nigeria Federal Competition and Consumer Protection Commission (FCCPC) case — 79 — Other adjusting items (including Engle) 96 170 80 Adjusted profit from operations 12,465 12,408 11,150 Operating margin -57.7% 38.1% 39.8% Adjusted operating margin 45.7% 44.9% 43.4% Impact of translational foreign exchange 324 (782) 802 Adjusted profit from operations re-translated at constant rates 12,789 11,626 11,952 Change in adjusted profit from operations re-translated at constant rates +3.1% +4.3% +5.2% Inorganic adjustments retranslated at constant rates (223) (276) Adjusted organic profit from operations re-translated at constant rates 12,566 11,350 Adjusted organic measures above are re-translated at constant rates. Adjusted organic profit from operations in 2022, translated at 2022 rates was £12,089 million. Accordingly, the movement in adjusted organic profit from operations, at constant rates of exchange in 2023 was up 3.9%. BAT Annual Report and Form 20-F 2023 Strategic Report Governance Report Financial Statements Other Information 339
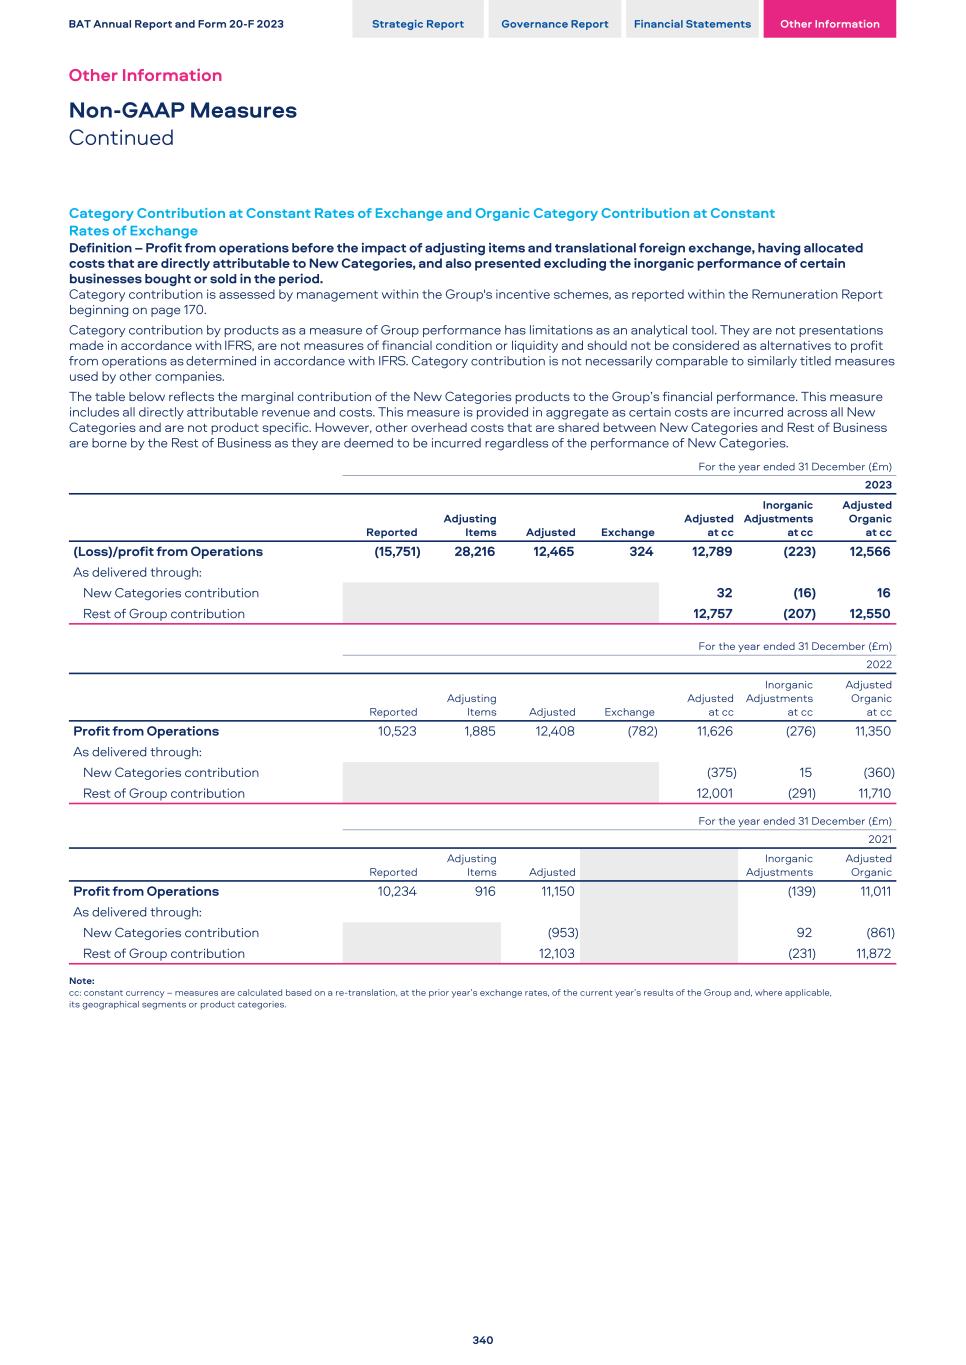
Category Contribution at Constant Rates of Exchange and Organic Category Contribution at Constant Rates of Exchange Definition – Profit from operations before the impact of adjusting items and translational foreign exchange, having allocated costs that are directly attributable to New Categories, and also presented excluding the inorganic performance of certain businesses bought or sold in the period. Category contribution is assessed by management within the Group's incentive schemes, as reported within the Remuneration Report beginning on page 170. Category contribution by products as a measure of Group performance has limitations as an analytical tool. They are not presentations made in accordance with IFRS, are not measures of financial condition or liquidity and should not be considered as alternatives to profit from operations as determined in accordance with IFRS. Category contribution is not necessarily comparable to similarly titled measures used by other companies. The table below reflects the marginal contribution of the New Categories products to the Group’s financial performance. This measure includes all directly attributable revenue and costs. This measure is provided in aggregate as certain costs are incurred across all New Categories and are not product specific. However, other overhead costs that are shared between New Categories and Rest of Business are borne by the Rest of Business as they are deemed to be incurred regardless of the performance of New Categories. For the year ended 31 December (£m) 2023 Reported Adjusting Items Adjusted Exchange Adjusted at cc Inorganic Adjustments at cc Adjusted Organic at cc (Loss)/profit from Operations (15,751) 28,216 12,465 324 12,789 (223) 12,566 As delivered through: New Categories contribution 32 (16) 16 Rest of Group contribution 12,757 (207) 12,550 For the year ended 31 December (£m) 2022 Reported Adjusting Items Adjusted Exchange Adjusted at cc Inorganic Adjustments at cc Adjusted Organic at cc Profit from Operations 10,523 1,885 12,408 (782) 11,626 (276) 11,350 As delivered through: New Categories contribution (375) 15 (360) Rest of Group contribution 12,001 (291) 11,710 For the year ended 31 December (£m) 2021 Reported Adjusting Items Adjusted Inorganic Adjustments Adjusted Organic Profit from Operations 10,234 916 11,150 (139) 11,011 As delivered through: New Categories contribution (953) 92 (861) Rest of Group contribution 12,103 (231) 11,872 Note: cc: constant currency – measures are calculated based on a re-translation, at the prior year’s exchange rates, of the current year’s results of the Group and, where applicable, its geographical segments or product categories. BAT Annual Report and Form 20-F 2023 Strategic Report Governance Report Financial Statements Other Information Other Information Non-GAAP Measures Continued 340
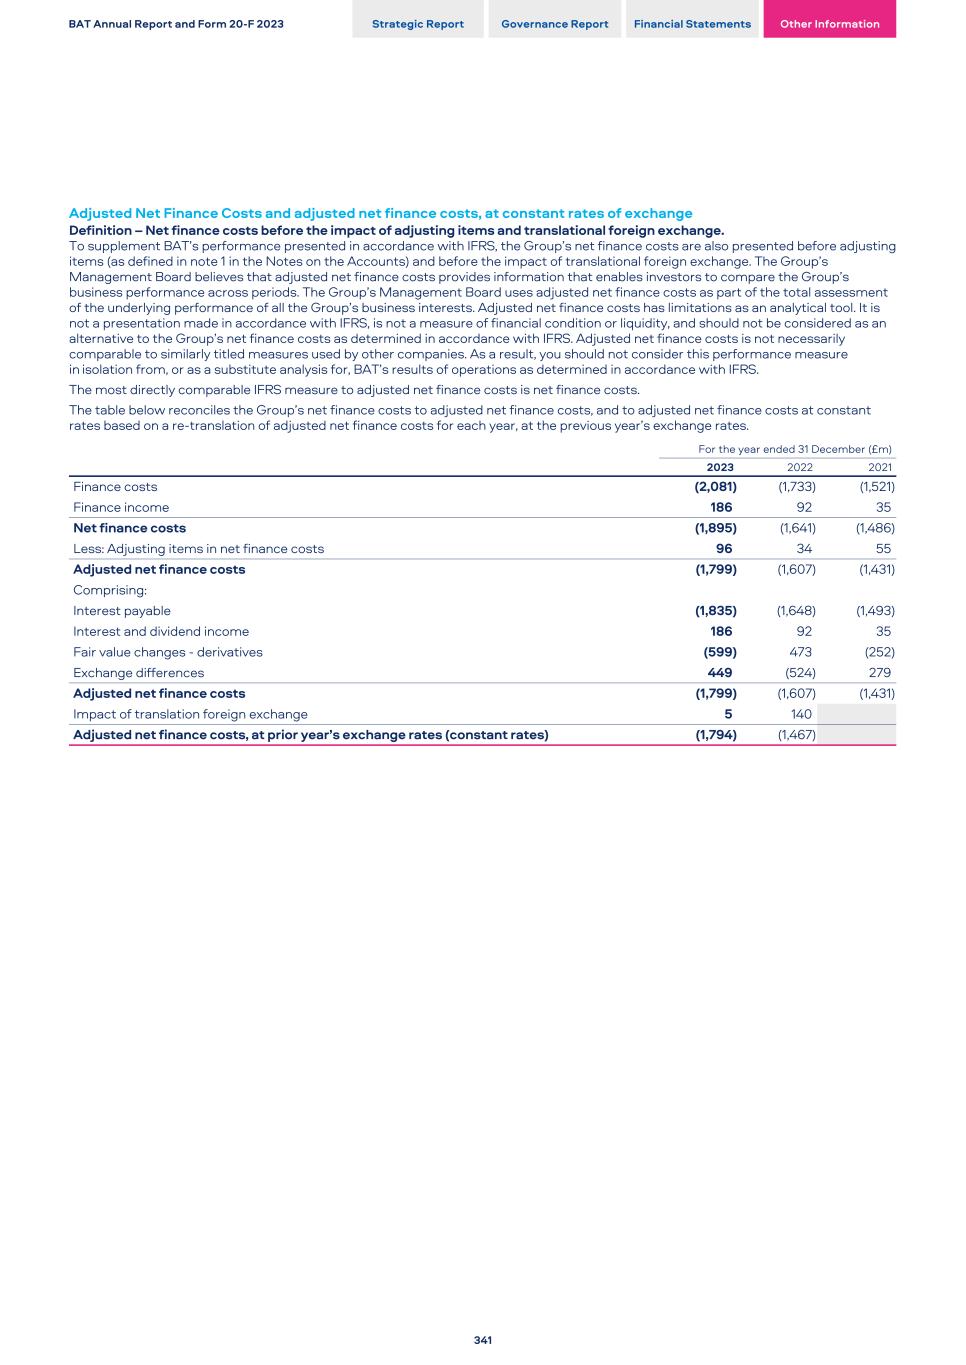
Adjusted Net Finance Costs and adjusted net finance costs, at constant rates of exchange Definition – Net finance costs before the impact of adjusting items and translational foreign exchange. To supplement BAT’s performance presented in accordance with IFRS, the Group’s net finance costs are also presented before adjusting items (as defined in note 1 in the Notes on the Accounts) and before the impact of translational foreign exchange. The Group’s Management Board believes that adjusted net finance costs provides information that enables investors to compare the Group’s business performance across periods. The Group’s Management Board uses adjusted net finance costs as part of the total assessment of the underlying performance of all the Group’s business interests. Adjusted net finance costs has limitations as an analytical tool. It is not a presentation made in accordance with IFRS, is not a measure of financial condition or liquidity, and should not be considered as an alternative to the Group’s net finance costs as determined in accordance with IFRS. Adjusted net finance costs is not necessarily comparable to similarly titled measures used by other companies. As a result, you should not consider this performance measure in isolation from, or as a substitute analysis for, BAT’s results of operations as determined in accordance with IFRS. The most directly comparable IFRS measure to adjusted net finance costs is net finance costs. The table below reconciles the Group’s net finance costs to adjusted net finance costs, and to adjusted net finance costs at constant rates based on a re-translation of adjusted net finance costs for each year, at the previous year’s exchange rates. For the year ended 31 December (£m) 2023 2022 2021 Finance costs (2,081) (1,733) (1,521) Finance income 186 92 35 Net finance costs (1,895) (1,641) (1,486) Less: Adjusting items in net finance costs 96 34 55 Adjusted net finance costs (1,799) (1,607) (1,431) Comprising: Interest payable (1,835) (1,648) (1,493) Interest and dividend income 186 92 35 Fair value changes - derivatives (599) 473 (252) Exchange differences 449 (524) 279 Adjusted net finance costs (1,799) (1,607) (1,431) Impact of translation foreign exchange 5 140 Adjusted net finance costs, at prior year’s exchange rates (constant rates) (1,794) (1,467) BAT Annual Report and Form 20-F 2023 Strategic Report Governance Report Financial Statements Other Information 341
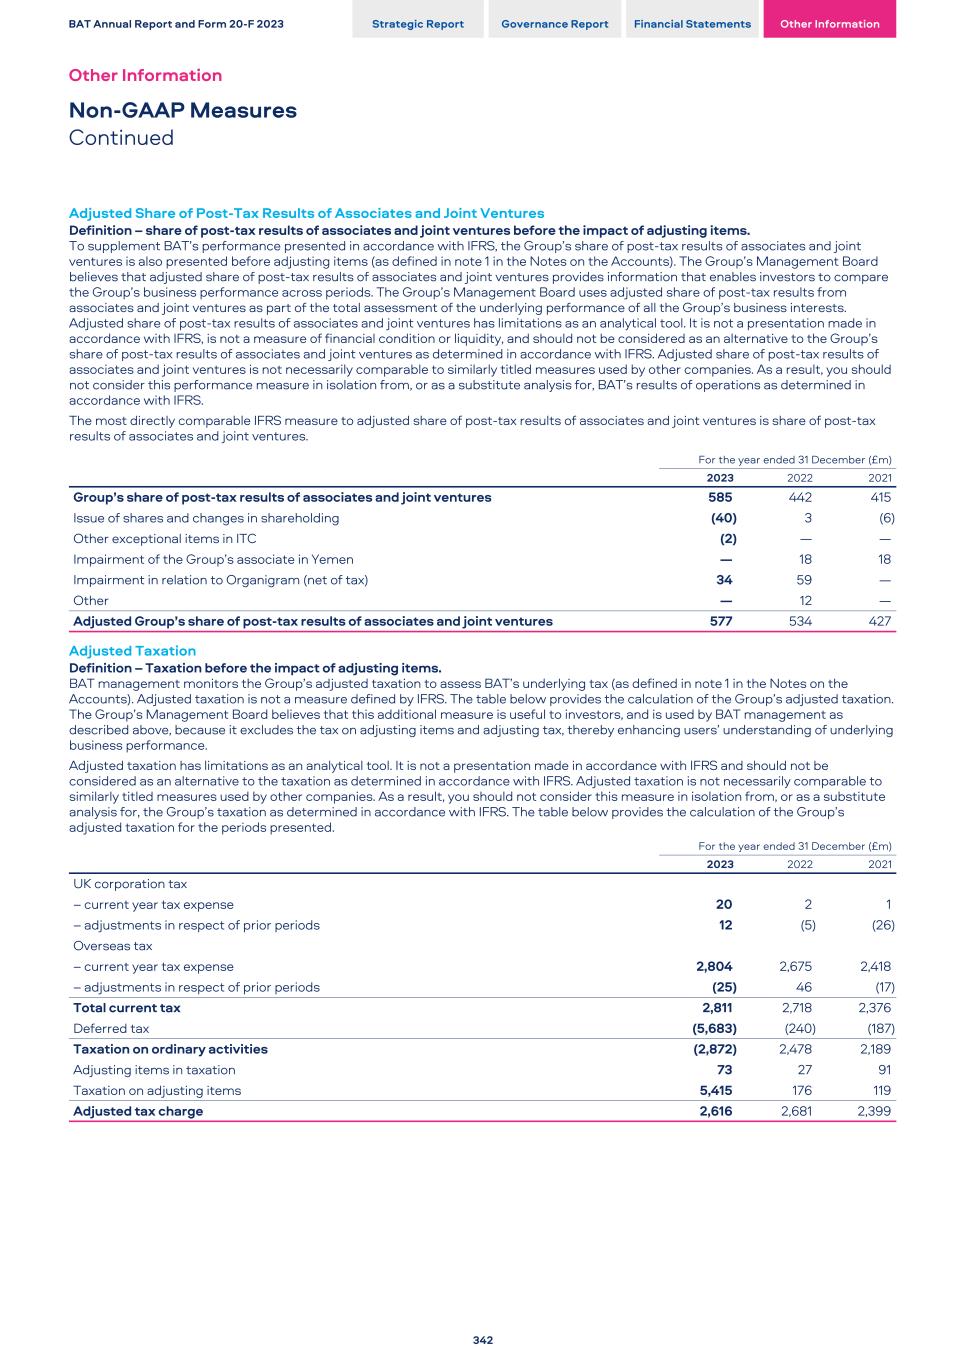
Adjusted Share of Post-Tax Results of Associates and Joint Ventures Definition – share of post-tax results of associates and joint ventures before the impact of adjusting items. To supplement BAT’s performance presented in accordance with IFRS, the Group’s share of post-tax results of associates and joint ventures is also presented before adjusting items (as defined in note 1 in the Notes on the Accounts). The Group’s Management Board believes that adjusted share of post-tax results of associates and joint ventures provides information that enables investors to compare the Group’s business performance across periods. The Group’s Management Board uses adjusted share of post-tax results from associates and joint ventures as part of the total assessment of the underlying performance of all the Group’s business interests. Adjusted share of post-tax results of associates and joint ventures has limitations as an analytical tool. It is not a presentation made in accordance with IFRS, is not a measure of financial condition or liquidity, and should not be considered as an alternative to the Group’s share of post-tax results of associates and joint ventures as determined in accordance with IFRS. Adjusted share of post-tax results of associates and joint ventures is not necessarily comparable to similarly titled measures used by other companies. As a result, you should not consider this performance measure in isolation from, or as a substitute analysis for, BAT’s results of operations as determined in accordance with IFRS. The most directly comparable IFRS measure to adjusted share of post-tax results of associates and joint ventures is share of post-tax results of associates and joint ventures. For the year ended 31 December (£m) 2023 2022 2021 Group’s share of post-tax results of associates and joint ventures 585 442 415 Issue of shares and changes in shareholding (40) 3 (6) Other exceptional items in ITC (2) — — Impairment of the Group’s associate in Yemen — 18 18 Impairment in relation to Organigram (net of tax) 34 59 — Other — 12 — Adjusted Group’s share of post-tax results of associates and joint ventures 577 534 427 Adjusted Taxation Definition – Taxation before the impact of adjusting items. BAT management monitors the Group’s adjusted taxation to assess BAT’s underlying tax (as defined in note 1 in the Notes on the Accounts). Adjusted taxation is not a measure defined by IFRS. The table below provides the calculation of the Group’s adjusted taxation. The Group’s Management Board believes that this additional measure is useful to investors, and is used by BAT management as described above, because it excludes the tax on adjusting items and adjusting tax, thereby enhancing users’ understanding of underlying business performance. Adjusted taxation has limitations as an analytical tool. It is not a presentation made in accordance with IFRS and should not be considered as an alternative to the taxation as determined in accordance with IFRS. Adjusted taxation is not necessarily comparable to similarly titled measures used by other companies. As a result, you should not consider this measure in isolation from, or as a substitute analysis for, the Group’s taxation as determined in accordance with IFRS. The table below provides the calculation of the Group’s adjusted taxation for the periods presented. For the year ended 31 December (£m) 2023 2022 2021 UK corporation tax – current year tax expense 20 2 1 – adjustments in respect of prior periods 12 (5) (26) Overseas tax – current year tax expense 2,804 2,675 2,418 – adjustments in respect of prior periods (25) 46 (17) Total current tax 2,811 2,718 2,376 Deferred tax (5,683) (240) (187) Taxation on ordinary activities (2,872) 2,478 2,189 Adjusting items in taxation 73 27 91 Taxation on adjusting items 5,415 176 119 Adjusted tax charge 2,616 2,681 2,399 BAT Annual Report and Form 20-F 2023 Strategic Report Governance Report Financial Statements Other Information Other Information Non-GAAP Measures Continued 342
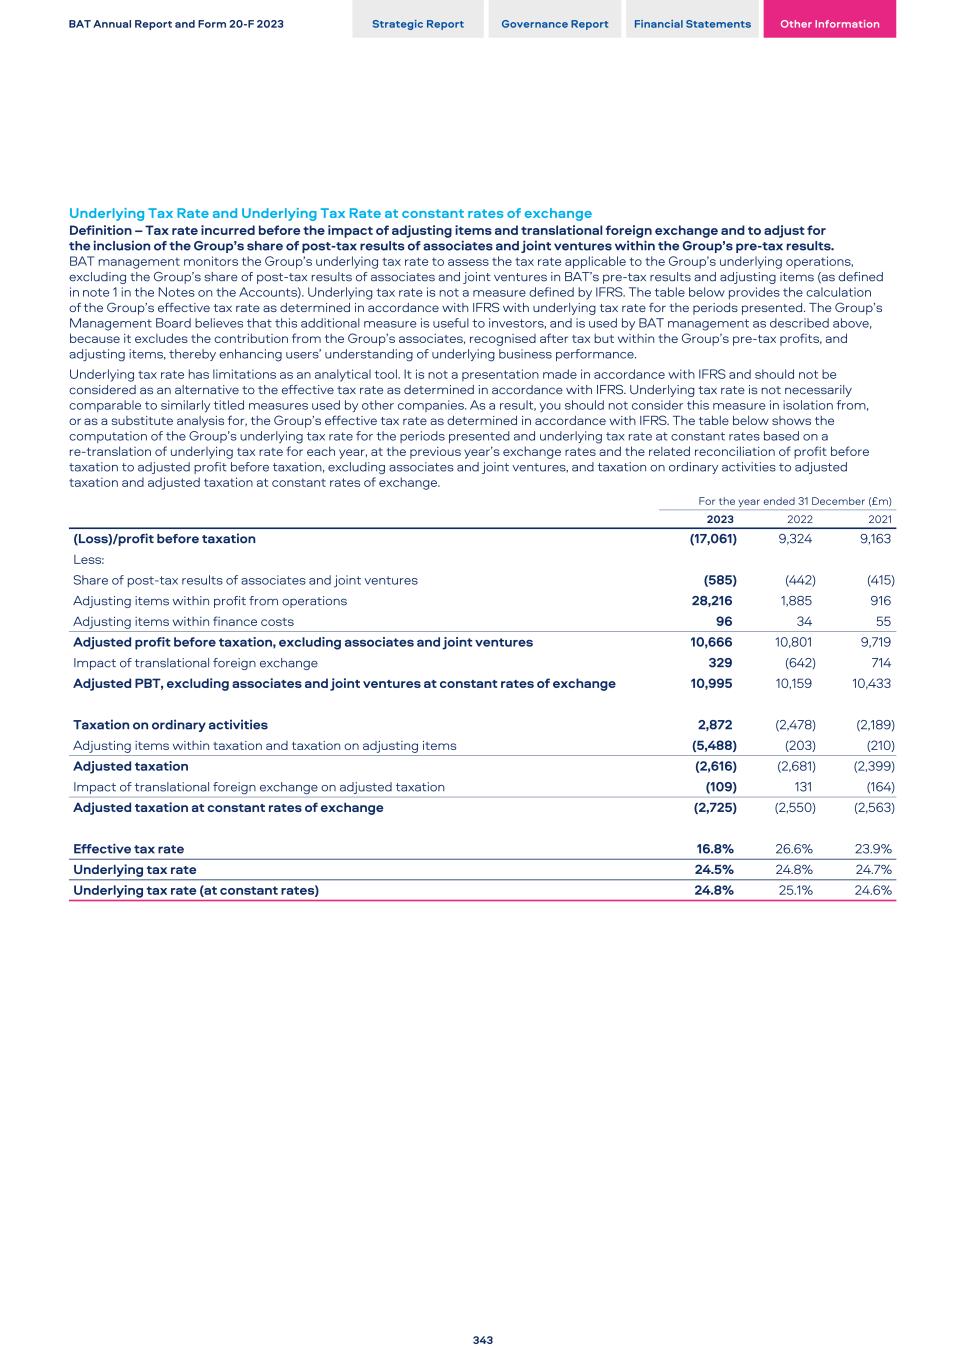
Underlying Tax Rate and Underlying Tax Rate at constant rates of exchange Definition – Tax rate incurred before the impact of adjusting items and translational foreign exchange and to adjust for the inclusion of the Group’s share of post-tax results of associates and joint ventures within the Group’s pre-tax results. BAT management monitors the Group’s underlying tax rate to assess the tax rate applicable to the Group’s underlying operations, excluding the Group’s share of post-tax results of associates and joint ventures in BAT’s pre-tax results and adjusting items (as defined in note 1 in the Notes on the Accounts). Underlying tax rate is not a measure defined by IFRS. The table below provides the calculation of the Group’s effective tax rate as determined in accordance with IFRS with underlying tax rate for the periods presented. The Group’s Management Board believes that this additional measure is useful to investors, and is used by BAT management as described above, because it excludes the contribution from the Group’s associates, recognised after tax but within the Group’s pre-tax profits, and adjusting items, thereby enhancing users’ understanding of underlying business performance. Underlying tax rate has limitations as an analytical tool. It is not a presentation made in accordance with IFRS and should not be considered as an alternative to the effective tax rate as determined in accordance with IFRS. Underlying tax rate is not necessarily comparable to similarly titled measures used by other companies. As a result, you should not consider this measure in isolation from, or as a substitute analysis for, the Group’s effective tax rate as determined in accordance with IFRS. The table below shows the computation of the Group’s underlying tax rate for the periods presented and underlying tax rate at constant rates based on a re-translation of underlying tax rate for each year, at the previous year’s exchange rates and the related reconciliation of profit before taxation to adjusted profit before taxation, excluding associates and joint ventures, and taxation on ordinary activities to adjusted taxation and adjusted taxation at constant rates of exchange. For the year ended 31 December (£m) 2023 2022 2021 (Loss)/profit before taxation (17,061) 9,324 9,163 Less: Share of post-tax results of associates and joint ventures (585) (442) (415) Adjusting items within profit from operations 28,216 1,885 916 Adjusting items within finance costs 96 34 55 Adjusted profit before taxation, excluding associates and joint ventures 10,666 10,801 9,719 Impact of translational foreign exchange 329 (642) 714 Adjusted PBT, excluding associates and joint ventures at constant rates of exchange 10,995 10,159 10,433 Taxation on ordinary activities 2,872 (2,478) (2,189) Adjusting items within taxation and taxation on adjusting items (5,488) (203) (210) Adjusted taxation (2,616) (2,681) (2,399) Impact of translational foreign exchange on adjusted taxation (109) 131 (164) Adjusted taxation at constant rates of exchange (2,725) (2,550) (2,563) Effective tax rate 16.8% 26.6% 23.9% Underlying tax rate 24.5% 24.8% 24.7% Underlying tax rate (at constant rates) 24.8% 25.1% 24.6% BAT Annual Report and Form 20-F 2023 Strategic Report Governance Report Financial Statements Other Information 343
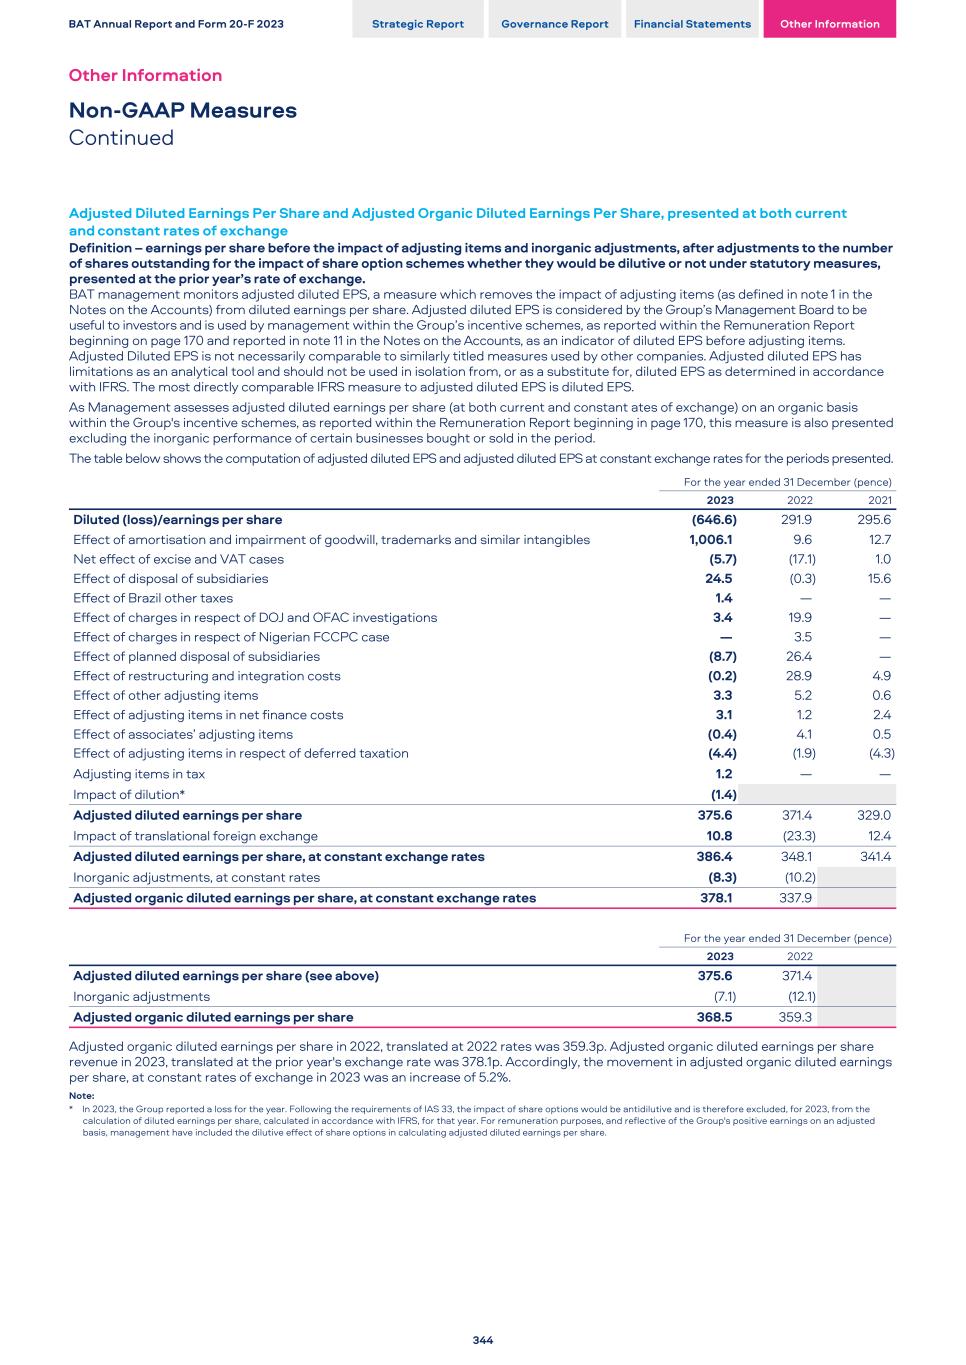
Adjusted Diluted Earnings Per Share and Adjusted Organic Diluted Earnings Per Share, presented at both current and constant rates of exchange Definition – earnings per share before the impact of adjusting items and inorganic adjustments, after adjustments to the number of shares outstanding for the impact of share option schemes whether they would be dilutive or not under statutory measures, presented at the prior year’s rate of exchange. BAT management monitors adjusted diluted EPS, a measure which removes the impact of adjusting items (as defined in note 1 in the Notes on the Accounts) from diluted earnings per share. Adjusted diluted EPS is considered by the Group’s Management Board to be useful to investors and is used by management within the Group’s incentive schemes, as reported within the Remuneration Report beginning on page 170 and reported in note 11 in the Notes on the Accounts, as an indicator of diluted EPS before adjusting items. Adjusted Diluted EPS is not necessarily comparable to similarly titled measures used by other companies. Adjusted diluted EPS has limitations as an analytical tool and should not be used in isolation from, or as a substitute for, diluted EPS as determined in accordance with IFRS. The most directly comparable IFRS measure to adjusted diluted EPS is diluted EPS. As Management assesses adjusted diluted earnings per share (at both current and constant ates of exchange) on an organic basis within the Group's incentive schemes, as reported within the Remuneration Report beginning in page 170, this measure is also presented excluding the inorganic performance of certain businesses bought or sold in the period. The table below shows the computation of adjusted diluted EPS and adjusted diluted EPS at constant exchange rates for the periods presented. For the year ended 31 December (pence) 2023 2022 2021 Diluted (loss)/earnings per share (646.6) 291.9 295.6 Effect of amortisation and impairment of goodwill, trademarks and similar intangibles 1,006.1 9.6 12.7 Net effect of excise and VAT cases (5.7) (17.1) 1.0 Effect of disposal of subsidiaries 24.5 (0.3) 15.6 Effect of Brazil other taxes 1.4 — — Effect of charges in respect of DOJ and OFAC investigations 3.4 19.9 — Effect of charges in respect of Nigerian FCCPC case — 3.5 — Effect of planned disposal of subsidiaries (8.7) 26.4 — Effect of restructuring and integration costs (0.2) 28.9 4.9 Effect of other adjusting items 3.3 5.2 0.6 Effect of adjusting items in net finance costs 3.1 1.2 2.4 Effect of associates’ adjusting items (0.4) 4.1 0.5 Effect of adjusting items in respect of deferred taxation (4.4) (1.9) (4.3) Adjusting items in tax 1.2 — — Impact of dilution* (1.4) Adjusted diluted earnings per share 375.6 371.4 329.0 Impact of translational foreign exchange 10.8 (23.3) 12.4 Adjusted diluted earnings per share, at constant exchange rates 386.4 348.1 341.4 Inorganic adjustments, at constant rates (8.3) (10.2) Adjusted organic diluted earnings per share, at constant exchange rates 378.1 337.9 For the year ended 31 December (pence) 2023 2022 Adjusted diluted earnings per share (see above) 375.6 371.4 Inorganic adjustments (7.1) (12.1) Adjusted organic diluted earnings per share 368.5 359.3 Adjusted organic diluted earnings per share in 2022, translated at 2022 rates was 359.3p. Adjusted organic diluted earnings per share revenue in 2023, translated at the prior year's exchange rate was 378.1p. Accordingly, the movement in adjusted organic diluted earnings per share, at constant rates of exchange in 2023 was an increase of 5.2%. Note: * In 2023, the Group reported a loss for the year. Following the requirements of IAS 33, the impact of share options would be antidilutive and is therefore excluded, for 2023, from the calculation of diluted earnings per share, calculated in accordance with IFRS, for that year. For remuneration purposes, and reflective of the Group's positive earnings on an adjusted basis, management have included the dilutive effect of share options in calculating adjusted diluted earnings per share. BAT Annual Report and Form 20-F 2023 Strategic Report Governance Report Financial Statements Other Information Other Information Non-GAAP Measures Continued 344
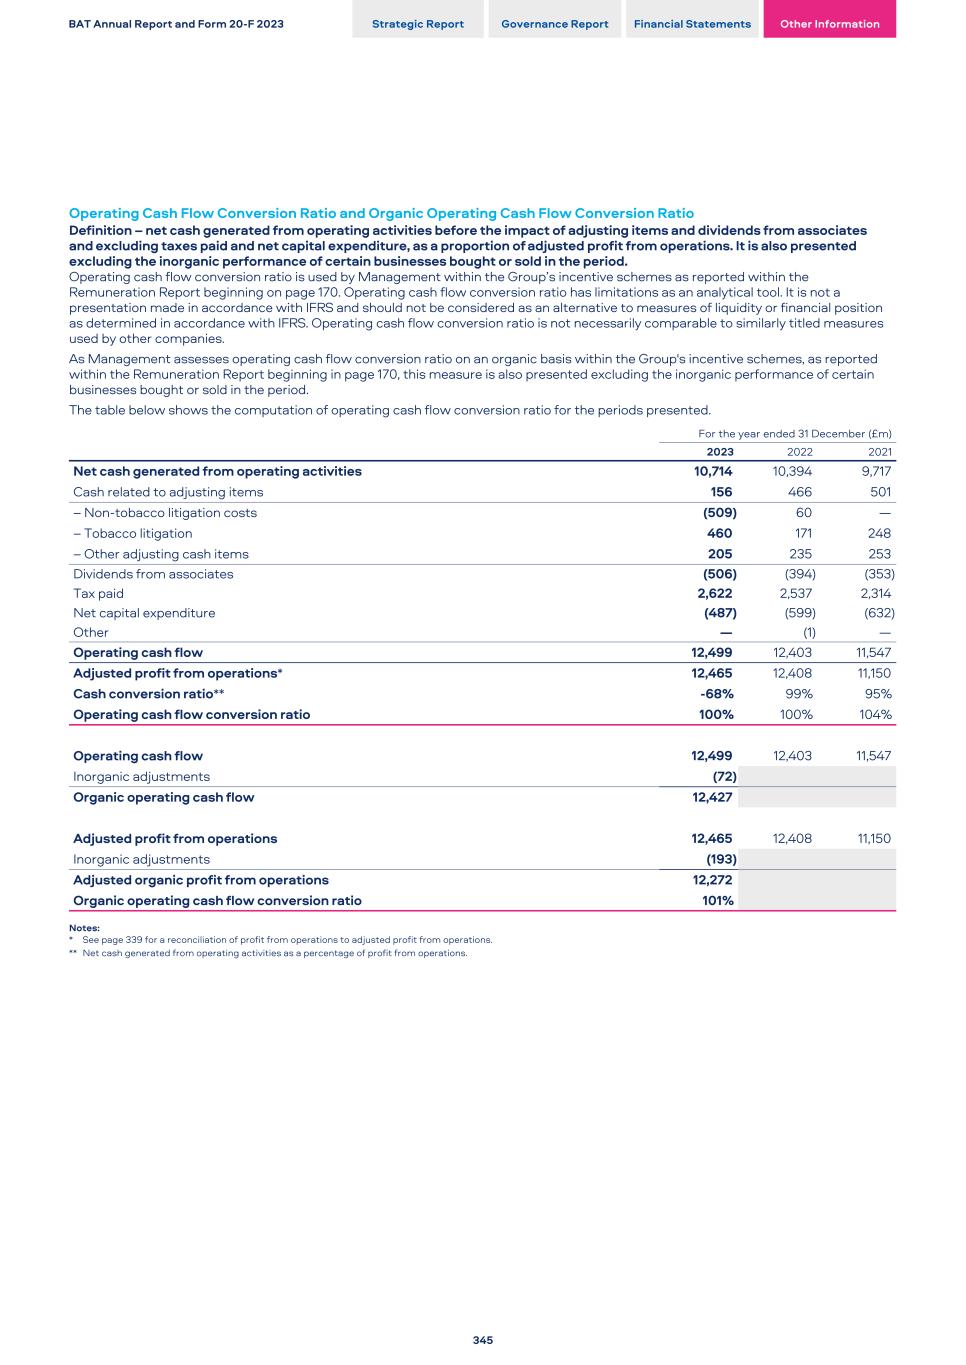
Operating Cash Flow Conversion Ratio and Organic Operating Cash Flow Conversion Ratio Definition – net cash generated from operating activities before the impact of adjusting items and dividends from associates and excluding taxes paid and net capital expenditure, as a proportion of adjusted profit from operations. It is also presented excluding the inorganic performance of certain businesses bought or sold in the period. Operating cash flow conversion ratio is used by Management within the Group’s incentive schemes as reported within the Remuneration Report beginning on page 170. Operating cash flow conversion ratio has limitations as an analytical tool. It is not a presentation made in accordance with IFRS and should not be considered as an alternative to measures of liquidity or financial position as determined in accordance with IFRS. Operating cash flow conversion ratio is not necessarily comparable to similarly titled measures used by other companies. As Management assesses operating cash flow conversion ratio on an organic basis within the Group's incentive schemes, as reported within the Remuneration Report beginning in page 170, this measure is also presented excluding the inorganic performance of certain businesses bought or sold in the period. The table below shows the computation of operating cash flow conversion ratio for the periods presented. For the year ended 31 December (£m) 2023 2022 2021 Net cash generated from operating activities 10,714 10,394 9,717 Cash related to adjusting items 156 466 501 – Non-tobacco litigation costs (509) 60 — – Tobacco litigation 460 171 248 – Other adjusting cash items 205 235 253 Dividends from associates (506) (394) (353) Tax paid 2,622 2,537 2,314 Net capital expenditure (487) (599) (632) Other — (1) — Operating cash flow 12,499 12,403 11,547 Adjusted profit from operations* 12,465 12,408 11,150 Cash conversion ratio** -68% 99% 95% Operating cash flow conversion ratio 100% 100% 104% Operating cash flow 12,499 12,403 11,547 Inorganic adjustments (72) Organic operating cash flow 12,427 Adjusted profit from operations 12,465 12,408 11,150 Inorganic adjustments (193) Adjusted organic profit from operations 12,272 Organic operating cash flow conversion ratio 101% Notes: * See page 339 for a reconciliation of profit from operations to adjusted profit from operations. ** Net cash generated from operating activities as a percentage of profit from operations. BAT Annual Report and Form 20-F 2023 Strategic Report Governance Report Financial Statements Other Information 345
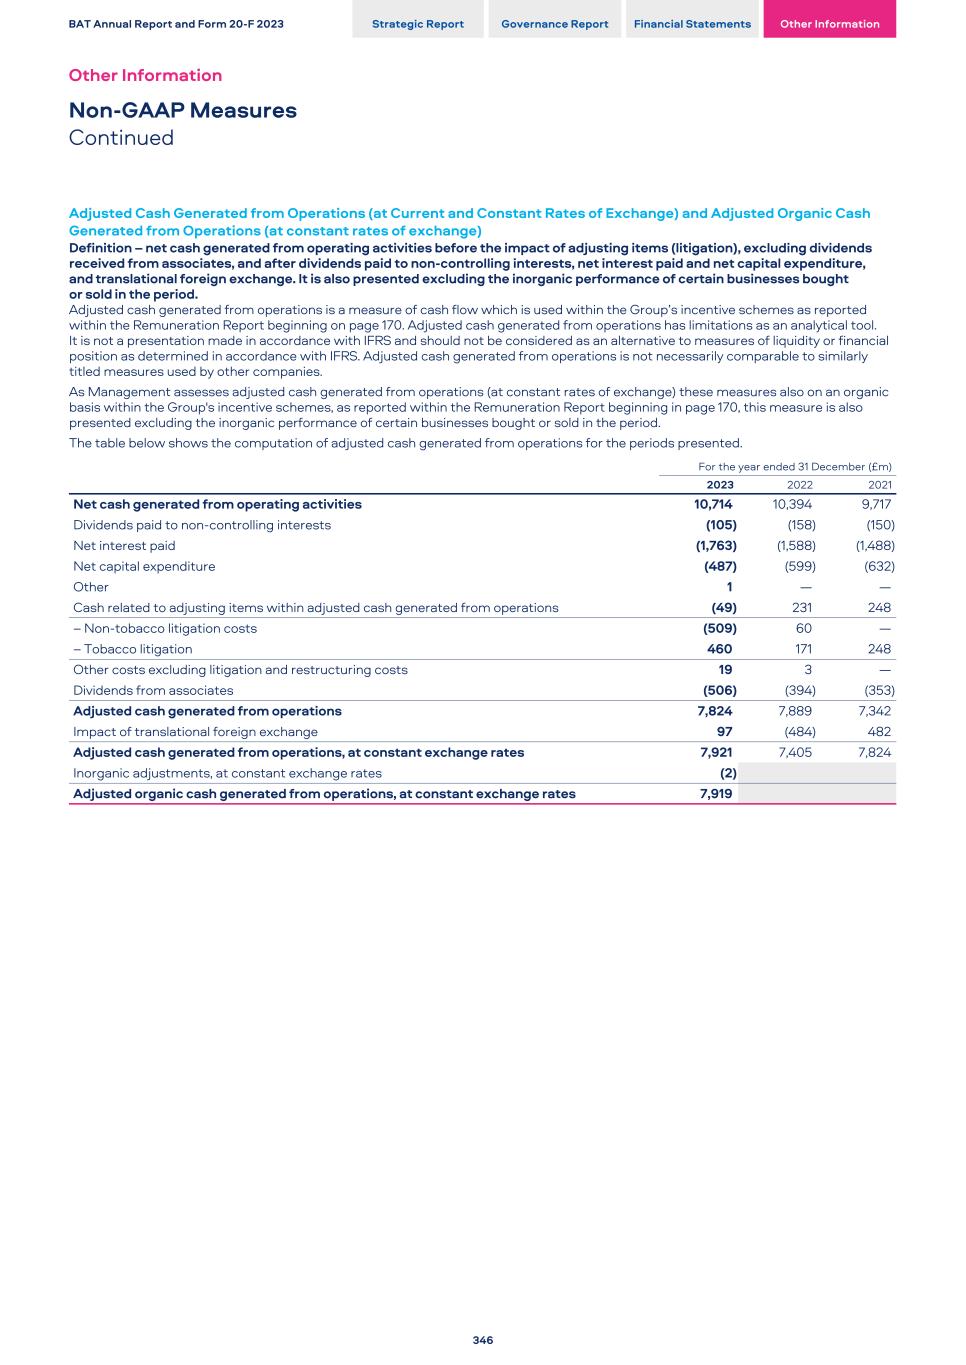
Adjusted Cash Generated from Operations (at Current and Constant Rates of Exchange) and Adjusted Organic Cash Generated from Operations (at constant rates of exchange) Definition – net cash generated from operating activities before the impact of adjusting items (litigation), excluding dividends received from associates, and after dividends paid to non-controlling interests, net interest paid and net capital expenditure, and translational foreign exchange. It is also presented excluding the inorganic performance of certain businesses bought or sold in the period. Adjusted cash generated from operations is a measure of cash flow which is used within the Group’s incentive schemes as reported within the Remuneration Report beginning on page 170. Adjusted cash generated from operations has limitations as an analytical tool. It is not a presentation made in accordance with IFRS and should not be considered as an alternative to measures of liquidity or financial position as determined in accordance with IFRS. Adjusted cash generated from operations is not necessarily comparable to similarly titled measures used by other companies. As Management assesses adjusted cash generated from operations (at constant rates of exchange) these measures also on an organic basis within the Group's incentive schemes, as reported within the Remuneration Report beginning in page 170, this measure is also presented excluding the inorganic performance of certain businesses bought or sold in the period. The table below shows the computation of adjusted cash generated from operations for the periods presented. For the year ended 31 December (£m) 2023 2022 2021 Net cash generated from operating activities 10,714 10,394 9,717 Dividends paid to non-controlling interests (105) (158) (150) Net interest paid (1,763) (1,588) (1,488) Net capital expenditure (487) (599) (632) Other 1 — — Cash related to adjusting items within adjusted cash generated from operations (49) 231 248 – Non-tobacco litigation costs (509) 60 — – Tobacco litigation 460 171 248 Other costs excluding litigation and restructuring costs 19 3 — Dividends from associates (506) (394) (353) Adjusted cash generated from operations 7,824 7,889 7,342 Impact of translational foreign exchange 97 (484) 482 Adjusted cash generated from operations, at constant exchange rates 7,921 7,405 7,824 Inorganic adjustments, at constant exchange rates (2) Adjusted organic cash generated from operations, at constant exchange rates 7,919 BAT Annual Report and Form 20-F 2023 Strategic Report Governance Report Financial Statements Other Information Other Information Non-GAAP Measures Continued 346

Net Debt Definition – total borrowings, including related derivatives, less cash and cash equivalents and current investments held at fair value. The Group uses net debt to assess its financial capacity. Net debt is not a measure defined by IFRS. The most directly comparable IFRS measure to net debt is total borrowings. The Group’s Management Board believes that this additional measure, which is used internally to assess the Group’s financial capacity, is useful to the users of the financial statements in helping them to see how business financing has changed over the year. Net debt has limitations as an analytical tool. It is not a presentation made in accordance with IFRS and should not be considered as an alternative to total borrowings or total liabilities determined in accordance with IFRS. Net debt is not necessarily comparable to similarly titled measures used by other companies. In addition, it does not exclude restricted cash (as set out in note 21 in the Notes on the Accounts) in the calculation. As a result, you should not consider this measure in isolation from, or as a substitute analysis for, the Group’s measures of financial position or liquidity as determined in accordance with IFRS. A reconciliation of borrowings to net debt is provided in note 23 in the Notes on the Accounts. BAT Annual Report and Form 20-F 2023 Strategic Report Governance Report Financial Statements Other Information 347

This page is intentionally left blank BAT Annual Report and Form 20-F 2023 Strategic Report Governance Report Financial Statements Other Information Other Information Non-GAAP Measures Continued 348
Results on a Constant Translational Currency Basis Movements in foreign exchange rates have impacted the Group’s financial results. The Group’s Management Board reviews certain of its results, including revenue, revenue growth from New Categories, adjusted profit from operations and adjusted diluted earnings per share, at constant rates of exchange. The Group calculates these financial measures at constant rates of exchange based on a re-translation, at prior year exchange rates, of the current year’s results of the Group and, where applicable, its geographic segments. The Group does not adjust for the normal transactional gains and losses in profit from operations that are generated by exchange movements. Although the Group does not believe that these measures are a substitute for IFRS measures, the Group’s Management Board does believe that such results excluding the impact of currency fluctuations year-on-year provide additional useful information to investors regarding the Group’s operating performance on a local currency basis. Accordingly, the constant rates of exchange financial measures appearing in the discussion of the Group results of operations (beginning on page 50) should be read in conjunction with the information provided in note 2 in the Notes on the Accounts. In 2023, 2022 and 2021, results were affected by translational exchange rate movements. In 2023, at the prevailing exchange rates, reported revenue declined by 1.3%, revenue from New Categories increased by 15.6% and adjusted profit from operations increased by 0.5% versus 2022. At constant rates of exchange, reported revenue would have increased by 1.6%, revenue from New Categories would have increased by 17.8% and adjusted profit from operations would have increased by 3.1%. This lower growth rate at prevailing exchange rates reflects the negative translational impact as a result of the relative strength of the pound sterling. In 2022, at the prevailing exchange rates, revenue increased by 7.7%, revenue from New Categories increased by 40.9% and adjusted profit from operations decreased by 11.3% versus 2021. At constant rates of exchange, revenue would have increased by 2.3%, revenue from New Categories would have increased by 37.0% and adjusted profit from operations would have increased by 4.3%. This higher growth rate at prevailing exchange rates reflects the positive translational impact as a result of the relative weakening of the pound sterling. In 2023, 2022 and 2021, adjusted diluted earnings per share was affected by translational exchange rate movements. In 2023, the adjusted diluted earnings per share of 375.6p, an increase of 1.1%, would, when translated at 2022 exchange rates, have been 386.4p, an increase of 4.0%. This lower growth rate, in 2023, at prevailing exchange rates, reflects the negative translational impact as a result of the relative strength of the pound sterling. In 2022, the adjusted diluted earnings per share of 371.4p, an increase of 12.9%, would, when translated at 2021 exchange rates, have been 348.1p, an increase of 5.8%. This higher growth rate, in 2022, at prevailing exchange rates, reflects the positive translational impact as a result of the relative weakness of the pound sterling. BAT Annual Report and Form 20-F 2023 Strategic Report Governance Report Financial Statements Other Information 349
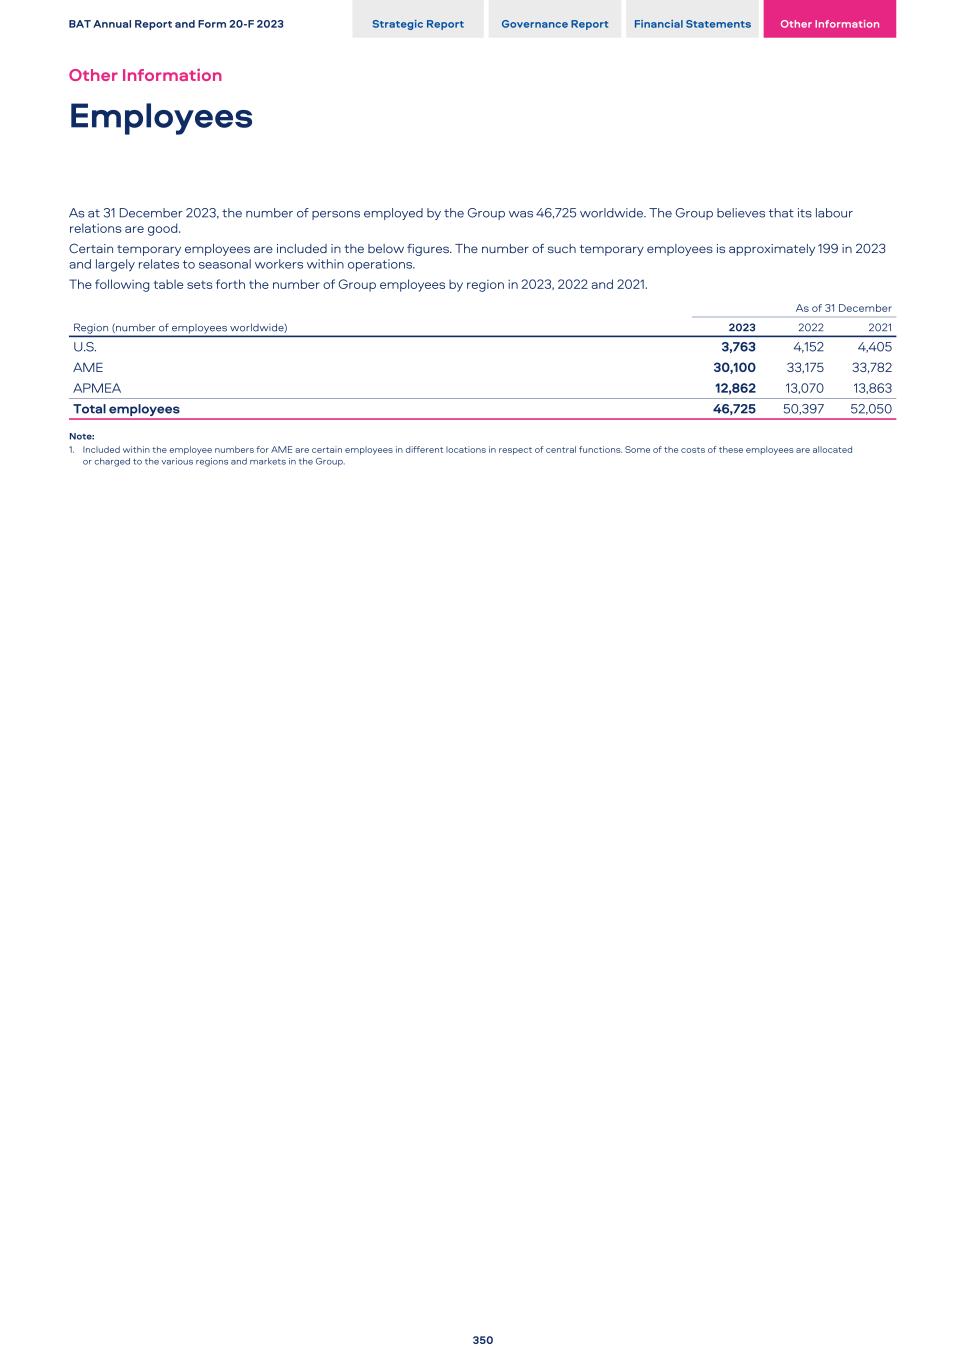
As at 31 December 2023, the number of persons employed by the Group was 46,725 worldwide. The Group believes that its labour relations are good. Certain temporary employees are included in the below figures. The number of such temporary employees is approximately 199 in 2023 and largely relates to seasonal workers within operations. The following table sets forth the number of Group employees by region in 2023, 2022 and 2021. Region (number of employees worldwide) As of 31 December 2023 2022 2021 U.S. 3,763 4,152 4,405 AME 30,100 33,175 33,782 APMEA 12,862 13,070 13,863 Total employees 46,725 50,397 52,050 Note: 1. Included within the employee numbers for AME are certain employees in different locations in respect of central functions. Some of the costs of these employees are allocated or charged to the various regions and markets in the Group. BAT Annual Report and Form 20-F 2023 Strategic Report Governance Report Financial Statements Other Information Other Information Employees 350
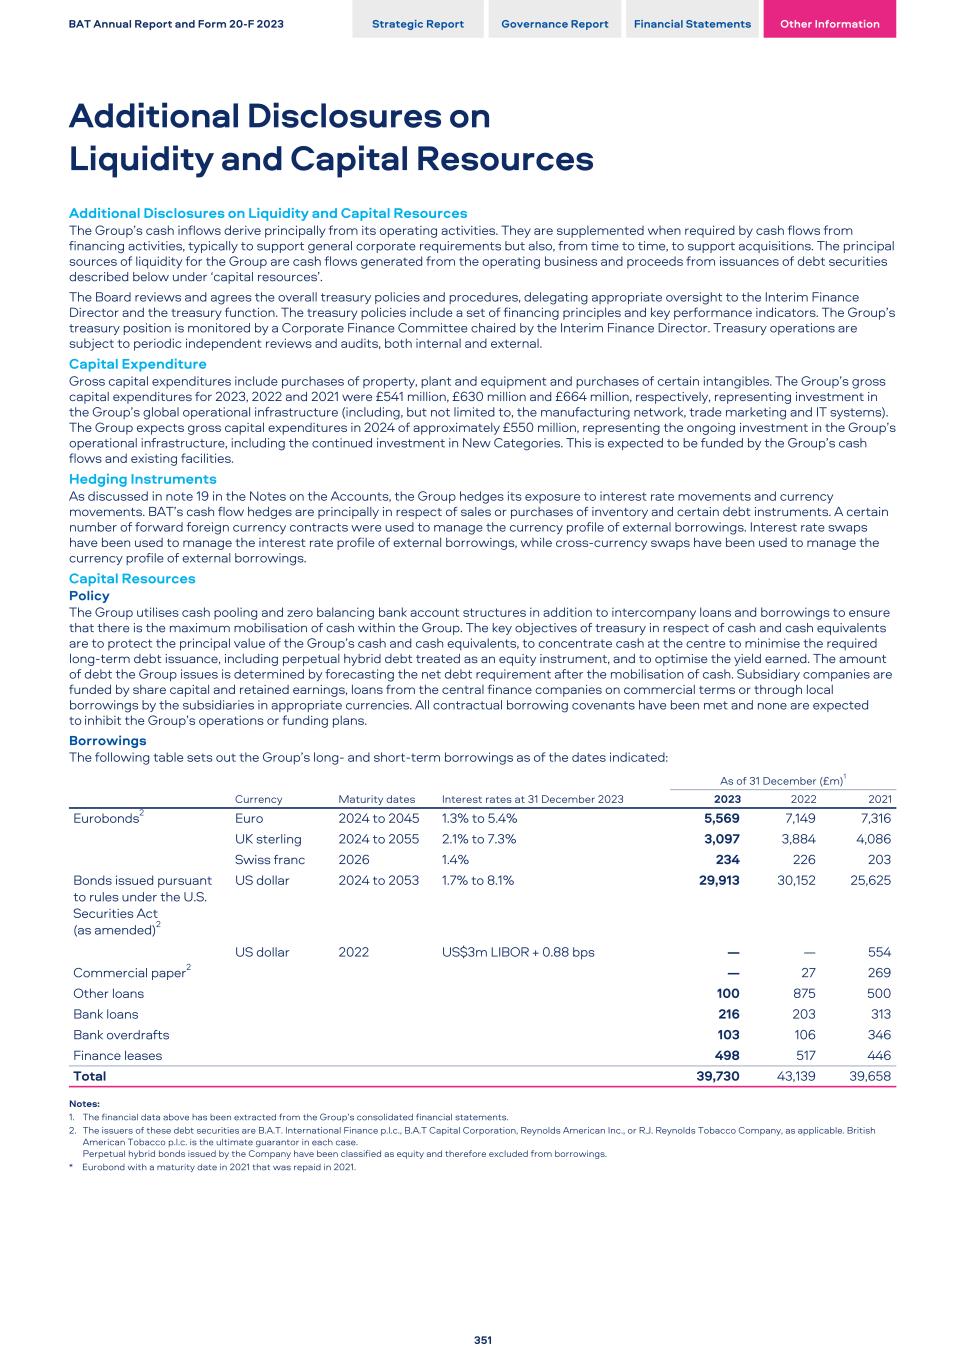
Additional Disclosures on Liquidity and Capital Resources The Group’s cash inflows derive principally from its operating activities. They are supplemented when required by cash flows from financing activities, typically to support general corporate requirements but also, from time to time, to support acquisitions. The principal sources of liquidity for the Group are cash flows generated from the operating business and proceeds from issuances of debt securities described below under ‘capital resources’. The Board reviews and agrees the overall treasury policies and procedures, delegating appropriate oversight to the Interim Finance Director and the treasury function. The treasury policies include a set of financing principles and key performance indicators. The Group’s treasury position is monitored by a Corporate Finance Committee chaired by the Interim Finance Director. Treasury operations are subject to periodic independent reviews and audits, both internal and external. Capital Expenditure Gross capital expenditures include purchases of property, plant and equipment and purchases of certain intangibles. The Group’s gross capital expenditures for 2023, 2022 and 2021 were £541 million, £630 million and £664 million, respectively, representing investment in the Group’s global operational infrastructure (including, but not limited to, the manufacturing network, trade marketing and IT systems). The Group expects gross capital expenditures in 2024 of approximately £550 million, representing the ongoing investment in the Group’s operational infrastructure, including the continued investment in New Categories. This is expected to be funded by the Group’s cash flows and existing facilities. Hedging Instruments As discussed in note 19 in the Notes on the Accounts, the Group hedges its exposure to interest rate movements and currency movements. BAT’s cash flow hedges are principally in respect of sales or purchases of inventory and certain debt instruments. A certain number of forward foreign currency contracts were used to manage the currency profile of external borrowings. Interest rate swaps have been used to manage the interest rate profile of external borrowings, while cross-currency swaps have been used to manage the currency profile of external borrowings. Capital Resources Policy The Group utilises cash pooling and zero balancing bank account structures in addition to intercompany loans and borrowings to ensure that there is the maximum mobilisation of cash within the Group. The key objectives of treasury in respect of cash and cash equivalents are to protect the principal value of the Group’s cash and cash equivalents, to concentrate cash at the centre to minimise the required long-term debt issuance, including perpetual hybrid debt treated as an equity instrument, and to optimise the yield earned. The amount of debt the Group issues is determined by forecasting the net debt requirement after the mobilisation of cash. Subsidiary companies are funded by share capital and retained earnings, loans from the central finance companies on commercial terms or through local borrowings by the subsidiaries in appropriate currencies. All contractual borrowing covenants have been met and none are expected to inhibit the Group’s operations or funding plans. Borrowings The following table sets out the Group’s long- and short-term borrowings as of the dates indicated: As of 31 December (£m)1 Currency Maturity dates Interest rates at 31 December 2023 2023 2022 2021 Eurobonds2 Euro 2024 to 2045 1.3% to 5.4% 5,569 7,149 7,316 UK sterling 2024 to 2055 2.1% to 7.3% 3,097 3,884 4,086 Swiss franc 2026 1.4% 234 226 203 Bonds issued pursuant to rules under the U.S. Securities Act (as amended)2 US dollar 2024 to 2053 1.7% to 8.1% 29,913 30,152 25,625 US dollar 2022 US$3m LIBOR + 0.88 bps — — 554 Commercial paper2 — 27 269 Other loans 100 875 500 Bank loans 216 203 313 Bank overdrafts 103 106 346 Finance leases 498 517 446 Total 39,730 43,139 39,658 Notes: 1. The financial data above has been extracted from the Group’s consolidated financial statements. 2. The issuers of these debt securities are B.A.T. International Finance p.l.c., B.A.T Capital Corporation, Reynolds American Inc., or R.J. Reynolds Tobacco Company, as applicable. British American Tobacco p.l.c. is the ultimate guarantor in each case. Perpetual hybrid bonds issued by the Company have been classified as equity and therefore excluded from borrowings. * Eurobond with a maturity date in 2021 that was repaid in 2021. BAT Annual Report and Form 20-F 2023 Strategic Report Governance Report Financial Statements Other Information Additional Disclosures on Liquidity and Capital Resources 351
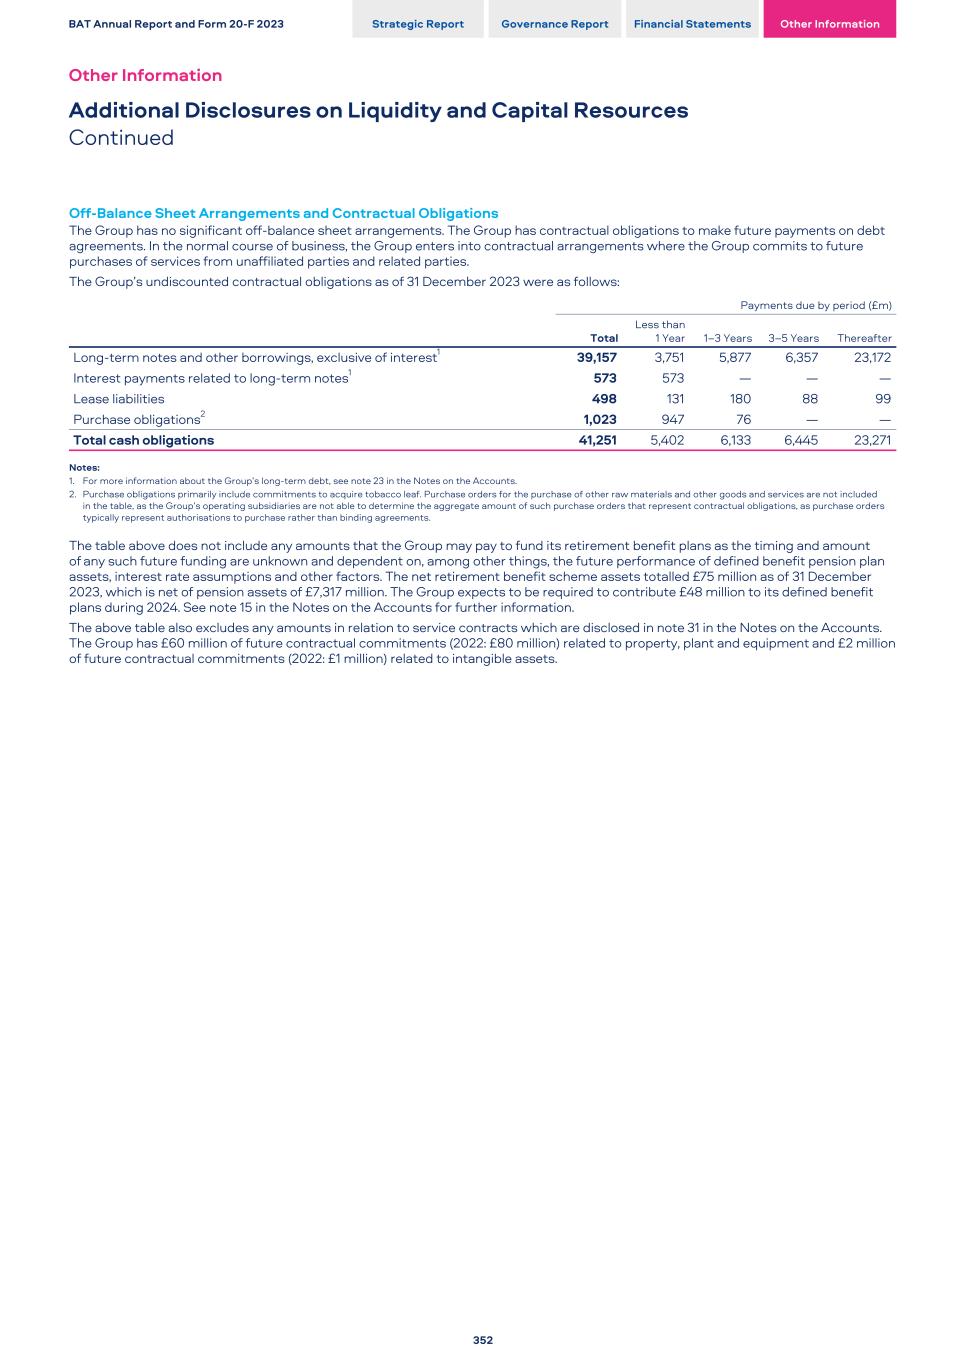
Off-Balance Sheet Arrangements and Contractual Obligations The Group has no significant off-balance sheet arrangements. The Group has contractual obligations to make future payments on debt agreements. In the normal course of business, the Group enters into contractual arrangements where the Group commits to future purchases of services from unaffiliated parties and related parties. The Group’s undiscounted contractual obligations as of 31 December 2023 were as follows: Payments due by period (£m) Total Less than 1 Year 1–3 Years 3–5 Years Thereafter Long-term notes and other borrowings, exclusive of interest1 39,157 3,751 5,877 6,357 23,172 Interest payments related to long-term notes1 573 573 — — — Lease liabilities 498 131 180 88 99 Purchase obligations2 1,023 947 76 — — Total cash obligations 41,251 5,402 6,133 6,445 23,271 Notes: 1. For more information about the Group’s long-term debt, see note 23 in the Notes on the Accounts. 2. Purchase obligations primarily include commitments to acquire tobacco leaf. Purchase orders for the purchase of other raw materials and other goods and services are not included in the table, as the Group’s operating subsidiaries are not able to determine the aggregate amount of such purchase orders that represent contractual obligations, as purchase orders typically represent authorisations to purchase rather than binding agreements. The table above does not include any amounts that the Group may pay to fund its retirement benefit plans as the timing and amount of any such future funding are unknown and dependent on, among other things, the future performance of defined benefit pension plan assets, interest rate assumptions and other factors. The net retirement benefit scheme assets totalled £75 million as of 31 December 2023, which is net of pension assets of £7,317 million. The Group expects to be required to contribute £48 million to its defined benefit plans during 2024. See note 15 in the Notes on the Accounts for further information. The above table also excludes any amounts in relation to service contracts which are disclosed in note 31 in the Notes on the Accounts. The Group has £60 million of future contractual commitments (2022: £80 million) related to property, plant and equipment and £2 million of future contractual commitments (2022: £1 million) related to intangible assets. BAT Annual Report and Form 20-F 2023 Strategic Report Governance Report Financial Statements Other Information Other Information Additional Disclosures on Liquidity and Capital Resources Continued 352
The following is a summary of some of the risks and uncertainties, the occurrence of any one of which, alone or in combination with other events or circumstances, may materially adversely affect the Group’s results of operations and financial condition. You should read this summary together with the ‘Group Principal Risks’ section from pages 121 to 128 and the more detailed description of each risk factor contained below. One of the principal risks "Inability to develop, commercialise and deliver the New Categories strategy" is an amalgamation of various risk factors across all four Group Risk Factor categories of Business execution and supply chain, Legal, regulatory and compliance, Economic and financial and Product pipeline, commercialisation and intellectual property. Business execution and supply chain risks – Competition from illicit trade. – Geopolitical tensions that have the potential to disrupt the Group’s business in multiple markets. – Injury, illness or death in the workplace. – Disruption to the Group’s data and information technology systems, including by cyber attack or the malicious manipulation or disclosure of confidential or sensitive information. – Failure to meet current or future New Categories demand. – Failure of a financial counterparty. – Exposure to unavailability of, and price volatility, in raw materials and increased costs of employment. – Failure to retain key personnel or to attract and retain skilled talent. – Disruption to the supply chain and distribution channels. – Failure to uphold the high standard of sustainability management, performance and reporting. – Failure to successfully design, implement and sustain an integrated framework and operating model for Artificial Intelligence (AI). – Inability to obtain adequate supplies of tobacco leaf. – Exposure to product contamination. – Failure to successfully design, implement and sustain an integrated technical landscape and ERP strategy. – Failure to manage the Group’s climate change and circular economy risks. – Impact of a pandemic on the performance of the Group. Legal, regulatory and compliance risks – Exposure to, the enactment of, proposals for, or expectations of regulation that significantly impairs the Group’s ability to communicate, differentiate, market or launch its products and/or the lack of appropriate regulation for New Categories. – Adverse implications of EU legislation on single-use plastics that will result in on-pack environmental warnings and financial implications relating to Extended Producer Responsibility (EPR). – Exposure to litigation, regulatory action or criminal investigations on tobacco, nicotine, New Categories and other issues. – Significant and/or unexpected increases or structural changes in tobacco and nicotine-related taxes. – Failure to comply with health and safety and environmental laws. – Exposure to unfavourable tax rulings. – Unexpected legislative changes to corporate income tax laws. – Exposure to potential liability under competition or antitrust laws. – Failure to establish and maintain adequate controls and procedures to comply with applicable securities, corporate governance and compliance regulations. – Lack of external recognition and acceptance of the foundational science and inability to effectively communicate to stakeholders about the potential health impact of our New Category products. – Insufficient product stewardship and failure to comply with product regulations. – Failure to uphold high standards of corporate behaviour, including through unintended or malicious breach of anti-bribery and anti- corruption and other anti-financial crime laws. – Imposition of sanctions under sanctions regimes or similar international, regional or national measures. – Failure to uphold New Categories marketing practices. – Loss or misuse of personal data through a failure to comply with the European General Data Protection Regulation, the UK Data Protection Act 2018, e-Privacy laws and other privacy legislation governing the processing of personal data. Economic and financial risks – Foreign exchange rate exposures. – Inability to obtain price increases and exposure to risks from excessive price increases and value chain erosion. – Effects of declining consumption of legitimate tobacco products and a tough competitive environment. – Funding, liquidity and interest rate risks. – Failure to achieve growth through mergers, acquisitions, joint ventures, investments and other transactions. – Unforeseen underperformance in key global markets. – Increases in net liabilities under the Group’s retirement benefit schemes. Product pipeline, commercialisation and Intellectual Property risks – Inability to predict consumers’ changing behaviours and launch innovative products that offer adult tobacco and nicotine consumers meaningful value-added differentiation. – Exposure to risks associated with intellectual property rights, including the failure to identify, protect and prevent infringement of the Group’s intellectual property rights and potential infringement of, or the failure to retain licences to use, third-party intellectual property rights. BAT Annual Report and Form 20-F 2023 Strategic Report Governance Report Financial Statements Other Information Summary of Group Risk Factors 353
Business Execution and Supply Chain Risks Risk: Competition from illicit trade Description Illicit trade in the form of counterfeit products, diversion of genuine Group products, and locally manufactured products, which do not comply with applicable regulations and/or in which applicable taxes are evaded, represent a significant and growing threat to the legitimate tobacco industry, including New Categories products. Factors such as increasing levels of taxation and inflation, economic downturn and increased cost of living, lack of law enforcement, appropriate penalties and weak border control are encouraging more adult tobacco and New Categories consumers to switch to illegal cheaper tobacco and New Categories products and are providing greater rewards for counterfeiters and smugglers. Regulatory restrictions such as plain packaging or graphic health warnings, display bans, flavour or ingredient restrictions and increased compliance costs further disadvantage legitimate industry participants by providing competitive advantages to illicit manufacturers and distributors of illicit tobacco and New Categories products. Impact Illicit trade has an overall negative impact on society, deprives governments of revenues and encourages various forms of crime such as terrorism and human trafficking. Above all, illicit trade has an adverse effect on the Group’s overall business and reputation. Illicit trade can damage brand equity, which could undermine the Group’s investment in Trade Marketing and Distribution, increase operational costs where products may become commoditised, make it more difficult to adhere to underage prevention and decrease volumes sold. Although our AIT policy is an integral part of our SoBC, representing our internal commitment in the fight against illicit trade and sets out the controls all Group companies must have in place and adhere to, it cannot prevent all instances of illicit trade. Furthermore, counterfeit products (especially New Categories) and other illicit products could harm consumers, damages goodwill and/or the category (with lower volumes and reduced profits), and could potentially lead to misplaced claims against BAT, further regulation and a failure to deliver our corporate harm reduction objective. Finally, as the Group has contractual and legislative obligations to prevent the diversion of our products into illicit channels, actual and perceived breaches of the obligations to prevent product diversion into illicit channels can lead to substantial fines in the forms of seizure payments and legislative penalties (including financial penalties), as well as the risk of reputational damage (including negative perceptions of our governance and our ESG credentials) from Group products being found in illicit channels. Risk: Geopolitical tensions that have the potential to disrupt the Group’s business in multiple markets Description The Group’s operations and financial condition are influenced by the economic and political situations in the markets and regions in which it has operations, which are often unpredictable and outside of its control. Some markets in which the Group operates face the threat of civil unrest and can be subject to frequent changes in regime. In others, there is a risk of terrorism, conflict, global health crisis, war, organised crime or other criminal activity. The Group is also exposed to economic policy changes in jurisdictions in which it operates. In addition, some markets maintain trade barriers or adopt policies that favour domestic producers, preventing or restricting the Group’s sales. Impact Deterioration of socio-economic or political conditions could lead to injury or loss of life, restricted mobility, loss of assets and/or denial of access to BAT sites that reduce the Group’s access to particular markets or may disrupt the Group’s operations, such as supply chain, or manufacturing or distribution capabilities. Such disruptions, including recent attacks on shipping routes in the Red Sea, may result in increased taxes and/or other costs due to the requirement for more complex supply chain and security arrangements, the need to build new facilities or to maintain inefficient facilities, or in a reduction of the Group’s sales volume. Further, there may be reputational damage, including negative perceptions of our governance and protection of our people and our ESG credentials. Risk: Injury, illness or death in the workplace Description The Group considers the safety of its employees and other individuals working with it as of utmost importance and fundamental concern. Loss of life, serious injury, disability or illness to employees or individuals due to accident, geopolitical tension or other events may occur during the research, manufacturing, distribution or retail of the Group’s products. Impact Past events have, and future events may led to serious injuries, ill health, disability or loss of life to employees and individuals who work with the Group. This may result in reputational damage, difficulties in recruiting and retaining staff, exposure to civil and criminal liability, prosecution and fines and penalties. These impacts could have an adverse effect on the Group’s results of operations and financial condition and have a negative impact on its ESG credentials. BAT Annual Report and Form 20-F 2023 Strategic Report Governance Report Financial Statements Other Information Other Information Group Risk Factors 354
Risk: Disruption to the Group’s data and information technology systems, including by cyber attack or the malicious manipulation or disclosure of confidential or sensitive information Description The Group relies on information and digital technology (IDT) systems and networks to conduct core activities, such as manufacturing, distribution, marketing, customer service, R&D and financial and management reporting, amongst other core activities. There is a risk that these systems may be disrupted by intentional or unintentional actions that may compromise the integrity of information, result in the inappropriate disclosure of confidential information, disrupt the operations of the Group, or may lead to false or misleading statements being made about the Group. Impact The Management recognises that cyber security threats could pose significant risks to the Group’s business, reputation, financial condition, and competitive position, and to the safety and privacy of our consumers, employees and other stakeholders. Any disruption to technology systems related to the Group’s operations could adversely affect its business and result in financial, legal and reputational impacts. Any delays or failure to detect or respond to attempts to gain unauthorised access to the Group’s information technology systems can lead to a loss in confidentiality, integrity or availability of systems and/or data. A security incident may result in: – Loss or theft of confidential business information, when used alone or in conjunction with any other available information that reduces the impact of BAT business strategy, investments and commercial operations. – Personal data breach incidents that result in the disclosure of personally identifiable data resulting in legal, reputational, and regulatory compliance impacts. – Disruption to BAT’s business operations that impacts R&D facilities, manufacturing, distribution or technology services resulting in business interruption and/or impacts to health and safety. – Inappropriate use of technology systems to enable fraud, or theft of product, technology, or monetary resources. – Loss of digital trust resulting in brand damage and a loss of consumer trust. – A cyber incident experienced by a third party partner or supplier resulting in business interruption, supply chain disruption, loss of company data or provides access or transmission of malicious activity from the supplier to BAT. Risk: Failure to meet current or future New Categories demand Description The New Categories supply chain is a multi-tiered and complex environment with reliance on multiple factors, such as third-party suppliers’ ability to upscale production in order to meet demand while maintaining product quality, dependency on single suppliers at various points in the chain and the Group’s ability to build adequate consumables production capacity in line with product demand. The geographical spread of suppliers and customers exposes the Group to political and economic issues such as Brexit and trade wars which may compromise the New Categories supply chain. Given the developing nature of the New Categories portfolio, there is also an enhanced risk that some products may not meet product quality and safety standards or may be subject to regulatory changes, leading to product recalls, which we have experienced in the past, or bans of certain ingredients or products. In addition, the New Categories supply chain may be vulnerable to changes in local legislation related to liquid nicotine that could increase import duties. Furthermore, the New Categories supply chain includes the development of sensitive trade secrets jointly with external design partners, which carries the risk of exposure of innovations to competitors. Impact Vulnerabilities in the New Categories supply chain may impact the Group’s ability to maintain supply and meet the current and future demand requirements across the New Categories portfolio, potentially resulting in significant reputational harm and financial impact that may negatively affect the Group’s results of operations and financial condition and cause the Group to fail to deliver on its strategic growth plans. Over-forecasting may also lead to write-offs and negatively impact working capital. The design of New Categories devices may also prevent the scaling of commercial manufacturing, which will either restrict supply or increase the costs of production. Further, there may be loss of investors’ confidence in ESG performance, including failure to deliver our corporate purpose of harm reduction. In addition, changes in local legislation related to liquid nicotine import duties may increase New Categories production costs, which may increase end market pricing and reduce demand. Furthermore, the exposure of sensitive trade secrets can lead to competitive disadvantages and further negatively impact the Group’s results of operations and financial condition and cause the Group to fail to deliver on its strategic growth plans. BAT Annual Report and Form 20-F 2023 Strategic Report Governance Report Financial Statements Other Information 355
Business Execution and Supply Chain Risks continued Risk: Failure of a financial counterparty Description The Group relies on transactions with a variety of financial counterparties to manage the Group’s business and financial risks. In the event that any of these counterparties fails, payments due from such counterparties, such as under hedging or insurance contracts, may not be recovered. In addition, failure of a transactional banking party may lead to the loss of cash balances and disruption to payment systems involving such counterparty. Impact The inability to recover payments due from one or more failed financial counterparties or the loss of cash balances may cause significant financial loss and have an adverse impact on the Group’s results of operations, financial condition and financial risk profile. In addition, the loss of cash balances or a disruption to payment systems may cause disruption to the Group’s ongoing operations and ability to pay its creditors and suppliers. Risk: Exposure to unavailability of, and price volatility in, raw materials and increased costs of employment Description The availability and price of various commodities required in the manufacture of the Group’s products fluctuate. Raw materials and other inputs used in the Group’s business, such as wood pulp and energy, are commodities that are subject to price volatility caused by numerous factors, including inflation, political influence, market fluctuations and natural disasters. Similarly, the Group is exposed to the risk of an increase above inflation in employment costs, including due to governmental action to introduce or increase minimum wages. Employment and health care law changes and the increase in inflation may also increase the cost of provided health care and other employment benefits expenses. Impact Restricted availability and price volatility of commodities may result in supply shortages and unexpected increases in costs for raw materials and packaging for the Group’s products, which may affect the Group’s results of operations and financial condition. The Group experienced some of these effects during 2023, including higher cost of direct materials due to energy scarcity, increase in transportation rates and commodity prices, as well as increases in utility costs resulting from the conflict in Ukraine, all of which have led to increases in overall cost. While inflation also caused an increase in employment costs, this did not have a material adverse effect to the Group's profitability. However, we cannot assure that this will not be materially affecting the Group's profitability in the future. The Group has not always been able to, and in the future may not be able to, increase prices to offset increased costs without suffering reduced sales volume and revenue. In the absence of compensating for increased costs through pricing, significant increases in raw material, packaging and employment costs above inflation will impact product margins, leading to lower profits and negatively affecting the Group’s results of operations and financial condition and cause the Group to fail to deliver on its strategic growth plans. Risk: Failure to retain key personnel or to attract and retain skilled talent Description The Group relies on a number of highly experienced employees with detailed knowledge of the tobacco and nicotine industry, other areas of focus for the Group (including New Categories and Beyond Nicotine) and the Group’s business. Similarly, the Group is dependent on its ability to identify, attract, develop and retain such qualified personnel in the future. The Group is also dependent on external hires to ensure we are equipped with the right new business-critical capabilities and knowledge to accelerate transformation. BAT anticipates that this trend will continue and therefore the ability to continue to build awareness, increase reach and ultimately attract the new target audience remains a primary focus. The shift in employees' preferences and societal expectations post COVID-19 are leading to shorter tenures. Furthermore, broader economic and ESG trends may impact the Group’s ability to retain key employees and may increase competition for highly talented employees. Whilst the Group is enhancing its effort on retaining critical capabilities and knowledge, building the right leadership behaviour and organisational culture, and focusing on employee development and engagement, the retention risk of experienced employees remains an area requiring management attention. Impact If the Group is unable to retain its existing key employees or to attract and retain skilled talent in the future, critical positions may be left vacant, resulting in a failure to retain critical business knowledge required for our transformation, as well as adversely impacting the Group’s results of operations, financial condition and achieving broader business objectives, such as its sustainability ambitions. High voluntary employee turnover may also reduce organisational performance and productivity, leading to further adverse impact on the Group’s results of operations and financial condition and cause the Group to fail to deliver on its strategic growth plans. BAT Annual Report and Form 20-F 2023 Strategic Report Governance Report Financial Statements Other Information Other Information Group Risk Factors Continued 356
Risk: Disruption to the supply chain and distribution channels Description The Group has adopted an increasingly global approach to managing its supply chain, including distribution channels. Disruption to the Group's supply chain may be caused by various factors, including, but not limited to, disruption to suppliers’ operations or to distribution channels, and the deterioration in the financial condition of a trading partner. The Group foresees a heightened level of risk of disruption in our New Categories supply chain because it is multi-tiered and complex in sourcing and distribution. Such disruption may be caused by a cyber event, a global health crisis, political tensions, strikes, riots, civil commotion, a major fire, severe weather conditions or other natural disasters which affect manufacturing or other facilities of the Group’s operating subsidiaries or those of their suppliers and distributors. In certain geographic areas where the Group operates, insurance coverage may not be obtainable on commercially reasonable terms, if at all. Coverage may be subject to limitations, or the Group may be unable to recover damages from its insurers. Disruption may also be caused by spread of infectious disease (such as the COVID-19 pandemic) or by a deterioration/shortage in labour or union relations, disputes or work stoppages or other labour-related developments within the Group or its suppliers and distributors. In addition, the Group’s operating subsidiaries may not be able to establish or maintain relationships on favourable commercial terms with their suppliers and distributors. In some markets, distribution of the Group’s products occurs through third-party monopoly channels, often licensed by governments. The Group may be unable to renew these third-party supplier and distribution agreements on satisfactory terms for many different reasons, including government regulations or sustainability considerations. There are also some product categories for which the Group does not have surplus production capacity or where substitution between different production plants is impractical - this may cause further disruption to our supply chain. Consolidation of global suppliers and certain distributors that control large geographies may reduce the Group’s availability of alternatives and negatively impact the Group’s negotiating power with key suppliers and distributors. These risks are particularly relevant in jurisdictions where the Group’s manufacturing facilities are more concentrated or for certain product categories where production is more centralised. Impact Any disruption to the Group’s supply chain and distribution channels could have an adverse effect on the results of operations and financial conditions of the Group through failures to meet shipment demand, contract disputes, increased costs, loss of market share and inability to reinvest into New Category and support harm reduction agenda and cause the Group to fail to deliver on its strategic growth plans. Risk: Failure to uphold the high standard of sustainability management, performance and reporting Description Stakeholder expectations of, and regulatory requirements for, the Group’s sustainability management, ESG performance and reporting are continually evolving: for example, the EU Corporate Sustainability Reporting Directive (CSRD) recently introduced a number of new reporting obligations. The Group may fail to have the appropriate internal standards, strategic plans and governance, compliance, monitoring and reporting mechanisms in place to ensure it can identify emerging issues, meet external expectations and comply with applicable requirements. In addition, the Group relies on third-parties for certain ESG performance monitoring, measurement and other sustainability- related services. Such service providers may fail to perform these services to the specified or required standards or timeframes. Impact Failure to uphold high standards of sustainability management and ESG performance or provide transparent and consistent reporting, in line with applicable requirements, could significantly impact Group reputation or compliance and reduce investor confidence. In addition, poor performance across any aspect of ESG, such as a failure to sufficiently address climate change mitigations, expectations and requirements or human rights impacts across the Group’s business and supply chain, could result in increased costs and regulation, difficulty in attracting and retaining talent, criminal or civil prosecution, or decreases in consumer demand for our products. Poor performance could also result in our failure to deliver our ESG targets. Failure to responsibly and transparently market our products and communicate our achievements and position, such that we are accused of greenwashing, could potentially cause reputational damage and litigation impacts. In addition, the Group's association with any provider of sustainability-related services that fails to perform its services for the Group or third-parties to the specified or required standard or is alleged to have done so could also result in reputational damage and litigation impacts. BAT Annual Report and Form 20-F 2023 Strategic Report Governance Report Financial Statements Other Information 357
Business Execution and Supply Chain Risks continued Risk: Failure to successfully design, implement and sustain an integrated framework and operating model for Artificial Intelligence (AI). Description Inability to effectively establish and maintain a cohesive and functional AI framework and operating model within the Group could result in suboptimal utilisation of available AI technology, reduced efficiency and effectiveness, missed opportunities for innovation and value creation, potentially harmful use of AI technology and violation of laws and regulations. Further, improper use of AI technology could cause potential exposure regarding consumer privacy breaches. Additionally, we might be non-compliant regarding the implementation of new technologies, including as a result of ambiguous legal requirements. The Group may also fail to ensure that the design, implementation and ongoing management of the AI framework and operating model are well-planned, properly resourced and effectively executed. Impact Without a well-designed and properly functioning AI framework and operating model, the organisation may not be able to fully leverage the potential of AI technology and improve operational efficiency and effectiveness, which could result in missed opportunities for innovation and value creation, potentially putting the organisation at a competitive disadvantage. The lack of a cohesive and functional AI framework and operating model could result in increased costs associated with suboptimal utilization of AI technology, as well as the potential need for additional resources to address issues and inefficiencies. Inability to adapt and adopt the technology in an effective and compliant manner could result in reputational damage if the organisation is perceived as being unable to effectively leverage emerging technologies and using data in a manner inconsistent with consumers' ethical expectations and company values. In addition, use of discriminatory or unexplainable algorithms for decision making could potentially result in fines for BAT and increased attention from regulatory authorities, consumers and other stakeholders. Risk: Inability to obtain adequate supplies of tobacco leaf Description The Group purchases significant volumes of packed leaf each year. Tobacco leaf, as any other agricultural commodity, can be impacted by a variety of external factors. Like any other agricultural supply chain, it can be particularly vulnerable to a range of challenges, including climate change, weather-related events, such as drought, flood and other natural disasters, increasing demand for land and natural resources, rural poverty, social inequality, child labour and ageing farmer populations. Tobacco production in certain countries is also subject to a variety of controls, including regulation affecting farming and production control programmes, and competition for land use from other agriculture commodities. Such controls and competition can further constrain the production of tobacco leaf, raising prices and reducing supply. The Group recognises the above and any combination of those, including topics like child labour, as a risk to our tobacco leaf supply chain. Impact Restricted availability of tobacco leaf may prevent the Group accessing sufficient tobacco leaf that meets its volume, quality and sustainability requirements. This could lead to an impact in the quality of the Group's products to a level that may be perceptible by consumers and may impact the Group's ability to deliver on consumer needs. The Group’s Sustainability commitments may restrict the sources we can buy from, which would result in an imbalance in supply and demand potentially causing incremental tobacco prices. Higher tobacco leaf prices would result in increased raw material costs and have an adverse effect on the Group's financial condition. The Group may also experience reputational damage from not adequately managing its sustainability priorities like climate change, protection of natural resources, including forests, and human rights in our leaf supply chain, which may restrict suppliers willing to do business with us. Risk: Exposure to product contamination Description The Group may experience product contamination, whether by accident or deliberate malicious intent, during supply chain or manufacturing processes, or may otherwise fail to comply with the Group’s quality standards. The Group may also receive threats of malicious tampering. Impact Product contamination or threats of contamination may expose the Group to significant costs associated with recalling products from the market or temporarily ceasing production. In addition, adult tobacco consumers may lose confidence in the specific brand affected by the contamination, resulting in reputational damage and a loss of sales volume and market share. The Group could be subject to liability and costs associated with civil and criminal actions as well as regulatory sanctions brought in connection with a contamination of the Group’s products. Each of these results may in turn have an adverse effect on the Group’s results of operations, financial condition and reputation and cause the Group to fail to deliver on its strategic growth plans. BAT Annual Report and Form 20-F 2023 Strategic Report Governance Report Financial Statements Other Information Other Information Group Risk Factors Continued 358
Risk: Failure to successfully design, implement and sustain an integrated technical landscape and ERP strategy Description The Group aims to improve profitability and productivity through supply chain improvements and the implementation of an integrated operating model and organisational structure, including standardisation of processes, centralised back-office services and a common IT platform. The Group undertakes transformation initiatives periodically which aim to enhance the organisation and facilitate growth, including the Group's focus on New Categories and Beyond Nicotine. The Group’s efforts to achieve these goals are driven and enabled through use of our TaO (central SAP ERP system) global template – a standardised process used by the Group with the use of a central SAP instance common for the Group's subsidiaries. These processes include, among others, core back-office global processes, procurement, warehouse management, accounting and controlling. Impact Failure by the Group to successfully evolve the TaO system to support a multi-category business model or not having a clear future- fit ERP strategy, could lead to the Group's inability to support BAT's strategy and transformation, and realise anticipated benefits. Additionally, this could lead to increased costs, disruption to operations, decreased trading performance, disgruntled employees, loss of institutional knowledge and reduced market share. These results could in turn reduce profitability and funds available for investment by the Group in long-term growth opportunities. Inability to develop governance process models in line with BAT's evolving business strategy may result in the failure to achieve sustainable multi-category growth including capturing additional productivity gains and achieving ESG goals which may in turn have an adverse effect on the Group’s results of operations and financial condition and cause the Group to fail to deliver on its strategic growth plans. Risk: Failure to manage the Group’s climate change and circular economy risks Description The Group is exposed to physical risks associated with climate change from severe weather events such as flooding, drought and storms across its global operations and supply chain. Climate change may cause acute physical risks such as more frequent and severe weather events, or chronic risks such as those related to longer-term shifts in climate patterns and temperatures. These, alongside their direct impact on Group operations, could lead to reductions in the supply and quality of tobacco leaf and other physical goods and cause transport and logistics disruptions in our supply chains. The Group may also experience transition risks associated with the move to a low carbon economy, such as emissions-related regulations and additional taxes applicable to its operations and its supply chain. The Group is exposed to risks associated with the move towards a circular economy, including product-related regulatory risks, such as product design/disassembly requirements and Extended Producer Responsibility (EPR) requirements. As climate change and circular economy-related legislation and reporting requirements further evolve, companies need to effectively identify, assess, monitor and mitigate associated transition risks; failure to do so adequately or less well than others could lead to BAT scoring lower in ESG ratings and indices used by financial actors in making investment decisions. As consumer and customer behaviours and expectations further evolve, the Group may fail to sufficiently adapt its product portfolio and marketing strategy in response to stakeholders' increasing sustainability expectations. Climate change and circular economy- related considerations, including relevant aspects of products and value chains, may result in a potential reduced demand for or rejection of the Group’s products as well as reputational risk in relation to sustainability matters. Impact Disruption to the Group's agricultural and/or non-agricultural supply chain or product distribution channels, including logistics, could have an adverse effect on its operations and financial condition through failures to meet product demand, contract disputes, increased costs and loss of market share. Consumer and customer behaviours and expectations may influence their purchasing decisions and may lead them to seek alternative product offerings. An inability to develop and commercialise products, packaging or value chain sustainability innovations in-line with demand or less well than competitors, including failures to adequately predict changes in consumer and societal behaviour and expectations and reflect them in the product portfolio, could lead to missed commercial opportunities, under- or over-supply, loss of competitive advantage, loss of market share, unrecoverable costs and the erosion of the Group's consumer base or brand equity. This includes potential impacts from a failure to adequately manage product-related ESG performance and EPR requirements. In addition, consumers failing to engage in product recycling and/or Take-Back schemes could also have an impact on the Group’s product-related and EPR risks and requirements. Material non-compliance with climate change and/or circular economy-related legislation or reporting requirements could reduce BAT's ability to attract investors, result in reputational damage and potentially regulatory sanctions. Poor results in ESG ratings and indices used by financial actors may negatively impact their investment decisions, and thereby increase the cost of capital or negatively impact share price. Failure to meet current and future employees’ expectations concerning the Group’s actions to mitigate and adapt to climate change or address circular economy matters may negatively impact the retention and/or attraction of high-quality employees. BAT Annual Report and Form 20-F 2023 Strategic Report Governance Report Financial Statements Other Information 359
Business Execution and Supply Chain Risks continued Risk: Impact of a pandemic on the performance of the Group Description The Group continues to closely monitor the potential for disruption arising from pandemics, the most recent having been coronavirus (COVID-19). Consequences may include significant logistical challenges for employees and their ability to perform their duties, potential loss of lives or significant level of illness in the workforce, inability to deliver revenue stream and market share targets impacting profits and cash flows, and disruption to the supply chain and third parties being unable to deliver contractual goods and services. In addition, some countries in which the Group operates have adopted regulations restricting the ability to manufacture, distribute, market and sell products. Impact The influence of COVID-19, future variants and other pandemics on the Group's operations and financial condition is difficult to predict given the wide range of determining factors, not least the nature of the pandemic/virus, its speed of infection, geographical scope and duration. The impact of a pandemic on global economic activity and the nature and severity of measures adopted by governments are numerous. The impact on the Group is not limited to: – Reductions or volatility in consumer demand for one or more of our products due to illness, retail closures, quarantine or other travel restrictions, health consciousness (quitting use of tobacco and nicotine products), government restrictions, the deterioration of socio-economic conditions, economic hardship and customer-downtrading (switching to a cheaper brand), which may impact the Group’s market share. – Disruptions to the Group’s operations, such as its supply chain, or manufacturing or distribution capabilities, which may result in increased costs due to the need for more complex supply chain arrangements, to expand existing facilities or to maintain inefficient facilities, a reduction of the Group’s sales volumes or an increase in bad debts from customers. – Disruption to the Group’s operations resulting from a significant number of the Group’s employees, including employees performing key functions, working remotely for extended periods of time or becoming ill, which may reduce the employees’ efficiency and productivity and cause product development delays, hamper new product innovation and have other adverse effects on the Group’s business. – Significant volatility in financial markets (including exchange rate volatility) and measures adopted by governments and central banks that further restrict liquidity, which may limit the Group’s access to funds, lead to shortages of cash and cash equivalents needed to operate the Group’s business, and impact the Group’s ability to refinance its existing debt. – Regulations restricting the ability to manufacture, distribute, market and sell products, and potentially increasing illicit trade. – Governments seeking to increase revenues through increased corporate taxes and excise in combustible and/or New Category products, increasing the cost and prices of our products – which could reduce volumes and margins, and/or increase illicit trade. While some negative effects caused by COVID-19 have taken place in several End Markets over the last few years, including reduced demand due to temporary smoking bans, lockdown restrictions, increased border checks and change in consumer behaviours, none of these have had a material effect on the Group’s overall profitability. However, all of the above factors may have material adverse effects on the Group’s results of operations and financial condition and cause the Group to fail to deliver on its strategic growth plans. The difficulty in predicting future pandemics exacerbates this risk. BAT Annual Report and Form 20-F 2023 Strategic Report Governance Report Financial Statements Other Information Other Information Group Risk Factors Continued 360
Legal, Regulatory and Compliance Risks Risk: Exposure to, the enactment of, proposals for, or expectations of regulation that significantly impairs the Group’s ability to communicate, differentiate, market or launch its products and/or the lack of appropriate regulation for New Categories Description Tobacco control measures are in place in nearly all markets in which we operate. Regulation for Vapour and THP is now widespread, while regulation of nicotine pouches is appearing in a growing number of markets. Such restrictions are introduced by legislation, regulations and/or voluntary agreements. Most tobacco and nicotine control measures can be categorised as follows: – Category Bans: including regulations that ban the sale, import, possession, or use of certain product categories, including entire bans on New Category or novel products; – Place: including regulations restricting consumption in private and public spaces (e.g. public place smoking or vaping bans, including restaurants and bars); – Product: including regulations on the use of or testing for ingredients, product design and attributes (e.g. tar/ nicotine / carbon monoxide ceilings, format restrictions, filter bans); flavours bans (including menthol); nicotine levels and low nicotine cigarettes; product safety (e.g. reduced cigarette ignition propensity standards); product disclosure (e.g. ingredients and emissions) and environmental impact (e.g. Extended Producer Responsibility requirements for cigarette filters or biodegradable filter requirements); – Packaging and labelling: including regulations on health warnings, dissuasive packaging, and other government-mandated messages; restrictions on the use of certain descriptors and brand names; requirements on pack shape, size, weight and colour; and mandatory plain packaging; – Advertising, promotion and sponsorship: including partial or total bans on advertising, promotions, corporate communications and sponsorship, and online and direct engagement communication; – Purchase: including regulations on where the products are sold, such as type of outlet (e.g. supermarkets, online and vending machines), radius or distance restrictions (e.g. 300 meters from a school), online sales bans, regulation regarding how they are sold and displayed (e.g. above the counter or under the counter) and minimum purchase age and increases thereto, including generational bans; – Price: including regulations that have implications on prices and margins (e.g. excise taxes, minimum prices and import/export duties); and – Responsibility: including regulations introducing Extended Producer Responsibility schemes on cigarette manufacturers to cover the cost to clean up cigarette waste (Single Use Plastics Directive (EU) 2019/904) and equipment-related cost sharing obligations to fight illicit trade (Article 15.7 of EU Tobacco Products Directive 2014). The Group believes that further tobacco control and nicotine regulation (including regulation for both nicotine and non-nicotine Herbal Heated Products) is expected over the medium term in many of the Group’s markets. Irresponsible behaviour or marketing practices of competitors (for example where there is a lack of appropriate regulation) or actions contrary to the regulations in certain markets, may cause reputational harm to the industry as a whole and may result in additional regulation or bans. Further, there is pressure on governments from international organisations and agencies, tobacco control NGOs, influential national regulators and the private sector (including philanthropists, pharmaceutical and security technology companies and social justice groups) to pursue regulatory policies and implement tobacco or nicotine product-related regulation which limit the commercial viability of tobacco and nicotine products or prohibit products completely. Regulators may be lacking in understanding of New Categories products and their role in tobacco harm reduction due to their novelty. These factors can lead to a lack of adequate or existing regulatory regimes or clear and appropriate product classifications. In addition, the Group may fail to implement the right level of control measures or to maintain adequate standards of compliance with regulatory measures. For example, the Group’s marketing activities may fail to comply with the relevant law and regulations or with the Group’s International Marketing Principles. Insufficient information, instruction and training in the relevant areas and a lack of knowledge of the existence and/or requirements of relevant regulations including tobacco and nicotine as well as other relevant regulations, such as battery or environmental regulation, or a failure to monitor, assess and implement the requirements of new or modified regulation, may increase these risks. There may also be negative and disproportionate societal responses to consumer abuse or misuse of tobacco and/or nicotine products (e.g. in New Categories) or to certain categories of products. With respect to Modern Oral and other New Categories, regulatory frameworks currently follow divergent approaches. In certain markets, where there is an absence of adequate regulation, actions of irresponsible competitors may cause reputational harm to the category and result in outright bans or adverse regulation. In markets where there is a likelihood of tobacco, pharmaceutical or food regulatory classification, the category can be at risk of severe regulation or total ban. The Group believes that there is a risk Tobacco Heated Products could be regulated as traditional tobacco products, driven by the decision of WHO’s 8th Conference of Parties to the Framework Convention on Tobacco Control, and Reports from the WHO submitted to the COP10, to apply tobacco control regulations to these products including recommendations for plain packaging and flavour bans. BAT Annual Report and Form 20-F 2023 Strategic Report Governance Report Financial Statements Other Information 361
Legal, Regulatory and Compliance Risks continued Risk: Exposure to, the enactment of, proposals for, or expectations of regulation that significantly impairs the Group’s ability to communicate, differentiate, market or launch its products and/or the lack of appropriate regulation for New Categories continued Description continued Traditional Tobacco Products With respect to tobacco and combustible products, many of the measures outlined in the FCTC have been or are in the process of being implemented through national legislation in many markets in which the Group operates, including recommendations for plain packaging and flavour bans (e.g. menthol bans – in effect in the European Union since 20 May 2020). In April 2022, the U.S. Food and Drug Administration (FDA) announced its intention to ban menthol as a characterising flavour in cigarettes in the U.S. In December 2023, the Biden administration released its latest unified agenda, indicating that the administration expects to issue the final menthol rule in March 2024; however, the administration is not bound by this timeline. In December 2022, the sale of all tobacco products with characterising flavours (including menthol) other than tobacco were banned in the state of California, which is the most populated state in the U.S. Subsequent to the FDA announcement on 28 April 2022 of a proposed product standard to prohibit menthol as a characterising flavour in cigarettes, the FDA formally submitted the final product standard to the Office of Management and Budget on 18 October 2023. Further, various national or international regulatory regimes may seek to require the reduction of nicotine levels in tobacco products. In March 2018, the FDA published its Advanced Notice of Proposed Rulemaking titled “Tobacco Product Standard for Nicotine Level of Combusted Cigarettes” and invited interested parties to submit comments on, among other issues, maximum nicotine limits and whether any maximum nicotine level should apply to combustible tobacco products. In October 2019, the FDA withdrew the Advanced Notice of Proposed Rulemaking without explanation. With the Spring Unified Agenda (released June 2022), the FDA announced a plan to move forward with the proposed rule reducing nicotine levels in cigarettes, indicating that the rule would be published in December 2023, which did not occur. With the Fall Unified Agenda (released December 2023), the agenda anticipates a proposed nicotine rule in April 2024; however, the FDA has clarified that there is no precise date on which is plans to issue the proposed rule. In the U.S., subject to the FDA's enforcement discretion, manufacturers of all tobacco products, which include nicotine derived from tobacco or any other source, must submit information to the FDA seeking formal marketing authorisation of such products. Although the new government from New Zealand recently announced that the relevant act would be repealed, New Zealand had approved legislation banning anyone born after 1 January 2009 from buying tobacco products, imposing a retail limit of 600 retailers across New Zealand from 1 July 2024, and implement a nicotine limit in smoked tobacco to 0.8 mg/g (~5% of current levels) from 1 April 2025. In the meantime, the UK government has announced its intention to impose a similar generational ban preventing people born after 1 January 2009 from buying tobacco products, including THPs, when they come of age (18 years old). The consultation process is ongoing and a regulatory impact assessment should be published in due course. Finally, the preparations of a revised EU Tobacco Products Directive are progressing, with estimated adoption in 2026. The current Directive might be replaced with a directly applicable regulation, following which transposition in Member States would no longer be required. It is anticipated that this new regulation could include plain packaging for combustibles and/or greater regulation of tobacco and nicotine product ingredients (including Herbal Heated Products). New Categories With respect to New Categories, regulation is still evolving and frameworks for regulation and taxation vary from country to country. Some regulators have applied or are considering applying combustible tobacco products’ restrictive regulatory framework to New Categories. Some jurisdictions have banned or are considering banning certain New Category products altogether. Following reports of individuals experiencing acute respiratory injury in suspected association with vaping certain e-liquids (EVALI) and reports regarding vaping youth usage in the U.S., stricter regulatory views gained momentum and were publicly supported by the World Health Organization (WHO) which continues to call on countries to ban or regulate novel nicotine products as tobacco. The U.S., the EU and Canada are playing a leading role across all identified regulatory risks, including: flavour regulations, advertising restrictions and nicotine limits, among others. On 12 October 2021, the FDA issued its first vapour product Marketing Granted Orders (MGOs) for tobacco flavoured Vuse Solo and Vuse Solo power units. On the same date, Reynolds American companies received Marketing Denial Orders (MDOs) for the flavoured (non- menthol and non-tobacco) Vuse Solo products. Reynolds American companies filed an internal agency appeal against these MDOs, which remains pending. On 12 May 2022, the FDA issued MGOs for Vuse Vibe and Vuse Ciro power units and “Original” (tobacco) flavours. On the same date, Reynolds American companies received MDOs for the flavoured (non-menthol and non-tobacco) Vuse Vibe and Ciro products. Reynolds American companies filed an internal agency appeal against these MDOs, which remains pending. On 24 January 2023, the FDA issued MDOs for Vuse Vibe and Ciro menthol products. Reynolds American companies filed a court challenge in the U.S. Court of Appeals for the Fifth Circuit. On 17 March 2023, the FDA issued MDOs for Vuse Solo menthol products. Reynolds American companies filed a court challenge in the Fifth Circuit. The Court issued a stay in these cases pending a decision on the merits of Reynolds’ legal challenges to the underlying MDOs. On 12 October 2023, the FDA issued MDOs for Vuse Alto menthol and mixed-berry products. Reynolds American companies immediately filed a lawsuit in the U.S. Court of Appeals for the Fifth Circuit challenging these MDOs and obtained a temporary administrative stay pending resolution of Reynolds’ motion for stay pending judicial review, which was filed on 20 October 2023. Briefing on the motion continues. Vuse Alto tobacco flavours remain under FDA review. The Group’s Velo products remain on the market in the U.S., again pending FDA decisions on their marketing authorisations, and there can be no assurance these will be granted. If the FDA denies a marketing authorisation then the relevant product(s) would need to be withdrawn from the market (unless a court or the FDA intervenes). Beyond Nicotine As the Group also looks to Beyond Nicotine products including CBD and cannabis (in connection with its investments in Organigram, Sanity Group and Charlotte's Web), it may be subject to additional regulation and these products might not be scalable on a global basis given varying degrees of regulation. Please refer to the discussion of tobacco and nicotine regulatory regimes under which the Group’s businesses operate set out from page 375. BAT Annual Report and Form 20-F 2023 Strategic Report Governance Report Financial Statements Other Information Other Information Group Risk Factors Continued 362
Impact Existing and future regulatory measures impacting one or more New Categories and/or Beyond Nicotine and/or traditional tobacco products could adversely affect volume, revenue and profits, as a result of: restrictions on the Group’s ability to sell and differentiate its products or brands, leverage price, innovate, make scientific claims, compete in future product categories and make new market entries; regulations (e.g. pharma or food) or total bans of tobacco and/or New Categories products in certain markets; reduced margins due to increased operating costs; impediments to building or maintaining brand equity; and restrictions on the Group’s ability to deliver, market and sell existing or new products responding to consumers’ preferences. In addition, new (and changes to existing) regulation could lead to greater complexity, as well as higher production and compliance costs. As an example, through the acquisition of Reynolds American Inc., the Group acquired the Newport brand, the leading menthol cigarette brand in the U.S., the Group’s largest single market. The sales of Newport, together with the other menthol brands of the Group’s operating subsidiaries, represent a significant portion of the Group’s total net sales. Any action by the FDA or any other governmental authority banning or materially restricting the use of menthol in tobacco products (such as the proposed FDA ban on menthol cigarettes) could have a significant negative impact on sales volumes which would, in turn, have an adverse effect on the results of operations and financial position of the Group. Regulations can also have an adverse impact on the Group’s ability to compete within the legitimate tobacco, nicotine or New Categories industry and with illicit traders or legal operators exploiting legal and regulatory loop holes. Regulations could also lead to reduced consumer acceptability of new product specifications, leading to consumers seeking alternatives in illicit markets, especially where enforcement is lacking, such as in the case of the increase in illicit single-use devices in the U.S. market. Unclear or inadequate regulations can lead to legal uncertainty, impacting the Group’s position in the marketplace. In the specific case of New Categories, our corporate harm reduction ambition, including of New Categories revenue of £5 billion by 2025 and 50 million consumers of Non-Combustible products by 2030 could be at risk if stricter regulatory views are imposed at a global scale, or if appropriate regulation is lacking or there is a lack of acceptance of tobacco harm reduction as a tobacco control policy (preventing a balanced regulatory framework for New Categories). Any action by the FDA or any government authority restricting the use of New Category products could also have an adverse effect on the operation and financial position of the Group and the possible failure of the Group’s harm reduction objective and loss of confidence in the Group’s ESG performance. As a reflection of the real or perceived impact of stricter regulation in our business, the Group’s share price has also experienced, and could in the future experience, shocks upon the announcement, expectation or enactment of restrictive regulation. All these effects may have an adverse effect on the Group’s results of operations and financial conditions and cause the Group to fail to deliver on its strategic growth plans. In addition, considering the significant number of regulations that may apply to the Group’s businesses across the world, the Group is and may in the future be subject to claims for breach of such regulations. Government authorities (such as the FDA), organisations or even individuals may allege that our marketing activities do not comply with the relevant law s and regulations, or with our International Marketing Principles. As such, the Group could be subject to liability and costs associated with civil and criminal actions as well as regulatory sanctions, fines and penalties brought in connection with these allegations. Even when proven untrue, there are often financial costs and reputational impacts in defending against such claims and allegations (including potential adverse impact on the treatment by the FDA of the Group ‘s PMTAs in the U.S.). Each of these results may in turn have an adverse effect on the Group’s results of operations and financial condition and cause the Group to fail to deliver on its strategic growth plans. BAT Annual Report and Form 20-F 2023 Strategic Report Governance Report Financial Statements Other Information 363
Legal, Regulatory and Compliance Risks continued Risk: Adverse implications of EU legislation on single-use plastics that will result in on-pack environmental warnings and financial implications relating to the Extended Producer Responsibility (EPR) Description The EU adopted a Directive on single-use plastics in July 2019 (the "SUP Directive") which, among other products, targets tobacco products with filters containing plastic. The Cellulose Acetate in our filters is defined as a single-use plastic under the Directive and, as such, the Directive will have an impact on the Group’s cigarettes, filters for other tobacco products and consumables for THPs. Under the SUP Directive, the Group will be subject to (and in some cases already is subject to) Extended Producer Responsibility (“EPR”) schemes, requiring the Group to cover the costs of collecting, transporting, treating and cleaning-up of filters containing plastic. The SUP Directive also imposes on tobacco manufacturers the obligation to finance consumer awareness campaigns and to place environmental markings on packs of products with filters containing plastic. Member States had to transpose the SUP Directive into national law by 3 July 2021, with an implementation deadline of 5 January 2023 for EPR schemes. In practice, most Member States are late on transposition and implementation, with the practical consequence that EPR schemes will go live with several months delays on average. The European Commission is also late in its issuance of guidelines on the criteria for the costs of cleaning up litter, which should have been issued prior to the anticipated implementation deadline for EPR schemes. This introduces further difficulties and uncertainty in the design and setting-up of EPR schemes. When transposing the SUP Directive into national law, EU member states could decide to expand the scope of EPR systems under their respective national laws, which may expose the Group to additional regulations and financial obligations. This is the case in France, where EPR implementation has already occurred with an expansion of the scope to include non-plastic filters for RYO products. Although Sweden’s government has abandoned plans to extend its national EPR system to Snus and Modern Oral pouches, other markets are still at risk of extension, such as in Spain (tobacco manufacturers would be mandated to financially contribute to the cost of cleaning of parts of the general sewage system), the Czech Republic (tobacco manufacturers would be mandated to contribute to the cost of managing household waste costs), and Poland and Romania (manufacturers’ financial contribution would also cover paper filters, although they are not plastic items). Proposed regulations are still being discussed in these countries. It is noted that there is a growing level of scrutiny on the use of single-use plastic across the world and a number of other markets in which the Group operates are considering ways to restrict (or ban) the use of filters made of plastic and/or introduce EPR schemes covering other plastic elements in our products beyond filters for traditional products and/or New Categories products. Impact The financial implications of existing and future EPR schemes will increase administrative burdens and operating costs and may have an adverse effect on the Group’s results of operations and financial condition and cause the Group to fail to deliver on its strategic growth plans. If significant space is appropriated on the packaging of some of the Group’s products, this may also be an impediment to maintaining or building brand equity of the Group’s products which may, in turn, have a negative impact on the Group’s sales volume. Failure to deliver appropriate EPR schemes may lead to imposition of the schemes by the local authorities at a higher cost to the Group, adversely impacting the Group’s results of operations, financial condition and reputation. Risk: Exposure to litigation, regulatory action or criminal investigations on tobacco, nicotine, New Categories and other issues Description The Group is involved in litigation related to its tobacco and nicotine products, including legal, regulatory and patent actions, proceedings and claims, brought against it in a number of jurisdictions. Claims brought against the Group may be based on personal injury (both individual claims and class actions), economic loss arising from the treatment of smoking and health-related diseases (such as medical recoupment claims brought by local governments), patent infringement (please refer to the risk factor under “Product pipeline, commercialisation and Intellectual Property risks, Exposure to risks associated with intellectual property rights, including the failure to identify, protect and prevent infringement of the Group’s intellectual property rights and potential infringement of, or the failure to retain licences to use, third-party intellectual property rights” below), negligence, strict tort liability, design defect, failure to warn, fraud, misrepresentation, deceptive/unfair trade practices, conspiracy, medical monitoring and violations of antitrust/ racketeering laws. Sustainability-related litigation and regulatory action may also be brought against the Group. Certain actions, such as those in the U.S. and Canada, involve claims in the tens or hundreds of billions of pounds sterling. The Group is also involved in proceedings that are not directly related to its tobacco and nicotine products, including proceedings based on environmental pollution claims. Additional legal and regulatory actions and investigations, proceedings and claims may be brought against the Group in the future. Impact The Group’s consolidated results of operations and financial position could be materially affected by any unfavourable outcome of certain pending or future litigation. The Group could be exposed to substantial liability, which may take the form of ongoing payments, such as is the case with the State Settlement Agreements in the U.S. that require substantial ongoing payments by Group subsidiary, RJRT. Whether successful or not, the costs of the Group’s involvement in litigation could materially increase due to costs associated with bringing proceedings and defending claims, which may also cause operational and strategic disruption by diverting management time away from business matters. Liabilities and costs in connection with litigation could result in bankruptcy of one or more Group entities, for example, following a judgement in Canada, certain of the Group's Canadian subsidiaries filed for protection under the CCAA. Any negative publicity resulting from these claims may also adversely affect the Group’s reputation. The occurrence of any of the above effects could in turn have an adverse effect on the Group’s results of operations and financial condition and cause the Group to fail to deliver on its strategic growth plans. Please refer to note 31 on page 286 in the Notes on the Accounts for details of contingent liabilities applicable to the Group. BAT Annual Report and Form 20-F 2023 Strategic Report Governance Report Financial Statements Other Information Other Information Group Risk Factors Continued 364
Risk: Significant and/or unexpected increases or structural changes in tobacco and nicotine-related taxes Description Tobacco and nicotine products are subject to high levels of taxation, including excise taxes, sales taxes, import duties and levies in most markets in which the Group operates. In many of these markets, taxes are generally increasing, but the rate of increase varies between markets and between different types of tobacco and nicotine products. Increases in, or the introduction of new, tobacco and nicotine- related taxes may be caused by a number of factors, including fiscal pressures, health policy objectives and increased lobbying pressure from anti-tobacco advocates. With respect to New Categories, although a common framework for regulation and taxation has yet to emerge, the manufacture, sale, packaging and advertising of such products are increasingly being regulated and taxed. Impact Significant or unexpected increases in, or the introduction of new, tobacco-related taxes or minimum retail selling prices, changes in relative tax rates for different tobacco and nicotine products or adjustments to excise have in the past resulted, and may in the future result, in the need for the Group to absorb such tax increases due to limits in its ability to increase prices, an alteration in the sales mix in favour of value-for-money brands or products, or growth in illicit trade, each of which could impact pricing, sales volume and profit for the Group’s products. Significant or unexpected increases of tobacco-related taxes could also impact the Group's ability to deliver the corporate purpose of harm reduction. Risk: Failure to comply with health and safety and environmental laws Description The Group is subject to a variety of laws, regulations and operational standards relating to health and safety and the environment. The Group may fail to assess certain risks and implement the right level of control measures or to maintain adequate standards of health and safety or environmental compliance, which could cause injury, ill health , disability or loss of life to employees, contractors or members of the public, or harm to the natural environment and local communities in which the Group operates. As a result of the outcomes of the COP26, further future regulation is anticipated as governments look to meet their climate change ambitions. Insufficient information, instruction and training in the relevant areas and a lack of knowledge of the existence and/or requirements of relevant regulations, or a failure to monitor, assess and implement the requirements of new or modified legislation, may increase these risks. Impact Any failure by the Group to comply with applicable health and safety or environmental laws, or the exposure to the consequences of a perceived failure, could result in business disruption, reputational damage, difficulties in recruiting and retaining staff, increased insurance costs, consequential losses, the obligation to install or upgrade costly pollution control equipment, loss of value of the Group’s assets, remedial costs and damages, fines and penalties as well as civil or criminal liability. Each of these results could in turn adversely impact the Group’s results of operations and financial condition and cause the Group to fail to deliver on its strategic growth plans. Risk: Exposure to unfavourable tax rulings Description The Group is subject to tax laws in a variety of jurisdictions. The Group‘s interpretation and application of the tax laws could differ from those of the relevant tax authority, which may subject the Group to claims for breach of such laws, including for late or incorrect filings or for misinterpretation of rules. Tax authorities in a variety of jurisdictions, such as the Netherlands and Russia, have assessed, and may in the future assess, the Group for historical tax claims, including interest and penalties, arising from disputed areas of tax law. The Group is currently party to tax disputes in a number of jurisdictions, some of which involve claims for amounts in the hundreds of millions of pounds sterling. Please refer to note 31 on page 286 in the Notes on the Accounts for details of contingent liabilities applicable to the Group. Impact The Group’s failure to comply with the relevant tax authority’s interpretation and application of the tax laws could result in significant financial and legal penalties, including the payment of additional taxes, fines and interest in the event of an unfavourable ruling by a tax authority in a disputed area, as well as the payment of dispute costs. Disruption to the business could occur as a result of management’s time being diverted away from business matters. Each of these results could negatively affect the Group’s results of operations and financial condition and cause the Group to fail to deliver on its strategic growth plans. Risk: Unexpected legislative changes to corporate income tax laws Description The Group is subject to corporate income tax laws in the jurisdictions in which it operates. These laws frequently change on a prospective or retroactive basis. Impact Legislative changes to corporate income tax laws and regulations may have an adverse impact on the Group’s corporate income tax liabilities and may lead to a material increase of the Group’s overall tax rate. This could, in turn, negatively affect the Group’s results of operations and financial condition and cause the Group to fail to deliver on its strategic growth plans. BAT Annual Report and Form 20-F 2023 Strategic Report Governance Report Financial Statements Other Information 365
Legal, Regulatory and Compliance Risks continued Risk: Exposure to potential liability under competition or antitrust laws Description According to the Group’s internal estimates, the Group is a market leader by volume and/or value in certain categories in a number of countries in which it operates and/or is one of a small number of tobacco and/or New Categories companies in certain other markets in which it operates. The Group has had antitrust infringement decisions imposed against it in the past and is subject to ongoing investigations (please refer to note 31 on page 286 in the Notes on the Accounts for details of contingent liabilities applicable to the Group). The Group may fail to comply with competition or antitrust laws and may be subject to investigation and/or litigation for alleged abuse of its position in markets in which it has significant market share or for alleged collusion/anti-competitive arrangements with other market participants. Competition/antitrust laws continue to evolve globally with increasingly aggressive enforcement. Impact Failure by the Group to comply with competition or antitrust laws and investigations (and/or litigation) for violation of such laws may result in significant legal liability, fines, penalties and/or damages actions; criminal sanctions against the Group, its officers and employees; increased costs, prohibitions on conduct of the Group’s business; forced changes in business practices, forced divestment of brands and businesses (or parts of businesses) to competitors or other buyers; director disqualifications; commercial agreements being held void; and operational and strategic disruption (including by diverting management time away from business matters). The Group may face increased public scrutiny and the investigation or imposition of sanctions by antitrust regulation agencies and/or courts for violations of competition regimes which may subject the Group to reputational damage and loss of goodwill, including negative perceptions of the Group’s governance and our ESG credentials. The occurrence of any of the above effects could in turn have an adverse effect on the Group’s results of operations and financial condition and cause the Group to fail to deliver on its strategic growth plans. Risk: Failure to establish and maintain adequate controls and procedures to comply with applicable securities, corporate governance and compliance regulations Description The Group’s operations are subject to a range of rules and regulations around the world. These include U.S. securities, corporate governance and compliance laws and regulations, such as the Sarbanes-Oxley Act of 2002 and the U.S. Foreign Corrupt Practices Act of 1977, and expanding ESG reporting and disclosure requirements which apply to the Group’s worldwide activities. While the Group continuously seeks to improve its systems of internal controls and to remedy any weaknesses identified, there can be no assurance that the policies and procedures will be followed at all times or effectively detect and prevent violations of applicable laws. In addition, the Group is subject to increasingly stringent reporting obligations under UK corporate reporting regulations. Impact The increased scope and complexity of applicable regulations to which the Group is subject may lead to higher costs for compliance. Failure to comply with laws and regulations may result in significant legal liability, fines, penalties, class action suits and/or damages actions, criminal sanctions against the Group, its officers and employees, and damage to the Group’s reputation. Non-compliance with such regulations could also lead to a loss of the Group’s listing on one or more stock exchanges or a loss of investor confidence with a subsequent reduction in share price. Risk: Lack of external recognition and acceptance of the foundational science and inability to effectively communicate to stakeholders about the potential health impact of our New Category products. Description Scientific evidence to support the harm reduction potential of New Category products is essential for demonstrating and communicating the risk reduction potential of these products to adult smokers. BAT conducts rigorous science to demonstrate the potential reduced risk outcomes when smokers switch to New Category products, and in the longer-term, epidemiological data will be required to demonstrate the health impact at population levels. Consumer expectations and the rapid pace of innovation necessitate the evolution of the product portfolio, which requires the Group to regularly re-assess and update the associated scientific evidence base. Long-term epidemiological data requires decades to acquire. Therefore, the scientific data available today is by necessity shorter-term data that provides a strong indication of the reduced-risk potential of New Category products relative to cigarettes. In terms of the wider tobacco harm reduction strategy, there is a risk that the long-term health impact of New Category products is not fully understood at this time. There is also a risk of failure to communicate the scientific findings in a timely or effective manner. Furthermore, there are challenges on the choice of standards, controls and/or experimental design and methodology used for demonstrating the robustness of scientific research, together with regulation limiting risk communication to consumers. Impact Inability to fully demonstrate and communicate the tobacco harm reduction abilities of New Category products in a timely manner may lead to greater regulatory restrictions or outright bans, market share reduction, fines and penalties, reputational damage, and inability to sustain our quality growth and sustainability strategy. These potential impacts could cause the Group to fail to deliver on its strategic growth plans and objectives. BAT Annual Report and Form 20-F 2023 Strategic Report Governance Report Financial Statements Other Information Other Information Group Risk Factors Continued 366
Risk: Insufficient product stewardship and failure to comply with product regulations Description We are subject to risks of safety incidents in pre-market testing or in market due to, for example, a lack of due caution and appropriate response paid to pre-market product data, or toxicology information, inaccurate and unreliable information from suppliers and/or compromise of data or other information through cybersecurity attacks. The interpretation and application of regulations concerning the Group’s products, such as the Tobacco and Related Products Directive (TPD2), may be subject to debate and uncertainty. This includes uncertainty over product classifications and restrictions on advertising. In particular, with respect to the developing category of New Categories, which has grown in size and complexity in a relatively short period of time, a consensus framework for the interpretation and application of existing regulation has yet to emerge. The continuously changing and evolving landscape of regulation concerning the Group’s products contributes to the uncertainty surrounding interpretation and application and creates a risk that the Group may misinterpret or fail to comply with developing regulations in the various jurisdictions in which it operates, or becomes subject to enforcement actions from regulators. With the continuous changing of product cycle plans and expansion to new markets and innovations, there is a risk that such changes and launches fail to comply with the relevant regulations, including pre-approval and/or pre-registration requirements. For example, some governments have intentionally banned or are seeking to ban novel tobacco products and products containing nicotine, while others would need to amend their existing legislation to permit their sale. Even in countries where the sale of such products is currently permitted, some governments have adopted, or are seeking to adopt, bans on New Categories or restrictions on certain flavours. Impact The significant number of emerging regulations and the uncertainty surrounding their interpretation and application may subject the Group to claims for breach of such regulations. Financial costs of such enforcement actions include financial penalties, product recalls and litigation costs, and entail a significant risk of adverse publicity and damage to the Group’s reputation and goodwill. In cases of consumer injury or fatality due to a consumer product safety issue, this could also cause significant Group reputational damage, leading to a negative impact on stakeholder confidence, including consumers, retailers, investors, and regulatory and public health organisations. Risk: Failure to uphold high standards of corporate behaviour, including through unintended or malicious breach of anti- bribery and anti-corruption and other anti-financial crime laws Description The Group is subject to various anti-corruption laws and regulations and other anti-financial crime laws including but not limited to those relating to tax evasion, money laundering, terrorist financing and bribery (Anti-Corruption Laws, including the UK Proceeds of Crime Acts (POCA)). All employees of BAT, its subsidiaries and joint ventures which it controls are expected to uphold a high standard of corporate behaviour and comply with the Group Standards of Business Conduct (SoBC) which includes a requirement to comply with Anti-Corruption Laws. Employees, associates, suppliers, distributors and agents are prohibited from engaging in improper conduct to obtain or retain business or to improperly influence (directly or indirectly) a person working in an official capacity to decide in the Group’s favour. The Group’s employees, contractors and service providers may fail to comply with our SoBC and/or may violate applicable Anti-Corruption Laws. From time to time, the Group investigates, and becomes aware of governmental authorities’ investigations into, allegations of misconduct, including allegations of corruption at Group companies. Some of these allegations are currently being investigated. The Group cooperates with the authorities where appropriate. Please refer to note 24 on page 272 in the Notes on the Accounts. Please refer to note 31 on page 286 in the Notes on the Accounts for details of contingent liabilities applicable to the Group. Impact Failure of the Group to comply with anti-corruption laws and regulations and other anti-financial crime laws, or to deploy and maintain robust internal policies, procedures and controls may and have resulted in significant fines and penalties (reducing the Group’s ability to reinvest in the future), a share price impact, criminal and/or civil sanctions against the Group and its officers and employees, increased costs, prohibitions or other limitations or requirements (e.g. compliance requirements) on the conduct of the Group’s business and reputational harm (including negative perceptions of the Group’s governance and our ESG credentials), and may subject the Group to claims for breach of such regulations. The occurrence of any of the above effects could in turn have an adverse effect on the Group’s results of operations and financial condition and cause the Group to fail to deliver on its strategic growth plans. Even when proven untrue, there are often financial costs, time demands and reputational impacts associated with investigating and defending against such claims. BAT Annual Report and Form 20-F 2023 Strategic Report Governance Report Financial Statements Other Information 367
Legal, Regulatory and Compliance Risks continued Risk: Imposition of sanctions under sanctions regimes or similar international, regional or national measures Description National, international and supra-national sanctions regimes or similar international, regional or national measures are complex and dynamic and may affect territories in which the Group operates or third parties with which it may have commercial relationships. There may be unintended or malicious breaches of sanctions due to inappropriate or negligent behaviour by BAT employees, contractors, customers, suppliers or service providers. Operations in countries and territories subject to sanctions expose the Group to the risk of significant financial costs and disruption in operations that may be difficult or impossible to predict or avoid or the activities could become commercially and/or operationally unviable. In particular, the Group has operations in Cuba, which is subject to various sanctions in the United States. From time to time, the Group investigates, and becomes aware of governmental authorities’ investigations into, allegations of misconduct, including alleged breaches of sanctions at Group companies. Some of these allegations are currently being investigated. The Group cooperates with the authorities, where appropriate. In 2023, the Group reached settlement agreements with the DOJ and OFAC in the United States related to breaches of sanctions related to North Korea, which resulted in the imposition of fines against the Group totalling US$635 million. Sanctions can be imposed quickly with the possibility of further territories the Group operates in becoming subject to sanctions at short notice. National, international and supra-national sanctions regimes may also affect third parties with which the Group has commercial relationships, e.g. through their banks (including possible risk aversion to being associated with a sanctioned territory), and could lead to supply and payment chain disruptions. Please refer to note 31 on page 286 in the Notes on the Accounts for details of contingent liabilities applicable to the Group. Impact As a result of the limitations imposed by sanctions, it may become commercially and/or operationally unviable for the Group and/or its critical business partners to operate in certain territories or execute transactions related to them and the Group may be required to exit existing operations in such territories. The Group may also experience difficulty in sourcing materials or importing products, repatriating currency from a sanctioned country and finding financial institutions willing to transact with it, any of which may expose the Group to increased costs. In addition, the costs of complying with sanctions may increase as a result of new, or changes to existing, sanctions regimes. In addition to the settlement agreements reached by the Group with the DOJ and OFAC in the United States, as detailed above, any future failure of the Group to comply with sanctions regimes or similar international, regional, national or supra-national measures, or to deploy and maintain robust internal policies, procedures and controls, could result in additional fines and penalties (reducing the Group’s ability to reinvest in the future), a share price impact, criminal and/or civil sanctions against the Group and its officers and employees, increased costs, prohibitions or other limitations or requirements (e.g. compliance requirements) on the conduct of the Group’s business, reputational harm (including negative perceptions of the Group’s governance or our ESG credentials), and damage to commercial or banking relationships, and may subject the Group to claims for breach of such regimes or measures. Reputational harm (including negative perceptions of the Group’s governance and our ESG credentials) may result regardless of whether the Group complies with imposed sanctions. The occurrence of any of the above effects could in turn have an adverse effect on the Group’s results of operations and financial condition and cause the Group to fail to deliver on its strategic growth plans. Even when proven untrue, there are often financial costs, time demands and reputational impacts associated with investigating and defending against such claims. Risk: Failure to uphold New Categories marketing practices Description The regulatory landscape is constantly evolving with marketing practices being different in key New Categories markets. The Group’s marketing activities may be found to be, or alleged (including in the media) to be, non-compliant with laws and regulations, or with the International Marketing Principles (IMPs) on the marketing and sale of tobacco and nicotine products to consumers such as age verification measures. On-line activities can also be found to be, or alleged to be, aimed at consumers in a country where such activities are not permitted. Impact The Group is and may in the future be subject to claims for breach of marketing practices. In particular, national authorities (such as the FDA), organisations or even individuals may allege that our marketing activities do not comply with the relevant laws and regulations, or with our IMPs. As such, the Group could be subject to liability and costs as well as regulatory sanctions, fines and penalties brought in connection with these allegations. Even when proven untrue, there are often financial costs and reputational impacts in defending against such claims and allegations. Future breaches may lead to a loss of investor confidence in ESG performance and inability to meet our responsible marketing focus area if our IMPs are not followed, impacting our corporate purpose of delivering harm reduction. BAT Annual Report and Form 20-F 2023 Strategic Report Governance Report Financial Statements Other Information Other Information Group Risk Factors Continued 368
Risk: Loss or misuse of personal data through a failure to comply with the European General Data Protection Regulation, the UK Data Protection Act 2018, e-Privacy Laws and other privacy legislation governing the processing of personal data. Description Personal data is a subset of data (which is likely to be confidential) which attracts different risks and treatment under applicable law. Breaches of data privacy laws include misuse of information which may not be confidential in nature. These include, for example, unsolicited marketing calls to a publicly available number, or using an individual’s personal data in a way which was not authorised or in a way that the individual did not reasonably expect through technologies such as online tracking or monitoring. Various privacy laws, including the European General Data Protection Regulation (GDPR), UK Data Protection Act 2018 (UKDPA) and e-Privacy Directive, including EU and UK Regulatory guidances (e-Privacy Laws), govern the way in which organisations (such as employees, contractors, service provider colleagues and other authorised persons) handle individuals’ personal data including how such organisations, including the Group, track or monitor their online behaviour. Unintended or malicious breaches of data privacy laws may occur through inappropriate or negligent behaviour by BAT employees, contractors, service providers or others. Depending on the risk to the individuals concerned, such breaches of data privacy laws (including mass personal data unavailability) could trigger a formal notification to a local data protection supervisory authority. This, in turn, could subject Group companies to not only regulatory scrutiny but also individual claims or even class action suits; and ePrivacy Laws state that any misuse of consumer personal data or lack of transparency provided to consumers on how we use their data or track their online behaviours are subject to regulatory scrutiny. Legal requirements relating to the collection, storage, handling, and transfer of personal data continue to evolve. Following the entry into force of the GDPR in May 2018, other jurisdictions in which the Group operates have enacted similar local legislation such as the California Consumer Privacy Act U.S. and the “LGPD” in Brazil which further increases the risks surrounding the processing of personal data especially in the consumer space. As part of the Group's digital transformation, initiatives, in particular related to New Categories, could further increase these risks as the expectation is that the exposure to consumer data volumes will increase as well. With the emergence of AI technologies, these risks (particularly, personal data misuse in the context of automated decision making by leveraging AI) may even be exacerbated. Impact Failure to comply with existing or future e-Privacy Laws and privacy legislation governing the processing of personal data may adversely impact the Group’s results of operations and financial condition. Loss or unlawful use of personal data may result in civil or criminal legal liability and prosecution by enforcement bodies, which may subject the Group to the imposition of material fines (currently up to 4% of Group worldwide turnover in the context of the EU GDPR and/or the UK Data Protection Act) and/or penalties and/or claims and costs associated with defending these claims (which could include class action suits brought by consumers). The Group’s officers and employees may also be subject to personal criminal sanctions in certain jurisdictions. Reputational damage could also potentially cause significant harm to the Group, including negative perceptions of the Group’s governance and our ESG credentials. Relevant data protection supervisory authority could also order certain Group legal entities to cease processing activities, which could result in a significant operational disruption. Regulatory interest may also prompt interest from other compliance authorities/ governments, leading to further regulation or proceedings. The occurrence of any of the above effects could in turn have an adverse effect on the Group’s results of operations and financial condition and cause the Group to fail to deliver on its strategic growth plans. BAT Annual Report and Form 20-F 2023 Strategic Report Governance Report Financial Statements Other Information 369
Economic and Financial Risks Risk: Foreign exchange rate exposures Description The Group’s reporting currency is the pound sterling. The Group is exposed to the risk of fluctuations in exchange rates affecting the translation of net assets and earned profits of overseas subsidiaries into the Group’s reporting currency. These translational exposures are not normally hedged. Exposures also arise from the foreign currency denominated trading transactions undertaken by subsidiaries and dividend flows. Where not offset by opposing flows, these exposures are generally hedged according to internal policies, but hedging of exposure to certain currencies might not be possible due to exchange controls, limited currency availability or prohibitive costs, and errors in hedging may occur. Monetary policy divergence in relation to interest rates between key markets may also increase these risks. Impact During periods of exchange rate volatility, the impact of exchange rates on the Group’s results of operations and financial condition can be significant. Fluctuations in exchange rates of key currencies against the pound sterling may result in volatility in the Group’s reported earnings per share, cash flow and balance sheet. Furthermore, the dividend paid by the Group may be impacted if the payout ratio is not adjusted. Differences in translation between earnings and net debt may also affect key ratios used by credit rating agencies, which may have an adverse effect on the Group’s credit ratings. In addition, volatility and/or increased costs in the Group’s business due to transactional foreign exchange rate exposures may adversely affect operating margins and profitability and attempts to increase prices to offset such increases could adversely impact sales volumes. The increased volatility observed in recent years in commodity and hydrocarbon prices has contributed to additional volatility of exchange rates, impacting the financial performance of the Group's subsidiaries. The global dynamic backdrop of monetary tightening, inflation cycle and economic performance may also increase the exchange rate risk in short term. Risk: Inability to obtain price increases and exposure to risks from excessive price increases and value chain erosion Description Annual price increases by the Group are among the key drivers in increasing market profitability. However, the Group has in the past been, and may in the future be, unable to obtain such price increases as a result of increased regulation; increased competition from illicit trade; stretched consumer affordability arising from deteriorating political and economic conditions and rising prices; sharp increases or changes in excise structures; and competitors’ pricing. As the New Categories market continues to develop, the Group may face erosion in the value chain for New Categories through lower market prices, excise taxes, high retail trade margins or high production costs that make New Categories less competitive versus combustible tobacco products. As an example, excise on Tobacco Heated Products in Japan increased and aligned closer to FMC following a five-year (2018-2022) phased excise plan. This led to a decrease in our profitability in Japan. In addition, the Group faces the risk that price increases it has conducted in the past, and may conduct in the future, may be excessive and not find adequate adult tobacco consumer acceptance. Impact If the Group is unable to obtain price increases or is adversely affected by impacts of excessive price increases, it may be unable to achieve its strategic growth metrics, have fewer funds to invest in growth opportunities, and, in the case of excessive price increases, be faced with quicker reductions in sales volumes than anticipated due to accelerated market decline, down-trading (switching to a cheaper brand) and increased illicit trade. These in turn impact the Group’s market share, results of operations and financial condition and cause the Group to fail to deliver on its strategic growth plans. In addition, erosion in the value chain for New Categories could have a negative impact on the Group’s sales volume or pricing for these products. High excise could dampen demand for New Categories or result in lower profit margins. Lower market prices, high retail trade margins or increases in production costs could also negatively impact profit margins or lead to uncompetitive pricing. BAT Annual Report and Form 20-F 2023 Strategic Report Governance Report Financial Statements Other Information Other Information Group Risk Factors Continued 370
Risk: Effects of declining consumption of legitimate tobacco products and a tough competitive environment Description Evidence of market contraction and the growth of illicit trade of tobacco products is apparent in several key global markets in which the Group operates. This decline is due to multiple factors, including increases in excise taxes leading to continuous above-inflation price rises, changes in the regulatory environment, the continuing difficult economic environment in many countries impacting consumers’ disposable incomes, the increase in the trade of illicit tobacco products, rising health concerns, a decline in the social acceptability of smoking and an increase in New Category uptake. The Group competes based on the strength of its strategic brand portfolio, product quality and taste, brand recognition, brand loyalty, taste, innovation, packaging, service, marketing, advertising and price. The Group is subject to highly competitive environments in all aspects of its business, and its competitive position can be significantly influenced by the prevailing economic climate, consumers’ disposable income, regulation, competitors’ introduction of lower-price or innovative products, higher tobacco product taxes, higher absolute prices, governmental action to increase minimum wages, employment costs, interest rates and increase in raw material costs. Furthermore, the Group is subject to substantial payment obligations under the State Settlement Agreements, which adversely affect the ability of the Group to compete in the U.S. with manufacturers of deep-discount cigarettes that are not subject to such substantial obligations. Impact Any future decline in the demand for legitimate tobacco products could have an adverse effect on the Group’s results of operations and financial conditions and cause the Group to fail to deliver on its strategic growth plans. In a tough competitive environment, factors such as market size reduction, customer down-trading, illicit trade and competitors aggressively taking market share through price re-positioning or price wars generally reduce the overall profit pool of the market and may impact delivery of the Group’s profits. This may also lead to a decline in sales volume, loss of market share, impact delivery of the Group’s ESG agenda, erosion of its portfolio mix and reduction of funds available for investment in growth opportunities. Risk: Funding, liquidity and interest rate risks Description The Group cannot be certain that it will have access to bank financing or to the debt and equity capital markets at all times and is therefore subject to funding and liquidity risks. In addition, the Group’s access to funding may be affected by restrictive covenants to which it is subject under some of its credit facilities. Furthermore, failure to appropriately engage with investors’ and lenders’ sustainability criteria and concerns may impact BAT’s credit ratings, access to funding, or may result in an increase in the cost of funding. The Group is also exposed to increases in interest rates in connection with both existing floating rate debt and future debt refinancings. Recently, after an extended period with historically low interest rates, interest rates have increased substantially and may further increase in the future. Furthermore, the Group operates in several markets closely regulated by governmental bodies that intervene in foreign exchange markets by imposing limitations on the ability to transfer local currency into foreign currency and introducing other currency controls that expose cash balances to devaluation risks or that increase costs to obtain hard currency. As a result, the Group’s operational entities in these markets may be restricted from using End Market cash resources to pay for imported goods, dividend remittances, interest payments and royalties. The inability to access End Market cash resources in certain markets contributes to the Group’s funding and liquidity risks. Compliance with sanctions and the restrictive policies of banks to facilitate transactions that are sanctions sensitive, can also restrict the ability to transfer and use cash that is sanctions sensitive. Anti-money laundering legislation can lead to additional restrictions relating to the payment and receipt of funds for both BAT as well as its business partners. In addition, the Group's further development into the cannabis sector may lead to inaccessible proceeds from this activity, and such activity may expose the Group to further regulatory and legal risks due to different local and international laws. The Group may also face reputation and compliance issues due to various levels of acceptance of the cannabis sector by stakeholders which may restrict bank and/or investor access. Impact Adverse developments in the Group’s funding, liquidity and interest rate environment may lead to shortages of cash and cash equivalents needed to operate the Group’s business and to refinance its existing debt. Inability to fund the business under the Group’s current capital structure, failure to access funding and foreign exchange or increases in interest rates may also have an adverse effect on the Group’s credit rating, which would in turn result in further increased funding costs and may require the Group to issue equity or seek new sources of capital. Although the Group currently benefits from investment grade ratings from Moody's, S&P and Fitch in 2022, S&P revised its outlook from stable to negative and maintained this outlook for 2023 as well. Any downgrade of the Group's credit ratings or loss of investment grade status could materially increase the Group's financing costs. Non-compliance with the Group’s covenants under certain credit facilities could lead to an acceleration of its debt. All these factors may have material adverse effects on the Group’s results of operations and financial conditions and cause the Group to fail to deliver on its strategic growth plans. These conditions could also lead to underperforming bond prices and increased yields. In the case of funding or liquidity constraints, the Group may also suffer reputational damage due to its perceived failure to manage the financial risk profile of its business, which may result in an erosion of shareholder value reflected in an underperforming share price, and/or underperforming bond prices and higher yields. In addition, the Group’s ability to finance strategic opportunities or respond to threats may be impacted by limited access to funds. BAT Annual Report and Form 20-F 2023 Strategic Report Governance Report Financial Statements Other Information 371
Economic and Financial Risks continued Risk: Failure to achieve growth through mergers, acquisitions, joint ventures, investments and other transactions Description The Group’s growth strategy includes a combination of organic growth as well as mergers, acquisitions, joint ventures and investments. The Group may be unable to acquire or invest in attractive businesses on favourable terms and may inappropriately value or otherwise fail to identify or capitalise on growth opportunities. The Group may not be able to deliver strategic objectives and revenue improvements from business combinations, successfully integrate businesses it acquires or establishes, or obtain appropriate regulatory approvals for business combinations. Risks from integration of businesses also include the risk that the integration may divert the Group’s focus and resources from its other strategic goals. Furthermore, transactions may include risks associated with an unpredictable regulatory landscape, such as bans or more restrictive regulations which come into force after the acquisition. Additionally, the Group could be exposed to financial, legal or reputational risks if it fails to appropriately consider and address any compliance, antitrust or sustainability aspects of a transaction or planned transaction. Further, the Group has certain uncapped indemnification obligations in connection with divestitures and could incur similar obligations in the future. Impact Any of the foregoing risks could result in increased costs, decreased revenues or a loss of opportunities and have an adverse effect on the Group’s results of operations and financial condition, and in the case of a breach of compliance, product regulation or antitrust regulation, could lead to reputational damage, fines and potentially criminal sanctions and an adverse impact on the Group's sustainability priorities. This may impact the Group's ability to compete in the long-term. Inability to execute planned divestments, or poorly executed divestments, may not deliver fair value, or may result in loss of potential sale proceeds resulting in fewer resources to drive quality growth or meet other corporate targets. The Group may become liable for claims arising in respect of conduct prior to any merger or acquisition of businesses if deemed to be a successor to the liabilities of the acquired company or indemnification claims relating to divestitures, and any resulting adverse judgment against the Group may adversely affect its results of operations and financial condition and cause the Group to fail to deliver on its strategic growth plans. Please refer to note 31 on page 286 in the Notes on the Accounts for details of contingent liabilities applicable to the Group. Risk: Unforeseen underperformance in key global markets Description A substantial majority of the Group’s profit from operations is based on its operations in certain key markets, including the U.S. A number of these markets are declining for a variety of factors, including price increases, restrictions on advertising and promotions, smoking prevention campaigns, increased pressure from anti-tobacco groups, accelerated migration to reduced risk products, increasing prevalence of non-compliant New Categories competitors, and private businesses adopting policies that prohibit or restrict, or are intended to discourage, smoking and tobacco use. Economic and political factors affecting the Group’s key markets include the prevailing economic climate, governmental austerity measures, levels of employment, inflation, governmental action to increase minimum wages, employment costs, interest rates, raw material costs, consumer confidence and consumer pricing. Impact Any change to the economic and political factors in any of the key markets in which the Group operates could affect consumer behaviour and have an impact on the Group’s results of operations and financial condition and cause the Group to fail to deliver on its strategic growth plans. Risk: Increases in net liabilities under the Group’s retirement benefit schemes Description The Group currently maintains and contributes to defined benefit pension plans and other post-retirement benefit plans that cover various categories of employees and retirees worldwide. The Group’s obligations to make contributions under these arrangements may increase in the case of increases in pension liabilities, decreases in asset returns, salary increases, inflation, decreases in long-term interest rates, increases in life expectancies, changes in population trends and other actuarial assumptions. Please refer to the information under the caption ‘Retirement benefit schemes’ on page 217 and to note 15 on page 248 in the Notes on the Accounts for details of the Group’s retirement benefit schemes. Impact Higher contributions to the Group’s retirement benefit schemes could have an adverse impact on the Group’s results of operations, financial condition and ability to raise funds and cause the Group to fail to deliver on its strategic growth plans. BAT Annual Report and Form 20-F 2023 Strategic Report Governance Report Financial Statements Other Information Other Information Group Risk Factors Continued 372
Product pipeline, commercialisation and Intellectual Property risks Risk: Inability to predict consumers’ changing behaviours and launch innovative products that offer adult tobacco and nicotine consumers meaningful value-added differentiation Description The Group focuses its research and development activities on both creating new products, including New Categories and Beyond Nicotine products, whilst maintaining and improving the quality of its existing products. In a competitive market, the Group believes that innovation is key to growth. The Group considers that one of its key challenges in the medium and long term is to provide adult tobacco and nicotine consumers with high-quality products that take into account their changing preferences and expectations, including those in relation to sustainability, while complying with evolving regulation. Predicting consumers’ changing needs and behaviours across categories is a critical requirement for the Group's development. The Group may fail to predict consumers' changing needs and behaviours across categories and fail to deliver its strategy effectively. The Group continues to develop and roll-out its New Categories portfolio which requires significant investment. The Group may be unsuccessful in developing and launching innovative products or maintaining and improving the quality of existing products across Combustibles, New Categories and Beyond Nicotine that offer consumers meaningful value-added differentiation. The Group may fail to keep pace with innovation in its sector or changes in consumer expectations and is also exposed to the risk of an inability to build a sufficiently strong brand equity through social media and other digital tools to successfully compete. There are potential bans and restrictions in key markets on using social media to advertise and communicate. Competitors may be more successful in predicting changing consumer behaviour or better able to develop and roll-out consumer-relevant products and may be able to do so more quickly and at a lower cost. In addition, the Group devotes considerable resources to the research and development of innovative products that may have the potential to reduce the risks of smoking-related diseases. The complex nature of research and development programmes necessary to satisfy emerging regulatory and scientific requirements creates a substantial risk that these programmes will fail to demonstrate health-related claims regarding New Categories and Beyond Nicotine or to achieve adult tobacco consumer, regulatory and scientific acceptance. Furthermore, the regulatory environment impacting Non-Combustible tobacco products, Vapour products and other non-tobacco nicotine products and Beyond Nicotine, including classification of products for regulatory and excise purposes, is still developing and it cannot be predicted whether regulations will permit the marketing of such products in any given market in the future. Categorisation as medicines, for example, and restrictions on advertising could stifle innovation, increase complexity and costs and significantly undermine the commercial viability of these products. Alternatively, categorisation of any New Categories, as tobacco products for instance, could result in the application of onerous regulation, which could further stifle uptake. Impact The inability to timely develop and roll out innovations or products in line with consumer demand, including any failure to predict changes in adult tobacco consumer and societal behaviour and expectations and to fill gaps in the product portfolio, as well as the risk of poor product quality, could lead to missed opportunities, under- or over-supply, loss of competitive advantage, unrecoverable costs and/or the erosion of the Group’s consumer base or brand equity. Restrictions on packaging and labelling or on promotion and advertising could impact the Group’s ability to communicate its innovations and product differences to adult tobacco consumers, leading to unsuccessful product launches. An inability to provide robust scientific results sufficient to substantiate health-related product claims poses a significant threat to the ability to launch innovative products and comply with emerging regulatory and legal regimes. The occurrence of any of the above effects could in turn have an adverse effect on the Group’s results of operations and financial condition and cause the Group to fail to deliver on its strategic growth plans. In addition, there may be loss of investors’ confidence in ESG performance, including failure to deliver our corporate purpose of harm reduction. BAT Annual Report and Form 20-F 2023 Strategic Report Governance Report Financial Statements Other Information 373
Product pipeline, commercialisation and Intellectual Property risks continued Risk: Exposure to risks associated with intellectual property rights, including the failure to identify, protect and prevent infringement of the Group’s intellectual property rights and potential infringement of, or the failure to retain licences to use, third-party intellectual property rights Description The Group relies on trademarks, patents, registered designs, copyrights, domain names and trade secrets. The brand names under which the Group’s products are sold are key assets of its business. The protection and maintenance of these brand names and of the reputation of these brands is important to the Group’s success. Protection of intellectual property rights is also important in connection with the Group’s innovative products, including New Categories. The Group is exposed to the risk of infringements of its intellectual property rights by third parties due to limitations in judicial protection, failure to identify, protect and register its innovations and/or inadequate enforceability of these rights in some markets in which the Group operates. The Group currently is involved in various patent infringement litigation proceedings in several countries related to the Group’s New Categories inventions and products. This litigation involves both claims by the Group that competitors are infringing the Group’s patents and claims by competitors that the Group is infringing competitors’ patents. From time to time, the Group settles such litigation. In February 2024, a Group subsidiary entered into a settlement agreement with an indirect wholly-owned subsidiary of Philip Morris International Inc. (PMI). Pursuant to this agreement (the Settlement Agreement), among other things, both parties agreed to take all actions, as necessary, to dismiss certain pending legal proceedings between the parties and certain of their affiliates concerning certain Vapour and Heated Products (HP) with prejudice and without admission of liability, to fully and finally discharge without admission of liability any injunctions granted to the parties and their respective affiliates in such proceedings, and mutually release each other from presently known and past, present and future claims arising out of or relating to, among other things, such proceedings, the infringement of the patents at issue in the proceedings and certain intellectual property rights relating to certain products existing on or before a specified date. The parties have also agreed to covenants not to sue, on a perpetual, royalty-bearing or royalty-free basis, as the case may be, in respect of patents associated with certain existing or changed Vapour or HP products. The parties have also agreed to covenants not to sue on a perpetual, royalty free basis and in respect of, among other things, the manufacture of products, accessories, replacement parts and upgrade parts, or their respective components, and research and development of such products, accessories and parts, or their respective components. Please refer to note 31 on page 286 in the Notes on the Accounts for details of contingent liabilities relating to patent litigation and related settlements applicable to the Group. Some brands and trademarks under which the Group’s products are sold are licensed for a fixed period of time in certain markets. If any of these licences are terminated or not renewed after the end of the applicable term, the Group would no longer have the right to use, and to sell products under, those brand(s) and trademark(s). In addition, as third party rights are not always identifiable, the Group may be subject to claims for infringement of third party intellectual property rights. Impact Any erosion in the value of the Group’s brands or innovations, or failure to obtain or maintain adequate protection of intellectual property rights for any reason, or the loss of brands, trademarks or other intellectual property rights under licence to Group companies, may have a material adverse effect on the Group‘s market share, results of operations and financial condition. Any inability to appropriately protect the Group’s products and key innovations will also limit its growth and affect competitiveness and return on innovation investment. Any infringement of third-party intellectual property rights could result in interim or final injunctions, product recalls, legal liability and the payment of damages, any of which may disrupt operations, negatively impact the Group’s reputation and have an adverse effect on its results of operations and financial condition and cause the Group to fail to deliver on its strategic growth plan. Litigation (even where successful) results in an intensive use of resources and management time leading to potential disruption. In addition, although intellectual property-related settlements, such as the Settlement Agreement, allow the Group to focus on developing innovative product solutions, they could also have an adverse effect on the Group’s results of operations and financial condition. For example, the payment of royalties would create higher costs for the Group, whereas the grant of licenses and/or covenants not to sue could result in a competitive advantage of the Group’s competitors which, in turn, could result in lower demand for the Group’s own products and cause the Group to fail to deliver on its strategic growth plans. BAT Annual Report and Form 20-F 2023 Strategic Report Governance Report Financial Statements Other Information Other Information Group Risk Factors Continued 374
Overview The Group’s businesses operate under increasingly stringent regulatory regimes worldwide. The tobacco and nicotine industry is one of the most highly regulated in the world, with manufacturers required to comply with a variety of different regulatory regimes across the globe. The Group continues to respond to these regimes and engages with governments and other regulatory bodies to find solutions to changing regulatory landscapes. Restrictions on the manufacture, sale, marketing and packaging of tobacco and non-tobacco nicotine products are in place in nearly all countries and markets. Regulation can typically be categorised as follows: Category Bans: including regulations that ban the sale, import, possession, or use of certain product categories, including entire bans on New Category or novel products; Place: including regulations restricting smoking and vaping in private, public and work places (e.g. public place smoking and vaping bans); Product: including regulations on the use of ingredients, product design and attributes (e.g. machine measured ceilings regarding tar, nicotine and carbon monoxide yields for cigarettes and restrictions on nicotine strength for non-tobacco nicotine products, as well as restrictions on flavours); product safety regulations (e.g. the EU’s General Product Safety Directive (2001/95/EC), electrical safety regulations and reduced ignition propensity standards for cigarettes); regulatory product disclosure requirements (e.g. in relation to ingredients and emissions); and bans of entire product categories (e.g. bans on the manufacture, import, and sale, of Non-Combustible tobacco products or non- tobacco nicotine products); Packaging and labelling: including regulations on health warnings and other government-mandated messages (e.g. in respect of content, positioning, size and rotation); restrictions on the use of certain descriptors and brand names; requirements on pack shape, size, weight and colour and plain packaging of products; and marking requirements relating to single-use plastics; Sponsorship, promotion and advertising: including partial or total bans on tobacco and/or non-tobacco nicotine product advertising, marketing, promotions and sponsorship and restrictions on brand sharing and stretching (the latter refers to the creation of an association between a tobacco product and a non-tobacco product by the use of tobacco branding on the non-tobacco product); Purchase: including regulations on the manner in which tobacco products and non-tobacco nicotine products are sold, such as type of outlet (e.g. supermarkets and vending machines); how they are sold (e.g. above-the-counter versus beneath-the-counter); and restrictions on adult purchase (e.g. generational bans which preclude the sale and supply of tobacco products to individuals born after a certain year); Price: including regulations which have implications for the prices that manufacturers can charge for their tobacco products and non-tobacco nicotine products (e.g. excise taxes and minimum prices); and Responsibility: including regulations introducing Extended Producer Responsibility schemes on cigarette manufacturers to cover the cost to clean up cigarette waste (see Single Use Plastics Directive (EU) 2019/904); and equipment-related cost sharing obligations to fight illicit trade (see Article 15.7 of EU Tobacco Products Directive 2014). In addition, the Group operates a number of global policies, and in some cases its businesses have also entered into voluntary agreements, which may impose more onerous obligations or standards than those imposed by local legislation. World Health Organization Framework Convention on Tobacco Control Much of the recent development in regulation at a global level has been driven by the World Health Organization Framework Convention on Tobacco Control (FCTC). The FCTC came into force in 2005 and contains provisions aimed at, among other things, reducing tobacco consumption and exposure to tobacco smoke. The original treaty is supplemented by one protocol (on illicit trade) and guidelines on the implementation of several of the treaty obligations. While the guidelines are not legally binding, they provide recommendations for Parties on the implementation of specific provisions of the FCTC. To date, the FCTC has been ratified by 183 countries, not including the U.S. The FCTC has led to increased efforts by tobacco control advocates and public health organisations to encourage governments to further regulate the tobacco and nicotine industry. As national regulations increasingly reflect global influences, the scope of areas regulated will likely further expand. The guidelines on advertising, promotion, and sponsorship, for example, seek to broaden the definition of tobacco advertising to include product display, the use of vending machines as well as the design of the pack itself. Where adopted by the Parties, a number of the measures referred to in the guidelines may result in either additional costs for the tobacco industry or restrictions on a manufacturer’s ability to differentiate its products and communicate those differences to adult smokers. The World Health Organization and other public health organisations have recently focused their efforts on attempting to widen the scope of the FCTC beyond the text of the Convention to include Reduced Risk Products (RRPs1), including adopting a decision that tobacco heated products (THPs) should be subject to the FCTC; recommending that governments adopt stricter regulations of RRPs; and applying existing cigarette regulations to RRPs. All engagement efforts of the tobacco industry are being closely monitored by these organisations and are often (incorrectly) labelled as unlawful industry interference. In turn, this has an impact on the willingness of Parties to engage with the industry, which limits the opportunity for the industry to provide input into the development of regulation. The last biannual session of the Conference of the Parties to the FCTC took place in November 2021 (COP9). Due to the virtual nature of the meetings most substantive discussions have however been postponed to COP10, which was scheduled to take place in November 2023 in Panama, but was postponed until February 2024 due to internal security and organisational concerns in Panama (save for a de minimis budget focused meeting). EU Tobacco and Related Products Directive (2014/40/EU) A revised EU Tobacco and Related Products Directive (2014/40/ EU) (TPD2) was adopted in April 2014 for transposition into EU Member States’ law by May 2016. Provisions of TPD2 include: large combined pictorial and textual health warnings covering 65% of the two main pack surfaces (front and back) for cigarettes; restrictions on pack shape and size, including minimum pack sizes of 20 sticks for cigarettes and 30g for roll-your-own and make- your-own tobacco; ingredients reporting; “tracking and tracing” requirements; and for e-cigarettes: nicotine limits, pre-market notification, ingredients reporting and advertising restrictions. Among other things, TPD2 bans the sale of cigarettes and roll- your-own tobacco with a characterising flavour. Enforcement of the ban in relation to menthol-flavoured cigarettes was delayed until May 2020, but those products are now also banned (see “Regulation of Ingredients, Including Flavoured Tobacco Products and RRPs”). TPD2 seeks to ensure that the same rules apply in the same way across all EU Member States, but it leaves open to individual Member States the possibility of further standardising the packaging of tobacco products and applying other requirements not regulated by TPD2, provided these are compatible with EU law. BAT Annual Report and Form 20-F 2023 Strategic Report Governance Report Financial Statements Other Information Regulation of the Group’s Business 375
The European Commission published its Article 28 report on the application of TPD2 on 20 May 2021. The report concluded that TPD2 helped decrease smoking rates and tobacco use but that more efforts are needed, particularly in relation to enforcement at national level and new market developments, such as novel tobacco products. Currently, the preparations of a revised EU Tobacco Products Directive are progressing, with estimated adoption in 2025. TPD2 might be replaced with a directly applicable regulation instead of a directive, following which transposition in Member States would no longer be required. It is anticipated that this new directive or regulation will include the following provisions: plain packaging for combustibles; more regulation of ingredients, including a ban on the use of any menthol for combustibles at the EU level; regulation of flavours and nicotine-free liquids for e-cigarettes at the EU level; more stringent advertising restrictions for e-cigarettes; stricter regulations for THPs; and regulation of oral nicotine pouches at the EU level. Single-Use Plastics The Single Use Plastics Directive (EU) 2019/904 (the SUP Directive) entered into force on 2 July 2019. The SUP Directive requires that EU Member States introduce Extended Producer Responsibility (EPR) schemes covering the cost to clean up litter and the application of on-pack marking requirements for tobacco product filters. Member States had to transpose the SUP Directive into national law by 3 July 2021, with an implementation deadline of 3 July 2021 for pack marking requirements and of 5 January 2023 for EPR schemes. Member States are late on transposition and implementation, with the practical consequence that EPR schemes will go live with several months delays on average. The European Commission is also late in its issuance of guidelines on the criteria for the costs of cleaning up litter, which should have been issued prior to the anticipated implementation deadline for EPR schemes. France was the only Member State to not await the 5 January 2023 deadline and, in December 2020 and February 2021, it implemented EPR schemes for, among others, cigarette manufacturers. These regulations are currently being challenged before the French Council of State. Other governments have passed or are considering similar legislation including Canada, Russia, South Korea, and various levels of government in the U.S. Restrictions on Smoking in Private, Public and Workplaces The Group operates in a number of markets which have in place restrictions on smoking and vaping in certain private, public and workplaces, including restaurants, bars, beaches and nightclubs. While these restrictions vary in scope, extensive public and workplace smoking and vaping bans have been enacted in markets including the U.S., Canada, the UK, France, Spain, New Zealand and Australia. Restrictions on smoking and vaping in private have also been adopted or proposed, and typically take the form of prohibitions on smoking and vaping in cars or residential homes when children are present, and/or smoking and vaping within a certain distance from specified public places (such as primary schools). Regulation of Ingredients, Including Flavoured Tobacco Products A number of countries have restricted or banned, and others are seeking to restrict or ban, the use of certain flavours or ingredients in cigarettes and other tobacco products, on the basis that such flavoured products are alleged to appeal disproportionally to minors, act as a catalyst for young people taking up smoking and/ or increase the addictiveness or toxicity of the relevant product. To the extent flavours are permitted, this is often restricted to tobacco and/or menthol flavours only. Such restrictions have been enacted in markets including the U.S., Canada, Australia and Türkiye. An ingredients ban in Brazil, which would ban the use of certain ingredients with flavouring or aromatic properties, including menthol, is not currently in force due to ongoing legal challenges. TPD2 similarly bans in the EU the manufacture and sale of cigarettes and roll-your-own tobacco with a characterising flavour other than tobacco. A number of the above regulations are subject to ongoing legal challenges (see “The U.S.” for information pertaining to the regulation of menthol in that market). Regulators in Europe are increasingly seeking to ban the use of flavours in Vapour products and other RRPs, except for non- tobacco and menthol (see “Reduced Risk Products”1). For example, Hungary, Finland, the Netherlands, Denmark and Norway have adopted, or are considering adopting, bills banning flavours in Vapour products. BAT is exploring its legal options in relation to these new regulations. The European Commission has also produced a Commission Delegated Directive (the "Delegated Directive") amending TPD2 to withdraw certain exemptions in respect of THPs. The Delegated Directive, which has now been transposed into national law in a number of Member States, extends the prohibition of tobacco products with a characterising flavour (which currently applies to cigarettes and hand rolling tobacco) to THPs. BAT is challenging the validity of the Delegated Directive in the High Court of Ireland which has determined to refer questions regarding the legality of the Delegated Directive to the Court of Justice of the European Union. Further legislation on ingredients, both for factory made cigarettes and RRPs1, is expected. The Conference of Parties to the FCTC tasked a working group to further elaborate the partial guidelines on the regulation of the contents of tobacco products and tobacco product disclosures (see Articles 9 and 10 of the FCTC). The work of this group was suspended in 2018 and an expert group was created to examine the reasons for low implementation of Articles 9 and 10, and related partial guidelines. This expert group presented its report in 2021, but the substantive discussions by the Conference of Parties of this report have been postponed to COP10 (see “World Health Organization Framework Convention on Tobacco Control”). Furthermore, several regulators in EU Member States have also taken action, or are considering taking action, to ban low menthol products, or products using other coolants, from the market. For example, in Belgium, the regulator banned all cigarettes and other tobacco products that include components with cooling and/or alleged analgesic effects. Plain and Standardised Packaging Plain (or “standardised”) packaging generally refers to a ban on the use of trademarks, logos and colours on packaging other than the use of a single colour and the presentation of brand name and variant in a specified font, size and location(s). The presentation of individual cigarettes may be similarly restricted. Plain packaging is high on the agenda of tobacco control groups, and the non-binding FCTC guidelines recommend that the Parties consider introducing plain packaging. As of 5 January 2024, 26 countries have implemented plain packaging (including Australia, Belgium, Canada, Denmark, France, Ireland, New Zealand, the Netherlands, Saudi Arabia, Singapore, Türkiye, and the UK), with a further nine countries examining legislation to introduce the measure. Countries, territories and states that are currently considering adopting plain packaging legislation include, but are not limited to, Argentina, India, Ecuador, Panama, Brazil, Chile, Spain and South Africa. Others, such as South Korea and Colombia, are considering implementing increased graphic health warnings. Also, RRPs are increasingly facing plain packaging regulations (see “Reduced Risk Products”1). Denmark fully implemented plain packaging for Vapour Products and Heated Products in 2022, followed by Finland in 2023, while legislation introducing plain packaging for Vapour Products is due to come into effect in Norway in 2024. Other countries which already require plain packaging for Heated Products include Canada and Israel. BAT Annual Report and Form 20-F 2023 Strategic Report Governance Report Financial Statements Other Information Other Information Regulation of the Group’s Business Continued 376
Product Display Bans at Point of Sale and Licensing Regimes Product display bans at point of sale and licensing regimes have become relatively commonplace for combustible tobacco products and have been implemented for several years in a number of countries both at national and state levels, including in Norway, Iceland, Finland, New Zealand, Thailand, Canada, Australia, and the UK. The Danish bill (referenced above) also introduced a product display ban for RRPs1. A large number of countries, such as Hungary, Finland and Spain, have also sought to restrict the supply of tobacco products, including through the adoption of licensing regimes limiting the number of retail outlets from which it is possible to purchase tobacco products and/or by prohibiting the sale of tobacco products within a certain distance of specified public places. Illicit Trade The illegal market for tobacco products is an increasingly important issue for governments and the industry across the world. Euromonitor International estimates that, in 2021, approximately 350 billion cigarettes (excl. China) were smuggled, manufactured illegally or counterfeited. A number of governments, regulators and organisations have or are considering adopting regulation to support anti-illicit trade activities. Among other forms, such regulation may comprise mandatory “tracking and tracing” requirements, enabling regulators to identify the point at which any seized product left the legal supply chain, security features to combat counterfeiting and inspection and authentication obligations in respect of seized product. The TPD2, for example, requires that all unit packets of tobacco are marked with a unique and irremovable identifier, which when scanned provides various information about that product’s route-to-market. In November 2012, the FCTC Parties adopted the Protocol to Eliminate Illicit Trade in Tobacco Products which includes a raft of supply chain control measures, including the implementation of “tracking and tracing” technologies. The Protocol entered into force on 25 September 2018 and was considered at the first session of the Meeting of the Parties to the Protocol in October 2018. The second session of the Meeting of the Parties to the Protocol took place in November 2021, and the third session is scheduled to take place in 2024 in Panama. As of 8 January 2024, 68 parties, including the EU, have ratified the Protocol. Reduced-Risk Products1 (“RRPs”) As the Vapour category has grown in size and complexity in a relatively short period of time, a consensus framework for regulation and taxation has yet to emerge. The TPD2, for example, establishes frameworks for the regulation of novel tobacco products and e-cigarettes, introducing nicotine limits, health warnings requirements, advertising bans and pre-market notification and post-market disclosure obligations. As noted above, the World Health Organization and other public health organisations have recently focused their efforts on attempting to widen the scope of the FCTC beyond the text of the Convention to include RRPs (see “World Health Organization Framework Convention on Tobacco Control”). In countries where the sale of Vapour products is permitted, governments are increasingly seeking to more strictly regulate these products, including by adopting or seeking to adopt bans on vaping in public places, bans or restrictions on flavours or other restrictions such as plain packaging and retail display and advertising bans. A number of governments have also announced plans to restrict the sale of single-use e-cigarettes. Conversely, some governments have expressly banned or are seeking to ban RRPs (such as Hong Kong), while others restrict their sale as medicinal products (such as Australia). Mexico has issued a series of decrees and more recently a law to ban the importation and sale of vaping products, including e-cigarettes, but legal challenges have been successful as tribunals found the absolute ban to be unconstitutional. Appeals by the government are ongoing. Also, other RRPs, such as nicotine pouches and THPs, are facing increasing scrutiny by regulators. In countries such as Belgium, Germany, and the Netherlands, regulators have sought to classify oral nicotine pouch products as food stuff, tobacco substitutes or medicinal products and ban these products from the market. The Belgian authorities, for example, first clarified that oral nicotine pouches should not be classified as medicinal products. However, nicotine pouches have now been banned in Belgium as impermissible tobacco substitutes. We expect tobacco-free nicotine pouches to be regulated at a European level as part of the next revision of the Tobacco Products Directive. In Germany and Hungary, THPs have faced being classified in the same way as traditional combustible tobacco products, with the potential consequence of facing the same restrictions and excise categories. However, in 2021, the Administrative Court of Braunschweig (Germany) concluded that THPs are smokeless because they do not involve a combustion process (Judgment of 23 September 20212). The federal German regulator did not appeal this judgment. Generational Bans A recent regulatory measure that some countries (such as the United Kingdom, Denmark, New Zealand and Malaysia) have considered or are currently considering involves the prohibition on sales and supply of tobacco and/or nicotine products to persons of a certain age that will follow them throughout their lifetime. This regulatory measure is referred to as a “generational ban” and entails that persons born on or after a certain date would never be able to lawfully be sold tobacco products. Over time, as more and more persons become subject to the ban, the pool of consumers for tobacco products would grow ever smaller. BAT is continuing to monitor this situation and whether other governments will follow suit with similar measures. Although the new government from New Zealand recently announced that the relevant act would be repealed, New Zealand had approved legislation banning anyone born after 1 January 2009 from buying tobacco products, imposing a retail limit of 600 retailers across New Zealand from 1 July 2024, and implement a nicotine limit in smoked tobacco to 0.8 mg/g (~5% of current levels) from 1 April 2025. In the meantime, the UK government has announced its intention to impose a similar generational ban preventing people born after 1 January 2009 from buying tobacco products, including THPs, when they come of age (18 years old). The consultation process is ongoing and a regulatory impact assessment should be published in due course. The U.S. Through the Reynolds American Inc. (RAI) subsidiaries, the Group is subject to U.S. federal, state, and local laws and regulations. The Family Smoking Prevention and Tobacco Control Act (FSPTCA), which was enacted in 2009, grants the U.S. Food & Drug Administration (FDA) broad authority over the manufacture, sale, marketing, and packaging of tobacco products but limited the Agency’s authority to cigarettes, smokeless tobacco products, cigarette tobacco and roll-your-own tobacco products. Key elements of the FSPTCA include: filing of facility registrations, product listing, constituent testing and ingredient information; obtaining the FDA's clearance for all new products and product modifications; banning all characterising flavours other than tobacco or menthol in cigarettes; establishing “user fees” to fund the FDA’s regulation of tobacco products; increasing the health warning size on cigarette packs with the option to introduce pictorial health warnings; implementing good manufacturing practices; revising the labelling and advertising requirements for smokeless tobacco products; and requiring the study of menthol. The U.S. Congress did limit the FDA’s authority in two areas, prohibiting it from: – Banning categories of tobacco products; and – Requiring the reduction of nicotine yields of a tobacco product to zero. BAT Annual Report and Form 20-F 2023 Strategic Report Governance Report Financial Statements Other Information 377
On 10 May 2016, the FDA issued a final regulation, referred to as the Deeming Rule, deeming all remaining products that are “made or derived from tobacco” to be subject to the FDA’s regulatory authority under the FSPTCA. The Deeming Rule became effective as of 8 August 2016, though each requirement of the Deeming Rule had its own compliance date. Such “deemed” tobacco products subject to the FSPTCA include, among others, electronic nicotine delivery systems (including e-cigarettes, e-hookah, e-cigars, vape pens, advanced refillable personal vapourisers, electronic pipes and e-liquids mixed in vape shops), certain dissolvable tobacco products, cigars, and pipe tobacco. The “grandfathered” (now called "pre-existing products") date under the Final Rule for newly deemed products remained the same as the “grandfathered” date for those tobacco products already subject to the FSPTCA – 15 February 2007 (known as “Pre-Existing Tobacco Products”). Any tobacco product that was not legally marketed as of 15 February 2007 is considered a new tobacco product subject to premarket review by the FDA. The FDA established a compliance policy allowing all newly deemed tobacco products that were on the market as of 8 August 2016 to remain on the market so long as the manufacturer filed a Premarket Tobacco Product Application (PMTA) by a specific deadline (9 September 2020). In October 2019, R. J. Reynolds Vapour Company filed PMTAs for Vuse Solo. Based upon requirements of the FSPTCA that must be addressed in PMTAs, and the FDA’s Guidance regarding the type of evidence required for such applications, the costs of preparing a PMTA are significant. R. J. Reynolds Vapor Company thereafter filed PMTAs for the remaining Vuse products (Vibe, Ciro, and Alto) and the Velo products (pouch and lozenge) by the September 2020 deadline. Certain additional data from ongoing research relevant to the Alto and Velo applications were submitted as amendments to the PMTAs during the FDA review process. The FDA issued marketing granted orders for the Vuse Solo device and its tobacco (‘original’) flavour in October 2021, but issued a marketing denial order for Vuse Solo flavours other than menthol (which were not on the market). That denial is being appealed with the FDA. In May 2022, the FDA issued marketing granted orders for tobacco flavoured Vuse Vibe and Ciro but issued a marketing denial order for flavours other than menthol (which were not on the market). R. J. Reynolds Vapor Company has appealed the denials issued for the relevant Vuse Vibe and Ciro products by requesting further Agency review. We have received and are challenging the FDA's marketing denial orders dated January 2023 related to Vibe and Ciro (menthol variants). In October 2023, the FDA issued a marketing denial order for Vuse Alto menthol. We have received court-ordered stays of enforcement of the FDA’s denial orders for menthol Vuse Alto, Ciro, and Vibe products, which means these Vuse menthol products can continue to be marketed and sold while the judicial review process continues. There can be no assurance that the Vuse menthol or other flavours appeals will succeed. The Vuse Alto device as well as Vuse Alto Rich Tobacco and Golden Tobacco products remain under the FDA's review. There can be no assurance that that these authorisations will be granted. Similarly, the Group’s Velo products remain on the market in the U.S., again pending the FDA's decisions on their premarket tobacco product applications and there can be no assurance these applications will be granted. If the FDA denies a marketing authorisation, then the relevant product(s) would need to be withdrawn from the market (unless a court, or the agency via supervisory review, intervenes). Legislation granting the FDA authority over synthetic nicotine products (products containing nicotine not “made or derived from tobacco”) went into effect in April 2022, which required manufacturers of such products to file PMTAs by a May 2022 deadline. Comprehensive plan for tobacco and nicotine regulation On 28 July 2017, the FDA announced its intent to develop a comprehensive plan for tobacco and nicotine regulation that recognises the continuum of risk for nicotine delivery. As part of that plan, the FDA planned to publish an Advance Notice of Proposed Rulemaking (ANPRM) to seek public input regarding the potential health benefits and possible adverse effects of lowering the level of nicotine in combustible cigarettes. The FDA also announced its intent to issue ANPRMs requesting public stakeholder input on the impact of flavours (including menthol) in increased initiation among youth and young adults as well as assisting adult smokers to switch to potentially less harmful forms of nicotine delivery, and the patterns of use and public health impact of premium cigars. This follows on from the FDA’s decision to issue its own preliminary scientific evaluation regarding menthol cigarettes in 2013, which concluded that menthol cigarettes adversely affect initiation, addiction and cessation compared to non-menthol cigarettes. In January 2018, the FDA held a public hearing to obtain input from a broad group of stakeholders on ways to streamline the regulatory process for the issuance of therapeutic claims for nicotine products. In March 2018, the Agency issued three ANPRMs, seeking information on (1) the lowering of nicotine levels to non-addictive or minimally addictive levels, (2) the impact of flavours (including menthol) in increased initiation among youth and young adults as well as assisting adult smokers to switch to potentially less harmful forms of nicotine delivery, and (3) the patterns of use and public health impact of premium cigars. In April 2022, the FDA published a proposed product standard that would ban menthol as a characterising flavour in cigarettes. The FDA accepted public comment on this proposed rule through to August 2022. RAI Services Company submitted a detailed comment to the FDA (available on the U.S. Government's Regulations website) opposing the proposed rule as unsupported by existing scientific evidence and with the potential for negative unintended consequences. In December 2022, the sale of all tobacco products with characterising flavours other than tobacco (including menthol) were banned in the state of California. Additional regulation In addition to the ANPRMs on reduced nicotine products and flavours, in April 2019, the FDA issued a proposed rule on the format and content of reports to demonstrate substantial equivalence. This follows on from the FDA’s previous statements regarding the development of foundational rules so as to provide clarity and predictability to the tobacco product submission process, including not only substantial equivalence applications but new product applications as well as MRTP applications. In September 2019, the FDA published a proposed rule on the format and content of PMTAs. The final foundational rules for substantial equivalence and PMTAs were published on 5 October 2021 and became effective on 4 November 2021. The FDA has not yet promulgated its proposed rule for MRTP applications. BAT Annual Report and Form 20-F 2023 Strategic Report Governance Report Financial Statements Other Information Other Information Regulation of the Group’s Business Continued 378
Under the FSPTCA, for a manufacturer to launch a new tobacco product or modify an existing tobacco product after 22 March 2011, the manufacturer must obtain an order from the FDA authorising the new or modified product to be marketed. Similarly, a manufacturer that introduced a cigarette or smokeless tobacco product between 15 February 2007 and 22 March 2011 was required to file a substantial equivalence report with the FDA demonstrating either (1) that the new or modified product had the same characteristics as a product commercially available as at 15 February 2007, referred to as a predicate product, or (2) if the new or modified product had different characteristics than the predicate product, that it did not raise different questions of public health. A product subject to such report is referred to as a provisional product. A manufacturer may continue to market a provisional product unless and until the FDA issues an order that the provisional product is not substantially equivalent, in which case the FDA could then require the manufacturer to remove the provisional product from the market. Many of the RAI subsidiaries’ cigarette and smokeless tobacco products currently on the market are provisional products. In January 2017, the FDA issued its first proposed product standard whereby the Agency would require the reduction, over a three-year period, of the levels of N-nitrosonornicotine (NNN) contained in smokeless tobacco products. Since issuing this proposal, the Agency has simply stated that it is evaluating submitted comments. The FDA’s semi-annual regulatory agenda has not listed the NNN proposal since its publication. Thus, it is not known whether or when this proposed rule will be finalised, and, if adopted, whether the final rule will be the same as or similar to the proposed rule. On 18 December 2017, the FDA accepted for review MRTP applications for six Camel Snus smokeless tobacco products. In 2018, the FDA began its review of these applications, which included facility inspections and a public meeting held 13-14 September 2018 before the Tobacco Product Scientific Advisory Committee to obtain its review and recommendation. These applications were withdrawn in Q4 2022. On 18 March 2020, the FDA issued a rule mandating the incorporation on cigarettes packages of graphic health warnings. The rule required eleven new textual warnings, each accompanied by a specific graphic image, on the top 50% of the front and back of all cigarette packages, on the left 50% of the front and back of cigarette cartons, and the top 20% of all cigarette advertising, beginning 18 June 2021. On 3 April 2020, RAI subsidiaries R. J. Reynolds Tobacco Company and Santa Fe Natural Tobacco Company, in conjunction with several cigarette manufacturers and retailers, filed a lawsuit seeking to permanently enjoin implementation of the rule. The court, following multiple orders to delay the implementation of the rule, invalidated it as unconstitutional in December 2022. In February 2023, the FDA appealed this decision to U.S. Court of Appeals for the Fifth Circuit. Briefing concluded and oral argument took place on 5 December 2023. On 6 December 2023, the Biden Administration released the Fall 2023 Unified Agenda. This is an outline of the Administration’s upcoming regulatory priorities. As a part of this agenda, the FDA announced a plan to move forward with, among other proposals, a proposed rule reducing nicotine levels in cigarettes to “minimally or non-addictive” levels. The regulatory agenda anticipates a proposed nicotine rule in April 2024; however, the FDA has clarified that there is no precise date on which it plans to issue the proposed rule. The regulatory agenda also anticipates issuance in March 2024 of a final rule to ban menthol as a characterising flavour in cigarettes; however, the administration is not bound by this timeline. Cigarettes and other tobacco products are subject to substantial taxes in the U.S. All states and the District of Columbia currently impose cigarette excise taxes. Certain city and county governments, such as those of New York City, Philadelphia, and Chicago, also impose substantial excise taxes on cigarettes sold in those jurisdictions. Also, all states and the District of Columbia currently subject smokeless tobacco products to excise taxes. Various states and the District of Columbia impose a tax on Vapour products, such as e-cigarettes, and many other states have proposed taxes on Vapour products. Currently, there is no federal tax on Vapour products. State and local governments also consider and implement other legislation and regulation regarding the sale of tobacco products. Measures include, among others, limiting or prohibiting the sale of flavours in tobacco products, restricting where tobacco products may be sold and increasing the minimum age to purchase tobacco products. The Group believes that, as a responsible business, it can contribute through information, ideas and practical steps, to help regulators address the key issues regarding its products, including underage access, illicit trade, product information, product design, involuntary exposure to smoke and the development of potentially less harmful products, while maintaining a competitive market that accommodates the significant percentage of adults who choose to be tobacco consumers. The Group is committed to working with national governments and multilateral organisations and welcomes opportunities to participate in good faith to achieve sensible and balanced regulation of traditional tobacco and potentially RRPs1. Notes: 1. Based on the weight of evidence and assuming a complete switch from cigarette smoking. These products are not risk free and are addictive. Our Vapour product Vuse (including Alto, Solo, Ciro and Vibe), and certain products, including Velo, Grizzly, Kodiak, and Camel Snus, which are sold in the U.S., are subject to FDA regulation and no reduced-risk claims will be made as to these products without agency clearance. 2. Administrative Court Braunschweig - 4th Chamber, case No. 4 A 23/19, British American Tobacco (Germany) GmbH v. Federal Republic of Germany, represented by the Federal Office of Consumer Protection and Food Safety, 23 September 2021. BAT Annual Report and Form 20-F 2023 Strategic Report Governance Report Financial Statements Other Information 379
The Master Settlement Agreement & State Settlement Agreements In 1998, the major U.S. cigarette manufacturers (including R.J. Reynolds Tobacco Company, Lorillard and Brown & Williamson, businesses which are now part of Reynolds American) entered into the Master Settlement Agreement (“MSA”) with attorneys general representing most U.S. states and territories. The MSA imposes a perpetual stream of future payment obligations on the major U.S. cigarette manufacturers. The amounts of money that the participating manufacturers are required to annually contribute are based upon, among other things, the volume of cigarettes sold and market share (based on cigarette shipments in that year). During 2012, R.J. Reynolds Tobacco Company, various other tobacco manufacturers, 17 states, the District of Columbia and Puerto Rico reached a final agreement related to Reynolds American’s 2003 MSA activities, and three more states joined the agreement in 2013. Under this agreement, R.J. Reynolds Tobacco Company has received credits of more than US$1 billion in respect of its Non-Participating Manufacturer (“NPM”) Adjustment claims related to the period from 2003 to 2012. These credits have been applied against the company’s MSA payments over a period of five years from 2013, subject to, and dependent upon, meeting the various ongoing performance obligations. During 2014, two additional states agreed to settle NPM disputes related to claims for the period 2003 to 2012. R.J. Reynolds Tobacco Company received US$170 million in credits, which have been applied over a five-year period from 2014. During 2015, another state agreed to settle NPM disputes related to claims for the period 2004 to 2014. R.J. Reynolds Tobacco Company received US$285 million in credits, which have been applied over a four-year period from 2016. During 2016, no additional states agreed to settle NPM disputes. During 2017, two more states agreed to settle NPM disputes related to claims for the period 2004 to 2014. R.J. Reynolds Tobacco Company received US$61 million in credits, which have been applied over a five-year period from 2017. During 2018, nine more states agreed to settle NPM disputes related to claims for the period 2004 to 2019, with an option through 2022, subject to certain conditions. R.J. Reynolds Tobacco Company received US$182 million in credits for settled periods through 2017, which have been applied over a five-year period from 2018. Also in 2018, a 10th additional state agreed to settle NPM disputes related to claims for the period 2004 to 2024, subject to certain conditions. R.J. Reynolds Tobacco Company received US$205 million in credits for settled periods through 2017, which have been applied over a five-year period from 2019. In the first quarter of 2020, certain conditions set forth in the 2018 agreements were met for those 10 states. In addition, in August 2020, 24 states, the District of Columbia and Puerto Rico agreed to settle NPM disputes related to claims for the period 2018-2022. In 2022, an additional state settled NPM disputes related to claims for the period 2005 to 2028. It is estimated that R.J. Reynolds Tobacco Company will receive US$130 million in credits for settled periods through 2018, which will be applied over a five-year period from 2022. In 2023, an additional state settled NPM disputes related to claims for the period 2005 to 2029. It is estimated that R.J. Reynolds Tobacco Company will receive a credit of US$29 million for settled periods through 2018, which will be applied over a five-year period from 2024. Credits in respect of future years’ payments and the NPM Adjustment claims would be accounted for in the applicable year and will not be treated as adjusting items. Only credits in respect of prior year payments are included as adjusting items. The BAT Group is subject to substantial payment obligations under the MSA and the state settlement agreements with the states of Mississippi, Florida, Texas and Minnesota (such settlement agreements, collectively “State Settlement Agreements”). Reynolds American Inc.'s operating subsidiaries' expenses and payments under the MSA and the State Settlement Agreements for 2023 amounted to US$2,516 million in respect of settlement expenses and US$2,874 million in respect of settlement cash payments; for 2022 amounted to US$2,951 million in respect of settlement expenses and US$3,129 million in respect of settlement cash payments; for 2021 amounted to US$3,420 million in respect of settlement expenses and US$3,744 million in respect of settlement cash payments; for 2020 amounted to US$3,572 million in respect of settlement expenses and US$2,848 million in respect of settlement cash payments; and for 2019 amounted to US$2,762 million in respect of settlement expenses and US$2,918 million in respect of settlement cash payments. R.J. Reynolds Tobacco Company divested certain brands to Imperial Tobacco Group (ITG) in 2015. In 2020, R.J. Reynolds Tobacco Company recognised additional expenses, included above, under the State Settlement Agreements in the states of Mississippi, Florida, Texas and Minnesota related to these divested brands. R.J. Reynolds Tobacco Company recognised US$241 million of expense for payment obligations to the state of Florida for the ITG acquired brands from the date of divestiture, 12 June 2015, as a result of an unfavourable judgment. In addition, R.J. Reynolds Tobacco Company recognised US$264 million related to the resolution of claims against it in the states of Texas, Minnesota and Mississippi for payment obligations to those states for the ITG acquired brands from the date of divestiture. R.J. Reynolds Tobacco Company settled certain related claims with Phillip Morris USA under the State Settlement Agreements in the states of Mississippi, Texas and Minnesota for US$8 million. Finally, in June 2022, R.J. Reynolds Tobacco Company settled PM USA's claims relating to the calculation of the base-year net operating profits for the ITG acquired brands for US$37 million. Reynolds American Inc.: Transfer of Pension Obligations On 7 June 2022, Reynolds American Inc. entered into a transaction with Metropolitan Tower Life Insurance Company to transfer approximately $1.6 billion of pension obligations through the purchase of annuities for retirees receiving benefit payments from one pension plan and less than a threshold amount per month from another pension plan. The transaction was funded with plan assets and resulted in an increase in the funded status of the retirement plan. Other Agreements Settlement Agreement between Nicoventures Trading Limited and Philip Morris Products S.A. On 1 February 2024, Nicoventures Trading Limited, an indirect, wholly-owned subsidiary of British American Tobacco p.l.c., entered into a settlement agreement with Philip Morris Products S.A., an indirect, wholly-owned subsidiary of Philip Morris International Inc. (the Settlement Agreement). Pursuant to this Settlement Agreement, among other things, both parties have agreed to take all actions, as necessary, to dismiss with prejudice, subject to certain limited exceptions, certain pending legal proceedings between the parties and their respective affiliates concerning certain Vapour products and Heated Products (HP) (including devices and consumables) without admission of liability, and to fully and finally discharge without admission of liability any injunctions granted to the parties and their respective affiliates in such proceedings. The parties have also agreed to a mutual release of presently known and past, present and future claims arising out of or relating to, among other things, such proceedings, the infringement of the patents at issue in the proceedings and certain intellectual property rights relating to certain products existing on or before a specified date. Additionally, the parties have agreed to covenants not to sue, on a perpetual, royalty-bearing or royalty-free basis, as the case may be, in respect of patents associated with certain existing or changed Vapour or HP products. The parties have also agreed to covenants not to sue on a perpetual, royalty-free basis in respect of, among other things, the manufacture of products, accessories, replacement parts and upgrade parts, or their respective components, and research and development of such products, accessories, replacement parts, upgrade parts and components. The Settlement Agreement is for a term of eight years from 1 February 2024 and is substantially worldwide in scope. BAT Annual Report and
Form 20-F 2023 Strategic Report Governance Report Financial Statements Other Information Other Information Material Contracts 380
Significant agreements Change of Control Provisions as at 31 December 2023 Nature of agreement Key provisions The revolving credit facilities agreement, effective 12 March 2020 and 6 March 2023, entered into between the Company, B.A.T. International Finance p.l.c., B.A.T. Netherlands Finance B.V. and B.A.T Capital Corporation (as borrowers and, in the case of the Company, as a guarantor) and HSBC Bank plc (as agent) and certain financial institutions (as lenders), pursuant to which the lenders have agreed to make available to the borrowers £5.4 billion for general corporate purposes (the Facility). – should a borrower (other than the Company) cease to be a direct or indirect subsidiary of the Company, such borrower shall immediately repay any outstanding advances made to it and shall cease to be a borrower under the Facility; and – where there is a change of control in respect of the Company, the lenders can require all amounts outstanding under the Facility to be repaid. During 2023, the Group arranged, extended and/or renewed short-term bilateral facilities with core relationship banks for a total amount of £2.7 billion. B.A.T. International Finance p.l.c. is the borrower under these facilities and the Company is the guarantor. As at 31 December 2023, £100 million was drawn on a short-term basis. – should the borrower cease to be a direct or indirect subsidiary of the Company, the borrower shall immediately repay any outstanding advances made to it under these facilities; and – where there is a change of control in respect of the Company, the lenders can require all amounts outstanding under these facilities to be repaid. On 25 July 2017, the Company acceded as a guarantor under the indenture of its indirect, wholly-owned subsidiary Reynolds American Inc.. The securities issued under the indenture include approximately US$6.7 billion aggregate principal amount of unsecured Reynolds American Inc. debt securities. – with respect to each series of debt securities issued under the indenture, upon a change of control event, combined with a credit ratings downgrade of the series to below investment-grade level (such downgrade occurring on any date from the date of the public notice of an arrangement that could result in a change of control event until the end of the 60-day period following public notice of the occurrence of a change of control event), Reynolds American Inc. is obligated to make an offer to repurchase all debt securities from each holder of debt securities. As a guarantor under the indenture, the Company guarantees such payments. Rules for the awards under the long-term incentive plans 2007 and 2016 (“LTIPs”), Restricted Share Plan (“RSP"), 2019 Deferred Annual Share Bonus Scheme ("DSBS") and 2016 Sharesave Scheme ("Sharesave"). – in the event of a change of control of the Company as a result of a takeover, reconstruction or winding-up of the Company (not being an internal reorganisation), LTIP, RSP, DSBS and Sharesave awards will vest (and in the case of an option, become exercisable for a limited period) based on the period of time that has elapsed since the date of the award and the achievement of the performance conditions (if applicable) at that date (performance conditions are applicable to LTIP only), unless the Remuneration Committee determines this not to be appropriate in the circumstances; and – the rules of the LTIPs, RSP, DSBS and Sharesave allow (as an alternative to early release) that participants may, if permitted, exchange their existing awards for new awards of shares in the acquiring company on a comparable basis. BAT Annual Report and Form 20-F 2023 Strategic Report Governance Report Financial Statements Other Information 381
The Group uses a combination of in-house and contract manufacturers to manufacture its products. BAT-owned manufacturing facilities1 United States AME APMEA Total Fully integrated manufacturing 1 15 22 38 Other processing sites (including leaf threshing and OTP) 1 9 6 16 Sites manufacturing other products (including Snus, Modern Oral and Liquids) 3 4 — 7 Research and development facilities 2 2 3 7 Total 7 30 31 68 Note: 1. As of 31 December 2023. The plants and properties owned or leased and operated by the Group’s subsidiaries are maintained in good condition and are believed to be suitable and adequate for the Group’s present needs. The technology employed in the Group’s factories is sophisticated, especially in the area of cigarette-making and packing where throughputs can reach between 500 and 1,000 packs per minute. The Group can produce many different pack formats (e.g., the number of cigarettes per packet) and configurations (e.g., bevel edge, round corner, international) to suit marketing and consumer requirements. New technology machines are sourced from the leading machinery suppliers to the industry. Close cooperation with these organisations helps the Group support its marketing strategy by driving its product innovations, which are brought to the market on a regular basis. The Group utilises quality standards, processes and procedures covering the entire end-to-end value chain to help to ensure quality products are provided to its customers and adult tobacco consumers according to the Group’s requirements and End Market regulatory requirements. In 2023, the Group manufactured cigarettes in 38 cigarette factories in 36 countries. These plants and properties are owned or leased and operated by the Group’s subsidiaries. The Group’s factory outputs and establishments vary significantly in size and production capacity. In line with our corporate commitment to fight climate change, our factories have decarbonisation, water usage and waste optimisation programmes. Also in 2023, the Group used third-party manufacturers to manufacture the components required, including the devices, related to New Categories. The Group also used third-party manufacturers to supplement the Group’s own production facilities in the U.S. and Poland to bottle the liquids used in Vapour products. For more information on property, plant and equipment, see note 13 in the Notes on the Accounts. Raw Materials While the Group does not own tobacco farms or directly employ farmers, it sources tobacco leaf directly from circa 91,000 contracted farmers and third-party suppliers, primarily in emerging markets. We are committed to enhancing the sustainability and viability of our contracted farmers by focusing on improving quality, distributing more resistant hybrid seeds and implementing tailored mechanisation to reduce costs of production and increased yield. We hold our third-party suppliers to similar expectations regarding their farmer contracts. We review our contracts on an annual basis, taking into account Group requirements over the medium term (2-3 years) to ensure stability of demand and supply on production volumes. Our third-party suppliers also conduct annual reviews. The Group also purchases a small amount of tobacco leaf from India via our associate ITC Ltd, where the tobacco is bought over an auction floor. ITC maintains full traceability and monitors farmers to ensure the sustainable provenance of the tobacco procured via the auction floor. Like any global agricultural commodity, the international price of tobacco fluctuates yearly. This is influenced by various factors including changes in production costs such as labour and agricultural inputs, local inflationary pressures, economic and political conditions, as well as climatic conditions that affect the supply, demand and quality of grown tobacco. While COVID-19 impacted tobacco supply chains (in 2020 and 2021) across most markets and required process enhancements to minimise transmission risks within communities, prices and availability of tobacco were not significantly impacted. The Group believes there is an adequate supply of tobacco leaf in the world markets to satisfy its current and anticipated production requirements. We also source a number of other materials required as part of our production requirements, covering areas that include wrapping materials and filters for our combustibles business and liquids and batteries for our New Categories products. We work closely with our suppliers to ensure a robust supply chain, with contingency sourcing in place. Contracts and sourcing agreements are reviewed regularly, to ensure competitive trading terms while recognising that prices may be impacted by external factors that affect our third-party supply partners. COVID-19 has led to some short-term disruption in the supply of certain materials (due to local lockdowns and travel restrictions), yet this has been proactively managed to mitigate the impact. BAT Annual Report and Form 20-F 2023 Strategic Report Governance Report Financial Statements Other Information Other Information Property, Plant and Equipment 382
Principles In the U.S., ADSs of the Company are listed on the New York Stock Exchange (NYSE). The significant differences between the Company’s corporate governance practices as a UK company and those required by NYSE listing standards for U.S. companies are discussed below. The Company has applied a robust set of board governance principles, which reflect the UK Corporate Governance Code 2018 and its principles-based approach to corporate governance. NYSE rules require U.S. companies to adopt and disclose on their websites corporate governance guidelines. The Company complies with UK requirements, including a statement in this report of how the Company has applied the principles of the UK Corporate Governance Code 2018 and that the Company has complied with the provisions of the UK Corporate Governance Code 2018. Independence The Company’s Board governance principles require that all Non-Executive Directors be determined by the Board to be independent in character and judgement and free from any business or other relationships that could interfere materially with, or appear to affect, their judgement. The Board also has formal procedures for managing conflicts of interest. The Board has determined that, in its judgement, the Chair of the Board and all of the Non-Executive Directors are independent. In doing so, the Board has taken into consideration the independence requirements outlined in the NYSE’s listing standards and considers these to be met by the Chair and all of its Non-Executive Directors. Committees The Company has a number of Board Committees that are broadly comparable in purpose and composition to those required by NYSE rules for domestic U.S. companies. For instance, the Company has a Nominations (rather than nominating/corporate governance) Committee and a Remuneration (rather than compensation) Committee. The Company also has an Audit Committee, which NYSE rules require for both U.S. companies and foreign private issuers. These Committees are composed solely of Non-Executive Directors and, in the case of the Nominations Committee, the Chair of the Board whom the Board has determined to be independent in the manner described above. Each Board Committee has its own terms of reference, which prescribe the composition, main tasks and requirements of each of the Committees (see the Board Committee reports on pages 154, 159 and 170). Under U.S. securities laws and the listing standards of the NYSE, the Company is required to have an audit committee that satisfies the requirements of Rule 10A-3 under the Exchange Act and Section 303A.06 of the NYSE Listed Company Manual. The Company’s Audit Committee complies with these requirements. The Company’s Audit Committee does not have direct responsibility for the appointment, reappointment or removal of the independent auditors. Instead, it follows the UK Companies Act 2006 by making recommendations to the Board on these matters for it to put forward for shareholder approval at the AGM. One of the NYSE’s additional requirements for the audit committee states that at least one member of the audit committee is to have ‘accounting or related financial management expertise’. The Board has determined that Holly Keller Koeppel, Véronique Laury and Darrell Thomas possess such expertise and also possess the financial and audit committee experience set forth in both the UK Corporate Governance Code 2018 and SEC rules (see the Audit Committee report on page 159). Holly Keller Koeppel and Darrell Thomas have also each been designated as an Audit Committee financial expert as defined in Item 16.A. of Form 20-F. The Board has also determined that each Audit Committee member meets the financial literacy requirements applicable under NYSE listing standards. Shareholder Approval of Equity Compensation Plans The NYSE rules for U.S. companies require that shareholders must be given the opportunity to vote on all equity-compensation plans and material revisions to those plans. The Company complies with UK requirements that are similar to the NYSE rules. The Board, however, does not explicitly take into consideration the NYSE’s detailed definition of what are considered ‘material revisions’. Codes of Business Conduct and Ethics The NYSE rules require U.S. companies to adopt and disclose a code of business conduct and ethics for all directors, officers and employees and promptly disclose any waivers of the code for directors or executive officers. The Group Standards of Business Conduct (the SoBC) described on pages 98 and 99 apply to all staff in the Group, including senior Management and the Board, and satisfy the NYSE requirements. All Group companies have adopted the SoBC (or localised versions). The SoBC also set out the Group’s whistleblowing policy, enabling staff, in confidence and anonymously, to raise concerns without fear of reprisal, including concerns regarding questionable accounting or auditing matters. The SoBC is available at bat.com/sobc. The Company has also adopted a code of ethics for its Chief Executive, Chief Financial Officer, Group Financial Controller and Group Chief Accountant as required by the provisions of Section 406 of the Sarbanes-Oxley Act of 2002 and the rules issued by the SEC. No waivers or exceptions to the Code of Ethics were granted in 2023. The Code of Ethics includes requirements in relation to confidentiality, conflicts of interest and corporate opportunities, and obligations for those senior financial officers to act with honesty and integrity in the performance of their duties and to promote full, fair, accurate, timely and understandable disclosures in all reports and other documents submitted to the SEC, the UK Financial Conduct Authority, and any other regulatory agency. The Company considers that these codes and policies address the matters specified in the NYSE rules for U.S. companies. Independent Director Contact Interested parties may communicate directly with the independent Directors, individually or as a group, by sending written correspondence addressed to the independent Director(s) to the attention of the Company Secretary at the following address: c/o Caroline Ferland, Company Secretary, British American Tobacco p.l.c., Globe House, 4 Temple Place, London WC2R 2PG. BAT Annual Report and Form 20-F 2023 Strategic Report Governance Report Financial Statements Other Information U.S. Corporate Governance Practices 383
Evaluation of Disclosure Controls and Procedures Disclosure controls and procedures The Group maintains ‘disclosure controls and procedures’ (as such term is defined in Exchange Act Rule 13a-15(e)), that are designed to ensure that information required to be disclosed in reports the Group files or submits under the Exchange Act is recorded, processed, summarised and reported within the time periods specified in the SEC rules and forms, and that such information is accumulated and communicated to Management, including the Chief Executive and Interim Finance Director, as appropriate, to allow timely decisions regarding required disclosure. In designing and evaluating our disclosure controls and procedures, our Management, including the Chief Executive and Interim Finance Director, recognise that any controls and procedures, no matter how well designed and operated, can provide only reasonable, not absolute, assurance that the objectives of the disclosure controls and procedures are met. Due to the inherent limitations in all control systems, no evaluation of controls can provide absolute assurance that all control issues and instances of fraud, if any, within the Group have been detected. The Group’s disclosure controls and procedures have been designed to meet, and Management believes that they meet, reasonable assurance standards. Management, with the participation of the Chief Executive and Interim Finance Director, has evaluated the effectiveness of the Group disclosure controls and procedures pursuant to Exchange Act Rule 13a-15(b) as of the end of the period covered by this annual report. Based on that evaluation, the Chief Executive and Interim Finance Director have concluded that the Group disclosure controls and procedures were effective at a reasonable assurance level. Management’s report on internal control over financial reporting Management, under the oversight of the Chief Executive and the Interim Finance Director, is responsible for establishing and maintaining adequate internal control over financial reporting for the Group. The Group’s internal control over financial reporting consists of processes which are designed to: provide reasonable assurance regarding the reliability of financial reporting and the preparation of the Group’s financial statements for external reporting purposes in accordance with IFRS as issued by the IASB and UK-adopted international accounting standards; provide reasonable assurance that receipts and expenditure are made only in accordance with the authorisation of Management; and provide reasonable assurance regarding the prevention or timely detection of any unauthorised acquisition, use or disposal of assets that could have a material effect on the consolidated financial statements. As required by Section 404 of the Sarbanes-Oxley Act of 2002, Management has assessed the effectiveness of the internal control over financial reporting (as defined in Rules 13(a)-13(f) and 15(d)-15(f) under the U.S. Securities Exchange Act of 1934) based on the updated Internal Control‑Integrated Framework issued by the Committee of Sponsoring Organisations of the Treadway Commission (COSO) (2013). Based on that assessment, Management has determined that the Group’s internal control over financial reporting was effective as at 31 December 2023. Any internal control framework, no matter how well designed, has inherent limitations, including the possibility of human error and the circumvention or overriding of controls and procedures and may not prevent or detect misstatements. Also, projections of any evaluation of effectiveness to future periods are subject to the risk that controls may become inadequate because of changes in conditions or because the degree of compliance with the policies or procedures may deteriorate. »KPMG LLP, an independent registered public accounting firm, who also audit the Group’s consolidated financial statements, has audited the effectiveness of the Group’s internal control over financial reporting as at 31 December 2023, which is included in this document.» Changes in internal control over financial reporting During the period covered by this report, there were no changes in the Group’s internal control over financial reporting that have materially affected or are reasonably likely to materially affect the effectiveness of internal control over financial reporting. Statements Regarding Competitive Position Statements referring to the competitive position of BAT and its subsidiaries are based on the Group’s belief and best estimates. In certain cases, such statements and figures rely on a range of sources, including investment analyst reports, independent market surveys, and the Group’s own internal assessments of market share. BAT Annual Report and Form 20-F 2023 Strategic Report Governance Report Financial Statements Other Information Other Information Controls and Procedures 384
This Other Information section of the British American Tobacco Annual Report and Form 20-F, which includes Additional Disclosures and Shareholder Information, forms part of, and includes certain disclosures which are required by law to be included in, the Directors’ Report. Strategic Report Disclosures Section 414C(11) of the Companies Act 2006 allows the Board to include in the Strategic Report information that it considers to be of strategic importance that would otherwise need to be disclosed in the Directors’ Report. The Board has chosen to take advantage of this provision and accordingly, the information set out below, which would otherwise be required to be contained in the Directors’ Report, has been included in the Strategic Report. Information required in the Directors’ Report Section in the Strategic Report Information on dividends Financial Performance Summary Certain risk information about the use of financial instruments Treasury and Cash Flow An indication of likely future developments in the business of the Group Strategic Pillar Overview Our Markets and Megatrends An indication of the activities of the Group in the field of research and development Harm Reduction Beyond Nicotine A statement describing the Group’s policy regarding the hiring, continuing employment and training, career development and promotion of disabled persons Employees, Diversity and Culture Details of employee engagement: information, consultation, regard to employee interests, share scheme participation and the achievement of a common awareness of the financial and economic factors affecting the performance of the Group Engaging with our stakeholders Employees, Diversity and Culture Details of business relationships: Directors’ regard to business relationships with customers, suppliers and other external stakeholders Engaging with our stakeholders Disclosures concerning greenhouse gas emissions and energy consumption TCFD Reporting Shareholder Information Disclosures Information required in the Directors’ Report Section in Other Information Change of control provisions Material contracts Information on dividends Dividends Share capital – structure and voting rights; restrictions on transfers of shares Articles of Association Directors – appointment and retirement Articles of Association Amendment of Articles of Association Articles of Association Branch outside of the UK - Representative Office in South Africa Inside page of the back cover Major shareholders Share capital and security ownership Directors – share issuance and buy-back powers Share capital and security ownership Purchases of shares Listing Rules (LRs) Disclosures For the purpose of LR 9.8.4C R the applicable information required to be disclosed by LR 9.8.4 R Section in Other Information Section (12) – shareholder waivers of dividends Group Employee Trust Section (13) – shareholder waivers of future dividends Group Employee Trust Directors: Interests and Indemnities Interests – details of Directors’ remuneration and emoluments, and their interests in the Company’s shares (including share options and deferred shares) as at 31 December 2023 are given in the Remuneration Report; and – no Director had any material interest in a contract of significance (other than a service contract) with the Company or any subsidiary company during the year. Insurance – appropriate cover provided in the event of legal action against the Company’s Directors. Indemnities – provision of indemnities to Directors in accordance with the Company’s Articles of Association and to the maximum extent permitted by law; and – as at the date of this report, such indemnities are in force covering any costs, charges, expenses or liabilities that they may incur in or about the execution of their duties to the Company or to any entity which is an associated company (as defined in Section 256 of the Companies Act 2006), or as a result of duties performed by them on behalf of the Company or any such associated company. Directors’ Report Approval and Signature The Directors’ Report comprises the information on pages 130 to 169 and pages 330 to 402. The Directors’ Report was approved by the Board of Directors on 7 February 2024 and signed on its behalf by Caroline Ferland, Company Secretary. BAT Annual Report and Form 20-F 2023 Strategic Report Governance Report Financial Statements Other Information Directors’ Report Information 385
This document contains certain forward-looking statements, including “forward-looking” statements made within the meaning of the U.S. Private Securities Litigation Reform Act of 1995. These statements are often, but not always, made through the use of words or phrases such as “believe,” “anticipate,” “could,” “may,” “would,” “should,” “intend,” “plan,” “potential,” “predict,” “will,” “expect,” “estimate,” “project,” “positioned,” “strategy,” “outlook”, “target” and similar expressions. These include statements regarding our intentions, beliefs or current expectations concerning, amongst other things, our results of operations, financial condition, liquidity, prospects, growth, strategies and the economic and business circumstances occurring from time to time in the countries and markets in which the Group operates. In particular, these forward-looking statements include, among other statements, statements regarding the Group’s future financial performance, planned product launches and future regulatory developments, as well as: (i) certain statements in the Overview section (pages 2 to 13), including the Our Global Business section, the Chair’s Introduction, Chief Executive’s Review and Interim Finance Director’s Overview; (ii) certain statements in the Our Strategy section (pages 14 to 27), including the Our Strategic Navigator section, the Strategic Summary section and the Investment Case section; (iii) certain statements in the Quality Growth section (pages 28 to 39), including the Strategic Pillar overview; (iv) certain statements in the Dynamic Business section (pages 40 to 59), including certain statements in the Strategic Pillar Overview section, the Financial Performance Summary section, the Treasury and Cash Flow section and the going concern discussions; (v) certain statements in the Sustainable Future section (pages 60 to 129), including the Leading in Sustainability & Integrity section, Sustainability highlights section, our material topics, TCFD reporting and Our approach to Taskforce on Nature-related Financial Disclosures (TNFD) section; (vi) certain statements in the Notes on Accounts (page 240), including the Group's ability to navigate regulatory change; and (vii) certain statements in the Other Information section (pages 330 to 406), including the Additional Disclosures and Shareholder Information sections. All such forward-looking statements involve estimates and assumptions that are subject to risks, uncertainties and other factors. It is believed that the expectations reflected in this document are reasonable but they may be affected by a wide range of variables that could cause actual results to differ materially from those currently anticipated. Among the key factors that could cause actual results to differ materially from those projected in the forward-looking statements are uncertainties related to the following: the impact of competition from illicit trade; the impact of adverse domestic or international legislation and regulation; the inability to develop, commercialise and deliver the Group’s New Categories strategy; the impact of Supply chain disruptions; adverse litigation and dispute outcomes and the effect of such outcomes on the Group’s financial condition; the impact of significant increases or structural changes in tobacco, nicotine and New Categories related taxes; translational and transactional foreign exchange rate exposure; changes or differences in domestic or international economic or political conditions; the ability to maintain credit ratings and to fund the business under the current capital structure; the impact of serious injury, illness or death in the workplace; adverse decisions by domestic or international regulatory bodies; changes in the market position, businesses, financial condition, results of operations or prospects of the Group; direct and indirect adverse impacts associated with Climate Change and the move towards a Circular Economy; and Cyber Security risks caused by the heightened cyber-threat landscape and increased digital interactions with consumers, and changes to regulation. Further details on the principal risks that may affect the Group can be found in the ‘Group Principal Risks’ section of the Strategic Report on pages 121 to 128 of this document. A summary of all the risk factors (including the principal risks) which are monitored by the Board through the Group’s risk register is set out in the Additional Disclosures section under the heading ‘Group Risk Factors’ on pages 353 to 374. Past performance is no guide to future performance and persons needing advice should consult an independent financial adviser. The forward-looking statements reflect knowledge and information available at the date of preparation of this document and the Group undertakes no obligation to update or revise these forward-looking statements, whether as a result of new information, future events or otherwise. Readers are cautioned not to place undue reliance on such forward-looking statements. No statement in this document is intended to be a profit forecast and no statement in this document should be interpreted to mean that earnings per share of BAT for the current or future financial years would necessarily match or exceed the historical published earnings per share of BAT. Although financial materiality has been considered in the development of our Double Materiality Assessment (DMA), our DMA and any conclusions in this document as to the materiality or significance of sustainability or ESG matters do not imply that all topics discussed therein are financially material to our business taken as a whole, and such topics may not significantly alter the total mix of information available about our securities. BAT Annual Report and Form 20-F 2023 Strategic Report Governance Report Financial Statements Other Information Other Information Cautionary Statement 386
Premium Listing – London Stock Exchange (LSE) The primary market for BAT’s ordinary shares is the LSE (Share Code: BATS; ISIN: GB0002875804). BAT’s ordinary shares have been listed on the LSE main market since 8 September 1998 and are a constituent element of the FTSE 100 Index. Secondary Listing – Johannesburg Stock Exchange (JSE Limited), South Africa BAT’s ordinary shares have a secondary listing and are traded in South African rand on the Main Board of the JSE in South Africa (Abbreviated name: BATS; Trading code: BTI). BAT’s ordinary shares have been listed on the JSE since 28 October 2008 and are a constituent element of the JSE Top 40 Index. American Depositary Shares (ADSs) – New York Stock Exchange (NYSE) BAT ordinary shares trade in the form of BAT ADSs in the United States under the symbol BTI (CUSIP Number: 110448107). The BAT ADSs have been listed on the NYSE since 25 July 2017 as a Sponsored Level III ADS programme for which Citibank, N.A. is the depositary (the ‘Depositary’) and transfer agent. Each ADS represents one ordinary share. ADSs are evidenced by American Depositary Receipts (ADRs). Share Prices The high and low prices at which the Company’s ordinary shares and ADSs are recorded as having traded during the year on each of the LSE, JSE and NYSE are as follows: High Low LSE £33.49 £22.79 JSE R709.00 R529.09 NYSE US$40.69 US$28.86 BAT Annual Report and Form 20-F 2023 Strategic Report Governance Report Financial Statements Other Information Shareholder Information 387
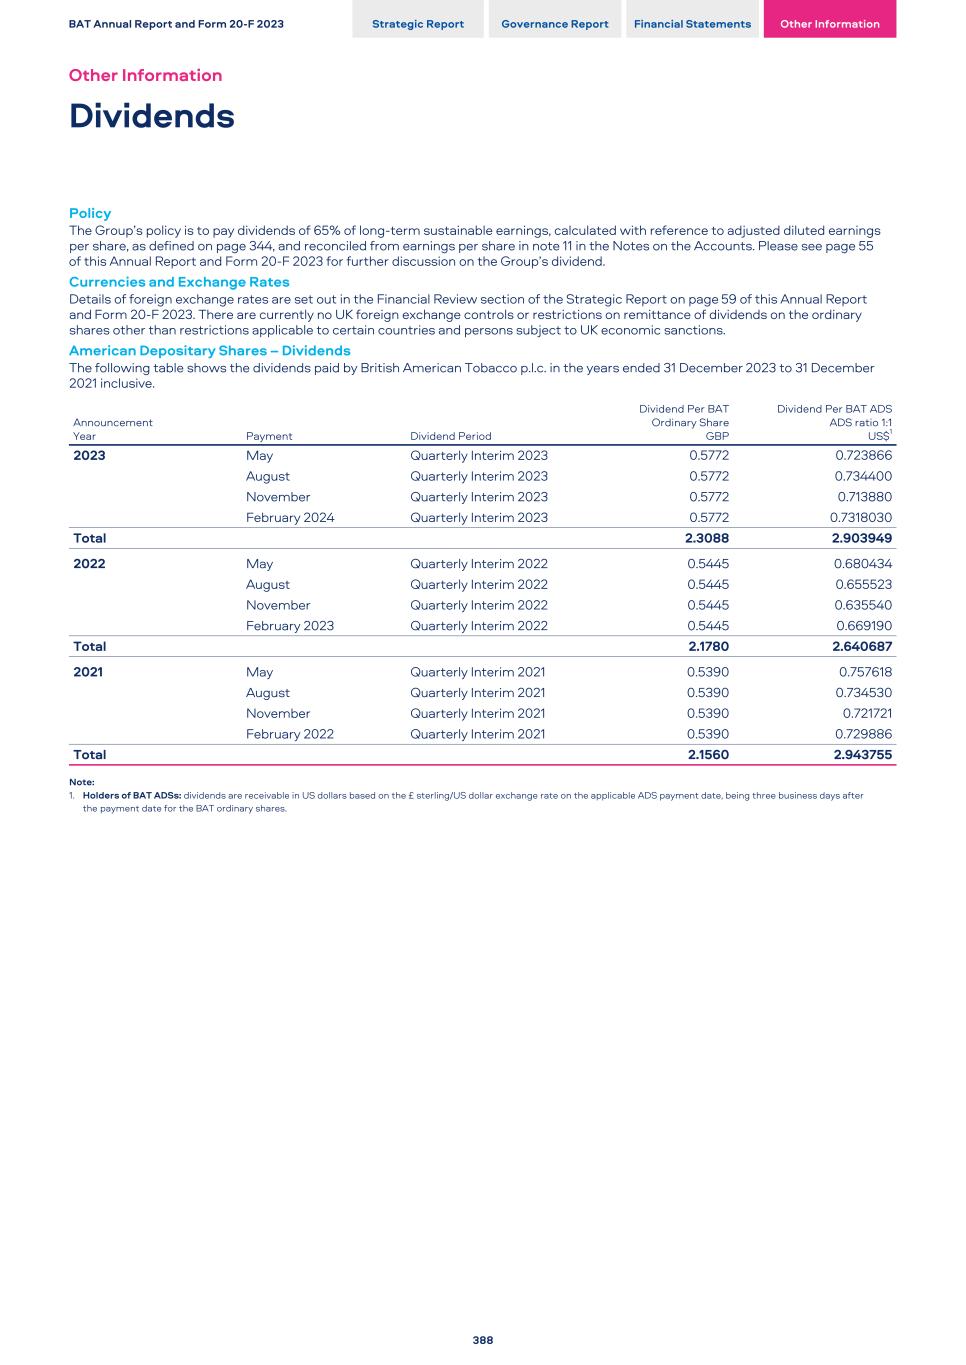
Policy The Group’s policy is to pay dividends of 65% of long-term sustainable earnings, calculated with reference to adjusted diluted earnings per share, as defined on page 344, and reconciled from earnings per share in note 11 in the Notes on the Accounts. Please see page 55 of this Annual Report and Form 20-F 2023 for further discussion on the Group’s dividend. Currencies and Exchange Rates Details of foreign exchange rates are set out in the Financial Review section of the Strategic Report on page 59 of this Annual Report and Form 20-F 2023. There are currently no UK foreign exchange controls or restrictions on remittance of dividends on the ordinary shares other than restrictions applicable to certain countries and persons subject to UK economic sanctions. American Depositary Shares – Dividends The following table shows the dividends paid by British American Tobacco p.l.c. in the years ended 31 December 2023 to 31 December 2021 inclusive. Announcement Year Payment Dividend Period Dividend Per BAT Ordinary Share GBP Dividend Per BAT ADS ADS ratio 1:1 US$1 2023 May Quarterly Interim 2023 0.5772 0.723866 August Quarterly Interim 2023 0.5772 0.734400 November Quarterly Interim 2023 0.5772 0.713880 February 2024 Quarterly Interim 2023 0.5772 0.7318030 Total 2.3088 2.903949 2022 May Quarterly Interim 2022 0.5445 0.680434 August Quarterly Interim 2022 0.5445 0.655523 November Quarterly Interim 2022 0.5445 0.635540 February 2023 Quarterly Interim 2022 0.5445 0.669190 Total 2.1780 2.640687 2021 May Quarterly Interim 2021 0.5390 0.757618 August Quarterly Interim 2021 0.5390 0.734530 November Quarterly Interim 2021 0.5390 0.721721 February 2022 Quarterly Interim 2021 0.5390 0.729886 Total 2.1560 2.943755 Note: 1. Holders of BAT ADSs: dividends are receivable in US dollars based on the £ sterling/US dollar exchange rate on the applicable ADS payment date, being three business days after the payment date for the BAT ordinary shares. BAT Annual Report and Form 20-F 2023 Strategic Report Governance Report Financial Statements Other Information Other Information Dividends 388
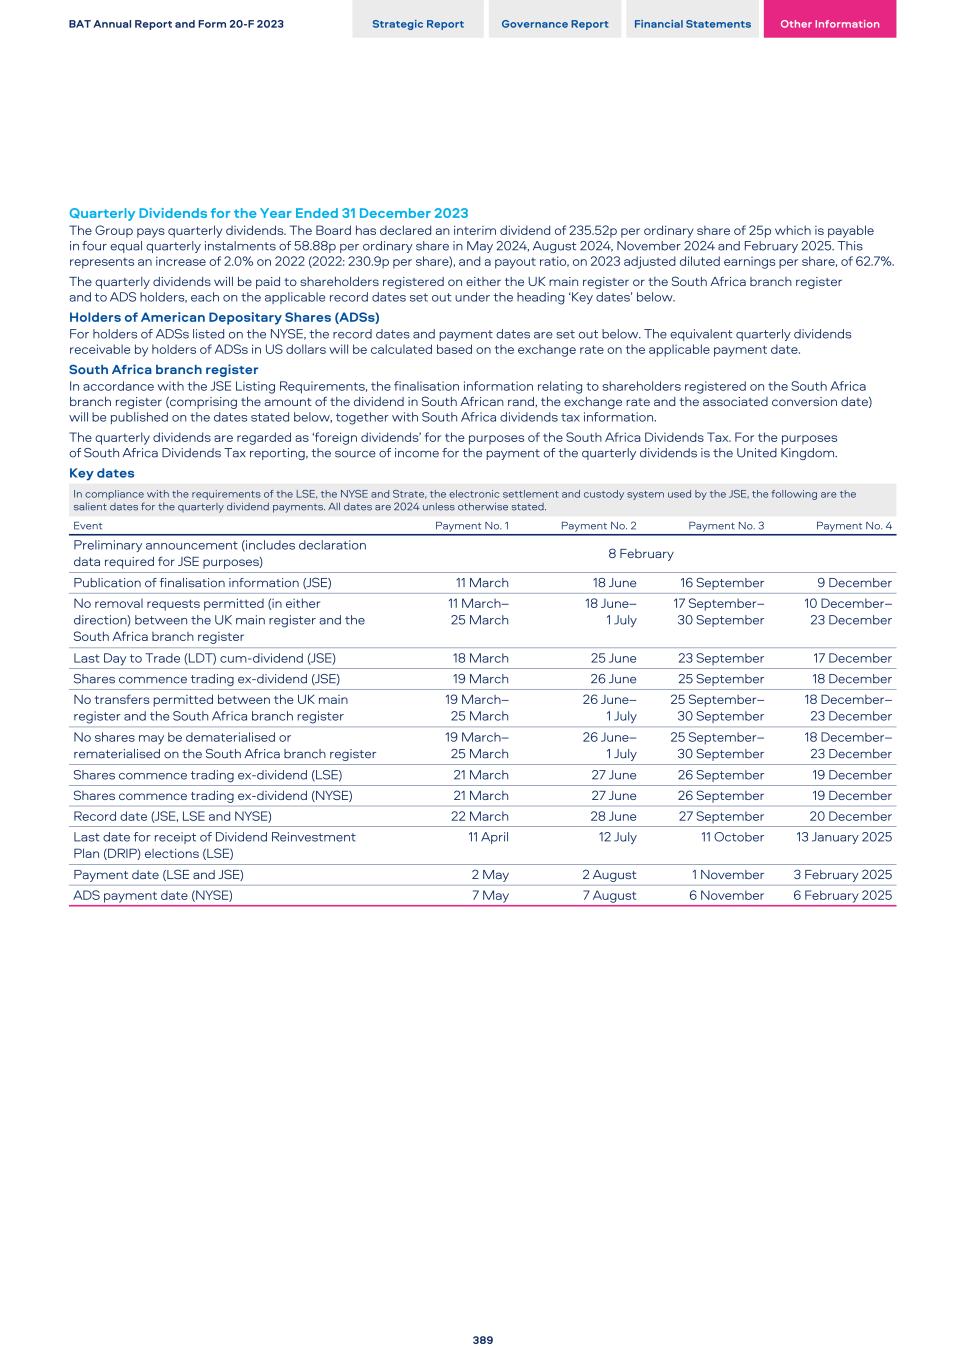
Quarterly Dividends for the Year Ended 31 December 2023 The Group pays quarterly dividends. The Board has declared an interim dividend of 235.52p per ordinary share of 25p which is payable in four equal quarterly instalments of 58.88p per ordinary share in May 2024, August 2024, November 2024 and February 2025. This represents an increase of 2.0% on 2022 (2022: 230.9p per share), and a payout ratio, on 2023 adjusted diluted earnings per share, of 62.7%. The quarterly dividends will be paid to shareholders registered on either the UK main register or the South Africa branch register and to ADS holders, each on the applicable record dates set out under the heading ‘Key dates’ below. Holders of American Depositary Shares (ADSs) For holders of ADSs listed on the NYSE, the record dates and payment dates are set out below. The equivalent quarterly dividends receivable by holders of ADSs in US dollars will be calculated based on the exchange rate on the applicable payment date. South Africa branch register In accordance with the JSE Listing Requirements, the finalisation information relating to shareholders registered on the South Africa branch register (comprising the amount of the dividend in South African rand, the exchange rate and the associated conversion date) will be published on the dates stated below, together with South Africa dividends tax information. The quarterly dividends are regarded as ‘foreign dividends’ for the purposes of the South Africa Dividends Tax. For the purposes of South Africa Dividends Tax reporting, the source of income for the payment of the quarterly dividends is the United Kingdom. Key dates In compliance with the requirements of the LSE, the NYSE and Strate, the electronic settlement and custody system used by the JSE, the following are the salient dates for the quarterly dividend payments. All dates are 2024 unless otherwise stated. Event Payment No. 1 Payment No. 2 Payment No. 3 Payment No. 4 Preliminary announcement (includes declaration data required for JSE purposes) 8 February Publication of finalisation information (JSE) 11 March 18 June 16 September 9 December No removal requests permitted (in either direction) between the UK main register and the South Africa branch register 11 March– 25 March 18 June– 1 July 17 September– 30 September 10 December– 23 December Last Day to Trade (LDT) cum-dividend (JSE) 18 March 25 June 23 September 17 December Shares commence trading ex-dividend (JSE) 19 March 26 June 25 September 18 December No transfers permitted between the UK main register and the South Africa branch register 19 March– 25 March 26 June– 1 July 25 September– 30 September 18 December– 23 December No shares may be dematerialised or rematerialised on the South Africa branch register 19 March– 25 March 26 June– 1 July 25 September– 30 September 18 December– 23 December Shares commence trading ex-dividend (LSE) 21 March 27 June 26 September 19 December Shares commence trading ex-dividend (NYSE) 21 March 27 June 26 September 19 December Record date (JSE, LSE and NYSE) 22 March 28 June 27 September 20 December Last date for receipt of Dividend Reinvestment Plan (DRIP) elections (LSE) 11 April 12 July 11 October 13 January 2025 Payment date (LSE and JSE) 2 May 2 August 1 November 3 February 2025 ADS payment date (NYSE) 7 May 7 August 6 November 6 February 2025 BAT Annual Report and Form 20-F 2023 Strategic Report Governance Report Financial Statements Other Information 389
The following discussion summarises material U.S. federal income tax consequences and UK taxation consequences to U.S. holders of owning and disposing of ordinary shares or ADSs, this information is accurate as at 5 February 2024. This discussion does not address any tax consequences arising under the laws of any state, local or foreign jurisdiction or under any U.S. federal laws other than those pertaining to income tax. This discussion is based upon the U.S. Internal Revenue Code of 1986 (the ‘U.S. Tax Code’), the Treasury regulations promulgated under the U.S. Tax Code and court and administrative rulings and decisions, all as in effect on the date hereof. These laws may change, possibly retroactively, and any change could affect the accuracy of the statements and conclusions set forth in this discussion. This discussion addresses only those U.S. holders of ordinary shares or ADSs who hold such equity interests as capital assets within the meaning of Section 1221 of the U.S. Tax Code. Further, this discussion does not address all aspects of U.S. federal income taxation that may be relevant to U.S. holders in light of their particular circumstances or that may be applicable to them if they are subject to special treatment under the U.S. federal income tax laws, including, without limitation: – a bank or other financial institution; – a tax-exempt organisation; – an S corporation or other pass-through entity and an investor therein; – an insurance company; – a mutual fund; – a regulated investment company or real estate investment trust; – a dealer or broker in stocks and securities, or currencies; – a trader in securities that elects mark-to-market treatment; – a U.S. holder subject to the alternative minimum tax provisions of the U.S. Tax Code; – a U.S. holder that received ordinary shares or ADSs through the exercise of an employee stock option, pursuant to a tax qualified retirement plan or otherwise as compensation; – a U.S. holder that is a tax-qualified retirement plan or a participant or a beneficiary under such a plan; – a person that is not a U.S. holder (as defined below); – a person that has a functional currency other than the US dollar; – a person required to recognise any item of gross income as a result of such income being recognised on an applicable financial statement; – a U.S. holder of ordinary shares or ADSs that holds such equity interest as part of a hedge, straddle, constructive sale, conversion or other integrated transaction; – a U.S. holder that owns (directly, indirectly or constructively) 10% or more of ordinary shares or ADSs by vote or by value; or – a U.S. expatriate. The determination of the actual tax consequences to a U.S. holder will depend on the U.S. holder’s specific situation. U.S. holders of ordinary shares or ADSs should consult their own tax advisers as to the tax consequences of owning and disposing of ordinary shares or ADSs, in each case, including the applicability and effect of the alternative minimum tax and any state, local, foreign or other tax laws and of changes in those laws. For purposes of this discussion, the term U.S. holder means a beneficial owner of ordinary shares or ADSs (as the case may be) that: – is for U.S. federal income tax purposes: (i) an individual citizen or resident of the United States; (ii) a corporation, including any entity treated as a corporation for U.S. federal income tax purposes, created or organised in or under the laws of the United States, any state thereof or the District of Columbia; (iii) a trust if a U.S. court is able to exercise primary supervision over the trust’s administration and one or more U.S. persons are authorised to control all substantial decisions of the trust or it has a valid election in effect under applicable Treasury regulations to be treated as a U.S. person; or (iv) an estate that is subject to U.S. federal income tax on its income regardless of its source; and – is not resident in the UK for UK tax purposes. The U.S. federal income tax consequences to a partner in an entity or arrangement treated as a partnership for U.S. federal income tax purposes that holds ordinary shares or ADSs generally will depend on the status of the partner and the activities of the partnership. Partners in a partnership holding any such equity interest should consult their own tax advisers. Material U.S. Federal Income Tax Consequences Relating to the Ownership and Disposition of Ordinary Shares or ADSs The following is a discussion of the material U.S. federal income tax consequences of the ownership and disposition by U.S. holders of ordinary shares or ADSs. This discussion assumes that BAT is not, and will not become, a passive foreign investment company for U.S. federal income tax purposes, as described below. ADSs A U.S. holder of ADSs, for U.S. federal income tax purposes, generally will be treated as the owner of the underlying ordinary shares that are represented by such ADSs. Accordingly, deposits or withdrawals of ordinary shares for or from ADSs will not be subject to U.S. federal income tax. Taxation of Dividends The gross amount of distributions on the ordinary shares or ADSs will be taxable as dividends to the extent paid out of BAT’s current or accumulated earnings and profits, as determined under U.S. federal income tax principles. Such income will be includable in a U.S. holder’s gross income as ordinary income on the day actually or constructively received by the U.S. holder. Such dividends will be treated as foreign source income and will not be eligible for the dividends received deduction allowed to corporations under the U.S. Tax Code. BAT Annual Report and Form 20-F 2023 Strategic Report Governance Report Financial Statements Other Information Other Information Shareholder Taxation Information 390
With respect to non-corporate U.S. investors, certain dividends received from a qualified foreign corporation may be subject to reduced rates of taxation. A qualified foreign corporation includes a foreign corporation that is eligible for the benefits of a comprehensive income tax treaty with the United States that the Treasury determines to be satisfactory for these purposes and that includes an exchange of information provision. The Treasury has determined that the treaty between the United States and the United Kingdom meets these requirements, and BAT believes that it is eligible for the benefits of the treaty. However, non-corporate holders that do not meet a minimum holding period requirement during which they are not protected from the risk of loss or that elect to treat the dividend income as ‘investment income’ pursuant to Section 163(d)(4) of the U.S. Tax Code will not be eligible for the reduced rates of taxation. In addition, the rate reduction will not apply to dividends if the recipient of a dividend is obligated to make related payments with respect to positions in substantially similar or related property. This disallowance applies even if the minimum holding period has been met. U.S. holders should consult their own tax advisers regarding the application of these rules to their particular circumstances. The amount of any dividend paid by BAT in £ sterling (including any such amount in respect of ADSs that is converted into US dollars by the depositary bank) will equal the US dollar value of the £ sterling actually or constructively received, calculated by reference to the exchange rate in effect on the date the dividend is so received by the U.S. holder, regardless of whether the £ sterling are converted into US dollars. If the £ sterling received as a dividend are converted into US dollars on the date received, the U.S. holder generally will not be required to recognise foreign currency exchange gain or loss in respect of the dividend income. If the £ sterling received as a dividend are not converted into US dollars on the date of receipt, the U.S. holder will have a basis in £ sterling equal to their US dollar value on the date of receipt. Any gain or loss realised on a subsequent conversion or other disposition of £ sterling will be treated as U.S. source ordinary income or loss. U.S. holders of ADSs should consult their own tax advisers regarding the application of these rules to the amount of any dividend paid by BAT in £ sterling that is converted into US dollars by the depositary bank. To the extent that the amount of any distribution exceeds BAT’s current and accumulated earnings and profits for a taxable year, as determined under U.S. federal income tax principles, the distribution will first be treated as a tax-free return of capital, causing a reduction in the U.S. holder’s adjusted basis of the ordinary shares or ADSs, and to the extent the amount of the distribution exceeds the U.S. holder’s tax basis, the excess will be taxed as capital gain recognised on a sale or exchange, as described below. BAT does not expect to determine earnings and profits in accordance with U.S. federal income tax principles. Therefore, notwithstanding the foregoing, U.S. holders should expect that distributions generally will be reported as dividend income for U.S. information reporting purposes. Distributions by BAT of additional ordinary shares (which may be distributed by the depositary bank to a holder of ADSs in the form of ADSs) to a U.S. holder that is made as part of a pro rata distribution to all holders of ordinary shares and ADSs in respect of their ordinary shares or ADSs, and for which there is no option to receive other property (not including ADSs), generally will not be subject to U.S. federal income tax. The basis of any new ordinary shares (or ADSs representing new ordinary shares) so received will be determined by allocating the U.S. holder’s basis in the previously held ordinary shares or ADSs between the previously held ordinary shares or ADSs and the new ordinary shares or ADSs, based on their relative fair market values on the date of distribution. Passive foreign investment company A passive foreign investment company (“PFIC”), is any foreign corporation if, after the application of certain ‘look-through’ rules: (1) at least 75% of its gross income is ‘passive income’ as that term is defined in the relevant provisions of the U.S. Tax Code; or (2) at least 50% of the average value of its assets produce ‘passive income’ or are held for the production of ‘passive income.’ The determination as to PFIC status is made annually. BAT does not believe that it is, for U.S. federal income tax purposes, a PFIC, and BAT expects to operate in such a manner so as not to become a PFIC. If, however, BAT is or becomes a PFIC, U.S. holders could be subject to additional U.S. federal income taxes on gain recognised with respect to the ordinary shares or ADSs and on certain distributions, plus an interest charge on certain taxes treated as having been deferred under the PFIC rules. Non-corporate U.S. holders will not be eligible for reduced rates of taxation on any dividends received from BAT if it is a PFIC in the taxable year in which such dividends are paid or in the preceding taxable year. BAT’s U.S. counsel expresses no opinion with respect to BAT’s PFIC status. Taxation of capital gains Upon a sale, exchange or other taxable disposition of ordinary shares or ADSs, a U.S. holder will generally recognise capital gain or loss for U.S. federal income tax purposes in an amount equal to the difference between the US dollar value of the amount realised on the disposition and the U.S. holder’s adjusted tax basis in the ordinary shares or ADSs as determined in US dollars. Such gain or loss generally will be U.S. source gain or loss, and will be long-term capital gain or loss if the U.S. holder has held the ordinary shares or ADSs for more than one year. Certain non-corporate U.S. holders may be eligible for preferential rates of U.S. federal income tax in respect of net long-term capital gains. The deductibility of capital losses is subject to limitations. The amount realised on a sale, exchange or other taxable disposition of ordinary shares for an amount in foreign currency will be the US dollar value of that amount on the date of sale or disposition. On the settlement date, the U.S. holder will recognise U.S. source foreign currency exchange gain or loss (taxable as ordinary income or loss) equal to the difference (if any) between the US dollar value of the amount received based on the exchange rates in effect on the date of sale, exchange or other disposition and the settlement date. However, in the case of ordinary shares traded on an established securities market that are sold by a cash- basis U.S. holder (or an accrual-basis U.S. holder that so elects), the amount realised will be based on the exchange rate in effect on the settlement date for the sale, and no foreign currency exchange gain or loss will be recognised at that time. A U.S. holder’s tax basis in ordinary shares or ADSs will generally equal the US dollar cost of the ordinary shares or ADSs. The US dollar cost of ordinary shares purchased with foreign currency will generally be the US dollar value of the purchase price on the date of purchase, or the settlement date for the purchase in the case of ordinary shares traded on an established securities market that are purchased by a cash-basis U.S. holder (or an accrual-basis U.S. holder that so elects). BAT Annual Report and Form 20-F 2023 Strategic Report Governance Report Financial Statements Other Information 391
Information with respect to foreign financial assets Individuals and certain entities that own ‘specified foreign financial assets’ with an aggregate value in excess of US$50,000 are generally required to file information reports with respect to such assets with their U.S. federal income tax returns. Depending on the individual’s circumstances, higher threshold amounts may apply. Specified foreign financial assets include any financial accounts maintained by foreign financial institutions, as well as any of the following, but only if they are not held in accounts maintained by financial institutions: (1) stocks and securities issued by non-U.S. persons; (2) financial instruments and contracts held for investment that have non-U.S. issuers or counterparties; and (3) interests in non‑U.S. entities. If a U.S. holder is subject to this information reporting regime, the failure to file information reports may subject the U.S. holder to penalties. U.S. holders are urged to consult their own tax advisers regarding their obligations to file information reports with respect to ordinary shares or ADSs. Medicare net investment tax Certain persons who are individuals (other than non-resident aliens), estates or trusts are required to pay an additional 3.8% tax on the lesser of (1) their ‘net investment income’ (in the case of individuals) or ‘undistributed net investment income’ (in the case of estates and trusts) (which includes dividend income in respect of, and gain recognised on the disposition of, ordinary shares or ADSs) for the relevant taxable year; and (2) the excess of their modified adjusted gross income (in the case of individuals) or adjusted gross income (in the case of estates and trusts) for the taxable year over specified dollar amounts. U.S. holders are urged to consult their tax advisers regarding the applicability of this provision to their ownership of ordinary shares or ADSs. Credits or deductions for UK taxes As indicated under ‘Material UK tax consequences’ below, dividends in respect of, and gains on the disposition of, ordinary shares or ADSs may be subject to UK taxation in certain circumstances. A U.S. holder may be eligible to claim a credit or deduction in respect of UK taxes attributable to such income or gain for purposes of computing the U.S. holder’s U.S. federal income tax liability, subject to certain limitations. The U.S. foreign tax credit rules are complex, and U.S. holders should consult their own tax advisers regarding the availability of U.S. foreign tax credits and the application of the U.S. foreign tax credit rules to their particular situation. Information reporting and backup withholding Information reporting and backup withholding may apply to dividend payments and proceeds from the sale, exchange or other taxable disposition of ordinary shares or ADSs. Backup withholding will not apply, however, to a U.S. holder that: (1) furnishes a correct taxpayer identification number (TIN), certifies that such holder is not subject to backup withholding on Internal Revenue Service Form W-9 (or appropriate successor form) and otherwise complies with all applicable requirements of the backup withholding rules; or (2) provides proof that such holder is otherwise exempt from backup withholding. Backup withholding is not an additional tax, and any amounts withheld under the backup withholding rules may be refunded or credited against a holder’s U.S. federal income tax liability, if any, provided that such holder furnishes the required information to the Internal Revenue Service in a timely manner. The Internal Revenue Service may impose a penalty upon any taxpayer that fails to provide the correct TIN. This summary of material U.S. federal income tax consequences is not tax advice. The determination of the actual tax consequences for a U.S. holder will depend on the U.S. holder’s specific situation. U.S. holders of ordinary shares or ADSs, in each case, should consult their own tax advisers as to the tax consequences of owning and disposing of ordinary shares or ADSs, including the applicability and effect of the alternative minimum tax and any state, local, foreign or other tax laws and of changes in those laws. BAT Annual Report and Form 20-F 2023 Strategic Report Governance Report Financial Statements Other Information Other Information Shareholder Taxation Information Continued 392
Material UK Tax Consequences The following paragraphs summarise material aspects of the UK tax treatment of U.S. holders of ordinary shares or ADSs and do not purport to be either a complete analysis of all tax considerations relating to holding ordinary shares or ADSs or an analysis of the tax position of BAT. They are based on current UK legislation and what is understood to be current HMRC practice, both of which are subject to change, possibly with retrospective effect. The comments are intended as a general guide and (otherwise than where expressly stated to the contrary) apply only to U.S. holders of ordinary shares or ADSs (other than under a personal equity plan or individual savings account) and who are the absolute beneficial owners of such shares. These comments do not deal with certain types of shareholders such as charities, dealers in securities, persons holding or acquiring shares in the course of a trade, persons who have or could be treated for tax purposes as having acquired their ordinary shares or ADSs by reason of their employment, collective investment schemes, persons subject to UK tax on the remittance basis and insurance companies. You are encouraged to consult an appropriate independent professional tax adviser with respect to your tax position. Tax on chargeable gains as a result of disposals of ordinary shares or ADSs Subject to the below, U.S. holders will not generally be subject to UK tax on chargeable gains on a disposal of ordinary shares or ADSs provided that they do not carry on a trade, profession or vocation in the United Kingdom through a branch, agency or permanent establishment in connection with which the ordinary shares or ADSs are held. A U.S. holder who is an individual, who has ceased to be resident for tax purposes in the United Kingdom for a period of less than five years and who disposes of ordinary shares or ADSs during that period may be liable for UK tax on capital gains (in the absence of any available exemptions or reliefs). If applicable, the tax charge will arise in the tax year that the individual returns to the United Kingdom. Tax on dividends BAT is not required to withhold UK tax at source from dividends paid on ordinary shares or ADSs. U.S. holders will not generally be subject to UK tax on dividends received from BAT provided that they do not carry on a trade, profession or vocation in the United Kingdom through a branch, agency or permanent establishment in connection with which the ordinary shares or ADSs are held. Stamp duty and stamp duty reserve tax (SDRT) Based on current published HMRC practice and recent case law, transfers of ADSs should not be subject to SDRT or stamp duty. The transfer of an underlying ordinary share to the ADS holder in exchange for the cancellation of an ADS should also not give rise to a stamp duty or SDRT charge. Transfers of ordinary shares outside of the depositary bank, including the repurchase of ordinary shares by BAT, will generally be subject to stamp duty or SDRT at the rate of 0.5% of the amount or value of the consideration given, except as described above in connection with the cancellation of an ADS. If ordinary shares are redeposited into a clearance service or depositary system, the redeposit will attract stamp duty or SDRT at the higher rate of 1.5%. The purchaser or the transferee of the ordinary shares or ADSs will generally be responsible for paying any stamp duty or SDRT payable. Where stamp duty or SDRT is payable, it is payable regardless of the residence position of the purchaser. Inheritance tax A gift or settlement of ordinary shares or ADSs by, or on the death of, an individual shareholder may give rise to a liability to UK inheritance tax even if the shareholder is not a resident of, or domiciled in, the United Kingdom. A charge to inheritance tax may arise in certain circumstances where ordinary shares or ADSs are held by close companies and trustees of settlements. However, pursuant to the Estate and Gift Tax Treaty 1980 (the “Treaty”) entered into between the United Kingdom and the United States, a gift or settlement of ordinary shares or ADSs by shareholders who are domiciled in the United States for the purposes of the Treaty may be exempt from any liability to UK inheritance tax. BAT Annual Report and Form 20-F 2023 Strategic Report Governance Report Financial Statements Other Information 393
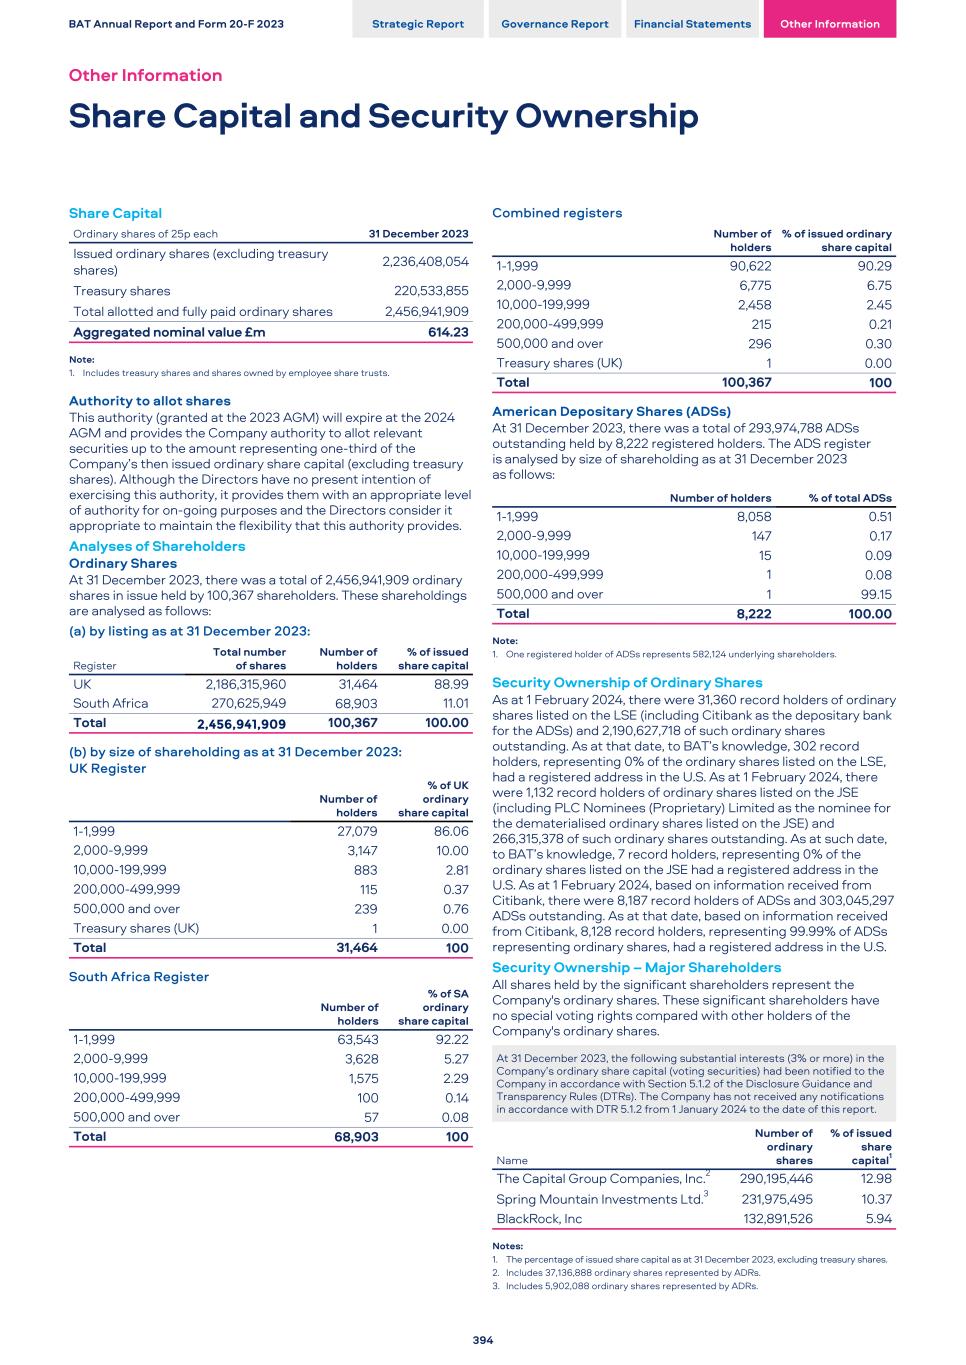
Share Capital Ordinary shares of 25p each 31 December 2023 Issued ordinary shares (excluding treasury shares) 2,236,408,054 Treasury shares 220,533,855 Total allotted and fully paid ordinary shares 2,456,941,909 Aggregated nominal value £m 614.23 Note: 1. Includes treasury shares and shares owned by employee share trusts. Authority to allot shares This authority (granted at the 2023 AGM) will expire at the 2024 AGM and provides the Company authority to allot relevant securities up to the amount representing one-third of the Company’s then issued ordinary share capital (excluding treasury shares). Although the Directors have no present intention of exercising this authority, it provides them with an appropriate level of authority for on-going purposes and the Directors consider it appropriate to maintain the flexibility that this authority provides. Analyses of Shareholders Ordinary Shares At 31 December 2023, there was a total of 2,456,941,909 ordinary shares in issue held by 100,367 shareholders. These shareholdings are analysed as follows: (a) by listing as at 31 December 2023: Register Total number of shares Number of holders % of issued share capital UK 2,186,315,960 31,464 88.99 South Africa 270,625,949 68,903 11.01 Total 2,456,941,909 100,367 100.00 (b) by size of shareholding as at 31 December 2023: UK Register Number of holders % of UK ordinary share capital 1-1,999 27,079 86.06 2,000-9,999 3,147 10.00 10,000-199,999 883 2.81 200,000-499,999 115 0.37 500,000 and over 239 0.76 Treasury shares (UK) 1 0.00 Total 31,464 100 South Africa Register Number of holders % of SA ordinary share capital 1-1,999 63,543 92.22 2,000-9,999 3,628 5.27 10,000-199,999 1,575 2.29 200,000-499,999 100 0.14 500,000 and over 57 0.08 Total 68,903 100 Combined registers Number of holders % of issued ordinary share capital 1-1,999 90,622 90.29 2,000-9,999 6,775 6.75 10,000-199,999 2,458 2.45 200,000-499,999 215 0.21 500,000 and over 296 0.30 Treasury shares (UK) 1 0.00 Total 100,367 100 American Depositary Shares (ADSs) At 31 December 2023, there was a total of 293,974,788 ADSs outstanding held by 8,222 registered holders. The ADS register is analysed by size of shareholding as at 31 December 2023 as follows: Number of holders % of total ADSs 1-1,999 8,058 0.51 2,000-9,999 147 0.17 10,000-199,999 15 0.09 200,000-499,999 1 0.08 500,000 and over 1 99.15 Total 8,222 100.00 Note: 1. One registered holder of ADSs represents 582,124 underlying shareholders. Security Ownership of Ordinary Shares As at 1 February 2024, there were 31,360 record holders of ordinary shares listed on the LSE (including Citibank as the depositary bank for the ADSs) and 2,190,627,718 of such ordinary shares outstanding. As at that date, to BAT’s knowledge, 302 record holders, representing 0% of the ordinary shares listed on the LSE, had a registered address in the U.S. As at 1 February 2024, there were 1,132 record holders of ordinary shares listed on the JSE (including PLC Nominees (Proprietary) Limited as the nominee for the dematerialised ordinary shares listed on the JSE) and 266,315,378 of such ordinary shares outstanding. As at such date, to BAT’s knowledge, 7 record holders, representing 0% of the ordinary shares listed on the JSE had a registered address in the U.S. As at 1 February 2024, based on information received from Citibank, there were 8,187 record holders of ADSs and 303,045,297 ADSs outstanding. As at that date, based on information received from Citibank, 8,128 record holders, representing 99.99% of ADSs representing ordinary shares, had a registered address in the U.S. Security Ownership – Major Shareholders All shares held by the significant shareholders represent the Company's ordinary shares. These significant shareholders have no special voting rights compared with other holders of the Company's ordinary shares. At 31 December 2023, the following substantial interests (3% or more) in the Company’s ordinary share capital (voting securities) had been notified to the Company in accordance with Section 5.1.2 of the Disclosure Guidance and Transparency Rules (DTRs). The Company has not received any notifications in accordance with DTR 5.1.2 from 1 January 2024 to the date of this report. Name Number of ordinary shares % of issued share capital1 The Capital Group Companies, Inc.2 290,195,446 12.98 Spring Mountain Investments Ltd.3 231,975,495 10.37 BlackRock, Inc 132,891,526 5.94 Notes: 1. The percentage of issued share capital as at 31 December 2023, excluding treasury shares. 2. Includes 37,136,888 ordinary shares represented by ADRs. 3. Includes 5,902,088 ordinary shares represented by ADRs. BAT Annual Report and Form 20-F 2023 Strategic Report Governance Report Financial Statements Other Information Other Information Share Capital and Security Ownership 394
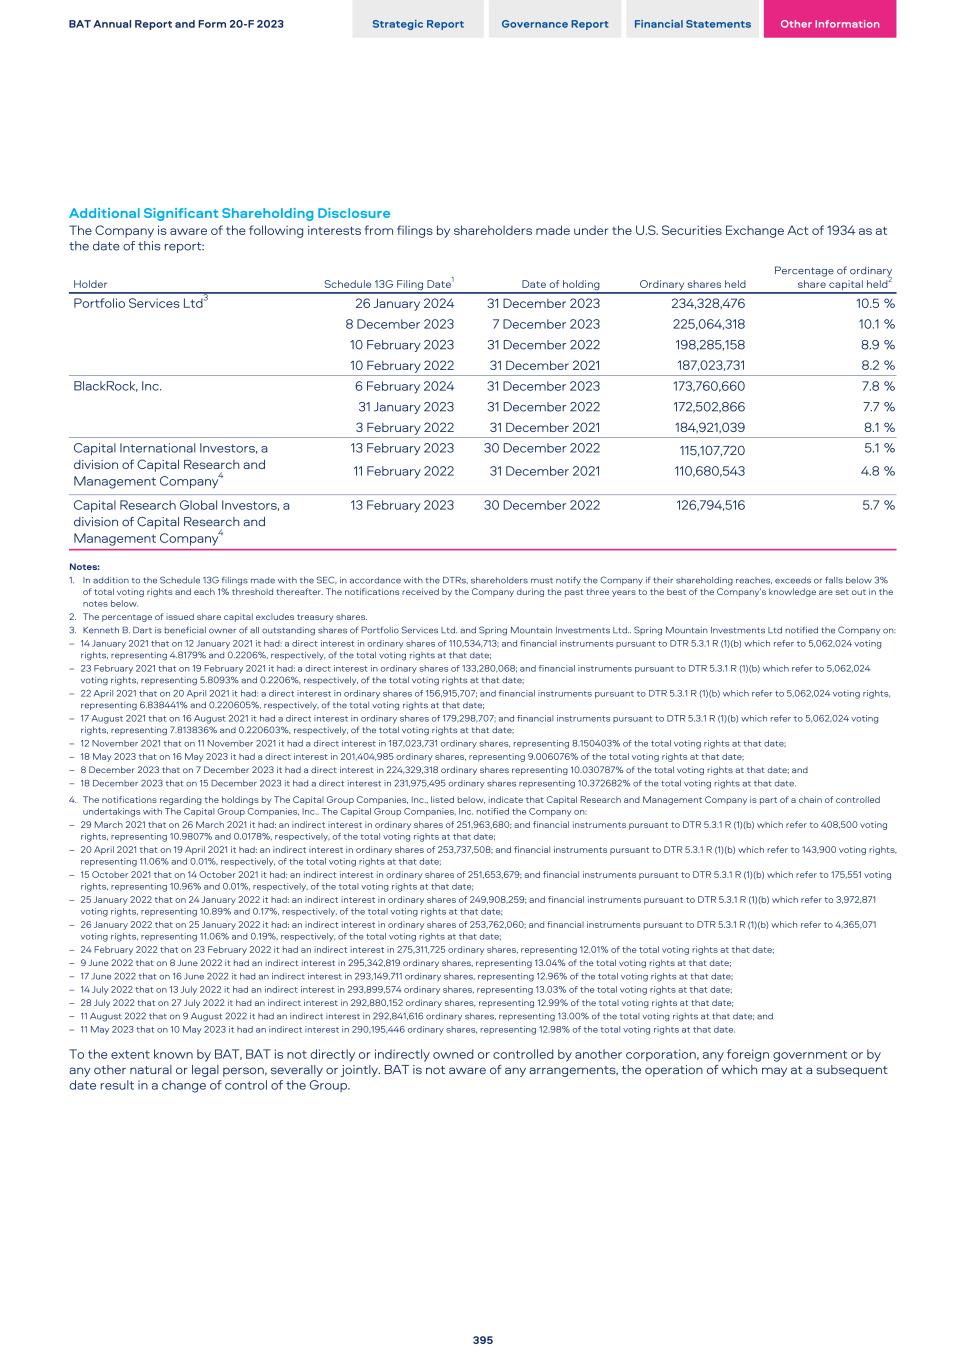
Additional Significant Shareholding Disclosure The Company is aware of the following interests from filings by shareholders made under the U.S. Securities Exchange Act of 1934 as at the date of this report: Holder Schedule 13G Filing Date1 Date of holding Ordinary shares held Percentage of ordinary share capital held2 Portfolio Services Ltd3 26 January 2024 31 December 2023 234,328,476 10.5 % 8 December 2023 7 December 2023 225,064,318 10.1 % 10 February 2023 31 December 2022 198,285,158 8.9 % 10 February 2022 31 December 2021 187,023,731 8.2 % BlackRock, Inc. 6 February 2024 31 December 2023 173,760,660 7.8 % 31 January 2023 31 December 2022 172,502,866 7.7 % 3 February 2022 31 December 2021 184,921,039 8.1 % Capital International Investors, a division of Capital Research and Management Company4 13 February 2023 30 December 2022 115,107,720 5.1 % 11 February 2022 31 December 2021 110,680,543 4.8 % Capital Research Global Investors, a division of Capital Research and Management Company4 13 February 2023 30 December 2022 126,794,516 5.7 % Notes: 1. In addition to the Schedule 13G filings made with the SEC, in accordance with the DTRs, shareholders must notify the Company if their shareholding reaches, exceeds or falls below 3% of total voting rights and each 1% threshold thereafter. The notifications received by the Company during the past three years to the best of the Company’s knowledge are set out in the notes below. 2. The percentage of issued share capital excludes treasury shares. 3. Kenneth B. Dart is beneficial owner of all outstanding shares of Portfolio Services Ltd. and Spring Mountain Investments Ltd.. Spring Mountain Investments Ltd notified the Company on: – 14 January 2021 that on 12 January 2021 it had: a direct interest in ordinary shares of 110,534,713; and financial instruments pursuant to DTR 5.3.1 R (1)(b) which refer to 5,062,024 voting rights, representing 4.8179% and 0.2206%, respectively, of the total voting rights at that date; – 23 February 2021 that on 19 February 2021 it had: a direct interest in ordinary shares of 133,280,068; and financial instruments pursuant to DTR 5.3.1 R (1)(b) which refer to 5,062,024 voting rights, representing 5.8093% and 0.2206%, respectively, of the total voting rights at that date; – 22 April 2021 that on 20 April 2021 it had: a direct interest in ordinary shares of 156,915,707; and financial instruments pursuant to DTR 5.3.1 R (1)(b) which refer to 5,062,024 voting rights, representing 6.838441% and 0.220605%, respectively, of the total voting rights at that date; – 17 August 2021 that on 16 August 2021 it had a direct interest in ordinary shares of 179,298,707; and financial instruments pursuant to DTR 5.3.1 R (1)(b) which refer to 5,062,024 voting rights, representing 7.813836% and 0.220603%, respectively, of the total voting rights at that date; – 12 November 2021 that on 11 November 2021 it had a direct interest in 187,023,731 ordinary shares, representing 8.150403% of the total voting rights at that date; – 18 May 2023 that on 16 May 2023 it had a direct interest in 201,404,985 ordinary shares, representing 9.006076% of the total voting rights at that date; – 8 December 2023 that on 7 December 2023 it had a direct interest in 224,329,318 ordinary shares representing 10.030787% of the total voting rights at that date; and – 18 December 2023 that on 15 December 2023 it had a direct interest in 231,975,495 ordinary shares representing 10.372682% of the total voting rights at that date. 4. The notifications regarding the holdings by The Capital Group Companies, Inc., listed below, indicate that Capital Research and Management Company is part of a chain of controlled undertakings with The Capital Group Companies, Inc.. The Capital Group Companies, Inc. notified the Company on: – 29 March 2021 that on 26 March 2021 it had: an indirect interest in ordinary shares of 251,963,680; and financial instruments pursuant to DTR 5.3.1 R (1)(b) which refer to 408,500 voting rights, representing 10.9807% and 0.0178%, respectively, of the total voting rights at that date; – 20 April 2021 that on 19 April 2021 it had: an indirect interest in ordinary shares of 253,737,508; and financial instruments pursuant to DTR 5.3.1 R (1)(b) which refer to 143,900 voting rights, representing 11.06% and 0.01%, respectively, of the total voting rights at that date; – 15 October 2021 that on 14 October 2021 it had: an indirect interest in ordinary shares of 251,653,679; and financial instruments pursuant to DTR 5.3.1 R (1)(b) which refer to 175,551 voting rights, representing 10.96% and 0.01%, respectively, of the total voting rights at that date; – 25 January 2022 that on 24 January 2022 it had: an indirect interest in ordinary shares of 249,908,259; and financial instruments pursuant to DTR 5.3.1 R (1)(b) which refer to 3,972,871 voting rights, representing 10.89% and 0.17%, respectively, of the total voting rights at that date; – 26 January 2022 that on 25 January 2022 it had: an indirect interest in ordinary shares of 253,762,060; and financial instruments pursuant to DTR 5.3.1 R (1)(b) which refer to 4,365,071 voting rights, representing 11.06% and 0.19%, respectively, of the total voting rights at that date; – 24 February 2022 that on 23 February 2022 it had an indirect interest in 275,311,725 ordinary shares, representing 12.01% of the total voting rights at that date; – 9 June 2022 that on 8 June 2022 it had an indirect interest in 295,342,819 ordinary shares, representing 13.04% of the total voting rights at that date; – 17 June 2022 that on 16 June 2022 it had an indirect interest in 293,149,711 ordinary shares, representing 12.96% of the total voting rights at that date; – 14 July 2022 that on 13 July 2022 it had an indirect interest in 293,899,574 ordinary shares, representing 13.03% of the total voting rights at that date; – 28 July 2022 that on 27 July 2022 it had an indirect interest in 292,880,152 ordinary shares, representing 12.99% of the total voting rights at that date; – 11 August 2022 that on 9 August 2022 it had an indirect interest in 292,841,616 ordinary shares, representing 13.00% of the total voting rights at that date; and – 11 May 2023 that on 10 May 2023 it had an indirect interest in 290,195,446 ordinary shares, representing 12.98% of the total voting rights at that date. To the extent known by BAT, BAT is not directly or indirectly owned or controlled by another corporation, any foreign government or by any other natural or legal person, severally or jointly. BAT is not aware of any arrangements, the operation of which may at a subsequent date result in a change of control of the Group. BAT Annual Report and Form 20-F 2023 Strategic Report Governance Report Financial Statements Other Information 395
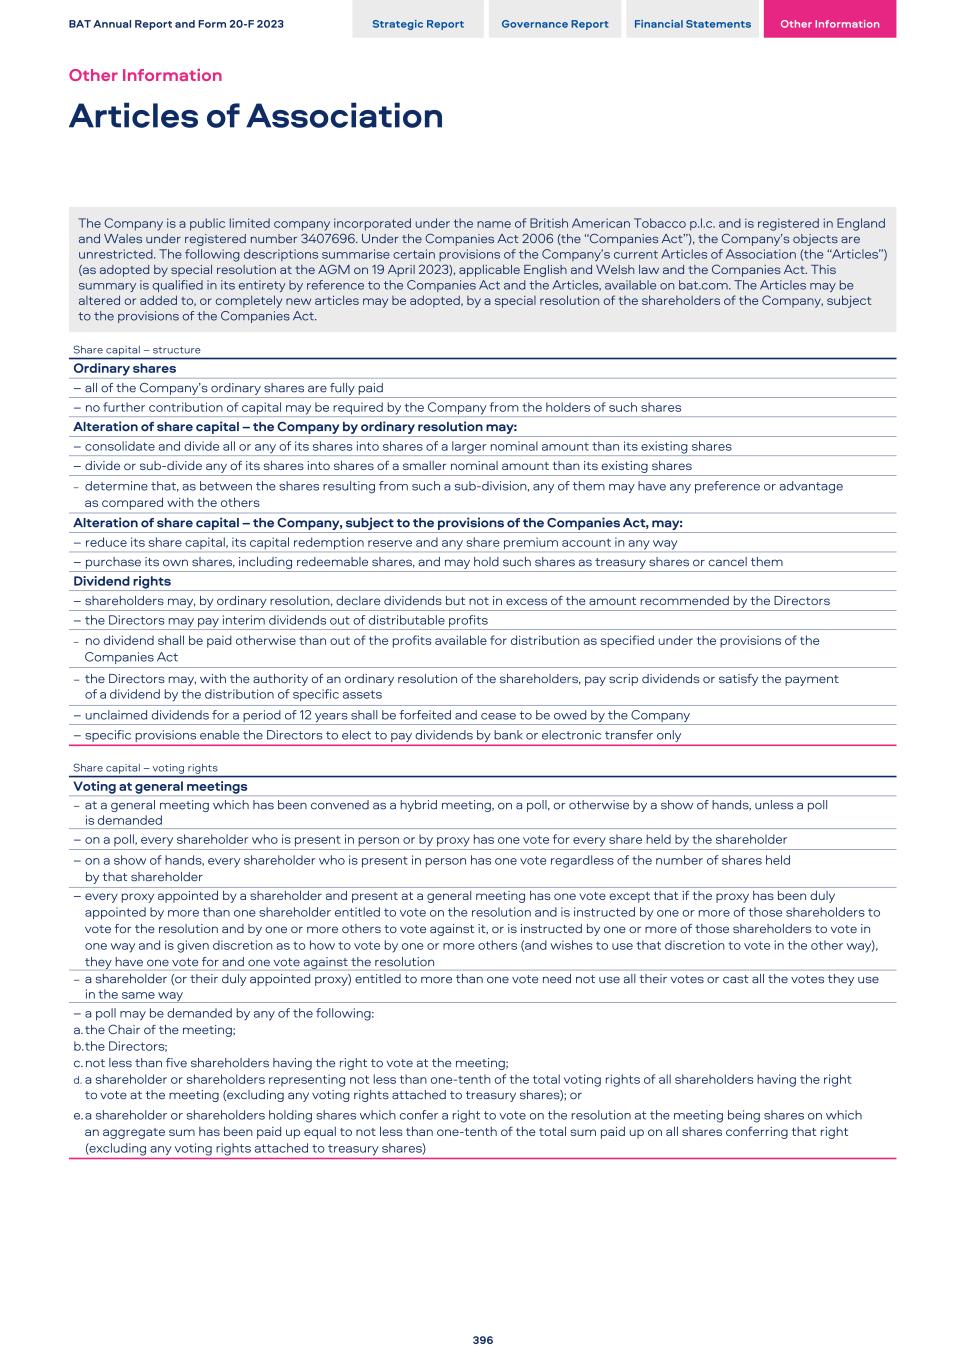
The Company is a public limited company incorporated under the name of British American Tobacco p.l.c. and is registered in England and Wales under registered number 3407696. Under the Companies Act 2006 (the “Companies Act”), the Company’s objects are unrestricted. The following descriptions summarise certain provisions of the Company’s current Articles of Association (the “Articles”) (as adopted by special resolution at the AGM on 19 April 2023), applicable English and Welsh law and the Companies Act. This summary is qualified in its entirety by reference to the Companies Act and the Articles, available on bat.com. The Articles may be altered or added to, or completely new articles may be adopted, by a special resolution of the shareholders of the Company, subject to the provisions of the Companies Act. Share capital – structure Ordinary shares – all of the Company’s ordinary shares are fully paid – no further contribution of capital may be required by the Company from the holders of such shares Alteration of share capital – the Company by ordinary resolution may: – consolidate and divide all or any of its shares into shares of a larger nominal amount than its existing shares – divide or sub-divide any of its shares into shares of a smaller nominal amount than its existing shares – determine that, as between the shares resulting from such a sub-division, any of them may have any preference or advantage as compared with the others Alteration of share capital – the Company, subject to the provisions of the Companies Act, may: – reduce its share capital, its capital redemption reserve and any share premium account in any way – purchase its own shares, including redeemable shares, and may hold such shares as treasury shares or cancel them Dividend rights – shareholders may, by ordinary resolution, declare dividends but not in excess of the amount recommended by the Directors – the Directors may pay interim dividends out of distributable profits – no dividend shall be paid otherwise than out of the profits available for distribution as specified under the provisions of the Companies Act – the Directors may, with the authority of an ordinary resolution of the shareholders, pay scrip dividends or satisfy the payment of a dividend by the distribution of specific assets – unclaimed dividends for a period of 12 years shall be forfeited and cease to be owed by the Company – specific provisions enable the Directors to elect to pay dividends by bank or electronic transfer only Share capital – voting rights Voting at general meetings – at a general meeting which has been convened as a hybrid meeting, on a poll, or otherwise by a show of hands, unless a poll is demanded – on a poll, every shareholder who is present in person or by proxy has one vote for every share held by the shareholder – on a show of hands, every shareholder who is present in person has one vote regardless of the number of shares held by that shareholder – every proxy appointed by a shareholder and present at a general meeting has one vote except that if the proxy has been duly appointed by more than one shareholder entitled to vote on the resolution and is instructed by one or more of those shareholders to vote for the resolution and by one or more others to vote against it, or is instructed by one or more of those shareholders to vote in one way and is given discretion as to how to vote by one or more others (and wishes to use that discretion to vote in the other way), they have one vote for and one vote against the resolution – a shareholder (or their duly appointed proxy) entitled to more than one vote need not use all their votes or cast all the votes they use in the same way – a poll may be demanded by any of the following: a.the Chair of the meeting; b.the Directors; c.not less than five shareholders having the right to vote at the meeting; d. a shareholder or shareholders representing not less than one-tenth of the total voting rights of all shareholders having the right to vote at the meeting (excluding any voting rights attached to treasury shares); or e.a shareholder or shareholders holding shares which confer a right to vote on the resolution at the meeting being shares on which an aggregate sum has been paid up equal to not less than one-tenth of the total sum paid up on all shares conferring that right (excluding any voting rights attached to treasury shares) BAT Annual Report and Form 20-F 2023 Strategic Report Governance Report Financial Statements Other Information Other Information Articles of Association 396
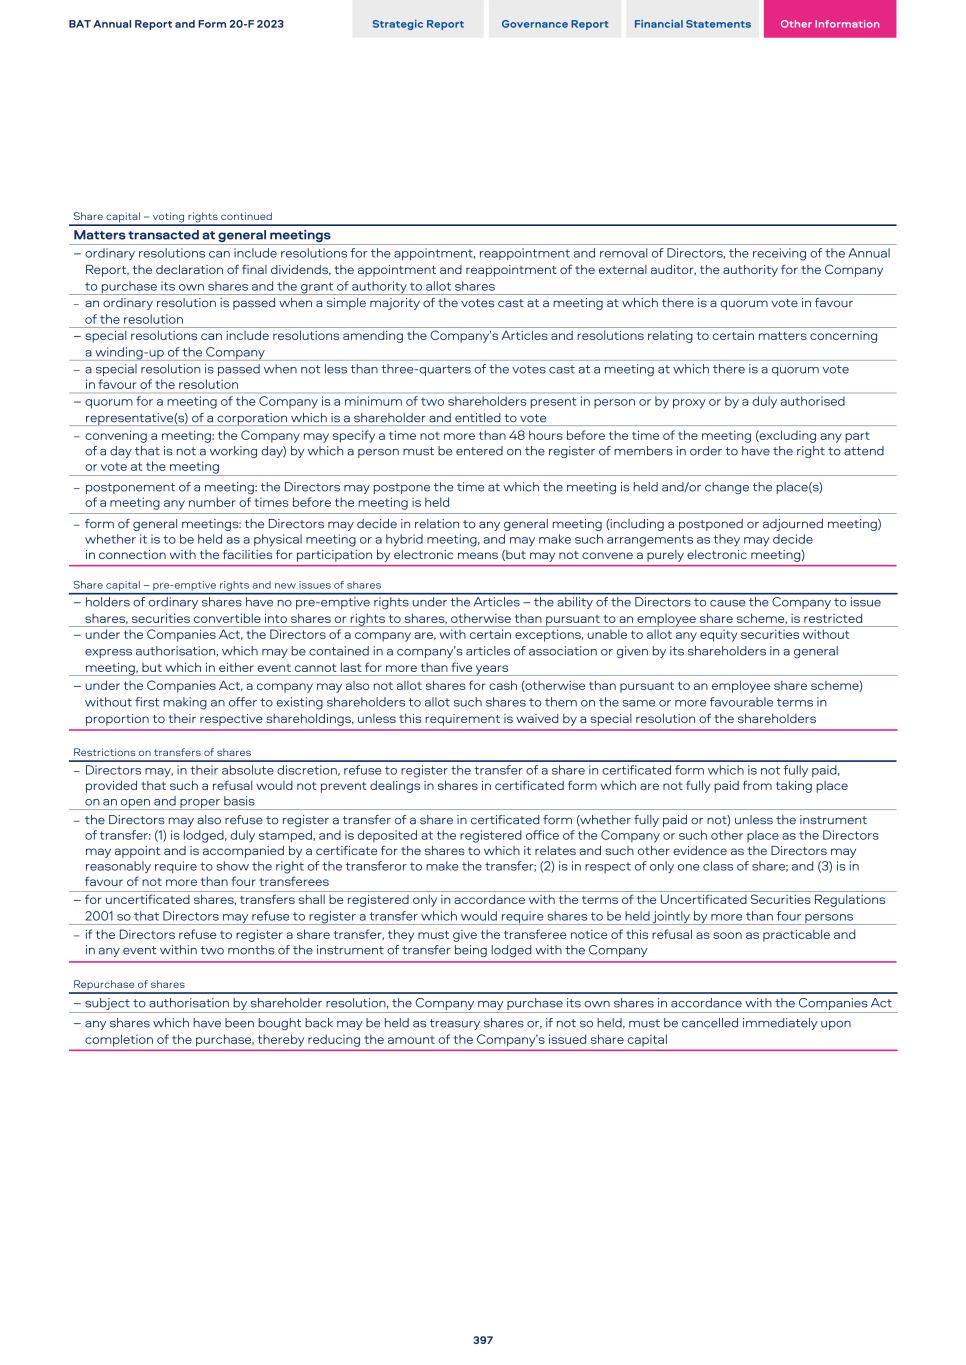
Share capital – voting rights continued Matters transacted at general meetings – ordinary resolutions can include resolutions for the appointment, reappointment and removal of Directors, the receiving of the Annual Report, the declaration of final dividends, the appointment and reappointment of the external auditor, the authority for the Company to purchase its own shares and the grant of authority to allot shares – an ordinary resolution is passed when a simple majority of the votes cast at a meeting at which there is a quorum vote in favour of the resolution – special resolutions can include resolutions amending the Company’s Articles and resolutions relating to certain matters concerning a winding‑up of the Company – a special resolution is passed when not less than three-quarters of the votes cast at a meeting at which there is a quorum vote in favour of the resolution – quorum for a meeting of the Company is a minimum of two shareholders present in person or by proxy or by a duly authorised representative(s) of a corporation which is a shareholder and entitled to vote – convening a meeting: the Company may specify a time not more than 48 hours before the time of the meeting (excluding any part of a day that is not a working day) by which a person must be entered on the register of members in order to have the right to attend or vote at the meeting – postponement of a meeting: the Directors may postpone the time at which the meeting is held and/or change the place(s) of a meeting any number of times before the meeting is held – form of general meetings: the Directors may decide in relation to any general meeting (including a postponed or adjourned meeting) whether it is to be held as a physical meeting or a hybrid meeting, and may make such arrangements as they may decide in connection with the facilities for participation by electronic means (but may not convene a purely electronic meeting) Share capital – pre-emptive rights and new issues of shares – holders of ordinary shares have no pre-emptive rights under the Articles – the ability of the Directors to cause the Company to issue shares, securities convertible into shares or rights to shares, otherwise than pursuant to an employee share scheme, is restricted – under the Companies Act, the Directors of a company are, with certain exceptions, unable to allot any equity securities without express authorisation, which may be contained in a company’s articles of association or given by its shareholders in a general meeting, but which in either event cannot last for more than five years – under the Companies Act, a company may also not allot shares for cash (otherwise than pursuant to an employee share scheme) without first making an offer to existing shareholders to allot such shares to them on the same or more favourable terms in proportion to their respective shareholdings, unless this requirement is waived by a special resolution of the shareholders Restrictions on transfers of shares – Directors may, in their absolute discretion, refuse to register the transfer of a share in certificated form which is not fully paid, provided that such a refusal would not prevent dealings in shares in certificated form which are not fully paid from taking place on an open and proper basis – the Directors may also refuse to register a transfer of a share in certificated form (whether fully paid or not) unless the instrument of transfer: (1) is lodged, duly stamped, and is deposited at the registered office of the Company or such other place as the Directors may appoint and is accompanied by a certificate for the shares to which it relates and such other evidence as the Directors may reasonably require to show the right of the transferor to make the transfer; (2) is in respect of only one class of share; and (3) is in favour of not more than four transferees – for uncertificated shares, transfers shall be registered only in accordance with the terms of the Uncertificated Securities Regulations 2001 so that Directors may refuse to register a transfer which would require shares to be held jointly by more than four persons – if the Directors refuse to register a share transfer, they must give the transferee notice of this refusal as soon as practicable and in any event within two months of the instrument of transfer being lodged with the Company Repurchase of shares – subject to authorisation by shareholder resolution, the Company may purchase its own shares in accordance with the Companies Act – any shares which have been bought back may be held as treasury shares or, if not so held, must be cancelled immediately upon completion of the purchase, thereby reducing the amount of the Company’s issued share capital BAT Annual Report and Form 20-F 2023 Strategic Report Governance Report Financial Statements Other Information 397
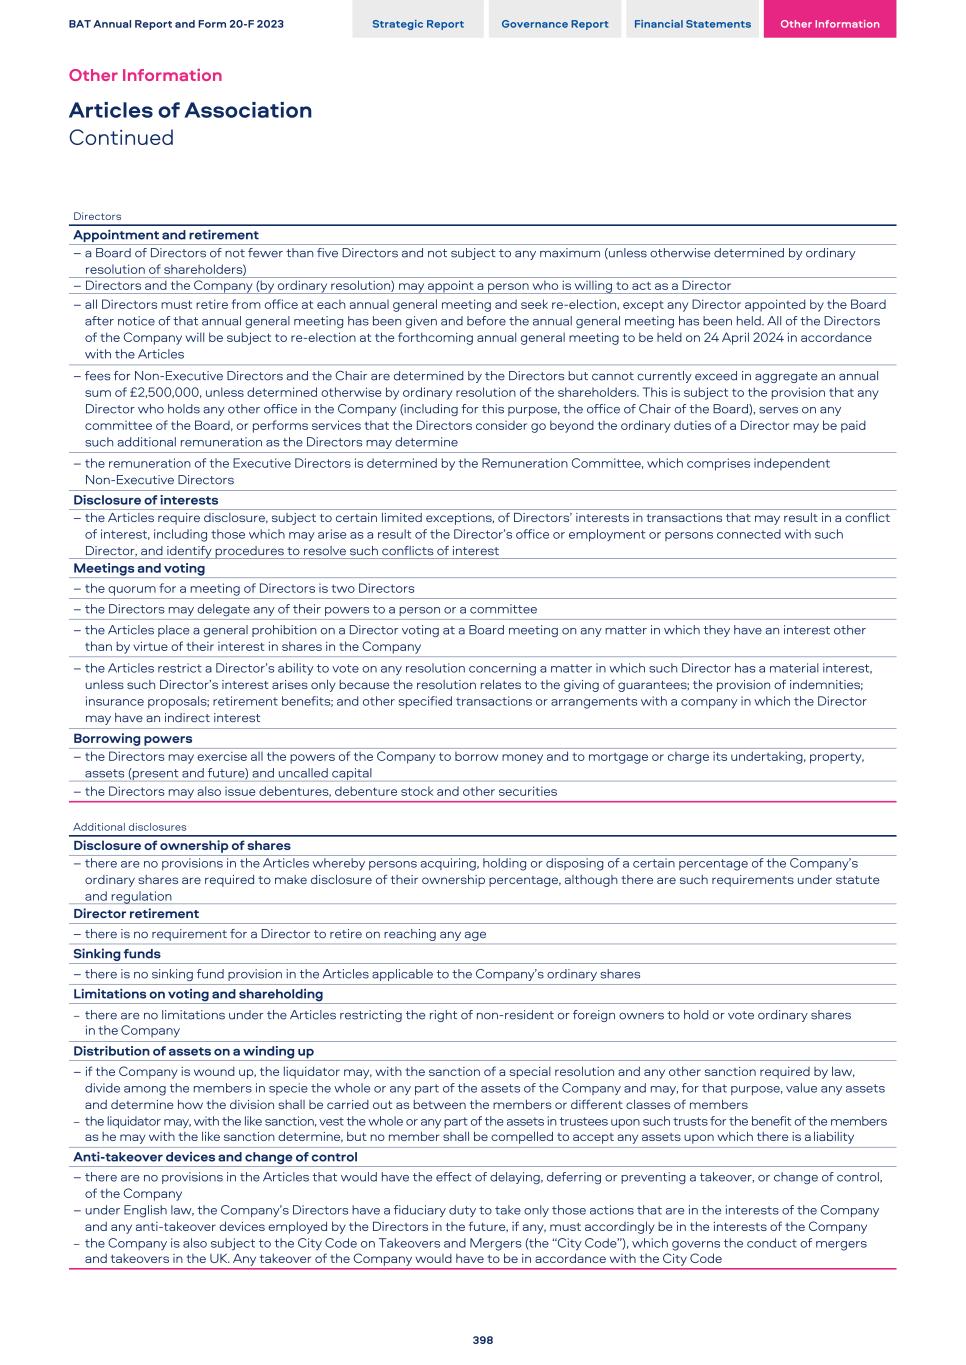
Directors Appointment and retirement – a Board of Directors of not fewer than five Directors and not subject to any maximum (unless otherwise determined by ordinary resolution of shareholders) – Directors and the Company (by ordinary resolution) may appoint a person who is willing to act as a Director – all Directors must retire from office at each annual general meeting and seek re-election, except any Director appointed by the Board after notice of that annual general meeting has been given and before the annual general meeting has been held. All of the Directors of the Company will be subject to re-election at the forthcoming annual general meeting to be held on 24 April 2024 in accordance with the Articles – fees for Non-Executive Directors and the Chair are determined by the Directors but cannot currently exceed in aggregate an annual sum of £2,500,000, unless determined otherwise by ordinary resolution of the shareholders. This is subject to the provision that any Director who holds any other office in the Company (including for this purpose, the office of Chair of the Board), serves on any committee of the Board, or performs services that the Directors consider go beyond the ordinary duties of a Director may be paid such additional remuneration as the Directors may determine – the remuneration of the Executive Directors is determined by the Remuneration Committee, which comprises independent Non‑Executive Directors Disclosure of interests – the Articles require disclosure, subject to certain limited exceptions, of Directors’ interests in transactions that may result in a conflict of interest, including those which may arise as a result of the Director’s office or employment or persons connected with such Director, and identify procedures to resolve such conflicts of interest Meetings and voting – the quorum for a meeting of Directors is two Directors – the Directors may delegate any of their powers to a person or a committee – the Articles place a general prohibition on a Director voting at a Board meeting on any matter in which they have an interest other than by virtue of their interest in shares in the Company – the Articles restrict a Director’s ability to vote on any resolution concerning a matter in which such Director has a material interest, unless such Director’s interest arises only because the resolution relates to the giving of guarantees; the provision of indemnities; insurance proposals; retirement benefits; and other specified transactions or arrangements with a company in which the Director may have an indirect interest Borrowing powers – the Directors may exercise all the powers of the Company to borrow money and to mortgage or charge its undertaking, property, assets (present and future) and uncalled capital – the Directors may also issue debentures, debenture stock and other securities Additional disclosures Disclosure of ownership of shares – there are no provisions in the Articles whereby persons acquiring, holding or disposing of a certain percentage of the Company’s ordinary shares are required to make disclosure of their ownership percentage, although there are such requirements under statute and regulation Director retirement – there is no requirement for a Director to retire on reaching any age Sinking funds – there is no sinking fund provision in the Articles applicable to the Company’s ordinary shares Limitations on voting and shareholding – there are no limitations under the Articles restricting the right of non-resident or foreign owners to hold or vote ordinary shares in the Company Distribution of assets on a winding up – if the Company is wound up, the liquidator may, with the sanction of a special resolution and any other sanction required by law, divide among the members in specie the whole or any part of the assets of the Company and may, for that purpose, value any assets and determine how the division shall be carried out as between the members or different classes of members – the liquidator may, with the like sanction, vest the whole or any part of the assets in trustees upon such trusts for the benefit of the members as he may with the like sanction determine, but no member shall be compelled to accept any assets upon which there is a liability Anti-takeover devices and change of control – there are no provisions in the Articles that would have the effect of delaying, deferring or preventing a takeover, or change of control, of the Company – under English law, the Company’s Directors have a fiduciary duty to take only those actions that are in the interests of the Company and any anti-takeover devices employed by the Directors in the future, if any, must accordingly be in the interests of the Company – the Company is also subject to the City Code on Takeovers and Mergers (the “City Code”), which governs the conduct of mergers and takeovers in the UK. Any takeover of the Company would have to be in accordance with the City Code BAT Annual Report and Form 20-F 2023 Strategic Report Governance Report Financial Statements Other Information Other Information Articles of Association Continued 398
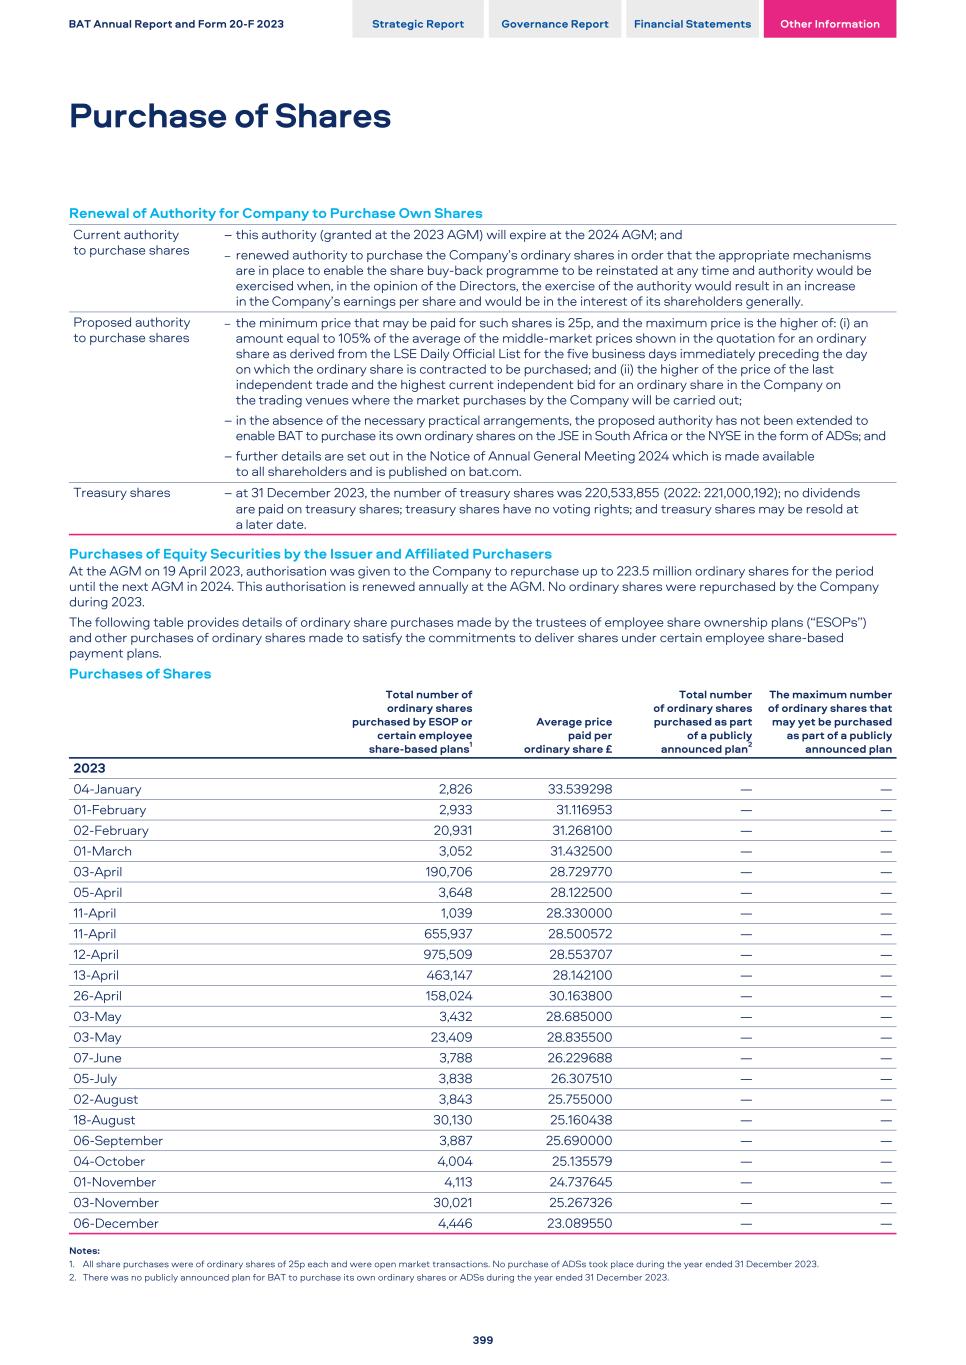
Renewal of Authority for Company to Purchase Own Shares Current authority to purchase shares – this authority (granted at the 2023 AGM) will expire at the 2024 AGM; and – renewed authority to purchase the Company’s ordinary shares in order that the appropriate mechanisms are in place to enable the share buy-back programme to be reinstated at any time and authority would be exercised when, in the opinion of the Directors, the exercise of the authority would result in an increase in the Company’s earnings per share and would be in the interest of its shareholders generally. Proposed authority to purchase shares – the minimum price that may be paid for such shares is 25p, and the maximum price is the higher of: (i) an amount equal to 105% of the average of the middle-market prices shown in the quotation for an ordinary share as derived from the LSE Daily Official List for the five business days immediately preceding the day on which the ordinary share is contracted to be purchased; and (ii) the higher of the price of the last independent trade and the highest current independent bid for an ordinary share in the Company on the trading venues where the market purchases by the Company will be carried out; – in the absence of the necessary practical arrangements, the proposed authority has not been extended to enable BAT to purchase its own ordinary shares on the JSE in South Africa or the NYSE in the form of ADSs; and – further details are set out in the Notice of Annual General Meeting 2024 which is made available to all shareholders and is published on bat.com. Treasury shares – at 31 December 2023, the number of treasury shares was 220,533,855 (2022: 221,000,192); no dividends are paid on treasury shares; treasury shares have no voting rights; and treasury shares may be resold at a later date. Purchases of Equity Securities by the Issuer and Affiliated Purchasers At the AGM on 19 April 2023, authorisation was given to the Company to repurchase up to 223.5 million ordinary shares for the period until the next AGM in 2024. This authorisation is renewed annually at the AGM. No ordinary shares were repurchased by the Company during 2023. The following table provides details of ordinary share purchases made by the trustees of employee share ownership plans (“ESOPs”) and other purchases of ordinary shares made to satisfy the commitments to deliver shares under certain employee share-based payment plans. Purchases of Shares Total number of ordinary shares purchased by ESOP or certain employee share-based plans1 Average price paid per ordinary share £ Total number of ordinary shares purchased as part of a publicly announced plan2 The maximum number of ordinary shares that may yet be purchased as part of a publicly announced plan 2023 04-January 2,826 33.539298 — — 01-February 2,933 31.116953 — — 02-February 20,931 31.268100 — — 01-March 3,052 31.432500 — — 03-April 190,706 28.729770 — — 05-April 3,648 28.122500 — — 11-April 1,039 28.330000 — — 11-April 655,937 28.500572 — — 12-April 975,509 28.553707 — — 13-April 463,147 28.142100 — — 26-April 158,024 30.163800 — — 03-May 3,432 28.685000 — — 03-May 23,409 28.835500 — — 07-June 3,788 26.229688 — — 05-July 3,838 26.307510 — — 02-August 3,843 25.755000 — — 18-August 30,130 25.160438 — — 06-September 3,887 25.690000 — — 04-October 4,004 25.135579 — — 01-November 4,113 24.737645 — — 03-November 30,021 25.267326 — — 06-December 4,446 23.089550 — — Notes: 1. All share purchases were of ordinary shares of 25p each and were open market transactions. No purchase of ADSs took place during the year ended 31 December 2023. 2. There was no publicly announced plan for BAT to purchase its own ordinary shares or ADSs during the year ended 31 December 2023. BAT Annual Report and Form 20-F 2023 Strategic Report Governance Report Financial Statements Other Information Purchase of Shares 399
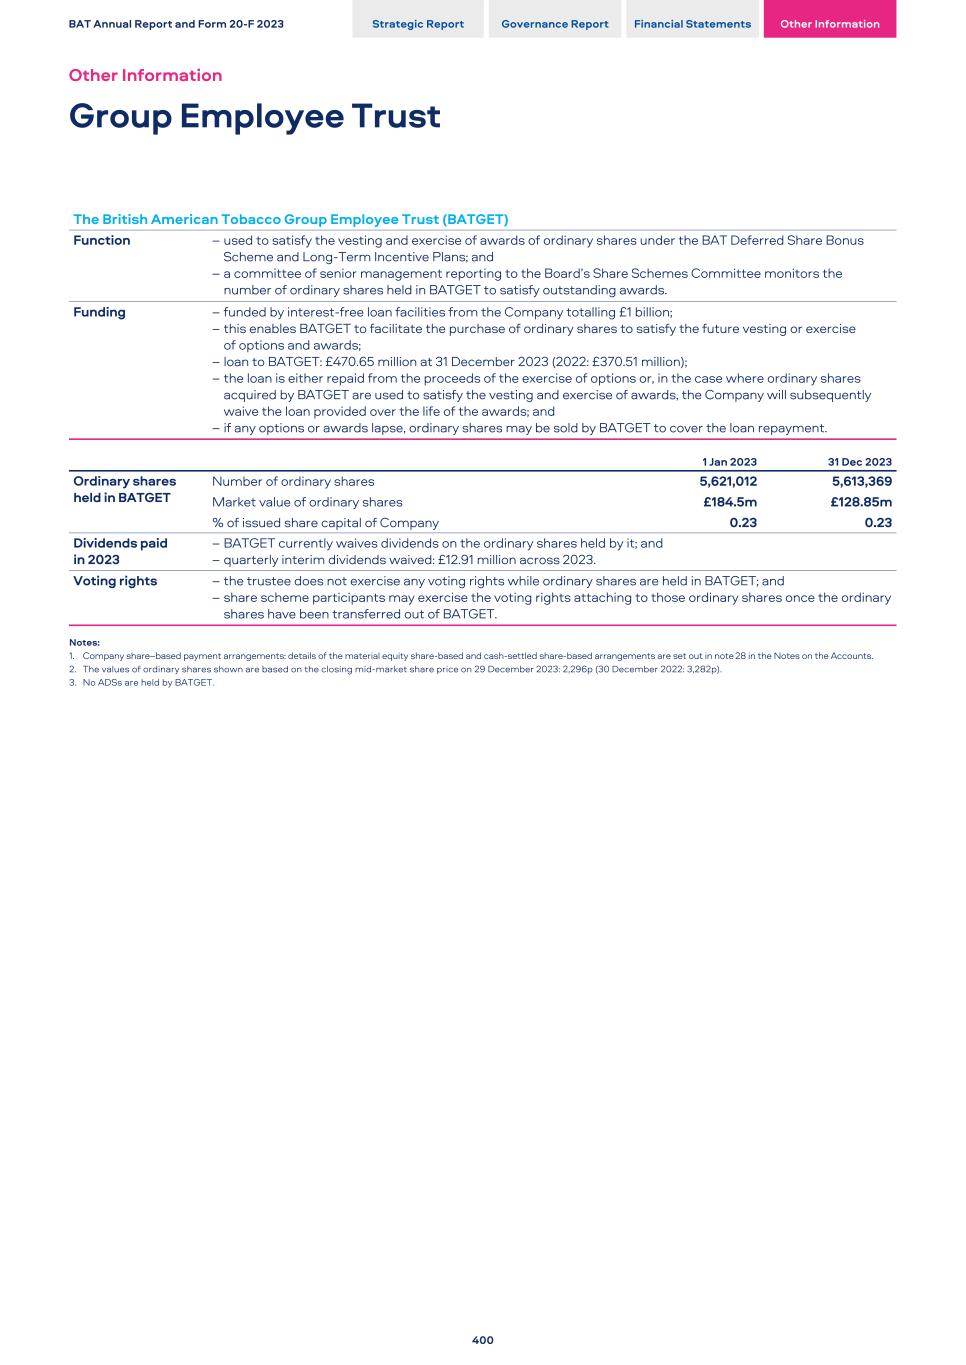
The British American Tobacco Group Employee Trust (BATGET) Function – used to satisfy the vesting and exercise of awards of ordinary shares under the BAT Deferred Share Bonus Scheme and Long-Term Incentive Plans; and – a committee of senior management reporting to the Board’s Share Schemes Committee monitors the number of ordinary shares held in BATGET to satisfy outstanding awards. Funding – funded by interest-free loan facilities from the Company totalling £1 billion; – this enables BATGET to facilitate the purchase of ordinary shares to satisfy the future vesting or exercise of options and awards; – loan to BATGET: £470.65 million at 31 December 2023 (2022: £370.51 million); – the loan is either repaid from the proceeds of the exercise of options or, in the case where ordinary shares acquired by BATGET are used to satisfy the vesting and exercise of awards, the Company will subsequently waive the loan provided over the life of the awards; and – if any options or awards lapse, ordinary shares may be sold by BATGET to cover the loan repayment. 1 Jan 2023 31 Dec 2023 Ordinary shares held in BATGET Number of ordinary shares 5,621,012 5,613,369 Market value of ordinary shares £184.5m £128.85m % of issued share capital of Company 0.23 0.23 Dividends paid in 2023 – BATGET currently waives dividends on the ordinary shares held by it; and – quarterly interim dividends waived: £12.91 million across 2023. Voting rights – the trustee does not exercise any voting rights while ordinary shares are held in BATGET; and – share scheme participants may exercise the voting rights attaching to those ordinary shares once the ordinary shares have been transferred out of BATGET. Notes: 1. Company share–based payment arrangements: details of the material equity share-based and cash-settled share-based arrangements are set out in note 28 in the Notes on the Accounts. 2. The values of ordinary shares shown are based on the closing mid-market share price on 29 December 2023: 2,296p (30 December 2022: 3,282p). 3. No ADSs are held by BATGET. BAT Annual Report and Form 20-F 2023 Strategic Report Governance Report Financial Statements Other Information Other Information Group Employee Trust 400
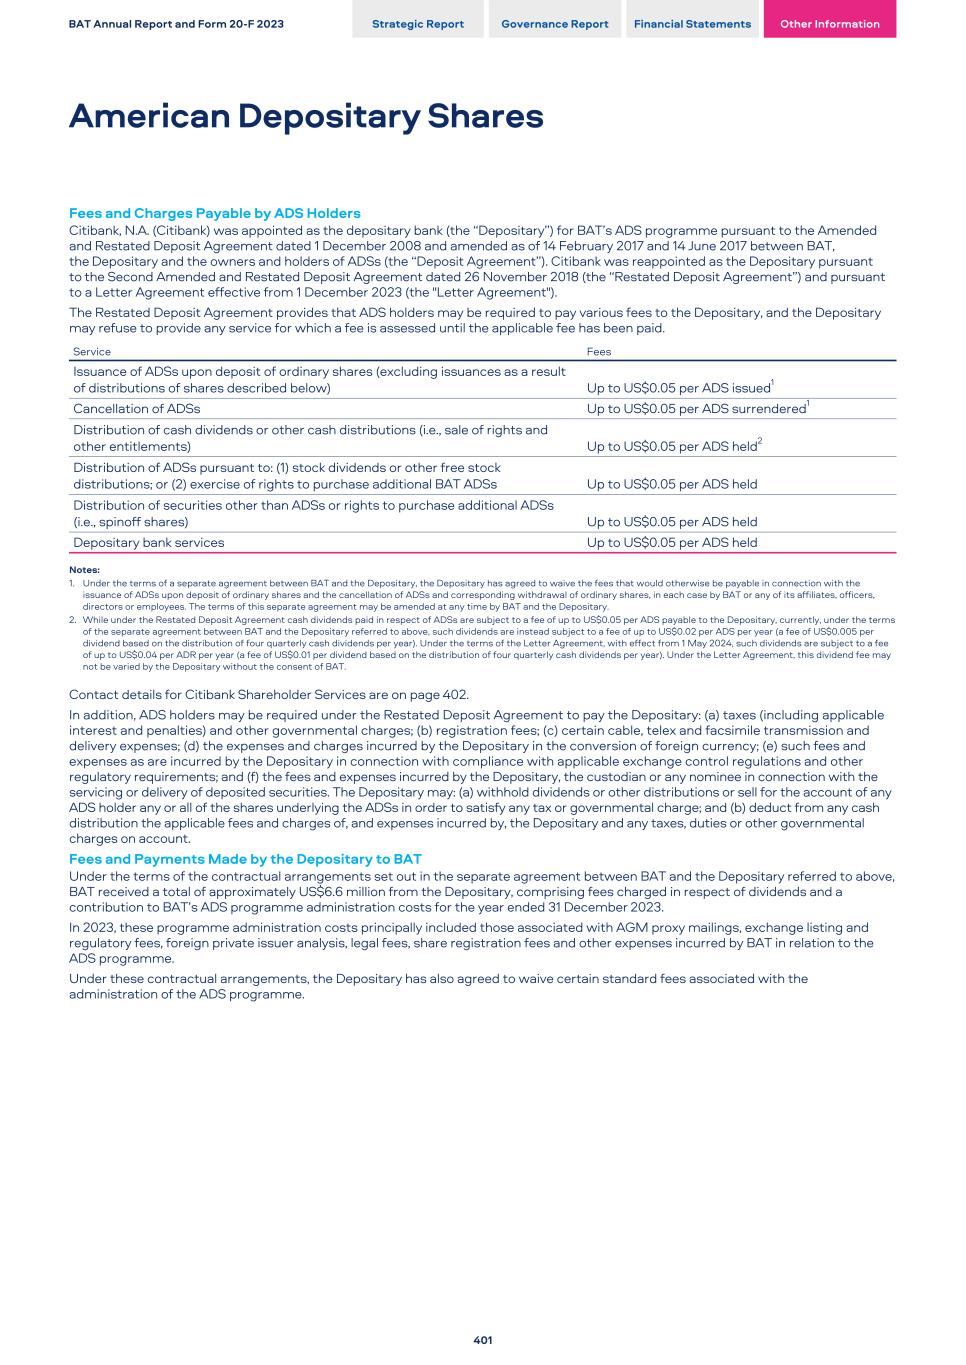
Fees and Charges Payable by ADS Holders Citibank, N.A. (Citibank) was appointed as the depositary bank (the “Depositary”) for BAT’s ADS programme pursuant to the Amended and Restated Deposit Agreement dated 1 December 2008 and amended as of 14 February 2017 and 14 June 2017 between BAT, the Depositary and the owners and holders of ADSs (the “Deposit Agreement”). Citibank was reappointed as the Depositary pursuant to the Second Amended and Restated Deposit Agreement dated 26 November 2018 (the “Restated Deposit Agreement”) and pursuant to a Letter Agreement effective from 1 December 2023 (the "Letter Agreement"). The Restated Deposit Agreement provides that ADS holders may be required to pay various fees to the Depositary, and the Depositary may refuse to provide any service for which a fee is assessed until the applicable fee has been paid. Service Fees Issuance of ADSs upon deposit of ordinary shares (excluding issuances as a result of distributions of shares described below) Up to US$0.05 per ADS issued1 Cancellation of ADSs Up to US$0.05 per ADS surrendered1 Distribution of cash dividends or other cash distributions (i.e., sale of rights and other entitlements) Up to US$0.05 per ADS held2 Distribution of ADSs pursuant to: (1) stock dividends or other free stock distributions; or (2) exercise of rights to purchase additional BAT ADSs Up to US$0.05 per ADS held Distribution of securities other than ADSs or rights to purchase additional ADSs (i.e., spinoff shares) Up to US$0.05 per ADS held Depositary bank services Up to US$0.05 per ADS held Notes: 1. Under the terms of a separate agreement between BAT and the Depositary, the Depositary has agreed to waive the fees that would otherwise be payable in connection with the issuance of ADSs upon deposit of ordinary shares and the cancellation of ADSs and corresponding withdrawal of ordinary shares, in each case by BAT or any of its affiliates, officers, directors or employees. The terms of this separate agreement may be amended at any time by BAT and the Depositary. 2. While under the Restated Deposit Agreement cash dividends paid in respect of ADSs are subject to a fee of up to US$0.05 per ADS payable to the Depositary, currently, under the terms of the separate agreement between BAT and the Depositary referred to above, such dividends are instead subject to a fee of up to US$0.02 per ADS per year (a fee of US$0.005 per dividend based on the distribution of four quarterly cash dividends per year). Under the terms of the Letter Agreement, with effect from 1 May 2024, such dividends are subject to a fee of up to US$0.04 per ADR per year (a fee of US$0.01 per dividend based on the distribution of four quarterly cash dividends per year). Under the Letter Agreement, this dividend fee may not be varied by the Depositary without the consent of BAT. Contact details for Citibank Shareholder Services are on page 402. In addition, ADS holders may be required under the Restated Deposit Agreement to pay the Depositary: (a) taxes (including applicable interest and penalties) and other governmental charges; (b) registration fees; (c) certain cable, telex and facsimile transmission and delivery expenses; (d) the expenses and charges incurred by the Depositary in the conversion of foreign currency; (e) such fees and expenses as are incurred by the Depositary in connection with compliance with applicable exchange control regulations and other regulatory requirements; and (f) the fees and expenses incurred by the Depositary, the custodian or any nominee in connection with the servicing or delivery of deposited securities. The Depositary may: (a) withhold dividends or other distributions or sell for the account of any ADS holder any or all of the shares underlying the ADSs in order to satisfy any tax or governmental charge; and (b) deduct from any cash distribution the applicable fees and charges of, and expenses incurred by, the Depositary and any taxes, duties or other governmental charges on account. Fees and Payments Made by the Depositary to BAT Under the terms of the contractual arrangements set out in the separate agreement between BAT and the Depositary referred to above, BAT received a total of approximately US$6.6 million from the Depositary, comprising fees charged in respect of dividends and a contribution to BAT’s ADS programme administration costs for the year ended 31 December 2023. In 2023, these programme administration costs principally included those associated with AGM proxy mailings, exchange listing and regulatory fees, foreign private issuer analysis, legal fees, share registration fees and other expenses incurred by BAT in relation to the ADS programme. Under these contractual arrangements, the Depositary has also agreed to waive certain standard fees associated with the administration of the ADS programme. BAT Annual Report and Form 20-F 2023 Strategic Report Governance Report Financial Statements Other Information American Depositary Shares 401
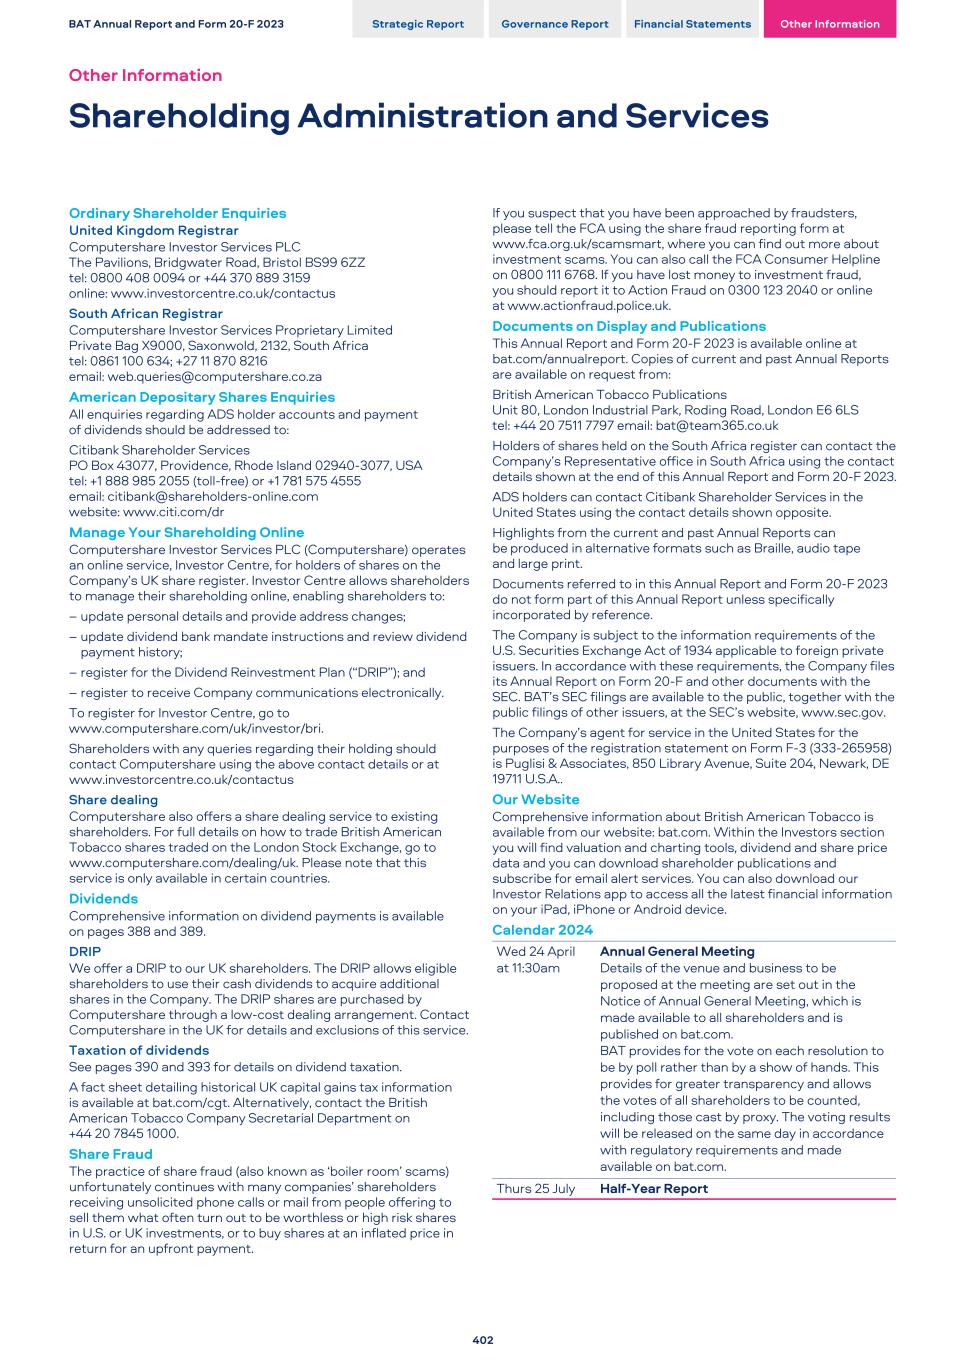
Ordinary Shareholder Enquiries United Kingdom Registrar Computershare Investor Services PLC The Pavilions, Bridgwater Road, Bristol BS99 6ZZ tel: 0800 408 0094 or +44 370 889 3159 online: www.investorcentre.co.uk/contactus South African Registrar Computershare Investor Services Proprietary Limited Private Bag X9000, Saxonwold, 2132, South Africa tel: 0861 100 634; +27 11 870 8216 email: web.queries@computershare.co.za American Depositary Shares Enquiries All enquiries regarding ADS holder accounts and payment of dividends should be addressed to: Citibank Shareholder Services PO Box 43077, Providence, Rhode Island 02940-3077, USA tel: +1 888 985 2055 (toll-free) or +1 781 575 4555 email: citibank@shareholders-online.com website: www.citi.com/dr Manage Your Shareholding Online Computershare Investor Services PLC (Computershare) operates an online service, Investor Centre, for holders of shares on the Company’s UK share register. Investor Centre allows shareholders to manage their shareholding online, enabling shareholders to: – update personal details and provide address changes; – update dividend bank mandate instructions and review dividend payment history; – register for the Dividend Reinvestment Plan (“DRIP”); and – register to receive Company communications electronically. To register for Investor Centre, go to www.computershare.com/uk/investor/bri. Shareholders with any queries regarding their holding should contact Computershare using the above contact details or at www.investorcentre.co.uk/contactus Share dealing Computershare also offers a share dealing service to existing shareholders. For full details on how to trade British American Tobacco shares traded on the London Stock Exchange, go to www.computershare.com/dealing/uk. Please note that this service is only available in certain countries. Dividends Comprehensive information on dividend payments is available on pages 388 and 389. DRIP We offer a DRIP to our UK shareholders. The DRIP allows eligible shareholders to use their cash dividends to acquire additional shares in the Company. The DRIP shares are purchased by Computershare through a low-cost dealing arrangement. Contact Computershare in the UK for details and exclusions of this service. Taxation of dividends See pages 390 and 393 for details on dividend taxation. A fact sheet detailing historical UK capital gains tax information is available at bat.com/cgt. Alternatively, contact the British American Tobacco Company Secretarial Department on +44 20 7845 1000. Share Fraud The practice of share fraud (also known as ‘boiler room’ scams) unfortunately continues with many companies’ shareholders receiving unsolicited phone calls or mail from people offering to sell them what often turn out to be worthless or high risk shares in U.S. or UK investments, or to buy shares at an inflated price in return for an upfront payment. If you suspect that you have been approached by fraudsters, please tell the FCA using the share fraud reporting form at www.fca.org.uk/scamsmart, where you can find out more about investment scams. You can also call the FCA Consumer Helpline on 0800 111 6768. If you have lost money to investment fraud, you should report it to Action Fraud on 0300 123 2040 or online at www.actionfraud.police.uk. Documents on Display and Publications This Annual Report and Form 20-F 2023 is available online at bat.com/annualreport. Copies of current and past Annual Reports are available on request from: British American Tobacco Publications Unit 80, London Industrial Park, Roding Road, London E6 6LS tel: +44 20 7511 7797 email: bat@team365.co.uk Holders of shares held on the South Africa register can contact the Company’s Representative office in South Africa using the contact details shown at the end of this Annual Report and Form 20-F 2023. ADS holders can contact Citibank Shareholder Services in the United States using the contact details shown opposite. Highlights from the current and past Annual Reports can be produced in alternative formats such as Braille, audio tape and large print. Documents referred to in this Annual Report and Form 20-F 2023 do not form part of this Annual Report unless specifically incorporated by reference. The Company is subject to the information requirements of the U.S. Securities Exchange Act of 1934 applicable to foreign private issuers. In accordance with these requirements, the Company files its Annual Report on Form 20-F and other documents with the SEC. BAT’s SEC filings are available to the public, together with the public filings of other issuers, at the SEC’s website, www.sec.gov. The Company’s agent for service in the United States for the purposes of the registration statement on Form F-3 (333-265958) is Puglisi & Associates, 850 Library Avenue, Suite 204, Newark, DE 19711 U.S.A.. Our Website Comprehensive information about British American Tobacco is available from our website: bat.com. Within the Investors section you will find valuation and charting tools, dividend and share price data and you can download shareholder publications and subscribe for email alert services. You can also download our Investor Relations app to access all the latest financial information on your iPad, iPhone or Android device. Calendar 2024 Wed 24 April at 11:30am Annual General Meeting Details of the venue and business to be proposed at the meeting are set out in the Notice of Annual General Meeting, which is made available to all shareholders and is published on bat.com. BAT provides for the vote on each resolution to be by poll rather than by a show of hands. This provides for greater transparency and allows the votes of all shareholders to be counted, including those cast by proxy. The voting results will be released on the same day in accordance with regulatory requirements and made available on bat.com. Thurs 25 July Half-Year Report BAT Annual Report and Form 20-F 2023 Strategic Report Governance Report Financial Statements Other Information Other Information Shareholding Administration and Services 402
| BAT Annual Report and Form 20-F 2023 | Strategic Report | Governance Report | Financial Statements | Other Information | |||||||||||||||||||
| Other Information | |||||||||||||||||||||||
| Exhibits | |||||||||||||||||||||||
The following documents are filed in the SEC EDGAR system, as part of this Annual Report on Form 20-F, and can be viewed on the SEC’s website, www.sec.gov:
Exhibit Number | Description | ||||
| 1 | |||||
| 2.1 | |||||
| 2.2 | |||||
| 2.3 | |||||
| 2.4 | |||||
| 2.5 | |||||
| 2.6 | |||||
| 2.7 | |||||
| 2.8 | |||||
| 2.9 | |||||
| 2.10 | |||||
| 2.11 | |||||
| 2.12 | |||||
| 2.13 | |||||
| 2.14 | |||||
| 2.15 | |||||
| 2.16 | |||||
| 2.17 | |||||
| 2.18 | |||||
| 2.19 | |||||
| 2.20 | |||||
| 2.21 | |||||
| 2.22 | |||||
| 2.23 | |||||
| 2.24 | |||||
| 2.25 | |||||
| 2.26 | |||||
403
| BAT Annual Report and Form 20-F 2023 | Strategic Report | Governance Report | Financial Statements | Other Information | |||||||||||||||||||
| Other Information | |||||||||||||||||||||||
Exhibits Continued | |||||||||||||||||||||||
| 2.27 | |||||
2.28 | Thirty-fourth Supplemental Trust Deed, dated 17 March 2022, by and among B.A.T. International Finance p.l.c., B.A.T Capital Corporation, B.A.T. Netherlands Finance B.V., British American Tobacco p.l.c. and the Law Debenture Trust Corporation p.l.c., further modifying the Trust Deed, dated as of 6 July 1998 (as previously modified and restated) relating to the US$3,000,000,000 (now £25,000,000,000) Euro Medium Term Note Programme.29 | ||||
2.29 | |||||
| 4.1 | |||||
| 4.2 | |||||
| 4.3 | |||||
| 4.4 | |||||
| 4.5 | |||||
| 4.6 | |||||
| 4.7 | |||||
| 4.8 | |||||
4.9 | |||||
| 4.10 | |||||
| 4.11 | |||||
| 4.12 | |||||
| 4.13 | |||||
| 4.14 | |||||
| 4.15 | |||||
| 4.16 | |||||
| 4.17 | |||||
| 4.18 | |||||
4.19 | |||||
4.20* | |||||
| 8 | List of Subsidiaries included on pages 312 to 321 in this report. | ||||
| 11 | |||||
| 12 | |||||
| 13 | |||||
| 15 | |||||
| 17 | |||||
| 97 | |||||
| 101 | Interactive Data Files (formatted in XBRL (Extensible Business Reporting Language) and furnished electronically). | ||||
404
| BAT Annual Report and Form 20-F 2023 | Strategic Report | Governance Report | Financial Statements | Other Information | |||||||||||||||||||
| Other Information | |||||||||||||||||||||||
Notes:
1. Incorporated by reference to Exhibit 99.1 to British American Tobacco p.l.c.’s Form 6-K filed on 19 April 2023.
2. Incorporated by reference to Exhibit 4.1 to BAT’s Registration Statement on Form S-8 (Reg. No. 333-237186) filed on 16 March 2020.
3. Incorporated by reference to Exhibit 2.4 to BAT’s Annual Report on Form 20-F for the year ended 31 December 2017 filed on 15 March 2018.
4. Incorporated by reference to Exhibit 4.2 to BAT’s Registration Statement on Form F-4 (Reg. No. 333-227658) filed on 2 October 2018.
5. Incorporated by reference to Exhibit 4.1 to British American Tobacco p.l.c.’s Form 6-K filed on 6 September 2019.
6. Incorporated by reference to Exhibit 4.2 to British American Tobacco p.l.c.’s Form 6-K filed on 6 September 2019.
7. Incorporated by reference to Exhibit 4.3 to British American Tobacco p.l.c.’s Form 6-K filed on 6 September 2019.
8. Incorporated by reference to Exhibit 4.4 to British American Tobacco p.l.c.’s Form 6-K filed on 6 September 2019.
9. Incorporated by reference to Exhibit 4.5 to British American Tobacco p.l.c.’s Form 6-K filed on 6 September 2019.
10. Incorporated by reference to Exhibit 4.1 to British American Tobacco p.l.c.’s Form 6-K filed on 2 April 2020.
11. Incorporated by reference to Exhibit 4.2 to British American Tobacco p.l.c.’s Form 6-K filed on 2 April 2020.
12. Incorporated by reference to Exhibit 4.3 to British American Tobacco p.l.c.’s Form 6-K filed on 2 April 2020.
13. Incorporated by reference to Exhibit 4.2 to British American Tobacco p.l.c.’s Form 6-K filed on 25 September 2020.
14. Incorporated by reference to Exhibit 4.3 to British American Tobacco p.l.c.’s Form 6-K filed on 25 September 2020.
15. Incorporated by reference to Exhibit 4.4 to British American Tobacco p.l.c.’s Form 6-K filed on 25 September 2020.
16. Incorporated by reference to Exhibit 4.5 to British American Tobacco p.l.c.’s Form 6-K filed on 25 September 2020.
17. Incorporated by reference to Exhibit 4.1 to British American Tobacco p.l.c.’s Form 6-K filed on 16 March 2022.
18. Incorporated by reference to Exhibit 4.2 to British American Tobacco p.l.c.’s Form 6-K filed on 16 March 2022.
19. Incorporated by reference to Exhibit 4.1 to British American Tobacco p.l.c.’s Form 6-K filed on 24 March 2022.
20. Incorporated by reference to Exhibit 4.1 to British American Tobacco p.l.c.’s Form 6-K filed on 19 October 2022.
21. Incorporated by reference to Exhibit 4.1 to British American Tobacco p.l.c.'s Form 6-K filed on 2 August 2023.
22.Incorporated by reference to Exhibit 4.2 to British American Tobacco p.l.c.'s Form 6-K filed on 2 August 2023.
23.Incorporated by reference to Exhibit 4.3 to British American Tobacco p.l.c.'s Form 6-K filed on 2 August 2023.
24.Incorporated by reference to Exhibit 4.4 to British American Tobacco p.l.c.'s Form 6-K filed on 2 August 2023.
25.Incorporated by reference to Exhibit 4.1 to British American Tobacco p.l.c.’s Form 6-K filed on 25 September 2020.
26. Incorporated by reference to Exhibit 4.6 to British American Tobacco p.l.c.’s Form 6-K filed on 25 September 2020.
27. Incorporated by reference to Exhibit 4.3 to British American Tobacco p.l.c.’s Form 6-K filed on 16 March 2022.
28.Incorporated by reference to Exhibit 4.5 to British American Tobacco p.l.c.’s Form 6-K filed on 2 August 2023.
29. Incorporated by reference to Exhibit 4.1 to British American Tobacco p.l.c.’s Registration Statement on Form F-3 (Reg. No. 333-265958) filed on 1 July 2022.
30. Incorporated by reference to Exhibit 10.6 to BAT’s Registration Statement on Form F-4 (Reg. No. 333-217939) filed on 12 May 2017.
31. Incorporated by reference to Exhibit 10.8 to BAT’s Registration Statement on Form F-4 (Reg. No. 333-217939) filed on 12 May 2017.
32. Incorporated by reference to Exhibit 4.6 to BAT’s Annual Report on Form 20-F for the year ended 31 December 2018 filed on 15 March 2019.
33. Incorporated by reference to Exhibit 10.43 to Reynolds American Inc.’s Annual Report on Form 10-K for the fiscal year ended 31 December 2007 filed on 27 February 2008.
34. Incorporated by reference to Exhibit 4 to R.J. Reynolds Tobacco Holdings, Inc.’s Form 8-K dated 24 November 1998.
35. Incorporated by reference to Exhibit 2 to R.J. Reynolds Tobacco Holdings, Inc.’s Form 8-K dated 5 September 1997.
36. Incorporated by reference to Exhibit 2 to R.J. Reynolds Tobacco Holdings, Inc.’s Form 8-K dated 27 January 1998.
37. Incorporated by reference to Exhibit 99.1 to R.J. Reynolds Tobacco Holdings, Inc.’s Quarterly Report on Form 10-Q for the quarter ended 30 March 1998 filed on 15 May 1998.
38. Incorporated by reference to Exhibit 99.2 to R.J. Reynolds Tobacco Holdings, Inc.’s Quarterly Report on Form 10-Q for the quarter ended 30 March 1998 filed on 15 May 1998.
39. Incorporated by reference to Exhibit 99.3 to R.J. Reynolds Tobacco Holdings, Inc.’s Quarterly Report on Form 10-Q for the quarter ended 30 March 1998 filed on 15 May 1998.
40. Incorporated by reference to Exhibit 99.2 to R.J. Reynolds Tobacco Holdings, Inc.’s Quarterly Report on Form 10-Q for the quarter ended 30 June 1998 filed on 14 August 1998.
41. Incorporated by reference to Exhibit 99.4 to R.J. Reynolds Tobacco Holdings, Inc.’s Quarterly Report on Form 10-Q for the quarter ended 30 June 1998 filed on 14 August 1998.
42. Incorporated by reference to Exhibit 99.1 to R.J. Reynolds Tobacco Holdings, Inc.’s Quarterly Report on Form 10-Q for the quarter ended 30 September 1998 filed on 12 November 1998.
43. Incorporated by reference to Exhibit 10.1 to Reynolds American Inc.’s Form 8-K dated 12 March 2013.
44. Incorporated by reference to Exhibit 99.1 to British American Tobacco p.l.c.’s Form 6-K filed on 8 February 2024.
45. Incorporated by reference to Exhibit 11 to BAT’s Annual Report on Form 20-F for the year ended 31 December 2021 filed on 8 March 2022.
46. These certifications are furnished only and are not filed as part of BAT’s Annual Report on Form 20-F for the year ended 31 December 2023.
Certain instruments which define the rights of holders of long-term debt issued by BAT and its subsidiaries are not being filed because the total amount of securities authorised under each such instrument does not exceed 10% of the total consolidated assets of BAT and its subsidiaries. BAT agrees to furnish copies of any or all such instruments to the SEC on request.
* Portions of the exhibit have been omitted because they are both (i) not material and (ii) is the type of information that the Company treats as private or confidential.
405
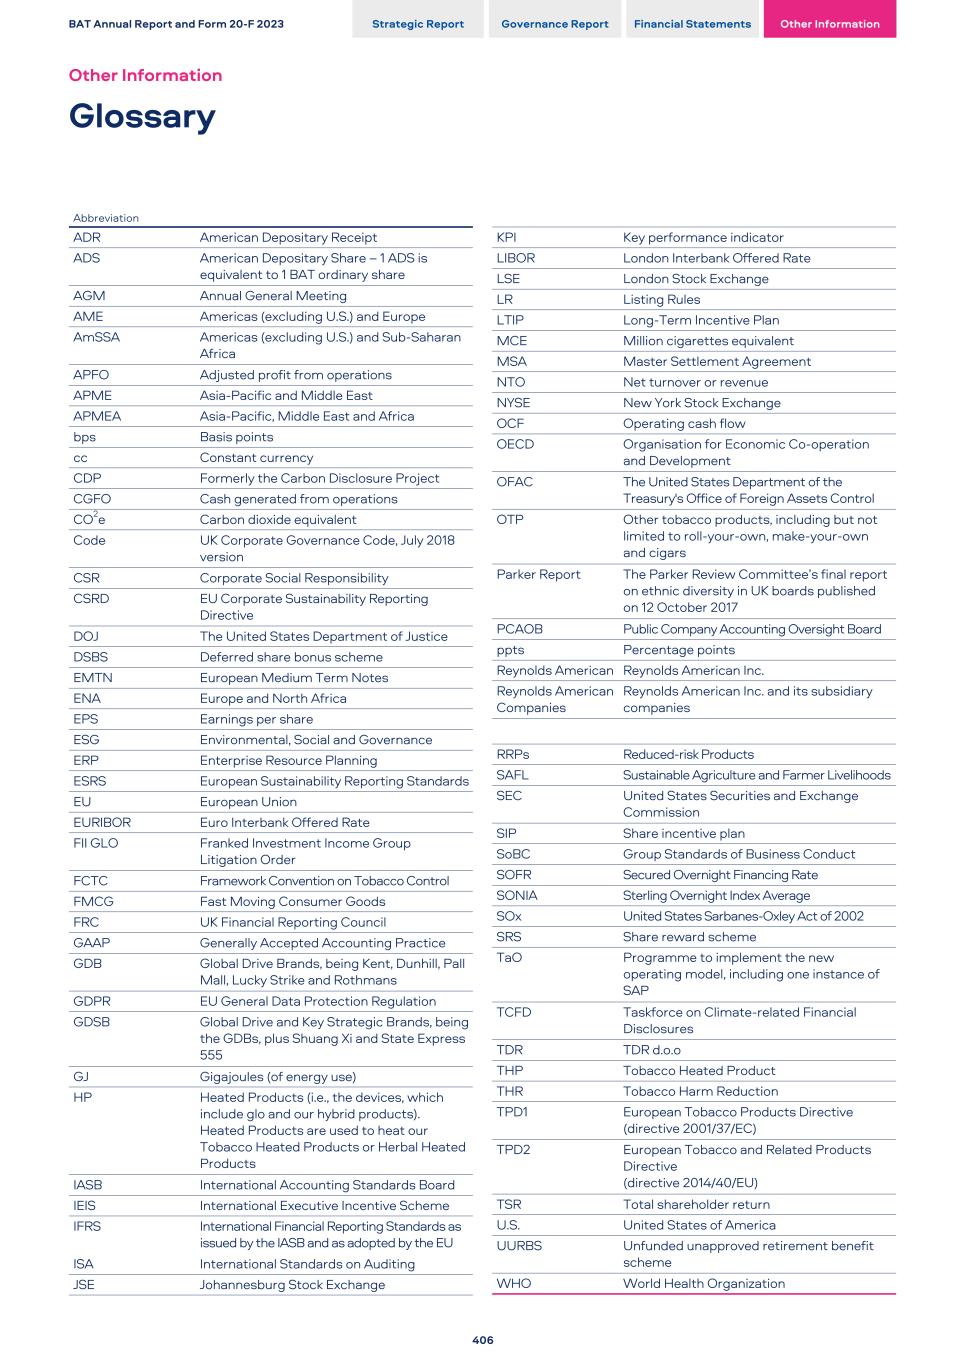
Abbreviation ADR American Depositary Receipt ADS American Depositary Share – 1 ADS is equivalent to 1 BAT ordinary share AGM Annual General Meeting AME Americas (excluding U.S.) and Europe AmSSA Americas (excluding U.S.) and Sub-Saharan Africa APFO Adjusted profit from operations APME Asia-Pacific and Middle East APMEA Asia-Pacific, Middle East and Africa bps Basis points cc Constant currency CDP Formerly the Carbon Disclosure Project CGFO Cash generated from operations CO2e Carbon dioxide equivalent Code UK Corporate Governance Code, July 2018 version CSR Corporate Social Responsibility CSRD EU Corporate Sustainability Reporting Directive DOJ The United States Department of Justice DSBS Deferred share bonus scheme EMTN European Medium Term Notes ENA Europe and North Africa EPS Earnings per share ESG Environmental, Social and Governance ERP Enterprise Resource Planning ESRS European Sustainability Reporting Standards EU European Union EURIBOR Euro Interbank Offered Rate FII GLO Franked Investment Income Group Litigation Order FCTC Framework Convention on Tobacco Control FMCG Fast Moving Consumer Goods FRC UK Financial Reporting Council GAAP Generally Accepted Accounting Practice GDB Global Drive Brands, being Kent, Dunhill, Pall Mall, Lucky Strike and Rothmans GDPR EU General Data Protection Regulation GDSB Global Drive and Key Strategic Brands, being the GDBs, plus Shuang Xi and State Express 555 GJ Gigajoules (of energy use) HP Heated Products (i.e., the devices, which include glo and our hybrid products). Heated Products are used to heat our Tobacco Heated Products or Herbal Heated Products IASB International Accounting Standards Board IEIS International Executive Incentive Scheme IFRS International Financial Reporting Standards as issued by the IASB and as adopted by the EU ISA International Standards on Auditing JSE Johannesburg Stock Exchange KPI Key performance indicator LIBOR London Interbank Offered Rate LSE London Stock Exchange LR Listing Rules LTIP Long-Term Incentive Plan MCE Million cigarettes equivalent MSA Master Settlement Agreement NTO Net turnover or revenue NYSE New York Stock Exchange OCF Operating cash flow OECD Organisation for Economic Co-operation and Development OFAC The United States Department of the Treasury's Office of Foreign Assets Control OTP Other tobacco products, including but not limited to roll-your-own, make-your-own and cigars Parker Report The Parker Review Committee’s final report on ethnic diversity in UK boards published on 12 October 2017 PCAOB Public Company Accounting Oversight Board ppts Percentage points Reynolds American Reynolds American Inc. Reynolds American Companies Reynolds American Inc. and its subsidiary companies RRPs Reduced-risk Products SAFL Sustainable Agriculture and Farmer Livelihoods SEC United States Securities and Exchange Commission SIP Share incentive plan SoBC Group Standards of Business Conduct SOFR Secured Overnight Financing Rate SONIA Sterling Overnight Index Average SOx United States Sarbanes-Oxley Act of 2002 SRS Share reward scheme TaO Programme to implement the new operating model, including one instance of SAP TCFD Taskforce on Climate-related Financial Disclosures TDR TDR d.o.o THP Tobacco Heated Product THR Tobacco Harm Reduction TPD1 European Tobacco Products Directive (directive 2001/37/EC) TPD2 European Tobacco and Related Products Directive (directive 2014/40/EU) TSR Total shareholder return U.S. United States of America UURBS Unfunded unapproved retirement benefit scheme WHO World Health Organization BAT Annual Report and Form 20-F 2023 Strategic Report Governance Report Financial Statements Other Information Other Information Glossary 406
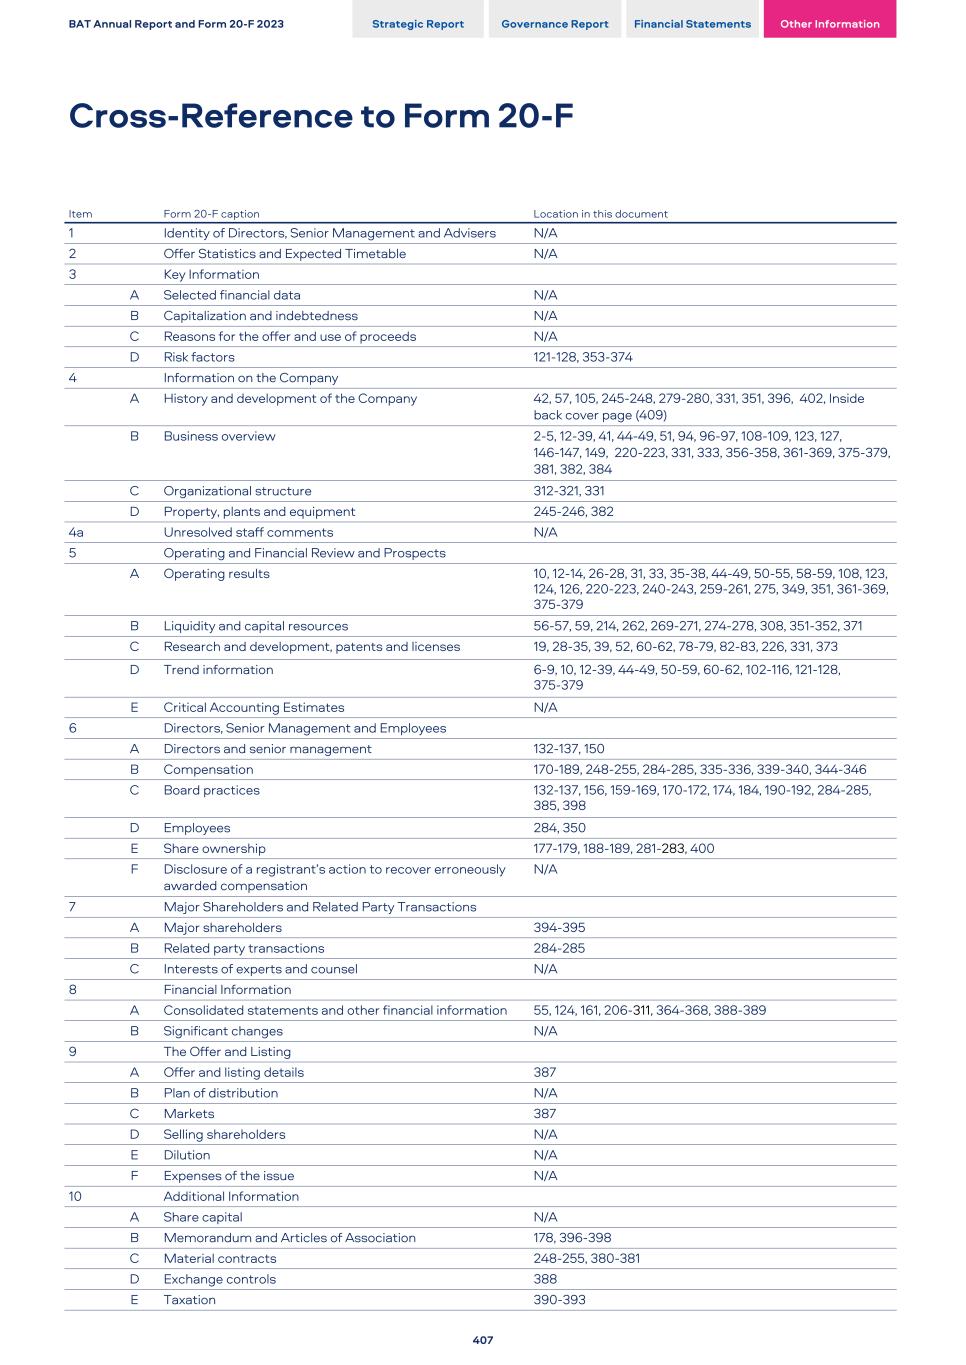
1 Identity of Directors, Senior Management and Advisers N/A 2 Offer Statistics and Expected Timetable N/A 3 Key Information A Selected financial data N/A B Capitalization and indebtedness N/A C Reasons for the offer and use of proceeds N/A D Risk factors 121-128, 353-374 4 Information on the Company A History and development of the Company 42, 57, 105, 245-248, 279-280, 331, 351, 396, 402, Inside back cover page (409) B Business overview 2-5, 12-39, 41, 44-49, 51, 94, 96-97, 108-109, 123, 127, 146-147, 149, 220-223, 331, 333, 356-358, 361-369, 375-379, 381, 382, 384 C Organizational structure 312-321, 331 D Property, plants and equipment 245-246, 382 4a Unresolved staff comments N/A 5 Operating and Financial Review and Prospects A Operating results 10, 12-14, 26-28, 31, 33, 35-38, 44-49, 50-55, 58-59, 108, 123, 124, 126, 220-223, 240-243, 259-261, 275, 349, 351, 361-369, 375-379 B Liquidity and capital resources 56-57, 59, 214, 262, 269-271, 274-278, 308, 351-352, 371 C Research and development, patents and licenses 19, 28-35, 39, 52, 60-62, 78-79, 82-83, 226, 331, 373 D Trend information 6-9, 10, 12-39, 44-49, 50-59, 60-62, 102-116, 121-128, 375-379 E Critical Accounting Estimates N/A 6 Directors, Senior Management and Employees A Directors and senior management 132-137, 150 B Compensation 170-189, 248-255, 284-285, 335-336, 339-340, 344-346 C Board practices 132-137, 156, 159-169, 170-172, 174, 184, 190-192, 284-285, 385, 398 D Employees 284, 350 E Share ownership 177-179, 188-189, 281-283, 400 F Disclosure of a registrant’s action to recover erroneously awarded compensation N/A 7 Major Shareholders and Related Party Transactions A Major shareholders 394-395 B Related party transactions 284-285 C Interests of experts and counsel N/A 8 Financial Information A Consolidated statements and other financial information 55, 124, 161, 206-311, 364-368, 388-389 B Significant changes N/A 9 The Offer and Listing A Offer and listing details 387 B Plan of distribution N/A C Markets 387 D Selling shareholders N/A E Dilution N/A F Expenses of the issue N/A 10 Additional Information A Share capital N/A B Memorandum and Articles of Association 178, 396-398 C Material contracts 248-255, 380-381 D Exchange controls 388 E Taxation 390-393 Item Form 20-F caption Location in this document BAT Annual Report and Form 20-F 2023 Strategic Report Governance Report Financial Statements Other Information Cross-Reference to Form 20-F 407
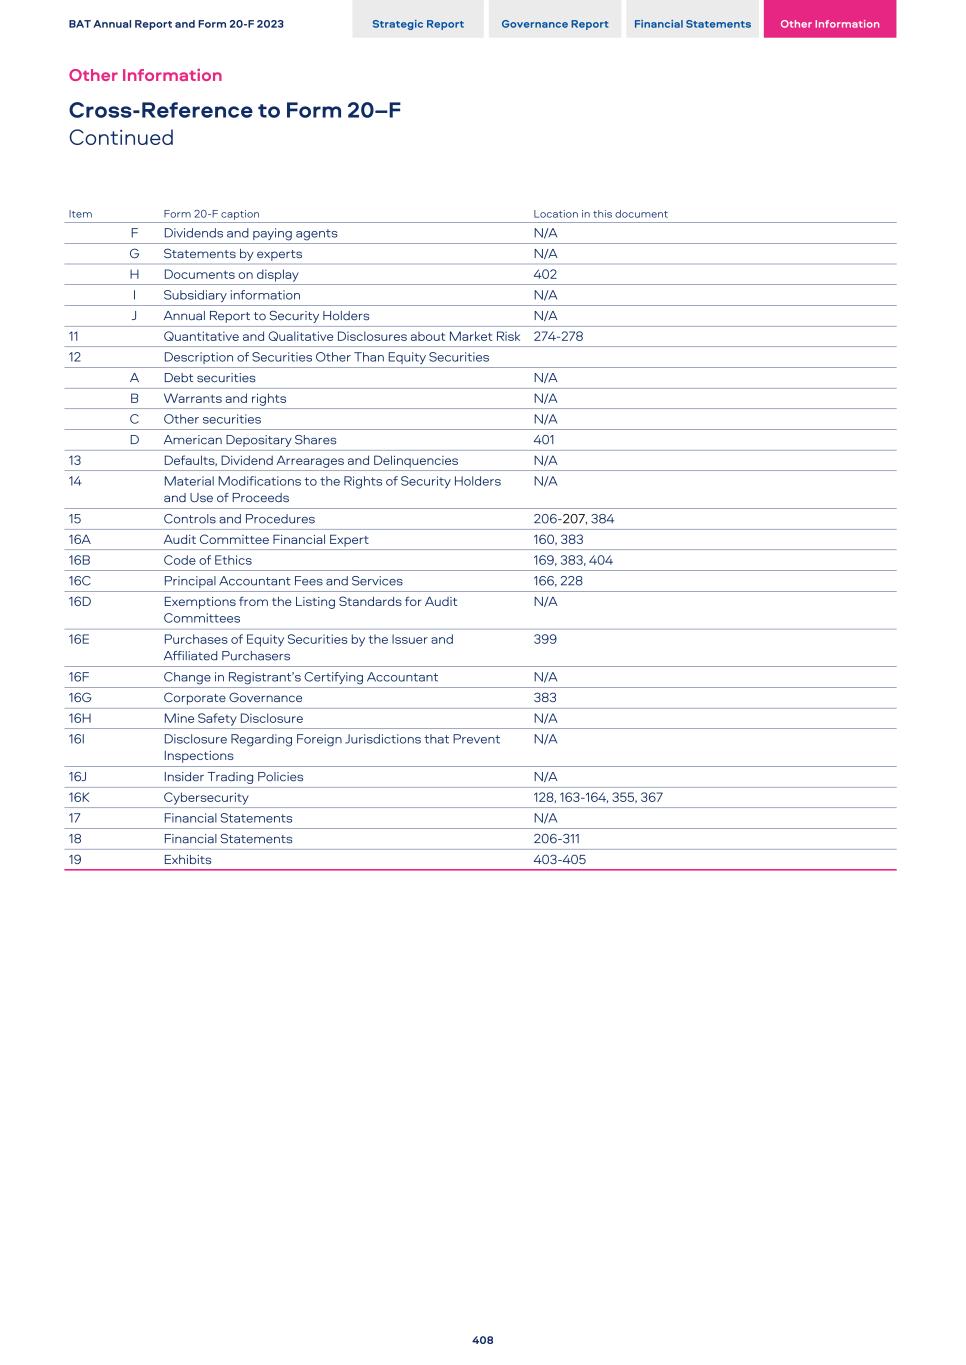
F Dividends and paying agents N/A G Statements by experts N/A H Documents on display 402 I Subsidiary information N/A J Annual Report to Security Holders N/A 11 Quantitative and Qualitative Disclosures about Market Risk 274-278 12 Description of Securities Other Than Equity Securities A Debt securities N/A B Warrants and rights N/A C Other securities N/A D American Depositary Shares 401 13 Defaults, Dividend Arrearages and Delinquencies N/A 14 Material Modifications to the Rights of Security Holders and Use of Proceeds N/A 15 Controls and Procedures 206-207, 384 16A Audit Committee Financial Expert 160, 383 16B Code of Ethics 169, 383, 404 16C Principal Accountant Fees and Services 166, 228 16D Exemptions from the Listing Standards for Audit Committees N/A 16E Purchases of Equity Securities by the Issuer and Affiliated Purchasers 399 16F Change in Registrant’s Certifying Accountant N/A 16G Corporate Governance 383 16H Mine Safety Disclosure N/A 16I Disclosure Regarding Foreign Jurisdictions that Prevent Inspections N/A 16J Insider Trading Policies N/A 16K Cybersecurity 128, 163-164, 355, 367 17 Financial Statements N/A 18 Financial Statements 206-311 19 Exhibits 403-405 Item Form 20-F caption Location in this document BAT Annual Report and Form 20-F 2023 Strategic Report Governance Report Financial Statements Other Information Other Information Cross-Reference to Form 20–F Continued 408
409

SIGNATURE
The registrant hereby certifies that it meets all of the requirements for filing on Form 20-F and that it has duly caused and authorized the undersigned to sign this annual report on its behalf.
Date: 9 February 2024
British American Tobacco p.l.c.
(Registrant)
(Registrant)
| By: | /s/ Caroline Ferland | ||||
Caroline Ferland Company Secretary | |||||