UNITED STATES
SECURITIES AND EXCHANGE COMMISSION
WASHINGTON, D.C. 20549
FORM
(Mark one)
REGISTRATION STATEMENT PURSUANT TO SECTION 12(b) OR (g) OF THE SECURITIES EXCHANGE ACT OF 1934 |
ANNUAL REPORT PURSUANT TO SECTION 13 OR 15(d) OF THE SECURITIES EXCHANGE ACT OF 1934 |
For the fiscal year ended
TRANSITION REPORT PURSUANT TO SECTION 13 OR 15(d) OF THE SECURITIES EXCHANGE ACT OF 1934 |
SHELL COMPANY REPORT PURSUANT TO SECTION 13 OR 15(d) OF THE SECURITIES EXCHANGE ACT OF 1934 |
Commission file number:
(Exact name of Registrant as specified in its charter)
Not Applicable
(Translation of Registrant’s name into English)
Bailiwick of
(Jurisdiction of incorporation or organization)
(Address of principal executive offices)
Telephone: (
Fax:
(Name, Telephone, E-mail and/or Facsimile Number and Address of Company Contact Person)
SECURITIES REGISTERED OR TO BE REGISTERED PURSUANT TO SECTION 12(b) OF THE ACT.
Title of Each Class |
| Trading Symbol(s) |
| Name of Each Exchange on Which Registered |
London Stock Exchange AIM |
SECURITIES REGISTERED OR TO BE REGISTERED PURSUANT TO SECTION 12(g) OF THE ACT. None
SECURITIES FOR WHICH THERE IS A REPORTING OBLIGATION PURSUANT TO SECTION 15(d) OF THE ACT. None
Indicate the number of outstanding shares of each of the issuer’s classes of capital or common stock as of the close of the period covered by the annual report. At December 31, 2023, there were
Indicate by check mark if the registrant is a well-known seasoned issuer, as defined in Rule 405 of the Securities Act. Yes ☐
If this report is an annual or transition report, indicate by check mark if the registrant is not required to file reports pursuant to Section 13 or 15(d) of the Securities Exchange Act of 1934. Yes ☐
Note – Checking the box above will not relieve any registrant required to file reports pursuant to Section 13 or 15(d) of the Securities Exchange Act of 1934 from their obligations under those Sections.
Indicate by check mark whether the registrant (1) has filed all reports required to be filed by Section 13 or 15(d) of the Securities Exchange Act of 1934 during the preceding 12 months (or for such shorter period that the registrant was required to file such reports) and (2) has been subject to such filing requirements for the past 90 days.
Indicate by check mark whether the registrant has submitted electronically every Interactive Data File required to be submitted pursuant to Rule 405 of Regulation S-T (§232.405 of this chapter) during the preceding 12 months (or for such shorter period that the registrant was required to submit such files).
Indicate by check mark whether the registrant is a large accelerated filer, an accelerated filer, a non-accelerated filer, or an emerging growth company. See definition of “large accelerated filer”, “accelerated filer”, and “emerging growth company” in Rule 12b-2 of the Exchange Act. (Check one):
Accelerated filer ☐ | Non-accelerated filer ☐ | Emerging growth company |
If an emerging growth company that prepares its financial statements in accordance with U.S. GAAP, indicate by check mark if the registrant has elected not to use the extended transition period for complying with any new or revised financial accounting standards† provided pursuant to Section 13(a) of the Exchange Act. ☐
† The term “new or revised financial accounting standard” refers to any update issued by the Financial Accounting Standards Board to its Accounting Standards Codification after April 5, 2012.
Indicate by check mark whether the registrant has filed a report on and attestation to its management’s assessment of the effectiveness of its internal control over financial reporting under Section 404(b) of the Sarbanes-Oxley Act (15 U.S.C. 7262(b)) by the registered public accounting firm that prepared or issued its audit report.
If securities are registered pursuant to Section 12(b) of the Act, indicate by check mark whether the financial statements of the registrant included in the filing reflect the correction of an error to previously issued financial statements.
Indicate by check mark whether any of those error corrections are restatements that required a recovery analysis of incentive-based compensation received by any of the registrant’s executive officers during the relevant recovery period pursuant to §240.10D-1(b).
Indicate by check mark which basis of accounting the registrant has used to prepare the financial statements included in this filing.
If “Other” has been checked in response to the previous question, indicate by check mark which financial statement item the registrant has elected to follow. Item 17 ☐ Item 18 ☐
If this is an annual report, indicate by check mark whether the registrant is a shell company (as defined in Rule 12b-2 of the Exchange Act). Yes
(APPLICABLE ONLY TO ISSUERS INVOLVED IN BANKRUPTCY PROCEEDINGS DURING THE PAST FIVE YEARS)
Indicate by check mark whether the registrant has filed all documents and reports required to be filed by Sections 12, 13 or 15(d) of the Securities Exchange Act of 1934 subsequent to the distribution of securities under a plan confirmed by a court. Yes ☐ No ☐
Forward-looking statements
In addition to statements of historical fact, this annual report on Form 20-F for the year ended December 31, 2023 (this “Annual Report”) contains “forward-looking statements” within the meaning of Section 21E of the US Securities Exchange Act of 1934, as amended (the “Exchange Act”). The disclosure and analysis set forth in this Annual Report include assumptions, expectations, projections, intentions and beliefs about future events in a number of instances, particularly in relation to our operations, cash flows, financial position, plans, strategies, business prospects, changes and trends in our business and the markets in which we operate. These statements are intended as “forward-looking statements”. In some cases, predictive, future-tense or forward-looking words such as “aim”, “anticipate”, “believe”, “continue”, “could”, “estimate”, “expect”, “forecast”, “guidance”, “intend”, “may”, “plan”, “potential”, “predict”, “projected”, “should” or “will” or the negative of such terms or other comparable terminology are intended to identify forward-looking statements, but are not the exclusive means of identifying such statements. In addition, we and our representatives may from time to time make other oral or written statements that are forward-looking, including in our other periodic reports that we file with, or furnish to, the US Securities and Exchange Commission (the “SEC”), other information made available to our security holders and other written materials. By their nature, forward-looking statements involve known and unknown risks, uncertainties and other factors because they relate to events and depend on circumstances that may or may not occur in the future. We caution that forward-looking statements are not guarantees of future performance and are based on numerous assumptions, expectations, projections, intentions and beliefs and that our actual results of operations, including our financial position and liquidity, and the development of the industry in which we operate may differ materially from (and be more negative than) those made in, or suggested by, the forward-looking statements contained in this Annual Report. In addition, even if our results of operations, including our financial position and liquidity, and the development of the industry in which we operate are consistent with the forward-looking statements contained in this Annual Report, those results of operations or developments may not be indicative of results of operations or developments in subsequent periods.
Factors that might cause future results of operations or developments to differ include, among others, the following:
| ▪ | Adverse litigation outcomes and timing of resolution of litigation matters |
| ▪ | Our ability to identify and select suitable legal finance assets |
| ▪ | Improper use or disclosure of, or access to, privileged information under our control due to cybersecurity breaches, unauthorized use or theft |
| ▪ | Inaccuracy or failure of the probabilistic model and decision science tools, including artificial intelligence (“AI”) tools, we use to predict the returns on our legal finance assets and in our operations |
| ▪ | Changes and uncertainty in laws, regulations and rules relating to the legal finance industry, including those relating to privileged information and/or disclosure and enforceability of legal finance arrangements |
| ▪ | Inadequacies in our due diligence process or unforeseen developments |
| ▪ | Credit risk and concentration risk relating to our legal finance assets |
| ▪ | Lack of liquidity of our legal finance assets and commitments that are in excess of our available capital |
| ▪ | Our ability to obtain attractive external capital or to refinance our outstanding indebtedness and our ability to raise capital to meet our liquidity needs |
| ▪ | Competitive factors and demand for our services and capital |
| ▪ | Negative publicity or public perception of the legal finance industry or us |
| ▪ | Valuation uncertainty with respect to the fair value of our capital provision assets |
| ▪ | Current and future legal, political and economic forces, including uncertainty surrounding the effects, severity and duration of public health threats and/or military actions |
| ▪ | Potential liability from litigation and legal proceedings against us |
| ▪ | Our ability to retain key personnel |
| ▪ | Improper functioning of our information systems or those of our third-party service providers |
Burford Capital Annual Report 2023 3
| ▪ | Failure to maintain effective internal control over financial reporting or effective disclosure controls and procedures |
| ▪ | Other factors discussed under “Risk factors” |
These factors should not be construed as exhaustive and should be read in conjunction with the other cautionary statements contained in this Annual Report and other periodic reports that we file with, or furnish to, the SEC. New factors emerge from time to time, and it is not possible for us to predict all of them. Further, we cannot assess the impact of each such factor on our business or the extent to which any factor or combination of factors may cause actual results to be materially different from those contained in any forward-looking statement.
The forward-looking statements speak only as of the date of this Annual Report and, except as required by applicable law, we undertake no obligation to update or revise any forward-looking statements contained in this Annual Report, whether as a result of new information, future events or otherwise.
Summary of risk factors
Risks relating to our business and industry
| ▪ | Litigation outcomes are risky and difficult to predict, and a loss in a litigation matter may result in the total loss of our capital associated with that matter. |
| ▪ | Our revenues, earnings and cash flows can vary materially between periods as both the timing of resolution and the outcome of litigation matters are difficult to predict. |
| ▪ | Our success depends on our ability to identify and select suitable legal finance assets to finance, and our failure to do so could have a material adverse effect on our business, financial position, results of operations and/or liquidity. |
| ▪ | Our business and operations could suffer if we are not able to prevent improper use or disclosure of, or access to, privileged information under our control due to cybersecurity breaches, unauthorized use or theft. |
| ▪ | The inaccuracy or failure of the probabilistic model and decision science tools, including AI tools, we use to predict the returns on our legal finance assets and in our operations could have a material adverse effect on our business. |
| ▪ | The laws relating to privileged information are complex and continue to evolve, and any adverse court rulings, changes in law or other developments could impair our ability to conduct effective due diligence on potential legal finance assets. |
| ▪ | The due diligence process that we undertake in connection with financing legal finance assets may not reveal all facts that may be relevant in connection with such financing. |
| ▪ | Investors will not have an opportunity to independently evaluate our legal finance assets. |
| ▪ | We are subject to credit risk relating to our various legal finance assets that could adversely affect our business, financial position, results of operations and/or liquidity. |
| ▪ | Our portfolio may be concentrated in cases likely to have correlated results, and we have a number of assets involving the same counterparty. |
| ▪ | The lack of liquidity of our legal finance assets may adversely affect our business, financial position, results of operations and/or liquidity. |
| ▪ | We have commitments that are in excess of our available capital. |
| ▪ | Changes in market conditions may negatively impact our ability to obtain attractive external capital or to refinance our outstanding indebtedness and may increase the cost of such financing or refinancing if it is obtained. |
| ▪ | We face substantial competition for opportunities with respect to legal finance assets, which could delay commitment and/or deployment of our capital, reduce returns and result in losses. |
| ▪ | If the lawyers we rely on to prosecute and/or defend claims do not exercise due skill and care, or the interests of their clients do not align with ours, there may be a material adverse effect on the value of our legal finance assets. |
| ▪ | If the commitments we make on behalf of our private funds perform poorly, we may not earn asset management fees and/or performance fees, and our ability to raise capital for future funds may be materially |
4 Burford Capital Annual Report 2023
| and adversely affected. |
| ▪ | A significant portion of our AUM (as defined below) is attributable to private funds with a single investor. |
| ▪ | We face competition for investments in our asset management business and may not be successful in raising private funds in the future. |
| ▪ | Negative publicity or public perception of the legal finance industry or us could adversely affect our reputation, business, financial position, results of operations and/or liquidity. |
| ▪ | We report our capital provision assets at fair value, which may result in us recognizing non-cash income that may never be realized. |
| ▪ | Legal, political and economic uncertainty surrounding the effects, severity and duration of public health threats could adversely affect our business, financial position, results of operations and/or liquidity. |
| ▪ | Expectations relating to environmental, social and governance (“ESG”) considerations could expose us to potential liabilities, increased costs and reputational harm and adversely affect our business, financial position, results of operations and/or liquidity. |
| ▪ | There are inherent uncertainties involved in estimates, judgments and assumptions used in the preparation of our consolidated financial statements. |
| ▪ | Our past performance may not be indicative of our future results of operations. |
| ▪ | Litigation and legal proceedings against us could adversely impact our business, financial position, results of operations and/or liquidity. |
| ▪ | Our success depends substantially on the continued retention of certain key personnel and our ability to hire and retain qualified personnel in the future to support our growth and execute our business strategies. |
| ▪ | Our international operations subject us to increased risks. |
| ▪ | We may face exposure to foreign currency exchange rate fluctuations and may hold unhedged securities positions. |
| ▪ | The tax treatment of our financing agreements is subject to significant uncertainty. |
Risks relating to regulation
| ▪ | The laws, regulations and rules relating to legal finance are evolving and may be uncertain, which may have negative consequences for the value or enforcement of our contractual agreements with our counterparties, our ability to do business in certain jurisdictions or our cost of doing business. |
| ▪ | Our asset management business is highly regulated, and changes in regulation or regulatory violations could adversely affect our business. |
| ▪ | We are subject to the risk of being deemed an investment company. |
Risks relating to cybersecurity, third-party service providers, information systems and data privacy and protection
| ▪ | Cybersecurity risks could result in the loss of data, interruptions in our business or damage to our reputation and subject us to regulatory actions, increased costs and financial losses, any of which could have a material adverse effect on our business, financial position, results of operations and/or liquidity. |
| ▪ | The failure of our third-party service providers to fulfill their obligations, or misconduct by our third-party service providers, may have a material adverse effect on our business, financial position, results of operations and/or liquidity. |
| ▪ | Our operations are dependent on the proper functioning of information systems. |
| ▪ | We are required to maintain the privacy and security of personal information and comply with applicable data privacy and protection laws and regulations. |
Risks relating to our indebtedness
| ▪ | We may not be able to generate sufficient cash to service our indebtedness and may be forced to take other actions to meet our obligations under our indebtedness, which may not be successful. |
| ▪ | Despite our level of indebtedness, we may be able to incur substantial additional indebtedness, which could further exacerbate the risks associated with our existing indebtedness. |
Risks relating to our ordinary shares
| ▪ | We face certain risks relating to our ordinary shares, including fluctuations in the trading price and volume of |
Burford Capital Annual Report 2023 5
| our ordinary shares, lack of assurance that we will pay dividends or distributions on our ordinary shares and declines in the market price of our ordinary shares as a result of future issuances or sales of our securities. |
| ▪ | We face certain risks relating to the requirements of being a US public company as well as our current status as a foreign private issuer and our expected loss of such status. |
| ▪ | The lack of available evidence to demonstrate the precision of management’s review of the process to determine certain assumptions used in the measurement of the fair value of our capital provision assets that resulted in the identification of a material weakness in our internal control over financial reporting and the determination that our internal control over financial reporting and disclosure controls and procedures were not effective could impact investors’ views on the reliability of our consolidated financial statements and could result in loss of investor confidence, shareholder litigation or adverse regulatory consequences, any of which could cause the market value of our ordinary shares or debt securities to decline or impact our ability to access the capital markets. |
Risks relating to our incorporation in Guernsey
| ▪ | We face certain risks relating to our incorporation in Guernsey, including differences in rights and protections afforded to our shareholders under Guernsey law, insolvency laws of Guernsey being less favorable than US bankruptcy laws and complexities of effecting service of US court process or enforcement of US judgments. |
Certain terms used in this Annual Report
In this Annual Report, references to “Burford”, “we”, “us” or “our” refer to Burford Capital Limited and its subsidiaries, unless the context requires otherwise.
Certain additional terms used in this Annual Report are set forth below:
Advantage Fund
Burford Advantage Master Fund LP, a private fund focused on pre-settlement litigation strategies where litigation risk remains, but the risk is anticipated to be lower than that of our core legal finance business. Investors in the Advantage Fund include third-party limited partnerships as well as Burford’s balance sheet. Assets held by the Advantage Fund are recorded as capital provision-indirect assets.
Alternative strategies
Encompasses (i) lower risk legal finance, (ii) post-settlement finance and (iii) complex strategies that provide lower but attractive risk-adjusted returns.
Asset management
Includes our activities administering the private funds we manage for third-party investors.
Asset recovery
Pursuit of enforcement of an unpaid legal judgment, which may include our financing of the cost of such pursuit and/or judgment enforcement.
BAIF
Burford Alternative Income Fund LP, a private fund focused on post-settlement matters.
BAIF II
Burford Alternative Income Fund II LP, a private fund focused on post-settlement matters.
BCIM
Burford Capital Investment Management LLC, a wholly owned indirect subsidiary of Burford Capital Limited, serves as the investment adviser to all of our private funds and is registered under the US Investment Advisers Act of 1940, as amended (the “Investment Advisers Act”).
BOF
Burford Opportunity Fund LP, a private fund focused on pre-settlement legal finance matters.
6 Burford Capital Annual Report 2023
BOF-C
Burford Opportunity Fund C LP, a private fund through which a sovereign wealth fund invests in pre-settlement legal finance matters under the sovereign wealth fund arrangement.
Capital provision assets
We subdivide our capital provision assets into two categories:
| ▪ | “Direct”, which includes all of our capital provision assets that we have originated directly (i.e., not through participation in a private fund) from our balance sheet. We also include direct (i.e., not through participation in a private fund) complex strategies assets in this category. See note 3 (Supplemental cash flow data) to our consolidated financial statements for additional information. |
| ▪ | “Indirect”, which includes the balance sheet’s participations in one of our private funds (i.e., the Advantage Fund). |
Claimant
The party asserting a right or title in a legal proceeding, in particular in arbitration matters.
Claim family
A group of legal finance assets with a related underlying claim shared by a number of different claimants.
Colorado
Colorado Investments Limited, an exempted company that was established for the secondary sale of some of our entitlement in the YPF-related Petersen matter.
COLP
BCIM Credit Opportunities, LP, a private fund focused on post-settlement matters.
Complex strategies
Encompasses our activities providing capital as a principal in legal- or regulatory-related assets, often securities, debt and other financial assets, where a significant portion of the expected return arises from the outcome of legal or regulatory activity.
Consolidated funds
Certain of our private funds in which, because of our investment in and/or control of such private funds, we are required under the generally accepted accounting principles in the United States (“US GAAP”) to consolidate the minority limited partner’s interests in such private funds and include the full financial results of such private funds within our consolidated financial statements. At the date of this Annual Report, BOF-C and the Advantage Fund are consolidated funds.
Core legal finance
Provision of capital and expertise, to clients or as a principal, in connection with (i) the underlying asset value of litigation claims and the enforcement of settlements, judgments and awards, (ii) the amount paid to law firms as legal fees and expenses and (iii) the value of assets affected by litigation.
Defendant
The party against whom a civil action is brought, in particular in litigation matters.
Deployment
Financing provided for an asset, which adds to our deployed cost in such asset.
Deferred Compensation Plan
Our deferred compensation plan, under which a specified group of employees can elect to defer a portion of their compensation until future years.
Burford Capital Annual Report 2023 7
Definitive commitments
Commitments where we are contractually obligated to advance incremental capital and failure to do so would typically result in adverse contractual consequences (such as a dilution in our returns or the loss of our deployed capital in a case).
Discretionary commitments
Commitments where we are not contractually obligated to advance capital and generally would not suffer adverse financial consequences from not doing so.
Fair value adjustment
The amount of unrealized gain or loss recognized in our consolidated statements of operations in the relevant period and added to or subtracted from, as applicable, the asset or liability value in our consolidated statements of financial position.
Judgment debtor
A party against whom there is a final adverse court award.
Judgment enforcement
The activity of using legal and financial strategies to force a judgment debtor to pay an adverse award made by a court.
Legal finance
Our legal finance products and services comprise (i) core legal finance and (ii) alternative strategies.
Legal risk management
Matters where we provide some form of legal risk arrangement, such as an indemnity or insurance for adverse legal costs.
Litigation
We use the term litigation colloquially to refer to any type of matter involved in the litigation, arbitration or regulatory process and the costs and legal fees associated therewith.
Lower risk legal finance
Pre-settlement litigation assets with lower risk and lower expected returns than assets included in our core legal finance portfolio. At the date of this Annual Report, our lower risk legal finance activity occurs primarily in the Advantage Fund.
LTIP
The Burford Capital 2016 Long Term Incentive Plan, as amended and renewed from time to time, for the awards of RSUs (as defined below) to employees.
Monetization
The acceleration of a portion of the expected value of a litigation or arbitration matter prior to resolution of such matter, which permits a client to convert an intangible claim or award into tangible cash on a non-recourse basis.
Net realized gain or loss
The sum of realized gains and realized losses.
Non-consolidated funds
Certain of our private funds that we are not required to include within our consolidated financial statements but include within Group-wide data. At the date of this Annual Report, (i) BCIM Partners II, LP, (ii) BCIM Partners III, LP, (iii) COLP, (iv) BOF, (v) BAIF and (vi) BAIF II and any “sidecar” funds are non-consolidated funds.
Plaintiff
The party who institutes a legal action or claim, in particular in litigation matters.
8 Burford Capital Annual Report 2023
Portfolio
Includes deployed cost, net unrealized gains or losses and undrawn commitments.
Portfolio finance
Legal finance assets with multiple paths to realization, such as financing for a pool of litigation claims.
Post-settlement finance
Includes our financing of legal-related assets in situations where litigation has been resolved, such as financing of settlements and law firm receivables. At the date of this Annual Report, our post-settlement activity occurs primarily in COLP, BAIF and BAIF II.
Privileged information
Confidential information that is protected from disclosure due to the application of a legal privilege or other doctrine, including attorney work product, depending on the laws of the relevant jurisdiction.
Realization
A legal finance asset is realized when the asset is concluded (i.e., when litigation risk has been resolved). A realization will result in us receiving cash or, occasionally, non-cash assets, or recognizing a due from settlement receivable, reflecting what we are owed on the asset.
Realized gain or loss
Reflects the total amount of gain or loss, relative to cost, generated by a legal finance asset when it is realized, calculated as realized proceeds less deployed cost, without regard for any previously recognized fair value adjustment.
Respondent
The party against whom a civil action is brought, in particular in arbitration matters.
RSUs
Restricted stock units awarded to employees under the LTIP.
Single-case finance
Legal finance assets that are subject to binary legal risk, such as a single filed litigation or arbitration matter with one plaintiff or group of plaintiffs and one defendant or group of defendants.
Strategic Value Fund
BCIM Strategic Value Master Fund, LP, a private fund that deployed capital in certain complex strategies assets. Investors in the Strategic Value Fund included third-party limited partners as well as Burford’s balance sheet. Assets held by the Strategic Value Fund were recorded as capital provision-indirect assets, and the Strategic Value Fund was a consolidated fund. At December 31, 2023, all assets held at the Strategic Value Fund have concluded, and the Strategic Value Fund was liquidated.
Sovereign wealth fund arrangement
The agreement we have entered into with a sovereign wealth fund pursuant to which it provides financing for a portion of our legal finance assets through BOF-C.
Transfers to realizations
The amount of fair value adjustment previously recognized on a legal finance asset, which is subsequently reversed in the period when a realized gain or loss is recognized.
Unrealized gain or loss
Represents the fair value of our legal finance assets over or under their deployed cost, as determined in accordance with the requirements of the applicable US GAAP standards, for the relevant financial reporting period (consolidated statements of operations) or cumulatively (consolidated statements of financial position).
Vintage
Refers to the calendar year in which a legal finance commitment is initially made.
Burford Capital Annual Report 2023 9
YPF-related assets
Refers to our Petersen and Eton Park legal finance assets, which are two claims relating to the Republic of Argentina’s nationalization of YPF S.A., the Argentine energy company.
Business
History and development
We are composed of our parent company, Burford Capital Limited, and a number of wholly owned subsidiaries in various jurisdictions through which we conduct our operations and deploy capital into our legal finance assets. Burford Capital LLC is a wholly owned indirect subsidiary of Burford Capital Limited and our primary operating company in the United States, and Burford Capital (UK) Limited is a wholly owned indirect subsidiary of Burford Capital Limited and our primary operating company in the United Kingdom. These two entities provide various corporate and investment advisory services to other group companies. Our parent company, Burford Capital Limited, does not have any operations or employees. See “—Organizational structure and significant subsidiaries” for additional information with respect to our organizational structure and significant subsidiaries.
Burford Capital Limited was incorporated in the Bailiwick of Guernsey (“Guernsey”) as a company limited by shares on September 11, 2009. Burford Capital Limited has a single class of ordinary shares, which were admitted to trading on AIM, a market operated by the London Stock Exchange (“AIM”), on October 21, 2009 and on the New York Stock Exchange (the “NYSE”) on October 19, 2020, in each case, under the symbol “BUR”. Our subsidiaries have issued bonds traded on the Main Market of the London Stock Exchange and debt securities through private placement transactions under Rule 144A and Regulation S under the Securities Act of 1933, as amended (the “Securities Act”). See note 13 (Debt) to our consolidated financial statements and “Equity and debt securities” for additional information with respect to our equity and debt securities.
During 2020, we registered with the SEC as a foreign private issuer, which, among other things, allows us to issue annual consolidated financial statements on Form 20-F and interim condensed consolidated financial statements on Form 6-K and exempts us from certain provisions applicable to US domestic public companies. Depending on whether the majority of our ordinary shares will be held in the United States at June 30, 2024, we may lose our status as a “foreign private issuer” as soon as the beginning of 2025 and will thereafter be subject to the same disclosure and financial reporting requirements as US domestic public companies and will no longer be permitted to follow our home country practice in lieu of the corporate governance requirements of the NYSE. See “Risk factors—Risks relating to our ordinary shares—We are currently a foreign private issuer within the meaning of the rules under the Exchange Act and, as such, we are exempt from certain provisions applicable to US domestic public companies”, “Risk factors—Risks relating to our ordinary shares—As a foreign private issuer whose ordinary shares are listed on the NYSE, we currently follow certain home country corporate governance practices instead of certain NYSE requirements” and “Risk factors—Risks relating to our ordinary shares—Our expected loss of foreign private issuer status will increase our regulatory and compliance costs” for additional information with respect to our status as a foreign private issuer.
We maintain our registered address at Oak House, Hirzel Street, St. Peter Port, Guernsey GY1 2NP. Our telephone number at our registered address is +44 1481 723 450.
Our industry
In recent years, certain trends have fueled the growth of the legal finance industry. In particular, an increasing number of corporations prefer to pay law firms for success rather than on an hourly fee basis. However, many law firms operate as cash businesses with comparatively limited balance sheet capacity and often need the steady stream of income that hourly fees provide. Legal finance has grown rapidly over the past decade to bridge this gap. In addition, we believe that legal departments at some corporations may generally feel pressure to extract value from their litigation claims, and legal finance gives them a tool to do so.
We believe our addressable market to be focused on three areas of legal activity: (i) the underlying asset value of litigation claims and the enforcement of settlements, judgments and awards; (ii) the amount paid to law firms as legal fees and expenses; and (iii) the value of assets affected by litigation. We believe that each of these areas is of significant size and much greater than the supply of capital available and that we are at an early stage of market development. We continuously look for new opportunities to capitalize on deploying capital into, or otherwise generating returns from, the legal finance sector.
10 Burford Capital Annual Report 2023
Products and services
Legal finance
Our legal finance products and services comprise (i) core legal finance and (ii) alternative strategies. Information about our products and services should be read in conjunction with "Operating and financial review and prospects", including presentation of our operating segments, and our consolidated financial statements contained elsewhere in this Annual Report.
We allocate potential assets to different pools of capital according to our allocation policy based on their characteristics, risk levels and anticipated returns. See “—Asset management” for additional information with respect to our allocation policy.
Core legal finance
Our core legal finance business provides capital and expertise in connection with the three areas of legal activity identified above, namely (i) the underlying asset value of litigation claims and the enforcement of settlements, judgments and awards, (ii) the amount paid to law firms as legal fees and expenses and (iii) the value of assets affected by litigation. Our clients include a number of the world’s largest law firms and corporations, and our offerings enable them to remove cost and risk associated with legal claims, accelerate the realization of cash from pending claims, increase capital available for other business purposes, recover assets from judgment debtors and/or generally improve risk management while adding budgetary certainty, among other things. In addition to providing capital to clients, we sometimes act as a principal. As a general rule, our only private funds that deploy capital into core legal finance are BOF, BOF-C and legacy funds, i.e., BCIM Partners II, LP and BCIM Partners III, LP.
The scope of our core legal finance business is broad and encompasses a wide variety of structures, risk levels and anticipated returns. We provide capital against the underlying value of commercial high-value single or multiple litigation matters at any stage of the litigation process, from before filing to after a final judgment has been entered. In some instances, we provide capital to a law firm that has agreed to take a case on a contingent fee or alternative fee basis. In other instances, we provide capital directly to the corporate client. Our provision of capital may be limited to financing the costs of the fees and expenses needed to take the matter forward or may also monetize some of the potential future value of a claim by offering a client an upfront cash payment. In return, we receive our contractually agreed entitlement from the ultimate settlement, judgment or award on the claim and, if the claim does not produce any cash proceeds or other value, we generally lose our capital. When we provide capital for multiple cases for the same client, we often do so on a cross-collateralized portfolio basis on terms that tend to recognize the lower risk of loss generally associated with multi-case portfolios. As a general rule, we underwrite each case in these portfolios although, in a limited number of instances, we may not conduct separate due diligence on certain individual cases within these portfolios. Portfolios allow us to originate larger volumes of assets with greater efficiency, as well as to provide clients financing for cases that could be difficult to finance otherwise. We also deploy capital in other ways to express a view about litigation outcomes, such as by purchasing securities whose future value may be affected by litigation outcomes or by acquiring assets that are or can be the basis for legal claims.
For law firm clients, legal finance allows them to obtain cash to operate their businesses and pay the salaries of their lawyers even when they have taken a case on a contingent fee or alternative fee basis. It also allows law firms that prefer to operate on an hourly basis to compete for contingency or alternative fee work. We have received financing inquiries from 94 of the 100 largest US law firms by revenue according to the 2023 rankings by The American Lawyer and 92 of the 100 largest global law firms by revenue according to the 2023 rankings by The American Lawyer as well as large regional firms and litigation boutiques.
For corporate clients, legal finance allows them to hire law firms that generally work on an hourly fee basis without incurring those fees. Further, legal finance may enable corporate clients to avoid incurring legal fees as an operating expense, thereby improving their net income metrics, and to boost corporate liquidity by obtaining cash through upfront monetization of legal assets that otherwise would not be reflected in their financial statements. As legal finance has become more widely known and as we have developed more direct relationships with corporate clients instead of relying on relationships with the law firms they engage, we are sourcing an increasing share of our corporate business directly.
We also provide legal risk management services to help protect clients against certain adverse litigation outcomes, including the risk of being held liable for adverse costs. In many legal jurisdictions (although generally not in the United States), the loser in a litigation must pay the winner’s legal expenses, creating adverse legal cost risk. Adverse legal cost risk can be a significant obstacle for clients, especially in the kind of larger complex litigation that is the focus of
Burford Capital Annual Report 2023 11
our core legal finance business. Burford Worldwide Insurance Limited, our wholly owned Guernsey insurer, offers adverse legal cost insurance globally in litigation and arbitration cases that we are financing as part of our core legal finance business, providing a further impetus for clients to work with us.
Alternative strategies
Our alternative strategies business is focused on assets that have attractive but lower risk and lower returns than core legal finance, consisting of (i) lower risk legal finance, (ii) post-settlement finance and (iii) complex strategies.
Lower risk legal finance
Our lower risk legal finance business focuses on pre-settlement litigation matters with lower risk and lower expected returns than the assets we include in our core legal finance portfolio. This strategy includes assets such as cross-collateralized portfolios or mature litigation matters that originate in the Advantage Fund, which provides capital where litigation risk remains but where the risk is anticipated to be lower than core legal finance matters for structural or other reasons. We are an investor in the Advantage Fund and, as a result, the Advantage Fund is consolidated for purposes of our consolidated financial statements.
Post-settlement finance
In our post-settlement business, we offer clients the ability to monetize post-settlement and other legal receivables. There can be significant delays between the point at which parties to a litigation matter agree upon a settlement and the finalization of and payment under the settlement. Often, those delays are due to the operation of the judicial process, which may require notice periods and fairness hearings before approval of settlements, or a settlement that may include a series of payments over time. In the interim period, both law firms awaiting payment of their fees and clients eager to receive their cash settlements may well find it attractive to secure financing against those expected receipts.
In addition, law firms are often looking for financing at various points, particularly towards their fiscal year-end when cash is needed to pay partners and employees. In those situations, we offer the ability to monetize or purchase a law firm’s receivables, which typically are high quality.
In both types of situations, as well as certain other situations where a lower risk but legal-related financing opportunity arises, pricing levels for our capital are generally lower than those for core legal finance. We provide post-settlement financing through our private funds, COLP, BAIF and BAIF II, which focus on post-settlement matters. Although we manage each of COLP, BAIF and BAIF II and receive asset management and performance fees, we are not an investor in COLP, BAIF or BAIF II and, as a result, none of COLP, BAIF or BAIF II is consolidated for purposes of our consolidated financial statements.
Complex strategies
In our complex strategies business, we act as a principal and acquire assets that we believe are mispriced and for which value can be realized through recourse to litigation proceedings that we launch. Accordingly, we are typically the owner of the asset associated with the claim and assert the claim ourselves and manage the claim actively. In most cases, there is underlying asset value to support our position, in addition to potential value from litigation proceedings.
Our complex strategies business has historically been undertaken largely through the Strategic Value Fund, in which we made a substantial general partner investment alongside capital provided by the limited partners. We did not deploy capital into any new assets in the Strategic Value Fund during the years ended December 31, 2023, 2022 and 2021. At December 31, 2023, all assets held at the Strategic Value Fund have concluded, and the Strategic Value Fund was liquidated. However, we expect to explore opportunities and may provide capital against legal finance assets in complex strategies to the extent we determine the risk levels and anticipated returns to be appropriate for our core legal finance business. See “—Core legal finance” for additional information with respect to our core legal finance business.
Asset management
At December 31, 2023, we operated eight private funds and three “sidecar” funds as an investment adviser registered with and regulated by the SEC. At each of December 31, 2023 and 2022, our total AUM was $3.4 billion. We believe that we are the largest investment manager focused solely on the legal finance sector by a considerable margin. We view our asset management business as an important addition to our balance sheet business. Having access to private fund capital has improved our ability to pursue financing opportunities and has also permitted us to engage in larger transactions without seeking external partners.
12 Burford Capital Annual Report 2023
Under our internal allocation policy in effect at the date of this Annual Report, we allocate certain portions of every new commitment to our balance sheet and our various private funds as follows:
| ▪ | Core legal finance: Since May 2022, we have generally allocated 25% of each new core legal finance asset to BOF-C, and our balance sheet takes the remaining 75%. Prior to May 2022 and following BOF reaching its investment capacity in the fourth quarter of 2020, we had generally been allocating 50% of each new core legal finance asset to BOF-C and 50% to our balance sheet. Prior to that, each new core legal finance asset was generally allocated 25% to BOF, 33% to BOF-C and 42% to our balance sheet. When we present BOF-C information in this Annual Report, we present information only with respect to the sovereign wealth fund’s portion of the arrangement, whereas our portion of the arrangement shared with the sovereign wealth fund is owned directly and included within the financial information presented on a Burford-only basis. |
| ▪ | Lower risk legal finance: We allocate 100% of our lower risk legal finance assets to the Advantage Fund, in which our balance sheet is an investor. Lower risk legal finance assets are pre-settlement commitments where the expected return based on our analysis at the time of commitment is in the 12-20% range and the risk of substantial capital impairment is lower than that of core legal finance assets, which have expected returns greater than 20%. Prior to 2022, we had relatively few lower risk legal finance assets, all of which were allocated 100% to our balance sheet. |
| ▪ | Post-settlement finance: We allocate 100% of our post-settlement assets to BAIF II. We no longer allocate any of our post-settlement assets to either COLP or BAIF because their respective investment periods have ended. Potential returns in our post-settlement business typically are less than 12%. |
| ▪ | Complex strategies: Complex strategies assets that fall outside the scope of our core legal finance business are allocated to our balance sheet. In addition, we expect to explore opportunities and may provide capital against legal finance assets in complex strategies to the extent the risk levels and anticipated returns are determined to be appropriate for our core legal finance business. |
| ▪ | Asset recovery: We allocate 100% of our asset recovery matters to our balance sheet. |
See “Operating and financial review and prospects—Asset management” for additional information with respect to the key statistics for each of our private funds.
We generally conduct our private funds activities through limited partnerships. Each private fund that is a limited partnership has a Burford-owned general partner that is responsible for the management and operation of the private fund’s affairs and makes all policy and asset selection decisions relating to the conduct of the private fund’s business. Except as required by law or as specified in a private fund’s governing documents, the limited partners of the private funds take no part in the conduct or control of the business of the private funds, have no right or authority to act for or bind the private funds, have limited visibility and input into the actions and decisions of the general partner and have no influence over the voting or disposition of the securities or other assets held by the private funds. Each private fund engages an investment adviser. BCIM serves as the investment adviser for all of our private funds and is registered under the Investment Advisers Act.
In addition, we operate certain “sidecar” funds pertaining to specific assets and had three active “sidecar” funds at December 31, 2023. A “sidecar” fund is a pooled investment vehicle through which certain investors co-invest directly in specific assets alongside our private funds. Except as required by law or as specified in a “sidecar” fund’s governing documents, the investors in the “sidecar” funds take no part in the conduct or control of the business of the “sidecar” funds, have no right or authority to act for or bind the “sidecar” funds, have limited visibility and input into the actions and decisions of the general partner or manager of the “sidecar” funds and have no influence over the voting or disposition of the securities or other assets held by the “sidecar” funds. Our interest in the “sidecar” funds is generally limited to the opportunity to earn incentive fees, if any. The discussion of our private funds ignores “sidecar” funds unless specifically included, and we collapse fund structures into overall strategies, ignoring, for example, onshore and offshore separations and parallel funds.
Operating processes
Origination and underwriting
Our origination and underwriting teams focus on generating new opportunities to commit capital against legal finance assets, which in turn is expected to be deployed over a period of time and/or upfront against those assets, both from our private funds and our balance sheet.
Burford Capital Annual Report 2023 13
We engage in extensive marketing and operate a dedicated origination team that targets both law firm and corporate clients. Upon receipt of inbound inquiries, we undertake an initial screening process that is intended to filter potential opportunities into our pipeline. Once a potential opportunity progresses into our pipeline, it is assigned to individual underwriters with input from our global team. Underwriters conduct extensive in-house due diligence on potential opportunities in our pipeline, including comprehensive legal and factual analysis. In addition, we undertake quantitative probabilistic modeling using proprietary analytical tools that rely on third-party data as well as a significant proprietary dataset we have developed since our inception in 2009.
Assuming the satisfactory completion of the in-house due diligence, the opportunity is presented to our dedicated commitments committee (the “Commitments Committee”) for review. All commitments of capital must be approved by the Commitments Committee, which considers legal and factual merits and risks, reasonably recoverable damages, proposed budget, proposed terms, collection issues and enforceability. If the Commitments Committee approves the opportunity, our underwriters proceed to negotiate the terms of the commitment with a counterparty with the goal of closing a transaction to provide the committed capital against the asset.
The manner in which we provide financing on a commitment varies widely. Some financing agreements require us to provide financing over a period of time, whereas other financing agreements require us to finance the total commitment upfront. In addition, our undrawn commitments are either discretionary or definitive. Discretionary commitments are those where we are not contractually obligated to advance capital and generally would not suffer adverse financial consequences from not doing so. Definitive commitments are those where we are contractually obligated to advance incremental capital and failure to do so would typically result in adverse contractual consequences (such as a dilution in our returns or the loss of our deployed capital in a case).
Pricing and returns
We use a wide range of economic structures for our assets, and our returns can have several components. In a basic single-case financing transaction, we pay some or all of the claimant’s costs in bringing a litigation matter. In such transactions, we typically use an economic structure that provides that, upon conclusion of a successful claim, we would receive the return of our deployed capital, plus one or a combination of the following: (i) a time-based return, such as an interest rate; (ii) a multiple of our deployed capital that may increase over time; and (iii) an entitlement to some percentage of the net realization that may increase or decrease over time or may depend on the size of the total resolution amount. For example, in the case of a multiple only structure, if the claim is successfully resolved (x) within one year after closing a transaction relating to the asset, our entitlement could be the return of our deployed capital plus one times our cost, (y) more than one and less than two years after closing a transaction relating to the asset, our entitlement could be the return of our deployed capital plus two times our cost or (z) more than two years after closing a transaction relating to the asset, our entitlement could be the return of our deployed capital plus three times our cost. The terms of each asset are bespoke, the foregoing examples are hypothetical, and not every asset will have all or any of these components. Further, some assets may have entirely different economic structures. Moreover, the larger or more complex a matter, the more likely it is that we will use an individually designed transactional structure to fit the needs of the matter, to accommodate what are often multiple parties with different economic interests, to align interests and to incentivize rational economic behavior.
We also engage in transactions in which we seek to reduce the risk of loss, typically by using a portfolio or multi-case structure, but occasionally through a variety of other structures, such as interest-bearing recourse debt (sometimes with a premium based on net realizations) or the purchase of equity or debt assets that underlie the relevant litigation or arbitration claims.
We price our assets commensurate with the risks we identify and quantify as part of our in-house due diligence process, which relies on, among other things, our probabilistic modeling to evaluate each potential asset considered by the Commitments Committee. In general, as we underwrite new assets, we target risk-adjusted returns consistent with the historic performance of our concluded portfolio, although returns vary widely across different types of assets.
Asset monitoring and realizations
We are an active manager of our capital provision assets, with a full-time team devoted to the oversight of those assets following the entry into capital provision agreements and tens of thousands of employee hours committed to these activities annually. Each of our individual matters has a dedicated in-house legal professional assigned to monitor developments in the underlying case. We generally seek to schedule regular calls with clients to discuss developments in the underlying cases, which are then reported monthly to senior management. In addition to receiving reports from counsel, we proactively keep ourselves informed of case developments, including receiving docket alerts and reviewing court documents filed. Our engagement varies depending on the circumstances of each individual matter, including not
14 Burford Capital Annual Report 2023
only the individual matter’s litigation dynamics, but also the experience and sophistication of our counterparties. We routinely consult on litigation strategy, participate in choosing arbitrators and expert witnesses, comment on draft pleadings, assist in the creation of the damages theory and consult on potential settlement, management of spending and performance against budget.
We devote meaningful resources to managing our capital provision assets and working collaboratively to improve their value. Our interest is aligned with our counterparties in an effort to maximize value. While our counterparties are generally not obliged to follow our advice, there is a clear alignment of interests that makes our advice valuable to our counterparties and worthy of serious consideration. In short, we normally do not have decision making authority in a contractual sense, such that we could actually veto a decision by a counterparty; rather, we have active engagement that makes us a valued and influential advisor to the litigation team. In addition, there are certain exceptions when we have specifically contracted to assume some control of a litigation matter or the underlying asset. In those instances, we have control over the conduct of the litigation matter subject to whatever contractual terms have been agreed.
We also conduct risk reviews on a regular basis and provide monthly and quarterly reporting on the portfolio and its risk profile to senior management and our board of directors (the “Board”). Further, we conduct an extensive review of every asset for valuation purposes following the occurrence of certain qualifying events in accordance with our valuation policy.
The matters underlying our assets resolve in various ways consistent with the outcomes in the litigation process generally. A majority of matters reach a negotiated resolution (i.e., a settlement) between the litigants, either before or after going to trial. Others do not resolve through settlement and proceed through the formal dispute resolution process, including trial and appeal(s). The timing of those outcomes varies widely and depends on the complexity of the matter and the schedule of the relevant tribunal. In a small number of matters, we have made a secondary sale of all or a portion of an asset prior to the conclusion of the matter underlying such asset.
In many instances, our clients receive their entire cash payment at the time of resolution of the legal dispute against which we have deployed our capital. However, in other instances, payments are delayed by agreement (i.e., when a settlement is paid in installments over time) or because the parties agree on an entitlement that includes non-cash value that must be monetized over time. Because our clients give up valuable leverage through the pendency of the litigation process by agreeing to a resolution, clients tend not to do so unless payment is reasonably certain and, in our experience, it is not common for there to be a default in connection with such payments. However, there are some instances where the adverse party loses and refuses to pay, in which case enforcement efforts may be needed.
Privileged information
In order to make our underwriting decisions and conduct our ongoing asset monitoring, we receive privileged information from our clients. Such privileged information can lose its protection and become accessible to a litigation opponent if it is disclosed (a concept called “waiver” in the United States), which could have detrimental consequences for the litigant. We are entitled to receive such privileged information but are under a strict obligation to protect it to minimize the risk of waiver. Among other things, this obligation requires us to tightly restrict access to the privileged information itself and conclusions drawn from it. As a result, we do not release asset valuations of ongoing matters underlying our assets, including partially concluded matters, and we are similarly unable to provide other asset-specific information about our portfolio unless such information becomes publicly available through other means.
Competition
The legal finance industry is highly competitive and evolving, and new competitors have entered and could enter the market and have affected and could affect our competitiveness in the future. We compete both globally and on a regional, industry and claims-based basis, based on numerous factors including performance of our legal finance assets, transaction execution, access to capital, access to and retention of qualified personnel, reputation, range of products and services, innovation and pricing.
We compete to acquire legal finance assets primarily with pure-play legal finance companies and multi-strategy firms that engage in legal finance in addition to their other strategies. Our competitors may have access to greater financial resources, technical capabilities or better relationships than we do, may have a lower cost of capital and access to financing sources that are not available to us, may have businesses that are smaller and more flexible than ours or may develop or market alternative financial arrangements that are more effective or less susceptible to challenges than ours. Other potential developments in big data analytics and AI and adoption of these capabilities by our competitors may negatively affect our returns if their technical capabilities outpace our own. In addition, some of our competitors
Burford Capital Annual Report 2023 15
may have higher risk tolerances or different risk assessments than we have. Any of these characteristics could allow our competitors to consider a wider variety of legal finance assets to finance, establish more relationships and offer better pricing and more flexible structuring. In addition to the pure-play legal finance companies and multi-strategy firms that engage in legal finance, we may also face competition from smaller industry participants or law firms using alternative financing models, insurance companies that may offer products to claimants and their counsel, as well as market entrants that have a regional-, industry- or specific claims-based approach. Such entities may offer more competitive terms or more tailored approaches to specific regions, industries or claims.
Competition is also intense for the attraction and retention of qualified personnel and consultants. Our ability to continue to compete effectively in our businesses will depend on our ability to attract new qualified personnel and consultants and retain and motivate our existing personnel and consultants.
Information concerning our competitors is limited as the vast majority of the participants in the legal finance industry either do not publish information publicly or, in the case of multi-strategy firms that engage in legal finance, do not publish information specific to their legal finance strategies. While there is limited available information regarding our competitors, we believe that we are well-positioned among our competitors in the legal finance industry. We believe that we are more visible than our competitive set in legal and business publications. For example, according to “share of voice” calculations using Muck Rack, a provider of public relations tracking software, we were featured in over half of the total articles that discussed the legal finance industry and that mentioned other pure play legal finance provider during the year ended December 31, 2023. In addition, according to the interviews conducted in the second quarter of 2023 by an independent researcher commissioned by us, Burford is the most recognized brand in the legal finance industry and is the first or only legal finance provider to be named by the overwhelming majority of law firm and in-house lawyers able to name any legal finance provider in response to the question “With which legal finance providers are you most familiar?”.
See “Risk factors—Risks relating to our business and industry—We face substantial competition for opportunities with respect to legal finance assets, which could delay commitment and/or deployment of our capital, reduce returns and result in losses” for additional information with respect to competitive risks we face.
Risk management and compliance
Framework
We have a risk management framework and internal control systems. In conjunction with determining our strategy, we establish which types of risks are significant and ascertain our tolerance levels for them as well as ensure that the decisions taken around these risks promote the success of our business. We have developed policies, procedures and controls for identifying, evaluating and managing these risks. In addition, we monitor actual or potential conflicts of interest while avoiding unnecessary risks and maintaining adequate capital and liquidity. Our risk management culture is critical to the effectiveness of our risk management framework. The audit committee of the Board (the “Audit Committee”) maintains oversight of the effectiveness of our internal controls and risk management framework.
Our risk appetite policy is founded on a set of robust and comprehensive financing and asset management procedures as well as a conservative approach to capital and liquidity management. Our review of key risks focuses on identifying those risks that could threaten the business model or the future performance, capital or liquidity of our business. The key risks are identified through consideration of our strategy, external developments, legal and regulatory expectations, the operating environment for our businesses and an analysis of individual processes and procedures.
In addition, we monitor and have procedures in place to address actual or potential conflicts of interest while avoiding unnecessary risks and maintaining adequate capital and liquidity. We are also focused on privacy and are sensitive to the various obligations we face in that regard. Our approach to privacy is set forth in our online privacy policies and notices.
See “Quantitative and qualitative disclosures about market risk” for information with respect to the various risks that we face in our business and operations.
Enterprise
We regularly consider business and systemic risks in our operating segments and overall. We have long been focused on operational risk and have a system of internal controls designed to protect and enhance the integrity of our internal processes and data. Moreover, we are fundamentally a business run by experienced lawyers, including some who have functioned in senior legal roles in major global corporations. The challenge in many businesses is reining in individuals who take on unacceptable or ill-considered risks, and it is the function of the lawyers to hold those reins. At Burford,
16 Burford Capital Annual Report 2023
we have a business run by people accustomed to that role. Our culture is disciplined and risk-focused, and it is augmented by an in-house legal and compliance team.
Legal finance assets
As applied to our portfolio of legal finance assets, we manage risk by employing a disciplined, comprehensive, multi-stage process to evaluate potential legal finance assets and engage in substantial portfolio management activities applying a risk-based approach, in which we benefit from the judgment and experience of our qualified team of experienced lawyers and finance professionals. See “—Operating processes—Origination and underwriting” and “—Operating processes—Asset monitoring and realizations” for information with respect to our due diligence process and asset monitoring for the legal finance assets.
We operate in a global market and many of our clients conduct litigation around the world, although we seek to avoid either financing matters or enforcing against judgments and awards in jurisdictions in which we believe the legal systems are less developed or susceptible to corruption or bias.
Financial controls
Our finance team, which includes a number of individuals with public accounting qualifications, is integrated into our business and is present in all three of our large offices. By integrating the finance team into our business and making it privy to asset-financing activity, we gain considerable control benefits in addition to operational efficiencies. We underwrite a limited number of legal finance assets annually, which allows us to tailor our processes and procedures accordingly. We also have controls around access to payment systems and the release of payments, such as requiring approvals from multiple individuals within the organization before a payment is released.
Escalation program
We have policies and procedures for reporting misconduct or other workplace issues. Our employees are directed to escalate any known or suspected compliance policy violations or misconduct to our Chief Compliance Officer. Alternatively, our employees have the option to call or email a hotline (which is administered by a third party) on an anonymous basis. We also maintain a global anti-retaliation and whistleblower policy, under which retaliation of any type against an individual who reports any suspected compliance policy violations or misconduct or assists in the investigation of compliance policy violations or misconduct is strictly prohibited. Our employees may also report potential violations of law or regulation directly to a government agency.
Cybersecurity
Cybersecurity risk management and strategy
We strive to create a pervasive culture of cybersecurity and information systems security, focusing particularly on the tone set by our senior management. We have developed and implemented a cybersecurity risk management program intended to protect the confidentiality, integrity and availability of our critical information systems and data. Our cybersecurity risk management program leverages certain practices from the National Institute of Standards and Technology Cybersecurity Framework, the Center for Internet Security Top 20 Critical Security Controls and the Control Objectives for Information and Related Technologies. This does not imply that we meet any particular technical standards, specifications or requirements, only that we use these frameworks and controls as a guide to help us identify, assess and manage cybersecurity risks relevant to our business.
Our cybersecurity risk management program is integrated into our overall enterprise risk management program and shares common methodologies, reporting channels and governance processes that apply across the enterprise risk management program to other legal, compliance, strategic, operational and financial risk areas. See “—Risk management and compliance” for additional information with respect to our enterprise risk management program and compliance.
To provide for the resilience of critical information systems and data, to maintain legal and regulatory compliance, to manage our material risks from cybersecurity threats and to protect against, detect and respond to cybersecurity incidents, our cybersecurity risk management program includes the following key elements:
| ▪ | 24x7x365 security operations monitoring of our information systems and services to detect and act on weaknesses and potential intrusions |
| ▪ | Operating on cloud-based platforms, allowing us to store our data on the servers of technology companies, with built-in disaster recovery protection and regular backups |
Burford Capital Annual Report 2023 17
| ▪ | Regular internal and external security audits, penetration tests and risk assessments designed to help identify significant cybersecurity risks to our critical information systems and data |
| ▪ | Collaboration with third-party service providers, where appropriate, to assess, test or otherwise assist with aspects of our security controls |
| ▪ | Testing of new products and services to identify potential security vulnerabilities before release |
| ▪ | Regular network and endpoint monitoring |
| ▪ | Business resiliency planning with disaster recovery and business continuity testing |
| ▪ | Role-based access controls to identify, authenticate and authorize individuals to access information systems based on their job responsibilities |
| ▪ | Protection, including encryption, for the secure communication of sensitive data |
| ▪ | Monitoring of emerging data protection laws and implementation of changes to our processes designed to comply therewith as well as regular review of best practices from both the legal and financial services industries and engaging in a program of continuous improvement |
| ▪ | Regular review of policies, procedures and standards related to cybersecurity |
| ▪ | Cybersecurity awareness training of our employees and senior management at regular intervals |
| ▪ | Cross-functional approach to addressing cybersecurity risk, composed of senior representatives from all of our offices in business, information technology, finance and legal and compliance functions |
| ▪ | Cybersecurity incident response plan that sets forth procedures for responding to cybersecurity incidents, including processes designed to triage, assess severity, escalate, contain, investigate and remediate such cybersecurity incidents, as well as to comply with potentially applicable legal and regulatory obligations and mitigate reputational damage |
| ▪ | Third-party risk management process for certain service providers based on our assessment of their criticality to our business and risk profile |
As part of the above processes and procedures, we regularly engage with assessors, consultants and other third parties, including by having a third-party consultant review our cybersecurity risk management program on an annual basis to help identify areas for continued focus, improvement and compliance.
Our cybersecurity risk management program also addresses cybersecurity risks associated with our use of third-party service providers, including those who have access to our employee data or our information systems. Cybersecurity considerations affect the selection and oversight of our third-party service providers, and we perform diligence on third-party service providers that have access to our information systems, data or facilities that house such information systems or data. In addition, we distribute a cybersecurity survey to all major third-party service providers on an annual basis to assess their adherence to our cybersecurity requirements.
During the years ended December 31, 2023, 2022 and 2021, we have not identified any material cybersecurity incidents and have not identified any material risks from cybersecurity threats that have materially affected or are reasonably likely to materially affect our business strategy, results of operations or financial condition, and the expenses we have incurred from any cybersecurity incidents were immaterial. There can be no assurance that our cybersecurity risk management program, including our policies, processes, controls and procedures, will be fully implemented, complied with or effective in protecting our systems and information. See “Risk factors—Risks relating to cybersecurity, third-party service providers, information systems and data privacy and protection” for additional information with respect to cybersecurity risks.
Cybersecurity governance
The Board considers cybersecurity risks as part of its risk management and oversight function and has delegated to the Audit Committee oversight of our enterprise risk management program, including cybersecurity and other information systems risks. At each of its quarterly meetings, members of the Audit Committee receive a comprehensive risk presentation and review the key risks across the global enterprise focusing, among other things, on cybersecurity and other information systems risks. The Audit Committee regularly reports to the Board regarding its activities, including those related to our cybersecurity risk management program. In addition, from time to time, the Board receives
18 Burford Capital Annual Report 2023
presentations on various cybersecurity topics from our Chief Information Officer, including relating to our efforts to improve our cybersecurity risk management program and comparison of our cybersecurity risk management program to those of other companies in the legal and financial services industries.
Our Chief Information Officer has primary responsibility for our overall cybersecurity risk management program and for assessing and managing material risks from cybersecurity threats. In doing so, our Chief Information Officer supervises both our internal information technology team and our external cybersecurity consultants and other third-party service providers. Our Chief Information Officer meets regularly with our internal cybersecurity committee, composed of senior representatives from all of our offices in business, information technology, finance and legal and compliance functions, including, among others, our Chief Financial Officer, our Co-Chief Operating Officer and our Chief Compliance Officer. Our Chief Information Officer, with assistance from our internal information technology team, conducts cybersecurity and other information systems risk assessments on at least an annual basis and reports the results of these assessments, as well as any material cybersecurity and other information systems risks, to the cybersecurity committee. The cybersecurity committee focuses on assessing processes and procedures to assist with prevention and detection of cybersecurity incidents, whereas our Chief Information Officer, with assistance from our internal information technology team, is responsible for mitigation and remediation of cybersecurity incidents.
Our cybersecurity policies specify escalation points for reporting potential cybersecurity incidents to our Chief Information Officer and our Chief Compliance Officer, and we have adopted a cybersecurity incident response plan that sets forth procedures for responding to cybersecurity incidents. If applicable, the Board receives briefings from management on our cybersecurity risk management program and any significant cybersecurity incidents.
Regulation
Our operations are subject to regulation and supervision in a number of jurisdictions. The level of regulation and supervision to which we are subject varies from jurisdiction to jurisdiction and is based on the type of activity involved. We, in conjunction with our outside advisors and counsel, seek to manage our operations in compliance with such regulation and supervision. There are a number of legislative and regulatory initiatives in the United States, the United Kingdom and the other jurisdictions in which we operate. See "Risk factors—Risks relating to regulation” for a discussion of risk factors relating to laws, rules and regulations applicable to our business and operations.
United States
We are subject to the rules and regulations of the SEC and the NYSE as a public company in the United States. Depending on whether the majority of our ordinary shares will be held in the United States at June 30, 2024, we may lose our status as a “foreign private issuer” as soon as the beginning of 2025 and will thereafter be subject to the same disclosure and financial reporting requirements as US domestic public companies and will no longer be permitted to follow our home country practice in lieu of the corporate governance requirements of the NYSE. Furthermore, our disclosure controls and procedures and internal control over financial reporting are documented, tested and assessed for design and operating effectiveness in accordance with the US Sarbanes-Oxley Act of 2002, as amended (the “Sarbanes-Oxley Act”).
BCIM, a wholly owned indirect subsidiary of Burford, serves as the investment adviser to all of our private funds and is registered as an investment adviser with the SEC under the Investment Advisers Act. BCIM, as an investment adviser, is subject to the anti-fraud provisions of the Investment Advisers Act and to fiduciary duties derived from these provisions, which apply to our relationships with our advisory clients globally, including the private funds that we manage. These provisions and duties impose restrictions and obligations on us with respect to our dealings with our private fund investors and our legal finance assets, including for example limitations on agency cross and principal transactions between an adviser or its affiliates and advisory clients. BCIM is subject to periodic examinations by the SEC and other requirements under the Investment Advisers Act and related regulations primarily intended to benefit advisory clients. These additional requirements relate, among other things, to maintaining an effective and comprehensive compliance program and code of ethics, conflicts of interests, record-keeping and reporting requirements, advertising and custody requirements, political contributions and disclosure requirements. The Investment Advisers Act generally grants the SEC broad administrative powers, including the power to limit or restrict an investment adviser from conducting advisory activities in the event it fails to comply with federal securities laws. Additional sanctions that may be imposed for failure to comply with applicable requirements include the prohibition of individuals from associating with an investment adviser, the revocation of registrations and other censures and fines.
Burford Capital Annual Report 2023 19
United Kingdom
The UK Financial Conduct Authority (the “FCA”) regulates our legacy UK insurance business and our UK insurance intermediation business, this latter ongoing activity being with respect to Burford Worldwide Insurance Limited. The FCA and the London Stock Exchange regulate the trading of our ordinary shares on AIM in the United Kingdom. Deutsche Numis (the new trading name used by Deutsche Bank AG, Numis Securities Limited and Numis Europe Limited for the combined UK and Ireland corporate finance business) is our nominated adviser under the AIM rules, in which capacity it advises and guides us on our responsibilities and continuing obligations under the rules and regulations of the London Stock Exchange. The FCA also reviews debt prospectuses for our retail bonds traded on the Main Market of the London Stock Exchange.
Burford Law, the independent alternative business structure law firm that supports and complements our asset recovery business, was subject to separate regulations (principally, the Standards and Regulations and the Code of Conduct of the Solicitors Regulation Authority of England and Wales) prior to its closure in May 2023.
Guernsey
The Guernsey Financial Services Commission regulates our insurance business conducted through Burford Worldwide Insurance Limited, our wholly owned Guernsey insurer. Burford Worldwide Insurance Limited is licensed to carry on international, domestic and general insurance business under the Insurance Business (Bailiwick of Guernsey) Law, 2002 (as amended).
Other laws, rules and regulations
We are also subject to various other laws, rules and regulations, ranging from the UK Bribery Act 2010, as amended, and the US Foreign Corrupt Practices Act of 1977, as amended, to anti-money laundering and know-your-customer regulations in a number of jurisdictions. In addition, we are subject to a range of US and international laws, rules and regulations relating to data privacy and protection, including the California Consumer Privacy Act, the California Privacy Rights Act, the UK General Data Protection Regulation, the UK Data Protection Act 2018, the EU General Data Protection Regulation and the DIFC Data Protection Law No. 5 of 2020.
Legal finance industry
We engage in a constant level of activity around monitoring of and engagement with regulatory initiatives relating to the legal finance industry. In the United States, some individual states and individual judicial districts have promulgated rules concerning matters such as disclosure of legal finance arrangements, and the US Government Accountability Office released a report on the legal finance industry in 2023. In general, we have not seen any indication that there is any groundswell of support for broad regulation of the legal finance industry, and ongoing discussion tends to focus on subsidiary issues, such as disclosure of the presence of litigation financing. At the date of this Annual Report, there are no new US state or federal regulations aimed at the commercial legal finance industry, although various US state and federal legislative proposals have been introduced and considered that, if passed, could potentially affect the legal finance industry.
We are a founding member of the Association of Litigation Funders of England and Wales (“ALF”), an independent organization charged by the UK Ministry of Justice with self-regulation of litigation financing in England and Wales. The ALF’s Code of Conduct sets forth the standards by which all members must abide. We are also a founding member of the International Legal Finance Association (“ILFA”), a non-profit trade association and the only global organization that represents the commercial legal finance sector. ILFA promotes the highest standards of operation and service for the sector, including respecting duties to the courts, avoiding conflicts of interest and preserving confidentiality and legal privilege.
In newer markets, such as Singapore and Hong Kong, authorities have also enacted regulatory regimes largely focused on capital adequacy and constraining abusive behavior.
Employees
At December 31, 2023, we had a total of 161 full-time employees across our offices in the United States, the United Kingdom, Australia, Singapore and United Arab Emirates and in other jurisdictions around the world where we do not have formal offices. At December 31, 2023, our employees included 54 lawyers qualified to practice in the United States, the United Kingdom, Argentina, Australia, Germany, Hong Kong, India and Switzerland, as applicable.
20 Burford Capital Annual Report 2023
The table below sets forth our full-time employees by office location based on the respective office affiliation of such full-time employees at December 31, 2023.
Office location | Number of employees | |
United States | 105 | |
United Kingdom | 45 | |
Rest of the world | 11 | |
Total | 161 |
Environmental, social and governance
We recognize that every business has a responsibility to account for its impact on ESG factors. In so doing, we have relied on guidance relating to the integration of ESG into investor reporting and communication from a number of sources, including the Principles for Responsible Investment supported by the United Nations, to which many of our investors are signatories and the influence of which was evidenced in the amendments to the UK Stewardship Code.
We believe that commercial legal finance has a positive social impact. Third-party financing of meritorious commercial claims through litigation or arbitration enables injured or harmed organizations to obtain redress, secure liquidity and recover losses. Oftentimes, the expense of litigating a claim leaves the pursuit of justice inefficient or unaffordable without the use of third-party financing.
We believe that our legal finance delivers two benefits. First, our financing increases access to justice and reinforces and strengthens the rule of law, both fundamental social goods. The global economy and modern society need strong, clear and efficient legal systems in order to function. Our commercial legal finance supports these systems and improves them by creating a more level economic playing field in commercial disputes, allocating capital to meritorious commercial legal matters and facilitating access to justice for commercial litigants. Second, our legal finance helps to increase the efficient allocation of scarce economic resources, another social good. When companies and law firms finance commercial litigation and arbitration with our capital, they preserve their own capital to invest in their businesses where and when doing so will have the greatest benefit, whether that means hiring employees, spending on research and development or simply easing liquidity pressures that would otherwise harm the enterprise. This benefits our clients, their stakeholders and the broader economy.
As a specialty legal finance provider, we have a limited environmental footprint, but we nonetheless work to minimize our carbon and energy footprints by, among other things, making extensive and increasing use of videoconferencing to minimize physical travel, encouraging employees to use ridesharing and public transit services over higher carbon footprint activities such as driving, discouraging the creation of potentially polluting materials, operating a robust recycling program in each of our offices and being sensitive to and monitoring energy and water consumption and waste generation across our offices.
Our Equity Project, with cumulative commitments of $168.6 million at December 31, 2023, earmarks legal finance capital to promote gender and racial diversity by giving litigators who have been historically underrepresented in the business of law an edge as they pursue leadership positions in significant commercial litigations and arbitrations. It also augments and advances companies’ corporate ESG and diversity, equity and inclusion initiatives and goals by empowering female and racially diverse lawyers to compete for new business, incentivizing law firms that employ them to appoint historically underrepresented lawyers to leadership positions in commercial disputes and promoting conversations with law firms about representation and origination credit.
Executive accountability for our ESG impact resides with an ESG working group, jointly headed by our Chief Financial Officer, Co-Chief Operating Officer and General Counsel and Chief Administrative Officer. The Board regularly scrutinizes our corporate responsibility, and oversight of enterprise-wide ESG activity is vested in the nominating and governance committee of the Board (the “Nominating and Governance Committee”).
We are committed to advancing transparency of our ESG reporting practices and intend to periodically publish ESG-related policies and reports, including our annual sustainability report, which is available on our website at investors.burfordcapital.com. The information on, or that can be accessed through, our website is not incorporated by reference into, and does not form a part of, this Annual Report.
See “Risk factors—Expectations relating to ESG considerations could expose us to potential liabilities, increased costs and reputational harm and adversely affect our business, financial position, results of operations and/or liquidity.”
Burford Capital Annual Report 2023 21
Organizational structure and significant subsidiaries
The chart below sets forth our organizational structure at December 31, 2023. The chart does not depict all of our subsidiaries, including intermediate holding companies through which certain of the subsidiaries depicted are held.
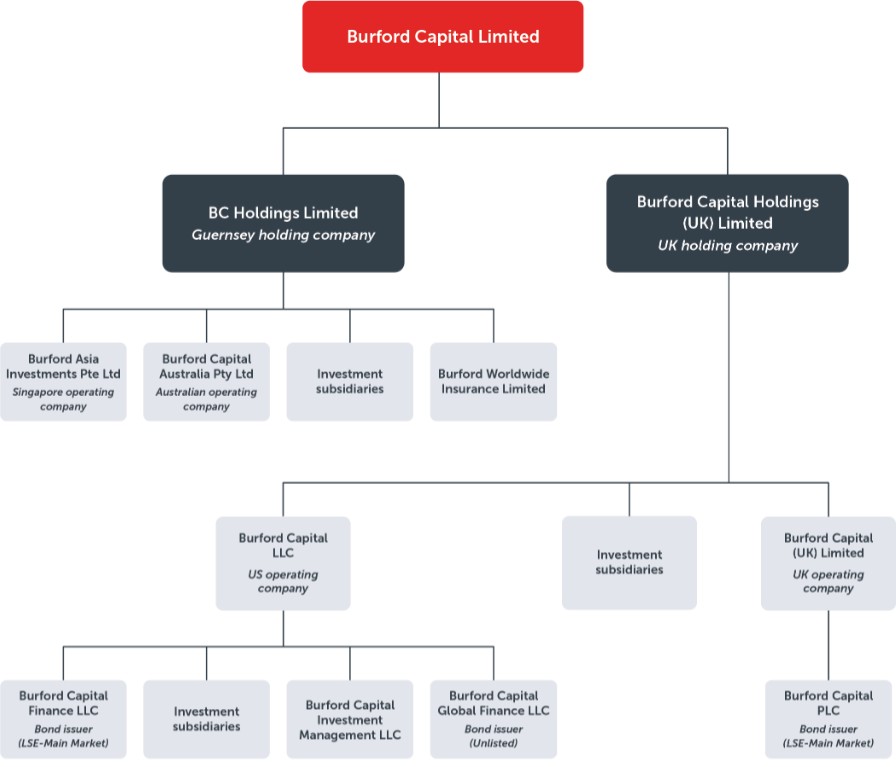
The information with respect to our “significant subsidiaries”, as defined in Rule 1-02(w) of Regulation S-X under the US securities law, at December 31, 2023 has been provided in Exhibit 8.1 to this Annual Report and is incorporated herein by reference.
Properties
We do not own any real property, and we lease our principal office spaces from third parties. The table below sets forth the location, square footage and main use of our principal leased offices at December 31, 2023.
Location | Size (square footage) | Main use | ||
New York, New York, United States | 19,516 | Office space | ||
London, United Kingdom | 10,883 | Office space | ||
Chicago, Illinois, United States | 7,113 | Office space |
In addition, at December 31, 2023, we leased shared office spaces in (i) Dubai, United Arab Emirates, (ii) Hong Kong, China, (iii) Singapore, Singapore, (iv) Sydney, Australia and (v) Washington, DC, United States.
Seasonality
While the litigation process is not driven by seasonality by nature, we have historically closed and financed a disproportionate amount of our new business in the fourth quarter, primarily driven by the behavior of our corporate and law firm clients. While realizations have historically been higher in the third and fourth quarters, there can be
22 Burford Capital Annual Report 2023
meaningful variation in the timing of the resolution of our legal finance assets, so the timing of realizations may be different in the future, especially if a single large legal finance asset resolves in the first or second quarter of a year.
Legal proceedings
From time to time, we may be involved in various legal or administrative proceedings, lawsuits and claims incidental to the conduct of our business. Some of these proceedings, lawsuits or claims may be material and involve highly complex issues that are subject to substantial uncertainties and could result in damages, fines, penalties, non-monetary sanctions or relief. At the date of this Annual Report, we are not a party to any material pending legal or administrative proceedings, lawsuits or claims that we believe may have a significant adverse effect on our business, financial position, results of operations or liquidity. Our business and operations are also subject to extensive regulation, which may result in regulatory proceedings against us.
Unresolved staff comments
None.
Burford Capital Annual Report 2023 23
Operating and financial review and prospects
The following discussion and analysis of our operating and financial review and prospects should be read in conjunction with our consolidated financial statements and the accompanying notes thereto contained elsewhere in this Annual Report. Certain information contained in the following discussion and analysis includes forward-looking statements that involve known and unknown risks, uncertainties and other factors. See “Forward-looking statements”.
The following discussion and analysis also contain a discussion of certain unaudited APMs (as defined below) and non-GAAP financial measures that are used by management to monitor our financial position and results of operations. These APMs and non-GAAP financial measures are supplemental and should not be considered in isolation from, as substitutes for, or superior to, our consolidated financial position or results of operations as reported under US GAAP. See “—Basis of presentation of financial information” and “—Reconciliations” for additional information with respect to APMs and non-GAAP financial measures and the applicable reconciliations.
See “Financial and operational review” in the annual report on Form 20-F for the year ended December 31, 2022 filed with the SEC on May 16, 2023 (the “2022 Annual Report”) for the discussion and analysis of our consolidated results of operations and cash flows for the years ended December 31, 2022 and 2021 and the corresponding year-over-year comparisons and a discussion of certain APMs and non-GAAP financial measures for the year ended December 31, 2021.
Economic and market conditions
Our returns are driven by judicial activity, and we believe our returns are generally uncorrelated to market conditions or the performance of the overall economy. At the date of this Annual Report, we observe signs of the effect of higher interest rates contributing to distress in sectors such as commercial real estate and reflected broadly in a higher level of company insolvencies and bankruptcies in the United States and Europe. See “Risk factors—Risks relating to our business and industry—We are subject to credit risk relating to our various legal finance assets that could adversely affect our business, financial position, results of operations and/or liquidity” and “Risk factors—Risks relating to our business and industry—Legal, political and economic uncertainty surrounding the effects, severity and duration of public health threats (such as the Covid-19 pandemic) could adversely affect our business, financial position, results of operations and/or liquidity”.
Covid-19
Court systems and other forms of adjudication have returned to functionality in the aftermath of the Covid-19 pandemic. In general, court activity has continued to work through the backlog caused by the Covid-19 pandemic and, during the year ended December 31, 2023, we have observed a high level of portfolio activity. Nevertheless, some court systems continue to face backlogs, delaying adjudication. In jurisdictions with court backlogs, the impetus to file new litigation may be diminished, unless there is an approaching limitation period. Inevitably, some of our matters (and thus our cash realizations from them) in jurisdictions impacted by court backlogs have been slowed by these dynamics. Delay in matters, however, is often profitable for us, as many of our assets have time-based terms that increase our returns as time passes, so we consider these delays to be deferral of income rather than its permanent diminution. We have not seen the discontinuance of any matters.
See “Risk factors—Risks relating to our business and industry—Legal, political and economic uncertainty surrounding the effects, severity and duration of public health threats could adversely affect our business, financial position, results of operations and/or liquidity”.
Inflation
The effect of inflation on our revenues is mitigated to a significant extent by a number of factors, including the high returns generated by capital provision-direct assets and their relatively short weighted average lives. Furthermore, inflationary increases in legal case fees and expenses can increase the size of commitments, deployments and damages sought. However, because returns on most of our assets are at least partially based upon a multiple of those fees and expenses, our returns on successful cases should also increase in such circumstances. To the degree that inflation drives higher interest rates and to the extent that pre- and post-judgment interest rates in a particular jurisdiction are tied to market interest rates, higher inflation would result in increases in awards by the relevant courts. The effect of inflation on our expenses would predominantly be through employee costs, which represent the majority of operating expenses, although a significant portion of compensation-related expenses are performance-based. Our principal
24 Burford Capital Annual Report 2023
finance costs are represented by interest expenses associated with our outstanding debt securities, though these are fixed coupon and non-adjustable, irrespective of the rate of inflation.
Party solvency
Litigation outcomes stand apart from the remainder of the conventional credit universe because they do not arise as a result of a contractual relationship between the judgment debtor and creditor, unlike essentially all other forms of credit obligation. Thus, for example, for a debtholder to recover on a defaulted debt, there are many steps typically involving notice, a cure period and usually a subsequent judicial or insolvency proceeding that will generally sweep in other creditors, resulting in a meaningful risk of the debt being impaired or compromised. By contrast, a judgment creditor has immediate and unfettered rights of action to, for example, seize assets and garnish cash flows.
The ultimate payor in much of our litigation is either (i) a government or a state-owned entity, (ii) an insurer or (iii) a large company in an industry less likely to be rendered insolvent by economic disruption associated with increases in interest rates. To the extent that parties in our matters do become insolvent, the impact of a party’s insolvency on pending litigation is difficult to predict and is not only case specific, but also dependent on the insolvency process in the country in issue. For example, in the United States, entry into a corporate restructuring via Chapter 11 of the US Bankruptcy Code does not eliminate litigation claims but is likely to delay them, whereas in countries that proceed directly to liquidation, a pending claim is more likely to be settled at a lower value than might have been the case had the party remained solvent. In general, however, other than in insolvencies where there is no recovery for anyone but secured creditors, we would still expect to see a recovery, but that recovery is likely to be delayed and could well be reduced in size during the restructuring or liquidation process. During the year ended December 31, 2023, due from settlement of capital provision assets included a realized loss of $11.3 million related to a corporate restructuring via Chapter 11 of the US Bankruptcy Code for a judgment debtor related to assets held by the Strategic Value Fund; we collected $57.0 million from the judgment debtor prior to such corporate restructuring.
Higher interest rates also present the risk that parties may become insolvent, which could impact the timing and quantum of litigation realizations.
As our portfolio has evolved, a much larger portion of our assets are related to large companies or law firms with low insolvency risk or in asset purchases where counterparty risk is not a factor. In a significant number of our assets, we are a secured creditor with respect to the litigation we are financing, and the litigation is a valuable contingent asset, the recovery of which is in the best interest of the counterparty’s stakeholders. As a result, it is unlikely that the financial distress or insolvency of one of our counterparties would interfere with the continued progress of the litigation matter.
International sanctions on Russian businesses and individuals
The international sanctions imposed on Russian businesses and individuals continue to impact the legal industry. Our legal finance assets in jurisdictions outside Russia that involve claims against entities that might have an ultimate Russian parent or controller (regardless of sanction status) represented in the aggregate $111.5 million (or approximately 2% of total fair value for capital provision assets) at December 31, 2023 as compared to $127.2 million (or approximately 3% of total fair value for capital provision assets) at December 31, 2022. There have been no significant changes or developments with respect to the impact of these international sanctions on our business. We are mindful of any sanctions or other issues and work regularly with specialist counsel in the sanctions area (as well as ensuring compliance with all legal requirements, such as anti-money laundering). Where we are required to enforce judgments or awards, even against sanctioned entities, such enforcement tends to be consistent with the goals of international sanctions regimes rather than running afoul of them, and the US Office of Foreign Assets Control and the UK Office of Financial Sanctions Implementation regularly grant licenses to do so. We do not anticipate any adverse material impact on our business from the sanctions regime.
Conflict in Israel and Gaza
At the date of this Annual Report, we have not been materially impacted by the conflict in Israel and Gaza and its effect on neighboring regions. We do not have material assets in Israel. It is too early to determine the full extent of the impact this conflict could have on our business and operations, and our assessment of the potential impacts is ongoing. At the date of this Annual Report, we do not anticipate any adverse material impact from the conflict in Israel and Gaza.
Burford Capital Annual Report 2023 25
Basis of presentation of financial information
We report our consolidated financial statements at and for the year ended December 31, 2023 and comparative periods contained in this Annual Report in accordance with US GAAP. Our consolidated financial statements are presented in US dollars.
Non-GAAP financial measures relating to our business structure
US GAAP requires us to present financial statements that consolidate some of the limited partner interests in private funds we manage as well as assets held on our balance sheet where we have a partner or minority investor. See note 16 (Variable interest entities) to our consolidated financial statements for additional information. We refer to this presentation as “consolidated”. We strive to provide a view of Burford as a stand-alone business (i.e., eliminating the impact of these private funds) by furnishing information on a non-GAAP basis that eliminates the effect of this consolidation. We refer to this presentation as “Burford-only”. In addition, we strive to provide supplemental information that presents the totality of our legal finance activities by furnishing information on a non-GAAP basis that reflects the contribution of both our consolidated and non-consolidated private funds. We refer to this presentation as “Group-wide”.
To that end, throughout this Annual Report, we refer to our business as follows:
| ▪ | Consolidated Refers to assets, liabilities and activities that include those third-party interests, partially owned subsidiaries and special purpose vehicles that we are required to consolidate under US GAAP. At the date of this Annual Report, the major entities where there is also a third-party partner in, or owner of, those entities include BOF-C, the Advantage Fund, Colorado and several other entities in which we hold investments where there is also a third-party partner in, or owner of, those entities. |
| ▪ | Burford-only Refers to assets, liabilities and activities that pertain only to Burford on a proprietary basis, excluding any third-party interests and the portions of jointly owned entities owned by others. |
| ▪ | Group-wide Refers to the totality of assets managed by Burford, including those portions of the private funds owned by third parties and including private funds that are not consolidated within Burford’s consolidated financial statements. Group-wide is therefore the sum of Burford-only and non-controlling interests in consolidated and non-consolidated private funds. Group-wide does not include third-party interests in capital provision assets, the economics of which have been sold to those third parties, and which do not meet the criteria to be recognized as a sale under US GAAP. This includes the third-party interests in Colorado and other capital provision asset subparticipations. |
We use Burford-only and Group-wide financial measures, which are calculated and presented using methodologies other than in accordance with US GAAP, to supplement analysis and discussion of our consolidated financial statements. We believe that the presentation of Burford-only financial measures is consistent with how management measures and assesses the performance of our reporting segments, which are evaluated by management on a Burford-only basis, and that it provides valuable and useful information to investors to aid in understanding our performance in addition to our consolidated financial statements prepared in accordance with US GAAP by eliminating the effect of the consolidation of some of the limited partner interests in our private funds we manage as well as assets held on our balance sheet where we have a partner or minority investor. We believe that the presentation of Group-wide financial measures, including Group-wide information on our capital provision assets and undrawn commitments, is useful to investors because they convey the scale of our existing (in the case of Group-wide capital provision assets) and potential future (in the case of Group-wide undrawn commitments) business and the performance of all legal finance assets originated by us. Although we do not receive all of the returns of our private funds, we do receive management and performance fees as part of our income. Further, we believe that Group-wide portfolio metrics, including the performance of our private funds, are important measures by which to assess our ability to attract additional capital and to grow our business, whether directly or through private funds. These non-GAAP financial measures should not be considered in isolation from, as a substitute for, or superior to, financial measures calculated in accordance with US GAAP. See “—Reconciliations” for the reconciliations of these non-GAAP financial measures to our consolidated financial statements prepared in accordance with US GAAP.
26 Burford Capital Annual Report 2023
APMs and non-GAAP financial measures relating to our operating and financial performance
APMs
This Annual Report presents certain unaudited alternative performance measures (“APMs”). The APMs are presented because (i) we use them to monitor our financial position and results of operations and/or (ii) we believe they are useful to investors, securities analysts and other interested parties. The APMs, as defined by us, may not be comparable to similarly titled measures as presented by other companies due to differences in the way the APMs are calculated. Even though the APMs are used to assess our financial position and results of operations, and these types of measures are commonly used by investors, they have important limitations as analytical tools and should not be considered in isolation from, as substitutes for, or superior to, our consolidated financial position or results of operations prepared in accordance with US GAAP. Consistent with how management assesses Burford’s business, we also present certain of these APMs on a (i) consolidated basis, (ii) Burford-only basis and (iii) Group-wide basis.
The presentation of the APMs is for informational purposes only and does not purport to present what our actual financial position or results of operations would have been, nor does it project our financial position at any future date or our results of operations for any future period. The presentation of the APMs is based on information available at the date of this Annual Report and certain assumptions and estimates that we believe are reasonable. Several of the APMs measure certain performance of our assets to the end of the period and include concluded and partially concluded assets (as defined below).
In discussing cash returns and performance of our asset management business, we refer to several alternative performance measures as set forth below:
| ▪ | Assets under management Consistent with our status as an SEC-registered investment adviser, we report publicly on our asset management business on the basis of US regulatory assets under management (“AUM”). AUM, as we report it, means the fair value of the capital invested in private funds and individual capital vehicles plus the capital that we are entitled to call from investors in those private funds and vehicles pursuant to the terms of their respective capital commitments to those private funds and vehicles. Our AUM differs from our private funds’ contribution to our Group-wide portfolio, which consists of deployed cost, fair value adjustments and undrawn commitments made on the legal finance assets those private funds have financed. |
| ▪ | Concluded and partially concluded assets A legal finance asset is “concluded” for our purposes when there is no longer any litigation risk remaining. We use the term to encompass (i) entirely concluded legal finance assets where we have received all proceeds to which we are entitled (net of any entirely concluded losses), (ii) partially concluded legal finance assets where we have received some proceeds (for example, from a settlement with one party in a multi-party case) but where the case is continuing with the possibility of receiving additional proceeds and (iii) legal finance assets where the underlying litigation has been resolved and there is a promise to pay proceeds in the future (for example, in a settlement that is to be paid over time). |
| ▪ | Deployed cost Deployed cost is the amount of financing we have provided for an asset at the applicable point in time. |
For purposes of calculating returns, we must consider how to allocate the costs associated with an asset in the event of a partial conclusion. Our approach to cost allocation depends on the type of asset:
| o | When single case assets have partial resolutions along the way without the entire case being resolved, most commonly because one party settles and the remaining part(y)/(ies) continue to litigate, we report the partial resolution when agreed as a partial realization and allocate a portion of the deployed cost to the partial resolution depending on the significance of the settling party to the overall claim. |
| o | In portfolio assets when a case (or part of a case) resolves or generates cash proceeds, we report the partial resolution when agreed as a partial realization and allocate a portion of the deployed cost to the resolution. The allocation depends on the structure of the individual portfolio arrangement and the significance of the resolution to the overall portfolio, but it is in essence a method that mimics the way an investor would allocate cost basis across a portfolio of security purchases. |
Burford Capital Annual Report 2023 27
| ▪ | Commitment A commitment is the amount of financing we agree to provide for a legal finance asset. Commitments can be definitive (requiring us to provide financing on a schedule or, more often, when certain expenses are incurred) or discretionary (allowing us to provide financing after reviewing and approving a future matter). Unless otherwise indicated, commitments include deployed cost and undrawn commitments. |
| ▪ | Internal rate of return Internal rate of return (“IRR”) is a discount rate that makes the net present value of a series of cash flows equal to zero and is expressed as a percentage figure. We compute IRR on concluded (including partially concluded) legal finance assets by treating that entire portfolio (or, when noted, a subset thereof) as one undifferentiated pool of capital and measuring actual and, if necessary, estimated inflows and outflows from that pool, allocating costs appropriately. IRRs do not include unrealized gains or losses. |
| ▪ | Return on invested capital Return on invested capital (“ROIC”) from a concluded asset is the absolute amount of realizations from such asset in excess of the amount of expenditure incurred in financing such asset divided by the amount of expenditure incurred, expressed as a percentage figure. ROIC is a measure of our ability to generate absolute returns on our assets. Some industry participants express returns on a multiple of invested capital (“MOIC”) instead of a ROIC basis. MOIC includes the return of capital and, therefore, is 1x higher than ROIC. In other words, 70% ROIC is the same as 1.70x MOIC. |
| ▪ | Weighted average life Weighted average life (“WAL”) of one of our legal finance assets represents the average length of time from deployment and/or cash outlay until we receive a cash realization (actual or, if necessary, estimated) from that asset weighted by the amount of that realization or deployment, as applicable. In other words, WAL is how long our asset is outstanding on average. |
Unlike our IRR and ROIC calculations, using the aggregate cash flows from the portfolio in making our portfolio level computations will not readily work with WAL computations because our funded assets are originated in different timeframes. Instead, in calculating a portfolio WAL, we compute a weighted average of the individual asset WALs. In doing this, we weight the individual WALs by the costs deployed on the asset and also, as a separate calculation, by the amount of realizations on the individual assets.
Non-GAAP financial measures
In addition to these measures of cash returns and performance of our asset management business, we also refer to cash receipts, tangible book value attributable to Burford Capital Limited and tangible book value attributable to Burford Capital Limited per ordinary share, which are non-GAAP financial measures:
| ▪ | Cash receipts Cash receipts provide a measure of the cash that our capital provision and other assets generate during a given period as well as cash from certain other fees and income. In particular, cash receipts represent the cash generated from capital provision and other assets, including cash proceeds from realized or concluded assets and any related hedging assets, and cash received from asset management income, services and/or other income, before any deployments into financing existing or new assets. |
Cash receipts are a non-GAAP financial measure and should not be considered in isolation from, as a substitute for, or superior to, financial measures calculated in accordance with US GAAP. The most directly comparable measure calculated in accordance with US GAAP is proceeds from capital provision assets as set forth in our consolidated statements of cash flows. We believe that cash receipts are an important measure of our operating and financial performance and are useful to management and investors when assessing the performance of our Burford-only capital provision assets. See “—Reconciliations—Cash receipts reconciliations” for a reconciliation of cash receipts to proceeds from capital provision assets, the most comparable measure calculated in accordance with US GAAP.
28 Burford Capital Annual Report 2023
| ▪ | Tangible book value attributable to Burford Capital Limited and tangible book value attributable to Burford Capital Limited per ordinary share |
Tangible book value attributable to Burford Capital Limited is calculated by subtracting intangible assets (such as goodwill) from total Burford Capital Limited equity. Tangible book value attributable to Burford Capital Limited per ordinary share is calculated by dividing tangible book value attributable to Burford Capital Limited by the total number of outstanding ordinary shares.
Each of tangible book value attributable to Burford Capital Limited and tangible book value attributable to Burford Capital Limited per ordinary share is a non-GAAP financial measure and should not be considered in isolation from, as a substitute for, or superior to, financial measures calculated in accordance with US GAAP. The most directly comparable measure calculated in accordance with US GAAP is total Burford Capital Limited equity as set forth in our consolidated statements of financial position. We believe that tangible book value attributable to Burford Capital Limited per ordinary share is an important measure of our financial condition and is useful to management and investors when assessing capital adequacy and our ability to generate earnings on tangible equity invested by our shareholders. See “—Reconciliations—Tangible book value attributable to Burford Capital Limited per ordinary share reconciliations” for a reconciliation of tangible book value attributable to Burford Capital Limited per ordinary share to total Burford Capital Limited equity, the most comparable measure calculated in accordance with US GAAP.
Burford Capital Annual Report 2023 29
Results of operations and financial position
Set forth below is a discussion of our consolidated results of operations for the years ended December 31, 2023 and 2022 and our consolidated financial position at December 31, 2023 and 2022, in each case, on a consolidated basis, unless noted otherwise. In addition, see the 2022 Annual Report for the discussion and analysis of our consolidated results of operations and cash flows for the years ended December 31, 2022 and 2021 and the corresponding year-over-year comparisons and a discussion of certain APMs and non-GAAP financial measures for the year ended December 31, 2021.
Statements of operations for the year ended December 31, 2023 as compared to the year ended December 31, 2022
The table below sets forth our consolidated statements of operations for the periods indicated.
Years ended December 31, | ||||||||
($ in thousands) | 2023 | 2022 | Change | % | ||||
Revenues | ||||||||
Capital provision income/(loss) | 1,341,923 | 319,108 | 1,022,815 | 321% | ||||
Plus/(Less): Third-party interests in capital provision assets | (279,263) | (494) | (278,769) | NM | ||||
Asset management income/(loss) | 7,642 | 9,116 | (1,474) | (16)% | ||||
Marketable securities income/(loss) and bank interest | 12,208 | (7,744) | 19,952 | NM | ||||
Other income/(loss) | 4,392 | (759) | 5,151 | NM | ||||
Total revenues | 1,086,902 | 319,227 | 767,675 | 240% | ||||
Operating expenses | ||||||||
Compensation and benefits | ||||||||
Salaries and benefits | 46,811 | 35,131 | 11,680 | 33% | ||||
Annual incentive compensation | 32,697 | 24,338 | 8,359 | 34% | ||||
Share-based compensation | 14,105 | 10,277 | 3,828 | 37% | ||||
Legacy asset recovery incentive compensation including accruals | 17,342 | 1,908 | 15,434 | NM | ||||
Long-term incentive compensation including accruals | 110,129 | 14,692 | 95,437 | 650% | ||||
General, administrative and other | 33,656 | 29,681 | 3,975 | 13% | ||||
Case-related expenditures ineligible for inclusion in asset cost | 16,496 | 8,245 | 8,251 | 100% | ||||
Total operating expenses | 271,236 | 124,272 | 146,964 | 118% | ||||
Operating income | 815,666 | 194,955 | 620,711 | 318% | ||||
Other expenses | ||||||||
Finance costs | 99,135 | 77,389 | 21,746 | 28% | ||||
(Gain)/loss on debt extinguishment | - | 875 | (875) | NM | ||||
Foreign currency transactions (gains)/losses | (21,752) | 7,674 | (29,426) | NM | ||||
Total other expenses | 77,383 | 85,938 | (8,555) | (10)% | ||||
Income before income taxes | 738,283 | 109,017 | 629,266 | 577% | ||||
(Provision for)/benefit from income taxes | (20,084) | (11,558) | (8,526) | 74% | ||||
Net income/(loss) | 718,199 | 97,459 | 620,740 | 637% | ||||
Net income/(loss) attributable to non-controlling interests | 107,677 | 66,953 | 40,724 | 61% | ||||
Net income/(loss) attributable to Burford Capital Limited shareholders | 610,522 | 30,506 | 580,016 | NM | ||||
Note: “NM” denotes not meaningful. Changes from negative to positive amounts and positive to negative amounts, increases or decreases from zero and changes greater than 700% are not considered meaningful.
Overview
Total revenues increased 240% to $1.1 billion for the year ended December 31, 2023 as compared to $319.2 million for the year ended December 31, 2022. Fair value increases in the YPF-related assets arising from the March 2023 Ruling and the September 2023 Final Judgment (each, as defined below) were a significant driver of the growth in total revenues. But even beyond the YPF-related assets, continued positive developments in the remaining portfolio, helped by reduced court backlogs post-Covid-19 pandemic, drove significantly higher revenues during the year ended December 31, 2023, with approximately $521.9 million in capital provision income from the portfolio, excluding the YPF-related assets, or 62% more than for the year ended December 31, 2022. The increase in total revenues was partially offset by an increase in operating expenses primarily due to compensation-related accruals driven largely by the fair value of the YPF-related and other assets and certain legacy asset recovery matters. The net result was a
30 Burford Capital Annual Report 2023
significant increase in the net income attributable to Burford Capital Limited shareholders to $610.5 million for the year ended December 31, 2023 from $30.5 million for the year ended December 31, 2022.
Capital provision income/(loss)
Capital provision income increased 321% to $1.3 billion for the year ended December 31, 2023 as compared to $319.1 million for the year ended December 31, 2022. The increase in capital provision income is primarily attributable to continued positive momentum in the progression of the capital provision assets in our portfolio due to either case resolution or incremental case milestones as court activity and legal processes further normalized in the aftermath of the Covid-19 pandemic. Fair value increase of $820.0 million in the YPF-related assets arising from the March 2023 Ruling and the September 2023 Final Judgment was a significant driver of the growth, though the breadth of the increase in portfolio activity was reflected in capital provision income, excluding the YPF-related assets, increasing to $521.9 million for the year ended December 31, 2023 as compared to $321.8 million for the year ended December 31, 2022.
The table below sets forth the components of our capital provision income for the periods indicated.
Years ended December 31, | ||||||
($ in thousands) | 2023 | 2022 | Change | |||
Realized gains/(losses) | 251,618 | 161,707 | 89,911 | |||
Fair value adjustment during the period, net of previously recognized unrealized gains transferred to realized gains | 1,081,644 | 169,104 | 912,540 | |||
Foreign exchange gains/(losses) | 8,012 | (6,357) | 14,369 | |||
Other | 649 | (5,346) | 5,995 | |||
Total capital provision income/(loss) | 1,341,923 | 319,108 | 1,022,815 | |||
For the year ended December 31, 2023, realized gains were $251.6 million, comprising $322.6 million of gross realized gains, offset by gross realized losses of $71.0 million. Our top five assets with realized gains accounted for over $180.0 million of realized gains, while over half of our realized losses were incurred as a result of just four assets. The largest realized loss was a $13.9 million loss incurred on one asset in the second quarter of 2023 where that asset had previously been largely written off through unrealized losses taken in prior periods. For the year ended December 31, 2022, realized gains were $161.7 million, comprising $176.5 million of gross realized gains, offset by gross realized losses of $14.8 million. These gross realized gains arose from $708.3 million in realizations for the year ended December 31, 2023 as compared to $426.7 million in realizations for the year ended December 31, 2022.
Fair value adjustments, net of previously recognized unrealized gains transferred to realized gains, increased to $1.1 billion for the year ended December 31, 2023 as compared to $169.1 million for the year ended December 31, 2022. For the year ended December 31, 2023, fair value adjustments were significantly driven by the occurrence of litigation milestones on the YPF-related assets, which accounted for $820.0 million of the $1.1 billion of total fair value adjustments for the year, as well as $261.6 million of fair value adjustments on our other capital provision assets.
The change in fair value for the YPF-related assets was also a significant driver of the change in the overall capital provision portfolio’s fair value adjusted risk premium, which decreased to 30.2% at December 31, 2023 from 38.1% at December 31, 2022. As part of our fair value methodology, the adjusted risk premium metric is a risk adjustment (haircut) applied to the potential proceeds due to us in the event of a successful litigation outcome and is intended to reflect the remaining litigation risk. The adjusted risk premium is also impacted by the addition of newly acquired or originated capital provision assets during the period, which generally have higher risk premiums at the start of the capital provision asset’s life and do not impact fair value in the originating period as they are calibrated to the transaction price at inception.
Fair value is also impacted by discounting the expected future cash flows. The weighted average discount rate applied to the portfolio decreased to 7.0% at December 31, 2023 from 7.3% at December 31, 2022. The decrease, expressed in basis points, is approximately 35 basis points and, in isolation, resulted in higher net present values. As an indication of the impact, the fair value of the capital provision assets had a sensitivity of an increase of $82.7 million in capital provision income for an assumed decrease of 50 basis points in discount rates at December 31, 2023. The sensitivity
Burford Capital Annual Report 2023 31
figure is a point in time calculation at December 31, 2023 and therefore an approximation of the impact the change in discount rates would have had on capital provision income.
Plus/(Less): Third-party interests in capital provision assets
Third-party interests in capital provision assets were a reduction in capital provision income of $279.3 million for the year ended December 31, 2023 as compared to a reduction in capital provision income of $0.5 million for the year ended December 31, 2022. The financial liability owed to Colorado increased during the year ended December 31, 2023, reflected as a reduction of $277.0 million to us, due to the March 2023 Ruling and the September 2023 Final Judgment which resulted in an unrealized gain on the underlying YPF-related capital provision asset.
Asset management income/(loss)
Asset management income decreased 16% to $7.6 million for the year ended December 31, 2023 as compared to $9.1 million for the year ended December 31, 2022. The decrease in asset management income was due to the non-recurrence in 2023 of the performance fees earned during the year ended December 31, 2022. The timing of the recognition of performance fees is variable as they are recognized when a reliable estimate of the performance fees can be made, and it is probable that a significant reversal in the amount of cumulative revenue recognized will not occur. The maturity and the terms of the applicable distribution waterfall for each of our private funds impacts this timing. As BOF-C is a consolidated entity, asset management income from this private fund is eliminated on a consolidated basis. See “—Asset management” for a discussion of our asset management income on a Burford-only basis.
Marketable securities income/(loss) and bank interest
Marketable securities income/(loss) and bank interest was an income of $12.2 million for the year ended December 31, 2023 as compared to a loss of $7.7 million for the year ended December 31, 2022. The year over year change primarily reflects the reversal of certain unrealized losses on marketable securities incurred during the year ended December 31, 2022 and the increase in bank interest.
Other income/(loss)
Other income/(loss) was an income of $4.4 million for the year ended December 31, 2023 as compared to a loss of $0.8 million for the year ended December 31, 2022. The year over year change was primarily from the absence of any payment on an adverse cost policy from Burford Worldwide Insurance Limited in the current year, as opposed to one instance of such a payment in the prior year.
Operating expenses
Operating expenses increased 118% to $271.2 million for the year ended December 31, 2023 as compared to $124.3 million for the year ended December 31, 2022. The increase in operating expenses is driven primarily by compensation-related accruals, associated mainly with the fair value of the YPF-related and other assets and certain legacy asset recovery matters. Additionally, the increase in operating expenses included non-cash accruals given the positive performance of Burford Capital Limited’s share price and costs associated with the development of our revised fair value methodology in connection with the SEC’s review of the 2022 Annual Report, which was completed in August 2023.
Compensation and benefits
Compensation and benefits increased 156% to $221.1 million for the year ended December 31, 2023 as compared to $86.3 million for the year ended December 31, 2022. Compensation and benefits encompass various types of expenses as described below.
Salaries and benefits increased 33% to $46.8 million for the year ended December 31, 2023 as compared to $35.1 million for the year ended December 31, 2022. The increase in salaries and benefits for the year ended December 31, 2023 is driven by a higher expense accrual of $6.0 million attributable to our shareholdings in the Deferred Compensation Plan as a result of the increase in Burford Capital Limited’s share price and an increase of $3.5 million in expense attributable to a rise in the annual salary for employees due to inflation and cost of living increases as well as an increase in the number of full-time employees.
32 Burford Capital Annual Report 2023
Annual incentive compensation increased 34% to $32.7 million for the year ended December 31, 2023 as compared to $24.3 million for the year ended December 31, 2022. The increase in annual incentive compensation is primarily due to increases in discretionary bonus payments as well as due to the impact from certain investment performances.
Share-based compensation increased 37% to $14.1 million for the year ended December 31, 2023 as compared to $10.3 million for the year ended December 31, 2022. The increase in share-based compensation is primarily attributable to a higher value of RSUs granted during the year ended December 31, 2023 as compared to those granted during the year ended December 31, 2022 as well as higher cost of RSUs that vested during the year ended December 31, 2023 as compared to those that vested during the year ended December 31, 2022.
Legacy asset recovery incentive compensation including accruals increased to $17.3 million for the year ended December 31, 2023 as compared to $1.9 million for the year ended December 31, 2022. The increase in legacy asset recovery incentive compensation including accruals resulted from a small number of grandfathered cases under a historical profit-sharing arrangement; during the year ended December 31, 2023, there was one case resolution with a realized gain and a second case with an increase in the fair value of a legacy asset recovery asset. One of the two remaining assets has substantially concluded and was mostly paid out in the fourth quarter of 2023.
Long-term incentive compensation including accruals increased to $110.1 million for the year ended December 31, 2023 as compared to $14.7 million for the year ended December 31, 2022. The increase in long-term incentive compensation including accruals is primarily driven by an increase in the fair value of our assets, including $69.2 million related to the YPF-related assets following the March 2023 Ruling and the September 2023 Final Judgment and, in addition to the YPF-related amounts, a further $16.9 million related to the entry into the New Employment Agreements (as defined below) with our Chief Executive Officer and our Chief Investment Officer. See “Compensation—Executive compensation” for a description of the compensation arrangements with our Chief Executive Officer and our Chief Investment Officer.
General, administrative and other
General, administrative and other expenses increased 13% to $33.7 million for the year ended December 31, 2023 as compared to $29.7 million for the year ended December 31, 2022. The increase in general, administrative and other expenses is primarily due to $3.3 million incurred in audit, professional and legal fees associated with the development of the revised fair value methodology and build-out of quarterly reporting.
Case-related expenditures ineligible for inclusion in asset cost
Case-related expenditures ineligible for inclusion in asset cost increased 100% to $16.5 million for the year ended December 31, 2023 as compared to $8.2 million for the year ended December 31, 2022. This reflects an increase in the number of instances where we incur legal or other related expenses that are directly attributable to a capital provision asset but that do not form part of the deployed amount under a capital provision agreement, such as when we bear incremental legal expenses in cases. Examples of such expenses include fees paid to third parties when our management has sought its own legal advice or expert opinion with respect to matters related to a capital provision asset. These expenses accounted for $14.7 million and $7.7 million of the total case-related expenditures ineligible for inclusion in asset cost for the years ended December 31, 2023 and 2022, respectively.
Case-related expenditures ineligible for inclusion in asset cost also include some situations where we are effectively the claimant in a litigation matter either due to the acquisition of assets or the assignment of a claim. This type of expense accounted for $1.8 million and $0.5 million of the total case-related expenditures ineligible for inclusion in asset cost for the years ended December 31, 2023 and 2022, respectively. While we report these costs as expenses for accounting purposes, we treat them for return and performance purposes no differently than traditional legal finance arrangements.
Finance costs
Finance costs increased 28% to $99.1 million for the year ended December 31, 2023 as compared to $77.4 million for the year ended December 31, 2022. The increase in finance costs is due to the inclusion for the year ended December 31, 2023 of interest expense for $400 million aggregate principal amount of the 9.250% Senior Notes due 2031 (the “Initial 2031 Notes”) issued in June 2023 and the full year of interest expense for the 6.875% Senior Notes due 2030 (the “2030 Notes”) issued in April 2022 as compared to the nine months of interest expense for the 2030 Notes for the year ended December 31, 2022, offset by the early redemption of the 6.500% bonds due 2022 in May 2022 and the 6.125% bonds due 2024 (the “2024 Bonds”) in July 2023.
Burford Capital Annual Report 2023 33
(Gain)/loss on debt extinguishment
(Gain)/loss on debt extinguishment was zero for the year ended December 31, 2023 as compared to a loss of $0.9 million for the year ended December 31, 2022, due to the absence of a premium on the early redemption of the 2024 Bonds in July 2023.
Foreign currency transactions (gains)/losses
Foreign currency transactions (gains)/losses were a gain of $21.8 million for the year ended December 31, 2023 as compared to a loss of $7.7 million for the year ended December 31, 2022. The transition from loss to gain was driven by a foreign currency gain of $19.3 million from a capital redemption between subsidiaries with different functional currencies that occurred during the year ended December 31, 2023 and $10.2 million related to foreign currency exchange gains on the values of our non-US-dollar-denominated assets held by subsidiaries with USD functional currency.
(Provision for)/benefit from income taxes
Provision for income taxes increased 74% to $20.1 million for the year ended December 31, 2023 as compared to $11.6 million for the year ended December 31, 2022. The increase in provision for income taxes for the year ended December 31, 2023 is due primarily to limitations on deductions and use of net operating losses in various jurisdictions, as compared to the year ended December 31, 2022, as well as an increase in net income before tax. Cash taxes paid were $14.1 million and $1.8 million for the years ended December 31, 2023 and 2022, respectively.
Net income/(loss) attributable to non-controlling interests
We consolidate certain entities that have other shareholders and/or investors, including the Advantage Fund and BOF-C. The Advantage Fund does not have a traditional management and performance fee structure, but instead we retain any excess returns after the first 10% of annual simple returns are remitted to the Advantage Fund’s investors. With respect to BOF-C, under the co-investing arrangement with the sovereign wealth fund, we (in our capacity as the appointed investment adviser) receive reimbursement of expenses from BOF-C up to a certain level before we or the sovereign wealth fund, as applicable, receive a return of capital. After the repayment of capital, we then receive a portion of the return generated from the assets held by BOF-C. We include 100% of the Advantage Fund’s and BOF-C’s income and expenses in the applicable line items in our consolidated statements of operations (for example, 100% of the income on the Advantage Fund’s and BOF-C’s capital provision assets is included in capital provision income in our consolidated statements of operations), and the net amount of those income and expense line items that relate to third-party interests is included in net income attributable to non-controlling interests. In turn, this is deducted from net income to arrive at net income attributable to Burford Capital Limited shareholders in our consolidated statements of operations. Net income attributable to non-controlling interests does not include Colorado. See note 2 (Summary of significant accounting policies—Consolidation) to our consolidated financial statements for additional information with respect to our consolidation policies.
Net income attributable to non-controlling interests increased 61% to $107.7 million for the year ended December 31, 2023 as compared to $67.0 million for the year ended December 31, 2022. The increase in net income attributable to non-controlling interests reflects non-controlling interests’ share of income on capital provision assets, the majority of which relates to the increase in the fair value of assets held by BOF-C. The resulting effect is a period-over-period increase in capital provision income and increase in the portion attributable to non-controlling interest.
Statements of financial position at December 31, 2023 as compared to at December 31, 2022
The table below sets forth specified line items from our consolidated statements of financial position at the dates indicated.
Consolidated (GAAP) | December 31, | |||||
($ in thousands) | 2023 | 2022 | Change | |||
Cash and cash equivalents | 220,549 | 107,658 | 112,891 | |||
Marketable securities | 107,561 | 136,358 | (28,797) | |||
Due from settlement of capital provision assets | 265,540 | 116,582 | 148,958 | |||
Capital provision assets | 5,045,388 | 3,735,556 | 1,309,832 | |||
34 Burford Capital Annual Report 2023
Cash and cash equivalents and marketable securities
Cash and cash equivalents increased 105% to $220.5 million at December 31, 2023 as compared to $107.7 million at December 31, 2022, and marketable securities decreased 21% to $107.6 million at December 31, 2023 as compared to $136.4 million at December 31, 2022. The net increase in cash and cash equivalents and marketable securities primarily reflects the proceeds from the issuance of the Initial 2031 Notes, partially offset by continued deployments in excess of proceeds from capital provision assets and the redemption of the 2024 Bonds in July 2023.
Due from settlement of capital provision assets
Due from settlement of capital provision assets increased 128% to $265.5 million at December 31, 2023 as compared to $116.6 million at December 31, 2022. The increase in due from settlement of capital provision assets is due to the generation of new receivables during the year. Of the $116.6 million of due from settlement receivables at December 31, 2022, 91% was collected in cash during the year ended December 31, 2023.
Capital provision assets
Capital provision assets increased 35% to $5.0 billion at December 31, 2023 as compared to $3.7 billion at December 31, 2022. The increase in capital provision assets reflects continued deployments into new capital provision assets and significant fair value movements as described above.
Segments
We have two reportable segments, (i) capital provision segment—i.e., the provision of capital to the legal industry or in connection with legal matters, both directly and through investment in our private funds, and (ii) asset management and other services segment—i.e., the provision of services to the legal industry, including litigation insurance. Other corporate includes certain operating and non-operating activities that are not used internally to measure and evaluate the performance of the reportable segments.
The tables below set forth the components of our income/(loss) before income taxes by segment for the periods indicated.
Reconciliation | ||||||||||||
Asset |
| Total | Adjustment for | |||||||||
Capital | management and | Other | segments | third-party | Total | |||||||
($ in thousands) | provision | other services | corporate | (Burford-only) | interests | consolidated | ||||||
Year ended December 31, 2023 | ||||||||||||
Total revenues | 896,371 | 68,104 | 12,067 | 976,542 | 110,360 | 1,086,902 | ||||||
Total operating expenses | 197,478 | 18,727 | 52,333 | 268,538 | 2,698 | 271,236 | ||||||
Total other expenses | 94,669 | 1,754 | (19,024) | 77,399 | (16) | 77,383 | ||||||
Income/(loss) before income taxes | 604,224 | 47,623 | (21,242) | 630,605 | 107,678 | 738,283 | ||||||
Year ended December 31, 2022 | ||||||||||||
Total revenues/(loss) | 202,878 | 55,321 | (7,594) | 250,605 | 68,622 | 319,227 | ||||||
Total operating expenses | 72,508 | 27,965 | 22,223 | 122,696 | 1,576 | 124,272 | ||||||
Total other expenses | 72,604 | 1,800 | 11,441 | 85,845 | 93 | 85,938 | ||||||
Income/(loss) before income taxes | 57,766 | 25,556 | (41,258) | 42,064 | 66,953 | 109,017 | ||||||
Change | ||||||||||||
Total revenues | 693,493 | 12,783 | 19,661 | 725,937 | 41,738 | 767,675 | ||||||
Total operating expenses | 124,970 | (9,238) | 30,110 | 145,842 | 1,122 | 146,964 | ||||||
Total other expenses | 22,065 | (46) | (30,465) | (8,446) | (109) | (8,555) | ||||||
Income/(loss) before income taxes | 546,458 | 22,067 | 20,016 | 588,541 | 40,725 | 629,266 | ||||||
On a Burford-only basis, in the capital provision segment, we generated income before income taxes of $604.2 million for the year ended December 31, 2023 as compared to $57.8 million for the year ended December 31, 2022. The increase in income before income taxes reflects significant fair value increases for the YPF-related assets and other assets, offset by higher operating expenses due to an increase in long-term incentive compensation and legacy asset recovery incentive compensation driven by the underlying capital provision assets, including the fair value increases for the YPF-related assets.
On a Burford-only basis, in the asset management and other services segment, we generated income before income taxes of $47.6 million for the year ended December 31, 2023 as compared to $25.6 million for the year ended
Burford Capital Annual Report 2023 35
December 31, 2022. The increase in income before income taxes in the asset management and other services segment primarily reflects higher income from BOF-C and lower segment expenses.
On a Burford-only basis, in the other corporate segment, we incurred a loss before income taxes of $21.2 million for the year ended December 31, 2023 as compared to a loss before income taxes of $41.3 for the year ended December 31, 2022. The change in loss before income taxes in the other corporate segment primarily reflects the income earned on marketable securities combined with a foreign currency transaction gain on a capital redemption between subsidiaries with different functional currencies during the year ended December 31, 2023 as compared to the loss on marketable securities during the year ended December 31, 2022.
Portfolio
Overview
We count each of our contractual relationships as an “asset”, although many such relationships are composed of multiple underlying litigation matters that are often cross collateralized rather than reliant on the performance of a single matter. At December 31, 2023, our Burford-only portfolio consisted of 206 assets held directly and 11 additional assets held indirectly through the Advantage Fund. At December 31, 2022, our Burford-only portfolio consisted of 211 assets held directly and nine additional assets held indirectly through the Strategic Value Fund and the Advantage Fund.
The tables below set forth our portfolio at the dates indicated on consolidated, Burford-only and Group-wide bases.
December 31, 2023 | ||||||||||||
(GAAP) | (non-GAAP) | |||||||||||
Elimination of | ||||||||||||
third-party | ||||||||||||
($ in thousands) |
| Consolidated | interests | Burford-only |
| Other funds |
| BOF-C |
| Group-wide | ||
Capital provision assets - direct: | ||||||||||||
Deployed cost | 2,116,304 | (542,773) | 1,573,531 | 416,318 | 428,110 | 2,417,959 | ||||||
Plus: Fair value adjustments | 2,743,575 | (929,505) | 1,814,070 | 180,169 | 220,363 | 2,214,602 | ||||||
Fair value | 4,859,879 | (1,472,278) | 3,387,601 | 596,487 | 648,473 | 4,632,561 | ||||||
Capital provision assets - indirect: | ||||||||||||
Fair value | 185,509 | (140,998) | 44,511 | 140,998 | - | 185,509 | ||||||
Total capital provision assets | 5,045,388 | (1,613,276) | 3,432,112 | 737,485 | 648,473 | 4,818,070 | ||||||
Post-settlement assets: | ||||||||||||
Deployed cost | - | - | - | 253,062 | - | 253,062 | ||||||
Plus: Fair value adjustments | - | - | - | 45,792 | - | 45,792 | ||||||
Fair value | - | - | - | 298,854 | - | 298,854 | ||||||
Undrawn commitments: | ||||||||||||
Capital provision-direct | 1,801,627 | (405,566) | 1,396,061 | 126,560 | 396,646 | 1,919,267 | ||||||
Capital provision-indirect | 71,662 | (59,718) | 11,944 | 59,718 | - | 71,662 | ||||||
Post-settlement | - | - | - | 62,455 | - | 62,455 | ||||||
Total undrawn commitments | 1,873,289 | (465,284) | 1,408,005 | 248,733 | 396,646 | 2,053,384 | ||||||
Total portfolio | 6,918,677 | (2,078,560) | 4,840,117 | 1,285,072 | 1,045,119 | 7,170,308 | ||||||
36 Burford Capital Annual Report 2023
December 31, 2022 | ||||||||||||
(GAAP) | (non-GAAP) | |||||||||||
Elimination of | ||||||||||||
third-party | ||||||||||||
($ in thousands) |
| Consolidated | interests | Burford-only |
| Other funds |
| BOF-C |
| Group-wide | ||
Capital provision assets - direct: | ||||||||||||
Deployed cost | 1,934,662 | (448,512) | 1,486,150 | 422,098 | 383,322 | 2,291,570 | ||||||
Plus: Fair value adjustments | 1,687,641 | (569,786) | 1,117,855 | 133,122 | 133,660 | 1,384,637 | ||||||
Fair value | 3,622,303 | (1,018,298) | 2,604,005 | 555,220 | 516,982 | 3,676,207 | ||||||
Capital provision assets - indirect: | ||||||||||||
Fair value | 113,253 | (81,839) | 31,414 | (1) | 81,840 | - | 113,254 | |||||
Total capital provision assets | 3,735,556 | (1,100,136) | 2,635,419 | 637,060 | 516,982 | 3,789,461 | ||||||
Post-settlement assets: | ||||||||||||
Deployed cost | - | - | - | 358,193 | - | 358,193 | ||||||
Plus: Fair value adjustments | - | - | - | 81,067 | - | 81,067 | ||||||
Fair value | - | - | - | 439,260 | - | 439,260 | ||||||
Undrawn commitments: | ||||||||||||
Capital provision-direct | 1,671,327 | (372,279) | 1,299,048 | 182,372 | 371,724 | 1,853,144 | ||||||
Capital provision-indirect | 49,400 | (41,167) | 8,233 | 41,167 | - | 49,400 | ||||||
Post-settlement | - | - | - | 15,606 | - | 15,606 | ||||||
Total undrawn commitments | 1,720,727 | (413,446) | 1,307,281 | 239,145 | 371,724 | 1,918,150 | ||||||
Total portfolio | 5,456,283 | (1,513,583) | 3,942,700 | 1,315,465 | 888,706 | 6,146,871 | ||||||
| 1. | The fair value of $31.4 million for the Burford-only capital provision-indirect assets did not include an additional $1.0 million for the Burford-only portion of the receivable from due from settlement of capital provision assets on concluded assets in the Strategic Value Fund for a total fair value of $32.4 million for Burford-only capital provision-indirect assets as noted in the table under “—Reconciliations—Capital provision asset reconciliations”. |
The total portfolio increased at a compound annual growth rate of 20%, 16% and 17% over the three-year period ended December 31, 2023, on consolidated, Group-wide and Burford-only bases, respectively. On a consolidated basis, the total portfolio increased to $6.9 billion at December 31, 2023 as compared to $5.5 billion at December 31, 2022. On a Group-wide basis, the total portfolio increased to $7.2 billion at December 31, 2023 as compared to $6.1 billion at December 31, 2022. On a Burford-only basis, the total portfolio increased to $4.8 billion at December 31, 2023 as compared to $3.9 billion at December 31, 2022. The growth in all three bases is driven largely by growth in fair value adjustments in capital provision-direct assets, coupled with the year over year impact in new deployments and commitments.
Fair value of capital provision assets
Valuation policy
See note 2 (Summary of significant accounting policies—Fair value of financial instruments) to our consolidated financial statements for a description of our valuation policy for capital provision assets.
Fair value of capital provision assets
On a consolidated basis, the aggregate fair value of our capital provision assets was $5.0 billion and $3.7 billion at December 31, 2023 and 2022, respectively. On a consolidated basis, the aggregate fair value adjustments on our portfolio of capital provision assets, excluding the YPF-related assets, were $773.9 million, or 26% of the aggregate fair value excluding the YPF-related assets, at December 31, 2023 as compared to $518.5 million, or 21% of the aggregate fair value excluding the YPF-related assets, at December 31, 2022. The increases in fair value adjustments reflect the progress of our portfolio as courts continue to address their backlogs related to the Covid-19 pandemic.
Burford Capital Annual Report 2023 37
The table below sets forth the deployed cost, unrealized gain and fair value of the YPF-related assets and other assets at the dates indicated on a consolidated basis.
Consolidated (GAAP) | December 31, 2023 | December 31, 2022 | ||||||||||
($ in thousands) | Deployed cost | Unrealized gain | Fair value | Deployed cost | Unrealized gain | Fair value | ||||||
YPF-related assets | 67,167 | 1,990,950 | 2,058,117 | 61,610 | 1,170,939 | 1,232,549 | ||||||
Other assets | 2,213,396 | 773,875 | 2,987,271 | 1,984,539 | 518,468 | 2,503,007 | ||||||
Total capital provision assets | 2,280,563 | 2,764,825 | 5,045,388 | 2,046,149 | 1,689,407 | 3,735,556 | ||||||
On a Burford-only basis, the aggregate fair value of our capital provision assets was $3.4 billion and $2.6 billion at December 31, 2023 and 2022, respectively. On a Burford-only basis, the aggregate fair value adjustments on our portfolio of capital provision assets, excluding the YPF-related assets, were $508.5 million, or 25% of the aggregate fair value excluding the YPF-related assets, at December 31, 2023 as compared to $348.6 million, or 19% of the aggregate fair value excluding the YPF-related assets, at December 31, 2022. The increases in fair value adjustments reflect the progress of our portfolio as courts continue to address their backlogs related to the Covid-19 pandemic.
The table below sets forth the deployed cost, unrealized gain and fair value of the YPF-related assets and other assets at the dates indicated on a Burford-only basis.
Burford-only (non-GAAP) | December 31, 2023 | December 31, 2022 | ||||||||||
($ in thousands) | Deployed cost | Unrealized gain | Fair value | Deployed cost | Unrealized gain | Fair value | ||||||
YPF-related assets | 60,338 | 1,311,319 | 1,371,657 | 54,625 | 768,410 | 823,035 | ||||||
Other assets | 1,551,944 | 508,511 | 2,060,455 | 1,464,822 | 348,583 | 1,813,405 | ||||||
Total capital provision assets | 1,612,282 | 1,819,830 | 3,432,112 | 1,519,447 | 1,116,993 | 2,636,440 | ||||||
Fair value of YPF-related assets
The determination of the fair value of the YPF-related assets—our financing of the Petersen and Eton Park claims—is based on the same methodology which we use to value all of our other capital provision assets. In June 2019, we sold a portion of the Petersen claim, constituting $100.0 million of a $148.0 million placement, to a number of institutional investors. Other third-party holders sold the remaining portion. Given the size of this sale and the participation of a meaningful number of third-party institutional investors, we concluded that this market evidence should be factored into our valuation process of the YPF-related assets. As a result, we have utilized the implicit valuation of the Petersen claim to calibrate our model to determine the fair value of the YPF-related assets in subsequent periods through December 31, 2023. Episodic subsequent trading of portions of the Petersen claim have not been factored into our valuation process of the YPF-related assets.
On March 31, 2023, the US District Court for the Southern District of New York (the “Court”) issued its opinion and order (the “March 2023 Ruling”) in connection with the summary judgment motions filed by the parties in the Petersen and Eton Park cases against the Republic of Argentina and YPF S.A. In summary, the Court decided that (i) Argentina was liable to Petersen and Eton Park for failing to make a tender offer for their YPF shares in 2012, (ii) YPF was not liable for failing to enforce its bylaws against Argentina, (iii) the various arguments Argentina had made to try to reduce its damages liability from the straightforward application of the formula in the bylaws were unavailing and (iv) an evidentiary hearing was needed to resolve two factual issues to enable the computation of damages, where those issues were (1) the date on which the Republic of Argentina should have made a tender offer for YPF S.A.’s shares and (2) the appropriate rate of pre-judgment interest to be applied.
On September 8, 2023, the Court issued its findings of fact and conclusions of law (the “September 2023 Ruling”) in connection with the Petersen and Eton Park cases against the Republic of Argentina and YPF S.A. In summary, the Court decided the issues raised at the evidentiary hearing in Petersen’s and Eton Park’s favor, holding that the appropriate date for the tender offer was April 16, 2012 and that pre-judgment interest should run from May 3, 2012 at a simple interest rate of 8%.
On September 15, 2023, the Court issued a final judgment (the “September 2023 Final Judgment”) that resulted in a complete win by Petersen and Eton Park with respect to damages against Argentina of $16.1 billion, comprised of $14.3 billion due to Petersen and $1.7 billion due to Eton Park. The September 2023 Final Judgment awards post-judgment interest at a rate of 5.42% per annum, computed daily to the date of payment and compounded annually. On October 10, 2023, the Republic of Argentina filed a notice of appeal with the US Court of Appeals for the Second Circuit and, on October 18, 2023, Petersen and Eton Park filed a notice a cross-appeal as to the dismissal of their claims against YPF S.A.
38 Burford Capital Annual Report 2023
On a consolidated basis, the fair value of the YPF-related assets (both Petersen and Eton Park combined) increased to $2.1 billion at December 31, 2023 as compared to $1.2 billion at December 31, 2022, due primarily to fair value adjustments on the YPF-related assets due to the impact of the March 2023 Ruling and the September 2023 Final Judgment. On a consolidated basis, our cost basis increased by $5.6 million and our unrealized gains increased by $820.0 million to $67.2 million and $2.0 billion, respectively, during the year ended December 31, 2023.
On a Burford-only basis, the fair value of the YPF-related assets (both Petersen and Eton Park combined) increased to $1.4 billion at December 31, 2023 as compared to $823.0 million at December 31, 2022, due primarily to fair value adjustments on the YPF-related assets due to the impact of the March 2023 Ruling and the September 2023 Final Judgment. On a Burford-only basis, our cost basis increased by $5.7 million and our unrealized gains increased by $542.9 million to $60.3 million and $1.3 billion, respectively, during the year ended December 31, 2023.
Gains from capital provision-direct portfolio
Consolidated gains from capital provision-direct portfolio
The table below sets forth the components of our total capital provision-direct income for the periods indicated on a consolidated basis.
Consolidated (GAAP) | Years ended December 31, | |||
($ in thousands) | 2023 | 2022 | ||
Realized gains/(losses) | 232,725 | 158,933 | ||
Fair value adjustment during the period, net of previous unrealized gains transferred to realized gains | 1,060,614 | 167,222 | ||
Foreign exchange gains/(losses) | 8,012 | (6,357) | ||
Other | 650 | 3,333 | ||
Total capital provision-direct income | 1,302,001 | 323,131 | ||
Consolidated realized gains
On a consolidated basis, realized gains on the capital provision-direct portfolio increased to $232.7 million for the year ended December 31, 2023 as compared to $158.9 million for the year ended December 31, 2022. For the year ended December 31, 2023, realized gains on the capital provision-direct portfolio of $232.7 million comprised $303.7 million in gross realized gains, offset by $71.0 million in gross realized losses. Within $232.7 million of realized gains, the largest individual realized gain was just under $50.0 million, resulting from the resolution of a single insolvency matter. A significant portion of the realized losses was due to one asset in the second quarter of 2023 that had previously been largely written off in prior periods. For the year ended December 31, 2022, realized gains on the capital provision-direct portfolio of $158.9 million comprised $173.7 million in gross realized gains, offset by $14.8 million in gross realized losses. As a percentage of average capital provision-direct assets at cost on a consolidated basis during the year ended December 31, 2023, gross realized losses were 3.5% as compared to 0.8% for the year ended December 31, 2022.
Consolidated unrealized gains
On a consolidated basis, fair value adjustments, net of previously recognized unrealized gains transferred to realized gains, on the capital provision-direct portfolio increased to $1,060.6 million for the year ended December 31, 2023 as compared to $167.2 million for the year ended December 31, 2022. This increase in fair value adjustments consisted of $820.0 million of fair value adjustments on the YPF-related assets due to the March 2023 Ruling and the September 2023 Final Judgment as well as $240.6 million of fair value adjustments on other assets. As a result of these changes, the adjusted risk premium in the fair value methodology decreased to 30.2% at December 31, 2023 from 38.1% at December 31, 2022. The increase of $240.6 million in fair value adjustments, excluding the YPF-related assets, has also occurred in part due to the impact of the capital provision-direct portfolio’s weighted average discount rate decreasing to 7.0% at December 31, 2023 from 7.3% at December 31, 2022, which increased our fair value adjustments for the year ended December 31, 2023.
Burford Capital Annual Report 2023 39
Burford-only gains from capital provision-direct portfolio
The table below sets forth the components of our total capital provision-direct income for the periods indicated on a Burford-only basis.
Burford-only (non-GAAP) | Years ended December 31, | |||
($ in thousands) | 2023 | 2022 | ||
Realized gains/(losses) | 186,443 | 133,357 | ||
Fair value adjustment during the period, net of previous unrealized gains transferred to realized gains | 694,307 | 73,989 | ||
Foreign exchange gains/(losses) | 7,507 | (4,485) | ||
Other | 650 | 3,333 | ||
Total capital provision-direct income | 888,907 | 206,194 | ||
Burford-only realized gains
On a Burford-only basis, realized gains on the capital provision-direct portfolio increased to $186.4 million for the year ended December 31, 2023 as compared to $133.4 million for the year ended December 31, 2022. For the year ended December 31, 2023, realized gains on the capital provision-direct portfolio of $186.4 million comprised $241.1 million in gross realized gains, offset by $54.7 million in gross realized losses. Within $186.4 million of realized gains, the largest individual realized gain was $37.0 million resulting from the resolution of an asset recovery matter. A significant portion of the realized losses was due to one asset in the second quarter of 2023 that had previously been largely written off in prior periods. For the year ended December 31, 2022, realized gains on the capital provision-direct portfolio of $133.4 million comprised $147.0 million in gross realized gains, offset by $13.6 million in gross realized losses. As a percentage of average capital provision-direct assets at cost on a Burford-only basis during the year ended December 31, 2023, gross realized losses represented 3.6% as compared to 1.0% for the year ended December 31, 2022.
Burford-only unrealized gains
On a Burford-only basis, fair value adjustments, net of previously recognized unrealized gains transferred to realized gains, on the capital provision-direct portfolio increased to $694.3 million for the year ended December 31, 2023 as compared to $74.0 million for the year ended December 31, 2022. This increase in fair value adjustments consisted of $542.9 million of fair value adjustments on the YPF-related assets as a result of the March 2023 Ruling and the September 2023 Final Judgment as well as $151.4 million of fair value adjustments on other assets, and also due in part to the decrease in the discount rates due to the movement in market interest rates.
Undrawn commitments
Our portfolio includes amounts deployed and fair value adjustments, as well as commitments that have not been funded and, therefore, are expected to become deployments at some future date. As our financing commitments may not be deployed for a variety of reasons, they are considered undrawn. See note 21 (Financial commitments and contingent liabilities) to our consolidated financial statements for additional information with respect to undrawn commitments.
At December 31, 2023 and 2022, our consolidated undrawn commitments were $1.9 billion and $1.7 billion, respectively.
The tables below set forth the components of our total undrawn commitments at the dates indicated on consolidated, Burford-only and Group-wide bases.
December 31, 2023 | |||||||||||||||
(GAAP) | (non-GAAP) | ||||||||||||||
Eliminations and | |||||||||||||||
($ in thousands) | Consolidated | adjustments | Burford-only | Other funds | BOF-C | Group-wide | |||||||||
Capital provision assets | 1,873,289 | (465,284) | 1,408,005 | 71% | 186,278 | 9% | 396,646 | 20% | 1,990,929 | ||||||
Post-settlement assets | - | - | - | 0% | 62,455 | 100% | 0% | 62,455 | |||||||
Total undrawn commitments | 1,873,289 | (465,284) | 1,408,005 | 69% | 248,733 | 12% | 396,646 | 19% | 2,053,384 | ||||||
40 Burford Capital Annual Report 2023
December 31, 2022 | |||||||||||||||
(GAAP) | (non-GAAP) | ||||||||||||||
Eliminations and | |||||||||||||||
($ in thousands) | Consolidated | adjustments | Burford-only | Other funds | BOF-C | Group-wide | |||||||||
Capital provision assets | 1,720,727 | (413,446) | 1,307,281 | 68% | 223,539 | 12% | 371,724 | 20% | 1,902,544 | ||||||
Post-settlement assets | - | - | - | 0% | 15,606 | 100% | - | 0% | 15,606 | ||||||
Total undrawn commitments | 1,720,727 | (413,446) | 1,307,281 | 68% | 239,145 | 12% | 371,724 | 20% | 1,918,150 | ||||||
Our undrawn commitments are primarily attributable to the capital provision-direct portfolio. Other undrawn commitments are the responsibility of our private funds and other capital pools, which plan separately and have other sources of liquidity to be able to meet those undrawn commitments, typically by calling capital from their investors. At December 31, 2023 and 2022, we had legal risk management undrawn commitments of $49.5 million and $75.3 million, respectively, none of which we expect to deploy capital and none of which can be drawn on any sort of accelerated basis as these commitments are to cover an indemnity or insurance for adverse costs, such that a deployment would only occur if there were losses in the underlying cases.
The table below sets forth the components of our total capital provision undrawn commitments at the dates indicated on a Burford-only basis.
Burford-only (non-GAAP) | December 31, 2023 | % of total | December 31, 2022 | % of total | ||
($ in thousands) | ||||||
Definitive undrawn commitments | 579,998 | 43% | 583,507 | 48% | ||
Discretionary undrawn commitments | 766,537 | 57% | 640,201 | 52% | ||
Total legal finance undrawn commitments | 1,346,535 | 100% | 1,223,708 | 100% | ||
Legal risk undrawn commitments | 49,526 | 75,340 | ||||
Total capital provision-direct undrawn commitments | 1,396,061 | 1,299,048 | ||||
Capital provision-indirect undrawn commitments (definitive) | 11,944 | 8,233 | ||||
Total capital provision undrawn commitments | 1,408,005 | 1,307,281 |
See “—Reconciliations—Reconciliations of capital provision undrawn commitments” for the reconciliations of the consolidated capital provision undrawn commitments to Burford-only capital provision undrawn commitments.
Our undrawn commitments can be divided into two categories: discretionary and definitive.
| ▪ | Discretionary commitments are those where we retain a considerable degree of discretion over whether to advance capital and generally would not suffer an adverse financial consequence from not doing so. Deployments on discretionary commitments are entirely within our control as we can decline to make the commitment if we do not want to deploy capital at that time. |
| ▪ | Definitive commitments are those where we are contractually obligated to advance incremental capital and failure to do so would typically result in adverse contractual consequences (such as a dilution in our returns or the loss of our deployed capital in a case). |
We believe we have significant visibility into, and control over, our deployments, as a significant portion of our commitments is discretionary. We also believe that we have good visibility into the timing of when definitive commitments will be drawn, partly because many of our agreements structure future draws on an explicit timetable or with reference to case events and partly because we have insight into the timing of individual legal actions. Because of the longer-term nature of such deployments, our aggregate deployments on undrawn commitments remain gradual, with a median over the last five years of 18% of undrawn commitments at prior period end funded in the following 12 months.
In addition, the incidence of settlement means that not all of our commitments will be drawn. Historically, the median deployment in the initial year from commitment was 41% of the commitment amount, increasing to 63% by the third year. On average, we have deployed 78% of our commitments on fully and partially concluded matters, although it can take many years to reach that level on any individual matter.
Portfolio concentrations
The claims underlying our capital provision-direct assets are generally diverse, as are our relationships with corporate and law firm clients.
Burford Capital Annual Report 2023 41
The table below sets forth the respective percentages of our commitments to corporate, law firm and other clients at the dates indicated on a Group-wide basis.
Group-wide capital provision-direct (non-GAAP) | December 31, 2023 | December 31, 2022 | ||
Corporates | 55% | 57% | ||
Law firms | 41% | 39% | ||
Other | 4% | 4% |
Our largest commitment (including deployed capital and undrawn commitment) to a corporate client on a Group-wide basis was $175.0 million ($130.0 million on a Burford-only basis) at December 31, 2023 and 2022. This accounted for 4% of our Group-wide commitments (4% on a Burford-only basis) at December 31, 2023 as compared to 4% of our Group-wide commitments (4% on a Burford-only basis) at December 31, 2022.
Our largest relationship with a single law firm consisted of (i) financing arrangements between us and the law firm, where the law firm seeks to monetize the risk that the law firm has taken with some of its clients, (ii) direct financing arrangements with counterparties that elect to hire the law firm where we finance the law firm’s legal fees and (iii) direct financing arrangements with counterparties that have hired the law firm but where our financing is used for corporate purposes other than for financing the law firm’s legal fees. This law firm is one of the 50 largest law firms in the United States based on revenue according to The American Lawyer, with more than 500 lawyers and more than 20 offices around the world. Our portfolio of matters with this law firm included over 25 different litigation matters at December 31, 2023. Taken together, these arrangements accounted for approximately $236.3 million of commitments on a Group-wide basis ($141.7 million on a Burford-only basis), or 5% of our Group-wide commitments (5% on a Burford-only basis) at December 31, 2023 as compared to $334.4 million of commitments on a Group-wide basis ($201.5 million on a Burford-only basis), or 8% of our Group-wide commitments (7% on a Burford-only basis) at December 31, 2022.
Portfolio tenor
The timing of realizations is difficult to forecast and is rarely in our control. The reality of litigation is that most cases settle and pay proceeds in a relatively short period of time, and a minority of cases go on to adjudication, which takes longer. Adjudication timing is subject to a myriad of factors, including delaying tactics by litigation opponents and court dockets and schedules, and the Covid-19 pandemic has added to this uncertainty. However, we are now seeing the impacts from the Covid-19 pandemic begin to subside. We believe that the impact of the Covid-19 pandemic delaying trial dates also has caused a delay in settlement timing, as an impending trial often can be a catalyst for a settlement. We do not believe there is a correlation between asset life and asset quality and generally structure our asset pricing to compensate us if assets take longer to resolve.
We provide extensive data about the WAL of our concluded portfolio, although this data may not be predictive of the ultimate WAL of our existing portfolio. The WAL of our concluded portfolio may lengthen over time if the longer-tenor assets in our existing portfolio account for a greater share of future concluded cases. Conversely, if our larger, more recently originated cases conclude relatively quickly, the WAL of our concluded portfolio could decrease.
In calculating the WAL of our portfolio, we compute a weighted average of the WALs of individual assets. On that basis, we assess the weighted average lives (beginning at the point of average deployment) of the concluded capital provision-direct portfolio, weighted both by deployed cost and realizations. Weighting by deployed cost provides a view on how long on average a dollar of capital is deployed, while weighting by realizations provides a view on how long on average it takes to recover a dollar of return.
The WALs of the concluded assets in our Burford-only capital provision-direct portfolio increased slightly at December 31, 2023 as compared to the WALs of the concluded assets in our Burford-only capital provision-direct portfolio at December 31, 2022. As mentioned above, the impact from the Covid-19 pandemic delaying settlement timing is expected to cause a slight increase in the WALs. In addition, the losses during the year ended December 31, 2023 added to the effect on the WAL weighted by deployed cost, which factors in all of the deployments, whereas the WAL weighted by realizations is less impacted by losses or lack of returns. The table below sets forth the WALs, weighted by
42 Burford Capital Annual Report 2023
deployed cost and realizations, of the concluded assets in our capital provision-direct portfolio at the dates indicated on a Burford-only basis.
Burford-only (non-GAAP) |
| December 31, | ||
(in years) |
| 2023 | 2022 | |
WAL weighted by deployed cost | 2.2 | 2.1 | ||
WAL weighted by realizations | 2.4 | 2.4 | ||
Returns on concluded portfolio
The table below sets forth our ROIC, IRR and cumulative realizations on concluded assets in our capital provision-direct portfolio at the dates indicated since inception on a Burford-only basis.
Burford-only (non-GAAP) |
| December 31, | ||
($ in thousands) |
| 2023 | 2022 | |
ROIC | 82% | 88% | ||
IRR | 27% | 29% | ||
Cumulative realizations | 2,707,300 | 2,211,084 | ||
As our older vintages conclude, we may see IRR decrease slightly as the impact from the Covid-19 pandemic caused delays in settlement timing. Three assets from our earlier vintages, one from 2010 and two from 2014, concluded during the year ended December 31, 2023 and, given the longer life of these assets, this lengthened the WAL by deployed cost and lowered IRR on our concluded portfolio. Our ROIC declined from 88% at December 31, 2022 to 82% at December 31, 2023 because we had a resolution in one large matter that originated in the 2023 vintage and resolved within six months—we generated $147.6 million of realizations and $33.0 million in realized gains, amounting to a 32% IRR with settlement payments that will occur over time during 2024. The speed of the resolution, given that we had not fully deployed our commitment, meant that our nominal returns were lower (29% ROIC), causing a reduction in our overall cumulative ROIC (82% ROIC). Our total returns from this matter were higher than expressed here given the participation of other pools of capital outside the capital provision-direct portfolio.
We do not consider cases to be concluded (and therefore part of these return metrics on our concluded portfolio) until there is no longer any litigation risk remaining. Return metrics on our concluded portfolio do not include fair value adjustments, either positive or negative. As a result, these return figures do not include the impact, positive or negative, of developments on matters while they remain pending.
Burford Capital Annual Report 2023 43
Capital provision-direct portfolio
The table below sets forth a summary by vintage of every legal finance asset that we have funded in our capital provision-direct portfolio at the date indicated since inception on a Burford-only basis.
December 31, 2023 | ||||||||||||||||
Burford-only (non-GAAP) | Number of | Commitment | Deployed | Realized |
| Concluded (fully and partially) | ||||||||||
($ in millions) | assets | amount(1)(2) | costs(1) | proceeds(1) | ROIC | IRR | WAL – D(3) | WAL – R(4) | ||||||||
Concluded |
| 3 | 12 | 12 | 40 | 251% | 32% | 3.3 | 4.8 | |||||||
Partially realized - concluded |
| — | — | — | — | |||||||||||
Partially realized - ongoing |
| — | — | — | — | |||||||||||
Ongoing |
| — | — | — | — | |||||||||||
2009 Total |
| 3 | 12 | 12 | 40 | |||||||||||
| ||||||||||||||||
Concluded |
| 15 | 104 | 90 | 188 | 108% | 18% | 4.0 | 4.7 | |||||||
Partially realized - concluded |
| — | — | — | — | |||||||||||
Partially realized - ongoing |
| — | — | — | — | |||||||||||
Ongoing |
| 1 | 14 | 14 | — | |||||||||||
2010 Total |
| 16 | 118 | 104 | 188 | |||||||||||
| ||||||||||||||||
Concluded |
| 12 | 107 | 79 | 78 | (2)% | 0% | 3.6 | 2.5 | |||||||
Partially realized - concluded |
| — | — | — | — | |||||||||||
Partially realized - ongoing |
| — | — | — | — | |||||||||||
Ongoing |
| 2 | 16 | 16 | — | |||||||||||
2011 Total |
| 14 | 123 | 95 | 78 | |||||||||||
| ||||||||||||||||
Concluded |
| 9 | 64 | 57 | 116 | 103% | 42% | 2.3 | 2.1 | |||||||
Partially realized - concluded |
| — | — | — | — | |||||||||||
Partially realized - ongoing |
| — | — | — | — | |||||||||||
Ongoing |
| — | — | — | — | |||||||||||
2012 Total |
| 9 | 64 | 57 | 116 | |||||||||||
| ||||||||||||||||
Concluded |
| 10 | 33 | 32 | 63 | 93% | 22% | 2.8 | 3.6 | |||||||
Partially realized - concluded |
| — | (5) | 6 | 6 | 10 | ||||||||||
Partially realized - ongoing |
| 2 | 3 | — | — | |||||||||||
Ongoing |
| — | — | — | — | |||||||||||
2013 Total |
| 12 | 42 | 38 | 73 | |||||||||||
| ||||||||||||||||
Concluded |
| 20 | 130 | 105 | 139 | 30% | 10% | 3.0 | 2.8 | |||||||
Partially realized - concluded |
| — | (5) | 18 | 18 | 21 | ||||||||||
Partially realized - ongoing |
| 3 | 17 | 12 | — | |||||||||||
Ongoing |
| — | — | — | — | |||||||||||
2014 Total |
| 23 | 165 | 135 | 160 | |||||||||||
Concluded |
| 16 | 109 | 86 | 112 | 272% | 136% | 1.7 | 2.8 | |||||||
Partially realized - concluded |
| — | (5) | 15 | 12 | 255 | ||||||||||
Partially realized - ongoing |
| 3 | 201 | 101 | — | |||||||||||
Ongoing |
| 1 | 5 | 5 | — | |||||||||||
2015 Total |
| 20 | 330 | 204 | 367 | |||||||||||
Concluded |
| 15 | 239 | 207 | 279 | 35% | 15% | 2.2 | 2.3 | |||||||
Partially realized - concluded |
| — | (5) | 51 | 32 | 44 | ||||||||||
Partially realized - ongoing |
| 5 | 129 | 69 | — | |||||||||||
Ongoing |
| 6 | 64 | 63 | — | |||||||||||
2016 Total |
| 26 | 483 | 371 | 323 | |||||||||||
Concluded |
| 11 | 139 | 82 | 141 | 90% | 27% | 2.7 | 3.1 | |||||||
Partially realized - concluded |
| — | (5) | 85 | 82 | 170 | ||||||||||
Partially realized - ongoing |
| 6 | 127 | 97 | — | |||||||||||
Ongoing |
| 8 | 209 | 108 | — | |||||||||||
2017 Total |
| 25 | 560 | 369 | 311 | |||||||||||
44 Burford Capital Annual Report 2023
Burford-only (non-GAAP) |
| Number of | Commitment | Deployed | Realized |
| Concluded (fully and partially) | |||||||||
($ in millions) | assets | amount(1)(2) | costs(1) | proceeds(1) | ROIC | IRR | WAL – D(3) | WAL – R(4) | ||||||||
Concluded |
| 15 | 135 | 75 | 141 | 81% | 36% | 2.0 | 2.0 | |||||||
Partially realized - concluded |
| — | (5) | 46 | 43 | 73 | ||||||||||
Partially realized - ongoing |
| 12 | 113 | 87 | — | |||||||||||
Ongoing |
| 12 | 137 | 92 | — | |||||||||||
2018 Total |
| 39 | 431 | 297 | 214 | |||||||||||
| ||||||||||||||||
Concluded |
| 17 | 127 | 117 | 286 | 151% | 99% | 1.5 | 1.6 | |||||||
Partially realized - concluded |
| — | (5) | 31 | 29 | 80 | ||||||||||
Partially realized - ongoing |
| 12 | 169 | 89 | — | |||||||||||
Ongoing |
| 18 | 172 | 71 | — | |||||||||||
2019 Total |
| 47 | 499 | 306 | 366 | |||||||||||
Concluded |
| 6 | 76 | 58 | 99 | 75% | 38% | 1.8 | 1.9 | |||||||
Partially realized - concluded |
| — | (5) | 9 | 9 | 18 | ||||||||||
Partially realized - ongoing |
| 7 | 70 | 47 | — | |||||||||||
Ongoing |
| 16 | 105 | 73 | — | |||||||||||
2020 Total |
| 29 | 260 | 187 | 117 | |||||||||||
Concluded |
| 5 | 17 | 12 | 1 | 43% | 37% | 1.2 | 1.2 | |||||||
Partially realized - concluded |
| — | (5) | 118 | 116 | 182 | ||||||||||
Partially realized - ongoing |
| 8 | 158 | 124 | — | |||||||||||
Ongoing |
| 24 | 246 | 122 | — | |||||||||||
2021 Total |
| 37 | 539 | 374 | 183 | |||||||||||
| ||||||||||||||||
Concluded |
| 2 | 26 | 3 | 8 | 118% | 83% | 0.7 | 0.7 | |||||||
Partially realized - concluded |
| — | (5) | 8 | 8 | 15 | ||||||||||
Partially realized - ongoing |
| 7 | 217 | 123 | — | |||||||||||
Ongoing |
| 30 | 388 | 211 | — | |||||||||||
2022 Total |
| 39 | 639 | 345 | 23 | |||||||||||
Concluded |
| 1 | 190 | 115 | 148 | 29% | 32% | 1.0 | 1.0 | |||||||
Partially realized - concluded |
| — | (5) | — | — | — | ||||||||||
Partially realized - ongoing |
| 4 | 50 | 26 | — | |||||||||||
Ongoing |
| 19 | 389 | 26 | — | |||||||||||
2023 Total |
| 24 | 629 | 167 | 148 | |||||||||||
Total portfolio: |
| |||||||||||||||
Concluded |
| 157 | 1,508 | 1,130 | 1,839 | |||||||||||
Partially realized - concluded(6) |
| 69 | 387 | 355 | 868 | |||||||||||
Total capital provision-direct - concluded portion |
| 226 | 1,895 | 1,485 | 2,707 | 82% | 27% | 2.2 | 2.4 | |||||||
Ongoing |
| 137 | 1,745 | 801 | — | |||||||||||
Partially realized – ongoing portion(6) |
| 69 | 1,254 | 775 | - | |||||||||||
Total capital provision-direct - ongoing portion |
| 206 | 2,999 | 1,576 | - | |||||||||||
Total capital provision-direct portfolio |
| 363 | 4,894 | 3,061 | 2,707 | |||||||||||
1. | Amounts in currencies other than US dollar are reported in this table at the foreign exchange rates in effect at the time of the historical transaction, i.e., when the commitment or deployment was made or when proceeds were realized, respectively. Amounts related to those transactions (such as undrawn commitments or deployed costs) reflected elsewhere in this “Operating and financial review and prospects” or in our consolidated financial statements may be reported based on the foreign exchange rates in effect at the end of the applicable period and, therefore, may differ from the amounts in this table. |
2. | A portion of certain ongoing assets’ undrawn commitments are no longer an obligation. This table presents an asset’s gross original commitments, so it does not reflect a reduction in commitment for the portion that is no longer an obligation. This will result in a difference when compared to undrawn commitments in note 21 (Financial commitments and contingent liabilities) to our consolidated financial statements. |
3. | WAL of the vintage weighted by deployed cost and inclusive of concluded and partially concluded assets in each vintage. |
4. | WAL of the vintage weighted by realizations and inclusive of concluded and partially concluded assets in each vintage. |
5. | The number of assets for partially realized concluded transactions are listed under the number of assets for partially realized ongoing transactions as these are the concluded and ongoing portions of the same transactions. |
6. | At December 31, 2023, there were 69 capital provision assets with partial realizations. We repeat the number with partial realizations in total capital provision-direct concluded and total capital provision-direct ongoing. |
Burford Capital Annual Report 2023 45
Capital provision-indirect portfolio
Capital provision-indirect, the category in our capital provision segment comprising our balance sheet’s participations in our private funds, consists of the Advantage Fund at December 31, 2023. The Advantage Fund closed as to fund raising and began deploying capital during the year ended December 31, 2022.
New commitments
The tables below set forth the components of our new commitments for the periods indicated on Burford-only and Group-wide bases.
Year ended December 31, 2023 | |||||||||||
(non-GAAP) | |||||||||||
($ in thousands) | Burford-only | Other funds | BOF-C | Group-wide | |||||||
Capital provision-direct | 691,086 | 77% | 3,389 | 0% | 202,333 | 23% | 896,808 | ||||
Capital provision-indirect | 33,125 | 17% | 165,626 | 83% | - | 0% | 198,751 | ||||
Post-settlement | - | 0% | 131,041 | 100% | - | 0% | 131,041 | ||||
Total new commitments | 724,211 | 59% | 300,056 | 25% | 202,333 | 16% | 1,226,600 | ||||
| 1. |
Year ended December 31, 2022 | |||||||||||
(non-GAAP) | |||||||||||
($ in thousands) | Burford-only | Other funds | BOF-C | Group-wide | |||||||
Capital provision-direct | 726,273 | 82% | 2,452 | 0% | 155,601 | 18% | 884,326 | ||||
Capital provision-indirect | 20,167 | 17% | 100,833 | 83% | - | 0% | 121,000 | ||||
Post-settlement | - | 0% | 174,009 | 100% | - | 0% | 174,009 | ||||
Total new commitments | 746,440 | 63% | 277,294 | 24% | 155,601 | 13% | 1,179,335 | ||||
| 2. |
Group-wide new commitments increased 4% to $1.2 billion, including $896.8 million within capital provision-direct, for the year ended December 31, 2023 as compared to Group-wide new commitments of $1.2 billion, including $884.3 million within capital provision-direct, for the year ended December 31, 2022. Group-wide capital provision-direct new commitments increased 1% for the year ended December 31, 2023, as we closed a single commitment of $253.0 million during the year ended December 31, 2023 which was double the size of the largest commitment of $125.0 million closed during the year ended December 31, 2022. Within capital provision-indirect, the Advantage Fund also added $198.8 million of new commitments during the year ended December 31, 2023 as compared to $121.0 million of new commitments during the year ended December 31, 2022.
Burford-only new commitments were $724.2 million, including $691.1 million within capital provision-direct, for the year ended December 31, 2023 as compared to Burford-only new commitments of $746.4 million, including $726.3 million within capital provision-direct, for the year ended December 31, 2022. Burford-only share of Group-wide capital provision-direct new commitments was 77% for the year ended December 31, 2023 as compared to 82% for the year ended December 31, 2022. Since May 2022, our allocation policy was restructured to share eligible capital provision assets using a split of 75/25 between the balance sheet and BOF-C, respectively, whereas prior to May 2022 our balance sheet and BOF-C each took 50% of eligible assets. The higher percentage of 82% of new commitments by the balance sheet for the year ended December 31, 2022 reflects certain assets which are not eligible to be allocated to BOF-C.
Deployments
The tables below set forth the components of our deployments for the periods indicated on consolidated, Burford-only and Group-wide bases.
Year ended December 31, 2023 | |||||||||||||||
(GAAP) | (non-GAAP) | ||||||||||||||
Eliminations and | |||||||||||||||
($ in thousands) | Consolidated | adjustments | Burford-only | Other funds | BOF-C | Group-wide | |||||||||
Capital provision-direct | 505,893 | (123,698) | 382,195 | 72% | 25,679 | 5% | 122,352 | 23% | 530,226 | ||||||
Capital provision-indirect | 176,134 | (146,778) | 29,356 | 17% | 146,778 | 83% | - | 0% | 176,134 | ||||||
Post-settlement | - | - | - | 0% | 85,397 | 100% | - | 0% | 85,397 | ||||||
Total deployments | 682,027 | (270,476) | 411,551 | 52% | 257,854 | 33% | 122,352 | 15% | 791,757 | ||||||
46 Burford Capital Annual Report 2023
Year ended December 31, 2022 | |||||||||||||||
(GAAP) | (non-GAAP) | ||||||||||||||
Eliminations and | |||||||||||||||
($ in thousands) | Consolidated | adjustments | Burford-only | Other funds | BOF-C | Group-wide | |||||||||
Capital provision-direct | 605,402 | (148,296) | 457,106 | 72% | 30,574 | 5% | 147,976 | 23% | 635,656 | ||||||
Capital provision-indirect | 121,896 | (101,573) | 20,323 | 17% | 101,158 | 83% | - | 0% | 121,481 | ||||||
Post-settlement | - | - | - | 0% | 170,689 | 100% | - | 0% | 170,689 | ||||||
Total deployments | 727,298 | (249,869) | 477,429 | 51% | 302,421 | 33% | 147,976 | 16% | 927,826 | ||||||
On a consolidated basis, total deployments were $682.0 million for the year ended December 31, 2023, down 6% from $727.3 million for the year ended December 31, 2022. On a Burford-only basis, total deployments were $411.6 million for the year ended December 31, 2023, down 14% from $477.4 million for the year ended December 31, 2022. On a Group-wide basis, total deployments were $791.8 million for the year ended December 31, 2023, down 15% from $927.8 million for the year ended December 31, 2022. On both consolidated and Group-wide bases, our largest deployment was a capital provision-direct asset for more than $150.0 million, with the Burford-only participation in the asset being $115.0 million.
See “—Reconciliations—Deployments reconciliations” for the reconciliations of the consolidated deployments to Burford-only deployments.
Realizations
We consider a legal finance asset to be concluded where there is no longer any litigation risk remaining, generally because of an agreed settlement or a final judgment. Upon conclusion, we record the legal finance asset, including both capital and return, as having been realized. At that point, we recognize the amount due to us for our capital and return as either cash or a due from settlement of capital provision assets receivable. Cash proceeds can be calculated by netting realizations with the change in due from settlement of capital provision assets receivables.
The tables below set forth the components of our realizations for the periods indicated on consolidated, Burford-only and Group-wide bases.
Year ended December 31, 2023 | |||||||||||||||
(GAAP) | (non-GAAP) | ||||||||||||||
Eliminations and | |||||||||||||||
($ in thousands) | Consolidated | adjustments | Burford-only | Other funds | BOF-C | Group-wide | |||||||||
Capital provision-direct | 564,491 | (68,275) | 496,216 | 68% | 112,188 | 15% | 124,409 | 17% | 732,813 | ||||||
Capital provision-indirect | 143,802 | (109,392) | 34,410 | 24% | 109,078 | 76% | - | 0% | 143,488 | ||||||
Post-settlement | - | - | - | 0% | 241,490 | 100% | - | 0% | 241,490 | ||||||
Total realizations | 708,293 | (177,667) | 530,626 | 47% | 462,756 | 42% | 124,409 | 11% | 1,117,791 | ||||||
Year ended December 31, 2022 | |||||||||||||||
(GAAP) | (non-GAAP) | ||||||||||||||
Eliminations and | |||||||||||||||
($ in thousands) | Consolidated | adjustments | Burford-only | Other funds | BOF-C | Group-wide | |||||||||
Capital provision-direct | 402,196 | (51,987) | 350,209 | 59% | 174,707 | 30% | 65,988 | 11% | 590,904 | ||||||
Capital provision-indirect | 24,538 | (14,216) | 10,322 | 26% | 28,746 | 74% | - | 0% | 39,068 | ||||||
Post-settlement | - | - | - | 0% | 104,637 | 100% | - | 0% | 104,637 | ||||||
Total realizations | 426,734 | (66,203) | 360,531 | 49% | 308,090 | 42% | 65,988 | 9% | 734,609 | ||||||
On a consolidated basis, total realizations were $708.3 million for the year ended December 31, 2023, up 66% from $426.7 million for the year ended December 31, 2022. On a Burford-only basis, total realizations were $530.6 million for the year ended December 31, 2023, up 47% from $360.5 million for the year ended December 31, 2022. On a Group-wide basis, total realizations were $1.1 billion for the year ended December 31, 2023, up 52% from $734.6 million for the year ended December 31, 2022, and capital provision-direct realizations were $732.8 million for the year ended December 31, 2023, up 24% from $590.9 million for the year ended December 31, 2022.
Since inception, we have generated $2.7 billion in realizations from concluded or partially concluded assets from Burford-only capital provision-direct assets with a deployed cost of $1.5 billion, earning $1.2 billion in realized gains. On a Burford-only capital provision-direct basis, at December 31, 2023 and 2022, we had $1.6 billion and $1.5 billion of deployed costs in ongoing assets (calculated at original exchange rates).
We expect to see significant realizations over time. However, period-to-period volatility is characteristic of our business, and the timing of realizations is uncertain. We can neither predict nor control the timing of the realizations
Burford Capital Annual Report 2023 47
on our legal finance assets. See “Business—Seasonality” for additional information with respect to the seasonality of our realizations.
See “—Reconciliations—Realizations reconciliations” for the reconciliations of our consolidated realizations to Group-wide realizations and our consolidated realizations to Burford-only realizations.
Asset management
At December 31, 2023, we operated eight private funds and three “sidecar” funds as an investment adviser registered with, and regulated by, the SEC. At each of December 31, 2023 and 2022, our total AUM was $3.4 billion. See “Business—Products and services—Asset management” for additional information with respect to our private funds.
The table below sets forth key statistics for each of our private funds at December 31, 2023.
December 31, 2023 |
| |||||||||||||||
Investor | Asset | Asset | Fee structure(1) | |||||||||||||
commitments | commitments | deployments | (management/ | Investment | ||||||||||||
($ in millions) |
| Strategy |
| closed |
| to date |
| to date |
| AUM |
| performance) |
| Waterfall |
| period (end) |
BCIM Partners II, LP(2) | Core legal finance | 260 | 253 | 184 | 150 | Class A: 2%/20%; Class B: 0%/50% | European |
| 12/15/2015 | |||||||
BCIM Partners III, LP | Core legal finance | 412 | 447 | 325 | 433 | 2%/20% | European |
| 1/1/2020(3) | |||||||
Burford Opportunity Fund LP & Burford Opportunity Fund B LP (BOF) | Core legal finance | 300 | 395 | 288 | 387 | 2%/20% | European |
| 12/31/2021(4) | |||||||
BCIM Credit Opportunities, LP (COLP) | Post-settlement | 488 | 699 | 695 | 411 | 1% on undrawn/ 2% on funded and 20% incentive | European |
| 9/30/2019(3) | |||||||
Burford Alternative Income Fund LP (BAIF)(2) | Post-settlement | 327 | 672 | 661 | 270 | 1.5%/10% | European |
| 4/4/2022 | |||||||
Burford Alternative Income Fund II LP (BAIF II) | Post-settlement | 350 | 286 | 234 | 368 | 1.5%/12.5% | European |
| 9/11/2025 | |||||||
Burford Advantage Master Fund LP (Advantage Fund) | Lower risk legal finance | 360 | 370 | 298 | 395 | Profit split(5) | American | 12/24/2024 | ||||||||
Burford Opportunity Fund C LP (BOF-C)(2) | Core legal finance | 766 | 1,106 | 681 | 1,017 | Expense reimbursement + profit share |
| Hybrid |
| 12/31/2024(6) | ||||||
Totals |
| 3,263 | 4,228 | 3,366 | 3,431 |
|
|
|
| |||||||
1. | Management fees are paid to BCIM for investment management and advisory services provided to our private funds. The management fee rates set forth in the table above are annualized and applied to an asset or commitment base that typically varies between a private fund’s investment period and any subsequent periods in the fund term. At December 31, 2023, we no longer earned any management fees from BCIM Partners II, LP, BCIM Partners III, LP, COLP and BAIF. Performance fees represent carried interest applied to distributions to a private fund’s limited partners after the return of capital contributions and preferred returns. |
2. | Includes amounts related to “sidecar” funds. |
3. | Ceased commitments to new legal finance assets in the fourth quarter of 2018 due to capacity. |
4. | Ceased commitments to new legal finance assets in the fourth quarter of 2020 due to capacity. |
5. | The Advantage Fund does not have a traditional management and performance fee structure, but instead provides the first 10% of annual simple returns to the fund investors while we retain any excess return. However, if the Advantage Fund produces returns in excess of 18% (which are supranormal for this level of risk), a level of sharing with the fund investors would take effect, but we do not expect that to occur. |
6. | In October 2023, BOF-C’s investment period was extended by one year through December 31, 2024. |
Our asset management income consists of (i) management fee income—i.e., the fee earned by us from administering the private funds we manage for third-party investors, and (ii) performance fee income—i.e., the share of profits generated from the private funds that we manage on behalf of third-party limited partners, which is paid as a performance fee when the private funds meet certain performance conditions.
The table below sets forth the components of our asset management income for the periods indicated on a consolidated basis.
Consolidated (GAAP) | Year ended December 31, | |||
($ in thousands) |
| 2023 | 2022 | |
Management fee income | 7,642 | 7,321 | ||
Performance fee income | - | 1,795 | ||
Total asset management income | 7,642 | 9,116 | ||
See “—Results of operations and financial position—Statements of operations for the year ended December 31, 2023 as compared to the year ended December 31, 2022—Asset management income” for the explanation of the period-over-period changes in our asset management income.
The table below sets forth the components of our asset management income for the periods indicated on a Burford-only basis. Because BOF-C is a consolidated entity, income from BOF-C is eliminated from asset management income on a consolidated basis but shown on a Burford-only basis.
48 Burford Capital Annual Report 2023
Burford-only (non-GAAP) | Year ended December 31, | |||
($ in thousands) |
| 2023 | 2022 | |
Management fee income | 7,750 | 7,633 | ||
Performance fee income | - | 1,795 | ||
Income from BOF-C | 55,962 | 46,652 | ||
Total asset management income | 63,712 | 56,080 | ||
On a Burford-only basis, asset management income increased 14% to $63.7 million for the year ended December 31, 2023 as compared to $56.1 million for the year ended December 31, 2022. This increase in asset management income primarily reflects higher capital provision income attributable to BOF-C. For the year ended December 31, 2022, we earned performance fees from BAIF in the amount of $1.8 million, which did not recur as no performance fees were earned for the year ended December 31, 2023.
The timing of the recognition of performance fees is variable as they are recognized when a reliable estimate of the performance fee can be made, and it is probable that a significant reversal in the amount of cumulative revenue recognized will not occur. The maturity and the terms of the applicable distribution waterfall for each of our private funds impact this timing.
See “—Reconciliations—Reconciliations of consolidated financial statements to Burford-only financial statements—Reconciliations of asset management income” for the reconciliations of our consolidated asset management income to Burford-only asset management income.
Liquidity and capital resources
Overview
The table below sets forth our cash and cash equivalents and marketable securities at the dates indicated on a consolidated basis.
Consolidated (GAAP) | December 31, | |||
($ in thousands) | 2023 | 2022 | ||
Cash and cash equivalents | 220,549 | 107,658 | ||
Marketable securities | 107,561 | 136,358 | ||
Total | 328,110 | 244,016 | ||
On a consolidated basis, our cash and cash equivalents and marketable securities increased 34% to $328.1 million at December 31, 2023 as compared to $244.0 million at December 31, 2022. The increase in cash and cash equivalents and marketable securities reflects proceeds from the Initial 2031 Notes, offset by the redemption of the 2024 Bonds and continued deployments in excess of proceeds from capital provision assets.
The table below sets forth our cash and cash equivalents and marketable securities at the dates indicated on a Burford-only basis.
Burford-only (non-GAAP) | December 31, | |||
($ in thousands) | 2023 | 2022 | ||
Cash and cash equivalents | 195,915 | 73,679 | ||
Marketable securities | 107,561 | 136,358 | ||
Total | 303,476 | 210,037 | ||
On a Burford-only basis, our cash and cash equivalents and marketable securities increased 44% to $303.5 million at December 31, 2023 as compared to $210.0 million at December 31, 2022. The increase in cash and cash equivalents and marketable securities reflects proceeds from the Initial 2031 Notes, partially offset by the redemption of the 2024 Bonds. In addition, cash receipts exceeded deployments on capital provision assets during the year ended December 31, 2023.
Our marketable securities primarily consist of short-duration and generally investment-grade fixed income assets, the bulk of which is held in separately managed accounts, managed by a third-party asset manager that specializes in short-duration and money market investments and actively trades those positions.
We believe our available cash and cash from operations, which includes proceeds from our capital provision assets, will be adequate to fund our operations and future growth, satisfy our working capital requirements, meet obligations under our debt securities, pay dividends and meet other liquidity requirements for the foreseeable future.
Burford Capital Annual Report 2023 49
Our material contractual obligations consist of financial liabilities relating to (i) definitive commitments to financing arrangements (ii) debt securities and related interest payments, (iii) operating leases and (iv) third-party interests in capital provision assets. See note 21 (Financial commitments and contingent liabilities) to our consolidated financial statements for additional information with respect to our contractual obligations. See “—Portfolio—Undrawn commitments” for information with respect to our undrawn commitments.
Debt
We issued $400 million aggregate principal amount of the Initial 2031 Notes in June 2023 and an additional $275 million aggregate principal amount of the 9.250% Senior Notes due 2031 (the “Additional 2031 Notes” and, together with the Initial 2031 Notes, the “2031 Notes”) in January 2024. In addition, we redeemed in full the aggregate outstanding principal amount of the 2024 Bonds in July 2023. As a result, at December 31, 2023, we had five series of debt securities outstanding, of which two series were listed on the Order Book for Retail Bonds of the London Stock Exchange and three series were issued through private placement transactions under Rule 144A and Regulation S under the Securities Act. See note 13 (Debt) to our consolidated financial statements and “Equity and debt securities” for additional information with respect to our outstanding debt securities.
We manage our business with relatively low levels of leverage and have laddered debt maturities with an overall weighted average maturity in excess of the expected weighted average life of our legal finance assets. At December 31, 2023, the weighted average maturity of our outstanding debt securities of 5.1 years continued to be longer than the weighted average life of our concluded capital provision-direct assets, weighted by realizations, of 2.4 years.
Going forward, we expect to continue to be an opportunistic issuer of debt securities and may issue new debt securities from time to time to fund our growth or refinance future debt maturities, among other things. In addition, depending on our liquidity position, we may purchase or redeem from time to time a portion of our outstanding debt securities. We chose to redeem in full the aggregate outstanding principal amount of the 2024 Bonds in July 2023 before their final maturity date because the cash economics of doing so were more favorable than allowing the 2024 Bonds to remain outstanding until their scheduled final maturity date in October 2024.
Our debt securities that are listed on the Order Book for Retail Bonds of the London Stock Exchange at the date of this Annual Report contain one significant financial covenant, which is a leverage ratio requirement that we maintain a level of Group Net Debt (as defined in the trust deeds governing such debt securities, and generally equivalent to our consolidated net debt, or our total principal amount of debt outstanding less cash and cash equivalents and marketable securities) that is less than 50% of our Group Total Assets (as defined in the trust deeds governing such debt securities, and generally equivalent to our consolidated tangible assets, or our total assets less goodwill). At December 31, 2023 and 2022, our consolidated net debt to consolidated tangible assets ratio was 22% and 25%, respectively. In addition, the indentures governing the 6.250% Senior Notes due 2028 (the “2028 Notes”) and the 2030 Notes contain certain restrictive covenants that, among other things, require us to have a Consolidated Indebtedness to Net Tangible Equity Ratio (as defined in the indentures governing the 2028 Notes and the 2030 Notes, as applicable) of less than 1.50 to 1.00, 1.75 to 1.00 or 2.00 to 1.00, as applicable, to use certain specified “baskets” in order to undertake specific actions, such as making restricted payments or permitted investments or incurring additional indebtedness. At December 31, 2023 and 2022, our Consolidated Indebtedness to Net Tangible Equity Ratio was 0.7 to 1.00 and 0.8 to 1.00, respectively. Furthermore, the indenture governing the 2031 Notes contains certain restrictive covenants that, among other things, require us to have a Consolidated Indebtedness to Consolidated Equity Ratio (as defined in the indenture governing the 2031 Notes) of less than 1.50 to 1.00, 1.75 to 1.00 or 2.00 to 1.00, as applicable, to use certain specified “baskets” in order to undertake specific actions, such as making restricted payments or permitted investments or incurring additional indebtedness. At December 31, 2023 and 2022, our Consolidated Indebtedness to Consolidated Equity Ratio was 0.6 to 1.00 and 0.7 to 1.00, respectively. See “—Reconciliations—Debt leverage ratio calculations” for the calculations of our debt leverage ratios. At December 31, 2023, we were in compliance with all of the covenants under the trust deeds and the indentures, as applicable.
We are required to provide certain information pursuant to the indentures governing the 2028 Notes, the 2030 Notes and the 2031 Notes. The tables below set forth the total assets and third-party indebtedness at the dates indicated and total revenues for the periods indicated, in each case, of (i) us and our Restricted Subsidiaries (as defined in the indentures governing the 2028 Notes, the 2030 Notes and the 2031 Notes, as applicable) and (ii) our Unrestricted Subsidiaries (as defined in the indentures governing the 2028 Notes, the 2030 Notes and the 2031 Notes, as applicable).
50 Burford Capital Annual Report 2023
Consolidated (GAAP) | December 31,(1) | |||
($ in thousands) | 2023 |
| 2022 | |
Company and its Restricted Subsidiaries | ||||
Total assets | 4,922,451 | 3,643,013 | ||
Third-party indebtedness | 1,534,730 | 1,252,270 | ||
Unrestricted Subsidiaries | ||||
Total assets | 914,943 | 645,346 | ||
Third-party indebtedness | - | - | ||
| 1. | The comparative data at December 31, 2022 in the table above has been amended to correct for immaterial differences. |
Consolidated (GAAP) | Years ended December 31, | |||||
(S in thousands) | 2023 |
| 2022 | 2021 | ||
Company and its Restricted Subsidiaries | ||||||
Total revenues | 973,461 | 245,383 | 173,405 | |||
Unrestricted Subsidiaries | ||||||
Total revenues | 113,441 | 73,844 | 43,925 | |||
Cash flows
Set forth below is a discussion of our cash flows for the periods indicated on a consolidated basis, unless noted otherwise.
The table below sets forth the components of our cash flows for the periods indicated.
Consolidated (GAAP) | Years ended December 31, | |||
($ in thousands) | 2023 | 2022 | ||
Net cash provided/(used) by operating activities | (274,682) | (466,104) | ||
Net cash provided/(used) by investing activities | (3,212) | (407) | ||
Net cash provided/(used) by financing activities | 389,534 | 399,131 | ||
Net increase/(decrease) in cash and cash equivalents | 111,640 | (67,380) | ||
Net cash provided/(used) by operating activities
Net cash used by operating activities decreased 41% to $274.7 million for the year ended December 31, 2023 as compared to $466.1 million for the year ended December 31, 2022. The decrease in net cash used by operating activities reflects primarily an increase of proceeds received from capital provision assets year-over-year.
The table below sets forth the components of our net cash provided/(used) by operating activities for the periods indicated.
Consolidated (GAAP) | Years ended December 31, | |||
($ in thousands) | 2023 | 2022 | ||
Net cash provided/(used) by operating activities before funding of operating activities | 372,874 | 233,328 | ||
Net proceeds from/(funding of) marketable securities | 34,471 | 27,866 | ||
Funding of capital provision assets | (682,027) | (727,298) | ||
Net cash provided/(used) by operating activities | (274,682) | (466,104) | ||
Net cash provided/(used) by investing activities
Net cash used by investing activities increased to $3.2 million for the year ended December 31, 2023 as compared to less than $1.0 million for the year ended December 31, 2022. The increase in net cash used by investing activities is due to spending on leasehold improvements, of which $2.7 million related to the setup of the new office in London, United Kingdom.
Net cash provided/(used) by financing activities
Net cash provided by financing activities decreased 2% to $389.5 million for the year ended December 31, 2023 as compared to $399.1 million for the year ended December 31, 2022. The decrease in net cash provided by financing activities is due to the increase in outflow of $50.1 million in debt repayments in excess of the higher inflow of $37.2 million from debt issuances year-over-year.
Cash receipts (non-GAAP financial measure)
Cash receipts provide a measure of the cash that our capital provision and other assets generate during a given period as well as cash from certain other fees and income. See “—Basis of presentation of financial information—APMs and
Burford Capital Annual Report 2023 51
non-GAAP financial measures relating to our operating and financial performance—Non-GAAP financial measures” for additional information with respect to our cash receipts. See “—Cash flows” for a discussion of our cash flows on a consolidated basis prepared in accordance with US GAAP.
The table below sets forth the components of our cash receipts for the periods indicated on a Burford-only basis.
Burford-only (non-GAAP) | Year ended December 31, | |||
($ in thousands) |
| 2023 | 2022 | |
Proceeds from capital provision-direct assets | 414,726 | 295,636 | ||
Proceeds from capital provision-indirect assets | 27,340 | 10,293 | ||
Proceeds from asset management income | 32,321 | 14,759 | ||
Proceeds from other items | 14,822 | 7,298 | ||
Cash receipts | 489,209 | 327,986 | ||
On a Burford-only basis, our cash receipts increased 49% to $489.2 million for the year ended December 31, 2023 as compared to $328.0 million for the year ended December 31, 2022. The increase in cash receipts reflects primarily an increase in realizations from the capital provision-direct portfolio period-over-period, including collections on the due from settlement of capital provision assets receivable that was outstanding at December 31, 2022. Of the $116.6 million of due from settlement receivables at December 31, 2022, 91% was collected during the year ended December 31, 2023.
See “—Reconciliations—Cash receipts reconciliation” for a reconciliation of cash receipts to proceeds from capital provision assets, the most comparable measure calculated in accordance with US GAAP.
Dividends
The table below sets forth our dividend payments during the year ended December 31, 2023.
($ in cents) |
| Cash dividend per ordinary share | Payment Date | Record date | ||
2022 final dividend | 6.25 | June 16, 2023 | May 26, 2023 | |||
2023 interim dividend | 6.25 | December 7, 2023 | November 10, 2023 | |||
Total dividend payments made during the year ended December 31, 2023 | 12.50 |
The Board has declared a final dividend of 6.25¢ per ordinary share to be paid, subject to shareholder approval at the annual general meeting to be held in May 2024, on June 14, 2024 to shareholders of record on May 24, 2024 (with an ex-dividend date of May 23, 2024).
We anticipate continuing to pay a total annual dividend of 12.50¢ per ordinary share, payable semi-annually, but do not anticipate regular increases in our dividend per ordinary share level. The Board may review our dividend per ordinary share level from time to time. See “Risk factors—Risks relating to our ordinary shares—There can be no assurance that we will pay dividends or distributions” for additional information with respect to our declaration and payment of dividends.
Off-balance sheet arrangements
At December 31, 2023 and 2022, we had off-balance sheet arrangements relating to legal finance assets with structured entities that aggregate claims from multiple parties in the amount of $2.8 million and $3.8 million, respectively. See note 16 (Variable interest entities) to our consolidated financial statements for additional information with respect to structured entities.
Research and development, patents and licenses, etc.
We do not spend material amounts on research and development, nor do we own any patents or licenses.
Critical accounting estimates
The preparation of our consolidated financial statements in accordance with US GAAP requires our management to make estimates, judgments and assumptions that affect the reported amounts of capital provision assets. Our management bases these estimates and judgments on available information, historical experience and other assumptions that we believe are reasonable under the circumstances. However, these estimates, judgments and assumptions are often subjective and may be impacted negatively based on changing circumstances or changes in our analyses. We believe that our critical accounting policies could potentially produce materially different results if we were to change underlying estimates, judgments and/or assumptions.
52 Burford Capital Annual Report 2023
Set forth below are certain aspects of our critical accounting policies. For a full discussion of these critical accounting policies and other significant accounting policies, see note 2 (Summary of significant accounting policies) to our consolidated financial statements.
Fair value of capital provision assets
The determination of fair value for capital provision assets and financial liabilities relating to third-party interests in capital provision assets involves significant estimates and judgments. While the potential range of outcomes for the assets is wide, our fair value estimation is our best assessment of the current fair value of each asset or liability. Such an estimate is inherently subjective, being based largely on management’s estimate of forecasted cash flows, an assigned discount rate and an assessment of how individual events have changed the possible outcomes of the asset and their relative probabilities and hence the extent to which the fair value has altered. The aggregate of the fair values selected falls within a wide range of reasonably possible estimates. In our management’s opinion, there is no useful alternative valuation that would better quantify the market risk inherent in the portfolio and there are no inputs or variables to which the values of the assets are correlated other than interest rates which impact the discount rates applied. See note 15 (Fair value of assets and liabilities) to our consolidated financial statements and “—Fair value of capital provision assets” for additional information with respect to fair value.
At December 31, 2023 and 2022, should management’s estimate of the value of those instruments have been 10% higher or lower, as applicable, than provided for in our fair value estimates, while all other variables remained constant, our consolidated income and net assets would have increased and decreased, respectively, by $458.7 million and $340.8 million, respectively.
Furthermore, at December 31, 2023 and 2022, should interest rates have been 50 or 100 basis points lower or higher, as applicable, than the actual interest rates used in the fair value estimates, while all other variables remained constant, the Group’s consolidated income and net assets would have increased or decreased, respectively, by the amounts set forth below.
Consolidated (GAAP) | December 31, | |||
($ in thousands) | 2023 | 2022(1) | ||
+100 bps interest rates | (161,110) | (116,874) | ||
+50 bps interest rates | (81,745) | (59,527) | ||
-50 bps interest rates | 82,724 | 59,212 | ||
-100 bps interest rates | 167,944 | 130,076 | ||
1. | The comparative data for December 31, 2022 in the table above has been amended to correct for immaterial differences. |
At December 31, 2023 and 2022, should duration rates have been six or 12 months lower or higher, as applicable, than the actual interest rates used in the fair value estimates, while all other variables remained constant, the Group’s consolidated income and net assets would have increased or decreased, respectively, by the amounts set forth below.
Consolidated (GAAP) | December 31, | |||
($ in thousands) | 2023 | 2022 | ||
+12 months duration(1) | (363,901) | (250,428) | ||
+6 months duration(1) | (188,718) | (130,086) | ||
-6 months duration(1) | 203,442 | 133,950 | ||
-12 months duration(1) | 393,248 | 277,833 | ||
| 1. | Duration refers to the expected timing of a favorable outcome. See note 2 (Summary of significant accounting policies—Fair value of financial instruments) to the Group’s condensed consolidated financial statements for additional information with respect to the valuation methodology for Level 3 assets. |
The sensitivity impact has been provided on a pre-tax basis for both our consolidated income and net assets as we consider the fluctuation in our effective tax rate from period to period could indicate changes in sensitivity not driven by the valuation that are difficult to follow and detract from the comparability of this information.
Impairment testing for goodwill
Goodwill is allocated to independent reporting units based on which reporting units are expected to benefit from the acquisition. After the acquisition, goodwill is subject to periodic impairment testing, which we perform on an annual basis or more frequently if an event occurs or circumstances change that could indicate impairment.
In our assessment of impairment, we may first elect to analyze qualitative factors to determine whether a quantitative analysis is necessary. As part of this analysis, we consider factors such as the results from previous quantitative analyses, macroeconomic conditions, company performance compared to our peers and certain benchmarks. If we
Burford Capital Annual Report 2023 53
conclude that it is more likely than not that a reporting unit’s fair value is less than its carrying amount, we would perform a further quantitative analysis. We may also elect to bypass the qualitative analysis and perform a quantitative analysis.
The quantitative analysis includes the identification of reporting units, assignment of assets and liabilities to reporting units, assignment of goodwill to reporting units and determination of the fair value of each reporting unit. The fair value of our reporting units is determined using cash flow projections, which necessarily take into account changes in the market in which the business operates including the level of growth, competitive activity and the impacts of any regulatory changes. Determining both the expected cash flows and the risk-adjusted interest rate appropriate to the reporting units requires the exercise of judgment. The estimation of cash flows is sensitive to the periods for which the projections are made and to assumptions regarding long-term sustainable cash flows. The model output and all key assumptions are analyzed and challenged by the finance team and are subject to our management’s review and approval. The key assumptions utilized in the quantitative test are the discount rate, terminal growth rate and the return on the capital provision assets.
Management completed a qualitative impairment analysis in the fourth quarter of 2023 for all reporting units and concluded that it is more likely than not that each reporting segment’s fair value is greater than its carrying amount.
Reconciliations
Reconciliations of consolidated financial statements to Burford-only financial statements
The tables below set forth the reconciliations of (i) the specified line items from the consolidated statements of operations to Burford-only statements of operations for the periods indicated and (ii) the consolidated statements of financial position to Burford-only statements of financial position at the dates indicated. The presentation of financial information on a Burford-only basis is intended to provide a view of Burford as a stand-alone business (i.e., eliminating the impact of our private funds) by furnishing information on a non-GAAP basis that eliminates the effect of consolidating some of the limited partner interests in our private funds we manage as well as assets held on our balance sheet where we have a partner or minority investor. See “—Basis of presentation of financial information—Non-GAAP financial measures relating to our business structure” for additional information with respect to presentation of financial information on a Burford-only basis.
The first column in the tables below sets forth our results of operations on a consolidated basis as reported in our consolidated financial statements prepared in accordance with US GAAP. These results of operations include investments in a number of entities that are not wholly owned subsidiaries of Burford Capital Limited and, therefore, contain third-party capital, including BOF-C, the Advantage Fund, Colorado and, prior to its liquidation in the fourth quarter of 2023, the Strategic Value Fund. The presentation of our results of operations on a consolidated basis requires a line-by-line consolidation of 100% of each non-wholly owned entity’s assets and liabilities as well as components of income and expense. The portion of the net assets and the associated income or loss that is attributable to the third-party interests are then presented separately as single line items within the consolidated statements of financial position and the consolidated statements of operations, respectively. We believe it is helpful to exclude the interests of investors other than Burford in our discussion of our results of operations, and we have therefore, as an alternative presentation, excluded from our presentation of our results of operations the non-Burford portion of the individual assets and liabilities as well as components of income and expense relating to such third-party capital. The reconciliations eliminate the line-by-line consolidation of all of the applicable entities’ individual assets and liabilities required by US GAAP to present Burford’s investment in the non-wholly owned entities and Burford’s share of the gain or loss earned on such investment.
The tables below set forth the elimination adjustments separately for BOF-C, the Advantage Fund, Colorado and, prior to its liquidation in the fourth quarter of 2023, the Strategic Value Fund as well as a number of other entities, in which Burford holds a portion of its capital provision assets through special purpose vehicles (an “SPV”) and has minority partners in the SPV, in an additional column titled “Other”. Because Burford controls and owns a significant portion of each of these SPVs, they are consolidated in our financial statements prepared in accordance with US GAAP. In each case, the elimination adjustments are fully reversing the amounts reported as “Plus/(Less): Third-party interest in capital provision assets” and “Financial liabilities relating to third-party interests in consolidated entities” against the applicable components required in the line-by-line consolidation to leave Burford’s gain or loss on its investment in the entities reported in “Capital provision income” and the fair value of its investment in the entities reported in “Capital provision assets”.
54 Burford Capital Annual Report 2023
Reconciliations of consolidated statements of operations to Burford-only statements of operations
The tables below set forth the reconciliations of specified line items from the consolidated statements of operations to Burford-only statements of operations for the periods indicated.
Year ended December 31, 2023 | ||||||||||||||
(GAAP) | (non-GAAP) | |||||||||||||
Elimination of third-party interests | ||||||||||||||
Strategic | Advantage | |||||||||||||
($ in thousands) | Consolidated | Value Fund | BOF-C | Colorado | Fund | Other | Burford-only | |||||||
Revenues | ||||||||||||||
Capital provision income | 1,341,923 | (1,073) | (132,094) | (277,102) | (31,385) | (3,898) | 896,371 | |||||||
(Less): Third-party interests in capital provision assets | (279,263) | - | - | 277,030 | - | 2,233 | - | |||||||
Asset management income | 7,642 | 108 | 55,962 | - | - | - | 63,712 | |||||||
Marketable securities gain/(loss) and bank interest | 12,208 | (2) | (76) | - | - | (63) | 12,067 | |||||||
Other income/(loss) | 4,392 | - | - | - | - | - | 4,392 | |||||||
Total revenues | 1,086,902 | (967) | (76,208) | (72) | (31,385) | (1,728) | 976,542 | |||||||
Operating income | 815,666 | (2) | (76,577) | - | (30,974) | (109) | 708,004 | |||||||
Net income/(loss) | 718,199 | (2) | (76,577) | - | (30,974) | (124) | 610,522 | |||||||
Year ended December 31, 2022 | ||||||||||||||
(GAAP) | (non-GAAP) | |||||||||||||
Elimination of third-party interests | ||||||||||||||
Strategic | Advantage | |||||||||||||
($ in thousands) | Consolidated | Value Fund | BOF-C | Colorado | Fund | Other | Burford-only | |||||||
Revenues | ||||||||||||||
Capital provision income | 319,108 | 3,709 | (112,370) | 661 | (1,417) | (6,813) | 202,878 | |||||||
Plus: Third-party interests in capital provision assets | (494) | - | - | (693) | - | 1,187 | - | |||||||
Asset management income | 9,116 | 312 | 46,652 | - | - | - | 56,080 | |||||||
Marketable securities (loss) and bank interest | (7,744) | 184 | (3) | - | - | (31) | (7,594) | |||||||
Other income/(loss) | (759) | - | - | - | - | - | (759) | |||||||
Total revenues | 319,227 | 4,205 | (65,721) | (32) | (1,417) | (5,657) | 250,605 | |||||||
Operating income | 194,955 | 5,200 | (65,857) | - | (919) | (5,470) | 127,909 | |||||||
Net income/(loss) | 97,459 | 5,200 | (65,857) | - | (919) | (5,377) | 30,506 | |||||||
Burford Capital Annual Report 2023 55
Reconciliations of consolidated statements of financial position to Burford-only statements of financial position
The tables below set forth the reconciliations of consolidated statements of financial position to Burford-only statements of financial position at the dates indicated.
December 31, 2023 | ||||||||||||||
(GAAP) | (non-GAAP) | |||||||||||||
Elimination of third-party interests | ||||||||||||||
Strategic | Advantage | |||||||||||||
($ in thousands) | Consolidated | Value Fund | BOF-C | Colorado | Fund | Other | Burford-only | |||||||
Assets |
|
|
|
|
|
|
|
|
| |||||
Cash and cash equivalents |
| 220,549 | - | (15,703) | (27) | (2,503) | (6,401) | 195,915 | ||||||
Marketable securities |
| 107,561 | - | - | - | - | - | 107,561 | ||||||
Other assets |
| 63,464 | - | 96,471 | 182 | - | - | 160,117 | ||||||
Due from settlement of capital provision assets |
| 265,540 | - | - | - | (78,912) | (1,361) | 185,267 | ||||||
Capital provision assets |
| 5,045,388 | - | (715,007) | (686,459) | (140,998) | (70,812) | 3,432,112 | ||||||
Goodwill |
| 133,965 | - | - | - | - | - | 133,965 | ||||||
Deferred tax asset |
| 927 | - | - | - | - | - | 927 | ||||||
Total assets |
| 5,837,394 |
| - |
| (634,239) |
| (686,304) | (222,413) | (78,574) | 4,215,864 | |||
Liabilities |
|
| ||||||||||||
Debt interest payable |
| 34,416 | - | - | - | - | - | 34,416 | ||||||
Other liabilities |
| 143,015 | - | - | (51) | (100) | (261) | 142,603 | ||||||
Debt payable |
| 1,534,730 | - | - | - | - | - | 1,534,730 | ||||||
Long-term incentive compensation payable | 162,318 | - | - | - | - | - | 162,318 | |||||||
Financial liabilities relating to third-party interests in capital provision assets |
| 704,196 | - | - | (686,253) | - | (17,943) | - | ||||||
Deferred tax liability |
| 50,939 | - | - | - | - | - | 50,939 | ||||||
Total liabilities |
| 2,629,614 |
| - |
| - |
| (686,304) | (100) | (18,204) | 1,925,006 | |||
Total shareholders' equity |
| 3,207,780 |
| - |
| (634,239) |
| - | (222,313) | (60,370) | 2,290,858 | |||
December 31, 2022 | ||||||||||||||
(GAAP) | (non-GAAP) | |||||||||||||
Elimination of third-party interests | ||||||||||||||
Strategic | Advantage | |||||||||||||
($ in thousands) | Consolidated | Value Fund | BOF-C | Colorado | Fund | Other | Burford-only | |||||||
Assets |
|
|
|
|
|
|
|
|
| |||||
Cash and cash equivalents |
| 107,658 | (1,906) | (7,003) | (20) | (23,635) | (1,415) | 73,679 | ||||||
Marketable securities |
| 136,358 | - | - | - | - | - | 136,358 | ||||||
Other assets |
| 51,856 | 58 | 64,909 | 127 | - | - | 116,950 | ||||||
Due from settlement of capital provision assets |
| 116,582 | (1) | - | - | - | (1,931) | 114,650 | ||||||
Capital provision assets |
| 3,735,556 | (930) | (535,496) | (409,356) | (79,888) | (73,446) | 2,636,440 | ||||||
Goodwill |
| 133,912 | - | - | - | - | - | 133,912 | ||||||
Deferred tax asset |
| 6,437 | - | - | - | - | - | 6,437 | ||||||
Total assets |
| 4,288,359 |
| (2,779) |
| (477,590) |
| (409,249) | (103,523) | (76,792) | 3,218,426 | |||
Liabilities |
|
|
|
|
|
|
|
|
|
|
| |||
Debt interest payable |
| 16,815 | - | - | - | - | - | 16,815 | ||||||
Other liabilities |
| 93,904 | (228) | - | (27) | (120) | (148) | 93,381 | ||||||
Debt payable |
| 1,252,270 | - | - | - | - | - | 1,252,270 | ||||||
Long-term incentive compensation payable | 61,769 | - | - | - | - | - | 61,769 | |||||||
Financial liabilities relating to third-party interests in capital provision assets |
| 425,205 | - | (4,234) | (409,222) | - | (11,468) | 281 | ||||||
Deferred tax liability |
| 51,326 | - | - | - | - | - | 51,326 | ||||||
Total liabilities |
| 1,901,289 |
| (228) |
| (4,234) |
| (409,249) | (120) | (11,616) | 1,475,842 | |||
Total shareholders' equity |
| 2,387,070 |
| (2,551) |
| (473,356) |
| - | (103,403) | (65,176) | 1,742,584 | |||
56 Burford Capital Annual Report 2023
Reconciliations of capital provision assets
The tables below set forth the reconciliations of components of the consolidated capital provision assets at the beginning and end of period and unrealized fair value at the end of period to Burford-only capital provision-direct and capital provision-indirect assets at the beginning and end of period and unrealized fair value at the end of period, in each case, for the periods indicated.
| Year ended December 31, 2023 | |||||||||
(GAAP) | (non-GAAP) | |||||||||
Burford-only | ||||||||||
Elimination of | Capital | Capital | ||||||||
third-party | Burford-only | provision- |
| provision- | ||||||
($ in thousands) | Consolidated | interests | total | direct | indirect | |||||
At beginning of period | 3,735,556 | (1,099,116) | 2,636,440 | 2,604,005 | 32,435 | |||||
Deployments | 682,027 | (270,234) | 411,793 | 379,841 | 31,952 | |||||
Realizations | (708,293) | 195,638 | (512,655) | (485,315) | (27,340) | |||||
Income for the period | 1,333,262 | (445,048) | 888,214 | 880,750 | 7,464 | |||||
Foreign exchange gains/(losses) | 2,836 | 5,484 | 8,320 | 8,320 | - | |||||
At end of period | 5,045,388 | (1,613,276) | 3,432,112 | 3,387,601 | 44,511 | |||||
Unrealized fair value at end of period | 2,764,825 | (944,995) | 1,819,830 | 1,814,070 | 5,760 | |||||
| Year ended December 31, 2022 | |||||||||
(GAAP) | (non-GAAP) | |||||||||
Burford-only | ||||||||||
Elimination of | Capital | Capital | ||||||||
third-party | Burford-only | provision- |
| provision- | ||||||
($ in thousands) | Consolidated | interests | total | direct | indirect | |||||
At beginning of period | 3,117,263 | (798,997) | 2,318,266 | 2,296,705 | 21,561 | |||||
Deployments | 727,298 | (245,001) | 482,297 | 457,814 | 24,483 | |||||
Realizations | (426,734) | 69,603 | (357,131) | (346,838) | (10,293) | |||||
Income for the period | 330,811 | (126,780) | 204,030 | 207,346 | (3,316) | |||||
Foreign exchange gains/(losses) | (13,082) | 2,059 | (11,022) | (11,022) | - | |||||
At end of period | 3,735,556 | (1,099,116) | 2,636,440 | 2,604,005 | 32,435 | |||||
Unrealized fair value at end of period | 1,689,407 | (572,414) | 1,116,993 | 1,117,855 | (862) | |||||
Reconciliations of capital provision income
The tables below set forth the reconciliations of components of the consolidated capital provision income to Burford-only capital provision-direct and capital provision-indirect income for the periods indicated.
| Year ended December 31, 2023 | |||||||||
Burford-only | ||||||||||
Elimination of | Capital | Capital | ||||||||
third-party | Burford-only | provision- |
| provision- | ||||||
($ in thousands) | Consolidated | interests | total | direct | indirect | |||||
Realized gains/(losses) | 251,618 | (64,242) | 187,376 | 186,443 | 933 | |||||
Fair value adjustment during the period, net of previously recognized unrealized gains transferred to realized gains | 1,081,644 | (380,806) | 700,838 | 694,307 | 6,531 | |||||
Income on capital provision assets | 1,333,262 | (445,048) | 888,214 | 880,750 | 7,464 | |||||
Foreign exchange gains/(losses) | 8,012 | (505) | 7,507 | 7,507 | - | |||||
Net loss on due from settlement of capital provision assets | (1) | 1 | - | - | - | |||||
Interest and other income | 650 | - | 650 | 650 | - | |||||
Total capital provision income | 1,341,923 | (445,552) | 896,371 | 888,907 | 7,464 | |||||
Burford Capital Annual Report 2023 57
| Year ended December 31, 2022 | |||||||||
Burford-only | ||||||||||
Elimination of | Capital | Capital | ||||||||
third-party | Burford-only | provision- |
| provision- | ||||||
($ in thousands) | Consolidated | interests | total | direct | indirect | |||||
Realized gains/(losses) | 161,707 | (27,234) | 134,473 | 133,357 | 1,116 | |||||
Fair value adjustment during the period, net of previously recognized unrealized gains transferred to realized gains | 169,104 | (99,547) | 69,557 | 73,989 | (4,432) | |||||
Income on capital provision assets | 330,811 | (126,781) | 204,030 | 207,346 | (3,316) | |||||
Interest and other income | 2,651 | (2,651) | - | - | - | |||||
Foreign exchange gains/(losses) | (6,357) | 1,872 | (4,485) | (4,485) | - | |||||
Unrealized loss on due from settlement of capital provision assets | (11,330) | 11,330 | - | - | - | |||||
Gain on financial liabilities at fair value through profit and loss | 3,333 | - | 3,333 | 3,333 | - | |||||
Total capital provision income | 319,108 | (116,230) | 202,878 | 206,194 | (3,316) | |||||
Reconciliations of capital provision income excluding the YPF-related assets
The tables below set forth the reconciliations of components of the consolidated capital provision income to consolidated capital provision income excluding the YPF-related assets.
Years ended December 31, | ||||
($ in thousands) | 2023 | 2022 | ||
Capital provision income | 1,341,923 | 319,108 | ||
Less: Capital provision income from YPF-related assets | (820,011) | 2,715 | ||
Capital provision income excluding YPF-related assets | 521,912 | 321,823 | ||
Reconciliations of capital provision assets excluding the YPF-related assets
The tables below set forth the reconciliations of components of the consolidated capital provision assets excluding the YPF-related assets to Burford-only capital provision assets excluding the YPF-related assets at the dates indicated
| December 31, 2023 | |||||
(GAAP) | (non-GAAP) | |||||
Elimination of | ||||||
third-party | Burford-only | |||||
($ in thousands) | Consolidated | interests | total | |||
Capital provision assets | 5,045,388 | (1,613,276) | 3,432,112 | |||
Deployed costs | 2,280,563 | (668,281) | 1,612,282 | |||
Deployed costs on YPF-related assets | 67,167 | (6,829) | 60,338 | |||
Deployed costs on non-YPF-related assets | 2,213,396 | (661,452) | 1,551,944 | |||
Unrealized gains | 2,764,825 | (944,995) | 1,819,830 | |||
Unrealized gains on YPF-related assets | 1,990,950 | (679,631) | 1,311,319 | |||
Unrealized gains on non-YPF-related assets | 773,875 | (265,364) | 508,511 | |||
| December 31, 2022 | |||||
(GAAP) | (non-GAAP) | |||||
Elimination of | ||||||
third-party | Burford-only | |||||
($ in thousands) | Consolidated | interests | total | |||
Capital provision assets | 3,735,556 | (1,099,116) | 2,636,440 | |||
Deployed costs | 2,046,149 | (526,702) | 1,519,447 | |||
Deployed costs on YPF-related assets | 61,610 | (6,985) | 54,625 | |||
Deployed costs on non-YPF-related assets | 1,984,539 | (519,717) | 1,464,822 | |||
Unrealized gains | 1,689,407 | (572,414) | 1,116,993 | |||
Unrealized gains on YPF-related assets | 1,170,939 | (402,529) | 768,410 | |||
Unrealized gains on non-YPF-related assets | 518,468 | (169,885) | 348,583 | |||
58 Burford Capital Annual Report 2023
Reconciliations of due from settlement of capital provision assets
The tables below set forth the reconciliations of components of the consolidated due from settlement of capital provision assets at the beginning and end of period to Burford-only due from settlement of capital provision-direct and capital provision-indirect assets at the beginning and end of period for the periods indicated.
| Year ended December 31, 2023 | |||||||||
(GAAP) | (non-GAAP) | |||||||||
Burford-only | ||||||||||
Elimination of | Capital | Capital | ||||||||
third-party | Burford-only | provision- |
| provision- | ||||||
($ in thousands) | Consolidated | interests | total | direct | indirect | |||||
At beginning of period | 116,582 | (1,932) | 114,650 | 114,650 | - | |||||
Transfer of realizations from capital provision assets | 708,293 | (195,638) | 512,655 | 485,315 | 27,340 | |||||
Realized gains/(losses) | (11,330) | 11,330 | - | - | - | |||||
Previously recognized unrealized loss transferred to realized loss | 11,329 | (11,329) | - | - | - | |||||
Proceeds received | (559,362) | 117,296 | (442,066) | (414,726) | (27,340) | |||||
Foreign exchange gains/(losses) | 28 | - | 28 | 28 | - | |||||
At end of period | 265,540 | (80,273) | 185,267 | 185,267 | - | |||||
| Year ended December 31, 2022 | |||||||||
(GAAP) | (non-GAAP) | |||||||||
Burford-only | ||||||||||
Elimination of | Capital | Capital | ||||||||
third-party | Burford-only | provision- |
| provision- | ||||||
($ in thousands) | Consolidated | interests | total | direct | indirect | |||||
At beginning of period | 86,311 | (22,864) | 63,447 | 63,447 | - | |||||
Transfer of realizations from capital provision assets | 426,734 | (69,603) | 357,131 | 346,838 | 10,293 | |||||
Interest and other income | 2,651 | (2,651) | - | - | - | |||||
Unrealized loss on due from settlement of capital provision assets | (11,330) | 11,330 | - | - | - | |||||
Proceeds received | (387,786) | 81,857 | (305,929) | (295,636) | (10,293) | |||||
Foreign exchange gains/(losses) | 2 | (1) | 1 | 1 | - | |||||
At end of period | 116,582 | (1,932) | 114,650 | 114,650 | - | |||||
Reconciliations of asset management income
The tables below set forth the reconciliations of components of the consolidated asset management income to Burford-only asset management income for the periods indicated.
Year ended December 31, 2023 | Year ended December 31, 2022 | |||||||||||
(GAAP) | (non-GAAP) | (GAAP) | (non-GAAP) | |||||||||
Elimination of | Elimination of | |||||||||||
third-party | third-party | |||||||||||
($ in thousands) | Consolidated | interests | Burford-only | Consolidated | interests | Burford-only | ||||||
Management fee income | 7,642 | 108 | 7,750 | 7,321 | 312 | 7,633 | ||||||
Performance fee income | - | - | - | 1,795 | - | 1,795 | ||||||
Income from BOF-C | - | 55,962 | 55,962 | - | 46,652 | 46,652 | ||||||
Total asset management income | 7,642 | 56,070 | 63,712 | 9,116 | 46,964 | 56,080 | ||||||
Burford Capital Annual Report 2023 59
Reconciliations of capital provision-direct undrawn commitments
The tables below set forth the reconciliations of the consolidated capital provision undrawn commitments to Burford-only capital provision undrawn commitments at the dates indicated.
December 31, 2023 | ||||||
(GAAP) | (non-GAAP) | |||||
Elimination of | ||||||
third-party | ||||||
($ in thousands) | Consolidated | interests | Burford-only | |||
Definitive | 768,311 | (188,313) | 579,998 | |||
Discretionary | 977,733 | (211,196) | 766,537 | |||
Total legal finance undrawn commitments | 1,746,044 | (399,509) | 1,346,535 | |||
Legal risk (definitive) | 55,583 | (6,057) | 49,526 | |||
Total capital provision-direct undrawn commitments | 1,801,627 | (405,566) | 1,396,061 | |||
Capital provision-indirect undrawn commitments | 71,662 | (59,718) | 11,944 | |||
Total capital provision undrawn commitments | 1,873,289 | (465,284) | 1,408,005 | |||
December 31, 2022 | ||||||
(GAAP) | (non-GAAP) | |||||
Elimination of | ||||||
third-party | ||||||
($ in thousands) | Consolidated | interests | Burford-only | |||
Definitive | 767,786 | (184,279) | 583,507 | |||
Discretionary | 822,348 | (182,147) | 640,201 | |||
Total legal finance undrawn commitments | 1,590,134 | (366,426) | 1,223,708 | |||
Legal risk (definitive) | 81,193 | (5,853) | 75,340 | |||
Total capital provision-direct undrawn commitments | 1,671,327 | (372,279) | 1,299,048 | |||
Capital provision-indirect undrawn commitments | 49,400 | (41,167) | 8,233 | |||
Total capital provision undrawn commitments | 1,720,727 | (413,446) | 1,307,281 | |||
Deployments reconciliations
The table below sets forth the reconciliations of the components of consolidated deployments to Burford-only deployments for the periods indicated.
Years ended December 31, | ||||
($ in thousands) |
| 2023 | 2022 | |
Consolidated deployments | 682,027 | 727,298 | ||
Less: Elimination of third-party interests | (270,234) | (245,001) | ||
Burford-only total deployments | 411,793 | 482,297 | ||
Burford-only capital provision-direct deployments | 379,841 | 457,814 | ||
Less: Capital deployed but not yet invested | (2,644) | (708) | ||
Plus: Capital deployed in prior years and invested in the current year | 3,727 | - | ||
Plus: Case-related expenditures ineligible for inclusion in asset cost | 988 | - | ||
Plus: Deployments on behalf of subparticipations | 283 | - | ||
Adjusted Burford-only capital provision-direct deployments | 382,195 | 457,106 | ||
Burford-only capital provision-indirect deployments | 31,952 | 24,483 | ||
Less: Capital deployed to fund level but not yet invested | (2,596) | (4,160) | ||
Adjusted Burford-only capital provision-indirect deployments | 29,356 | 20,323 | ||
Adjusted Burford-only total deployments | 411,551 | 477,429 | ||
See “—Basis of presentation of financial information—APMs and non-GAAP financial measures relating to our operating and financial performance—APMs” and “Certain terms used in this Annual Report” for additional information with respect to certain terms useful for the understanding of our deployments information and “Operating and financial review and prospects—Deployments” for additional information with respect to our deployments.
60 Burford Capital Annual Report 2023
Realizations reconciliations
The table below sets forth the reconciliations of the components of consolidated realizations to Burford-only realizations for the periods indicated.
Years ended December 31, | ||||
($ in thousands) |
| 2023 | 2022 | |
Consolidated realizations | 708,293 | 426,734 | ||
Less: Elimination of third-party interests | (195,638) | (69,603) | ||
Burford-only total realizations | 512,655 | 357,131 | ||
Burford-only capital provision-direct realizations | 485,315 | 346,838 | ||
Plus: Realizations from financial liabilities at fair value through profit or loss | - | 3,333 | ||
Plus: Realizations from investment subparticipations | 199 | 38 | ||
Plus: Reported realizations held at joint venture and not yet distributed | 10,702 | - | ||
Adjusted Burford-only capital provision-direct realizations | 496,216 | 350,209 | ||
Burford-only capital provision-indirect realizations | 27,340 | 10,293 | ||
Plus/(Less): Reported realizations held at fund level and not yet distributed | 7,070 | 29 | ||
Adjusted Burford-only capital provision-indirect realizations | 34,410 | 10,322 | ||
Adjusted Burford-only total realizations | 530,626 | 360,531 | ||
See “—Basis of presentation of financial information—APMs and non-GAAP financial measures relating to our operating and financial performance—APMs” and “Certain terms used in this Annual Report” for additional information with respect to certain terms useful for the understanding of our realizations information and “Operating and financial review and prospects—Realizations” for additional information with respect to our realizations.
Cash receipts reconciliations
The table below sets forth the reconciliations of cash receipts to proceeds from capital provision assets, the most comparable measure calculated in accordance with US GAAP, for the periods indicated.
Year ended December 31, | ||||
($ in thousands) |
| 2023 | 2022 | |
Consolidated proceeds from capital provision assets | 559,362 | 387,786 | ||
Less: Elimination of third-party interests | (117,296) | (81,857) | ||
Burford-only total proceeds from capital provision assets | 442,066 | 305,929 | ||
Burford-only proceeds from capital provision-direct assets | 414,726 | 295,636 | ||
Burford-only proceeds from capital provision-indirect assets | 27,340 | 10,293 | ||
Burford-only total proceeds from capital provision assets | 442,066 | 305,929 | ||
Consolidated asset management income | 7,642 | 9,116 | ||
Plus: Eliminated income from funds | 56,070 | 46,964 | ||
Burford-only asset management income | 63,712 | 56,080 | ||
Less: Non-cash adjustments(1) | (31,391) | (41,321) | ||
Burford-only proceeds from asset management income | 32,321 | 14,759 | ||
Burford-only proceeds from marketable securities interest and dividends | 6,297 | 3,585 | ||
Burford-only proceeds from other income | 7,875 | 3,713 | ||
Burford-only proceeds from non-recurring items | 650 | - | ||
Burford-only proceeds from other items | 14,822 | 7,298 | ||
Cash receipts | 489,209 | 327,986 | ||
| 1. | Adjustments for the change in asset management receivables accrued during the applicable period but not yet received at the end of such period. |
See “—Basis of presentation of financial information—APMs and non-GAAP financial measures relating to our operating and financial performance—Non-GAAP financial measures” and “Operating and financial review and prospects—Cash receipts” for additional information with respect to cash receipts.
Burford Capital Annual Report 2023 61
Reconciliations of consolidated portfolio to Group-wide portfolio
The tables below set forth the reconciliations of specified line items from the consolidated statements of financial position and notes to the financials to the Group-wide portfolio for the periods indicated.
December 31, 2021 | ||||||||||||
(GAAP) | (non-GAAP) | |||||||||||
Elimination of | ||||||||||||
third-party | ||||||||||||
($ in thousands) |
| Consolidated | interests | Burford-only |
| Other funds |
| BOF-C |
| Group-wide | ||
Capital provision assets - direct: | ||||||||||||
Deployed cost | 1,582,929 | (332,384) | 1,250,545 | 508,034 | 274,110 | 2,032,689 | ||||||
Plus: Fair value adjustments | 1,521,479 | (475,319) | 1,046,160 | 130,285 | 49,364 | 1,225,809 | ||||||
Fair value | 3,104,408 | (807,703) | 2,296,705 | 638,319 | 323,474 | 3,258,498 | ||||||
Capital provision assets - indirect: | ||||||||||||
Fair value | 12,855 | (1,595) | 11,260 | (1) | 1,595 | - | 12,855 | |||||
Total capital provision assets | 3,117,263 | (809,298) | 2,307,965 | 639,914 | 323,474 | 3,271,353 | ||||||
Post-settlement assets: | ||||||||||||
Deployed cost | - | - | - | 274,593 | - | 274,593 | ||||||
Plus: Fair value adjustments | - | - | - | 56,731 | - | 56,731 | ||||||
Fair value | - | - | - | 331,324 | - | 331,324 | ||||||
Undrawn commitments: | ||||||||||||
Capital provision-direct | 1,492,784 | (360,508) | 1,132,276 | 216,769 | 359,209 | 1,708,254 | ||||||
Capital provision-indirect | - | - | - | - | - | - | ||||||
Post-settlement | - | - | - | 11,833 | - | 11,833 | ||||||
Total undrawn commitments | 1,492,784 | (360,508) | 1,132,276 | 228,602 | 359,209 | 1,720,087 | ||||||
Total portfolio | 4,610,047 | (1,169,806) | 3,440,241 | 1,199,840 | 682,683 | 5,322,764 | ||||||
| 1. | The $11.3 million carrying value for the Burford-only capital provision-indirect assets did not include an additional $10.3 million for the Burford-only portion of the receivable from due from settlement of capital provision assets on concluded assets in the Strategic Value Fund for a total of $21.6 million carrying value for Burford-only capital provision-indirect assets. |
December 31, 2020(1) | ||||||||||||
(GAAP) | (non-GAAP) | |||||||||||
Elimination of | ||||||||||||
third-party | ||||||||||||
($ in thousands) |
| Consolidated | interests | Burford-only |
| Other funds |
| BOF-C |
| Group-wide | ||
Capital provision assets - direct: | ||||||||||||
Deployed cost | 1,159,612 | (211,556) | 948,056 | 414,946 | 152,332 | 1,515,334 | ||||||
Plus: Fair value adjustments | 1,469,536 | (451,798) | 1,017,738 | 103,400 | 29,117 | 1,150,255 | ||||||
Fair value | 2,629,148 | (663,354) | 1,965,794 | 518,346 | 181,449 | 2,665,589 | ||||||
Capital provision assets - indirect: | ||||||||||||
Fair value | 85,166 | (41,951) | 43,215 | 41,951 | - | 85,166 | ||||||
Total capital provision assets | 2,714,314 | (705,305) | 2,009,009 | 560,297 | 181,449 | 2,750,755 | ||||||
Post-settlement assets: | ||||||||||||
Deployed cost | - | - | - | 255,413 | - | 255,413 | ||||||
Plus: Fair value adjustments | - | - | - | 32,421 | - | 32,421 | ||||||
Fair value | - | - | - | 287,834 | - | 287,834 | ||||||
Undrawn commitments: | ||||||||||||
Capital provision-direct | 1,254,612 | (244,885) | 1,009,727 | 285,782 | 239,581 | 1,535,090 | ||||||
Capital provision-indirect | - | - | - | - | - | - | ||||||
Post-settlement | - | - | - | 27,034 | - | 27,034 | ||||||
Total undrawn commitments | 1,254,612 | (244,885) | 1,009,727 | 312,816 | 239,581 | 1,562,124 | ||||||
Total portfolio | 3,968,926 | (950,190) | 3,018,736 | 1,160,947 | 421,030 | 4,600,713 | ||||||
| 1. | The comparative data for December 31, 2020 in the table above has been amended to correct for immaterial differences. |
62 Burford Capital Annual Report 2023
Tangible book value attributable to Burford Capital Limited per ordinary share reconciliations
The table below sets forth the reconciliations of tangible book value attributable to Burford Capital Limited per ordinary share to total Burford Capital Limited equity, the most comparable measure calculated in accordance with US GAAP, at the dates indicated.
| December 31, | |||
($ in thousands, except share data) | 2023 | 2022 | ||
Shareholders' equity | 3,207,780 | 2,387,070 | ||
Less: Non-controlling interests | (916,922) | (644,486) | ||
Total Burford Capital Limited equity | 2,290,858 | 1,742,584 | ||
Less: Goodwill | (133,965) | (133,912) | ||
Tangible book value attributable to Burford Capital Limited | 2,156,893 | 1,608,672 | ||
Basic ordinary shares outstanding | 218,962,441 | 218,581,877 | ||
Tangible book value attributable to Burford Capital Limited per ordinary share | 9.85 | 7.36 | ||
See “—Basis of presentation of financial information—APMs and non-GAAP financial measures relating to our operating and financial performance—Non-GAAP financial measures” for additional information with respect to tangible book value attributable to Burford Capital Limited per ordinary share.
Debt leverage ratio calculations
Consolidated net debt to consolidated tangible assets ratio calculation
The table below sets forth the calculations of consolidated net debt to consolidated tangible assets ratio at the dates indicated.
| December 31, | |||
($ in thousands) | 2023 | 2022 | ||
Total principal amount of debt outstanding(1) | 1,563,073 | 1,271,073 | ||
Less: Cash and cash equivalents | (220,549) | (107,658) | ||
Less: Marketable securities | (107,561) | (136,358) | ||
Consolidated net debt | 1,234,963 | 1,027,057 | ||
Total assets | 5,837,394 | 4,288,359 | ||
Less: Goodwill | (133,965) | (133,912) | ||
Consolidated tangible assets | 5,703,429 | 4,154,447 | ||
Consolidated net debt to consolidated tangible assets ratio | 22% | 25% | ||
1. | Represents the total principal amount of debt outstanding as set forth in note 13 (Debt) to our consolidated financial statements. Debt securities denominated in pound sterling have been converted to US dollar using GBP/USD exchange rates of $1.2747 and $1.2039 at December 31, 2023 and 2022, respectively. |
See “Operating and financial review and prospects—Debt” for additional information with respect to our debt securities.
Consolidated Indebtedness to Net Tangible Equity Ratio calculation
The table below sets forth the calculations of Consolidated Indebtedness to Net Tangible Equity Ratio (as defined in the indentures governing the 2028 Notes and the 2030 Notes, as applicable) at the dates indicated.
| December 31, | |||
($ in thousands) | 2023 | 2022(1) | ||
Debt payable | 1,534,730 | 1,252,270 | ||
Less: Debt attributable to Unrestricted Subsidiaries | - | - | ||
Consolidated Indebtedness | 1,534,730 | 1,252,270 | ||
Total equity | 3,207,780 | 2,387,070 | ||
Less: Equity attributable to Unrestricted Subsidiaries | (901,146) | (631,171) | ||
Less: Goodwill | (133,965) | (133,912) | ||
Net Tangible Equity | 2,172,669 | 1,621,987 | ||
Consolidated Indebtedness to Net Tangible Equity Ratio | 0.71x | 0.77x | ||
1. | The comparative data for December 31, 2022 in the table above has been amended to correct for immaterial differences. |
Burford Capital Annual Report 2023 63
See “Operating and financial review and prospects—Debt” for additional information with respect to our debt securities.
Consolidated Indebtedness to Consolidated Equity Ratio calculation
The table below sets forth the calculations of Consolidated Indebtedness to Consolidated Equity Ratio (as defined in the indenture governing the 2031 Notes) at the dates indicated.
| December 31, | |||
($ in thousands) | 2023 | 2022(1) | ||
Debt payable | 1,534,730 | 1,252,270 | ||
Less: Debt attributable to Unrestricted Subsidiaries | - | - | ||
Less: The lesser of specified cash and cash equivalent or $100 million | (100,000) | (100,000) | ||
Consolidated Indebtedness | 1,434,730 | 1,152,270 | ||
Total equity | 3,207,780 | 2,387,070 | ||
Less: Equity attributable to Unrestricted Subsidiaries | (901,146) | (631,171) | ||
Consolidated Equity | 2,306,634 | 1,755,899 | ||
Consolidated Indebtedness to Consolidated Equity Ratio | 0.62x | 0.66x | ||
1. | The comparative data for December 31, 2022 in the table above has been amended to correct for immaterial differences. |
See “Operating and financial review and prospects—Debt” for additional information with respect to our debt securities.
64 Burford Capital Annual Report 2023
Directors’ report
To our shareholders:
Each of the Directors present this annual report and the audited consolidated financial statements of Burford Capital Limited and its subsidiaries (collectively, “Burford”) for the financial year ended December 31, 2023.
Business activities and organization
Burford provides legal finance and asset management products and services with a focus on the legal sector. Burford Capital Limited is incorporated under the Companies (Guernsey) Law, 2008, as amended (the “Guernsey Companies Law”). Burford Capital Limited’s ordinary shares were admitted to trading on AIM, a market operated by the London Stock Exchange, on October 21, 2009, and on the New York Stock Exchange on October 19, 2020.
Corporate governance
The Directors recognize the high standards of corporate governance demanded of listed companies. Burford Capital Limited has adopted and complied with the Finance Sector Code of Corporate Governance issued by the Guernsey Financial Services Commission. In addition, Burford is subject to the applicable rules and regulations of the US Securities and Exchange Commission, the applicable listing standards of the New York Stock Exchange and the applicable AIM rules.
Results of operations and dividends
Burford’s results of operations for the year ended December 31, 2023 are set forth in the consolidated statements of operations included elsewhere in this annual report on Form 20-F (this “Annual Report”).
Burford Capital Limited paid an interim dividend for the year ended December 31, 2022 of 6.25 US cents per ordinary share on June 16, 2023 and paid an interim dividend for the year ended December 31, 2023 of 6.25 US cents per ordinary share on December 7, 2023. The Directors are proposing a final dividend for the year ended December 31, 2023 of 6.25 US cents per ordinary share to be paid, subject to shareholder approval at the annual general meeting to be held in May 2024, on June 14, 2024 to the shareholders on the register at the close of business on May 24, 2024, with an ex-dividend date of May 23, 2024.
Because Burford is a US dollar-denominated business, dividends are declared in US dollars. For shareholders electing to receive their dividends in pounds sterling, dividends are subsequently converted into pounds sterling based on the exchange rate determined on or about the record date and are paid in pounds sterling. UK shareholders who would like to receive dividends in US dollars instead of pounds sterling should contact the registrar. US shareholders will automatically receive dividends in US dollars unless they request otherwise.
Directors
The Directors of Burford Capital Limited who served during the year ended December 31, 2023 and to the date of this Annual Report are set forth under “Governance—Directors and senior management—Directors”.
Interests of the Directors
The interests of the Directors are set forth under “Compensation—Director compensation” and “Compensation—Holdings and commitments to private funds of directors and senior management—Directors”.
Statement of the Directors’ responsibilities in relation to the consolidated financial statements
The Directors are responsible for preparing this Annual Report and the consolidated financial statements in accordance with applicable Guernsey law and generally accepted accounting principles in the United States (“US GAAP”).
Under the Guernsey Companies Law, the Directors must not approve the consolidated financial statements unless they are satisfied that they give a true and fair view of the financial position, results of operations and cash flows of Burford at and for the year ended December 31, 2023. In preparing the consolidated financial statements, the Directors are required to:
| ▪ | Select suitable accounting policies and apply such accounting policies consistently |
Burford Capital Annual Report 2023 65
| ▪ | Present information, including accounting policies, in a manner that provides relevant, reliable, comparable and understandable information |
| ▪ | Make judgments and estimates that are reasonable and prudent |
The Directors are responsible for keeping adequate accounting records that are sufficient to show and explain Burford’s transactions and disclose with reasonable accuracy at any time its financial position and enable them to ensure that the consolidated financial statements comply with the Guernsey Companies Law. They are also responsible for safeguarding Burford’s assets and, therefore, for taking reasonable steps for the prevention and detection of fraud and other irregularities.
Disclosure of information to auditors
So far as each of the Directors is aware, there is no relevant audit information of which Burford’s independent registered public accounting firm is unaware, and each of the Directors has taken all of the steps he or she ought to have taken as a director to make himself or herself aware of any relevant audit information and to establish that Burford’s independent registered public accounting firm is aware of such information.
Independent registered public accounting firm
Ernst & Young LLP has expressed its willingness to continue in office and a resolution to re-appoint it will be proposed at the annual general meeting of shareholders to be held in 2024.
66 Burford Capital Annual Report 2023
Burford Capital Annual Report 2023 67
Report of independent registered public accounting firm
To the board of directors and shareholders of Burford Capital Limited:
Opinion on the Financial Statements
We have audited the accompanying consolidated statements of financial position of Burford Capital Limited (the "Company") as of December 31, 2023 and 2022, the related consolidated statements of operations, comprehensive income, changes in equity and cash flows, for each of the three years in the period ended December 31, 2023, and the related notes (collectively referred to as the "consolidated financial statements"). In our opinion, the consolidated financial statements present fairly, in all material respects, the financial position of the Company at December 31, 2023 and 2022, and the results of its operations and its cash flows for each of the three years in the period ended December 31, 2023, in conformity with U.S. generally accepted accounting principles.
We also have audited, in accordance with the standards of the Public Company Accounting Oversight Board (United States) (PCAOB), the Company's internal control over financial reporting as of December 31, 2023, based on criteria established in Internal Control-Integrated Framework issued by the Committee of Sponsoring Organizations of the Treadway Commission (2013 framework), and our report dated March 28, 2024 expressed an adverse opinion thereon.
Basis for Opinion
These financial statements are the responsibility of the Company's management. Our responsibility is to express an opinion on the Company's financial statements based on our audits. We are a public accounting firm registered with the PCAOB and are required to be independent with respect to the Company in accordance with the U.S. federal securities laws and the applicable rules and regulations of the Securities and Exchange Commission and the PCAOB.
We conducted our audits in accordance with the standards of the PCAOB. Those standards require that we plan and perform the audit to obtain reasonable assurance about whether the financial statements are free of material misstatement, whether due to error or fraud. Our audits included performing procedures to assess the risks of material misstatement of the financial statements, whether due to error or fraud, and performing procedures that respond to those risks. Such procedures included examining, on a test basis, evidence regarding the amounts and disclosures in the financial statements. Our audits also included evaluating the accounting principles used and significant estimates made by management, as well as evaluating the overall presentation of the financial statements. We believe that our audits provide a reasonable basis for our opinion.
Critical Audit Matter
The critical audit matter communicated below is a matter arising from the current period audit of the financial statements that was communicated or required to be communicated to the audit committee and that: (1) relates to accounts or disclosures that are material to the financial statements and (2) involved our especially challenging, subjective, or complex judgments. The communication of the critical audit matter does not alter in any way our opinion on the consolidated financial statements, taken as a whole, and we are not, by communicating the critical audit matter below, providing a separate opinion on the critical audit matter or on the accounts or disclosures to which it relates.
Valuation of capital provision assets
Description of the Matter | At December 31, 2023, the Company’s reported capital provision assets (“CPAs”) totalled $5,045 million. For the year ended December 31, 2023, the Company recognized net positive fair value adjustments on CPAs of $1,082 million. As more fully described in Notes 2, 6 and 15 to the consolidated financial statements, CPAs are held at fair value, with income or loss related to changes in fair value recorded through ‘Capital provision income/(loss)’ in the consolidated statement of operations. Fair value movements are recognized in accordance with the Company’s CPA valuation methodology, which uses an income approach. Significant unobservable assumptions used in the Company’s fair value estimate include the estimated quantum and timing of future cash flows, the adjusted risk premium, reflecting the uncertainty inherent in the estimated future cash flows, primarily driven by litigation risk, which changes as a result of observable |
68 Burford Capital Annual Report 2023
litigation events, and the discount rate, that reflects the funding risk of deploying capital for CPAs. Auditing management’s judgments and assumptions used in the valuation of the CPAs involved complex auditor judgment, due to the selection of the valuation methodology utilized, as well as the significant estimation uncertainty associated with the unobservable assumptions described above. | |
How We Addressed the Matter in Our Audit | To test the fair value of CPAs, we performed audit procedures that included, among others, evaluating the valuation methodology used by management in determining the fair value of the CPAs, against the requirements of FASB Accounting Standards Codification Topic 820 – Fair Value Measurement (“ASC 820”). We involved our valuation specialists to assist us in independently testing the CPA valuation models for consistency of application of the CPA valuation methodology and testing model mathematical integrity across the portfolio of CPAs. Our valuation specialists also assisted us with assessing the CPA-specific discount rates used in the valuation models, by comparing the inputs to the discount rate to market data and studies. To evaluate the reasonableness of adjusted risk premiums across the portfolio as a whole, our procedures included, with the assistance of our valuation specialists, performing a statistical analysis of historical CPA realizations since inception, analyzing the correlation between key inputs to the valuation models and realized proceeds. With the assistance of legal specialists, we evaluated the completeness of observable litigation events included in the Company's valuation policy, together with the relative change in legal risk represented by those specific events. To evaluate the completeness and accuracy of the observable litigation events considered in the determination of the adjusted risk premium for each CPA, our procedures included, among others, performing independent research of information in the public domain, for example a search for and review of available court documents and comparing our results to management’s assessment of the same. To assess the estimated future cash flows, among other procedures, for a sample of CPAs, we recalculated the Company’s contractual entitlement based on the terms of the related capital provision agreements. For the same sample, where the estimated future cash flows were impacted by damages or settlement estimates, we agreed those estimates to court documents, if available. Where court documents were not available, we held discussions with management, including the Company’s underwriting team and inspected evidence to assess how management derived their estimation. To independently assess management’s ability to forecast the expected timing of realizations, among other procedures, for the CPAs held at 31 December 2023 that were also held at 31 December 2022, we compared the change in weighted average duration to our expectations and investigated differences. Also, for a sample of CPAs, we evaluated the duration applied by management in determining the CPA’s fair value, by comparison to similar CPAs and in relation to case-specific observable litigation events. For the same sample, we assessed the evolution of the duration from the prior year, if applicable, and investigated differences from our expectations. We evaluated the adequacy of the Company’s CPA fair value measurements disclosures, included in Notes 2, 6, and 15 to the consolidated financial statements, to the requirements of ASC 820. |
Burford Capital Annual Report 2023 69
We have served as the Company’s auditor since 2010.
/s/
March 28, 2024
70 Burford Capital Annual Report 2023
Report of independent registered public accounting firm
To the board of directors and shareholders of Burford Capital Limited:
Opinion on Internal Control Over Financial Reporting
We have audited Burford Capital Limited’s internal control over financial reporting as of December 31, 2023, based on criteria established in Internal Control—Integrated Framework issued by the Committee of Sponsoring Organizations of the Treadway Commission (2013 framework) (the COSO criteria). In our opinion, because of the effect of the material weakness described below on the achievement of the objectives of the control criteria, Burford Capital Limited (the Company) has not maintained effective internal control over financial reporting as of December 31, 2023, based on the COSO criteria.
A material weakness is a deficiency, or combination of deficiencies, in internal control over financial reporting, such that there is a reasonable possibility that a material misstatement of the company’s annual or interim financial statements will not be prevented or detected on a timely basis. The following material weakness has been identified and included in management’s assessment. Management has identified a material weakness due to a lack of available evidence to demonstrate the precision of management’s review of certain assumptions used in the measurement of the fair value of capital provision assets.
We also have audited, in accordance with the standards of the Public Company Accounting Oversight Board (United States) (PCAOB), the consolidated statements of financial position of the Company as of December 31, 2023 and 2022, the related consolidated statements of operations, comprehensive income, changes in equity and cash flows for each of the three years in the period ended December 31, 2023, and the related notes. This material weakness was considered in determining the nature, timing and extent of audit tests applied in our audit of the 2023 consolidated financial statements, and this report does not affect our report dated March 28, 2024, which expressed an unqualified opinion thereon.
Basis for Opinion
The Company’s management is responsible for maintaining effective internal control over financial reporting and for its assessment of the effectiveness of internal control over financial reporting included in the accompanying Management’s report on internal control over financial reporting. Our responsibility is to express an opinion on the Company’s internal control over financial reporting based on our audit. We are a public accounting firm registered with the PCAOB and are required to be independent with respect to the Company in accordance with the U.S. federal securities laws and the applicable rules and regulations of the Securities and Exchange Commission and the PCAOB.
We conducted our audit in accordance with the standards of the PCAOB. Those standards require that we plan and perform the audit to obtain reasonable assurance about whether effective internal control over financial reporting was maintained in all material respects.
Our audit included obtaining an understanding of internal control over financial reporting, assessing the risk that a material weakness exists, testing and evaluating the design and operating effectiveness of internal control based on the assessed risk, and performing such other procedures as we considered necessary in the circumstances. We believe that our audit provides a reasonable basis for our opinion.
Definition and Limitations of Internal Control Over Financial Reporting
A company’s internal control over financial reporting is a process designed to provide reasonable assurance regarding the reliability of financial reporting and the preparation of financial statements for external purposes in accordance with generally accepted accounting principles. A company’s internal control over financial reporting includes those policies and procedures that (1) pertain to the maintenance of records that, in reasonable detail, accurately and fairly reflect the transactions and dispositions of the assets of the company; (2) provide reasonable assurance that transactions are recorded as necessary to permit preparation of financial statements in accordance with generally accepted accounting principles, and that receipts and expenditures of the company are being made only in accordance with authorizations of management and directors of the company; and (3) provide reasonable assurance regarding prevention or timely detection of unauthorized acquisition, use, or disposition of the company’s assets that could have a material effect on the financial statements.
74 Burford Capital Annual Report 2023
Because of its inherent limitations, internal control over financial reporting may not prevent or detect misstatements. Also, projections of any evaluation of effectiveness to future periods are subject to the risk that controls may become inadequate because of changes in conditions, or that the degree of compliance with the policies or procedures may deteriorate.
/s/ Ernst & Young LLP
Guernsey, Channel Islands
March 28, 2024
Burford Capital Annual Report 2023 75
Burford Capital Limited and subsidiaries
Consolidated statements of operations
($ in thousands, except share data)
| Years ended December 31, | |||||
2023 | 2022 | 2021 | ||||
Revenues |
|
| ||||
Capital provision income/(loss) | | | | |||
Plus/(Less): Third-party interests in capital provision assets | ( | ( | | |||
Asset management income/(loss) | | | | |||
Marketable securities income/(loss) and bank interest | | ( | | |||
Other income/(loss) | | ( | | |||
Total revenues | | | | |||
Operating expenses | ||||||
Compensation and benefits | ||||||
Salaries and benefits | | | | |||
Annual incentive compensation | | | | |||
Share-based compensation | | | | |||
Legacy asset recovery incentive compensation including accruals | | | | |||
Long-term incentive compensation including accruals | | | | |||
General, administrative and other | | | | |||
Case-related expenditures ineligible for inclusion in asset cost | | | | |||
Total operating expenses | | | | |||
Operating income/(loss) | | | | |||
Other expenses |
|
|
| |||
Finance costs | | | | |||
(Gains)/losses on debt extinguishment | - | | | |||
Foreign currency transactions (gains)/losses | ( | | | |||
Total other expenses | | | | |||
Income/(loss) before income taxes | | | | |||
(Provision for)/benefit from income taxes | ( | ( | ( | |||
Net income/(loss) | | | ( | |||
Net income attributable to non-controlling interests | | | | |||
Net income/(loss) attributable to Burford Capital Limited shareholders | | | ( | |||
Net income/(loss) attributable to Burford Capital Limited per ordinary share |
| |||||
Basic | $ | $ | ($ | |||
Diluted | $ | $ | ($ | |||
Weighted average ordinary shares outstanding |
| |||||
Basic | | | | |||
Diluted | | | | |||
See accompanying notes to the consolidated financial statements.
76 Burford Capital Annual Report 2023
Burford Capital Limited and subsidiaries
Consolidated statements of comprehensive income/(LOSS)
($ in thousands)
| Years ended December 31, | |||||
2023 | 2022 | 2021 | ||||
Net income/(loss) | | | ( | |||
Other comprehensive income/(loss) | ||||||
Foreign currency translation adjustment | ( | | ( | |||
Comprehensive income/(loss) | | | ( | |||
Less: Comprehensive income attributable to non-controlling interests | | | | |||
Comprehensive income/(loss) attributable to Burford Capital Limited shareholders | | | ( | |||
See accompanying notes to the consolidated financial statements.
Burford Capital Annual Report 2023 77
Burford Capital Limited and subsidiaries
Consolidated statements of financial position
($ in thousands, except share data)
| December 31, | |||
2023 |
| 2022 | ||
Assets | ||||
Cash and cash equivalents | | | ||
Marketable securities | | | ||
Other assets | | | ||
Due from settlement of capital provision assets | | | ||
Capital provision assets | | | ||
Goodwill | | | ||
Deferred tax asset | | | ||
Total assets | | | ||
Liabilities | ||||
Debt interest payable | | | ||
Other liabilities | | | ||
Long-term incentive compensation payable | | | ||
Debt payable | | | ||
Financial liabilities relating to third-party interests in capital provision assets | | | ||
Deferred tax liability | | | ||
Total liabilities | | | ||
Commitments and contingencies (Note 21) | ||||
Shareholders' equity | ||||
Ordinary shares, | | | ||
Additional paid-in capital | | | ||
Accumulated other comprehensive income | | | ||
Treasury shares of | ( | ( | ||
Retained earnings | | | ||
Total Burford Capital Limited equity | | | ||
Non-controlling interests | | | ||
Total shareholders' equity | | | ||
Total liabilities and shareholders' equity | | | ||
See accompanying notes to the consolidated financial statements.
The consolidated financial statements on pages 76 to 113 of this Annual Report were approved by the Board on March 28, 2024 and were signed on its behalf by:
/s/ Christopher Halmy
Christopher Halmy
Director
March 28, 2024
78 Burford Capital Annual Report 2023
Burford Capital Limited and subsidiaries
Consolidated statements of cash flows
($ in thousands)
| Years ended December 31, | |||||
2023 | 2022 | 2021 | ||||
Cash flows from operating activities: |
|
| ||||
Net income/(loss) | | | ( | |||
Adjustments to reconcile net income/(loss) to net cash (used in)/provided by operating activities: | ||||||
Capital provision income | ( | ( | ( | |||
(Income)/loss on marketable securities | ( | | | |||
Other income | ( | | ( | |||
Share-based compensation | | | | |||
Amortization and depreciation of debt issuance costs and property and equipment | | | | |||
Deferred tax (benefit)/expense | | | | |||
Other | ( | | | |||
Changes in operating assets and liabilities: | ||||||
Proceeds from capital provision assets | | | | |||
(Funding) of capital provision assets | ( | ( | ( | |||
Net proceeds/(funding) of marketable securities | | | ( | |||
Net proceeds/(funding) from financial liabilities at fair value through profit or loss | - | | - | |||
Proceeds from other income | | | | |||
Proceeds from break fee income | | - | - | |||
(Increase)/decrease in other assets | ( | ( | | |||
Increase/(decrease) in other liabilities | | | | |||
Net increase/(decrease) on financial liability to third-party investment | | | ( | |||
Net cash provided/(used) by operating activities | ( | ( | ( | |||
Cash flows from investing activities: | ||||||
Purchases of property and equipment | ( | ( | ( | |||
Net cash provided/(used) by investing activities | ( | ( | ( | |||
Cash flows from financing activities: | ||||||
Issuance of debt, net of original issue discount | | | | |||
Debt issuance costs | ( | ( | ( | |||
Redemption of debt | ( | ( | ( | |||
Dividends paid on ordinary shares | ( | ( | ( | |||
Payments for treasury share purchases | ( | ( | - | |||
Acquisition of ordinary shares to meet share-based payment obligations | - | ( | ( | |||
Third-party net capital contribution/(distribution) | | | | |||
Net cash provided/(used) by financing activities | | | | |||
Net increase/(decrease) in cash and cash equivalents | | ( | ( | |||
Cash and cash equivalents at beginning of period | | | | |||
Effect of exchange rate changes on cash and cash equivalents | | ( | ( | |||
Cash and cash equivalents at end of period | | | | |||
The table below sets forth supplemental disclosures to our statement of consolidated cash flows.
| Years ended December 31, | |||||
($ in thousands) | 2023 | 2022 | 2021 | |||
Cash received from interest and dividend income | | | | |||
Cash paid for debt interest | ( | ( | ( | |||
Cash received from income tax refund | | | - | |||
Cash paid for income taxes | ( | ( | ( | |||
Assets received in-kind(1) | - | - | | |||
Contributions paid in-kind(1) | - | - | | |||
1. |
See accompanying notes to the consolidated financial statements.
Burford Capital Annual Report 2023 79
Burford Capital Limited and subsidiaries
Consolidated statements of changes in equity
($ in thousands, except share data)
Year ended December 31, 2023 | |||||||||||||||
Shares | Amount | ||||||||||||||
Accumulated | |||||||||||||||
Additional | other | Total Burford | Total | ||||||||||||
Ordinary | Treasury | Ordinary | Treasury | paid-in | Retained | comprehensive | Capital Limited | Non-controlling | shareholders’ | ||||||
| shares | shares | shares | shares | capital | earnings | income/(loss) | equity | interests | equity | |||||
At beginning of period | | ( | | ( | | | | | | | |||||
Net income/(loss) | - | - | - | - | - | | - | | | | |||||
Foreign currency translation adjustment | - | - | - | - | - | - | ( | ( | - | ( | |||||
Issuance of ordinary shares for vested RSU awards | | - | | - | ( | - | - | - | - | - | |||||
Acquisition of ordinary shares held in treasury | - | ( | - | ( | - | - | - | ( | - | ( | |||||
Distribution of ordinary shares for vested RSU awards | - | | - | | ( | - | - | - | - | - | |||||
Ordinary shares distributed by the Burford Capital Employee Benefit Trust | - | - | - | - | - | - | - | - | - | - | |||||
Transfer RSU awards on vesting | - | - | - | - | | ( | - | ( | - | ( | |||||
Share-based compensation | - | - | - | - | | - | - | | - | | |||||
Dividends paid | - | - | - | - | - | ( | - | ( | - | ( | |||||
Third-party net capital contribution/(distribution) | - | - | - | - | - | - | - | - | | | |||||
At end of period | | ( | | ( | | | | | | | |||||
Year ended December 31, 2022 | |||||||||||||||
Shares | Amount | ||||||||||||||
Accumulated | |||||||||||||||
Additional | other | Total Burford | Total | ||||||||||||
Ordinary | Treasury | Ordinary | Treasury | paid-in | Retained | comprehensive | Capital Limited | Non-controlling | shareholders’ | ||||||
| shares | shares | shares | shares | capital | earnings | income/(loss) | equity | interests | equity | |||||
At beginning of period | | - | | - | | | | | | | |||||
Net income/(loss) | - | - | - | - | - | | - | | | | |||||
Foreign currency translation adjustment | - | - | - | - | - | - | | | - | | |||||
Acquisition of ordinary shares held in treasury | - | ( | - | ( | - | - | - | ( | - | ( | |||||
Ordinary shares purchased by the Burford Capital Employee Benefit Trust | - | - | - | - | ( | - | - | ( | - | ( | |||||
Ordinary shares distributed by the Burford Capital Employee Benefit Trust | - | - | - | - | - | ( | - | ( | - | ( | |||||
Transfer RSU awards on vesting | - | - | - | - | ( | | - | - | - | - | |||||
Share-based compensation | - | - | - | - | | - | - | | - | | |||||
Dividends paid | - | - | - | - | - | ( | - | ( | - | ( | |||||
Third-party net capital contribution/(distribution) | - | - | - | - | - | - | - | - | | | |||||
Other | - | - | - | - | - | - | | | - | | |||||
At end of period | | ( | | ( | | | | | | | |||||
Year ended December 31, 2021 | |||||||||||
Shares | Amount | ||||||||||
Accumulated | |||||||||||
Additional | other | Total Burford | Total | ||||||||
Ordinary | Ordinary | paid-in | Retained | comprehensive | Capital Limited | Non-controlling | shareholders’ | ||||
| shares | shares | capital | earnings | income/(loss) | equity | interests | equity | |||
At beginning of period | | | | | | | | | |||
Net income/(loss) | - | - | - | ( | - | ( | | ( | |||
Foreign currency translation adjustment | - | - | - | - | ( | ( | - | ( | |||
Ordinary shares purchased by the Burford Capital Employee Benefit Trust | - | - | ( | - | - | ( | - | ( | |||
Ordinary shares distributed by the Burford Capital Employee Benefit Trust | - | - | | ( | - | ( | - | ( | |||
Transfer RSU awards on vesting | - | - | ( | | - | - | - | - | |||
Share-based compensation | - | - | | - | - | | - | | |||
Dividends paid | - | - | - | ( | - | ( | - | ( | |||
Third-party net capital contribution/(distribution) | - | - | - | - | - | - | | | |||
At end of period | | | | | | | | | |||
See accompanying notes to the consolidated financial statements.
80 Burford Capital Annual Report 2023
1. Organization
Burford Capital Limited (the “Company”) and its consolidated subsidiaries (collectively with the Company, the “Group”) provide legal finance products and services and are engaged in the asset management business.
The Company was incorporated as a company limited by shares under the Guernsey Companies Law on September 11, 2009. The Company has a single class of ordinary shares, which commenced trading on AIM in October 2009 and on the NYSE in October 2020, in each case, under the symbol “BUR”. The Company’s subsidiaries have issued bonds that are traded on the Main Market of the London Stock Exchange and unregistered senior notes in private placement transactions pursuant to Rule 144A and Regulation S under the Securities Act.
2. Summary of significant accounting policies
Basis of presentation
The Group’s audited consolidated financial statements at and for the year ended December 31, 2023 and comparative periods have been prepared in accordance with US GAAP.
Use of estimates
The preparation of the Group’s consolidated financial statements requires management to make estimates that affect the reported amounts of assets and liabilities and the disclosure of contingent assets and liabilities, in each case, at the date of the consolidated financial statements and the reported amounts of revenues and expenses during the reporting periods. Such estimates include, among others, the valuation of capital provision assets (which requires the use of Level 3 valuation inputs) and other financial instruments, the measurement of deferred tax balances (including valuation allowances) and the accounting for goodwill. Actual results could differ from those estimates, and such differences could be material.
Consolidation
The consolidated financial statements include the accounts of (i) the Company, (ii) its wholly owned or majority owned subsidiaries, (iii) the consolidated entities that are considered to be variable interest entities (“VIEs”) and for which the Company is considered the primary beneficiary and (iv) certain entities that are not considered VIEs but that the Company controls through a majority voting interest.
In connection with private funds and other related entities where the Group does not own 100% of the relevant entity, the Group makes judgments about whether it is required to consolidate such entities by applying the factors set forth in US GAAP for VIEs or voting interest entities under Accounting Standards Codification (“ASC”) 810—Consolidation.
VIEs are entities that, by design, either (i) lack sufficient equity to permit the entity to finance its activities without additional subordinated financial support from other parties, (ii) have equity investors that (A) do not have the ability to make significant decisions relating to the entity’s operations through voting rights, (B) do not have the obligation to absorb the expected losses or (C) do not have the right to receive the residual returns of the entity or (iii) have equity investors’ voting rights that are not proportional to the economics, and substantially all of the activities of the entity either involve or are conducted on behalf of an investor that has disproportionately few voting rights. An entity is deemed to be the primary beneficiary of the VIE if such entity has both (i) the power to direct the activities that most significantly impact the VIE’s economic performance and (ii) the right to receive benefits from the VIE or the obligation to absorb losses of the VIE that could be significant to the VIE.
In determining whether the Group is the primary beneficiary of a VIE, the Group considers both qualitative and quantitative factors regarding the nature, size and form of its involvement with the VIE, such as its role establishing the VIE and its ongoing rights and responsibilities, the design of the VIE, its economic interests, servicing fees and servicing responsibilities and certain other factors. The Group performs ongoing reassessments to evaluate whether changes in the entity’s capital structure or changes in the nature of the Group’s involvement with the entity result in a change to the VIE designation or a change to the Group’s consolidation conclusion.
The most significant judgments relate to the assessment of the Group’s exposure or rights to variable returns in Burford Opportunity Fund C LP (“BOF-C”), Burford Advantage Master Fund LP (the “Advantage Fund”), Colorado Investments Limited (“Colorado”) and, prior to its liquidation in the fourth quarter of 2023, BCIM Strategic Value Master Fund, LP (the “Strategic Value Fund”). The Group has assessed that its economic interest in the income generated from BOF-C
Burford Capital Annual Report 2023 81
and its investment as a limited partner in the Strategic Value Fund and the Advantage Fund, coupled with its power over the relevant activities as the fund manager, require the consolidation of BOF-C, the Strategic Value Fund and the Advantage Fund in the consolidated financial statements. Similarly, the Group has assessed that its shareholding in Colorado, coupled with its power over the relevant activities of Colorado through contractual agreements, require the consolidation of Colorado in the consolidated financial statements.
The Group is deemed to have a controlling financial interest in VIEs in which it is the primary beneficiary and in other entities in which it owns more than
For entities the Group controls but does not wholly own, the Group generally records a non-controlling interest within shareholders’ equity for the portion of the entity’s equity attributed to the non-controlling ownership interests. Accordingly, third-party share of net income or loss relating to non-controlling interests in consolidated entities is treated as a reduction or increase, respectively, of net income or loss in the consolidated statements of operations. With respect to Colorado, an entity the Group controls but does not wholly own, the Group records a financial liability within financial liabilities relating to third-party interests in capital provision assets for the portion of Colorado’s equity held by third parties. The third-party share of income or loss is included in third-party interests in capital provision assets in the consolidated statements of operations. All significant intercompany balances, transactions and unrealized gains and losses on such transactions are eliminated on consolidation.
Third-party interests in capital provision assets
Third-party interests in capital provision assets include the financial liability relating to third-party interests in Colorado as well as financial liabilities relating to third-party interests resulting from capital provision asset subparticipations recognized at fair value. Colorado holds a single financial asset and does not have any other business activity. Accordingly, Colorado does not meet the definition of a business, and the third-party interests in Colorado are accounted for as a collateralized borrowing rather than non-controlling interests in shareholders’ equity. Amounts included in the consolidated statements of financial position represent the fair value of the third-party interests in the related capital provision assets, and the amounts included in the consolidated statements of operations represent the third-party share of any gain or loss during the reporting period. Gains in the underlying capital provision asset result in increased financial liabilities to third-party interests in capital provision assets in the consolidated statement of financial position and negative adjustments in the consolidated statement of operations, presented as “(Less): Third-party interests in capital provision assets”. Conversely, losses in the underlying capital provision asset result in decreased financial liabilities to third-party interests in capital provision assets in the consolidated statement of financial position and positive adjustments in the consolidated statement of operations, presented as “Plus: Third-party interests in capital provision assets”.
During the year ended December 31, 2023, the Group has renamed the line item in the consolidated statements of operations from “Gain/(loss) relating to third-party interests in capital provision assets” to “Plus/(Less): Third-party interests in capital provision assets” and has changed the order to include this line item directly beneath the line item “Capital provision income”.
Reclassifications
Certain reclassifications of the amounts for prior periods have been made to conform to the presentation for the current period, such as combining the “Insurance income/(loss)” and “Services income/(loss)” line items under the “Other income/(loss)” line item within the consolidated statements of operations. These reclassifications have no effect on previously reported results of operations or total shareholders’ equity.
Revisions
Certain voluntary corrections of the amounts for prior periods have been made as a result of immaterial errors to previously issued consolidated financial statements. These corrections have been appropriately referenced.
Covid-19 pandemic and global economic market conditions
The Covid-19 pandemic and restrictions on certain non-essential businesses have caused disruption in the United States and global economies. Although the clearing of court backlogs is underway, it continues to be gradual, uneven and characterized by meaningful dispersion across sectors and regions. The estimates and assumptions underlying the
82 Burford Capital Annual Report 2023
consolidated financial statements at December 31, 2023 and 2022 and for the years ended December 31, 2023, 2022 and 2021 include judgments about the financial markets and economic conditions, which may change over time. Among estimates and assumptions, certain inputs to the valuation of the Group’s capital provision assets were impacted as a result of the Covid-19 pandemic, including expected timing and amount of cash flows in the Group’s cash flow forecasts and applicable discount rates.
As a result of the Russian Federation’s invasion of Ukraine in February 2022 (the “Ukraine War”), various nations, including the United States, have instituted economic sanctions and other responsive measures, which have resulted in an increased level of global economic and political uncertainty. At and for the years ended December 31, 2023 and 2022, the effects of the Ukraine War, including international sanctions imposed on Russian businesses and individuals, have not had a material impact on the Group’s consolidated financial statements.
In addition, in October 2023, an armed conflict began in Israel, Gaza and surrounding areas, which has resulted in an increased level of global economic and political uncertainty. At and for the year ended December 31, 2023, the effects of the conflict in Israel and Gaza have not had a material impact on the Group’s consolidated financial statements.
Cash and cash equivalents
Cash and cash equivalents include funds held by depository institutions, money market funds and government securities with original maturities of three months or less when purchased. Interest income from cash and cash equivalents is recorded in marketable securities income/(loss) and bank interest in the consolidated statements of operations. The fair values of the money market funds included in cash and cash equivalents were $
Statement of cash flows
The core business purpose of the Group is the provision of capital and expertise, to clients or as a principal, in connection with (i) the underlying asset value of litigation claims and the enforcement of settlements, judgments and awards, (ii) the amount paid to law firms as legal fees and expenses and (iii) the value of assets affected by litigation. These contractual arrangements are presented as capital provision assets in the consolidated statements of financial position, and the returns on those capital provision assets form the principal source of revenue earned by the Group. The cash flows associated with capital provision assets are reported within cash flows from operating activities because the ongoing management of the capital provision assets is a key operating activity for the Group.
Marketable securities
Marketable securities primarily consist of government securities with original maturities longer than three months when purchased, corporate bonds, asset-backed securities and mutual funds. Marketable securities are recorded at fair value. Interest income on marketable securities is included in the overall change in fair value which is recognized in marketable securities income/(loss) and bank interest in the consolidated statements of operations.
Bank interest
Bank interest is recognized on an accruals basis and included in marketable securities income/(loss) and bank interest.
Fair value of financial instruments
The Group’s capital provision assets meet the definition of a financial instrument under ASC 825—Financial instruments. Single case, portfolio, portfolio with equity risk and legal risk management capital provision assets meet the definition of a derivative instrument under ASC 815—Derivatives and hedging and are accounted for at fair value.
The Group has elected the fair value option for the Group’s equity method investments, marketable securities, due from settlement of capital provision assets and financial liabilities relating to third-party interests in capital provision assets to provide a consistent fair value measurement approach for all capital provision related activity. Such election is irrevocable and is applied to financial instruments on an individual basis at initial recognition.
Financial instruments are recorded at fair value. The fair value of a financial instrument is the price that would be received to sell an asset or paid to transfer a liability in an orderly transaction between market participants at the measurement date under current market conditions.
Burford Capital Annual Report 2023 83
Fair value hierarchy
US GAAP establishes a hierarchical disclosure framework that prioritizes and ranks the level of market price observability used in measuring financial instruments at fair value. Market price observability is affected by a number of factors, including the type of financial instrument, the characteristics specific to the financial instrument and the state of the marketplace, including the existence and transparency of transactions between market participants. Financial instruments with readily available quoted prices in active markets generally will have a higher degree of market price observability and a lesser degree of judgment used in measuring fair value.
Financial instruments measured and reported at fair value are classified and disclosed based on the observability of inputs used in the determination of fair values as follows:
| ▪ | Level 1—quoted prices (unadjusted) in active markets for identical assets or liabilities that the reporting entity can access at the measurement date |
| ▪ | Level 2—inputs other than quoted prices included within Level 1 that are observable for the asset or liability, either directly or indirectly |
| ▪ | Level 3—unobservable inputs for the asset or liability |
All transfers into and out of these levels are recognized as if they have taken place at the beginning of each reporting period.
Valuation processes
The Group’s senior professionals are responsible for developing the policies and procedures for fair value measurement of assets and liabilities. Following origination and at each reporting date, the movements in the values of assets and liabilities are required to be reassessed in accordance with the Group’s accounting policies. For this analysis, the reasonableness of material estimates and assumptions underlying the valuation is discussed and the major inputs applied are verified by comparing the information in the valuation computation to contracts, asset status and progress information and other relevant documents.
Valuation methodology for Level 1 assets and liabilities
Level 1 assets and liabilities are comprised of listed instruments, including equities, fixed income securities and investment funds. All Level 1 assets and liabilities are valued at the quoted market price at the reporting date.
Valuation methodology for Level 2 assets and liabilities
Level 2 assets and liabilities are comprised of debt and equity securities that are not actively traded and are valued at the last quoted or traded price at the reporting date, provided there is evidence that the price is not assessed as significantly stale so as to warrant a Level 3 classification.
Valuation methodology for Level 3 assets and liabilities
Fair value represents the price that would be received to sell an asset or paid to transfer a liability (an exit price) in an orderly transaction between market participants at the measurement date.
The methods and procedures to determine fair value of assets and liabilities may include, among others, (i) obtaining information provided by third parties when available, (ii) obtaining valuation-related information from the issuers or counterparties (or their respective advisors), (iii) performing comparisons of comparable or similar assets or liabilities, as applicable, (iv) calculating the present value of future cash flows, (v) assessing other analytical data and information relating to the asset or liability, as applicable, that is an indication of value, (vi) evaluating financial information provided by or otherwise available with respect to the counterparties or other relevant entities and (vii) entering into a market transaction with an arm’s-length counterparty.
The material estimates and assumptions used in the analyses of fair value include the status and risk profile of the underlying asset or liability and, as applicable, the timing and expected amount of cash flows based on the structure and agreement of the asset or liability, the appropriateness of any discount rates used and the timing of, and estimated minimum proceeds from, a favorable outcome. Discount rates and a discounted cash flow basis for estimating fair value are applied to assets and liabilities measured at fair value, as applicable, most notably the Group’s capital provision assets. Significant judgment and estimation go into the assumptions that underlie the
84 Burford Capital Annual Report 2023
analyses, and the actual values realized with respect to assets or liabilities, as applicable, could be materially different from values obtained based on the use of those estimates.
Capital provision assets are fair valued using an income approach. The income approach estimates fair value based on estimated, risk-adjusted future cash flows, using a discount rate to reflect the funding risk of deploying capital for financing capital provision assets. The income approach requires management to make a series of assumptions, such as discount rate, the timing and amount of both expected cash inflows and additional financings and a risk-adjustment factor reflecting the uncertainty inherent in the cash flows primarily driven by litigation risk, which changes as a result of observable litigation events. These assumptions are considered Level 3 inputs.
A cash flow forecast is developed for each capital provision asset based on the anticipated financing commitments, damages or settlement estimates and the Group’s contractual entitlement. Cash flow forecasts incorporate management’s assumptions related to creditworthiness of the counterparty and collectability. In cases where cash flows are denominated in a foreign currency, forecasts are developed in the applicable foreign currency and translated to US dollars.
Capital provision assets are recorded at initial fair value, which is equivalent to the initial transaction price for a given capital provision asset, based on an assessment that it is an arm’s-length transaction between independent third parties and an orderly transaction between market participants. Using the cash flow forecast and a discount rate, an appropriate risk-adjustment factor is calculated to be applied to the forecast cash inflows to calibrate the valuation model to the initial transaction price. Each reporting period, the cash flow forecast is updated based on the best available information on damages or settlement estimates and it is determined whether there has been an objective event in the underlying litigation process, which would change the litigation risk and thus the risk-adjustment factor associated with the capital provision asset. The risk-adjustment factor as adjusted for any objective events in the underlying litigation process is referred to as the adjusted risk premium. For example, assume the risk premium at inception is calculated to be 65%, which is held constant until there is a milestone event. Assuming there is a favorable trial court ruling one year later for which the applicable milestone factor is 50%, then the risk premium would be adjusted to 32.5%, effectively releasing 50% of the original 65% risk premium haircut that was applied. Conversely, assuming there is a negative event one year later for which the applicable milestone factor is (50)%, then the risk premium would be adjusted to 82.5%, effectively closing the gap between the original risk premium of 65% and 100% by 50%. These objective events could include, among others:
| ▪ | A significant positive ruling or other objective event prior to any trial court judgment |
| ▪ | A favorable trial court judgment |
| ▪ | A favorable judgment on the first appeal |
| ▪ | The exhaustion of as-of-right appeals |
| ▪ | In arbitration cases, where there are limited opportunities for appeal, issuance of a tribunal award |
| ▪ | An objective negative event at various stages in the litigation process |
Each reporting period, the updated risk-adjusted cash flow forecast is discounted at the then current discount rate to measure fair value. See note 15 (Fair value of assets and liabilities) for additional information.
In a small number of instances, the Group has the benefit of a secondary sale of a portion of an asset or liability. When this occurs, the market evidence is factored into the valuation process to maximize the use of relevant observable inputs. Secondary sales are evaluated for relevance, including whether such transactions are orderly, and weight is attributed to the market price accordingly, which may include calibrating the valuation model to observed market price.
Non-controlling interests
For entities that are consolidated, but not wholly owned, a portion of the income or loss and corresponding equity is allocated to owners other than the Company. The aggregate of the income or loss and corresponding equity that is not owned by the Company is included in non-controlling interests in the consolidated financial statements. Non-controlling interests also include ownership interests in certain consolidated private funds and VIEs. Non-controlling interests are presented as a separate component of shareholders’ equity in the consolidated statements of financial position.
Burford Capital Annual Report 2023 85
The primary components of non-controlling interests are separately presented in the consolidated statements of changes in equity to clearly distinguish the interest in the Group and other ownership interests in the consolidated entities. Net income/(loss) includes the net income/(loss) attributable to the holders of non-controlling interests in the consolidated statements of comprehensive income. Profits and losses are allocated to non-controlling interests in proportion to their relative ownership interests regardless of their basis. Non-controlling interests exclude the third-party interests in Colorado as it represents a consolidated entity that holds a single financial asset and does not have any other business activity.
Asset management income
Asset management income is derived from the governing agreements in place with the Group’s private funds. The rate or amount at which fees are charged, the basis on which such fees are calculated and the timing of payments vary across private funds and, as to a particular private fund, may also vary across investment options available to underlying investors in, or members of, the private fund. Management fees are generally based on an agreed percentage of a private fund’s commitments and/or amounts committed or deployed, depending on the private fund agreement. Management fees are recognized over time as the services are provided. In addition, the Group receives performance fees from its private funds, which are earned when contractually agreed performance levels are exceeded within specified performance measurement periods. The Group’s private funds (other than BOF-C and the Advantage Fund) use a so-called “European” structure for the payment of performance fees, whereby the manager is not paid any performance fees until private fund investors have had their entire capital investment repaid. This contrasts with a so-called “American” structure for the payment of performance fees, whereby the performance fees are paid on profitable resolutions as they occur. Performance fees are recognized when a reliable estimate of the performance fee can be made and it is probable that a significant reversal in the amount of cumulative revenue recognized will not occur.
Insurance activities
The Group (i) acts as an administrator in the sale of legal expenses insurance policies issued in the name of Great Lakes Reinsurance (UK) plc, a subsidiary of MunichRe, under a binding authority agreement, and (ii) underwrites legal expenses insurance policies through its wholly owned Guernsey insurer, Burford Worldwide Insurance Limited. Income earned from acting as insurance administrator and underwriting legal expenses insurance policies is included in “Other income”.
Leases
At the inception of any arrangement, the Group determines whether the arrangement is or contains a lease based on the unique facts and circumstances present in the arrangement. Leases are recognized as a right-of-use asset and a corresponding liability at the date at which the leased asset is available for use by the Group. The Group recognizes lease liabilities measured at the present value of lease payments to be made over the lease term. In calculating the present value, the Group uses its incremental borrowing rate at the lease commencement date as the interest rate implicit in the lease is not readily determinable.
The lease agreements generally contain lease and non-lease components. Non-lease components primarily include payments for maintenance and utilities. The Group combines fixed payments for non-lease components with its lease payments and accounts for them together as a single lease component which increases the amount of its lease assets and liabilities. Payments under the lease arrangements are primarily fixed. Variable rents, if any, are expensed as incurred.
Each lease payment is allocated between the liability and finance cost. The finance cost is charged to the consolidated statements of operations over the period so as to produce a constant periodic rate of interest on the remaining balance of the liability for each period. The right-of-use asset is depreciated over the shorter of the asset’s useful life and the lease term on a straight-line basis. The right-of-use asset and associated lease liability are derecognized upon the termination of a lease agreement.
The Group has elected to not recognize leases with an original term of one year or less in the consolidated statements of financial position. The Group typically only includes an initial lease term in its assessment of a lease arrangement, whereas options to renew a lease are not included in this assessment unless there is a reasonable certainty that the lease will be renewed.
86 Burford Capital Annual Report 2023
In the consolidated statements of financial position, right-of-use assets are included within other assets, and lease liabilities are included in other liabilities.
Compensation and benefits
Salaries and benefits
Salaries and benefits include base salaries and employee benefits.
Annual incentive compensation
Annual incentive compensation includes discretionary and non-discretionary annual bonuses that are generally accrued over the related service period. Under certain non-discretionary arrangements, the Company may require that a portion of the incentive compensation distributed to its employees be allocated as RSUs under the LTIP. Such share-based awards are recorded as share-based compensation expense ratably over the relevant service period once granted.
Share-based compensation
Share-based compensation consists of RSUs with service-based and/or performance-based (which in turn may include performance-based and/or market-based) conditions. The fair value of these RSUs is estimated using the Monte-Carlo model at the grant date. The Group recognizes share-based compensation expense ratably over the relevant service period and accounts for forfeitures based on its estimates. Forfeiture estimates are trued up at the end of the vesting period to ensure that share-based compensation expense is recognized only for those RSUs that ultimately vest. Upon vesting of an RSU award, ordinary shares (which are either purchased on the open market or newly issued) are released to employees net of any applicable income tax withholding.
Legacy asset recovery incentive compensation including accruals and long-term incentive compensation including accruals
Incentive compensation, which includes the “phantom carry pool” program, primarily consists of a portion of gains on capital provision assets or performance fees earned from certain of the Group’s private funds that are allocated to employees. Incentive compensation amounts are not paid until the related gains on capital provision assets or performance fees have been realized in cash by the Group. Incentive compensation amounts are recorded as the related fair value gains or losses on capital provision assets or performance fees are recognized. Accordingly, incentive compensation amounts can be reversed during periods when there is a decline in fair value or performance revenues that were previously recorded.
Business combinations
Business combinations are accounted for using the acquisition method. The cost of an acquisition is measured as the aggregate of the consideration transferred, which is measured at fair value on the acquisition date. Acquisition-related costs are expensed as incurred and included in the consolidated statements of operations. When the Group acquires a business, it assesses the financial assets and liabilities assumed for appropriate classification and designation in accordance with the contractual terms, economic circumstances and pertinent conditions at the acquisition date.
Any contingent consideration to be transferred by the acquirer will be recognized at fair value at the acquisition date. Subsequent changes in the fair value of contingent consideration classified as an asset or liability are reflected in the consolidated statements of operations. Contingent consideration classified as equity is not remeasured, and its subsequent settlement is accounted for within shareholders’ equity.
Goodwill
Goodwill arises as a result of the acquisition of subsidiaries and represents the excess of the purchase consideration over the fair value of the Group’s share of the assets acquired and the liabilities assumed on the acquisition date. After initial recognition, goodwill is measured at cost less any accumulated impairment losses. For the purposes of impairment testing, goodwill acquired in a business combination is, from the acquisition date, allocated to each of the Group’s reporting units that are expected to benefit from the combination, irrespective of whether other assets or liabilities of the acquiree are assigned to those units. The Group tests goodwill acquired in a business combination annually for impairment.
Burford Capital Annual Report 2023 87
Foreign currency translation
Functional and presentation currency
Items included in the financial statements of each of the Group’s entities are measured using the currency of the primary economic environment in which such entity operates (the “functional currency”). The functional currency of the Company, as determined in accordance with US GAAP, is the US dollar, because this is the currency that best reflects the economic substance of the underlying events and circumstances of the Company. The consolidated financial statements are presented in US dollar (the “presentation currency”).
Certain subsidiaries operate and prepare financial statements denominated in pound sterling and Australian dollar. For the purposes of preparing consolidated financial statements, those subsidiaries’ assets and liabilities are translated at exchange rates prevailing at each applicable reporting date. Income and expense items are translated at average exchange rates for the reporting period. Non-monetary items are measured using the exchange rate at the date of the initial transaction. Any exchange rate-related differences are recognized in other comprehensive income/(loss).
Transactions and balances
Foreign currency transactions are translated into the functional currency using the exchange rate prevailing at the transaction date. Foreign exchange gains and losses resulting from the settlement of such transactions and from the translation at period-end exchange rates of monetary assets and liabilities denominated in foreign currencies, including intragroup balances, are recognized in the consolidated statements of operations as part of the income or loss, as applicable, for the period. See note 6 (Capital provision assets) to the Group’s consolidated financial statements for additional information with respect to the treatment of capital provision assets.
Since April 2016, certain intragroup balances have been considered as part of a net investment in a foreign operation. Gains and losses on such balances are recognized in other comprehensive income/(loss), with gains of $
Expenses
All expenses are accounted for on an accruals basis.
Finance costs
Finance costs represent interest and issuance expenses of outstanding indebtedness calculated using the effective interest rate method recognized in the consolidated statements of operations.
Gain/(loss) on debt extinguishment
Gain/(loss) on debt extinguishment represents a gain or loss arising from the difference between the amortized cost and the cost of extinguishing the debt on the extinguishment date and is recognized in the consolidated statements of operations.
Income taxes
The Group computes income taxes using the asset and liability method, under which deferred income taxes are recognized based on the differences between the carrying amounts and the respective tax bases of the Group’s assets and liabilities. Deferred tax assets and liabilities are measured using enacted tax rates expected to apply to taxable income in the periods in which the Group expects the temporary differences to reverse. The effect of a change in tax rates on deferred taxes is recognized in income/(loss) before income taxes in the consolidated statements of operations for the period that includes the enactment date.
The Group routinely evaluates the likelihood of realizing the benefit of its deferred tax assets and may record a valuation allowance if, based on all available evidence, it determines that a portion of the tax benefit will not be realized. In evaluating the Group’s ability to recover its deferred tax assets within the jurisdictions from which they arise, the Group considers all available positive and negative evidence, including scheduled reversals of deferred tax liabilities, projected future taxable income, tax-planning strategies and results of recent operations. If the Group determines that it would be able to realize its deferred tax assets in the future in excess of their net recorded amount, the Group would make an adjustment to the deferred tax asset valuation allowance, which would reduce the provision for income taxes.
88 Burford Capital Annual Report 2023
The Group evaluates its exposures associated with its various tax filing positions and recognizes a tax benefit from an uncertain tax position only if it is more likely than not that the tax position will be sustained upon examination by the relevant tax authorities, including resolutions of any related appeals or litigation processes, based on the technical merits of the Group’s tax filing position. The tax benefits recognized in the consolidated financial statements from a tax filing position are measured based on the largest benefit that has a greater than 50% likelihood of being realized upon ultimate settlement. The Group adjusts its unrecognized tax benefit liability and income tax expense in the period in which the uncertain tax position is effectively settled, the statute of limitations expires for the relevant tax authority to examine the tax position or when new information becomes available.
Interest and penalties related to income tax matters are recorded in other expenses in the consolidated statements of operations. Accrued interest and penalties are included within the related tax balances in the consolidated statements of financial position.
Dividends
Dividends paid during the period are recorded as a reduction to retained earnings in the consolidated statements of changes in equity.
Property and equipment
Property and equipment are recorded at cost less accumulated depreciation and provision for impairment and are included in other assets in the consolidated statements of financial position. Depreciation is provided to write off the cost less estimated residual value in equal instalments over the estimated useful lives of the assets.
The table below sets forth the expected useful lives of the Group’s various assets.
Property and equipment |
| Useful life |
Leasehold improvements |
| Life of lease |
Fixtures, fittings and equipment |
| |
Computer hardware and software |
|
The gain or loss arising on the disposal or retirement of an asset is determined as the difference between the net sales proceeds and the carrying amount of the asset and is recognized in income/(loss) before income taxes in the consolidated statements of operations.
Prepayments and other payables
Prepayments and other payables are recognized at nominal value, are non-interest-bearing and are recorded in other assets and other liabilities, as applicable, in the consolidated statements of financial position.
Shareholders’ equity
Ordinary shares are classified as equity in shareholders’ equity. Contingent shares are classified as equity in shareholders’ equity, where contingent shares will be issued and converted to ordinary shares only after the specified conditions have been satisfied. Additional paid-in capital includes the obligation for the issuance of ordinary shares to the Group’s employees under the LTIP. Incremental costs directly attributable to the issuance of new ordinary shares are deducted from equity in shareholders’ equity.
Net income/(loss) per ordinary share
The Group presents basic and diluted net income/(loss) per ordinary share. Basic net income/(loss) per ordinary share excludes potential dilution and is computed by dividing net income/(loss) attributable to ordinary shares by the weighted average number of ordinary shares issued and outstanding during the period. Diluted income/(loss) per ordinary share reflects the potential dilution that could occur if ordinary shares were issued pursuant to the Group’s share-based compensation awards. The potential dilution from share-based compensation awards is computed using the treasury stock method based on the average market value of ordinary shares during the period.
Recently issued or adopted accounting pronouncements
There have been no recently issued or adopted accounting pronouncements that had or are expected to have a material impact on the consolidated financial statements.
In October 2023, the Financial Accounting Standards Board (the “FASB”) issued Accounting Standards Update 2023-06, Disclosure Improvements (“ASU 2023-06”). ASU 2023-06 aims to clarify or improve disclosure and presentation
Burford Capital Annual Report 2023 89
requirements of a variety of topics and align the requirements in the FASB’s accounting standard codification with the SEC’s regulations. The amendments set forth in ASU 2023-06 will be effective on the date, on which the related disclosures are removed from Regulation S-X or Regulation S-K by the SEC, and will no longer be effective if the SEC has not removed the applicable disclosure requirement by June 30, 2027. The Group is currently evaluating the impact of ASU 2023-06 on its consolidated financial statements.
In November 2023, the FASB issued Accounting Standards Update 2023-07, Segment Reporting (Topic 280) (“ASU 2023-07”). ASU 2023-07 relates to improvements in disclosures about a public entity’s reportable segments and provision of more detailed information about a reportable segment’s expenses. ASU 2023-07 is effective for fiscal years beginning after December 15, 2023 and interim periods within fiscal years after December 15, 2024. Early adoption is permitted. The Group is currently evaluating the impact of ASU 2023-07 on its consolidated financial statements.
In December 2023, the FASB issued Accounting Standards Update 2023-09, Income Taxes (Topic 740) (“ASU 2023-09”). ASU 2023-09 relates to improvements in income tax disclosures to enhance their transparency and decision usefulness. ASU 2023-09 is effective for fiscal years beginning after December 15, 2024 and interim periods within those fiscal years. Early adoption is permitted for annual financial statements that have not yet been issued or made available for issuance. The Group is currently evaluating the impact of ASU 2023-09 on its consolidated financial statements.
3. Supplemental cash flow data
The tables below set forth supplemental information with respect to the cash inflows and outflows for capital provision-direct and capital provision-indirect assets for the periods indicated.
| Year ended December 31, 2023 | |||||
Capital provision- |
| Capital provision- | ||||
($ in thousands) | direct assets |
| indirect assets | Total | ||
Proceeds from capital provision assets | |
| |
| | |
Increase in payable for capital provision assets | | - | | |||
Funding of capital provision assets | ( |
| ( |
| ( | |
| Year ended December 31, 2022 | |||||
Capital provision- |
| Capital provision- | ||||
($ in thousands) | direct assets |
| indirect assets | Total | ||
Proceeds from capital provision assets |
| | | | ||
Funding of capital provision assets |
| ( | ( | ( | ||
| Year ended December 31, 2021 | |||||
Capital provision- |
| Capital provision- | ||||
($ in thousands) | direct assets |
| indirect assets | Total | ||
Proceeds from capital provision assets |
| |
| |
| |
Decrease in payable for capital provision assets | ( | - | ( | |||
Funding of capital provision assets |
| ( |
| - |
| ( |
Capital provision-direct assets represent those assets for which the Group has provided financing directly to a client or to finance a principal position in a legal finance asset. BOF-C is included in capital provision-direct assets because the Group does not invest any capital in BOF-C.
Capital provision-indirect assets represent those assets for which the Group’s capital is provided through a private fund as a limited partner contribution. For the years ended December 31, 2023 and 2022, activity in the capital provision-indirect assets related primarily to those assets held through the Advantage Fund, which closed during the year ended December 31, 2022, whereas capital provision-indirect assets consisted entirely of assets held through the Strategic Value Fund for the year ended December 31, 2021.
4. Income taxes
The Company qualifies for exemption from income tax in Guernsey under the Income Tax (Exempt Bodies) (Guernsey) Ordinance, 1989, as amended. This exemption has to be applied for annually and has been applied for, and granted, with respect to the year ended December 31, 2023.
The Company’s operating subsidiaries in Australia, Ireland, Singapore, the United Kingdom and the United States are subject to taxation in such jurisdictions as determined in accordance with relevant tax legislation. In certain cases, an
90 Burford Capital Annual Report 2023
operating subsidiary of the Company may elect a transaction structure that could be subject to income tax in a country related to the transaction creating the capital provision asset.
The effective tax rates were
The table below sets forth the domestic and foreign income/(loss) before income taxes for the periods indicated.
Years ended December 31, | ||||||
($ in thousands) | 2023 | 2022 | 2021 | |||
Domestic |
| | | ( | ||
Foreign |
| | | | ||
Income/(loss) before income taxes |
| | | | ||
The table below sets forth the components of the tax charge based on the domestic statutory tax rate to the provision for/(benefit from) income taxes for the periods indicated.
Years ended December 31, | ||||||
($ in thousands) | 2023 | 2022 | 2021 | |||
Statutory rate |
| - | - | - | ||
Foreign rate differential |
| | | | ||
Compensation |
| | | | ||
Valuation allowance |
| | ( | | ||
Withholding tax |
| | | | ||
Non-deductible taxes |
| - | ( | - | ||
Prior period adjustments |
| ( | | | ||
Impairment | - | - | ( | |||
Non-taxable income |
| ( | - | ( | ||
Other, net |
| ( | ( | ( | ||
Provision for/(benefit from) income taxes |
| | | | ||
The table below sets forth an analysis for the foreign tax differential for the periods indicated.
Years ended December 31, | ||||||
($ in thousands) | 2023 | 2022 | 2021 | |||
US subsidiaries at statutory tax rate |
| | | ( | ||
Singapore subsidiaries at statutory tax rate |
| ( | ( | | ||
Irish subsidiaries at statutory tax rate |
| | ( | | ||
UK subsidiaries at statutory tax rate |
| | ( | | ||
Other | ( | | | |||
Total |
| | | | ||
The table below sets forth the current and deferred components of the provision for/(benefit from) income taxes for the periods indicated.
Years ended December 31, | ||||||
($ in thousands) | 2023 | 2022 | 2021 | |||
Current: |
|
|
| |||
Domestic (Guernsey) |
| - | - | - | ||
Foreign - US federal and state |
| | | ( | ||
Foreign - other and withholding |
| | ( | ( | ||
Total current provision for/(benefit from) income taxes |
| | | ( | ||
Deferred: |
| |||||
Domestic (Guernsey) |
| - | - | - | ||
Foreign - US federal and state |
| | | | ||
Foreign - other |
| ( | | | ||
Total deferred provision for/(benefit from) income taxes |
| | | | ||
Total provision for/(benefit from) income taxes |
| | | | ||
Burford Capital Annual Report 2023 91
The table below sets forth the tax effect of temporary differences and carryforwards that comprise significant portions of gross deferred tax assets and liabilities at the dates indicated.
December 31, | ||||
($ in thousands) | 2023 | 2022 | ||
Deferred tax assets: |
| |||
Compensation and benefit accruals | | | ||
Net operating loss carryforwards | | | ||
Non-deductible and excess interest | | | ||
Unrealized loss | - | - | ||
Acquisition costs | | | ||
Capital lease | | | ||
Other | | | ||
Total deferred tax assets(1) | | | ||
Deferred tax liabilities: | ||||
Compensation and benefit accruals | - | - | ||
Depreciation and amortization | ( | ( | ||
Goodwill | ( | ( | ||
Unrealized gain | ( | ( | ||
Total deferred tax liabilities(1) | ( | ( | ||
Net deferred tax position | ( | ( | ||
Valuation allowance | ( | ( | ||
Net deferred tax liabilities | ( | ( | ||
| 1. | Total deferred tax assets and liabilities in this table are shown on a gross basis. Deferred tax assets and liabilities as shown in the consolidated statements of financial position are offset within each tax jurisdiction, to the extent that they relate to the same taxable entity. |
The table below sets forth the net operating loss carryforwards at the dates indicated. US net operating loss carryforwards reported in the Group’s consolidated financial statements reflect the US federal statutory rate and an estimated blended state rate, and the effective state rate in a particular year may differ from the blended state rate.
December 31, | ||||
($ in thousands) | 2023 | 2022 | ||
US federal(1) | - | - | ||
US state(2) | | | ||
Foreign(1) | | | ||
1. | US federal and foreign net operating losses have indefinite carryforward periods. |
2. | US state operating losses will expire on various dates from 2038 through 2042. |
The valuation allowance primarily relates to interest expense, foreign net operating loss carryforwards and other deferred tax assets. The Company has performed an assessment of positive and negative evidence, including the nature, frequency and severity of cumulative financial reporting losses in recent years, the future reversal of existing temporary differences, predictability of future taxable income exclusive of reversing temporary differences of the character necessary to realize the tax assets, relevant carryforward periods, taxable income in carryback periods if carryback is permitted under applicable tax laws and prudent and feasible tax planning strategies that would be implemented, if necessary, to protect against the loss of the deferred tax assets that would otherwise expire. Although realization is not assured, based on the Company’s assessment, the Company has concluded that it is more likely than not that the remaining gross deferred tax assets will be realized and, as such, no additional valuation allowance has been provided.
5. Segment reporting
There are
Other corporate includes certain operating and non-operating activities that are not used internally to measure and evaluate the performance of the reportable segments.
92 Burford Capital Annual Report 2023
The tables below set forth certain information with respect to the Group’s reportable segments for the periods indicated.
Year ended December 31, 2023 | ||||||||||||
Reconciliation | ||||||||||||
Asset |
| Total | Adjustment for | |||||||||
Capital | management and | Other | segments | third-party | Total | |||||||
($ in thousands) | provision | other services | corporate | (Burford-only) | interests(1) | consolidated | ||||||
Capital provision income/(loss) |
| | - | - | | | | |||||
Plus/(Less): Third-party interests in capital provision assets | - | - | - | - | ( | ( | ||||||
Asset management income/(loss)* |
| - | | - | | ( | | |||||
Marketable securities income/(loss) and bank interest |
| - | - | | | | | |||||
Other income/(loss)* | - | | - | | - | | ||||||
Total revenues |
| | | | | | | |||||
| ||||||||||||
Operating expenses |
| | | | | | | |||||
Other expenses |
| |||||||||||
Finance costs |
| | | | | ( | | |||||
Foreign currency transactions (gains)/losses |
| - | - | ( | ( | ( | ( | |||||
Total other expenses | | | ( | | ( | | ||||||
Income/(loss) before income taxes |
| | | ( | | | | |||||
*Includes the following revenue from contracts with customers for services transferred over time |
| - | | - | | ( | | |||||
1. | Adjusted for third-party interests in non-wholly owned consolidated entities, which included BOF-C, the Strategic Value Fund, the Advantage Fund, Colorado and several other entities in which the Company holds investments and there is a third-party partner in, or owner of, those entities. |
Year ended December 31, 2022 | ||||||||||||
Reconciliation | ||||||||||||
Asset |
| Total | Adjustment for | |||||||||
Capital | management and | Other | segments | third-party | Total | |||||||
($ in thousands) |
| provision | other services | corporate | (Burford-only) | interests(1) | consolidated | |||||
Capital provision income/(loss) |
| | - | - | | | | |||||
Plus/(Less): Third-party interests in capital provision assets | - | - | - | - | ( | ( | ||||||
Asset management income/(loss)* |
| - | | - | | ( | | |||||
Marketable securities income/(loss) and bank interest |
| - | - | ( | ( | ( | ( | |||||
Other income/(loss)* | - | ( | - | ( | - | ( | ||||||
Total revenues* |
| | | ( | | | | |||||
| ||||||||||||
Operating expenses |
| | | | | | | |||||
Other expenses |
| |||||||||||
Finance costs |
| | | | | - | | |||||
(Gains)/Losses on debt extinguishment | | | | | - | | ||||||
Foreign currency transactions (gains)/losses |
| - | - | | | | | |||||
Total other expenses | | | | | | | ||||||
Income/(loss) before income taxes |
| | | ( | | | | |||||
*Includes the following revenue from contracts with customers for services transferred over time |
| - | | - | | ( | | |||||
1. | Adjusted for third-party interests in non-wholly owned consolidated entities, which included BOF-C, the Strategic Value Fund, Colorado and several other entities in which the Company holds investments and there is a third-party partner in, or owner of, those entities. |
Burford Capital Annual Report 2023 93
Year ended December 31, 2021 | ||||||||||||
Reconciliation | ||||||||||||
Asset |
| Total | Adjustment for | |||||||||
Capital | management and | Other | segments | third-party | Total | |||||||
($ in thousands) |
| provision | other services | corporate | (Burford-only) | interests(1) | consolidated | |||||
Capital provision income/(loss) |
| | - | - | | | | |||||
Plus/(Less): Third-party interests in capital provision assets | - | - | - | - | | | ||||||
Asset management income/(loss)* |
| - | | - | | ( | | |||||
Marketable securities income/(loss) and bank interest |
| - | - | | | | | |||||
Other income/(loss)* | - | | - | | - | | ||||||
Total revenues* |
| | | | | | | |||||
| ||||||||||||
Operating expenses |
| | | | | | | |||||
Other expenses |
| |||||||||||
Finance costs |
| | | | | - | | |||||
(Gains)/Losses on debt extinguishment | | | | | - | | ||||||
Foreign currency transactions (gains)/losses |
| | - | | | - | | |||||
Total other expenses | | | | | - | | ||||||
Income/(loss) before income taxes |
| | | ( | ( | | | |||||
*Includes the following revenue from contracts with customers for services transferred over time |
| - | | - | | ( | | |||||
1. | Adjusted for third-party interests in non-wholly owned consolidated entities, which included BOF-C, the Strategic Value Fund, Colorado and several other entities in which the Company holds investments and there is a third-party partner in, or owner of, those entities. |
The tables below set forth the Group’s total assets by reporting segment at the dates indicated.
Reconciliation | ||||||||||||
Asset |
| Total | Adjustment for | |||||||||
Capital | management and | Other | segments | third-party | Total | |||||||
($ in thousands) | provision | other services | corporate | (Burford-only) | interests(1) | consolidated | ||||||
Total assets at December 31, 2023 | | | | | | | ||||||
Total assets at December 31, 2022 |
| | | | | | | |||||
| 1. | Adjusted for third-party interests in non-wholly owned consolidated entities, which included BOF-C, the Strategic Value Fund, the Advantage Fund, Colorado and several other entities in which the Company holds investments and there is a third-party partner in, or owner of, those entities. |
6. Capital provision assets
Capital provision assets are financial instruments that relate to the provision of capital in connection with legal finance. Capital provision-direct assets represent those assets for which the Group has provided financing directly to a client or to finance a principal position in a legal finance asset. BOF-C is included in capital provision-direct assets because the Group does not invest any capital in BOF-C. Capital provision-indirect assets represent those assets for which the Group’s capital is provided through a private fund as a limited partner contribution. For the years ended December 31, 2023 and 2022, activity in the capital provision-indirect assets related primarily to those assets held through the Advantage Fund, which closed during the year ended December 31, 2022, whereas capital provision-indirect assets consisted entirely of assets held through the Strategic Value Fund for the year ended December 31, 2021. The table below sets forth the changes in capital provision assets at the beginning and end of the relevant reporting periods.
94 Burford Capital Annual Report 2023
Years ended December 31, | ||||
($ in thousands) |
| 2023 | 2022 | |
At beginning of period | | | ||
Deployments | | | ||
Realizations |
| ( | ( | |
Income/(loss) for the period |
| | | |
Foreign exchange gains/(losses) |
| | ( | |
At end of period |
| | | |
Capital provision-direct assets |
| | | |
Capital provision-indirect assets |
| | | |
Total capital provision assets | | | ||
Unrealized fair value at end of period | | | ||
The table below sets forth the components of the capital provision income/(loss) for the periods indicated.
Years ended December 31, | ||||||
($ in thousands) |
| 2023 | 2022 | 2021 | ||
Realized gains/(losses) |
| | | | ||
Fair value adjustment during the period, net of previously recognized unrealized gains transferred to realized gains |
| | | | ||
Income/(loss) on capital provision assets |
| | | | ||
Interest and other income/(loss) | - | | | |||
Impairment of other asset | - | - | ( | |||
Foreign exchange gains/(losses) | | ( | ( | |||
Net realized and unrealized loss on due from settlement of capital provision assets | ( | ( | - | |||
Gains/(losses) on financial liabilities at fair value through profit or loss | - | | - | |||
Break fee income | | - | - | |||
Total capital provision income as reported in the consolidated statements of operations |
| | | | ||
Exchange differences arising from capital provision assets denominated in a currency other than the functional currency of the entity in which such capital provision assets are held are recognized in capital provision income/(loss) in the consolidated statements of operations. All other foreign exchange translation differences arising from capital provision assets held by non-US dollar functional currency entities are recognized in other comprehensive income/(loss) in the consolidated statements of comprehensive income. The currency of the primary economic environment in which the Group’s entity operates is referred to as the “functional currency” of the Group’s entity.
On a consolidated basis, the capital provision-indirect assets represent legal finance assets in the Advantage Fund and, prior to its liquidation in the fourth quarter of 2023, equity securities and related claims in the Strategic Value Fund.
7. Due from settlement of capital provision assets
Amounts due from settlement of capital provision assets relate to the realization of capital provision assets that have successfully concluded and where there is no longer any litigation risk remaining. The settlement terms and timing of realizations vary by capital provision asset. The majority of settlement balances are received shortly after the respective period ends in which the capital provision assets have concluded, and all settlement balances are generally expected to be received within 12 months after the capital provision assets have concluded.
Burford Capital Annual Report 2023 95
The table below sets forth the changes in due from settlement of capital provision assets and the breakdown between current and non-current due from settlement of capital provision assets at the beginning and end of the relevant reporting periods.
Years ended December 31, | ||||
($ in thousands) | 2023 | 2022 | ||
At beginning of period |
| | | |
Transfer of realizations from capital provision assets |
| | | |
Interest and other income |
| - | | |
Proceeds from capital provision assets |
| ( | ( | |
Realized loss | ( | - | ||
Unrealized gain/(loss) on due from settlement of capital provision assets, net of previously recognized unrealized loss transferred to realized loss | | ( | ||
Foreign exchange gains/(losses) | | | ||
At end of period |
| | | |
Current assets | | | ||
Non-current assets |
| | | |
Total due from settlement of capital provision assets |
| | | |
8. Asset management income
The table below sets forth the components of the asset management income for the periods indicated.
Years ended December 31, | ||||||
($ in thousands) |
| 2023 | 2022 | 2021 | ||
Management fee income |
| | | | ||
Performance fee income |
| - | | | ||
Total asset management income |
| | | | ||
9. Long-term incentive compensation payable
The table below sets forth the changes in the long-term incentive compensation payable at the beginning and end of the relevant reporting periods. During the year ended December 31, 2023, the Company recognized a charge in the amount of $
Years ended December 31, | ||||
($ in thousands) |
| 2023 | 2022 | |
At beginning of period |
| | | |
Long-term incentive compensation including accruals |
| | | |
Transfer to short-term payable within general expenses payable |
| ( | ( | |
Cash paid | ( | ( | ||
Foreign exchange gains/(losses) | | ( | ||
At end of period |
| | | |
=
f
10. Marketable securities
The table below sets forth the changes in marketable securities at the beginning and end of the relevant reporting periods.
Years ended December 31, | ||||
($ in thousands) |
| 2023 | 2022 | |
At beginning of period |
| | | |
Purchases |
| | | |
Proceeds on disposal |
| ( | ( | |
Net realized gains/(losses) on disposal |
| ( | ( | |
Fair value movement |
| | ( | |
Change in accrued interest |
| ( | | |
Foreign exchange gains/(losses) |
| | ( | |
At end of period |
| | | |
96 Burford Capital Annual Report 2023
The table below sets forth the components of the total marketable securities income/(loss) and bank interest for the periods indicated.
Years ended December 31, | ||||||
($ in thousands) |
| 2023 |
| 2022 | 2021 | |
Net realized gains/(losses) on disposal |
| ( |
| ( |
| ( |
Changes in fair value |
| |
| ( |
| |
Interest and dividend income |
| |
| |
| |
Bank interest |
| |
| |
| |
Total marketable securities income/(loss) and bank interest |
| |
| ( | | |
11. Other assets
The table below sets forth the components of total other assets at the dates indicated.
December 31 | ||||
($ in thousands) |
| 2023 | 2022 | |
Reinsurance assets |
| | | |
Right-of-use assets | | | ||
Property and equipment | | | ||
Prepayments |
| | | |
Other receivables |
| | | |
Total other assets |
| | | |
12. Other liabilities
The table below sets forth the components of total other liabilities at the dates indicated.
| December 31, | |||
($ in thousands) | 2023 |
| 2022 | |
General expenses payable | | | ||
Insurance liabilities | | | ||
| | |||
Legacy asset recovery incentive compensation | | | ||
Audit fees payable | | | ||
Tax payable | | | ||
Payable for capital provision assets | | - | ||
Total other liabilities | | | ||
13. Debt
The table below sets forth certain information with respect to the Group’s debt securities outstanding at the dates indicated. Debt securities denominated in pound sterling have been converted to US dollar using GBP/USD exchange rates of $
Outstanding at | Carrying value (at amortized cost) at | Fair value(1) at | ||||||||||||
USD equivalent | December 31, | December 31, | ||||||||||||
face value | 2023 (in local | 2023 | December 31, | December 31, | December 31, | December 31, | ||||||||
($ in thousands) | at issuance | currency) | (in USD) | 2023 | 2022 | 2023 | 2022 | |||||||
Burford Capital PLC | ||||||||||||||
$ |
| £- | $ - | $ - | $ | $ - | $ | |||||||
$ |
| £ | $ | $ | $ | $ | $ | |||||||
Burford Capital Finance LLC |
|
| ||||||||||||
$ | $ | $ | $ | $ | $ | $ | ||||||||
Burford Capital Global Finance LLC |
| |||||||||||||
$ | $ | $ | $ | $ | $ | $ | ||||||||
$ | $ | $ | $ | $ | $ | $ | ||||||||
$ | $ | $ | $ | $ - | $ | $ - | ||||||||
Total debt |
|
| $ | $ | $ | $ | $ | |||||||
1. | The Group’s outstanding indebtedness is held at amortized cost in the consolidated financial statements and these values represent the fair value equivalent amounts. The Group’s debt securities are classified as Level 2 within the fair value hierarchy. |
Burford Capital Annual Report 2023 97
The table below sets forth a summary of the changes in the outstanding indebtedness due to cash flows and non-cash changes at the beginning and end of the relevant reporting periods.
Years ended December 31, | ||||
($ in thousands) |
| 2023 |
| 2022 |
At beginning of period | | | ||
Debt issued, net of original issue discount | | | ||
Debt issuance costs | ( | ( | ||
Finance costs | | | ||
Interest paid | ( | ( | ||
Foreign exchange (gain)/loss | | ( | ||
Debt extinguishment | ( | ( | ||
At end of period | | | ||
|
| |||
Debt payable | | | ||
Debt interest payable | | | ||
Total debt and interest payable | | | ||
The table below sets forth unamortized issuance costs of the outstanding debt securities at the dates indicated.
December 31, | ||||
($ in thousands) | 2023 |
| 2022 | |
- | | |||
| | |||
| | |||
| | |||
| | |||
| - | |||
The table below sets forth the components of total finance costs of the outstanding indebtedness for the periods indicated.
Years ended December 31, | ||||||
(S in thousands) |
| 2023 | 2022 | 2021 | ||
Debt interest expense |
| |
| |
| |
Debt issuance costs incurred as finance costs |
| |
| |
| |
Total finance costs |
| |
| |
| |
Description of debt securities
All of the Group’s outstanding debt securities have a fixed interest rate payable semi-annually in arrears and are unsecured, unsubordinated obligations of the respective issuer that are fully and unconditionally guaranteed by the Company and certain of its wholly owned indirect subsidiaries.
At December 31, 2023, the Group was in compliance with the covenants set forth in the respective agreements governing its debt securities.
The Company is required to provide certain information pursuant to the indentures governing the 2028 Notes, the 2030 Notes and the 2031 Notes. The tables below set forth the total assets and third-party indebtedness at the dates indicated and total revenues for the periods indicated, in each case, of (i) the Company and its Restricted Subsidiaries (as defined in the indentures governing the 2028 Notes, the 2030 Notes and the 2031 Notes, as applicable) and (ii) the Company’s Unrestricted Subsidiaries (as defined in the indentures governing the 2028 Notes, the 2030 Notes and the 2031 Notes, as applicable).
December 31, | ||||
($ in thousands) | 2023 |
| 2022(1) | |
Company and its Restricted Subsidiaries | ||||
Total assets | | | ||
Third-party indebtedness | | | ||
Unrestricted Subsidiaries | ||||
Total assets | | | ||
Third-party indebtedness | - | - | ||
| 1. | The comparative data at December 31, 2022 in the table above has been amended to correct for immaterial differences. |
98 Burford Capital Annual Report 2023
Years ended December 31, | ||||||
(S in thousands) | 2023 |
| 2022 | 2021 | ||
Company and its Restricted Subsidiaries | ||||||
Total revenues | | | | |||
Unrestricted Subsidiaries | ||||||
Total revenues | | | | |||
Issuance of 2030 Notes
On April 11, 2022, Burford Capital Global Finance LLC issued $
Redemption of 2022 Bonds
On May 25, 2022, Burford Capital PLC redeemed in full the remaining aggregate outstanding principal amount of the
Issuance of Initial 2031 Notes
On June 26, 2023, Burford Capital Global Finance LLC issued $
Redemption of 2024 Bonds
On July 12, 2023, Burford Capital PLC redeemed in full the aggregate outstanding principal amount of the 2024 Bonds at a redemption price of
14. Goodwill
Goodwill arises as a result of the acquisition of subsidiaries and represents the excess of the purchase consideration over the fair value of the Group’s share of the assets acquired and the liabilities assumed on the acquisition date. The Group’s goodwill primarily relates to the acquisition of BCIM Holdings LLC in December 2016.
The tables below set forth the allocation of the carrying value of goodwill to each of the Group’s reportable segments at the beginning and end of the relevant reporting periods.
Asset | ||||||||
management | ||||||||
Capital | and other | Other | ||||||
($ in thousands) |
| provision |
| services |
| corporate |
| Total |
December 31, 2021 | | | | | ||||
Foreign exchange gain/(loss) | - | - | ( | ( | ||||
December 31, 2022 | | | | | ||||
Foreign exchange gain/(loss) | - | - | | | ||||
December 31, 2023 | | | | |
Management has determined there was
Burford Capital Annual Report 2023 99
15. Fair value of assets and liabilities
The tables below set forth the fair value of financial instruments grouped by the fair value level at the dates indicated.
December 31, 2023 | ||||||||
($ in thousands) | Level 1 | Level 2 | Level 3 | Total | ||||
Assets: | ||||||||
Capital provision assets | ||||||||
Derivative financial assets | ||||||||
Single case | - | - | | | ||||
Portfolio | - | - | | | ||||
Portfolio with equity risk | - | - | | | ||||
Legal risk management | - | - | | | ||||
Non-derivative financial assets | ||||||||
Joint ventures and equity method investments | - | - | | | ||||
Single case with equity risk | | - | - | | ||||
Assets of consolidated investment companies | ||||||||
Core legal finance (BOF-C) | | - | | | ||||
Lower risk legal finance (Advantage Fund) | - | - | | | ||||
Due from settlement of capital provision assets | - | - | | | ||||
Marketable securities | ||||||||
Government securities | | | - | | ||||
Corporate bonds | - | | - | | ||||
Asset-backed securities | - | | - | | ||||
Mutual funds | | - | - | | ||||
Certificates of deposit | | - | - | | ||||
Total assets | | | | | ||||
Liabilities: | ||||||||
Financial liabilities relating to third-party interests in capital provision assets | - | - | | | ||||
Total liabilities | - | - | | | ||||
Net total | | | | | ||||
December 31, 2022 | ||||||||
($ in thousands) | Level 1 | Level 2 | Level 3 | Total | ||||
Assets: | ||||||||
Capital provision assets | ||||||||
Derivative financial assets | ||||||||
Single case | - | - | | | ||||
Portfolio | - | - | | | ||||
Portfolio with equity risk | - | - | | | ||||
Legal risk management | - | - | | | ||||
Non-derivative financial assets | ||||||||
Joint ventures and equity method investments | - | - | | | ||||
Single case with equity risk | | - | - | | ||||
Assets of consolidated investment companies | ||||||||
Complex strategies (Strategic Value Fund) | - | - | | | ||||
Core legal finance (BOF-C) | | - | | | ||||
Lower risk legal finance (Advantage Fund) | - | - | | | ||||
Due from settlement of capital provision assets | - | - | | | ||||
Marketable securities | ||||||||
Government securities | | | - | | ||||
Corporate bonds | - | | - | | ||||
Asset-backed securities | - | | - | | ||||
Mutual funds | | - | - | | ||||
Total assets | | | | | ||||
Liabilities: | ||||||||
Financial liabilities relating to third-party interests in capital provision assets | - | - | | | ||||
Total liabilities | - | - | | | ||||
Net total | | | | | ||||
The Group has elected the fair value option for the Group’s equity method investments, marketable securities, due from settlement of capital provision assets and financial liabilities relating to third-party interests in capital provision assets to provide a consistent fair value measurement approach for all capital provision related activity. Realized gains
100 Burford Capital Annual Report 2023
and losses, unrealized gains and losses and interest and dividend income on these assets are recognized as income/(loss) and presented in the consolidated statements of operations when they are earned.
The key risk and sensitivity across all the capital provision assets relate to the underlying litigation associated with each case that is underwritten and financed. The sensitivity to this Level 3 input is therefore considered to be similar across the different types of capital provision assets and is expressed as a portfolio-wide stress.
Movements in Level 3 fair value assets and liabilities
The tables below set forth the analysis of the movements in the Level 3 financial assets and liabilities for the periods indicated.
Year ended December 31, 2023 | ||||||||||||||||
Transfers | Income/(loss) | Foreign | At | |||||||||||||
At beginning | Transfers | between | exchange | end of | ||||||||||||
($ in thousands) | of period | into Level 3 | types | Deployments | Realizations | period | gains/(losses) | period | ||||||||
Single case | | - | ( | | ( | | ( | | ||||||||
Portfolio | | - | | | ( | | ( | | ||||||||
Portfolio with equity risk | | - | - | | - | | - | | ||||||||
Legal risk management | | - | - | - | ( | | | | ||||||||
Joint ventures and equity method investments | | - | - | | ( | | | | ||||||||
Complex strategies (Strategic Value Fund) | | - | - | - | ( | | - | - | ||||||||
Core legal finance (BOF-C) | | - | - | | ( | | - | | ||||||||
Lower risk legal finance (Advantage Fund) | | - | - | | ( | | - | | ||||||||
Total capital provision assets | | - | - | | ( | | | | ||||||||
Due from settlement of capital provision assets | | - | - | | ( | ( | | | ||||||||
Total Level 3 assets | | - | - | | ( | | | | ||||||||
Financial liabilities relating to third-party interests in capital provision assets | | - | - | | ( | | - | | ||||||||
| - | - | | ( | | - | | |||||||||
Year ended December 31, 2022(1) | ||||||||||||||||
Transfers | Income/(loss) | Foreign | At | |||||||||||||
At beginning | Transfers | between | exchange | end of | ||||||||||||
($ in thousands) | of period | into Level 3 | types | Deployments | Realizations | period | gains/(losses) | period | ||||||||
Single case | | - | ( | | ( | | ( | | ||||||||
Portfolio | | - | | | ( | | ( | | ||||||||
Portfolio with equity risk | | - | - | | ( | | - | | ||||||||
Legal risk management | | - | - | | - | | ( | | ||||||||
Joint ventures and equity method investments | | - | - | | ( | ( | ( | | ||||||||
Complex strategies (Strategic Value Fund) | | - | - | - | ( | | - | | ||||||||
Core legal finance (BOF-C) | | - | - | | ( | | | | ||||||||
Lower risk legal finance (Advantage Fund) | - | - | - | | ( | | - | | ||||||||
Other | | - | - | - | ( | - | - | - | ||||||||
Total capital provision assets | | - | - | | ( | | ( | | ||||||||
Due from settlement of capital provision assets | | - | - | | ( | ( | | | ||||||||
Total Level 3 assets | | - | - | | ( | | ( | | ||||||||
Financial liabilities relating to third-party interests in capital provision assets | | - | - | | ( | | - | | ||||||||
Total Level 3 liabilities | | - | - | | ( | | - | | ||||||||
| 1. | The comparative data for December 31, 2022 in the table above has been amended to correct for immaterial differences. |
All transfers into and out of Level 3 are recognized as if they have taken place at the beginning of each reporting period. There were
Key unobservable inputs for Level 3 valuations
The Group’s valuation policy for capital provision assets provides for ranges of percentages to be applied against the risk-adjustment factor to more than
Burford Capital Annual Report 2023 101
Company typically marks assets at the middle of that range unless there are specific factors that cause the Group’s valuation committee to select a different point in the range and, on an exceptional basis, the Group’s valuation committee may also select a point outside the range. To decide which percentage to apply to a given asset, the Group’s valuation committee considers the kind and degree of legal, procedural or other investment-specific circumstances that may be present. See note 2 (Summary of significant accounting policies—Fair value of financial instruments) to the Group’s consolidated financial statements for additional information with respect to the Group’s valuation approach.
The tables below set forth each of the key unobservable inputs used to value the Group’s capital provision assets and the applicable ranges and weighted average by relative fair value for such inputs.
($ in thousands) | December 31, 2023 | |||||||||||
Type: | Single case, Portfolio, Joint ventures and equity method investments, Legal risk management, Core legal finance (BOF-C)(1), Financial liabilities relating to third party interests in capital provision assets | |||||||||||
Principal value technique: | Discounted cash flow | |||||||||||
Unobservable input: | Cost | Unrealized | Fair value | Minimum | Maximum | Weighted average | ||||||
Discount rate | ||||||||||||
Duration(2) (years) | | | | |||||||||
Adjusted risk premium | ||||||||||||
Positive case milestone factor: | ||||||||||||
Significant ruling or other objective event prior to trial court judgment | $ | $ | $ | |||||||||
Trial court judgment or tribunal award | $ | $ | $ | |||||||||
Appeal judgment | $ | $ | $ | |||||||||
Asset freeze | $ | $ | $ | |||||||||
Exhaustion of as-of-right appeals | $ | $ | $ | |||||||||
Exhaustion of all appeals | $ | $ | $ | |||||||||
Settlement | $ | $ | $ | |||||||||
Portfolios with multiple factors | $ | $ | $ | |||||||||
Other | $ | ($ | $ | |||||||||
Negative case milestone factor: | ||||||||||||
Significant ruling or other objective event prior to trial court judgment | $ | ($ | $ | ( | ( | ( | ||||||
Trial court judgment or tribunal award | $ | ($ | $ | ( | ( | ( | ||||||
Appeal judgment | $ | ($ | $ - | ( | ( | ( | ||||||
Portfolios with multiple factors | $ | ($ | $ | ( | ( | ( | ||||||
No case milestone: | $ | $ | $ | |||||||||
YPF-related assets: | $ | $ | $ | |||||||||
$ | $ | $ | ||||||||||
Type: | Lower risk legal finance (Advantage Fund) | |||||||||||
Principal value technique: | Discounted cash flow | |||||||||||
Unobservable input: | Cost | Unrealized | Fair value | Minimum | Maximum | Weighted average | ||||||
Discount rate | $ | $ | $ | |||||||||
Duration(2) (years) | | | | |||||||||
Type: | Portfolio with equity risk, Core legal finance (BOF-C)(1) | |||||||||||
Principal value technique: | Discounted cash flow | |||||||||||
Unobservable input: | Cost | Unrealized | Fair value | Minimum | Maximum | Weighted average | ||||||
Discount rate | $ | $ | $ | |||||||||
Resolution timing (years) | | | | |||||||||
Conversion ratio | | | | |||||||||
Type: | Due from settlement of capital provision assets | |||||||||||
Principal value technique: | Discounted cash flow | |||||||||||
Unobservable input: | Cost | Unrealized | Fair value | Minimum | Maximum | Weighted average | ||||||
Collection risk | $ | $ - | $ | |||||||||
Level 3 assets and liabilities, net | $ | $ | $ | |||||||||
| 1. | Includes the proportional investment in these capital provision assets held by BOF-C. |
102 Burford Capital Annual Report 2023
| 2. | Duration refers to the expected timing of a favorable outcome. See note 2 (Summary of significant accounting policies—Fair value of financial instruments) to the Group’s condensed consolidated financial statements for additional information with respect to the valuation methodology for Level 3 assets. |
($ in thousands) | December 31, 2022(1) | |||||||||||
Type: | Single case, Portfolio, Joint ventures and equity method investments, Legal risk management, Core legal finance (BOF-C)(2), Financial liabilities relating to third party interests in capital provision assets | |||||||||||
Principal value technique: | Discounted cash flow | |||||||||||
Unobservable input: | Cost | Unrealized | Fair value | Minimum | Maximum | Weighted average | ||||||
Discount rate | ||||||||||||
Duration(3) (years) | | | | |||||||||
Adjusted risk premium | ||||||||||||
Positive case milestone factor: | ||||||||||||
Significant ruling or other objective event prior to trial court judgment | $ | $ | $ | |||||||||
Trial court judgment or tribunal award | $ | $ | $ | |||||||||
Appeal judgment | $ | $ | $ | |||||||||
Asset freeze | $ | $ | $ | |||||||||
Settlement | $ | $ | $ | |||||||||
Portfolios with multiple factors | $ | $ | $ | |||||||||
Other | $ | ($ | $ | |||||||||
Negative case milestone factor: | ||||||||||||
Significant ruling or other objective event prior to trial court judgment | $ | ($ | $ | ( | ( | ( | ||||||
Trial court judgment or tribunal award | $ | ($ | $ | ( | ( | ( | ||||||
Appeal judgment | $ | ($ | $ | ( | ( | ( | ||||||
Portfolios with multiple factors | $ | ($ | $ | ( | ( | ( | ||||||
No case milestone: | $ | $ | $ | |||||||||
YPF-related assets: | $ | $ | $ | |||||||||
$ | $ | $ | ||||||||||
Type: | Lower risk legal finance (Advantage Fund) | |||||||||||
Principal value technique: | Discounted cash flow | |||||||||||
Unobservable input: | Cost | Unrealized | Fair value | Minimum | Maximum | Weighted average | ||||||
Discount rate | $ | $ | $ | |||||||||
Duration(3) (years) | | | | |||||||||
Type: | Portfolio with equity risk, Core legal finance (BOF-C)(2) | |||||||||||
Principal value technique: | Discounted cash flow | |||||||||||
Unobservable input: | Cost | Unrealized | Fair value | Minimum | Maximum | Weighted average | ||||||
Discount rate | $ | ($ | $ | |||||||||
Resolution timing (years) | | | | |||||||||
Conversion ratio | | | | |||||||||
Type: | Due from settlement of capital provision assets | |||||||||||
Principal value technique: | Discounted cash flow | |||||||||||
Unobservable input: | Cost | Unrealized | Fair value | Minimum | Maximum | Weighted average | ||||||
Collection risk | $ | ($ | $ | |||||||||
Type: | Complex strategies (Strategic Value Fund) | |||||||||||
Principal value technique: | Other | |||||||||||
Unobservable input: | Cost | Unrealized | Fair value | |||||||||
Other | $ | $ | $ | |||||||||
Level 3 assets and liabilities, net | $ | $ | $ | |||||||||
| 1. | The comparative data for December 31, 2022 in the table above has been amended to correct for immaterial differences. |
| 2. | Includes the proportional investment in these capital provision assets held by BOF-C. |
| 3. | Duration refers to the expected timing of a favorable outcome. See note 2 (Summary of significant accounting policies—Fair value of financial instruments) to the Group’s condensed consolidated financial statements for additional information with respect to the valuation methodology for Level 3 assets. |
Burford Capital Annual Report 2023 103
Sensitivity of Level 3 valuations
Following origination, the Group engages in a review of each capital provision asset’s fair value in connection with the preparation of the consolidated financial statements. Should the prices of the Level 3 due from settlement of capital provision assets, capital provision assets and financial liabilities relating to third-party interests in capital provision assets have been 10% higher or lower, while all other variables remained constant, the Group’s consolidated income and net assets would have increased or decreased, , by $
In addition, at December 31, 2023 and 2022, should interest rates have been
December 31, | ||||
($ in thousands) | 2023 | 2022(1) | ||
+ | ( | ( | ||
+ | ( | ( | ||
| | |||
| | |||
1. | The comparative data for December 31, 2022 in the table above has been amended to correct for immaterial differences. |
Furthermore, at December 31, 2023 and 2022, should duration have been six or
December 31, | ||||
($ in thousands) | 2023 | 2022 | ||
+ | ( | ( | ||
+ | ( | ( | ||
| | |||
| | |||
| 1. | Duration refers to the expected timing of a favorable outcome. See note 2 (Summary of significant accounting policies—Fair value of financial instruments) to the Group’s condensed consolidated financial statements for additional information with respect to the valuation methodology for Level 3 assets. |
The sensitivity impact has been provided on a pre-tax basis for both the Group’s consolidated income and net assets as the Group considers the fluctuation in its effective tax rate from period to period could indicate changes in sensitivity not driven by the valuation that are difficult to follow and detract from the comparability of this information.
Reasonably possible alternative assumptions
The determination of fair value for capital provision assets, due from settlement of capital provision assets and financial liabilities relating to third-party interests in capital provision assets involves significant judgments and estimates. While the potential range of outcomes for the assets is wide, the Group’s fair value estimation is its best assessment of the current fair value of each asset or liability, as applicable. Such estimate is inherently subjective, being based largely on an assessment of how individual events have changed the possible outcomes of the asset or liability, as applicable, and their relative probabilities and hence the extent to which the fair value has altered. The aggregate of the fair values selected falls within a wide range of reasonably possible estimates. In the Group’s opinion, there is no useful alternative valuation that would better quantify the market risk inherent in the portfolio and there are no inputs or variables to which the values of the assets are correlated other than interest rates which impact the discount rates applied.
16. Variable interest entities
Consolidated VIEs
Pursuant to US GAAP consolidation guidance, the Group consolidates certain VIEs for which it is considered the primary beneficiary, either directly or indirectly, through a consolidated entity or affiliate. See note 2 (Summary of significant accounting policies) to the Group’s consolidated financial statements for additional information with respect to the Group’s consolidation.
104 Burford Capital Annual Report 2023
Consolidated VIEs include entities relating to the Group’s private funds (e.g., BOF-C, the Advantage Fund and, prior to its liquidation in the fourth quarter of 2023, the Strategic Value Fund), investment vehicles for sale and resale of the participation interests (e.g., Colorado) and acquisition of interests in secured promissory notes (e.g., Mellor Investments LLC, formerly known as Forest Hills Investments LLC).
The purpose of the private funds is to provide strategy-specific investment opportunities for investors in exchange for management-based and performance-based fees. The investment strategies of the private funds differ by product, but the fundamental risks are similar.
Colorado is an exempted company established to receive a portion of the Group’s interest in the YPF-related Petersen claims and provide a vehicle for the sale and resale of the participation interests.
The Group, together with BCIM Partners III, LP and COLP, acquired interest in certain secured promissory notes through Mellor Investments LLC. The secured promissory notes are legal finance investments with proceeds payable out of
The Group provides revolving credit facilities to certain of its private funds for capital calls as required. These revolving credit facilities are entirely discretionary insofar as the Group is not obligated to fund under the revolving credit facilities. There were
The table below sets forth assets and liabilities of the consolidated VIEs at the dates indicated.
December 31, | ||||
($ in thousands) | 2023 | 2022 | ||
Total assets | | | ||
Total liabilities | ( | ( | ||
The table below sets forth the total revenues and certain information relating to cash flows of the consolidated VIEs for the periods indicated.
Years ended December 31, | ||||||
($ in thousands) | 2023 | 2022 | 2021 | |||
Total revenue: | | | | |||
Cash flows: | ||||||
Proceeds | | | | |||
(Funding) | ( | ( | ( | |||
Cash balance at period end | | | | |||
Unconsolidated VIEs
The Group’s maximum exposure to loss from the unconsolidated VIEs is the sum of capital provision assets, fee receivables, accrued income and loans to the unconsolidated VIEs.
The table below sets forth the Group’s maximum exposure to loss from the unconsolidated VIEs at the dates indicated.
December 31, | ||||
($ in thousands) | 2023 | 2022 | ||
On-balance sheet exposure | | | ||
Off-balance sheet exposure - undrawn commitments | | | ||
Maximum exposure to loss | |
| | |
17. Joint ventures and equity method investments
The Group holds certain of its capital provision assets through joint ventures that are accounted for at fair value through profit or loss. See note 15 (Fair value of assets and liabilities) to the Group’s consolidated financial statements for additional information with respect to the Group’s valuation of its capital provision assets.
Burford Capital Annual Report 2023 105
The table below sets forth the fair value of the Group’s interest in joint ventures and equity method investments, which are included in capital provision assets in the Group’s consolidated statements of financial position.
December 31, | ||||
($ in thousands) | 2023 | 2022 | ||
Interest in joint ventures | | | ||
Interest in equity method investments | | | ||
None of these joint ventures or equity method investments is individually material to the Group, and there are no significant restrictions on the ability of the joint ventures to make cash distributions or repayment of advances to the Group.
The table below sets forth the fair value of the Group’s share of commitments for the joint ventures and equity method investments, which are included in the commitment amounts relating to asset agreements, at the dates indicated. See note 21 (Financial commitments and contingent liabilities) to the Group’s consolidated financial statements for additional information with respect to the Group’s commitments and contingencies.
December 31, | ||||
($ in thousands) | 2023 | 2022 | ||
Commitments for joint ventures | | | ||
Commitments for equity method investments | | | ||
18. Shareholders' equity
Shareholder rights
All of the Company’s issued and outstanding ordinary shares are fully paid. Holders of the Company’s ordinary shares do not have conversion or redemption rights. There are no provisions in the Company’s memorandum of incorporation or articles of incorporation discriminating against a shareholder as a result of such shareholder’s ownership of a particular number of the Company’s ordinary shares.
Each holder of the Company’s ordinary shares who is present in person (including any corporation by its duly authorized representative) or by proxy at a general meeting will have
The Board may provide for classes of shares other than ordinary shares, including series of preferred shares. If any preferred shares are issued, the rights, preferences and privileges of the Company’s ordinary shares will be subject to, and may be adversely affected by, the rights of holders of the Company’s preferred shares.
The rights attached to any class of shares may be varied only with the consent in writing of the holders of a majority of the issued shares of such class or with the sanction of an ordinary resolution passed by a majority of the votes cast at a separate meeting of the holders of the shares of such class.
If the Company is liquidated, the liquidator may, with the authority of a special resolution, divide among the shareholders, in the form specified, the whole or any part of the Company’s assets. For such purpose, the liquidator may set the value of any assets and determine how the division will be carried out between the shareholders or different classes of shareholders.
The Company’s memorandum of incorporation and articles of incorporation do not impose limitations on the rights of persons to own the Company’s securities, including rights of non-resident or foreign shareholders to hold or exercise voting rights with respect to the Company’s securities.
There are no provisions in the Company’s memorandum of incorporation or articles of incorporation that would have the effect of delaying, deferring or preventing a change in control of the Company and that would operate only with respect to a merger, acquisition or corporate restructuring involving the Company or any of its subsidiaries.
Dividends
Dividends on the Company’s issued and outstanding ordinary shares are payable at the discretion of the Board. Each year, once the prior year’s results of operations are known, the Board reviews the Company’s revenues, net income/(loss), cash generation and cash needs and recommends a dividend level to shareholders for consideration at the Company’s annual general meeting. The Company may declare dividends by ordinary resolution at a general
106 Burford Capital Annual Report 2023
meeting in accordance with the respective rights of any class of shares. No dividend may exceed the amount recommended by the Board. Subject to the provisions of the Guernsey Companies Law, the Board may, if it thinks fit, from time to time pay interim dividends if it appears to the Board they are justified by the assets of the Company. Subject to rights which may attach to any other class of shares, holders of the Company’s ordinary shares are entitled to receive ratably all dividends, if any, that are declared. Dividends may be paid in any currency that the Board determines. The declaration and payment of dividends and distributions, if any, is subject to the discretion of the Board and the requirements of Guernsey law (including, among others, satisfaction of a statutory solvency test). The timing and amount of any dividends or distributions declared depends on, among others, the Company’s cash flows from operations and available liquidity, its results of operations and financial position and any applicable contractual restrictions. Any dividend that has not been claimed after a period of
The table below sets forth dividends and their respective record dates for the periods indicated.
($ in cents) |
| Cash dividend per ordinary share |
| Record date |
2023 year | ||||
First half | | November 10, 2023 | ||
Second half | | May 24, 2024 | ||
Total for the year ended December 31, 2023 | | |||
2022 year | ||||
First half | | November 4, 2022 | ||
Second half | | May 26, 2023 | ||
Total for the year ended December 31, 2022 | | |||
2021 year |
|
| ||
First half | | November 12, 2021 | ||
Second half | | May 27, 2022 | ||
Total for the year ended December 31, 2021 | |
Burford Capital Employee Benefit Trust
The Burford Capital Employee Benefit Trust was established for the purpose of holding the Company’s ordinary shares in connection with the LTIP. It was treated as being controlled by the Group for accounting purposes and, therefore, was consolidated. The Company’s ordinary shares held in the Burford Capital Employee Benefit Trust at the period end were included in issued and outstanding share capital and were deducted from shareholders’ equity.
Treasury shares
During the years ended December 31, 2023 and 2022, the Company purchased into treasury a total of
Issuance of ordinary shares
During the year ended December 31, 2023, the Company issued an aggregate of
Burford Capital Annual Report 2023 107
Contingent share capital
The acquisition of BCIM Holdings LLC in December 2016 included contingent equity consideration.
19. Share-based compensation
Share-based awards granted to the employees as compensation consist of RSUs with service-based and/or performance-based (which in turn may include performance-based and/or market-based) conditions and are measured based on the grant date fair value of the award. Share-based awards that do not require future service are expensed immediately. Share-based awards with service-based and performance-based conditions are expensed over the relevant service period to the extent the performance conditions are met or deemed probable. Share-based awards with service-based and market-based conditions are expensed over the relevant service period regardless of whether the market condition is met.
LTIP
In 2016, the Company’s shareholders approved the LTIP, which was amended and extended by shareholder approval on May 13, 2020. The LTIP creates alignment between participants in the LTIP and public shareholders and creates a long-term retention vehicle. All of the Group’s employees may be granted awards under the LTIP, and the Group typically makes an initial grant to each new employee and periodic grants thereafter.
The LTIP is administered by the compensation committee of the Board (the “Compensation Committee”). The Compensation Committee has discretion to select plan participants, determine the type and the number of awards and set the performance targets or adjust them in certain circumstances; provided that, in the period from 2016 to 2030, awards may not be granted under the LTIP if such grant (together with any other grant made at the same time) would cause the number of ordinary shares that have been issued or could be issued under the LTIP or any other equity-based plan adopted by the Group to exceed
Awards under the LTIP are granted in the form of RSUs, which are treated as phantom awards for tax and legal purposes. RSUs are subject to satisfaction of service-based conditions, requiring that the participant remains employed by the Group through the date of vesting, and may also require satisfaction of performance-based conditions determined by the Compensation Committee at the time of grant and including total shareholder return over different measuring periods. RSUs granted prior to January 1, 2021 included both service-based and performance-based conditions. RSUs granted on and after January 1, 2021 have continued to have service-based conditions, while at least
In the event of a participant’s termination of employment for any reason prior to vesting, other than death, disability or retirement, all outstanding RSUs will be forfeited. In the event of the participant’s death, disability, retirement or, in certain circumstances, at the discretion of the Compensation Committee (e.g., good leavers), outstanding RSUs will continue to be eligible to vest at the end of the service period and, if applicable, the performance period and may be prorated (other than in the case of retirement) based on the number of full months the participant was employed during the service and, if applicable, performance period. In special circumstances, the Compensation Committee has the discretion to accelerate vesting of awards or alter proration or performance targets for outstanding awards.
Certain awards granted under the LTIP are subject to clawback provisions in accordance with applicable law and pursuant to, and in accordance with, the Company’s clawback policy for incentive-based executive compensation (the “Clawback Policy”), effective October 2, 2023, which is intended to meet the scope of the SEC Rule 10D-1 and the associated NYSE listing exchange rules. Awards granted under the LTIP are also subject to clawback at the discretion of the Compensation Committee in accordance with the terms of the LTIP for up to five years from the vesting date in the
108 Burford Capital Annual Report 2023
following circumstances: (i) a material financial misstatement or miscalculation of the Group’s audited financial statements; (ii) the assessment of any performance-based condition on vesting which was based on error, misleading information or inaccurate assumptions; or (iii) the gross misconduct of a participant.
During the period since the LTIP’s inception through December 31, 2023, the Group has issued RSUs in respect of approximately
The table below sets forth the grant, vesting and forfeiture of RSUs for the year ended December 31, 2023 and the number of unvested RSUs at the beginning and end of the relevant period.
| Number of |
| Weighted average | ||
ordinary | grant date fair value | ||||
(Ordinary shares in thousands) | shares | per ordinary share | |||
Unvested RSUs at December 31, 2022 |
| | $ | | |
Granted(1) |
| | | ||
Vested(2) |
| ( | | ||
Forfeited |
| ( | | ||
Unvested RSUs at December 31, 2023 |
| | $ | | |
| 1. | The aggregate grant date fair value of RSUs granted during the years ended December 31, 2023, 2022 and 2021 was $ |
| 2. | The aggregate fair value of RSUs that vested during the years ended December 31, 2023, 2022 and 2021 was $ |
The Group used the Monte-Carlo model to estimate the fair value of RSUs granted during the years ended December 31, 2023, 2022 and 2021. If applicable, the Group would adjust the grant date fair value of RSUs for material nonpublic information existing at the grant date that could affect the fair value of RSUs, consistent with ASC 718 and the SEC staff guidance in SAB 120. The weighted average remaining contractual term of the unvested RSUs was
The table below sets forth the key assumptions used for valuing RSUs granted during the periods indicated.
| 2023 | 2022 | 2021 | |||
Dividend yield |
| |||||
Expected volatility |
| |||||
Risk-free interest rate |
| |||||
Expected term (years) |
| |||||
Weighted average fair value per ordinary share ($) |
| | | | ||
Weighted average price per ordinary share ($) |
| | | |
The expected volatility reflects the assumption that the historical volatility over a period similar to the life of RSUs is indicative of future trends, which may not necessarily be the actual outcome.
Deferred Compensation Plan
In 2021, the Group established the Deferred Compensation Plan, under which a specified group of employees can elect to defer a portion of their compensation until future years. Participants may elect to defer base salary, bonuses, payments under the “phantom carry pools” program and RSUs granted under the LTIP. The deferral period is a minimum of
Burford Capital Annual Report 2023 109
the individual participant when the deferral is first elected. The Deferred Compensation Plan is administered and maintained by an independent third party.
For the years ended December 31, 2023 and 2022, the Group granted
The outstanding deferred compensation liability to participants was $
20. Earnings per ordinary share
Basic earnings per ordinary share is computed by dividing net income/(loss) attributable to Burford Capital Limited shareholders by the weighted average number of ordinary shares issued and outstanding during the period. Diluted earnings per ordinary share reflects the assumed conversion of all dilutive securities, including, when applicable, RSUs. There were
The table below sets forth the computation for basic and diluted net income/(loss) attributable to Burford Capital Limited per ordinary share for the periods indicated.
Years ended December 31, | ||||||
($ in thousands, except share data) |
| 2023 |
| 2022 |
| 2021 |
Net income/(loss) attributable to Burford Capital Limited shareholders | | | ( | |||
Net income/(loss) attributable to Burford Capital Limited shareholders per ordinary share: | ||||||
Basic | | | ( | |||
Diluted | | | ( | |||
Weighted average ordinary shares outstanding: | ||||||
Basic | | | | |||
Dilutive effect of share-based awards | | | - | |||
Diluted | | | | |||
110 Burford Capital Annual Report 2023
21. Financial commitments and contingent liabilities
The table below sets forth the maturity profile of the Group’s financial liabilities based on contractual undiscounted payments at the date indicated.
December 31, 2023 | ||||||||||||
($ in thousands) | Leases | Debt payable | Debt interest payable | Other liabilities | Long-term incentive compensation payable | Financial liabilities relating to third-party interests in capital provision assets | ||||||
2024 | | - | | | - | - | ||||||
2025 | | | | | - | - | ||||||
2026 | | | | | - | - | ||||||
2027 | | - | | | - | - | ||||||
2028 | | | | | - | - | ||||||
Thereafter | | | | | - | - | ||||||
No contractual maturity date | - | - | - | | | | ||||||
Total undiscounted cash flows | | | | | | | ||||||
Lease present value adjustment | ( | |||||||||||
Lease liabilities | | |||||||||||
Commitments to financing arrangements
As a normal part of its business, the Group routinely enters into financing agreements that may require the Group to provide continuing financing over time, whereas other financing agreements provide for immediate financing of the total commitment. The terms of the former type of financing agreements vary widely—e.g., in cases of discretionary commitments, the Group is not contractually obligated to advance capital and generally would not suffer adverse financial consequences from not doing so and, therefore, has broad discretion as to each incremental financing of a continuing capital provision asset, while in cases of definitive commitments, the Group is contractually obligated to advance incremental capital and failure to do so would typically result in adverse contractual consequences (such as a dilution in the Group’s returns or the loss of the Group’s deployed capital in a case).
The Group’s commitments are capped at a fixed amount in its financing agreements. In addition, at December 31, 2023 and 2022, the Group had exposure to assets where the Group provided some form of legal risk arrangement pursuant to which the Group does not generally expect to deploy the full committed capital unless there is a failure of the claim, such as providing an indemnity for adverse legal costs. The table below sets forth the components of undrawn commitments at the dates indicated (assuming the GBP/USD exchange rate of
December 31, | ||||
($ in thousands) | 2023 | 2022 | ||
Definitive | | | ||
Discretionary | | | ||
Total legal finance undrawn commitments | | | ||
Legal risk (definitive) | | | ||
Total capital provision-direct undrawn commitments | | | ||
Capital provision-indirect undrawn commitments | | | ||
Total capital provision undrawn commitments | | | ||
Leases
Leases consist primarily of the Group’s leased office space in (i) New York, New York, United States, (ii) Chicago, Illinois, United States, (iii) Washington, DC, United States, (iv) London, United Kingdom, (v) Dubai, United Arab Emirates, (vi) Singapore, Singapore, (vii) Hong Kong, China and (viii) Sydney, Australia, which the Group has determined to be operating leases under US GAAP.
The table below sets forth the components of lease costs for the periods indicated.
Years ended December 31, | ||||||
($ in thousands) |
| 2023 |
| 2022 | 2021 | |
Operating lease cost | | | | |||
Cash paid for amounts included in the measurement of operating lease liabilities | | | | |||
Burford Capital Annual Report 2023 111
The table below sets forth right-of-use assets, lease liabilities, weighted average remaining lease term and weighted average discount rate for the operating leases at the dates indicated.
December 31, | ||||
| 2023 |
| 2022 | |
|
| | ||
Operating lease liabilities | |
| | |
Weighted average remaining lease term (years) | ||||
Weighted average discount rate | ||||
Litigation
Given the nature of the Group’s business, the Group may from time to time receive claims against it or be subject to inbound litigation. Having considered the legal merits of any relevant claims or progressed litigation and having received relevant legal advice (including any legal advice from external advisers), the Group considers there to be no material contingent liability in respect of any such litigation requiring disclosure in the consolidated financial statements.
22. Related party transactions
The Group has interests in joint ventures and equity method investments. See note 17 (Joint ventures and equity method investments) to the Group’s consolidated financial statements for additional information with respect to the balances held with joint ventures and equity method investments.
The table below sets forth the fundings and proceeds from joint ventures and equity method investments for the periods indicated.
For the years ended | ||||||
($ in thousands) | 2023 | 2022 | 2021 | |||
Fundings of joint ventures and equity method investments | | | | |||
Proceeds from joint ventures and equity method investments | | | | |||
23. Credit risk from financial instruments
The Group is exposed to credit risk in various asset structures that are set forth in note 2 (Summary of significant accounting policies) to the Group’s consolidated financial statements, most of which involve financing sums recoverable only out of successful capital provision assets with a concomitant risk of loss of deployed cost. Upon becoming contractually entitled to proceeds, depending on the structure of the particular capital provision asset, the Group could be a creditor of, and subject to direct or indirect credit risk from, a claimant, a defendant and/or other parties, or a combination thereof. Moreover, the Group may be indirectly subject to credit risk to the extent a defendant does not pay a claimant immediately, notwithstanding successful adjudication of a claim in the claimant’s favor. The Group’s credit risk is uncertain given that its entitlement pursuant to its assets is generally not established until a successful resolution of claims, and its potential credit risk is mitigated by the diversity of its counterparties and indirect creditors, and due to a judgment creditor (in contrast to a conventional debtholder and in the absence of an actual bankruptcy of the counterparty) having immediate and unfettered rights of action to, for example, seize assets and garnish cash flows. The Group is also exposed to credit risk in respect of the cash and cash equivalents and marketable securities. The credit risk of the cash and cash equivalents is mitigated as all cash is placed with reputable banks with a sound credit rating. Marketable securities primarily consist of government securities with original maturities longer than three months when purchased, investment grade corporate bonds, asset-backed securities and mutual funds, all of which can be redeemed on short notice or be sold on an active trading market.
The maximum credit risk exposure represented by cash, cash equivalents, marketable securities, due from settlement of capital provision assets and capital provision assets is specified in the consolidated statements of financial position.
In addition, the Group is exposed to credit risk on financial assets and receivables in other assets, all of which are held at amortized cost. The maximum credit exposure for such amounts was the carrying value of $
112 Burford Capital Annual Report 2023
loss relating to the financial assets held at amortized cost. The Group recognized
The Group is not exposed to concentration of credit risk from a particular region or customer.
24. Subsequent events
On January 30, 2024, Burford Capital Global Finance LLC issued $
Burford Capital Annual Report 2023 113
Governance
Directors and senior management
Directors
The Board consists of seven directors at the date of this Annual Report. Given our SEC registration and NYSE listing, we assess director independence under the applicable rules and regulations of the SEC and the listing standards of the NYSE. The Board has determined that six of our directors (other than Mr. Christopher Bogart, our Chief Executive Officer) are independent under the applicable rules and regulations of the SEC and the listing standards of the NYSE.
Our articles of incorporation do not impose a limitation on the minimum or maximum number of directors required to be on the Board, however this is subject to the Guernsey Companies Law which provides that a Guernsey company must have at least one director. Any person may be appointed or removed as director by an ordinary resolution. At each annual general meeting, all of the directors retire from the Board and may, if willing to continue to act, be elected or reelected, as applicable, to the Board at such annual general meeting. If a director is not reelected to the Board, such director retains office until another person is elected in his or her place at such annual general meeting or, if no person is elected, until the end of such annual general meeting. Directors are required to retire from the Board at the annual general meeting immediately following their 72nd birthday.
Mr. Hugh Steven Wilson, one of our original directors and the chair of the Board, is expected to continue serving as the chair of the Board until the end of the annual general meeting in 2024 and then retire. Following Mr. Hugh Steven Wilson’s expected retirement at the end of the annual general meeting in 2024 and upon Mr. John Sievwright’s reelection to the Board, Mr. John Sievwright is expected to become the chair of the Board at the annual general meeting in 2024 and to serve in that role until the annual general meeting in 2027, at which time he will retire from the Board. In addition, upon reelection, Mr. Christopher Halmy is expected to become the vice chair of the Board at the annual general meeting in 2024 and to serve in that role until the annual general meeting in 2027, at which time he is expected to become the chair of the Board.
The table below sets forth the names, ages and positions of our directors at the date of this Annual Report.
Name | Age | Position | ||
Hugh Steven Wilson | 76 | Chair | ||
Rukia Baruti | 55 | Non-Executive Director | ||
Christopher Bogart | 58 | Chief Executive Officer and Director | ||
Pamela Corrie | 66 | Non-Executive Director | ||
Robert Gillespie | 69 | Non-Executive Director | ||
Christopher Halmy | 55 | Non-Executive Director | ||
John Sievwright | 69 | Non-Executive Director |
 Hugh Steven Wilson, Chair of the Board Mr. Wilson spent more than 30 years at Latham & Watkins, one of the world’s largest law firms, where he was Co-Head of Latham & Watkins' Global Mergers and Acquisitions Practice Group and Chairman of the national Litigation Department and the Mergers and Acquisitions Litigation Practice Group. He then joined Tennenbaum Capital Partners, a US-based private investment business, as Managing Partner and served as the Chief Executive Officer of multiple registered investment funds managed by Tennenbaum Capital Partners. After his retirement, Mr. Wilson continued to serve as a Senior Adviser to Tennenbaum Capital Partners through its acquisition by BlackRock. Mr. Wilson has served as the chairman of the boards of directors and a director of numerous public and private companies. Mr. Wilson also serves as the chair of Burford Capital Holdings (UK) Limited, one of our principal subsidiaries, to ensure non-executive oversight. Mr. Wilson holds a BA from Indiana University, a JD from the University of Chicago Law School and a Master of Laws degree from Harvard Law School. Mr. Wilson has served as a director on the Board since 2009. |
Burford Capital Annual Report 2023 114
 Rukia Baruti, Non-Executive Director Dr. Baruti is an experienced independent arbitrator and is a qualified solicitor in England and Wales. She serves as an Advisory Board Member of the Tanzania International Arbitration Centre. Her career began in commercial law in the City of London in 1997. In 2006, she joined the international arbitration group at SJ Berwin LLP (later merged with King & Wood Mallesons), where she practiced arbitration and litigation until 2010. In 2011, Dr. Baruti founded the Africa International Legal Awareness, a non-profit organization dedicated to advancing African involvement in the international legal community, where she was a managing director until 2018. She also co-founded the African Arbitration Association, a non-profit organization dedicated to promotion of African arbitration practitioners, where she served as Secretary General from 2018 to 2022. Dr. Baruti holds a bachelor’s degree in international studies from Birkbeck College, University of London, an MA in diplomatic studies and international law from the University of Westminster and a Ph.D. from the University of Geneva. Dr. Baruti has served as a director on the Board since August 2022. |
See “—Senior management” for biographical information relating to Christopher Bogart, our Chief Executive Officer. |
 Pamela Corrie, Non-Executive Director Ms. Corrie has significant experience at the nexus of finance and law. She was most recently a Managing Director in the Financial Advisory division of Carl Marks Advisors, focused on restructuring matters from 2018 to 2023. For 12 years, she was a General Counsel at GE Capital Americas, where she served as the chief legal advisor to the risk organization in the corporate leasing and lending division and oversaw hundreds of restructurings, corporate ombudsman investigations, bankruptcies and litigations. She previously spent ten years practicing law at Weil, Gotshal & Manges, where she represented large corporate debtors in Chapter 11 proceedings as well as clients in all phases of restructuring, bankruptcy counseling and litigation. Ms. Corrie serves as a member of the board of directors of BC Parent Holdings LLC, a direct-to-consumer company that sells skin care and cosmetic products, and as a member of the board of directors of Joann Inc., the nation’s category leader in sewing and fabrics, to which she was appointed in her capacity as a restructuring professional. In addition, she serves as a member of the board of directors, the chair of the nominating and governance committee and a member of the audit, compensation and special committees of IFit Health and Fitness Inc., a global health and fitness platform. She also serves as a member of the board of directors and a member of the special committee of AIG Financial Products, to which she was appointed in her capacity as a restructuring professional. Ms. Corrie has previously served on the boards of directors of numerous companies, primarily in her capacity as a restructuring professional. Ms. Corrie has a bachelor’s degree from Stanford University and earned her JD from the University of California, Los Angeles. Ms. Corrie has served as a director on the Board since January 2024. |
 Robert Gillespie, Non-Executive Director Mr. Gillespie had a lengthy career as an investment banker, spending more than 25 years at UBS and its predecessors in a range of senior positions, including Vice Chairman, Chief Executive Officer, EMEA and Joint Global Head of Investment Banking, while also serving on the Group Managing Board and the Management Committee for many years. Mr. Gillespie started his career as a Chartered Accountant at PwC. Mr. Gillespie is the current Chairman of the UK Export Finance Board and also serves as the chair of the board of directors of Spirit Yacht Holdings Ltd. He has previously served as a director of NatWest Group plc (formerly known as Royal Bank of Scotland plc) and certain of its principal subsidiary companies and was a member of NatWest Group plc’s audit and risk committees. In addition, Mr. Gillespie also served as the Director General of the UK Takeover Panel, a director of Citizens Financial Group Inc. and Ashurst LLP, a law firm, and as the chair of the board of directors of Boat Race Company Ltd., Somerset House Trust and the Council of Durham University, from which he graduated with a degree in economics. Mr. Gillespie has served as a director on the Board since May 2020. |
Burford Capital Annual Report 2023 115
 Christopher Halmy, Non-Executive Director Mr. Halmy was most recently the Chief Financial Officer of Ally Financial Inc. (NYSE: ALLY), where he led the multinational initial public offering for the company and was responsible for Ally Financial Inc.’s $25 billion investment portfolio. Before that, Mr. Halmy worked in various finance, accounting and treasury roles at JP Morgan, Bank of America and MBNA. He began his career as an auditor at Deloitte. Mr. Halmy also serves as the non-executive chair of the board of directors and the chair of the audit committee of Mercury® Financial LLC. He has previously served as a non-executive director of Mosaic Sustainable Finance Corp. and a non-executive director of Spectrum Automotive Holdings Corporation prior to its sale in 2021. Mr. Halmy earned his MBA and undergraduate degrees from Villanova University, where he currently serves as a member of the Provost Advisory Board, and is a Certified Public Accountant. Mr. Halmy has served as a director on the Board since May 2022. |
 John Sievwright, Non-Executive Director Mr. Sievwright is the former Chief Operating Officer, International, of Merrill Lynch. Mr. Sievwright had a 20-year career with Merrill Lynch with a range of global leadership positions, including Chief Operating Officer, Global Markets and Investment Banking; President and Chief Operating Officer, Merrill Lynch Japan; and Head of Global Futures and Options (during which time he also served as the President of the Futures Industry Association). Prior to Merrill Lynch, Mr. Sievwright held finance and accounting functions at Bankers Trust and the Bank of Tokyo. He began his career as an auditor at Ernst & Young and qualified as a Chartered Accountant. He has an MA in accountancy and economics from the University of Aberdeen. Mr. Sievwright also serves as a trustee and the chair of the audit committee for several Abrdn closed end funds and an Abrdn open end fund and as a non-executive director and the chair of the risk committee of Revolut, a financial services company. He is also the chair of the board of directors of Buyside Trading Solutions, a financial services company. Mr. Sievwright has previously served as the senior independent director and the chair of the audit and risk committee at ICAP plc (now NEX Group plc) and the senior independent director and the chair of the audit committee of FirstGroup plc. Mr. Sievwright has served as a director on the Board since May 2020. |
Senior management
The table below sets forth the names, ages and positions of the members of the Management Committee at the date of this Annual Report.
Name | Age | Position | ||
Craig Arnott | 57 | Deputy Chief Investment Officer | ||
Christopher Bogart | 58 | Chief Executive Officer | ||
Mark Klein | 56 | Chief Administrative Officer and General Counsel | ||
Jordan Licht | 46 | Chief Financial Officer | ||
Jonathan Molot | 57 | Chief Investment Officer | ||
Elizabeth O’Connell | 57 | Chief Strategy Officer | ||
David Perla | 54 | Co-Chief Operating Officer | ||
Aviva Will | 55 | Co-Chief Operating Officer |
 Craig Arnott, Deputy Chief Investment Officer Prior to joining Burford in August 2016, Mr. Arnott was a barrister at Sixth Floor Selborne and Wentworth Chambers in Sydney. Previously, he was a Partner and Head of Competition/Antitrust Law in London at the international law firm Fried Frank. During his time at Fried Frank, Mr. Arnott oversaw many significant transactions, serving as counsel to the pharmaceuticals company Merck in its acquisition of Schering-Plough and as European Counsel to Delta & Pine Land in its acquisition by The Monsanto Company. Before his time at Fried Frank, Mr. Arnott worked at Cravath, Swaine & Moore in New York, Gilbert + Tobin in Sydney and Ashurst in London. Mr. Arnott earned his BCL and DPhil from the University of Oxford, where he is an alumnus of Balliol College and a Rhodes Scholar. He graduated from the University of Queensland with First Class Honours in both his Law and Arts degrees, with the University Medals in both. He clerked for the Honorable W. Pincus of the Federal Court of Australia. |
116 Burford Capital Annual Report 2023
 Christopher Bogart, Chief Executive Officer Before co-founding Burford, Mr. Bogart held numerous senior executive positions with Time Warner: Executive Vice President and General Counsel of Time Warner Inc.; Chief Executive Officer of Time Warner Cable Ventures; and Chief Executive Officer of Time Warner Entertainment Ventures. Mr. Bogart came to Time Warner from Cravath, Swaine & Moore, where he was a litigator representing companies such as IBM, General Electric and Time Warner. He has also served as Chief Executive Officer of Glenavy Capital LLC, an international investment firm whose projects included Churchill Ventures, a publicly traded media and technology investment vehicle of which he also served as Chief Executive Officer, as well as Glenavy Arbitration Investment Fund, a pioneering litigation finance vehicle. He began his professional career as an investment banker with what is now JPMorgan Chase. Mr. Bogart earned his law degree with distinction from the Faculty of Law of the University of Western Ontario, where he was the gold medalist. He clerked for the Chief Justice of Ontario. Mr. Bogart has been married to Ms. Elizabeth O’Connell, Burford’s Chief Strategy Officer, since 1992. Mr. Bogart has served as a director on the Board since May 2020. |
 Mark Klein, General Counsel and Chief Administrative Officer Prior to joining Burford in September 2017, Mr. Klein spent 13 years at UBS in a wide range of corporate roles, including as Managing Director and General Counsel of its infrastructure and private equity funds and funds of funds business. Most recently, he was General Counsel and Chief Compliance Officer at Marketfield Asset Management, a large US-registered investment adviser. Prior to that, Mr. Klein was General Counsel and Chief Compliance Officer at NewGlobe Capital, a registered investment adviser. Mr. Klein began his career at Weil, Gotshal & Manges. Mr. Klein earned his JD from New York University School of Law. |
 Jordan Licht, Chief Financial Officer Prior to joining Burford in September 2022, Mr. Licht was most recently the Chief Operating Officer of both Caliber Home Loans and Newrez LLC, two multi-billion-dollar mortgage businesses that combined under the Rithm banner (NYSE: RITM). Prior to the combination, Mr. Licht held a series of finance and operating roles at Caliber, including as Deputy Chief Financial Officer. Previously, he spent a decade at Morgan Stanley in financial services investment banking. Before his investment banking career, Mr. Licht spent six years as a management consultant at Diamond Consulting (now PricewaterhouseCoopers). Mr. Licht earned his MBA from Columbia Business School and his BA from the University of Pennsylvania. |
 Jonathan Molot, Chief Investment Officer Prior to co-founding Burford in October 2009, Mr. Molot founded Litigation Risk Solutions, a business that assisted hedge funds, private equity funds, investment banks, insurance companies and insurance brokers to develop litigation risk transfers where lawsuits threaten to interfere with M&A and private equity deals. In addition to his role at Burford, Mr. Molot is a Professor of Law at Georgetown University. Mr. Molot has also taught courses on litigation risk management and finance at Harvard Law School, Georgetown University Law Center and George Washington University Law School. Mr. Molot served as counsel to the economic policy team on the Obama-Biden Presidential Transition Team and as senior advisor in the Department of the Treasury at the start of the Obama Administration. He practiced law at Cleary Gottlieb in New York and at Kellogg Hansen in Washington, D.C. Mr. Molot earned his BA magna cum laude from Yale College and his JD magna cum laude from Harvard Law School, where he was Articles Co-Chair of the Harvard Law Review and won the Sears Prize, awarded to the two top-performing students in a class of over 500. He clerked for US Supreme Court Justice Stephen Breyer. |
Burford Capital Annual Report 2023 117
 Elizabeth O’Connell CFA, Chief Strategy Officer One of Burford’s founders, Ms. O’Connell assumed the role of Chief Strategy Officer in August 2019, having previously served as Chief Financial Officer and as a Managing Director responsible for overseeing the company’s finance function and investor relations. Prior to founding Burford, Ms. O’Connell was a Managing Director and Chief Financial Officer of Glenavy Capital, an international investment firm. Ms. O’Connell was also Chief Financial Officer of Churchill Ventures Limited, a technology and media company listed on NYSE American (formerly known as the American Stock Exchange). Earlier in her career, Ms. O’Connell was a senior Equity Syndicate Director at Credit Suisse. Before that, she spent the bulk of her investment banking career at Salomon Brothers (later Citigroup). She began her finance career in foreign exchange sales at Bank of America. Ms. O’Connell is a Chartered Financial Analyst. Ms. O’Connell earned her MBA in finance from the University of Western Ontario Richard Ivey School of Business and her BA from the University of Western Ontario. Ms. O’Connell has been married to Christopher Bogart, Burford’s Chief Executive Officer, since 1992. |
 David Perla, Co-Chief Operating Officer Prior to joining Burford in May 2018, Mr. Perla served as President of Bloomberg BNA Legal Division / Bloomberg Law, where he oversaw Bloomberg BNA’s legal and related products, including its flagship Bloomberg Law enterprise legal news, information and tools platform. Previously, Mr. Perla co-founded and was co-Chief Executive Officer and a director of Pangea3, the top-ranked global legal process outsourcing provider. Pangea3 was acquired by Thomson Reuters in 2010 and grew to over 1,000 employees globally under Mr. Perla’s leadership. Before launching Pangea3, he was Vice President of Business & Legal Affairs for Monster.com. Mr. Perla began his career in the New York office of Katten Muchin. Mr. Perla earned both his BA and JD degrees from the University of Pennsylvania. |
 Aviva Will, Co-Chief Operating Officer Prior to joining Burford in March 2010, Ms. Will was a senior litigation manager and Assistant General Counsel at Time Warner Inc., where she managed a portfolio of significant antitrust, intellectual property and complex commercial litigation. She was also the company’s leading antitrust and regulatory counsel, advising senior management on antitrust risk and overseeing all government antitrust investigations and merger clearances worldwide. Ms. Will also served as the Assistant Secretary for the company, managing corporate compliance and governance for the company and the board of directors. Prior to joining Time Warner Inc., Ms. Will was a senior litigator at Cravath, Swaine & Moore. Ms. Will earned her JD cum laude from Fordham University School of Law, where she was the Writing & Research Editor of the Fordham Law Review and a member of the Order of the Coif. She earned her BA from Columbia University. She clerked for the Honorable Stewart G. Pollock on the New Jersey Supreme Court. |
Corporate governance
Overview
The Board holds an in-person meeting every quarter during which it reviews thoroughly all aspects of the businesses’ strategy and performance. The directors spend at least one evening and one full day together for each meeting of the Board. During the year ended December 31, 2023, the Board held all four of its quarterly meetings in person, and all directors attended every meeting of the Board for which they were eligible. The Board is supported by the Company Secretary, who assists the Board in addressing corporate governance issues. Our Chief Executive Officer and our Chief Investment Officer participated in the entirety of each meeting of the Board (other than the closed sessions discussed below), joined as appropriate by other members of senior management. The Board evaluates its performance and reviews director compensation annually and regularly discusses succession planning and management oversight. The Board meets in closed session without management present at each of its meetings. In addition to chairing the Board, Mr. Hugh Steven Wilson also chairs the board of directors of Burford Capital Holdings (UK) Limited, one of our principal subsidiaries, to ensure non-executive oversight.
At its quarterly meetings, the Board is presented with materials so it can meaningfully assess the businesses’ performance, measure the impact of the businesses’ strategy and evaluate the businesses’ position. We have a significant professional finance function that provides detailed management reporting and prepares consolidated financial statements in accordance with US GAAP. In addition, the Board is in regular contact with Ernst & Young LLP,
118 Burford Capital Annual Report 2023
our independent registered public accounting firm. The Board has ultimate responsibility for our objectives and business plans.
The Board is responsible for overseeing timely and balanced disclosure and reporting pursuant to applicable obligations. The Board’s general practice is to publicly disclose materials that are relevant to our performance whenever necessary or practical and in compliance with any applicable rules and regulations. The Board provides the annual general meeting as a forum for shareholders to exercise their rights as well as supervises a robust investor relations program.
The Board delegates oversight of our risk management to the Audit Committee. At each of its quarterly meetings, members of the Audit Committee receive a comprehensive risk presentation and review the key risks across the global business focusing, among other things, on the risks relating to information systems security, liquidity, financial reporting and compliance. In addition, the Nominating and Governance Committee is responsible for considering the impact of climate change on our business strategy and risk profile. We have a robust management team focused on risk, including our General Counsel, our Chief Compliance Officer and a number of other in-house lawyers. In addition, dozens of our professional staff are lawyers, including many of the most senior members of our management. Our Deputy General Counsel and a senior director from the finance team co-lead the business risk function, with our General Counsel maintaining oversight of the work the business risk function carries out.
Our directors are experienced and collectively well-versed in the legislative and regulatory environment in which we operate. They are provided with relevant information in a timely manner and kept abreast of relevant developments so that they can discharge their duties effectively. The Board has overall responsibility for our governance, strategy, risk management and key policies and engages in robust scrutiny of the business and our portfolio. The Board evaluates its own performance annually and regularly discusses improvements to its structure and processes. The Board is subject to our various integrity policies, including with respect to conflicts of interest, self-dealing and fiduciary duties. The Board is well-versed in its fiduciary responsibilities to act in our best interests. Any directors’ interests are disclosed at each quarterly meeting of the Board, and additional declarations are made as may be applicable during each other meeting of the Board.
Performance
The Board is responsible for our corporate governance. In order to progress our objectives, the Board meets regularly and is responsible for organizing and directing us in a way that promotes our success. The principal matters considered by the Board during the year ended December 31, 2023 included, among others:
| ▪ | Strategy, objectives and business plans and related performance measures |
| ▪ | Reports and updates on our businesses and functions |
| ▪ | Reports and updates on our portfolio and individual legal finance assets |
| ▪ | Annual and quarterly reports and corresponding consolidated financial statements and other ad hoc updates |
| ▪ | Annual budgeting process |
| ▪ | Capital management strategy, dividend policy and dividends |
| ▪ | Enterprise capability and individual succession plans |
| ▪ | Regular reports on business risks and risk controls testing |
| ▪ | Compensation and retirement matters, including awards |
| ▪ | Regular reports from our Chief Executive Officer and our Chief Financial Officer |
| ▪ | Regular reports from the committees of the Board |
We have an established organizational structure with clearly defined lines of responsibility to, and delegation of authority by, the Board.
Committees of the Board
The Board also operates through three committees composed entirely of independent directors, the Audit Committee, the Compensation Committee and the Nominating and Governance Committee, all of which meet throughout the year as required.
Burford Capital Annual Report 2023 119
Audit Committee
At the date of this Annual Report, the Audit Committee is comprised of Mr. Christopher Halmy (chair), Ms. Pamela Corrie, Mr. Robert Gillespie and Mr. John Sievwright. Mr. Christopher Halmy is expected to continue to serve in the role of the chair of the Audit Committee until the annual general meeting in 2027, at which time he is expected to leave the Audit Committee to assume the role of the chair of the Board. The Board has determined that each member of the Audit Committee meets the definition of “independent director” for purposes of serving on an audit committee under the applicable rules and regulations of the SEC and the listing standards of the NYSE. Each member of the Audit Committee is financially literate, and the Board has determined that each of Ms. Pamela Corrie, Mr. Christopher Halmy, Mr. Robert Gillespie and Mr. John Sievwright qualifies as an “audit committee financial expert”, as defined in the applicable rules and regulations of the SEC.
The Audit Committee is responsible for, among others:
| ▪ | Monitoring the integrity of our financial statements |
| ▪ | Reviewing the effectiveness of our internal controls and risk management systems and reviewing and approving the statements to be included in the annual report concerning internal controls and risk management |
| ▪ | Reviewing our arrangements for concerns to be raised, in confidence, about possible wrongdoing in financial reporting or other matters and reviewing our procedures for detecting fraud |
| ▪ | Reviewing and advising the Board on the need for an internal audit function |
| ▪ | Considering and making recommendations to the Board relating to the appointment, re-appointment and removal of our external auditor, including evaluating our external auditor’s qualifications and independence |
| ▪ | Overseeing the relationship with our external auditor, including evaluating and approving their remuneration and terms of engagement, assessing their independence and objectivity, monitoring our external auditor’s compliance with relevant ethical and professional guidance on the rotation of audit partners and other related requirements and assessing our external auditor’s qualifications, expertise and resources and the effectiveness of the audit process |
| ▪ | Meeting regularly with our external auditor, including at least once a year without senior management present, and reviewing the findings of the audit with our external auditor |
| ▪ | Developing and implementing a policy on the supply of non-audit services by our external auditor |
Compensation Committee
At the date of this Annual Report, the Compensation Committee is comprised of Mr. John Sievwright (chair), Dr. Rukia Baruti and Mr. Hugh Steven Wilson. Mr. John Sievwright is expected to continue to serve in the role of the chair of the Compensation Committee until the annual general meeting in 2027, at which time Mr. Christopher Halmy is expected to assume the role of the chair of the Compensation Committee. The Board has determined that each member of the Compensation Committee meets the definition of “independent director” for purposes of serving on a compensation committee under the applicable rules and regulations of the SEC and the listing standards of the NYSE.
The Compensation Committee is responsible for, among others:
| ▪ | Reviewing and approving the compensation of our Chief Executive Officer and our Chief Investment Officer and, as necessary and appropriate, reviewing and approving employment agreements for our Chief Executive Officer and our Chief Investment Officer |
| ▪ | Reviewing and approving the compensation of the members of the Management Committee other than our Chief Executive Officer and our Chief Investment Officer, including salary, bonuses, equity-based awards, material perquisites and any other compensation |
| ▪ | Determining the broad compensation policy or framework for all of our employees and periodically reviewing the ongoing appropriateness and relevance of such compensation policy or framework |
| ▪ | Approving the design of, and determining targets for, any performance-related pay schemes operated by us and approving the total annual payments made under such schemes |
| ▪ | Reviewing periodically the design of all share incentive plans |
120 Burford Capital Annual Report 2023
| ▪ | Determining the policy for, and the scope of, any pension arrangements |
| ▪ | Overseeing succession planning for key positions in the senior management team |
Nominating and Governance Committee
At the date of this Annual Report, the Nominating and Governance Committee is comprised of Mr. Hugh Steven Wilson (chair), Dr. Rukia Baruti, Ms. Pamela Corrie and Mr. Robert Gillespie. Following Mr. Hugh Steven Wilson’s expected retirement at the end of the annual general meeting in 2024 and upon Mr. Robert Gillespie’s reelection, Mr. Robert Gillespie is expected to become the chair of the Nominating and Governance Committee and, following Mr. Robert Gillespie’s expected retirement at the end of the annual general meeting in 2027, Dr. Rukia Baruti is expected to become the chair of the Nominating and Governance Committee. The Board has determined that each member of the Nominating and Governance Committee meets the definition of “independent director” for purposes of serving on a nominating and governance committee under the applicable rules and regulations of the SEC and the listing standards of the NYSE.
The Nominating and Governance Committee is responsible for, among others:
| ▪ | Regularly reviewing the structure, size and composition of the Board and making recommendations to the Board with respect to any changes |
| ▪ | Identifying and nominating for the approval of the Board candidates to fill vacancies on the Board as and when they arise |
| ▪ | Reviewing the results of the Board’s performance evaluation process that relate to the composition of the Board |
| ▪ | Assisting the Board in its oversight of our management in defining and implementing our strategy relating to ESG matters |
| ▪ | Making recommendations to the Board concerning formulating plans for succession for non-executive directors, in particular for the key role of the chair of the Board |
| ▪ | Making recommendations to the Board concerning membership of the Audit Committee, the Compensation Committee and any other committees of the Board as appropriate, in consultation with the chairs of those committees |
| ▪ | Making recommendations to the Board concerning the re-appointment of any non-executive director and any matters relating to the continuation in office of any director at any time |
| ▪ | Making recommendations to the Board concerning changes to our corporate governance framework and the delegation of authority and authority levels in light of best practices |
Corporate governance documents
We have adopted a number of key documents set forth below relating to our corporate governance. These documents and other important information on our corporate governance are posted on our website and may be viewed at investors.burfordcapital.com. Shareholders may direct their requests to the attention of our Investor Relations team at ir@burfordcapital.com. The information on, or that can be accessed through, our website is not incorporated by reference into, and does not form a part of, this Annual Report.
Guernsey Code of Corporate Governance
We have adopted the Finance Sector Code of Corporate Governance issued by the Guernsey Financial Services Commission, as amended from time to time (the “Guernsey Code of Corporate Governance”), and our compliance has been the subject of regular reporting to, and oversight by, the Board. Our adoption of the Guernsey Code of Corporate Governance is current at February 14, 2024 and is reviewed as part of our annual reporting process. There are no material departures from our obligations under the Guernsey Code of Corporate Governance.
Code of ethics
In addition to our code of ethics that is part of our compliance manual, which is applicable to all of our employees, we have adopted the Ethical Conduct Code for Senior Financial Officers that imposes additional obligations on our principal executive officer, principal financial officer, principal accounting officer and persons performing similar functions. The Ethical Conduct Code for Senior Financial Officers is posted on our website and may be viewed at
Burford Capital Annual Report 2023 121
investors.burfordcapital.com. We intend to disclose on our website any amendments to, or waivers from, a provision of the Ethical Conduct Code for Senior Financial Officers to the extent required under the applicable rules and regulations of the SEC and the listing standards of the NYSE.
Committee charters
Each of the Audit Committee, the Compensation Committee and the Nominating and Governance Committee has adopted a written charter governing the respective committee. Each of the charters is posted on our website and may be viewed at investors.burfordcapital.com.
Exemptions from NYSE corporate governance rules
We are currently a “foreign private issuer” under the securities laws of the United States and the rules of the NYSE. Under the securities laws of the United States, “foreign private issuers” are subject to different disclosure requirements than US-domiciled registrants, as well as different financial reporting requirements. Subject to certain exceptions, the rules of the NYSE permit a “foreign private issuer” to follow its home country practice in lieu of the corporate governance requirements of the NYSE. We are not required to, and do not meet, the following NYSE corporate governance requirements: (i) the requirement to adopt and disclose corporate governance guidelines; and (ii) the requirement to have an internal audit function. Depending on whether the majority of our ordinary shares will be held in the United States at June 30, 2024, we may lose our status as a “foreign private issuer” as soon as the beginning of 2025 and will thereafter be subject to the same disclosure and financial reporting requirements as US domestic public companies and will no longer be permitted to follow our home country practice in lieu of the corporate governance requirements of the NYSE.
122 Burford Capital Annual Report 2023
Compensation
Director compensation
For the year ended December 31, 2023, our independent non-executive directors received cash fees and grants of our ordinary shares under the Burford Capital Limited 2021 Non-Employee Directors’ Share Plan (the “NED Plan”) for his or her service on the Board and the committees of the Board, with additional compensation for their service on the boards of directors of our subsidiaries. The cash fees are paid quarterly in arrears, prorated for any partial period and converted into a director’s local currency at the exchange rate on the date of payment. The grants of our ordinary shares under the NED Plan were made on June 29, 2023. No director (other than Mr. Christopher Bogart, our Chief Executive Officer) has an employment agreement or is entitled to any benefits upon retirement or termination of service on the Board.
The table below sets forth the cash fees paid and our ordinary shares granted under the NED Plan to each of our directors as compensation for their service on the Board and the committees of the Board for the year ended December 31, 2023.
| Year ended December 31, 2023 | ||||
($ in thousands) | Cash fees(1) | Ordinary shares | |||
Hugh Steven Wilson(2) | 170 | 6,204 | (3) | ||
Rukia Baruti | 90 | 2,492 | |||
Christopher Bogart(4) | - | - | |||
Robert Gillespie | 90 | 2,492 | (5) | ||
Christopher Halmy | 90 | 2,482 | (3) | ||
Andrea Muller(6) | 46 | 1,241 | (3) | ||
Charles Parkinson(2),(6) | 62 | - | |||
John Sievwright | 90 | 2,492 | (5) | ||
Total | 638 | 17,403 | |||
1. | Based on the average GBP/USD exchange rate of 1.2512 at December 31, 2023. |
2. | Includes fees for service on the boards of directors of our subsidiaries – Burford Capital Holdings (UK) Limited for Mr. Hugh Steven Wilson and Burford Worldwide Insurance Limited for Mr. Charles Parkinson. |
3. | Based on the average of the closing prices per ordinary share on June 26, 27 and 28, 2023 on the NYSE of $12.09. |
4. | Mr. Christopher Bogart does not receive compensation for his service on the Board in addition to his compensation as our Chief Executive Officer. |
5. | Based on the average of the closing prices per ordinary share on June 26, 27 and 28, 2023 on AIM of £9.49. |
6. | Ms. Andrea Muller and Mr. Charles Parkinson each retired from the Board at the end of the annual general meeting held on July 5, 2023. Ms. Andrea Muller chose to receive a grant of our ordinary shares, and Ms. Andrea Muller’s cash fees and grant of our ordinary shares were prorated through July 5, 2023. Mr. Charles Parkinson chose to receive cash in lieu of a grant of our ordinary shares, and Mr. Charles Parkinson’s cash fees were prorated through July 5, 2023. |
Senior management and employee compensation
Our compensation programs are designed to incentivize performance and retention. For many of our employees, the primary forms of compensation are base salaries and performance-based annual bonuses. The more senior an employee, the more his or her compensation reflects corporate performance. This compensation mix in part reflects the origins of our team members, who typically hail from law firms and financial firms that also use this compensation approach. Most of our employees also participate in the LTIP and the retirement plans. In addition, we offer certain employees, depending on function and compensation level, participation in our “carry pools” program and the Deferred Compensation Plan as well as offer all eligible employees the ability to invest in our private funds on a fee-less basis.
At March 14, 2024, our employees (including members of our senior management) held an aggregate of 21,018,482 ordinary shares and an aggregate of 4,621,436 unvested RSUs. See “—Holdings and commitments to private funds of directors and senior management—Senior management” for holdings of our ordinary shares by members of our senior management.
LTIP
In 2016, our shareholders approved the LTIP, which was amended and extended by shareholder approval on May 13, 2020. The LTIP creates alignment between participants in the LTIP and public shareholders and creates a long-term retention vehicle. All of our employees may be granted awards under the LTIP, and we typically make an initial grant to each new employee and periodic grants thereafter.
The LTIP is administered by the Compensation Committee. The Compensation Committee has discretion to select plan participants, determine the type and the number of awards and set the performance targets or adjust them in certain circumstances; provided that, in the period from 2016 to 2030, awards may not be granted under the LTIP if such grant (together with any other grant made at the same time) would cause the number of ordinary shares that have been
Burford Capital Annual Report 2023 123
issued or could be issued under the LTIP or any other equity-based plan adopted by us to exceed 10% of our issued ordinary share capital at the proposed date of grant. The settlement of awards granted under the LTIP through shares purchased on the open market is treated as an issuance of ordinary shares for the purposes of the above limit for so long as institutional shareholder guidelines recommend this. If awards are satisfied through a transfer of existing ordinary shares, the percentage limit stated above will not apply.
Awards under the LTIP are granted in the form of RSUs, which are treated as phantom awards for tax and legal purposes. RSUs are subject to satisfaction of service-based conditions, requiring that the participant remains employed by us through the date of vesting, and may also require satisfaction of performance-based conditions determined by the Compensation Committee at the time of grant and including total shareholder return over different measuring periods. RSUs granted prior to January 1, 2021 included both service-based and performance-based conditions. RSUs granted on and after January 1, 2021 have continued to have service-based conditions, while at least 50% of RSUs granted to our senior management must also have a performance-based condition. RSUs generally vest in full on the third anniversary of the grant date, and each performance-based condition (as applicable) is measured over the three individual financial years beginning with the financial year in which the relevant RSUs were granted as well as over the entire three financial years as a whole.
In the event of a participant’s termination of employment for any reason prior to vesting, other than death, disability or retirement, all outstanding RSUs will be forfeited. In the event of the participant’s death, disability, retirement or, in certain circumstances, at the discretion of the Compensation Committee (e.g., good leavers), outstanding RSUs will continue to be eligible to vest at the end of the service period and, if applicable, the performance period and may be prorated (other than in the case of retirement) based on the number of full months the participant was employed during the service and, if applicable, performance period. In special circumstances, the Compensation Committee has the discretion to accelerate vesting of awards or alter proration or performance targets for outstanding awards.
Certain awards granted under the LTIP are subject to clawback provisions in accordance with applicable law and pursuant to, and in accordance with, the Clawback Policy, which is intended to meet the scope of the SEC Rule 10D-1 and the associated NYSE listing exchange rules. Awards granted under the LTIP are also subject to clawback at the discretion of the Compensation Committee in accordance with the terms of the LTIP for up to five years from the vesting date in the following circumstances: (i) a material financial misstatement or miscalculation of our audited financial statements; (ii) the assessment of any performance-based condition on vesting which was based on error, misleading information or inaccurate assumptions; or (iii) the gross misconduct of a participant.
During the period since the LTIP’s inception through December 31, 2023, we have issued RSUs in respect of approximately 3.7% of our issued and outstanding ordinary share capital and, at December 31, 2023, there was a total of approximately 8.2 million RSUs issued under the LTIP since its inception. RSUs may be satisfied with newly issued ordinary shares, a transfer of treasury shares or ordinary shares purchased on the open market. In connection with the vesting of RSUs during the year ended December 31, 2023, we purchased 261,000 ordinary shares on the open market. See “Purchases of equity securities by the issuer and affiliated purchasers” for additional information with respect to our purchases of ordinary shares. At December 31, 2023, approximately 14.4 million ordinary shares remained available for future grants under the LTIP through 2030.
The table below sets forth the grant, vesting and forfeiture of RSUs for the year ended December 31, 2023, the number of unvested RSUs at the beginning and end of the relevant period and the number of RSUs scheduled to vest during the year ending December 31, 2024.
| Number of |
| Weighted average | ||
ordinary | grant date fair value | ||||
(Ordinary shares in thousands) | shares | per ordinary share | |||
Unvested RSUs at December 31, 2022 |
| 4,707 | $ | 7.15 | |
Granted(1) |
| 1,727 | 6.89 | ||
Vested(2) |
| (1,654) | 4.15 | ||
Forfeited |
| (108) | 8.43 | ||
Unvested RSUs at December 31, 2023 |
| 4,672 | $ | 8.09 | |
RSUs scheduled to vest during the year ending December 31, 2024 | 1,693 | $ | 8.67 | ||
1. | The aggregate grant date fair value of RSUs granted during the years ended December 31, 2023, 2022 and 2021 was $11.9 million, $12.2 million and $16.6 million, respectively. The associated weighted average grant date fair value per ordinary share for RSUs granted during the years ended December 31, 2023, 2022 and 2021 was $6.89, $8.90 and $8.74, respectively. |
2. | The aggregate fair value of RSUs that vested during the years ended December 31, 2023, 2022 and 2021 was $6.9 million, $9.9 million and $2.5 million, respectively. |
124 Burford Capital Annual Report 2023
“Phantom carry pools” program
We operate a “phantom carry pool” program for certain eligible employees, which is designed to provide such employees with direct alignment to the cash performance of our assets. Payments under the “phantom carry pool” program are awarded on a vintage year basis. Accordingly, each year, we award eligible employees the right to receive a portion of the realized cash gains generated over time by the assets for which financing was originated during such vintage year. In each subsequent year, we determine the realized performance of all of the assets for such vintage year and make payments under the “phantom carry pool” program based on their collective performance in such year, so that realized losses offset realized gains. Payments under the “phantom carry pool” program continue until each vintage year is fully resolved and are treated as compensation.
Deferred Compensation Plan
In 2021, we established the Deferred Compensation Plan, under which a specified group of employees can elect to defer a portion of their compensation until future years. Participants may elect to defer base salary, bonuses, payments under the “phantom carry pools” program and RSUs granted under the LTIP. The deferral period is a minimum of three years (five years following grant in the case of RSUs granted under the LTIP), and deferral distributions may be elected to be received in a lump sum or in annual installments. During the deferral period, the participant elects for their deferral account to be notionally invested in various mutual funds or our ordinary shares. In addition, we may in our sole discretion make a matching contribution to the participant’s deferral account to the extent cash deferrals are notionally invested in our ordinary shares. The matching contribution of the Deferred Compensation Plan is accounted for as share-based compensation and vests after a two-year service period. From time to time, we may purchase mutual fund investments or ordinary shares of Burford Capital Limited to minimize our exposure resulting from the elections of the participants in the Deferred Compensation Plan. Distributions from the Deferred Compensation Plan will be made in accordance with the timing and form selected by the individual participant when the deferral is first elected. The Deferred Compensation Plan is administered and maintained by an independent third party.
Retirement savings
We offer a defined contribution 401(k) retirement plan to our US employees, under which employees make pre-tax or Roth contributions to a retirement savings account and we make a corresponding contribution to their accounts. A similar arrangement is in effect for our UK employees. For the year ended December 31, 2023, we contributed $0.7 million for US employees and $0.7 million for UK employees under these retirement plans. In addition, we had $0.1 million in pension costs for our employees in jurisdictions other than the United States and the United Kingdom.
Our employees are eligible to retire when the combination of their age and years of service totals at least 75, with a minimum of eight years of service with us. Eligible retirees are entitled to retire and have any contingent compensation (including RSUs, payments under the “phantom carry pool” program and the matching component under the Deferred Compensation Plan) continue to vest as though they had continued to be employed by us, as long as they do not take on other employment in the legal or legal finance sector or full-time employment in their area of expertise.
Senior management compensation
The table below sets forth the aggregate compensation paid or accrued during the year ended December 31, 2023 (including cash bonus and other incentive compensation that was paid or accrued for the year ended December 31, 2023 that was paid or is expected to be paid in the year ending December 31, 2024) for the senior management as a group.
($ in thousands) |
| Year ended December 31, 2023 |
Salary | 5,116 | |
Annual incentive bonus(1) | 16,944 | |
Performance related-other(2),(3) | 8,461 | |
RSUs granted | 6,759 | |
Burford matching contribution to 401(k) retirement plan | 92 | |
Senior management as a group (8 people) | 37,372 |
1. | Includes approximately $4.6 million deferred under the Deferred Compensation Plan. |
2. | Includes approximately $6.4 million deferred under the Deferred Compensation Plan. |
3. | Consists of payments under the “phantom carry pool” program and related to gains on capital provision assets. |
Burford Capital Annual Report 2023 125
Executive compensation
Overview
Mr. Bogart, our Chief Executive Officer, and Mr. Molot, our Chief Investment Officer, are employed under identical employment agreements, each of which became effective as of January 1, 2024 and is scheduled to expire on December 31, 2028 (the “New Employment Agreements”). The New Employment Agreements replaced Mr. Bogart’s and Mr. Molot’s respective prior employment agreements (the “Prior Employment Agreements”). The Prior Employment Agreements provided, and the New Employment Agreements provide, for identical compensation for each of them, which reflects Mr. Bogart’s and Mr. Molot’s roles as joint founders and leaders of our company. Both Mr. Bogart and Mr. Molot report directly to the Board. Upon expiration of their respective terms, each of the New Employment Agreements renews automatically for successive one-year periods if neither we nor Mr. Bogart or Mr. Molot, as applicable, provides notice of an intent to terminate the respective New Employment Agreement.
Historically, Mr. Bogart’s and Mr. Molot’s incentive compensation was entirely formulaic and based solely on the generation of cash proceeds. Under the New Employment Agreements, the proportion of their compensation that is formulaic has been reduced, with a larger portion of their respective incentive compensation based on goals and performance that is determined at the discretion of the Compensation Committee, which is more closely aligned with market approach to executive compensation for US public companies. The New Employment Agreements are not intended to cause any material change in their total compensation other than their first increase in base salary in eleven years.
The New Employment Agreements provide that the portion of Mr. Bogart and Mr. Molot’s compensation paid, if any, that is formulaic be solely in the form of their carried interest participation, rather than pursuant to a percentage of cash proceeds being paid in the form of an annual bonus as was the case under the Prior Employment Agreements. We believe this structure has advantages for both Burford and for the executives. However, given that we accrue an expense for the carry plan as assets increase in fair value (and do not so accrue with respect to annual bonus amounts other than during the course of the year to which such annual bonus relates), this new structure resulted in a one-time increase in the accrual for the carry plan for the year ended December 31, 2023, in addition to the increase in the carry accrual generally due to the substantial increase in the fair value of our assets for the year ended December 31, 2023. Again, these are purely accounting charges, and no cash is paid to the executives until we receive cash proceeds from our assets. In addition, because the New Employment Agreements did not take effect until January 1, 2024, the compensation paid for the year ended December 31, 2023 was pursuant to the Prior Employment Agreements.
Compensation for the year ended December 31, 2023
For the year ended December 31, 2023, pursuant to their respective Prior Employment Agreements, each of Mr. Bogart and Mr. Molot received or is expected to receive (i) an annual base salary in the amount of $950,000 (2022: $950,000), (ii) an entirely formulaic annual incentive bonus based on cash proceeds in the amount of $2.5 million in cash and $2.5 million in long-term incentive awards under the LTIP (2022: $1.5 million in cash and $1.5 million in long-term incentive awards under the LTIP) and (iii) $3.6 million in respect of carry payments (2022: $1.3 million). Each of Mr. Bogart and Mr. Molot also received a one-time payment in the amount of $2.0 million, in recognition of strong results for the year ended December 31, 2023. In addition, for the year ended December 31, 2023, each of Mr. Bogart and Mr. Molot contributed to the defined contribution 401(k) retirement plan, and we made a matching contribution of $13,200 for each of them.
In December 2022, each of Mr. Bogart and Mr. Molot elected to defer the cash portion of their respective annual incentive bonus for the year ended December 31, 2023 in excess of $2.25 million to the Deferred Compensation Plan and subsequently committed to allocate half of such deferred cash portion of their respective annual incentive bonus to our ordinary shares in the Deferred Compensation Plan. At such time, each of Mr. Bogart and Mr. Molot also elected to defer receipt of RSUs awarded to them in 2023 into the Deferred Compensation Plan following the vesting of such RSUs in 2026, and Mr. Molot also deferred 100% of payments made under the carry plan during the year ended December 31, 2023 into the Deferred Compensation Plan. In addition, each of Mr. Bogart and Mr. Molot take advantage of the opportunity offered to all eligible employees to invest in our private funds on a fee-less basis, again showing their alignment with investors, and, at December 31, 2023, each of Mr. Bogart and Mr. Molot had commitments in the amount of $1.0 million to Burford Opportunity Fund B LP (as compared to $2.0 million to the Strategic Value Fund and
126 Burford Capital Annual Report 2023
Burford Opportunity Fund B LP at December 31, 2022 given the termination of the Strategic Value Fund during the year ended December 31, 2023).
Holdings and commitments to private funds of directors and senior management
The tables below set forth the holdings of our securities and commitments to private funds of our directors and senior management at March 14, 2024. Beneficial ownership does not necessarily imply that the named person has the economic or other benefits of ownership. For purposes of these tables, in accordance with applicable SEC rules regarding the determination of beneficial ownership, ordinary shares that a person or entity has the right to acquire within 60 days of March 14, 2024 through the exercise of any option, warrant or other right are considered as beneficially owned by the person holding those options, warrants or other rights. The applicable percentage of ownership of ordinary shares of each director or officer, as applicable, is based on 218,965,081 ordinary shares outstanding at March 14, 2024.
Directors
March 14, 2024 | ||||||||||
Ordinary shares | % of ordinary shares | Bonds owned | Commitments to | |||||||
| owned |
| outstanding |
| (principal amount) |
| private funds(1) | |||
Rukia Baruti | 2,492 | * | $ | — | $ | — | ||||
Pamela Corrie | 2,074 | * | $ | — | $ | — | ||||
Robert Gillespie | 12,798 | * | $ | — | $ | — | ||||
Christopher Halmy | 25,490 | * | $ | — | $ | — | ||||
John Sievwright | 17,798 | * | $ | 500,000(2) | $ | — | ||||
Hugh Steven Wilson | 303,835 | 0.1% | $ | 600,000(3) | $ | 500,000 | ||||
Total | 364,487 | 0.2% | $ | 1,100,000 | $ | 500,000 | ||||
* Represents less than 0.1%.
1. | Represents commitments to Burford Opportunity Fund B LP. |
2. | Represents $250,000 aggregate principal amount of the 2028 Notes and $250,000 aggregate principal amount of the 2031 Notes. |
3. | Represents $600,000 aggregate principal amount of the 6.125% Bonds due 2025 issued by Burford Capital Finance LLC. |
Senior management
March 14, 2024 | ||||||||||
Ordinary shares | % of ordinary shares | Bonds owned | Commitments to | |||||||
| owned |
| outstanding |
| (principal amount) |
| private funds(1) | |||
Craig Arnott | 240,122 | (2) | 0.1% | $ | — | $ | 75,000 | |||
Christopher Bogart | 9,207,115 | (3) | 4.2% | $ | 500,000 | (4) | $ | 1,000,000 | ||
Mark Klein | 79,851 | (5) | * | $ | — | $ | 25,000 | |||
Jordan Licht | — | (6) | — | $ | — | $ | — | |||
Jonathan Molot | 9,811,515 | (7) | 4.5% | $ | 500,000 | (4) | $ | 1,000,000 | ||
Elizabeth O’Connell | 130,892 | (8) | 0.1% | $ | — | $ | — | |||
David Perla | 72,207 | (9) | * | $ | — | $ | 75,000 | |||
Aviva Will | 297,927 | (10) | 0.1% | $ | — | $ | 150,000 | |||
Senior management as a group (8 people) | 19,839,629 | 9.1% | $ | 1,000,000 | $ | 2,325,000 | ||||
* Represents less than 0.1%.
1. | Represents commitments to Burford Opportunity Fund B LP. |
2. | Includes 75,496 ordinary shares underlying the RSUs that are expected to vest within 60 days of March 14, 2024 (including any ordinary shares that may be withheld for tax purposes). Does not include 63,756 ordinary shares underlying the RSUs that are not expected to vest within 60 days of March 14, 2024. |
3. | Represents securities beneficially owned, directly and indirectly, by Mr. Bogart, over which he has or shares voting and dispositive control, but does not include securities held by Ms. O’Connell, Mr. Bogart’s spouse and our Chief Strategy Officer, as to which Mr. Bogart disclaims beneficial ownership. Includes 213,950 ordinary shares held by a US charitable foundation established by Mr. Bogart. Does not include (i) 225,610 ordinary shares underlying the RSUs that are expected to vest within 60 days of March 14, 2024 (including any ordinary shares that may be withheld for tax purposes) that were deferred pursuant to the Deferred Compensation Plan, (ii) 364,775 ordinary shares underlying the RSUs that are not expected to vest within 60 days of March 14, 2024 and (iii) 187,200 ordinary shares (including our matching contribution) representing cash compensation that was deferred pursuant to the Deferred Compensation Plan. |
4. | Represents $500,000 aggregate principal amount of the 6.125% Bonds due 2025 issued by Burford Capital Finance LLC. |
5. | Includes 35,138 ordinary shares underlying the RSUs that are expected to vest within 60 days of March 14, 2024 (including any ordinary shares that may be withheld for tax purposes). Does not include (i) 63,756 ordinary shares underlying the RSUs that are not expected to vest within 60 days of March 14, 2024 and (ii) 6,305 ordinary shares (including our matching contribution) representing cash compensation that was deferred pursuant to the Deferred Compensation Plan. |
6. | Does not include 140,086 ordinary shares underlying the RSUs that are not expected to vest within 60 days of March 14, 2024 and, therefore, are not included in the beneficial ownership table above. |
7. | Includes 227,195 ordinary shares held by a US charitable foundation established by Mr. Molot. Does not include (i) 225,610 ordinary shares underlying the RSUs that are expected to vest within 60 days of March 14, 2024 (including any ordinary shares that may be withheld for tax purposes) that have been deferred pursuant to the Deferred Compensation Plan, (ii) 364,775 ordinary shares underlying the RSUs that are not expected to vest within 60 days of March 14, 2024 and (iii) 348,797 ordinary shares (including our matching contribution) representing cash compensation that was deferred pursuant to the Deferred Compensation Plan. |
Burford Capital Annual Report 2023 127
8. | Does not include (i) 42,112 ordinary shares underlying the RSUs that are expected to vest within 60 days of March 14, 2024 (including any ordinary shares that may be withheld for tax purposes) that were deferred pursuant to the Deferred Compensation Plan and (ii) 63,756 ordinary shares underlying the RSUs that are not expected to vest within 60 days of March 14, 2024. |
9. | Does not include (i) 105,903 ordinary shares underlying the RSUs that are expected to vest within 60 days of March 14, 2024 (including any ordinary shares that may be withheld for tax purposes) that were deferred pursuant to the Deferred Compensation Plan, (ii) 63,756 ordinary shares underlying the RSUs that are not expected to vest within 60 days of March 14, 2024 and (iii) 27,975 ordinary shares (including our matching contribution) representing cash compensation that was deferred pursuant to the Deferred Compensation Plan. |
10. | Does not include (i) 47,923 ordinary shares underlying the RSUs that are expected to vest within 60 days of March 14, 2024 (including any ordinary shares that may be withheld for tax purposes) that were deferred pursuant to the Deferred Compensation Plan, (ii) 63,756 ordinary shares underlying the RSUs that are not expected to vest within 60 days of March 14, 2024 and (iii) 27,217 ordinary shares (including our matching contribution) representing cash compensation that was deferred pursuant to the Deferred Compensation Plan. |
Recovery of erroneously awarded compensation
Pursuant to the Clawback Policy, in the event that we are required to prepare an accounting restatement due to our material noncompliance with a financial reporting requirement, we are required to make reasonable efforts to recover from any current or former executive officer the amount of certain incentive-based compensation received on or following the effective date of the Clawback Policy in excess of what would have been paid or granted to such executive officer under the circumstances reflected by the accounting restatement. See note 19 (Share-based compensation) to our consolidated financial statements for additional information with respect to the Clawback Policy. No recovery related to the restatement prepared by us in 2023 (as previously disclosed in the 2022 Annual Report) was required pursuant to the terms of the Clawback Policy.
128 Burford Capital Annual Report 2023
Major shareholders and related party transactions
Major shareholders
The table below sets forth certain information regarding the beneficial ownership of our outstanding ordinary shares at March 14, 2024 held by each person or entity that we know beneficially owns 5% or more of our ordinary shares. Beneficial ownership does not necessarily imply that the named person has the economic or other benefits of ownership. For purposes of this table, in accordance with applicable SEC rules regarding the determination of beneficial ownership, ordinary shares that a person or entity has the right to acquire within 60 days of March 14, 2024 through the exercise of any option, warrant or other right are considered as beneficially owned by the person holding such options, warrants or other rights. The applicable percentage of ownership of ordinary shares of each shareholder is based on 218,965,081 ordinary shares outstanding at March 14, 2024.
March 14, 2024 | |||||
Identity of person or group |
| Number of ordinary shares |
| % of ordinary shares outstanding | |
Mithaq Capital SPC | 18,527,987 | (1) | 8.5 | % | |
1. | Based solely on Form TR-1 (Standard form for notification of major holdings) furnished to the SEC on Form 6-K on March 7, 2024. Represents ordinary shares beneficially owned by Mithaq Capital SPC having received the ordinary shares without consideration from Mithaq Capital, an affiliated entity. As previously reported (i) on Schedule 13G/A, at December 31, 2023, Mithaq Capital beneficially owned 23,029,054 ordinary shares, constituting 10.5% of the then outstanding ordinary shares, (ii) on Form TR-1, at March 31, 2019, Mithaq Capital beneficially owned 11,122,413 ordinary shares, constituting 5.1% of the then outstanding ordinary shares, (iii) on Form TR-1, at August 18, 2020, Mithaq Capital beneficially owned 23,021,070 ordinary shares, constituting 10.5% of the then outstanding ordinary shares, and (iv) Schedule 13G/A, at December 31, 2020, Mithaq Capital SPC beneficially owned 23,021,070 ordinary shares, constituting 10.5% of the then outstanding ordinary shares. |
We have a single class of ordinary shares and, accordingly, our major shareholders have the same voting rights as our other shareholders.
At February 29, 2024, based on a preliminary analysis of our shareholders and share register, approximately 50% of our outstanding ordinary shares were held by residents of the United States, with 11 holders of record in the United States and additional holdings through banks, brokers and other nominees. If the majority of our ordinary shares will be held in the United States at June 30, 2024, we will lose our status as a “foreign private issuer” effective as of the beginning of 2025 and will thereafter be subject to the same disclosure and financial reporting requirements as US domestic public companies and will no longer be permitted to follow our home country practice in lieu of the corporate governance requirements of the NYSE. See “Risk factors—Risks relating to our ordinary shares—We are currently a foreign private issuer within the meaning of the rules under the Exchange Act and, as such, we are exempt from certain provisions applicable to US domestic public companies” and “Risk factors—Risks relating to our ordinary shares—As a foreign private issuer whose shares are listed on the NYSE, we currently follow certain home country corporate governance practices instead of certain NYSE requirements” for additional information with respect to our status as a foreign private issuer.
See “Compensation—Holdings and commitments to private funds of directors and senior management” for information relating to holdings of our directors and members of our senior management.
Related party transactions
At March 14, 2024, our directors and members of our senior management held our ordinary shares and/or debt securities and/or had commitments to certain of our private funds. See “Compensation—Holdings and commitments to private funds of directors and senior management” for additional information with respect to holdings and commitments to certain of our private funds of our directors and members of our senior management.
We hold certain of our capital provision assets through joint ventures or companies with equity method investments that are our related parties. See note 17 (Joint ventures and equity method investments) and note 22 (Related party transactions) to our consolidated financial statements for additional information with respect to joint ventures and companies with equity method investments.
129 Burford Capital Annual Report 2022
Risk factors
Investing in our securities involves risk. Persons investing in our securities should carefully consider the risks set forth below and the other information contained in this Annual Report and our other reports that we file with, or furnish to, the SEC, including our consolidated financial statements and accompanying notes. Any of the following risks could materially and adversely affect our business, financial position, results of operations and/or liquidity. Our business, financial position, results of operations and/or liquidity could also be materially and adversely affected by additional factors that apply to all companies generally as well as other risks that are not currently known to us or that we currently view to be immaterial. In any such case, the trading price of our securities could decline, and you may lose all or part of your original investment. While we attempt to mitigate known risks to the extent we believe to be practicable and reasonable, we can provide no assurance, and we make no representation, that our mitigation efforts will be successful. See “Forward-looking statements” for additional information.
Risks relating to our business and industry
Litigation outcomes are risky and difficult to predict, and a loss in a litigation matter may result in the total loss of our capital associated with that matter.
It is difficult to predict the outcome of litigation, particularly complex commercial litigation of the type in which we specialize. We typically advance capital to our counterparties on a non-recourse basis and are therefore entirely dependent on a positive, cash-generative outcome in the underlying litigation matter in order to recover our principal and earn a return. If our counterparty is unsuccessful in the underlying litigation matter, if the damages awarded in favor of our counterparty are less than we expect or if it is not possible to successfully enforce a favorable judgment, we could suffer a variety of adverse consequences, including the total loss of our deployed capital and, in some jurisdictions, liability for the adverse costs of the successful party to the litigation. In addition, to the extent we have provided insurance coverage in respect of adverse cost risk in the matter, a loss resulting from an adverse outcome would be compounded with additional adverse cost loss. Unfavorable outcomes in litigation matters we have financed could, individually or in the aggregate, have a material adverse effect on our business, financial position, results of operations and/or liquidity.
Our revenues, earnings and cash flows can vary materially between periods as both the timing of resolution and the outcome of litigation matters are difficult to predict.
Our revenues, earnings and cash flows can vary materially from period to period due to the nature of our business, including the fact that litigation matters often take many years to resolve and the processes involved are subject to change and uncertainty. We are unable to control the progress and resolution of most of our assets because their timing depends upon parties working through the legal systems in various jurisdictions. As a result, the timelines for our receipt of any potential return on our assets and the related cash inflows can be long and are difficult to predict. Events or conditions that have not been anticipated may occur and may have a significant effect on the outcome or process of a litigation matter, which may reduce the actual rate of return on an asset. Moreover, the substantive or procedural law relevant to the litigation matters brought by our counterparties may change after we have committed capital. The time, complexity and expense involved in collecting returns on our assets, including the enforcement of judgments and the release of funds held in escrow pending the resolution of a litigation matter, also affect our cash flows. All of these factors contribute to potentially significant volatility in our financial performance and the trading price of our securities. In addition, we cannot assure you that we will generate cash flows from the returns on our assets in an amount sufficient to enable us to meet all of our obligations or to fund our working capital, asset and other business needs.
Our success depends on our ability to identify and select suitable legal finance assets to finance, and our failure to do so could have a material adverse effect on our business, financial position, results of operations and/or liquidity.
Our success depends on our ability to identify and select legal finance assets that will be successful and pay returns, which in turn depends upon the conclusion, management and realization of suitable financing opportunities. The Commitments Committee is primarily responsible for approving the opportunities that have been identified for us to finance. There can be no assurance that we will be successful in sourcing suitable legal finance assets in a timely manner or at all or in sourcing a sufficient number of suitable legal finance assets to finance that meet our diversification, underwriting and other requirements. Our ability to select such legal finance assets depends on the
Burford Capital Annual Report 2022 130
availability of desirable financing opportunities, which is subject to market conditions, client demand, pricing, competition and other factors outside our control, including changes in regulations in various jurisdictions in which we operate and limitations on our ability to adequately investigate the merits of the case or parties involved, among other things. A failure by us to identify and select suitable legal finance assets to finance could have a material adverse effect on our business, financial position, results of operations and/or liquidity.
Our business and operations could suffer if we are not able to prevent improper use or disclosure of, or access to, privileged information under our control due to cybersecurity breaches, unauthorized use or theft.
We obtain privileged information as part of our analysis of potential legal finance assets and as part of our ongoing asset monitoring. When we receive privileged information, we are under a strict obligation to protect it. Among other things, this obligation requires us to tightly restrict access to the privileged information itself.
As described under “—Risks relating to cybersecurity, third-party service providers, information systems and data privacy and protection—Cybersecurity risks could result in the loss of data, interruptions in our business, damage to our reputation and subject us to regulatory actions, increased costs and financial losses, any of which could have a material adverse effect on our business, financial position, results of operations and/or liquidity”, attempts to gain unauthorized access to our information systems have become increasingly sophisticated over time, and our efforts to detect and investigate all security incidents and to prevent their recurrence may be unsuccessful. In addition to the risk of a breach of confidentiality due to a cybersecurity incident, privileged information could be compromised in other ways. Although we have implemented controls to protect privileged information, there can be no assurance that such controls would be effective. If our employees, third-party service providers or counterparties engage in misconduct or fail to follow appropriate security measures, the improper release or use of privileged information could result.
The improper use or disclosure of, or access to, our intellectual property or litigation or business strategy or those of our clients due to a cybersecurity breach, unauthorized use or theft could harm our competitive position, reduce the value of our capital provision assets and have a negative impact on our reputation or otherwise adversely affect our business, financial position, results of operations and/or liquidity. In addition, if the courts were to find that we have improperly used or disclosed privileged information, there could be significant adverse consequences for the litigant, and we could be subject to complaints or lawsuits for damages or regulatory action as a result.
The inaccuracy or failure of the probabilistic model and decision science tools, including AI tools, we use to predict the returns on our legal finance assets and in our operations could have a material adverse effect on our business.
We use internally developed probabilistic modeling and other decision science tools, including AI tools, in our operations, including to assist us in underwriting and pricing potential legal finance assets and evaluating the expected returns on our legal finance assets throughout their respective lives, as well as in capital and liquidity management. At the time we enter into a contract to finance a legal finance asset, however, we are likely to have imperfect information about the litigation matter in question and the likely future outcome. In addition, our historical information about cases or portfolios of cases may not be indicative of the characteristics of subsequent cases or portfolios of cases within the same industry or with comparable other characteristics, and our internal databases and external statistical data may not be as extensive as needed for comprehensive decision science. In addition, we disclose aggregate calculations derived from our probabilistic modeling of individual matters and our portfolio as a whole. The inherent volatility and unpredictability of legal finance assets precludes forecasting and limits the predictive nature of our probabilistic model. Furthermore, the inherent nature of the probabilistic model is that actual results will differ from the modeled results, and such differences could be material. If the probabilistic model and decision science tools we use are inaccurate or fail, including to accurately evaluate and predict the returns on our legal finance assets, there could be a material adverse effect on our business, financial position, results of operations and/or liquidity.
The legal and regulatory landscape surrounding AI technologies is rapidly evolving and uncertain, including in relation to the areas of cybersecurity and privacy and data protection. Compliance with new or changing laws, regulations or industry standards relating to AI may impose significant operational costs and may limit our ability to develop, deploy or use AI technologies. Failure to appropriately respond to this evolving landscape may result in legal liability, regulatory action or reputational harm.
Burford Capital Annual Report 2023 131
The laws relating to privileged information are complex and continue to evolve, and any adverse court rulings, changes in law or other developments could impair our ability to conduct effective due diligence on potential legal finance assets.
To make informed financing decisions, we often need access to information beyond that which is publicly available about a litigation matter and regularly seek and obtain privileged information, which is information that is protected from disclosure due to the application of a legal privilege or other doctrine, including attorney work product, depending on the laws of the relevant jurisdiction. Such privileged information can lose its protection and become accessible to a litigation opponent if it is used publicly (a concept called “waiver”), which could have significant adverse consequences for the litigant. The laws relating to privileged information are complex and continue to evolve, and we could be adversely affected by court rulings, changes in law or other developments. If a court in a particular jurisdiction were to find that disclosure to legal finance providers effected a waiver of applicable legal privileges, our access to such privileged information could become constrained in that jurisdiction. Any significant limitations on our ability to access such privileged information could adversely affect our ability to conduct due diligence and make informed financing decisions with respect to certain legal finance assets.
The due diligence process that we undertake in connection with financing legal finance assets may not reveal all facts that may be relevant in connection with such financing.
Before offering to finance legal finance assets on specified economic and other terms, we conduct due diligence based on the facts and circumstances applicable to the matter that may be the subject of such financing. As part of our due diligence, we may be required to evaluate important and complex business, financial, tax, accounting, technological, environmental, social, governance, ethical, political, legal and regulatory issues. When conducting due diligence and making an assessment regarding financing a legal finance asset, we rely on the information available to us, including information provided by the parties involved in the case we intend to finance. We have no control over the accuracy or sufficiency of information received from such third parties and, in some cases, we have limited experience or no prior dealings with such third parties and are unable to assess their integrity.
The due diligence investigation that we carry out with respect to any financing opportunity may not reveal or highlight all relevant facts (including, among others, bribery, fraud or other illegal activities) or risks that would be helpful in evaluating such opportunity. Particularly where we finance a case that is at an early stage, such as before the conclusion of the fact discovery stage in a US litigation, we may have limited ability to ascertain the facts that may have a material impact on the outcome of the litigation. In addition, although we regularly perform factual and legal research beyond what is provided to us by our prospective counterparties, we may underestimate the importance of a legal or factual risk of financing an asset that ends up being conclusive. There are also material factors that contribute to the outcome of financing a legal finance asset that are impossible to research or predict at the outset, such as a judge’s or jury’s positive or negative disposition towards a particular party, witness or lawyer.
Further, we may not identify or foresee future developments that could have a material adverse effect on our returns on a legal finance asset, such as the credit risk from our counterparty or from a party in a case. For example, we may not uncover the risk associated with poor management of general finances or the litigation itself by a counterparty or other party, any insolvency risk or potential key-person risk from a counterparty or other party or a misalignment of economic incentives between us and a counterparty because of the economics of our financing and developments in the litigation. In addition, financial fraud or other deceptive practices, failures by personnel at our counterparties to comply with anti-bribery, trade or economic sanctions or other legal and regulatory requirements or our counterparties being or becoming subject to trade or economic sanctions could cause significant legal, reputational and business harm to us.
Poor returns on our legal finance assets due to shortcomings or failures in our due diligence process or unforeseen developments could adversely affect our reputation and could materially and adversely affect our business, financial position, results of operations and/or liquidity.
Investors will not have an opportunity to independently evaluate our legal finance assets.
We generally do not disclose details of our existing or prospective legal finance assets (including their valuations for accounting purposes) on an individual basis because of restrictions applicable to privileged information and other relevant restrictions. As a result, investors will not have an opportunity to evaluate our legal finance assets and will be dependent upon our judgment and ability in selecting, managing and valuing our assets.
132 Burford Capital Annual Report 2023
We are subject to credit risk relating to our various legal finance assets that could adversely affect our business, financial position, results of operations and/or liquidity.
Prior to the conclusion of a litigation matter, we are subject to the risk that a claimant who is our counterparty, a party against whom our counterparty is making a claim, a law firm, an insurance company or another relevant party will encounter financial difficulties or become insolvent, which could delay or prevent the litigation matter from being resolved and could adversely affect our ability to earn a return on the relevant legal finance asset. On becoming contractually entitled to proceeds after the conclusion of a litigation matter, depending on the structure of the particular legal finance asset, we could be a creditor of, or otherwise subject to credit risk from, a claimant, a party against whom our counterparty is making a claim, a law firm, an insurance company or another relevant party. Moreover, we may be indirectly subject to credit risk to the extent a defendant does not pay a claimant immediately, notwithstanding successful adjudication of a claim in the claimant’s favor. If the defendant is unable or unwilling to pay or perform or if any of the parties challenges the judgment or award, we may encounter difficulties in collection. Furthermore, although we occasionally procure judgment preservation insurance to protect judgments and awards, such insurance policies may not provide full protection for a number of reasons, including because the circumstance of the loss was not covered by the insurance policies. Finally, in addition to the credit risk associated with individual parties to a litigation matter, losses due to the credit exposures inherent in our business could adversely affect our business, financial position, results of operations and/or liquidity.
Our portfolio may be concentrated in cases likely to have correlated results, and we have a number of assets involving the same counterparty.
Our capital provision-direct portfolio includes certain related exposures where we have financed multiple different counterparties in relation to the same or very similar claims, such that outcomes on these related exposures are likely to be correlated. We estimate that the fair value of the assets underlying our largest correlated exposure (excluding YPF-related assets) represented approximately 8% and 4% of the consolidated fair value of capital provision-direct assets at December 31, 2023 and 2022, respectively, and approximately 7% and 5% of the Burford-only fair value of capital provision-direct assets at December 31, 2023 and 2022, respectively. An adverse litigation outcome in respect of any of these individual claims may result in, or increase the likelihood of, losses on the other related claims.
In addition, we have a number of assets involving the same counterparty. See “Operating and financial review and prospects—Portfolio—Portfolio concentrations” for information with respect to our portfolio concentrations with a law firm and a corporate client. Accordingly, although our direct financial exposure to such law firm and/or corporate client is limited to matters in which such law firm or corporate client, as applicable, is our counterparty, if such law firm or corporate client were to encounter financial difficulties, dissolve or suffer a substantial loss of personnel, there could be a material adverse effect on our business, financial position, results of operations and/or liquidity. Furthermore, we may enter into legal finance arrangements and hold legal finance assets with law firms that provide advice on transactions for which we or one of our counterparties is an underlying claimant, which may increase our direct or indirect overall exposure to the underlying claim.
Our exposure to cases likely to have correlated results or counterparty concentration could lead to increased volatility and could materially and adversely affect our business, financial position, results of operations and/or liquidity.
The lack of liquidity of our legal finance assets may adversely affect our business, financial position, results of operations and/or liquidity.
Our legal finance assets typically require significant advances of capital with no guarantee of return or repayment. It may be difficult or impossible to find willing buyers for these assets at prices we believe are representative of their underlying value or at all. Volatility in markets also could negatively impact the liquidity of our legal finance assets. Illiquid assets typically experience greater price volatility as a ready market does not exist and therefore they can be more difficult to value. In addition, the prices prospective buyers are willing to pay for illiquid assets may be more subjective than the prices for more liquid assets. The illiquidity of legal finance assets also is exacerbated by the fact that third parties may be limited in their ability to value these assets because they cannot perform full legal due diligence on a case due to the limitations imposed by applicable legal privileges and protections. The illiquidity of our legal finance assets may make it difficult for us to sell such assets if the need or desire arises. If we are required to liquidate all or a portion of our portfolio quickly, we may realize significantly less than the value at which we have previously recorded our legal finance assets in our consolidated financial statements. As a result, our ability to change
Burford Capital Annual Report 2023 133
the makeup of our portfolio of legal finance assets in response to changes in economic and other conditions may be relatively limited, which could adversely affect our business, financial position, results of operations and/or liquidity.
We have commitments that are in excess of our available capital.
We typically have commitments to finance legal finance assets that exceed our available capital. We seek to manage our available capital and our capital provision assets portfolio to minimize the risk of a mismatch between the timing of when our commitments will be drawn and available cash, and many of our capital provision agreements set forth timetables for draws or structure draws with reference to case events, which provides us with some control over the timing and amounts of capital we provide in respect of our commitments. However, as we do not control the timing of developments in the matters that we finance, it is possible that such a mismatch will occur, in which case we would need either to raise additional capital (which could include the potential sale of an interest in one or more of our existing legal finance assets) or to decline to meet a commitment. There can be no assurance that we will be able to raise capital on reasonable terms or at all, and our inability to do so could cause damage to our business and the potential loss of business and financial relationships. A failure by us to deploy capital on our definitive commitments may result in adverse consequences to our business such as a loss of entitlement to any returns with respect to such definitive commitments, a loss of capital we have already deployed or a claim by a counterparty for damages. Some of our private funds also have commitments in excess of capital available and, accordingly, have some of the foregoing risks.
Changes in market conditions may negatively impact our ability to obtain attractive external capital or to refinance our outstanding indebtedness and may increase the cost of such financing or refinancing if it is obtained.
Our strategy includes raising external capital to finance the growth of our business. If market conditions were to restrict our access to external capital, our growth prospects could be adversely affected, especially if cases resolve at a significantly slower-than-expected pace or if we are unable to attract new business due to the market conditions. In addition, to the extent that conditions in the credit markets impair our ability to refinance or extend maturities on our outstanding indebtedness, either on favorable terms or at all, our performance may be negatively impacted and may result in our inability to repay debt at maturity or pay interest when due. Any of the above factors, individually or in the aggregate, could adversely affect our growth prospects, business, financial position, results of operations and/or liquidity.
We face substantial competition for opportunities with respect to legal finance assets, which could delay commitment and/or deployment of our capital, reduce returns and result in losses.
Competition for attractive opportunities with respect to legal finance assets may affect our ability to finance on terms which we consider attractive. We compete to acquire legal finance assets primarily with pure-play legal finance companies and multi-strategy firms that engage in legal finance in addition to their other strategies. Our competitors may have access to greater financial resources, technical capabilities or better relationships than we do, may have businesses that are smaller and more flexible than ours or may develop or market alternative financial arrangements that are more effective or less susceptible to challenges than ours. For example, some competitors may have a lower cost of capital and access to financing sources that are not available to us. Other potential developments in big data analytics and AI and adoption of these capabilities by our competitors may negatively affect our returns if their technical capabilities outpace our own. In addition, some of our competitors may have higher risk tolerances or different risk assessments than we have. Any of these characteristics could allow our competitors to consider a wider variety of legal finance assets to finance, establish more relationships and offer better pricing and more flexible structuring. In addition to the pure-play legal finance companies and multi-strategy firms that engage in legal finance, we may also face competition from smaller industry participants or law firms using alternative financing models, insurance companies that may offer products to claimants and their counsel, as well as market entrants that have a regional-, industry- or specific claims-based approach. Such entities may offer more competitive terms or more tailored approaches to specific regions, industries or claims. We may lose financing opportunities if we do not match our competitors’ pricing, terms and/or structure. If we are forced to match our competitors’ pricing, terms and/or structure to commit and/or deploy our capital, we may not be able to achieve acceptable returns on our legal finance assets or may bear substantial risk of capital loss. See “Business—Competition” for additional information with respect to the competition we face.
134 Burford Capital Annual Report 2023
If the lawyers we rely on to prosecute and/or defend claims do not exercise due skill and care, or the interests of their clients do not align with ours, there may be a material adverse effect on the value of our legal finance assets.
We are particularly reliant on lawyers to prosecute and/or defend claims with due skill and care. If they are unable or unwilling to do this for any reason, it is likely to have a material adverse effect on the value of our legal finance assets. While we will typically evaluate the lawyers involved in any legal finance asset we acquire, we do not select such lawyers or we may have limited experience or no prior dealings with such lawyers, and there can be no assurance that the outcome of a case will be in line with our or the lawyers’ assessment of the case or that such lawyers will perform with the expected skill and care. As a matter of legal ethics in most jurisdictions, we are also unable to prevent our counterparties from discharging the lawyers who were originally in place in a case and replacing them with lawyers who may be less capable.
In addition, lawyers owe a duty to their clients as well as an overriding duty to the courts. We generally do not own or control a claim which we have financed and, as a result, we generally will not be the client of the law firm representing the claimant in a case that is the subject of our commitment or financing. Accordingly, that law firm may be required to act in accordance with its client’s instructions and interests rather than our own. If the interests of the claimants in the cases we have financed are not aligned with ours, the actions of the lawyers representing such claimants could have a material adverse effect on the value of our legal finance assets and, therefore, our business, financial position, results of operations and/or liquidity.
If the commitments we make on behalf of our private funds perform poorly, we may not earn asset management fees and/or performance fees, and our ability to raise capital for future funds may be materially and adversely affected.
Our income from our asset management business derives from fees earned from our management of our private funds and performance fees or carried interest with respect to those private funds. If the commitments we make on behalf of our private funds perform poorly, we may not earn performance fees. Further, if a private fund does not achieve certain returns over its life and carried interest that was previously distributed to us exceeds the amounts to which we are ultimately entitled, we may be required to repay such amounts under a “clawback” obligation. Moreover, to the extent we have deployed capital from our balance sheet in our private funds, we could experience losses on our own principal as a result of poor performance by our private funds or individual assets.
In addition, poor performance by our private funds could make it more difficult for us to raise capital for new private funds in the future. Investors and potential investors in our private funds continually assess our private funds’ performance, and our ability to raise capital for future funds will depend on our private funds’ continued satisfactory performance. Poor performance may deter future investments in our private funds or result in investors demanding lower fees which would adversely affect our management fees and/or performance fees and, therefore, our business, financial position, results of operations and/or liquidity.
A significant portion of our AUM is attributable to private funds with a single investor.
At December 31, 2023 and 2022, BOF-C and one of our “sidecar” funds, both funds with a single investor which is a sovereign wealth fund, represented approximately 30% and 25%, respectively, of our AUM. While the sovereign wealth fund is contractually obligated to advance capital on its commitments to such private funds, if it fails to do so we will no longer have access to this capital and our cash flows from these private funds will decline. This could result in our inability to meet a commitment, which in turn could cause damage to our business and the potential loss of business and financial relationships. See “—We have commitments that are in excess of our available capital”. In addition, if the sovereign wealth fund does not renew its arrangement with us, this could reduce our overall ability to grow our business. See “—We face competition for investments in our asset management business and may not be successful in raising private funds in the future”.
We face competition for investments in our asset management business and may not be successful in raising private funds in the future.
The asset management business is highly competitive and, if investors determine that our product offerings are not attractive, we may have difficulty raising additional private funds in the future. In order to attract capital, we may be required to structure private funds on terms that are less favorable to us or otherwise different from the terms that we have been able to obtain in the past. These risks could occur for reasons beyond our control, including general
Burford Capital Annual Report 2023 135
economic or market conditions, regulatory changes or increased competition. Our inability to grow our asset management business could result in a decrease in AUM, management fees and/or performance fees, in which case our business, financial position, results of operations and/or liquidity may be adversely affected. Because we rely on the capital available in our private funds to acquire legal finance assets, our inability to maintain or increase this source of capital could reduce our overall ability to grow our business.
Negative publicity or public perception of the legal finance industry or us could adversely affect our reputation, business, financial position, results of operations and/or liquidity.
Negative publicity about the legal finance industry in general or us specifically, even if inaccurate, could adversely affect our reputation and the confidence in our business model. For example, there is regular negative political and media activity in the United States with respect to the US consumer litigation finance industry. Although we do not participate in the US consumer litigation finance industry, negative publicity about that industry could adversely affect the public perception of the commercial legal finance industry or lead to overly broad regulation of legal finance in general. See “—Risks relating to regulation—The laws, regulations and rules relating to legal finance are evolving and may be uncertain, which may have negative consequences for the value or enforcement of our contractual agreements with our counterparties, our ability to do business in certain jurisdictions or our cost of doing business” for additional information with respect to the risks relating to regulation.
Failure to protect our reputation and brand in the face of negative publicity and ethical, legal or moral challenges could lead to a loss of trust and confidence. There are various factors that may cause litigants, law firms and other actual and potential customers to be more reluctant to pursue external financing, such as stories in the online, print and broadcast media about us or the legal finance industry, about real or perceived abusive practices in the legal finance industry or about regulatory investigations or enforcement actions in the legal finance industry. Online articles, blogs and tweets may lead to the increasingly rapid dissemination of a story and increase our exposure to negative publicity. Adverse public perception of the legal finance industry or us may increase media scrutiny of our business and could make it more likely that we receive negative attention if our employees engage in unlawful or questionable behavior, if we engage in internal disputes or disputes with former employees or if any of our counterparties is subject to negative publicity. Negative publicity relating to legal or regulatory violations by any of the third parties we engage, or negative publicity relating to the kind of matters we pursue, could also result in reputational damage to us.
Negative publicity could jeopardize our relationships with existing counterparties or our ability to establish new relationships or diminish our attractiveness to counterparties generally. Any of the foregoing could impact our ability to advance capital on our commitments, pursue our legal rights or collect amounts due to us and may materially and adversely affect our business, financial position, results of operations and/or liquidity.
We report our capital provision assets at fair value, which may result in us recognizing non-cash income that may never be realized.
Our capital provision assets are classified as financial instruments and are accounted for at fair value in the consolidated statements of operations in accordance with US GAAP. See note 2 (Summary of significant accounting policies), note 6 (Capital provision assets) and note 15 (Fair value of assets and liabilities) to our consolidated financial statements and “Operating and financial review and prospects—Portfolio—Fair value of capital provisions assets” for additional information with respect to our valuation policy and fair value of our capital provision assets. In addition to using a discounted cash flow model that can be sensitive to changes in interest rates, duration and other traditional valuation factors, the valuation policy assigns an updated risk adjustment, in prescribed percentages, to the forecasted cash inflows based on the type of case (e.g., commercial litigation or patent, geography and case milestone). As a result, when there is an objective event in the underlying litigation that would cause a change in fair value, we reflect the positive or negative impact of such objective event through a fair value adjustment. Due to the illiquid nature of our capital provision assets, there is inherent valuation uncertainty in the assessment of fair value, and our valuation methodologies require us to make significant and complex judgments about legal and other matters that are intrinsically difficult to predict. As such, there is a risk that a case underlying one of our capital provision assets could experience a negative event even after a positive event that had previously resulted in a fair value adjustment in accordance with our valuation policy. This later event, in turn, could lower the value of such capital provision asset in our consolidated statements of financial position and negatively impact related fair value adjustments recognized in our consolidated statements of operations in future periods.
136 Burford Capital Annual Report 2023
Certain of our individual assets represent a significant portion of the fair value of our capital provision assets. We have one set of exposures on the YPF-related assets that accounted for approximately 41% and 32% of the fair value of our capital provision assets at December 31, 2023 and 2022, respectively. The fair value of the YPF-related assets (both Petersen and Eton Park combined) on our consolidated statements of financial position was $2.1 billion and $1.2 billion at December 31, 2023 and 2022, respectively, with unrealized gains of $2.0 billion and $1.2 billion at December 31, 2023 and 2022, respectively, with the increase in fair value at December 31, 2023 due primarily to fair value adjustments on the YPF-related assets resulting from the impact of the March 2023 Ruling, the September 2023 Ruling and the September 2023 Final Judgment. In addition, on October 10, 2023, the Republic of Argentina filed a notice of appeal with the U.S. Court of Appeals for the Second Circuit and, on October 18, 2023, Petersen and Eton Park filed a notice a cross-appeal as to the dismissal of their claims against YPF S.A. See “Operating and financial review and prospects—Portfolio—Fair value of capital provisions assets—Fair value of YPF-related assets” for additional information with respect to the YPF-related assets.
Accordingly, the application of fair value accounting to our capital provision assets may result in us recognizing non-cash income that may never be realized, which could have a material adverse effect on our business, financial position, results of operations and/or liquidity.
Legal, political and economic uncertainty surrounding the effects, severity and duration of public health threats could adversely affect our business, financial position, results of operations and/or liquidity.
Legal, political and economic uncertainty surrounding the effects, severity and duration of public health threats could adversely affect our business, financial position, results of operations and/or liquidity. For example, the Covid-19 pandemic adversely affected the global economy, disrupted global supply chains and created significant volatility in the financial markets. In addition, the Covid-19 pandemic disrupted the operation of courts around the world, causing delays in, and elongation of the life of, a number of our existing matters and slowdowns in new litigation activity. In turn, this resulted in lower cash proceeds from litigation resolutions as the courts around the world worked through these issues.
In addition, in a period of constrained liquidity, litigants may be less willing to settle litigation matters, extending the lives of our matters and therefore restricting our ability to recycle capital. There is also an increased risk that litigants may encounter financial difficulties or become insolvent, which could impact the timing and quantum of litigation realizations. To the extent that litigants in our matters do become insolvent, the impact of a litigant’s insolvency on pending litigation is very difficult to predict and is not only case specific but dependent on the insolvency process in the jurisdiction in issue. Our expected realizations may be delayed and could be reduced during the restructuring or liquidation process.
The counterparties to whom we provide capital may also encounter financial difficulties or become insolvent in a period of constrained liquidity. We typically provide capital to our counterparties on a non-recourse basis and only receive a return upon the conclusion of a successful claim. If our counterparties encounter financial difficulties or become insolvent before the final resolution of their claims and are otherwise unable or unwilling to continue with their claims, we may decide to advance additional capital to them on terms that are less favorable to us. If we decide not to advance additional capital to such counterparties, it is possible that they will not be able to pursue their claims and we may therefore not earn any returns from such counterparties.
While it is not possible to ascertain the precise impact that public health threats may have on us from an economic, financial or regulatory perspective, individually or in the aggregate, public health threats could have a material adverse effect on our business, financial position, results of operations and/or liquidity.
Expectations relating to ESG considerations could expose us to potential liabilities, increased costs and reputational harm and adversely affect our business, financial position, results of operations and/or liquidity.
As a specialty legal finance provider, we depend to a large extent on our relationships with our clients and our reputation for integrity and high-caliber professional services to attract and retain clients. Companies across all industries are facing increasing scrutiny from customers, clients, regulators, investors and other stakeholders related to their ESG practices and disclosure. Not only governments and regulators but also investor advocacy groups, investment funds and influential investors are increasingly focused on ESG practices and disclosure, especially as they relate to the environment, health and safety, diversity, equity, inclusion, labor conditions and human and civil rights. Further, there is increased public awareness and concern regarding global climate change. As a result, if any of our stakeholders are not satisfied with our services, our ESG practices or disclosure or the ESG practices or disclosure of any parties to whom
Burford Capital Annual Report 2023 137
we provide capital, such dissatisfaction may be damaging to our business. In addition, increasing governmental and societal attention to ESG matters, including expanding mandatory and voluntary reporting, and disclosure topics such as climate change, sustainability, natural resources, waste reduction, energy, human capital and risk oversight, could expand the nature, scope and complexity of matters that we are required to control, assess and report.
We have been, and may be in the future, subject to informal private or public inquiries and formal proxy proposals by activists urging us to take certain corporate actions related to ESG matters. These activities may adversely affect our business in a number of ways, since responding to inquiries or proposals can be costly, time-consuming and disruptive to our operations and could meaningfully divert our resources, including the attention of our management team and our employees.
We make statements about our ESG goals and initiatives through our ESG reporting, including our annual sustainability report, and information provided on our website and in our press releases and other communications. While we are committed to advancing our responsibility to account for our impact on ESG, there can be no assurance that we will achieve our announced ESG goals and initiatives. Given the dynamic nature of ESG expectations, standards and regulations, which may change over time, we may from time to time need to update or otherwise revise our current practices, goals and initiatives, including in response to legislative or legal developments. In addition, some stakeholders may disagree with our goals and initiatives. Any failure, or perceived failure, to achieve our goals, further our initiatives, adhere to our public statements, comply with ESG laws and regulations or meet evolving and varied stakeholder expectations and standards could result in sales, and associated declines in the market price, of our securities and impact our ability to access capital markets, which in turn could have a material adverse effect on our business, financial position, results of operations and/or liquidity. See “Business—Environmental, social and governance” for additional information with respect to our ESG practices.
There are inherent uncertainties involved in estimates, judgments and assumptions used in the preparation of our consolidated financial statements.
The preparation of our consolidated financial statements requires management and the Board to make estimates, judgments and assumptions that affect the application of policies and the reported amounts of assets and liabilities, income and expenses. Estimates, judgments and assumptions are inherently subject to change in the future, and any such changes in these estimates, judgments or assumptions, including any changes as a result of changes in accounting principles and guidance or their interpretation, could result in corresponding changes to the amounts of assets and liabilities, income and expenses and therefore unfavorable accounting charges or effects. Any errors or misstatements in our consolidated financial statements could have a material adverse effect on our business, financial position, results of operations and/or liquidity.
Our past performance may not be indicative of our future results of operations.
Our past performance should not be considered indicative of our future results of operations. Our past returns have benefited from financing opportunities and general market conditions that may not continue or recur, and there can be no assurance that we or our private funds will be able to avail ourselves of comparable opportunities and conditions. As the market in which we operate matures, we may be subject to increased competition for talent and financing opportunities and potentially new regulations in various jurisdictions. There can be no assurance that any of the current or future single matters or matters contained in our portfolios will eventually be successful. Failure to achieve results of operations consistent with our historical performance could have a material adverse effect on our business, financial position, results of operations and/or liquidity.
Litigation and legal proceedings against us could adversely impact our business, financial position, results of operations and/or liquidity.
We are regularly subject to litigation and arbitration incidental to our business, including tactical litigation against us in the context of an ongoing legal finance asset. The types of claims made against us in lawsuits include claims for compensatory damages, punitive and consequential damages or injunctive relief. When we finance cases against sovereigns, there is the further risk of retaliatory criminal investigation or prosecution. In the past, purported securities class action litigation has been instituted against companies following periods of volatility in the overall market and in the price of a company’s securities. We have previously been the subject of one purported class action litigation of this nature. Although that litigation was withdrawn, listing our ordinary shares on the NYSE means that we may be more likely to be subject to similar litigation in the future, which, even if not successful, may divert our management’s attention and cause us to incur significant expenses in defending these lawsuits. Any insurance or
138 Burford Capital Annual Report 2023
indemnification rights that we may have may be insufficient or unavailable to protect us against such losses. Any of these developments could materially adversely affect our business, financial position, results of operations and/or liquidity.
Our success depends substantially on the continued retention of certain key personnel and our ability to hire and retain qualified personnel in the future to support our growth and execute our business strategies.
Our performance is, to a large extent, dependent upon the judgment and abilities of our management, including, in particular, our co-founders, Chief Executive Officer Christopher Bogart and Chief Investment Officer Jonathan Molot. We also depend on other key personnel, including the members of the Management Committee and the Commitments Committee. Our success will therefore depend largely upon the abilities of certain members of our management and other key personnel and our ability to retain them and to compensate them appropriately, especially in light of the high levels of compensation available from the major law firms from which they have typically come and the potential pressures on such compensation levels from the public markets. The death, incapacity or loss of the service of any of our management or other key personnel could have a material adverse impact on our business. In addition, our performance may be limited by our ability to employ and retain sufficiently qualified personnel and consultants. Such a failure to retain qualified personnel or consultants or recruit suitable replacements for significant numbers of qualified personnel or consultants could materially adversely affect our business and growth prospects.
Our international operations subject us to increased risks.
We operate internationally and, accordingly, our business is subject to risks resulting from differing legal and regulatory requirements, political, social and economic conditions and unforeseeable developments in a variety of jurisdictions. Our non-US operations are subject to the following risks, among others:
| ▪ | Political instability |
| ▪ | International hostilities, military actions (including the Ukraine War and the conflict in Israel and Gaza), terrorist or cyber-terrorist activities, climate change, natural disasters, pandemics (including the Covid-19 pandemic) and infrastructure disruptions |
| ▪ | Differing economic cycles and adverse economic conditions |
| ▪ | Unexpected changes in regulatory and tax environments and government interference in the economy |
| ▪ | Changes to trade and economic sanctions laws and regulations |
| ▪ | Foreign exchange controls and restrictions on repatriation of capital |
| ▪ | Fluctuations in currency exchange rates |
| ▪ | Inability to collect payments or seek recourse under, or comply with, ambiguous or vague commercial or other laws |
| ▪ | Difficulties in attracting and retaining qualified management and/or personnel |
| ▪ | Difficulties in penetrating new markets due to entrenched competitors or lack of local acceptance of our services |
Our overall success as a global business depends, in part, on our ability to anticipate and effectively manage these risks, and there can be no assurance that we will be able to do so without incurring unexpected costs. If we are not able to manage the risks related to our non-US operations, our business, financial position, results of operations and/or liquidity may be materially adversely affected.
We may face exposure to foreign currency exchange rate fluctuations and may hold unhedged securities positions.
One of our five series of debt securities outstanding at the date of this Annual Report is denominated in pound sterling, and some of our legal finance contracts and intercompany loans are denominated in local currencies. Fluctuations in the value of the US dollar and foreign currencies, particularly pound sterling, may affect our results of operations when translated into US dollars. We do not currently engage in any currency-hedging activities to seek to limit the risk of exchange rate fluctuations. However, in the future, we may use derivative instruments, such as foreign currency
Burford Capital Annual Report 2023 139
forward and option contracts, to seek to hedge certain exposures to fluctuations in foreign currency exchange rates. The use of such hedging activities may not offset any or more than a portion of the adverse financial effects of unfavorable movements in foreign exchange rates over the limited time the hedges are in place. Moreover, the use of hedging instruments may introduce additional risks if we are unable to structure effective hedges.
In addition, from time to time, we may take substantial positions in the securities of companies that are subject to a corporate or regulatory event or to litigation. While we may seek to hedge these positions, appropriate hedging may not be available at a cost we consider reasonable or at all. If the value of the underlying securities was to decline, we would experience losses, which may have a materially adverse effect on our business, financial position, results of operations and/or liquidity.
The tax treatment of our financing agreements is subject to significant uncertainty.
We structure our financings on a case-by-case basis in consultation with our professional advisers and seek to comply with applicable law. However, there is limited authority and significant uncertainty regarding the tax treatment of legal finance and/or the structures through which we provide our financing in the applicable jurisdictions in which they are made. Accordingly, there can be no assurance that an applicable tax authority will accept our position on the tax treatment of a financing or the structures we employ. If an applicable tax authority was to successfully maintain a different position, the value of our assets could be adversely affected or we could be subject to additional tax liability, or both. In addition, tax laws and regulations are under constant development and often subject to change as a result of government policy, frequently with retroactive effect. Changes in applicable tax laws could adversely affect the taxation of us or our assets.
Risks relating to regulation
The regulatory and legal requirements that apply to our business and operations are subject to change from time to time and may become more restrictive, which may make compliance with applicable requirements more difficult or expensive or otherwise restrict our ability to conduct our business and operations in the manner in which they are now conducted. Changes in applicable regulatory and legal requirements, including changes in their enforcement, could materially and adversely affect our business, financial position, results of operations and/or liquidity. As a matter of public policy, the regulatory bodies that regulate our business and operations are generally responsible for safeguarding the integrity of the securities and financial markets and protecting private fund investors who participate in those markets rather than protecting the interests of our shareholders.
The laws, regulations and rules relating to legal finance are evolving and may be uncertain, which may have negative consequences for the value or enforcement of our contractual agreements with our counterparties, our ability to do business in certain jurisdictions or our cost of doing business.
The laws, regulations and rules in the area of acquiring or otherwise taking a financial position or a commercial interest with respect to legal claims and defenses is evolving and can be complex and uncertain in the United States and elsewhere. Our legal finance assets could be open to challenge or subsequently reduced in value or extinguished as a result of these regulations. In various jurisdictions, there are prohibitions or restrictions in connection with financing claims (known in many common law jurisdictions as maintenance, and a form of maintenance, called champerty) or the assignment of, or other economic participation in, legal claims. For example, in the State of New York, Judiciary Law § 489 prohibits the assignment of a legal claim in certain circumstances, and certain other jurisdictions have similar laws. In the State of New York, the relevant case law provides at the date of this Annual Report that the contracts underlying our legal finance assets are valid. However, such case law may be overruled or the statutory and other laws in the State of New York or other jurisdictions could be amended to include additional prohibitions or restrictions, which may adversely affect our business. The ability to participate financially in a lawyer’s fees is also limited in certain jurisdictions (including by ethical rules prohibiting a lawyer from sharing fees with non-lawyers). Such prohibitions and restrictions are governed by the laws, regulations and rules of each relevant jurisdiction and vary in degrees of strength and enforcement in different state, federal or non-US jurisdictions. This is a complex issue that involves both substantive law and choice of law principles. However, in many jurisdictions, the relevant issues may not have been considered by the courts nor addressed by statute and thus obtaining legal advice or clarity is difficult. If we, our counterparties or the lawyers handling the underlying matters were to be found to have violated the relevant prohibitions or restrictions in connection with certain matters, there could be a materially adverse effect on the value of the affected legal finance assets, our ability to enforce the relevant contractual agreements with our counterparties and the amounts we would be able to recover with respect to such matters or our costs for such matters.
140 Burford Capital Annual Report 2023
In addition, politicians, advocacy groups and media reports have, in the past, advocated action to restrict legal finance. Some jurisdictions have enacted or are considering enacting laws, regulations or rules requiring the disclosure of litigation financing or other non-prohibitory regulation. Such laws, regulations or rules or other future laws, regulations or rules may deter parties from engaging us, result in a reduction in the overall number of potential legal finance assets and/or adversely affect the value of legal finance assets already in existence in such jurisdictions.
The laws, regulations, rules and supervisory guidance and policies applicable to our business activities are subject to regular modification and change, including by institutions such as US state and federal legislatures, bar associations, courts and other US and non-US legislative, regulatory, judicial or advisory bodies. For example, in the United States, legislation has been introduced in the US Congress in multiple sessions that would require litigants to “produce for inspection and copying” any legal financing agreements creating contingent rights to payment in class actions and multidistrict litigations. Such legislation has not received consideration beyond introduction, but we expect that the same or similar legislation will be introduced again in the future. In addition, similar legislation is introduced in various US state legislatures from time to time. In addition, some newer entrants to the market, such as Singapore and Hong Kong, have also enacted regulatory regimes largely focused on capital adequacy and constraining abusive behavior. Further, recent case law in the United Kingdom held that certain litigation financing arrangements where the litigation finance provider is entitled to a percentage of any damages recovered are unenforceable if they do not comply with relevant legal requirements.
Changes to laws, regulations or rules, including changes in interpretation or implementation of laws, regulations or rules, could affect us in substantial and unpredictable ways. Such changes could subject us to additional costs, delay new financing arrangements, limit the quantity and size of our financing arrangements, limit the types of products and services we may offer or our financing opportunities, decrease returns on our legal finance or other assets and allow certain clients to void our contracts with them, any of which may have a materially adverse effect on our business, financial position, results of operations and/or liquidity.
Our asset management business is highly regulated, and changes in regulation or regulatory violations could adversely affect our business.
Our asset management business is highly regulated, and the applicable regulations are subject to change. Compliance with these regulations requires a significant investment of management and financial resources, and any liability imposed on us for violations of existing or future regulations could adversely affect our asset management business. The SEC regulates our investment management activities and is empowered to conduct investigations and administrative proceedings that can potentially result in fines, suspensions of personnel, changes in policies, procedures or disclosure or other sanctions, including censure, the issuance of cease-and-desist orders, the suspension or expulsion of an investment adviser from registration or memberships or the commencement of a civil or criminal lawsuit against us or our personnel. Any SEC actions or initiatives against us could have an adverse effect on our business, financial position, results of operations and/or liquidity. Even if an investigation or proceeding does not result in a sanction or the sanction imposed against us or our personnel was small in monetary amount, the adverse publicity relating to the investigation, proceeding or imposition of these sanctions could harm our reputation.
The SEC enacted, and proposes to enact, new rules and amendments to existing rules under the Investment Advisers Act that will impact our asset management business. Two of these new rules relate to the Form PF, which is a regulatory filing made to the SEC by investment advisers to private funds. The third new rule is a series of requirements that would expand regulatory obligations for private fund investment advisers. In addition, proposed rules relate to oversight of service providers that perform certain covered functions related to advisory services and to cybersecurity risk management. The new and proposed rules, if the proposed rules are finalized and enacted with or without modifications, will likely require significant investment of additional management and financial resources and otherwise have a significant impact on our asset management business, which may have an adverse effect on our business, financial position, results of operations and/or liquidity.
We are subject to the risk of being deemed an investment company.
If we were deemed an “investment company” under the US Investment Company Act of 1940, as amended (the “Investment Company Act”), applicable restrictions could make it impractical for us to continue our business as contemplated and could have a material adverse effect on our business. An entity will generally be deemed to be an “investment company” for purposes of the Investment Company Act if (i) it is or holds itself out as being engaged primarily, or proposes to engage primarily, in the business of investing, reinvesting or trading in securities (frequently
Burford Capital Annual Report 2023 141
referred to as an “orthodox” investment company) or (ii) absent an applicable exemption, it owns or proposes to acquire investment securities having a value exceeding 40% of the value of its total assets (exclusive of US government securities and cash items) on an unconsolidated basis (frequently referred to as an “inadvertent” investment company). Excluded from the term “investment securities”, among others, are US federal government securities and securities issued by majority-owned subsidiaries that are not themselves investment companies and are not relying on the exception from the definition of investment company set forth in Section 3(c)(1) or Section 3(c)(7) of the Investment Company Act.
We are and hold ourselves out as a leading global finance and asset management firm focused on law. We believe that, even if our legal finance assets were to be determined to constitute investment securities for purposes of the Investment Company Act, we should be exempt from registration as an investment company under Section 3(c)(5) of the Investment Company Act. Section 3(c)(5) of the Investment Company Act excludes from the definition of investment company “[a]ny person who is not engaged in the business of issuing redeemable securities, face-amount certificates of the installment type or periodic payment plan certificates, and who is primarily engaged in one or more of the following businesses: (A) [p]urchasing or otherwise acquiring notes, drafts, acceptances, open accounts receivable, and other obligations representing part or all of the sales price of merchandise, insurance, and services or (B) making loans to manufacturers, wholesalers, and retailers of, and to prospective purchasers of, specified merchandise, insurance, and services”. We and our subsidiaries that conduct our core legal finance business are not in the business of issuing redeemable securities, face-amount certificates of the installment type or periodic payment plan certificates and are primarily engaged in the business of legal finance by way of financing and acquiring notes evidencing financing, for purposes of the Investment Company Act, to parties engaged in litigation or arbitration and their law firms. The purpose of such financing is to provide the counterparties with the capital necessary to finance the costs associated with litigation.
The Investment Company Act and the rules thereunder contain detailed parameters for the organization and operation of investment companies. Among others, the Investment Company Act and the rules thereunder limit or prohibit transactions with affiliates, impose limitations on the issuance of debt and equity securities, generally prohibit the issuance of options and impose certain governance requirements. We conduct our operations so that we will not be deemed an investment company under the Investment Company Act, which requires us to conduct our business in a manner that does not subject us to the registration and other requirements of the Investment Company Act. If we are deemed to be an investment company under the Investment Company Act, requirements imposed by the Investment Company Act, including limitations on our capital structure, ability to transact business with affiliates and ability to compensate key employees, could make it impractical for us to continue our business as currently conducted, impair the agreements and arrangements between and among us and our customers and materially adversely affect our business, financial position, results of operations and/or liquidity.
Risks relating to cybersecurity, third-party service providers, information systems and data privacy and protection
Cybersecurity risks could result in the loss of data, interruptions in our business or damage to our reputation and subject us to regulatory actions, increased costs and financial losses, any of which could have a material adverse effect on our business, financial position, results of operations and/or liquidity.
Our information systems may fail to operate properly or become disabled as a result of tampering or a breach of our network security systems or otherwise, as well as a result of tampering or a breach of the network security systems of our third parties. In addition, our information systems and those of our third parties face ongoing cybersecurity threats and cyberattacks. Cyberattacks on our information systems, and those of our third parties, could involve, and in the past have involved, attempts intended to obtain unauthorized access to our proprietary information, destroy data or disable, degrade or sabotage our systems, or divert or otherwise steal funds, including through the introduction of computer viruses, “phishing” attempts and other forms of social engineering. Cyberattacks and other security threats could originate from a wide variety of external sources, including cyber criminals, nation state hackers, hacktivists and other outside parties. Cyberattacks and other security threats could also originate from the malicious or accidental acts of insiders, such as employees. In addition, there is an increased risk that we may experience cybersecurity-related incidents as a result of our employees, third-party service providers or other third parties working remotely on less secure systems and environments. Recent developments in the threat landscape that have heightened cybersecurity risk include use of AI and machine learning, as well as an increased number of cyber extortion and ransomware attacks, with higher financial ransom demand amounts and increasing sophistication and variety of ransomware techniques and methodology. Increasing socioeconomic and political instability in some countries has further heightened these risks. Retaliatory acts by foreign governments in response to Western sanctions could include cyberattacks that could directly
142 Burford Capital Annual Report 2023
or indirectly impact our business. There has been an increase in the frequency and sophistication of the cybersecurity threats we face, with cyberattacks ranging from those common to businesses generally to those that are more advanced and persistent, which may target us, and our third parties, because we hold a significant amount of privileged information about our legal finance assets. As a result, we and our third parties may face a heightened risk of a cybersecurity incident or disruption with respect to such privileged information. While we take significant efforts to protect our information systems and information, including establishing internal processes and implementing technological measures designed to provide multiple layers of security, our safety and security measures might be insufficient to prevent damage to, or interruption or breach of, our information systems, data (including personal data), and operations, especially because cyberattack techniques change frequently or are not recognized until successful. If our systems, or those of our third parties, are compromised, do not operate properly or are disabled, or if we fail to provide the appropriate regulatory or other notifications in a timely manner, we could suffer financial loss, a disruption of our business, liability to our shareholders and/or private funds and private fund investors, regulatory intervention or reputational damage. Furthermore, if we fail to comply with relevant laws, rules and regulations, it could result in regulatory investigations and penalties, which could lead to negative publicity and reputational harm and may cause our shareholders and/or private fund investors and counterparties to lose confidence in the effectiveness of our security measures.
The failure of our third-party service providers to fulfill their obligations, or misconduct by our third-party service providers, may have a material adverse effect on our business, financial position, results of operations and/or liquidity.
We depend on third-party service providers for, among other things, fund administration and provision of a variety of corporate services to manage our multi-jurisdictional structure. There can be no assurance that our internal controls and procedures will be effective in monitoring and managing such third-party service providers. The failure of our third-party service providers to fulfill their obligations to us, or misconduct by our third-party service providers, could disrupt our operations and lead to reputational harm, which may have a material adverse effect on our business, financial position, results of operations and/or liquidity.
Our operations are dependent on the proper functioning of information systems.
We rely on our information systems, or those of our third parties, to conduct our business, including case management and documentation, as well as producing financial and management reports on a timely basis and maintaining accurate records and utilizing AI tools or solutions. Our information technology processes and information systems, or those of our third parties, may not operate as expected, may not fulfil their intended purpose or may be damaged or interrupted by increases in usage, human error, unauthorized access, natural or man-made hazards or disasters or similarly disruptive events. Any disruption or failure of our information systems, or those of our third parties, including a disruption or failure involving electronic communications or other services used by us or our third-party service providers or affecting our cloud services providers, could lead to costs and disruptions that could adversely affect our reputation, prospects, business, financial position, results of operations and/or liquidity.
Information systems are susceptible to malfunctions and interruptions (including those due to equipment damage, power outages, computer viruses, natural or man-made hazards or disasters and a range of other hardware, software and network problems). A significant malfunction or interruption of one or more of our information systems, or those of our third parties, could adversely affect our ability to keep our operations running efficiently and affect service availability. In addition, it is possible that a malfunction of our data system security measures could enable unauthorized persons to access sensitive data, including information relating to our intellectual property or litigation or business strategy or those of our clients. Any such malfunction or disruptions could cause economic losses. A failure of our information systems, or those of our third parties, could also cause damage to our reputation which could harm our business. Any of these developments, alone or in combination, could have a material adverse effect on our business, financial position, results of operations and/or liquidity.
We are required to maintain the privacy and security of personal information and comply with applicable data privacy and protection laws and regulations.
We collect, store and process personal information about individuals, including employees, contractors and third-party service providers as well as suppliers, agents, clients, investors and counterparties. This information is increasingly subject to a range of international data privacy and protection laws and regulations, including the California Consumer Privacy Act, the California Privacy Rights Act, the UK General Data Protection Regulation, the UK Data Protection Act
Burford Capital Annual Report 2023 143
2018, the EU General Data Protection Regulation and the DIFC Data Protection Law No. 5 of 2020. Additional data privacy and protection laws and regulations may come into effect in the United States on a state-by-state basis or worldwide that could potentially impact our business. While we have invested and continue to invest resources to comply with data privacy and protection laws and regulations, many of these laws and regulations are new, complex and subject to interpretation. To maintain compliance with these laws and regulations, we may incur increased costs to continually evaluate and modify our policies and processes and to adapt to new legal and regulatory requirements. A failure to comply with data privacy and protection laws and regulations could result in negative publicity, damage to our reputation, regulatory investigations, penalties or significant legal liability. Furthermore, our business and operations could also be adversely affected if legislation or regulations are expanded to require changes in our business practices or if governing jurisdictions interpret or implement their legislation or regulations in ways that negatively affect our business.
Risks relating to our indebtedness
We may not be able to generate sufficient cash to service our indebtedness and may be forced to take other actions to meet our obligations under our indebtedness, which may not be successful.
We have significant debt service obligations. Our ability to make principal or interest payments when due on our indebtedness and to fund our ongoing operations will depend on our future performance and our ability to generate cash, which is subject to general economic, financial, competitive, legislative, legal, regulatory and other factors, many of which are beyond our control. In addition, our cash flows, to a large extent, depend on the outcome of litigation matters to which we have made a capital commitment. Such outcomes are inherently uncertain, and it is difficult to accurately forecast our cash flows for any future period. While the interest payment dates on our debt obligations are fixed, the cash inflows from litigation matters fluctuate materially. In addition, the trust deeds and the indentures governing our indebtedness contain various covenants, including the requirement to maintain a certain leverage ratio in the case of the trust deeds. If we are unable to comply with these covenants, payment on our indebtedness may become due early. If we do not have sufficient cash at the required time, we may have difficulty meeting our payment obligations under our existing indebtedness.
At the maturity of the obligations under our outstanding indebtedness and any other indebtedness that we may incur in the future, if we do not have sufficient cash flows from operations and other capital resources to pay our debt obligations or to fund our other liquidity needs, or if we are otherwise restricted from doing so due to corporate, tax or contractual limitations, we may be required to refinance our indebtedness. If we are unable to refinance all or a portion of our indebtedness or obtain such refinancing on terms acceptable to us, we may be forced to reduce or delay our business obligations, activities or capital expenditures, sell assets, raise additional debt or equity financing in amounts that could be substantial or restructure or refinance all or a portion of our indebtedness, on or before maturity. There can be no assurance that we would be able to accomplish any of these alternatives on a timely basis or on satisfactory terms, if at all, or that those actions would secure sufficient capital to meet our obligations under our indebtedness.
In particular, our ability to restructure or refinance our indebtedness will depend, in part, on our financial condition at the time of restructuring or refinancing, as the case may be, as well as on many factors outside our control, including then-prevailing conditions in the international credit and capital markets. Any refinancing of our indebtedness could be at higher interest rates than our existing indebtedness and may require us to comply with more onerous covenants. The terms of our existing or future indebtedness may restrict us from adopting some of these alternatives. In addition, any failure to make payments of interest or principal on our outstanding indebtedness on a timely basis would likely result in a reduction of our credit rating, which could harm our ability to incur additional indebtedness.
Despite our level of indebtedness, we may be able to incur substantial additional indebtedness, which could further exacerbate the risks associated with our existing indebtedness.
Despite our level of indebtedness, we may be able to incur substantial additional indebtedness in the future. Although the agreements governing our indebtedness contain restrictions on the incurrence of additional indebtedness, these restrictions are subject to a number of significant qualifications and exceptions and, under certain circumstances, the amount of indebtedness that could be incurred in compliance with these restrictions could be substantial. If additional indebtedness is added to our existing levels of indebtedness, the related risks that we now face would increase, and we may not be able to meet all of the obligations under our existing indebtedness. In addition, our debt instruments do not prevent us from incurring obligations that do not constitute indebtedness.
144 Burford Capital Annual Report 2023
Risks relating to our ordinary shares
Our ordinary shares are traded on more than one market, which may result in price and volume variations.
Our ordinary shares have traded on the NYSE since October 2020 and on AIM since 2009. Trading in our ordinary shares on these markets takes place in different currencies (US dollar on the NYSE and pound sterling on AIM) and at different times (resulting from different time zones, different trading days and different public holidays in the United States and the United Kingdom). The trading prices, volatility and liquidity of our ordinary shares on these two markets may differ due to these and other factors, including different custody and settlement arrangements that may affect cross-market trading. Any decrease in the price of our ordinary shares on AIM could cause a decrease in the trading price of our ordinary shares on the NYSE, and vice versa. Investors could seek to sell or buy our ordinary shares to take advantage of any price differences between the markets through a practice referred to as arbitrage. Any arbitrage activity could create unexpected volatility in the trading price of our ordinary shares.
The trading price of our ordinary shares may fluctuate significantly.
The market price of our ordinary shares has been highly volatile. For example, the market price of our ordinary shares has ranged on AIM from a high of £18.70 per ordinary share on March 14, 2019 (approximately $24.84 using the exchange rate of $1.3282 on March 14, 2019) to a low of £2.81 per ordinary share on March 18, 2020 (approximately $3.31 using the exchange rate of $1.1763 on March 18, 2020). The market price of our ordinary shares on the NYSE and AIM could continue to be volatile as a result of the risks set forth in this Annual Report and others beyond our control, including:
| ▪ | Regulatory actions or changes in laws with respect to legal finance or practices commonly used in the legal finance industry |
| ▪ | Actual or anticipated fluctuations in our financial position and/or results of operations |
| ▪ | Increased competition and actual or anticipated changes in our growth rate relative to our competitors |
| ▪ | Announcements by us or our competitors of significant acquisitions, strategic partnerships, joint ventures, collaborations or capital commitments |
| ▪ | Failure to meet or exceed financial estimates and projections of the investment community or that we provide to the public |
| ▪ | Issuance of research reports by securities analysts or other members of the financial community |
| ▪ | Fluctuations in the valuation of companies perceived by investors to be comparable to us |
| ▪ | Additions or departures of key management |
| ▪ | Sales or issuances of our ordinary shares by us, our insiders or our other shareholders |
| ▪ | General economic and market conditions |
These and other market and industry factors may cause the market price and demand for our ordinary shares to fluctuate significantly, regardless of our actual operating performance. In addition, the trading market for our ordinary shares is affected by the research and reports that equity research analysts publish about us and our business, over which we have no control. The price of our ordinary shares could fluctuate significantly if one or more equity analysts issue unfavorable commentary or cease publishing reports about us.
There can be no assurance that we will pay dividends or distributions.
The Board has declared a final cash dividend for the year ended December 31, 2023 of 6.25 cents per ordinary share, payable in June 2024, subject to shareholder approval at our upcoming annual general meeting in May 2024. In the past, the Board did not declare an interim cash dividend for the year ended December 31, 2020 and, given the economic uncertainties surrounding the Covid-19 pandemic, the Board did not propose payment of a final cash dividend for the year ended December 31, 2019. We cannot assure you that we will declare dividends or distributions in the future. The declaration and payment of dividends and distributions, if any, will always be subject to the discretion of the Board and the requirements of Guernsey law (including, among others, satisfaction of a statutory solvency test). The timing and amount of any dividends or distributions declared will depend on, among other things, our cash flows
Burford Capital Annual Report 2023 145
from operations and available liquidity, our earnings and financial position and any applicable contractual restrictions, including restrictions in the instruments governing our debt securities.
Given the demand for our capital and the tax inefficiency of dividend payments to certain shareholders, we anticipate continuing to pay a total annual dividend of 12.50¢ per ordinary share, payable semi-annually, but do not anticipate regular increases in our dividend per ordinary share level. However, the Board may review our dividend per ordinary share level from time to time.
In addition, we are a holding company with no material assets, other than the ownership of our subsidiaries, and no independent means of generating revenues. Accordingly, our ability to pay dividends or distributions will be subject to the ability of our subsidiaries to transfer funds to us.
Future issuances or sales of our securities may cause the market price of our ordinary shares to decline.
The market price of our ordinary shares could decline as a result of issuances of securities (including our ordinary shares) by us or sales by our existing shareholders of ordinary shares in the market, or the perception that such issuances or sales could occur. Sales of our ordinary shares by shareholders may make it more difficult for us to sell equity securities at a time and price that we deem appropriate. See “Compensation—Senior management and employee compensation—LTIP” for information with respect to our ordinary shares issued, and available for future grants, under the LTIP. Issuances or sales of substantial numbers of our ordinary shares, or the perception that such issuances or sales could occur, may adversely affect the market price of our ordinary shares.
We are currently a foreign private issuer within the meaning of the rules under the Exchange Act and, as such, we are exempt from certain provisions applicable to US domestic public companies.
Because we currently qualify as a foreign private issuer within the meaning of the rules under the Exchange Act, we are exempt from certain provisions of the securities rules and regulations that are applicable to US domestic public companies, including, among others:
| ▪ | The rules under the Exchange Act requiring the filing with the SEC of quarterly reports on Form 10-Q and current reports on Form 8-K |
| ▪ | The sections of the Exchange Act regulating the solicitation of proxies, consents or authorizations in respect of a security registered under the Exchange Act |
| ▪ | The sections of the Exchange Act requiring insiders to file public reports of their stock ownership and trading activities and liability for insiders who profit from trades made in a short period of time |
| ▪ | The Regulation FD rules governing the selective disclosure of material non-public information |
We are required to file an annual report on Form 20-F within four months following the end of each fiscal year. In addition, during the year ended December 31, 2023, we have begun making available our interim unaudited condensed consolidated financial statements on a quarterly basis, commencing with the quarter ended on March 31, 2023. Press releases relating to financial results and material events are also furnished to the SEC on Form 6-K. However, the information we are required to file with, or furnish to, the SEC is less extensive and less timely compared to that required to be filed with the SEC by US domestic public companies. As a result, our shareholders will not receive the same information that would be made available if we were a US domestic public company.
As a foreign private issuer whose ordinary shares are listed on the NYSE, we currently follow certain home country corporate governance practices instead of certain NYSE requirements.
We are incorporated under the laws of Guernsey and our corporate affairs, including with respect to corporate governance, are principally governed by the Guernsey Companies Law. We are currently a foreign private issuer within the meaning of the rules under the Exchange Act and the NYSE. Under the NYSE rules, a foreign private issuer is subject to less stringent corporate governance requirements. Subject to certain exceptions, the rules of the NYSE permit a foreign private issuer to follow its home country practices in lieu of the listing requirements of the NYSE, including, among others, (i) the requirement to adopt and disclose corporate governance guidelines and (ii) the requirement to have an internal audit function. Accordingly, our shareholders may not have the same protections afforded to shareholders of companies that are subject to all of the NYSE corporate governance requirements for US domestic public companies.
146 Burford Capital Annual Report 2023
Our expected loss of foreign private issuer status will increase our regulatory and compliance costs.
We expect to lose foreign private issuer status as soon as the beginning of 2025 depending on whether the majority of our ordinary shares will be held in the United States. Following the loss of foreign private issuer status, we will no longer be eligible to use the rules designated for foreign private issuers and will be required to comply with the reporting regime that applies to US domestic public companies. The regulatory and compliance costs to us under US securities laws as a US domestic public company will potentially be greater than the costs incurred as a foreign private issuer. Among other consequences, once we are not a foreign private issuer, we will be required to file periodic and current reports and registration statements on US domestic public company forms with the SEC, which are generally more detailed and extensive than the forms available to a foreign private issuer and are generally required to be filed within shorter time periods. In addition, we will be required to comply with the proxy requirements applicable to US domestic public companies and will lose the ability to rely on exemptions from corporate governance requirements that are available to foreign private issuers.
The requirements of being a US public company may strain our resources, divert management’s attention and affect our ability to attract and retain key personnel and qualified senior management and members of the Board.
We are subject to the reporting requirements of the Exchange Act, the Sarbanes-Oxley Act, the Dodd-Frank Wall Street Reform and Consumer Protection Act of 2010, as amended, the listing requirements of the NYSE and other securities rules and regulations applicable to a foreign private issuer within the meaning of the rules under the Exchange Act. Compliance with these rules and regulations has increased our legal and financial compliance costs, making some activities more difficult, time-consuming and costly, and has increased demand on our systems and resources. Such demands would likely continue to increase, particularly when we expect to lose our status as a foreign private issuer. As a result of the complexity involved in complying with the rules and regulations applicable to US public companies, our management’s attention may be diverted from other business concerns, which could adversely affect our reputation, prospects, business, financial position, results of operations and/or liquidity. In addition, as a US public company, it is more expensive for us to maintain adequate director and officer liability insurance, and we may be required to accept reduced coverage or incur substantially higher costs to obtain coverage. These factors could also make it more difficult for us to attract and retain qualified senior management and members of the Board.
The material weakness that was identified in our internal control over financial reporting and the determination that our internal control over financial reporting and disclosure controls and procedures were not effective could impact investors’ views on the reliability of our consolidated financial statements and could result in loss of investor confidence, shareholder litigation or adverse regulatory consequences, any of which could cause the market value of our ordinary shares or debt securities to decline or impact our ability to access the capital markets.
The SEC rules implementing Section 404(a) of the Sarbanes-Oxley Act require a company subject to the reporting requirements of the Exchange Act to complete a comprehensive evaluation of its internal control over financial reporting. To comply with these rules, we are required to assess, document and test our internal control procedures, and our management is required to assess and issue a report concerning our internal control over financial reporting. We also maintain disclosure controls and procedures that are designed, among other things, to ensure that information required to be disclosed in the reports we file or furnish under the Exchange Act is recorded, processed, summarized and reported within the time periods specified in the SEC’s rules and forms and that such information is accumulated and communicated to management, including our Chief Executive Officer and Chief Financial Officer, as appropriate to allow timely decisions regarding required disclosure. In addition, we are subject to the independent auditor attestation requirements under Section 404(b) of the Sarbanes-Oxley Act, pursuant to which our independent auditor is required to attest to and report on management’s assessment of our internal control over financial reporting.
Under the PCAOB auditing standards applicable to us as a reporting company under the Exchange Act, a “material weakness” is a deficiency, or a combination of deficiencies, in internal control over financial reporting, such that there is a reasonable possibility that a material misstatement of our consolidated financial statements will not be prevented or detected on a timely basis. As disclosed under “Controls and procedures”, a material weakness existed in our internal control over financial reporting at December 31, 2023 due to a lack of available evidence to demonstrate the precision of our management’s review of the process to determine certain assumptions used in the measurement of the fair value of our capital provision assets. See “Controls and procedures—Management’s report on internal control over financial reporting” for additional information with respect to such material weakness. While we intend to establish
Burford Capital Annual Report 2023 147
remediation controls that are designed to address such material weakness, there can be no assurance that additional material weaknesses will not be identified in the future.
In addition, as previously disclosed in the 2022 Annual Report, we revised our approach to determining the fair value of our capital provision assets in consideration of Accounting Standards Codification Topic 820—Fair Value Measurement (“ASC 820”). In connection with this revision in approach, our management determined, together with the Audit Committee, that our historical approach to fair value accounting did not comply with US GAAP and resulted in measurement errors requiring restatement of our historical audited consolidated financial statements at and for the years ended December 31, 2021, 2020 and 2019 and the unaudited condensed consolidated financial statements for the six months ended June 30, 2022. Under the PCAOB auditing standards, a restatement of financial statements is by definition evidence of a material weakness in internal controls. Thus, in connection with the identified material weakness in our internal control over financial reporting which failed to prevent or detect the identified misstatements requiring the restatement of our consolidated financial statements, we concluded that our internal control over financial reporting and disclosure controls and procedures were not effective at each of December 31, 2022 and 2021. Furthermore, as previously disclosed under “Controls and procedures” in the annual report on Form 20-F for the year ended December 31, 2021 filed with the SEC on March 29, 2022, material weaknesses unrelated to the material weakness discussed above existed in our internal control over financial reporting at December 31, 2021, and the determination was made that our internal control over financial reporting and disclosure controls and procedures were not effective at December 31, 2021, although we have established appropriate remediation controls with the result that we remediated such material weaknesses during the year ended December 31, 2022. We also previously restated our historical audited consolidated financial statements at and for the years ended December 31, 2020, 2019 and 2018 and the unaudited condensed consolidated financial statements for the six months ended June 30, 2021 and 2020 in connection with (i) the consolidation of certain subsidiaries, most notably Colorado, and (ii) the potential future expense associated with “carry” payments that may be payable to certain employees in connection with future realized performance of our portfolio.
If additional material weaknesses are identified in the future or if we are unable to successfully remediate our existing or any future material weaknesses or other deficiencies in our internal control over financial reporting or disclosure controls and procedures, our ability to record, process and report financial information accurately and to prepare consolidated financial statements within the time periods specified by the rules and regulations of the SEC could be adversely affected. This could in turn subject us to shareholder litigation or adverse regulatory consequences, including sanctions by the SEC or violations of the applicable listing rules of the NYSE, which may result in a breach of the covenants under our existing or future debt instruments. In addition, any failure to implement and maintain effective internal control over financial reporting could adversely affect the results of periodic management evaluations and the independent registered public accounting firm’s annual attestation reports regarding the effectiveness of our internal control over financial reporting. There could also be a negative reaction in the financial markets due to a loss of investor confidence in us and the reliability of our consolidated financial statements, which could have a material adverse effect on our business, financial position, results of operations and/or liquidity and lead to a decline in the market price of our ordinary shares or debt securities or impact our ability to access capital markets.
If we are classified as a PFIC for US federal income tax purposes, such classification could result in adverse US federal income tax consequences to US investors.
If we are treated as a passive foreign investment company (“PFIC”) in any year during which a US Holder holds our ordinary shares, such US Holder could be subject to significant adverse US federal income tax consequences as a result of the ownership and disposition of our ordinary shares. See “Tax considerations—Material US federal income tax considerations” for additional information with respect to PFIC classification and consequences to US federal income tax consequences to US investors.
Risks relating to our incorporation in Guernsey
The rights and protections of our shareholders are governed by Guernsey law, which may differ in certain material respects from the rights and protections of shareholders of US domestic public companies.
Our corporate affairs are governed principally by our memorandum and articles of incorporation and by the Guernsey Companies Law. The Guernsey Companies Law differs in certain material respects from laws applicable to companies organized under the laws of the United States. See “Memorandum and articles of incorporation”. As a result, the rights
148 Burford Capital Annual Report 2023
and protections of our shareholders may differ in certain material respects from the rights and protections of shareholders of US domestic public companies.
The Royal Court of Guernsey may require a party to litigation to reimburse the prevailing party for its costs associated with the litigation, and our articles of incorporation entitle us to require shareholders to provide security against any such costs awarded to us by the Royal Court of Guernsey.
The Royal Court of Guernsey may require a party to litigation to reimburse the prevailing party for its costs associated with the litigation. Accordingly, if a shareholder was to bring an action against us in the Royal Court of Guernsey and we prevail in the litigation, the Royal Court of Guernsey may order the shareholder to reimburse us for our fees, costs and expenses incurred in connection with the defense of such action.
Article 40 of our articles of incorporation provides that we are entitled to security for costs in connection with any proceedings brought against us by a shareholder (which may include proceedings in jurisdictions outside Guernsey). This provision, for example, applies to any proceeding brought against us by a shareholder in its capacity as a shareholder under the Guernsey Companies Law or our articles of incorporation. Article 40 of our articles of incorporation does not apply to any proceeding brought against any of our directors, officers or affiliates. This means that, if a shareholder brings an action against us in the Royal Court of Guernsey, we may request that the Royal Court of Guernsey order such shareholder to provide security (which will need to be in a form acceptable to the Royal Court of Guernsey and may be direct or through a third-party surety) to satisfy any award of costs the Royal Court of Guernsey may award to us.
The Royal Court of Guernsey’s ability to award costs to us, and the provision in our articles of incorporation requiring shareholders to provide security for any such award of costs to us, could discourage shareholders from bringing lawsuits that might otherwise benefit our shareholders.
The insolvency laws of Guernsey and other jurisdictions may not be as favorable to you as the US bankruptcy laws.
We are incorporated under the laws of Guernsey. In the event of a bankruptcy, insolvency or similar event, proceedings could be initiated in Guernsey or another relevant jurisdiction. The bankruptcy, insolvency, administrative and other laws of our and our subsidiaries’ jurisdictions of organization or incorporation may be materially different from, or in conflict with, one another and those of the United States, including in the areas of rights of creditors, shareholders, priority of governmental and other creditors and timing and duration of the proceedings. The application of these laws, or any conflict among them, could call into question whether any particular jurisdiction’s law should apply, adversely affecting our shareholders’ ability to enforce their rights under the ordinary shares in those jurisdictions or limit any amounts that they may receive.
It may be complex or time-consuming to effect service of US court process or enforcement of US judgments against us or certain of our directors and officers.
We are incorporated under the laws of Guernsey, and certain of our directors and officers reside outside the United States. In addition, a substantial portion of our assets is located outside the United States. It may be more complex or time-consuming to serve US court process on us or our officers or directors or to enforce US court judgments against us than if we were a US company with all of our officers and directors located in the United States, including judgments predicated upon civil liabilities under US federal securities laws.
In Guernsey, foreign judgments may be recognized by the Royal Court of Guernsey either pursuant to the Judgments (Reciprocal Enforcement) (Guernsey) Law, 1957 (as amended), which provides an obligatory statutory framework for the enforcement of judgments from certain recognized jurisdictions, or pursuant to the principles of customary and common law. Guernsey is not party to any convention or bilateral treaty with the United States providing for the reciprocal recognition and enforcement of judgments. As a result, a judgment obtained in a court in the United States against us or any of our officers and directors incorporated or located, as applicable, in Guernsey will not automatically be recognized or enforced in Guernsey but may be enforceable by separate action on the judgment in accordance with the Guernsey customary and common law rules. To obtain an enforceable judgment in Guernsey, the claimant would be required to bring new proceedings before the competent court in Guernsey (typically summary judgment proceedings). In such proceedings, the Guernsey court is unlikely to re-hear the case on its merits, except in accordance with principles of private international law. According to current practice, the Royal Court of Guernsey
Burford Capital Annual Report 2023 149
may enforce the judgment of a court in the United States in a claim in personam if the following conditions, among other things, are satisfied:
| ▪ | The judgment is for a debt or fixed or ascertainable sum of money (provided that the judgment does not relate to US penal, revenue or other public laws) |
| ▪ | The judgment is final and conclusive |
| ▪ | The court in the United States had, at the time when proceedings were served, jurisdiction over the judgment debtor in accordance with the principles of private international law, as applied by Guernsey law |
| ▪ | The judgment was not (i) procured by fraud or (ii) given in breach of principles of natural or substantial justice |
| ▪ | Recognition of the judgment would not be contrary to Guernsey public policy or natural justice |
| ▪ | The judgment is not a judgment on a matter previously determined by a Guernsey court, or another court whose judgment is entitled to recognition in Guernsey, or that conflicts with an earlier judgment of such court |
| ▪ | The judgment was not obtained in breach of an agreement for the settlement of disputes |
| ▪ | Enforcement proceedings are not time barred under the Guernsey Laws on Prescription/Limitation. If the Guernsey court gives judgment for the sum payable under a judgment of a US court, the Guernsey judgment would be enforceable by the methods generally available for the enforcement of Guernsey judgments |
These conditions give the court discretion whether to allow enforcement by any particular method. In addition, it may not be possible to obtain a Guernsey judgment or to enforce a Guernsey judgment if the judgment debtor is subject to any administration, winding-up or similar proceedings, if there is delay, if an appeal is pending or anticipated against the Guernsey judgment in Guernsey or against the foreign judgment in the courts of the United States or if the judgment debtor has any set-off or counterclaim against the judgment creditor.
Furthermore, any pre-existing security interest in Guernsey situs assets may affect both the enforcement of a judgment debt against the assets in which the interest has been created and the ability of any persons empowered under foreign insolvency law to act on behalf of an insolvent company, and recognized in Guernsey, to effect any recovery of such assets.
150 Burford Capital Annual Report 2023
Memorandum and articles of incorporation
The information required by Item 10.B of Form 20-F has been provided in Exhibit 2.1 to this Annual Report and is incorporated herein by reference.
Material contracts
Set forth below are material contracts outside the ordinary course of business to which we are a party at the date of this Annual Report. Summaries of the material contracts are not intended to be complete and reference is made to the contracts themselves, which are exhibits to this Annual Report.
Indenture, dated as of June 26, 2023, by and among Burford Capital Global Finance LLC, as issuer, Burford Capital Limited, as parent guarantor, the other guarantors party thereto from time to time and U.S. Bank Trust Company, National Association, as trustee
On June 26, 2023, Burford Capital Global Finance LLC issued $400 million aggregate principal amount of 9.250% Senior Notes due 2031 (the “Initial 2031 Notes”) and, on January 30, 2024, Burford Capital Global Finance LLC issued additional $275 million aggregate principal amount of the 9.250% Senior Notes due 2031 (the “Additional 2031 Notes” and, together with the Initial 2031 Notes, the “2031 Notes”). The 2031 Notes bear interest at a rate of 9.250% per annum, payable semi-annually in arrears on July 1 and January 1 of each year.
The 2031 Notes were issued under an indenture by and among Burford Capital Global Finance LLC, as issuer, Burford Capital Limited, as parent guarantor, the other guarantors party thereto from time to time and U.S. Bank Trust Company, National Association, as trustee. The 2031 Notes (i) are senior unsecured obligations of Burford Capital Global Finance LLC, (ii) rank equal in right of payment with all existing and future unsecured indebtedness of Burford Capital Global Finance LLC that is not expressly subordinated in right of payment to the 2031 Notes and are senior in right of payment to all existing and future indebtedness of Burford Capital Global Finance LLC expressly subordinated in right of payment to the 2031 Notes and (iii) are fully and unconditionally guaranteed on a senior and unsecured basis by Burford Capital Limited, Burford Capital Finance LLC and Burford Capital PLC. Each restricted subsidiary of Burford Capital Limited (other than Burford Capital Global Finance LLC) that (i) incurs or guarantees any indebtedness under the notes that were outstanding at the issue date of the Initial 2031 Notes or (ii) incurs or guarantees other indebtedness for borrowed money of Burford Capital Global Finance LLC or any guarantor of the 2031 Notes in an aggregate principal amount in excess of $7.5 million, is required to guarantee the 2031 Notes.
Burford Capital Global Finance LLC may redeem all or part of the 2031 Notes on or after July 1, 2026 at the redemption prices set forth in the indenture governing the 2031 Notes, plus accrued and unpaid interest. Burford Capital Global Finance LLC may redeem all or part of the 2031 Notes at any time before July 1, 2026 at a redemption price equal to 100% of the aggregate principal amount of the 2031 Notes redeemed, plus a make-whole premium and accrued and unpaid interest. In addition, prior to July 1, 2026, Burford Capital Global Finance LLC may redeem at its option up to 40% of the aggregate principal amount of the 2031 Notes originally issued (calculated after giving effect to the issuance of the Additional 2031 Notes and any other issuance of additional 2031 Notes) with the proceeds of certain equity offerings at the redemption price set forth in the indenture governing the 2031 Notes, provided that at least 50% of the aggregate principal amount of the 2031 Notes originally issued (calculated after giving effect to the issuance of the Additional 2031 Notes and any other issuance of additional 2031 Notes) remains outstanding. Furthermore, Burford Capital Global Finance LLC will be required to make an offer to repurchase all the outstanding 2031 Notes upon the occurrence of certain events constituting a Change of Control Triggering Event (as defined in the indenture governing the 2031 Notes) at a price equal to 101% of the principal amount of the 2031 Notes repurchased, plus accrued and unpaid interest. If Burford Capital Global Finance LLC sells certain assets and the net cash proceeds are not applied as permitted under the indenture governing the 2031 Notes, Burford Capital Global Finance LLC may be required to use such proceeds to offer to purchase some of the 2031 Notes at 100% of the principal amount of the 2031 Notes repurchased, plus accrued and unpaid interest.
The indenture governing the 2031 Notes contains certain customary covenants, including restrictions on the ability of Burford Capital Limited and its restricted subsidiaries to (i) incur or guarantee additional indebtedness, (ii) pay cash dividends or make other cash distributions in respect of, or repurchase or redeem, capital stock or make other restricted payments (including restricted investments), (iii) create or incur certain liens, (iv) merge or consolidate with another company or sell all or substantially all of their assets and (v) enter into transactions with affiliates. The 2031 Notes are governed by the laws of the State of New York.
Burford Capital Annual Report 2022 151
Indenture, dated as of April 11, 2022, by and among Burford Capital Global Finance LLC, as issuer, Burford Capital Limited, as parent guarantor, the other guarantors party thereto from time to time and U.S. Bank Trust Company, National Association, as trustee
On April 11, 2022, Burford Capital Global Finance LLC issued $360 million aggregate principal amount of 6.875% senior notes due 2030 (the “2030 Notes”). The 2030 Notes bear interest at a rate of 6.875% per annum, payable semi-annually in arrears on April 15 and October 15 of each year.
The 2030 Notes were issued under an indenture by and among Burford Capital Global Finance LLC, as issuer, Burford Capital Limited, as parent guarantor, the other guarantors party thereto from time to time and U.S. Bank Trust Company, National Association, as trustee. The 2030 Notes (i) are senior unsecured obligations of Burford Capital Global Finance LLC, (ii) rank equal in right of payment with all existing and future unsecured indebtedness of Burford Capital Global Finance LLC that is not expressly subordinated in right of payment to the 2030 Notes and are senior in right of payment to all existing and future indebtedness of Burford Capital Global Finance LLC expressly subordinated in right of payment to the 2030 Notes and (iii) are fully and unconditionally guaranteed on a senior and unsecured basis by Burford Capital Limited, Burford Capital Finance LLC and Burford Capital PLC. Each restricted subsidiary of Burford Capital Limited (other than Burford Capital Global Finance LLC) that (i) incurs or guarantees any indebtedness under the notes that were outstanding at the issue date of the 2030 Notes or (ii) incurs or guarantees other indebtedness for borrowed money of Burford Capital Global Finance LLC or any guarantor of the 2030 Notes in an aggregate principal amount in excess of $5.0 million, is required to guarantee the 2030 Notes.
Burford Capital Global Finance LLC may redeem all or part of the 2030 Notes on or after April 15, 2025 at the redemption prices set forth in the indenture governing the 2030 Notes, plus accrued and unpaid interest. Burford Capital Global Finance LLC may redeem all or part of the 2030 Notes at any time before April 15, 2025 at a redemption price equal to 100% of the aggregate principal amount of the 2030 Notes redeemed, plus a make-whole premium and accrued and unpaid interest. In addition, prior to April 15, 2025, Burford Capital Global Finance LLC may redeem at its option up to 40% of the aggregate principal amount of the 2030 Notes originally issued (calculated after giving effect to any issuance of additional 2030 Notes) with the proceeds of certain equity offerings at the redemption price set forth in the indenture governing the 2030 Notes, provided that at least 50% of the aggregate principal amount of the 2030 Notes originally issued (calculated after giving effect to any issuance of additional 2030 Notes) remains outstanding. Furthermore, Burford Capital Global Finance LLC will be required to make an offer to repurchase all the outstanding 2030 Notes upon the occurrence of certain events constituting a Change of Control Triggering Event (as defined in the indenture governing the 2030 Notes) at a price equal to 101% of the principal amount of the 2030 Notes repurchased, plus accrued and unpaid interest. If Burford Capital Global Finance LLC sells certain assets and the net cash proceeds are not applied as permitted under the indenture governing the 2030 Notes, Burford Capital Global Finance LLC may be required to use such proceeds to offer to purchase some of the 2030 Notes at 100% of the principal amount of the 2030 Notes repurchased, plus accrued and unpaid interest.
The indenture governing the 2030 Notes contains certain customary covenants, including restrictions on the ability of Burford Capital Limited and its restricted subsidiaries to (i) incur or guarantee additional indebtedness, (ii) pay cash dividends or make other cash distributions in respect of, or repurchase or redeem, capital stock or make other restricted payments (including restricted investments), (iii) create or incur certain liens, (iv) merge or consolidate with another company or sell all or substantially all of their assets and (v) enter into transactions with affiliates. The 2030 Notes are governed by the laws of the State of New York.
Indenture, dated as of April 5, 2021, by and among Burford Capital Global Finance LLC, as issuer, Burford Capital Limited, as parent guarantor, the other guarantors party thereto from time to time and U.S. Bank Trust Company, National Association, as trustee
On April 5, 2021, Burford Capital Global Finance LLC issued $400 million aggregate principal amount of 6.250% senior notes due 2028 (the “2028 Notes”). The 2028 Notes bear interest at a rate of 6.250% per annum, payable semi-annually in arrears on April 15 and October 15 of each year.
The 2028 Notes were issued under an indenture by and among Burford Capital Global Finance LLC, as issuer, Burford Capital Limited, as parent guarantor, the other guarantors party thereto from time to time and U.S. Bank Trust Company, National Association, as successor to U.S. Bank National Association, as trustee. The 2028 Notes (i) are senior unsecured obligations of Burford Capital Global Finance LLC, (ii) rank equal in right of payment with all existing and future unsecured indebtedness of Burford Capital Global Finance LLC that is not expressly subordinated in right of
152 Burford Capital Annual Report 2023
payment to the 2028 Notes and are senior in right of payment to all existing and future indebtedness of Burford Capital Global Finance LLC expressly subordinated in right of payment to the 2028 Notes and (iii) are fully and unconditionally guaranteed on a senior and unsecured basis by Burford Capital Limited, Burford Capital Finance LLC and Burford Capital PLC. Each restricted subsidiary of Burford Capital Limited (other than Burford Capital Global Finance LLC) that (i) incurs or guarantees any indebtedness under the notes that were outstanding at the issue date of the 2028 Notes or (ii) incurs or guarantees other indebtedness for borrowed money of Burford Capital Global Finance LLC or any guarantor of the 2028 Notes in an aggregate principal amount in excess of $5.0 million, is required to guarantee the 2028 Notes.
Burford Capital Global Finance LLC may redeem all or part of the 2028 Notes on or after April 15, 2024 at the redemption prices set forth in the indenture governing the 2028 Notes, plus accrued and unpaid interest. Burford Capital Global Finance LLC may redeem all or part of the 2028 Notes at any time before April 15, 2024 at a redemption price equal to 100% of the aggregate principal amount of the 2028 Notes redeemed, plus a make-whole premium and accrued and unpaid interest. In addition, prior to April 15, 2024, Burford Capital Global Finance LLC may redeem at its option up to 40% of the aggregate principal amount of the 2028 Notes originally issued (calculated after giving effect to any issuance of additional 2028 Notes) with the proceeds of certain equity offerings at the redemption price set forth in the indenture governing the 2028 Notes, provided that at least 50% of the aggregate principal amount of the 2028 Notes originally issued (calculated after giving effect to any issuance of additional 2028 Notes) remains outstanding. Furthermore, Burford Capital Global Finance LLC will be required to make an offer to repurchase all the outstanding 2028 Notes upon the occurrence of certain events constituting a Change of Control Triggering Event (as defined in the indenture governing the 2028 Notes) at a price equal to 101% of the principal amount of the 2028 Notes repurchased, plus accrued and unpaid interest. If Burford Capital Global Finance LLC sells certain assets and the net cash proceeds are not applied as permitted under the indenture governing the 2028 Notes, Burford Capital Global Finance LLC may be required to use such proceeds to offer to purchase some of the 2028 Notes at 100% of the principal amount of the 2028 Notes repurchased, plus accrued and unpaid interest.
The indenture governing the 2028 Notes contains certain customary covenants, including restrictions on the ability of Burford Capital Limited and its restricted subsidiaries to (i) incur or guarantee additional indebtedness, (ii) pay cash dividends or make other cash distributions in respect of, or repurchase or redeem, capital stock or make other restricted payments (including restricted investments), (iii) create or incur certain liens, (iv) merge or consolidate with another company or sell all or substantially all of their assets and (v) enter into transactions with affiliates. The 2028 Notes are governed by the laws of the State of New York.
Trust Deed, dated as of February 12, 2018, by and among Burford Capital Finance LLC, as issuer, Burford Capital Limited, Burford Capital PLC and Burford Capital Global Finance LLC, as guarantors, and U.S. Bank Trustees Limited, as trustee
On February 12, 2018, Burford Capital Finance LLC issued $180 million aggregate principal amount of 6.125% bonds due 2025 (the “2025 Bonds”). The 2025 Bonds bear interest at a rate of 6.125% per annum, payable semi-annually in arrears on February 12 and August 12 of each year.
The 2025 Bonds were issued under a trust deed by and among Burford Capital Finance LLC, as issuer, Burford Capital Limited, Burford Capital PLC and Burford Capital Global Finance LLC, as guarantors, and U.S. Bank Trustees Limited, as trustee. The 2025 Bonds (i) are unsecured, unsubordinated obligations of Burford Capital Finance LLC, (ii) rank equally in right of payment with all other existing and future unsecured, unsubordinated indebtedness of Burford Capital Finance LLC and (iii) are unconditionally guaranteed by Burford Capital Limited, Burford Capital PLC and Burford Capital Global Finance LLC. If any subsidiary, other than certain excluded subsidiaries, of Burford Capital Limited has certain indebtedness which amounts to more than £2.0 million, such subsidiary is required to provide a guarantee in respect of the 2025 Bonds.
Burford Capital Finance LLC may redeem the 2025 Bonds for certain tax reasons, in whole, but not in part, at any time at the principal amount, plus accrued and unpaid interest.
The trust deed governing the 2025 Bonds contains certain covenants, including (i) a restriction on the creation of any security interest by Burford Capital Finance LLC, Burford Capital Limited, Burford Capital PLC or Burford Capital Global Finance LLC with respect to their respective businesses, undertakings, assets or revenues to secure certain financial indebtedness unless the 2025 Bonds are secured equally, subject to certain exemptions, and (ii) a requirement that Burford Capital Limited maintains a level of consolidated net debt that is less than 50% of the level of its consolidated tangible assets. The 2025 Bonds are governed by English law.
Burford Capital Annual Report 2023 153
Trust Deed, dated as of June 1, 2017, by and among Burford Capital PLC, as issuer, Burford Capital Limited, Burford Capital Finance LLC and Burford Capital Global Finance LLC, as guarantor, and U.S. Bank Trustees Limited, as trustee
On June 1, 2017, Burford Capital PLC issued £175 million aggregate principal amount of 5.000% bonds due 2026 (the “2026 Bonds”). The 2026 Bonds bear interest at a rate of 5.000% per annum, payable semi-annually in arrears on December 1 and June 1 of each year.
The 2026 Bonds were issued under a trust deed by and among Burford Capital PLC, as issuer, Burford Capital Limited, Burford Capital Finance LLC and Burford Capital Global Finance LLC, as guarantors, and U.S. Bank Trustees Limited, as trustee. The 2026 Bonds (i) are unsecured, unsubordinated obligations of Burford Capital PLC, (ii) rank equally in right of payment with all other existing and future unsecured, unsubordinated indebtedness of Burford Capital PLC and (iii) are unconditionally guaranteed by Burford Capital Limited, Burford Capital Finance LLC and Burford Capital Global Finance LLC. If any subsidiary, other than certain excluded subsidiaries, of Burford Capital Limited has certain indebtedness which amounts to more than £2.0 million, such subsidiary is required to provide a guarantee in respect of the 2026 Bonds.
Burford Capital PLC may redeem the 2026 Bonds, in whole, but not in part, at any time at the greater of (x) the principal amount and (y) an amount calculated by reference to the then-current yield of the UK 1.5% Treasury Gilt 2026 plus 1.0%, in each case, plus accrued and unpaid interest. Burford Capital PLC may redeem the 2026 Bonds for certain tax reasons, in whole, but not in part, at any time at the principal amount, plus accrued and unpaid interest.
The trust deed governing the 2026 Bonds contains certain covenants, including (i) a restriction on the creation of any security interest by Burford Capital PLC, Burford Capital Limited, Burford Capital Finance LLC or Burford Capital Global Finance LLC with respect to their respective businesses, undertakings, assets or revenues to secure certain financial indebtedness unless the 2026 Bonds are secured equally, subject to certain exemptions, and (ii) a requirement that Burford Capital Limited maintains a level of consolidated net debt that is less than 50% of the level of its consolidated tangible assets. The 2026 Bonds are governed by English law.
Exchange controls and other limitations affecting security holders
Under Guernsey law, there are currently no restrictions on the export or import of capital, including foreign exchange controls, or restrictions that affect the remittance of dividends, interest or other payments to non-resident holders of our ordinary shares.
Tax considerations
For purposes of the discussion below, unless the context otherwise requires, references in this section to “we”, “our” or “us” are references to Burford Capital Limited.
Guernsey tax considerations
The summary below is based on Guernsey law and published practice in Guernsey at the date of this Annual Report, both of which are subject to change, possibly with retroactive effect. This summary is intended as a general guide to certain Guernsey tax matters related to the holders of our ordinary shares only and is not, is not intended to be nor should it be construed to be, legal or tax advice or a summary of all tax matters in Guernsey.
Shareholders, whether corporations or individuals, that are not residents of Guernsey for tax purposes and that do not carry on business in Guernsey through a permanent establishment situated in Guernsey, will not be subject to Guernsey income tax or Guernsey withholding tax. Any distributions made by us to non-Guernsey tax resident shareholders will not be subject to Guernsey income tax or Guernsey withholding tax.
Individual shareholders who are residents of Guernsey for tax purposes will generally be subject to Guernsey income tax at the individual standard rate of 20% on distributions received from us.
Corporate shareholders that are residents of Guernsey for tax purposes (and that do not have exempt company status under the Income Tax (Exempt Bodies) (Guernsey) Ordinance, 1989, as amended) will generally be subject to Guernsey income tax at the company standard rate, which is currently 0%, on distributions received from us.
At the date of this Annual Report, Guernsey does not levy capital gains tax and, therefore, shareholders will not suffer capital gains tax in Guernsey.
154 Burford Capital Annual Report 2023
No stamp duty is chargeable in Guernsey on the issue, acquisition, transfer, conversion or redemption or other disposition of our ordinary shares (provided that it does not hold Guernsey real property).
Guernsey has implemented through domestic legislation matters related to (i) the Foreign Account Tax Compliance Act (“FATCA”) contained in the US Internal Revenue Code of 1986, as amended (the “Code”), and the Treasury Regulations promulgated thereunder and (ii) the Organisation for Economic Co-operation and Development’s regime known as the Common Reporting Standard (“CRS”). Pursuant to FATCA and CRS, disclosure and reporting of information may be required, including disclosure of certain information about shareholders, their ultimate beneficial owners and/or controllers and their investment in us. Shareholders should consult their tax advisers regarding the possible implications of FATCA, CRS and other similar regimes that may be relevant to their ownership and disposition of our ordinary shares.
Shareholders, including any nominees, should inform themselves as to all legal and tax consequences, and any foreign exchange requirements, which may apply to them in their respective jurisdictions in connection with their purchase, holding or disposal of our ordinary shares.
Material US federal income tax considerations
General
The following is a discussion of the material US federal income tax considerations that may be relevant to US Holders (as defined below). This discussion is based upon provisions of the Code, the Treasury Regulations promulgated thereunder and administrative rulings and court decisions, all as in effect or existence on the date of this Annual Report and all of which are subject to change, possibly with retroactive effect. Changes in these authorities may cause the tax consequences of ownership of our ordinary shares to vary substantially from the consequences described below.
The following discussion applies only to beneficial owners of our ordinary shares that own ordinary shares as “capital assets” within the meaning of Section 1221 of the Code (i.e., generally, for investment purposes) and is not intended to be applicable to all categories of shareholders, such as shareholders subject to special tax rules (i.e., banks or financial institutions, regulated investment companies, insurance companies, broker-dealers or traders in stocks and securities or currencies, tax-exempt organizations, real estate investment trusts, retirement plans or individual retirement accounts, US expatriates, persons who hold our ordinary shares as part of a straddle, hedge, conversion, constructive sale or other integrated transaction for US federal income tax purposes, traders in securities that have elected the mark-to-market method of accounting for their securities, persons liable for alternative minimum tax, persons who are investors in pass-through entities, persons that own (actually or constructively) 10% or more of our equity securities (by vote or value), persons who elect to receive dividends in a currency other than the US dollar or persons that have a functional currency other than the US dollar), each of whom may be subject to tax rules that differ significantly from those summarized below. If a partnership or other entity classified as a partnership for US federal income tax purposes holds our ordinary shares, the tax treatment of its partners generally will depend upon the status of the partner and the activities of the partnership. If you are a partner in a partnership holding our ordinary shares, you should consult your own tax advisor regarding the tax consequences to you of the partnership’s ownership of our ordinary shares.
No ruling has been or will be requested from the Internal Revenue Service (the “IRS”) in connection with any matter affecting us or our shareholders. The statements made herein may be challenged by the IRS and, if so challenged, may not be sustained upon review in a court. This discussion does not contain information regarding any US state, US local or US estate or gift tax considerations concerning the ownership or disposition of our ordinary shares. This discussion does not comment on all aspects of US federal income taxation that may be important to particular shareholders in light of their individual circumstances, and each shareholder is encouraged to consult its own tax advisor regarding the US federal, state, local and other tax consequences of the ownership or disposition of our ordinary shares.
As used herein, the term “US Holder” means a beneficial owner of our ordinary shares that is:
| ▪ | An individual citizen or resident of the US |
| ▪ | A corporation (including any entity treated as a corporation for US federal income tax purposes) created or organized in or under the laws of the United States, any state thereof or the District of Columbia |
| ▪ | An estate the income of which is subject to US federal income taxation regardless of its source or |
| ▪ | A trust if (i) its administration is subject to the primary supervision of a court within the United States and one |
Burford Capital Annual Report 2023 155
| or more US persons, within the meaning of Section 7701(a)(30) of the Code, have the authority to control all substantial decisions of the trust or (ii) it has a valid election in effect under applicable Treasury Regulations to be treated as a US person for US federal income tax purposes. |
Distributions
Subject to the discussion below of the rules applicable to PFICs, any distributions to a US Holder made by us with respect to our ordinary shares generally will constitute dividends to the extent of our current and accumulated earnings and profits, as determined under US federal income tax principles. Distributions in excess of our earnings and profits will be treated first as a nontaxable return of capital to the extent of the US Holder’s tax basis in our ordinary shares held by the US Holder and thereafter as capital gain. Because we do not maintain calculations of our earnings and profits under US federal income tax principles, US Holders should expect that distributions generally will be treated as dividends for US federal income tax purposes. US Holders that are corporations generally will not be entitled to claim a dividend received deduction with respect to distributions they receive from us. Distributions on our ordinary shares to certain non-corporate US Holders that satisfy a minimum holding period and other generally applicable requirements should generally be eligible for taxation at preferential rates. However, non-corporate holders that do not meet a minimum holding period requirement during which they are not protected from the risk of loss or that elect to treat the dividend income as “investment income” pursuant to Section 163(d)(4) of the Code will not be eligible for the reduced rates of taxation. In addition, the rate reduction will not apply to dividends if the recipient of a dividend is obligated to make related payments with respect to positions in substantially similar or related property. This disallowance applies even if the minimum holding period has been met. Shareholders should consult their own tax advisors regarding the application of these rules to their particular circumstances. Dividends received with respect to our ordinary shares generally will be treated as foreign source “passive category income” for purposes of computing allowable foreign tax credits for US federal income tax purposes. The US foreign tax credit rules are complex, and US Holders are urged to consult their own tax advisors regarding the availability of the US foreign tax credits and the application of the US foreign tax credit rules to their particular situation.
Sale, exchange or other disposition of our ordinary shares
Subject to the discussion below of the rules applicable to PFICs, a US Holder generally will recognize gain or loss upon a sale, exchange or other disposition of our ordinary shares in an amount equal to the difference between the amount realized by the US Holder from such sale, exchange or other disposition and the US Holder’s adjusted tax basis in such ordinary shares. The US Holder’s tax basis in our ordinary shares held by the US Holder generally will be the US Holder’s purchase price for our ordinary shares reduced by the amount of any distributions on our ordinary shares that are treated as non-taxable returns of capital (see “—Distributions”). Such gain or loss will be treated as capital gain or loss and will be long-term capital gain or loss if the US Holder’s holding period is greater than one year at the time of the sale, exchange or other disposition. Certain US Holders (including individuals) may be eligible for preferential rates of US federal income tax in respect of long-term capital gains. A US Holder’s ability to deduct capital losses is subject to limitations. Such capital gain or loss generally will be treated as US source income or loss, as applicable, for US foreign tax credit purposes.
PFIC
In general, we will be treated as a PFIC if, in any tax year in which, after applying certain look-through rules, either (i) at least 75% of our gross income for such taxable year consists of passive income (e.g., dividends, interest, rents, royalties and capital gains from the sale or exchange of investment property) or (ii) at least 50% of the average value of the assets held by us during such taxable year produce, or are held for the production of, passive income. If we were a PFIC for any year during which a US Holder holds our ordinary shares, we generally would continue to be treated as a PFIC with respect to that US Holder for all succeeding years during which that US Holder holds our ordinary shares, even if we otherwise ceased to meet the requirements for PFIC status in that year.
There is substantial uncertainty regarding the tax treatment of our investments as well as the application of the PFIC rules to such investments and, in particular, whether all or some of our investments are passive assets or otherwise produce passive income under the applicable PFIC rules. As a result, although we do not believe we are currently a PFIC, and we do not expect to be treated as a PFIC in the foreseeable future, there can be no assurance the IRS will not successfully assert that we are or were a PFIC, that all or some of our investments are passive assets or otherwise produce passive income or that a change in law or interpretation of current law, possibly with retroactive effect, could cause us to be treated as a PFIC in a current, future or prior taxable year.
156 Burford Capital Annual Report 2023
If we were treated as a PFIC, a US Holder would be subject to significant adverse tax consequences, including interest charges and additional taxes, on certain excess distributions, sales, exchanges or other dispositions of our ordinary shares and certain transactions involving our subsidiaries that are themselves PFICs. A US Holder may mitigate certain, but not all, of these adverse consequences by making a timely “mark-to-market” election with respect to our ordinary shares. In addition, certain information reporting requirements apply with respect to the ownership of our ordinary shares. The US federal income tax rules relating to PFICs are very complex. Shareholders are strongly encouraged to consult their own tax advisor with respect to the impact of the PFIC rules on the purchase, ownership and disposition of our ordinary shares.
Specified foreign financial assets
Individual US Holders that own “specified foreign financial assets” with an aggregate value in excess of (i) $50,000 on the last day of the tax year or (ii) $75,000 at any time during the tax year are generally required to report information relating to such assets. “Specified foreign financial assets” include any financial accounts held at a foreign financial institution, as well as securities issued by a foreign issuer (which would include our ordinary shares) that are not held in accounts maintained by financial institutions. Higher reporting thresholds apply to certain married individuals. The applicable Treasury Regulations extend this reporting requirement to certain entities that are treated as formed or availed of to hold direct or indirect interests in “specified foreign financial assets” based on certain objective criteria. US Holders who fail to report the required information could be subject to substantial penalties. Shareholders are encouraged to consult their own tax advisor regarding reporting obligations, if any, that would result from their purchase, ownership or disposition of our ordinary shares.
Backup withholding and information reporting
In general, US Holders will be subject to information reporting requirements on dividends received with respect to our ordinary shares and the proceeds of a disposition of our ordinary shares, unless a US Holder is an exempt recipient (such as a corporation). Backup withholding may apply to such amounts if the US Holder fails to provide an accurate taxpayer identification number (generally on an IRS Form W-9) or is otherwise subject to backup withholding. Backup withholding is not an additional tax. A US Holder generally may obtain a credit for any amount withheld against its liability for US federal income tax (and obtain a refund of any amounts withheld in excess of such liability), provided that certain required information is timely furnished to the IRS.
Purchases of equity securities by the issuer and affiliated purchasers
The table below sets forth information about purchases by us and our affiliated purchasers during the year ended December 31, 2023 of equity securities that are registered by us pursuant to Section 12 of the Exchange Act.
| Total number of | Maximum number | ||||||
Total number | ordinary shares | (or approximate dollar | ||||||
of | purchased as part | value) of ordinary shares | ||||||
ordinary | Average price | of publicly | that may yet be | |||||
shares | paid per | announced plans | purchased under | |||||
Period | purchased | ordinary share(1) | or programs | the plans or programs(2) | ||||
01/01/2023-01/31/2023 | - | - | - | 21,254,941 | ||||
02/01/2023-02/28/2023 | - | - | - | 21,254,941 | ||||
03/01/2023-03/31/2023 | - | - | - | 21,254,941 | ||||
04/01/2023-04/30/2023 | - | - | - | 21,254,941 | ||||
05/01/2023-05/31/2023 | - | - | - | 21,254,941 | ||||
06/01/2023-06/30/2023 | 17,403 | (3) | $ 11.84 | 17,403 | 21,237,538 | |||
07/01/2023-07/31/2023 | - | - | - | 21,895,721 | ||||
08/01/2023-08/31/2023 | - | - | - | 21,895,721 | ||||
09/01/2023-09/30/2023 | 261,000 | (4) | $ 14.40 | 261,000 | 21,634,721 | |||
10/01/2023-10/31/2023 | - | - | - | 21,634,721 | ||||
11/01/2023-11/30/2023 | - | - | - | 21,634,721 | ||||
12/01/2023-12/31/2023 | - | - | - | 21,634,721 |
1. | Includes broker commissions. The average price of our ordinary shares purchased on AIM was converted into US dollars using the applicable exchange rate. |
2. | On May 18, 2022, our shareholders approved a resolution at our annual general meeting renewing our authorization to purchase up to 21,904,987 ordinary shares on the open market, which authority expired at the close of our annual general meeting held in July 2023. On July 5, 2023, our shareholders approved a resolution at our annual general meeting renewing our authorization to purchase up to 21,895,721 ordinary shares on the open market, which authority is set to expire at the close of our annual general meeting to be held in 2024. |
3. | Consists of 17,403 ordinary shares purchased on the open market on AIM on June 29, 2023 to satisfy grants of awards under the NED Plan. |
4. | Consists of 261,000 ordinary shares purchased on the open market on AIM between September 20, 2023 and September 26, 2023 in connection with obligations under the LTIP. |
Burford Capital Annual Report 2023 157
We use a variety of structures, including the purchases of our ordinary shares on the open market, to offset dilution from the issuance of new ordinary shares related to the equity-based or equity-related compensation of our employees and directors.
Documents on display
We are subject to the reporting requirements under the Exchange Act applicable to foreign private issuers. Accordingly, we file certain reports with, and furnish other information to, the SEC. Such reports and other information regarding registrants, such as us, that file electronically with the SEC may be inspected without charge at a website maintained by the SEC at www.sec.gov.
In addition, we use our website at investors.burfordcapital.com to make available documents and other information about our company. The documents and other information we make available on our website may be deemed material. Accordingly, investors should monitor our website in addition to following our press releases, SEC filings and public conference calls and webcasts. Furthermore, investors may automatically receive email alerts and other information about our company upon submitting a request at the “Investor Email Alerts” section of our website at investors.burfordcapital.com. The information on, or that can be accessed through, the SEC’s website or our website is not incorporated by reference into, and does not form a part of, this Annual Report.
Quantitative and qualitative disclosures about market risk
Market and asset risk
We are exposed to market and asset risk with respect to our marketable securities, due from settlement of capital provision assets, capital provision assets and financial liabilities relating to third-party interests in capital provision assets. With respect to our marketable securities, which primarily consist of government securities with original maturities longer than three months when purchased, investment grade corporate bonds, asset-backed securities and mutual funds, market risk is the risk that the fair value of marketable securities will fluctuate due to changes in market variables, such as interest rates, credit risk, security and bond prices and foreign exchange rates. At December 31, 2023 and 2022, should the prices of the investments in corporate bonds and investment funds have been 10% higher or lower, while all other variables remained constant, our consolidated income and net assets would have increased or decreased, respectively, by $10.8 million and $13.6 million, respectively.
We only finance capital provision assets upon undertaking an in-house due diligence process. However, capital provision assets involve high risk, and there can be no assurance of a particular realization on any individual capital provision asset. Certain of our capital provision assets are comprised of a portfolio of assets thereby mitigating the impact of the outcome of any single capital provision asset. While the claims underlying our capital provision assets are generally diverse, we monitor and manage the portfolio for related exposures that finance different clients relative to the same or very similar claims, such that the outcomes on those related exposures are likely to be correlated. Capital provision assets include a portfolio with equity risk where the price of a listed equity security is a determinant of the ultimate amount of the realization upon the resolution of the litigation risk. At December 31, 2023 and 2022, should the prices of the due from settlement of capital provision assets, capital provision assets and financial liabilities relating to third-party interests in capital provision assets have been 10% higher or lower, while all other variables remained constant, our consolidated income and net assets would have increased or decreased, respectively, by $460.7 million and $342.7 million respectively.
The sensitivity impacts have been provided on a pre-tax basis for both our consolidated income and net assets as we consider the fluctuation in our effective tax rate from period to period could indicate changes in sensitivity not driven by the valuation that are difficult to follow and detract from the comparability of this information.
Liquidity risk
We are exposed to liquidity risk. Our financing of capital provision assets requires capital to meet commitments (as described in note 21 (Financial commitments and contingent liabilities) to our consolidated financial statements) and for settlement of operating liabilities. Our capital provision assets typically require significant capital contributions with little or no immediate return and no guarantee of return or repayment. To manage liquidity risk, we finance assets with a range of anticipated lives and hold marketable securities which can be readily realized to meet those liabilities and commitments.
158 Burford Capital Annual Report 2023
Marketable securities primarily consist of government securities with original maturities longer than three months when purchased, investment grade corporate bonds, asset-backed securities and mutual funds, all of which can be redeemed on short notice or be sold on an active trading market.
At December 31, 2023 and 2022, we had $1.6 billion and $1.3 billion aggregate principal amount of our debt securities outstanding, respectively, which were issued primarily for the purpose of raising sufficient capital to help mitigate liquidity risk. At December 31, 2023 and 2022, the future interest payments on our outstanding debt securities amounted to $625.3 million and $413.1 million, respectively, until their respective maturities in August 2025, December 2026, April 2028, April 2030 and July 2031, at which point the respective aggregate principal amounts will be required to be repaid. See note 13 (Debt) and note 21 (Financial commitments and contingent liabilities) to our consolidated financial statements for additional information with respect to our debt securities, including a schedule of maturities.
Credit risk
We are exposed to credit risk in various asset structures as described in note 2 (Summary of significant accounting policies) to our consolidated financial statements, most of which involve financing sums recoverable only out of successful capital provision assets with a concomitant risk of loss of deployed cost. Upon becoming contractually entitled to proceeds, depending on the structure of the particular capital provision asset, we could be a creditor of, and subject to direct or indirect credit risk from, a claimant, a defendant and/or other parties, or a combination thereof. Moreover, we may be indirectly subject to credit risk to the extent a defendant does not pay a claimant immediately, notwithstanding successful adjudication of a claim in the claimant’s favor. Our credit risk is uncertain given that our entitlement pursuant to our assets is generally not established until a successful resolution of claims, and our potential credit risk is mitigated by the diversity of our counterparties and indirect creditors, and due to a judgment creditor (in contrast to a conventional debtholder and in the absence of an actual bankruptcy of the counterparty) having immediate and unfettered rights of action to, for example, seize assets and garnish cash flows. We are also exposed to credit risk in respect of the marketable securities and cash and cash equivalents. The credit risk of the cash and cash equivalents is mitigated as all cash is placed with reputable banks with a sound credit rating. Marketable securities primarily consist of government securities with original maturities longer than three months when purchased, investment grade corporate bonds, asset-backed securities and mutual funds, all of which can be redeemed on short notice or be sold on an active trading market.
The maximum credit risk exposure represented by cash and cash equivalents, marketable securities, due from settlement of capital provision assets and capital provision assets is specified in our consolidated statements of financial position.
In addition, we are exposed to credit risk on financial assets and receivables in other assets, all of which are held at amortized cost. The maximum credit exposure for such amounts was the carrying value of $17.8 million and $17.7 million at December 31, 2023 and 2022, respectively. We review the lifetime expected credit loss based on historical collection performance, the specific provisions of any settlement agreement and a forward-looking assessment of macroeconomic factors. Based on this review, we have not identified any material expected credit loss relating to the financial assets held at amortized cost. We recognized no impairments for the years ended December 31, 2023 and 2022 and $0.5 million of impairments for the year ended December 31, 2021.
Currency risk
We hold assets denominated in currencies other than US dollar, our functional currency, including pound sterling, Euro and Australian dollar. In addition, we issued debt securities denominated in pound sterling in 2017 that remained outstanding at the date of this Annual Report. We are therefore exposed to currency risk, as values of the assets and liabilities denominated in other currencies will fluctuate due to changes in exchange rates. We may use forward exchange contracts from time to time to mitigate currency risk.
At December 31, 2023 and 2022, should pound sterling, Euro and Australian dollar have strengthened or weakened by 10% against US dollar, while all other variables remained constant, our capital provision assets and other assets/(liabilities) would have increased and decreased, respectively, as set forth in the tables below.
Burford Capital Annual Report 2023 159
December 31, 2023 | ||||||
($ in thousands) | Capital | Other assets/ |
| Currency risk exposure of 10 % | ||
US dollar |
| 4,846,759 | (1,603,260) | — | ||
Pound sterling |
| 10,921 | (235,052) | (22,413) | ||
Euro | 131,922 | 735 | 13,266 | |||
Australian dollar |
| 21,863 | (150) | 2,171 | ||
Canadian dollar | 31,376 | 119 | 3,150 | |||
Singapore dollar | 2,547 | — | 255 | |||
Total | 5,045,388 | (1,837,608) | (3,571) | |||
December 31, 2022 | ||||||
($ in thousands) | Capital | Other assets/ |
| Currency risk exposure of 10 % | ||
US dollar |
| 3,588,344 | (1,021,405) | — | ||
Pound sterling |
| 20,969 | (328,337) | (30,737) | ||
Euro | 100,051 | 226 | 10,028 | |||
Australian dollar |
| 15,224 | (368) | 1,486 | ||
Canadian dollar | 8,911 | 1,398 | 1,031 | |||
Singapore dollar | 2,057 | — | 206 | |||
Total | 3,735,556 | (1,348,486) | (17,986) | |||
Interest rate risk
Interest rate risk is the risk that the fair value of future cash flows of a financial instrument will fluctuate because of changes in market interest rates. Our exposure to market risk for changes in floating interest rates relates primarily to our cash and cash equivalents, capital provision assets and certain marketable securities. All cash and cash equivalents bear interest at floating rates. There are certain capital provision assets, due from settlement of capital provision assets and marketable securities that earn interest based on fixed rates, but those assets do not have interest rate risk as they are not exposed to changes in market interest rates. While not interest bearing, the fair value of our capital provision assets is sensitive to changes in interest rates that impact the discount rates applied in measuring fair value. See “Critical accounting estimates—Fair value of capital provision assets” for additional information with respect to such interest rate sensitivity. Our outstanding debt securities incur interest at a fixed rate and, therefore, are not exposed to changes in market interest rates.
The interest-bearing floating rate assets and liabilities are denominated in both US dollar and pound sterling. If interest rates increased and decreased by 25 basis points, while all other variables remained constant, the net income/(loss) for the year ended December 31, 2023 and net assets at December 31, 2023 would increase and decrease by $0.7 million, the net income/(loss) for the year ended December 31, 2022 and net assets at December 31, 2022 would increase and decrease by $0.3 million and the net income for the year ended December 31, 2021 and net assets at December 31, 2021 would increase and decrease by $0.5 million. For fixed rate assets and liabilities, it is estimated that there would be no material impact on net income or net assets. Fixed rate liabilities include our outstanding indebtedness as described in note 13 (Debt) to our consolidated financial statements.
160 Burford Capital Annual Report 2023
The tables below set forth respective maturity periods of our floating and fixed rate assets and liabilities at the dates indicated.
December 31, 2023 | ||||||
($ in thousands) | Floating |
| Fixed |
| Total | |
Assets |
| |||||
Less than 3 months | 220,549 | 11,571 | 232,120 | |||
3 to 6 months |
| — | 16,795 | 16,795 | ||
6 to 12 months |
| — | 29,830 | 29,830 | ||
1 to 2 years |
| — | 12,272 | 12,272 | ||
Greater than 2 years | 76,887 | 163,296 | 240,183 | |||
Liabilities | ||||||
1 to 2 years |
| — | (180,000) | (180,000) | ||
Greater than 2 years | — | (1,383,073) | (1,383,073) | |||
Net asset/(liabilities) | 297,436 | (1,329,309) | (1,031,873) | |||
December 31, 2022 | ||||||
($ in thousands) | Floating |
| Fixed |
| Total | |
Assets |
| |||||
Less than 3 months | 107,658 | 8,672 | 116,330 | |||
3 to 6 months |
| — | 2,583 | 2,583 | ||
6 to 12 months |
| — | 5,519 | 5,519 | ||
1 to 2 years |
| — | 57,555 | 57,555 | ||
Greater than 2 years | 11,110 | 358,023 | 369,133 | |||
Liabilities | ||||||
1 to 2 years |
| — | (120,390) | (120,390) | ||
Greater than 2 years | — | (1,150,683) | (1,150,683) | |||
Net asset/(liabilities) | 118,768 | (838,721) | (719,953) | |||
Controls and procedures
Disclosure controls and procedures
We maintain disclosure controls and procedures, as defined in Rules 13a-15(e) and 15d-15(e) under the Exchange Act, that are designed to ensure that information required to be disclosed in the reports we file or furnish under the Exchange Act is recorded, processed, summarized and reported within the time periods specified in the SEC’s rules and forms and that such information is accumulated and communicated to management, including our Chief Executive Officer and Chief Financial Officer, as appropriate, to allow timely decisions regarding required disclosure.
In designing and evaluating our disclosure controls and procedures, our management necessarily is required to apply its judgment. The design of our disclosure controls and procedures also is based in part upon certain assumptions about the likelihood of future events, and there can be no assurance that any design will succeed in achieving its stated goals under all potential future conditions. Thus, in designing and evaluating our disclosure controls and procedures, our management, including our Chief Executive Officer and Chief Financial Officer, recognizes that any controls and procedures, no matter how well designed and operated, can provide only reasonable, not absolute, assurance of achieving the desired objectives of the disclosure controls and procedures.
Our management, with the participation of our Chief Executive Officer and Chief Financial Officer, has evaluated the effectiveness of our disclosure controls and procedures pursuant to Rule 13a-15(b) under the Exchange Act at December 31, 2023. Based on such evaluation, our Chief Executive Officer and Chief Financial Officer have concluded that, at December 31, 2023, our disclosure controls and procedures were not effective due to a material weakness in internal control over financial reporting due to a lack of available evidence to demonstrate the precision of management’s review of the process to determine certain assumptions used in the measurement of the fair value of capital provision assets that resulted in the identification of a material weakness, although no material accounting errors were identified. See “—Management’s report on internal control over financial reporting” for additional information with respect to such material weakness.
Management’s report on internal control over financial reporting
Our management is responsible for establishing and maintaining adequate internal control over financial reporting. Internal control over financial reporting, as defined in Rules 13a-15(f) and 15d-15(f) under the Exchange Act, is a
Burford Capital Annual Report 2023 161
process designed by, or under the supervision of, a company’s principal executive officer and principal financial officer to provide reasonable assurance regarding the reliability of financial reporting and the preparation of consolidated financial statements for external purposes in accordance with generally accepted accounting principles and includes those policies and procedures that:
| ▪ | Pertain to the maintenance of records that in reasonable detail, accurately and fairly reflect the transactions and dispositions of the assets of the company |
| ▪ | Provide reasonable assurance that transactions are recorded as necessary to permit preparation of financial statements in accordance with generally accepted accounting principles, and that receipts and expenditures of the company are being made only in accordance with authorizations of management and directors of the company |
| ▪ | Provide reasonable assurance regarding prevention or timely detection of unauthorized acquisition, use or disposition of the company’s assets that could have a material effect on the financial statements |
Because of its inherent limitations, internal control over financial reporting may not prevent or detect misstatements. In addition, projections of any evaluation of effectiveness to future periods are subject to the risk that controls may become inadequate because of changes in conditions or that the degree of compliance with the policies or procedures may deteriorate.
Our management conducted an assessment of the effectiveness of our internal control over financial reporting at December 31, 2023. In conducting this assessment, our management used the criteria set forth by the Committee of Sponsoring Organizations of the Treadway Commission in Internal Control—Integrated Framework (2013). Based on such assessment, our management has concluded that, at December 31, 2023, our internal control over financial reporting was not effective due to a lack of available evidence to demonstrate the precision of management’s review of the process to determine certain assumptions used in the measurement of the fair value of capital provision assets that resulted in the identification of a material weakness. A material weakness is a deficiency, or combination of deficiencies, in internal control over financial reporting, such that there is a reasonable possibility that a material misstatement of our annual or interim consolidated financial statements will not be prevented or detected on a timely basis.
While no material accounting errors were identified, in the absence of such evidence there cannot be assurance that the control would prevent material accounting errors in the assessment of fair value of our capital provision assets.
At the date of this Annual Report, our management, in consultation with the Audit Committee, has identified a remediation plan to adopt policies requiring additional documentation to be prepared and retained to evidence the precision of management’s review controls used in the process to determine certain assumptions used in the measurement of the fair value of capital provision assets. We believe this material weakness will be remediated upon the completion of this remediation plan, including evaluation and testing of the related controls. We will next assess the effectiveness of our internal control over financial reporting at December 31, 2024.
Remediation of previously disclosed material weakness identified at December 31, 2022
During the year ended December 31, 2022 and as disclosed in the 2022 Annual Report, our management identified a material weakness related to the determination of our approach to measure the fair value of capital provision assets, in accordance with ASC 820. To remediate the material weakness relating to our approach to the fair value accounting for our capital provision assets identified at December 31, 2022, our management, in consultation with the Audit Committee, implemented a remediation plan to strengthen our internal control over financial reporting, which included the following measures:
| ▪ | Designed, documented and implemented a revised approach to determine the fair value of our capital provision assets that has been assessed to be in compliance with ASC 820 |
| ▪ | Designated a Chief Valuation Officer role to oversee the valuation process |
| ▪ | Hired staff with valuation expertise |
The remediation measures relating to the fair value of capital provision assets have been fully implemented at December 31, 2023, and the operational effectiveness of our internal control over financial reporting with respect to
162 Burford Capital Annual Report 2023
this material weakness has been validated through testing. Based on these measures and the testing and evaluation of the effectiveness of our internal control over financial reporting, our management concluded that the material weakness has been remediated at December 31, 2023.
Changes in internal control over financial reporting
Other than with respect to the material weakness discussed under “—Management’s report on internal control over financial reporting—Remediation of previously disclosed material weakness identified at December 31, 2022”, there were no changes in our internal control over financial reporting, as defined in Rules 13a-15(f) and 15d-15(f) under the Exchange Act, during the year ended December 31, 2023 that have materially affected, or are reasonably likely to materially affect, our internal control over financial reporting.
Attestation report of independent registered public accounting firm
Ernst & Young LLP, our independent registered public accounting firm that audited our consolidated financial statements included in this Annual Report, has issued its attestation report included in this Annual Report on the effectiveness of our internal control over financial reporting.
Principal accountant fees and services
Ernst & Young LLP has acted as our independent registered public accounting firm during each of the years ended December 31, 2023 and 2022.
The table below sets forth the aggregate fees for professional services provided by Ernst & Young LLP and associated member firms (collectively, the “Ernst & Young Entities”) for the years ended December 31, 2023 and 2022.
| Years ended December 31, | |||
($ in thousands) | 2023 | 2022 | ||
Audit fees(1) | 6,119 | 5,700 | ||
Audit-related fees | - | - | ||
Tax fees(2) | 273 | 395 | ||
All other fees | - | - | ||
Total principal accountant fees | 6,392 | 6,095 | ||
1. | Includes fees for work performed by the Ernst & Young Entities to issue opinions on our consolidated financial statements and to issue reports on local statutory financial statements. Includes fees for other assurance services provided by the Ernst & Young Entities but not restricted to those that can only be provided by the statutory auditor, such as reviews of other financial information and other audit-related services. |
2. | Includes fees associated with tax compliance, assistance with historical tax matters and other tax-related services. |
The charter of the Audit Committee, which is available on our website at investors.burfordcapital.com under "Governance—Corporate Governance", requires the Audit Committee to approve all audit and non-audit services to be provided by our independent registered public accounting firm in accordance with the charter of the audit committee.
Burford Capital Annual Report 2023 163
Exhibits
Exhibit |
|
| Description |
1.1 | |||
1.2 | |||
2.1 | |||
4.1 | |||
4.2 | |||
4.3 | |||
4.4 | |||
4.5 | |||
4.6 | |||
4.7 | |||
8.1* | |||
12.1* | Certification of Chief Executive Officer pursuant to Rule 13a-14(a) / 15d-14(a). | ||
12.2* | Certification of Chief Financial Officer pursuant to Rule 13a-14(a) / 15d-14(a). | ||
13.1** | |||
15.1* | |||
97.1* | |||
101 | The following financial information from Burford Capital Limited’s Annual Report on Form 20-F for the year ended December 31, 2023 formatted in iXBRL (Inline eXtensible Business Reporting Language): (i) the consolidated statements of operations for the years ended December 31, 2023, 2022 and 2021; (ii) the consolidated statements of comprehensive income for the years ended December 31, 2023, 2022 and 2021; (iii) the consolidated statements of financial position at December 31, 2023 and 2022; (iv) the consolidated statements of cash flows for the years ended December 31, 2023, 2022 and 2021; (v) the consolidated statements of changes in equity for the years ended December 31, 2023, 2022 and 2021; and (vi) the notes to the consolidated financial statements. | ||
104 | Cover Page Interactive Data File (embedded within the Inline XBRL document). | ||
164 Burford Capital Annual Report 2023
* | Filed herewith. | ||
** | Furnished herewith. | ||
Signatures
The registrant hereby certifies that it meets all of the requirements for filing on Form 20-F and that it has duly caused and authorized the undersigned to sign this Annual Report on Form 20-F on its behalf.
BURFORD CAPITAL LIMITED | |||
By: | /s/ Christopher Halmy | ||
Name: Christopher Halmy | |||
Title: Authorized Person | |||
Dated: March 28, 2024 | |||
Burford Capital Annual Report 2023 165
Cross reference
Item |
|
| Form 20-F caption |
| Location in this Annual Report | |
|---|---|---|---|---|---|---|
1 | Identity of directors, senior management and advisers | N/A | ||||
2 | Offer statistics and expected timetable | N/A | ||||
3 | Key information | |||||
A | [Reserved] | N/A | ||||
B | Capitalization and indebtedness | N/A | ||||
C | Reasons for the offer and use of proceeds | N/A | ||||
D | Risk factors | 130-150 | ||||
4 | Information on the company | |||||
A | History and development of the company | 10 | ||||
B | Business overview | 6-9, 10-23, 36-48, see also Item 5 | ||||
C | Organizational structure | 22 | ||||
D | Property, plants and equipment | 22 | ||||
4A | Unresolved staff comments | N/A | ||||
5 | Operating and financial review and prospects | |||||
A | Operating results | 6-9, 30-54, see also Item 5.D | ||||
B | Liquidity and capital resources | 49-52 | ||||
C | Research and development, patents and licenses, etc. | 52 | ||||
D | Trend information | 24-52, see also Item 5.A | ||||
E | Critical accounting estimates | 52-54 | ||||
6 | Directors, senior management and employees | |||||
A | Directors and senior management | 114-118 | ||||
B | Compensation | 123-128 | ||||
C | Board practices | 114, 118-122 | ||||
D | Employees | 20 | ||||
E | Share ownership | 123, 127-128 | ||||
F | Disclosure of a registrant’s action to recover erroneously awarded compensation | N/A | ||||
7 | Major shareholders and related party transactions | |||||
A | Major shareholders | 129 | ||||
B | Related party transactions | 129 | ||||
C | Interests of experts and counsel | N/A | ||||
8 | Financial information | |||||
A | Consolidated statements and other financial information | See Item 18 | ||||
B | Significant changes | 113 | ||||
9 | The offer and listing | |||||
A | Offer and listing details | 10 | ||||
B | Plan of distribution | N/A | ||||
C | Markets | 10 | ||||
D | Selling shareholders | N/A | ||||
E | Dilution | N/A | ||||
F | Expenses of the issue | N/A | ||||
10 | Additional information | |||||
A | Share capital | N/A | ||||
B | Memorandum and articles of association | 151 | ||||
C | Material contracts | 151-154 | ||||
D | Exchange controls | 154 | ||||
E | Taxation | 154-157 | ||||
F | Dividends and paying agents | N/A | ||||
G | Statements by experts | N/A | ||||
H | Documents on display | 158 | ||||
I | Subsidiary information | N/A | ||||
J | Annual report to security holders | N/A | ||||
11 | Quantitative and qualitative disclosures about market risk | 158-161 | ||||
12 | Description of securities other than equity securities | |||||
A | Debt securities | N/A | ||||
B | Warrants and rights | N/A | ||||
C | Other securities | N/A | ||||
D | American depositary shares | N/A | ||||
13 | Defaults, dividend arrearages and delinquencies | N/A | ||||
14 | Material modifications to the rights of security holders and use of proceeds | N/A |
166 Burford Capital Annual Report 2023
Item |
|
| Form 20-F caption |
| Location in this Annual Report | |
15 | Controls and procedures | 161-163 | ||||
16 | [Reserved] | N/A | ||||
16A | Audit committee financial expert | 120 | ||||
16B | Code of ethics | 121-122 | ||||
16C | Principal accountant fees and services | 163 | ||||
16D | Exemptions from the listing standards for audit committees | N/A | ||||
16E | Purchases of equity securities by the issuer and affiliated purchasers | 157-158 | ||||
16F | Change in registrant’s certifying accountant | N/A | ||||
16G | Corporate governance | 114, 118-122 | ||||
16H | Mine safety disclosure | N/A | ||||
16I | Disclosure regarding foreign jurisdictions that prevent inspections | N/A | ||||
16J | Insider trading policies | N/A | ||||
16K | Cybersecurity | 17-19 | ||||
17 | Financial statements | See Item 18 | ||||
18 | Financial statements | 67-113 | ||||
19 | Exhibits | 164-165 |
Burford Capital Annual Report 2023 167
Further information
Directors Christopher Bogart Robert Gillespie Christopher Halmy | Registered office |
Independent registered public accounting firm Royal Chambers St. Julian’s Avenue | Advisor to the company on Guernsey law |
Advisor to the company on English law | Advisor to the company on US law |
Nominated adviser and joint broker London EC2V 7BF | Joint broker Jefferies International Limited London EC2N 4JL United Kingdom |
Joint broker Joh. Berenberg, Gossler & Co. KG, London Branch 60 Threadneedle Street London EC2R 8HP United Kingdom | |
Registrar | Administrator and company secretary |
Computershare Investor Services United States of America |
168 Burford Capital Annual Report 2023
Equity and debt securities
The table below sets forth certain information relating to our equity and debt securities outstanding at the date of this Annual Report.
Issuer |
| Security |
| Exchange |
| Ticker |
| ISIN/CUSIP |
| FIGI |
| SEDOL/ID |
Burford Capital Limited | GG00BMGYLN96 | |||||||||||
Ordinary shares | New York Stock Exchange | BUR | G17977110 | BBG004FJ52G6 | BMHLZ26 US | |||||||
Ordinary shares | London Stock Exchange—AIM | BUR | GG00BMGYLN96 | BBG000PN88Q7 | BMGYLN9 GB | |||||||
Burford Capital PLC | Bonds | London Stock Exchange—Main Market | BUR3 | XS1614096425 | BBG00GPZLYD7 | AN5937551 | ||||||
Burford Capital Finance LLC | Bonds | London Stock Exchange—Main Market | BUR4 | XS1756325228 | BBG00JWN4HQ2 | AQ9291818 | ||||||
Burford Capital Global Finance LLC | Senior notes | Unlisted | N/A | Rule 144A: US12116LAA70 / 12116L AA7 Regulation S: USU1056LAA99 / U1056L AA9 | BBG00ZSKX1F2 BBG00ZSKX1P1 | BO7730613 BO7730647 | ||||||
Senior notes | Unlisted | N/A | Rule 144A: US12116LAC37 / 12116L AC3 Regulation S: USU1056LAB72 / U1056L AB7 | BBG016KF3DV3 BBG016KF3G37 | BV7236672 BV7236722 | |||||||
Senior notes | Unlisted | N/A | Rule 144A: US12116LAE92 / 12116L AE9 Regulation S: USU1056LAC55 / U1056L AC5 | BBG01H3TWCR3 BBG01H3TWDC7 | BRTZPD2 BN45QL4 | |||||||
Company website
Our website is located at www.burfordcapital.com. The information on, or that can be accessed through, our website is not incorporated by reference into, and does not form a part of, this Annual Report.
Investor relations inquiries
For all investor relations inquiries about Burford Capital Limited, please contact Investor Relations at:
350 Madison Avenue Telephone: +1 (646) 793 9176 | Paternoster House, 4th Floor Telephone: +44 (0)20 3530 2023 |
Email: IR@burfordcapital.com | |
Visit the investor relations section of our website located at investors.burfordcapital.com for investor relations information, including the latest share price, presentations relating to financial position and results of operations and regulatory news. The information on, or that can be accessed through, our website is not incorporated by reference into, and does not form a part of, this Annual Report.
Burford Capital Annual Report 2023 169