UNITED STATES
SECURITIES AND EXCHANGE COMMISSION
Washington, D.C. 20549
FORM
(Mark One)
ANNUAL REPORT PURSUANT TO SECTION 13 OR 15(d) OF THE SECURITIES EXCHANGE ACT OF 1934 |
For the fiscal year ended
OR
TRANSITION REPORT PURSUANT TO SECTION 13 OR 15(d) OF THE SECURITIES EXCHANGE ACT OF 1934 FOR THE TRANSITION PERIOD FROM TO |
Commission File Number

(Exact name of Registrant as specified in its Charter)
(State or other jurisdiction of incorporation or organization) |
(I.R.S. Employer Identification No.) |
(Address of principal executive offices) |
(Zip Code) |
Registrant’s telephone number, including area code: (
Securities registered pursuant to Section 12(b) of the Act:
Title of each class |
Trading Symbol |
Name of each exchange on which registered |
Securities registered pursuant to Section 12(g) of the Act: None
Indicate by check mark if the Registrant is a well-known seasoned issuer, as defined in Rule 405 of the Securities Act. Yes ☐
Indicate by check mark if the Registrant is not required to file reports pursuant to Section 13 or 15(d) of the Act. Yes ☐
Indicate by check mark whether the Registrant: (1) has filed all reports required to be filed by Section 13 or 15(d) of the Securities Exchange Act of 1934 during the preceding 12 months (or for such shorter period that the Registrant was required to file such reports), and (2) has been subject to such filing requirements for the past 90 days.
Indicate by check mark whether the Registrant has submitted electronically every Interactive Data File required to be submitted pursuant to Rule 405 of Regulation S-T (§232.405 of this chapter) during the preceding 12 months (or for such shorter period that the Registrant was required to submit such files).
Indicate by check mark whether the registrant is a large accelerated filer, an accelerated filer, a non-accelerated filer, a smaller reporting company, or an emerging growth company. See the definitions of "large accelerated filer," "accelerated filer," "smaller reporting company," and "emerging growth company" in Rule 12b-2 of the Exchange Act.
Large accelerated filer |
|
☐ |
|
|
☒ |
|
Emerging growth company |
|
||
|
|
|
|
|
|
|
|
|||
Non-accelerated filer |
|
☐ |
|
Smaller reporting company |
|
|
|
|
|
|
If an emerging growth company, indicate by check mark if the registrant has elected not to use the extended transition period for complying with any new or revised financial accounting standards provided pursuant to Section 13(a) of the Exchange Act. ☐
Indicate by check mark whether the registrant has filed a report on and attestation to its management’s assessment of the effectiveness of its internal control over financial reporting under Section 404(b) of the Sarbanes-Oxley Act (15 U.S.C. 7262(b)) by the registered public accounting firm that prepared or issued its audit report
If securities are registered pursuant to Section 12(b) of the Act, indicate by check mark whether the financial statements of the registrant included in the filing reflect the correction of an error to previously issued financial statements.
Indicate by check mark whether any of those error corrections are restatements that required a recovery analysis of incentive-based compensation received by any of the registrant’s executive officers during the relevant recovery period pursuant to §240.10D-1(b). ☐
Indicate by check mark whether the Registrant is a shell company (as defined in Rule 12b-2 of the Exchange Act). Yes
The aggregate market value of the voting and non-voting common equity held by non-affiliates of the Registrant, based on the closing price of the Registrant’s common stock on the New York Stock Exchange on June 30, 2023, was approximately $
The number of shares of Registrant’s common stock outstanding as of March 1, 2024 was
Auditor Firm Id: |
Auditor Name: |
Auditor Location: |
Table of Contents
|
|
Page |
PART I |
|
|
Item 1. |
4 |
|
Item 1A. |
19 |
|
Item 1B. |
30 |
|
Item 1C. |
30 |
|
Item 2. |
31 |
|
Item 3. |
31 |
|
Item 4. |
31 |
|
|
|
|
PART II |
|
|
Item 5. |
32 |
|
Item 6. |
33 |
|
Item 7. |
Management’s Discussion and Analysis of Financial Condition and Results of Operations |
34 |
Item 7A. |
61 |
|
Item 8. |
63 |
|
Item 9. |
Changes in and Disagreements With Accountants on Accounting and Financial Disclosure |
127 |
Item 9A. |
127 |
|
Item 9B. |
127 |
|
Item 9C. |
Disclosure Regarding Foreign Jurisdictions that Prevent Inspections |
127 |
|
|
|
PART III |
|
|
Item 10. |
127 |
|
Item 11. |
128 |
|
Item 12. |
Security Ownership of Certain Beneficial Owners and Management and Related Stockholder Matters |
128 |
Item 13. |
Certain Relationships and Related Transactions, and Director Independence |
129 |
Item 14. |
129 |
|
|
|
|
PART IV |
|
|
Item 15. |
130 |
|
Item 16. |
131 |
|
|
132 |
i
Special Note Regarding Forward-Looking Statements
Statements contained in this Annual Report on Form 10-K and in other documents we file with or furnish to the Securities and Exchange Commission ("SEC") that are not historical facts may constitute "forward-looking statements" within the meaning of the U.S. Private Securities Litigation Reform Act of 1995. Any statements about our expectations, beliefs, plans, strategies, predictions, forecasts, objectives or assumptions of future events or performance are not historical facts and may be forward-looking. These statements are often, but not always, made through the use of words or phrases such as "anticipates," "believes," "expects," "can," "could," "may," "predicts," "potential," "opportunity," "should," "will," "estimate," "plans," "projects," "continuing," "ongoing," "expects," "seeks," "intends" and similar words or phrases. Accordingly, these statements involve estimates, known and unknown risks, assumptions and uncertainties that could cause actual strategies, actions or results to differ materially from those expressed in such statements, and are not guarantees of future results or other events or performance. Readers are cautioned not to place undue reliance on such statements.
Our ability to predict results or the actual effects of future plans, strategies or events is inherently uncertain. Factors which could cause actual results or conditions to differ materially from those reflected in forward-looking statements include:
2
These risks and uncertainties should be considered in evaluating any forward-looking statements, and undue reliance should not be placed on such statements. Additional information concerning the Company, including additional factors and risks that could materially affect our business and financial results, are included herein. See Item 1A. "Risk Factors". Forward-looking statements speak only as of the date they are made. We assume no obligation to update any of these statements in light of new information, future events or otherwise unless required under the federal securities laws.
3
PART I
Item 1. Business.
General
Byline Bancorp, Inc., headquartered in Chicago, Illinois, is a bank holding company and we conduct all our business activities through our subsidiary, Byline Bank, a full service commercial bank, and Byline Bank’s subsidiaries. The words "the Company," "we," "Byline," "our" and "us" refer to Byline Bancorp, Inc. and its consolidated subsidiaries, unless we indicate otherwise.
We offer a broad range of banking products and services to small and medium sized businesses, commercial real estate and financial sponsors and to consumers who generally live or work near our branches. We also offer online account opening to consumer and business customers through our website and provide trust and wealth management services to our customers. In addition to our traditional commercial banking business, we provide small ticket equipment leasing solutions through Byline Financial Group, a wholly-owned subsidiary of Byline Bank, headquartered in Bannockburn, Illinois with sales offices in Illinois, and sales representatives in Illinois, Michigan, New Jersey, and New York. We participate in U.S. government guaranteed lending programs and originate U.S. government guaranteed loans. Byline Bank was the fifth most active originator of SBA loans in the country and the most active SBA lender in Illinois, and Wisconsin, as reported by the SBA for the fiscal year ended September 30, 2023. As of December 31, 2023, we had consolidated total assets of $8.9 billion, total gross loans and leases outstanding of $6.7 billion, total deposits of $7.2 billion, and total stockholders’ equity of $990.2 million.
Strategic growth
As part of our strategic growth plan, we explore potential opportunities for expansion in our primary and adjacent market areas through organic growth and the acquisition of financial institutions, branches, and non-banking organizations.
Organic Growth
We believe our local presence and our scale are essential to the continued growth of our deposit base. Small businesses are a significant source of low-cost deposits and represent opportunities for future growth. We believe our small business customers value our ability to provide convenience and access to local, responsive decision makers. As of December 31, 2023, commercial deposits accounted for 46.5% of total deposits and were 77.5% of non-interest bearing deposits. Commercial accounts generally have higher deposit balances and transaction volumes than individual deposit accounts.
Our ability to originate loans and leases across a range of industries and product types helps us maintain a diversified loan and lease portfolio across various sectors, including commercial and industrial lending, leasing, U.S. government guaranteed loans and real estate loans, allowing us to efficiently manage our credit exposures and capitalize on more lending opportunities. We have also enhanced our product and lending capabilities with the addition of experienced lending teams hired from larger banks.
The following charts outline the composition of our loan and lease and deposit portfolios as of December 31, 2023:
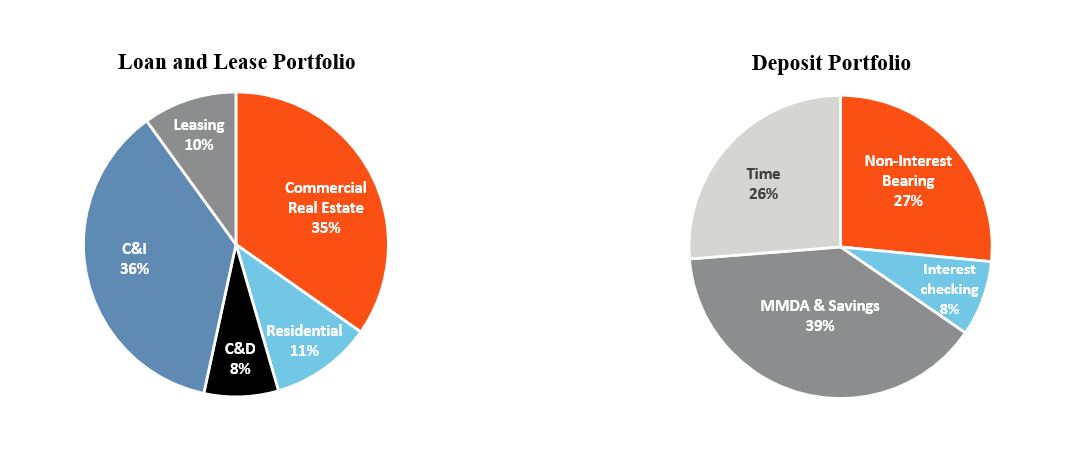
4
Acquisitions
Our ability to engage in certain merger or acquisition transactions depends on a number of factors, including opportunities in our market areas, access to capital, our bank regulators' views at the time as to the capital levels, quality of management and our overall financial condition, in addition to their assessment of a variety of other factors, including our compliance with laws and regulations. We have successfully completed a number of strategic acquisitions since our recapitalization in 2013, which include:
Year |
|
Company Acquired |
2023 |
|
Inland Bancorp, Inc. |
2019 |
|
Oak Park River Forest Bankshares, Inc. |
2018 |
|
First Evanston Bancorp, Inc. |
2016 |
|
Ridgestone Financial Services, Inc. |
2014 |
|
Baytree Leasing Company LLC |
On July 1, 2023, we completed our acquisition of Inland Bancorp, Inc. ("Inland Bancorp"), and Inland Bancorp's wholly owned bank subsidiary, Inland Bank and Trust, an Illinois chartered bank (collectively "Inland acquisition" or "acquisition of Inland"). Refer to Note 3—Acquisition of a Business contained within Part II, Item 8, Notes to the Consolidated Financial Statements of this document.
Branch network and distribution channels
The primary market in which we operate is the Chicago metropolitan area, and our 47 branch network in this area is our core distribution channel. We take advantage of our focused footprint and deep-rooted relationships to target local customers with a diversified product offering.
Our local branch network enables us to gather low cost deposits, promote the Byline brand and customer loyalty, originate loans, leases and other products and maintain relationships with our customers through regular community involvement. We believe our branch network is fundamental to our ability to achieve successful customer outreach in line with our culture, which promotes high touch engagement with our customers and proactive solutions.
While our branch network continues to be our primary delivery channel, we understand the evolving banking environment requires digital interaction to keep pace with our customers’ needs. We continually perform strategic reviews of our branch network and our existing banking footprint. With technology improvements and changes to customers’ banking preferences, we examine branch growth and consolidation potential, customer usage, branch profitability, services provided, markets served and proximity to other locations with a goal of minimizing customer impact and deposit runoff.
Since our recapitalization in June 2013, our branch network has been reduced from 88 to 48, including 23 branches added through acquisition. During 2023, we added 10 branches within our network as part of our acquisition of Inland. In the first quarter of 2024, we announced plans to consolidate two branches during the second quarter of 2024. We expect these consolidations to generate approximately $1.1 million of annual cost savings and anticipate a one-time charge of $1.5 million.
We plan to continue to leverage our seasoned management team, the attractive market opportunity in the Chicago metropolitan area, our diversified lending approach and our track record of successfully integrating acquisitions to drive future growth. We believe that having a deep understanding of customers, longstanding ties to the communities in which we operate, a strong market position, and exceptional employees allow us to provide the attention, responsiveness, and customized service our customers seek while offering a diverse range of products to serve a variety of needs.
Segments
We have one reportable segment. Our chief operating decision makers evaluate our business and operations using consolidated information for purposes of allocating resources and assessing performance.
Our Products and Services
We are a full service, commercial bank offering a broad range of deposit products and lending services to small and medium sized businesses, commercial real estate and financial sponsors, and consumers around our 47 branch locations in the Chicago metropolitan area and one branch in Wauwatosa, Wisconsin. The products and services we offer are described below.
Commercial banking
Commercial banking is a fundamental component of our business. We define commercial banking as lending to small and medium sized businesses, real estate and financial sponsors. We offer a comprehensive range of commercial loan, deposit and treasury management products. Our primary commercial lending groups are described below:
Commercial & Industrial. Our commercial and industrial ("C&I") group focuses on small and lower middle market businesses with up to $100 million of annual revenue and seeks to establish long term relationships. We believe this customer segment is underserved by larger institutions that do not focus on this space, as well as by smaller institutions that lack product sophistication and capabilities. We offer a broad range of lending products including term loans, revolving lines of credit and treasury management products and services. As of December 31, 2023, the C&I group managed a portfolio of $2.7 billion in loans outstanding.
5
Commercial real estate. Our commercial real estate ("CRE") business focuses on experienced real estate professionals with long track records of performance and access to ample equity capital sources. We believe our specialized expertise and efficient decision making process differentiate us from our competitors. We offer fixed and floating rate term loans, construction financing and revolving lines of credit with a wide range of term options. Our portfolio is broadly diversified by geography and property type including loans secured by multifamily, industrial, retail, and office properties. As of December 31, 2023, the CRE group had $1.3 billion in loans outstanding.
Sponsor finance. Our sponsor finance group provides senior secured financing solutions to private equity backed lower middle market companies throughout the U.S. with earnings before interest, tax, depreciation and amortization generally between $2.0 million and $10.0 million. We support the acquisition, recapitalization and growth investment efforts of private equity firms operating in the lower middle market, and we believe our expertise in this niche is unique for a bank our size. As of December 31, 2023, we had $658.9 million in sponsor finance loans outstanding.
Syndications. From time to time, our syndications group seeks to deploy excess liquidity by opportunistically participating in syndicated loans, acquiring whole loans, or purchasing participations from lead banks that have existing relationships with well capitalized and experienced sponsors. We employed this strategy extensively following our recapitalization by leveraging our relationships with local, regional and national lenders as we developed our own lending capabilities and had excess liquidity. Now, with developed lending capabilities, our participation in syndications has decreased and represents a smaller portion of our portfolio. The syndications group targets transactions in the home mortgage, CRE, and C&I categories that provide attractive risk/reward characteristics, and we continue to maintain the ability to sell loan positions to manage credit and specific customer and industry concentrations. As of December 31, 2023, the group had $385.7 million in loan syndications outstanding.
Commercial deposits and treasury management. We also support our business customers with a variety of deposit and treasury management products, along with business transaction accounts. Our comprehensive suite of products includes treasury services, information reporting, fraud management, cash collection, and interest rate derivative products. We believe these tailored products allow us to provide a robust service offering to our customers and to support their day to day funding and risk management needs. These services are provided through multiple points of contact including branch, online, and mobile interfaces.
Small Business Capital. Our U.S. government guaranteed lending business serves small businesses in need of, and qualifying for, SBA and USDA loans (referred to together as "U.S. government guaranteed loans"). We provide SBA lending services throughout the country, with a primary focus on the Midwest, Tennessee, Florida, Texas, Colorado, Utah, and California. We generally sell the government guaranteed portion of SBA and USDA loans into the secondary market while retaining the non-guaranteed portion of the loan and the servicing rights. This allows us to realize one time gain on sale income along with a recurring servicing and interest revenue stream. In addition to the business development officers who we rely on to generate new business, we also have a dedicated servicing, portfolio management and workout staff with specialized expertise in U.S. government guaranteed loans. As of December 31, 2023, total loans and leases included the guaranteed amount of U.S. government guaranteed loans of $93.3 million. The total unpaid principal balances of SBA and USDA loans serviced for others was $1.7 billion at December 31, 2023.
Community banking
We offer customers traditional deposit products through our branch network, consumer and business online account opening through our website, and customer access to their accounts through online and mobile banking platforms. The wide variety of deposit products we offer include non-interest-bearing accounts, money market demand accounts, savings accounts, interest-bearing checking accounts and time deposits with maturities ranging from seven days to five years. We consider our core deposits, defined as all deposits except time deposits exceeding $100,000, to be our primary and most valuable funding source. As of December 31, 2023, core deposits represented 87.0% of our total deposits. In addition to these products, we offer ATM and debit cards as well as online, mobile, and text banking. We strive to retain an attractive deposit mix from both large and small customers as well as a broad market reach, which has resulted in our top 50 customers accounting for approximately 10.3% of all deposits as of December 31, 2023. Our bankers are incentivized to acquire and maintain quality core deposits as we depend on these deposits to fund the majority of our loans and leases. We believe that our long standing and high quality relationships with our depositors who provide us with long term funding are due to the convenience and dedicated service we offer. We leverage our expansive branch locations and deep network of customer relationships in the Chicago metropolitan area to provide both low cost funding sources for our lending business and deposit related fee income. We had $7.2 billion of deposits at December 31, 2023, and our average cost of deposits was 1.90% for the year ended December 31, 2023.
Small ticket equipment leasing
Through our Bank’s subsidiary, Byline Financial Group ("BFG"), we provide financing solutions for equipment vendors and their end users. The vertical markets served by our equipment vendors specialize primarily in manufacturing, small equipment construction, wholesalers, and healthcare. The end users (i.e., our lessees and borrowers) are primarily manufacturers, retailers, wholesalers, physician group practices and other healthcare related entities. The average lease size at origination for BFG for the year ended December 31, 2023 was approximately $75,000. Our sales team originates leases throughout the country, and we have lessees in nearly every state. As of December 31, 2023, BFG had $665.7 million in leases outstanding with a weighted average life of approximately 3.5 years.
6
Trust and wealth management
We provide investment, trust and wealth management services to our customers, such as foundations and endowments and high net worth individuals, which include fiduciary and executor services, financial planning solutions, investment advisory services, and private banking services. These services are provided through credentialed investment, legal, tax, and wealth management professionals who identify opportunities and provide services tailored to our customers’ goals and objectives. Assets under administration were $770.5 million as of December 31, 2023.
Competition
The financial services industry is highly competitive as we compete for loans, leases, deposits and customer relationships within and outside of our markets. Competition involves efforts to retain current customers, make new loans and leases, obtain new deposits, increase the scope and sophistication of services offered, the availability, ease of use, and range of banking services provided on the internet and through mobile devices, and offer competitive interest rates paid on deposits and charged on loans and leases. We face competition not only from other financial holding companies and commercial banks, but also from internet banks, savings and loan associations, FinTech companies, credit unions, trust and wealth management providers, and other providers of financial services and products. Competition is generally based on the variety, rates and terms of products and services offered to customers and the performance of funds under management.
Human Capital
At Byline, we are a bank that believes in putting our name behind everything we do and we are here to roll up our sleeves and help our customers write their stories. Our #1 core value, reflected in our "Things That Matter," is our People, all of whom are encouraged to live out a shared purpose of making people’s lives better, helping businesses thrive, and strengthening the communities we serve. We believe purpose driven leadership facilitates progress in achieving a diverse and inclusive workforce and in driving performance. We are dedicated to attracting, retaining, and developing top talent to accomplish our long-term strategy which is critical to our success. It is this shared purpose and focus on People that allowed us to be recognized in 2023 by Forbes as one of America’s Best Small Employers.
In 2023 we issued our first Environmental, Social and Governance ("ESG") Report. We are proud of all we have accomplished to reach underserved communities, serve the diverse and unique credit and borrowing needs of our clients, measure our carbon footprint, and further increase the diversity of our talent pipeline by focusing on inclusive hiring practices across all roles.
Governance and Oversight
Our Board of Directors and executive management team are committed to executing on our long-term vision. Our Board members are accomplished leaders from diverse backgrounds, bringing the perspectives, skills, and experience necessary to use independent judgment that will effectively challenge and drive continued success. Our Board members oversee our corporate strategy and sets the tone for our culture, values and high ethical standards, and, through its Committees, holds management accountable for results. The Compensation Committee reviews and monitors matters related to human capital management, including compensation and benefits, Company culture, talent development, diversity, equity and inclusion ("DEI") programs and initiatives and other ESG matters.
Total Rewards
At Byline Bank we recognize that our most valuable resource is our People. We strive to become an employer of choice and many of our advantages are found within our four Total Rewards pillars: Pay, Benefits, Health and Wellness, Work-Life Harmony, and Professional Development.
Pay
We believe our compensation strategy supports our core principles and provides every employee with a competitive compensation package that fairly reflects their individual contributions to Byline. We offer a compensation package which includes base pay, short-term incentives (annual cash bonuses, commissions plans, and referral incentives) and long-term incentives (equity-based compensation) for applicable roles. Our approach to compensation is driven by internal and external equity which seeks to ensure our compensation elements are competitive and market driven. In our commitment to transparency, our job architecture and paygrade structure is communicated to all employees.
Benefits, Health and Wellness
We believe that our benefits package not only attracts top talent but also fosters a positive and engaged workforce. We provide a comprehensive health insurance plan that covers medical expenses for our employees and their dependents including legal spouse, domestic partner, children up to age 26, and disabled children over age 26. We offer a 401(k) retirement savings plan, with an employer match, and an Employee Stock Purchase Plan with a discount on the price of the stock. Additionally, employees have access to resources and information to help with financial planning, mental health and wellbeing, and personal, family and life issues. We provide a tuition reimbursement and student loan repayment program. We offer wellness programs, an adoption and surrogacy assistance program, as well as cover fertility planning services within the healthcare plans and provide up to 12 weeks of paid parental leave for employees.
7
Work-Life Harmony
Eligible employees are provided paid time off and 11 paid federal holidays, including Juneteenth, and one floating Cultural Holiday to observe a holiday of personal significance.
Our work-life philosophy is to lead with flexibility. We offer our non-branch employees the opportunity to work either fully remote or hybrid based on the expectations of their role. During 2023, approximately 51% of non-branch employees were working fully remote, 42% were in the office one to three days per week, and 7% were in the office full-time. We believe this level of flexibility to be a competitive advantage to attracting and retaining talent within and outside of our market.
Professional Development Opportunities
We recognize the critical importance of providing career development and advancement opportunities for all employees, and we provide a variety of formal and informal development opportunities to help employees grow in their current roles and build new skills.
Over 100 senior leaders have attended the Byline Leadership That Matters program and we have made additional investments to the Management That Matters program which focuses on enhancing core management skills. All employees have access to development resources for each of the four behavioral competencies expected of all Byline employees in the annual performance management process: Valuing Differences, Collaborating for Results, Delivering Customer Focused Solutions, and Continuous Improvement. We believe one example of our success in optimally deploying talent is our ability to fill vacancies from within. During 2023, approximately 28% of our position postings were filled internally. We encourage our employees to pursue educational opportunities, including obtaining certifications, that will help improve performance and professional development.
Our Board of Directors oversees the succession planning for executive management on an annual basis. Key development areas are identified by evaluating leadership, business, and executive role-based skills. Succession candidates create development plans that are updated throughout the year.
Diversity, Equity and Inclusion
Our commitment to DEI starts with our Board of Directors, of which 78% are female and/or racially or ethnically diverse. We believe this diversity enables us to set the expectations for the Company and drive meaningful initiatives and change.
To facilitate talent attraction, development and retention across our franchise, we strive to make Byline a diverse, inclusive, safe and healthy workplace, with opportunities for our employees to grow and develop in their careers, supported by strong compensation, benefits, and health and welfare programs.
We seek to leverage our current diverse workforce and prominent community outreach efforts to further define and enhance our DEI focus in four key areas:
Our employee resource groups ("ERG") and affinity resource group ("ARG") were formed to support development, engagement and inclusion across the organization. As part of our workforce initiatives, during 2023 we launched the Women’s Development Program. as well as began providing leadership educational opportunities and peer discussions for members and allies of our ERGs and ARG.
Our diversity metrics as of December 31, 2023 are as follows:
|
|
Female |
|
Male |
|
Racial/Ethnic |
|
Overall Diversity |
Workforce |
|
61% |
|
39% |
|
43% |
|
73% |
Executive Leadership |
|
43% |
|
57% |
|
36% |
|
64% |
Board of Directors |
|
33% |
|
67% |
|
67% |
|
78% |
8
Employee Recognition and Engagement
We conduct an annual employee engagement survey with over 90% participation and continue to see improvements in employee engagement year-over-year. We focus on communication with employees and managers through monthly manager forums, quarterly all employee calls, and town hall meetings.
Human Capital Metrics
As of December 31, 2023, we had 1,055 employees (1,036 full time, and 19 part time) in locations primarily across the Chicagoland and greater Milwaukee, Wisconsin areas. Our employees are not represented by a collective bargaining agreement. We consider our relationship with our employees to be good. We believe we have a strong bench of talent and are attracting experienced bankers from larger regional banks as a result of continued market disruption.
For additional information, please see our definitive proxy statement for our 2024 Annual Meeting of Stockholders, a copy of which will be filed with the SEC no later than 120 days after the end of our fiscal year.
Corporate Information
Our principal executive offices are located at 180 North LaSalle Street, Suite 300, Chicago, Illinois 60601, and our telephone number at that address is (773) 244-7000. Our website address is www.bylinebancorp.com. We make available at this address, under the "Investor Relations" tab, free of charge, our Annual Report on Form 10-K, Quarterly Reports on Form 10-Q, Current Reports on Form 8-K and amendments to those reports filed or furnished pursuant to Section 13(a) or 15(d) of the Securities Exchange Act of 1934, as amended (the "Exchange Act") as soon as reasonably practicable after such material is electronically filed with, or furnished to, the SEC. These filings are also available on the SEC's website at www.sec.gov. The contents of our website are not incorporated by reference into this report.
Supervision and Regulation
We and our subsidiaries are subject to extensive regulation under federal and state banking laws that establish a comprehensive framework for our operations, and are subject to oversight and supervision by multiple federal and state banking agencies, including the Federal Deposit Insurance Corporation (the "FDIC"), the Board of Governors of the Federal Reserve System (the "FRB") and the Illinois Department of Financial and Professional Regulation (the "IDFPR"). This framework may materially affect our growth potential and financial performance and is intended primarily for the protection of depositors, customers, federal deposit insurance funds and the banking system as a whole, not for the protection of our stockholders and creditors. Any change in applicable laws or regulations, whether by the FDIC, the FRB, the IDFPR or the U.S. Congress, could have a material adverse impact on the operations and financial performance of us and our subsidiaries.
Set forth below is a brief description of the significant elements of the statutes, regulations and policies applicable to us and our subsidiaries. The description below is limited to certain material aspects of the statutes and regulations addressed and is not intended to be a complete description of such statutes and regulations and their effects on us and our subsidiaries.
Regulatory Agencies
We are a bank holding company under the Bank Holding Company Act of 1956 (the "BHCA"). Consequently, we and our subsidiaries are subject to supervision, regulation and examination by the FRB. The BHCA provides generally for "umbrella" regulation of bank holding companies and functional regulation of holding company subsidiaries by applicable regulatory agencies. We are also subject to the rules and regulations of the SEC under the federal securities laws, including the disclosure and regulatory requirements of the Securities Act and the Exchange Act as administered by the SEC, and the rules adopted by the New York Stock Exchange (the "NYSE") applicable to NYSE listed companies.
Byline Bank, our bank subsidiary, is an FDIC-insured commercial bank chartered under the laws of Illinois. Our bank is not a member of the FRB. Consequently, the FDIC and the IDFPR are the primary regulators of our bank and also regulate our bank’s subsidiaries. As the owner of an Illinois-chartered commercial bank, we are also subject to supervision and examination by the IDFPR.
Permissible Activities for Bank Holding Companies
In general, the BHCA limits the business of bank holding companies to banking, managing or controlling banks and other activities that the FRB has determined to be so closely related to banking as to be a proper incident thereto, which include certain activities relating to extending credit or acting as an investment or financial advisor. We currently do not conduct any non-banking activities through any non-bank subsidiaries.
Bank holding companies that qualify and elect to be treated as "financial holding companies" may engage in a broader range of additional activities than bank holding companies that are not financial holding companies. In particular, financial holding companies may engage in activities that are (i) financial in nature or incidental to such financial activities or (ii) complementary to a financial activity and do not pose a substantial risk to the safety and soundness of depository institutions or the financial system generally. These activities include securities underwriting and dealing, insurance underwriting and making merchant banking investments. We have not elected to be treated as a financial holding company and currently have no plans to make a financial holding company election.
9
The FRB has the power to order any bank holding company or any of its subsidiaries to terminate any activity or to terminate its ownership or control of any subsidiary when the FRB has reasonable grounds to believe that continuing such activity, ownership or control constitutes a serious risk to the financial soundness, safety or stability of any bank subsidiary of the bank holding company.
Permissible Activities for Banks
As an Illinois-chartered commercial bank, our bank’s business is subject to extensive supervision and regulation by state and federal bank regulatory agencies. Our business is generally limited to activities permitted by Illinois law and any applicable federal laws. Under the Illinois Banking Act, our bank may generally engage in all usual banking activities, including, among other things, accepting deposits; lending money on personal and real estate security; issuing letters of credit; buying, discounting, and negotiating promissory notes and other forms of indebtedness; buying and selling foreign currency and, subject to certain limitations, certain investment securities; engaging in certain insurance activities and maintaining safe deposit boxes on premises.
Illinois law also imposes restrictions on Byline Bank’s activities intended to ensure the safety and soundness of our bank. For example, Byline Bank is restricted under the Illinois Banking Act from investing in certain types of investment securities and is generally limited in the amount of money it can lend to a single borrower or invest in securities issued by a single issuer.
Acquisitions by Bank Holding Companies
The BHCA, Section 18(c) of the Federal Deposit Insurance Act, popularly known as the "Bank Merger Act," the Illinois Banking Act, the Illinois Bank Holding Company Act and other federal and state statutes regulate acquisitions of commercial banks and other FDIC-insured depository institutions. We must obtain the prior approval of the FRB under the BHCA before (i) acquiring more than 5% of the voting stock of any FDIC-insured depository institution or other bank holding company(other than directly through our bank), (ii) acquiring all or substantially all of the assets of any bank or bank holding company or (iii) merging or consolidating with any other bank holding company. Under the Bank Merger Act, the prior approval of the FDIC is required for our bank to merge with another bank or purchase all or substantially all of the assets or assume any of the deposits of another FDIC-insured depository institution or to assume certain liabilities of non-banks. In reviewing applications seeking approval of merger and acquisition transactions, banking regulators consider, among other things, the competitive effect and public benefits of the transactions, the capital position and managerial resources of the combined organization, the risks to the stability of the U.S. banking or financial system, the applicant’s performance record under the Community Reinvestment Act of 1977 ("CRA"), the applicant’s compliance with fair housing and other consumer protection laws and the effectiveness of all organizations involved in combating money laundering activities. In addition, failure to implement or maintain adequate compliance programs could cause banking regulators not to approve an acquisition where regulatory approval is required or to prohibit an acquisition even if approval is not required.
Dividends
We are a legal entity separate and distinct from Byline Bank and other subsidiaries. As a bank holding company, we are subject to certain restrictions on our ability to pay dividends under applicable banking laws and regulations.
Federal banking regulators are authorized to determine under certain circumstances relating to the financial condition of a bank holding company or a bank that the payment of dividends would be an unsafe or unsound practice and to prohibit payment thereof. In particular, federal banking regulators have stated that paying dividends that deplete a banking organization’s capital base to an inadequate level would be an unsafe and unsound banking practice and that banking organizations should generally pay dividends only out of current operating earnings. In addition, in the current financial and economic environment, the FRB has indicated that bank holding companies should carefully review their dividend policy and has discouraged payment ratios that are at maximum allowable levels unless both asset quality and capital are very strong. Under the capital rules defined in the Regulatory Capital Requirements section, institutions that seek to pay dividends must maintain 2.5% in Common Equity Tier 1 capital attributable to the capital conservation buffer. For more information on these financial measures at the Company and Byline Bank, refer to Note 20 of the notes to our audited consolidated financial statements contained in Item 8 of this report.
A significant portion of our income, on a stand-alone basis, comes from dividends from our bank, which is also the primary source of our liquidity. In addition to the restrictions discussed previously, our bank is subject to limitations under Illinois law regarding the level of dividends that it may pay to us. Under the Illinois Banking Act, Byline Bank generally may not pay dividends in an amount greater than its net profits then on hand, deducting first therefrom its losses and bad debts. Under these restrictions, Byline Bank could pay aggregate dividends of approximately $206.7 million to us without obtaining affirmative regulatory approvals as of December 31, 2023.
Transactions with Affiliates and Insiders
Transactions between our bank and its subsidiaries, on the one hand, and us or any other subsidiary, on the other hand, are regulated under Sections 23A and 23B of the Federal Reserve Act. The Federal Reserve Act imposes quantitative and qualitative requirements and collateral requirements on covered transactions by Byline Bank with, or for the benefit of, its affiliates. Generally, Sections 23A and 23B of the Federal Reserve Act limit the extent to which our bank or its subsidiaries may engage in "covered transactions" with any one affiliate to an amount equal to 10% of our bank’s capital stock and surplus, limits the aggregate amount of all such transactions with all affiliates to an amount equal to 20% of such capital stock and surplus, and requires those transactions to be on terms at least as favorable to our bank as if the transaction were conducted with an unaffiliated third party. Covered transactions are defined by statute to include a loan or extension of credit, as well as a purchase of securities issued by an affiliate, a purchase of
10
assets (unless otherwise exempted by the FRB) from the affiliate, certain derivative transactions with an affiliate, the acceptance of securities issued by the affiliate as collateral for a loan, and the issuance of a guarantee, acceptance or letter of credit on behalf of an affiliate. In addition, any credit transactions with any affiliate must be secured by designated amounts of specified collateral.
Federal law also limits our bank’s authority to extend credit to its insiders, which is defined under applicable law to include its directors, executive officers and 10% stockholders, as well as to entities controlled by such persons, or their immediate family members as defined under the regulation. Among other things, extensions of credit to insiders are required to be made on terms that are substantially the same as, and follow credit underwriting procedures that are not less stringent than, those prevailing for comparable transactions with unaffiliated persons. Also, the terms of such extensions of credit may not involve more than the normal risk of non-repayment or present other unfavorable features and may not exceed certain limitations on the amount of credit extended to such persons individually and in the aggregate. In addition, we have certain stockholders who are foreign nationals, and we and these foreign national stockholders have entered into commitments with the FRB that restrict our ability to engage in certain business transactions without the consent of the FRB.
Source of Strength
FRB policy and federal law require bank holding companies to act as a source of financial and managerial strength to their subsidiary banks. Under this requirement, we are expected to commit resources to support Byline Bank, including at times when we may not be in a financial position to provide such resources, and it may not be in our, or our stockholders’ or creditors’, best interests to do so. In addition, any capital loans we make to our bank are subordinate in right of payment to depositors and to certain other indebtedness of our bank. In the event of our bankruptcy, any commitment by us to a federal banking regulatory agency to maintain the capital of our bank will be assumed by the bankruptcy trustee and entitled to priority of payment.
Regulatory Capital Requirements
The FRB monitors the capital adequacy of our holding company on a consolidated basis, and the FDIC and the IDFPR monitor the capital adequacy of our bank. The banking regulators use a combination of risk-based guidelines and a leverage ratio to evaluate capital adequacy. The risk-based capital guidelines applicable to us and our bank are based on the Basel Committee’s December 2010 final capital framework for strengthening international capital standards, known as Basel III, as implemented by the federal banking regulators, as well as various other rules implemented by the federal banking regulators as described below. The risk-based guidelines are intended to make regulatory capital requirements sensitive to differences in credit and market risk profiles among banks and bank holding companies, to account for off-balance sheet exposure and to minimize disincentives for holding liquid assets.
The Capital Rules. Over the past several years, the federal banking regulators have adopted a number of final rules, which we refer to as the Capital Rules, implementing Basel III, various provisions of the Dodd-Frank Wall Street and Consumer Protection Act (the "Dodd-Frank Act"), various provisions of the Economic Growth Regulatory Relief and Consumer Protection Act (the "Consumer Protection Act") and certain other statutory and regulatory provisions relating to capital requirements. The Capital Rules, among other things, (i) include a capital measure called "Common Equity Tier 1" ("CET1"), (ii) specify that Tier 1 capital consists of CET1 and "Additional Tier 1 capital" instruments meeting certain revised requirements, (iii) define CET1 narrowly by requiring that most deductions/adjustments to regulatory capital measures be made to CET1 and not to the other components of capital and (iv) expand the scope of the deductions/adjustments to capital as compared to prior regulations. The Capital Rules also address risk based capital requirements and risk weights and other issues affecting regulatory capital ratio calculations.
Under the Capital Rules, the minimum capital ratios are (i) 4.5% CET1 to risk-weighted assets, (ii) 6% Tier 1 capital (that is, CET1 plus Additional Tier 1 capital) to risk-weighted assets, (iii) 8% total capital (that is, Tier 1 capital plus Tier 2 capital) to risk- weighted assets and (iv) 4% Tier 1 capital to average consolidated assets as reported on consolidated financial statements (known as the "leverage ratio").
The current Capital Rules also include a capital conservation buffer designed to absorb losses during periods of economic stress. The capital conservation buffer, which is composed entirely of CET1, is in addition to these minimum risk-weighted asset ratios. The capital conservation buffer is equal to 2.5% of CET1. In addition, the Capital Rules provide for a countercyclical capital buffer applicable only to certain covered institutions. We do not expect the countercyclical capital buffer to be applicable to us or our bank. Banking institutions with a ratio of CET1 to risk-weighted assets above the minimum but below the capital conservation buffer (or below the combined capital conservation buffer and countercyclical capital buffer, when the latter is applied) will face constraints on dividends, equity repurchases, and compensation based on the amount of the shortfall.
As a result of the fully phased-in capital conservation buffer rule, we and our bank are required to maintain an additional capital conservation buffer of 2.5% of CET1, effectively resulting in minimum ratios of (i) 7% CET1 to risk-weighted assets, (ii) 8.5% Tier 1 capital to risk-weighted assets, (iii) 10.5% total capital to risk-weighted assets and (iv) a minimum leverage ratio of 4%.
The Capital Rules provide for a number of deductions from and adjustments to CET1. These include, for example, the requirement that mortgage servicing rights, certain deferred tax assets and significant investments in non-consolidated financial entities be deducted from CET1 to the extent that any one such category exceeds 10% of CET1 or all such categories in the aggregate exceed 15% of CET1. Implementation of the deductions and other adjustments to CET1 began on January 1, 2015 and have been phased in over the past several years. The Capital Rules also generally preclude certain hybrid securities, such as trust preferred securities, from being counted as Tier 1 capital for most bank holding companies. Bank holding companies such as us who had less than $15 billion in
11
assets as of December 31, 2009 (and who continue to have less than $15 billion in assets) are permitted to include qualifying trust preferred securities issued prior to May 19, 2010 as Additional Tier 1 capital under the Capital Rules, however.
In addition, under the general risk-based Capital Rules, the effects of accumulated other comprehensive income items included in capital were excluded for the purposes of determining regulatory capital ratios. Under the Capital Rules, the effects of certain accumulated other comprehensive income items are not excluded; however, non-advanced approaches banking organizations, including us and Byline Bank, were able to make a one-time permanent election to continue to exclude these items.
The Capital Rules also include a standardized approach for risk weightings of assets that include more risk-sensitive categories compared to previous capital rules. These risk-weighting categories depend on the nature of the assets, generally ranging from 0%, for U.S. government and agency securities, to 600% for certain equity exposures, and resulting in higher risk weights for a variety of asset categories.
With respect to our bank, the Capital Rules also revised the prompt corrective action regulations pursuant to Section 38 of the Federal Deposit Insurance Act (the "FDIA"). On September 17, 2019, pursuant to the Consumer Protection Act, the federal banking regulators issued a final rule meant to simplify the capital rules for community banks. Under the final rule, most depository institutions and depository institution holding companies that have less than $10 billion in total consolidated assets, that have limited amounts of off-balance sheet exposures and trading assets and liabilities, and that have a community bank leverage ratio of greater than 9% would be eligible to opt into a community bank leverage ratio framework beginning on January 1, 2020. Under the final rule, should a qualified community bank or its holding company elect to use the community bank leverage ratio and maintain a community bank leverage ratio of greater than 9% then it would not be subject to other risk-based and leverage capital requirements, including the risk-based capital rules relating to high volatility commercial real estate, mortgage servicing rights, certain deferred tax assets and significant investments in non-consolidated financial entities, and would be considered to have met the well capitalized ratio requirements for purposes of Section 38 of the FDIA and the generally applicable capital requirements under the federal banking regulators’ capital rules. While the community bank leverage ratio framework is available to us and Byline Bank, neither we nor Byline Bank have elected to adopt the community bank leverage ratio framework at this time.
As part of the adoption of Accounting Standards Update ("ASU") 2016-13, the Company has elected to opt into the regulators’ joint current expected credit losses ("CECL") transition provision, which allows the Company to phase in the capital impact of the adoption of CECL over the next three years beginning January 1, 2022. Accordingly, capital ratios as of December 31, 2023 reflect 50% of the CECL impact, and capital ratios as of December 31, 2022 reflect 25% of the CECL impact.
Liquidity Regulations
Historically, the regulation and monitoring of bank and bank holding company liquidity has been addressed as a supervisory matter, without required formulaic measures. The Basel III final framework requires banks and bank holding companies to measure their liquidity against specific liquidity tests that, although similar in some respects to liquidity measures historically applied by banks and regulators for management and supervisory purposes, going forward would be required by regulation. One test, referred to as the liquidity coverage ratio ("LCR"), is designed to ensure that the banking entity maintains an adequate level of unencumbered high-quality liquid assets equal to the entity’s expected net cash outflow for a 30-day time horizon (or, if greater, 25% of its expected total cash outflow) under an acute liquidity stress scenario. The other test, referred to as the net stable funding ratio, or the ("NSFR"), is designed to promote more medium- and long-term funding of the assets and activities of banking entities over a one-year time horizon. These requirements incentivize banking entities to increase their holdings of U.S. Department of Treasury ("U.S. Treasury") securities and other sovereign debt as a component of assets and increase the use of long-term debt as a funding source.
Federal banking regulators approved final rules implementing the LCR for advanced approaches banking organizations (i.e., banking organizations with $250 billion or more in total consolidated assets or $10 billion or more in total on-balance sheet foreign exposure) and a modified version of the LCR for bank holding companies with at least $50 billion in total consolidated assets that are not advanced approaches banking organizations. Neither of these final versions of the LCR apply to us or our bank. On October 20, 2020, federal banking regulators also approved a final rule implementing the NSFR that requires certain U.S. banking organizations to ensure that they have access to stable funding over a defined time period. However, the final rule implementing the NSFR does not apply to U.S. banking organizations with less than $50 billion in total consolidated assets such as us and Byline Bank.
Prompt Corrective Action Framework
The FDIA requires federal banking regulators to take prompt corrective action in respect of depository institutions that fail to meet specified capital requirements. The FDIA establishes five capital categories: "well capitalized," "adequately capitalized," "undercapitalized," "significantly undercapitalized," and "critically undercapitalized." Federal banking regulators are required to take certain mandatory supervisory actions, and are authorized to take other discretionary actions, with respect to institutions that are undercapitalized, significantly undercapitalized or critically undercapitalized. The severity of these mandatory and discretionary supervisory actions depends upon the capital category in which the institution is placed. The relevant capital measures, which reflect changes under the Capital Rules that became effective on January 1, 2015, are the total capital ratio, the CET1 capital ratio, the Tier 1 capital ratio and the leverage ratio.
A bank will be (i) "well capitalized" if the institution has a total risk-based capital ratio of 10% or greater, a CET1 capital ratio of 6.5% or greater, a Tier 1 risk-based capital ratio of 8% or greater and a leverage ratio of 5% or greater, and is not subject to any order
12
or written directive by any such regulatory authority to meet and maintain a specific capital level for any capital measure;(ii) "adequately capitalized" if the institution has a total risk-based capital ratio of 8% or greater, a CET1 capital ratio of 4.5% or greater, a Tier 1 risk- based capital ratio of 6% or greater and a leverage ratio of 4% or greater and is not "well capitalized;" (iii) "undercapitalized" if the institution has a total risk-based capital ratio that is less than 8%, a CET1 capital ratio less than 4.5%, a Tier 1 risk-based capital ratio of less than 6% or a leverage ratio of less than 4%; (iv) "significantly undercapitalized" if the institution has a total risk-based capital ratio of less than 6%, a CET1 capital ratio less than 3%, a Tier 1 risk-based capital ratio of less than 4% or a leverage ratio of less than 3%; and (v) "critically undercapitalized" if the institution’s tangible equity is equal to or less than 2% of average quarterly tangible assets. A bank’s capital category is determined solely for the purpose of applying prompt corrective action regulations, and the capital category may not constitute an accurate representation of Byline Bank’s overall financial condition or prospects for other purposes.
The FDIA generally prohibits a depository institution from making any capital distributions (including payment of a dividend) or paying any management fee to its parent holding company if the depository institution would thereafter be "undercapitalized." An institution that is categorized as undercapitalized, significantly undercapitalized or critically undercapitalized is required to submit an acceptable capital restoration plan to its appropriate federal banking regulator. Under the FDIA, in order for the capital restoration plan to be accepted by the appropriate federal banking agency, a bank holding company must guarantee that a subsidiary depository institution will comply with its capital restoration plan, subject to certain limitations. The bank holding company must also provide appropriate assurances of performance. The obligation of a controlling bank holding company under the FDIA to fund a capital restoration plan is limited to the lesser of 5% of an undercapitalized subsidiary’s assets or the amount required to meet regulatory capital requirements. An undercapitalized institution is also generally prohibited from increasing its average total assets, making acquisitions and capital distributions, establishing any branches or engaging in any new line of business, except in accordance with an accepted capital restoration plan or with the approval of the FDIC. Institutions that are undercapitalized and either fail to submit an acceptable capital restoration plan or fail to implement an approved capital restoration plan may be subject to a number of requirements and restrictions, including orders to sell sufficient voting stock to become adequately capitalized, requirements to reduce total assets and cessation of receipt of deposits from correspondent banks.
Significantly undercapitalized depository institutions may be subject to a number of requirements and restrictions, including orders to sell sufficient voting stock to become adequately capitalized, requirements to reduce total assets, and cessation of receipt of deposits from correspondent banks. Critically undercapitalized depository institutions are subject to appointment of a receiver or conservator.
The appropriate federal banking agency may, under certain circumstances, reclassify a well-capitalized insured depository institution as adequately capitalized. The FDIA provides that an institution may be reclassified if the appropriate federal banking agency determines (after notice and opportunity for hearing) that the institution is in an unsafe or unsound condition or deems the institution to be engaging in an unsafe or unsound practice. The appropriate agency is also permitted to require an adequately capitalized or undercapitalized institution to comply with the supervisory provisions as if the institution were in the next lower category (but not treat a significantly undercapitalized institution as critically undercapitalized) based on supervisory information other than the capital levels of the institution. An institution may be downgraded to, or deemed to be in, a capital category that is lower than indicated by its capital ratios if it is determined to be in an unsafe or unsound condition or if it receives an unsatisfactory examination rating with respect to certain matters.
As part of the adoption of ASU 2016-13, the Company has elected to opt into the regulators’ joint CECL transition provision, which allows the Company to phase in the capital impact of the adoption of CECL over a three year period, which began January 1, 2022. Accordingly, capital ratios as of December 31, 2023 reflect 50% of the CECL impact. As of December 31, 2023, our Company was considered "well capitalized" with a Tier 1 capital ratio of 11.39%, total capital ratio of 13.38%, Tier 1 leverage ratio of 10.86%, and a CET1 capital ratio of 10.35%, as calculated under Basel III. For more information on these financial measures at the Company and Byline Bank, refer to Note 20 of the notes to our audited consolidated financial statements contained in Item 8 of this report.
Safety and Soundness Standards
The FDIA requires the federal banking agencies to prescribe standards, by regulations or guidelines, relating to internal controls, information systems and internal audit systems, loan documentation, credit underwriting, interest rate risk exposure, asset growth, asset quality, earnings, stock valuation and compensation, fees and benefits, and such other operational and managerial standards as the agencies deem appropriate. Federal banking agencies adopted the Interagency Guidelines for Establishing Standards for Safety and Soundness. Such guidelines establish general standards relating to internal controls and information systems, internal audit systems, loan documentation, credit underwriting, interest rate exposure, asset growth, asset quality, earnings and compensation, fees and benefits. In general, these guidelines require, among other things, appropriate systems and practices to identify and manage the risk and exposures specified in the guidelines. These guidelines also prohibit excessive compensation as an unsafe and unsound practice and describe compensation as excessive when the amounts paid are unreasonable or disproportionate to the services performed by an executive officer, employee, director or principal stockholder. In addition, the agencies adopted regulations that authorize, but do not require, an agency to order an institution that has been given notice by an agency that it is not satisfying any of such safety and soundness standards to submit a compliance plan. If, after being so notified, an institution fails to submit an acceptable compliance plan or fails in
13
any material respect to implement an acceptable compliance plan, the banking regulator must issue an order directing action to correct the deficiency and may issue an order directing other actions of the types to which an undercapitalized institution may be subject under the FDIA. See Item 1. "Business—Supervision and Regulation—Prompt Corrective Action Framework." If an institution fails to comply with such an order, the banking regulator may seek to enforce such order in judicial proceedings and to impose civil money penalties.
Deposit Insurance
FDIC insurance assessments
As an FDIC-insured bank, our bank must pay deposit insurance assessments to the FDIC based on its average total assets minus its average tangible equity. Deposits are insured up to applicable limits by the FDIC and such insurance is backed by the full faith and credit of the U.S. government.
As an institution with less than $10 billion in assets, our bank’s assessment rates are based on the level of risk it poses to the FDIC’s deposit insurance fund (the "DIF"). The FDIC has the authority to increase insurance assessments and published a final rule on October 24, 2022 to increase initial base deposit insurance assessment rate schedules uniformly by 2 basis points, which began in the first quarterly assessment period of 2023. The stated purpose of the increase in assessment rate schedules is to increase the likelihood that the reserve ratio of the DIF reaches the statutory minimum of 1.35% by the statutory deadline of September 30, 2028. For established smaller institutions, like Byline Bank, supervisory ratings are used along with (i) an initial base assessment rate, (ii) an unsecured debt adjustment (which can be positive or negative) and (iii) a brokered deposit adjustment, to calculate a total base assessment rate. Accordingly, as of January 1, 2023, the total base assessment rate range, which does not include the depository institution debt adjustment, for institutions of Byline Bank’s size is 2.5 basis points to 32 basis points.
The limit on FDIC deposit insurance is $250,000. The coverage limit is per depositor, per insured depository institution for each account ownership category. The minimum DIF reserve ratio is 1.35% of estimated insured deposits. Under the FDIA, the FDIC may terminate deposit insurance upon a finding that an institution has engaged in unsafe and unsound practices, is in an unsafe or unsound condition to continue operations or has violated any applicable law, regulation, rule, order or condition imposed by the FDIC.
Other assessments
All Illinois state-chartered banks are required to pay supervisory assessments to the IDFPR to fund the operations of that agency. The amount of the assessment is calculated on the basis of Byline Bank’s total assets.
The Volcker Rule
The Dodd-Frank Act, pursuant to a statutory provision commonly called the "Volcker Rule," prohibits banks and their affiliates from engaging in proprietary trading and investing in and sponsoring hedge funds and private equity funds. The Volcker Rule became effective in July 2015. On July 9, 2019, pursuant to the Consumer Protection Act, the federal banking regulators issued a final rule to exempt community banks that have total assets of $10 billion or less and total consolidated trading assets and liabilities equal to or less than 5% of total consolidated assets from the Volcker Rule. Although we and Byline Bank qualify for exemption under the final rule, the Volcker Rule would not significantly affect the operations of us and our subsidiaries, as we do not have any significant engagement in the businesses covered by the Volcker Rule.
Depositor Preference
The FDIA provides that, in the event of the "liquidation or other resolution" of an insured depository institution, the claims of depositors of the institution, including the claims of the FDIC as subrogee of insured depositors, and certain claims for administrative expenses of the FDIC as a receiver, will have priority over other general unsecured claims against the institution. If an insured depository institution fails, insured and uninsured depositors, along with the FDIC, will have priority in payment ahead of unsecured, non-deposit creditors, including depositors whose deposits are payable only outside of the U.S. and the parent bank holding company, with respect to any extensions of credit they have made to such insured depository institution.
Interstate Branching
Illinois state-chartered banks, such as Byline Bank, have the authority under Illinois law to establish branches anywhere in the State of Illinois, subject to receipt of all required regulatory approvals.
Federal law permits state and national banks to merge with banks in other states subject to: (i) regulatory approval; (ii) federal and state deposit concentration limits; and (iii) any state law limitations requiring the merging bank to have been in existence for a minimum period of time (not to exceed five years) prior to the merger. The establishment of new interstate branches or the acquisition of individual branches of a bank in another state (rather than the acquisition of an out-of-state bank in its entirety) has historically been permitted only in those states the laws of which expressly authorize such expansion. However, the Dodd-Frank Act permits well-capitalized and well-managed banks to establish new branches across state lines without these impediments.
Consumer Financial Protection
We are subject to a number of federal and state consumer protection laws that extensively govern our relationship with our customers. These laws include the Equal Credit Opportunity Act (the "ECOA"), the Fair Credit Reporting Act, the Truth in Lending Act (the "TILA"), the Truth in Savings Act, the Electronic Fund Transfer Act, the Expedited Funds Availability Act, the Home Mortgage
14
Disclosure Act, the Fair Housing Act, the Real Estate Settlement Procedures Act, the Fair Debt Collection Practices Act, the Fair Credit Reporting Act, the Service Members Civil Relief Act, the Right to Financial Privacy Act, the Telephone Consumer Protection Act, the CAN-SPAM Act, and these laws’ respective state-law counterparts, as well as state usury laws and laws regarding unfair and deceptive acts and practices. These and other federal laws, among other things, require disclosures of the cost of credit and terms of deposit accounts, provide substantive consumer rights, prohibit discrimination in credit transactions, regulate the use of credit report information, provide financial privacy protections, restrict our ability to raise interest rates on extensions of credit and subject us to substantial regulatory oversight. Violations of applicable consumer protection laws can result in significant potential liability from litigation brought by customers, including actual damages, restitution and attorneys’ fees. Federal banking regulators, state attorneys general and state and local consumer protection agencies may also seek to enforce consumer protection requirements and obtain these and other remedies, including regulatory sanctions, customer rescission rights, action by the state and local attorneys general in each jurisdiction in which we operate and civil money penalties. Failure to comply with consumer protection requirements may also result in our failure to obtain any required bank regulatory approval for merger or acquisition transactions we may wish to pursue or our prohibition from engaging in such transactions even if approval is not required.
The Consumer Financial Protection Bureau (the "CFPB"), has broad rulemaking, supervisory and enforcement powers under various federal consumer financial protection laws with respect to certain consumer financial products and services, including the ability to require reimbursements and other payments to customers for alleged legal violations. The CFPB has the authority to impose significant penalties, as well as injunctive relief that prohibits lenders from engaging in allegedly unlawful practices. The CFPB is also authorized to engage in consumer financial education, track consumer complaints, request data and promote the availability of financial services to underserved consumers and communities. Although all institutions are subject to rules adopted by the CFPB and examination by the CFPB in conjunction with examinations by the institution’s primary federal regulator, the CFPB has primary examination and enforcement authority over banks with assets of $10 billion or more. The FDIC has primary responsibility for examination of our bank and enforcement with respect to various federal consumer protection laws so long as our bank has total consolidated assets of less than $10 billion, and state authorities are responsible for monitoring our compliance with all state consumer laws. The CFPB also has the authority to require reports from institutions with less than $10 billion in assets, such as our bank, to support the CFPB in implementing federal consumer protection laws, supporting examination activities, and assessing and detecting risks to consumers and financial markets.
The consumer protection provisions of the Dodd-Frank Act and the examination, supervision and enforcement of those laws and implementing regulations by the CFPB have created a more intense and complex environment for consumer finance regulation. The CFPB has significant authority to implement and enforce federal consumer finance laws, including the TILA and the ECOA.
The CFPB has broad rulemaking authority for a wide range of consumer financial laws that apply to all banks including, among other things, the authority to prohibit "unfair, deceptive, or abusive" acts and practices. Abusive acts or practices are defined in the Dodd-Frank Act as those that (1) materially interfere with a consumer’s ability to understand a term or condition of a consumer financial product or service, or (2) take unreasonable advantage of a consumer’s (a) lack of financial savvy, (b) inability to protect herself or himself in the selection or use of consumer financial products or services or (c) reasonable reliance on a covered entity to act in the consumer’s interests. The review of products and practices to prevent such acts and practices is a continuing focus of the CFPB, and of banking regulators more broadly. The ultimate impact of this heightened scrutiny is uncertain but it could result in changes to pricing, practices, products and procedures. It could also result in increased costs related to regulatory oversight, supervision and examination, additional remediation efforts and possible penalties. The Dodd-Frank Act does not prevent states from adopting stricter consumer protection standards. State regulation of financial products and potential enforcement actions could also adversely affect our business, financial condition or results of operations.
Federal Home Loan Bank System
Byline Bank is a member of the Federal Home Loan Bank of Chicago ("FHLB"), which serves as a central credit facility for its members. The FHLB is funded primarily from proceeds from the sale of obligations of the FHLB system. It makes loans to member banks in the form of FHLB advances. All advances from the FHLB are required to be fully collateralized as determined by the FHLB.
Ability-To-Pay Rules and Qualified Mortgages
As required by the Dodd-Frank Act, the CFPB issued a series of final rules amending Regulation Z, implementing the TILA, which requires mortgage lenders to make a reasonable and good faith determination, based on verified and documented information, that a consumer applying for a residential mortgage loan has a reasonable ability to repay the loan according to its terms. These rules prohibit creditors, such as Byline Bank, from extending residential mortgage loans without regard for the consumer’s ability to repay and add restrictions and requirements to residential mortgage origination and servicing practices. In addition, these rules restrict the imposition of prepayment penalties and restrict compensation practices relating to residential mortgage loan origination.
On April 27, 2021, the CFPB issued two new rules that would modify qualified mortgage loan requirements and provide flexibility to banks and other lenders in determining consumers’ ability-to-repay. Compliance with these rules was required by October 1, 2022. Byline Bank complies with, and will continue with, all applicable qualified mortgage loan requirements.
Commercial Real Estate Guidance
In December 2015, the federal banking regulators released a statement entitled "Interagency Statement on Prudent Risk Management for Commercial Real Estate Lending" (the "CRE Guidance"). In the CRE Guidance, the federal banking regulators (i)
15
expressed concerns with institutions that ease commercial real estate underwriting standards, (ii) directed financial institutions to maintain underwriting discipline and exercise risk management practices to identify, measure and monitor lending risks and (iii) indicated that they will continue to pay special attention to commercial real estate lending activities and concentrations going forward. The federal banking regulators previously issued guidance in December 2006, entitled "Interagency Guidance on Concentrations in Commercial Real Estate Lending, Sound Risk Management Practices," which stated that an institution is potentially exposed to significant commercial real estate concentration risk, and should employ enhanced risk management practices, where (1) total commercial real estate loans represent 300% or more of its total capital and (2) the outstanding balance of such institution’s commercial real estate loan portfolio has increased by 50% or more during the prior 36 months.
Leveraged Lending Guidance
The federal banking regulators have jointly issued guidance on leveraged lending that updates and replaces prior guidance for leveraged finance activities. The revised leveraged lending guidance describes regulatory expectations for the sound risk management of leveraged lending activities, including the importance for institutions to maintain, among other things, (i) a credit limit and concentration framework consistent with the institution’s risk appetite, (ii) underwriting standards that define acceptable leverage levels, (iii) strong pipeline management policies and procedures and (iv) guidelines for conducting periodic portfolio and pipeline stress tests.
Community Reinvestment Legislation
Community Reinvestment Act of 1977 (Federal)
Under the CRA, our bank has an obligation, consistent with safe and sound operations, to help meet the credit needs of the market areas where it operates, which includes providing credit to low- and moderate-income individuals and communities. In connection with its examination of our bank, the FDIC is required to assess our bank’s compliance with the CRA. Our bank’s failure to comply with the CRA could, among other things, result in the denial or delay of certain corporate applications filed by us or our bank, including applications for branch openings or relocations and applications to acquire, merge or consolidate with another banking institution or holding company. Our bank received a rating of "Satisfactory" in its most recently completed CRA examination during March of 2023.
On October 24, 2023, the Office of the Comptroller of the Currency, the FDIC and the FRB jointly issued a final rule to revise the CRA’s implementing regulations. While the final rule formally takes effect on April 1, 2024, the majority of its provisions have a compliance date of January 1, 2026. The final rule implements a revised regulatory framework that, like the current framework, is based on bank asset size and business model. Under the final rule, banks with over $2 billion in total assets as of December 31 in either of the prior two calendar years, such as Byline Bank, will be required to be evaluated under the new "Retail Lending Test," the new "Retail Products and Services Test," the new "Community Development Financing Test" and the new "Community Development Services Test," but banks of all sizes will maintain the option to elect to be evaluated under a strategic plan with the final rule updating the standards for obtaining approval for such plan. The new Retail Lending Test evaluates a bank’s record of helping to meet the credit needs of its community through the origination and purchase of home mortgage, multifamily, small business, small farm and, in certain cases, automobile loans. The new Retail Products and Services Test evaluates the availability of a bank’s retail banking services and retail banking products and the responsiveness of such to the credit needs of the bank’s entire community. The new Community Development Financing Test evaluates a bank’s commitment to making qualifying community development loans and investments, and, lastly, the new Community Development Services Test evaluates a bank’s record of helping to meet the community development services needs of its entire community. At this time, we are unable to determine what impact, if any, the CRA reform may have on the operations of Byline Bank.
Illinois Community Reinvestment Act (State)
The Illinois Community Reinvestment Act ("IL-CRA"), which became law in March 2021, requires banks, credit unions, and nonbank mortgage companies to invest in, loan to, and serve historically disinvested communities. It is anticipated that the IL-CRA will impose certain new obligations on Byline Bank, however, the rules necessary to implement the IL-CRA have not yet been finalized. As a result, at this time, we are unable to determine what impact the IL-CRA may have on the operations of Byline Bank.
Small Business Lending Rule
On March 30, 2023, the CFPB issued a final rule amending Regulation B, the implementing regulation of the ECOA, to implement section 1071 of the Dodd-Frank Act. Consistent with section 1071, covered financial institutions are required to collect and report to the CFPB data on applications for credit for small businesses, including those that are owned by women or minorities. The rule also addresses the CFPB’s approach to privacy interests and the publication of section 1071 data, shielding certain demographic data from underwriters and other persons, recordkeeping requirements and enforcement provisions. Compliance with the small business lending rule beginning October 1, 2024 is required for covered financial institutions that originate the most covered credit transactions for small businesses (i.e., at least 2,500 covered originations in both 2022 and 2023). However, institutions with a moderate transaction volume (i.e., at least 500 but less than 2,500 covered originations in both 2022 and 2023) have until April 1, 2025 to begin complying with the rule and those with the lowest volume (i.e., at least 100 but less than 500 covered originations in both 2022 and 2023) have until January 1, 2026. Based on Byline Bank’s volume of covered transactions, it will be required to comply by October 1, 2024.
16
Financial Privacy
The federal banking regulators have adopted rules limiting the ability of banks and other financial institutions to disclose non- public information about consumers to unaffiliated third parties. These limitations require disclosure of privacy policies to consumers and, in some circumstances, allow consumers to prevent disclosure of certain personal information to an unaffiliated third party. These regulations affect how consumer information is transmitted through diversified financial companies and conveyed to outside vendors.
Anti-Money Laundering and the USA PATRIOT Act
A major focus of governmental policy on financial institutions in recent years has been combating money laundering and terrorist financing. The Uniting and Strengthening America by Providing Appropriate Tools Required to Intercept and Obstruct Terrorism Act of 2001, or the USA PATRIOT Act, substantially broadened the scope of U.S. anti money laundering laws and regulations by imposing significant new compliance and due diligence obligations, creating new crimes and penalties and expanding the extra-territorial jurisdiction of the U.S. in these areas: customer identification programs, money laundering, terrorist financing, identifying and reporting suspicious activities and currency transactions, currency crimes, and cooperation between financial institutions and law enforcement authorities. The U.S. Treasury’s Financial Crimes Enforcement Network ("FinCEN"), among other federal agencies, also promulgates rules and regulations regarding the USA PATRIOT Act with which financial institutions are required to comply. Financial institutions are prohibited from entering into specified financial transactions and account relationships and must use enhanced due diligence procedures in their dealings with certain types of high-risk customers and implement a written customer identification program. Financial institutions must take certain steps to assist government agencies in detecting and preventing money laundering and report certain types of suspicious transactions. Regulatory authorities routinely examine financial institutions for compliance with these obligations, and failure of a financial institution to maintain and implement adequate programs to combat money laundering and terrorist financing, or to comply with all of the relevant laws or regulations, could have serious legal and reputational consequences for the institution, including causing applicable bank regulatory authorities not to approve merger or acquisition transactions when regulatory approval is required or to prohibit such transactions even if approval is not required. Regulatory authorities have imposed cease and desist orders and significant civil money penalties against institutions found to be violating these obligations and have in some cases brought criminal actions against some institutions for these types of violations.
On January 1, 2021, the U.S. Congress passed the Corporate Transparency Act as part of the National Defense Authorization Act, which enacted the most significant overhaul of the anti-money laundering laws since the USA PATRIOT Act. Notable amendments include (i) significant changes to the collection of beneficial ownership information ("BOI") and the establishment of a beneficial ownership registry, which requires corporate entities (generally, any corporation, limited liability company, or other similar entity with 20 or fewer employees and annual gross income of $5 million or less) to report BOI to FinCEN (which will be maintained by FinCEN and made available upon request to financial institutions); (ii) enhanced whistleblower provisions, which provide that one or more whistleblowers who voluntarily provide original information leading to the successful prosecution of violations of the anti-money laundering laws in any judicial or administrative action brought by the Secretary of the U.S. Treasury or the U.S. Attorney General resulting in monetary sanctions exceeding $1 million (including disgorgement and interest but excluding forfeiture, restitution, or compensation to victims) will receive not more than 30% of the monetary sanctions collected and will receive increased protections; (iii) increased penalties for violations of anti-money laundering laws and regulations; (iv) improvements to existing information sharing provisions that permit financial institutions to share information relating to suspicious activity reports with foreign branches, subsidiaries, and affiliates (except those located in the People's Republic of China, the Russian Federation or certain other jurisdictions) for the purpose of combating illicit finance risks; and (v) expanded duties and enforcement powers for FinCEN. Many of the amendments, including those with respect to beneficial ownership, require FinCEN to promulgate rules.
On September 29, 2022, FinCEN finalized the first of three proposed rules to implement changes to the beneficial ownership requirements and related amendments set forth in the Corporate Transparency Act. The final rule prescribes which corporate entities created in or registered to do business in the U.S. will be required to provide BOI directly to FinCEN. This first rule is effective, and compliance is required as of January 1, 2024, however, reporting companies created or registered prior to that date will have until January 1, 2025 to file their initial reports with FinCEN.
On December 21, 2023, FinCEN finalized the second of the three proposed rules which allows for FinCEN, upon request, to disclose BOI to a statutorily defined group of governmental authorities and financial institutions. The second final rule identifies the entities FinCEN is allowed to provide access to BOI to include (i) federal agencies engaged in national security, intelligence or law enforcement activity, (ii) state, local and tribal law enforcement agencies with court authorization, (iii) foreign law enforcement agencies, judges, prosecutors and other authorities that meet specific criteria, (iv) U.S. Treasury personnel, (v) financial institutions using BOI in order to comply with customer due diligence ("CDD") requirements and (vi) regulators, acting in a supervisory capacity, evaluating such institutions for CDD-related compliance. The second final rule provides that such CDD requirements could include anti-money laundering and countering the financing of terrorism obligations set forth under the Bank Secrecy Act (e.g., anti-money laundering program, customer identification, suspicious activity reports filing and enhanced due diligence requirements) and compliance with the U.S. Treasury’s Office of Foreign Assets Control ("OFAC") sanctions. This rule provides that FinCEN may disclose BOI to an authorized financial institution provided that such institution has developed and implemented administrative, technical and physical safeguards reasonably designed to protect the information and has received the relevant reporting company’s consent to such disclosure. The second final rule is effective as of February 20, 2024.
17
Office of Foreign Assets Control Regulation
OFAC, under authority of various laws, administers and enforces economic and trade sanctions against targeted foreign countries and regimes, including designated foreign countries, nationals and others. OFAC publishes lists of specially designated targets and countries. We and our bank are responsible for, among other things, blocking accounts of, and transactions with, such targets and countries, prohibiting unlicensed trade and financial transactions with them and reporting blocked transactions after their occurrence. Failure to comply with these sanctions could have serious legal and reputational consequences and could result in civil money penalties imposed on the institution by OFAC. Failure to comply with these sanctions could also cause applicable bank regulatory authorities not to approve merger or acquisition transactions when regulatory approval is required or to prohibit such transactions even if approval is not required.
Cybersecurity
In March 2015, federal regulators issued two related statements regarding cybersecurity. One statement indicates that financial institutions should design multiple layers of security controls to establish lines of defense and to ensure that their risk management processes also address the risk posed by compromised customer credentials, including security measures to reliably authenticate customers accessing internet-based services of the financial institution. The other statement indicates that a financial institution’s management is expected to maintain sufficient business continuity planning processes to ensure the rapid recovery, resumption and maintenance of the institution’s operations after a cyberattack involving destructive malware. A financial institution is also expected to develop appropriate processes to enable recovery of data and business operations and address rebuilding network capabilities and restoring data if the institution or its critical service providers fall victim to this type of cyberattack. If we fail to observe the regulatory guidance, we could be subject to various regulatory sanctions, including financial penalties.
In November 2021, the federal regulators finalized a rule concerning notification requirements for banks related to significant computer security incidents. Under the final rule, a bank or its bank holding company is required to notify its applicable federal banking regulators within 36 hours of incidents that have materially disrupted or degraded, or are reasonably likely to materially disrupt or degrade, the banking organization’s ability to deliver services to a material portion of its customer base, jeopardize the viability of key operations of the organization, or impact the stability of the financial sector. The rule was effective April 1, 2022 and compliance was required by May 1, 2022.
In March 2022, the Cyber Incident Reporting for Critical Infrastructure Act of 2022 ("CIRCIA") was signed into law. The enactment of CIRCIA requires the U.S. Department of Homeland Security’s Cybersecurity and Infrastructure Security Agency (the "CISA") to develop and implement regulations requiring covered entities to report covered cyber incidents and ransomware payments to the CISA in an effort to better equip the CISA to provide resources and assistance to victims suffering attacks and share information necessary to warn other potential victims. In part, CIRCIA requires the CISA to develop and issue regulations requiring covered entities to report to the CISA within 72 hours from the time an entity reasonably believes a covered cyber incident occurred and within 24 hours of making any ransom payments made as a result of a ransomware attack. The CISA is required to complete mandatory rulemaking activities before the reporting requirements go into effect. It is possible, but not yet confirmed, that banks could be subject to CIRCIA.
In the ordinary course of business, we rely on electronic communications and information systems to conduct our operations and to store sensitive data. We employ an in-depth, layered, defensive approach that leverages people, processes and technology to manage and maintain cybersecurity controls. We employ a variety of preventative and detective tools to monitor, block, and provide alerts regarding suspicious activity, as well as to report on any suspected advanced persistent threats. Notwithstanding the strength of our defensive measures, the threat from cyberattacks is severe, attacks are sophisticated and increasing in volume, and attackers respond rapidly to changes in defensive measures. While to-date we have not experienced a significant compromise, significant data loss or any material financial losses related to cybersecurity attacks, our systems and those of our customers and third-party service providers are under constant threat and it is possible that we could experience a significant event in the future. Risks and exposures related to cybersecurity attacks are expected to remain high for the foreseeable future due to the rapidly evolving nature and sophistication of these threats, as well as due to the expanding use of internet banking, mobile banking and other technology-based products and services by us and our customers.
Future Legislation and Regulation
The U.S. Congress may enact legislation from time to time that affects the regulation of the financial services industry, and state legislatures may enact legislation from time to time affecting the regulation of financial institutions chartered by or operating in those states. Federal and state regulatory agencies also periodically propose and adopt changes to their regulations or change the manner in which existing regulations are applied. The substance or impact of pending or future legislation or regulation, or the application thereof, cannot be predicted, although enactment of the proposed legislation could affect the regulatory structure under which we operate and may significantly increase our costs, impede the efficiency of our internal business processes, require us to increase our regulatory capital or modify our business strategy, or limit our ability to pursue business opportunities in an efficient manner. Our business, financial condition, results of operations or prospects may be adversely affected, perhaps materially, as a result.
Information About Our Executive Officers
The following list sets forth the name, current age, principal position and recent business experience of each of our executive officers:
18
Thomas Abraham, 58, became President of Byline Bank’s Small Business Capital ("SBC") line of business in May 2019. Mr. Abraham previously served as Senior Vice President, SBA Sales Manager of SBC since October 2016.
John M. Barkidjija, 60, became Executive Vice President and Head of Commercial Real Estate and Specialty Finance of Byline Bank in January 2019. Mr. Barkidjija previously served as Senior Vice President, Group Head, Commercial Real Estate of Byline Bank since January 2014.
Thomas J. Bell III, 57, became Executive Vice President and Chief Financial Officer of Byline and Byline Bank in August 2022. Mr. Bell has been serving as Corporate Treasurer of Byline Bank since August 2013.
Megan Biggam, 45, became Executive Vice President of Community Banking of Byline Bank in February 2020. Ms. Biggam previously served as Senior Vice President of Community Banking of Byline Bank since June 2013.
Ana Casanueva, 40, became Senior Vice President and Director of Legal of Byline and Byline Bank in June 2021. Ms. Casanueva previously served as Associate General Counsel of Byline Bank since 2019, and as Corporate Development Officer from 2013 to 2019.
Mark Fucinato, 67, became Executive Vice President and Chief Credit Officer for Byline and Byline Bank in August 2020. He previously served as Senior Vice President and Senior Credit Officer of Byline Bank since August 2019. Prior to that, Mr. Fucinato served as Senior Credit Officer at MB Financial Bank from 2016 to 2019.
Roberto R. Herencia, 64, became Chairman of Byline Bancorp, Inc. and Byline Bank in June 2013, and Executive Chairman and Chief Executive Officer in February, 2021. He serves as a member of the Board of Director’s risk committee, and as a member of the risk, executive credit, trust, and Asset- Liability Committee ("ALCO") committees of Byline Bank.
Michelle Johnson, 42, became Executive Vice President and Chief Risk Officer of Byline Bank in October 2019. Prior to that, Ms. Johnson served as Deputy Chief Risk Officer since 2018. Ms. Johnson joined Byline Bank in 2015 as Director of IT Risk Management.
Nicolas Mando, 52, became Senior Vice President and Chief Technology and Operations Officer of Byline Bank in November 2021. He served as Director of Special Projects of Byline Bank since 2019. Prior to that, Mr. Mando served as Chief Operating Officer at Bridgeview Bank since 2009.
Sherylle Olano, 46, became Senior Vice President and Chief Accounting Officer of Byline and Byline Bank in August 2022. Prior to that, Ms. Olano previously served as Controller since 2014.
Alberto J. Paracchini, 53, is President and a Director of Byline Bancorp, Inc. and Chief Executive Officer, President and a Director of Byline Bank. He joined Byline in June 2013.
Brogan Ptacin, 63, became Executive Vice President and Head of Commercial Banking for Byline Bank in January 2019. Prior to that, Mr. Ptacin served as a Managing Director of First Bank & Trust since 2009 until First Bank & Trust was acquired by Byline in 2018.
Dana Rose, 54, became Executive Vice President and Chief Human Resources Officer of Byline Bank in November 2019. Prior to that, Ms. Rose served as Interim Chief Human Resources Officer for Discover Financial Services and held various other roles at Discover since 1994.
Item 1A. Risk Factors.
The material risks and uncertainties that management believes affect us are described below. You should carefully consider these risks, together with all of the information included herein. Any of the following risks, as well as risks that we do not know or currently deem immaterial, could have a material adverse effect on our business, financial condition, or results of operations.
Risks Related to Our Business
Credit and Interest Rate Risks
Our business depends on our ability to successfully manage credit risk.
The operation of our business requires us to manage credit risk. As a lender, we are exposed to the risk that our borrowers may be unable to repay their loans and leases according to their terms, and that the collateral securing repayment of their loans or leases, if any, may not be sufficient to ensure repayment. In addition, there are risks inherent in making any loan or lease, including risks with respect to the period of time over which the loan or lease may be repaid, risks relating to proper loan or lease underwriting, risks resulting from changes in economic and industry conditions and risks inherent in dealing with individual borrowers, including the risk that a borrower may not provide information to us about its business in a timely manner, and/or may present inaccurate or incomplete information to us, and risks relating to the value of collateral. In order to manage credit risk successfully, we must, among other things, maintain disciplined and prudent underwriting standards. The weakening of these standards for any reason, a lack of discipline or diligence in underwriting and monitoring loans and leases, the inability to adequately adapt policies and procedures to changes in economic or any other conditions affecting borrowers and the quality of our loan and lease portfolio, may result in defaults, foreclosures
19
and additional charge-offs and may necessitate that we significantly increase our allowance for credit losses - loans and leases, each of which could adversely affect our net income. As a result, our inability to successfully manage credit risk could have a material adverse effect on our business, financial condition, or results of operations.
We may underestimate the credit losses inherent in our loan and lease portfolio and have credit losses in excess of the amount we provide for loan and lease losses.
The credit quality of our loan and lease portfolio can have a significant impact on our earnings. We maintain an allowance for credit losses, which is a reserve established through a provision charged to expense representing management’s estimate of current expected credit losses. The allowance, in the judgment of management, is necessary to reserve for current expected losses and risks inherent in our loan and lease portfolio. The level of the allowance reflects management’s continuing evaluation of specific credit risks; the quality of the portfolio; the value of the underlying collateral; the level of non-accruing loans and leases; current expected losses inherent in the portfolio; and economic, political, and regulatory conditions. Management estimates the allowance balance using relevant available information from internal and external sources relating to past events, current conditions, and reasonable and supportable forecasts, which could increase the subjectivity of the calculation. This process, which is critical to our financial results and condition, requires difficult, subjective and complex judgments. In accordance with accounting principles generally accepted in the United States of America ("GAAP") for business combination accounting, the loans acquired through subsequent bank acquisitions are recorded at their estimated fair value, and an allowance for credit losses associated with those loans also recorded.
Although we believe our allowance for credit losses is adequate to absorb current expected losses in our loan and lease portfolio, it may not be sufficient. We could sustain credit losses that are significantly higher than the amount of our allowance as a result of a variety of reasons, such as changes in economic conditions affecting borrowers, new information and other factors within and outside our control. If real estate values were to decline or if economic conditions in our markets were to deteriorate unexpectedly, additional losses not incorporated in the existing allowance might occur. Losses in excess of the existing allowance will reduce our net income and could have a material adverse effect on our business, financial condition, or results of operations. A severe downturn in the economy generally, in our markets specifically, or affecting the business and assets of individual customers, would generate increased charge-offs and a need for higher provision for credit losses.
We may also be required to take additional provisions for credit losses in the future to further supplement the allowance due to requirements by our banking regulators. Bank regulatory agencies periodically review our allowance, the policies and procedures we use to determine the level of the allowance and the value attributed to non-performing loans or to real estate acquired through foreclosure. Such regulatory agencies may require us to make further provisions or recognize future charge-offs. Further, charge-offs in future periods that exceed the allowance would require an increase to the allowance.
Any increases in our provision for credit losses will result in a decrease in net income and may reduce retained earnings and capital and, therefore, have a material adverse effect on our business, financial condition and results of operations.
Our business is subject to interest rate risk and fluctuations in interest rates may adversely affect our earnings.
Fluctuations in interest rates may negatively affect our business and may weaken demand for some of our products. Our earnings and cash flows are largely dependent on net interest income, which is the difference between the interest income that we earn on interest-earning assets, such as investment securities, loans, and leases, the interest expense that we pay on interest-bearing liabilities, such as deposits and borrowings. Additionally, changes in interest rates also affect the premiums we may receive in connection with the sale of U.S. government guaranteed loans in the secondary market, pre-payment speeds of loans for which we own servicing rights, our ability to fund our operations with customer deposits, and the fair value of securities in our investment portfolio. Therefore, any change in general market interest rates can have a significant effect on our net interest income and results of operations.
We seek to mitigate our interest rate risk by entering into interest rate swaps and other interest rate derivative contracts from time to time with counterparties. Our hedging strategies rely on assumptions and projections regarding interest rates, asset levels, and general market factors and subject us to counterparty risk. There is no assurance that our interest rate mitigation strategies will be successful, and if our assumptions and projections prove to be incorrect or our hedging strategies do not adequately mitigate the impact of changes in interest rates, we may incur losses that could adversely affect our earnings.
Our interest-earning assets and interest-bearing liabilities may react in different degrees to changes in market interest rates. Interest rates on some types of assets and liabilities may fluctuate prior to changes in broader market interest rates, while rates on other types of assets and liabilities may lag. The result of these changes to rates may cause differing spreads on interest-earning assets and interest-bearing liabilities. Although we take measures intended to manage the risks from changes in market interest rates, we cannot control or accurately predict changes in market rates of interest or be sure our protective measures are adequate.
As of December 31, 2023, we had $1.9 billion of non-interest-bearing demand deposits and $577.6 million of interest-bearing checking accounts. As the Federal Reserve raised its overnight target rate, we have cautiously managed our deposit repricing strategies to seek to expand our net interest margin by keeping deposit rates at relatively low levels. As the competition for funding among banks increases, and customers move money to achieve higher yields, we may need to increase our deposit pricing accordingly. To the extent we offer higher interest rates on targeted interest-bearing deposit products to maintain current customers or attract new customers, our interest expense will increase, perhaps materially. Furthermore, if we fail to offer interest rates at a sufficient level to keep these demand
20
deposits, our core deposits may be reduced, which would require us to obtain funding in other ways or risk slowing our future asset growth.
We may be adversely impacted by the continuing transition from the London Interbank Offered Rate ("LIBOR") as a reference rate.
On March 5, 2021, the United Kingdom’s Financial Conduct Authority and the Intercontinental Exchange Benchmark Administration announced that the one-week and two-month U.S. dollar LIBOR ("USD LIBOR") settings would cease to be published immediately after December 31, 2021. The publication of overnight and one-, three-, six‑, and 12-month USD LIBOR settings would be extended through June 30, 2023 to provide additional time for market participants to wind down or modify existing contracts that reference these LIBOR tenors.
In response, the FDIC, the Board of Governors of the Federal Reserve System, and the OCC issued joint guidance directing banks and market participants to cease entering new LIBOR contracts after December 31, 2021, which we have done. Although most LIBOR tenors continued to be published through June 30, 2023 to aid in the transition of legacy LIBOR contracts (e.g., maturity), as of January 1, 2021, we no longer originate loans indexed to LIBOR nor enter into modifications which create new LIBOR exposure.
During 2021, we began a transition to using a forward-looking term rate based upon the Secured the Overnight Financing Rate ("SOFR"), CME Term SOFR ("Term SOFR") as the replacement benchmark index in lieu of LIBOR. SOFR is the Alternative Reference Rates Committee’s recommended alternative to USD LIBOR. Because the Term SOFR market continues to develop and deepen, changes in SOFR or Term SOFR or changes in market perceptions of the acceptability of Term SOFR as a benchmark could result in changes to our risk exposures (for example, because SOFR is a broad measurement of the cost borrowing cash secured by U.S. Treasury securities, changes or disruptions in the repo market may adversely affect the availability or cost of floating-rate funding and, therefore, our exposure to fluctuations in interest rates) or otherwise result in losses on a product or having to pay more or receive less on financial instruments that we own or have issued.
Uncertainty as to the nature of other alternative reference rates and their broader acceptance by the market may also adversely affect SOFR rates and the value of SOFR-based loans, and to a lesser extent securities in our portfolio, and may impact the availability and cost of hedging instruments and borrowings, including the rates we pay on our subordinated debentures and trust preferred securities.
Our business, profitability, and liquidity may be adversely affected by deterioration in the credit quality of, or defaults by, third parties who owe us money, securities or other assets or whose securities, or obligations we hold.
In addition to relying on borrowers to repay their loans and leases, we are exposed to the risk that third parties that owe us money, securities, or other assets will not perform their obligations. These parties may default on their obligations to us due to bankruptcy, lack of liquidity, operational failure, or other reasons. A default by a significant market participant, or concerns that such a party may default, could lead to significant liquidity problems, losses, or defaults by other parties, which in turn could adversely affect us.
We are also subject to the risk that our rights against third parties may not be enforceable in all circumstances. Deterioration in the credit quality of third parties whose securities or obligations we hold, including the Federal Home Loan Mortgage Corporation, Government National Mortgage Association and municipalities, could result in significant losses.
We depend on the accuracy and completeness of information about customers and counterparties.
In deciding whether to extend credit or enter into other transactions, and in evaluating and monitoring our loan and lease portfolio on an ongoing basis, we may rely on information furnished by or on behalf of customers and counterparties, including financial statements, credit reports, and other financial information. We may also rely on representations of those customers or counterparties or of other third parties, such as independent auditors, as to the accuracy and completeness of that information. Reliance on inaccurate, incomplete, fraudulent, or misleading financial statements, credit reports or other financial or business information, or the failure to receive such information on a timely basis, could result in loan or lease losses, reputational damage or other effects that could have a material adverse effect on our business, financial condition, or results of operations.
The value of the financial instruments we own may decline in the future.
As of December 31, 2023, we owned $1.4 billion of investment securities, which consisted primarily of our positions in U.S. government and government-sponsored enterprises and federal agency obligations, mortgage and asset-backed securities and municipal securities. We evaluate our investment securities on at least a quarterly basis, and more frequently when economic and market conditions warrant such an evaluation, to determine whether any decline in fair value below amortized cost is the result of credit losses. The process for determining whether unrealized losses contain credit losses usually requires complex, subjective judgments in order to assess the probability of receiving all contractual principal and interest payments on the security. We may be required to recognize credit losses in future periods, which could adversely affect our business, results of operations or financial condition. In addition, further increases in market interest rates may continue to affect the market value of our securities portfolio, potentially further reducing accumulated other comprehensive income and/or earnings.
21
Funding Risks
A lack of liquidity could affect operations and jeopardize our business, financial condition, and results of operations.
Liquidity risk is the risk that we will not be able to meet our obligations, including financial commitments, as they come due and is inherent in our operations. An inability to raise funds through deposits, borrowings, the sale of loans and/or investment securities, and from other sources could have a material negative effect on our liquidity. Our most important source of funds consists of our customer deposits. If customers move money out of bank deposits and into other investments, we could lose a relatively low cost source of funds. This loss would require us to seek other funding alternatives in order to continue to grow, thereby increasing our funding costs and reducing our net interest income and net income.
Other primary sources of funds consist of cash from operations and investment maturities, redemptions, and sales, as well as borrowings from the Federal Reserve Bank of Chicago, the FHLB and other third-party lenders from time to time. Our access to funding sources in amounts adequate to finance or capitalize our activities or on terms that are acceptable to us could be impaired by factors that affect us directly or the financial services industry or economy in general, such as disruptions in the financial markets or negative views and expectations about the prospects for the financial services industry.
Any decline in available funding could adversely impact our ability to continue to implement our business plan, which could have a material adverse impact on our liquidity, business, financial condition, and results of operations.
Our liquidity is dependent on dividends from Byline Bank.
We are a legal entity separate and distinct from Byline Bank, our wholly-owned banking subsidiary. A substantial portion of our cash flow from operating activities, comes primarily from dividends we receive from Byline Bank. Various federal and state laws and regulations limit the amount of dividends that the bank may pay to us. As of December 31, 2023, Byline Bank had the capacity to pay us dividends of up to $206.7 million without the need to obtain prior regulatory approval. Also, our right to participate in a distribution of assets upon a subsidiary’s liquidation or reorganization is subject to the prior claims of the subsidiary’s creditors. In the event Byline Bank is unable to pay dividends to us, we may not be able to service our existing debt or any debt we may incur, pay obligations or pay dividends on our common and preferred stock, which could have a material adverse effect on our business, financial condition or results of operations.
We may need to raise additional capital in the future, and such capital may not be available when needed or at all.
We may need to raise additional capital, in the form of debt or equity securities, in the future to have sufficient capital resources to meet our commitments and fund our business and future growth, particularly if the quality of our assets or earnings were to deteriorate significantly. Our ability to raise additional capital, if needed, will depend on, among other things, conditions in the capital markets at that time, which are outside of our control, and our financial condition. Further, if we need to raise capital in the future, we may have to do so when many other financial institutions are also seeking to raise capital and would then have to compete with those institutions for investors. An inability to raise additional capital on acceptable terms when needed, or at all, could have a material adverse effect on our business, financial condition or results of operations.
Operational Risks
We may not be able to implement our growth strategy or manage costs effectively, resulting in lower earnings or profitability.
There can be no assurance that we will be able to continue to grow and to be profitable in future periods, or, if profitable, that our overall earnings will remain consistent or increase in the future. Our strategy focuses on organic growth, supplemented by opportunistic acquisitions.
Our growth requires that we increase our loan and deposit growth while managing risks by following prudent loan underwriting standards without increasing interest rate risk or compressing our net interest margin, maintaining more than adequate capital at all times, hiring and retaining qualified employees, and successfully implementing strategic projects and initiatives. Even if we are able to increase our interest income, our earnings may nonetheless be reduced by increased expenses, such as additional employee compensation or other general and administrative expenses and increased interest expense on any liabilities incurred or deposits solicited to fund increases in assets. Additionally, if our competitors extend credit on terms we find to pose excessive risks, or at interest rates which we believe do not warrant the credit exposure, we may not be able to maintain our lending volume and could experience deteriorating financial performance. Our inability to manage our growth successfully or to continue to expand into new markets could have a material adverse effect on our business, financial condition, or results of operations.
New lines of business, products, product enhancements or services may subject us to additional risks.
From time to time, we may implement new lines of business or offer new products and product enhancements as well as new services within our existing lines of business. There are substantial risks and uncertainties associated with these efforts, particularly in
22
instances in which the markets are not fully developed. In implementing, developing, or marketing new lines of business, products, product enhancements or services, we may invest significant time and resources and not realize their expected results or returns. Further, initial timetables for the introduction and development of new lines of business, products, product enhancements or services may not be achieved, and price and profitability targets may not prove feasible. External factors, such as compliance with regulations, competitive alternatives and shifting market preferences, may also affect the ultimate implementation of a new line of business or offerings of new products, product enhancements or services. Furthermore, any new line of business, product, product enhancement or service or system conversion could have a significant impact on the effectiveness of our system of internal controls. Failure to successfully manage these risks in the development and implementation of new lines of business or offerings of new products, product enhancements or services could have a material adverse effect on our business, financial condition, or results of operations.
External Risks
Our business may be adversely affected by conditions in the financial markets and economic conditions generally.
Our financial performance generally, and in particular the ability of our borrowers to pay interest on and repay principal of outstanding loans and leases and the value of collateral securing those loans and leases, as well as demand for loans and leases and other products and services we offer, is highly dependent upon the business environment in the markets in which we operate and in the United States as a whole. Unlike larger banks that are more geographically diversified, we provide banking and financial services to customers primarily in the Chicago metropolitan area. The economic conditions in this local market may be different from, or worse than, the economic conditions in the United States as a whole. Some elements of the business environment that affect our financial performance include short-term and long-term interest rates, the prevailing yield curve, inflation and price levels, tax policy, monetary policy, unemployment, and the strength of the domestic economy and the local economy in the markets in which we operate. Also, the occurrence of other external events, such as geopolitical events and widespread public health emergencies or pandemics may negatively affect the business environment in our markets. Unfavorable market conditions can result in a deterioration in the credit quality of our borrowers and the demand for our products and services, an increase in the number of loan and lease delinquencies, defaults and charge-offs, additional provisions for credit losses and an overall material adverse effect on the quality of our loan and lease portfolio. Unfavorable or uncertain economic and market conditions can be caused by, among other factors, declines in economic growth, business activity or investor or business confidence; limitations on the availability or increases in the cost of credit and capital; changes in inflation or interest rates; increases in real estate and other state and local taxes; high unemployment; natural disasters; geopolitical issues, conflicts and uncertainty; public health concerns; and other external factors or a combination of these or other factors.
Our business is significantly dependent on the real estate markets in which we operate, as a significant percentage of our loan portfolio is secured by real estate.
Many of the loans in our portfolio are secured by real estate. As of December 31, 2023, our real estate loans held for investment include $525.7 million of construction and development loans, $399.3 million of multifamily loans, $1.0 billion of non-owner occupied CRE loans and $320.2 million of residential mortgage loans, with the majority of these real estate loans concentrated in the Chicago metropolitan area and the State of Illinois. Real property values in our primary market may differ from real property values in other markets where we may do business and may be affected by a variety of factors outside of our control and the control of our borrowers, including national and local economic conditions, generally. The Chicago metropolitan area has experienced volatility in real estate values over the past decade. Declines in real estate values, including prices for homes and commercial properties in the Chicago metropolitan area, could result in a deterioration of the credit quality of our borrowers, an increase in the number of loan delinquencies, defaults and charge-offs, and reduced demand for our products and services, generally. In addition, our appraisal of the property may change significantly in relatively short periods of time and may not accurately describe the fair value of the real property collateral after the loan is made, resulting in loss if we foreclose on the property prior to realizing the full amount of any remaining indebtedness. Our CRE loans may have a greater risk of loss than residential mortgage loans, in part because these loans are generally larger or more complex to underwrite. In particular, real estate construction and acquisition and development loans have certain risks not present in other types of loans, including risks associated with construction cost overruns, project completion risk, general contractor credit risk and risks associated with the ultimate sale or use of the completed construction. In addition, declines in real property values could reduce the value of any collateral we realize following a default on these loans. An increase in the level of non-performing assets increases our risk profile and may affect the capital levels regulators believe are appropriate in light of the ensuing risk profile. In addition, we rely on appraisals and other valuation techniques to establish the value of our other real estate owned ("OREO") and personal property that we acquire through foreclosure proceedings and to determine certain loan impairments. If any of these valuations are inaccurate, our consolidated financial statements may not reflect the correct value of our OREO, and our allowance for credit losses - loans and leases may not reflect accurate loan impairments. This could have a material adverse effect on our business, financial condition or results of operations. Our failure to effectively mitigate these risks could have a material adverse effect on our business, financial condition, or results of operations.
23
Technology Risks
We depend on information technology and telecommunications systems of third parties, and any systems failures, interruptions, or data breaches involving these systems could adversely affect our operations and financial condition.
Our business is highly dependent on the successful and uninterrupted functioning of our information technology and telecommunications systems, third-party servicers, accounting systems, mobile and online banking platforms and financial intermediaries. We outsource to third parties many of our major systems, such as data processing, loan servicing, deposit processing, and internal audit systems. The failure of these systems, or the termination of a third-party software license or service agreement on which any of these systems is based, could interrupt our operations. Because our information technology and telecommunications systems interface with and depend on third-party systems, we could experience service denials if demand for such services exceeds capacity, or such third-party systems fail or experience interruptions. If sustained or repeated, a system failure or service denial could result in a deterioration of our ability to operate effectively or service our customers, resulting in potential noncompliance with applicable laws or regulations, loss of customer business, and/or subject us to additional regulatory scrutiny and possible financial liability, any of which could have a material adverse effect on our financial condition. In addition, failure of third parties to comply with applicable laws and regulations, or fraud or misconduct on the part of employees of any of these third parties, could disrupt our operations or adversely affect our reputation.
It may be difficult for us to replace some of our third-party vendors, particularly vendors providing our core banking, debit card services, and information services, in a timely manner if they are unwilling or unable to provide us with these services in the future for any reason, and even if we are able to replace them, it may be at higher cost or result in the loss of customers. Any such events could have a material adverse effect on our business, financial condition, or results of operations.
The occurrence of fraudulent activity, breaches or failures of our information security controls, or cybersecurity-related incidents could have a material adverse effect on our business, financial condition, or results of operations.
As a financial institution, we are susceptible to fraudulent activity, information security breaches, and cybersecurity-related incidents that may be committed against us, our customers, or third-party service providers that we utilize, which may result in financial losses or increased costs to us or our customers, disclosure or misuse of our information or our customer information, misappropriation of assets, privacy breaches against our customers, litigation, or damage to our reputation. Information security breaches and cybersecurity-related incidents may include fraudulent or unauthorized access to systems used by us or our customers, denial or degradation of service attacks, and malware or other cyberattacks. There continues to be a rise in electronic fraudulent activity, security breaches, and cyberattacks directed at the financial services industry. Consistent with industry trends, we have also experienced an increase in attempted electronic fraudulent activity, security breaches, and cybersecurity-related incidents. Information pertaining to us and our customers is maintained, and transactions are executed, on networks and systems maintained by us and certain third-party partners, such as our online banking or reporting systems. The secure maintenance and transmission of confidential information, as well as execution of transactions over these systems, are essential to protect us and our customers against fraud and security breaches and to maintain our customers’ confidence and privacy. Although we have developed, and continue to invest in, systems and processes that are designed to detect and prevent security breaches and cyberattacks and periodically test our security, our or our third-party partners’ inability to anticipate, or failure to adequately mitigate, breaches of security could result in: losses to us or our customers; our loss of business and/or customers; damage to our reputation; the incurrence of additional expenses; disruption to our business; our inability to grow our online services or other businesses; additional regulatory scrutiny or penalties; or our exposure to civil litigation and possible financial liability-any of which could have a material adverse effect on our business, financial condition, or results of operations.
We continually encounter technological change.
The financial services industry is continually undergoing rapid technological change with frequent introductions of new, technology-driven products and services. Our future success depends, in part, upon our ability to address the needs of our customers by using technology to provide products and services that will satisfy customer demands, as well as to create additional efficiencies in our operations. Many of our competitors have substantially greater resources to invest in technological improvements than we do. We may not be able to effectively implement new, technology-driven products and services, or be successful in marketing these products and services to our customers. In addition, the implementation of technological changes and upgrades to maintain current systems and integrate new ones may also cause service interruptions, transaction processing errors, and system conversion delays, and may cause us to fail to comply with applicable laws. Failure to successfully keep pace with technological change affecting the financial services industry and failure to avoid interruptions, errors, and delays could have a material adverse effect on our business, financial condition, or results of operations.
24
Guaranteed Loans Risks
Small Business Administration lending and other government guaranteed lending is an important part of our business. Our government guaranteed lending programs are dependent upon the U.S. federal government, and we face specific risks associated with originating SBA and other government guaranteed loans.
Our SBA lending program is dependent upon the U.S. federal government. As an approved participant in the SBA Preferred Lender’s Program (an "SBA Preferred Lender"), we enable our customers to obtain SBA loans without being subject to the potentially lengthy SBA approval process necessary for lenders that are not SBA Preferred Lenders. The SBA periodically reviews the lending operations of participating lenders to assess, among other things, whether the lender exhibits prudent risk management. When weaknesses are identified, the SBA may request corrective actions or impose enforcement actions, including revocation of the lender’s SBA Preferred Lender status. If we lose our status as an SBA Preferred Lender, we may lose some or all of our customers to lenders who are SBA Preferred Lenders, and as a result we could experience a material adverse effect to our financial results. Any changes to the SBA program, changes to program-specific rules impacting volume eligibility under the guaranty program, as well as changes to the program amounts authorized by Congress, may also have a material adverse effect on our business. In addition, any default by the U.S. government on its obligations or any prolonged government shutdown could impede our ability to originate SBA loans or other government guaranteed loans or sell such loans in the secondary market, which could materially adversely affect our business, results of operations, and financial condition.
Generally, we sell the guaranteed portion of our SBA 7(a) loans in the secondary market. These sales result in premium income for us at the time of sale and create a stream of future servicing income, as we retain the servicing rights to these loans. For the reasons described above, we may not be able to continue originating these loans or sell them in the secondary market. Furthermore, even if we are able to continue to originate and sell SBA 7(a) loans in the secondary market, we might not continue to realize premiums upon the sale of the guaranteed portion of these loans, or the premiums may decline due to economic and competitive factors. When we originate SBA loans, we incur credit risk on the non-guaranteed portion of the loans, and if a customer defaults on a loan, we share any loss and recovery related to the loan pro-rata with the SBA. If the SBA establishes that a loss on an SBA guaranteed loan is attributable to significant technical deficiencies in the manner in which the loan was originated, funded, or serviced by us, the SBA may seek recovery of the principal loss related to the deficiency from us. Generally, we do not maintain reserves or loss allowances for such potential claims and any such claims could materially adversely affect our business, financial condition, or results of operations.
The laws, regulations and standard operating procedures that are applicable to government guaranteed loan products may change in the future. We cannot predict the effects of these changes on our business and profitability. Because government regulation greatly affects the business and financial results of all commercial banks and bank holding companies and especially our organization, changes in the laws, regulations and procedures applicable to government guaranteed loans could adversely affect our ability to operate profitably.
The recognition of gains on the sale of loans and servicing asset valuations reflect certain assumptions.
We continue to expect that gains on the sale of U.S. government guaranteed loans will continue to comprise a significant component of our revenue. The gain on such sales recognized for year ended December 31, 2023 was $22.8 million. The determination of these gains is based on assumptions regarding the value of unguaranteed loans retained, servicing rights retained and deferred fees and costs, and net premiums paid by purchasers of the guaranteed portions of U.S. government guaranteed loans. The value of retained unguaranteed loans and servicing rights are determined based on market-derived factors such as prepayment rates, current market conditions and recent loan sales. Deferred fees and costs are determined using internal analysis of the cost to originate loans. Significant errors in assumptions used to compute gains on sale of loans or servicing asset valuations could result in material revenue misstatements, which may have a material adverse effect on our business, results of operations and profitability. In addition, while we believe these valuations reflect fair value and such valuations are subject to validation by an independent third-party, if such valuations are not reflective of fair market value, then our business, results of operations and financial condition may be materially and adversely affected.
Legal, Accounting, and Compliance Risks
Our accounting estimates and risk management processes and controls rely on analytical and forecasting techniques and models and assumptions, which may not accurately predict future events.
Our accounting policies and methods are fundamental to the manner in which we record and report our financial condition and results of operations. Our management must exercise judgment in selecting and applying many of these accounting policies and methods so they comply with GAAP and reflect management’s judgment of the most appropriate manner to report our financial condition and results of operations. In some cases, management must select the accounting policy or method to apply from two or more alternatives, any of which may be reasonable under the circumstances, yet which may result in our reporting materially different results than would have been reported under a different alternative.
25
Certain accounting policies and estimates are critical to presenting our financial condition and results of operations. They require management to make difficult, subjective or complex judgments about matters that are uncertain. Materially different amounts could be reported under different conditions or using different assumptions or estimates. These critical accounting policies and estimates include (i) determining the provision and allowance for credit losses, (ii) the valuation of intangible assets such as goodwill, servicing assets, core deposit intangibles, and customer relationship intangible, and (iii) the determination of fair value for financial instruments. Refer to Note 1 of the notes to our audited consolidated financial statements contained in Item 8 of this report for further information. Because of the uncertainty of estimates involved in these matters, we may be required to do one or more of the following: significantly increase the allowance for credit losses - loans and leases or sustain loan and lease losses that are significantly higher than the reserve provided; reduce the carrying value of an asset measured at fair value; or significantly increase our accrued tax liability. Any of these could have a material adverse effect on our business, financial condition or results of operations. See Item 7. "Management’s Discussion and Analysis of Financial Condition and Results of Operations".
Our internal controls, disclosure controls, processes and procedures, and corporate governance policies and procedures are based in part on certain assumptions and can provide only reasonable (not absolute) assurances that the objectives of the system are met. Furthermore, we currently outsource our internal audit function. Any failure or circumvention of our controls, processes and procedures or failure to comply with regulations related to controls, processes and procedures could necessitate changes in those controls, processes and procedures, which may increase our compliance costs, divert management attention from our business or subject us to regulatory actions and increased regulatory scrutiny. Any of these could have a material adverse effect on our business, financial condition, or results of operations.
Our goodwill may become impaired, which may adversely impact our results of operations and financial condition and may limit Byline Bank’s ability to pay dividends to us, thereby causing liquidity issues.
As of December 31, 2023, we had goodwill of $181.7 million, or 18.4% of our total stockholders’ equity. The excess purchase consideration over the fair value of net assets from acquisitions, or goodwill, is evaluated for impairment at least annually and on an interim basis if an event or circumstance indicates that it is more likely than not that an impairment has occurred. In testing for impairment, we conduct a qualitative assessment, and we also estimate the fair value of net assets based on analyses of our market value, discounted cash flows and peer values. Consequently, the determination of the fair value of goodwill is sensitive to market-based economics and other key assumptions. Variability in market conditions or in key assumptions could result in impairment of goodwill, which is recorded as a non-cash adjustment to income. An impairment of goodwill could have a material adverse effect on our business, financial condition and results of operations.
The accounting for loans acquired in connection with our recapitalization and acquisitions is based on numerous subjective determinations that may prove to be inaccurate and have a negative impact on our results of operations.
All loans acquired as part of our recapitalization in 2013 as well as loans acquired in connection with our subsequent acquisitions were recorded at their estimated fair value on their acquisition date without a carryover of the related allowance for credit losses. The determination of estimated fair value of purchased credit deteriorated and acquired non-credit-deteriorated loans requires management to make subjective determinations regarding discount rate, estimates of losses on defaults, market conditions and other factors that are highly subjective in nature. A risk exists that our estimate of the fair value of purchased credit deteriorated and acquired non-credit-deteriorated loans will prove to be inaccurate and that we ultimately will not recover the amount at which we recorded such loans on our balance sheet, which would require us to recognize losses.
Loans acquired that have experienced more than insignificant credit deterioration since origination are accounted for under Accounting Standards Codification ("ASC") Topic 326, Financial Instruments – Credit Losses. These purchased credit deteriorated ("PCD") loans have experienced more than insignificant credit deterioration since origination, like non-credit-deteriorated loans acquired, and have been recorded at the amount paid. An allowance for credit losses is determined using the same methodology as other loans held for investment. The initial allowance for credit losses - loans and leases, determined on a collective basis, is allocated to individual loans. The sum of the loan’s purchase price and allowance for credit losses becomes its initial amortized cost basis. The difference between the initial amortized cost basis and the par value of the loan is a noncredit discount or premium, which is amortized into interest income over the life of the loan. Subsequent changes to the allowance for credit losses are recorded through credit loss expense.
Acquired non‑credit-deteriorated loans and leases are accounted for under ASC Subtopic 310‑20, Receivables Nonrefundable Fees and Other Costs ("ASC 310‑20"). The difference between the fair value and unpaid principal balance of the loan at the acquisition date is amortized or accreted to interest income over the life of the loan. While credit discounts are included in the determination of the fair value from non-credit-deteriorated loans, since these discounts are expected to be accreted over the life of the loans, they cannot be used to offset the allowance for credit losses that must be recorded at the acquisition date. As a result, an allowance for credit losses is determined at the acquisition date using the same methodology as other loans held for investment and is recognized as a provision for credit losses in the consolidated statements of operations. Any subsequent deterioration (improvement) in credit quality is recognized by recording a provision (recapture) for credit losses.
26
Our ability to recognize the benefits of deferred tax assets is dependent on future cash flows and taxable income.
We recognize the expected future tax benefit from deferred tax assets when it is more likely than not that the tax benefit will be realized. Otherwise, a valuation allowance is applied against deferred tax assets, reducing the value of such assets. Assessing the recoverability of deferred tax assets requires management to make significant estimates related to expectations of future taxable income from all sources, including reversal of taxable temporary differences, forecasted operating earnings and available tax planning strategies. Estimates of future taxable income are based on forecasted income from operations and the application of existing tax laws in each jurisdiction. Our acquisitions and risk profile are key components used in the determination of our ability to realize the expected future benefit of our deferred tax assets. To the extent that future taxable income differs significantly from estimates as a result of the interest rate environment and loan and lease growth capabilities or other factors, our ability to realize the net deferred tax assets could be affected.
Certain activities are restricted due to commitments entered into with the FRB by us and our foreign national stockholders.
We have certain stockholders who invested in our recapitalization who are foreign nationals, and we and these foreign national stockholders have entered into commitments with the FRB that restrict some of our activities. In particular, without approval of the FRB, we are restricted from engaging in certain transactions with these foreign national stockholders, their immediate families, and any company controlled by such foreign national stockholders or by their immediate families. If we were to fail to comply with any of these restrictions, we could be subject to enforcement and other legal actions by the FRB, including civil and criminal penalties, which could have a material adverse effect on our business, financial condition and results of operations.
Monetary policies and regulations of the FRB could adversely affect our business, financial condition, and results of operations.
In addition to being affected by general economic conditions, our earnings and growth are affected by the policies of the FRB. An important function of the FRB is to regulate the money supply and credit conditions. Among the instruments used by the FRB to implement these objectives are open market purchases and sales of U.S. government securities, adjustments of the discount rate, and changes in banks’ reserve requirements against bank deposits. These instruments are used in varying combinations to influence overall economic growth and the distribution of credit, bank loans, investments, and deposits. Their use also affects interest rates charged on loans or paid on deposits.
The monetary policies and regulations of the FRB have had a significant effect on the operating results of commercial banks in the past and are expected to continue to do so in the future. The effects of such policies upon our business, financial condition, and results of operations cannot be predicted.
We are subject to numerous laws designed to protect consumers, including the Community Reinvestment Act and fair lending laws, and failure to comply with these laws could lead to a wide variety of sanctions.
The CRA requires our bank, consistent with safe and sound operations, to ascertain and meet the credit needs of its entire community, including low and moderate income areas. Our bank’s failure to comply with the CRA could, among other things, result in the denial or delay of certain corporate applications filed by us or our bank, including applications for branch openings or relocations and applications to acquire, merge or consolidate with another banking institution or holding company. In addition, the ECOA, the Fair Housing Act, and other fair lending laws and regulations prohibit discriminatory lending practices by financial institutions. A challenge to an institution’s compliance with fair lending laws and regulations could result in a wide variety of sanctions, including damages and civil money penalties, injunctive relief, restrictions on mergers and acquisitions activity, restrictions on expansion, and restrictions on entering new business lines. Private parties may also challenge an institution’s performance under fair lending laws in private class action litigation. Such actions could have a material adverse effect on our business, financial condition, results of operations, and growth prospects.
Litigation and regulatory actions, including possible enforcement actions, could subject us to significant fines, penalties, judgments, or other requirements resulting in increased expenses or restrictions on our business activities.
Our business is subject to increased litigation and regulatory risks as a result of a number of factors, including the highly regulated nature of the financial services industry and the focus of state and federal prosecutors on banks and the financial services industry generally. In the normal course of business, we have in the past and may in the future be named as a defendant in various legal actions, including arbitrations, class actions, and other litigation, arising in connection with our current and/or prior business activities. Legal actions could include claims for substantial compensatory or punitive damages or claims for indeterminate amounts of damages, resulting in increased expenses, diminished income, damage to our reputation, and divert management attention from the operation of our business. In addition, while the arbitration provisions in certain of our customer agreements historically have limited our exposure to consumer class action litigation, there can be no assurance that we will be successful in enforcing our arbitration clause in the future. Further, we have in the past and may in the future be subject to consent orders with our regulators.
27
We may also, from time to time, be the subject of subpoenas, requests for information, reviews, investigations and proceedings (both formal and informal) by governmental agencies regarding our current and/or prior business activities. Further, any settlement, consent order or adverse judgment in connection with any formal or informal proceeding or investigation by government agencies may result in litigation, investigations or proceedings as other litigants and government agencies begin independent reviews of the same activities. As a result, the outcome of legal and regulatory actions could be material to our business, results of operations, financial condition and cash flows.
Non-compliance with the USA PATRIOT Act, the Bank Secrecy Act or other laws and regulations could result in fines or sanctions against us.
The USA PATRIOT Act of 2001 and the Bank Secrecy Act require financial institutions to design and implement programs to prevent financial institutions from being used for money laundering and terrorist activities. If such activities are detected, financial institutions are obligated to file suspicious activity reports with the Financial Crimes Enforcement Network of the U.S. Department of the Treasury. These rules require financial institutions to establish procedures for identifying and verifying the identity of customers seeking to open new financial accounts. Federal and state bank regulators also have focused on compliance with Bank Secrecy Act and anti-money laundering regulations. Failure to comply with these regulations could result in fines or sanctions, including restrictions on conducting acquisitions or establishing new branches. While we have developed policies and procedures designed to assist in compliance with these laws and regulations, these policies and procedures may not be effective in preventing violations of these laws and regulations. Failure to maintain and implement adequate programs to combat money laundering and terrorist financing could also have serious reputational consequences for us, which could have a material adverse effect on our business, financial condition or results of operations.
Regulations relating to privacy, information security, and data protection could increase our costs, affect or limit how we collect and use personal information, and adversely affect our business opportunities.
We are subject to various privacy, information security, and data protection laws, including requirements concerning security breach notification, and we could be negatively affected by these laws. For example, our business is subject to the Gramm-Leach-Bliley Act which, among other things: (i) imposes certain limitations on our ability to share nonpublic personal information about our customers with nonaffiliated third parties; (ii) requires that we provide certain disclosures to customers about our information collection, sharing and security practices, and (iii) requires that we develop, implement and maintain a written comprehensive information security program. Various state and federal banking regulators and states have also enacted data security breach notification requirements with varying levels of individual, consumer, regulatory or law enforcement notification in certain circumstances in the event of a security breach. Moreover, legislators and regulators in the United States are increasingly adopting or revising privacy, information security and data protection laws that potentially could have a significant impact on our privacy, data protection and information security-related practices, our collection, use, sharing, retention and safeguarding of consumer or employee information, and some of our current or planned business activities. This could also increase our costs of compliance and business operations and could reduce income from certain business initiatives.
Compliance with current or future privacy, data protection, and information security laws to which we are subject could result in higher compliance and technology costs and could restrict our ability to provide certain products and services, which could have a material adverse effect on our business, financial condition or results of operations. Our failure to comply with privacy, data protection and information security laws could result in potentially significant regulatory or governmental investigations or actions, litigation, fines, sanctions and damage to our reputation, which could have a material adverse effect on our business, financial condition, or results of operations.
Risks Related to Acquisition Activity
We may be adversely affected by risks associated with completed and potential acquisitions, including execution risks, failure to realize anticipated transaction benefits, and failure to overcome integration risks, which could adversely affect our growth and profitability.
We have continued to grow our business both organically and through the acquisition of smaller banks that management believes strategically fit within our franchise and that we believe support our businesses and make financial and strategic sense. In the event that we continue to pursue further acquisitions, we may have difficulty executing on and may not realize the anticipated benefits of any transaction we complete. Any of the foregoing matters could materially and adversely affect us.
Generally, any acquisition of target financial institutions, branches, or other banking assets by us will require approval by, and cooperation from, a number of governmental regulatory agencies, possibly including the FRB and the FDIC as well as the IDFPR. Such regulators could deny our application, which would restrict our growth, or the regulatory approvals may not be granted on terms that are acceptable to us.
As to any acquisition that we complete, we may fail to realize some or all of the anticipated transaction benefits if the integration process takes longer or is more costly than expected or otherwise fails to meet our expectations. Depending on the condition of any
28
institution or assets or liabilities that we may acquire, that acquisition may, at least in the near term, adversely affect our capital and earnings and, if not successfully integrated with our organization, may continue to have such effects over a longer period. Also, acquisitions may involve the payment of a premium over book and market values and, therefore, some dilution of our tangible book value and net income per common share may occur in connection with any future transaction. Our inability to overcome these risks could have a material adverse effect on our profitability, return on equity, return on assets, and our ability to implement our business strategy and enhance stockholder value, which, in turn, could have a material adverse effect on our business, financial condition, and results of operations.
General Risk Factors
Loss of deposits could increase our funding costs and negatively affect our liquidity.
We rely on customer deposits to meet a considerable portion of our funding needs, and we continue to seek customer deposits to maintain this funding base. We accept deposits directly from consumer and commercial customers and, as of December 31, 2023, we had $7.2 billion in deposits. These deposits are subject to potential fluctuations in availability or the price we must pay (in the form of interest) to obtain them due to certain factors outside our control, such as increasing competitive pressures from other financial services firms for deposits and changes in interest rates and returns on other investment classes, which could result in significant outflows of deposits within short periods of time or significant changes in pricing necessary to maintain current deposits or attract additional deposits. The loss of customer deposits for any reason could increase our funding costs, and negatively affect our liquidity.
We operate in a highly competitive and changing industry and market area and compete with both banks and non-banks.
We operate in the highly competitive financial services industry and face significant competition for customers from financial institutions located both within and beyond our principal markets. We compete with national commercial banks, regional banks, private banks, savings banks, credit unions, non-bank financial services companies, FinTech companies and other financial institutions operating within or near the areas we serve, many of whom are much larger and have significantly greater resources than us and that target the same customers we do in the Chicago metropolitan area. In order to compete, we may have to pay higher interest rates to attract deposits, accept lower yields to attract loans and pay higher wages for new employees, resulting in lower net interest margins and reduced profitability. As customer preferences and expectations continue to evolve, technology has lowered barriers to entry and made it possible for banks to expand their geographic reach by providing digital banking services and for non-banks to offer products and services traditionally provided by banks. The banking industry is experiencing rapid changes in technology, and, as a result, our future success will depend in part on our ability to address our customers’ needs by using technology. Many of our non-bank competitors are not subject to the same extensive regulations that govern our activities and, as a result, may have greater flexibility in competing for business. We also face increased competition in our U.S. government guaranteed lending business, which can adversely affect our volume and the premium, if any, recognized on sales of the guaranteed portions of such U.S. government guaranteed loans. Our inability to compete successfully in the markets in which we operate could have a material adverse effect on our business, financial condition, or results of operations.
Our principal stockholder, MBG Investors I, L.P. has significant influence over us, and its interests could conflict with those of our other stockholders.
Currently, our principal stockholder, MBG Investors I, L.P., owns approximately 27.0% of the outstanding shares of our common stock and its general partner is one of our directors. As a result, MBG Investors I, L.P. is able to influence matters requiring approval by our stockholders, including the election of directors and the approval of mergers or other extraordinary transactions. MBG Investors I, L.P. may also have interests that differ from yours and may vote in a way with which you disagree, and which may be adverse to your interests. The concentration of ownership may also have the effect of delaying, preventing, or deterring a change of control of the Company, could deprive our stockholders of an opportunity to receive a premium for their common stock as part of a private sale of their shares of the Company, subject us to the influence of a presently unknown third-party and might ultimately affect the market price of our common stock.
Future sales of our common stock in the public market, including by our pre-IPO stockholders, could lower our stock price.
The market price of our common stock could decline as a result of sales of a large number of shares of our common stock or from the perception that such sales could occur. These sales, or the possibility that these sales may occur, also may make it more difficult for us to raise additional capital by selling equity securities in the future, at a time and price that we deem appropriate.
Certain of our pre-IPO stockholders, including affiliates such as MBG Investors, I, L.P., hold restricted shares that could be sold in accordance with the volume, manner of sale, and other limitations under Rule 144 or through registration under the Securities Act. We cannot predict the size of future issuances or sales of our common stock by our pre-IPO stockholders or the effect, if any, that future issuances or sales of shares of our common stock may have on the market price of our common stock. Sales or distributions of substantial amounts of our common stock (including shares issued in connection with an acquisition), or the perception that such sales could occur, may cause the market price of our common stock to decline.
29
Item 1B. Unresolved Staff Comments.
None
Item 1C. Cybersecurity.
In the ordinary course of business, we rely on electronic communications and information systems to conduct our operations and to store sensitive data.
Managing Material Risks and Integrated Overall Risk Management
We have developed an Information Security Program (the “Program”) as part of our overall risk assessment and Enterprise Risk Management ("ERM") to address material risks from potential cybersecurity threats, as well as to facilitate the governance and oversight of cybersecurity risks. The Program, which is administered by our Chief Risk Officer, includes policies and procedures that identify how security measures and controls are developed, implemented, maintained and assessed.
Governance
As part of our ERM, our Board of Directors reviews and approves the Program on an annual basis. The Board oversees efforts to develop, implement, and maintain an effective Information Security Program, including reviewing management’s reporting on Program effectiveness. In addition to a Privacy and Security Governance Committee, we also have Governance, Risk, Information Technology and Compliance functions that monitor and address enterprise risks, including cybersecurity risks.
A risk assessment, based on a method and guidance from a recognized national standards organization, is conducted at least annually. The risk assessment, along with risk-based analysis and judgment, are used to select security controls to address and to seek to mitigate risks. Factors considered during this process include, but are not limited to, the likelihood and severity of the risk, the impact on the Company and others, such as our customers, if a risk materializes, the feasibility and cost of controls, and the impact of controls on our operations.
Engaging Third Parties on Risk Management
Specific controls that address cybersecurity risks include endpoint threat detection and response, identity and access management, logging and monitoring involving the use of security information and event management, multi-factor authentication, conditional access, firewalls and intrusion detection and prevention, and vulnerability and patch management. We engage third-party security firms in different capacities to provide or operate some of these controls, such as vulnerability assessments, penetration testing and other procedures to identify potential weaknesses in our systems and processes. In addition, as a financial institution, we conduct appropriate due diligence and monitoring procedures to address potential cybersecurity threats related to the use of third-party technology and outsourced services, including pre-acquisition due diligence, imposition of contractual obligations, and performance monitoring.
Oversight of Third-party Risk
We have processes in place to oversee and manage risks associated with third-party service providers, including risks related to data breaches or other security incidents. This includes conducting security due diligence reviews of critical third-party providers, subjecting third parties to periodic risk assessments and requiring third parties to sign standard contractual provisions before receiving sensitive information from the Company.
Risk from Cybersecurity Treats
We recognize that individual employees are frequent targets of threat actors. We regularly train employees on the importance of protecting our information, and communicate with our customers and employees on the importance to protect information and enhancing cybersecurity through security campaigns, newsletters, posters and ad-hoc communications. If specific threats are identified, management may communicate those threats directly to employees for heightened awareness. Our cybersecurity program requires employees to review and acknowledge information security and privacy policies annually, complete multiple cybersecurity training courses throughout the year, and participate in mock phishing campaigns regularly.
We also have a written Incident Response Plan and conduct tabletop exercises to enhance incident response preparedness. Business Continuity and Disaster Recovery plans are used to prepare for the potential for a disruption in technology we rely on. Employees undergo security awareness training when hired and annually.
While to-date we have not experienced a significant cybersecurity incident, significant data loss or any material financial losses related to cybersecurity attacks on our systems and those of our customers and third-party service providers are under constant threat, and it is possible that we could experience an incident in the future that could have a material adverse effect on our business strategy, results of operations and financial condition. See also Item 1A, Risk Factors – Technology Risks.
As a financial institution (or third parties it relies on) we may not be able to fully, continuously, and effectively, implement security controls as intended. As described above, we utilize a risk-based approach and judgment to determine the security controls to implement and it is possible we may not implement appropriate controls if we do not recognize or underestimate a particular risk. In
30
addition, security controls, no matter how well designed or implemented, may only mitigate, and not fully eliminate risks. And events, when detected by security tools or third parties, may not always be immediately understood or acted upon.
Item 2. Properties.
Our corporate headquarters is located at 180 North LaSalle Street, Suite 300, Chicago, IL 60601. In addition to our corporate headquarters, we operate 47 branch offices located in the Chicago metropolitan area and one branch office in Wauwatosa, Wisconsin. We lease 17 of our branch offices and our headquarters and own the remainder of our branch offices. We are continually evaluating opportunities to improve our existing branches and branch network, and we have in the recent past closed and may in the future choose to close branches in certain circumstances in order to improve our efficiency or for other business reasons.
Item 3. Legal Proceedings.
We operate in a highly regulated environment. From time to time, we are a party to various litigation matters incidental to the conduct of our business. We are not presently a party to any legal proceedings the resolution of which we believe would have a material adverse effect on our business, financial condition, liquidity, results of operation, cash flows or capital levels.
Item 4. Mine Safety Disclosures.
Not applicable.
31
PART II
Item 5. Market for Registrant’s Common Equity, Related Stockholder Matters and Issuer Purchases of Equity Securities.
Our common stock is listed on the NYSE under the symbol "BY". There were approximately 1,132 holders of record of our common stock as of March 1, 2024.
The timing and amount of cash dividends paid on our common stock depends on our earnings, financial condition, capital requirements and other relevant factors. The primary sources for payment of dividends to our stockholders are dividends paid to the Company by Byline Bank and cash on hand. We are subject to state law limitations on the payment of dividends. Delaware law generally limits dividends if: (a) the corporation does not have a surplus; or (b) the corporation does not have net profits for the fiscal year in which the dividend is declared and/or the preceding fiscal year. We have an internal policy that prohibits the Board of Byline Bank from declaring and paying dividends that would cause the minimum capital amounts required for Byline Bank to be considered less than "well capitalized" for regulatory purposes. See Item 1. "Business – Supervision and Regulations – Dividends" above and Note 20 of notes to consolidated financial statements contained in Item 8 of this report.
We paid a cash dividend of $0.09 per share for each quarter of 2022 and 2023.
Issuer Purchases of Equity Securities.
On December 12, 2022, we announced that our Board of Directors approved a new stock repurchase program authorizing the purchase of up to an aggregate of 1,250,000 shares of our outstanding common stock. The program was in effect from January 1, 2023 until December 31, 2023.
We did not purchase any shares of our common stock under the stock repurchase program during 2023.
On December 6, 2023, we announced that our Board of Directors approved a new stock repurchase program authorizing the purchase of up to an aggregate of 1,250,000 shares of our outstanding common stock. The program will be in effect from January 1, 2024 until December 31, 2024, unless terminated earlier. The shares may, at the discretion of management, be repurchased from time to time in open market purchases as market conditions warrant or in privately negotiated transactions. We are not obligated to purchase any shares under the program, and the program may be discontinued at any time. The actual timing, number and share price of shares purchased under the repurchase program will be determined by us at our discretion and will depend on a number of factors, including the market price of our stock, general market and economic conditions and applicable legal requirements. The shares authorized to be repurchased represent approximately 2.9% of the Company’s outstanding common stock at December 31, 2023.
The table below includes information regarding purchases of our common stock during the quarter ended December 31, 2023. We did not purchase any shares of our common stock during the fourth quarter of 2023 under our stock repurchase program.
Issuer Purchases of Equity Securities |
|
|||||||||||||||
|
|
|
|
|
|
|
|
|
|
|
Maximum Number of |
|
||||
|
|
Total |
|
|
Average |
|
|
Total Number of Shares |
|
|
Shares that |
|
||||
|
|
Number of |
|
|
Price |
|
|
Purchased as Part of a |
|
|
May Yet Be |
|
||||
|
|
Shares |
|
|
Paid per |
|
|
Publicly Announced |
|
|
Purchased Under the |
|
||||
|
|
Purchased(1) |
|
|
Share |
|
|
Plan or Program |
|
|
Plan or Program |
|
||||
October 1 - October 31, 2023 |
|
|
3,206 |
|
|
$ |
19.62 |
|
|
|
— |
|
|
|
1,250,000 |
|
November 1 - November 30, 2023 |
|
|
— |
|
|
|
— |
|
|
|
— |
|
|
|
1,250,000 |
|
December 1 - December 31, 2023 |
|
|
15,228 |
|
|
|
23.56 |
|
|
|
— |
|
|
|
1,250,000 |
|
Total |
|
|
18,434 |
|
|
$ |
22.88 |
|
|
|
— |
|
|
|
|
|
(1) These shares were acquired pursuant to our 2017 Omnibus Incentive Compensation Plan. Under the terms of this plan, we can accept previously owned shares of common stock to be surrendered to satisfy the exercise price of stock options, the settlement of restricted stock awards and tax withholding obligations upon vesting and/or exercise.
Recent Sales of Unregistered Securities; Use of Proceeds From Registered Securities.
None.
32
Stock Performance Graph.
The following graph compares the cumulative total stockholder return on our common stock from December 31, 2018 through December 31, 2023, with the cumulative total return of: (1) the Russell 2000 (U.S. Stock) Index, (2) a peer group of the S&P U.S. SmallCap Banks Index and, (3) the KBW NASDAQ Regional Bank Index ("KRX"). Included in the KRX index are U.S. regional banks that we believe are similar to the Company. We believe the KRX index provides a meaningful comparison to our cumulative total return. Total return assumes the reinvestment of all dividends.
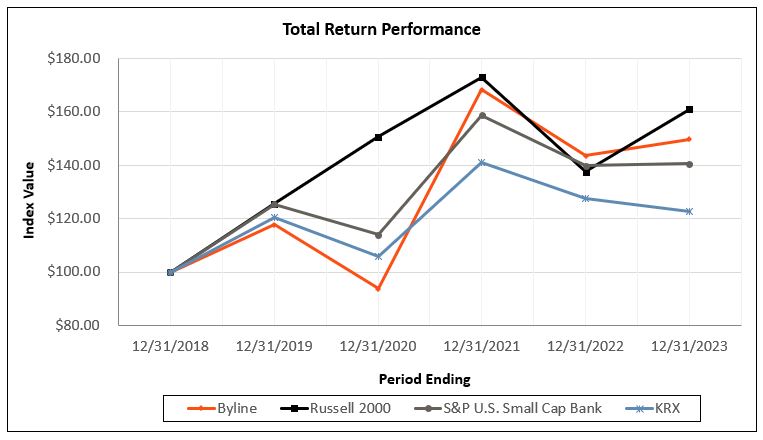
* The information assumes that $100 was invested at the closing price on December 31, 2018 in our stock and each index, and that all dividends are reinvested.
|
|
|
|
|
|
|
|
|
|
|
|
|
|
|
|
|
|
|
||||||
Index |
|
12/31/2018 |
|
|
12/31/2019 |
|
|
12/31/2020 |
|
|
12/31/2021 |
|
|
12/31/2022 |
|
|
12/31/2023 |
|
||||||
Byline Bancorp, Inc. |
|
$ |
100.00 |
|
|
$ |
117.65 |
|
|
$ |
93.85 |
|
|
$ |
168.27 |
|
|
$ |
143.47 |
|
|
$ |
149.67 |
|
Russel 2000 |
|
|
100.00 |
|
|
|
125.52 |
|
|
|
150.58 |
|
|
|
172.90 |
|
|
|
137.56 |
|
|
|
160.85 |
|
S&P U.S. Small Cap Bank |
|
|
100.00 |
|
|
|
125.46 |
|
|
|
113.94 |
|
|
|
158.62 |
|
|
|
139.85 |
|
|
|
140.55 |
|
KRX |
|
|
100.00 |
|
|
|
120.38 |
|
|
|
105.82 |
|
|
|
140.94 |
|
|
|
127.62 |
|
|
|
122.51 |
|
Item 6. [Reserved]
33
Item 7. Management’s Discussion and Analysis of Financial Condition and Results of Operations.
The following is a discussion and analysis of our financial condition and results of operations and should be read in conjunction with our financial statements and notes thereto included in Item 8 of this report. In addition to historical information, this discussion contains forward‑looking statements that involve risks, uncertainties and assumptions that could cause actual results to differ materially from management’s expectations. Factors that could cause such differences are discussed in the sections entitled "Special Note Regarding Forward‑Looking Statements" and "Risk Factors". Byline assumes no obligation to update any of these forward‑looking statements.
Management’s discussion focuses on 2023 results compared to 2022. For a discussion of 2022 results compared to 2021, refer to Part I, Item 7 of our 2022 Annual Report filed on Form 10-K, which was filed with the SEC on March 6, 2023.
Executive Summary
Our results of operations depend substantially on net interest income, which is the difference between interest income on interest-earning assets, consisting primarily of interest income on loans and lease receivables, including accretion income on loans, investment securities and other short-term investments, and interest expense on interest-bearing liabilities, consisting primarily of deposits and borrowings. Our results of operations are also dependent upon our generation of non-interest income, consisting primarily of income from fees and service charges on deposits, loan servicing revenue, wealth management and trust income, ATM and interchange fees, and net gains on sales of investment securities and loans. Other factors contributing to our results of operations include our provisions for credit losses, provision for income taxes, and non-interest expenses, such as salaries and employee benefits, occupancy and equipment expenses and other miscellaneous operating costs.
We reported consolidated net income of $107.9 million for the year ended December 31, 2023, compared to net income of $88.0 million for the year ended December 31, 2022, an increase of $19.9 million. The increase in net income was attributable to a $65.3 million increase in net interest income, offset by a $25.5 million increase in non-interest expense, an $11.1 million increase in provision for income taxes, and a $7.8 million increase in provision for credit losses. The increase in net interest income was primarily a result of higher interest income and fees on loans and leases due to growth including acquired loans, and higher yields, partially offset by an increase in deposit interest expense due to higher rates paid and growth. The increase in non-interest expense was driven mainly by expenses related to the Inland acquisition. The increase in provision for credit losses was mainly driven by an increase in non-performing loans and acquired non-credit-deteriorated loans. The increase in provision for income taxes was mostly driven by an increase in net income before provision for income taxes during the period.
Dividends declared and paid on preferred shares were $196,000 for the year ended December 31, 2022. There was no preferred stock issued or outstanding during 2023. Dividends declared on common shares were $14.6 million $13.5 million for the years ended December 31, 2023 and 2022, respectively. Dividends paid on common shares were $14.6 million and $13.4 million for the years ended December 31, 2023 and 2022, respectively. For the years ended December 31, 2023 and 2022, net income available to common stockholders was $107.9 million, or $2.69 per basic and $2.67 per diluted common share, and $87.8 million, or $2.37 per basic and $2.34 per diluted common share, respectively. Our results of operations for the years ended December 31, 2023 and 2022, produced an annual return on average assets of 1.34% and 1.25% and a return on average stockholders’ equity of 12.50% and 11.33%, respectively.
Since our recapitalization in June 2013, our branch network has been reduced from 88 to 48, including 23 branches added through acquisition. During 2023 we added 10 branches within our network as a result of our acquisition of Inland.
Critical accounting policies and estimates
Our accounting and reporting policies conform to GAAP and to general practices within the banking industry. To prepare financial statements and interim financial statements in conformity with GAAP, management makes estimates, assumptions and judgments based on available information. These estimates, assumptions and judgments affect the amounts reported in the financial statements and accompanying notes; and are based on information available as of the date of the financial statements. As this information changes, actual results could differ from the estimates, assumptions and judgments reflected in the financial statements. In particular, management has identified several accounting policies that, due to the estimates, assumptions and judgments inherent in those policies, are critical in understanding our financial statements.
These critical accounting policies and estimates include (i) determination of the allowance for credit losses, (ii) the valuation of intangible assets such as goodwill, and assessment of impairment, (iii) fair value estimates, and (iv) the determination and assessment of impairment for other intangible assets.
The following is a discussion of the critical accounting policies and significant estimates that require us to make complex and subjective judgments. Additional information about these policies can be found in Note 1 of our audited consolidated financial statements contained in Item 8 of this report.
Allowance for credit losses
The allowance for credit losses ("ACL") represents management’s estimate of current expected credit losses over the life of a financial asset carried at amortized cost at an appropriate level based upon management’s evaluation of the adequacy of collectively and individually evaluated loss reserves.
34
The ACL is maintained at a level that management believes is appropriate to provide for current expected credit losses as of the dates of the Consolidated Statements of Financial Condition, and we have established methodologies for the determination of its adequacy. The methodologies are set forth in a formal policy and take into consideration relevant available information, from internal and external sources, relating to past events, current conditions, and reasonable and supportable forecasts. We increase our ACL by recording provisions for current expected credit losses against our income and decrease by charge‑offs, net of recoveries.
The evaluation is inherently subjective, as it requires estimates that are susceptible to significant revision as more information becomes available. While management uses available information to recognize losses on loans and leases, changes in economic or other conditions may necessitate revision of the estimate in future periods.
For each portfolio, management estimates expected credit losses over the life of each loan and lease utilizing lifetime or cumulative loss rate methodology. The lifetime loss rates are estimated by analyzing a combination of internal and external data related to historical performance of each loan and lease pool over a complete economic cycle. Loss rates are based on historical averages for each loan and lease pool, adjusted to reflect the impact of a forward-looking forecast of certain macroeconomic variables, primarily unemployment rates, which management considers to be both reasonable and supportable. Various economic scenarios are considered and weighted to arrive at the forecast that most reflects management’s expectation of future conditions. After a one-year forecast period, a one-year reversion period adjusts loss experience to the historical average on a straight-line basis.
Management also considers qualitative risk factor adjustments that are intended to capture internal and external trends not reflected in historical loss history. Each risk factor is assigned an allowance level based on management’s judgment as to the expected impact of each risk factor on each loan and lease portfolio and is monitored quarterly. All loans and leases of $500,000 or greater with an internal risk rating of substandard or below, or on nonaccrual status are individually evaluated for impairment on a quarterly basis.
The Company also maintains an allowance for credit losses on off-balance sheet credit exposures for unfunded loan commitments. The estimate includes consideration of the likelihood that funding will occur and an estimate of expected credit losses on commitments expected to be funded over its estimated life based on management’s consideration of past events, current conditions, and reasonable and supportable economic forecasts. Management tracks the level and trends in unused commitments and takes into consideration the same factors as those considered for purposes of the allowance for credit losses on outstanding loans.
Results for the years ended December 31, 2023 and 2022 are presented under CECL methodology while December 31, 2021 amounts are reported using prior accounting guidance. Additional information about these policies can be found in Note 1 of our audited consolidated financial statements contained in Part II, Item 8 of this report.
Goodwill
For acquisitions, we are required to record the assets acquired, including identified intangible assets such as goodwill, and the liabilities assumed at their fair value. These determinations often involve estimates based on third party valuations, such as appraisals or other valuations based on discounted cash flow analyses or other valuation techniques that may consider estimates such as attrition, growth rates, or other relevant assumptions. Goodwill is not amortized but is evaluated for impairment on an annual basis or more frequently should events warrant. We have selected November 30 as the date to perform the annual goodwill impairment test.
Impairment testing is performed using either a qualitative or quantitative approach at the reporting unit level. Our goodwill is allocated to Byline Bank, which is our only applicable reporting unit for the purposes of testing goodwill for impairment. We first apply a qualitative approach in which we consider if any recent events or circumstances indicate it is more likely than not that the fair value of the reporting unit is less than its carrying amount. These events and circumstances include our performance, the condition of the related industry in which Byline Bank operates and general economic environment. If we determine it is more likely than not that impairment exists, we will consider the quantitative approach. Using a quantitative approach, we compare the reporting unit’s fair value to its carrying value. If the carrying value of the reporting unit is determined to be higher than its fair value, we would measure and recognize an impairment loss. An impairment loss would not exceed the total amount of goodwill allocated to the reporting unit.
Other intangible assets
Other intangible assets primarily consist of core deposit intangible assets and customer relationship intangible. In valuing intangible assets, we consider variables such as servicing costs, attrition rates and market discount rates. Intangible assets are reviewed annually, or more frequently when events or changes in circumstances occur that indicate that their carrying values may not be recoverable. If the recoverable amount of the intangible asset is determined to be less than its carrying value, we would then measure the amount of impairment based on an estimate of the fair value at that time. We also evaluate whether the events or circumstances have occurred that warrant a revision to the remaining useful lives of intangible assets. In cases where a revision is deemed appropriate, the remaining carrying amounts of the intangible assets are amortized over the revised remaining useful life. Core deposit intangibles are currently amortized over an approximate ten-year period and customer intangibles are amortized over a twelve-year period.
35
Fair value of financial instruments
A portion of the Company’s assets and liabilities are carried at fair value on the Consolidated Statements of Financial Condition, with changes in fair value recorded either through earnings or other comprehensive income in accordance with applicable accounting principles. These include the Company’s available-for-sale debt securities, equity securities, derivatives, and servicing assets.
ASC Topic 820, Fair Value Measurement defines fair value as the price that would be received to sell a financial asset or paid to transfer a financial liability in an orderly transaction between market participants at the measurement date.
The degree of management judgment involved in determining the fair value of assets and liabilities is dependent upon the availability of quoted market prices or observable market parameters. Assets acquired, liabilities assumed, and consideration exchanged are recorded at their respective acquisition date fair values. For financial instruments that trade actively and have quoted market prices or observable market parameters, there is minimal subjectivity involved in measuring fair value. When observable market prices and parameters are not available, management judgment and the use of models are necessary to estimate fair value. Significant assumptions used in models, which include assumptions for interest rates, discount rates, prepayments, and credit losses, are independently verified against observable market data when possible. When changes in market conditions reduce the availability of quoted prices or observable data, the estimate of fair value becomes more subjective and requires a higher degree of management judgment.
Refer to Note 17 of the notes to our audited consolidated financial statements contained in Item 8 of this report for a complete discussion of our use of fair value and the related measurement practices.
Selected Financial Data.
The following table summarizes certain selected historical consolidated financial data of Byline as of or for the fiscal years ended December 31, 2023, 2022, and 2021, and is derived from our audited financial statements. You should read this information in conjunction with our consolidated financial statements and related notes included in Item 8 of this report. Management uses the non-GAAP financial measures set forth herein in its analysis of our performance and believes that these non-GAAP financial measures provide useful information to management and investors; however, you should not view these disclosures as a substitute for results determined in accordance with GAAP financial measures.
36
|
|
As of or for the years ended December 31, |
|
|||||||||
(Dollars in thousands except share and per share data) |
|
2023 |
|
|
2022 |
|
|
2021 |
|
|||
Income Statement Data |
|
|
|
|
|
|
|
|
|
|||
Net interest income |
|
$ |
330,621 |
|
|
$ |
265,330 |
|
|
$ |
236,387 |
|
Provision for credit losses |
|
|
31,653 |
|
|
|
23,879 |
|
|
|
973 |
|
Non-interest income |
|
|
56,315 |
|
|
|
57,314 |
|
|
|
74,253 |
|
Non-interest expense |
|
|
209,603 |
|
|
|
184,082 |
|
|
|
185,455 |
|
Income before income taxes |
|
|
145,680 |
|
|
|
114,683 |
|
|
|
124,212 |
|
Provision for income taxes |
|
|
37,802 |
|
|
|
26,729 |
|
|
|
31,427 |
|
Net income |
|
|
107,878 |
|
|
|
87,954 |
|
|
|
92,785 |
|
Dividends on preferred shares |
|
|
— |
|
|
|
196 |
|
|
|
783 |
|
Income available to common stockholders |
|
$ |
107,878 |
|
|
$ |
87,758 |
|
|
$ |
92,002 |
|
Earnings per Common Share |
|
|
|
|
|
|
|
|
|
|||
Basic earnings per common share |
|
$ |
2.69 |
|
|
$ |
2.37 |
|
|
$ |
2.45 |
|
Diluted earnings per common share |
|
$ |
2.67 |
|
|
$ |
2.34 |
|
|
$ |
2.40 |
|
Adjusted diluted earnings per share(1)(2)(3) |
|
$ |
2.89 |
|
|
$ |
2.36 |
|
|
$ |
2.71 |
|
Weighted-average common shares outstanding (basic) |
|
|
40,045,208 |
|
|
|
36,972,972 |
|
|
|
37,609,723 |
|
Weighted-average common shares outstanding (diluted) |
|
|
40,445,553 |
|
|
|
37,476,120 |
|
|
|
38,369,067 |
|
Common shares outstanding |
|
|
43,764,056 |
|
|
|
37,492,775 |
|
|
|
37,713,903 |
|
Balance Sheet Data |
|
|
|
|
|
|
|
|
|
|||
Loans and leases held for investment, before |
|
$ |
6,684,306 |
|
|
$ |
5,421,258 |
|
|
$ |
4,537,128 |
|
Loans and leases held for sale |
|
|
18,005 |
|
|
|
47,823 |
|
|
|
64,460 |
|
Allowance for credit losses - loans and leases (ACL) |
|
|
101,686 |
|
|
|
81,924 |
|
|
|
55,012 |
|
Acquisition accounting adjustments(5) |
|
|
— |
|
|
|
4,769 |
|
|
|
13,389 |
|
Interest-bearing deposits in other banks |
|
|
165,705 |
|
|
|
117,079 |
|
|
|
122,684 |
|
Investment securities |
|
|
1,352,380 |
|
|
|
1,185,125 |
|
|
|
1,469,005 |
|
Assets held for sale |
|
|
4,484 |
|
|
|
8,673 |
|
|
|
9,153 |
|
Other real estate owned, net |
|
|
1,200 |
|
|
|
4,717 |
|
|
|
2,112 |
|
Goodwill and other intangibles |
|
|
203,478 |
|
|
|
158,887 |
|
|
|
165,558 |
|
Servicing assets |
|
|
19,844 |
|
|
|
19,172 |
|
|
|
23,744 |
|
Total assets |
|
|
8,881,967 |
|
|
|
7,362,941 |
|
|
|
6,696,172 |
|
Total deposits |
|
|
7,176,999 |
|
|
|
5,695,121 |
|
|
|
5,155,047 |
|
Total liabilities |
|
|
7,891,816 |
|
|
|
6,597,125 |
|
|
|
5,859,790 |
|
Total stockholders’ equity |
|
|
990,151 |
|
|
|
765,816 |
|
|
|
836,382 |
|
Deposits per branch |
|
|
149,521 |
|
|
|
149,872 |
|
|
|
117,160 |
|
Book value per common share |
|
|
22.62 |
|
|
|
20.43 |
|
|
|
21.90 |
|
Tangible book value per common share(1) |
|
|
17.98 |
|
|
|
16.19 |
|
|
|
17.51 |
|
Performance Ratios |
|
|
|
|
|
|
|
|
|
|||
Net interest margin |
|
|
4.31 |
% |
|
|
4.00 |
% |
|
|
3.84 |
% |
Net interest margin, fully taxable equivalent(1)(4) |
|
|
4.32 |
|
|
|
4.01 |
|
|
|
3.86 |
|
Average cost of deposits |
|
|
1.90 |
|
|
|
0.36 |
|
|
|
0.09 |
|
Efficiency ratio(5) |
|
|
52.62 |
|
|
|
54.99 |
|
|
|
57.42 |
|
Adjusted efficiency ratio(1)(2)(5) |
|
|
49.61 |
|
|
|
54.70 |
|
|
|
52.14 |
|
Non-interest expense to average assets |
|
|
2.60 |
|
|
|
2.62 |
|
|
|
2.79 |
|
Adjusted non-interest expense to average assets(1)(2) |
|
|
2.46 |
|
|
|
2.61 |
|
|
|
2.54 |
|
Return on average stockholders’ equity |
|
|
12.50 |
|
|
|
11.33 |
|
|
|
11.31 |
|
Adjusted return on average stockholders' equity(1)(2)(3) |
|
|
13.53 |
|
|
|
11.43 |
|
|
|
12.77 |
|
Return on average assets |
|
|
1.34 |
|
|
|
1.25 |
|
|
|
1.40 |
|
Adjusted return on average assets(1)(2)(3) |
|
|
1.45 |
|
|
|
1.26 |
|
|
|
1.58 |
|
Non-interest income to total revenues(1) |
|
|
14.55 |
|
|
|
17.76 |
|
|
|
23.90 |
|
Pre-tax pre-provision return on average assets(1) |
|
|
2.20 |
|
|
|
1.97 |
|
|
|
1.88 |
|
Adjusted pre-tax pre-provision return on average assets(1)(2) |
|
|
2.35 |
|
|
|
1.99 |
|
|
|
2.13 |
|
Return on average tangible common stockholders' equity(1) |
|
|
16.46 |
|
|
|
15.15 |
|
|
|
15.17 |
|
Adjusted return on average tangible common stockholders' equity(1)(2)(3) |
|
|
17.76 |
|
|
|
15.28 |
|
|
|
17.04 |
|
Non-interest-bearing deposits to total deposits |
|
|
26.56 |
|
|
|
37.55 |
|
|
|
41.87 |
|
Loans and leases held for sale and loans and leases |
|
|
93.39 |
|
|
|
96.03 |
|
|
|
89.26 |
|
Deposits to total liabilities |
|
|
90.94 |
|
|
|
86.33 |
|
|
|
87.97 |
|
Asset Quality Ratios |
|
|
|
|
|
|
|
|
|
|||
Non-performing loans and leases / total loans and leases held for investment, |
|
|
0.96 |
% |
|
|
0.66 |
% |
|
|
0.51 |
% |
ACL / total loans and leases held for investment, net before ACL |
|
|
1.52 |
|
|
|
1.51 |
|
|
|
1.21 |
|
Net charge-offs / average total loans and leases held for investment, net before ACL |
|
|
0.38 |
|
|
|
0.16 |
|
|
|
0.28 |
|
Capital Ratios |
|
|
|
|
|
|
|
|
|
|||
Common equity to assets |
|
|
11.15 |
% |
|
|
10.40 |
% |
|
|
12.33 |
% |
Tangible common equity to tangible assets(1) |
|
|
9.06 |
|
|
|
8.42 |
|
|
|
10.11 |
|
Leverage ratio |
|
|
10.86 |
|
|
|
10.29 |
|
|
|
10.89 |
|
Common equity tier 1 capital ratio |
|
|
10.35 |
|
|
|
10.20 |
|
|
|
11.39 |
|
Tier 1 capital ratio |
|
|
11.39 |
|
|
|
10.85 |
|
|
|
12.37 |
|
Total capital ratio |
|
|
13.38 |
|
|
|
13.00 |
|
|
|
14.70 |
|
37
GAAP Reconciliation and Management Explanation of Non-GAAP Financial Measures
Some of the financial measures included in the "Selected Financial Data" are not measures of financial performance in accordance with GAAP. Our management uses the non‑GAAP financial measures set forth below in its analysis of our performance.
38
We believe that these non‑GAAP financial measures provide useful information to its management and investors that is supplementary to our financial condition, results of operations and cash flows computed in accordance with GAAP; however, we acknowledge that our non‑GAAP financial measures have a number of limitations. As such, you should not view these disclosures as a substitute for results determined in accordance with GAAP financial measures that we and other companies use. Management also uses these measures for peer comparison.
The following reconciliation tables provide a more detailed analysis of the non‑GAAP financial measures discussed herein:
|
|
As of or for the years ended December 31, |
|
|||||||||
(dollars in thousands, except per share data) |
|
2023 |
|
|
2022 |
|
|
2021 |
|
|||
Net income and earnings per share |
|
|
|
|
|
|
|
|
|
|||
Reported Net Income |
|
$ |
107,878 |
|
|
$ |
87,954 |
|
|
$ |
92,785 |
|
Significant items: |
|
|
|
|
|
|
|
|
|
|||
Impairment charges on assets held for sale and ROU asset |
|
|
2,395 |
|
|
|
372 |
|
|
|
16,430 |
|
Merger-related expense |
|
|
9,222 |
|
|
|
538 |
|
|
|
— |
|
Tax benefit on impairment charges and merger-related expenses |
|
|
(2,696 |
) |
|
|
(118 |
) |
|
|
(4,462 |
) |
Adjusted Net Income |
|
$ |
116,799 |
|
|
$ |
88,746 |
|
|
$ |
104,753 |
|
Reported Diluted Earnings per Share |
|
$ |
2.67 |
|
|
$ |
2.34 |
|
|
$ |
2.40 |
|
Significant items: |
|
|
|
|
|
|
|
|
|
|||
Impairment charges on assets held for sale and ROU asset |
|
|
0.06 |
|
|
|
0.01 |
|
|
|
0.43 |
|
Merger-related expense |
|
|
0.23 |
|
|
|
0.01 |
|
|
|
— |
|
Tax benefit on impairment charges and merger-related expenses |
|
|
(0.07 |
) |
|
|
— |
|
|
|
(0.12 |
) |
Adjusted Diluted Earnings per Share |
|
$ |
2.89 |
|
|
$ |
2.36 |
|
|
$ |
2.71 |
|
39
|
|
As of or for the years ended December 31, |
|
|||||||||
(dollars in thousands, except per share data) |
|
2023 |
|
|
2022 |
|
|
2021 |
|
|||
Adjusted non-interest expense: |
|
|
|
|
|
|
|
|
|
|||
Non-interest expense |
|
$ |
209,603 |
|
|
$ |
184,082 |
|
|
$ |
185,455 |
|
Less: significant items |
|
|
|
|
|
|
|
|
|
|||
Impairment charges on assets held for sale and ROU asset |
|
|
2,395 |
|
|
|
372 |
|
|
|
16,430 |
|
Merger-related expense |
|
|
9,222 |
|
|
|
538 |
|
|
|
— |
|
Adjusted non-interest expense |
|
$ |
197,986 |
|
|
$ |
183,172 |
|
|
$ |
169,025 |
|
Adjusted non-interest expense excluding |
|
|
|
|
|
|
|
|
|
|||
Adjusted non-interest expense |
|
$ |
197,986 |
|
|
$ |
183,172 |
|
|
$ |
169,025 |
|
Less: Amortization of intangible assets |
|
|
6,011 |
|
|
|
6,671 |
|
|
|
7,073 |
|
Adjusted non-interest expense excluding amortization of intangible assets |
|
$ |
191,975 |
|
|
$ |
176,501 |
|
|
$ |
161,952 |
|
Pre-tax pre-provision net income: |
|
|
|
|
|
|
|
|
|
|||
Pre-tax income |
|
$ |
145,680 |
|
|
$ |
114,683 |
|
|
$ |
124,212 |
|
Add: Provision for credit losses |
|
|
31,653 |
|
|
|
23,879 |
|
|
|
973 |
|
Pre-tax pre-provision net income |
|
$ |
177,333 |
|
|
$ |
138,562 |
|
|
$ |
125,185 |
|
Adjusted pre-tax pre-provision net income: |
|
|
|
|
|
|
|
|
|
|||
Pre-tax pre-provision net income |
|
$ |
177,333 |
|
|
$ |
138,562 |
|
|
$ |
125,185 |
|
Impairment charges on assets held for sale and ROU asset |
|
|
2,395 |
|
|
|
372 |
|
|
|
16,430 |
|
Merger-related expense |
|
|
9,222 |
|
|
|
538 |
|
|
|
— |
|
Adjusted pre-tax pre-provision net income |
|
$ |
188,950 |
|
|
$ |
139,472 |
|
|
$ |
141,615 |
|
Tax equivalent net interest income: |
|
|
|
|
|
|
|
|
|
|||
Net interest income |
|
$ |
330,621 |
|
|
$ |
265,330 |
|
|
$ |
236,387 |
|
Add: Tax-equivalent adjustment |
|
|
903 |
|
|
|
915 |
|
|
|
1,039 |
|
Net interest income, fully taxable equivalent |
|
$ |
331,524 |
|
|
$ |
266,245 |
|
|
$ |
237,426 |
|
Total revenues: |
|
|
|
|
|
|
|
|
|
|||
Net interest income |
|
$ |
330,621 |
|
|
$ |
265,330 |
|
|
$ |
236,387 |
|
Add: non-interest income |
|
|
56,315 |
|
|
|
57,314 |
|
|
|
74,253 |
|
Total revenues |
|
$ |
386,936 |
|
|
$ |
322,644 |
|
|
$ |
310,640 |
|
Tangible common stockholders' equity: |
|
|
|
|
|
|
|
|
|
|||
Total stockholders' equity |
|
$ |
990,151 |
|
|
$ |
765,816 |
|
|
$ |
836,382 |
|
Less: Preferred stock |
|
|
— |
|
|
— |
|
|
|
10,438 |
|
|
Less: Goodwill |
|
|
181,705 |
|
|
|
148,353 |
|
|
|
148,353 |
|
Less: Core deposit intangibles and other intangibles |
|
|
21,773 |
|
|
|
10,534 |
|
|
|
17,205 |
|
Tangible common stockholders' equity |
|
$ |
786,673 |
|
|
$ |
606,929 |
|
|
$ |
660,386 |
|
Tangible assets: |
|
|
|
|
|
|
|
|
|
|||
Total assets |
|
$ |
8,881,967 |
|
|
$ |
7,362,941 |
|
|
$ |
6,696,172 |
|
Less: Goodwill |
|
|
181,705 |
|
|
|
148,353 |
|
|
|
148,353 |
|
Less: Core deposit intangibles and other intangibles |
|
|
21,773 |
|
|
|
10,534 |
|
|
|
17,205 |
|
Tangible assets |
|
$ |
8,678,489 |
|
|
$ |
7,204,054 |
|
|
$ |
6,530,614 |
|
Average tangible common stockholders' equity: |
|
|
|
|
|
|
|
|
|
|||
Average total stockholders' equity |
|
$ |
863,092 |
|
|
$ |
776,225 |
|
|
$ |
820,017 |
|
Less: Average preferred stock |
|
— |
|
|
|
2,459 |
|
|
|
10,438 |
|
|
Less: Average goodwill |
|
|
164,487 |
|
|
|
148,353 |
|
|
|
148,353 |
|
Less: Average core deposit intangibles and other intangibles |
|
|
16,230 |
|
|
|
13,850 |
|
|
|
20,689 |
|
Average tangible common stockholders' equity |
|
$ |
682,375 |
|
|
$ |
611,563 |
|
|
$ |
640,537 |
|
Average tangible assets: |
|
|
|
|
|
|
|
|
|
|||
Average total assets |
|
$ |
8,048,331 |
|
|
$ |
7,018,779 |
|
|
$ |
6,642,131 |
|
Less: Average goodwill |
|
|
164,487 |
|
|
|
148,353 |
|
|
|
148,353 |
|
Less: Average core deposit intangibles and other intangibles |
|
|
16,230 |
|
|
|
13,850 |
|
|
|
20,689 |
|
Average tangible assets |
|
$ |
7,867,614 |
|
|
$ |
6,856,576 |
|
|
$ |
6,473,089 |
|
Tangible net income available |
|
|
|
|
|
|
|
|
|
|||
Net income available to common stockholders |
|
$ |
107,878 |
|
|
$ |
87,758 |
|
|
$ |
92,002 |
|
Add: After-tax intangible asset amortization |
|
|
4,408 |
|
|
|
4,890 |
|
|
|
5,147 |
|
Tangible net income available to common stockholders |
|
$ |
112,286 |
|
|
$ |
92,648 |
|
|
$ |
97,149 |
|
Adjusted Tangible net income available to common stockholders: |
|
|
|
|
|
|
|
|
|
|||
Tangible net income available to common stockholders |
|
$ |
112,286 |
|
|
$ |
92,648 |
|
|
$ |
97,149 |
|
Impairment charges on assets held for sale and ROU asset |
|
|
2,395 |
|
|
|
372 |
|
|
|
16,430 |
|
Merger-related expense |
|
|
9,222 |
|
|
|
538 |
|
|
|
— |
|
Tax benefit on significant items |
|
|
(2,696 |
) |
|
|
(118 |
) |
|
|
(4,462 |
) |
Adjusted tangible net income available to common stockholders |
|
$ |
121,207 |
|
|
$ |
93,440 |
|
|
$ |
109,117 |
|
40
|
|
As of or for the years ended December 31, |
|
|||||||||
(dollars in thousands, except share and per share data) |
|
2023 |
|
|
2022 |
|
|
2021 |
|
|||
Pre-tax pre-provision return on average assets: |
|
|
|
|
|
|
|
|
|
|||
Pre-tax pre-provision net income |
|
$ |
177,333 |
|
|
$ |
138,562 |
|
|
$ |
125,185 |
|
Total average assets |
|
|
8,048,331 |
|
|
|
7,018,779 |
|
|
|
6,642,131 |
|
Pre-tax pre-provision return on average assets |
|
|
2.20 |
% |
|
|
1.97 |
% |
|
|
1.88 |
% |
Adjusted Pre-tax pre-provision return on average assets: |
|
|
|
|
|
|
|
|
|
|||
Adjusted pre-tax pre-provision net income |
|
$ |
188,950 |
|
|
$ |
139,472 |
|
|
$ |
141,615 |
|
Total average assets |
|
|
8,048,331 |
|
|
|
7,018,779 |
|
|
|
6,642,131 |
|
Adjusted pre-tax pre-provision return on average assets |
|
|
2.35 |
% |
|
|
1.99 |
% |
|
|
2.13 |
% |
Net interest margin, fully taxable equivalent: |
|
|
|
|
|
|
|
|
|
|||
Net interest income, fully taxable equivalent |
|
$ |
331,524 |
|
|
$ |
266,245 |
|
|
$ |
237,426 |
|
Total average interest-earning assets |
|
|
7,677,848 |
|
|
|
6,630,464 |
|
|
|
6,148,841 |
|
Net interest margin, fully taxable equivalent |
|
|
4.32 |
% |
|
|
4.01 |
% |
|
|
3.86 |
% |
Non-interest income to total revenues: |
|
|
|
|
|
|
|
|
|
|||
Non-interest income |
|
$ |
56,315 |
|
|
$ |
57,314 |
|
|
$ |
74,253 |
|
Total revenues |
|
|
386,936 |
|
|
|
322,644 |
|
|
|
310,640 |
|
Non-interest income to total revenues |
|
|
14.55 |
% |
|
|
17.76 |
% |
|
|
23.90 |
% |
Adjusted non-interest expense to average assets: |
|
|
|
|
|
|
|
|
|
|||
Adjusted non-interest expense |
|
$ |
197,986 |
|
|
$ |
183,172 |
|
|
$ |
169,025 |
|
Total average assets |
|
|
8,048,331 |
|
|
|
7,018,779 |
|
|
|
6,642,131 |
|
Adjusted non-interest expense to average assets |
|
|
2.46 |
% |
|
|
2.61 |
% |
|
|
2.54 |
% |
Adjusted efficiency ratio: |
|
|
|
|
|
|
|
|
|
|||
Adjusted non-interest expense excluding amortization of intangible assets |
|
$ |
191,975 |
|
|
$ |
176,501 |
|
|
$ |
161,952 |
|
Total revenues |
|
|
386,936 |
|
|
|
322,644 |
|
|
|
310,640 |
|
Adjusted efficiency ratio |
|
|
49.61 |
% |
|
|
54.70 |
% |
|
|
52.14 |
% |
Adjusted return on average assets: |
|
|
|
|
|
|
|
|
|
|||
Adjusted net income |
|
$ |
116,799 |
|
|
$ |
88,746 |
|
|
$ |
104,753 |
|
Total average assets |
|
|
8,048,331 |
|
|
|
7,018,779 |
|
|
|
6,642,131 |
|
Adjusted return on average assets |
|
|
1.45 |
% |
|
|
1.26 |
% |
|
|
1.58 |
% |
Adjusted return on average stockholders' equity: |
|
|
|
|
|
|
|
|
|
|||
Adjusted net income |
|
$ |
116,799 |
|
|
$ |
88,746 |
|
|
$ |
104,753 |
|
Average stockholders' equity |
|
|
863,092 |
|
|
|
776,225 |
|
|
|
820,017 |
|
Adjusted return on average stockholders' equity |
|
|
13.53 |
% |
|
|
11.43 |
% |
|
|
12.77 |
% |
Tangible common equity to tangible assets: |
|
|
|
|
|
|
|
|
|
|||
Tangible common equity |
|
$ |
786,673 |
|
|
$ |
606,929 |
|
|
$ |
660,386 |
|
Tangible assets |
|
|
8,678,489 |
|
|
|
7,204,054 |
|
|
|
6,530,614 |
|
Tangible common equity to tangible assets |
|
|
9.06 |
% |
|
|
8.42 |
% |
|
|
10.11 |
% |
Return on average tangible common stockholders' equity: |
|
|
|
|
|
|
|
|
|
|||
Tangible net income available to common stockholders |
|
$ |
112,286 |
|
|
$ |
92,648 |
|
|
$ |
97,149 |
|
Average tangible common stockholders' equity |
|
|
682,375 |
|
|
|
611,563 |
|
|
|
640,537 |
|
Return on average tangible common stockholders' equity: |
|
|
16.46 |
% |
|
|
15.15 |
% |
|
|
15.17 |
% |
Adjusted return on average tangible common |
|
|
|
|
|
|
|
|
|
|||
Adjusted tangible net income available to common stockholders |
|
$ |
121,207 |
|
|
$ |
93,440 |
|
|
$ |
109,117 |
|
Average tangible common stockholders' equity |
|
|
682,375 |
|
|
|
611,563 |
|
|
|
640,537 |
|
Adjusted return on average tangible common stockholders' equity |
|
|
17.76 |
% |
|
|
15.28 |
% |
|
|
17.04 |
% |
Tangible book value per share: |
|
|
|
|
|
|
|
|
|
|||
Tangible common equity |
|
$ |
786,673 |
|
|
$ |
606,929 |
|
|
$ |
660,386 |
|
Common shares outstanding |
|
|
43,764,056 |
|
|
|
37,492,775 |
|
|
|
37,713,903 |
|
Tangible book value per share |
|
$ |
17.98 |
|
|
$ |
16.19 |
|
|
$ |
17.51 |
|
41
Results of Operations
Net interest income
Net interest income, representing interest income less interest expense, is a significant contributor to our revenues and earnings. We generate interest income from interest and dividends on interest-earning assets, which include loans, leases and investment securities we own. We incur interest expense from interest paid on interest-bearing liabilities, which include interest-bearing deposits, subordinated notes, junior subordinated debentures and other borrowings. To evaluate net interest income, we measure and monitor (i) yields on our loans and other interest-earning assets, (ii) the costs of our deposits and other funding sources, (iii) our net interest spread and (iv) our net interest margin. Net interest spread is the difference between rates earned on interest-earning assets and rates paid on interest-bearing liabilities. Net interest margin is calculated as the net interest income divided by average interest-earning assets. Because non-interest-bearing sources of funds, such as non-interest-bearing deposits and stockholders’ equity, also fund interest-earning assets, net interest margin includes the benefit of these non-interest-bearing sources.
We also recognize income from the accretable discounts associated with the purchase of interest-earning assets. Because of our recapitalization and acquisitions, we derive a portion of our interest income from the accretable discounts on purchased credit deteriorated and acquired non-credit-deteriorated loans. The accretion is generally recognized over the life of the loan. As of December 31, 2023, purchased credit deteriorated loans accounted for under ASC Topic 326 represented 3.4% of our total loan portfolio, compared to 1.4% at December 31, 2022.
Changes in the market interest rates we earn on interest-earning assets or pay on interest-bearing liabilities, as well as the volume and types of interest-earning assets, interest-bearing and non-interest-bearing liabilities, are the largest drivers of periodic changes in net interest spread, net interest margin and net interest income. In addition, our interest income includes the accretion of the discounts on our purchased credit deteriorated and acquired non-credit-deteriorated loans, which will also affect our net interest spread, net interest margin and net interest income.
42
The following tables present, for the periods indicated, information about (i) average balances, the total dollar amount of interest income from interest-earning assets and the resultant average yields; (ii) average balances, the total dollar amount of interest expense on interest-bearing liabilities and the resultant average rates; (iii) net interest income; (iv) the interest rate spread; and (v) the net interest margin. Yields have been calculated on a pre-tax basis (dollars in thousands):
|
Year Ended December 31, |
|
|||||||||||||||||||||||||||
|
2023 |
|
|
2022 |
|
|
2021 |
|
|||||||||||||||||||||
|
Average |
|
Interest |
|
Avg |
|
|
Average |
|
Interest |
|
Avg |
|
|
Average |
|
Interest |
|
Avg |
|
|||||||||
ASSETS |
|
|
|
|
|
|
|
|
|
|
|
|
|
|
|
|
|
|
|
|
|||||||||
Cash and cash equivalents |
$ |
157,754 |
|
$ |
5,029 |
|
|
3.19 |
% |
|
$ |
76,978 |
|
$ |
547 |
|
|
0.71 |
% |
|
$ |
69,338 |
|
$ |
117 |
|
|
0.17 |
% |
Loans and leases(1) |
|
6,038,797 |
|
|
440,984 |
|
|
7.30 |
% |
|
|
5,073,288 |
|
|
273,412 |
|
|
5.39 |
% |
|
|
4,518,836 |
|
|
222,993 |
|
|
4.93 |
% |
Taxable securities |
|
1,322,379 |
|
|
30,068 |
|
|
2.27 |
% |
|
|
1,316,147 |
|
|
24,156 |
|
|
1.84 |
% |
|
|
1,376,045 |
|
|
21,909 |
|
|
1.59 |
% |
Tax-exempt securities(2) |
|
158,918 |
|
|
4,300 |
|
|
2.71 |
% |
|
|
164,051 |
|
|
4,359 |
|
|
2.66 |
% |
|
|
184,622 |
|
|
4,946 |
|
|
2.68 |
% |
Total interest-earning assets |
$ |
7,677,848 |
|
$ |
480,381 |
|
|
6.26 |
% |
|
$ |
6,630,464 |
|
$ |
302,474 |
|
|
4.56 |
% |
|
$ |
6,148,841 |
|
$ |
249,965 |
|
|
4.07 |
% |
Allowance for credit losses - loans and leases |
|
(98,067 |
) |
|
|
|
|
|
|
(74,233 |
) |
|
|
|
|
|
|
(63,351 |
) |
|
|
|
|
||||||
All other assets |
|
468,550 |
|
|
|
|
|
|
|
462,548 |
|
|
|
|
|
|
|
556,641 |
|
|
|
|
|
||||||
TOTAL ASSETS |
$ |
8,048,331 |
|
|
|
|
|
|
$ |
7,018,779 |
|
|
|
|
|
|
$ |
6,642,131 |
|
|
|
|
|
||||||
LIABILITIES AND STOCKHOLDERS’ |
|
|
|
|
|
|
|
|
|
|
|
|
|
|
|
|
|
|
|
|
|||||||||
Deposits |
|
|
|
|
|
|
|
|
|
|
|
|
|
|
|
|
|
|
|
|
|||||||||
Interest checking |
$ |
574,335 |
|
$ |
9,212 |
|
|
1.60 |
% |
|
$ |
593,903 |
|
$ |
3,572 |
|
|
0.60 |
% |
|
$ |
622,147 |
|
$ |
883 |
|
|
0.14 |
% |
Money market accounts |
|
1,802,675 |
|
|
53,933 |
|
|
2.99 |
% |
|
|
1,357,371 |
|
|
10,484 |
|
|
0.77 |
% |
|
|
1,073,970 |
|
|
1,285 |
|
|
0.12 |
% |
Savings |
|
585,820 |
|
|
883 |
|
|
0.15 |
% |
|
|
658,968 |
|
|
649 |
|
|
0.10 |
% |
|
|
610,953 |
|
|
289 |
|
|
0.05 |
% |
Time deposits |
|
1,468,836 |
|
|
57,408 |
|
|
3.91 |
% |
|
|
691,650 |
|
|
5,091 |
|
|
0.74 |
% |
|
|
722,974 |
|
|
2,045 |
|
|
0.28 |
% |
Total interest-bearing deposits |
|
4,431,666 |
|
|
121,436 |
|
|
2.74 |
% |
|
|
3,301,892 |
|
|
19,796 |
|
|
0.60 |
% |
|
|
3,030,044 |
|
|
4,502 |
|
|
0.15 |
% |
Other borrowings |
|
484,984 |
|
|
17,125 |
|
|
3.53 |
% |
|
|
478,374 |
|
|
9,308 |
|
|
1.95 |
% |
|
|
525,078 |
|
|
1,663 |
|
|
0.32 |
% |
Federal funds purchased |
|
685 |
|
|
36 |
|
|
5.30 |
% |
|
|
630 |
|
|
14 |
|
|
2.32 |
% |
|
|
— |
|
|
— |
|
|
0.00 |
% |
Subordinated notes and debentures |
|
127,825 |
|
|
10,260 |
|
|
8.03 |
% |
|
|
110,723 |
|
|
7,111 |
|
|
6.42 |
% |
|
|
110,108 |
|
|
6,374 |
|
|
5.79 |
% |
Total borrowings |
|
613,494 |
|
|
27,421 |
|
|
4.47 |
% |
|
|
589,727 |
|
|
16,433 |
|
|
2.79 |
% |
|
|
635,186 |
|
|
8,037 |
|
|
1.27 |
% |
Total interest-bearing liabilities |
$ |
5,045,160 |
|
$ |
148,857 |
|
|
2.95 |
% |
|
$ |
3,891,619 |
|
$ |
36,229 |
|
|
0.93 |
% |
|
$ |
3,665,230 |
|
$ |
12,539 |
|
|
0.34 |
% |
Non-interest bearing demand deposits |
|
1,965,663 |
|
|
|
|
|
|
|
2,236,615 |
|
|
|
|
|
|
|
2,085,454 |
|
|
|
|
|
||||||
Other liabilities |
|
174,416 |
|
|
|
|
|
|
|
114,320 |
|
|
|
|
|
|
|
71,430 |
|
|
|
|
|
||||||
Total stockholders’ equity |
|
863,092 |
|
|
|
|
|
|
|
776,225 |
|
|
|
|
|
|
|
820,017 |
|
|
|
|
|
||||||
TOTAL LIABILITIES AND |
$ |
8,048,331 |
|
|
|
|
|
|
$ |
7,018,779 |
|
|
|
|
|
|
$ |
6,642,131 |
|
|
|
|
|
||||||
Net interest spread(3) |
|
|
|
|
|
3.31 |
% |
|
|
|
|
|
|
3.63 |
% |
|
|
|
|
|
|
3.73 |
% |
||||||
Net interest income, fully taxable equivalent |
|
|
$ |
331,524 |
|
|
|
|
|
|
$ |
266,245 |
|
|
|
|
|
|
$ |
237,426 |
|
|
|
||||||
Net interest margin, fully taxable equivalent(2)(4) |
|
|
|
|
|
4.32 |
% |
|
|
|
|
|
|
4.01 |
% |
|
|
|
|
|
|
3.86 |
% |
||||||
Tax-equivalent adjustment |
|
|
|
903 |
|
|
0.01 |
% |
|
|
|
|
915 |
|
|
0.01 |
% |
|
|
|
|
1,039 |
|
|
0.02 |
% |
|||
Net interest income |
|
|
$ |
330,621 |
|
|
|
|
|
|
$ |
265,330 |
|
|
|
|
|
|
$ |
236,387 |
|
|
|
||||||
Net interest margin(4) |
|
|
|
|
|
4.31 |
% |
|
|
|
|
|
|
4.00 |
% |
|
|
|
|
|
|
3.84 |
% |
||||||
|
|
|
|
|
|
|
|
|
|
|
|
|
|
|
|
|
|
|
|
|
|||||||||
Net loan accretion impact on margin |
|
|
$ |
16,726 |
|
|
0.22 |
% |
|
|
|
$ |
4,555 |
|
|
0.07 |
% |
|
|
|
$ |
6,451 |
|
|
0.10 |
% |
|||
43
Increases and decreases in interest income and interest expense result from changes in average balances (volume) of interest-earning assets and interest-bearing liabilities, as well as changes in average interest rates. The following tables set forth the effects of changing rates and volumes on our net interest income during the periods shown. Information is provided with respect to (i) effects on interest income attributable to changes in volume (changes in volume multiplied by prior rate) and (ii) effects on interest income attributable to changes in rate (changes in rate multiplied by prior volume). Changes applicable to both volume and rate have been allocated to volume. Yields have been calculated on a pre-tax basis. The tables below are a summary of the increases and decreases in interest income and interest expense resulting from changes in average balances (volume) and changes in average interest rates (dollars in thousands):
|
|
Year Ended December 31, |
|
|||||||||||||||||||||
|
|
2023 Compared to 2022 |
|
|
2022 Compared to 2021 |
|
||||||||||||||||||
|
|
Change Due to |
|
|
Change Due to |
|
|
Total |
|
|
Change Due to |
|
|
Change Due to |
|
|
Total |
|
||||||
|
|
Volume |
|
|
Rate |
|
|
Change |
|
|
Volume |
|
|
Rate |
|
|
Change |
|
||||||
Interest income |
|
|
|
|
|
|
|
|
|
|
|
|
|
|
|
|
|
|
||||||
Cash and cash equivalents |
|
$ |
2,573 |
|
|
$ |
1,909 |
|
|
$ |
4,482 |
|
|
$ |
56 |
|
|
$ |
374 |
|
|
$ |
430 |
|
Loans and leases(1) |
|
|
70,672 |
|
|
|
96,900 |
|
|
|
167,572 |
|
|
|
29,632 |
|
|
|
20,787 |
|
|
|
50,419 |
|
Taxable securities |
|
|
253 |
|
|
|
5,659 |
|
|
|
5,912 |
|
|
|
(1,193 |
) |
|
|
3,440 |
|
|
|
2,247 |
|
Tax-exempt securities(2) |
|
|
(141 |
) |
|
|
82 |
|
|
|
(59 |
) |
|
|
(550 |
) |
|
|
(37 |
) |
|
|
(587 |
) |
Total interest income |
|
$ |
73,357 |
|
|
$ |
104,550 |
|
|
$ |
177,907 |
|
|
$ |
27,945 |
|
|
$ |
24,564 |
|
|
$ |
52,509 |
|
Interest expense |
|
|
|
|
|
|
|
|
|
|
|
|
|
|
|
|
|
|
||||||
Deposits |
|
|
|
|
|
|
|
|
|
|
|
|
|
|
|
|
|
|
||||||
Interest checking |
|
$ |
(299 |
) |
|
$ |
5,939 |
|
|
$ |
5,640 |
|
|
$ |
(173 |
) |
|
$ |
2,862 |
|
|
$ |
2,689 |
|
Money market accounts |
|
|
13,315 |
|
|
|
30,134 |
|
|
|
43,449 |
|
|
|
2,218 |
|
|
|
6,981 |
|
|
|
9,199 |
|
Savings |
|
|
(95 |
) |
|
|
329 |
|
|
|
234 |
|
|
|
55 |
|
|
|
305 |
|
|
|
360 |
|
Time deposits |
|
|
30,392 |
|
|
|
21,925 |
|
|
|
52,317 |
|
|
|
(280 |
) |
|
|
3,326 |
|
|
|
3,046 |
|
Total interest-bearing deposits |
|
|
43,313 |
|
|
|
58,327 |
|
|
|
101,640 |
|
|
|
1,820 |
|
|
|
13,474 |
|
|
|
15,294 |
|
Other borrowings |
|
|
254 |
|
|
|
7,563 |
|
|
|
7,817 |
|
|
|
(914 |
) |
|
|
8,559 |
|
|
|
7,645 |
|
Federal funds purchased |
|
|
3 |
|
|
|
19 |
|
|
|
22 |
|
|
|
14 |
|
|
|
— |
|
|
|
14 |
|
Subordinated notes and |
|
|
1,373 |
|
|
|
1,776 |
|
|
|
3,149 |
|
|
|
40 |
|
|
|
697 |
|
|
|
737 |
|
Total borrowings |
|
|
1,630 |
|
|
|
9,358 |
|
|
|
10,988 |
|
|
|
(860 |
) |
|
|
9,256 |
|
|
|
8,396 |
|
Total interest expense |
|
$ |
44,943 |
|
|
$ |
67,685 |
|
|
$ |
112,628 |
|
|
$ |
960 |
|
|
$ |
22,730 |
|
|
$ |
23,690 |
|
Net interest income |
|
$ |
28,414 |
|
|
$ |
36,865 |
|
|
$ |
65,279 |
|
|
$ |
26,985 |
|
|
$ |
1,834 |
|
|
$ |
28,819 |
|
(1) Includes loans and leases on non-accrual status.
(2) Interest income and rates include the effects of a tax equivalent adjustment to adjust tax-exempt investment income on tax-exempt investment securities to a fully taxable basis, assuming a federal income tax rate of 21%.
Net interest income for the year ended December 31, 2023 was $330.6 million, an increase of $65.3 million, or 24.6% compared to 2022. The increase in interest income of $177.9 million was principally a result of higher yields and increased average balances on loans and leases resulting from loan and lease growth, including acquired loans. The average balance of interest-earning assets was $7.7 billion for the year ended December 31, 2023, an increase of $1.0 billion, or 15.8%, compared to 2022, primarily due to growth in our loan and lease portfolios. Interest expense increased by $112.6 million for the year ended December 31, 2023 compared to 2022, mostly due to increased rates paid on deposits, change in deposit mix, and growth of deposits from assumed deposits. Average total interest-bearing deposits increased $1.1 billion, or 34.2% year over year.
Interest expense on borrowings for the year ended December 31, 2023 was $27.4 million compared to $16.4 million for the year ended December 31, 2022, an increase of $11.0 million, or 66.9%. This increase was primarily driven by increases in rates paid on borrowed funds, assumption of junior subordinated debentures from the Inland acquisition, and utilization of term and revolving credit facilities.
The net interest margin for the year ended December 31, 2023 was 4.31%, an increase of 31 basis points compared to 4.00% for the year ended December 31, 2022. The average yield on interest-earning assets increased 170 basis points to 6.26% for the year ended December 31, 2023 compared to 4.56% for the year ended December 31, 2022, while the average rate paid on interest-bearing liabilities increased by 202 basis points to 2.95%, resulting in a decrease in the interest rate spread of 32 basis points.
44
Net loan accretion income was $16.7 million for the year ended December 31, 2023 compared to $4.6 million for the year ended December 31, 2022, an increase of $12.2 million. Total net loan accretion on acquired loans contributed 22 basis points to the net interest margin for the year ended December 31, 2023 compared to seven basis points for the year ended December 31, 2022. We expected loan accretion income to decline as acquired loans mature. Projected accretion income as of December 31, 2023 is summarized as follows:
|
|
Estimated Projected Accretion(1)(2) |
|
|
2024 |
|
$ |
10,111 |
|
2025 |
|
|
6,154 |
|
2026 |
|
|
4,489 |
|
2027 |
|
|
2,829 |
|
2028 |
|
|
1,619 |
|
Thereafter |
|
|
14,301 |
|
Total |
|
$ |
39,503 |
|
(1) Estimated projected accretion excludes contractual interest income on acquired loans and leases. |
|
|||
Provision for credit losses
The provision for credit losses reflects the amount required to maintain the ACL at an appropriate level based upon management’s evaluation of collectively and individually evaluated loss reserves. The provision for credit losses represents a charge to earnings necessary to establish an allowance for credit losses that, in management’s evaluation, is appropriate to provide coverage for current expected credit losses in the loan and lease portfolio. The ACL is increased by the provision for credit losses and is decreased by charge-offs, net of recoveries on prior charge-offs.
Provision for credit losses for the year ended December 31, 2023 was $31.7 million compared to $23.9 million for the year ended December 31, 2022, an increase of $7.8 million. The increase in provision was driven by an increase in non-performing loans and acquired non-credit-deteriorated loans. For the year ended December 31, 2023, the provision for credit losses is comprised of a provision for loan and lease losses of $32.2 million and a recapture for unfunded commitments of $567,000. For the year ended December 31, 2022, the provision for credit losses is comprised of a provision for loan and lease losses of $22.7 million and a provision for unfunded commitments of $1.2 million. The ACL as a percentage of loans and leases increased slightly from 1.51% at December 31, 2022 to 1.52% at December 31, 2023.
Non-interest income
Non-interest income was $56.3 million for the year ended December 31, 2023, compared to $57.3 million for the year ended December 31, 2022, a decrease of $999,000 or 1.7%. The decrease in non-interest income was mostly due to a decrease in net gains on sale of loans, offset by a lower downward valuation adjustment of the servicing asset.
The following table presents the major components of our non-interest income for the periods indicated (dollars in thousands):
|
|
Year ended December 31, |
|
|
2023 compared to 2022 |
|
|
2022 compared to 2021 |
|
|||||||||||||||||||
|
|
2023 |
|
|
2022 |
|
|
2021 |
|
|
$ Change |
|
|
% Change |
|
|
$ Change |
|
|
% Change |
|
|||||||
Fees and service charges on deposits |
|
$ |
9,211 |
|
|
$ |
8,152 |
|
|
$ |
7,254 |
|
|
$ |
1,059 |
|
|
|
13.0 |
% |
|
$ |
898 |
|
|
|
12.4 |
% |
Loan servicing revenue |
|
|
13,503 |
|
|
|
13,479 |
|
|
|
12,693 |
|
|
|
24 |
|
|
|
0.2 |
% |
|
|
786 |
|
|
|
6.2 |
% |
Loan servicing asset revaluation |
|
|
(5,089 |
) |
|
|
(11,743 |
) |
|
|
(6,658 |
) |
|
|
6,654 |
|
|
|
(56.7 |
)% |
|
|
(5,085 |
) |
|
|
76.4 |
% |
ATM and interchange fees |
|
|
4,462 |
|
|
|
4,437 |
|
|
|
4,476 |
|
|
|
25 |
|
|
|
0.6 |
% |
|
|
(39 |
) |
|
|
(0.9 |
)% |
Net gains on sales of securities available-for-sale |
|
|
— |
|
|
|
50 |
|
|
|
1,435 |
|
|
|
(50 |
) |
|
|
(100.0 |
)% |
|
|
(1,385 |
) |
|
|
(96.5 |
)% |
Change in fair value of equity securities, net |
|
|
1,071 |
|
|
|
(603 |
) |
|
|
(62 |
) |
|
|
1,674 |
|
|
NM |
|
|
|
(541 |
) |
|
NM |
|
||
Net gains on sales of loans |
|
|
22,805 |
|
|
|
31,899 |
|
|
|
46,274 |
|
|
|
(9,094 |
) |
|
|
(28.5 |
)% |
|
|
(14,375 |
) |
|
|
(31.1 |
)% |
Wealth management and trust income |
|
|
4,158 |
|
|
|
3,807 |
|
|
|
3,069 |
|
|
|
351 |
|
|
|
9.2 |
% |
|
|
738 |
|
|
|
24.0 |
% |
Other non-interest income |
|
|
6,194 |
|
|
|
7,836 |
|
|
|
5,772 |
|
|
|
(1,642 |
) |
|
|
(21.0 |
)% |
|
|
2,064 |
|
|
|
35.8 |
% |
Total non-interest income |
|
$ |
56,315 |
|
|
$ |
57,314 |
|
|
$ |
74,253 |
|
|
$ |
(999 |
) |
|
|
(1.7 |
)% |
|
$ |
(16,939 |
) |
|
|
(22.8 |
)% |
NM - Not meaningful |
|
|
|
|
|
|
|
|
|
|
|
|
|
|
|
|
|
|
|
|
|
|||||||
Fees and service charge on deposits represent amounts charged to customers for banking services, such as fees on deposit accounts, and include, but not limited to, maintenance fees, insufficient fund fees, overdraft protection fees, wire transfer fees, and other charges. Fees and service charges on deposits were $9.2 million for the year ended December 31, 2023, compared to $8.2 million for the year ended December 31, 2022, an increase of $1.1 million or 13.0%. The increase was a result of increases in deposit balances and changes in fee structure.
45
While portions of the loans that we originate are sold and generate gains on sale revenue, servicing rights for the majority of the loans that we sell are retained by us. In exchange for continuing to service loans that have been sold, we receive servicing revenue from a portion of the interest cash flow of the loan. We generated $13.5 million in loan servicing revenue on the sold portion of the U.S. government guaranteed loans for each of the years ended December 31, 2023, and 2022. At December 31, 2023 and 2022, the outstanding balances of U.S. government guaranteed loans serviced, was $1.7 billion.
Loan servicing asset revaluation represents net changes in the fair value of our servicing assets. Loan servicing asset revaluation had a downward adjustment of $5.1 million for the year ended December 31, 2023, compared to a downward adjustment of $11.7 million for the year ended December 31, 2022. The variance was primarily driven by the change in fair value of the servicing asset as a result of changes to valuation assumptions, including prepayment speeds, discount rates, and expected average loan life on U.S. government guaranteed loans based on the current interest rate environment.
Net gains on sales of loans were $22.8 million for the year ended December 31, 2023 compared to $31.9 million for the year ended December 31, 2022, a decrease of $9.1 million, or 28.5%. The decrease in net gains on sales was primarily driven by lower volume of government guaranteed loans sold and lower market premiums for government guaranteed loans. We sold $348.4 million and $382.2 million of U.S. government guaranteed loans during the years ended December 31, 2023 and 2022, respectively.
Wealth management and trust income represents fees charged to customers for investment, trust, or wealth management services and are primarily determined by total assets under administration. Wealth management and trust income was $4.2 million for the year ended December 31, 2023 compared to $3.8 million for the year ended December 31, 2022, an increase of $351,000 or 9.2%, mainly due to increases in assets under administration. Assets under administration were $770.5 million and $548.7 million as of December 31, 2023 and 2022, respectively.
Other non-interest income was $6.2 million for the year ended December 31, 2023 compared to $7.8 million for the year ended December 31, 2022, a decrease of $1.6 million or 21.0%. Customer derivative products fee income was $443,000 for the year ended December 31, 2023 compared to $2.7 million for the year ended December 31, 2022, a decrease of $2.3 million. This decrease was partially offset by a $293,000 increase in cash surrender value of bank owned life insurance ("BOLI") of $2.3 million for the year ended December 31, 2023 compared to $2.1 million for the year ended December 31, 2022. The Company acquired additional BOLI policies as a result of the Inland acquisition.
Non-interest expense
We reported non-interest expense for the year ended December 31, 2023 of $209.6 million compared to $184.1 million for the year ended December 31, 2022, an increase of $25.5 million or 13.9%. The increase was primarily due to the acquisition of Inland and related increases in salaries and employee benefits, data processing, and legal, audit and other professional fees.
The following table presents the major components of our non-interest expense for the periods indicated (dollars in thousands):
|
|
Year ended December 31, |
|
|
2023 compared to 2022 |
|
|
2022 compared to 2021 |
|
|||||||||||||||||||
|
|
2023 |
|
|
2022 |
|
|
2021 |
|
|
$ Change |
|
|
% Change |
|
|
$ Change |
|
|
% Change |
|
|||||||
Salaries and employee benefits |
|
$ |
126,979 |
|
|
$ |
118,051 |
|
|
$ |
101,222 |
|
|
$ |
8,928 |
|
|
|
7.6 |
% |
|
$ |
16,829 |
|
|
|
16.6 |
% |
Occupancy expense, net |
|
|
14,030 |
|
|
|
13,197 |
|
|
|
16,553 |
|
|
|
833 |
|
|
|
6.3 |
% |
|
|
(3,356 |
) |
|
|
(20.3 |
)% |
Equipment expense |
|
|
4,478 |
|
|
|
3,791 |
|
|
|
4,059 |
|
|
|
687 |
|
|
|
18.1 |
% |
|
|
(268 |
) |
|
|
(6.6 |
)% |
Impairment charge on assets held for sale |
|
|
2,000 |
|
|
|
372 |
|
|
|
12,332 |
|
|
|
1,628 |
|
|
NM |
|
|
|
(11,960 |
) |
|
|
(97.0 |
)% |
|
Loan and lease related expenses |
|
|
2,936 |
|
|
|
1,707 |
|
|
|
5,957 |
|
|
|
1,229 |
|
|
|
72.0 |
% |
|
|
(4,250 |
) |
|
|
(71.3 |
)% |
Legal, audit and other professional fees |
|
|
12,946 |
|
|
|
10,357 |
|
|
|
10,198 |
|
|
|
2,589 |
|
|
|
25.0 |
% |
|
|
159 |
|
|
|
1.6 |
% |
Data processing |
|
|
19,509 |
|
|
|
13,358 |
|
|
|
11,780 |
|
|
|
6,151 |
|
|
|
46.1 |
% |
|
|
1,578 |
|
|
|
13.4 |
% |
Net loss recognized on other real |
|
|
385 |
|
|
|
708 |
|
|
|
1,078 |
|
|
|
(323 |
) |
|
|
(45.6 |
)% |
|
|
(370 |
) |
|
|
(34.3 |
)% |
Regulatory assessments |
|
|
4,143 |
|
|
|
2,953 |
|
|
|
1,717 |
|
|
|
1,190 |
|
|
|
40.3 |
% |
|
|
1,236 |
|
|
|
72.0 |
% |
Other intangible assets amortization expense |
|
|
6,011 |
|
|
|
6,671 |
|
|
|
7,073 |
|
|
|
(660 |
) |
|
|
(9.9 |
)% |
|
|
(402 |
) |
|
|
(5.7 |
)% |
Advertising and promotions |
|
|
3,796 |
|
|
|
2,825 |
|
|
|
1,800 |
|
|
|
971 |
|
|
|
34.4 |
% |
|
|
1,025 |
|
|
|
56.9 |
% |
Telecommunications |
|
|
1,447 |
|
|
|
918 |
|
|
|
1,155 |
|
|
|
529 |
|
|
|
57.6 |
% |
|
|
(237 |
) |
|
|
(20.5 |
)% |
Other non-interest expense |
|
|
10,943 |
|
|
|
9,174 |
|
|
|
10,531 |
|
|
|
1,769 |
|
|
|
19.3 |
% |
|
|
(1,357 |
) |
|
|
(12.9 |
)% |
Total non-interest expense |
|
$ |
209,603 |
|
|
$ |
184,082 |
|
|
$ |
185,455 |
|
|
$ |
25,521 |
|
|
|
13.9 |
% |
|
$ |
(1,373 |
) |
|
|
(0.7 |
)% |
Salaries and employee benefits expense for the year ended December 31, 2023 was $127.0 million compared to $118.1 million for the year ended December 31, 2022, an increase of $8.9 million or 7.6%, primarily a result of a higher headcount, merit increases, and increased compensation associated with the Inland acquisition.
46
Occupancy expense for the year ended December 31, 2023 was $14.0 million compared to $13.2 million for the year ended December 31, 2022, an increase of $833,000, or 6.3%. The increase was primarily a result of increased building maintenance and depreciation due to acquired branches.
Equipment expense for the year ended December 31, 2023 was $4.5 million compared to $3.8 million for the year ended December 31, 2022, an increase of $687,000 or 18.1%. The increase was primarily a result of increased software depreciation, as we continue to invest in digital capabilities in improve customer experience and gain operational efficiencies.
Impairment charge on assets held for sale was $2.0 million for the year ended December 31, 2023 compared to $372,000 for the year ended December 31, 2022, an increase of $1.6 million. The increase was primarily a result of write-downs on assets held for sale based on fair values of properties, less estimated costs to sell.
Loan and lease related expenses for the year ended December 31, 2023 were $2.9 million compared to $1.7 million for the year ended December 21, 2022, an increase of $1.2 million, or 72.0%. The increase was due to increases in expenses related to government guaranteed loans.
Legal, audit and other professional fees for the year ended December 31, 2023 were $12.9 million compared to $10.4 million for the year ended December 31, 2022, an increase of $2.6 million or 25.0%. The increase was mainly driven by increased legal and professional services related to the Inland acquisition.
Data processing expense for the year ended December 31, 2023 was $19.5 million compared to $13.4 million for the year ended December 31, 2022, an increase of $6.2 million or 46.1% primarily due to increased data processing expenses related to the Inland acquisition, including contract termination expenses.
Regulatory assessments for the year ended December 31, 2023 were $4.1 million compared to $3.0 million for the year ended December 31, 2022, an increase of $1.2 million, or 40.3%. The increase was primarily driven by an increase in our asset size and increased DIF reserve ratio requirement. See Item 1. "Business - Supervision and Regulation - Deposit Insurance - FDIC insurance assessments, for more information on assessment rates.
Advertising and promotions for the year ended December 31, 2023 were $3.8 million compared to $2.8 million for the year ended December 31, 2022, an increase of $971,000 or 34.4%, primarily due to an increase in digital deposit advertising campaigns.
Other non-interest expense for the year ended December 31, 2023 was $10.9 million compared to $9.2 million for the year ended December 31, 2022, an increase of $1.8 million, or 19.3%. The increase was primarily due to general increased expenses associated with our increased size.
For the years ended December 31, 2023 and 2022, our efficiency ratio was 52.62% and 54.99%, respectively. The improvement in our efficiency ratio was primarily attributable to increased net interest income. For the years ended December 31, 2023 and 2022, our adjusted efficiency ratio was 49.61% and 54.70%, respectively. Please refer to the "GAAP Reconciliation and Management Explanation of Non-GAAP Financial Measures" included in Item 7 of this report, for more information on how our adjusted efficiency ratio is calculated.
Income Taxes
Income tax expense was $37.8 million for the year ended December 31, 2023, compared to $26.7 million for the year ended December 31, 2022. The increase in income tax expense was primarily due to increased income before provision for income taxes during 2023.
Our effective tax rate was 25.9% for the year ended December 31, 2023 and 23.3% for the year ended December 31, 2022. The increase in our effective tax rate was primarily driven by a decrease in tax benefit from share-based compensation and an increase in the state tax rate. We expect our effective tax rate for 2024 to be approximately 25% to 27%.
Financial Condition
Balance sheet analysis
Our total assets increased by $1.5 billion, or 20.6%, to $8.9 billion at December 31, 2023, compared to $7.4 billion at December 31, 2022. The increase in total assets includes an increase of $1.3 billion, or 23.3%, in loans and leases from $5.4 billion at December 31, 2022 to $6.7 billion at December 31, 2023. Our originated loan and lease portfolio increased by $636.3 million, and our purchased credit deteriorated and acquired non-credit-deteriorated loan and lease portfolio increased by $626.7 million. The increases in our originated portfolio was mostly attributed to organic loan and lease growth and the increase in our acquired portfolio was due to the Inland acquisition.
Total liabilities increased by $1.3 billion, or 19.6%, to $7.9 billion at December 31, 2023 compared to $6.6 billion at December 31, 2022. The increase is a result of an increase in total deposits of $1.5 billion, or 26.0%, primarily attributed to our acquisition and organic deposit growth, offset by lower FHLB advances.
47
Investment portfolio
Our investment securities portfolio consists of securities classified as equity and other securities, at fair value, available-for-sale, and held-to-maturity. There were no securities classified as trading in our investment portfolio as of or for the years ended December 31, 2023 and 2022. All available-for sale securities are carried at fair value and may be used for liquidity purposes should management consider it to be in our best interest. Securities available-for-sale consist primarily of residential mortgage-backed securities, commercial mortgage-backed securities and U.S. government agencies securities and has an average duration of 4.8 years.
Securities available-for-sale increased $168.0 million, or 14.3%, from $1.2 billion at December 31, 2022 to $1.3 billion at December 31, 2023, primarily due to purchases of securities and securities acquired in the Inland acquisition.
Our held-to-maturity securities portfolio consists of municipal securities. We carry these securities at amortized cost. Securities held-to-maturity were $1.2 million and $2.7 million at December 31, 2023 and 2022, respectively.
The fair value of our equity and other securities portfolio was $8.7 million at December 31, 2023, and $8.0 million at December 31, 2022.
The following tables summarize the fair value of the available-for-sale and held-to-maturity securities portfolio as of the dates presented (dollars in thousands):
|
|
December 31, 2023 |
|
|
December 31, 2022 |
|
||||||||||
|
|
Amortized |
|
|
Fair |
|
|
Amortized |
|
|
Fair |
|
||||
Available-for-sale |
|
|
|
|
|
|
|
|
|
|
|
|
||||
U.S. Treasury Notes |
|
$ |
116,398 |
|
|
$ |
115,434 |
|
|
$ |
42,430 |
|
|
$ |
40,723 |
|
U.S. Government agencies |
|
|
147,062 |
|
|
|
130,695 |
|
|
|
150,524 |
|
|
|
130,364 |
|
Obligations of states, municipalities, and political |
|
|
86,022 |
|
|
|
82,275 |
|
|
|
68,019 |
|
|
|
61,876 |
|
Residential mortgage-backed securities |
|
|
|
|
|
|
|
|
|
|
|
|
||||
Agency |
|
|
786,970 |
|
|
|
695,803 |
|
|
|
707,157 |
|
|
|
595,796 |
|
Non-agency |
|
|
122,359 |
|
|
|
100,260 |
|
|
|
130,654 |
|
|
|
106,249 |
|
Commercial mortgage-backed securities |
|
|
|
|
|
|
|
|
|
|
|
|
||||
Agency |
|
|
181,452 |
|
|
|
147,204 |
|
|
|
191,172 |
|
|
|
157,030 |
|
Corporate securities |
|
|
40,681 |
|
|
|
36,171 |
|
|
|
45,302 |
|
|
|
41,436 |
|
Asset-backed securities |
|
|
35,857 |
|
|
|
34,638 |
|
|
|
43,085 |
|
|
|
40,957 |
|
Total |
|
$ |
1,516,801 |
|
|
$ |
1,342,480 |
|
|
$ |
1,378,343 |
|
|
$ |
1,174,431 |
|
|
|
December 31, 2023 |
|
|
December 31, 2022 |
|
||||||||||
|
|
Amortized |
|
|
Fair |
|
|
Amortized |
|
|
Fair |
|
||||
Held-to-maturity |
|
|
|
|
|
|
|
|
|
|
|
|
||||
Obligations of states, municipalities, and political |
|
$ |
1,157 |
|
|
$ |
1,149 |
|
|
$ |
2,705 |
|
|
$ |
2,672 |
|
Total |
|
$ |
1,157 |
|
|
$ |
1,149 |
|
|
$ |
2,705 |
|
|
$ |
2,672 |
|
Certain securities have fair values less than amortized cost and, therefore, contain unrealized losses. At December 31, 2023, we evaluated the securities in an unrealized loss position for credit losses and determined there were none. There were 285 investment securities with unrealized losses at December 31, 2023. We anticipate full recovery of amortized cost with respect to these securities by maturity, or sooner in the event of a more favorable market interest rate environment. We do not intend to sell these securities and it is not more likely than not that we will be required to sell them before recovery of their amortized cost basis, which may be at maturity.
48
The following table (dollars in thousands) set forth certain information regarding contractual maturities and the weighted average yields of our debt securities as of December 31, 2023. Expected maturities may differ from contractual maturities if borrowers have the right to call or prepay obligations with or without call or prepayment penalties.
|
|
Maturity as of December 31, 2023 |
|
|||||||||||||||||||||||||||||
|
|
Due in One Year or Less |
|
|
Due from One to Five Years |
|
|
Due from Five to Ten Years |
|
|
Due after Ten Years |
|
||||||||||||||||||||
|
|
Amortized |
|
|
Weighted |
|
|
Amortized |
|
|
Weighted |
|
|
Amortized |
|
|
Weighted |
|
|
Amortized |
|
|
Weighted |
|
||||||||
Available-for-sale |
|
|
|
|
|
|
|
|
|
|
|
|
|
|
|
|
|
|
|
|
|
|
|
|
||||||||
U.S. Treasury Notes |
|
$ |
83,779 |
|
|
|
4.85 |
% |
|
$ |
32,619 |
|
|
|
2.79 |
% |
|
$ |
— |
|
|
|
0.00 |
% |
|
$ |
— |
|
|
|
0.00 |
% |
U.S. government agencies |
|
|
— |
|
|
|
0.00 |
% |
|
|
57,119 |
|
|
|
2.12 |
% |
|
|
82,799 |
|
|
|
1.47 |
% |
|
|
7,144 |
|
|
|
4.04 |
% |
Obligations of states, |
|
|
3,255 |
|
|
|
2.97 |
% |
|
|
20,882 |
|
|
|
3.06 |
% |
|
|
24,604 |
|
|
|
3.65 |
% |
|
|
37,281 |
|
|
|
2.34 |
% |
Residential mortgage-backed |
|
|
|
|
|
|
|
|
|
|
|
|
|
|
|
|
|
|
|
|
|
|
|
|
||||||||
Agency |
|
|
— |
|
|
|
0.00 |
% |
|
|
32,222 |
|
|
|
1.64 |
% |
|
|
55,176 |
|
|
|
1.61 |
% |
|
|
699,572 |
|
|
|
2.32 |
% |
Non-agency |
|
|
— |
|
|
|
0.00 |
% |
|
|
— |
|
|
|
0.00 |
% |
|
|
— |
|
|
|
0.00 |
% |
|
|
122,359 |
|
|
|
2.16 |
% |
Commercial mortgage-backed |
|
|
|
|
|
|
|
|
|
|
|
|
|
|
|
|
|
|
|
|
|
|
|
|
||||||||
Agency |
|
|
— |
|
|
|
0.00 |
% |
|
|
— |
|
|
|
0.00 |
% |
|
|
14,152 |
|
|
|
1.68 |
% |
|
|
167,300 |
|
|
|
2.06 |
% |
Corporate securities |
|
|
— |
|
|
|
0.00 |
% |
|
|
12,129 |
|
|
|
4.50 |
% |
|
|
28,552 |
|
|
|
3.85 |
% |
|
|
— |
|
|
|
0.00 |
% |
Asset-backed securities |
|
|
— |
|
|
|
0.00 |
% |
|
|
— |
|
|
|
0.00 |
% |
|
|
35,857 |
|
|
|
5.54 |
% |
|
|
— |
|
|
|
0.00 |
% |
Total |
|
$ |
87,034 |
|
|
|
4.78 |
% |
|
$ |
154,971 |
|
|
|
2.47 |
% |
|
$ |
241,140 |
|
|
|
2.62 |
% |
|
$ |
1,033,656 |
|
|
|
2.27 |
% |
|
|
Maturity as of December 31, 2023 |
|
|||||||||||||||||||||||||||||
|
|
Due in One Year or Less |
|
|
Due from One to Five Years |
|
|
Due from Five to Ten Years |
|
|
Due after Ten Years |
|
||||||||||||||||||||
|
|
Amortized |
|
|
Weighted |
|
|
Amortized |
|
|
Weighted |
|
|
Amortized |
|
|
Weighted |
|
|
Amortized |
|
|
Weighted |
|
||||||||
Held-to-maturity |
|
|
|
|
|
|
|
|
|
|
|
|
|
|
|
|
|
|
|
|
|
|
|
|
||||||||
Obligations of states, |
|
$ |
550 |
|
|
|
2.75 |
% |
|
$ |
607 |
|
|
|
2.75 |
% |
|
$ |
— |
|
|
|
0.00 |
% |
|
$ |
— |
|
|
|
0.00 |
% |
Total |
|
$ |
550 |
|
|
|
2.75 |
% |
|
$ |
607 |
|
|
|
2.75 |
% |
|
$ |
— |
|
|
|
0.00 |
% |
|
$ |
— |
|
|
|
0.00 |
% |
(1) The weighted average yields are based on amortized cost.
Total non-taxable securities classified as obligations of states, municipalities and political subdivisions were $55.7 million at December 31, 2023, an increase of $11.9 million from December 31, 2022.
There were no holdings of securities of any one issuer, other than U.S. government-sponsored entities and agencies, with total outstanding balances greater than 10% of our stockholders’ equity as of December 31, 2023 and 2022.
Restricted stock
As a member of the Federal Home Loan Bank system, Byline Bank is required to maintain an investment in the capital stock of the FHLB. No market exists for this stock, and it has no quoted market value. The stock is redeemable at par by the FHLB and is, therefore, carried at cost. In addition, Byline Bank owns stock of Bankers’ Bank, which is redeemable at par and carried at cost. As of December 31, 2023 and 2022, we held $16.3 million and $28.2 million, respectively, in FHLB and Bankers’ Bank stock. We evaluate impairment of our investment in FHLB and Bankers’ Bank based on the ultimate recoverability of the par value rather than by recognizing temporary declines in value. We did not identify any indicators of impairment of FHLB and Bankers’ Bank stock as of December 31, 2023 and 2022.
Loan and lease portfolio
Lending-related income is the most important component of our net interest income and is the main driver of the results of our operations. Total loans and leases at December 31, 2023 and 2022 were $6.7 billion and $5.4 billion, respectively, an increase of $1.3 billion or 23.3%. The growth in the originated loan and lease portfolio was primarily driven by increases in commercial and industrial loans and leases, commercial real estate, and leasing financing receivables, as well as renewals of acquired loans that are now reflected with originated loans. Purchased credit deteriorated loans and acquired non-credit-deteriorated loans and leases were $917.3 million at December 31, 2023, an increase of $626.7 million, compared to $290.5 million at December 31, 2022. The increase in the purchased credit deteriorated and acquired non-credit-deteriorated loan and lease portfolio was driven by loans acquired in the Inland acquisition.
49
We strive to maintain a relatively diversified loan and lease portfolio to help reduce the risk inherent in concentration in certain types of collateral. Our exposure to certain industries as of December 31, 2023 represents the following percentages of the portfolio: 36.5% real estate, 12.5% manufacturing, 7.7% finance and insurance, 6.4% wholesale trade, 5.0% retail trade, and all other industries represent less than 5% of the portfolio or 31.9% of the total loan and lease portfolio. As of December 31, 2023, the loan portfolio included $422.8 million of unguaranteed SBA 7(a) and USDA loans with exposure to the following top three industries: 16.8% retail trade, 14.0% accommodation and food services and 11.6% manufacturing. The following table shows our allocation of originated, purchased credit deteriorated, and acquired non-credit-deteriorated loans and leases as of the dates presented (dollars in thousands):
|
|
December 31, |
|
|||||||||||||
|
|
2023 |
|
|
2022 |
|
||||||||||
|
|
Amount |
|
|
% of Total |
|
|
Amount |
|
|
% of Total |
|
||||
Originated loans and leases |
|
|
|
|
|
|
|
|
|
|
|
|
||||
Commercial real estate |
|
$ |
1,907,029 |
|
|
|
28.5 |
% |
|
$ |
1,712,152 |
|
|
|
31.6 |
% |
Residential real estate |
|
|
465,133 |
|
|
|
7.0 |
% |
|
|
426,226 |
|
|
|
7.9 |
% |
Construction, land development, and other land |
|
|
415,162 |
|
|
|
6.2 |
% |
|
|
438,617 |
|
|
|
8.1 |
% |
Commercial and industrial |
|
|
2,311,048 |
|
|
|
34.6 |
% |
|
|
2,029,855 |
|
|
|
37.5 |
% |
Paycheck Protection Program |
|
|
515 |
|
|
|
0.0 |
% |
|
|
761 |
|
|
|
0.0 |
% |
Installment and other |
|
|
2,919 |
|
|
|
0.0 |
% |
|
|
1,410 |
|
|
|
0.0 |
% |
Leasing financing receivables |
|
|
665,239 |
|
|
|
10.0 |
% |
|
|
521,689 |
|
|
|
9.6 |
% |
Total originated loans and leases |
|
$ |
5,767,045 |
|
|
|
86.3 |
% |
|
$ |
5,130,710 |
|
|
|
94.7 |
% |
Purchased credit deteriorated loans |
|
|
|
|
|
|
|
|
|
|
|
|
||||
Commercial real estate |
|
$ |
137,807 |
|
|
|
2.1 |
% |
|
$ |
45,143 |
|
|
|
0.8 |
% |
Residential real estate |
|
|
42,510 |
|
|
|
0.6 |
% |
|
|
32,228 |
|
|
|
0.6 |
% |
Construction, land development, and other land |
|
|
25,331 |
|
|
|
0.4 |
% |
|
|
372 |
|
|
|
0.0 |
% |
Commercial and industrial |
|
|
19,460 |
|
|
|
0.3 |
% |
|
|
2,192 |
|
|
|
0.0 |
% |
Installment and other |
|
|
125 |
|
|
|
0.0 |
% |
|
|
140 |
|
|
|
0.0 |
% |
Total purchased credit deteriorated loans |
|
$ |
225,233 |
|
|
|
3.4 |
% |
|
$ |
80,075 |
|
|
|
1.4 |
% |
Acquired non-credit-deteriorated loans and leases |
|
|
|
|
|
|
|
|
|
|
|
|
||||
Commercial real estate |
|
$ |
275,476 |
|
|
|
4.1 |
% |
|
$ |
152,193 |
|
|
|
2.8 |
% |
Residential real estate |
|
|
211,887 |
|
|
|
3.2 |
% |
|
|
31,508 |
|
|
|
0.6 |
% |
Construction, land development, and other land |
|
|
86,344 |
|
|
|
1.3 |
% |
|
|
— |
|
|
|
0.0 |
% |
Commercial and industrial |
|
|
117,538 |
|
|
|
1.7 |
% |
|
|
24,266 |
|
|
|
0.5 |
% |
Installment and other |
|
|
156 |
|
|
|
0.0 |
% |
|
|
209 |
|
|
|
0.0 |
% |
Leasing financing receivables |
|
|
627 |
|
|
|
0.0 |
% |
|
|
2,297 |
|
|
|
0.0 |
% |
Total acquired non-credit-deteriorated loans and leases |
|
$ |
692,028 |
|
|
|
10.3 |
% |
|
$ |
210,473 |
|
|
|
3.9 |
% |
Total loans and leases |
|
$ |
6,684,306 |
|
|
|
100.0 |
% |
|
$ |
5,421,258 |
|
|
|
100.0 |
% |
Allowance for credit losses - loans and leases |
|
$ |
(101,686 |
) |
|
|
|
|
|
(81,924 |
) |
|
|
|
||
Total loans and leases, net of allowance for credit losses - loans and leases |
|
$ |
6,582,620 |
|
|
|
|
|
$ |
5,339,334 |
|
|
|
|
||
Loans collateralized by real estate comprised 53.4% and 52.4% of the loan and lease portfolio at December 31, 2023 and 2022, respectively. Commercial real estate loans comprised the largest portion of the real estate loan portfolio as of December 31, 2023 and 2022, and totaled $2.3 billion, or 65.0%, of real estate loans and 34.7% of the total loan and lease portfolio at December 31, 2023. At December 31, 2022, commercial real estate loans totaled $1.9 billion and comprised 67.3% of real estate loans and 35.2% of the total loan and lease portfolio. Purchased credit deteriorated commercial real estate loans increased from $45.1 million as of December 31, 2022 to $137.8 million as of December 31, 2023, as a result of the Inland acquisition. At December 31, 2023 and 2022, commercial real estate loans, including both owner-occupied and non-owner occupied, as a percentage of total capital were 299.6% and 313.4%, respectively. Non-owner occupied commercial real estate loans were $1.0 billion and $736.7 million, or 95.9% and 86.6% of total capital, at December 31, 2023 and 2022, respectively.
Residential real estate loans totaled $719.5 million at December 31, 2023 compared to $490.0 million at December 31, 2022, an increase of $229.6 million or 46.9%. The residential real estate loan portfolio comprised 20.2% and 17.3% of real estate loans as of December 31, 2023 and 2022, respectively, and 10.8% and 9.1% of total loans and leases at December 31, 2023 and 2022, respectively. Purchased credit deteriorated residential real estate loans increased from $32.2 million as of December 31, 2022 to $42.5 million as of December 31, 2023, or 31.9%. Multifamily real estate loans were $399.3 million and $303.0 million, or 36.8% and 35.7% of total capital, at December 31, 2023 and December 31, 2022, respectively.
Construction, land development and other land loans totaled $526.8 million at December 31, 2023 compared to $439.0 million at December 31, 2022, an increase of $87.8 million or 20.0%. The construction, land development and other land loan portfolio comprised 14.8% and 15.5% of real estate loans as of December 31, 2023 and 2022, respectively, and 7.9% and 8.1% of the total loan and lease portfolio as of December 31, 2023 and 2022, respectively. The construction, land development and other land loan portfolio was 48.3% and 51.2% of total capital, at December 31, 2023 and December 31, 2022, respectively.
Commercial and industrial loans totaled $2.4 billion and $2.1 billion at December 31, 2023 and 2022, respectively, an increase of $391.7 million, or 19.1%, primarily due to the acquisition and organic growth. The commercial and industrial loan portfolio comprised 36.6% and 37.9% of the total loan and lease portfolio as of December 31, 2023 and 2022, respectively.
50
Lease financing receivables comprised 10.0% and 9.7% of the loan and lease portfolio as of December 31, 2023 and 2022, respectively. Total lease financing receivables were $665.9 million and $524.0 million at December 31, 2023 and 2022, respectively, an increase of $141.9 million, or 27.1%.
Loan and lease portfolio maturities and interest rate sensitivity
The following table shows our loan and lease portfolio by scheduled maturity at December 31, 2023 (dollars in thousands):
|
|
Due in One Year or Less |
|
|
Due after One Year |
|
|
Due after Five Years |
|
|
Due after Fifteen Years |
|
|
|
|
|||||||||||||||||||||
|
|
Fixed |
|
|
Floating |
|
|
Fixed |
|
|
Floating |
|
|
Fixed |
|
|
Floating |
|
|
Fixed |
|
|
Floating |
|
|
Total |
|
|||||||||
Originated loans and leases |
|
|
|
|
|
|
|
|
|
|
|
|
|
|
|
|
|
|
|
|
|
|
|
|
|
|
|
|||||||||
Commercial real estate |
|
$ |
108,341 |
|
|
$ |
199,445 |
|
|
$ |
728,047 |
|
|
$ |
322,199 |
|
|
$ |
253,912 |
|
|
$ |
129,161 |
|
|
$ |
9,341 |
|
|
$ |
156,583 |
|
|
$ |
1,907,029 |
|
Residential real estate |
|
|
13,810 |
|
|
|
34,762 |
|
|
|
155,612 |
|
|
|
81,806 |
|
|
|
25,686 |
|
|
|
90,274 |
|
|
|
60,422 |
|
|
|
2,761 |
|
|
|
465,133 |
|
Construction, land |
|
|
625 |
|
|
|
156,773 |
|
|
|
43,057 |
|
|
|
190,130 |
|
|
|
20,404 |
|
|
|
4,021 |
|
|
|
152 |
|
|
|
— |
|
|
|
415,162 |
|
Commercial and industrial |
|
|
34,136 |
|
|
|
454,177 |
|
|
|
352,251 |
|
|
|
1,029,222 |
|
|
|
148,811 |
|
|
|
251,485 |
|
|
|
30,918 |
|
|
|
10,048 |
|
|
|
2,311,048 |
|
Paycheck Protection Program |
|
|
— |
|
|
|
— |
|
|
|
515 |
|
|
|
— |
|
|
|
— |
|
|
|
— |
|
|
|
— |
|
|
|
— |
|
|
|
515 |
|
Installment and other |
|
|
244 |
|
|
|
— |
|
|
|
840 |
|
|
|
1,633 |
|
|
|
202 |
|
|
|
— |
|
|
|
— |
|
|
|
— |
|
|
|
2,919 |
|
Leasing financing receivables |
|
|
16,777 |
|
|
|
— |
|
|
|
586,846 |
|
|
|
— |
|
|
|
61,616 |
|
|
|
— |
|
|
|
— |
|
|
|
— |
|
|
|
665,239 |
|
Total originated loans and |
|
$ |
173,933 |
|
|
$ |
845,157 |
|
|
$ |
1,867,168 |
|
|
$ |
1,624,990 |
|
|
$ |
510,631 |
|
|
$ |
474,941 |
|
|
$ |
100,833 |
|
|
$ |
169,392 |
|
|
$ |
5,767,045 |
|
Purchased credit deteriorated |
|
|
|
|
|
|
|
|
|
|
|
|
|
|
|
|
|
|
|
|
|
|
|
|
|
|
|
|||||||||
Commercial real estate |
|
$ |
41,339 |
|
|
$ |
17,623 |
|
|
$ |
38,187 |
|
|
$ |
25,107 |
|
|
$ |
4,569 |
|
|
$ |
10,721 |
|
|
$ |
129 |
|
|
$ |
132 |
|
|
$ |
137,807 |
|
Residential real estate |
|
|
8,591 |
|
|
|
242 |
|
|
|
17,482 |
|
|
|
582 |
|
|
|
6,192 |
|
|
|
414 |
|
|
|
5,610 |
|
|
|
3,397 |
|
|
|
42,510 |
|
Construction, land |
|
|
— |
|
|
|
25,318 |
|
|
|
13 |
|
|
|
— |
|
|
|
— |
|
|
|
— |
|
|
|
— |
|
|
|
— |
|
|
|
25,331 |
|
Commercial and industrial |
|
|
34 |
|
|
|
1,473 |
|
|
|
8,452 |
|
|
|
2,837 |
|
|
|
— |
|
|
|
6,664 |
|
|
|
— |
|
|
|
— |
|
|
|
19,460 |
|
Installment and other |
|
|
5 |
|
|
|
— |
|
|
|
20 |
|
|
|
— |
|
|
|
100 |
|
|
|
— |
|
|
|
— |
|
|
|
— |
|
|
|
125 |
|
Total purchased credit |
|
$ |
49,969 |
|
|
$ |
44,656 |
|
|
$ |
64,154 |
|
|
$ |
28,526 |
|
|
$ |
10,861 |
|
|
$ |
17,799 |
|
|
$ |
5,739 |
|
|
$ |
3,529 |
|
|
$ |
225,233 |
|
Acquired non-credit- |
|
|
|
|
|
|
|
|
|
|
|
|
|
|
|
|
|
|
|
|
|
|
|
|
|
|
|
|||||||||
Commercial real estate |
|
$ |
22,317 |
|
|
$ |
14,937 |
|
|
$ |
153,812 |
|
|
$ |
27,610 |
|
|
$ |
15,381 |
|
|
$ |
23,000 |
|
|
$ |
2,495 |
|
|
$ |
15,924 |
|
|
$ |
275,476 |
|
Residential real estate |
|
|
5,201 |
|
|
|
3,709 |
|
|
|
48,286 |
|
|
|
12,489 |
|
|
|
24,293 |
|
|
|
9,958 |
|
|
|
6,022 |
|
|
|
101,929 |
|
|
|
211,887 |
|
Construction, land |
|
|
— |
|
|
|
26,065 |
|
|
|
10,296 |
|
|
|
33,892 |
|
|
|
— |
|
|
|
— |
|
|
|
16,091 |
|
|
|
— |
|
|
|
86,344 |
|
Commercial and industrial |
|
|
1,325 |
|
|
|
6,928 |
|
|
|
36,685 |
|
|
|
10,458 |
|
|
|
59,379 |
|
|
|
2,566 |
|
|
|
— |
|
|
|
197 |
|
|
|
117,538 |
|
Installment and other |
|
|
32 |
|
|
|
— |
|
|
|
124 |
|
|
|
— |
|
|
|
— |
|
|
|
— |
|
|
|
— |
|
|
|
— |
|
|
|
156 |
|
Leasing financing receivables |
|
|
399 |
|
|
|
— |
|
|
|
228 |
|
|
|
— |
|
|
|
— |
|
|
|
— |
|
|
|
— |
|
|
|
— |
|
|
|
627 |
|
Total acquired non-credit- |
|
$ |
29,274 |
|
|
$ |
51,639 |
|
|
$ |
249,431 |
|
|
$ |
84,449 |
|
|
$ |
99,053 |
|
|
$ |
35,524 |
|
|
$ |
24,608 |
|
|
$ |
118,050 |
|
|
$ |
692,028 |
|
Total loans and leases |
|
$ |
253,176 |
|
|
$ |
941,452 |
|
|
$ |
2,180,753 |
|
|
$ |
1,737,965 |
|
|
$ |
620,545 |
|
|
$ |
528,264 |
|
|
$ |
131,180 |
|
|
$ |
290,971 |
|
|
$ |
6,684,306 |
|
As of December 31, 2023, 47.7% of the loan and lease portfolio bears interest at fixed rates and 52.3% at floating rates. The expected life of our loan portfolio will differ from contractual maturities because borrowers may have the right to curtail or prepay their loans with or without penalties. Because a portion of the portfolio is accounted for under ASC 326, the carrying value is significantly affected by estimates and it is impracticable to allocate scheduled payments for those loans based on those estimates. Consequently, the tables presented include information limited to contractual maturities of the underlying loans.
51
Allowance for credit losses - loans and leases
The ACL is determined by us on a quarterly basis, although we are engaged in monitoring the appropriate level of the allowance on a more frequent basis. The ACL reflects management’s estimate of current expected credit losses inherent in the loan and lease portfolios. The computation includes elements of judgment and high levels of subjectivity.
Factors considered by us include, but are not limited to, actual loss experience, peer loss experience, changes in size and risk profile of the portfolio, identification of individual problem loan and lease situations that may affect a borrower’s ability to repay, application of a reasonable and supportable forecast, and evaluation of the prevailing economic conditions. Changes in conditions may necessitate revision of the estimate in future periods.
We assess the ACL based on three categories: (i) originated loans and leases, (ii) acquired non-credit-deteriorated loans and leases, and (iii) purchased credit deteriorated loans.
Total ACL was $101.7 million at December 31, 2023 compared to $81.9 million at December 31, 2022, an increase of $19.8 million, or 24.1%. The increase was primarily due to acquired loans as a result of the Inland acquisition and an increase in specific reserves to loans individually evaluated for impairment. Total ACL to total loans and leases held for investment, net before ACL was 1.52% and 1.51% of total loans and leases at December 31, 2023 and 2022, respectively. As of December 31, 2023, approximately $34.4 million of the ACL was allocated to unguaranteed loans in our government lending portfolio.
52
The following table presents an analysis of the allowance for credit losses - loans and leases for the periods presented (dollars in thousands):
|
|
Commercial |
|
|
Residential |
|
|
Construction, |
|
|
Commercial |
|
|
Installment |
|
|
Lease |
|
|
Total |
|
|||||||
Balance at December 31, 2022 |
|
$ |
26,061 |
|
|
$ |
3,140 |
|
|
$ |
3,134 |
|
|
$ |
41,889 |
|
|
$ |
24 |
|
|
$ |
7,676 |
|
|
$ |
81,924 |
|
Adjustment for acquired PCD loans |
|
|
8,230 |
|
|
|
660 |
|
|
|
97 |
|
|
|
1,609 |
|
|
|
— |
|
|
|
— |
|
|
|
10,596 |
|
Provision for PCD loans |
|
|
(1,319 |
) |
|
|
(432 |
) |
|
|
101 |
|
|
|
414 |
|
|
|
(1 |
) |
|
|
— |
|
|
|
(1,237 |
) |
Provision for acquired |
|
|
(1,666 |
) |
|
|
340 |
|
|
|
606 |
|
|
|
181 |
|
|
|
1 |
|
|
|
(31 |
) |
|
|
(569 |
) |
Provision for originated loans |
|
|
10,222 |
|
|
|
(310 |
) |
|
|
(1,032 |
) |
|
|
22,807 |
|
|
|
11 |
|
|
|
2,328 |
|
|
|
34,026 |
|
Total provision |
|
$ |
7,237 |
|
|
$ |
(402 |
) |
|
$ |
(325 |
) |
|
$ |
23,402 |
|
|
$ |
11 |
|
|
$ |
2,297 |
|
|
$ |
32,220 |
|
Charge-offs for PCD |
|
|
(1,229 |
) |
|
|
— |
|
|
|
— |
|
|
|
— |
|
|
|
— |
|
|
|
— |
|
|
|
(1,229 |
) |
Charge-offs for acquired non-credit |
|
|
— |
|
|
|
— |
|
|
|
— |
|
|
|
— |
|
|
|
— |
|
|
|
— |
|
|
|
— |
|
Charge-offs for originated loans |
|
|
(8,500 |
) |
|
|
(21 |
) |
|
|
— |
|
|
|
(15,411 |
) |
|
|
(3 |
) |
|
|
(2,437 |
) |
|
|
(26,372 |
) |
Total charge-offs |
|
$ |
(9,729 |
) |
|
$ |
(21 |
) |
|
$ |
— |
|
|
$ |
(15,411 |
) |
|
$ |
(3 |
) |
|
$ |
(2,437 |
) |
|
$ |
(27,601 |
) |
Recoveries for PCD |
|
|
— |
|
|
|
— |
|
|
|
— |
|
|
|
— |
|
|
|
— |
|
|
|
— |
|
|
|
— |
|
Recoveries for acquired non-credit |
|
|
— |
|
|
|
— |
|
|
|
— |
|
|
|
— |
|
|
|
— |
|
|
|
— |
|
|
|
— |
|
Recoveries for originated loans |
|
|
1,438 |
|
|
|
118 |
|
|
|
— |
|
|
|
2,293 |
|
|
|
4 |
|
|
|
694 |
|
|
|
4,547 |
|
Total recoveries |
|
$ |
1,438 |
|
|
$ |
118 |
|
|
$ |
— |
|
|
$ |
2,293 |
|
|
$ |
4 |
|
|
$ |
694 |
|
|
$ |
4,547 |
|
Net charge-offs (recoveries) |
|
|
(8,291 |
) |
|
|
97 |
|
|
|
— |
|
|
|
(13,118 |
) |
|
|
1 |
|
|
|
(1,743 |
) |
|
|
(23,054 |
) |
Balance at December 31, 2023 |
|
$ |
33,237 |
|
|
$ |
3,495 |
|
|
$ |
2,906 |
|
|
$ |
53,782 |
|
|
$ |
36 |
|
|
$ |
8,230 |
|
|
$ |
101,686 |
|
Ending ACL balances |
|
|
|
|
|
|
|
|
|
|
|
|
|
|
|
|
|
|
|
|
|
|||||||
PCD loans |
|
$ |
6,833 |
|
|
$ |
902 |
|
|
$ |
211 |
|
|
$ |
2,069 |
|
|
$ |
1 |
|
|
$ |
— |
|
|
$ |
10,016 |
|
Acquired non-credit-deteriorated loans |
|
|
2,070 |
|
|
|
636 |
|
|
|
607 |
|
|
|
1,410 |
|
|
|
2 |
|
|
|
3 |
|
|
|
4,728 |
|
Originated loans |
|
|
24,334 |
|
|
|
1,957 |
|
|
|
2,088 |
|
|
|
50,303 |
|
|
|
33 |
|
|
|
8,227 |
|
|
|
86,942 |
|
Balance at December 31, 2023 |
|
$ |
33,237 |
|
|
$ |
3,495 |
|
|
$ |
2,906 |
|
|
$ |
53,782 |
|
|
$ |
36 |
|
|
$ |
8,230 |
|
|
$ |
101,686 |
|
Loans individually |
|
$ |
12,361 |
|
|
$ |
— |
|
|
$ |
— |
|
|
$ |
14,880 |
|
|
$ |
— |
|
|
$ |
— |
|
|
$ |
27,241 |
|
Loans collectively |
|
|
20,876 |
|
|
|
3,495 |
|
|
|
2,906 |
|
|
|
38,902 |
|
|
|
36 |
|
|
|
8,230 |
|
|
|
74,445 |
|
Balance at December 31, 2023 |
|
$ |
33,237 |
|
|
$ |
3,495 |
|
|
$ |
2,906 |
|
|
$ |
53,782 |
|
|
$ |
36 |
|
|
$ |
8,230 |
|
|
$ |
101,686 |
|
Loans and leases ending balances |
|
|
|
|
|
|
|
|
|
|
|
|
|
|
|
|
|
|
|
|
|
|||||||
Loans individually |
|
$ |
64,339 |
|
|
$ |
3,593.00 |
|
|
$ |
813.00 |
|
|
$ |
44,749 |
|
|
$ |
— |
|
|
$ |
— |
|
|
$ |
113,494 |
|
Loans collectively |
|
|
2,255,973 |
|
|
|
715,937 |
|
|
|
526,024 |
|
|
|
2,403,812 |
|
|
|
3,200 |
|
|
|
665,866 |
|
|
|
6,570,812 |
|
Total loans at December 31, 2023, |
|
$ |
2,320,312 |
|
|
$ |
719,530 |
|
|
$ |
526,837 |
|
|
$ |
2,448,561 |
|
|
$ |
3,200 |
|
|
$ |
665,866 |
|
|
$ |
6,684,306 |
|
Ratio of net charge-offs to average |
|
|
|
|
|
|
|
|
|
|
|
|
|
|
|
|
|
|
|
|
|
|||||||
PCD loans |
|
|
0.02 |
% |
|
|
0.00 |
% |
|
|
0.00 |
% |
|
|
0.00 |
% |
|
|
0.00 |
% |
|
|
0.00 |
% |
|
|
0.02 |
% |
Acquired non-credit-deteriorated loans |
|
|
0.00 |
% |
|
|
0.00 |
% |
|
|
0.00 |
% |
|
|
0.00 |
% |
|
|
0.00 |
% |
|
|
0.00 |
% |
|
|
0.00 |
% |
Originated loans |
|
|
0.12 |
% |
|
|
0.00 |
% |
|
|
0.00 |
% |
|
|
0.22 |
% |
|
|
0.00 |
% |
|
|
0.02 |
% |
|
|
0.36 |
% |
Loans ending balance as a |
|
|
|
|
|
|
|
|
|
|
|
|
|
|
|
|
|
|
|
|
|
|||||||
Loans individually |
|
|
0.96 |
% |
|
|
0.05 |
% |
|
|
0.01 |
% |
|
|
0.67 |
% |
|
|
0.00 |
% |
|
|
0.00 |
% |
|
|
1.70 |
% |
Loans collectively |
|
|
33.75 |
% |
|
|
10.70 |
% |
|
|
7.87 |
% |
|
|
35.96 |
% |
|
|
0.05 |
% |
|
|
9.96 |
% |
|
|
98.30 |
% |
Total |
|
|
34.71 |
% |
|
|
10.75 |
% |
|
|
7.88 |
% |
|
|
36.63 |
% |
|
|
0.05 |
% |
|
|
9.96 |
% |
|
|
100.00 |
% |
53
|
|
Commercial |
|
|
Residential |
|
|
Construction, |
|
|
Commercial |
|
|
Installment |
|
|
Lease |
|
|
Total |
|
|||||||
Balance at December 31, 2021 |
|
$ |
16,918 |
|
|
$ |
1,628 |
|
|
$ |
522 |
|
|
$ |
33,129 |
|
|
$ |
9 |
|
|
$ |
2,806 |
|
|
$ |
55,012 |
|
Impact of Adopting CECL - PCD |
|
|
(303 |
) |
|
|
353 |
|
|
|
120 |
|
|
|
(207 |
) |
|
|
— |
|
|
|
— |
|
|
|
(37 |
) |
Impact of Adopting CECL - |
|
|
1,909 |
|
|
|
124 |
|
|
|
— |
|
|
|
(279 |
) |
|
|
1 |
|
|
|
39 |
|
|
|
1,794 |
|
Impact of Adopting CECL - Originated |
|
|
4,761 |
|
|
|
570 |
|
|
|
1,071 |
|
|
|
1,739 |
|
|
|
8 |
|
|
|
2,262 |
|
|
|
10,411 |
|
Total impact Day 1 CECL adoption |
|
$ |
6,367 |
|
|
$ |
1,047 |
|
|
$ |
1,191 |
|
|
$ |
1,253 |
|
|
$ |
9 |
|
|
$ |
2,301 |
|
|
$ |
12,168 |
|
Provision for PCD loans |
|
|
(753 |
) |
|
|
(495 |
) |
|
|
(56 |
) |
|
|
(281 |
) |
|
|
(18 |
) |
|
|
— |
|
|
|
(1,603 |
) |
Provision for acquired |
|
|
(1,517 |
) |
|
|
321 |
|
|
|
1 |
|
|
|
(1,243 |
) |
|
|
(1 |
) |
|
|
(282 |
) |
|
|
(2,721 |
) |
Provision for originated loans |
|
|
7,522 |
|
|
|
1,082 |
|
|
|
1,530 |
|
|
|
13,526 |
|
|
|
10 |
|
|
|
3,328 |
|
|
|
26,998 |
|
Total provision |
|
$ |
5,252 |
|
|
$ |
908 |
|
|
$ |
1,475 |
|
|
$ |
12,002 |
|
|
$ |
(9 |
) |
|
$ |
3,046 |
|
|
$ |
22,674 |
|
Charge-offs for PCD |
|
|
(195 |
) |
|
|
(945 |
) |
|
|
(94 |
) |
|
|
(7 |
) |
|
|
(4 |
) |
|
|
— |
|
|
|
(1,245 |
) |
Charge-offs for acquired non-credit |
|
|
(6 |
) |
|
|
(174 |
) |
|
|
— |
|
|
|
(72 |
) |
|
|
— |
|
|
|
(28 |
) |
|
|
(280 |
) |
Charge-offs for originated loans |
|
|
(3,634 |
) |
|
|
(90 |
) |
|
|
— |
|
|
|
(5,299 |
) |
|
|
(3 |
) |
|
|
(1,444 |
) |
|
|
(10,470 |
) |
Total charge-offs |
|
$ |
(3,835 |
) |
|
$ |
(1,209 |
) |
|
$ |
(94 |
) |
|
$ |
(5,378 |
) |
|
$ |
(7 |
) |
|
$ |
(1,472 |
) |
|
$ |
(11,995 |
) |
Recoveries for PCD |
|
|
592 |
|
|
|
755 |
|
|
|
40 |
|
|
|
177 |
|
|
|
22 |
|
|
|
— |
|
|
|
1,586 |
|
Recoveries for acquired non-credit |
|
|
— |
|
|
|
— |
|
|
|
— |
|
|
|
— |
|
|
|
— |
|
|
|
257 |
|
|
|
257 |
|
Recoveries for originated loans |
|
|
768 |
|
|
|
11 |
|
|
|
— |
|
|
|
705 |
|
|
|
— |
|
|
|
738 |
|
|
|
2,222 |
|
Total recoveries |
|
$ |
1,360 |
|
|
$ |
766 |
|
|
$ |
40 |
|
|
$ |
882 |
|
|
$ |
22 |
|
|
$ |
995 |
|
|
$ |
4,065 |
|
Net charge-offs (recoveries) |
|
|
(2,475 |
) |
|
|
(443 |
) |
|
|
(54 |
) |
|
|
(4,496 |
) |
|
|
15 |
|
|
|
(477 |
) |
|
|
(7,930 |
) |
Balance at December 31, 2022 |
|
$ |
26,062 |
|
|
$ |
3,140 |
|
|
$ |
3,134 |
|
|
$ |
41,888 |
|
|
$ |
24 |
|
|
$ |
7,676 |
|
|
$ |
81,924 |
|
Ending ACL Balances |
|
|
|
|
|
|
|
|
|
|
|
|
|
|
|
|
|
|
|
|
|
|||||||
PCD loans |
|
$ |
1,151 |
|
|
$ |
674 |
|
|
$ |
13 |
|
|
$ |
46 |
|
|
$ |
2 |
|
|
$ |
— |
|
|
$ |
1,886 |
|
Acquired non-credit-deteriorated loans |
|
|
3,736 |
|
|
|
296 |
|
|
|
1 |
|
|
|
1,229 |
|
|
|
1 |
|
|
|
34 |
|
|
|
5,297 |
|
Originated loans |
|
|
21,175 |
|
|
|
2,170 |
|
|
|
3,120 |
|
|
|
40,613 |
|
|
|
21 |
|
|
|
7,642 |
|
|
|
74,741 |
|
Balance at December 31, 2022 |
|
$ |
26,062 |
|
|
$ |
3,140 |
|
|
$ |
3,134 |
|
|
$ |
41,888 |
|
|
$ |
24 |
|
|
$ |
7,676 |
|
|
$ |
81,924 |
|
Loans individually |
|
$ |
6,102 |
|
|
$ |
— |
|
|
$ |
265 |
|
|
$ |
8,971 |
|
|
$ |
— |
|
|
$ |
— |
|
|
$ |
15,338 |
|
Loans collectively |
|
|
19,960 |
|
|
|
3,140 |
|
|
|
2,869 |
|
|
|
32,917 |
|
|
|
24 |
|
|
|
7,676 |
|
|
|
66,586 |
|
Balance at December 31, 2022 |
|
$ |
26,062 |
|
|
$ |
3,140 |
|
|
$ |
3,134 |
|
|
$ |
41,888 |
|
|
$ |
24 |
|
|
$ |
7,676 |
|
|
$ |
81,924 |
|
Loans and leases ending balances |
|
|
|
|
|
|
|
|
|
|
|
|
|
|
|
|
|
|
|
|
|
|||||||
Loans individually |
|
$ |
37,959 |
|
|
$ |
879 |
|
|
$ |
5,541 |
|
|
$ |
47,846 |
|
|
$ |
— |
|
|
$ |
— |
|
|
$ |
92,225 |
|
Loans collectively |
|
|
1,871,529 |
|
|
|
489,083 |
|
|
|
433,448 |
|
|
|
2,009,228 |
|
|
|
1,759 |
|
|
|
523,986 |
|
|
|
5,329,033 |
|
Total loans at December 31, 2022, |
|
$ |
1,909,488 |
|
|
$ |
489,962 |
|
|
$ |
438,989 |
|
|
$ |
2,057,074 |
|
|
$ |
1,759 |
|
|
$ |
523,986 |
|
|
$ |
5,421,258 |
|
Ratio of net charge-offs to average |
|
|
|
|
|
|
|
|
|
|
|
|
|
|
|
|
|
|
|
|
|
|||||||
PCD loans |
|
|
(0.01 |
)% |
|
|
0.00 |
% |
|
|
0.00 |
% |
|
|
0.00 |
% |
|
|
0.00 |
% |
|
|
0.00 |
% |
|
|
(0.01 |
)% |
Acquired non-credit-deteriorated loans |
|
|
0.00 |
% |
|
|
0.00 |
% |
|
|
0.00 |
% |
|
|
0.00 |
% |
|
|
0.00 |
% |
|
|
0.00 |
% |
|
|
0.00 |
% |
Originated loans |
|
|
0.06 |
% |
|
|
0.00 |
% |
|
|
0.00 |
% |
|
|
0.09 |
% |
|
|
0.00 |
% |
|
|
0.01 |
% |
|
|
0.16 |
% |
Loans ending balance as a |
|
|
|
|
|
|
|
|
|
|
|
|
|
|
|
|
|
|
|
|
|
|||||||
Loans individually |
|
|
0.70 |
% |
|
|
0.02 |
% |
|
|
0.10 |
% |
|
|
0.88 |
% |
|
|
0.00 |
% |
|
|
0.00 |
% |
|
|
1.70 |
% |
Loans collectively |
|
|
34.52 |
% |
|
|
9.01 |
% |
|
|
8.00 |
% |
|
|
37.06 |
% |
|
|
0.03 |
% |
|
|
9.67 |
% |
|
|
98.30 |
% |
Total |
|
|
35.22 |
% |
|
|
9.03 |
% |
|
|
8.10 |
% |
|
|
37.94 |
% |
|
|
0.03 |
% |
|
|
9.67 |
% |
|
|
100.00 |
% |
54
Non-performing assets
Non-performing loans and leases include loans and leases 90 days past due and still accruing and loans and leases accounted for on a non-accrual basis. Non-performing assets consist of non-performing loans and leases plus other real estate owned. Non-accrual loans and leases as December 31, 2023 and 2022 totaled $64.1 million and $36.0 million, respectively. Non-performing assets consisted of $4.2 million and $2.2 million of U.S. government guaranteed balances at December 31, 2023 and 2022, respectively.
Total OREO decreased from $4.7 million as of December 31, 2022 to $1.2 million at December 31, 2023. The $3.5 million decrease in OREO resulted primarily from sales.
The following table sets forth the amounts of non-performing loans and leases, non-performing assets, and OREO at the dates indicated (dollars in thousands):
|
|
December 31, |
|
|
December 31, |
|
||
Non-performing assets: |
|
|
|
|
|
|
||
Non-accrual loans and leases(1)(2) |
|
$ |
64,107 |
|
|
$ |
36,027 |
|
Past due loans and leases 90 days or more and still |
|
|
— |
|
|
|
— |
|
Total non-performing loans and leases |
|
|
64,107 |
|
|
|
36,027 |
|
Other real estate owned |
|
|
1,200 |
|
|
|
4,717 |
|
Total non-performing assets |
|
$ |
65,307 |
|
|
$ |
40,744 |
|
Total non-performing loans and leases as a percentage of total |
|
|
0.96 |
% |
|
|
0.66 |
% |
Total non-accrual loans and leases as a percentage of total |
|
|
0.96 |
% |
|
|
0.66 |
% |
Total non-performing assets as a percentage of |
|
|
0.74 |
% |
|
|
0.55 |
% |
Allowance for credit losses - loans and leases, as a percentage of |
|
|
158.62 |
% |
|
|
227.40 |
% |
Allowance for credit losses - loans and leases, as a percentage of |
|
|
158.62 |
% |
|
|
227.40 |
% |
|
|
|
|
|
|
|
||
Non-performing loans guaranteed by U.S. |
|
|
|
|
|
|
||
Non-accrual loans guaranteed |
|
$ |
4,154 |
|
|
$ |
2,225 |
|
Past due loans 90 days or more and still accruing interest |
|
|
— |
|
|
|
— |
|
Total non-performing loans guaranteed |
|
$ |
4,154 |
|
|
$ |
2,225 |
|
Total non-performing loans and leases not guaranteed as |
|
|
0.90 |
% |
|
|
0.62 |
% |
Total non-accrual loans and leases not guaranteed as |
|
|
0.62 |
% |
|
|
0.62 |
% |
Total non-performing assets not guaranteed as a |
|
|
0.69 |
% |
|
|
0.52 |
% |
Total non-accrual loans increased by $28.1 million between December 31, 2023 and 2022 primarily due to increases in non-accrual commercial real estate and commercial and industrial loans.
Total accruing loans past due increased from $15.4 million at December 31, 2022 to $36.1 million at December 31, 2023, an increase of $20.7 million, and can be primarily attributed to increases in commercial and industrial loans, residential real estate, commercial real estate and construction, land development, and other land loans. Refer to Note 5 of the notes to our audited consolidated financial statements contained in Item 8 of this report for further information.
55
Deposits
We gather deposits primarily through each of our 47 branch locations in the Chicago metropolitan area and one branch in Wauwatosa, Wisconsin. Through our branch network, online, mobile and other banking channels, we offer a variety of deposit products including demand deposit accounts, interest-bearing products, savings accounts, and certificates of deposit. Small businesses are a significant source of low cost deposits as they value convenience, flexibility and access to local decision makers that are responsive to their needs.
Total deposits at December 31, 2023 were $7.2 billion, representing an increase of $1.5 billion, or 26.0%, compared to $5.7 billion at December 31, 2022. Non-interest-bearing deposits were $1.9 billion, or 26.6% of total deposits, at December 31, 2023, a decrease of $232.8 million, or 10.9%, compared to $2.1 billion at December 31, 2022, or 37.6% of total deposits. Core deposits were 87.0% and 92.7% of total deposits at December 31, 2023 and 2022, respectively.
The following tables show the average balance amounts and the average contractual rates paid on our deposits for the periods indicated (dollars in thousands):
|
|
For the Year Ended |
|
|
For the Year Ended |
|
||||||||||
|
|
Average |
|
|
Average |
|
|
Average |
|
|
Average |
|
||||
Non-interest-bearing demand deposits |
|
$ |
1,965,663 |
|
|
|
0.00 |
% |
|
$ |
2,236,615 |
|
|
|
0.00 |
% |
Interest checking |
|
|
574,335 |
|
|
|
1.60 |
% |
|
|
593,903 |
|
|
|
0.60 |
% |
Money market accounts |
|
|
1,802,675 |
|
|
|
2.99 |
% |
|
|
1,357,371 |
|
|
|
0.77 |
% |
Savings |
|
|
585,820 |
|
|
|
0.15 |
% |
|
|
658,968 |
|
|
|
0.10 |
% |
Time deposits (below $100,000) |
|
|
808,882 |
|
|
|
4.09 |
% |
|
|
315,172 |
|
|
|
0.85 |
% |
Time deposits ($100,000 and above) |
|
|
659,954 |
|
|
|
3.69 |
% |
|
|
376,478 |
|
|
|
0.64 |
% |
Total |
|
$ |
6,397,329 |
|
|
|
1.90 |
% |
|
$ |
5,538,506 |
|
|
|
0.36 |
% |
Our average cost of deposits was 190 basis points during the year ended December 31, 2023 compared to 36 basis points during the year ended December 31, 2022. This increase was primarily attributed to higher rates on interest-bearing deposits as a result of the interest rate environment, an increase in interest bearing deposits and corresponding decrease in non-interest-bearing deposits, both related to the deposit flows and impact of the Inland acquisition. The ratio of our average non-interest-bearing deposits to total average deposits was 30.7% as of December 31, 2023 compared to 40.4% as of December 31, 2022.
There were $480.0 million and $251.5 million of brokered deposits included in Time deposits of below $100,000 at December 31, 2023 and 2022, respectively. Brokered deposits were 6.7% and 4.4% of total deposits as of December 31, 2023 and 2022, respectively. The increase to brokered deposits was due to increases in funding requirements.
The following table shows time deposits by remaining maturity, and includes the uninsured portion related to such time deposits as of December 31, 2023 (dollars in thousands):
|
|
Less than $250,000 |
|
|
$250,000 or Greater |
|
|
Total |
|
|
Uninsured Portion |
|
||||
Three months or less |
|
$ |
524,041 |
|
|
$ |
75,677 |
|
|
$ |
599,718 |
|
|
$ |
19,927 |
|
Over three months through six months |
|
|
402,857 |
|
|
|
104,417 |
|
|
|
507,274 |
|
|
|
35,917 |
|
Over six months through 12 months |
|
|
554,677 |
|
|
|
169,859 |
|
|
|
724,536 |
|
|
|
60,609 |
|
Over 12 months |
|
|
38,507 |
|
|
|
14,917 |
|
|
|
53,424 |
|
|
|
6,417 |
|
Total |
|
$ |
1,520,082 |
|
|
$ |
364,870 |
|
|
$ |
1,884,952 |
|
|
$ |
122,870 |
|
Total estimated uninsured deposits were $1.9 billion and $1.6 billion as of December 31, 2023 and 2022.
56
Borrowed funds
In addition to deposits, we also utilize FHLB advances as a supplementary funding source to finance our operations. The Bank’s advances from the FHLB are collateralized by commercial, residential and multi-family real estate loans, and securities. At December 31, 2023 and 2022, we had maximum available borrowing capacity from the FHLB of $2.8 billion and $1.9 billion, respectively, subject to the availability of collateral.
At December 31, 2023, fixed-rate advances totaled $75.0 million, with an interest rate of 5.45% and maturity of January 2024. Total variable rate advances were $250.0 million at December 31, 2023, with an interest rate of 5.59% that may reset daily and mature in March 2024. The Company’s required investment in FHLB stock is $4.50 for every $100 in advances. Refer to Note 4—Securities in the consolidated financial statements included in Part II, Item 8 of this report, for additional discussion. The Bank’s maximum FHLB borrowing capacity is limited to 35% of total assets.
We have the capacity to borrow funds from the discount window of the FRB. We did not utilize the discount window during 2023 and there were no borrowings outstanding under the FRB discount window line as of December 31, 2023. We pledge loans as collateral for any borrowings under the FRB discount window.
During 2020, we issued $75.0 million in fixed-to-floating subordinated notes that mature on July 1, 2030. The subordinated notes bear a fixed interest rate of 6.00% until July 1, 2025 and a floating interest rate equal to a benchmark rate, which is expected to be three-month Secured Overnight Financing Rate plus 588 basis points thereafter until maturity. The transaction resulted in debt issuance costs of approximately $1.7 million that are being amortized over 10 years.
On January 17, 2024, the Company entered into a Letter Agreement with the Federal Reserve Bank of Chicago that allows the Bank to access the Bank Term Funding Program ("BTFP"). On January 22, 2024, the Company opened an advance of $200.0 million from the FRB as part of the BTFP. Under the terms of the BTFP, the bank pledges securities to FBR Chicago as collateral for available advances. The advance carries a fixed interest rate of 4.91%, and matures on January 22, 2025. Advances under the BTFP are prepayable at any time without a prepayment penalty.
57
The following table sets forth certain information regarding our short-term borrowings at the dates and for the periods indicated (dollars in thousands):
|
|
Year Ended December 31, |
|
|||||||||
|
|
2023 |
|
|
2022 |
|
|
2021 |
|
|||
Federal Reserve Bank discount window borrowing: |
|
|
|
|
|
|
|
|
|
|||
Average balance outstanding |
|
$ |
— |
|
|
$ |
— |
|
|
$ |
— |
|
Maximum outstanding at any month-end period during |
|
|
— |
|
|
|
— |
|
|
|
— |
|
Balance outstanding at end of period |
|
|
— |
|
|
|
— |
|
|
|
— |
|
Weighted average interest rate during period |
|
N/A |
|
|
N/A |
|
|
N/A |
|
|||
Weighted average interest rate at end of period |
|
N/A |
|
|
N/A |
|
|
N/A |
|
|||
Federal Home Loan Bank advances: |
|
|
|
|
|
|
|
|
|
|||
Average balance outstanding |
|
$ |
435,264 |
|
|
$ |
436,618 |
|
|
$ |
227,408 |
|
Maximum outstanding at any month-end period during |
|
|
675,000 |
|
|
|
735,000 |
|
|
|
490,000 |
|
Balance outstanding at end of period |
|
|
325,000 |
|
|
|
625,000 |
|
|
|
490,000 |
|
Weighted average interest rate during period |
|
|
3.48 |
% |
|
|
2.07 |
% |
|
|
0.22 |
% |
Weighted average interest rate at end of period |
|
|
5.56 |
% |
|
|
4.33 |
% |
|
|
0.27 |
% |
Federal funds purchased: |
|
|
|
|
|
|
|
|
|
|||
Average balance outstanding |
|
$ |
685 |
|
|
$ |
630 |
|
|
$ |
— |
|
Maximum outstanding at any month-end period during |
|
|
— |
|
|
|
45,000 |
|
|
|
— |
|
Balance outstanding at end of period |
|
|
— |
|
|
|
— |
|
|
|
— |
|
Weighted average interest rate during period |
|
|
5.30 |
% |
|
|
2.32 |
% |
|
N/A |
|
|
Weighted average interest rate at end of period |
|
N/A |
|
|
N/A |
|
|
N/A |
|
|||
Paycheck Protection Program Liquidity Facility |
|
|
|
|
|
|
|
|
|
|||
Average balance outstanding |
|
$ |
— |
|
|
$ |
— |
|
|
$ |
265,922 |
|
Maximum outstanding at any month-end period during |
|
|
— |
|
|
|
— |
|
|
|
439,066 |
|
Balance outstanding at end of period |
|
|
— |
|
|
|
— |
|
|
|
— |
|
Weighted average interest rate during period |
|
N/A |
|
|
N/A |
|
|
|
0.35 |
% |
||
Weighted average interest rate at end of period |
|
N/A |
|
|
N/A |
|
|
|
— |
|
||
Term loan |
|
|
|
|
|
|
|
|
|
|||
Average balance outstanding |
|
$ |
9,557 |
|
|
$ |
— |
|
|
$ |
— |
|
Maximum outstanding at any month-end period during |
|
|
20,000 |
|
|
|
— |
|
|
|
— |
|
Balance outstanding at end of period |
|
|
18,333 |
|
|
|
— |
|
|
|
— |
|
Weighted average interest rate during period |
|
|
7.63 |
% |
|
N/A |
|
|
N/A |
|
||
Weighted average interest rate at end of period |
|
|
7.64 |
% |
|
N/A |
|
|
N/A |
|
||
Revolving line of credit: |
|
|
|
|
|
|
|
|
|
|||
Average balance outstanding |
|
$ |
6,545 |
|
|
$ |
— |
|
|
$ |
— |
|
Maximum outstanding at any month-end period during |
|
|
15,000 |
|
|
|
— |
|
|
|
— |
|
Balance outstanding at end of period |
|
|
11,250 |
|
|
|
— |
|
|
|
— |
|
Weighted average interest rate during period |
|
|
7.72 |
% |
|
N/A |
|
|
N/A |
|
||
Weighted average interest rate at end of period(1) |
|
|
7.39 |
% |
|
N/A |
|
|
N/A |
|
||
Customer repurchase agreements (sweeps)
Securities sold under agreements to repurchase represent a demand deposit product offered to customers that sweep balances in excess of the FDIC insurance limit into overnight repurchase agreements. We pledge securities as collateral for the repurchase agreements. Securities sold under agreements to repurchase were $40.6 million at December 31, 2023, compared to $15.4 million at December 31, 2022 an increase of $25.2 million.
58
Liquidity
We manage liquidity based upon factors that include the amount of core deposits as a percentage of total deposits, the level of diversification of our funding sources, the amount of non-deposit funding used to fund assets, the availability of unused funding sources, off-balance sheet obligations, the availability of assets readily converted into cash without undue loss, the amount of cash and liquid securities we hold and the re-pricing characteristics and maturities of our assets when compared to the re-pricing characteristics of our liabilities, the ability to securitize and sell certain pools of assets and other factors.
Our liquidity needs are primarily met by cash and investment securities positions, growth in deposits, cash flow from amortizing loan portfolios, and borrowings from the FHLB. For additional information regarding our operating, investing, and financing cash flows, see "Consolidated Statements of Cash Flows" in our audited consolidated financial statements contained in Item 8 of this report.
As of December 31, 2023, Byline Bank had maximum borrowing capacity from the FHLB of $3.1 billion and $866.5 million from the FRB. As of December 31, 2023, Byline Bank had open advances from the FHLB of $325.0 million and open letters of credit of $19.7 million, providing available aggregate borrowing capacity of $1.6 billion. In addition, Byline Bank had an uncommitted federal funds line available of $135.0 million at December 31, 2023.
As of December 31, 2022, Byline Bank had maximum borrowing capacity from the FHLB of $2.5 billion and $804.6 million from the FRB. As of December 31, 2022, Byline Bank had open advances from the FHLB of $625.0 million and open letters of credit of $13.5 million, providing available aggregate borrowing capacity of $1.0 billion. In addition, Byline Bank had an uncommitted federal funds line available of $135.0 million at December 31, 2022.
The Company is currently party to a revolving credit agreement with a correspondent bank with availability of up to $15.0 million that matures on May 26, 2024. The revolving line of credit bears interest at either SOFR plus 205 basis points or the Prime Rate minus 75 basis points, not to be less than 2.00%, based on the Company’s election, which is required to be communicated at least three business days prior to the commencement of an interest period. If the Company fails to provide timely notification, the interest rate will be Prime Rate minus 75 basis points. At December 31, 2023, the outstanding balance was $11.3 million. At December 31, 2022 the line of credit had no outstanding balance.
There are regulatory limitations that affect the ability of Byline Bank to pay dividends to the Company. Refer to Note 20 of the notes to our audited consolidated financial statements contained in Item 8 of this report for additional information. Management believes that such limitations will not impact our ability to meet our ongoing short-term cash obligations.
As of December 31, 2023, we had outstanding commitments to extend credit of $2.4 billion, primarily related to unused credit lines and $14.3 million of commitments under operating lease agreements. For additional information regarding future financial commitments, refer to Notes 9 and 16 of the notes to our audited consolidated financial statements contained in Item 8 of this report for additional information.
We expect that our cash and liquidity resources will be generated by the operations of Byline Bank, which we expect to be sufficient to satisfy our liquidity and capital requirements for at least the next 12 months.
Capital resources
Stockholders’ equity at December 31, 2023 was $990.2 million compared to $765.8 million at December 31, 2022, an increase of $224.3 million, or 29.3%. The increase was primarily due to increased retained earnings due to net income, and a reduction in our accumulated other comprehensive loss, net of tax on our AFS securities portfolio.
The Company and Byline Bank are subject to various regulatory capital requirements administered by federal banking regulators. Failure to meet minimum capital requirements can initiate certain mandatory and possibly additional discretionary actions by federal banking regulators that, if undertaken, could have a direct material effect on our financial statements.
Under applicable bank regulatory capital requirements, each of the Company and Byline Bank must meet specific capital guidelines that involve quantitative measures of their assets, liabilities and certain off-balance sheet items as calculated under regulatory accounting practices. Byline Bank must also meet certain specific capital guidelines under the prompt corrective action framework. The capital amounts and classification are subject to qualitative judgments by the federal banking regulators about components, risk weightings and other factors. Quantitative measures established by regulation to ensure capital adequacy require the Company and Byline Bank to maintain minimum amounts and ratios of CET1 capital, Tier 1 capital and total capital to risk-weighted assets and Tier 1 capital to average consolidated assets, (referred to as the "leverage ratio"), as defined under these capital requirements. For further information, see Item 1. "Business—Supervision and Regulation—Regulatory Capital Requirements", "Business—Supervision and Regulation—Prompt Corrective Action Framework" and Note 20 of the notes to our audited consolidated financial statements contained in Item 8 of this report for additional information.
As of December 31, 2023, Byline Bank exceeded all applicable regulatory capital requirements and was considered "well-capitalized". There have been no conditions or events since December 31, 2023 that management believes have changed Byline Bank’s classifications.
Off-balance sheet items and other financing arrangements
We are a party to financial instruments with off-balance sheet risk in the normal course of business to meet the financing needs of our customers. These financial instruments include commitments to extend credit, commercial letters of credit and standby letters of credit. Those instruments involve, to varying degrees, elements of credit and interest rate risk in excess of the amount recognized in the
59
Consolidated Statements of Financial Condition. The contractual or notional amounts of those instruments reflect the extent of involvement we have in particular classes of financial instruments.
Commitments to extend credit are agreements to lend to a customer as long as there is no violation of any condition established in the contract. Commitments generally have fixed expiration dates or other termination clauses and may require payment of a fee. Since many of the commitments are expected to expire without being drawn upon, the total commitment amount does not necessarily represent future cash requirements. We evaluate each customer’s creditworthiness on a case-by-case basis. The amount of collateral obtained, if deemed necessary by Byline Bank upon extension of credit, is based on management’s credit evaluation of the counterparty. Collateral is primarily obtained in the form of commercial and residential real estate (including income producing commercial properties).
Letters of credit are conditional commitments issued by Byline Bank to guarantee the performance of a customer to a third-party. Those guarantees are primarily issued to support public and private borrowing arrangements, bond financing and similar transactions. The credit risk involved in issuing letters of credit is essentially the same as that involved in extending loan facilities to customers.
Commitments to make loans are generally made for periods of 90 days or less. The fixed rate loan commitments have interest rates ranging from 1.00% to 15.00% and maturities up to 2053. Variable rate loan commitments have interest rates ranging from 4.00% to 18.50% and maturities up to 2049.
Our exposure to credit loss in the event of non-performance by the other party to the financial instrument for commitments to extend credit and standby letters of credit is represented by the contractual or notional amount of those instruments. We use the same credit policies in making commitments and conditional obligations as for funded instruments. We do not anticipate any material losses as a result of the commitments and standby letters of credit.
We enter into interest rate swaps that are used to manage differences in the amount, timing, and duration of our known or expected cash receipts and its known or expected cash payments principally related to certain variable rate borrowings. We also enter into interest rate derivatives with certain qualified borrowers to facilitate the borrowers’ risk management strategies and concurrently entered into mirror-image derivatives with a third party counterparty.
We recognize derivative financial instruments at fair value regardless of the purpose or intent for holding the instrument. We record derivative assets and derivative liabilities on the Consolidated Statements of Financial Condition within other assets and other liabilities, respectively. Refer to Note 21 of the notes to our audited consolidated financial statements contained in Item 8 of this report for additional information. Because the derivative assets and liabilities recorded on the balance sheet at December 31, 2023 do not represent the amounts that may ultimately be paid under these contracts, these assets and liabilities are listed in the table below (dollars in thousands):
|
|
December 31, 2023 |
|
|||||||||
|
|
|
|
|
Fair Value |
|
||||||
|
|
Notional |
|
|
Asset |
|
|
Liability |
|
|||
Interest rate swaps designated as cash flow hedges |
|
$ |
650,000 |
|
|
$ |
37,475 |
|
|
$ |
— |
|
Other interest rate derivatives—pay fixed, receive floating |
|
|
706,126 |
|
|
|
19,447 |
|
|
|
(19,345 |
) |
Other credit derivatives |
|
|
3,602 |
|
|
|
1 |
|
|
|
— |
|
60
Item 7A. Quantitative and Qualitative Disclosures About Market Risk.
Our primary market risk is interest rate risk, which is defined as the risk of loss of net interest income or net interest margin because of changes in interest rates.
We seek to measure and manage the potential impact of interest rate risk. Interest rate risk occurs when interest-earning assets and interest-bearing liabilities mature or re-price at different times, on a different basis or in unequal amounts. Interest rate risk also arises when our assets, liabilities and off-balance sheet contracts each respond differently to changes in interest rates, including as a result of explicit and implicit provisions in agreements related to such assets and liabilities and in off-balance sheet contracts that alter the applicable interest rate and cash flow characteristics as interest rates change.
We are also exposed to interest rate risk through the retained portion of the U.S. government guaranteed loans we make and the related servicing rights. Our U.S. government guaranteed loan portfolio is comprised primarily of SBA 7(a) loans, virtually all of which are quarterly or monthly adjustable with the prime rate. The SBA portfolio reacts differently in a rising rate environment than our other non-guaranteed portfolios. Generally, when interest rates rise, the prepayments in the SBA portfolio tend to increase.
Our management of interest rate risk is overseen by our Board of Directors and management asset liability committees based on a risk management infrastructure approved by our Board of Directors that outline reporting and measurement requirements. Our risk management infrastructure also requires a periodic review of all key assumptions used, such as identifying appropriate interest rate scenarios, setting loan prepayment rates based on historical analysis, non-interest-bearing and interest-bearing demand deposit lives based on historical analysis and the targeted investment term of capital. The committees closely monitor our interest sensitivity exposure, asset and liability allocation decisions, liquidity and capital positions, and local and national economic conditions and attempts to structure the loan and investment portfolios and funding sources to maximize earnings within acceptable risk tolerances.
We manage the interest rate risk associated with our interest-bearing liabilities by managing the interest rates and tenors associated with our borrowings from the FHLB, and deposits from our customers that we rely on for funding. We manage the interest rate risk associated with our interest-earning assets by managing the interest rates and tenors associated with our investment and loan portfolios, from time to time purchasing and selling investment securities.
We utilize interest rate derivatives to hedge our interest rate exposure on commercial loans when it meets our customers’ and Byline Bank’s needs. As of December 31, 2023, we had a notional amount of $1.4 billion of interest rate derivatives outstanding that includes customer swaps and those on Byline Bank’s balance sheet. The overall effectiveness of our hedging strategies is subject to market conditions, the quality of our execution, the accuracy of our valuation assumptions, the associated counterparty credit risk and changes in interest rates.
We do not engage in speculative trading activities relating to interest rates, foreign exchange rates, commodity prices, equities or credit.
Evaluation of Interest Rate Risk
We evaluate interest rate risk through the use of two different models: net interest income ("NII") simulations and economic value of equity ("EVE") simulations. The simulations provide an estimate of the impact of changes in interest rates on equity and net interest income based on a variety of assumptions. Changes in assumptions may significantly alter the results of our simulations.
We use an NII simulation model to measure and evaluate potential changes in our net interest income. We run various hypothetical interest rate scenarios at least quarterly and compare these results against a scenario with no changes in interest rates. Our NII simulation model incorporates various assumptions, which we believe are reasonable but which may have a significant impact on results such as: (1) asset prepayment speed assumptions, (2) predefined credit spreads for both investment securities and loans, (3) re-pricing characteristics for market-rate-sensitive instruments on and off balance sheet, and (4) the effect of interest rate limitations in our assets, such as floors and caps. Because of limitations inherent in any approach used to measure interest rate risk, simulation results are not intended as a forecast of the actual effect of a change in market interest rates on our results but rather as a means to better plan and execute appropriate asset-liability management strategies and manage our interest rate risk.
We use an EVE simulation to analyze the Company's long-term view of interest rate risk as it analyzes the Company's future cash flows. EVE is defined as the present value of the Company's assets, less the present value of its liabilities, adjusted for off-balance sheet items, with the results showing a theoretical change in the economic value of stockholders' equity as interest rates change. Our EVE simulation model incorporates various assumptions, which we believe are reasonable but which may have a significant impact on results such as: (1) asset prepayment speed assumptions, (2) deposit decay rate assumptions, (3) predefined credit spreads for both investment securities and loans (4) re-pricing characteristics for market-rate-sensitive instruments on and off balance sheet, (5) amortization schedule, and (6) discount rates associated with the products on balance sheet.
61
Potential changes to our net interest income and economic value of equity in hypothetical rising and declining interest rate scenarios calculated as of December 31, 2023 are presented below.
|
|
Estimated Increase/Decrease in |
|
Estimated Percentage |
||
|
|
Year ending December 31 |
|
As of |
||
Basis Point Change in Interest Rates |
|
2024 |
|
2025 |
|
December 31, 2023 |
+300 |
|
9.8% |
|
13.4% |
|
(13.1)% |
+200 |
|
6.5% |
|
8.8% |
|
(8.9)% |
+100 |
|
3.2% |
|
4.4% |
|
(4.5)% |
-100 |
|
(3.3)% |
|
(4.6)% |
|
3.7% |
-200 |
|
(7.3)% |
|
(10.2)% |
|
6.3% |
-300 |
|
(11.1)% |
|
(15.4)% |
|
7.7% |
For the dynamic balance sheet and rate shift scenarios, we assume a balance sheet that reflects management's growth outlook and interest rates follow a forward yield curve. The shocks are defined as gradual shifts up and down it by 1/12th of the total change in rates each month for 12 months. For dynamic balance sheet and rate shifts, a gradual shift downward of 100 basis points would result in a 2.9% decrease to net interest income, and a gradual shift upwards of 100 and 200 basis points would result in 2.7% and 5.4% increases to net interest income, respectively, over the next 12 months.
The Bank's aggregate interest rate risk exposure is monitored and managed based on the economic outlook and under guidance of board-approved policy limits. The results of the simulations are hypothetical, and a variety of factors might cause actual results to differ substantially from what is depicted, including: the timing, magnitude, and frequency of interest rate changes, changes in market conditions, depositor behavior changes, and management strategies.
62
Item 8. Financial Statements and Supplementary Data.
BYLINE BANCORP, INC.
CONSOLIDATED FINANCIAL STATEMENTS
December 31, 2023, 2022, and 2021
INDEX
63
Report of Independent Registered Public Accounting Firm
To the Stockholders and the Board of Directors of
Byline Bancorp, Inc. and Subsidiaries
Opinions on the Financial Statements and Internal Control over Financial Reporting
We have audited the accompanying consolidated statements of financial condition of Byline Bancorp, Inc. and Subsidiaries (the “Company”) as of December 31, 2023 and 2022, the related consolidated statements of operations, comprehensive income (loss), changes in stockholders’ equity, and cash flows for each of the three years in the period ended December 31, 2023, and the related notes (collectively referred to as the consolidated financial statements). We also have audited the Company’s internal control over financial reporting as of December 31, 2023, based on criteria established in Internal Control – Integrated Framework (2013) issued by the Committee of Sponsoring Organizations of the Treadway Commission (COSO).
In our opinion, the consolidated financial statements referred to above present fairly, in all material respects, the consolidated financial position of the Company as of December 31, 2023 and 2022, and the consolidated results of its operations and its cash flows for each of the three years in the period ended December 31, 2023, in conformity with accounting principles generally accepted in the United States of America. Also in our opinion, the Company maintained, in all material respects, effective internal control over financial reporting as of December 31, 2023, based on criteria established in Internal Control – Integrated Framework (2013) issued by COSO.
Change in Accounting Principle
The Company changed its method of accounting for credit losses effective January 1, 2022, due to the adoption of Accounting Standards Codification Topic 326: Financial Instruments – Credit Losses (“Topic 326”). The Company adopted the new credit loss standard using the modified retrospective approach such that prior period amounts are not adjusted and continue to be reported in accordance with previously applicable generally accepted accounting principles.
Basis for Opinions
The Company’s management is responsible for these consolidated financial statements, for maintaining effective internal control over financial reporting, and for its assessment of the effectiveness of internal control over financial reporting, included in the accompanying Management Report on Internal Control over Financial Reporting. Our responsibility is to express an opinion on the Company’s consolidated financial statements and an opinion on the Company’s internal control over financial reporting based on our audits. We are a public accounting firm registered with the Public Company Accounting Oversight Board (United States) (“PCAOB”) and are required to be independent with respect to the Company in accordance with the U.S. federal securities laws and the applicable rules and regulations of the Securities and Exchange Commission and the PCAOB.
We conducted our audits in accordance with the standards of the PCAOB. Those standards require that we plan and perform the audits to obtain reasonable assurance about whether the consolidated financial statements are free of material misstatement, whether due to error or fraud, and whether effective internal control over financial reporting was maintained in all material respects.
Our audits of the consolidated financial statements included performing procedures to assess the risks of material misstatement of the consolidated financial statements, whether due to error or fraud, and performing procedures to respond to those risks. Such procedures included examining, on a test basis, evidence regarding the amounts and disclosures in the consolidated financial statements. Our audits also included evaluating the accounting principles used and significant estimates made by management, as well as evaluating the overall presentation of the consolidated financial statements. Our audit of internal control over financial reporting included obtaining an understanding of internal
64
control over financial reporting, assessing the risk that a material weakness exists, and testing and evaluating the design and operating effectiveness of internal control based on the assessed risk. Our audits also included performing such other procedures as we considered necessary in the circumstances. We believe that our audits provide a reasonable basis for our opinions.
Definition and Limitations of Internal Control Over Financial Reporting
A company’s internal control over financial reporting is a process designed to provide reasonable assurance regarding the reliability of financial reporting and the preparation of financial statements for external purposes in accordance with generally accepted accounting principles. A company’s internal control over financial reporting includes those policies and procedures that (1) pertain to the maintenance of records that, in reasonable detail, accurately and fairly reflect the transactions and dispositions of the assets of the company; (2) provide reasonable assurance that transactions are recorded as necessary to permit preparation of financial statements in accordance with generally accepted accounting principles, and that receipts and expenditures of the company are being made only in accordance with authorizations of management and directors of the company; and (3) provide reasonable assurance regarding prevention or timely detection of unauthorized acquisition, use, or disposition of the company’s assets that could have a material effect on the financial statements.
Because of its inherent limitations, internal control over financial reporting may not prevent or detect misstatements. Also, projections of any evaluation of effectiveness to future periods are subject to the risk that controls may become inadequate because of changes in conditions, or that the degree of compliance with the policies or procedures may deteriorate.
Critical Audit Matter
The critical audit matters communicated below are matters arising from the current period audit of the consolidated financial statements that were communicated or required to be communicated to the audit committee and that (1) relate to accounts or disclosures that are material to the consolidated financial statements and (2) involved our especially challenging, subjective, or complex judgments. The communication of critical audit matters does not alter in any way our opinion on the consolidated financial statements, taken as a whole, and we are not, by communicating the critical audit matters below, providing a separate opinion on the critical audit matters or on the accounts or disclosures to which it relates.
Allowance for Credit Losses for Loans and Leases – Identifying Loans to be Individually Evaluated, Loan Risk Ratings, Reasonable and Supportable Forecasts and Qualitative Factors
As described in Note 5 to the consolidated financial statements, the Company’s allowance for credit losses for loans and leases was $101.7 million as of December 31, 2023, and consists of both a historical credit loss experience component and management’s estimates of current conditions and reasonable and supportable forecasts. The Company’s allowance for credit losses for loans and leases is a valuation account that is deducted from the amortized cost basis of loans and leases to present the net carrying value expected to be collected on such loans and leases and is a material and complex estimate requiring significant management judgment in the estimation of expected lifetime losses within the loan and lease portfolio as of the balance sheet date.
We identified management’s risk rating of loans, identification of loans to be individually evaluated, the reasonable and supportable forecasts, and the estimate of qualitative risk factor adjustments that are intended to capture internal and external trends not reflected in historical loss history, and the selection of the methodology and economic variables and forecast scenarios utilized, as a critical audit matter. In estimating the allowance for credit losses on loans and leases, the Company utilizes relevant information from internal and external sources relating to past events, current conditions, and reasonable and supportable forecasts. The Company considers loan-specific risk characteristics for each loan and lease segment, identifies loans to be individually evaluated, and estimates losses for each loan and lease segment based upon their nature, historical experience, and risk profile. This process requires significant management judgment in the review of the loan and lease portfolio and identification of individually evaluated loans based upon the characteristics of loans and leases. In addition, estimation of the lifetime expected credit losses for loans and leases requires significant management judgment, particularly as it relates to forward-looking information through the use of qualitative risk factors
65
and peer data applied over the forecasted life of the loans and leases. Auditing these complex judgments and assumptions involved especially challenging auditor judgment due to the nature and extent of audit evidence and effort required to address these matters.
The primary procedures we performed to address this critical audit matter included:
Business Combination – Inland Bancorp, Inc. acquired loans and core deposit intangible valuation
As discussed in Note 1 and Note 3 to the consolidated financial statements, on July 1, 2023, the Company completed the acquisition of Inland Bancorp, Inc. (Inland). Total merger consideration, including cash and stock transactions, was $138.9 million. The fair value of total assets acquired as a result of the merger totaled $1.2 billion, with the fair value of loans totaling $808.0 million before an allowance for credit losses adjustment of $10.6 million related to purchased credit deteriorated loans. The overall transaction resulted in the recognition of $33.4 million of goodwill. The merger was accounted for using the acquisition method of accounting in which assets, liabilities, and consideration exchanged were recorded at their respective fair values at the merger date. To estimate the fair value of the acquired loans, the Company utilized a discounted cash flow methodology that involved assumptions and judgments as to principal default and loss rates, prepayment rates, and market discount rates. The acquired loans were recorded at fair value at the acquisition date without carryover of Inland’s previously established allowance for credit losses. The fair value adjustment to acquired loans was a reduction to the carrying amount of $62.1 million. To estimate the fair value of the core deposit intangible, the Company utilized a discounted economic benefit methodology that involved assumptions such as deposit runoff rates, cost of deposits, cost of alternative funds, and a discount rate applied. The fair value of the core deposit intangible recorded was $17.3 million.
We identified the valuation of acquired loans and the valuation of the core deposit intangible as critical audit matters because of the judgment necessary by management to identify purchased loans with deteriorated credit quality since acquisition and to determine the fair value of the loan portfolio acquired and the fair value of the core deposit intangible recorded, and the related high degree of auditor judgment and the extensive audit effort involved in testing management’s significant estimates and assumptions, including using individuals with specialized skill and knowledge.
66
The primary procedures we performed to address this critical audit matter included:
/s/ Moss Adams LLP
Portland, Oregon
March 4, 2024
We have served as the Company’s auditor since 2013.
67
BYLINE BANCORP, INC. AND SUBSIDIARIES
CONSOLIDATED STATEMENTS OF FINANCIAL CONDITION
DECEMBER 31, 2023 AND 2022
|
|
|
|
|
|
|
||
(dollars in thousands, except per share data) |
|
2023 |
|
|
2022 |
|
||
ASSETS |
|
|
|
|
|
|
||
Cash and due from banks |
|
$ |
|
|
$ |
|
||
Interest bearing deposits with other banks |
|
|
|
|
|
|
||
Cash and cash equivalents |
|
|
|
|
|
|
||
Equity and other securities, at fair value |
|
|
|
|
|
|
||
Securities available-for-sale, at fair value (amortized cost at |
|
|
|
|
|
|
||
Securities held-to-maturity, at amortized cost (fair value at |
|
|
|
|
|
|
||
Restricted stock, at cost |
|
|
|
|
|
|
||
Loans held for sale |
|
|
|
|
|
|
||
Loans and leases: |
|
|
|
|
|
|
||
Loans and leases |
|
|
|
|
|
|
||
Allowance for credit losses - loans and leases |
|
|
( |
) |
|
|
( |
) |
Net loans and leases |
|
|
|
|
|
|
||
Servicing assets, at fair value |
|
|
|
|
|
|
||
Accrued interest receivable |
|
|
|
|
|
|
||
Premises and equipment, net |
|
|
|
|
|
|
||
Operating lease right-of-use asset |
|
|
|
|
|
|
||
Assets held for sale |
|
|
|
|
|
|
||
Other real estate owned, net |
|
|
|
|
|
|
||
Goodwill |
|
|
|
|
|
|
||
Other intangible assets, net |
|
|
|
|
|
|
||
Bank-owned life insurance |
|
|
|
|
|
|
||
Deferred tax assets, net |
|
|
|
|
|
|
||
Due from counterparty |
|
|
|
|
|
|
||
Other assets |
|
|
|
|
|
|
||
Total assets |
|
$ |
|
|
$ |
|
||
LIABILITIES AND STOCKHOLDERS’ EQUITY |
|
|
|
|
|
|
||
LIABILITIES |
|
|
|
|
|
|
||
Non-interest-bearing demand deposits |
|
$ |
|
|
$ |
|
||
Interest-bearing deposits: |
|
|
|
|
|
|
||
Interest bearing checking, savings accounts, and money market accounts |
|
|
|
|
|
|
||
Time deposits |
|
|
|
|
|
|
||
Total deposits |
|
|
|
|
|
|
||
Federal Home Loan Bank advances |
|
|
|
|
|
|
||
Term loan |
|
|
|
|
|
|
||
Line of credit |
|
|
|
|
|
|
||
Subordinated notes, net |
|
|
|
|
|
|
||
Securities sold under agreements to repurchase |
|
|
|
|
|
|
||
Junior subordinated debentures issued to capital trusts, net |
|
|
|
|
|
|
||
Accrued interest payable |
|
|
|
|
|
|
||
Operating lease liability |
|
|
|
|
|
|
||
Accrued expenses and other liabilities |
|
|
|
|
|
|
||
Total liabilities |
|
|
|
|
|
|
||
|
|
|
|
|
|
|||
STOCKHOLDERS’ EQUITY (Note 24) |
|
|
|
|
|
|
||
Preferred stock, $ |
|
|
|
|
|
|
||
Common stock, voting $ |
|
|
|
|
|
|
||
Additional paid-in capital |
|
|
|
|
|
|
||
Retained earnings |
|
|
|
|
|
|
||
Treasury stock at cost, |
|
|
( |
) |
|
|
( |
) |
Accumulated other comprehensive loss, net of tax |
|
|
( |
) |
|
|
( |
) |
Total stockholders’ equity |
|
|
|
|
|
|
||
Total liabilities and stockholders’ equity |
|
$ |
|
|
$ |
|
||
See accompanying Notes to Consolidated Financial Statements
68
BYLINE BANCORP, INC. AND SUBSIDIARIES
CONSOLIDATED STATEMENTS OF OPERATIONS
FOR THE YEARS ENDED DECEMBER 31, 2023, 2022, AND 2021
|
|
|
|
|
|
|
|
|
|
|||
|
|
|
|
|
|
|
|
|
|
|||
(dollars in thousands, except per share data) |
|
2023 |
|
|
2022 |
|
|
2021 |
|
|||
INTEREST AND DIVIDEND INCOME |
|
|
|
|
|
|
|
|
|
|||
Interest and fees on loans and leases |
|
$ |
|
|
$ |
|
|
$ |
|
|||
Interest on taxable securities |
|
|
|
|
|
|
|
|
|
|||
Interest on tax-exempt securities |
|
|
|
|
|
|
|
|
|
|||
Other interest and dividend income |
|
|
|
|
|
|
|
|
|
|||
Total interest and dividend income |
|
|
|
|
|
|
|
|
|
|||
INTEREST EXPENSE |
|
|
|
|
|
|
|
|
|
|||
Deposits |
|
|
|
|
|
|
|
|
|
|||
Other borrowings |
|
|
|
|
|
|
|
|
|
|||
Subordinated notes and debentures |
|
|
|
|
|
|
|
|
|
|||
Total interest expense |
|
|
|
|
|
|
|
|
|
|||
Net interest income |
|
|
|
|
|
|
|
|
|
|||
PROVISION FOR CREDIT LOSSES |
|
|
|
|
|
|
|
|
|
|||
Net interest income after provision for credit losses |
|
|
|
|
|
|
|
|
|
|||
NON-INTEREST INCOME |
|
|
|
|
|
|
|
|
|
|||
Fees and service charges on deposits |
|
|
|
|
|
|
|
|
|
|||
Loan servicing revenue |
|
|
|
|
|
|
|
|
|
|||
Loan servicing asset revaluation |
|
|
( |
) |
|
|
( |
) |
|
|
( |
) |
ATM and interchange fees |
|
|
|
|
|
|
|
|
|
|||
Net gains on sales of securities available-for-sale |
|
|
|
|
|
|
|
|
|
|||
Change in fair value of equity securities, net |
|
|
|
|
|
( |
) |
|
|
( |
) |
|
Net gains on sales of loans |
|
|
|
|
|
|
|
|
|
|||
Wealth management and trust income |
|
|
|
|
|
|
|
|
|
|||
Other non-interest income |
|
|
|
|
|
|
|
|
|
|||
Total non-interest income |
|
|
|
|
|
|
|
|
|
|||
NON-INTEREST EXPENSE |
|
|
|
|
|
|
|
|
|
|||
Salaries and employee benefits |
|
|
|
|
|
|
|
|
|
|||
Occupancy expense, net |
|
|
|
|
|
|
|
|
|
|||
Equipment expense |
|
|
|
|
|
|
|
|
|
|||
Impairment charge on assets held for sale |
|
|
|
|
|
|
|
|
|
|||
Loan and lease related expenses |
|
|
|
|
|
|
|
|
|
|||
Legal, audit, and other professional fees |
|
|
|
|
|
|
|
|
|
|||
Data processing |
|
|
|
|
|
|
|
|
|
|||
Net loss recognized on other real estate owned and other related expenses |
|
|
|
|
|
|
|
|
|
|||
Regulatory assessments |
|
|
|
|
|
|
|
|
|
|||
Other intangible assets amortization expense |
|
|
|
|
|
|
|
|
|
|||
Advertising and promotions |
|
|
|
|
|
|
|
|
|
|||
Telecommunications |
|
|
|
|
|
|
|
|
|
|||
Other non-interest expense |
|
|
|
|
|
|
|
|
|
|||
Total non-interest expense |
|
|
|
|
|
|
|
|
|
|||
INCOME BEFORE PROVISION FOR INCOME TAXES |
|
|
|
|
|
|
|
|
|
|||
PROVISION FOR INCOME TAXES |
|
|
|
|
|
|
|
|
|
|||
NET INCOME |
|
|
|
|
|
|
|
|
|
|||
Dividends on preferred shares |
|
|
|
|
|
|
|
|
|
|||
INCOME AVAILABLE TO COMMON STOCKHOLDERS |
|
$ |
|
|
$ |
|
|
$ |
|
|||
EARNINGS PER COMMON SHARE |
|
|
|
|
|
|
|
|
|
|||
Basic |
|
$ |
|
|
$ |
|
|
$ |
|
|||
Diluted |
|
$ |
|
|
$ |
|
|
$ |
|
|||
See accompanying Notes to Consolidated Financial Statements
69
BYLINE BANCORP, INC. AND SUBSIDIARIES
CONSOLIDATED STATEMENTS OF COMPREHENSIVE INCOME (LOSS)
FOR THE YEARS ENDED DECEMBER 31, 2023, 2022, AND 2021
(dollars in thousands) |
|
2023 |
|
|
2022 |
|
|
2021 |
|
|||
Net income |
|
$ |
|
|
$ |
|
|
$ |
|
|||
Securities available-for-sale |
|
|
|
|
|
|
|
|
|
|||
Unrealized holding gains (losses) arising during the period |
|
|
|
|
|
( |
) |
|
|
( |
) |
|
Reclassification adjustments for net gains included in net income |
|
|
|
|
|
( |
) |
|
|
( |
) |
|
Tax effect |
|
|
( |
) |
|
|
|
|
|
|
||
Net of tax |
|
|
|
|
|
( |
) |
|
|
( |
) |
|
Cash flow hedges |
|
|
|
|
|
|
|
|
|
|||
Unrealized holding gains arising during the period |
|
|
|
|
|
|
|
|
|
|||
Reclassification adjustments for net (gains) losses included in |
|
|
( |
) |
|
|
( |
) |
|
|
|
|
Tax effect |
|
|
|
|
|
( |
) |
|
|
( |
) |
|
Net of tax |
|
|
( |
) |
|
|
|
|
|
|
||
Total other comprehensive income (loss) |
|
|
|
|
|
( |
) |
|
|
( |
) |
|
Comprehensive income (loss) |
|
$ |
|
|
$ |
( |
) |
|
$ |
|
||
See accompanying Notes to Consolidated Financial Statements
70
BYLINE BANCORP, INC. AND SUBSIDIARIES
CONSOLIDATED STATEMENTS OF CHANGES IN STOCKHOLDERS’ EQUITY
FOR THE YEARS ENDED DECEMBER 31, 2023, 2022, AND 2021
|
|
|
|
|
|
|
|
|
|
|
|
|
Additional |
|
|
|
|
|
|
|
|
Accumulated |
|
|
Total |
|
|||||||||
(dollars in thousands, |
Preferred Stock |
|
|
Common Stock |
|
|
Paid-In |
|
|
Retained |
|
|
Treasury |
|
|
Comprehensive |
|
|
Stockholders’ |
|
|||||||||||||||
except share data) |
Shares |
|
|
Amount |
|
|
Shares |
|
|
Amount |
|
|
Capital |
|
|
Earnings |
|
|
Stock |
|
|
Income (Loss) |
|
|
Equity |
|
|||||||||
Balance, January 1, 2021 |
|
|
|
$ |
|
|
|
|
|
$ |
|
|
$ |
|
|
$ |
|
|
$ |
( |
) |
|
$ |
|
|
$ |
|
||||||||
Net income |
|
— |
|
|
|
— |
|
|
|
— |
|
|
|
— |
|
|
|
— |
|
|
|
|
|
|
— |
|
|
|
— |
|
|
|
|
||
Other comprehensive loss, net of tax |
|
— |
|
|
|
— |
|
|
|
— |
|
|
|
— |
|
|
|
— |
|
|
|
— |
|
|
|
— |
|
|
|
( |
) |
|
|
( |
) |
Issuance of common stock upon, |
|
— |
|
|
|
— |
|
|
|
|
|
|
|
|
|
|
|
|
— |
|
|
|
|
|
|
— |
|
|
|
|
|||||
Restricted stock activity, net |
|
— |
|
|
|
— |
|
|
|
|
|
|
|
|
|
( |
) |
|
|
— |
|
|
|
( |
) |
|
|
— |
|
|
|
( |
) |
||
Issuance of common stock |
|
— |
|
|
|
— |
|
|
|
|
|
|
|
|
|
|
|
|
— |
|
|
|
— |
|
|
|
— |
|
|
|
|
||||
Cash dividends declared on |
|
— |
|
|
|
— |
|
|
|
— |
|
|
|
— |
|
|
|
— |
|
|
|
( |
) |
|
|
— |
|
|
|
— |
|
|
|
( |
) |
Cash dividends declared on |
|
— |
|
|
|
— |
|
|
|
— |
|
|
|
— |
|
|
|
— |
|
|
|
( |
) |
|
|
— |
|
|
|
— |
|
|
|
( |
) |
Repurchases of common stock |
|
— |
|
|
|
— |
|
|
|
( |
) |
|
|
— |
|
|
|
— |
|
|
|
— |
|
|
|
( |
) |
|
|
— |
|
|
|
( |
) |
Share-based compensation expense |
|
— |
|
|
|
— |
|
|
|
— |
|
|
|
— |
|
|
|
|
|
|
— |
|
|
|
— |
|
|
|
— |
|
|
|
|
||
Balance, December 31, 2021 |
|
|
|
$ |
|
|
|
|
|
$ |
|
|
$ |
|
|
$ |
|
|
$ |
( |
) |
|
$ |
( |
) |
|
$ |
|
|||||||
Net income |
|
— |
|
|
|
— |
|
|
|
— |
|
|
|
— |
|
|
|
— |
|
|
|
|
|
|
— |
|
|
|
— |
|
|
|
|
||
Other comprehensive loss, net of tax |
|
— |
|
|
|
— |
|
|
|
— |
|
|
|
— |
|
|
|
— |
|
|
|
— |
|
|
|
— |
|
|
|
( |
) |
|
|
( |
) |
Issuance of common stock upon |
|
— |
|
|
|
— |
|
|
|
|
|
|
— |
|
|
|
( |
) |
|
|
— |
|
|
|
( |
) |
|
|
— |
|
|
|
( |
) |
|
Restricted stock activity, net |
|
— |
|
|
|
— |
|
|
|
|
|
|
|
|
|
( |
) |
|
|
— |
|
|
|
( |
) |
|
|
|
|
|
( |
) |
|||
Issuance of common stock |
|
— |
|
|
|
— |
|
|
|
|
|
|
|
|
|
( |
) |
|
|
— |
|
|
|
|
|
|
— |
|
|
|
|
||||
Cumulative-effect adjustment |
|
— |
|
|
|
— |
|
|
|
— |
|
|
|
— |
|
|
|
— |
|
|
|
( |
) |
|
|
— |
|
|
|
— |
|
|
|
( |
) |
Redemption of Series B |
|
( |
) |
|
|
( |
) |
|
|
— |
|
|
|
— |
|
|
|
— |
|
|
|
— |
|
|
|
— |
|
|
|
— |
|
|
|
( |
) |
Cash dividends declared on |
|
— |
|
|
|
— |
|
|
|
— |
|
|
|
— |
|
|
|
— |
|
|
|
( |
) |
|
|
— |
|
|
|
— |
|
|
|
( |
) |
Cash dividends declared on |
|
— |
|
|
|
— |
|
|
|
— |
|
|
|
— |
|
|
|
— |
|
|
|
( |
) |
|
|
— |
|
|
|
— |
|
|
|
( |
) |
Repurchases of common stock |
|
— |
|
|
|
— |
|
|
|
( |
) |
|
|
— |
|
|
|
— |
|
|
|
— |
|
|
|
( |
) |
|
|
— |
|
|
|
( |
) |
Share-based compensation expense |
|
— |
|
|
|
— |
|
|
|
— |
|
|
|
— |
|
|
|
|
|
|
— |
|
|
|
— |
|
|
|
— |
|
|
|
|
||
Balance, December 31, 2022 |
|
|
|
$ |
|
|
|
|
|
$ |
|
|
$ |
|
|
$ |
|
|
$ |
( |
) |
|
$ |
( |
) |
|
$ |
|
|||||||
Net income |
|
— |
|
|
|
— |
|
|
|
— |
|
|
|
— |
|
|
|
— |
|
|
|
|
|
|
— |
|
|
|
— |
|
|
|
|
||
Other comprehensive income, net of tax |
|
— |
|
|
|
— |
|
|
|
— |
|
|
|
— |
|
|
|
— |
|
|
|
— |
|
|
|
— |
|
|
|
|
|
|
|
||
Issuance of common stock upon |
|
— |
|
|
|
— |
|
|
|
|
|
|
|
|
|
|
|
|
— |
|
|
|
— |
|
|
|
— |
|
|
|
|
||||
Restricted stock activity, net |
|
— |
|
|
|
— |
|
|
|
|
|
|
|
|
|
( |
) |
|
|
— |
|
|
|
( |
) |
|
|
— |
|
|
|
( |
) |
||
Issuance of common stock |
|
— |
|
|
|
— |
|
|
|
|
|
|
— |
|
|
|
|
|
|
— |
|
|
|
|
|
|
— |
|
|
|
|
||||
Issuance of common stock due |
|
— |
|
|
|
— |
|
|
|
|
|
|
|
|
|
|
|
|
— |
|
|
|
— |
|
|
|
— |
|
|
|
|
||||
Cash dividends declared on |
|
— |
|
|
|
— |
|
|
|
— |
|
|
|
— |
|
|
|
— |
|
|
|
( |
) |
|
|
— |
|
|
|
— |
|
|
|
( |
) |
Share-based compensation expense |
|
— |
|
|
|
— |
|
|
|
— |
|
|
|
— |
|
|
|
|
|
|
— |
|
|
|
— |
|
|
|
— |
|
|
|
|
||
Balance, December 31, 2023 |
|
|
|
$ |
|
|
|
|
|
$ |
|
|
$ |
|
|
$ |
|
|
$ |
( |
) |
|
$ |
( |
) |
|
$ |
|
|||||||
See accompanying Notes to Consolidated Financial Statements
71
BYLINE BANCORP, INC. AND SUBSIDIARIES
CONSOLIDATED STATEMENTS OF CASH FLOWS
FOR THE YEARS ENDED DECEMBER 31, 2023, 2022, AND 2021
|
|
|
|
|||||||||
(dollars in thousands) |
|
2023 |
|
|
2022 |
|
|
2021 |
|
|||
CASH FLOWS FROM OPERATING ACTIVITIES |
|
|
|
|
|
|
|
|
|
|||
Net income |
|
$ |
|
|
$ |
|
|
$ |
|
|||
Adjustments to reconcile net income to net cash from operating activities: |
|
|
|
|
|
|
|
|
|
|||
Provision for credit losses |
|
|
|
|
|
|
|
|
|
|||
Impairment loss on premises and equipment |
|
|
|
|
|
|
|
|
|
|||
Impairment loss on right-of-use asset |
|
|
|
|
|
|
|
|
|
|||
Impairment loss on assets held for sale |
|
|
|
|
|
|
|
|
|
|||
Depreciation and amortization of premises and equipment |
|
|
|
|
|
|
|
|
|
|||
Net amortization of securities |
|
|
|
|
|
|
|
|
|
|||
Net change in fair value of equity securities, net |
|
|
( |
) |
|
|
|
|
|
|
||
Net gains on sales of securities available-for-sale |
|
|
|
|
|
( |
) |
|
|
( |
) |
|
Net losses (gains) on sales and valuation adjustments of premises and equipment |
|
|
( |
) |
|
|
|
|
|
( |
) |
|
Net gains on sales of loans |
|
|
( |
) |
|
|
( |
) |
|
|
( |
) |
Originations of U.S. government guaranteed loans |
|
|
( |
) |
|
|
( |
) |
|
|
( |
) |
Proceeds from U.S. government guaranteed loans sold |
|
|
|
|
|
|
|
|
|
|||
Accretion of premiums and discounts on acquired loans, net |
|
|
( |
) |
|
|
( |
) |
|
|
( |
) |
Net change in servicing assets |
|
|
( |
) |
|
|
|
|
|
( |
) |
|
Net losses on sales and valuation adjustments of other real estate owned |
|
|
|
|
|
|
|
|
|
|||
Net amortization of other acquisition accounting adjustments |
|
|
|
|
|
|
|
|
|
|||
Amortization of subordinated debt issuance cost |
|
|
|
|
|
|
|
|
|
|||
Accretion of junior subordinated debentures discount |
|
|
|
|
|
|
|
|
|
|||
Share-based compensation expense |
|
|
|
|
|
|
|
|
|
|||
Deferred tax provision (benefit) |
|
|
|
|
|
|
|
|
( |
) |
||
Increase in cash surrender value of bank owned life insurance |
|
|
( |
) |
|
|
( |
) |
|
|
( |
) |
Changes in assets and liabilities: |
|
|
|
|
|
|
|
|
|
|||
Accrued interest receivable and other assets |
|
|
( |
) |
|
|
( |
) |
|
|
( |
) |
Accrued interest payable and other liabilities |
|
|
( |
) |
|
|
|
|
|
( |
) |
|
Net cash provided by operating activities |
|
|
|
|
|
|
|
|
|
|||
CASH FLOWS FROM INVESTING ACTIVITIES |
|
|
|
|
|
|
|
|
|
|||
Purchases of securities available-for-sale |
|
|
( |
) |
|
|
( |
) |
|
|
( |
) |
Proceeds from maturities and calls of securities available-for-sale |
|
|
|
|
|
|
|
|
|
|||
Proceeds from paydowns of securities available-for-sale |
|
|
|
|
|
|
|
|
|
|||
Proceeds from sales of securities available-for-sale |
|
|
|
|
|
|
|
|
|
|||
Proceeds from maturities and calls of securities held-to-maturity |
|
|
|
|
|
|
|
|
|
|||
Redemptions (purchases) of Federal Home Loan Bank stock, net |
|
|
|
|
|
( |
) |
|
|
( |
) |
|
Proceeds from other loans sold |
|
|
|
|
|
|
|
|
|
|||
Net change in loans and leases |
|
|
( |
) |
|
|
( |
) |
|
|
( |
) |
Purchases of premises and equipment |
|
|
( |
) |
|
|
( |
) |
|
|
( |
) |
Proceeds from sales of premises and equipment |
|
|
|
|
|
|
|
|
|
|||
Proceeds from sales of assets held for sale |
|
|
|
|
|
|
|
|
|
|||
Proceeds from sales of other real estate owned |
|
|
|
|
|
|
|
|
|
|||
Investment in bank owned life insurance |
|
|
|
|
|
|
|
|
( |
) |
||
Net cash received in acquisition of a business |
|
|
|
|
|
|
|
|
|
|||
Net cash used in investing activities |
|
|
( |
) |
|
|
( |
) |
|
|
( |
) |
See accompanying Notes to Consolidated Financial Statements
72
BYLINE BANCORP, INC. AND SUBSIDIARIES
CONSOLIDATED STATEMENTS OF CASH FLOWS (continued)
FOR THE YEARS ENDED DECEMBER 31, 2023, 2022, AND 2021
|
|
|
|
|||||||||
(dollars in thousands) |
|
2023 |
|
|
2022 |
|
|
2021 |
|
|||
CASH FLOWS FROM FINANCING ACTIVITIES |
|
|
|
|
|
|
|
|
|
|||
Net increase in deposits |
|
$ |
|
|
$ |
|
|
$ |
|
|||
Proceeds from short-term borrowings |
|
|
|
|
|
|
|
|
|
|||
Repayments of short-term borrowings |
|
|
( |
) |
|
|
( |
) |
|
|
( |
) |
Proceeds from revolving line of credit |
|
|
|
|
|
|
|
|
|
|||
Repayments of revolving line of credit |
|
|
( |
) |
|
|
|
|
|
|
||
Proceeds from term loan |
|
|
|
|
|
|
|
|
|
|||
Repayments of term loan |
|
|
( |
) |
|
|
|
|
|
|
||
Proceeds from Paycheck Protection Program Liquidity Facility |
|
|
|
|
|
|
|
|
|
|||
Repayments of Paycheck Protection Program Liquidity Facility |
|
|
|
|
|
|
|
|
( |
) |
||
Net change in securities sold under agreements to repurchase |
|
|
|
|
|
( |
) |
|
|
( |
) |
|
Dividends paid on preferred stock |
|
|
|
|
|
( |
) |
|
|
( |
) |
|
Dividends paid on common stock |
|
|
( |
) |
|
|
( |
) |
|
|
( |
) |
Proceeds from issuance of common stock |
|
|
|
|
|
|
|
|
|
|||
Redemption of preferred stock |
|
|
|
|
|
( |
) |
|
|
|
||
Repurchase of common stock |
|
|
|
|
|
( |
) |
|
|
( |
) |
|
Net cash provided by financing activities |
|
|
|
|
|
|
|
|
|
|||
NET INCREASE IN CASH AND CASH EQUIVALENTS |
|
|
|
|
|
|
|
|
|
|||
CASH AND CASH EQUIVALENTS, beginning of period |
|
|
|
|
|
|
|
|
|
|||
CASH AND CASH EQUIVALENTS, end of period |
|
$ |
|
|
$ |
|
|
$ |
|
|||
SUPPLEMENTAL DISCLOSURES OF CASH FLOW INFORMATION: |
|
|
|
|
|
|
|
|
|
|||
Cash paid during the period for interest |
|
$ |
|
|
$ |
|
|
$ |
|
|||
Cash payments during the period for taxes |
|
$ |
|
|
$ |
|
|
$ |
|
|||
SUPPLEMENTAL DISCLOSURES OF NON-CASH INVESTING AND |
|
|
|
|
|
|
|
|
|
|||
Reclassification from equity securities to other assets |
|
$ |
|
|
$ |
|
|
$ |
|
|||
Transfer of loans to other real estate owned |
|
$ |
|
|
$ |
|
|
$ |
|
|||
Right of use asset exchanged for operating lease liabilties |
|
$ |
|
|
$ |
|
|
$ |
|
|||
Common stock issued due to acquisition of a business |
|
$ |
|
|
$ |
|
|
$ |
|
|||
Common dividend declared, not paid |
|
$ |
|
|
$ |
|
|
$ |
|
|||
Common share withholding |
|
$ |
|
|
$ |
|
|
$ |
|
|||
Total assets acquired from acquisition |
|
$ |
|
|
$ |
|
|
$ |
|
|||
Value ascribed to goodwill |
|
$ |
|
|
$ |
|
|
$ |
|
|||
Total liabilities assumed from acquisition |
|
$ |
|
|
$ |
|
|
$ |
|
|||
See accompanying Notes to Consolidated Financial Statements
73
BYLINE BANCORP, INC. AND SUBSIDIARIES
NOTES TO CONSOLIDATED FINANCIAL STATEMENTS
(Table dollars in thousands, except share and per share data)
Note 1—Business and Summary of Significant Accounting Policies
Nature of business—Byline Bancorp, Inc. (the "Company," "we," "us," "our") is a bank holding company whose principal activity is the ownership and management of its subsidiary bank, Byline Bank (the "Bank"). The Bank originates commercial, commercial real estate and consumer loans and leases, U.S. government guaranteed loans, and receives deposits from customers located primarily in the Chicago, Illinois metropolitan area. The Bank operates
The Bank is a participant in the Small Business Administration ("SBA") and the United States Department of Agriculture ("USDA") (collectively referred to as "U.S. government guaranteed loans") lending programs and originates U.S. government guaranteed loans.
The Bank engages in short‑term direct financing lease contracts through BFG Corporation, doing business as Byline Financial Group ("BFG"), a wholly‑owned subsidiary of the Bank. BFG is located in Bannockburn, Illinois with sales offices in Illinois, and sales representatives in Illinois, Florida, Michigan, New Jersey and New York.
Subsequent events—No subsequent events were identified that would have required a change to the consolidated financial statements or disclosure in the notes to the consolidated financial statements. In the first quarter of 2024, we announced plans to consolidate two branches during the second quarter of 2024. We expect these consolidations to generate approximately $
Basis of financial statement presentation and consolidation—The consolidated financial statements include the accounts of the Company and its subsidiaries. Significant intercompany items and transactions have been eliminated in consolidation. The accounting and reporting policies of the Company conform to accounting principles generally accepted in the United States of America ("GAAP") and rules and regulations of the Securities and Exchange Commission ("SEC"). In accordance with applicable accounting standards, the Company does not consolidate statutory trusts established for the sole purposes of issuing trust preferred securities and related trust common securities. Refer to Note 14—Subordinated Notes and Junior Subordinated Debentures, for additional discussion.
Dollars within footnote tables disclosed within the consolidated financial statements are presented in thousands, except share and per share data. Operating results include the years ended December 31, 2023, 2022 and 2021.
Use of estimates—In preparing the consolidated financial statements, management is required to make estimates and assumptions that affect the reported amounts of certain assets and liabilities and the disclosure of contingent assets and liabilities as of the date of the Consolidated Statements of Financial Condition and certain revenues and expenses for the periods included in the Consolidated Statements of Operations and the accompanying notes. Actual results could differ from those estimates.
Estimates that are particularly susceptible to significant changes in the near term relate to allowance for credit losses, fair value measurements for assets and liabilities, the valuation of assets and liabilities acquired in business combinations, and other intangible assets and goodwill.
Business combinations—The Company accounts for business combinations under the acquisition method of accounting in accordance with Accounting Standards Codification ("ASC") Topic 805, Business Combinations ("ASC 805"). The Company recognizes the fair value of the assets acquired and liabilities assumed as of the date of acquisition, with any excess of the fair value of consideration provided over the fair value of the identifiable net tangible and intangible assets acquired recorded as goodwill. Transaction costs are immediately expensed as applicable. The results of operations of the acquired business are included in the Consolidated Statements of Operations from the effective date of the acquisition, which is the date control is obtained.
The acquiring company retains the right to make appropriate adjustments to the assets and liabilities of the acquired entity for information obtained during the measurement period about facts and circumstances that existed as of the acquisition date. The measurement period ends as of the earlier of (a) one year from the acquisition date or (b) the date when the acquirer receives the information necessary to complete the business combination accounting.
Cash and cash equivalents—Cash and cash equivalents have original maturities of three months or less. The Company holds cash and cash equivalents on deposit with other banks and financial institutions in amounts that periodically exceed the federal deposit insurance limit. The Company evaluates the credit quality of these banks and financial institutions to mitigate its credit risk and has not experienced any losses in such accounts. Interest-bearing deposits in other financial institutions mature within one year and are carried at cost.
74
BYLINE BANCORP, INC. AND SUBSIDIARIES
NOTES TO CONSOLIDATED FINANCIAL STATEMENTS
(Table dollars in thousands, except share and per share data)
Note 1—Business and Summary of Significant Accounting Policies (continued)
Banks are required by the Federal Reserve Act to maintain reserves against deposits. Reserves are held either in the form of vault cash or balances maintained with the FRB and are based on the average daily deposit balances and statutory reserve ratios prescribed by the type of deposit account. In March 2020, the FRB adopted a rule to amend its reserve regulation which included lowering the reserve requirement to zero percent. As a result, at December 31, 2023 and 2022, there was
Equity and other securities—Equity and other securities have no stated maturities and may be sold in response to the same environmental factors as securities available for sale. Equity and other securities are recorded at fair value with changes in fair value included in earnings.
Securities—Securities are classified as available‑for‑sale if the instrument may be sold in response to such factors including changes in market interest rates and related changes in prepayment risk, needs for liquidity, changes in the availability of and the yield on alternative instruments, and changes in funding sources and terms. Gains or losses on the sales of available‑for‑sale securities are recorded on the trade date and determined using the specific‑identification method. Unrealized holding gains or losses, net of tax, on available‑for‑sale securities are carried as accumulated other comprehensive income (loss) within stockholders’ equity until realized. Securities are classified as held‑to‑maturity and carried at amortized cost when management has the positive intent and ability to hold them to maturity. The recognition of interest income on a debt security is discontinued when any principal or interest payment becomes 90 days past due, at which time the debt security is placed on non-accrual status. All accrued and unpaid interest on such debt security is then reversed. Accrued interest receivable is excluded from the estimate of expected credit losses.
Fair values of securities are generally based on quoted market prices for the same or similar instruments. Refer to Note 17—Fair Value Measurement for additional discussion on the determination of fair values. Interest income includes the amortization of purchase premiums and discounts, which are recognized using the effective interest method over the terms of the securities.
Allowance for credit losses - securities—Management measures expected credit losses on held-to-maturity debt securities on a collective basis by security type. The Company’s held-to-maturity portfolio contains municipal bonds that are typically rated by major rating agencies as ‘Aa’ or better. The Company uses industry historical credit loss information adjusted for current conditions to establish an allowance for credit losses. For securities available-for-sale in a loss position, the Company evaluates, on a security-by-security basis, whether the decline in fair value below amortized cost resulted from a credit loss or other factors, and if the loss is attributable to credit loss, the loss is recognized through an allowance for credit losses on securities. In assessing credit loss, the Company considers, among other things: the extent to which fair value is less than the amortized cost basis, adverse conditions specific to the security or industry, historical payment patterns, the likelihood of future payments and changes to the rating of a security by a rating agency. The full amount of the loss will be charged to earnings if the Company intends to sell an impaired security, or it is more likely than not that the Company would be required to sell an impaired security before recovering its amortized cost basis. There was no recorded allowance for credit losses on securities as of December 31, 2023 or 2022. Changes in the allowance for credit losses would be recorded as a provision for credit losses. Losses would be charged against the allowance when management believes the security is uncollectible or management intends to sell or is required to sell the security. Prior to the adoption of ASU 2016-13, declines in the fair value of securities below their cost deemed to be other‑than‑temporary impairment ("OTTI") were reflected in operations as realized losses. Refer to Note 4—Securities for additional information.
Restricted stock—The Company owns stock of the Federal Home Loan Bank of Chicago ("FHLB"). No ready market exists for this stock, and it has no quoted market value. As a member of the FHLB system, the Bank is required to maintain an investment in FHLB stock. The stock is redeemable at par by the FHLB and is, therefore, carried at cost. In addition, the Company owns stock of Bankers Bank, which is redeemable at par and carried at cost.
Restricted stock is generally viewed as a long‑term investment. Accordingly, when evaluating for impairment, its value is determined based on the ultimate recoverability of the par value rather than by recognizing declines in value. The Company did not recognize impairment of its restricted stock as a result of its impairment analyses for the years ended December 31, 2023, 2022 and 2021.
75
BYLINE BANCORP, INC. AND SUBSIDIARIES
NOTES TO CONSOLIDATED FINANCIAL STATEMENTS
(Table dollars in thousands, except share and per share data)
Note 1—Business and Summary of Significant Accounting Policies (continued)
Loans held for sale—Loans that management has the intent and ability to sell are designated as held for sale. U.S. government guaranteed loans and mortgage loans originated are carried at either amortized cost or estimated fair value. The Company determines whether to account for loans at fair value or amortized cost at origination. The loans accounted for at fair value remain at fair value after the determination. The loans accounted for at amortized cost are carried at the lower of cost or fair value, valued on a loan by loan basis. Decreases in fair value, if any, are recorded as a valuation allowance and charged to earnings. Gains or losses on sales of U.S. government guaranteed loans are recognized based on the difference between the net sales proceeds and the carrying value of the sold portion of the loan, less the fair value of the servicing asset recognized, and are reflected as operating activities in the Consolidated Statements of Cash Flows. The difference between the initial carrying balance of the retained portion of the loan and the relative fair value of the sold portion is recorded as a discount to the retained portion of the loan, establishing a new carrying balance. The recorded discount is accreted to earnings on a level yield basis. U.S. government guaranteed loans are generally sold with servicing retained. Loans sold that have not yet settled as of year-end are classified as due-from counterparty on the Consolidated Statements of Financial Condition.
Originated loans—Originated loans are stated at the amount of unpaid principal outstanding, net of purchase premiums and discounts, and any deferred fees or costs. Net deferred fees, costs, discounts and premiums are recognized as yield adjustments over the contractual life of the loan. Interest on loans is calculated daily based on the principal amount outstanding. Additionally, once an acquired non-credit-deteriorated loan or purchases credit deteriorated ("PCD") loan is performing and reaches its contractual maturity date, it is re-underwritten, and if renewed, it is classified as an originated loan.
Prior to the adoption of ASC 326, originated loans were classified as impaired when, based on current information and events, it was probable that the Company would be unable to collect the scheduled payments of principal and interest when due, in accordance with the terms of the original loan agreement. The carrying value of impaired loans was based on the present value of expected future cash flows (discounted at each loan’s effective interest rate) or, for collateral dependent loans, at the fair value of the collateral less estimated selling costs. If the measurement of each impaired loan’s value was less than the recorded investment in the loan, impairment was recognized. Refer to Note 2—Recently Issued Accounting Pronouncements for additional information and refer to Note 5—Loans and Lease Receivables and Allowance for Credit Losses for disclosure of individually evaluated and collateral-dependent loans previously considered impaired.
Modifications for financial difficulty—Modified loans and leases are reviewed to determine if the modification was done for borrowers experiencing financial difficulty. The concessions may be granted in various forms, including a reduction in the stated interest rate, reduction in the loan balance or accrued interest, extension of the maturity date, or a combination of these.
Direct finance leases—The Company engages in leasing for small‑ticket equipment, software, machinery and ancillary supplies and services to customers under leases that qualify as direct financing leases for financial reporting. Certain leases qualify as operating leases for income tax purposes. Under the direct financing method of accounting, the minimum lease payments to be received under the lease contract, together with the estimated unguaranteed residual values of the related equipment, are recorded as lease receivables when the lease is signed and funded, and the lease property is delivered to the customer. The excess of the minimum lease payments and residual values over the amount financed is recorded as unearned lease income. Unearned lease income is recognized over the term of the lease based on the effective yield interest method. Residual value is the estimated fair value of the equipment on lease at lease termination. In estimating the equipment’s fair value at lease termination, the Company relies on historical experience by equipment type and manufacturer and, where available, valuations by independent appraisers, adjusted for known trends. The Company’s residual values are estimates for reasonableness; however, the amounts the Company will ultimately realize could differ from the estimated amounts. If the review of the residual value results in other‑than‑temporary impairment, the impairment is recognized in current period earnings. An upward adjustment of the estimated residual value is not recorded.
76
BYLINE BANCORP, INC. AND SUBSIDIARIES
NOTES TO CONSOLIDATED FINANCIAL STATEMENTS
(Table dollars in thousands, except share and per share data)
Note 1—Business and Summary of Significant Accounting Policies (continued)
The policies for delinquency and non‑accrual for direct finance leases are materially consistent with those described for all classes of loan receivables. The Company defers and amortizes certain initial direct costs over the contractual term of the lease as an adjustment to the yield. The unamortized direct costs are recorded as a reduction of unearned lease income.
Allowance for credit losses - loans and leases—The allowance for credit losses - loans and leases is a valuation account that is deducted from the loans’ amortized cost basis to present the net amount expected to be collected on the loans. Loans are charged off against the allowance when management believes uncollectibility of loan is confirmed. Expected recoveries do not exceed the aggregate of amounts previously charged off and expected to be charged off.
Management estimates the allowance balance using relevant available information, from internal and external sources, relating to past events, current conditions, and reasonable and supportable forecasts. Historical credit loss experience provides the basis for the estimation of expected credit losses. Cash flow models calculate an expected life-of-loan loss percentage for each loan category by calculating the probability of default, based on the migration of loans from performing to non-performing and a loss given default, based on net lifetime losses incurred. Adjustments to historical loss information are made for differences in current loan-specific risk characteristics such as differences in underwriting standards, portfolio mix, delinquency level, as well as for changes in environmental conditions, such as changes in unemployment rates, property values, or other relevant factors. The allowance for credit losses is measured on a collective (segment) basis when similar risk characteristics exist. Segments generally reflect underlying collateral categories as well taking into consideration the risk ratings and unguaranteed balance of small business loans. Management considers various economic scenarios in its forecast when evaluating economic indicators and weights the various scenario calculation results to arrive at the forecast that most reflects management’s expectation of future conditions. After a one-year forecast period, a one-year reversion period adjusts loss experience to the historical average on a straight-line basis.
Loans that do not share risk characteristics are evaluated on an individual basis. Loans evaluated individually are not included in the collective evaluation. When management determines that foreclosure is probable, expected credit losses are based on the fair value of the collateral, adjusted for undiscounted selling costs as appropriate. When the discounted cash flow method is used to determine the allowance for credit losses, management does not adjust the effective interest rate used to discount expected cash flows to incorporate expected prepayments.
Expected credit losses are estimated over the contractual term of the loans, adjusted for expected prepayments when appropriate. The contractual term excludes expected extensions, renewals, and modifications unless either of the following applies: management has a reasonable expectation at the reporting date that a loan modification will be executed with an individual borrower, or the extension or renewal options are included in the original or modified contract at the reporting date and are not unconditionally cancellable by the Company.
77
BYLINE BANCORP, INC. AND SUBSIDIARIES
NOTES TO CONSOLIDATED FINANCIAL STATEMENTS
(Table dollars in thousands, except share and per share data)
Note 1—Business and Summary of Significant Accounting Policies (continued)
The Company also maintains an allowance for credit losses on off-balance sheet credit exposures for unfunded loan commitments. This allowance is reflected as a component of other liabilities which represents management’s current estimate of expected losses in the unfunded loan commitments. The estimate includes consideration of the likelihood that funding will occur and an estimate of expected credit losses on commitments expected to be funded over its estimated life based on management’s consideration of past events, current conditions and reasonable and supportable economic forecasts. Management tracks the level and trends in unused commitments and takes into consideration the same factors as those considered for purposes of the allowance for credit losses on outstanding loans.
Results for the full years and periods ended December 31, 2023 and 2022 are presented under the current expected credit losses ("CECL") methodology while activity for the year ended December 31, 2021 was reported under the incurred loss methodology. Refer to Note 5—Loans and Lease Receivables and Allowance for Credit Losses, for further discussion.
Servicing assets—Servicing assets are recognized separately when they are acquired through sales of loans. When loans are sold with servicing rights retained, servicing assets are recorded at fair value in accordance with ASC 860. Fair value is based on market prices for comparable servicing contracts, when available, or alternatively, is based on a valuation model that calculates the present value of estimated future net servicing income.
Sales of U.S. government guaranteed loans are executed on a servicing retained basis. The standard SBA loan sale agreement is structured to provide the Company with a servicing spread paid from a portion of the interest cash flow of the loan. SBA regulations require the Company to retain a portion of the cash flow from the interest payments received for a sold loan. The USDA loan sale agreements are not standardized with respect to servicing.
Servicing fee income, which is reported on the Consolidated Statements of Operations as loan servicing revenue, is recorded for fees earned for servicing loans. The fees are based on a contractual percentage of the outstanding principal. Late fees and ancillary fees related to loan servicing are not material.
The Company has elected the fair value measurement method and measures servicing rights at fair value at each reporting date and reports changes in fair value of servicing assets in earnings in the period in which the changes occur and are recorded as loan servicing asset revaluation on the Consolidated Statements of Operations. The fair value of servicing rights is highly sensitive to changes in underlying assumptions. Changes in the prepayment speed and discount rate assumptions have the most significant impact on the fair value of servicing rights.
Servicing fee income, which is reported on the Consolidated Statements of Operations as loan servicing revenue, is recorded for fees earned for servicing loans. The fees are based on a contractual percentage of the outstanding principal. Late fees and ancillary fees related to loan servicing are not material.
Concentrations of credit risk—Most of the Company’s business activity is concentrated with customers located within its principal market areas, with the exception of government guaranteed loans and leasing activities. The Company originates commercial real estate, construction, land development and other land, commercial and industrial, residential real estate, installment and other loans, and leases. Generally, loans are secured by accounts receivable, inventory, deposit accounts, personal property or real estate.
Rights to collateral vary and are legally documented to the extent practicable. The Company has a concentration in commercial real estate loans and the ability of borrowers to honor these and other contracts is dependent upon the real estate and general economic conditions within their geographic market.
Transfers of financial assets—Transfers of financial assets are accounted for as sales when control over the assets has been relinquished. The Company has assessed that partial sales of financial assets meet the definition of participating interest. Control over transferred assets is deemed to be surrendered when the assets have been isolated from the Company and the transferee obtains the right (free of conditions that constrain it from taking advantage of that right beyond a trivial benefit) to pledge or exchange the transferred assets. Gains or losses are recognized in the period of sale upon derecognition of the asset.
78
BYLINE BANCORP, INC. AND SUBSIDIARIES
NOTES TO CONSOLIDATED FINANCIAL STATEMENTS
(Table dollars in thousands, except share and per share data)
Note 1—Business and Summary of Significant Accounting Policies (continued)
Premises and equipment—Premises and equipment acquired through a business combination are initially stated at the acquisition date fair value less accumulated depreciation. All other premises and equipment are stated at cost less accumulated depreciation. Depreciation on premises and equipment is recognized on a straight‑line basis over their estimated useful lives ranging from to
Long‑lived assets are evaluated periodically for impairment when events or changes in circumstances indicate the carrying amounts may be not recoverable. Impairment exists when the undiscounted expected future cash flows of a long‑lived asset are less than its carrying value. In that event, the Company recognizes a loss for the difference between the carrying amount and the estimated fair value of the asset based on a quoted market price, if applicable, or a discounted cash flow analysis. Impairment losses are recorded in non‑interest expense.
Assets held for sale—Assets held for sale consist of former branch locations and real estate previously purchased for expansion. Assets are considered held for sale when management has approved to sell the assets. The properties are being actively marketed and transferred to assets held for sale based at the lower of its carrying value or its fair value, less estimated costs to sell. Assets held for sale are evaluated periodically for impairment, with any impairment losses recorded in non-interest expense.
Other real estate owned—Other real estate owned ("OREO") includes real estate assets that have been acquired through, or in lieu of, loan foreclosure or repossession and are to be sold. OREO assets are initially recorded at fair value, less estimated costs to sell, of the collateral of the loan, on the date of foreclosure or repossession, establishing a new cost basis. Adjustments that reduce loan balances to fair value at the time of foreclosure or repossession are recognized as charge‑offs in the allowance for credit losses - loans and leases. After foreclosure or repossession, management periodically obtains new valuations, and real estate or other assets may be adjusted to a lower carrying amount, determined by the fair value of the asset, less estimated costs to sell. Any subsequent write‑downs are recorded as a decrease in the asset and charged against other real estate owned valuation adjustments. Operating expenses of such properties, net of related income, and gains and losses on their disposition are included in non‑interest expense. Any losses on the sales of other real estate owned properties are recognized immediately. OREO is recorded net of participating interests sold.
Goodwill—The excess of the cost of our recapitalization and acquisitions over the fair value of the net assets acquired, including core deposit intangible, consists of goodwill. Goodwill is not amortized but is periodically evaluated for impairment under the provisions of ASC Topic 350, Intangibles—Goodwill and Other ("ASC 350").
Impairment testing is performed using either a qualitative or quantitative approach at the reporting unit level. All of the Company’s goodwill is allocated to the Bank, which is the Company’s only applicable reporting unit for the purposes of testing goodwill for impairment. The Company has selected November 30 as the date it performs the annual goodwill impairment test. Additionally, the Company performs a goodwill impairment evaluation on an interim basis when events or circumstances indicate impairment potentially exists. The Company performs impairment testing using a qualitative approach to determine whether it is more likely than not that the fair value of a reporting unit is less than its carrying amount. A significant amount of judgment is involved in determining if an indicator of impairment has occurred. Such indicators may include, among others, a material change in the estimated value of the Company based on current market multiples common for community banks of similar size and operations; a significant change in our stock price or market capitalization; a significant adverse change in legal factors or in the business climate; adverse action or assessment by a regulator; and unanticipated competition. If the assessment of qualitative factors indicates that it is not more likely than not that impairment exists, an impairment loss is recognized if the carrying amount of the reporting unit goodwill exceeds its fair value.
Based on an annual analysis completed as of November 30, 2023, 2022 and 2021, the Company did
Other intangible assets—Other intangible assets primarily consist of core deposit intangible assets. Other intangible assets with definite useful lives are amortized to their estimated residual values over their respective estimated useful lives and are also reviewed periodically for impairment. Amortization of other intangible assets is included in other non‑interest expense. Core deposit intangibles were recognized apart from goodwill based on market valuations. Core deposit intangibles are amortized over an approximate
Customer relationship intangibles—Customer relationship intangibles relate to the value of existing trust and wealth management relationships and are amortized over
79
BYLINE BANCORP, INC. AND SUBSIDIARIES
NOTES TO CONSOLIDATED FINANCIAL STATEMENTS
(Table dollars in thousands, except share and per share data)
Note 1—Business and Summary of Significant Accounting Policies (continued)
Bank‑owned life insurance—The Company holds life insurance policies that provide protection against the adverse financial effects that could result from the death of current and former employees and provide tax deferred income. Although the lives of individual current or former management‑level employees are insured, the Company is the owner and is split beneficiary on certain policies. The Company is exposed to credit risk to the extent an insurance company is unable to fulfill its financial obligations under a policy. Split‑dollar life insurance is recorded as an asset at cash surrender value. Increases in the cash value of these policies, as well as insurance proceeds received, are recorded in other non‑interest income and are not subject to income tax.
Income taxes—The Company uses the asset and liability method to account for income taxes. The objective of the asset and liability method is to establish deferred tax assets and liabilities for the temporary differences between the financial reporting basis and the income tax basis of the Company’s assets and liabilities at enacted tax rates expected to be in effect when such amounts are realized or settled. The Company’s annual tax rate is based on its income, statutory tax rates and available tax planning opportunities. Deferred tax assets and liabilities are adjusted through the tax provision for the effects of changes in tax laws and rates on the date of enactment. Tax laws are complex and subject to different interpretations by the taxpayer and respective governmental taxing authorities. Significant judgment is required in determining tax expense and in evaluating tax positions, including evaluating uncertainties.
Deferred income tax assets represent amounts available to reduce income taxes payable on taxable income in future years. Such assets arise because of temporary differences between the financial reporting and tax bases of assets and liabilities, as well as from net operating loss carryforwards. The Company reviews its deferred tax positions periodically and adjusts the balances as new information becomes available. The Company evaluates the recoverability of these future tax deductions by assessing the adequacy of future expected taxable income from all sources, including reversal of taxable temporary differences, forecasted operating earnings and available tax planning strategies. The Company uses short and long‑range business forecasts to provide additional information for its evaluation of the recoverability of deferred tax assets. As of December 31, 2023 and 2022, the Company had
A deferred tax valuation allowance is established to reduce the net carrying amount of deferred tax assets if it is determined to be more likely than not that all or some of the deferred tax asset will not be realized. At December 31, 2023 and 2022, the Company did not record a deferred tax valuation allowance. Deferred tax assets and liabilities are adjusted for the effects of changes in tax laws and rates on the date of enactment.
Derivative financial instruments and hedging activities—The Company enters into derivative transactions principally to protect against the risk of adverse price or interest rate movements on the future cash flows of certain assets. ASC Topic 815, Derivatives and Hedging ("ASC 815"), establishes accounting and reporting standards requiring that every derivative instrument be recorded in the Consolidated Statements of Financial Condition as either an asset or liability measured at its fair value. The accounting for changes in the fair value of a derivative instrument depends on whether it has been designated and qualifies as part of a hedging relationship and on the type of hedging relationship. On the date the derivative contract is entered into, the Company designates the derivative as a fair value hedge, a cash flow hedge, or a non‑designated derivative.
Fair value hedges are accounted for by recording the changes in the fair value of the derivative instrument and the changes in the fair value related to the risk being hedged of the hedged asset or liability on the Consolidated Statements of Financial Condition with corresponding offsets recorded in the Consolidated Statements of Operations. The adjustment to the hedged asset or liability is included in the basis of the hedged item, while the fair value of the derivative is recorded as an asset or liability.
Cash flow hedges are accounted for by recording the changes in the fair value of the derivative instrument in other comprehensive income (loss) and are recognized in the Consolidated Statements of Operations when the hedged item affects earnings.
Derivative instruments that are not designated as hedges according to accounting guidance are reported in the Consolidated Statements of Financial Condition at fair value and the changes in fair value are recognized as non‑interest income during the period of the change.
The Company formally documents the relationship between a derivative instrument and a hedged asset or liability, as well as its risk management objective and strategy for undertaking various hedge transactions. The Company also formally assesses, both at the hedge’s inception and on an ongoing basis, whether the derivatives that are used in the hedging transactions are highly effective in offsetting changes in fair values or cash flows of hedged items.
80
BYLINE BANCORP, INC. AND SUBSIDIARIES
NOTES TO CONSOLIDATED FINANCIAL STATEMENTS
(Table dollars in thousands, except share and per share data)
Note 1—Business and Summary of Significant Accounting Policies (continued)
Comprehensive income—Recognized revenue, expenses, gains and losses are included in net income. Certain changes in assets and liabilities, such as unrealized gains and losses on available‑for‑sale securities and adjustments related to cash flow hedges, are reported on a cumulative basis, net of tax effects, as a separate component of equity on the Consolidated Statements of Financial Condition. Changes in such items, along with net income, are components of comprehensive income.
Advertising expense—Advertising costs are expensed as incurred.
Off‑balance sheet instruments—In the ordinary course of business, the Company has entered into off‑balance sheet arrangements consisting of commitments to extend credit, commercial letters of credit, and standby letters of credit. The face amount for these items represents the exposure to loss, before considering customer collateral or ability to repay. Such financial instruments are recorded in the consolidated financial statements when they are funded or when the related fees are incurred or received.
Segment reporting—The Company has
Loss contingencies—Loss contingencies, including claims and legal actions arising in the ordinary course of business, are recorded as liabilities when the likelihood of loss is probable, and an amount or range of loss can be reasonably estimated. Management does not believe there are any such matters that will have a material effect on the Consolidated Financial Statements for the years ended December 31, 2023, 2022, and 2021.
Share‑based compensation—The Company accounts for share‑based compensation in accordance with ASC Topic 718, Compensation—Stock Compensation ("ASC 718"), which requires compensation cost relating to share‑based compensation transactions be recognized in the Consolidated Statements of Operations, based generally upon the grant‑date fair value of the share‑based compensation granted by the Company. Share‑based awards may have service, market or performance conditions. Refer to Note 18—Share-Based Compensation for additional information.
Earnings per share—Earnings per common share ("EPS") is computed under the two-class method. Pursuant to the two-class method, non-vested stock-based payment awards that contain non-forfeitable rights to dividends or dividend equivalents are participating securities and are included in the computation of EPS. The two-class method is an earnings allocation formula that determines earnings per share for each class of common stock and participating security according to dividends declared (or accumulated) and participation rights in undistributed earnings. Application of the two-class method resulted in the equivalent earnings per share to the treasury method. Basic earnings per common share is computed by dividing net earnings allocated to common stockholders by the weighted-average number of common shares outstanding during the applicable period, excluding outstanding participating securities. Diluted earnings per common share is computed using the weighted-average number of shares determined for the basic earnings per common share computation plus the dilutive effect of stock compensation and warrants for common stock using the treasury stock method.
Dividend restrictions—Banking regulations require maintaining certain capital levels and may limit the dividends paid by the bank to the holding company or by the holding company to stockholders.
Fair value of assets and liabilities—Fair value is defined as the price that would be received to sell an asset, or paid to transfer a liability, including respective accrued interest balances, in an orderly transaction between market participants at the measurement date. The Company determines fair value based upon quoted prices when available or through the use of alternative approaches, such as matrix or model pricing, when market quotes are not readily accessible or available. The valuation techniques used are based on observable and unobservable inputs. Observable inputs reflect market data obtained from independent sources, while unobservable inputs reflect the Company’s market assumptions. Changes in assumptions or in market conditions could significantly affect these estimates.
Reclassifications—Some items in prior years consolidated financial statements were reclassified to conform to the current presentation. Reclassifications had no effect on prior years’ net income or stockholders’ equity.
81
BYLINE BANCORP, INC. AND SUBSIDIARIES
NOTES TO CONSOLIDATED FINANCIAL STATEMENTS
(Table dollars in thousands, except share and per share data)
Note 2—Accounting Pronouncements Recently Issued
The following reflect recent accounting pronouncements that were adopted and are pending adoption by the Company.
Adopted Accounting Pronouncements
Financial Instruments – Credit Losses – Troubled Debt Restructurings and Vintage Disclosures (Topic 326) – In March 2022, the Financial Accounting Standards Board ("FASB") issued Accounting Standards Update ("ASU") No. 2022-02, Credit Losses – Troubled Debt Restructurings and Vintage Disclosures. The Company adopted this update effective March 31, 2023. This update eliminates the recognition and measurement guidance for troubled debt restructurings ("TDRs") by creditors in ASC 310-40. The update also enhances disclosure requirements for certain loan restructurings by creditors when a borrower is experiencing financial difficulty. Specifically, rather than applying the recognition and measurement guidance for TDRs, an entity will apply the loan refinancing and restructuring guidance to determine whether a modification or other form of restructuring results in a new loan or a continuation of an existing loan. Additionally, the amendments in this ASU require a public business entity to disclose current-period gross write-offs by year of origination for financing receivables and net investments in leases in the existing vintage disclosures. Refer to Note 5—Loan and Lease Receivables and Allowance for Credit Losses for additional details regarding these disclosures.
Issued Accounting Pronouncements Pending Adoption
Fair Value Measurement (Topic 820) – In June 2022, the FASB issued ASU No. 2022-03, Fair Value Measurement of Equity Securities Subject to Contractual Sale Restrictions. The guidance in the ASU clarifies that a contractual restriction on the sale of an equity security is not considered part of the unit of account on the equity security and, therefore, is not considered in measuring fair value. The ASU also requires additional disclosures about the restriction. The amendments in this update are effective for fiscal years beginning after December 15, 2023, and interim periods within those fiscal years. The Company is evaluating the accounting and disclosure requirements of this update and does not expect them to have a material effect on the consolidated financial statements.
Business Combinations (Topic 805) – In August 2023, the FASB issued ASU 2023-05, Business Combinations—Joint Venture ("JV") Formations: Recognition and Initial Measurement. The guidance requires newly-formed JVs to apply a new basis of accounting to all of its contributed net assets, which results in the JV initially measuring its contributed net assets under ASC 805-20, Business Combinations. The new guidance would be applied prospectively and is effective for all newly-formed joint venture entities with a formation date on or after January 1, 2025, with early adoption permitted. The Company is evaluating the accounting and disclosure requirements of this update and does not expect them to have a material effect on the consolidated financial statements.
Segment Reporting – Improvements to Reportable Segment Disclosures (Topic 280) – In November 2023, the FASB issued ASU 2023-07 to enhance disclosures about significant segment expenses for public entities reporting segment information under Topic 280. It requires that a public entity disclose, on an annual and interim basis, significant expense categories for each reportable segment. Significant expense categories are derived from expenses that are 1) regularly reported to an entity’s chief operating decision-maker ("CODM"), and 2) included in a segment’s reported measure of profit or loss. The disclosures should include an amount for "other segment items," reflecting the difference between 1) segment revenue less significant segment expenses, and 2) the reportable segment’s profit or loss measures. It requires that a public entity disclose the title and position of the CODM and how the CODM uses the reported measure of profit or loss to assess segment performance and to allocate resources. Further it clarifies that entities with a single reportable segment must disclose both new and existing segment reporting requirements. The amendments are effective for fiscal years beginning after December 15, 2023, and interim periods within fiscal years beginning after December 15, 2024. Entities must adopt the guidance on a retrospective basis. The Company is evaluating the internal control and disclosure requirements of this update and does not expect them to have a material effect on the consolidated financial statements.
Income Taxes – Improvements to Income Tax Disclosures (Topic 740) – In December 2023, the FASB issued ASU 2023-09 to provide additional transparency into an entity’s income tax disclosures primarily related to the rate reconciliation and income taxes paid information. The standard requires that public business entities disclose, on an annual basis, specific categories in the rate reconciliation and additional information for reconciling items meeting a certain quantitative threshold. The amendments also require that entities disclose on an annual basis: 1) income taxes paid (net of refunds received) disaggregated by federal (national), state, and foreign taxes and 2) the income taxes paid (net of refunds received) disaggregated by individual jurisdictions exceeding 5% of total income taxes paid (net of refunds received). The amendments are effective for public business entities for annual periods beginning after December 15, 2024. The Company is evaluating the accounting and disclosure requirements of this update and does not expect them to have a material effect on the consolidated financial statements.
82
BYLINE BANCORP, INC. AND SUBSIDIARIES
NOTES TO CONSOLIDATED FINANCIAL STATEMENTS
(Table dollars in thousands, except share and per share data)
Note 3—Acquisition of a Business
On
In a related but separate transaction, on March 31, 2023, Byline entered into a side letter agreement with the majority shareholder of Inland in which Byline agreed to purchase
At the effective time of the merger (the "Effective Time"), each share of Inland’s common stock was converted into the right to receive: (1)
The transaction resulted in goodwill of $
The acquisition of Inland was accounted for using the acquisition method of accounting in accordance with ASC Topic 805. Assets acquired, liabilities assumed, and consideration exchanged were recorded at their respective acquisition date fair values. Determining the fair value of assets and liabilities involves significant judgment regarding methods and assumptions used to calculate estimated fair values. Fair values are preliminary and subject to refinement for up to one year after the closing date of the acquisition as additional information regarding the closing date fair values become available.
83
BYLINE BANCORP, INC. AND SUBSIDIARIES
NOTES TO CONSOLIDATED FINANCIAL STATEMENTS
(Table dollars in thousands, except share and per share data)
Note 3—Acquisition of a Business (continued)
The following table presents a summary of the preliminary estimates of fair values of assets acquired and liabilities assumed as of the acquisition date:
Assets |
|
|
|
|
Cash and cash equivalents |
|
$ |
|
|
Securities available-for-sale |
|
|
|
|
Restricted stock |
|
|
|
|
Loans |
|
|
|
|
Allowance for credit losses |
|
|
( |
) |
Premises and equipment |
|
|
|
|
Operating lease right-of-use asset |
|
|
|
|
Other intangible assets |
|
|
|
|
Bank-owned life insurance |
|
|
|
|
Deferred tax assets, net |
|
|
|
|
Other assets |
|
|
|
|
Total assets acquired |
|
|
|
|
Liabilities |
|
|
|
|
Deposits |
|
|
|
|
Federal Home Loan Bank advances |
|
|
|
|
Securities sold under agreements to repurchase |
|
|
|
|
Junior subordinated debentures |
|
|
|
|
Operating lease liability |
|
|
|
|
Accrued expenses and other liabilities |
|
|
|
|
Total liabilities assumed |
|
|
|
|
Net assets acquired |
|
$ |
|
|
Consideration paid |
|
|
|
|
Common stock ( |
|
|
|
|
Cash paid |
|
|
|
|
Total consideration paid |
|
|
|
|
Goodwill |
|
$ |
|
|
84
BYLINE BANCORP, INC. AND SUBSIDIARIES
NOTES TO CONSOLIDATED FINANCIAL STATEMENTS
(Table dollars in thousands, except share and per share data)
Note 3—Acquisition of a Business (continued)
The following table presents the fair value and gross contractual amounts receivable of acquired non-credit-deteriorated loans from the Inland acquisition, and their respective expected contractual cash flows as of the acquisition date:
Fair value |
|
$ |
|
|
Gross contractual amounts receivable |
|
|
|
|
Estimate of contractual cash flows not expected to be collected(1) |
|
|
|
|
Estimate of contractual cash flows expected to be collected |
|
|
|
(1)
The following table provides the unaudited pro forma information for the results of operations for the years ended December 31, 2023 and 2022, as if the acquisition had occurred on January 1, 2022. The pro forma results combine the historical results of Inland into the Company’s Consolidated Statements of Operations, including the impact of certain acquisition accounting adjustments, which includes loan discount accretion, intangible assets amortization, deposit premium accretion, fixed assets amortization, and borrowing discount amortization. The pro forma results have been prepared for comparative purposes only and are not necessarily indicative of the results that would have been obtained had the acquisition actually occurred on January 1, 2022. No assumptions have been applied to the pro forma results of operations regarding possible revenue enhancements, provision for credit losses, expense efficiencies or asset dispositions. Recognized acquisition-related expenses and other adjustments related to the timing of expenses, are included in net income in the following table:
|
Year Ended |
|
|||||
|
December 31, |
|
|||||
|
2023 |
|
|
2022 |
|
||
Total revenues (net interest income and non-interest income) |
$ |
|
|
$ |
|
||
Net income |
$ |
|
|
$ |
|
||
Earnings per share—basic |
$ |
|
|
$ |
|
||
Earnings per share—diluted |
$ |
|
|
$ |
|
||
The operating results of the Company include the operating results generated by the acquired assets and assumed liabilities of Inland for the period from July 1, 2023 through December 31, 2023. Revenues and earnings of the acquired company since the acquisition date have not been disclosed as it is not practicable as Inland was merged into the Company and separate financial information is not readily available.
85
BYLINE BANCORP, INC. AND SUBSIDIARIES
NOTES TO CONSOLIDATED FINANCIAL STATEMENTS
(Table dollars in thousands, except share and per share data)
Note 4—Securities
The following tables summarize the amortized cost and fair values of securities available-for-sale, securities held-to-maturity and equity and other securities at December 31, 2023 and 2022 and the corresponding amounts of gross unrealized gains and losses:
2023 |
|
Amortized |
|
|
Gross |
|
|
Gross |
|
|
Fair |
|
||||
Available-for-sale |
|
|
|
|
|
|
|
|
|
|
|
|
||||
U.S. Treasury Notes |
|
$ |
|
|
$ |
|
|
$ |
( |
) |
|
$ |
|
|||
U.S. Government agencies |
|
|
|
|
|
|
|
|
( |
) |
|
|
|
|||
Obligations of states, municipalities, and political |
|
|
|
|
|
|
|
|
( |
) |
|
|
|
|||
Residential mortgage-backed securities |
|
|
|
|
|
|
|
|
|
|
|
|
||||
Agency |
|
|
|
|
|
|
|
|
( |
) |
|
|
|
|||
Non-agency |
|
|
|
|
|
|
|
|
( |
) |
|
|
|
|||
Commercial mortgage-backed securities |
|
|
|
|
|
|
|
|
|
|
|
|
||||
Agency |
|
|
|
|
|
|
|
|
( |
) |
|
|
|
|||
Corporate securities |
|
|
|
|
|
|
|
|
( |
) |
|
|
|
|||
Asset-backed securities |
|
|
|
|
|
|
|
|
( |
) |
|
|
|
|||
Total |
|
$ |
|
|
$ |
|
|
$ |
( |
) |
|
$ |
|
|||
2023 |
|
Amortized |
|
|
Gross |
|
|
Gross |
|
|
Fair |
|
||||
Held-to-maturity |
|
|
|
|
|
|
|
|
|
|
|
|
||||
Obligations of states, municipalities, and political |
|
$ |
|
|
$ |
|
|
$ |
( |
) |
|
$ |
|
|||
Total |
|
$ |
|
|
$ |
|
|
$ |
( |
) |
|
$ |
|
|||
2022 |
|
Amortized |
|
|
Gross |
|
|
Gross |
|
|
Fair |
|
||||
Available-for-sale |
|
|
|
|
|
|
|
|
|
|
|
|
||||
U.S. Treasury Notes |
|
$ |
|
|
$ |
|
|
$ |
( |
) |
|
$ |
|
|||
U.S. Government agencies |
|
|
|
|
|
|
|
|
( |
) |
|
|
|
|||
Obligations of states, municipalities, and political |
|
|
|
|
|
|
|
|
( |
) |
|
|
|
|||
Residential mortgage-backed securities |
|
|
|
|
|
|
|
|
|
|
|
|
||||
Agency |
|
|
|
|
|
|
|
|
( |
) |
|
|
|
|||
Non-agency |
|
|
|
|
|
|
|
|
( |
) |
|
|
|
|||
Commercial mortgage-backed securities |
|
|
|
|
|
|
|
|
|
|
|
|
||||
Agency |
|
|
|
|
|
|
|
|
( |
) |
|
|
|
|||
Corporate securities |
|
|
|
|
|
|
|
|
( |
) |
|
|
|
|||
Asset-backed securities |
|
|
|
|
|
|
|
|
( |
) |
|
|
|
|||
Total |
|
$ |
|
|
$ |
|
|
$ |
( |
) |
|
$ |
|
|||
2022 |
|
Amortized |
|
|
Gross |
|
|
Gross |
|
|
Fair |
|
||||
Held-to-maturity |
|
|
|
|
|
|
|
|
|
|
|
|
||||
Obligations of states, municipalities, and political |
|
$ |
|
|
$ |
|
|
$ |
( |
) |
|
$ |
|
|||
Total |
|
$ |
|
|
$ |
|
|
$ |
( |
) |
|
$ |
|
|||
The Company did
86
BYLINE BANCORP, INC. AND SUBSIDIARIES
NOTES TO CONSOLIDATED FINANCIAL STATEMENTS
(Table dollars in thousands, except share and per share data)
Note 4—Securities (continued)
Gross unrealized losses and fair values, aggregated by investment category and length of time that individual securities have been in a continuous unrealized loss position as of December 31, 2023 and 2022 are summarized as follows:
|
|
|
|
|
Less than 12 Months |
|
|
12 Months or Longer |
|
|
Total |
|
||||||||||||||||
2023 |
|
# of |
|
|
Fair |
|
|
Unrealized |
|
|
Fair |
|
|
Unrealized |
|
|
Fair |
|
|
Unrealized |
|
|||||||
Available-for-sale |
|
|
|
|
|
|
|
|
|
|
|
|
|
|
|
|
|
|
|
|
|
|||||||
U.S. Treasury Notes |
|
|
|
|
$ |
|
|
$ |
( |
) |
|
$ |
|
|
$ |
( |
) |
|
$ |
|
|
$ |
( |
) |
||||
U.S. Government agencies |
|
|
|
|
|
|
|
|
( |
) |
|
|
|
|
|
( |
) |
|
|
|
|
|
( |
) |
||||
Obligations of states, municipalities and |
|
|
|
|
|
|
|
|
( |
) |
|
|
|
|
|
( |
) |
|
|
|
|
|
( |
) |
||||
Residential mortgage-backed securities |
|
|
|
|
|
|
|
|
|
|
|
|
|
|
|
|
|
|
|
|
|
|||||||
Agency |
|
|
|
|
|
|
|
|
( |
) |
|
|
|
|
|
( |
) |
|
|
|
|
|
( |
) |
||||
Non-agency |
|
|
|
|
|
|
|
|
|
|
|
|
|
|
( |
) |
|
|
|
|
|
( |
) |
|||||
Commercial mortgage-backed securities |
|
|
|
|
|
|
|
|
|
|
|
|
|
|
|
|
|
|
|
|
|
|||||||
Agency |
|
|
|
|
|
|
|
|
( |
) |
|
|
|
|
|
( |
) |
|
|
|
|
|
( |
) |
||||
Corporate securities |
|
|
|
|
|
|
|
|
|
|
|
|
|
|
( |
) |
|
|
|
|
|
( |
) |
|||||
Asset-backed securities |
|
|
|
|
|
|
|
|
|
|
|
|
|
|
( |
) |
|
|
|
|
|
( |
) |
|||||
Total |
|
|
|
|
$ |
|
|
$ |
( |
) |
|
$ |
|
|
$ |
( |
) |
|
$ |
|
|
$ |
( |
) |
||||
Held to Maturity |
|
|
|
|
|
|
|
|
|
|
|
|
|
|
|
|
|
|
|
|
|
|||||||
Obligations of states, municipalities and |
|
|
|
|
$ |
|
|
$ |
|
|
$ |
|
|
$ |
( |
) |
|
$ |
|
|
$ |
( |
) |
|||||
Total |
|
|
|
|
$ |
|
|
$ |
|
|
$ |
|
|
$ |
( |
) |
|
$ |
|
|
$ |
( |
) |
|||||
|
|
|
|
|
Less than 12 Months |
|
|
12 Months or Longer |
|
|
Total |
|
||||||||||||||||
2022 |
|
# of |
|
|
Fair |
|
|
Unrealized |
|
|
Fair |
|
|
Unrealized |
|
|
Fair |
|
|
Unrealized |
|
|||||||
Available-for-sale |
|
|
|
|
|
|
|
|
|
|
|
|
|
|
|
|
|
|
|
|
|
|||||||
U.S. Treasury Notes |
|
|
|
|
$ |
|
|
$ |
( |
) |
|
$ |
|
|
$ |
( |
) |
|
$ |
|
|
$ |
( |
) |
||||
U.S. Government agencies |
|
|
|
|
|
|
|
|
( |
) |
|
|
|
|
|
( |
) |
|
|
|
|
|
( |
) |
||||
Obligations of states, municipalities and |
|
|
|
|
|
|
|
|
( |
) |
|
|
|
|
|
( |
) |
|
|
|
|
|
( |
) |
||||
Residential mortgage-backed securities |
|
|
|
|
|
|
|
|
|
|
|
|
|
|
|
|
|
|
|
|
|
|||||||
Agency |
|
|
|
|
|
|
|
|
( |
) |
|
|
|
|
|
( |
) |
|
|
|
|
|
( |
) |
||||
Non-agency |
|
|
|
|
|
|
|
|
( |
) |
|
|
|
|
|
( |
) |
|
|
|
|
|
( |
) |
||||
Commercial mortgage-backed securities |
|
|
|
|
|
|
|
|
|
|
|
|
|
|
|
|
|
|
|
|
|
|||||||
Agency |
|
|
|
|
|
|
|
|
( |
) |
|
|
|
|
|
( |
) |
|
|
|
|
|
( |
) |
||||
Corporate securities |
|
|
|
|
|
|
|
|
( |
) |
|
|
|
|
|
( |
) |
|
|
|
|
|
( |
) |
||||
Asset-backed securities |
|
|
|
|
|
|
|
|
( |
) |
|
|
|
|
|
( |
) |
|
|
|
|
|
( |
) |
||||
Total |
|
|
|
|
$ |
|
|
$ |
( |
) |
|
$ |
|
|
$ |
( |
) |
|
$ |
|
|
$ |
( |
) |
||||
Held to Maturity |
|
|
|
|
|
|
|
|
|
|
|
|
|
|
|
|
|
|
|
|
|
|||||||
Obligations of states, municipalities and |
|
|
|
|
$ |
|
|
$ |
( |
) |
|
$ |
|
|
$ |
|
|
$ |
|
|
$ |
( |
) |
|||||
Total |
|
|
|
|
$ |
|
|
$ |
( |
) |
|
$ |
|
|
$ |
|
|
$ |
|
|
$ |
( |
) |
|||||
87
BYLINE BANCORP, INC. AND SUBSIDIARIES
NOTES TO CONSOLIDATED FINANCIAL STATEMENTS
(Table dollars in thousands, except share and per share data)
Note 4—Securities (continued)
Certain securities have fair values less than amortized cost and, therefore, contain unrealized losses. The Company evaluated the securities which had unrealized losses for potential credit losses and determined there were none. There were
Management measures expected credit losses on held-to-maturity debt securities on a collective basis by major security types. The Company’s held-to-maturity portfolio contains municipal bonds that are typically rated by major rating agencies as ‘Aa’ or better. The Company uses industry historical credit loss information adjusted for current conditions to establish an allowance for credit losses. Accrued interest receivable on securities available-for-sale and held-to-maturity totaled $
The Company anticipates full recovery of amortized cost with respect to these securities by maturity, or sooner, in the event of a more favorable market interest rate environment. The Company does not intend to sell these securities and it is not more likely than not that the Company will be required to sell them before recovery of their amortized cost basis, which may be at maturity.
The proceeds from all sales and calls of securities were available-for-sale, and the associated gains and losses for the years ended December 31, 2023, 2022, and 2021 are listed below:
|
|
2023 |
|
|
2022 |
|
|
2021 |
|
|||
Proceeds |
|
$ |
|
|
$ |
|
|
$ |
|
|||
Gross gains |
|
|
|
|
|
|
|
|
|
|||
Gross losses |
|
|
|
|
|
|
|
|
|
|||
There were $
Securities posted and pledged as collateral at December 31, 2023 and 2022 had carrying amounts of $
At December 31, 2023, the amortized cost and fair value of debt securities are shown by contractual maturity. Expected maturities may differ from contractual maturities if borrowers have the right to call or prepay obligations with or without call or prepayment penalties.
|
|
Amortized |
|
|
Fair |
|
||
Available-for-sale |
|
|
|
|
|
|
||
Due in one year or less |
|
$ |
|
|
$ |
|
||
Due from one to five years |
|
|
|
|
|
|
||
Due from five to ten years |
|
|
|
|
|
|
||
Due after ten years |
|
|
|
|
|
|
||
Mortgage-backed securities |
|
|
|
|
|
|
||
Total |
|
$ |
|
|
$ |
|
||
Held-to-maturity |
|
|
|
|
|
|
||
Due in one year or less |
|
$ |
|
|
$ |
|
||
Due from one to five years |
|
|
|
|
|
|
||
Total |
|
$ |
|
|
$ |
|
||
88
BYLINE BANCORP, INC. AND SUBSIDIARIES
NOTES TO CONSOLIDATED FINANCIAL STATEMENTS
(Table dollars in thousands, except share and per share data)
Note 5—Loans and Lease Receivables and Allowance for Credit Losses
Loan and Lease Receivables
Outstanding loan and lease receivables as of December 31, 2023 and 2022 were categorized as follows:
|
|
2023 |
|
|
2022 |
|
||
Commercial real estate |
|
$ |
|
|
$ |
|
||
Residential real estate |
|
|
|
|
|
|
||
Construction, land development, and other land |
|
|
|
|
|
|
||
Commercial and industrial |
|
|
|
|
|
|
||
Installment and other |
|
|
|
|
|
|
||
Lease financing receivables |
|
|
|
|
|
|
||
Total loans and leases |
|
|
|
|
|
|
||
Net unamortized deferred fees and costs |
|
|
|
|
|
|
||
Initial direct costs |
|
|
|
|
|
|
||
Allowance for credit losses - loans and leases |
|
|
( |
) |
|
|
( |
) |
Net loans and leases |
|
$ |
|
|
$ |
|
||
|
|
2023 |
|
|
2022 |
|
||
Lease financing receivables |
|
|
|
|
|
|
||
Net minimum lease payments |
|
$ |
|
|
$ |
|
||
Unguaranteed residual values |
|
|
|
|
|
|
||
Unearned income |
|
|
( |
) |
|
|
( |
) |
Total lease financing receivables |
|
|
|
|
|
|
||
Initial direct costs |
|
|
|
|
|
|
||
Lease financial receivables before allowance for |
|
$ |
|
|
$ |
|
||
Total loans and leases consist of originated loans and leases, PCD loans, and acquired non-credit-deteriorated loans and leases. At December 31, 2023 and 2022, total loans and leases included the guaranteed amount of U.S. government guaranteed loans of $
The minimum annual lease payments for lease financing receivables as of December 31, 2023 are summarized as follows:
|
|
Minimum Lease |
|
|
2024 |
|
$ |
|
|
2025 |
|
|
|
|
2026 |
|
|
|
|
2027 |
|
|
|
|
2028 |
|
|
|
|
Thereafter |
|
|
|
|
Total |
|
$ |
|
|
89
BYLINE BANCORP, INC. AND SUBSIDIARIES
NOTES TO CONSOLIDATED FINANCIAL STATEMENTS
(Table dollars in thousands, except share and per share data)
Note 5—Loans and Lease Receivables and Allowance for Credit Losses (continued)
Originated loans and leases represent originations excluding loans initially acquired in a business combination. However, once an acquired loan reaches its maturity date, and is re-underwritten and renewed, it is internally classified as an originated loan. PCD loans are loans acquired from a business combination with evidence of more than insignificant credit deterioration and are accounted for under ASC Topic 326. Acquired non-credit-deteriorated loans and leases represent loans and leases acquired from a business combination without more than insignificant evidence of credit deterioration and are accounted for under ASC Topic 310-20.
2023 |
|
Originated |
|
|
Purchased Credit Deteriorated |
|
|
Acquired |
|
|
Total |
|
||||
Commercial real estate |
|
$ |
|
|
$ |
|
|
$ |
|
|
$ |
|
||||
Residential real estate |
|
|
|
|
|
|
|
|
|
|
|
|
||||
Construction, land development, and other land |
|
|
|
|
|
|
|
|
|
|
|
|
||||
Commercial and industrial |
|
|
|
|
|
|
|
|
|
|
|
|
||||
Installment and other |
|
|
|
|
|
|
|
|
|
|
|
|
||||
Lease financing receivables |
|
|
|
|
|
|
|
|
|
|
|
|
||||
Total loans and leases |
|
$ |
|
|
$ |
|
|
$ |
|
|
$ |
|
||||
2022 |
|
Originated |
|
|
Purchased Credit Deteriorated |
|
|
Acquired |
|
|
Total |
|
||||
Commercial real estate |
|
$ |
|
|
$ |
|
|
$ |
|
|
$ |
|
||||
Residential real estate |
|
|
|
|
|
|
|
|
|
|
|
|
||||
Construction, land development, and other land |
|
|
|
|
|
|
|
|
|
|
|
|
||||
Commercial and industrial |
|
|
|
|
|
|
|
|
|
|
|
|
||||
Installment and other |
|
|
|
|
|
|
|
|
|
|
|
|
||||
Lease financing receivables |
|
|
|
|
|
|
|
|
|
|
|
|
||||
Total loans and leases |
|
$ |
|
|
$ |
|
|
$ |
|
|
$ |
|
||||
PCD loans—The unpaid principal balance and carrying amount of all PCD (formerly acquired impaired) loans are summarized below.
|
|
2023 |
|
|
2022 |
|
||||||||||
|
|
Unpaid |
|
|
Carrying |
|
|
Unpaid |
|
|
Carrying |
|
||||
Commercial real estate |
|
$ |
|
|
$ |
|
|
$ |
|
|
$ |
|
||||
Residential real estate |
|
|
|
|
|
|
|
|
|
|
|
|
||||
Construction, land development, and other land |
|
|
|
|
|
|
|
|
|
|
|
|
||||
Commercial and industrial |
|
|
|
|
|
|
|
|
|
|
|
|
||||
Installment and other |
|
|
|
|
|
|
|
|
|
|
|
|
||||
Total purchased credit deteriorated loans |
|
$ |
|
|
$ |
|
|
$ |
|
|
$ |
|
||||
The following table is a reconciliation of the acquired Inland PCD loans between their purchase price and their par value at the time of acquisition. Refer to Note 3—Acquisition of a Business for further information.
Fair value of loans at acquisition |
|
$ |
|
|
Allowance for credit losses - loans and leases, at acquisition |
|
|
|
|
Non-credit discount/premium at acquisition |
|
|
|
|
Par value of acquired PCD loans at acquisition |
|
$ |
|
90
BYLINE BANCORP, INC. AND SUBSIDIARIES
NOTES TO CONSOLIDATED FINANCIAL STATEMENTS
(Table dollars in thousands, except share and per share data)
Note 5—Loans and Lease Receivables and Allowance for Credit Losses (continued)
Acquired non-credit-deteriorated loans and leases—
|
|
2023 |
|
|
2022 |
|
||||||||||
|
|
Unpaid |
|
|
Carrying |
|
|
Unpaid |
|
|
Carrying |
|
||||
Commercial real estate |
|
$ |
|
|
$ |
|
|
$ |
|
|
$ |
|
||||
Residential real estate |
|
|
|
|
|
|
|
|
|
|
|
|
||||
Construction, land development, and other land |
|
|
|
|
|
|
|
|
|
|
|
|
||||
Commercial and industrial |
|
|
|
|
|
|
|
|
|
|
|
|
||||
Installment and other |
|
|
|
|
|
|
|
|
|
|
|
|
||||
Lease financing receivables |
|
|
|
|
|
|
|
|
|
|
|
|
||||
Total acquired non-credit-deteriorated loans and leases |
|
$ |
|
|
$ |
|
|
$ |
|
|
$ |
|
||||
The Company hedges interest rates on certain loans using interest rate swaps through which the Company pays variable amounts and receives fixed amounts. Refer to Note 21—Derivative Instruments and Hedging Activities for additional discussion.
Allowance for Credit Losses
The Company adopted CECL on December 31, 2022, and applied it retroactively to the period beginning January 1, 2022 using the modified retrospective method of accounting. Loans and leases considered for inclusion in the allowance for credit losses include acquired non-credit-deteriorated loans and leases, purchased credit deteriorated loans, and originated loans and leases.
The Bank’s credit risk rating methodology assigns risk ratings from 1 to 10, where a higher rating represents higher risk. Risk ratings for all loans of $
Pass—Ratings 1‑4 define the risk levels of borrowers and guarantors that offer a minimal to an acceptable level of risk.
Watch—A watch asset (rating of 5) has credit exposure that presents higher than average risk and warrants greater than routine attention by Bank personnel due to conditions affecting the borrower, the borrower’s industry or the economic environment.
Special Mention—A special mention asset (rating of 6) has potential weaknesses that deserve management’s close attention. If left uncorrected, these potential weaknesses may result in deterioration of the repayment prospects for the asset or in the Company’s credit position at some future date.
Substandard Accrual—A substandard accrual asset (rating of 7) has well‑defined weakness or weaknesses in cash flow and collateral coverage resulting in a distinct possibility that the Company will sustain some loss if the deficiencies are not corrected. This classification may be used in limited cases, where despite credit severity, the borrower is current on payments and there is an agreed plan for credit remediation.
Substandard Non‑Accrual—A substandard asset (rating of 8) has well‑defined weakness or weaknesses in cash flow and collateral coverage resulting in the distinct possibility that the Company will sustain some loss if the deficiencies are not corrected.
Doubtful—A doubtful asset (rating of 9) has all the weaknesses inherent in one classified substandard with the added characteristic that the weaknesses make collection or liquidation in full, on the basis of currently existing facts, conditions and values, highly questionable and improbable.
Loss—A loss asset (rating of 10) is considered uncollectible and of such little value that its continuance as a realizable asset is not warranted.
Revolving loans that are converted to term loans are treated as new originations in the tables below and are presented by year of initial origination. During the years ended December 31, 2023, and 2022, $
The following tables summarize the risk rating categories of the loans and leases considered for inclusion in the allowance for credit losses calculation as of December 31, 2023 and 2022.
91
BYLINE BANCORP, INC. AND SUBSIDIARIES
NOTES TO CONSOLIDATED FINANCIAL STATEMENTS
(Table dollars in thousands, except share and per share data)
Note 5—Loans and Lease Receivables and Allowance for Credit Losses (continued)
|
|
December 31, 2023 |
|
|||||||||||||||||||||||||||||
|
|
Term loans amortized cost by origination year |
|
|
Revolving |
|
|
Total |
|
|||||||||||||||||||||||
|
|
2023 |
|
|
2022 |
|
|
2021 |
|
|
2020 |
|
|
2019 |
|
|
Prior |
|
|
Loans |
|
|
Loans |
|
||||||||
Commercial Real Estate |
|
|
|
|
|
|
|
|
|
|
|
|
|
|
|
|
|
|
|
|
|
|
|
|
||||||||
Pass |
|
$ |
|
|
$ |
|
|
$ |
|
|
$ |
|
|
$ |
|
|
$ |
|
|
$ |
|
|
$ |
|
||||||||
Watch |
|
|
|
|
|
|
|
|
|
|
|
|
|
|
|
|
|
|
|
|
|
|
|
|
||||||||
Special Mention |
|
|
|
|
|
|
|
|
|
|
|
|
|
|
|
|
|
|
|
|
|
|
|
|
||||||||
Substandard |
|
|
|
|
|
|
|
|
|
|
|
|
|
|
|
|
|
|
|
|
|
|
|
|
||||||||
Total |
|
$ |
|
|
$ |
|
|
$ |
|
|
$ |
|
|
$ |
|
|
$ |
|
|
$ |
|
|
$ |
|
||||||||
Gross charge-offs, year ended December 31, 2023 |
|
$ |
|
|
$ |
|
|
$ |
|
|
$ |
|
|
$ |
|
|
$ |
|
|
$ |
|
|
$ |
|
||||||||
|
|
|
|
|
|
|
|
|
|
|
|
|
|
|
|
|
|
|
|
|
|
|
|
|
||||||||
Residential Real Estate |
|
|
|
|
|
|
|
|
|
|
|
|
|
|
|
|
|
|
|
|
|
|
|
|
||||||||
Pass |
|
$ |
|
|
$ |
|
|
$ |
|
|
$ |
|
|
$ |
|
|
$ |
|
|
$ |
|
|
$ |
|
||||||||
Watch |
|
|
|
|
|
|
|
|
|
|
|
|
|
|
|
|
|
|
|
|
|
|
|
|
||||||||
Special Mention |
|
|
|
|
|
|
|
|
|
|
|
|
|
|
|
|
|
|
|
|
|
|
|
|
||||||||
Substandard |
|
|
|
|
|
|
|
|
|
|
|
|
|
|
|
|
|
|
|
|
|
|
|
|
||||||||
Total |
|
$ |
|
|
$ |
|
|
$ |
|
|
$ |
|
|
$ |
|
|
$ |
|
|
$ |
|
|
$ |
|
||||||||
Gross charge-offs, year ended December 31, 2023 |
|
$ |
|
|
$ |
|
|
$ |
|
|
$ |
|
|
$ |
|
|
$ |
|
|
$ |
|
|
$ |
|
||||||||
|
|
|
|
|
|
|
|
|
|
|
|
|
|
|
|
|
|
|
|
|
|
|
|
|
||||||||
Construction, Land Development, & Land |
|
|
|
|
|
|
|
|
|
|
|
|
|
|
|
|
|
|
|
|
|
|
|
|
||||||||
Pass |
|
$ |
|
|
$ |
|
|
$ |
|
|
$ |
|
|
$ |
|
|
$ |
|
|
$ |
|
|
$ |
|
||||||||
Watch |
|
|
|
|
|
|
|
|
|
|
|
|
|
|
|
|
|
|
|
|
|
|
|
|
||||||||
Special Mention |
|
|
|
|
|
|
|
|
|
|
|
|
|
|
|
|
|
|
|
|
|
|
|
|
||||||||
Substandard |
|
|
|
|
|
|
|
|
|
|
|
|
|
|
|
|
|
|
|
|
|
|
|
|
||||||||
Total |
|
$ |
|
|
$ |
|
|
$ |
|
|
$ |
|
|
$ |
|
|
$ |
|
|
$ |
|
|
$ |
|
||||||||
Gross charge-offs, year ended December 31, 2023 |
|
$ |
|
|
$ |
|
|
$ |
|
|
$ |
|
|
$ |
|
|
$ |
|
|
$ |
|
|
$ |
|
||||||||
|
|
|
|
|
|
|
|
|
|
|
|
|
|
|
|
|
|
|
|
|
|
|
|
|
||||||||
Commercial & Industrial |
|
|
|
|
|
|
|
|
|
|
|
|
|
|
|
|
|
|
|
|
|
|
|
|
||||||||
Pass |
|
$ |
|
|
$ |
|
|
$ |
|
|
$ |
|
|
$ |
|
|
$ |
|
|
$ |
|
|
$ |
|
||||||||
Watch |
|
|
|
|
|
|
|
|
|
|
|
|
|
|
|
|
|
|
|
|
|
|
|
|
||||||||
Special Mention |
|
|
|
|
|
|
|
|
|
|
|
|
|
|
|
|
|
|
|
|
|
|
|
|
||||||||
Substandard |
|
|
|
|
|
|
|
|
|
|
|
|
|
|
|
|
|
|
|
|
|
|
|
|
||||||||
Total |
|
$ |
|
|
$ |
|
|
$ |
|
|
$ |
|
|
$ |
|
|
$ |
|
|
$ |
|
|
$ |
|
||||||||
Gross charge-offs, year ended December 31, 2023 |
|
$ |
|
|
$ |
|
|
$ |
|
|
$ |
|
|
$ |
|
|
$ |
|
|
$ |
|
|
$ |
|
||||||||
|
|
|
|
|
|
|
|
|
|
|
|
|
|
|
|
|
|
|
|
|
|
|
|
|
||||||||
Installment and Other |
|
|
|
|
|
|
|
|
|
|
|
|
|
|
|
|
|
|
|
|
|
|
|
|
||||||||
Pass |
|
$ |
|
|
$ |
|
|
$ |
|
|
$ |
|
|
$ |
|
|
$ |
|
|
$ |
|
|
$ |
|
||||||||
Watch |
|
|
|
|
|
|
|
|
|
|
|
|
|
|
|
|
|
|
|
|
|
|
|
|
||||||||
Special Mention |
|
|
|
|
|
|
|
|
|
|
|
|
|
|
|
|
|
|
|
|
|
|
|
|
||||||||
Substandard |
|
|
|
|
|
|
|
|
|
|
|
|
|
|
|
|
|
|
|
|
|
|
|
|
||||||||
Total |
|
$ |
|
|
$ |
|
|
$ |
|
|
$ |
|
|
$ |
|
|
$ |
|
|
$ |
|
|
$ |
|
||||||||
Gross charge-offs, year ended December 31, 2023 |
|
$ |
|
|
$ |
|
|
$ |
|
|
$ |
|
|
$ |
|
|
$ |
|
|
$ |
|
|
$ |
|
||||||||
|
|
|
|
|
|
|
|
|
|
|
|
|
|
|
|
|
|
|
|
|
|
|
|
|
||||||||
Lease Financing Receivables |
|
|
|
|
|
|
|
|
|
|
|
|
|
|
|
|
|
|
|
|
|
|
|
|
||||||||
Pass |
|
$ |
|
|
$ |
|
|
$ |
|
|
$ |
|
|
$ |
|
|
$ |
|
|
$ |
|
|
$ |
|
||||||||
Watch |
|
|
|
|
|
|
|
|
|
|
|
|
|
|
|
|
|
|
|
|
|
|
|
|
||||||||
Special Mention |
|
|
|
|
|
|
|
|
|
|
|
|
|
|
|
|
|
|
|
|
|
|
|
|
||||||||
Substandard |
|
|
|
|
|
|
|
|
|
|
|
|
|
|
|
|
|
|
|
|
|
|
|
|
||||||||
Total |
|
$ |
|
|
$ |
|
|
$ |
|
|
$ |
|
|
$ |
|
|
$ |
|
|
$ |
|
|
$ |
|
||||||||
Gross charge-offs, year ended December 31, 2023 |
|
$ |
|
|
$ |
|
|
$ |
|
|
$ |
|
|
$ |
|
|
$ |
|
|
$ |
|
|
$ |
|
||||||||
|
|
|
|
|
|
|
|
|
|
|
|
|
|
|
|
|
|
|
|
|
|
|
|
|
||||||||
Total Loans and Leases |
|
|
|
|
|
|
|
|
|
|
|
|
|
|
|
|
|
|
|
|
|
|
|
|
||||||||
Pass |
|
$ |
|
|
$ |
|
|
$ |
|
|
$ |
|
|
$ |
|
|
$ |
|
|
$ |
|
|
$ |
|
||||||||
Watch |
|
|
|
|
|
|
|
|
|
|
|
|
|
|
|
|
|
|
|
|
|
|
|
|
||||||||
Special Mention |
|
|
|
|
|
|
|
|
|
|
|
|
|
|
|
|
|
|
|
|
|
|
|
|
||||||||
Substandard |
|
|
|
|
|
|
|
|
|
|
|
|
|
|
|
|
|
|
|
|
|
|
|
|
||||||||
Total |
|
$ |
|
|
$ |
|
|
$ |
|
|
$ |
|
|
$ |
|
|
$ |
|
|
$ |
|
|
$ |
|
||||||||
Gross charge-offs, year ended December 31, 2023 |
|
$ |
|
|
$ |
|
|
$ |
|
|
$ |
|
|
$ |
|
|
$ |
|
|
$ |
|
|
$ |
|
||||||||
92
BYLINE BANCORP, INC. AND SUBSIDIARIES
NOTES TO CONSOLIDATED FINANCIAL STATEMENTS
(Table dollars in thousands, except share and per share data)
Note 5—Loans and Lease Receivables and Allowance for Credit Losses (continued)
|
|
December 31, 2022 |
|
|||||||||||||||||||||||||||||
|
|
Term loans amortized cost by origination year |
|
|
Revolving |
|
|
Total |
|
|||||||||||||||||||||||
|
|
2022 |
|
|
2021 |
|
|
2020 |
|
|
2019 |
|
|
2018 |
|
|
Prior |
|
|
Loans |
|
|
Loans (1) |
|
||||||||
Commercial Real Estate |
|
|
|
|
|
|
|
|
|
|
|
|
|
|
|
|
|
|
|
|
|
|
|
|
||||||||
Pass |
|
$ |
|
|
$ |
|
|
$ |
|
|
$ |
|
|
$ |
|
|
$ |
|
|
$ |
|
|
$ |
|
||||||||
Watch |
|
|
|
|
|
|
|
|
|
|
|
|
|
|
|
|
|
|
|
|
|
|
|
|
||||||||
Special Mention |
|
|
|
|
|
|
|
|
|
|
|
|
|
|
|
|
|
|
|
|
|
|
|
|
||||||||
Substandard |
|
|
|
|
|
|
|
|
|
|
|
|
|
|
|
|
|
|
|
|
|
|
|
|
||||||||
Total |
|
$ |
|
|
$ |
|
|
$ |
|
|
$ |
|
|
$ |
|
|
$ |
|
|
$ |
|
|
$ |
|
||||||||
Gross charge-offs, year ended December 31, 2022 |
|
$ |
|
|
$ |
|
|
$ |
|
|
$ |
|
|
$ |
|
|
$ |
|
|
$ |
|
|
$ |
|
||||||||
|
|
|
|
|
|
|
|
|
|
|
|
|
|
|
|
|
|
|
|
|
|
|
|
|
||||||||
Residential Real Estate |
|
|
|
|
|
|
|
|
|
|
|
|
|
|
|
|
|
|
|
|
|
|
|
|
||||||||
Pass |
|
$ |
|
|
$ |
|
|
$ |
|
|
$ |
|
|
$ |
|
|
$ |
|
|
$ |
|
|
$ |
|
||||||||
Watch |
|
|
|
|
|
|
|
|
|
|
|
|
|
|
|
|
|
|
|
|
|
|
|
|
||||||||
Special Mention |
|
|
|
|
|
|
|
|
|
|
|
|
|
|
|
|
|
|
|
|
|
|
|
|
||||||||
Substandard |
|
|
|
|
|
|
|
|
|
|
|
|
|
|
|
|
|
|
|
|
|
|
|
|
||||||||
Total |
|
$ |
|
|
$ |
|
|
$ |
|
|
$ |
|
|
$ |
|
|
$ |
|
|
$ |
|
|
$ |
|
||||||||
Gross charge-offs, year ended December 31, 2022 |
|
$ |
|
|
$ |
|
|
$ |
|
|
$ |
|
|
$ |
|
|
$ |
|
|
$ |
|
|
$ |
|
||||||||
|
|
|
|
|
|
|
|
|
|
|
|
|
|
|
|
|
|
|
|
|
|
|
|
|
||||||||
Construction, Land Development, |
|
|
|
|
|
|
|
|
|
|
|
|
|
|
|
|
|
|
|
|
|
|
|
|
||||||||
Pass |
|
$ |
|
|
$ |
|
|
$ |
|
|
$ |
|
|
$ |
|
|
$ |
|
|
$ |
|
|
$ |
|
||||||||
Watch |
|
|
|
|
|
|
|
|
|
|
|
|
|
|
|
|
|
|
|
|
|
|
|
|
||||||||
Special Mention |
|
|
|
|
|
|
|
|
|
|
|
|
|
|
|
|
|
|
|
|
|
|
|
|
||||||||
Substandard |
|
|
|
|
|
|
|
|
|
|
|
|
|
|
|
|
|
|
|
|
|
|
|
|
||||||||
Total |
|
$ |
|
|
$ |
|
|
$ |
|
|
$ |
|
|
$ |
|
|
$ |
|
|
$ |
|
|
$ |
|
||||||||
Gross charge-offs, year ended December 31, 2022 |
|
$ |
|
|
$ |
|
|
$ |
|
|
$ |
|
|
$ |
|
|
$ |
|
|
$ |
|
|
$ |
|
||||||||
|
|
|
|
|
|
|
|
|
|
|
|
|
|
|
|
|
|
|
|
|
|
|
|
|
||||||||
Commercial & Industrial |
|
|
|
|
|
|
|
|
|
|
|
|
|
|
|
|
|
|
|
|
|
|
|
|
||||||||
Pass |
|
$ |
|
|
$ |
|
|
$ |
|
|
$ |
|
|
$ |
|
|
$ |
|
|
$ |
|
|
$ |
|
||||||||
Watch |
|
|
|
|
|
|
|
|
|
|
|
|
|
|
|
|
|
|
|
|
|
|
|
|
||||||||
Special Mention |
|
|
|
|
|
|
|
|
|
|
|
|
|
|
|
|
|
|
|
|
|
|
|
|
||||||||
Substandard |
|
|
|
|
|
|
|
|
|
|
|
|
|
|
|
|
|
|
|
|
|
|
|
|
||||||||
Total |
|
$ |
|
|
$ |
|
|
$ |
|
|
$ |
|
|
$ |
|
|
$ |
|
|
$ |
|
|
$ |
|
||||||||
Gross charge-offs, year ended December 31, 2022 |
|
$ |
|
|
$ |
|
|
$ |
|
|
$ |
|
|
$ |
|
|
$ |
|
|
$ |
|
|
$ |
|
||||||||
|
|
|
|
|
|
|
|
|
|
|
|
|
|
|
|
|
|
|
|
|
|
|
|
|
||||||||
Installment and Other |
|
|
|
|
|
|
|
|
|
|
|
|
|
|
|
|
|
|
|
|
|
|
|
|
||||||||
Pass |
|
$ |
|
|
$ |
|
|
$ |
|
|
$ |
|
|
$ |
|
|
$ |
|
|
$ |
|
|
$ |
|
||||||||
Watch |
|
|
|
|
|
|
|
|
|
|
|
|
|
|
|
|
|
|
|
|
|
|
|
|
||||||||
Special Mention |
|
|
|
|
|
|
|
|
|
|
|
|
|
|
|
|
|
|
|
|
|
|
|
|
||||||||
Substandard |
|
|
|
|
|
|
|
|
|
|
|
|
|
|
|
|
|
|
|
|
|
|
|
|
||||||||
Total |
|
$ |
|
|
$ |
|
|
$ |
|
|
$ |
|
|
$ |
|
|
$ |
|
|
$ |
|
|
$ |
|
||||||||
Gross charge-offs, year ended December 31, 2022 |
|
$ |
|
|
$ |
|
|
$ |
|
|
$ |
|
|
$ |
|
|
$ |
|
|
$ |
|
|
$ |
|
||||||||
|
|
|
|
|
|
|
|
|
|
|
|
|
|
|
|
|
|
|
|
|
|
|
|
|
||||||||
Lease Financing Receivables |
|
|
|
|
|
|
|
|
|
|
|
|
|
|
|
|
|
|
|
|
|
|
|
|
||||||||
Pass |
|
$ |
|
|
$ |
|
|
$ |
|
|
$ |
|
|
$ |
|
|
$ |
|
|
$ |
|
|
$ |
|
||||||||
Watch |
|
|
|
|
|
|
|
|
|
|
|
|
|
|
|
|
|
|
|
|
|
|
|
|
||||||||
Special Mention |
|
|
|
|
|
|
|
|
|
|
|
|
|
|
|
|
|
|
|
|
|
|
|
|
||||||||
Substandard |
|
|
|
|
|
|
|
|
|
|
|
|
|
|
|
|
|
|
|
|
|
|
|
|
||||||||
Total |
|
$ |
|
|
$ |
|
|
$ |
|
|
$ |
|
|
$ |
|
|
$ |
|
|
$ |
|
|
$ |
|
||||||||
Gross charge-offs, year ended December 31, 2022 |
|
$ |
|
|
$ |
|
|
$ |
|
|
$ |
|
|
$ |
|
|
$ |
|
|
$ |
|
|
$ |
|
||||||||
|
|
|
|
|
|
|
|
|
|
|
|
|
|
|
|
|
|
|
|
|
|
|
|
|
||||||||
Total Loans and Leases |
|
|
|
|
|
|
|
|
|
|
|
|
|
|
|
|
|
|
|
|
|
|
|
|
||||||||
Pass |
|
$ |
|
|
$ |
|
|
$ |
|
|
$ |
|
|
$ |
|
|
$ |
|
|
$ |
|
|
$ |
|
||||||||
Watch |
|
|
|
|
|
|
|
|
|
|
|
|
|
|
|
|
|
|
|
|
|
|
|
|
||||||||
Special Mention |
|
|
|
|
|
|
|
|
|
|
|
|
|
|
|
|
|
|
|
|
|
|
|
|
||||||||
Substandard |
|
|
|
|
|
|
|
|
|
|
|
|
|
|
|
|
|
|
|
|
|
|
|
|
||||||||
Total |
|
$ |
|
|
$ |
|
|
$ |
|
|
$ |
|
|
$ |
|
|
$ |
|
|
$ |
|
|
$ |
|
||||||||
Gross charge-offs, year ended December 31, 2022 |
|
$ |
|
|
$ |
|
|
$ |
|
|
$ |
|
|
$ |
|
|
$ |
|
|
$ |
|
|
$ |
|
||||||||
(1)
For the years ended December 31, 2023 and 2022 there were no loans or leases which were risk rated Doubtful or Loss.
93
BYLINE BANCORP, INC. AND SUBSIDIARIES
NOTES TO CONSOLIDATED FINANCIAL STATEMENTS
(Table dollars in thousands, except share and per share data)
Note 5—Loans and Lease Receivables and Allowance for Credit Losses (continued)
The following tables summarize contractual delinquency information of the loans and leases considered for inclusion in the allowance for credit losses - loans and leases calculation at December 31, 2023 and December 31, 2022:
|
|
December 31, 2023 |
|
|||||||||||||||||||||||||||||
|
|
2023 |
|
|
2022 |
|
|
2021 |
|
|
2020 |
|
|
2019 |
|
|
Prior |
|
|
Revolving |
|
|
Total |
|
||||||||
Commercial Real Estate |
|
|
|
|
|
|
|
|
|
|
|
|
|
|
|
|
|
|
|
|
|
|
|
|
||||||||
Current |
|
$ |
|
|
$ |
|
|
$ |
|
|
$ |
|
|
$ |
|
|
$ |
|
|
$ |
|
|
$ |
|
||||||||
30-59 Days Past Due |
|
|
|
|
|
|
|
|
|
|
|
|
|
|
|
|
|
|
|
|
|
|
|
|
||||||||
60-89 Days Past Due |
|
|
|
|
|
|
|
|
|
|
|
|
|
|
|
|
|
|
|
|
|
|
|
|
||||||||
Greater than 90 Accruing |
|
|
|
|
|
|
|
|
|
|
|
|
|
|
|
|
|
|
|
|
|
|
|
|
||||||||
Non-accrual |
|
|
|
|
|
|
|
|
|
|
|
|
|
|
|
|
|
|
|
|
|
|
|
|
||||||||
Total Past Due |
|
|
|
|
|
|
|
|
|
|
|
|
|
|
|
|
|
|
|
|
|
|
|
|
||||||||
Total |
|
$ |
|
|
$ |
|
|
$ |
|
|
$ |
|
|
$ |
|
|
$ |
|
|
$ |
|
|
$ |
|
||||||||
|
|
|
|
|
|
|
|
|
|
|
|
|
|
|
|
|
|
|
|
|
|
|
|
|
||||||||
Residential Real Estate |
|
|
|
|
|
|
|
|
|
|
|
|
|
|
|
|
|
|
|
|
|
|
|
|
||||||||
Current |
|
$ |
|
|
$ |
|
|
$ |
|
|
$ |
|
|
$ |
|
|
$ |
|
|
$ |
|
|
$ |
|
||||||||
30-59 Days Past Due |
|
|
|
|
|
|
|
|
|
|
|
|
|
|
|
|
|
|
|
|
|
|
|
|
||||||||
60-89 Days Past Due |
|
|
|
|
|
|
|
|
|
|
|
|
|
|
|
|
|
|
|
|
|
|
|
|
||||||||
Greater than 90 Accruing |
|
|
|
|
|
|
|
|
|
|
|
|
|
|
|
|
|
|
|
|
|
|
|
|
||||||||
Non-accrual |
|
|
|
|
|
|
|
|
|
|
|
|
|
|
|
|
|
|
|
|
|
|
|
|
||||||||
Total Past Due |
|
|
|
|
|
|
|
|
|
|
|
|
|
|
|
|
|
|
|
|
|
|
|
|
||||||||
Total |
|
$ |
|
|
$ |
|
|
$ |
|
|
$ |
|
|
$ |
|
|
$ |
|
|
$ |
|
|
$ |
|
||||||||
|
|
|
|
|
|
|
|
|
|
|
|
|
|
|
|
|
|
|
|
|
|
|
|
|
||||||||
Construction, Land Development, |
|
|
|
|
|
|
|
|
|
|
|
|
|
|
|
|
|
|
|
|
|
|
|
|
||||||||
Current |
|
$ |
|
|
$ |
|
|
$ |
|
|
$ |
|
|
$ |
|
|
$ |
|
|
$ |
|
|
$ |
|
||||||||
30-59 Days Past Due |
|
|
|
|
|
|
|
|
|
|
|
|
|
|
|
|
|
|
|
|
|
|
|
|
||||||||
60-89 Days Past Due |
|
|
|
|
|
|
|
|
|
|
|
|
|
|
|
|
|
|
|
|
|
|
|
|
||||||||
Greater than 90 Accruing |
|
|
|
|
|
|
|
|
|
|
|
|
|
|
|
|
|
|
|
|
|
|
|
|
||||||||
Non-accrual |
|
|
|
|
|
|
|
|
|
|
|
|
|
|
|
|
|
|
|
|
|
|
|
|
||||||||
Total Past Due |
|
|
|
|
|
|
|
|
|
|
|
|
|
|
|
|
|
|
|
|
|
|
|
|
||||||||
Total |
|
$ |
|
|
$ |
|
|
$ |
|
|
$ |
|
|
$ |
|
|
$ |
|
|
$ |
|
|
$ |
|
||||||||
|
|
|
|
|
|
|
|
|
|
|
|
|
|
|
|
|
|
|
|
|
|
|
|
|
||||||||
Commercial & Industrial |
|
|
|
|
|
|
|
|
|
|
|
|
|
|
|
|
|
|
|
|
|
|
|
|
||||||||
Current |
|
$ |
|
|
$ |
|
|
$ |
|
|
$ |
|
|
$ |
|
|
$ |
|
|
$ |
|
|
$ |
|
||||||||
30-59 Days Past Due |
|
|
|
|
|
|
|
|
|
|
|
|
|
|
|
|
|
|
|
|
|
|
|
|
||||||||
60-89 Days Past Due |
|
|
|
|
|
|
|
|
|
|
|
|
|
|
|
|
|
|
|
|
|
|
|
|
||||||||
Greater than 90 Accruing |
|
|
|
|
|
|
|
|
|
|
|
|
|
|
|
|
|
|
|
|
|
|
|
|
||||||||
Non-accrual |
|
|
|
|
|
|
|
|
|
|
|
|
|
|
|
|
|
|
|
|
|
|
|
|
||||||||
Total Past Due |
|
|
|
|
|
|
|
|
|
|
|
|
|
|
|
|
|
|
|
|
|
|
|
|
||||||||
Total |
|
$ |
|
|
$ |
|
|
$ |
|
|
$ |
|
|
$ |
|
|
$ |
|
|
$ |
|
|
$ |
|
||||||||
|
|
|
|
|
|
|
|
|
|
|
|
|
|
|
|
|
|
|
|
|
|
|
|
|
||||||||
Installment and Other |
|
|
|
|
|
|
|
|
|
|
|
|
|
|
|
|
|
|
|
|
|
|
|
|
||||||||
Current |
|
$ |
|
|
$ |
|
|
$ |
|
|
$ |
|
|
$ |
|
|
$ |
|
|
$ |
|
|
$ |
|
||||||||
30-59 Days Past Due |
|
|
|
|
|
|
|
|
|
|
|
|
|
|
|
|
|
|
|
|
|
|
|
|
||||||||
60-89 Days Past Due |
|
|
|
|
|
|
|
|
|
|
|
|
|
|
|
|
|
|
|
|
|
|
|
|
||||||||
Greater than 90 Accruing |
|
|
|
|
|
|
|
|
|
|
|
|
|
|
|
|
|
|
|
|
|
|
|
|
||||||||
Non-accrual |
|
|
|
|
|
|
|
|
|
|
|
|
|
|
|
|
|
|
|
|
|
|
|
|
||||||||
Total Past Due |
|
|
|
|
|
|
|
|
|
|
|
|
|
|
|
|
|
|
|
|
|
|
|
|
||||||||
Total |
|
$ |
|
|
$ |
|
|
$ |
|
|
$ |
|
|
$ |
|
|
$ |
|
|
$ |
|
|
$ |
|
||||||||
|
|
|
|
|
|
|
|
|
|
|
|
|
|
|
|
|
|
|
|
|
|
|
|
|
||||||||
Lease Financing Receivables |
|
|
|
|
|
|
|
|
|
|
|
|
|
|
|
|
|
|
|
|
|
|
|
|
||||||||
Current |
|
$ |
|
|
$ |
|
|
$ |
|
|
$ |
|
|
$ |
|
|
$ |
|
|
$ |
|
|
$ |
|
||||||||
30-59 Days Past Due |
|
|
|
|
|
|
|
|
|
|
|
|
|
|
|
|
|
|
|
|
|
|
|
|
||||||||
60-89 Days Past Due |
|
|
|
|
|
|
|
|
|
|
|
|
|
|
|
|
|
|
|
|
|
|
|
|
||||||||
Greater than 90 Accruing |
|
|
|
|
|
|
|
|
|
|
|
|
|
|
|
|
|
|
|
|
|
|
|
|
||||||||
Non-accrual |
|
|
|
|
|
|
|
|
|
|
|
|
|
|
|
|
|
|
|
|
|
|
|
|
||||||||
Total Past Due |
|
|
|
|
|
|
|
|
|
|
|
|
|
|
|
|
|
|
|
|
|
|
|
|
||||||||
Total |
|
$ |
|
|
$ |
|
|
$ |
|
|
$ |
|
|
$ |
|
|
$ |
|
|
$ |
|
|
$ |
|
||||||||
|
|
|
|
|
|
|
|
|
|
|
|
|
|
|
|
|
|
|
|
|
|
|
|
|
||||||||
Total Loans and Leases |
|
|
|
|
|
|
|
|
|
|
|
|
|
|
|
|
|
|
|
|
|
|
|
|
||||||||
Current |
|
$ |
|
|
$ |
|
|
$ |
|
|
$ |
|
|
$ |
|
|
$ |
|
|
$ |
|
|
$ |
|
||||||||
30-59 Days Past Due |
|
|
|
|
|
|
|
|
|
|
|
|
|
|
|
|
|
|
|
|
|
|
|
|
||||||||
60-89 Days Past Due |
|
|
|
|
|
|
|
|
|
|
|
|
|
|
|
|
|
|
|
|
|
|
|
|
||||||||
Greater than 90 Accruing |
|
|
|
|
|
|
|
|
|
|
|
|
|
|
|
|
|
|
|
|
|
|
|
|
||||||||
Non-accrual |
|
|
|
|
|
|
|
|
|
|
|
|
|
|
|
|
|
|
|
|
|
|
|
|
||||||||
Total Past Due |
|
|
|
|
|
|
|
|
|
|
|
|
|
|
|
|
|
|
|
|
|
|
|
|
||||||||
Total |
|
$ |
|
|
$ |
|
|
$ |
|
|
$ |
|
|
$ |
|
|
$ |
|
|
$ |
|
|
$ |
|
||||||||
94
BYLINE BANCORP, INC. AND SUBSIDIARIES
NOTES TO CONSOLIDATED FINANCIAL STATEMENTS
(Table dollars in thousands, except share and per share data)
Note 5—Loans and Lease Receivables and Allowance for Credit Losses (continued)
Total non-accrual loans without an allowance included $
|
|
December 31, 2022 |
|
|||||||||||||||||||||||||||||
|
|
2022 |
|
|
2021 |
|
|
2020 |
|
|
2019 |
|
|
2018 |
|
|
Prior |
|
|
Revolving |
|
|
Total |
|
||||||||
Commercial Real Estate |
|
|
|
|
|
|
|
|
|
|
|
|
|
|
|
|
|
|
|
|
|
|
|
|
||||||||
Current |
|
$ |
|
|
$ |
|
|
$ |
|
|
$ |
|
|
$ |
|
|
$ |
|
|
$ |
|
|
$ |
|
||||||||
30-59 Days Past Due |
|
|
|
|
|
|
|
|
|
|
|
|
|
|
|
|
|
|
|
|
|
|
|
|
||||||||
60-89 Days Past Due |
|
|
|
|
|
|
|
|
|
|
|
|
|
|
|
|
|
|
|
|
|
|
|
|
||||||||
Greater than 90 Accruing |
|
|
|
|
|
|
|
|
|
|
|
|
|
|
|
|
|
|
|
|
|
|
|
|
||||||||
Non-accrual |
|
|
|
|
|
|
|
|
|
|
|
|
|
|
|
|
|
|
|
|
|
|
|
|
||||||||
Total Past Due |
|
|
|
|
|
|
|
|
|
|
|
|
|
|
|
|
|
|
|
|
|
|
|
|
||||||||
Total |
|
$ |
|
|
$ |
|
|
$ |
|
|
$ |
|
|
$ |
|
|
$ |
|
|
$ |
|
|
$ |
|
||||||||
|
|
|
|
|
|
|
|
|
|
|
|
|
|
|
|
|
|
|
|
|
|
|
|
|
||||||||
Residential Real Estate |
|
|
|
|
|
|
|
|
|
|
|
|
|
|
|
|
|
|
|
|
|
|
|
|
||||||||
Current |
|
$ |
|
|
$ |
|
|
$ |
|
|
$ |
|
|
$ |
|
|
$ |
|
|
$ |
|
|
$ |
|
||||||||
30-59 Days Past Due |
|
|
|
|
|
|
|
|
|
|
|
|
|
|
|
|
|
|
|
|
|
|
|
|
||||||||
60-89 Days Past Due |
|
|
|
|
|
|
|
|
|
|
|
|
|
|
|
|
|
|
|
|
|
|
|
|
||||||||
Greater than 90 Accruing |
|
|
|
|
|
|
|
|
|
|
|
|
|
|
|
|
|
|
|
|
|
|
|
|
||||||||
Non-accrual |
|
|
|
|
|
|
|
|
|
|
|
|
|
|
|
|
|
|
|
|
|
|
|
|
||||||||
Total Past Due |
|
|
|
|
|
|
|
|
|
|
|
|
|
|
|
|
|
|
|
|
|
|
|
|
||||||||
Total |
|
$ |
|
|
$ |
|
|
$ |
|
|
$ |
|
|
$ |
|
|
$ |
|
|
$ |
|
|
$ |
|
||||||||
|
|
|
|
|
|
|
|
|
|
|
|
|
|
|
|
|
|
|
|
|
|
|
|
|
||||||||
Construction, Land Development, |
|
|
|
|
|
|
|
|
|
|
|
|
|
|
|
|
|
|
|
|
|
|
|
|
||||||||
Current |
|
$ |
|
|
$ |
|
|
$ |
|
|
$ |
|
|
$ |
|
|
$ |
|
|
$ |
|
|
$ |
|
||||||||
30-59 Days Past Due |
|
|
|
|
|
|
|
|
|
|
|
|
|
|
|
|
|
|
|
|
|
|
|
|
||||||||
60-89 Days Past Due |
|
|
|
|
|
|
|
|
|
|
|
|
|
|
|
|
|
|
|
|
|
|
|
|
||||||||
Greater than 90 Accruing |
|
|
|
|
|
|
|
|
|
|
|
|
|
|
|
|
|
|
|
|
|
|
|
|
||||||||
Non-accrual |
|
|
|
|
|
|
|
|
|
|
|
|
|
|
|
|
|
|
|
|
|
|
|
|
||||||||
Total Past Due |
|
|
|
|
|
|
|
|
|
|
|
|
|
|
|
|
|
|
|
|
|
|
|
|
||||||||
Total |
|
$ |
|
|
$ |
|
|
$ |
|
|
$ |
|
|
$ |
|
|
$ |
|
|
$ |
|
|
$ |
|
||||||||
|
|
|
|
|
|
|
|
|
|
|
|
|
|
|
|
|
|
|
|
|
|
|
|
|
||||||||
Commercial & Industrial |
|
|
|
|
|
|
|
|
|
|
|
|
|
|
|
|
|
|
|
|
|
|
|
|
||||||||
Current |
|
$ |
|
|
$ |
|
|
$ |
|
|
$ |
|
|
$ |
|
|
$ |
|
|
$ |
|
|
$ |
|
||||||||
30-59 Days Past Due |
|
|
|
|
|
|
|
|
|
|
|
|
|
|
|
|
|
|
|
|
|
|
|
|
||||||||
60-89 Days Past Due |
|
|
|
|
|
|
|
|
|
|
|
|
|
|
|
|
|
|
|
|
|
|
|
|
||||||||
Greater than 90 Accruing |
|
|
|
|
|
|
|
|
|
|
|
|
|
|
|
|
|
|
|
|
|
|
|
|
||||||||
Non-accrual |
|
|
|
|
|
|
|
|
|
|
|
|
|
|
|
|
|
|
|
|
|
|
|
|
||||||||
Total Past Due |
|
|
|
|
|
|
|
|
|
|
|
|
|
|
|
|
|
|
|
|
|
|
|
|
||||||||
Total |
|
$ |
|
|
$ |
|
|
$ |
|
|
$ |
|
|
$ |
|
|
$ |
|
|
$ |
|
|
$ |
|
||||||||
|
|
|
|
|
|
|
|
|
|
|
|
|
|
|
|
|
|
|
|
|
|
|
|
|
||||||||
Installment and Other |
|
|
|
|
|
|
|
|
|
|
|
|
|
|
|
|
|
|
|
|
|
|
|
|
||||||||
Current |
|
$ |
|
|
$ |
|
|
$ |
|
|
$ |
|
|
$ |
|
|
$ |
|
|
$ |
|
|
$ |
|
||||||||
30-59 Days Past Due |
|
|
|
|
|
|
|
|
|
|
|
|
|
|
|
|
|
|
|
|
|
|
|
|
||||||||
60-89 Days Past Due |
|
|
|
|
|
|
|
|
|
|
|
|
|
|
|
|
|
|
|
|
|
|
|
|
||||||||
Greater than 90 Accruing |
|
|
|
|
|
|
|
|
|
|
|
|
|
|
|
|
|
|
|
|
|
|
|
|
||||||||
Non-accrual |
|
|
|
|
|
|
|
|
|
|
|
|
|
|
|
|
|
|
|
|
|
|
|
|
||||||||
Total Past Due |
|
|
|
|
|
|
|
|
|
|
|
|
|
|
|
|
|
|
|
|
|
|
|
|
||||||||
Total |
|
$ |
|
|
$ |
|
|
$ |
|
|
$ |
|
|
$ |
|
|
$ |
|
|
$ |
|
|
$ |
|
||||||||
|
|
|
|
|
|
|
|
|
|
|
|
|
|
|
|
|
|
|
|
|
|
|
|
|
||||||||
Lease Financing Receivables |
|
|
|
|
|
|
|
|
|
|
|
|
|
|
|
|
|
|
|
|
|
|
|
|
||||||||
Current |
|
$ |
|
|
$ |
|
|
$ |
|
|
$ |
|
|
$ |
|
|
$ |
|
|
$ |
|
|
$ |
|
||||||||
30-59 Days Past Due |
|
|
|
|
|
|
|
|
|
|
|
|
|
|
|
|
|
|
|
|
|
|
|
|
||||||||
60-89 Days Past Due |
|
|
|
|
|
|
|
|
|
|
|
|
|
|
|
|
|
|
|
|
|
|
|
|
||||||||
Greater than 90 Accruing |
|
|
|
|
|
|
|
|
|
|
|
|
|
|
|
|
|
|
|
|
|
|
|
|
||||||||
Non-accrual |
|
|
|
|
|
|
|
|
|
|
|
|
|
|
|
|
|
|
|
|
|
|
|
|
||||||||
Total Past Due |
|
|
|
|
|
|
|
|
|
|
|
|
|
|
|
|
|
|
|
|
|
|
|
|
||||||||
Total |
|
$ |
|
|
$ |
|
|
$ |
|
|
$ |
|
|
$ |
|
|
$ |
|
|
$ |
|
|
$ |
|
||||||||
|
|
|
|
|
|
|
|
|
|
|
|
|
|
|
|
|
|
|
|
|
|
|
|
|
||||||||
Total Loans and Leases |
|
|
|
|
|
|
|
|
|
|
|
|
|
|
|
|
|
|
|
|
|
|
|
|
||||||||
Current |
|
$ |
|
|
$ |
|
|
$ |
|
|
$ |
|
|
$ |
|
|
$ |
|
|
$ |
|
|
$ |
|
||||||||
30-59 Days Past Due |
|
|
|
|
|
|
|
|
|
|
|
|
|
|
|
|
|
|
|
|
|
|
|
|
||||||||
60-89 Days Past Due |
|
|
|
|
|
|
|
|
|
|
|
|
|
|
|
|
|
|
|
|
|
|
|
|
||||||||
Greater than 90 Accruing |
|
|
|
|
|
|
|
|
|
|
|
|
|
|
|
|
|
|
|
|
|
|
|
|
||||||||
Non-accrual |
|
|
|
|
|
|
|
|
|
|
|
|
|
|
|
|
|
|
|
|
|
|
|
|
||||||||
Total Past Due |
|
|
|
|
|
|
|
|
|
|
|
|
|
|
|
|
|
|
|
|
|
|
|
|
||||||||
Total |
|
$ |
|
|
$ |
|
|
$ |
|
|
$ |
|
|
$ |
|
|
$ |
|
|
$ |
|
|
$ |
|
||||||||
95
BYLINE BANCORP, INC. AND SUBSIDIARIES
NOTES TO CONSOLIDATED FINANCIAL STATEMENTS
(Table dollars in thousands, except share and per share data)
Note 5—Loans and Lease Receivables and Allowance for Credit Losses (continued)
Total non-accrual loans without an allowance included $
2023 |
|
Commercial |
|
|
Residential |
|
|
Construction, |
|
|
Commercial |
|
|
Installment |
|
|
Lease |
|
|
Total |
|
|||||||
Allowance for credit losses - loans and leases |
|
|
|
|
|
|
|
|
|
|
|
|
|
|
|
|
|
|
|
|
|
|||||||
Beginning balance |
|
$ |
|
|
$ |
|
|
$ |
|
|
$ |
|
|
$ |
|
|
$ |
|
|
$ |
|
|||||||
Adjustment for acquired PCD loans |
|
|
|
|
|
|
|
|
|
|
|
|
|
|
|
|
|
|
|
|
|
|||||||
Provision/(recapture) |
|
|
|
|
|
( |
) |
|
|
( |
) |
|
|
|
|
|
|
|
|
|
|
|
|
|||||
Charge-offs |
|
|
( |
) |
|
|
( |
) |
|
|
|
|
|
( |
) |
|
|
( |
) |
|
|
( |
) |
|
|
( |
) |
|
Recoveries |
|
|
|
|
|
|
|
|
|
|
|
|
|
|
|
|
|
|
|
|
|
|||||||
Ending balance |
|
$ |
|
|
$ |
|
|
$ |
|
|
$ |
|
|
$ |
|
|
$ |
|
|
$ |
|
|||||||
Ending balance: |
|
|
|
|
|
|
|
|
|
|
|
|
|
|
|
|
|
|
|
|
|
|||||||
Individually evaluated for impairment |
|
$ |
|
|
$ |
|
|
$ |
|
|
$ |
|
|
$ |
|
|
$ |
|
|
$ |
|
|||||||
Collectively evaluated for impairment |
|
|
|
|
|
|
|
|
|
|
|
|
|
|
|
|
|
|
|
|
|
|||||||
Total allowance for credit losses - loans and leases |
|
$ |
|
|
$ |
|
|
$ |
|
|
$ |
|
|
$ |
|
|
$ |
|
|
$ |
|
|||||||
2023 |
|
Commercial |
|
|
Residential |
|
|
Construction, |
|
|
Commercial |
|
|
Installment |
|
|
Lease |
|
|
Total |
|
|||||||
Loans and leases ending balance: |
|
|
|
|
|
|
|
|
|
|
|
|
|
|
|
|
|
|
|
|
|
|||||||
Individually evaluated for |
|
$ |
|
|
$ |
|
|
$ |
|
|
$ |
|
|
$ |
|
|
$ |
|
|
$ |
|
|||||||
Collectively evaluated for |
|
|
|
|
|
|
|
|
|
|
|
|
|
|
|
|
|
|
|
|
|
|||||||
Total loans and leases |
|
$ |
|
|
$ |
|
|
$ |
|
|
$ |
|
|
$ |
|
|
$ |
|
|
$ |
|
|||||||
The allowance for credit losses increased $
96
BYLINE BANCORP, INC. AND SUBSIDIARIES
NOTES TO CONSOLIDATED FINANCIAL STATEMENTS
(Table dollars in thousands, except share and per share data)
Note 5—Loans and Lease Receivables and Allowance for Credit Losses (continued)
2022 |
|
Commercial |
|
|
Residential |
|
|
Construction, |
|
|
Commercial |
|
|
Installment |
|
|
Lease |
|
|
Total |
|
|||||||
Allowance for credit losses - loans and leases |
|
|
|
|
|
|
|
|
|
|
|
|
|
|
|
|
|
|
|
|
|
|||||||
Beginning balance pre-CECL adoption |
|
$ |
|
|
$ |
|
|
$ |
|
|
$ |
|
|
$ |
|
|
$ |
|
|
$ |
|
|||||||
Impact of CECL adoption |
|
|
|
|
|
|
|
|
|
|
|
|
|
|
|
|
|
|
|
|
|
|||||||
Provision/(recapture) |
|
|
|
|
|
|
|
|
|
|
|
|
|
|
( |
) |
|
|
|
|
|
|
||||||
Charge-offs |
|
|
( |
) |
|
|
( |
) |
|
|
( |
) |
|
|
( |
) |
|
|
( |
) |
|
|
( |
) |
|
|
( |
) |
Recoveries |
|
|
|
|
|
|
|
|
|
|
|
|
|
|
|
|
|
|
|
|
|
|||||||
Ending balance |
|
$ |
|
|
$ |
|
|
$ |
|
|
$ |
|
|
$ |
|
|
$ |
|
|
$ |
|
|||||||
Ending balance: |
|
|
|
|
|
|
|
|
|
|
|
|
|
|
|
|
|
|
|
|
|
|||||||
Individually evaluated for impairment |
|
$ |
|
|
$ |
|
|
$ |
|
|
$ |
|
|
$ |
|
|
$ |
|
|
$ |
|
|||||||
Collectively evaluated for impairment |
|
|
|
|
|
|
|
|
|
|
|
|
|
|
|
|
|
|
|
|
|
|||||||
Total allowance for credit losses - loans and leases |
|
$ |
|
|
$ |
|
|
$ |
|
|
$ |
|
|
$ |
|
|
$ |
|
|
$ |
|
|||||||
2022 |
|
Commercial |
|
|
Residential |
|
|
Construction, |
|
|
Commercial |
|
|
Installment |
|
|
Lease |
|
|
Total |
|
|||||||
Loans and leases ending balance: |
|
|
|
|
|
|
|
|
|
|
|
|
|
|
|
|
|
|
|
|
|
|||||||
Individually evaluated for |
|
$ |
|
|
$ |
|
|
$ |
|
|
$ |
|
|
$ |
|
|
$ |
|
|
$ |
|
|||||||
Collectively evaluated for |
|
|
|
|
|
|
|
|
|
|
|
|
|
|
|
|
|
|
|
|
|
|||||||
Total loans and leases |
|
$ |
|
|
$ |
|
|
$ |
|
|
$ |
|
|
$ |
|
|
$ |
|
|
$ |
|
|||||||
2021 |
|
Commercial |
|
|
Residential |
|
|
Construction, |
|
|
Commercial |
|
|
Installment |
|
|
Lease |
|
|
Total |
|
|||||||
Allowance for loan and lease losses |
|
|
|
|
|
|
|
|
|
|
|
|
|
|
|
|
|
|
|
|
|
|||||||
Beginning balance |
|
$ |
|
|
$ |
|
|
$ |
|
|
$ |
|
|
$ |
|
|
$ |
|
|
$ |
|
|||||||
Provision/(recapture) |
|
|
|
|
|
( |
) |
|
|
( |
) |
|
|
( |
) |
|
|
( |
) |
|
|
|
|
|
|
|||
Charge-offs |
|
|
( |
) |
|
|
( |
) |
|
|
( |
) |
|
|
( |
) |
|
|
|
|
|
( |
) |
|
|
( |
) |
|
Recoveries |
|
|
|
|
|
|
|
|
|
|
|
|
|
|
|
|
|
|
|
|
|
|||||||
Ending balance |
|
$ |
|
|
$ |
|
|
$ |
|
|
$ |
|
|
$ |
|
|
$ |
|
|
$ |
|
|||||||
Ending balance: |
|
|
|
|
|
|
|
|
|
|
|
|
|
|
|
|
|
|
|
|
|
|||||||
Individually evaluated for impairment |
|
$ |
|
|
$ |
|
|
$ |
|
|
$ |
|
|
$ |
|
|
$ |
|
|
$ |
|
|||||||
Collectively evaluated for impairment |
|
|
|
|
|
|
|
|
|
|
|
|
|
|
|
|
|
|
|
|
|
|||||||
Loans acquired with deteriorated credit |
|
|
|
|
|
|
|
|
|
|
|
|
|
|
|
|
|
|
|
|
|
|||||||
Total allowance for loan and lease losses |
|
$ |
|
|
$ |
|
|
$ |
|
|
$ |
|
|
$ |
|
|
$ |
|
|
$ |
|
|||||||
2021 |
|
Commercial |
|
|
Residential |
|
|
Construction, |
|
|
Commercial |
|
|
Paycheck Protection Program |
|
|
Installment |
|
|
Lease |
|
|
Total |
|
||||||||
Loans and leases ending balance: |
|
|
|
|
|
|
|
|
|
|
|
|
|
|
|
|
|
|
|
|
|
|
|
|
||||||||
Individually evaluated for |
|
$ |
|
|
$ |
|
|
$ |
|
|
$ |
|
|
$ |
|
|
$ |
|
|
$ |
|
|
$ |
|
||||||||
Collectively evaluated for |
|
|
|
|
|
|
|
|
|
|
|
|
|
|
|
|
|
|
|
|
|
|
|
|
||||||||
Loans acquired with deteriorated |
|
|
|
|
|
|
|
|
|
|
|
|
|
|
|
|
|
|
|
|
|
|
|
|
||||||||
Total loans and leases |
|
$ |
|
|
$ |
|
|
$ |
|
|
$ |
|
|
$ |
|
|
$ |
|
|
$ |
|
|
$ |
|
||||||||
The Company increased the allowance for credit losses - loans and leases by $
97
BYLINE BANCORP, INC. AND SUBSIDIARIES
NOTES TO CONSOLIDATED FINANCIAL STATEMENTS
(Table dollars in thousands, except share and per share data)
Note 5—Loans and Lease Receivables and Allowance for Credit Losses (continued)
The Company increased the allowance for credit losses - loans and leases by $
Comparisons between 2022 and 2021 balances are not presented because of the different classifications used for CECL adoption.
The Company decreased the allowance by $
The following tables summarize the recorded investment, unpaid principal balance, related allowance, average recorded investment, and interest income recognized for loans and leases considered impaired as of December 31, 2021, which excludes acquired impaired loans:
2021 |
|
Recorded |
|
|
Unpaid |
|
|
Related |
|
|
Average |
|
|
Interest |
|
|||||
With no related allowance recorded |
|
|
|
|
|
|
|
|
|
|
|
|
|
|
|
|||||
Commercial real estate |
|
$ |
|
|
$ |
|
|
$ |
— |
|
|
$ |
|
|
$ |
|
||||
Residential real estate |
|
|
|
|
|
|
|
|
— |
|
|
|
|
|
|
|
||||
Commercial and industrial |
|
|
|
|
|
|
|
|
— |
|
|
|
|
|
|
|
||||
With an allowance recorded |
|
|
|
|
|
|
|
|
|
|
|
|
|
|
|
|||||
Commercial real estate |
|
|
|
|
|
|
|
|
|
|
|
|
|
|
|
|||||
Residential real estate |
|
|
|
|
|
|
|
|
|
|
|
|
|
|
|
|||||
Commercial and industrial |
|
|
|
|
|
|
|
|
|
|
|
|
|
|
|
|||||
Total impaired loans |
|
$ |
|
|
$ |
|
|
$ |
|
|
$ |
|
|
$ |
|
|||||
For purposes of these tables, the unpaid principal balance represents the outstanding contractual balance. Impaired loans include loans that are individually evaluated for impairment as well as troubled debt restructurings for all loan categories. The sum of non‑accrual loans and loans past due 90 days still on accrual will differ from the total impaired loan amount.
The following table presents loans with modified terms as of December 31, 2023:
December 31, 2023 |
|
Payment Delay |
|
|
Term Modification |
|
|
Combination Term Modification and Interest Rate Reduction |
|
|
Total Modified by Class |
|
|
% of Class of Loans and Leases |
|
|||||
Modified loans |
|
|
|
|
|
|
|
|
|
|
|
|
|
|
|
|||||
Commercial real estate |
|
$ |
|
|
$ |
|
|
$ |
|
|
$ |
|
|
|
% |
|||||
Commercial and industrial |
|
|
|
|
|
|
|
|
|
|
|
|
|
|
% |
|||||
Total modified loans |
|
$ |
|
|
$ |
|
|
$ |
|
|
$ |
|
|
|
% |
|||||
Loans reflected as having a payment delay included a general adjustment in loan terms similar to those of pass-rated credits. The weighted average term extension (in months) for loans modified during the year ended December 31, 2023 was 18 months. Loans having term modifications included extension of term as a result of a new borrower structure and other miscellaneous term adjustments. Loans having a combination of term modification and interest rate reduction reflect a longer amortization period and a reduction in the weighted average contractual rate of
98
BYLINE BANCORP, INC. AND SUBSIDIARIES
NOTES TO CONSOLIDATED FINANCIAL STATEMENTS
(Table dollars in thousands, except share and per share data)
Note 5—Loans and Lease Receivables and Allowance for Credit Losses (continued)
Prior to 2023, TDRs were granted due to borrower financial difficulty and provide for a modification of loan repayment terms. Trouble debt restructurings are granted due to borrower financial difficulty and provide for a modification of loan repayment terms. TDRs are treated in the same manner as impaired loans for purposes of calculating the allowance for credit losses - loans and leases.
2022 |
|
Number |
|
|
Pre-Modification |
|
|
Post-Modification |
|
|
Charge-offs |
|
|
Individually Evaluated |
|
|||||
Accruing: |
|
|
|
|
|
|
|
|
|
|
|
|
|
|
|
|||||
Commercial real estate |
|
|
|
|
$ |
|
|
$ |
|
|
$ |
— |
|
|
$ |
|
||||
Commercial and industrial |
|
|
|
|
|
|
|
|
|
|
|
— |
|
|
|
|
||||
Residential real estate |
|
|
|
|
|
|
|
|
|
|
|
— |
|
|
|
— |
|
|||
Total accruing |
|
|
|
|
|
|
|
|
|
|
|
— |
|
|
|
|
||||
Non-accruing: |
|
|
|
|
|
|
|
|
|
|
|
|
|
|
|
|||||
Commercial real estate |
|
|
|
|
|
|
|
|
|
|
|
|
|
|
|
|||||
Commercial and industrial |
|
|
|
|
|
|
|
|
|
|
|
|
|
|
|
|||||
Total non-accruing |
|
|
|
|
|
|
|
|
|
|
|
|
|
|
|
|||||
Total troubled debt restructurings |
|
|
|
|
$ |
|
|
$ |
|
|
$ |
|
|
$ |
|
|||||
2021 |
|
Number |
|
|
Pre-Modification |
|
|
Post-Modification |
|
|
Charge-offs |
|
|
Specific |
|
|||||
Accruing: |
|
|
|
|
|
|
|
|
|
|
|
|
|
|
|
|||||
Commercial real estate |
|
|
|
|
$ |
|
|
$ |
|
|
$ |
— |
|
|
$ |
|
||||
Commercial and industrial |
|
|
|
|
|
|
|
|
|
|
|
— |
|
|
|
|
||||
Residential real estate |
|
|
|
|
|
|
|
|
|
|
|
— |
|
|
|
— |
|
|||
Total accruing |
|
|
|
|
|
|
|
|
|
|
|
— |
|
|
|
|
||||
Non-accruing: |
|
|
|
|
|
|
|
|
|
|
|
|
|
|
|
|||||
Commercial real estate |
|
|
|
|
|
|
|
|
|
|
|
|
|
|
|
|||||
Commercial and industrial |
|
|
|
|
|
|
|
|
|
|
|
|
|
|
— |
|
||||
Total non-accruing |
|
|
|
|
|
|
|
|
|
|
|
|
|
|
|
|||||
Total troubled debt restructurings |
|
|
|
|
$ |
|
|
$ |
|
|
$ |
|
|
$ |
|
|||||
There was no commitment outstanding on troubled debt restructurings at December 31, 2022.
99
BYLINE BANCORP, INC. AND SUBSIDIARIES
NOTES TO CONSOLIDATED FINANCIAL STATEMENTS
(Table dollars in thousands, except share and per share data)
Note 5—Loans and Lease Receivables and Allowance for Credit Losses (continued)
Loans modified as troubled debt restructurings that occurred during the years ended December 31, 2022, and 2021:
|
|
For the Year Ended December 31, |
|
|||||
|
|
2022 |
|
|
2021 |
|
||
Accruing: |
|
|
|
|
|
|
||
Beginning balance |
|
$ |
|
|
$ |
|
||
Additions |
|
|
|
|
|
|
||
Net payments |
|
|
( |
) |
|
|
( |
) |
Net transfers (to) from non-accrual |
|
|
|
|
|
( |
) |
|
Ending balance |
|
|
|
|
|
|
||
Non-accruing: |
|
|
|
|
|
|
||
Beginning balance |
|
|
|
|
|
|
||
Additions |
|
|
|
|
|
|
||
Net payments |
|
|
( |
) |
|
|
( |
) |
Charge-offs |
|
|
( |
) |
|
|
( |
) |
Net transfers (to) from accrual |
|
|
|
|
|
|
||
Ending balance |
|
|
|
|
|
|
||
Total troubled debt restructurings |
|
$ |
|
|
$ |
|
||
There were
The following table presents the amortized cost basis of collateral-dependent loans and leases, which are individually evaluated to determine expected credit losses as of December 31, 2023 and 2022:
2023 |
|
Commercial Construction |
|
|
Non-owner Occupied Commercial |
|
|
Owner-Occupied Commercial |
|
|
Multi-Family |
|
|
Single Family Residence (1st Lien) |
|
|
Single Family Residence (2nd Lien) |
|
|
Business Assets |
|
|
Total |
|
||||||||
Commercial real estate |
|
$ |
|
|
$ |
|
|
$ |
|
|
$ |
|
|
$ |
|
|
$ |
|
|
$ |
|
|
$ |
|
||||||||
Residential real estate |
|
|
|
|
|
|
|
|
|
|
|
|
|
|
|
|
|
|
|
|
|
|
|
|
||||||||
Construction, land development, |
|
|
|
|
|
|
|
|
|
|
|
|
|
|
|
|
|
|
|
|
|
|
|
|
||||||||
Commercial and industrial |
|
|
|
|
|
|
|
|
|
|
|
|
|
|
|
|
|
|
|
|
|
|
|
|
||||||||
Total |
|
$ |
|
|
$ |
|
|
$ |
|
|
$ |
|
|
$ |
|
|
$ |
|
|
$ |
|
|
$ |
|
||||||||
|
|
|
|
|
|
|
|
|
|
|
|
|
|
|
|
|
|
|
|
|
|
|
|
|
||||||||
2022 |
|
Commercial Construction |
|
|
Non-owner Occupied Commercial |
|
|
Owner-Occupied Commercial |
|
|
Multi-Family |
|
|
Single Family Residence (1st Lien) |
|
|
Single Family Residence (2nd Lien) |
|
|
Business Assets |
|
|
Total |
|
||||||||
Commercial real estate |
|
$ |
|
|
$ |
|
|
$ |
|
|
$ |
|
|
$ |
|
|
$ |
|
|
$ |
|
|
$ |
|
||||||||
Residential real estate |
|
|
|
|
|
|
|
|
|
|
|
|
|
|
|
|
|
|
|
|
|
|
|
|
||||||||
Construction, land development, |
|
|
|
|
|
|
|
|
|
|
|
|
|
|
|
|
|
|
|
|
|
|
|
|
||||||||
Commercial and industrial |
|
|
|
|
|
|
|
|
|
|
|
|
|
|
|
|
|
|
|
|
|
|
|
|
||||||||
Total |
|
$ |
|
|
$ |
|
|
$ |
|
|
$ |
|
|
$ |
|
|
$ |
|
|
$ |
|
|
$ |
|
||||||||
The following table presents the change in balance for allowance for credit losses - unfunded commitments, which are included in the Consolidated Statement of Financial Condition as part of Accrued expenses and other liabilities, as of December 31, 2023, 2022 and 2021:
|
|
For the Year Ended December 31, |
|
|||||||||
|
|
2023 |
|
|
2022 |
|
|
2021 |
|
|||
Beginning balance |
|
$ |
|
|
$ |
|
|
$ |
|
|||
Impact of CECL adoption |
|
|
|
|
|
|
|
|
— |
|
||
Provision/(recapture) for/of unfunded commitments |
|
|
( |
) |
|
|
|
|
|
( |
) |
|
Ending balance |
|
$ |
|
|
$ |
|
|
$ |
|
|||
100
BYLINE BANCORP, INC. AND SUBSIDIARIES
NOTES TO CONSOLIDATED FINANCIAL STATEMENTS
(Table dollars in thousands, except share and per share data)
Note 6—Servicing Assets
Activity for servicing assets and the related changes in fair value for the years ended December 31, 2023, 2022 and 2021 is as follows:
|
|
2023 |
|
|
2022 |
|
|
2021 |
|
|||
Beginning balance |
|
$ |
|
|
$ |
|
|
$ |
|
|||
Additions, net |
|
|
|
|
|
|
|
|
|
|||
Changes in fair value |
|
|
( |
) |
|
|
( |
) |
|
|
( |
) |
Ending balance |
|
$ |
|
|
$ |
|
|
$ |
|
|||
Loans serviced for others are not included in the Consolidated Statements of Financial Condition. The unpaid principal balances of these loans serviced for others were as follows as of December 31, 2023 and 2022:
|
|
2023 |
|
|
2022 |
|
||
Loan portfolios serviced for: |
|
|
|
|
|
|
||
SBA guaranteed loans |
|
$ |
|
|
$ |
|
||
USDA guaranteed loans |
|
|
|
|
|
|
||
Total |
|
$ |
|
|
$ |
|
||
Loan servicing revenue totaled $
Loan servicing asset revaluation, which represents the changes in fair value of servicing assets, totaled downward valuations of $
The fair value of servicing rights is highly sensitive to changes in underlying assumptions. Changes in secondary market premiums and prepayment speed assumptions have the most significant impact on the fair value of servicing rights. Generally, as interest rates rise on variable rate loans, loan prepayments increase due to an increase in refinance activity, which may result in a decrease in the fair value of servicing assets. Measurement of fair value is limited to the conditions existing, and the assumptions used as of a particular point in time, and those assumptions may change over time. Refer to Note 17—Fair Value Measurement for further details.
Note 7—Other Real Estate Owned
The following table presents the change in OREO for the years ended December 31, 2023, 2022 and 2021:
|
|
2023 |
|
|
2022 |
|
|
2021 |
|
|||
Beginning balance |
|
$ |
|
|
$ |
|
|
$ |
|
|||
Net additions to OREO |
|
|
|
|
|
|
|
|
|
|||
Proceeds from sales of OREO |
|
|
( |
) |
|
|
( |
) |
|
|
( |
) |
Gains (losses) on sales of OREO |
|
|
( |
) |
|
|
|
|
|
|
||
Valuation adjustments |
|
|
( |
) |
|
|
( |
) |
|
|
( |
) |
Ending balance |
|
$ |
|
|
$ |
|
|
$ |
|
|||
At December 31, 2023, the balance of real estate owned did not include any foreclosed residential real estate properties recorded as a result of obtaining physical possession of the property. At December 31, 2022, the balance included $
At December 31, 2023, there was $
There were
101
BYLINE BANCORP, INC. AND SUBSIDIARIES
NOTES TO CONSOLIDATED FINANCIAL STATEMENTS
(Table dollars in thousands, except share and per share data)
Note 8—Premises and Equipment and Assets Held for Sale
Classifications of premises and equipment as of December 31, 2023 and 2022 and were as follows:
|
|
2023 |
|
|
2022 |
|
||
Premises |
|
$ |
|
|
$ |
|
||
Furniture, fixtures and equipment |
|
|
|
|
|
|
||
Leasehold improvements |
|
|
|
|
|
|
||
Total cost |
|
|
|
|
|
|
||
Less accumulated depreciation, amortization and impairment |
|
|
( |
) |
|
|
( |
) |
Net book value of premises, furniture, fixtures, equipment, and leasehold improvements |
|
|
|
|
|
|
||
Construction in progress |
|
|
|
|
|
|
||
Land |
|
|
|
|
|
|
||
Premises and equipment, net |
|
$ |
|
|
$ |
|
||
Depreciation and amortization expense related to premises and equipment for the years ended December 31, 2023, 2022 and 2021 was $
During 2021,
During the year ended December 31, 2021, an impairment charge of $
During 2022,
During 2023,
Branches owned by the Company and actively marketed for sale are transferred to assets held for sale based on the lower of carrying value or fair value, less estimated costs to sell. Assets are considered held for sale when management has approved the sale of the assets following a branch closure or other events.
|
|
2023 |
|
|
2022 |
|
|
2021 |
|
|||
Beginning balance |
|
$ |
|
|
$ |
|
|
$ |
|
|||
Transfers in |
|
|
|
|
|
|
|
|
|
|||
Proceeds from sales |
|
|
( |
) |
|
|
( |
) |
|
|
( |
) |
Net gains on sales |
|
|
|
|
|
|
|
|
|
|||
Impairment charge |
|
|
( |
) |
|
|
( |
) |
|
|
( |
) |
Ending balance |
|
$ |
|
|
$ |
|
|
$ |
|
|||
102
BYLINE BANCORP, INC. AND SUBSIDIARIES
NOTES TO CONSOLIDATED FINANCIAL STATEMENTS
(Table dollars in thousands, except share and per share data)
Note 9—Leases
The Company enters into leases in the normal course of business primarily for its banking facilities and branches. The Company’s operating leases have varying maturity dates through year end
Leases are classified at the lease commencement date. Lease expense for operating leases and short-term leases is recognized on a straight-line basis over the lease term. Right-of-use assets represent our right to use an underlying asset for the lease term and lease liabilities represent our obligation to make lease payments arising from the lease. Right-of-use assets and lease liabilities are recognized at the lease commencement date based on the estimated present value of lease payments over the lease term.
The Company uses its incremental borrowing rate at leases commencement to calculate the present value of lease payments when the rate implicit in a lease is not known. The Company's incremental borrowing rate is based on the FHLB regular advance rate, adjusted for the lease term and other factors. At December 31, 2023, the weighted average discount borrowing rate was
The following table presents certain information related to the lease costs for operating leases included as a component of occupancy expense on the Consolidated Statement of Operations for the years ended December 31, 2023, 2022 and 2021:
|
|
2023 |
|
|
2022 |
|
|
|
2021 |
|
||
Operating lease cost |
|
$ |
|
|
$ |
|
|
$ |
|
|||
Short-term lease cost |
|
|
|
|
|
|
|
|
|
|||
Variable lease cost |
|
|
|
|
|
|
|
|
|
|||
Less: Sublease income |
|
|
( |
) |
|
|
( |
) |
|
|
( |
) |
Total lease cost, net |
|
$ |
|
|
$ |
|
|
$ |
|
|||
Operating cash flows paid for operating lease amounts included in the measure of lease liabilities were $
The Company recorded $
During the year ended December 31, 2023, the Company recorded $
The future minimum lease payments for finance leases and operating leases, subsequent to December 31, 2023, as recorded on the balance sheet, are summarized as follows:
|
|
Operating Lease |
|
|
2024 |
|
$ |
|
|
2025 |
|
|
|
|
2026 |
|
|
|
|
2027 |
|
|
|
|
2028 |
|
|
|
|
Thereafter |
|
|
|
|
Total |
|
$ |
|
|
Imputed interest |
|
|
( |
) |
Present value of future minimum lease payments |
|
$ |
|
|
The total amount of minimum rentals to be received in the future on these subleases is approximately $
103
BYLINE BANCORP, INC. AND SUBSIDIARIES
NOTES TO CONSOLIDATED FINANCIAL STATEMENTS
(Table dollars in thousands, except share and per share data)
Note 10—Goodwill, Core Deposit Intangible and Other Intangible Assets
The Company’s annual goodwill test was performed as of November 30, 2023. The Company determined that no impairment existed as of that date. Refer to Note 1—Business and Summary of Significant Accounting Policies for discussion of goodwill.
The following table summarizes the changes in the Company’s goodwill and core deposit intangible assets for the years ended December 31, 2023, 2022, and 2021:
|
2023 |
|
|
2022 |
|
|
2021 |
|
||||||||||||||||||||||||
|
Goodwill |
|
Core Deposit |
|
|
Customer |
|
|
Goodwill |
|
Core Deposit |
|
|
Customer |
|
|
Goodwill |
|
Core Deposit |
|
|
Customer |
|
|||||||||
Beginning balance |
$ |
|
$ |
|
|
$ |
|
|
$ |
|
$ |
|
|
$ |
|
|
$ |
|
$ |
|
|
$ |
|
|||||||||
Additions |
|
|
|
|
|
|
— |
|
|
|
— |
|
|
— |
|
|
|
— |
|
|
|
— |
|
|
— |
|
|
|
— |
|
||
Amortization or accretion |
|
— |
|
|
( |
) |
|
|
( |
) |
|
|
— |
|
|
( |
) |
|
|
( |
) |
|
|
— |
|
|
( |
) |
|
|
( |
) |
Ending balance |
$ |
|
$ |
|
|
$ |
|
|
$ |
|
$ |
|
|
$ |
|
|
$ |
|
$ |
|
|
$ |
|
|||||||||
Accumulated amortization |
N/A |
|
$ |
|
|
$ |
|
|
N/A |
|
$ |
|
|
$ |
|
|
N/A |
|
$ |
|
|
$ |
|
|||||||||
Weighted average |
N/A |
|
|
|
|
|
N/A |
|
|
|
|
|
N/A |
|
|
|
|
|||||||||||||||
The Company added additional goodwill and core deposit intangible assets in conjunction with the Inland acquisition. Please refer to Note 3—Acquisition of a Business for further details.
The following table presents the estimated amortization expense for core deposit intangible and other intangible assets recognized at December 31, 2023:
|
|
Estimated |
|
|
2024 |
|
$ |
|
|
2025 |
|
|
|
|
2026 |
|
|
|
|
2027 |
|
|
|
|
2028 |
|
|
|
|
Thereafter |
|
|
|
|
Total |
|
$ |
|
|
104
BYLINE BANCORP, INC. AND SUBSIDIARIES
NOTES TO CONSOLIDATED FINANCIAL STATEMENTS
(Table dollars in thousands, except share and per share data)
Note 11—Income Taxes
The following were the components of provision for income taxes for the years ended December 31, 2023, 2022, and 2021:
|
|
2023 |
|
|
2022 |
|
|
2021 |
|
|||
Current tax expense (benefit): |
|
|
|
|
|
|
|
|
|
|||
Federal |
|
$ |
|
|
$ |
( |
) |
|
$ |
|
||
State and local |
|
|
|
|
|
|
|
|
|
|||
Total current tax expense |
|
|
|
|
|
|
|
|
|
|||
Deferred tax expense (benefit): |
|
|
|
|
|
|
|
|
|
|||
Federal |
|
|
|
|
|
|
|
|
|
|||
State and local |
|
|
|
|
|
|
|
|
( |
) |
||
Total deferred tax expense (benefit) |
|
|
|
|
|
|
|
|
( |
) |
||
Provision for income taxes |
|
$ |
|
|
$ |
|
|
$ |
|
|||
|
|
2023 |
|
|
2022 |
|
|
2021 |
|
|
|||
Calculated tax expense at statutory rate |
|
|
|
% |
|
|
% |
|
|
% |
|||
Increase (decrease) in income taxes resulting from: |
|
|
|
|
|
|
|
|
|
|
|||
State taxes, net of federal income tax |
|
|
|
|
|
|
|
|
|
|
|||
Tax exempt income |
|
|
( |
) |
|
|
( |
) |
|
|
( |
) |
|
Share-based compensation |
|
|
( |
) |
|
|
( |
) |
|
|
( |
) |
|
Non-deductible expenses |
|
|
|
|
|
|
|
|
|
|
|||
Total income tax expense |
|
|
|
% |
|
|
% |
|
|
% |
|||
The following were the significant components of the deferred tax assets and liabilities as of December 31, 2023 and 2022:
|
|
2023 |
|
|
2022 |
|
||
Deferred tax assets: |
|
|
|
|
|
|
||
Net operating losses |
|
$ |
|
|
$ |
|
||
Interest on non-accrual loans |
|
|
|
|
|
|
||
Allowance for credit losses - loans and leases and loan basis |
|
|
|
|
|
|
||
Servicing assets |
|
|
|
|
|
|
||
Premises and equipment |
|
|
|
|
|
|
||
Other real estate owned |
|
|
|
|
|
|
||
Net unrealized holding loss on securities available-for-sale |
|
|
|
|
|
|
||
Accrued expenses |
|
|
|
|
|
|
||
Other |
|
|
|
|
|
|
||
Total deferred tax assets |
|
|
|
|
|
|
||
Deferred tax liabilities: |
|
|
|
|
|
|
||
Equipment leasing |
|
|
( |
) |
|
|
( |
) |
Core deposit intangibles |
|
|
( |
) |
|
|
( |
) |
Deposits |
|
|
( |
) |
|
|
|
|
Trust preferred securities |
|
|
( |
) |
|
|
( |
) |
Net unrealized holding gain on cash flow hedges |
|
|
( |
) |
|
|
( |
) |
Other |
|
|
( |
) |
|
|
( |
) |
Total deferred tax liabilities |
|
|
( |
) |
|
|
( |
) |
Net deferred tax assets |
|
$ |
|
|
$ |
|
||
105
BYLINE BANCORP, INC. AND SUBSIDIARIES
NOTES TO CONSOLIDATED FINANCIAL STATEMENTS
(Table dollars in thousands, except share and per share data)
Note 11—Income Taxes (continued)
The following were the gross carryforwards available to offset future taxable income as of December 31, 2023 and 2022:
|
|
2023 |
|
|
2022 |
|
||
Federal gross NOL carryforwards - begin to expire in |
|
$ |
|
|
$ |
|
||
Federal gross NOL carryforwards - with no expiration |
|
|
|
|
|
|
||
Illinois gross NLD carryforwards - begin to expire in |
|
|
|
|
|
|
||
During the second quarter of 2021, Illinois Senate Bill 2017 was passed which created a temporary limitation on Net Loss Deduction ("NLD") usage. For tax years 2021, 2022, and 2023, C Corporations are limited to applying a maximum of $
The Company and the Bank file consolidated income tax returns. The Company and the Bank are no longer subject to United States federal income tax examinations for years before 2020 and state income tax examinations for years before 2019.
Note 12—Deposits
The following is a summary of the Company’s deposits as of December 31, 2023 and 2022:
|
|
December 31, |
|
|
December 31, |
|
||
|
|
2023 |
|
|
2022 |
|
||
Non-interest-bearing demand deposits |
|
$ |
|
|
$ |
|
||
Interest-bearing checking accounts |
|
|
|
|
|
|
||
Money market demand accounts |
|
|
|
|
|
|
||
Other savings |
|
|
|
|
|
|
||
Time deposits (below $250,000) |
|
|
|
|
|
|
||
Time deposits ($250,000 and above) |
|
|
|
|
|
|
||
Total deposits |
|
$ |
|
|
$ |
|
||
There were $
At December 31, 2023, the scheduled maturities of time deposits were as follows:
|
|
Scheduled Maturities |
|
|
2024 |
|
$ |
|
|
2025 |
|
|
|
|
2026 |
|
|
|
|
2027 |
|
|
|
|
2028 |
|
|
|
|
Total |
|
$ |
|
|
The Company hedges interest rates on certain money market accounts using interest rate swaps through which the Company receives variable amounts and pays fixed amounts. Refer to Note 21—Derivative Instruments and Hedging Activities for additional discussion.
106
BYLINE BANCORP, INC. AND SUBSIDIARIES
NOTES TO CONSOLIDATED FINANCIAL STATEMENTS
(Table dollars in thousands, except share and per share data)
Note 13—Other Borrowings
The following is a summary of the Company’s other borrowings as of December 31, 2023 and 2022:
|
|
2023 |
|
|
2022 |
|
||
Federal Home Loan Bank advances |
|
$ |
|
|
$ |
|
||
Securities sold under agreements to repurchase |
|
|
|
|
|
|
||
Term Loan |
|
|
|
|
|
|
||
Line of credit |
|
|
|
|
|
|
||
Total |
|
$ |
|
|
$ |
|
||
Byline Bank has the capacity to borrow funds from the discount window of the FRB. As of December 31, 2023 and 2022, there were
On January 17, 2024, the Company entered into a Letter Agreement with the Federal Reserve Bank of Chicago that allows the Bank to access the Bank Term Funding Program ("BTFP"). On January 22, 2024, the Company opened an advance of $
At December 31, 2023, FHLB fixed-rate advances totaled $
Securities sold under agreements to repurchase represent a demand deposit product offered to customers that sweep balances in excess of the FDIC insurance limit into overnight repurchase agreements. The Company pledges securities as collateral for the repurchase agreements. Refer to Note 4—Securities for additional discussion.
On October 13, 2016, the Company entered into a $
At December 31, 2023, the variable term loan had a $
The following table presents short-term credit lines available for use as of December 31, 2023 and 2022:
|
|
2023 |
|
|
2022 |
|
||
Federal Home Loan Bank line |
|
$ |
|
|
$ |
|
||
Federal Reserve Bank of Chicago discount window line |
|
|
|
|
|
|
||
Available federal funds lines |
|
|
|
|
|
|
||
The Company hedges interest rates on borrowed funds using interest rate swaps through which the Company receives variable amounts and pays fixed amounts. Refer to Note 21—Derivative Instruments and Hedging Activities for additional discussion.
107
BYLINE BANCORP, INC. AND SUBSIDIARIES
NOTES TO CONSOLIDATED FINANCIAL STATEMENTS
(Table dollars in thousands, except share and per share data)
Note 14—Subordinated Notes and Junior Subordinated Debentures
During 2020, the Company issued $
At December 31, 2023 and 2022, the Company’s junior subordinated debentures by issuance were as follows:
|
|
|
|
Aggregate Principal Amount |
|
|
|
|
|
|||||
Name of Trust |
|
Stated |
|
December 31, 2023 |
|
|
December 31, 2022 |
|
|
Contractual Rate at December 31, 2023 |
|
Interest Rate Spread(1) |
||
Metropolitan Statutory Trust I |
|
|
$ |
|
|
$ |
|
|
|
|||||
First Evanston Bancorp Trust I |
|
|
|
|
|
|
|
|
|
|||||
AmeriMark Capital Trust I |
|
|
|
|
|
|
|
|
|
|||||
Inland Bancorp Trust II |
|
|
|
|
|
|
|
|
|
|||||
Inland Bancorp Trust III |
|
|
|
|
|
|
|
|
|
|||||
Inland Bancorp Trust IV |
|
|
|
|
|
|
|
|
|
|||||
Inland Bancorp Trust V |
|
|
|
|
|
|
|
|
|
|||||
Total liability, at par |
|
|
|
|
|
|
|
|
|
|
|
|
||
Discount |
|
|
|
|
( |
) |
|
|
( |
) |
|
|
|
|
Total liability, at carrying value |
|
|
|
$ |
|
|
$ |
|
|
|
|
|
||
(1) SOFR is three month SOFR and the spread adjustment is
In 2004, the Company’s predecessor, Metropolitan Bank Group, Inc., issued $
As part of the acquisition of First Evanston Bancorp, Inc. ("First Evanston"), the Company assumed the obligations to First Evanston Bancorp Trust I of $
As part of the Inland acquisition, the Company assumed the obligations to several trust preferred securities. Refer to Note 3—Acquisition of a Business for further details. Interest rates are calculated as the three-month SOFR plus a tenor spread adjustment of
The Trusts are not consolidated with the Company. Accordingly, the Company reports the subordinated debentures held by the Trusts as liabilities. The Company owns all of the common securities of each trust. The junior subordinated debentures qualify, and are treated as, Tier 1 regulatory capital of the Company subject to regulatory limitations. The trust preferred securities issued by each trust rank equally with the common securities in right of payment, except that if an event of default under the indenture governing the notes has occurred and is continuing, the preferred securities will rank senior to the common securities in right of payment.
108
BYLINE BANCORP, INC. AND SUBSIDIARIES
NOTES TO CONSOLIDATED FINANCIAL STATEMENTS
(Table dollars in thousands, except share and per share data)
Note 15—Employee Benefit Plans
The Company’s defined contribution 401(k) savings plan (the "Plan") covers substantially all employees that have completed certain service requirements. The Board of Directors determines the amount of any discretionary profit sharing contribution made to the Plan. There were
The 401(k) employer match contribution is equal to
On June 14, 2017, the Company’s Board of Directors adopted the Byline Bancorp, Inc. Employee Stock Purchase Plan (the "ESPP") within the meaning of Section 423 of the Internal Revenue Code, as amended. The ESPP allows employees to purchase shares of the Company’s common stock at a discount to the market price of the stock through automatic payroll deductions. A total of
Note 16—Commitments and Contingent Liabilities
Legal contingencies—In the ordinary course of business, the Company and Bank have various outstanding commitments and contingent liabilities that are not recognized in the accompanying consolidated financial statements. In addition, the Company may be a defendant in certain claims and legal actions arising in the ordinary course of business. In the opinion of management, after consultation with legal counsel, the ultimate disposition of these matters is currently not expected to have a material adverse effect on the Company’s Consolidated Financial Statements.
Operating lease commitments—Refer to Note 9—Leases for additional information on operating lease commitments.
Commitments to extend credit—The Company is party to financial instruments with off‑balance sheet risk in the normal course of business to meet the financing needs of its customers. These financial instruments include commitments to extend credit and standby letters of credit. Those instruments involve, to varying degrees, elements of credit and interest rate risk in excess of the amount recognized in the Consolidated Statements of Financial Condition. The contractual or notional amounts of those instruments reflect the extent of involvement the Company has in particular classes of financial instruments.
The Company’s exposure to credit loss in the event of non‑performance by the other party to the financial instrument for commitments to extend credit and letters of credit is represented by the contractual or notional amount of those instruments. The Company uses the same credit policies in making commitments and conditional obligations as it does for funded instruments. The Company does not anticipate any material losses as a result of the commitments and letters of credit. Refer to Note 5—Loans and Lease Receivables and Allowance for Credit Losses for additional information on the allowance for unfunded commitments.
The following table summarizes the contract or notional amount of outstanding loan and lease commitments at December 31, 2023 and 2022:
|
|
2023 |
|
|
2022 |
|
||||||||||||||||||
|
|
Fixed Rate |
|
|
Variable Rate |
|
|
Total |
|
|
Fixed Rate |
|
|
Variable Rate |
|
|
Total |
|
||||||
Commitments to extend credit |
|
$ |
|
|
$ |
|
|
$ |
|
|
$ |
|
|
$ |
|
|
$ |
|
||||||
Letters of credit |
|
|
|
|
|
|
|
|
|
|
|
|
|
|
|
|
|
|
||||||
Total |
|
$ |
|
|
$ |
|
|
$ |
|
|
$ |
|
|
$ |
|
|
$ |
|
||||||
Commitments to extend credit are agreements to lend to a customer as long as there is no violation of any condition established in the contract. Commitments generally have fixed expiration dates or other termination clauses and may require payment of a fee. Since many of the commitments are expected to expire without being drawn upon, the total commitment amount does not necessarily represent future cash requirements. The Company evaluates each customer’s creditworthiness on a case-by-case basis. The amount of collateral obtained, if deemed necessary by the Company upon extension of credit, is based on management’s credit evaluation of the counterparty. Collateral is primarily obtained in the form of commercial and residential real estate (including income producing commercial properties).
Letters of credit are conditional commitments issued by the Company to guarantee to a third-party the performance of a customer. Those guarantees are primarily issued to support public and private borrowing arrangements, bond financing and similar transactions. The credit risk involved in issuing letters of credit is essentially the same as that involved in extending loan facilities to customers.
109
BYLINE BANCORP, INC. AND SUBSIDIARIES
NOTES TO CONSOLIDATED FINANCIAL STATEMENTS
(Table dollars in thousands, except share and per share data)
Note 16—Commitments and Contingent Liabilities (continued)
Commitments to make loans are generally made for periods of
Note 17—Fair Value Measurement
Fair value is the exchange price that would be received for an asset or paid to transfer a liability (exit price) in the principal or most advantageous market for the asset or liability in an orderly transaction between market participants on the measurement date. In addition, the Company has the ability to obtain fair values for markets that are not accessible. These types of inputs create the following fair value hierarchy:
Level 1—Quoted prices in active markets for identical assets or liabilities.
Level 2—Quoted prices for similar instruments in active markets, quoted prices for identical or similar instruments in markets that are not active and model-derived valuations whose inputs are observable or whose significant value drivers are observable.
Level 3—Unobservable inputs that are supported by little or no market activity and that are significant to the fair value of the asset or liability. Unobservable inputs are used to measure fair value to the extent that observable inputs are not available. The Company’s own data used to develop unobservable inputs may be adjusted for market considerations when reasonably available.
The categorization within the valuation hierarchy is based upon the lowest level of input that is significant to the fair value measurement. The Company’s assessment of the significance of a particular input to the fair value measurement in its entirety requires judgment and considers factors specific to assets and liabilities.
The Company used the following methods and significant assumptions to estimate fair value for certain assets measured and carried at fair value on a recurring basis:
Securities available-for-sale—The Company obtains fair value measurements from an independent pricing service. Management reviews the procedures used by the third party, including significant inputs used in the fair value calculations. The fair value measurements consider observable data that may include dealer quotes, market spreads, cash flows, the U.S. Treasury yield curve, live trading levels, trade execution data, market consensus prepayment speeds, credit information and the bond’s terms and conditions, among other things. When market quotes are not readily accessible or available, alternative approaches are utilized, such as matrix or model pricing.
The Company’s methodology for pricing non-rated bonds focuses on three distinct inputs: equivalent rating, yield and other pricing terms. To determine the rating for a given non-rated municipal bond, the Company references a publicly issued bond by the same issuer if available as well as other additional key metrics to support the credit worthiness. Typically, pricing for these types of bonds would require a higher yield than a similar rated bond from the same issuer. A reduction in price is applied to the rating obtained from the comparable bond, as the Company believes if liquidated, a non-rated bond would be valued less than a similar bond with a verifiable rating. The reduction applied by the Company is one notch lower (i.e., a "AA" rating for a comparable bond would be reduced to "AA-" for the Company’s valuation). In 2023 and 2022, all of the ratings derived by the Company were "BBB-" or better with and without comparable bond proxies. The fair value measurement of municipal bonds is sensitive to the rating input, as a higher rating typically results in an increased valuation. The remaining pricing inputs used in the bond valuation are observable. Based on the rating determined, the Company obtains a corresponding current market yield curve available to market participants. Other terms including coupon, maturity date, redemption price, number of coupon payments per year, and accrual method are obtained from the individual bond term sheets.
Equity and other securities—The Company utilizes the same fair value measurement methodology for equity and other securities as detailed in the securities available-sale portfolio above.
Servicing assets—Fair value is based on a loan-by-loan basis taking into consideration the original term to maturity, the current age of the loan and the remaining term to maturity. The valuation methodology utilized for the servicing assets begins with generating estimated future cash flows for each servicing asset, based on their unique characteristics and market-based assumptions for prepayment speeds and costs to service. The present value of the future cash flows are then calculated utilizing market-based discount rate assumptions.
Derivative instruments—Interest rate derivatives are valued by a third party, using models that primarily use market observable inputs, such as yield curves, and are validated by comparison with valuations provided by the respective counterparties. Derivative financial instruments are included in other assets and other liabilities in the Consolidated Statements of Financial Condition.
110
BYLINE BANCORP, INC. AND SUBSIDIARIES
NOTES TO CONSOLIDATED FINANCIAL STATEMENTS
(Table dollars in thousands, except share and per share data)
Note 17—Fair Value Measurement (continued)
The following tables summarize the Company’s financial assets and liabilities that were measured at fair value on a recurring basis at December 31, 2023 and 2022:
|
|
|
|
|
Fair Value Measurements Using |
|
||||||||||
2023 |
|
Fair Value |
|
|
Level 1 |
|
|
Level 2 |
|
|
Level 3 |
|
||||
Financial assets |
|
|
|
|
|
|
|
|
|
|
|
|
||||
Securities available-for-sale |
|
|
|
|
|
|
|
|
|
|
|
|
||||
U.S. Treasury Notes |
|
$ |
|
|
$ |
|
|
$ |
— |
|
|
$ |
— |
|
||
U.S. Government agencies |
|
|
|
|
|
— |
|
|
|
|
|
|
— |
|
||
Obligations of states, municipalities, and political |
|
|
|
|
|
— |
|
|
|
|
|
|
|
|||
Mortgage-backed securities; residential |
|
|
|
|
|
|
|
|
|
|
|
|
||||
Agency |
|
|
|
|
|
— |
|
|
|
|
|
|
— |
|
||
Non-Agency |
|
|
|
|
|
— |
|
|
|
|
|
|
— |
|
||
Mortgage-backed securities; commercial |
|
|
|
|
|
|
|
|
|
|
|
|
||||
Agency |
|
|
|
|
|
— |
|
|
|
|
|
|
— |
|
||
Corporate securities |
|
|
|
|
|
— |
|
|
|
|
|
|
— |
|
||
Asset-backed securities |
|
|
|
|
|
— |
|
|
|
|
|
|
— |
|
||
Equity and other securities, at fair value |
|
|
|
|
|
|
|
|
|
|
|
|
||||
Mutual funds |
|
|
|
|
|
|
|
|
— |
|
|
|
— |
|
||
Equity securities |
|
|
|
|
|
— |
|
|
|
|
|
|
|
|||
Servicing assets |
|
|
|
|
|
— |
|
|
|
— |
|
|
|
|
||
|
|
|
|
|
— |
|
|
|
|
|
|
— |
|
|||
Financial liabilities |
|
|
|
|
|
|
|
|
|
|
|
|
||||
|
|
|
|
|
— |
|
|
|
|
|
|
— |
|
|||
|
|
|
|
|
Fair Value Measurements Using |
|
||||||||||
2022 |
|
Fair Value |
|
|
Level 1 |
|
|
Level 2 |
|
|
Level 3 |
|
||||
Financial assets |
|
|
|
|
|
|
|
|
|
|
|
|
||||
Securities available-for-sale |
|
|
|
|
|
|
|
|
|
|
|
|
||||
U.S. Treasury Notes |
|
$ |
|
|
$ |
|
|
$ |
— |
|
|
$ |
— |
|
||
U.S. Government agencies |
|
|
|
|
|
— |
|
|
|
|
|
|
— |
|
||
Obligations of states, municipalities, and political |
|
|
|
|
|
— |
|
|
|
|
|
|
— |
|
||
Mortgage-backed securities; residential |
|
|
|
|
|
|
|
|
|
|
|
|
||||
Agency |
|
|
|
|
|
— |
|
|
|
|
|
|
— |
|
||
Non-Agency |
|
|
|
|
|
— |
|
|
|
|
|
|
— |
|
||
Mortgage-backed securities; commercial |
|
|
|
|
|
|
|
|
|
|
|
|
||||
Agency |
|
|
|
|
|
— |
|
|
|
|
|
|
— |
|
||
Corporate securities |
|
|
|
|
|
|
|
|
|
|
|
— |
|
|||
Asset-backed securities |
|
|
|
|
|
— |
|
|
|
|
|
|
— |
|
||
Equity and other securities, at fair value |
|
|
|
|
|
|
|
|
|
|
|
|
||||
Mutual funds |
|
|
|
|
|
|
|
|
— |
|
|
|
— |
|
||
Equity securities |
|
|
|
|
|
— |
|
|
|
|
|
|
|
|||
Servicing assets |
|
|
|
|
|
— |
|
|
|
— |
|
|
|
|
||
|
|
|
|
|
— |
|
|
|
|
|
|
— |
|
|||
Financial liabilities |
|
|
|
|
|
|
|
|
|
|
|
|
||||
|
|
|
|
|
— |
|
|
|
|
|
|
— |
|
|||
111
BYLINE BANCORP, INC. AND SUBSIDIARIES
NOTES TO CONSOLIDATED FINANCIAL STATEMENTS
(Table dollars in thousands, except share and per share data)
Note 17—Fair Value Measurement (continued)
The Company has originated, and acquired through a business combination, servicing assets classified as Level 3 of the fair value hierarchy. The Company acquired single‑issuer trust preferred securities which are categorized as Level 3 of the fair value hierarchy. These securities are classified as equity securities consistent with accounting guidance.
The Company did
The following table presents additional information about financial assets measured at fair value on recurring basis for which the Company used significant unobservable inputs (Level 3):
|
Years Ended December 31, |
|
|||||||||||||
|
2023 |
|
|
2022 |
|
|
2023 |
|
|
2022 |
|
||||
|
Investment Securities |
|
|
Servicing Assets |
|
||||||||||
Balance, beginning of period |
$ |
|
|
$ |
|
|
$ |
|
|
$ |
|
||||
|
|
|
|
|
|
|
|
|
|
|
|||||
Maturities |
|
( |
) |
|
|
|
|
|
|
|
|
|
|||
Accretion |
|
|
|
|
|
|
|
|
|
|
|
||||
|
( |
) |
|
|
( |
) |
|
|
( |
) |
|
|
( |
) |
|
Balance, end of period |
$ |
|
|
$ |
|
|
$ |
|
|
$ |
|
||||
The following table presents additional information about the unobservable inputs used in the fair value measurements on recurring basis that were categorized within Level 3 of the fair value hierarchy as of December 31, 2023:
Financial Instruments |
|
Valuation Technique |
|
Unobservable Inputs |
|
Range of |
|
Weighted |
|
|
Impact to |
|
Single issuer trust preferred |
|
Discounted cash flow |
|
|
|
|
% |
|
||||
|
Discounted cash flow |
|
Prepayment speeds |
|
( |
|
|
% |
|
|||
|
|
|
|
Discount rate |
|
( |
|
|
% |
|
||
|
|
|
|
Expected weighted |
|
|
|
|
||||
The Company used the following methods and significant assumptions to estimate fair value for certain assets measured and carried at fair value on a
Individually Evaluated Loans—The Company individually evaluates loans that do not share similar risk characteristics, including non-accrual loans. Specific allowance for credit losses is measured based on a discounted cash flow of ongoing operations, discounted at the loan’s original effective interest rate, or a calculation of the fair value of the underlying collateral less estimated selling costs. Valuations of individually assessed loans that are collateral dependent are supported by third party appraisals in accordance with the Bank’s credit policy. Accordingly, individually evaluated loans are classified as Level 3.
Assets held for sale—Assets held for sale consist of former branch locations and real estate previously purchased for expansion. Assets are considered held for sale when management has approved to sell the assets following a branch closure or other events. The properties are being actively marketed and transferred to assets held for sale based on the lower of carrying value or its fair value, less estimated costs to sell.
Other real estate owned—Certain assets held within other real estate owned represent real estate or other collateral that has been adjusted to its estimated fair value, less cost to sell, as a result of transferring from the loan portfolio at the time of foreclosure or repossession and based on management’s periodic impairment evaluation. From time to time, non-recurring fair value adjustments to other real estate owned are recorded to reflect partial write-downs based on an observable market price or current appraised value of property.
112
BYLINE BANCORP, INC. AND SUBSIDIARIES
NOTES TO CONSOLIDATED FINANCIAL STATEMENTS
(Table dollars in thousands, except share and per share data)
Note 17—Fair Value Measurement (continued)
Adjustments to fair value based on such non-recurring transactions generally result from the application of lower-of-cost-or-market accounting or write-downs of individual assets due to impairment.
|
|
|
|
|
Fair Value Measurements Using |
|
||||||||||
2023 |
|
Fair Value |
|
|
Level 1 |
|
|
Level 2 |
|
|
Level 3 |
|
||||
Non-recurring |
|
|
|
|
|
|
|
|
|
|
|
|
||||
Individually evaluated loans |
|
|
|
|
|
|
|
|
|
|
|
|
||||
Commercial real estate |
|
$ |
|
|
$ |
— |
|
|
$ |
— |
|
|
$ |
|
||
Residential real estate |
|
|
|
|
|
— |
|
|
|
— |
|
|
|
|
||
Construction, land development, and other land |
|
|
|
|
|
— |
|
|
|
— |
|
|
|
|
||
Commercial and industrial |
|
|
|
|
|
— |
|
|
|
— |
|
|
|
|
||
Assets held for sale |
|
|
|
|
|
— |
|
|
|
— |
|
|
|
|
||
Other real estate owned |
|
|
|
|
|
— |
|
|
|
— |
|
|
|
|
||
|
|
|
|
|
Fair Value Measurements Using |
|
||||||||||
2022 |
|
Fair Value |
|
|
Level 1 |
|
|
Level 2 |
|
|
Level 3 |
|
||||
Non-recurring |
|
|
|
|
|
|
|
|
|
|
|
|
||||
Individually evaluated loans |
|
|
|
|
|
|
|
|
|
|
|
|
||||
Commercial real estate |
|
$ |
|
|
$ |
— |
|
|
$ |
— |
|
|
$ |
|
||
Residential real estate |
|
|
|
|
|
— |
|
|
|
— |
|
|
|
|
||
Construction, land development, and other land |
|
|
|
|
|
— |
|
|
|
— |
|
|
|
|
||
Commercial and industrial |
|
|
|
|
|
— |
|
|
|
— |
|
|
|
|
||
Assets held for sale |
|
|
|
|
|
— |
|
|
|
— |
|
|
|
|
||
Other real estate owned |
|
|
|
|
|
— |
|
|
|
— |
|
|
|
|
||
The following methods and assumptions were used by the Company in estimating fair values of other assets and liabilities for disclosure purposes:
Cash and due from banks and interest bearing deposits with other banks—For these short-term instruments, the carrying amount is a reasonable estimate of fair value.
Securities held-to-maturity—The Company obtains fair value measurements from an independent pricing service. Management reviews the procedures used by the third party, including significant inputs used in the fair value calculations. The fair value measurements consider observable data that may include dealer quotes, market spreads, cash flows, the U.S. Treasury yield curve, live trading levels, trade execution data, market consensus prepayment speeds, credit information and the bond’s terms and conditions, among other things. When market quotes are not readily accessible or available, alternative approaches are utilized, such as matrix or model pricing.
Restricted stock—The fair value has been determined to approximate cost.
Loans held for sale—The fair value of loans held for sale are based on quoted market prices, where available, and determined by discounted estimated cash flows using interest rates approximating the Company’s current origination rates for similar loans adjusted to reflect the inherent credit risk.
Loan and lease receivables, net—For certain variable rate loans that reprice frequently and with no significant changes in credit risk, fair value is estimated at carrying value. The fair value of other types of loans is estimated using an exit price notion for 2023 and 2022 values. It is estimated by discounting future cash flows, using current rates at which similar loans would be made to borrowers with similar credit ratings and for the same remaining maturities.
Deposits—The fair value of demand deposits, savings accounts, and money market deposits is the amount payable on demand at the reporting date. The fair value of fixed-maturity certificates of deposit is estimated by discounting future cash flows, using rates currently offered for deposits of similar remaining maturities.
113
BYLINE BANCORP, INC. AND SUBSIDIARIES
NOTES TO CONSOLIDATED FINANCIAL STATEMENTS
(Table dollars in thousands, except share and per share data)
Note 17—Fair Value Measurement (continued)
Federal Home Loan Bank advances—The fair value of FHLB advances is estimated by discounting the agreements based on maturities using rates currently offered for FHLB advances of similar remaining maturities adjusted for prepayment penalties that would be incurred if the borrowings were paid off on the measurement date.
Securities sold under agreements to repurchase—The carrying amount approximates fair value due to maturities of less than ninety days.
Term loan—The carrying amount approximates fair value, given the variable interest rate and repricing of interest.
Line of credit—The carrying amount approximates fair value, given the variable interest rate and repricing of interest.
Subordinated notes—The fair value is based on available market prices.
Junior subordinated debentures—The fair value of junior subordinated debentures, in the form of trust preferred securities, is determined using rates currently available to the Company for debt with similar terms and remaining maturities.
Accrued interest receivable and payable—The carrying amount approximates fair value.
Commitments to extend credit and letters of credit—The fair values of these off-balance sheet commitments to extend credit and commercial and letters of credit are not considered practicable to estimate because of the lack of quoted market prices and the inability to estimate fair value without incurring excessive costs.
The estimated fair values of financial instruments not carried at fair value and levels within the fair value hierarchy at December 31, 2023 and 2022 are as follows:
|
Fair Value |
|
|
2023 |
|
|
2022 |
|
|||||||||||
|
Hierarchy |
|
|
Carrying |
|
|
Estimated |
|
|
Carrying |
|
|
Estimated |
|
|||||
Financial assets |
|
|
|
|
|
|
|
|
|
|
|
|
|
|
|||||
Cash and due from banks |
|
1 |
|
|
$ |
|
|
$ |
|
|
$ |
|
|
$ |
|
||||
Interest bearing deposits with other banks |
|
2 |
|
|
|
|
|
|
|
|
|
|
|
|
|
||||
Securities held-to-maturity |
|
2 |
|
|
|
|
|
|
|
|
|
|
|
|
|
||||
Restricted stock |
|
2 |
|
|
|
|
|
|
|
|
|
|
|
|
|
||||
Loans held for sale |
|
3 |
|
|
|
|
|
|
|
|
|
|
|
|
|
||||
Loans and lease receivables, net (less individually |
|
3 |
|
|
|
|
|
|
|
|
|
|
|
|
|
||||
Accrued interest receivable |
|
3 |
|
|
|
|
|
|
|
|
|
|
|
|
|
||||
Financial liabilities |
|
|
|
|
|
|
|
|
|
|
|
|
|
|
|||||
Non-interest-bearing deposits |
|
2 |
|
|
|
|
|
|
|
|
|
|
|
|
|
||||
Interest-bearing deposits |
|
2 |
|
|
|
|
|
|
|
|
|
|
|
|
|
||||
Accrued interest payable |
|
2 |
|
|
|
|
|
|
|
|
|
|
|
|
|
||||
Federal Home Loan Bank advances |
|
2 |
|
|
|
|
|
|
|
|
|
|
|
|
|
||||
Securities sold under repurchase agreement |
|
2 |
|
|
|
|
|
|
|
|
|
|
|
|
|
||||
Term loan |
|
2 |
|
|
|
|
|
|
|
|
|
|
|
|
|
||||
Line of credit |
|
2 |
|
|
|
|
|
|
|
|
|
|
|
|
|
||||
Subordinated notes |
|
2 |
|
|
|
|
|
|
|
|
|
|
|
|
|
||||
Junior subordinated debentures |
|
3 |
|
|
|
|
|
|
|
|
|
|
|
|
|
||||
114
BYLINE BANCORP, INC. AND SUBSIDIARIES
NOTES TO CONSOLIDATED FINANCIAL STATEMENTS
(Table dollars in thousands, except share and per share data)
Note 18—Share-Based Compensation
In June 2017, the Company's Board of Directors adopted, and the Company's stockholder approved, the 2017 Omnibus Incentive Compensation Plan (the "Omnibus Plan"). The Omnibus Plan provides for the grant of stock options, stock appreciation rights, restricted stock, restricted stock units, dividend equivalent rights and other equity-based, equity-related or cash-based awards. A total of
The Company primarily grants time-based restricted share awards that vest over a to
During 2023, the Company granted
The following table discloses the changes in all unvested restricted shares for the year ended December 31, 2023:
|
|
Omnibus Plan |
|
|||||
|
|
Number of Shares |
|
|
Weighted Average Grant Date Fair Value |
|
||
Beginning balance, January 1, 2023 |
|
|
|
|
$ |
|
||
Granted |
|
|
|
|
|
|
||
Incremental performance shares vested and issued |
|
|
|
|
|
|
||
Vested |
|
|
( |
) |
|
|
|
|
Forfeited |
|
|
( |
) |
|
|
|
|
Ending balance outstanding at December 31, 2023 |
|
|
|
|
|
|
||
A total of
The Company recognizes share-based compensation based on the estimated fair value of the restricted stock at the grant date. The fair value of the total stock return performance-based awards granted in 2023 were calculated based on a Monte Carlo simulation, using expected volatilities between
The following table summarizes restricted stock compensation expense for the years ended:
|
|
Years Ended December 31, |
|
|||||||||
|
|
2023 |
|
|
2022 |
|
|
2021 |
|
|||
Total share-based compensation - restricted stock |
|
$ |
|
|
$ |
|
|
$ |
|
|||
Income tax benefit |
|
|
|
|
|
|
|
|
|
|||
Unrecognized compensation expense - restricted stock |
|
|
|
|
|
|
|
|
|
|||
Weighted-average amortization period remaining |
|
|
|
|
|
|
||||||
The fair value of the unvested restricted stock awards at December 31, 2023 was $
115
BYLINE BANCORP, INC. AND SUBSIDIARIES
NOTES TO CONSOLIDATED FINANCIAL STATEMENTS
(Table dollars in thousands, except share and per share data)
Note 18—Share-Based Compensation (continued)
During February 2024, the Company granted
In October 2014, the Company adopted the Byline Bancorp, Inc. Equity Incentive Plan ("BYB Plan"). The maximum number of shares available for grants under this plan was
The types of stock options granted under the BYB Plan were Time Options and Performance Options. The exercise price of each option is equal to the fair value of the stock as of the date of grant. These option awards had vesting periods ranging from to
The fair values of the stock options were determined using the Black-Scholes-Merton model for Time Options and a Monte Carlo simulation model for Performance Options.
The following table discloses the activity in shares subject to options and the weighted average exercise prices, in actual dollars, for the year ended December 31, 2023:
|
|
BYB Plan |
|
|||||||||||||
|
|
Number of Shares |
|
|
Weighted Average Exercise Price |
|
|
Intrinsic Value |
|
|
Weighted Average Remaining Contractual Term (in Years) |
|
||||
Beginning balance, January 1, 2023 |
|
|
|
|
$ |
|
|
$ |
|
|
|
|
||||
Expired |
|
|
— |
|
|
|
|
|
|
|
|
|
|
|||
Exercised |
|
|
— |
|
|
|
|
|
|
|
|
|
|
|||
Forfeited |
|
|
— |
|
|
|
|
|
|
|
|
|
|
|||
Ending balance outstanding at December 31, 2023 |
|
|
|
|
$ |
|
|
$ |
|
|
|
|
||||
Exercisable at December 31, 2023 |
|
|
|
|
$ |
|
|
$ |
|
|
|
|
||||
Pursuant to the terms of the Agreement and Plan of Merger with First Evanston and its subsidiaries, dated as of November 27, 2017 (the "First Evanston Merger Agreement"), each outstanding First Evanston option held by a participant in the First Evanston Bancorp, Inc. Stock Incentive Plan (the "FEB Plan") ceased to represent a right to acquire shares of First Evanston common stock and was assumed and converted automatically into a fully vested and exercisable adjusted option to purchase shares of Byline common stock (each an "Adjusted Option"). In accordance with the First Evanston Merger Agreement, the number of shares of Byline common stock to which each such Adjusted Option relates is equal to the product (rounded down to the nearest whole share of Byline common stock) of: (a) the number of shares of First Evanston common stock subject to the First Evanston option immediately prior to May 31, 2018, multiplied by (b)
116
BYLINE BANCORP, INC. AND SUBSIDIARIES
NOTES TO CONSOLIDATED FINANCIAL STATEMENTS
(Table dollars in thousands, except share and per share data)
Note 18—Share-Based Compensation (continued)
The following table discloses the activity in shares subject to options under the FEB Plan and the weighted average exercise prices, in actual dollars, for the year ended December 31, 2023:
|
|
FEB Plan |
|
|||||||||||||
|
|
Number of Shares |
|
|
Weighted Average Exercise Price |
|
|
Intrinsic Value |
|
|
Weighted Average Remaining Contractual Term (in Years) |
|
||||
Beginning balance, January 1, 2023 |
|
|
|
|
$ |
|
|
$ |
|
|
|
|
||||
Exercised |
|
|
( |
) |
|
$ |
|
|
$ |
|
|
|
|
|||
Forfeited |
|
|
— |
|
|
|
|
|
|
|
|
|
|
|||
Expired |
|
|
— |
|
|
|
|
|
|
|
|
|
|
|||
Ending balance outstanding at December 31, 2023 |
|
|
|
|
$ |
|
|
$ |
|
|
|
|
||||
Exercisable at December 31, 2023 |
|
|
|
|
$ |
|
|
$ |
|
|
|
|
||||
A total of
Note 19—Related Party Transactions
Loans to related parties—Loans that may be made to the Bank’s executive officers, as defined in 12 CFR 215 (Regulation O), directors, principal stockholders and their affiliates are on substantially the same terms, including interest rates and collateral, as those prevailing at the time for comparable transactions with unrelated persons and do not involve more than normal risk of collectability. As of December 31, 2023 and 2022, there were no material loans made to the related parties as described.
Deposits from related parties—Deposits from related parties were not material as of December 31, 2023 and 2022.
117
BYLINE BANCORP, INC. AND SUBSIDIARIES
NOTES TO CONSOLIDATED FINANCIAL STATEMENTS
(Table dollars in thousands, except share and per share data)
Note 20—Regulatory Capital Requirements
The Company and the Bank are subject to various regulatory capital requirements administered by their respective banking agencies. Failure to meet minimum capital requirements can initiate certain mandatory and possibly additional discretionary actions by regulators that, if undertaken, could have a direct material effect on the Company’s financial statements.
Under capital adequacy guidelines and the regulatory framework for prompt corrective action, the Company and the Bank must meet specific capital guidelines that involve quantitative measures of their assets, liabilities and certain off‑balance sheet items as calculated under regulatory accounting practices. The capital amounts and classification are also subject to qualitative judgments by the regulators about components, risk weightings and other factors. Quantitative measures established by regulation to ensure capital adequacy require the Company and the Bank to maintain minimum amounts and ratios of Common Equity Tier 1 capital ("CET1"), Tier 1 capital and total capital to risk‑weighted assets and of Tier 1 capital to average consolidated assets, as defined in the regulations.
As of December 31, 2023, the most recent notification from the FDIC categorized the Bank as well‑capitalized under the framework for prompt corrective action. There are no conditions or events since that notification that management believes have changed the Bank’s category.
The required regulatory capital ratios are set forth in the following tables along with the minimum capital amounts required for the Company and the Bank and the minimum capital amount required for the Bank to be considered to be well capitalized.
|
|
Actual |
|
|
Minimum Capital |
|
|
Required to be |
|
|||||||||||||||
2023 |
|
Amount |
|
|
Ratio |
|
|
Amount |
|
|
Ratio |
|
|
Amount |
|
|
Ratio |
|
||||||
Total capital to risk weighted assets: |
|
|
|
|
|
|
|
|
|
|
|
|
|
|
|
|
|
|
||||||
Company |
|
$ |
|
|
|
% |
|
$ |
|
|
|
% |
|
N/A |
|
|
N/A |
|
||||||
Bank |
|
|
|
|
|
% |
|
|
|
|
|
% |
|
$ |
|
|
|
% |
||||||
Tier 1 capital to risk weighted assets: |
|
|
|
|
|
|
|
|
|
|
|
|
|
|
|
|
|
|
||||||
Company |
|
$ |
|
|
|
% |
|
$ |
|
|
|
% |
|
N/A |
|
|
N/A |
|
||||||
Bank |
|
|
|
|
|
% |
|
|
|
|
|
% |
|
$ |
|
|
|
% |
||||||
Common Equity Tier 1 (CET1) to risk weighted |
|
|
|
|
|
|
|
|
|
|
|
|
|
|
|
|
|
|
||||||
Company |
|
$ |
|
|
|
% |
|
$ |
|
|
|
% |
|
N/A |
|
|
N/A |
|
||||||
Bank |
|
|
|
|
|
% |
|
|
|
|
|
% |
|
$ |
|
|
|
% |
||||||
Tier 1 capital to average assets: |
|
|
|
|
|
|
|
|
|
|
|
|
|
|
|
|
|
|
||||||
Company |
|
$ |
|
|
|
% |
|
$ |
|
|
|
% |
|
N/A |
|
|
N/A |
|
||||||
Bank |
|
|
|
|
|
% |
|
|
|
|
|
% |
|
$ |
|
|
|
% |
||||||
|
|
Actual |
|
|
Minimum Capital |
|
|
Required to be |
|
|||||||||||||||
2022 |
|
Amount |
|
|
Ratio |
|
|
Amount |
|
|
Ratio |
|
|
Amount |
|
|
Ratio |
|
||||||
Total capital to risk weighted assets: |
|
|
|
|
|
|
|
|
|
|
|
|
|
|
|
|
|
|
||||||
Company |
|
$ |
|
|
|
% |
|
$ |
|
|
|
% |
|
N/A |
|
|
N/A |
|
||||||
Bank |
|
|
|
|
|
% |
|
|
|
|
|
% |
|
$ |
|
|
|
% |
||||||
Tier 1 capital to risk weighted assets: |
|
|
|
|
|
|
|
|
|
|
|
|
|
|
|
|
|
|
||||||
Company |
|
$ |
|
|
|
% |
|
$ |
|
|
|
% |
|
N/A |
|
|
N/A |
|
||||||
Bank |
|
|
|
|
|
% |
|
|
|
|
|
% |
|
$ |
|
|
|
% |
||||||
Common Equity Tier 1 (CET1) to risk weighted |
|
|
|
|
|
|
|
|
|
|
|
|
|
|
|
|
|
|
||||||
Company |
|
$ |
|
|
|
% |
|
$ |
|
|
|
% |
|
N/A |
|
|
N/A |
|
||||||
Bank |
|
|
|
|
|
% |
|
|
|
|
|
% |
|
$ |
|
|
|
% |
||||||
Tier 1 capital to average assets: |
|
|
|
|
|
|
|
|
|
|
|
|
|
|
|
|
|
|
||||||
Company |
|
$ |
|
|
|
% |
|
$ |
|
|
|
% |
|
N/A |
|
|
N/A |
|
||||||
Bank |
|
|
|
|
|
% |
|
|
|
|
|
% |
|
$ |
|
|
|
% |
||||||
118
BYLINE BANCORP, INC. AND SUBSIDIARIES
NOTES TO CONSOLIDATED FINANCIAL STATEMENTS
(Table dollars in thousands, except share and per share data)
Note 20—Regulatory Capital Requirements (continued)
The Company and Byline Bank must maintain a capital conservation buffer consisting of CET1 capital greater than
Provisions of state and federal banking regulations may limit, by statute, the amount of dividends that may be paid to the Company by Byline Bank without prior approval of Byline Bank’s regulatory agencies. The Company is economically dependent on the cash dividends received from Byline Bank. These dividends represent the Company’s primary cash flow from operating activities used to service its obligations. For years ended December 31, 2023 and 2022, the Company received $
Note 21—Derivative Instruments and Hedge Activities
As required by ASC 815, the Company records all derivatives on the balance sheet at fair value. The accounting for changes in the fair value of derivatives depends on the intended use of the derivative, whether the Company has elected to designate a derivative in a hedging relationship and apply hedge accounting and whether the hedging relationship has satisfied the criteria necessary to apply hedge accounting. The Company records derivative assets and derivative liabilities on the Consolidated Statements of Financial Condition within accrued interest receivable and other assets and accrued interest payable and other liabilities, respectively.
|
|
2023 |
|
|
2022 |
|
||||||||||||||||||
|
|
|
|
|
Fair Value |
|
|
|
|
|
Fair Value |
|
||||||||||||
|
|
Notional |
|
|
Other |
|
|
Other |
|
|
Notional |
|
|
Other |
|
|
Other |
|
||||||
Derivatives designated as hedging instruments |
|
|
|
|
|
|
|
|
|
|
|
|
|
|
|
|
|
|
||||||
Interest rate swaps designated |
|
$ |
|
|
$ |
|
|
$ |
|
|
$ |
|
|
$ |
|
|
$ |
|
||||||
Derivatives not designated as hedging instruments |
|
|
|
|
|
|
|
|
|
|
|
|
|
|
|
|
|
|
||||||
Other interest rate derivatives |
|
|
|
|
|
|
|
|
( |
) |
|
|
|
|
|
|
|
|
( |
) |
||||
Other credit derivatives |
|
|
|
|
|
|
|
|
|
|
|
|
|
|
|
|
|
|
||||||
Total derivatives |
|
$ |
|
|
$ |
|
|
$ |
( |
) |
|
$ |
|
|
$ |
|
|
$ |
( |
) |
||||
As of the effective time of the transaction reported in Note 3—Acquisition of a Business, Byline acquired and assumed two types of derivative instruments. Interest rate swap agreements previously designated as cash flow hedges of certain junior subordinated debentures issued to capital trusts had notional amounts of $
Interest rate swaps designated as cash flow hedges—Cash flow hedges of interest payments associated with certain other borrowings had notional amounts totaling $
As of December 31, 2023, pay-fixed interest rate swaps are comprised of six effective hedges. Receive-fixed interest rate swaps totaling $
119
BYLINE BANCORP, INC. AND SUBSIDIARIES
NOTES TO CONSOLIDATED FINANCIAL STATEMENTS
(Table dollars in thousands, except share and per share data)
Note 21—Derivative Instruments and Hedge Activities (continued)
For derivatives designated and that qualify as cash flow hedges of interest rate risk, the unrealized gain or loss on the derivatives is recorded in accumulated other comprehensive income (loss) and subsequently reclassified into interest income or expense in the same period during which the hedged transaction affects earnings. Amounts reported in accumulated other comprehensive income (loss) related to derivatives will be reclassified to interest income or expense as interest payments are made on the hedged instruments. Interest recorded on these swap transactions included $
Accumulated other comprehensive income also includes the amortization of the remaining balance related to terminated interest rate swaps designated as cash flow hedges, which are over the original life of the cash flow hedge. In March 2023, the Company terminated interest rate swaps designated as cash flow hedges totaling $
The following table reflects the cash flow hedges as of December 31, 2023:
Notional amounts |
|
$ |
|
|
Derivative assets fair value |
|
|
|
|
Derivative liabilities fair value |
|
|
|
|
Weighted average remaining maturity |
|
|
||
Receive rates are determined at the time the swaps become effective. As of December 31, 2023, the weighted average pay rates of the six effective pay-fixed hedges for $
The following table reflects the net gains (losses) recorded in accumulated other comprehensive income (loss) and the Consolidated Statements of Operations relating to the cash flow derivative instruments for the years ended December 31, 2023 and 2022:
|
|
2023 |
|
|
2022 |
|
||||||||||||||||||
|
|
Amount of |
|
|
Amount of Gain |
|
|
Amount of |
|
|
Amount of |
|
|
Amount of Gain |
|
|
Amount of |
|
||||||
|
$ |
|
|
$ |
|
|
$ |
|
|
$ |
|
|
$ |
|
|
$ |
|
|||||||
Derivatives not designated as hedges are not speculative and are used to manage the Company’s exposure to interest rate movements and other identified risks but do not meet the strict hedge accounting requirements and/or the Company has not elected to apply hedge accounting. Changes in the fair value of derivatives not designated in hedging relationships are recorded directly in earnings.
Other interest rate derivatives—The total combined notional amount was $
120
BYLINE BANCORP, INC. AND SUBSIDIARIES
NOTES TO CONSOLIDATED FINANCIAL STATEMENTS
(Table dollars in thousands, except share and per share data)
Note 21—Derivative Instruments and Hedge Activities (continued)
These instruments are inherently subject to market risk and credit risk. Market risk is associated with changes in interest rates and credit risk relates to the Company’s risk of loss when the counterparty to a derivative contract fails to perform according to the terms of the agreement. Market and credit risks are managed and monitored as part of the Company’s overall asset-liability management process. The credit risk related to derivatives entered into with certain qualified borrowers is managed through the Company’s loan underwriting process. The Company’s loan underwriting process also approves the Bank’s swap counterparty used to mirror the borrowers’ swap. The Company has a bilateral agreement with each swap counterparty that provides that fluctuations in derivative values are to be fully collateralized with either cash or securities.
The following table reflects other interest rate derivatives as of December 31, 2023:
Notional amounts |
|
$ |
|
|
Derivative assets fair value |
|
|
|
|
Derivative liabilities fair value |
|
|
|
|
Weighted average pay rates |
|
|
% |
|
Weighted average receive rates |
|
|
% |
|
Weighted average remaining maturity |
|
|
||
Other credit derivatives—The Company has entered into risk participation agreements with counterparty banks to assume or sell a portion of the credit risk related to borrower transactions. As of December 31, 2023, the total notional amount of risk participated in was $
The Company has agreements with its derivative counterparties that contain a cross-default provision under which if the Company defaults on any of its indebtedness, including default where repayment of the indebtedness has not been accelerated by the lender, then the Company could also be declared in default on its derivative obligations. The Company also has agreements with certain derivative counterparties that contain a provision where if the Company fails to maintain its status as a well or adequately capitalized institution, then the counterparty could terminate the derivative positions and the Company would be required to settle its obligations resulted in a net asset position.
The following table reflects amounts included in non-interest income in the Consolidated Statements of Operations relating to derivative instruments that are not designated in a hedging relationship for the years ended December 31, 2023, 2022, and 2021:
|
|
2023 |
|
|
2022 |
|
|
2021 |
|
|||
Other interest rate derivatives |
|
$ |
( |
) |
|
$ |
|
|
$ |
|
||
Other credit derivatives |
|
|
|
|
|
|
|
|
|
|||
Total |
|
$ |
( |
) |
|
$ |
|
|
$ |
|
||
The Company records interest rate derivatives subject to master netting agreements at their gross value and does not offset derivative asset and liabilities on the Consolidated Statements of Financial Condition.
121
BYLINE BANCORP, INC. AND SUBSIDIARIES
NOTES TO CONSOLIDATED FINANCIAL STATEMENTS
(Table dollars in thousands, except share and per share data)
Note 21—Derivative Instruments and Hedge Activities (continued)
|
|
2023 |
|
|
2022 |
|
||||||||||
|
|
Derivative |
|
|
Derivative |
|
|
Derivative |
|
|
Derivative |
|
||||
Gross amounts recognized |
|
$ |
|
|
$ |
( |
) |
|
$ |
|
|
$ |
( |
) |
||
Less: Amounts offset in the Consolidated Statements of Financial |
|
|
|
|
|
|
|
|
|
|
|
|
||||
Net amount presented in the Consolidated Statements of Financial |
|
$ |
|
|
$ |
( |
) |
|
$ |
|
|
$ |
( |
) |
||
Gross amounts not offset in the Consolidated Statements of |
|
|
|
|
|
|
|
|
|
|
|
|
||||
Offsetting derivative positions |
|
|
( |
) |
|
|
|
|
|
( |
) |
|
|
|
||
Collateral received |
|
|
( |
) |
|
|
|
|
|
( |
) |
|
|
|
||
Net credit exposure |
|
$ |
|
|
$ |
( |
) |
|
$ |
|
|
$ |
( |
) |
||
As of December 31, 2023, the fair value of derivatives in a net liability position, which includes accrued interest but excludes any adjustment for nonperformance risk, related to these agreements was $
Note 22—Parent Company Only Condensed Financial Statements
The following represents the condensed financial statements of Byline Bancorp, Inc., the Parent Company:
Statements of Financial Condition
Parent Company Only
|
|
As of December 31, |
|
|||||
|
|
2023 |
|
|
2022 |
|
||
ASSETS |
|
|
|
|
|
|
||
Cash |
|
$ |
|
|
$ |
|
||
Investment in banking subsidiary |
|
|
|
|
|
|
||
Other assets |
|
|
|
|
|
|
||
Total assets |
|
$ |
|
|
$ |
|
||
LIABILITIES AND STOCKHOLDERS’ EQUITY |
|
|
|
|
|
|
||
Line of credit |
|
$ |
|
|
$ |
|
||
Term loan |
|
|
|
|
|
|
||
Subordinated notes, net |
|
|
|
|
|
|
||
Junior subordinated debentures issued to capital trusts, net |
|
|
|
|
|
|
||
Accrued expenses and other liabilities |
|
|
|
|
|
|
||
Stockholders' equity |
|
|
|
|
|
|
||
Total liabilities and stockholders' equity |
|
$ |
|
|
$ |
|
||
122
BYLINE BANCORP, INC. AND SUBSIDIARIES
NOTES TO CONSOLIDATED FINANCIAL STATEMENTS
(Table dollars in thousands, except share and per share data)
Note 22—Parent Company Only Condensed Financial Statements (continued)
Statements of Operations
Parent Company Only
|
|
Years ended December 31, |
|
|||||||||
|
|
2023 |
|
|
2022 |
|
|
2021 |
|
|||
INCOME |
|
|
|
|
|
|
|
|
|
|||
Dividends from subsidiary |
|
$ |
|
|
$ |
|
|
$ |
|
|||
Other interest and dividend income |
|
|
( |
) |
|
|
( |
) |
|
|
|
|
Change in fair value of equity securities, net |
|
|
|
|
|
|
|
|
|
|||
Other noninterest income |
|
|
|
|
|
|
|
|
|
|||
Total income |
|
|
|
|
|
|
|
|
|
|||
EXPENSES |
|
|
|
|
|
|
|
|
|
|||
Interest expense |
|
|
|
|
|
|
|
|
|
|||
Other noninterest expense |
|
|
|
|
|
|
|
|
|
|||
Total expenses |
|
|
|
|
|
|
|
|
|
|||
Income before provision for income taxes and equity in undistributed income |
|
|
|
|
|
|
|
|
|
|||
Benefit for income taxes |
|
|
( |
) |
|
|
( |
) |
|
|
( |
) |
Income before equity in undistributed income of subsidiary |
|
|
|
|
|
|
|
|
|
|||
Equity in undistributed income of subsidiary |
|
|
|
|
|
|
|
|
|
|||
Net income |
|
$ |
|
|
$ |
|
|
$ |
|
|||
Statements of Cash Flows
Parent Company Only
|
|
Years ended December 31, |
|
|||||||||
|
|
2023 |
|
|
2022 |
|
|
2021 |
|
|||
CASH FLOWS FROM OPERATING ACTIVITIES |
|
|
|
|
|
|
|
|
|
|||
Net income |
|
$ |
|
|
$ |
|
|
$ |
|
|||
Adjustments to reconcile net income to net cash from operating activities: |
|
|
|
|
|
|
|
|
|
|||
Equity in undistributed income of subsidiary |
|
|
( |
) |
|
|
( |
) |
|
|
( |
) |
Share-based compensation expense |
|
|
|
|
|
|
|
|
|
|||
Change in fair value of equity securities, net |
|
|
|
|
|
|
|
|
( |
) |
||
Amortization of subordinated debt issuance cost |
|
|
|
|
|
|
|
|
|
|||
Accretion of junior subordinated debentures discount |
|
|
|
|
|
|
|
|
|
|||
Changes in other assets and other liabilities |
|
|
|
|
|
( |
) |
|
|
( |
) |
|
Net cash provided by operating activities |
|
|
|
|
|
|
|
|
|
|||
CASH FLOWS FROM INVESTING ACTIVITIES |
|
|
|
|
|
|
|
|
|
|||
Purchases of securities available-for-sale |
|
|
( |
) |
|
|
( |
) |
|
|
( |
) |
Net cash paid in acquisition of business |
|
|
( |
) |
|
|
|
|
|
|
||
Net cash used in investing activities |
|
|
( |
) |
|
|
( |
) |
|
|
( |
) |
CASH FLOWS FROM FINANCING ACTIVITIES |
|
|
|
|
|
|
|
|
|
|||
Proceeds from revolving line of credit |
|
|
|
|
|
|
|
|
|
|||
Repayments of revolving line of credit |
|
|
( |
) |
|
|
|
|
|
|
||
Proceeds from term loan |
|
|
|
|
|
|
|
|
|
|||
Repayments of term loan |
|
|
( |
) |
|
|
|
|
|
|
||
Dividends paid on preferred stock |
|
|
|
|
|
( |
) |
|
|
( |
) |
|
Dividends paid on common stock |
|
|
( |
) |
|
|
( |
) |
|
|
( |
) |
Proceeds from issuance of common stock, net |
|
|
|
|
|
|
|
|
|
|||
Repurchase of preferred stock |
|
|
|
|
|
( |
) |
|
|
|
||
Repurchase of common stock |
|
|
|
|
|
( |
) |
|
|
( |
) |
|
Net cash provided by (used in) financing activities |
|
|
|
|
|
( |
) |
|
|
( |
) |
|
NET CHANGE IN CASH AND CASH EQUIVALENTS |
|
|
|
|
|
( |
) |
|
|
( |
) |
|
CASH AND CASH EQUIVALENTS, beginning of period |
|
|
|
|
|
|
|
|
|
|||
CASH AND CASH EQUIVALENTS, end of period |
|
$ |
|
|
$ |
|
|
$ |
|
|||
123
BYLINE BANCORP, INC. AND SUBSIDIARIES
NOTES TO CONSOLIDATED FINANCIAL STATEMENTS
(Table dollars in thousands, except share and per share data)
Note 23—Earnings per Share
A reconciliation of the numerators and denominators for earnings per common share computations is presented below. Incremental shares represent outstanding stock options for which the exercise price is less than the average market price of the Company’s common stock during the periods presented. Options to purchase
|
|
Years ended December 31, |
|
|||||||||
|
|
2023 |
|
|
2022 |
|
|
2021 |
|
|||
Net income |
|
$ |
|
|
$ |
|
|
$ |
|
|||
Less: Dividends on preferred shares |
|
|
|
|
|
|
|
|
|
|||
Net income available to common stockholders |
|
$ |
|
|
$ |
|
|
$ |
|
|||
Weighted-average common stock outstanding: |
|
|
|
|
|
|
|
|
|
|||
Weighted-average common stock outstanding (basic) |
|
|
|
|
|
|
|
|
|
|||
Incremental shares |
|
|
|
|
|
|
|
|
|
|||
Weighted-average common stock outstanding (dilutive) |
|
|
|
|
|
|
|
|
|
|||
Basic earnings per common share |
|
$ |
|
|
$ |
|
|
$ |
|
|||
Diluted earnings per common share |
|
$ |
|
|
$ |
|
|
$ |
|
|||
Note 24—Stockholders’ Equity
A summary of the Company’s preferred and common stock at December 31, 2023 and 2022 is as follows:
|
|
2023 |
|
|
2022 |
|
||
Preferred stock |
|
|
|
|
|
|
||
Par value per share |
|
$ |
|
|
$ |
|
||
Shares authorized |
|
|
|
|
|
|
||
Shares issued |
|
|
|
|
|
|
||
Shares outstanding |
|
|
|
|
|
|
||
Common stock, voting |
|
|
|
|
|
|
||
Par value |
|
$ |
|
|
$ |
|
||
Shares authorized |
|
|
|
|
|
|
||
Shares issued |
|
|
|
|
|
|
||
Shares outstanding |
|
|
|
|
|
|
||
Treasury shares |
|
|
|
|
|
|
||
During 2016, the Company authorized and issued Series B
On February 15, 2022, the Company gave notice of its intention to redeem all of its outstanding shares of the Series B Preferred Stock (the "Preferred Stock Redemption"). The Preferred Stock Redemption was in accordance with the terms of the Certificate of Designations of the Series B Preferred Stock dated as of June 16, 2017 (the "Certificate of Designation"). On
For the years ended December 31, 2022 and 2021 the Company declared and paid dividends on the Series B Preferred Stock of $
124
BYLINE BANCORP, INC. AND SUBSIDIARIES
NOTES TO CONSOLIDATED FINANCIAL STATEMENTS
(Table dollars in thousands, except share and per share data)
Note 24—Stockholders’ Equity (continued)
Total cash dividends declared and paid on the Company’s common stock during the years ended December 31, 2023, 2022 and 2021 were: $
On December 10, 2020, we announced that our Board of Directors approved a stock repurchase program authorizing the purchase of up to an aggregate of
On December 12, 2022, we announced that our Board of Directors approved a new stock repurchase program authorizing the purchase of up to an aggregate of
The Company did
On December 6, 2023, we announced that our Board of Directors approved a new stock repurchase program authorizing the purchase of up to an aggregate of
On January 23, 2024, the Company’s Board of Directors declared a cash dividend of $
Note 25—Consolidated Statements of Changes in Accumulated Other Comprehensive Income (Loss)
The following table summarized the change in accumulated other comprehensive income (loss) for the years ended December 31, 2023, 2022, and 2021:
(dollars in thousands) |
|
Unrealized Gains (Losses) on Cash Flow Hedges |
|
|
Unrealized Gains (Losses) on Available-for-Sale Securities |
|
|
Total Accumulated Other |
|
|||
Balance, January 1, 2021 |
|
$ |
( |
) |
|
$ |
|
|
$ |
|
||
Other comprehensive income (loss), net of tax |
|
|
|
|
|
( |
) |
|
|
( |
) |
|
Balance, December 31, 2021 |
|
$ |
|
|
$ |
( |
) |
|
$ |
( |
) |
|
Other comprehensive income (loss), net of tax |
|
|
|
|
|
( |
) |
|
|
( |
) |
|
Balance, December 31, 2022 |
|
$ |
|
|
$ |
( |
) |
|
$ |
( |
) |
|
Other comprehensive income (loss), net of tax |
|
|
( |
) |
|
|
|
|
|
|
||
Balance, December 31, 2023 |
|
$ |
|
|
$ |
( |
) |
|
$ |
( |
) |
|
125
BYLINE BANCORP, INC. AND SUBSIDIARIES
NOTES TO CONSOLIDATED FINANCIAL STATEMENTS
(Table dollars in thousands, except share and per share data)
Note 26—Selected Quarterly Financial Data (unaudited)
On December 31, 2022, the Company's Emerging Growth Company status expired and the Company adopted CECL and applied it retrospectively to the period beginning January 1, 2022 using the modified retrospective method of accounting. Adoption of CECL includes both a $
|
|
For the year ended December 31, 2022 |
|
|||||||||||||||||||||||||||||||||||||
|
|
First |
|
|
Second |
|
|
Third |
|
|
Fourth |
|
||||||||||||||||||||||||||||
|
|
As Reported |
|
|
Adjustment |
|
|
Recast |
|
|
As Reported |
|
|
Adjustment |
|
|
Recast |
|
|
As Reported |
|
|
Adjustment |
|
|
Recast |
|
|
As Reported |
|
||||||||||
Interest and dividend |
|
$ |
|
|
$ |
( |
) |
|
$ |
|
|
$ |
|
|
$ |
|
|
$ |
|
|
$ |
|
|
$ |
( |
) |
|
$ |
|
|
$ |
|
||||||||
Interest expense |
|
|
|
|
|
|
|
|
|
|
|
|
|
|
|
|
|
|
|
|
|
|
|
|
|
|
|
|
|
|
||||||||||
Net interest income |
|
|
|
|
|
( |
) |
|
|
|
|
|
|
|
|
|
|
|
|
|
|
|
|
|
( |
) |
|
|
|
|
|
|
||||||||
Provision/(recapture) for |
|
|
|
|
|
|
|
|
|
|
|
|
|
|
( |
) |
|
|
|
|
|
|
|
|
|
|
|
|
|
|
|
|||||||||
Net interest income after |
|
|
|
|
|
( |
) |
|
|
|
|
|
|
|
|
|
|
|
|
|
|
|
|
|
( |
) |
|
|
|
|
|
|
||||||||
Non-interest income |
|
|
|
|
|
|
|
|
|
|
|
|
|
|
|
|
|
|
|
|
|
|
|
|
|
|
|
|
|
|
||||||||||
Non-interest expense |
|
|
|
|
|
( |
) |
|
|
|
|
|
|
|
|
( |
) |
|
|
|
|
|
|
|
|
( |
) |
|
|
|
|
|
|
|||||||
Income before provision |
|
|
|
|
|
( |
) |
|
|
|
|
|
|
|
|
|
|
|
|
|
|
|
|
|
( |
) |
|
|
|
|
|
|
||||||||
Provision for income taxes |
|
|
|
|
|
( |
) |
|
|
|
|
|
|
|
|
|
|
|
|
|
|
|
|
|
( |
) |
|
|
|
|
|
|
||||||||
Net income |
|
|
|
|
|
( |
) |
|
|
|
|
|
|
|
|
|
|
|
|
|
|
|
|
|
( |
) |
|
|
|
|
|
|
||||||||
Dividends on preferred |
|
|
|
|
|
|
|
|
|
|
|
|
|
|
|
|
|
|
|
|
|
|
|
|
|
|
|
|
|
|
||||||||||
Income available to common |
|
$ |
|
|
$ |
( |
) |
|
$ |
|
|
$ |
|
|
$ |
|
|
$ |
|
|
$ |
|
|
$ |
( |
) |
|
$ |
|
|
$ |
|
||||||||
Basic earnings per |
|
$ |
|
|
$ |
( |
) |
|
$ |
|
|
$ |
|
|
$ |
|
|
$ |
|
|
$ |
|
|
$ |
( |
) |
|
$ |
|
|
$ |
|
||||||||
Diluted earnings per |
|
$ |
|
|
$ |
( |
) |
|
$ |
|
|
$ |
|
|
$ |
|
|
$ |
|
|
$ |
|
|
$ |
( |
) |
|
$ |
|
|
$ |
|
||||||||
Item 9. Changes in and Disagreements With Accountants on Accounting and Financial Disclosure.
None.
Item 9A. Controls and Procedures.
Evaluation of disclosure controls and procedures. The Company’s management, including our Chief Executive Officer and our Chief Financial Officer, have evaluated the effectiveness of our "disclosure controls and procedures" (as defined in Rule 13a-15(e) under the Exchange Act), as of the end of the period covered by this report. Based on such evaluation, our Chief Executive Officer and our Chief Financial Officer have concluded that, as of December 31, 2023, the Company’s disclosure controls and procedures were effective to provide reasonable assurance that the information required to be disclosed by the Company in the reports it files or submits under the Exchange Act is recorded, processed, summarized and reported within the time periods specified in the rules and forms of the SEC and is accumulated and communicated to the Company’s management, including our Chief Executive Officer and our Chief Financial Officer, as appropriate, to allow timely decisions regarding required disclosure.
Management’s annual report on internal control over financial reporting. Management of the Company is responsible for establishing and maintaining effective internal control over financial reporting. Internal control is designed to provide reasonable assurance regarding the reliability of financial reporting and the preparation of published financial statements. Internal control over financial reporting includes self-monitoring mechanisms, and actions are taken to correct deficiencies as they are identified.
Management assessed the effectiveness of the Company’s internal control over financial reporting as of December 31, 2023. This assessment was based on criteria for effective internal control over financial reporting established in Internal Control-Integrated Framework (2013) issued by the Committee of Sponsoring Organizations of the Treadway Commission (COSO). Based on this assessment, our Chief Executive Officer and our Chief Financial Officer have determined that the Company maintained effective internal control over financial reporting as of December 31, 2023, based on the specified criteria.
All internal control systems, no matter how well designed, have inherent limitations. Therefore, even those systems determined to be effective can provide only reasonable assurance with respect to financial statement preparation and presentation. Also, projections of any evaluation of effectiveness to future periods are subject to the risk that controls may become inadequate because of changes in conditions, or that the degree of compliance with the policies or procedures may deteriorate.
Moss Adams LLP, an independent registered public accounting firm that audited the Consolidated Financial Statements of the Company included in this Annual Report, has issued an audit opinion on the effectiveness of the Company's internal control over financial reporting as of December 31, 2023. The report, which expresses an unqualified opinion on the effectiveness of the Company's internal control over financial reporting as of December 31, 2023, is included in Item 8 - Financial Statements and Supplementary Data under the heading "Report of Independent Registered Public Accounting Firm".
Changes in internal control over financial reporting. There was no change in the Company’s internal control over financial reporting during the quarter ended December 31, 2023, that has materially affected, or is reasonably likely to materially affect, the Company’s internal control over financial reporting.
Item 9B. Other Information.
Trading Arrangements: During the quarter ended December 31, 2023, no director or officer (as defined in Rule 16a-1(f) under the Exchange Act) of the Company adopted or
Item 9C. Disclosure Regarding Foreign Jurisdictions that Prevent Inspections.
Not applicable.
PART III
Item 10. Directors, Executive Officers and Corporate Governance.
Directors and Executive Officers. The information concerning our Directors and Executive Officers required by this item will be included in and is incorporated herein by reference from our definitive proxy statement for our 2024 Annual Meeting of Stockholders (the "2024 Proxy Statement"), a copy of which will be filed with the SEC no later than 120 days after the end of our fiscal year.
Delinquent Section 16(a) Reports. The information concerning the filing of any delinquent reports by our Directors and Executive Officers pursuant to the requirements of Section 16(a) of the Exchange Act required by this item will be included in and is incorporated herein by reference from the 2024 Proxy Statement, a copy of which will be filed with the SEC no later than 120 days after the end of our fiscal year.
127
Code of Business Conduct and Ethics. Our Board of Directors has adopted a code of business conduct and ethics (the "Code of Ethics") that applies to all of our Directors, officers and employees, including our principal executive officer, principal financial officer and principal accounting officer and persons performing similar functions. A copy of the Code of Ethics is available without charge upon written request to Corporate Secretary, Byline Bancorp, Inc., 180 North LaSalle Street, Suite 300, Chicago, Illinois 60601 and is also posted on our website at www.bylinebancorp.com. If we amend or grant any waiver from a provision of our Code of Ethics that applies to our Executive Officers, we will publicly disclose such amendment or waiver on our website and as required by applicable law, including by filing a Current Report on Form 8-K.
Stockholder Nominating Procedures: The information concerning procedures as to how stockholders can nominate directors for election at a stockholder meeting required by this item will be included in and is incorporated herein by reference from the 2024 Proxy Statement, a copy of which will be filed with the SEC no later than 120 days after the end of our fiscal year.
Audit Committee: The information regarding our Audit Committee and Audit Committee Financial Expert required by this item will be included in and is incorporated herein by reference from the 2024 Proxy Statement, a copy of which will be filed with the SEC no later than 120 days after the end of our fiscal year.
Item 11. Executive Compensation.
The information concerning the compensation paid to our Executive Officers and Directors required by this item will be included in and is incorporated herein by reference from the 2024 Proxy Statement, a copy of which will be filed with the SEC no later than 120 days after the end of our fiscal year.
The information regarding the payments payable to our Executive Officers in the event of a change in control of the Company will be included in and is incorporated herein by reference from the 2024 Proxy Statement, a copy of which will be filed with the SEC no later than 120 days after the end of our fiscal year.
The information concerning any Compensation Committee interlocks required by this item will be included in and is incorporated herein by reference from the 2024 Proxy Statement, a copy of which will be filed with the SEC no later than 120 days after the end of our fiscal year.
The Report of the Compensation Committee required by this item will be included in and is incorporated herein by reference from the 2024 Proxy Statement, a copy of which will be filed with the SEC no later than 120 days after the end of our fiscal year.
Item 12. Security Ownership of Certain Beneficial Owners and Management and Related Stockholder Matters.
The information concerning the ownership of shares of our common stock by certain beneficial owners and management required by this item will be included in and is incorporated herein by reference from the 2024 Proxy Statement, a copy of which will be filed with the SEC no later than 120 days after the end of our fiscal year.
The following table sets forth information as of December 31, 2023, regarding our equity compensation plans that provide for the award of equity securities or the grant of options to purchase equity securities of the Company to employees and directors of Byline and its subsidiaries:
|
|
(A) |
|
|
(B) |
|
|
(C) |
|
|||
Plan Category |
|
Number of Securities to be issued upon exercise of outstanding options or vesting of outstanding restricted stock grants |
|
|
Weighted average exercise price of outstanding options |
|
|
Number of Securities remaining available for future issuance under equity compensation plans excluding securities reflected in column (A) |
|
|||
Equity compensation plans approved by stockholders |
|
|
|
|
|
|
|
|
|
|||
2017 Omnibus Incentive Compensation Plan |
|
|
627,271 |
|
|
N/A |
|
|
|
1,181,493 |
|
|
Equity compensation plans not approved by stockholders |
|
|
|
|
|
|
|
|
|
|||
Byline Bancorp Equity Incentive Plan(1) |
|
|
768,564 |
|
|
$ |
11.31 |
|
|
|
— |
|
First Evanston Option Exchange(1) |
|
|
103,135 |
|
|
$ |
11.95 |
|
|
|
— |
|
Total |
|
|
1,498,970 |
|
|
|
|
|
|
1,181,493 |
|
|
(1) For a description of the plan, please see Note 18 - Share Based Compensation to the Consolidated Financial Statements included under Part II, Item 8 of this Annual Report.
128
Item 13. Certain Relationships and Related Transactions, and Director Independence.
The information concerning certain relationships and related party transactions, our policy regarding the review and approval of related party transactions and our Directors’ independence required by this item will be included in and is incorporated herein by reference from the 2024 Proxy Statement, a copy of which will be filed with the SEC no later than 120 days after the end of our fiscal year.
Item 14. Principal Accounting Fees and Services.
The information concerning the services provided by and the fees paid to our independent registered public accounting firm, Moss Adams LLP, required by this item will be included in and is incorporated herein by reference from the 2024 Proxy Statement, a copy of which will be filed with the SEC no later than 120 days after the end of our fiscal year.
129
PART IV
Item 15. Exhibits and Financial Statement Schedules.
See Index to Consolidated Financial Statements on page 63
All financial statement schedules are omitted because they are either not applicable or not required, or because the required information is included in the Consolidated Financial Statements or the Notes thereto included in Part II, Item 8.
See (b) below
The exhibits filed as part of this report and exhibits incorporated by reference to other documents are as follows:
EXHIBIT |
||
Number |
|
Description |
|
|
|
3.1 |
|
|
|
|
|
3.2 |
|
|
|
|
|
4.1 |
|
Certain instruments defining the rights of holders of long-term debt securities of the Company and its subsidiaries are omitted pursuant to Item 601(b)(4)(iii) of Regulation S-K. The Company hereby undertakes to furnish to the SEC, upon request, copies of any such instruments. |
|
|
|
4.2 |
|
|
|
|
|
10.1 |
|
|
|
|
|
10.2 |
|
|
|
|
|
10.3 |
|
|
|
|
|
10.4 |
|
|
|
|
|
10.5 |
|
|
|
|
|
10.6 |
|
|
|
|
|
10.7 |
|
|
|
|
|
10.8 |
|
|
|
|
|
10.9 |
|
|
|
|
|
10.10 |
|
First Amendment to Byline Bancorp, Inc. Employee Stock Purchase Plan |
130
|
|
|
10.11 |
|
|
|
|
|
10.12 |
|
|
|
|
|
10.13 |
|
|
|
|
|
10.14 |
|
|
|
|
|
10.15 |
|
|
|
|
|
10.16 |
|
|
|
|
|
10.17 |
|
|
|
|
|
21.1 |
|
|
|
|
|
23.1 |
|
|
|
|
|
24.1 |
|
|
|
|
|
31.1 |
|
|
|
|
|
31.2 |
|
|
|
|
|
32.1(a) |
|
|
|
|
|
97.1 |
|
|
|
|
|
101 |
|
Financial information from the Company’s Annual Report on Form 10-K for the year ended December 31, 2023, formatted in Inline XBRL interactive data files pursuant to Rule 405 of Regulation S-T: (i) Consolidated Statements of Financial Condition; (ii) Consolidated Statements of Operations; (iii) Consolidated Statements of Comprehensive Income (Loss); (iv) Consolidated Statements of Changes in Stockholders’ Equity; (v) Consolidated Statements of Cash Flows; and (vi) Notes to Consolidated Financial Statements |
|
|
|
104 |
|
Cover Page Interactive Date File – the cover page XBRL taxes are embedded within the Inline XBRL document |
† Indicates a management contract or compensatory plan.
Item 16. Form 10-K Summary.
None
131
SIGNATURES
Pursuant to the requirements of Section 13 or 15(d) of the Securities Exchange Act of 1934, as amended, the Registrant has duly caused this Report to be signed on its behalf by the undersigned, thereunto duly authorized.
|
|
BYLINE BANCORP, INC. |
|
|
|
|
|
Date: March 4, 2024 |
|
By: |
/s/ Roberto R. Herencia |
|
|
|
Roberto R. Herencia |
|
|
|
Chief Executive Officer |
POWER OF ATTORNEY
KNOW ALL PERSONS BY THESE PRESENTS, that each person whose signature appears below hereby constitutes and appoints Roberto R. Herencia and Thomas J. Bell III, with full power to act without the other, his or her true and lawful attorney-in-fact and agent, with full and several powers of substitution, for him or her and in his or her name, place and stead, in any and all capacities, to sign any and all amendments to this Annual Report on Form 10-K, and to file the same, with all exhibits thereto and other documents in connection therewith, with the Securities and Exchange Commission, and hereby grants to such attorneys-in-fact and agents, and each of them, full power and authority to do and perform each and every act and thing requisite and necessary to be done, as fully as to all intents and purposes as each of the undersigned might or could do in person, hereby ratifying and confirming all that said attorneys-in-fact and agents, or any of them, or their or his substitute or substitutes, may lawfully do or cause to be done by virtue hereof. Pursuant to the requirements of the Securities Exchange Act of 1934, as amended, this Report has been signed below by the following persons on behalf of the Registrant in the capacities and on the dates indicated.
Name |
|
Title |
|
Date |
|
|
|
|
|
/s/ Roberto R. Herencia |
|
Director (executive Chairman) and Chief Executive Officer (principal executive officer) |
|
March 4, 2024 |
Roberto R. Herencia |
|
|
|
|
|
|
|
|
|
/s/ Thomas J. Bell III |
|
Executive Vice President and Chief Financial Officer (principal financial officer) |
|
March 4, 2024 |
Thomas J. Bell III |
|
|
|
|
|
|
|
|
|
/s/ Maria Sherylle A. Olano |
|
Senior Vice President and Chief Accounting Officer (principal accounting officer) |
|
March 4, 2024 |
Maria Sherylle A. Olano |
|
|
|
|
|
|
|
|
|
/s/ Alberto J. Paracchini |
|
Director and President |
|
March 4, 2024 |
Alberto J. Paracchini |
|
|
|
|
|
|
|
|
|
/s/ Phillip R. Cabrera |
|
Director |
|
March 4, 2024 |
Phillip R. Cabrera |
|
|
|
|
|
|
|
|
|
/s/ Mary Jo S. Herseth |
|
Director |
|
March 4, 2024 |
Mary Jo S. Herseth |
|
|
|
|
|
|
|
|
|
/s/ Steven P. Kent |
|
Director |
|
March 4, 2024 |
Steven P. Kent |
|
|
|
|
|
|
|
|
|
/s/ William G. Kistner |
|
Director |
|
March 4, 2024 |
William G. Kistner |
|
|
|
|
|
|
|
|
|
/s/ Antonio del Valle Perochena |
|
Director |
|
March 4, 2024 |
Antonio del Valle Perochena |
|
|
|
|
|
|
|
|
|
/s/ Margarita Hugues Vélez |
|
Director |
|
March 4, 2024 |
Margarita Hugues Vélez |
|
|
|
|
|
|
|
|
|
/s/ Pamela Stewart |
|
Director |
|
March 4, 2024 |
Pamela Stewart |
|
|
|
|
|
|
|
|
|
/s/ Carlos Ruiz Sacristán |
|
Director |
|
March 4, 2024 |
Carlos Ruiz Sacristán |
|
|
|
|
132