UNITED STATES
SECURITIES AND EXCHANGE COMMISSION
Washington, D.C. 20549
FORM 10-K
ANNUAL REPORT PURSUANT TO SECTION 13 OR 15(d) OF THE SECURITIES EXCHANGE ACT OF 1934 | ||||||||
For the fiscal year ended December 31 , 2023
TRANSITION REPORT PURSUANT TO SECTION 13 OR 15(d) OF THE SECURITIES EXCHANGE ACT OF 1934 | ||||||||
For the transition period from to
Commission file number: 001-39731
(Exact name of registrant as specified in its charter)
| (State or other jurisdiction of incorporation or organization) | (I.R.S. Employer Identification No.) | |||||||||||||
| (Address of principal executive offices) | (Zip Code) | |||||||||||||
Registrant’s telephone number, including area code: (276 ) 656-1776
Securities registered pursuant to Section 12(b) of the Act:
| Title of each class | Trading Symbol(s) | Name of each exchange on which registered | ||||||
Securities registered pursuant to Section 12(g) of the Act: None
Indicate by check mark if the registrant is a well-known seasoned issuer, as defined in Rule 405 of the Securities Act. Yes ☐ No ☒
Indicate by check mark if the registrant is not required to file reports pursuant to Section 13 or Section 15(d) of the Act. Yes ☐ No ☒
Indicate by check mark whether the registrant (1) has filed all reports required to be filed by Section 13 or 15(d) of the Securities Exchange Act of 1934 during the preceding 12 months (or for such shorter period that the registrant was required to file such reports), and (2) has been subject to such filing requirements for the past 90 days. Yes ☒ No ☐
Indicate by check mark whether the registrant has submitted electronically every Interactive Data File required to be submitted pursuant to Rule 405 of Regulation S-T (§ 232.405 of this chapter) during the preceding 12 months (or for such shorter period that the registrant was required to submit such files). Yes ☒ No ☐
Indicate by check mark whether the registrant is a large accelerated filer, an accelerated filer, a non-accelerated filer, a smaller reporting company, or an emerging growth company. See the definitions of “large accelerated filer,” “accelerated filer,” “smaller reporting company,” and “emerging growth company” in Rule 12b-2 of the Exchange Act.
Large accelerated filer | ¨ | x | Emerging growth company | |||||||||||||||||
Non-accelerated filer | o | Smaller reporting company | ||||||||||||||||||
If an emerging growth company, indicate by check mark if the registrant has elected not to use the extended transition period for complying with any new or revised financial accounting standards provided pursuant to Section 13(a) of the Exchange Act. ¨
Indicate by check mark whether the registrant has filed a report on and attestation to its management’s assessment of the effectiveness of its internal control over financial reporting under Section 404(b) of the Sarbanes-Oxley Act (15 U.S.C. 7262(b)) by the registered public accounting firm that prepared or issued its audit report.
Indicate by check mark whether any of those error corrections are restatements that required a recovery analysis of incentive-based compensation received by any of the registrant’s executive officers during the relevant recovery period pursuant to §240.10D-1(b). ☐
Indicate by check mark whether the registrant is a shell company (as defined in Rule 12b-2 of the Act). Yes ☐ No ☒
The aggregate market value of Carter Bankshares, Inc.’s common stock held by non-affiliates, computed by reference to the price at which the common stock was last sold, or the average bid and asked price of such common stock, as of June 30, 2023 was $339,949,437 .
There were 23,022,221 shares of common stock of Carter Bankshares, Inc. outstanding as of March 4, 2024.
DOCUMENTS INCORPORATED BY REFERENCE
Portions of the definitive Proxy Statement of Carter Bankshares, Inc., to be filed pursuant to Regulation 14A for the 2024 annual meeting of shareholders to be held May 22, 2024, are incorporated by reference into Part III of this Annual Report on Form 10-K.
TABLE OF CONTENTS
Item 9C. | Disclosure Regarding Foreign Jurisdictions that Prevent Inspections | |||||||
Important Note Regarding Forward-Looking Statements
This Annual Report on Form 10-K contains or incorporates certain forward-looking statements within the meaning of the Private Securities Litigation Reform Act of 1995. Forward-looking statements include statements that relate to our financial condition, market conditions, results of operations, plans, objectives, outlook for earnings, strategic initiatives and related earn-back periods, revenues, expenses, capital and liquidity levels and ratios, asset levels and asset quality, including but not limited to statements regarding the interest rate environment, the impact of future changes in interest rates, and the impacts of the Company placing its largest lending relationship on nonaccrual status. Forward looking statements are typically identified by words or phrases such as “will likely result,” “expect,” “anticipate,” “estimate,” “forecast,” “project,” “intend,” “ believe,” “assume,” “strategy,” “trend,” “plan,” “outlook,” “outcome,” “continue,” “remain,” “potential,” “opportunity,” “comfortable,” “current,” “position,” “maintain,” “sustain,” “seek,” “achieve” and variations of such words and similar expressions, or future or conditional verbs such as will, would, should, could or may.
These statements are not guarantees of future results or performance and involve certain risks, uncertainties and assumption that are difficult to predict and often are beyond the Company’s control. Although we believe the assumptions upon which these forward-looking statements are based are reasonable, any of these assumptions could prove to be inaccurate and the forward-looking statements based on these assumptions could be incorrect. The matters discussed in these forward-looking statements are subject to various risks, uncertainties and other factors that could cause actual results and trends to differ materially from those made, projected, or implied in or by the forward-looking statements including, but not limited to the effects of:
•market interest rates and the impacts of market interest rates on economic conditions, customer behavior, and the Company’s loan and securities portfolios;
•inflation, market and monetary fluctuations;
•changes in trade, monetary and fiscal policies and laws of the U.S. government, including policies of the Federal Reserve, FDIC and Treasury Department;
•cyber-security threats, attacks or events;
•rapid technological developments and changes;
•our ability to resolve our nonperforming assets and our ability to secure collateral on loans that have entered nonaccrual status due to loan maturities and failure to pay in full;
•changes in the Company’s liquidity and capital positions;
•concentrations of loans secured by real estate, particularly commercial real estate, and the potential impacts of changes in market conditions on the value of real estate collateral;
•increased delinquency and foreclosure rates on commercial real estate loans;
•an insufficient allowance for credit losses;
•the potential adverse effects of unusual and infrequently occurring events, such as weather-related disasters, terrorist acts, war and other military conflicts (such as the war between Israel and Hamas and the ongoing war between Russia and Ukraine) or public health events (such as the COVID-19 pandemic), and of any governmental and societal responses thereto; these potential adverse effects may include, without limitation, adverse effects on the ability of the Company's borrowers to satisfy their obligations to the Company, on the value of collateral securing loans, on the demand for the Company's loans or its other products and services, on incidents of cyberattack and fraud, on the Company’s liquidity or capital positions, on risks posed by reliance on third-party service providers, on other aspects of the Company's business operations and on financial markets and economic growth;
•a change in spreads on interest-earning assets and interest-bearing liabilities;
•regulatory supervision and oversight, including our relationship with regulators and any actions that may be initiated by our regulators;
•legislation affecting the financial services industry as a whole (such as the Inflation Reduction Act of 2022), and the Company and the Bank, in particular;
•the outcome of pending and future litigation and/or governmental proceedings, including the outcome of the lawsuits between the Bank and West Virginia Governor James C. Justice, II, his wife Cathy Justice, his son James C. Justice, III and various related entities that he and/or they own and control, concerning, among other items, their lending relationship with the Bank and repayment of amounts owed to the Bank;
•increasing price and product/service competition;
•the ability to continue to introduce competitive new products and services on a timely, cost-effective basis;
•managing our internal growth and acquisitions;
•the possibility that the anticipated benefits from acquisitions cannot be fully realized in a timely manner or at all, or that integrating the acquired operations will be more difficult, disruptive or more costly than anticipated;
•the soundness of other financial institutions and any indirect exposure related to recent significant bank failures or broader stability or liquidity concerns regarding other financial institutions including but not limited to other regional banks, which may also adversely impact, directly or indirectly, other financial institutions and market participants with which the Company has commercial or deposit relationships with;
•material increases in costs and expenses;
•reliance on significant customer relationships;
•general economic or business conditions, including unemployment levels, continuing supply chain disruptions and slowdowns in economic growth;
•significant weakening of the local economies in which we operate;
•changes in customer behaviors, including consumer spending, borrowing and saving habits;
•changes in deposit flows and loan demand;
•our failure to attract or retain key employees;
•expansions or consolidations in the Company’s branch network, including that the anticipated benefits of the Company’s branch network optimization project are not fully realized in a timely manner or at all;
•deterioration of the housing market and reduced demand for mortgages; and
•re-emergence of turbulence in significant portions of the global financial and real estate markets that could impact our performance, both directly, by affecting our revenues and the value of our assets and liabilities, and indirectly, by affecting the economy generally and access to capital in the amounts, at the times and on the terms required to support our future businesses.
Many of these factors, as well as other factors, are described throughout this Annual Report on Form 10-K, including Part I, Item 1A, “Risk Factors” and any of our subsequent filings with the Securities and Exchange Commission (“SEC”). Forward-looking statements are based on beliefs and assumptions using information available at the time the statements are made. We caution you not to unduly rely on forward-looking statements because the assumptions, beliefs, expectations and projections about future events are expressed in or implied by a forward-looking statement may, and often do, differ materially from actual results. Any forward-looking statement speaks only as to the date on which it is made, and we undertake no obligation to update, revise or clarify any forward-looking statement to reflect developments occurring after the statement is made.
CARTER BANKSHARES, INC. AND SUBSIDIARIES
PART 1
ITEM 1. BUSINESS
General
Carter Bankshares, Inc. (the “Company”) is a holding company headquartered in Martinsville, Virginia with assets of $4.5 billion at December 31, 2023. The Company is the parent company of its wholly owned subsidiary, Carter Bank & Trust (the “Bank”). The Bank is an Federal Deposit Insurance Corporation (“FDIC”) insured, Virginia state-chartered commercial bank which operates 65 branches in Virginia and North Carolina. The Bank provides a full range of retail and commercial financial products and services and insurance products.
In this Annual Report on Form 10-K, unless the context suggests otherwise, the terms “we,” “us” and “our” refer to the Company and its subsidiaries, including the Bank.
History and Holding Company Reorganization
The Bank commenced business on December 29, 2006, following the effectiveness of the concurrent merger of ten banking institutions. The ten merged banks and their respective main office locations were Blue Ridge Bank, N.A. (Floyd, Virginia); Central National Bank (Lynchburg, Virginia); Community National Bank (South Boston, Virginia); First National Bank (Rock Mount, Virginia); First National Exchange Bank (Roanoke, Virginia); Mountain National Bank (Galax, Virginia); Patrick Henry National Bank (Martinsville, Virginia); Patriot Bank, N.A. (Fredericksburg, Virginia); Peoples National Bank (Danville, Virginia); and Shenandoah National Bank (Staunton, Virginia).
The Company was incorporated on October 7, 2020, by and at the direction of the board of directors of the Bank, for the sole purpose of acquiring the Bank and serving as the Bank’s parent bank holding company pursuant to a corporate reorganization transaction (the “Reorganization”). On November 9, 2020, the Bank entered into an Agreement and Plan of Reorganization (the “Reorganization Agreement”) with the Company and CBT Merger Sub, Inc. (the “Merger Sub”), a wholly-owned subsidiary of the Company, pursuant to which the Reorganization would be effected. Effective at 7:00 p.m. on November 20, 2020 (the “Effective Time”), under the terms of the Reorganization Agreement and pursuant to Section 13.1-719.1 of the Virginia Stock Corporation Act (the “VSCA”), the Bank merged with the Merger Sub and survived such merger as a wholly-owned subsidiary of the Company. Prior to the Effective Time, the Company had no material assets and had not conducted any business or operations except for activities related to the Company’s organization and the Reorganization.
At the Effective Time, under the terms of the Reorganization Agreement and pursuant to Section 13.1-719.1 of the VSCA, each of the outstanding shares of the Bank’s common stock, par value $1.00 per share, formerly held by its shareholders was converted into and exchanged for one newly issued share of the Company’s common stock, par value $1.00 per share, and the Bank became the Company’s wholly-owned subsidiary. The shares of the Company’s common stock issued to the Bank’s shareholders were issued without registration under the Securities Act of 1933, as amended (the “Act”), pursuant to the exemption from registration provided by Section 3(a)(12) of the Act. Pursuant to Section 13.1-719.1 of the VSCA, the Reorganization did not require approval of the Bank’s shareholders.
In the Reorganization, each shareholder of the Bank received securities of the same class, having substantially the same designations, rights, powers, preferences, qualifications, limitations and restrictions, as those that the shareholder held in the Bank.
Prior to the Effective Time, the Bank’s common stock was registered under Section 12(b) of the Securities Exchange Act of 1934, as amended (the “Exchange Act”). The Bank was subject to the information requirements of the Exchange Act and, in accordance with Section 12(i) thereof, it filed annual and quarterly reports, proxy statements and other information with the FDIC. Upon consummation of the Reorganization, the Company’s common stock was deemed to be registered under Section 12(b) of the Exchange Act, pursuant to Rule 12g-3(a) promulgated thereunder, and the Company now files annual reports, proxy statements and other information with the SEC.
The Company’s common stock is traded on the Nasdaq Global Select Market (“NASDAQ”) under the ticker symbol “CARE.”
6
Operations
The Company is a bank holding company that conducts its business solely through the Bank. The Bank earns revenue primarily from interest on loans and securities and fees charged for financial services provided to customers. The Bank incurs expenses for the cost of deposits, provision for credit losses and other operating costs such as salaries and employee benefits, data processing, occupancy and tax expense.
Beginning in 2023, and continuing into 2024 and 2025, the Company is focusing on refining and enhancing its brand image and position in the markets it serves. To strengthen and further shape the culture of the Company, a new set of guiding principles were introduced to associates in June 2023. The guiding principles include a new purpose statement: To create opportunities for more people and businesses to prosper; supported by our new set of core values: Build Relationships, Earn Trust and Take Ownership. We believe these new guiding principles will help create alignment to support future growth by empowering our associates and igniting a passion for the Company.
The Company’s goal is to shift from restructuring the balance sheet to pursuing a prudent growth strategy when appropriate. We believe this strategy will be primarily targeted at organic growth, but will also consider opportunistic acquisitions that fit this strategic vision. We believe that the Bank’s strong capital and liquidity positions support this strategy. In addition to loan and deposit growth, the Company will seek to increase fee income while closely monitoring operating expenses.
The Bank offers a full range of deposit services including Lifetime Free Checking, interest checking accounts, savings accounts, retirement accounts and other deposit accounts of various types, ranging from money market accounts to longer-term CDs. These products and services are available to our personal and business customers. The transaction accounts and CDs are tailored to each of the Bank's principal markets at competitive rates. All deposit accounts are insured by the FDIC up to the maximum amount allowed by law.
The Bank also offers a full range of commercial and consumer loans. Commercial loans include both secured and unsecured loans, real estate construction and acquisition loans, and commercial and industrial loans. Consumer loans include residential mortgage, secured and unsecured loans for financing automobiles, home improvements, education, overdraft protection, personal investments and credit cards. The Bank also originates and holds fixed and variable rate mortgage loans and offers home equity lines of credit to its customers.
The Bank's lending activities are subject to a variety of lending limits imposed by federal law. While differing limits apply in certain circumstances based on the type of loan or the nature of the borrower (including the borrower's relationship to the Bank), in general the Bank is subject to a “loan to one” borrower limit of an amount equal to 15% of the Bank's unimpaired capital and surplus. The Bank may not make loans to any director, officer, associate or 10% shareholder of the Company unless the loan is approved by the Company’s Board of Directors (the “Board”) and is made on terms no more favorable than loans made available to a person not affiliated with the Bank.
Our other bank services include safe deposit boxes, direct deposit of payroll and social security checks and debit cards. Online banking products including a full suite of digital tools including: online and mobile banking, online account opening, bill pay, eStatements (paperless electronic statements), mobile deposit, Zelle®, CardValet®, digital wallet, and MoneyPass® network of ATMs. Treasury and corporate cash management services are also available to our business customers. The Bank also provides title insurance and other financial institution-related products and services. The Bank has no current plans to exercise trust powers.
The Bank has one wholly owned subsidiary, CB&T Investment Company (“the Investment Company”), which was chartered effective April 1, 2019. The Investment Company was formed to hold and manage a group of investments previously owned by the Bank and to provide additional latitude to purchase other investments.
The Company is a Virginia business corporation subject to the Bank Holding Company Act of 1956, as amended. As such, the Company is subject to supervision and examination by, and the regulations and reporting requirements of, the Board of Governors of the Federal Reserve System (“FRB”). The Company’s principal office, which is the same as the Bank’s principal office, is located at 1300 Kings Mountain Road, Martinsville, Virginia 24112. The Company’s telephone number at that address is (276) 656-1776. The Company’s website address is www.cbtcares.com. The information on our website is not a part of, nor is it incorporated by reference, into this report.
7
Competition
The Bank experiences significant competition in attracting depositors and borrowers. Competition in lending activities comes principally from other commercial banks, savings associations, insurance companies, governmental agencies, credit unions, brokerage firms and other non-bank lenders including mortgage companies and consumer finance companies. Competition for deposits comes from other commercial banks, savings associations, money market and mutual funds, credit unions, insurance companies and brokerage firms. Some of the financial organizations competing with the Bank have greater financial resources than the Bank. Certain of these financial organizations also have greater geographic coverage and some offer bank and bank-related services that the Bank does not offer.
Human Capital Management
Our associates are the engine that drives our purpose to create opportunities for more people and businesses to prosper. Our core values of building relationships, earning trust, and taking ownership are key to building and maintaining a team-oriented environment with associates that are engaged in open communication to help each other serve, learn, and grow. Our investment in competitive compensation, health benefits, wellness programs, and a focus on healthy work-life integration allows our associates to provide a high level of professional service to our customers.
Associates
As of December 31, 2023, we employed 679 full-time associates across our two-state footprint. No associates are represented by a collective bargaining unit. For fiscal year 2023, we hired 182 associates and our voluntary separation turnover rate was 13.8%.
Compensation, Benefits, and Wellness
Our compensation strategy includes the development of job descriptions that are reviewed annually. We use market-based compensation and benefits data to provide competitive salaries and benefits to our associates. We offer paid leave, health benefits, wellness programs, a 401(k) program with matching and employer contributions, restricted stock awards for high performing associates, flexible spending accounts, and employee assistance programs to all eligible associates. We bring in external professionals who conduct wellness programs to help our associates remain focused on their health and wellness.
Associate Performance and Development
The development and performance of our associates is centered on open dialogue that provides the associate with our expectations for their role and management with the opportunity to understand associates’ career aspirations. Our performance review process uses core competencies and a standardized rating system to measure performance. Associates are provided the opportunity at the start of the review cycle to perform a self-assessment including comments on their performance. These self-assessments are available for leaders to review as they develop an associate’s overall performance rating. The performance review is used as a factor for the merit increase process.
The Bank conducts a standard New Hire Orientation program that associates attend on their first day of employment so new associates receive consistent information to jump start their new opportunity with the Bank. Associates also complete an average of 15 hours of regulatory and compliance training each year, in addition to training specific to their job duties and responsibilities. The Bank also develops and conducts programs to provide leaders with the tools and resources they need to develop their associates and build high-performing teams. Associates are given opportunities to attend webinars and enroll in outside classes to enrich their professional goals.
Diversity, Equity, and Inclusion
We strive to promote inclusion through our core Company values and behaviors. We use various communication channels to develop an engaged workforce and create an inclusive workplace. In 2021, we created a Diversity, Equity, and Inclusion Council (the “DEI Council”) that is overseen by our Chief Executive Officer (or “CEO”) and directed by our Chief Human Resources Officer and our Regulatory Risk Management Director. The DEI Council consists of at least 10 associates from
8
across our organization and is focused on collecting data and presenting information to management to further the Bank’s efforts of identifying focus areas to cultivate a culture that will attract and retain a diverse and inclusive workforce.
Here is a snapshot of our diversity metrics as of December 31, 2023:
| Gender | % of Total Workforce | |||||||
| Female | 77.1 | % | ||||||
| Male | 22.9 | % | ||||||
| Generation | % of Total Workforce | |||||||
| Generation Z (1997 and later) | 13.0 | % | ||||||
| Millennials (1981 - 1996) | 37.7 | % | ||||||
| Generation X (1965 – 1980) | 32.3 | % | ||||||
| Baby Boomers (1946 – 1964) | 16.3 | % | ||||||
| Silent Generation (before 1946) | 0.7 | % | ||||||
| Ethnicity | % of Total Workforce | |||||||
| American Indian / Alaskan Native | 0.3 | % | ||||||
| Asian | 1.2 | % | ||||||
| Black or African American | 12.5 | % | ||||||
| Hispanic or Latino | 3.0 | % | ||||||
| Not specified | 2.5 | % | ||||||
| Two or more races | 2.7 | % | ||||||
| White | 77.8 | % | ||||||
We continue our commitment to equal employment opportunities by focusing on attracting, developing and retaining a diverse and inclusive workforce. We conducted an annual engagement survey that includes a section to inform the Bank on many areas of engagement, including inclusion. Our leaders continue to use this data to inform decisions on how to continue to develop a diverse and inclusive workforce.
Talent Acquisition and Retention
We focus on fairness and equitable approaches to create an environment where all of our associates can develop and thrive. Our efforts include ongoing reviews of our selection and hiring practices alongside a continued focus on pay analysis to offer our associates salaries based on their experience, knowledge, skills, abilities, and fit for a position’s duties and responsibilities.
Our talent acquisition program uses various external partners to reach a diverse population of candidates. We have developed training programs that prepare associates for their roles and responsibilities. Our leaders identify and work with our Human Resources teams to promote associates when opportunities are available.
Supervision and Regulation
General
Bank holding companies, banks and their affiliates are extensively regulated under federal and state law. Consequently, the growth and earnings performance of the Company and the Bank can be affected not only by management decisions and general economic conditions, but also by the statutes administered by, and the regulations and policies of, various governmental regulatory authorities including, but not limited to, the Bureau of Financial Institutions (the “Bureau”) of the Virginia State Corporation Commission (the “SCC”), the FDIC, the FRB, the Internal Revenue Service (“IRS”), federal and state taxing authorities, and the SEC.
The following summary briefly describes significant provisions of currently applicable federal and state laws and certain regulations and the potential impact of such provisions. This summary is not complete, and we refer you to the particular
9
statutory or regulatory provisions or proposals for more information. Because regulation of financial institutions changes regularly and is the subject of constant legislative and regulatory debate, we cannot forecast how federal and state regulation and supervision of financial institutions may change in the future and affect the Company’s and the Bank’s operations.
Regulatory Environment
Banking and other financial services statutes, regulations and policies are continually under review by the U.S. Congress, state legislatures and federal and state regulatory agencies. The scope of the laws and regulations, and the intensity of the supervision to which the Company and its subsidiaries are subject, have increased in recent years, initially in response to the 2008 financial crisis, and more recently in light of other factors, including continued turmoil and stress in the financial markets, technological factors, market changes, and increased scrutiny of proposed bank mergers and acquisitions by federal and state bank regulators. Regulatory enforcement and fines have also increased across the banking and financial services sector.
The Company continues to experience ongoing regulatory reform and these regulatory changes could have a significant effect on how we conduct business. The specific impacts of regulatory reforms, including but not limited to the Dodd-Frank Wall Street Reform and Consumer Protection Act (the “Dodd Frank Act”), which was enacted in 2010, or the Economic Growth, Regulatory Relief and Consumer Protection Act (the “EGRRCPA”), which was enacted in 2018, cannot yet be fully predicted and will depend to a large extent on the specific regulations that are likely to be adopted in the future.
Regulation of the Company and the Bank
As a Virginia bank holding company, the Company is subject to the Bank Holding Company Act of 1956 (the “BHCA”) and regulation and supervision by the FRB, and also is subject to the bank holding company laws of Virginia and is subject to regulation and supervision by the SCC and the Bureau. Pursuant to the BHCA, the FRB has the power to order any bank holding company or its subsidiaries to terminate any activity or to terminate its ownership or control of any subsidiary when it has reasonable grounds to believe that continuation of such activity or ownership constitutes a serious risk to the financial soundness, safety or stability of any bank subsidiary of the bank holding company. The FRB and the FDIC have adopted guidelines and released interpretative materials that establish operational and managerial standards to promote the safe and sound operation of banks and bank holding companies. These standards relate to the institution’s key operating functions, including but not limited to capital management, internal controls, internal audit systems, information systems, data and cybersecurity, loan documentation, credit underwriting, interest rate exposure and risk management, vendor management, executive management and its compensation, corporate governance, asset growth, asset quality, earnings, liquidity and risk management.
The BHCA applicable Virginia bank holding company laws generally limit the activities of a bank holding company and its subsidiaries to that of banking, managing or controlling banks, or any other activity that is closely related to banking or to managing or controlling banks. The BHCA also permits interstate banking acquisitions subject to certain conditions, including national and state concentration limits. The FRB has jurisdiction under the BHCA to approve any bank or non-bank acquisition, merger or consolidation proposed by a bank holding company. A bank holding company must be “well capitalized” and “well managed” to engage in an interstate bank acquisition or merger, and banks may branch across state lines provided that the law of the state in which the branch is to be located would permit establishment of the branch if the bank were a state bank chartered by such state. In addition, applicable Virginia law requires prior notice to the Virginia SCC before a Virginia bank holding company may acquire more than 5% of the shares of, or otherwise gain control of, any entity other than a bank, bank holding company or other financial institution.
The Bank is subject to supervision, regulation and examination by the Bureau and the Bank’s primary federal regulator, the FDIC. Federal and state laws and regulations generally applicable to financial institutions regulate, among other things, the scope of business, investments, reserves against deposits, capital levels relative to operations, the nature and amount of collateral for loans, the establishment of branches, mergers, consolidations and dividends. The system of supervision and regulation applicable to the Bank establishes a comprehensive framework for its operations and is intended primarily for the protection of the FDIC’s deposit insurance funds and the depositors. The Bank is not a member of the Federal Reserve System.
10
Banking Acquisitions; Changes in Control
The BHCA and related regulations require, among other things, the prior approval of the FRB in any case where a bank holding company proposes to (i) acquire direct or indirect ownership or control of more than 5% of the outstanding voting stock of any bank or bank holding company (unless it already owns a majority of such voting shares), (ii) acquire all or substantially all of the assets of another bank or bank holding company, or (iii) merge or consolidate with any other bank holding company. In determining whether to approve a proposed bank acquisition, the FRB will consider, among other factors, the effect of the acquisition on competition, the public benefits expected to be received from the acquisition, any outstanding regulatory compliance issues of any institution that is a party to the transaction, the projected capital ratios and levels on a post-acquisition basis, the financial condition of each institution that is a party to the transaction and of the combined institution after the transaction, the parties’ managerial resources and risk management and governance processes and systems, the parties’ compliance with the Bank Secrecy Act and anti-money laundering requirements, and the acquiring institution’s performance under the Community Reinvestment Act and its compliance with fair housing and other consumer protection laws.
On July 9, 2021, President Biden issued an Executive Order on Promoting Competition in the American Economy, which, among other initiatives, encouraged the review of current practices and adoption of a plan for the revitalization of merger oversight under the BHCA and the Bank Merger Act. On March 25, 2022, the FDIC published a Request for Information seeking information and comments regarding the regulatory framework that applies to merger transactions involving one or more insured depository institution. Making any formal changes to the framework for evaluating bank mergers would require an extended process, and any such changes are uncertain and cannot be predicted at this time. However, the adoption of more expansive or stringent standards may have an impact on the Company’s acquisition activity. Additionally, this Executive Order could influence the federal bank regulatory agencies’ expectations and supervisory oversight for banking acquisitions.
Subject to certain exceptions, the BHCA and the Change in Bank Control Act, together with the applicable regulations, require FRB approval (or, depending on the circumstances, no notice of disapproval) prior to any person or company’s acquiring “control” of a bank or bank holding company. A conclusive presumption of control exists if an individual or company acquires the power, directly or indirectly, to direct the management or policies of an insured depository institution or to vote 25% or more of any class of voting securities of any insured depository institution. A rebuttable presumption of control exists if a person or company acquires 10% or more but less than 25% of any class of voting securities of an insured depository institution and either the institution has registered its securities with the SEC under Section 12 of the Exchange Act or no other person will own a greater percentage of that class of voting securities immediately after the acquisition. The Company’s common stock is registered under Section 12 of the Exchange Act.
On April 1, 2020, the FRB issued a rule for determining whether a company has control over a bank or other company for purposes of the BHCA, and the control presumptions promulgated under Regulation Y, became effective. The rule provides specific guidance for the FRB’s approach to certain control evaluations, including a tiered framework incorporating a series of presumptions based on ownership of a class of voting securities. A company may be presumed to be in control of a target second company based on five levels of ownership of voting securities: (i) less than five percent; (ii) five percent; (iii) ten percent; (iv) 15 percent; (v) 25 percent; and (vi) with a presumption triggered at levels below 25 percent, depending on whether any of nine types of relationships exist (i.e., directors and director service positions, business relationships and business terms, officer/employee interlocks, contractual powers, proxy contests involving directors, and total equity ownership) and, at the same time, ownership of a class of voting securities exceeds certain thresholds. A presumption of control (once triggered) does not automatically result in a control determination under the BHCA as such presumptions may be rebutted. The rule applies only to questions of control under the BHCA, but does not extend to the Change in Bank Control Act.
In addition, Virginia law requires the prior approval of the SCC for (i) the acquisition by a Virginia bank holding company of more than 5% of the voting shares of a Virginia bank or a Virginia bank holding company, or (ii) the acquisition by any other person of control of a Virginia bank holding company or a Virginia bank.
Certain Transactions by Insured Banks with their Affiliates
There are statutory restrictions related to the extent bank holding companies and their non-bank subsidiaries may borrow, obtain credit from or otherwise engage in “covered transactions” with their insured depository institution (i.e., banking) subsidiaries. In general, an “affiliate” of a bank includes the bank’s parent holding company and any subsidiary thereof. However, an “affiliate” does not generally include the bank’s operating subsidiaries. A bank (and its subsidiaries) may not lend money to, or
11
engage in other covered transactions with, its non-bank affiliates if the aggregate amount of covered transactions outstanding involving the bank, plus the proposed transaction, exceeds the following limits: (a) in the case of any one such affiliate, the aggregate amount of covered transactions of the bank and its subsidiaries cannot exceed 10 percent of the bank’s capital stock and surplus; and (b) in the case of all affiliates, the aggregate amount of covered transactions of the bank and its subsidiaries cannot exceed 20 percent of the bank’s capital stock and surplus. “Covered transactions” are defined to include a loan or extension of credit to an affiliate, a purchase of or investment in securities issued by an affiliate, a purchase of assets from an affiliate, the acceptance of securities issued by an affiliate as collateral for a loan or extension of credit to any person or company, the issuance of a guarantee, acceptance or letter of credit on behalf of an affiliate, securities borrowing or lending transactions with an affiliate that creates a credit exposure to such affiliate, or a derivatives transaction with an affiliate that creates a credit exposure to such affiliate. Certain covered transactions are also subject to collateral security requirements.
Covered transactions as well as other types of transactions between a bank and a bank holding company must be on market terms, which means that the transaction must be conducted on terms and under circumstances that are substantially the same, or at least as favorable to the bank, as those prevailing at the time for comparable transactions with or involving nonaffiliates or, in the absence of comparable transactions, that in good faith would be offered to or would apply to nonaffiliates. Moreover, certain amendments to the BHCA provide that, to further competition, a bank holding company and its subsidiaries are prohibited from engaging in certain tying arrangements in connection with any extension of credit, lease or sale of property of any kind, or furnishing of any service.
Regulatory Capital Requirements
All financial institutions are required to maintain minimum levels of regulatory capital. The FDIC establishes risk-based and leveraged capital standards for the financial institutions they regulate. The FDIC also may impose capital requirements in excess of these standards on a case-by-case basis for various reasons, including financial condition or actual or anticipated growth.
As of December 31, 2023 and 2022, the Bank qualified as a “well capitalized” institution. Refer to Note 21, Capital Adequacy, of the Notes to Consolidated Financial Statements in Part II, Item 8, of this Annual Report on Form 10-K.
Basel III Capital Framework
The FRB and the FDIC have adopted rules to implement the Basel III capital framework as outlined by the Basel Committee on Banking Supervision and standards for calculating risk-weighted assets and risk-based capital measurements (collectively, the “Basel III Final Rules”) that apply to banking institutions they supervise and to bank holding companies. For the purposes of the Basel III Final Rules, (i) common equity tier 1 capital (CET1) consists principally of common stock (including surplus) and retained earnings; (ii) Tier 1 capital consists principally of CET1 plus non-cumulative preferred stock and related surplus, and certain grandfathered cumulative preferred stocks and trust preferred securities; and (iii) Tier 2 capital consists of other capital instruments, principally qualifying subordinated debt and preferred stock, and limited amounts of an institution’s allowance for credit losses. Each regulatory capital classification is subject to certain adjustments and limitations, as implemented by the Basel III Final Rules. The Basel III Final Rules also establish risk weightings that are applied to many classes of assets held by community banks, importantly including applying higher risk weightings to certain commercial real estate loans.
The Basel III Final Rules also include a requirement that banks and bank holding companies maintain additional capital (the “capital conservation buffer”). The Basel III Final Rules and capital conservation buffer require:
•a minimum ratio of CET1 to risk-weighted assets of at least 4.5%, plus a 2.5% capital conservation buffer (which is added to the minimum CET1 ratio, effectively resulting in a required ratio of CET1 to risk-weighted assets of at least 7%);
•a minimum ratio of Tier 1 capital to risk-weighted assets of at least 6.0%, plus the capital conservation buffer (effectively resulting in a required Tier 1 capital ratio of 8.5%);
•a minimum ratio of total capital (that is, Tier 1 plus Tier 2) capital to risk-weighted assets of at least 8.0%, plus the capital conservation buffer (effectively resulting in a required total capital ratio of 10.5%); and
12
•a minimum leverage ratio of 4.0%, calculated as the ratio of Tier 1 capital to average total assets, subject to certain adjustments and limitations.
The Basel III Final Rules provide deductions from and adjustments to regulatory capital measures, primarily to CET1, including deductions and adjustments that were not applied to reduce CET1 under historical regulatory capital rules. For example, mortgage servicing rights, deferred tax assets dependent upon future taxable income, and significant investments in non-consolidated financial entities must be deducted from CET1 to the extent that any one such category exceeds 10% of CET1 or all such categories in the aggregate exceed 15% of CET1. As of December 31, 2023, the Company and the Bank met all capital adequacy requirements under the Basel III Final Rules.
In July 2023, the Federal Reserve Board and the FDIC issued proposed rules to implement the final components of the Basel III agreement, often known as the “Basel III endgame.” These proposed rules contain provisions that apply to banks with $100 billion or more in total assets and that will significantly alter how those banks calculate risk-based assets. These proposed rules do not apply to holding companies or banks with less than $100 billion in assets, such as the Company and the Bank, but the final impacts of these rules cannot yet be predicted. The comment window for these proposed rules closed on November 30, 2023.
Community Bank Leverage Ratio
As a result of the EGRRCPA, Qualifying banks with less than $10 billion in consolidated assets to elect to be subject to a 9% leverage ratio applied using less complex leverage calculations (the “Community Bank Leverage Ratio Framework” or “CBLRF”). Banks that opt into the CBLRF and maintain a leverage ratio of greater than 9% are not subject to other risk-based and leverage capital requirements and are deemed to meet Basel III Final Rules’ well capitalized ratio requirements. To qualify for the CBLRF, a bank must have less than $10 billion in total consolidated assets, limited amounts of off-balance sheet exposures and trading assets and liabilities, and a leverage ratio greater than 9%. A bank that elects the CBLRF and has a leverage ratio greater than 9% will be considered to be in compliance with Basel III capital requirements and exempt from the complex Basel III calculations. A bank that falls out of compliance with the CBLRF will have a two-quarter grace period to come back into full compliance, provided that its leverage ratio remains above 8% (a bank will be deemed well-capitalized during the grace period). The CBLRF became available for banking organizations to use as of March 31, 2020 (with the flexibility for banking organizations to subsequently opt into or out of the CBLRF, as applicable). As of December 31, 2023, the Bank has not elected to apply the CBLRF, but the Bank continues to assess the potential impact of opting in to CBLRF as part of its ongoing capital management and planning processes.
Dividend Limitations
The Company is a legal entity that is separate and distinct from the Bank. A significant portion of the revenues of the Company result from dividends paid to it by the Bank. Both the Company and the Bank are subject to laws and regulations that limit the payment of dividends, including limits on the sources of dividends and requirements to maintain capital at or above regulatory minimums. Banking regulators have indicated that Virginia banking organizations should generally pay dividends only (1) from net undivided profits of the bank, after providing for all expenses, losses, interest and taxes accrued or due by the bank and (2) if the prospective rate of earnings retention appears consistent with the organization’s capital needs, asset quality and overall financial condition. In addition, FRB supervisory guidance indicates that the FRB may have safety and soundness concerns if a bank holding company pays dividends that exceed earnings for the period in which the dividend is being paid. Further, the Federal Deposit Insurance Act (“FDIA”) prohibits insured depository institutions such as the Bank from making capital distributions, including paying dividends, if, after making such distribution, the institution would become undercapitalized as defined in the statute. We do not expect that any of these laws, regulations or policies will materially affect the ability of the Company or the Bank to pay dividends.
Insurance of Accounts, Assessments and Regulation by the FDIC
Deposits with the Bank are insured through the Deposit Insurance Fund (“DIF”) of the FDIC. As a DIF-insured institution, the Bank is subject to FDIC rules and regulations as administrator of the DIF. The Dodd-Frank Act made permanent the current standard maximum deposit insurance amount of $250,000. The FDIC coverage applies per depositor, per insured depository
13
institution, for each account ownership category. The FDIC is authorized to conduct examinations of and to require reporting by DIF-insured institutions.
The FDIC is authorized to prohibit any DIF-insured institution from engaging in any activity that the FDIC determines by regulation or order to pose a serious threat to the insurance fund. Also, the FDIC may initiate enforcement actions against banks after first giving the institution’s primary regulatory authority an opportunity to take such action. The FDIC may terminate the deposit insurance of any depository institution, including the Bank, if it determines, after a hearing, that the institution has engaged or is engaging in unsafe or unsound practices, is in an unsafe or unsound condition to continue operations, or has violated any applicable law, regulation, order or any condition imposed in writing by the FDIC. It also may suspend deposit insurance temporarily during the hearing process for the permanent termination of insurance, if the institution has no tangible capital. If deposit insurance is terminated, the deposits at the institution at the time of termination, less subsequent withdrawals, shall continue to be insured for a period from six months to two years, as determined by the FDIC. Management is aware of no existing circumstances that could result in termination of the Bank’s deposit insurance.
The DIF is funded by assessments on banks and other depository institutions calculated based on average consolidated total assets minus average tangible equity (defined as Tier 1 capital). The actual assessment to be paid by each DIF member is based on the institution’s assessment risk classification and whether the institution is considered by its supervisory agency to be financially sound or to have supervisory concerns. As required by the Dodd-Frank Act, the FDIC has adopted a large-bank pricing assessment scheme, set a target “designated reserve ratio” (described in more detail below) of 2% for the DIF and, in lieu of dividends, provides for a lower assessment rate schedule when the reserve ratio reaches 2% and 2.5%. An institution's assessment rate is based on a statistical analysis of financial ratios that estimates the likelihood of failure over a three-year period, which considers the institution’s weighted average CAMELS composite rating, and is subject to further adjustments including those related to levels of unsecured debt and brokered deposits. At December 31, 2022, total base assessment rates for institutions that have been insured for at least five years range from 1.5 to 40 basis points applying to banks with less than $10 billion in assets.
Banks with less than $10 billion in total consolidated assets (such as the Bank) receive credits to offset the portion of their assessments that help to raise the reserve ratio to 1.35%. The FDIC will automatically apply such a bank’s credits to reduce its regular DIF assessment up to the entire amount of the assessment. The FDIC will remit any such remaining credits in a lump sum to the appropriate bank following application to the bank’s regular DIF assessment for four quarterly assessment periods.
The Dodd-Frank Act transferred to the FDIC increased discretion with regard to managing the required amount of reserves for the DIF, or the “designated reserve ratio.” The FDIA requires the FDIC to consider the appropriate level for the DIF on at least an annual basis. On October 18, 2022, the FDIC adopted a final rule to increase initial base deposit insurance assessment rate schedules uniformly by 2 bps, beginning in the first quarterly assessment period of 2023. This increase in assessment rate schedules is intended to increase the likelihood that the reserve ratio reaches 1.35% by the statutory deadline of September 30, 2028. The new assessment rate schedules will remain in effect unless and until the reserve ratio meets or exceeds 2%. Progressively lower assessment rate schedules will take effect when the reserve ratio reaches 2%, and again when it reaches 2.5%.
In November 2023, the FDIC issued a final rule to implement a special DIF assessment following the FDIC’s use of the “systemic risk” exception to the least-cost resolution test in connection with the failures and resolutions of Silicon Valley Bank and Signature Bank. Banks with less than $5 billion of uninsured deposits, such as the Bank, are exempt from this special assessment.
Community Reinvestment
The Community Reinvestment Act (the “CRA”) imposes on financial institutions, including the Bank, an affirmative obligation to help meet the credit needs of their local communities, including low and moderate-income neighborhoods, consistent with the safe and sound operation of those institutions. Each financial institution’s efforts in helping meet community credit needs currently are evaluated as part of the examination process pursuant to regulations adopted by the federal banking agencies. Under the regulation, a financial institution’s efforts in helping meet its community’s credit needs are evaluated, based on the particular institution’s total assets, according to three-pronged test of lending, investment and service in the community. The grade received by a bank is considered in evaluating mergers, acquisitions and applications to open a branch or facility. To the
14
best knowledge of the Bank, it is meeting its obligations under the CRA. The Bank received a rating of “satisfactory” on its most recent CRA examination dated October 23, 2023.
On October 24, 2023, the federal bank regulatory agencies jointly issued a final rule to modernize CRA regulations consistent with the following key goals: (1) to encourage banks to expand access to credit, investment, and banking services in low to moderate incoming communities; (2) to adapt to changes in the banking industry, including internet and mobile banking and the growth of non-branch delivery systems; (3) to provide greater clarity and consistency in the application of the CRA regulations, including adoption of a new metrics-based approach to evaluating bank retail lending and community development financing; and (4) to tailor CRA evaluations and data collection to bank size and type, recognizing that differences in bank size and business models may impact CRA evaluations and qualifying activities. Most of the final CRA rule’s requirements will be applicable beginning January 1, 2026, with certain requirements, including the data reporting requirements, applicable as of January 1, 2027. The Bank is evaluating the expected impact of the modified CRA regulations, but currently does not anticipate any material impact to its business, operations or financial condition due to the modified CRA regulations.
Federal Home Loan Bank of Atlanta
The Bank is a member of the Federal Home Loan Bank (“FHLB”) of Atlanta, which is one of 12 regional FHLBs that provide funding to their members for making housing loans as well as for affordable housing and community development loans. Each regional FHLB serves as a reserve, or central bank, for the members within its assigned region. Each FHLB makes loans to members in accordance with policies and procedures established by the Board of Directors of the FHLB. As a member, the Bank must purchase and maintain stock in the FHLB. At December 31, 2023, the Bank owned $21.6 million of FHLB stock.
Consumer Protection
The Consumer Financial Protection Bureau (the “CFPB”) is the federal regulatory agency responsible for implementing, examining and enforcing compliance with federal consumer financial laws for institutions with more than $10 billion of assets and, to a lesser extent, smaller institutions. The CFPB supervises and regulates providers of consumer financial products and services, and has rule making authority in connection with numerous federal consumer financial protection laws (for example, but not limited to, the Truth-in-Lending Act (“TILA”) and the Real Estate Settlement Procedures Act (“RESPA”)).
Because the Company and the Bank are smaller institutions (i.e., with assets of $10 billion or less), most consumer protection aspects of the Dodd-Frank Act will continue to be applied to the Company by the FRB and the Bank by the FDIC. However, the CFPB may include its own examiners in regulatory examinations by a smaller institution’s principal regulators and may require smaller institutions to comply with certain CFPB reporting requirements. In addition, regulatory positions taken by the CFPB and administrative and legal precedents established by CFPB enforcement activities, including in connection with supervision of larger banks, could influence how the FRB and the FDIC apply consumer protection laws and regulations to financial institutions that are not directly supervised by the CFPB. The precise effect of the CFPB’s consumer protection activities on the Company and the Bank cannot be determined with certainty.
Mortgage Banking Regulation
In connection with making mortgage loans, the Bank is subject to rules and regulations that, among other things, establish standards for loan origination, prohibit discrimination, provide for inspections and appraisals of property, require credit reports on prospective borrowers, restrict in some cases certain loan features and fix maximum interest rates and fees, require the disclosure of certain basic information to mortgagors concerning credit and settlement costs, limit payment for settlement services to the reasonable value of the services rendered and require the maintenance and disclosure of information regarding the disposition of mortgage applications based on race, gender, geographical distribution and income level. The Bank’s mortgage origination activities are subject to the Equal Credit Opportunity Act, TILA, the Home Mortgage Disclosure Act, RESPA, the Home Ownership Equity Protection Act, and the regulations promulgated under these acts, among other additional state and federal laws, regulations and rules.
The Bank’s mortgage origination activities are also subject to Regulation Z, which implements TILA. Certain provisions of Regulation Z require mortgage lenders to make a reasonable and good faith determination, based on verified and documented information, that a consumer applying for a mortgage loan has a reasonable ability to repay the loan according to its terms. Alternatively, a mortgage lender can originate “qualified mortgages,” which are generally defined as mortgage loans without
15
negative amortization, interest-only payments, balloon payments, terms exceeding 30 years, and points and fees paid by a consumer equal to or less than 3% of the total loan amount. Under the EGRRCPA, most residential mortgage loans originated and held in portfolio by a bank with less than $10 billion in assets will be designated as “qualified mortgages.” Higher-priced qualified mortgages (e.g., sub-prime loans) receive a rebuttable presumption of compliance with ability-to-repay rules, and other qualified mortgages (e.g., prime loans) are deemed to comply with the ability-to-repay rules. The Bank predominantly originates mortgage loans that comply with Regulation Z’s “qualified mortgage” rules.
Brokered Deposits
Section 29 of the FDIA and FDIC regulations generally limit the ability of any bank to accept, renew or roll over any brokered deposit unless it is “well capitalized” or, with the FDIC’s approval, “adequately capitalized.” On December 15, 2020, the FDIC issued rules to revise brokered deposit regulations in light of modern deposit-taking methods. The rules established a new framework for certain provisions of the “deposit broker” definition and amended the FDIC’s interest rate methodology calculating rates and rate caps. The rules became effective on April 1, 2021 and, to date, there has been no material impact to either the Company or the Bank from the rules.
Prompt Corrective Action
Federal banking agencies have broad powers under current federal law to take prompt corrective action to resolve problems of insured depository institutions. The extent of these powers depends upon whether the institution in question is “well capitalized,” “adequately capitalized,” “undercapitalized,” “significantly undercapitalized” or “critically undercapitalized.” These terms are defined under uniform regulations issued by each of the federal banking agencies regulating these institutions. An insured depository institution which is less than adequately capitalized must adopt an acceptable capital restoration plan, is subject to increased regulatory oversight and is increasingly restricted in the scope of its permissible activities. As of December 31, 2023, the Bank was considered “well capitalized.”
Incentive Compensation
The Dodd-Frank Act requires the federal banking agencies and the SEC to establish joint regulations or guidelines prohibiting incentive-based payment arrangements at specified regulated entities with at least $1 billion in total consolidated assets, that encourage inappropriate risks by providing an executive officer, employee, director, or principal shareholder with excessive compensation, fees, or benefits that could lead to material financial loss to the entity. In 2016, the SEC and the federal banking agencies proposed rules that prohibit covered financial institutions (including bank holding companies and banks) from establishing or maintaining incentive-based compensation arrangements that encourage inappropriate risk taking by providing covered persons (consisting of senior executive officers and significant risk takers, as defined in the rules) with excessive compensation, fees or benefits that could lead to material financial loss to the financial institution. The proposed rules outline factors to be considered when analyzing whether compensation is excessive and whether an incentive-based compensation arrangement encourages inappropriate risks that could lead to material loss to the covered financial institution, and establish minimum requirements that incentive-based compensation arrangements must meet to be considered to not encourage inappropriate risks and to appropriately balance risk and reward. The proposed rules also impose additional corporate governance requirements on the boards of directors of covered financial institutions and impose additional record-keeping requirements. The comment period for these proposed rules has closed and a final rule has not yet been published. If the rules are adopted as proposed, they will restrict the manner in which executive compensation is structured.
Confidentiality and Required Disclosures of Customer Information
The Company is subject to various laws and regulations that address the privacy of nonpublic personal financial information of consumers. The Gramm-Leach-Bliley Act and certain regulations issued thereunder protect against the transfer and use by financial institutions of consumer nonpublic personal information. A financial institution must provide to its customers, at the beginning of the customer relationship and annually thereafter, the institution’s policies and procedures regarding the handling of customers’ nonpublic personal financial information. These privacy provisions generally prohibit a financial institution from providing a customer’s personal financial information to unaffiliated third parties unless the institution discloses to the customer that the information may be so provided and the customer is given the opportunity to opt-out of such disclosure. Certain exceptions may apply to the requirement to deliver an annual privacy notice based on how a financial institution limits sharing
16
of nonpublic personal information, and whether the institution’s disclosure practices or policies have changed in certain ways since the last privacy notice that was delivered.
Data privacy and data protection are areas of increasing state legislative focus. In March 2021, the Governor of Virginia signed into law the Virginia Consumer Data Protection Act (the “VCDPA”), which went into effect on January 1, 2023. The VCDPA grants Virginia residents the right to access, correct, delete, know, and opt-out of the sale and processing for targeted advertising purposes of their personal information, similar to the protections provided by similar consumer data privacy laws in California and in Europe. The VCDPA also imposes data protection assessment requirements and authorizes the Attorney General of Virginia to enforce the VCDPA, but does not provide a private right of action for consumers. The Bank is exempt from the VCDPA, but certain third party vendors of the Bank are or will be subject to the VCDPA. The Company and the Bank are monitoring for the potential negative effects on the products and services provided by these vendors.
The Company is also subject to various laws and regulations that attempt to combat money laundering and terrorist financing. The Bank Secrecy Act (the “BSA”) requires all financial institutions to, among other things, create a system of controls designed to prevent money laundering and the financing of terrorism, and imposes recordkeeping and reporting requirements. The USA PATRIOT Act added regulations to facilitate information sharing among governmental entities and financial institutions for the purpose of combating terrorism and money laundering and requires financial institutions to establish anti-money laundering programs. Regulations adopted under the BSA impose on financial institutions customer due diligence requirements, and the federal banking regulators expect that customer due diligence programs will be integrated within a financial institution’s broader BSA and anti-money laundering compliance program. The Office of Foreign Assets Control (“OFAC”), which is a division of the U.S. Department of Treasury, is responsible for helping to ensure that United States entities do not engage in transactions with “enemies” of the United States, as defined by various Executive Orders and Acts of Congress. If the Company finds the name of an “enemy” of the United States on any transaction, account or wire transfer that is on an OFAC list, it must freeze such account or place transferred funds into a blocked account, and report it to OFAC.
Although these laws and programs impose compliance costs and create privacy obligations and, in some cases, reporting obligations, and compliance with all of the laws, programs, and privacy and reporting obligations may require significant resources of the Company and the Bank, these laws and programs do not materially affect the Bank’s products, services or other business activities.
Corporate Transparency Act
On January 1, 2021, as part of the 2021 National Defense Authorization Act, Congress enacted the Corporate Transparency Act (“CTA”), which requires the Financial Crimes Enforcement Network (“FinCEN”) to issue regulations implementing reporting requirements for “reporting companies” (as defined in the CTA) to disclose beneficial ownership interests of certain U.S. and foreign entities by January 1, 2022. The CTA imposes additional reporting requirements on entities not previously subject to such beneficial ownership disclosure regulations and also contains exemptions for several different types of entities, including among others: (i) certain banks, bank holding companies, and credit unions; (ii) money transmitting businesses registered with FinCEN; and (iii) certain insurance companies. Reporting companies subject to the CTA are required to provide specific information with respect to beneficial owner(s) (as defined in the CTA) as well as satisfy initial filing obligations (for newly-formed reporting companies) and submit on-going periodic reports. Non-compliance with FinCEN regulations promulgated under the CTA may result in civil fines and criminal penalties. On September 29, 2022, FinCEN issued a final rule to implement the beneficial ownership reporting requirements of the CTA, which became effective January 1, 2024. The Company and the Bank continue to monitor regulatory developments related to the CTA and will continue to assess the ultimate impact of the CTA on the Company and the Bank.
Cybersecurity
The federal banking agencies have also adopted guidelines for establishing information security standards and cybersecurity programs for implementing safeguards under the supervision of a financial institution’s board of directors. These guidelines, along with related regulatory materials, increasingly focus on risk management and processes related to information technology and the use of third parties in the provision of financial products and services. The federal banking agencies expect financial institutions to establish lines of defense and ensure that their risk management processes also address the risk posed by compromised customer credentials, and also expect financial institutions to maintain sufficient business continuity planning processes to ensure rapid recovery, resumption and maintenance of the institution’s operations after a cyber-attack. If the
17
Company or the Bank fails to meet the expectations set forth in this regulatory guidance, the Company or the Bank could be subject to various regulatory actions and any remediation efforts may require significant resources of the Company or the Bank. In addition, all federal and state banking agencies continue to increase focus on cybersecurity programs and risks as part of regular supervisory exams.
On November 18, 2021, the federal bank regulatory agencies issued final rules to improve the sharing of information about cyber incidents that may affect the U.S. banking system. These rules require a banking organization to notify its primary federal regulator of any significant computer-security incident as soon as possible and no later than 36 hours after the banking organization determines that a cyber-incident has occurred. Notification is required for incidents that have materially affected or are reasonably likely to materially affect the viability of a banking organization’s operations, its ability to deliver banking products and services, or the stability of the financial sector. In addition, the rules require a bank service provider to notify affected banking organization customers as soon as possible when the provider determines that it has experienced a computer-security incident that has materially affected or is reasonably likely to materially affect banking organization customers for four or more hours. The rule became effective on May 1, 2022. The final rules did not have a material impact on the Company or the Bank’s operations.
Stress Testing
The federal banking agencies have implemented stress-testing requirements for certain large or risky financial institutions, including bank holding companies and state-chartered banks. Although these requirements do not apply to the Company and the Bank, the federal banking agencies emphasize that all banking organizations, regardless of size, should have the capacity to analyze the potential effect of adverse market conditions or outcomes on the organization’s financial condition. Based on existing regulatory guidance, the Company and the Bank will be expected to consider its interest rate risk management, commercial real estate loan concentrations and other credit-related information, and funding and liquidity management during this analysis of adverse market conditions or outcomes.
Volcker Rule
The Dodd-Frank Act prohibits bank holding companies and their subsidiary banks from engaging in proprietary trading except in limited circumstances, and places limits on ownership of equity investments in private equity and hedge funds (the “Volcker Rule”). The EGRRCPA and final rules adopted to implement the EGRRCPA exempt all banks with less than $10 billion in assets (including their holding companies and affiliates) from the Volcker Rule, provided that the institution has total trading assets and liabilities of 5% or less of total assets, subject to certain limited exceptions. The Company believes that its financial condition and its operations are not significantly affected by the Volcker Rule, amendments thereto, or its implementing regulations.
Call Reports and Examination Cycle
All institutions, regardless of size, submit a quarterly call report that includes data used by federal banking agencies to monitor the condition, performance, and risk profile of individual institutions and the industry as a whole. The EGRRCPA contained provisions expanding the number of regulated institutions eligible to use streamlined call report forms. In June 2019, the federal banking agencies issued a final rule to permit insured depository institutions with total assets of less than $5 billion that do not engage in certain complex or international activities to file the most streamlined version of the quarterly call report, and to reduce data reportable on certain streamlined call report submissions.
Effect of Governmental Monetary Policies
As with other financial institutions, the earnings of the Company and the Bank are affected by general economic conditions as well as by the monetary policies of the FRB. Such policies, which include regulating the national supply of bank reserves and bank credit, can have a major effect upon the source and cost of funds and the rates of return earned on loans and investments, and on levels of inflation in the United States. The FRB exerts a substantial influence on interest rates and credit conditions, primarily through establishing target rates for federal funds, open market operations in U.S. Government securities, varying the discount rate on member bank borrowings and setting cash reserve requirements against deposits. Changes in monetary policy, including changes in interest rates, will influence the origination of loans, the purchase of investments, the generation of deposits, and rates received on loans and investment securities and paid on deposits. Federal Reserve monetary policies have
18
had a significant effect on the operating results of community banks, including us, in the past and are expected to do so in the future.
Application of Supervisory Guidance to the Company and the Bank
On March 31, 2021, the Federal Reserve issued a final rule outlining and confirming the use of supervisory guidance for regulated institutions, including bank holding companies like the Company. The rule generally codifies a statement issued by the federal banking agencies in September 2018 clarifying the differences between regulations and guidance, and provides that, unlike a law or regulation, supervisory guidance does not have the force and effect of law, and the agencies do not take enforcement actions based on supervisory guidance. Rather, guidance outlines expectations and priorities, or articulates views regarding appropriate practices for a specific subject. The rule became effective on April 30, 2021. The Company has not been materially impacted by the effectiveness of this rule.
Future Regulation
From time to time, various legislative and regulatory initiatives are introduced in Congress and state legislatures, as well as by regulatory agencies. Such initiatives may include proposals to expand or contract the powers of bank holding companies and depository institutions or to substantially change the financial institution regulatory system. Such legislation could change banking statutes and the operating environment of the Company and the Bank in substantial and unpredictable ways. If enacted, such legislation could increase or decrease the cost of doing business, limit or expand permissible activities or affect the competitive balance among banks, savings associations, credit unions, and other financial institutions with which we compete. The Company cannot predict whether any such legislation will be enacted, and, if enacted, the effect that it, or any implementing regulations, would have on its financial condition or results of operations. A change in statutes, regulations or regulatory policies applicable to the Company and the Bank could have a material effect on our business.
Where You Can Find More Information
The Company files quarterly, annual and periodic reports, proxy statements and insider filings with the SEC. The Company’s SEC filings are available to the public over the Internet at the SEC’s web site at http://www.sec.gov. The Company’s SEC filings also are available through our website, www.CBTCares.com. Copies of documents may also be obtained free of charge by directing a request by telephone to (276) 656-1776 or mail to Investor Relations, Carter Bankshares, Inc., 1300 Kings Mountain Road, Martinsville, Virginia 24112.
19
CARTER BANKSHARES, INC. AND SUBSIDIARIES
ITEM 1A. RISK FACTORS
Investments in the Company’s common stock involves risks. In addition to the other information set forth in this Annual Report on Form 10-K, including the information addressed above under “Important Note Regarding Forward-Looking Statements,” investors in the Company’s common stock should carefully consider the risk factors discussed below. The following discussion highlights the risks that we believe are material to the Company, but the following discussion does not necessarily include all risks that we may face, and an investor in the Company’s common stock should not interpret the disclosure of a risk in the following discussion to state or imply that the risk has not already materialized. These factors could materially and adversely affect the Company’s business, financial condition, liquidity, results of operations, and capital position, and could cause the Company’s actual results to differ materially from its historical results or the results contemplated by the forward-looking statements contained in this Annual Report on Form 10-K, in which case, the trading price of the Company’s common stock could decline.
Risks Related to Credit
Nonperforming assets can take significant time to resolve and may adversely affect the Company’s results of operations and financial condition, and could result in further losses in the future.
As of December 31, 2023, our nonperforming loans totaled $309.5 million, or 8.83%, of the Company’s loan portfolio. The Company’s policy is to place loans in nonaccrual status when collection of interest or principal is doubtful, or generally when interest or principal payments are 90 days or more past due based on contractual terms. While the Company generally seeks to reduce or resolve problem assets through, among other methods, loan workouts, restructurings, or sales of the loans or underlying collateral, decreases in the value of the underlying collateral, decreases in the respective borrowers’ financial condition, profitability, or operating performance, or efforts by the respective borrowers’ to delay or avoid legal processes may inhibit such reduction or resolution efforts which, in turn, could adversely impact the Company’s business, financial condition and results of operations.
The Company’s nonperforming assets adversely affect its business, financial condition and results of operations in various ways. The Company does not record interest income on nonaccrual loans or OREO; thus nonperforming assets adversely affect the Company’s net income and returns on assets and equity, increase the Company’s loan administration costs and adversely affects the Company’s results of operations and efficiency ratio. The resolution of nonperforming assets requires significant time commitments from management which can adversely impact the Company’s and Bank’s other strategic and operational priorities. If the Bank takes collateral in foreclosure and via a similar proceeding, the Bank is required to mark the collateral to its then-fair market value, which may result in a loss, and the Bank will incur legal and other expenses, which may be significant, in connection with the foreclosure and sale process. Nonperforming loans and OREO can also increase the Company’s and the Bank’s risk profile and the level of regulatory capital that their respective banking regulators believe is appropriate. Nonperforming loans and OREO also can adversely impact the Company’s liquidity available with secondary liquidity sources, as the Bank is not able to pledge nonperforming loans and OREO as collateral for borrowings from these sources. FDIC expense has increased significantly due to the deterioration in asset quality as a direct result of one large nonperforming loan relationship, which is a component used to determine the assessment.
During the second quarter of 2023, the Company placed in nonaccrual status certain commercial loans in the Other segment of the Company’s loan portfolio, all relating to the Bank’s largest lending relationship, that have an aggregate principal amount of $301.9 million. Because the Company placed these loans on nonaccrual status, the Company was unable to accrue approximately $30.0 million of interest income related to these loans as of December 31, 2023.
The Company’s level of credit risk is elevated due to relationship exposure to the Company’s largest lending relationship.
As of December 31, 2023, the Company’s largest lending relationship operates in the hospitality, agriculture and energy sectors and had loans outstanding with an aggregate principal amount of $301.9 million. All such loans are classified in the Other segment of the Company’s loan portfolio. During the second quarter of 2023, the Company placed these loans on nonaccrual status due to loan maturities and failure to pay in full. This lending relationship comprises 96.8% of the Company’s nonperforming assets and 97.5% of the Company’s nonperforming loans and 8.6% of total portfolio loans at December 31, 2023.
20
The Company has initiated collection processes with respect to such loans and intends to explore all alternatives for repayment or recovery. Although the Company believes it is well secured based on the net carrying value of the credit relationship and appropriately reserved for potential losses with respect to all such loans based on information currently available, we cannot give any assurance as to the timing or amount of future payments or collections on such loans or that the Company will ultimately collect all amounts contractually due under the terms of such loans.
Further deterioration of this lending relationship, including adverse changes in the financial condition of the respective borrowers or guarantors, potential claims by other creditors of the respective borrowers, further litigation with the respective borrowers or guarantors or adverse changes in the value of collateral that secures this lending relationship, could require the Company to increase its allowance for loan losses or result in significant losses to the Company, which could have a material adverse effect on the Company’s business, financial condition and results of operations.
A large percentage of the Company’s commercial loans are secured by real estate, and an adverse change in the real estate market or in economic conditions more generally may result in losses and adversely affect our profitability.
Approximately 92.4% of the Company’s commercial loan portfolio as of December 31, 2023, was comprised of loans secured by real estate. An adverse change in the economy affecting occupancy and/or rental rates in the investment real estate market areas we serve could increase the likelihood of defaults. Real estate collateral securing the Company's loans are a secondary source of repayment in the event of unremedied defaults. The value of the Company's collateral could be impaired by changes in demand, rental rates and capitalization rates and could be insufficient to recover outstanding principal and interest. As a result, the Company’s profitability and financial condition could be negatively impacted by an adverse change in the real estate market.
The Company’s CRE loan portfolio is concentrated predominantly in North Carolina and Virginia, within the retail, multifamily, hospitality, warehouse and office metrics. As a result of this concentration of the company’s loan portfolio, it may be more sensitive, as compared to more diversified institutions, to future disruptions in and deterioration of this market.
The Company relies on independent appraisals to determine the value of the real estate which secures a significant portion of our loans, and the values indicated by such appraisals may not be realizable if foreclosure on such loans is forced.
A significant portion of the Company’s loan portfolio consists of loans secured by real estate. We rely on independent appraisers to provide professional opinions of the value of such real estate. Appraisals are only estimates of value and the independent appraisers may make mistakes of fact or judgment that adversely affect the reliability of their appraisals. In addition, events occurring after the initial appraisal may cause the value of the real estate to increase or decrease. As a result of any of these factors, the real estate securing some of the loans may be more or less valuable than anticipated at the time the loans were made. If a default occurs on a loan secured by real estate that is less valuable than originally estimated, the Company may not be able to recover the outstanding balance of the loan.
Appraisal valuations can be impacted by changes in the equilibrium between supply and demand, changes in occupancy, lease rates and capitalization rates. Appraisals can also be impacted by the information available to the appraiser, including age of industry, market or borrower information, by access to property that is the subject of the appraisal, and by changing economic, industry or market conditions. The bank updates appraisals in connection with defined extensions of credit, which includes but is not limited to requests for additional loan funding, material changes to the loan’s amortization or material extensions of the maturity date. Additionally, the bank will generally update appraisals when the loan is considered collateral dependent and is either subject to Individually Evaluated Loan status or prior to the completion of a foreclosure initiating a collection process.
The Company’s level of credit risk is elevated due to the concentration of commercial real estate loans and commercial real estate construction loans in its portfolio.
As of December 31, 2023, the Company’s exposure to loans secured by commercial purpose real estate, including investment real estate loans related to hospitality, retail and multifamily apartments (but excluding construction) equated to $1.8 billion, or 51.2% of its total loan portfolio. The average balance of these loans are generally larger and these loans generally involve a more complex degree of financial and credit risk than loans secured by residential real estate. Repayment of these loans is dependent on the success of the borrower’s underlying business and/or the borrower’s ability to generate leases in order to receive sufficient cash flow to service its debts. The financial and credit risk associated with these loans is a result of several
21
factors, including, but not limited to, macroeconomic conditions affecting supply, demand and property valuations, as well as larger balances in a smaller population of loans.
The Company’s exposure to hospitality at December 31, 2023 equated to approximately $341.1 million, or 9.7% of its total loan portfolio. These were mostly loans secured by upscale or top tier flagged hotels, which have historically exhibited low leverage and strong operating cash flows.
The Company’s exposure to commercial real estate construction loans at December 31, 2023 equated to approximately $500.0 million, or 14.3% of total portfolio loans. Construction loans are inherently risky. These risks include, but are not limited to, potential adverse changes in material costs resulting in cost overruns, and the potential that the general contractors develop financial stress and are unable to complete projects and the speculative nature of lease up risk. A severe downturn in real estate could affect demand for leases, capitalization rates and property valuations, which could adversely affect our financial condition and results of operations.
Our allowance for credit losses may be insufficient.
The measure of our allowance for credit losses is dependent on the interpretation and application of the Current Expected Credit Losses (“CECL”) methodology, which the Company adopted effective January 1, 2021, and which replaced the incurred loss methodology that was used by the Company and the Bank under GAAP prior to that date. The CECL methodology reflects expected credit losses and requires consideration of a broader range of reasonable and supportable information to inform credit loss estimates. Accordingly, the implementation of the CECL model changed the Company’s current method of providing allowance for credit losses (“ACL”) and resulted in material changes in the Company’s accounting for credit losses on financial instruments. The CECL model may create more volatility in the Company’s level of ACL, which, if materially increased, could adversely affect our business, financial condition, and results of operations.
We have and will continue to implement further enhancements or changes to our methodology, models and the underlying assumptions, estimates and assessments, as needed. If the assumptions or estimates we use in adopting the new standard are incorrect or we need to change our underlying assumptions and estimates, there may be a material adverse impact on our results of operation and financial condition. We maintain an ACL at a level we believe is adequate to absorb expected losses in our loan portfolio as of the corresponding balance sheet date. The process to determine the ACL uses models and assumptions that require us to make difficult and complex judgments that are often interrelated, including how borrowers will perform in changing economic and market conditions. Also, we may fail to accurately identify the appropriate economic indicators, to accurately estimate the timing of future changes in economic or market conditions, or to estimate accurately the impacts of future changes in economic or market conditions on our borrowers. Any of these failures could significantly impact the accuracy of our loss forecasts and allowance estimates and the sufficiency of our ACL.
If the models, estimates, and assumptions we use to establish reserves or the judgments we make in extending credit to our borrowers prove inaccurate in predicting future events, we may suffer unexpected losses. There is no guarantee that our ACL will be sufficient to address credit losses, particularly if the economic outlook deteriorates significantly and quickly, or if a specific segment of the Company’s loan or borrower portfolio is adversely impacted by changing market or other conditions. In such an event, we may need to increase our ACL, which would result in provisions for credit losses that would reduce our earnings. Management evaluates the appropriateness of the ACL for the “Other” segment through the projected discounted cash flow analysis with various assumptions and multiple scenarios. It is difficult to predict the specific resolution of this relationship. As a result, the reserve analysis employs a number of potential outcomes, which are weighted based on probabilities as determined by management based on current information available to us. Additionally, to the extent that credit losses are worse than expected, which could be caused by persistent inflation or an economic recession that negatively impacts borrowers, we may need to increase our provision for loan losses.
Our real estate lending business can result in increased costs associated with Other Real Estate Owned (“OREO”).
Because we originate loans secured by real estate, we may have to foreclose on the collateral property to protect our investment and may thereafter own and operate such property, in which case we are exposed to the risks inherent in the ownership of real estate. We use methods for valuing collateral for individually evaluated loans and OREO that are in compliance with Accounting Standards Codification (“ASC”) Topic 310 Receivables. The methods require the use of assumptions that are subject to change based on events impacting real estate values. The amount that we may realize after a default is dependent upon factors outside of our control, including, but not limited to, general or local economic conditions, environmental cleanup
22
liability, neighborhood values, interest rates, real estate tax rates, operating expenses of the mortgaged properties, and supply of and demand for properties. Certain expenditures associated with the ownership of income producing real estate, principally real estate taxes and maintenance costs, may adversely affect the net cash flows generated by the real estate. Therefore, the cost of operating income-producing real property may exceed the rental income earned from such property, and we may have to advance funds to protect our investment or we may be required to dispose of the real property at a loss.
Risks Related to Our Operations, Cybersecurity and Technology
A failure in or breach of our operational or security systems or infrastructure, or those of third parties, could disrupt the Company’s businesses, and adversely impact our results of operations, liquidity and financial condition, as well as cause reputational harm.
The Company’s operational and security systems, infrastructure, including our computer systems, data management, and internal processes, as well as those of third parties, are integral to our business. We rely on our associates and third parties in our day-to-day and ongoing operations, who may, as a result of human error, misconduct or malfeasance, or failure or breach of third-party systems or infrastructure, expose us to risk. We have taken measures to implement backup systems and other safeguards to support our operations, but our ability to conduct business may be adversely affected by any significant disruptions to us or to third parties with whom we interact. In addition, our ability to implement backup systems and other safeguards with respect to third-party systems is more limited than with our own systems.
The Company handles a substantial volume of customer and other financial transactions every day. Our financial, accounting, data processing, check processing, electronic funds transfer, loan processing, online and mobile banking, backup or other operating or security systems and infrastructure may fail to operate properly or become disabled or damaged as a result of a number of factors including events that are wholly or partially beyond our control. This could adversely affect our ability to process these transactions or provide these services. There could be sudden increases in customer transaction volume, electrical, telecommunications or other major physical infrastructure outages, natural disasters, events arising from local or larger scale political or social matters, including terrorist acts, and cyber-attacks. We continuously update these systems to support our operations and growth. This updating entails significant costs and creates risk associated with implementing new systems and integrating them with existing ones. Operational risk exposures could adversely impact our results of operations, liquidity and financial condition, and cause reputational harm.
A cyber-attack, information or security breach, or a technology failure of ours or of a third-party could adversely affect the Company’s ability to conduct business or manage exposure to risk, resulting in the disclosure or misuse of confidential or proprietary information, increase costs to maintain and update our operational systems, security systems, and infrastructure, and adversely impact results of operations, liquidity and financial condition, as well as cause reputation harm.
The Company’s business is highly dependent on the security and efficacy of our infrastructure, computer and data management systems, as well as those of third parties with whom we interact and rely upon. Cyber security risks for financial institutions have significantly increased in recent years in part because of the proliferation of new technologies, the use of the internet and telecommunications technologies to conduct financial transactions, and the increased sophistication and activities of organized crime, hackers, terrorists and other external parties, including foreign state actors. Our operations rely on the secure processing, transmission, storage and retrieval of confidential, proprietary and other information in our computer and data management systems and networks, and in the computer and data management systems and networks of third parties. We rely on digital technologies, computer, database and email systems, software, and networks to conduct our operations. In addition, to access our network, products and services, our customers and third parties may use personal mobile devices or computing devices that are outside of our network environment.
Financial services institutions have been subject to, and are likely to continue to be the target of, cyber-attacks, including computer viruses, malicious or destructive code, phishing attacks, denial of service or other security breaches that could result in the unauthorized release, gathering, monitoring, misuse, loss or destruction of confidential, proprietary and other information of the institution, its associates or customers or of third parties, or otherwise materially disrupt network access or business operations. For example, denial of service attacks have been launched against a number of large financial institutions and several large retailers have disclosed substantial cyber security breaches affecting debit and credit card accounts of their customers. We have not experienced material cyber security incidents in the past, but there is no assurance that we will not experience an attack in the future. Technology failures, cyber-attacks or other information or security breaches can cause
23
material losses or other material consequences, and even with all reasonable security efforts, not every system or network breach can be prevented or even detected. Furthermore, because some of our employees are working remotely from their homes, there is an increased risk of disruption to our operations because our employees’ residential networks and infrastructure may not be as secure as our office environment.
In addition to external threats, insider threats also represent a risk to us. Insiders, having legitimate access to our systems and the information contained in them, have the opportunity to make inappropriate use of the systems and information. We have policies, procedures and controls in place designed to prevent or limit this risk, but we cannot guarantee that such policies, procedures and controls fully mitigate this risk.
As cyber threats continue to evolve, we may be required to expend significant additional resources to continue to modify and enhance our protective measures or to investigate and remediate any information security vulnerabilities or incidents. Any of these matters could result in loss of customers and business opportunities, significant disruption to our operations and business, misappropriation or destruction of our confidential information and/or that of our customers, damage to computers or systems of our customers and/or third parties, violation of applicable privacy laws and other laws, litigation, costs associated with customer notification and credit monitoring services, increased insurance premiums, regulatory fines, penalties or intervention, loss of confidence in our security measures, reputational damage, reimbursement or other compensatory costs, and additional compliance costs. In addition, any of the matters described above could adversely impact our results of operations and financial condition.
The Company relies on third-party providers and other suppliers for a number of services that are important to our business. An interruption or cessation of an important service by any third-party could have a material adverse effect on our business.
The Company is dependent for the majority of our technology, including our core operating system, on third-party providers. If these companies were to discontinue providing services to us, we may experience significant disruptions to our business. In addition, each of these third parties faces the risk of a cyber-attack, information breach or loss, or technology failure and there is no assurance that they have not or will not experience a system or network breach. If any of our third-party service providers experience such difficulties, or if there is any other disruption in our relationships with them, we may be required to find alternative sources of such services, which may not be on comparable or commercially reasonable terms. We are dependent on these third-party providers securing their information systems, over which we have no control, and any failure to maintain performance, reliability and security of these systems could have a significant adverse effect on our financial condition or results of operations. A breach of our third-party providers’ information systems could adversely affect our ability to process transactions, service our clients or manage our exposure to risk and could result in the disclosure of sensitive, personal customer information, which could have a material adverse impact on our business through damage to our reputation, loss of customer business, remedial costs, additional regulatory scrutiny or exposure to civil litigation and possible financial liability. Assurance cannot be provided that we could negotiate terms with alternative service sources that are as favorable or could obtain services with similar functionality as found in our existing systems without the need to expend substantial resources, if at all, thereby resulting in a material adverse impact on our business and results of operations.
The Company is dependent on its management team, and the loss of any senior executive officers or other key personnel could impair its relationship with its customers and adversely affect its business and financial results.
We believe that our growth and future success will depend in large part on the skills of our executive officers. We also depend upon the experience of the senior executive officers and other key personnel and their relationship with the communities they serve. The loss of the services of one or more of these officers or key personnel could have an adverse impact on the business of the Company because of their skills, knowledge of the market, years of industry experience and the difficulty promptly finding qualified replacement personnel.
The success of our business strategies depends on our ability to identify and recruit individuals with experience and relationships in our primary markets.
The successful implementation of our business strategy will require us to continue to attract, hire, motivate and retain skilled personnel to develop new customer relationships as well as new financial products and services. The market for qualified management personnel is competitive, which has contributed to salary and employee benefit costs that have risen and are expected to continue to rise, which may have an adverse effect on the Company’s net income (loss). In addition, the process of
24
identifying and recruiting individuals with the combination of skills and attributes required to carry out our strategy is often lengthy, and we may not be able to effectively integrate these individuals into our operations. Our inability to identify, recruit and retain talented personnel to manage our operations effectively and in a timely manner could limit our growth or impair our ability to implement our business strategy effectively and efficiently, which could materially adversely affect our business.
Risks Related to Market Conditions, Interest Rates and Investments
The Company’s business is subject to interest rate risk and fluctuations in interest rates may adversely affect its earnings and capital levels.
The majority of our assets are monetary in nature and, as a result, we are subject to significant risk from changes in interest rates. Changes in interest rates can impact our net interest income as well as the valuation of our assets and liabilities. Also, our earnings are significantly dependent on net interest income, which is the difference between interest income on interest-earning assets, such as loans and securities, and interest expense on interest-bearing liabilities, such as deposits and borrowings. We expect we will experience “gaps” in the interest rate sensitivities of our assets and liabilities, meaning that either our interest-bearing liabilities will be more sensitive to changes in market interest rates than our interest-earning assets, or vice versa. In either event, if market interest rates should move contrary to our position, this “gap” will work against us and our earnings may be negatively affected.
To combat rising inflation, between March of 2022 and July of 2023, the Federal Reserve raised the federal funds benchmark rate by a total of 525 basis points. Although the Federal Reserve has held rates steady since July 2023 and signaled the potential for rate cuts in 2024, if interest rates do not rise, or if the Federal Reserve lowers the target federal funds rate to below 0%, such low rates could limit our interest rate spread and may adversely affect our business forecasts. Moreover, if the interest rates on our interest-bearing liabilities increase at a faster pace than the interest rates on our interest-earning assets, the result would be a reduction in net interest income and with it, a reduction in net earnings. Further increases in the general level of interest rates, to combat inflation or otherwise, may also, among other things, result in a change in the mix of noninterest and interest-bearing accounts, reduce the demand for loans or increase the rate of default on existing loans. Conversely, a decrease in the general level of interest rates may, among other things, lead to an increase in prepayments on loans and increased competition for deposits. Accordingly, changes in the general level of market interest rates may affect net yield on interest-earning assets, loan origination volume, loan portfolios, and funding costs which impact our overall results.
Although our asset-liability management strategy is designed to control our risk from changes in the general level of market interest rates, market interest rates will be affected by many factors outside of our control, including inflation, recession, changes in unemployment, other economic conditions, money supply and international disorder and instability in domestic and foreign financial markets. We are unable to predict changes in interest rates, which are affected by factors beyond our control, including inflation, deflation, recession, unemployment, money supply and other changes in financial markets. It is possible that significant or unexpected changes in interest rates may take place in the future, and we cannot always accurately predict the nature or magnitude of such changes or how such changes may affect our business or results of operations.
The value of our investment securities could decline.
Changes in interest rates could cause the value of our investment securities to decline. We hold available-for-sale investment securities, which are carried at fair value, the majority of which are high-quality, liquid fixed income securities. The determination of fair value for certain of these securities requires significant judgment of management. Therefore, the market price we receive for our investment securities could be less than the carrying value for such securities. Further, the value of our investment portfolio could decline for numerous reasons, many of which are outside our control, including general market conditions, volatility in the securities market, changes in market interest rates, and inflation rates or expectations of inflation. For example, increases in interest rates or changes in interest rate spreads may negatively impact the fair value of our investment securities and may adversely affect accumulated other comprehensive income and, thus, our equity levels.
Changes in interest rates could adversely affect our income and cash flows and may result in higher defaults and lower collateral values in a rising rate environment.
Changes in interest rates influence the origination of loans, the prepayment of loans, the fair value of existing assets and liabilities, the purchase of investments, the retention and generation of deposits, the rates received on loans and investment securities, and the rates paid on deposits or other sources of funding. In general, periods of rising interest rates and other
25
inflationary pressures can have a significant negative effect on our borrowers, and particularly on borrowers that operate businesses that generate revenue to pay principal and interest on commercial loans. Periods of rising interest rates and other inflationary pressures could cause the values of collateral securing our loans to decline. If either our borrowers are negatively impacted by rising interest rates or other inflationary pressures, or if the value of collateral securing our loans declines, our financial performance may be negatively impacted.
Inflation could negatively impact our business, our profitability, and our stock price.
Volatility and uncertainty related to inflation and the effects of inflation, may lead to increased costs for businesses and consumers and potentially contribute to poor business and economic conditions. For example, higher inflation, or volatility and uncertainty related to inflation, could reduce demand for the Company’s products, which could affect the creditworthiness of the Company’s borrowers, result in lower values for the Company’s investment securities and other interest-earning assets and increase expense related to talent acquisition and retention. If significant inflation continues the Company could result in missed earnings and budgetary projections causing our stock price to suffer.
Risks Related to Liquidity
Adverse developments affecting the financial services industry, such as actual events or concerns involving liquidity, defaults, or non-performance by financial institutions or transactional counterparties, may have a material adverse effect on our financial condition and results of operations.
Actual events involving limited liquidity, defaults, non-performance or other adverse developments that affect financial institutions, transactional counterparties or other companies in the financial services industry or the financial services industry generally, or concerns or rumors about any events of these kinds or other similar risks, which may be compounded by the reach and depth of media attention, including social media, have in the past and may in the future lead to market-wide liquidity problems. Liquidity is essential to the Company’s banking business, and the Company’s business strategies are largely based on access to funding from customer deposits and supplemental funding provided by secondary liquidity sources, including wholesale funding facilities.
Deposit levels may be impacted by industry factors, market interest rates, rates paid for deposits by other financial institutions and market interest rates generally, inflationary conditions, general economic conditions than can impact savings rates, and banking industry conditions that can impact customers perceptions of the safety and soundness of the banking industry generally or of specific financial institutions. The failures of Silicon Valley Bank, Signature Bank and First Republic Bank in the first quarter of 2023, and the resulting industry turmoil, have underscored the importance of maintaining diversified funding sources to ensure the safety and soundness of a financial institution. In response to these failures, the Treasury Department, the Federal Reserve Board (“FRB”) and the FDIC approved actions enabling the FDIC to complete its resolution of Silicon Valley Bank, Signature Bank and First Republic Bank in a manner that fully protected depositors by utilizing the FDIC Deposit Insurance Fund, and the Federal Reserve took actions to make available additional term funding for eligible financial institutions to help ensure continued liquidity in the banking industry. It is uncertain whether these additional steps will be sufficient to address the turmoil in the banking industry, ensure continued funding and liquidity, reduce the risk of deposit outflows, and particularly sudden outflows, from banks. Should any of these conditions materialize, our liquidity, financial condition and results of operations could be materially and adversely impacted.
The Company’s liquidity could be impaired by an inability to access short-term funding or the inability to monetize liquid assets.
If significant volatility or disruptions occur in the wholesale funding or investment securities markets, the Company’s ability to access short-term liquidity could be materially impaired. In addition, other factors outside of the Company’s control could limit the Company’s ability to access short-term funding or to monetize liquid assets, including by selling investment securities at an attractive price or at all, operational issues that impact third parties in the funding or securities markets or unforeseen significant deposit outflows. The Company’s inability to access short-term funding or inability to monetize liquid assets could impair the
26
Company’s ability to make new loans or meet existing lending commitments, and could adversely impact the Company’s overall financial condition, liquidity and regulatory capital.
We rely substantially on deposits obtained from customers in our target markets to provide liquidity and support growth, and impairment of our access to funding may negatively affect our financial performance.
Our primary funding and liquidity source to support our business strategies is a stable customer deposit base. Deposit levels may be affected by a number of factors, including interest rates paid by competitors, general interest rate levels, returns available to customers on alternative investments and general economic conditions. If our deposit levels fall, we could lose a relatively low-cost source of funding and our interest expense would likely increase as we obtain alternative funding to replace lost deposits. If local customer deposits are not sufficient to fund our normal operations and growth, we will look to outside sources, such as fed funds lines with other financial institutions or borrowings with the FHLB and we have access to the institutional CD market and the brokered deposit market. We may also seek to raise funds through the issuance of shares of our common stock, or other equity or equity-related securities, or debt securities including subordinated notes as additional sources of liquidity. A number of factors, many of which are outside the Company’s control, could make accessing such financing more difficult or more expensive, or could make such financing unavailable altogether, including the financial condition of the Company, rate disruptions in the capital markets, the attractiveness of investing in or lending to financial services companies generally, and competition for funding from other banks, holding companies or similar financial service companies, some of which could be substantially larger or have stronger credit ratings or profiles. If we are unable to access funding sufficient to support our business operations and growth strategies or are only able to access such funding on unattractive terms, we may not be able to implement our business strategies which may negatively affect our financial performance.
Our ability to meet contingency funding needs, in the event of a crisis that causes a disruption to our core deposit base, is dependent on access to wholesale markets, including funds provided by the FHLB of Atlanta.
We own stock in the FHLB of Atlanta, in order to qualify for membership in the FHLB system, which enables us to borrow on our line of credit with the FHLB that is secured by a blanket lien on select commercial loans, multifamily loans, residential mortgages and investment securities available-for-sale and is estimated to be equal to 25% of our assets approximating $1.1 billion, with available borrowing capacity subject to the amount of eligible collateral pledged at any given time. Changes or disruptions to the FHLB or the FHLB system in general may materially impact our ability to meet short and long-term liquidity needs or meet growth plans. Additionally, we cannot be assured that the FHLB will be able to provide funding to us when needed, nor can we be certain that the FHLB will provide funds specifically to us, should our financial condition and/or our regulators prevent access to our line of credit. The inability to access this source of funds could have a materially adverse effect on our ability to meet our customer’s needs. Our financial flexibility could be severely constrained if we were unable to maintain our access to funding or if adequate financing is not available at acceptable interest rates.
Other wholesale market sources of liquidity include the Fed discount window, the brokered CD market, and our four fed funds lines totaling $95.0 million with correspondent banks. Additionally, we have a large bond portfolio that can be used for liquidity purposes, including pledging or outright sales. It should also be noted that our customer base is very diversified and granular, which should minimize any unexpected deposit outflows. Average commercial deposit account balances are $42 thousand, and average consumer retail deposit account balances are $14 thousand.
We rely on dividends from our subsidiaries for most of our revenue.
The Company is a separate and distinct legal entity from the Bank. A substantial portion of the Company’s revenue comes from dividends from the Bank. Various federal and Virginia laws and regulations limit the amount of dividends that the Bank may pay to us. Also, in the event the Bank is unable to pay dividends to the Company, the Company may not be able to service any debt that is outstanding, pay obligations, or pay any future dividends on its common stock. The inability to receive dividends from the Bank could have a material adverse effect on our business, financial condition, and results of operations.
Risks Related to Our Business Strategy
Our profitability depends significantly on economic conditions.
Our success depends primarily on the general economic conditions of the geographic markets in which we operate, primarily in Virginia and North Carolina. The local economic conditions in the areas where we operate have a significant impact on our
27
commercial, real estate and construction loans, the ability of our borrowers to repay their loans and the value of the collateral securing these loans and on customer demand for loans, deposits and other bank products. A significant decline in general economic conditions, including pandemics or significant health hazards (such as the COVID-19 pandemic), inflation, recession, acts of terrorism, outbreak of hostilities (including the military conflict between Russia and Ukraine and between Israel and Palestine) or other international or domestic calamities, unemployment or other factors, all of which are beyond our control, could impact economic conditions and negatively affect our financial results.
We face strong competition from financial services companies and other companies that offer banking services which could negatively affect our business.
We conduct our banking operations primarily in Virginia and North Carolina, including Fredericksburg, Charlottesville, Lynchburg, Roanoke, Blacksburg, Martinsville, and Danville in Virginia, and Greensboro, Charlotte, Raleigh and Mooresville in North Carolina. Increased competition in these markets may result in reduced loans and deposits. Ultimately, we may not be able to compete successfully against current and future competitors. Many competitors offer the same banking services that we offer in our service area. These competitors include national banks, regional banks and other community banks. We also face competition from many other types of financial institutions, including without limitation, savings and loan institutions, finance companies, brokerage firms, insurance companies, credit unions, mortgage banks and other financial intermediaries. In particular, our competitors include several major financial companies whose greater resources may afford them a marketplace advantage by enabling them to maintain numerous banking locations and ATMs, conduct extensive promotional and advertising campaigns and offer a wider range of products, services and technologies.
Additionally, banks and other financial institutions with larger capitalization and financial intermediaries not subject to bank regulatory restrictions have larger lending limits and are thereby able to serve the credit needs of larger customers. Areas of competition include interest rates for loans and deposits, efforts to obtain deposits, and range and quality of products and services provided, including new technology-driven products and services. Technological innovation continues to contribute to greater competition in domestic and international financial services markets as technological advances enable more companies to provide financial services, products and services traditionally provided by banks, such as automatic transfer and automatic payment systems. We also face competition from out-of-state financial intermediaries that have opened loan production offices or that solicit deposits in our market areas. If we are unable to attract and retain banking customers, we may be unable to continue to grow our loan and deposit portfolios or may be required to increase the rates we pay on deposits or lower the rates we offer on loans and results of operations and financial condition may otherwise be adversely affected.
Our customers may increasingly decide not to use the Bank to complete their financial transactions, which would have a material adverse impact on our financial condition and operations.
Technology and other changes are allowing parties to complete financial transactions through alternative methods that have historically involved banks. For example, customers can now maintain funds that would have historically been held as bank deposits in brokerage accounts, mutual funds, or general-purpose reloadable prepaid cards. Customers can also complete transactions such as paying bills and/or transferring funds directly without the assistance of banks. We face increasing competition from fintech companies, as trends toward digital financial transactions have accelerated since the COVID-19 pandemic. The process of eliminating banks as intermediaries, known as “disintermediation,” could result in the loss of fee income, as well as the loss of customer deposits and the related income generated from those deposits. The loss of these revenue streams and the lower cost of deposits as a source of funds could have a material adverse effect on our financial condition and results of operations.
Risks Related to Regulatory Compliance and Legal Matters
We are subject to extensive government regulation and supervision.
Banking regulations are primarily intended to protect depositors’ funds, federal deposit insurance funds and the banking system as a whole, not security holders. These regulations affect our lending practices, capital structure, investment practices, dividend policy and growth, among other things. Congress and federal regulatory agencies continually review banking laws, regulations and policies for possible changes. Changes to statutes, regulations or regulatory policies, including changes in interpretation or implementation of statutes, regulations or policies, could affect us in substantial and unpredictable ways. Such changes could subject us to additional costs, limit the types of financial services and products we may offer and/or increase the ability of non-banks to offer competing financial services and products, among other things. For example, we currently derive a portion of our
28
noninterest income from consumer overdraft fees, which have recently come under scrutiny by banking regulators and politicians. Such regulators or politicians could act to impose additional restrictions on overdraft fee programs which could reduce our noninterest income, increase our compliance costs, or increase our exposure to regulatory and legal claims related to our overdraft program. Failure to comply with laws, regulations, policies or supervisory guidance could result in enforcement and other legal actions by Federal or state authorities, including criminal and civil penalties, the loss of FDIC insurance, the revocation of a banking charter, other sanctions by regulatory agencies, civil money penalties and/or reputational damage. In this regard, government authorities, including the bank regulatory agencies, are pursuing aggressive enforcement actions with respect to compliance and other legal matters involving financial activities, which heightens the risks associated with actual and perceived compliance failures. See “Supervision and Regulation” included in Item 1, Business, of this Annual Report on Form 10-K for a more detailed description of the certain regulatory requirements applicable to the Bank.
Regulatory capital standards may require the Company and the Bank to maintain higher levels of capital and liquidity, which could adversely affect its return on equity and otherwise affect its business.
The Company and the Bank are each subject to capital adequacy guidelines and other regulatory requirements specifying minimum amounts and types of capital, which each must maintain. From time to time, regulators implement changes to these regulatory capital adequacy guidelines. In addition, regulators may require the Company to maintain higher levels of regulatory capital based on the Company’s condition, risk profile, or growth plans or conditions in the banking industry or economy. The Basel III capital adequacy standards applicable to the Company and the Bank impose stricter capital requirements and leverage limits than the requirements to which the Company and the Bank were subject in the past.
The application of more stringent capital requirements could, among other things, result in lower returns on equity, require the raising of additional capital, and result in regulatory actions if the Company were to be unable to comply with such requirements. Furthermore, the imposition of liquidity requirements in connection with the implementation of Basel III capital adequacy standards could result in the Company having to lengthen the term of its funding, restructure its business models, and/or increase its holdings of liquid assets. Implementation of changes to asset risk weightings for risk-based capital calculations, items included or deducted in calculating regulatory capital and/or additional capital conservation buffers could result in management modifying its business strategy, and could limit the Company’s ability to make distributions, including paying out dividends or buying back shares. If the Company and the Bank fail to meet these minimum capital guidelines and/or other regulatory requirements, the Company’s financial condition would be materially and adversely affected.
Failure to maintain effective systems of internal control over financial reporting and disclosure controls and procedures could have a material adverse effect on our results of operation and financial condition.
Effective internal controls over financial reporting and disclosure controls and procedures are necessary for us to provide reliable financial reports and effectively prevent fraud and to operate successfully as a public company. We are required to establish and maintain an adequate internal control structure over financial reporting. If we cannot provide reliable financial reports or prevent fraud, our reputation and operating results would be harmed. As part of our ongoing monitoring of internal control, we may discover material weaknesses or significant deficiencies in our internal control that require remediation. A “material weakness” is a deficiency, or a combination of deficiencies, in internal control over financial reporting, such that there is a reasonable possibility that a material misstatement of a company’s annual or interim financial statements will not be prevented or detected on a timely basis.
Our inability to maintain the operating effectiveness of the controls described above could result in a material misstatement to our financial statements or other disclosures, which could have an adverse effect on our business, financial condition or results of operations. In addition, any failure to maintain effective controls or to timely effect any necessary improvement of our internal and disclosure controls could, among other things, require significant investments of management time, funds and other resources in remediation efforts, result in losses from fraud or error or harm to our reputation, or cause investors to lose confidence in our reported financial information, all of which could have a material adverse effect on our results of operation and financial condition.
Claims and litigation against the Company could result in significant expenses or losses or damage to our reputation, which may have a material adverse effect on its financial condition, results of operation or business.
The Company operates in a business, legal and regulatory environment that exposes the Company to potential significant litigation risk. The Company may be involved from time to time in a variety of litigation arising out of its business, and the
29
outcome of litigation and other legal matters is frequently uncertain. Litigation and claims against the Company can arise from the Company’s lending activities, commercial agreements, compliance programs, and other general business matters. Such litigation and claims have involved and could involve large amounts in controversy and substantial legal costs necessary for the Company’s defense or to recover amounts owed to the Company, and substantial legal liability, which may or may not be insured, against the Company could materially and adversely impact the Company’s financial condition and results of operations. Even if the Company has insurance coverage for certain claims or legal or administrative actions against it, the Company’s insurance may not cover all claims that may be asserted against it in legal or administrative actions or costs that it may incur defending such actions, and any claims asserted against it, regardless of merit or eventual outcome, may harm the Company’s reputation which may harm the Company’s business. Should the ultimate judgments or settlements and/or costs incurred in any litigation exceed any applicable insurance coverage, they could have a material adverse effect on the Company’s financial condition and results of operation for any period. Litigation may also divert management resources, which may adversely impact the Company’s business and results of operations.
The Company is currently involved in significant pending litigation. Please see the information contained in Part II, Item 8. Financial Statements and Supplementary Data – Note 18, “Commitments and Contingencies,” under the heading “Legal Proceedings”.
Our risk management framework may not be effective in mitigating risk and loss.
We maintain an enterprise risk management program that is designed to identify, quantify, monitor, report and control the risks we face. These risks include, but are not limited to, interest rate, credit, liquidity, operational, reputation, legal, compliance, economic and litigation risk. Although we assess our risk management program on an ongoing basis and make identified improvements to it, we can offer no assurances that this approach and risk management framework (including related controls) will effectively mitigate the risks listed above or limit losses that we may incur. If our risk management program has flaws or gaps, or if our risk management controls do not function effectively, our results of operations, financial condition or business may be adversely affected.
Our earnings are significantly affected by the fiscal and monetary policies of the federal government and its agencies.
The policies of the FRB affect us significantly. The FRB regulates the supply of money and credit in the United States. Its policies directly and indirectly influence the rate of interest earned on loans and paid on borrowings and interest-bearing deposits and can also affect the value of financial instruments we hold. Those policies determine, to a significant extent, our cost of funds for lending and investing, and can significantly impact the levels of inflation in the United States. Changes in those policies are beyond our control and are difficult to predict. FRB policies can also affect our borrowers, potentially increasing the risk that they may fail to repay their loans. For example, a tightening of the money supply by the FRB could reduce the demand for a borrower's products and services. This could adversely affect the borrower’s earnings and ability to repay a loan, which could have a material adverse effect on our financial condition and results of operations.
Increased scrutiny and evolving expectations from customers, regulators, investors, and other stakeholders with respect to environmental, social and governance (“ESG”) practices may impose additional costs on the Company or expose it to new or additional risks.
As a regulated financial institution and a publicly traded company, we are facing increasing scrutiny from customers, regulators, investors, and other stakeholders related to ESG practices and disclosure. Investor advocacy groups, investment funds, and influential investors are increasingly focused on these practices, especially as they relate to climate risk, hiring practices, the diversity of the work force, and racial and social justice issues. Failure to adapt to or comply with regulatory requirements or investor or stakeholder expectations and standards could negatively impact the Company’s reputation, ability to do business with certain partners, and stock price. New government regulations could also result in new or more stringent forms of ESG oversight and expanding mandatory and voluntary reporting, diligence, and disclosure. ESG-related costs, including with respect to compliance with any additional regulatory or disclosure requirements or expectations, could adversely impact our results of operations.
30
Risks Related to Owning Our Stock
The market price of our common stock may fluctuate significantly in response to a number of factors.
Our operating results may fluctuate due to a variety of factors, many of which are outside of our control, including the changing U.S. economic environment and changes in the commercial and residential real estate market, any of which may cause our stock price to fluctuate. If our operating results fall below the expectation of investors or securities analysts, the price of our common stock could decline substantially.
Our stock price can fluctuate significantly in response to a variety of factors including, among other things:
•volatility of stock market prices and volumes in general;
•changes in market valuations of similar companies;
•changes in the conditions of credit markets;
•changes in accounting policies or procedures as required by the Financial Accounting Standards Board, or other regulatory agencies;
•legislative and regulatory actions, including the impact of the Dodd-Frank Act and related regulations, that may subject us to additional regulatory oversight which may result in increased compliance costs and/or require us to change our business model;
•government intervention in the U.S. financial system and the effects of and changes in trade and monetary and fiscal policies and laws, including the interest rate policies of the FRB;
•additions or departures of key members of management;
•fluctuations in our quarterly or annual operating results; and
•changes in analysts’ estimates of financial performance.
Future issuances of the Company’s common stock could adversely affect the market price of the common stock and could be dilutive.
The Company is not restricted from issuing additional shares of common stock, and may issue securities that are convertible into or exchangeable for, or that represent the right to receive, shares of common stock. Issuances of a substantial number of shares of common stock, or the expectation that such issuances might occur, including in connection with acquisitions by the Company, could materially adversely affect the market price of the shares of common stock and could be dilutive to shareholders. Because the Company’s decision to issue equity securities in the future will depend on market conditions and other factors, it cannot predict or estimate the amount, timing, or nature of possible future stock issuances. Accordingly, the Company’s shareholders bear the risk that future stock issuances will reduce market prices and dilute their stock holdings in the Company.
Common stock is equity and is subordinate to the Company’s existing and future indebtedness and effectively subordinated to all the indebtedness and other non-equity claims against the Bank.
Shares of the Company’s common stock are equity interests and do not constitute indebtedness. As such, shares of the common stock will rank junior to all of the Company’s indebtedness and to other non-equity claims against the Company and its assets available to satisfy claims against it, including in the event of the Company’s liquidation. The Company is permitted to incur additional debt. Upon liquidation, lenders and holders of the Company’s debt securities would receive distributions of the Company’s available assets prior to holders of the Company’s common stock. Furthermore, the Company’s right to participate in a distribution of assets upon the Bank’s liquidation or reorganization is subject to the prior claims of the Bank’s creditors, including holders of any depositors of the Bank or any debt issued by the Bank.
31
CARTER BANKSHARES, INC. AND SUBSIDIARIES
ITEM 1B. UNRESOLVED STAFF COMMENTS
Not applicable.
ITEM 1C. CYBERSECURITY
Cybersecurity Risk Management and Strategy
The Company has developed and implemented a Cybersecurity and Information Technology Incident Response Plan intended to ensure the confidentiality, integrity, and availability of the Company’s critical systems and information.
The Company has designed this Cybersecurity and Information Technology Incident Response Plan based in part on the National Institute of Standards and Technology Cybersecurity Framework (“NIST”). Use of the framework does not imply that the Company meets any particular technical standards, specifications, or requirements, but rather the NIST is used as a guide to help identify, assess, and manage cybersecurity risks relevant to the Company’s business. The Company’s Cybersecurity and Information Technology Response Plan is led by our Chief Operations Officer, (“COO”) who is responsible for the oversight and implementation of such plan. Additionally, the COO and the Information Security Manager meet with the Information Technology Steering Committee (“IT Steering Committee”) on a monthly basis or more frequently as necessary to discuss, among other things, cybersecurity matters.
The Cybersecurity and Information Technology Incident Response Plan is aligned to the Company’s business strategy. It shares common methodologies, reporting channels and governance processes that apply to other areas of enterprise risk management, including legal, compliance, strategic, operational, and financial risk. In the event of a material or potentially material cybersecurity event, senior members of management, which includes the Chief Financial Officer, are promptly informed of the event and status update, response, and disclosure efforts following the terms of a documented incident response plan. Key elements of the Cybersecurity and Information Technology Incident Response Plan include:
•risk assessments designed to help identify material cybersecurity risks to our critical systems, information, products, services, and our broader information technology (“IT”) environment;
•an incident response team principally responsible for managing cybersecurity risk assessment processes, security controls, and responses to cybersecurity incidents;
•the use of external service providers, where appropriate, to assess, test or otherwise assist with aspects of our security controls;
•training and awareness programs for team members that include periodic and ongoing assessments to drive adoption and awareness of cybersecurity processes and controls;
•a cybersecurity and IT incident response plan that includes procedures for responding to cybersecurity incidents;
•utilization of independent third parties to perform penetration testing of the Company’s environment; and
•utilization of a third party to monitor our environment continuously.
The Company has experienced cybersecurity incidents in the past, but none of these incidents, individually or in the aggregate, have had a material adverse effect on our business, financial condition or results of operations. For a discussion of whether and how any risks from cybersecurity threats, including as a result of any previous cybersecurity incidents, have materially affected or are reasonably likely to materially affect the Company, including our business strategy, results of operations or financial condition, refer to Item 1A. Risk Factors – "Risks Related to Our Operations and Technology," which is incorporated by reference into this Item 1C.
Cybersecurity Governance
Management’s Role
The Company’s management has created an Incident Response Team (“IRT”), that consists of the Chief Operations Officer, a network manager, an application delivery manager, an information security manager, the IT Steering Committee, the regulatory
32
CARTER BANKSHARES, INC. AND SUBSIDIARIES
risk management director and an internal auditor. Our COO holds multiple cybersecurity industry-recognized certifications and has gained extensive cybersecurity knowledge and skills through over 7 years of work experience on the IT security team at the Company. Our Information Security Manager, who also holds multiple cybersecurity industry-recognized certifications and is a member of the IT Steering Committee, has 20 years of experience working in IT and cybersecurity in various roles and industries throughout his career. Additionally, leaders in the Company’s IT function receive periodic training and education on cybersecurity related topics. The IRT is governed by policies and procedures and their proactive responsibilities include implementing awareness programs for the overall cybersecurity risk management plan and for the supervision of vulnerability and penetration testing.
The Company’s IRT serves as the central point for all cybersecurity incidents and reporting, including incidents that directly target associates, customers or the Company’s internal information systems and incidents originating from third parties. The IRT evaluates each incident in terms of its impact on the Company’s operations, ability to conduct business with customers, reputational risk to the Company, reduce legal risk and the speed and degree to which the incident has been contained. The IRT is also responsible for assessing the nature and scope of the incident, and engaging third-party service providers where appropriate to support the Company through the resolution of the incident. The COO escalates incidents to the Company’s IT Steering Committee, who is responsible for cybersecurity risk oversight, and also reports to the Board on a monthly basis.
Our information security team and members of IT also monitor the prevention, detection, mitigation, and remediation of cybersecurity risks and incidents through various means, which may include briefings with law enforcement, regulators, and external consultants we may engage, and reports produced by security tools we have deployed in our IT environment.
Board of Director’s Role
The Company’s Board of Directors recognizes the importance of cybersecurity in safeguarding the Company’s sensitive data, including with respect to its associates and customers. The Board is responsible for the consideration and oversight of risk facing the Company and is also responsible for ensuring that material risks are identified and managed appropriately, including cybersecurity risks. The COO gives a monthly report to the Company’s IT Steering Committee and Board on various information security issues. The Company has created and designated a separate committee of its Board as the Audit Committee consisting of four independent directors. The Audit Committee meets quarterly and reviews the Company’s major financial risk exposures, including cybersecurity risks, and reviews the steps management is taking to monitor and control such exposures, including results of internal and external audits.
ITEM 2. PROPERTIES
The Company’s principal executive office is located at 1300 Kings Mountain Road in Martinsville, Virginia. There are also two other corporate administrative locations that house its operations center and various other corporate functions. As of December 31, 2023, we offer our community banking services through 65 combined depository locations in Virginia and North Carolina, and have 53 offices located in Virginia and 12 offices located in North Carolina. Three of these depository banking locations are held under lease contracts. In addition, the Bank leases a loan production office, a commercial banking office and another office housing various Bank functions. Management believes the terms of the various leases are consistent with market standards and were arrived at through arm’s length bargaining. The leases are described in Note 9, Premises and Equipment, of the Notes to Consolidated Financial Statements in Item 8 of this Annual Report on Form 10-K.
ITEM 3. LEGAL PROCEEDINGS
The information contained in Part II, Item 8. Financial Statements and Supplementary Data – Note 18, “Commitments and Contingencies,” under the heading “Legal Proceedings,” is incorporated by reference into this Item 3.
ITEM 4. MINE SAFETY DISCLOSURES
Not applicable.
33
CARTER BANKSHARES, INC. AND SUBSIDIARIES
ITEM 5. MARKET FOR REGISTRANT’S COMMON EQUITY, RELATED STOCKHOLDER MATTERS AND ISSUER PURCHASES OF EQUITY SECURITIES
PART II
Market for Common Stock and Dividends
The Company’s common stock trades on NASDAQ, under the ticker symbol “CARE.” As of the close of business on March 4, 2024, we had 2,160 shareholders of record.
Dividends
In October 2016, prior to the Reorganization, the board of directors of the Bank (the "Bank Board") determined that it was prudent not to declare a quarterly cash dividend on the Bank's common stock beginning in the fourth quarter of 2016. Notwithstanding the Bank’s prior practice of paying a quarterly cash dividend on its common stock, the Bank Board believed this decision was necessary and appropriate as the Bank committed, and now the Company commits, additional resources to assist with regulatory compliance, and making significant investments in new technology and human resources.
The Bank Board paid a special one-time cash dividend of $0.14 per share on March 3, 2020. The amount and timing of future dividends, if any, remains subject to the discretion of the Board and will depend upon a number of factors, including future earnings, financial condition, liquidity and capital requirements of the Company, applicable governmental regulations and other factors deemed relevant by the Board.
Repurchases of Shares of Common Stock
On March 29, 2023, the Company announced that its Board of Directors (the “Board”) authorized, effective May 1, 2023, a common share repurchase program to purchase up to 1,000,000 shares of the Company’s common stock in the aggregate over a period of twelve months, (the “2023 Program”) subject to receipt of non-objection from the Federal Reserve Bank of Richmond, which was received on April 24, 2023. The 2023 Program authorizes the purchase of the Company’s common stock in open market transactions or privately negotiated transactions, including pursuant to a trading plan in accordance with Rule 10b-18 promulgated under the Securities Exchange Act of 1934, as amended. The authorization permits management to repurchase shares of the Company’s common stock from time to time at management’s discretion. The actual means and timing of any shares purchased under the 2023 Program will depend on a variety of factors, including the market price of the Company’s common stock, general market and economic conditions, management’s evaluation of the Company’s financial condition and liquidity position and applicable legal and regulatory requirements. The 2023 Program is authorized through May 1, 2024, although it may be modified or terminated by the Board at any time. The 2023 Program does not obligate the Company to purchase any particular number of shares, and was exhausted as of August 31, 2023. During the year ended December 31, 2023, 1,000,000 shares of common stock had been repurchased under this program at a total cost of $14.2 million, or an average price of $14.16 per share.
Previously on June 28, 2022, the Company announced that its Board authorized, effective August 1, 2022, a common share repurchase program to purchase up to 750,000 shares of the Company’s common stock in the aggregate over a period of twelve months, subject to non-objection from the Federal Reserve Bank of Richmond, which was received in July 2022 (the “2022 Program”). The 2022 Program authorized the purchase of the Company’s common stock in open market transactions or privately negotiated transactions, including pursuant to a trading plan in accordance with Rule 10b-18 promulgated under the Exchange Act. The authorization permitted management to repurchase shares of the Company’s common stock from time to time at management’s discretion. The 2022 Program was originally authorized through August 1, 2023, did not obligate the Company to purchase any particular number of shares, and was exhausted as of March 10, 2023.
Previously on December 13, 2021, the Company announced that its Board authorized, effective December 10, 2021, a common share repurchase program to purchase up to 2,000,000 shares of the Company’s common stock in the aggregate over a period of twelve months (the “2021 Program”). The 2021 Program was originally authorized through December 9, 2022, did not obligate the Company to purchase any particular number of shares, and was exhausted as of April 28, 2022.
34
CARTER BANKSHARES, INC. AND SUBSIDIARIES
ITEM 5. MARKET FOR REGISTRANT’S COMMON EQUITY, RELATED STOCKHOLDER MATTERS AND ISSUER PURCHASES OF EQUITY SECURITIES - (continued)
The following table provides information regarding the Company’s purchases of our common stock during the quarter ended December 31, 2023.
| Period | Total number of shares purchased | Average Price Paid Per Share | Total Number of Shares Purchased as Part of Publicly Announced Plan | Approximate Dollar Value of Shares That May Yet be Purchased Under the Plan(1) | ||||||||||||||||||||||
| 10/10/2023 - 10/31/2023 | — | $— | — | — | ||||||||||||||||||||||
| 11/01/2023 - 11/30/2023 | — | — | — | — | ||||||||||||||||||||||
| 12/01/2023 - 12/31/2023 | — | — | — | — | ||||||||||||||||||||||
| Total | — | $— | — | |||||||||||||||||||||||
Five-Year Cumulative Total Return
The following chart compares the cumulative total shareholder return on our common stock with the cumulative total return of the NASDAQ Composite Index and S&P U.S. BMI Banks Index, which includes the stocks of banks, thrifts and bank and financial holding companies listed on all major exchanges (NYSE, AMEX, NASDAQ) in the S&P Global Market Intelligence’s coverage universe.
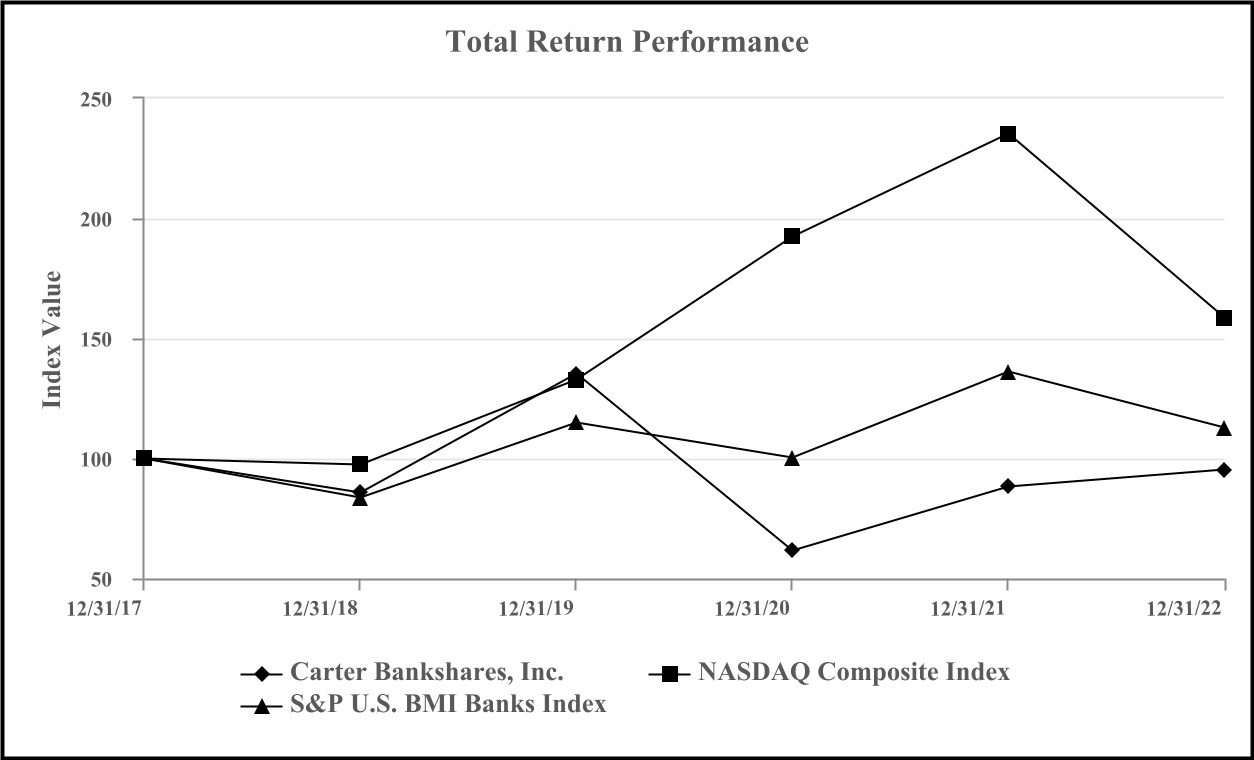
| Period Ending | ||||||||||||||||||||||||||||||||||||||
| Index | 12/31/18 | 12/31/19 | 12/31/20 | 12/31/21 | 12/31/22 | 12/31/23 | ||||||||||||||||||||||||||||||||
Carter Bankshares, Inc.(1) | 100.00 | 158.13 | 71.98 | 103.33 | 111.39 | 100.51 | ||||||||||||||||||||||||||||||||
| NASDAQ Composite Index | 100.00 | 136.69 | 198.10 | 242.03 | 163.28 | 236.17 | ||||||||||||||||||||||||||||||||
| S&P U.S. BMI Banks Index | 100.00 | 137.36 | 119.83 | 162.92 | 135.13 | 147.41 | ||||||||||||||||||||||||||||||||
(1)An investment in Carter Bankshares, Inc. prior to November 2020 represents an investment in Carter Bank & Trust.
35
CARTER BANKSHARES, INC. AND SUBSIDIARIES
ITEM 6. [RESERVED]
ITEM 7. MANAGEMENT’S DISCUSSION AND ANALYSIS OF FINANCIAL CONDITION AND RESULTS OF OPERATIONS
OVERVIEW
The following Management’s Discussion and Analysis of Financial Condition and Results of Operations (“MD&A”) is intended to help the reader understand Carter Bankshares, Inc., our operations, and our present business environment. The MD&A is provided as a supplement to, and should be read in conjunction with, our Consolidated Financial Statements and the accompanying notes thereto contained in Item 8 of this Annual Report on Form 10-K. The MD&A includes the following sections:
•Explanation of Use of Non-GAAP Financial Measures
•Critical Accounting Estimates
•Our Business & Strategy
•Results of Operations and Financial Condition
•Capital Resources
•Contractual Obligations
•Off-Balance Sheet Arrangements
•Liquidity
•Inflation
•Stock Repurchase Program
This section reviews our financial condition for each of the past two years and results of operations for each of the past three years. Certain reclassifications have been made to prior periods to place them on a basis comparable with the current period presentation. Some tables may include additional time periods to illustrate trends within our Consolidated Financial Statements and notes thereto. The results of operations reported in the accompanying Consolidated Financial Statements are not necessarily indicative of results to be expected in future periods.
Explanation of Use of Non-GAAP Financial Measures
In addition to the results of operations presented in accordance with generally accepted accounting principles in the United States (“GAAP”), management uses, and this annual report references, interest and dividend income, yield on interest earnings assets, net interest income and net interest margin on a fully taxable equivalent, (“FTE”) basis, which are non-GAAP financial measures. Management believes these measures provide information useful to investors in understanding our underlying business, operational performance and performance trends as it facilitates comparisons with the performance of other companies in the financial services industry. The Company believes the presentation of interest and dividend income, yield on interest earnings assets, net interest income and net interest margin on an FTE basis ensures the comparability of interest and dividend income, yield on interest earning assets, net interest income and net interest margin arising from both taxable and tax-exempt sources and is consistent with industry practice. Interest and dividend income (GAAP) per the Consolidated Statements of Income is reconciled to interest and dividend income adjusted on an FTE basis, yield on interest earning assets (GAAP) is reconciled to yield on interest earning assets adjusted on an FTE basis, net interest income (GAAP) is reconciled to net interest income adjusted on an FTE basis and net interest margin (GAAP) is reconciled to net interest margin adjusted on an FTE basis in the "Results of Operations and Financial Condition - Net Interest Income" section of this MD&A for the years ended 2023, 2022 and 2021.
Although management believes that this non-GAAP financial measure enhances investors’ understanding of our business and performance, this non-GAAP financial measure should not be considered an alternative to GAAP or considered to be more relevant than financial results determined in accordance with GAAP, nor is it necessarily comparable with similar non-GAAP measures which may be presented by other companies.
36
CARTER BANKSHARES, INC. AND SUBSIDIARIES
ITEM 7. MANAGEMENT’S DISCUSSION AND ANALYSIS OF FINANCIAL CONDITION AND RESULTS OF OPERATIONS - (continued)
Critical Accounting Estimates
The Company’s preparation of financial statements in accordance with GAAP requires management to make estimates, assumptions and judgments that affect the amounts reported in the financial statements and accompanying notes. Over time, these estimates, assumptions and judgments may prove to be inaccurate or vary from actual results and may significantly affect our reported results and financial position for the periods presented or in future periods. We currently view the determination of the allowance for credit losses to be critical, because it is made in accordance with GAAP, is highly dependent on subjective or complex judgments, assumptions and estimates made by management and have had or is reasonably likely to have a material impact on the Company’s financial condition and results of operations.
We have identified the following critical accounting estimate:
Allowance for Credit Losses (“ACL”)
The ACL represents an amount which, in management's judgment, is adequate to absorb expected credit losses over the life of outstanding loans as of the balance sheet date based on the evaluation of current risk characteristics of the loan portfolio, past events, current conditions, reasonable and supportable forecasts of future economic conditions and prepayment experience. The ACL is measured and recorded upon the initial recognition of a financial asset. The ACL is reduced by charge-offs, net of recoveries of previous losses, and is increased by a provision or decreased by a recovery for credit losses, which is recorded as a current period operating expense.
Determination of an appropriate ACL is inherently complex and requires the use of significant and highly subjective estimates. The reasonableness of the ACL is reviewed quarterly by management.
Management believes it uses relevant information available to make determinations about the ACL and that it has established the existing allowance in accordance with GAAP. However, the determination of the ACL requires significant judgment, and estimates of expected credit losses in the loan portfolio can vary from the amounts actually observed. While management uses available information to recognize expected credit losses, future additions to the ACL may be necessary based on changes in the loans comprising the portfolio, changes in the current and forecasted economic conditions, changes to the interest rate environment which may directly impact prepayment and curtailment rate assumptions, and changes in the financial condition of borrowers.
Management will periodically assess what adjustments are necessary to qualitatively adjust the ACL based on their assessment of current expected credit losses and other economic factors. Various regulatory agencies also review the allowance for credit losses as an integral part of their examination process. The Company periodically engages a third party to validate the model. We believe the level of the allowance for credit losses is appropriate as recorded in the consolidated financial statements as of December 31, 2023. As future events cannot be determined with precision, actual results could differ significantly from our estimates.
The ACL “base case” model is derived from various economic forecasts provided by widely recognized sources. Management evaluates the variability of market conditions by examining the peak and trough of economic cycles. These peaks and troughs are used to stress the base case model to develop a range of potential outcomes. Management then determines the appropriate reserve through an evaluation of these various outcomes relative to current economic conditions and known risks in the portfolio. For the year ended December 31, 2023 the range of outcomes would produce a 16.98% reduction or a 18.80% increase in reserves based on the best and worst case scenarios, respectively.
Refer to Note 1, Summary of Significant Accounting Policies, for further detailed descriptions of our estimation process and methodology related to the ACL and Note 6, Allowance for Credit Losses, of this Annual Report on Form 10-K.
Our Business and Strategy
Carter Bankshares, Inc. (the “Company”) is a bank holding company headquartered in Martinsville, Virginia with assets of $4.5 billion at December 31, 2023. The Company is the parent company of its wholly owned subsidiary, Carter Bank & Trust (the “Bank”). The Bank is a Federal Deposit Insurance Corporation, (“FDIC”) insured, Virginia state-chartered bank, which operates 65 branches in Virginia and North Carolina. The Company provides a full range of financial services with retail, and
37
CARTER BANKSHARES, INC. AND SUBSIDIARIES
ITEM 7. MANAGEMENT’S DISCUSSION AND ANALYSIS OF FINANCIAL CONDITION AND RESULTS OF OPERATIONS - (continued)
commercial banking products and insurance. Our common stock trades on the Nasdaq Global Select Market under the ticker symbol “CARE”.
The Company earns revenue primarily from interest on loans and securities and fees charged for financial services provided to our customers. The Company incurs expenses for the cost of deposits, provision for credit losses and other operating costs such as salaries and employee benefits, data processing, occupancy and income tax provision.
Beginning in 2023, and continuing into 2024 and 2025, the Company is focusing on refining and enhancing its brand image and position in the markets it serves. To strengthen and further shape the culture of the Company, a new set of guiding principles were introduced to associates in June 2023. The guiding principles include a new purpose statement: To create opportunities for more people and businesses to prosper; supported by our new set of core values: Build Relationships, Earn Trust and Take Ownership. We believe these new guiding principles will help create alignment to support future growth by empowering our associates and igniting a passion for the Company.
The Company’s goal is to shift from restructuring the balance sheet to pursuing a prudent growth strategy when appropriate. We believe this strategy will be primarily targeted at organic growth, but will also consider opportunistic acquisitions that fit this strategic vision. We believe that the Bank’s strong capital and liquidity positions support this strategy. In addition to loan and deposit growth, the Company will seek to increase fee income while closely monitoring operating expenses.
The Company is focused on executing this strategy to successfully build our new brand and grow our business in our current markets as well as any new markets we may enter. As part of executing this strategy, the Company continues to dedicate significant resources to resolving the Company’s nonaccrual loans, the significant majority of which are related to a single large lending relationship that the Company placed on nonaccrual status in the second quarter of 2023 due to loan maturities and failure to pay in full, in a manner that best protects the Company, the Bank and shareholders. The Company is also dedicating significant resources to resolving pending litigation related to this single large lending relationship in a manner that best protects the Company, the Bank and shareholders.
Results of Operations and Financial Condition
Earnings Summary
2023 Highlights
•Net interest income decreased $17.6 million, or 12.6%, to $122.3 million for the year ended December 31, 2023 compared to the same period in 2022 primarily due to an increase of 156 basis points in funding costs and the $30.0 million year-to-date negative impact of placing the Bank’s largest lending relationship in nonaccrual status during the second quarter of 2023, partially offset by an increase of 59 basis points in the yield on earning assets due to the higher interest rate environment;
•The provision for credit losses increased $3.1 million to $5.5 million for the year ended December 31, 2023, compared to the same period in 2022;
•Total noninterest income decreased $3.4 million to $18.3 million for the year ended December 31, 2023 compared to the same period in 2022;
•Total noninterest expense increased $8.5 million to $105.5 million for the year ended December 31, 2023 compared to the same period in 2022; and
•Provision for income taxes decreased $6.3 million to $5.3 million for the year ended December 31, 2023 compared to the same period in 2022.
38
CARTER BANKSHARES, INC. AND SUBSIDIARIES
ITEM 7. MANAGEMENT’S DISCUSSION AND ANALYSIS OF FINANCIAL CONDITION AND RESULTS OF OPERATIONS - (continued)
Balance Sheet Highlights (period-end balances, December 31, 2023 compared to December 31, 2022)
•The securities portfolio decreased $57.3 million and is currently 17.3% of total assets compared to 19.9% of total assets;
•Total portfolio loans increased $357.0 million, or 11.3%, primarily due to loan growth in the commercial real estate (“CRE”), residential mortgage and construction segments during the year ended December 31, 2023;
•The portfolio loans to deposit ratio was 94.2%, compared to 86.7%, due to loan growth;
•Nonperforming loans as a percentage of total portfolio loans were 8.83% compared to 0.21% at December 31, 2022. The significant increase is due to loans contained in the Other segment with an aggregate principal balance of $301.9 million that were placed into nonaccrual status due to loan maturities and failure to pay in full during the second quarter of 2023. These loans comprise 97.5% of nonperforming loans at December 31, 2023;
•Total deposits increased $89.4 million or 2.5% to $3.7 billion at December 31, 2023 due to increases of $29.4 million in money market accounts and $325.1 million in CDs, offset by a total decrease of $265.1 million in noninterest-bearing demand, interest-bearing demand and savings accounts; and
•The ACL to total portfolio loans ratio was 2.77% compared to 2.98%. The ACL on portfolio loans totaled $97.1 million at December 31, 2023, compared to $93.9 million at December 31, 2022.
The Company reported net income of $23.4 million, or $1.00 diluted earnings per share for the year ended December 31, 2023 compared to net income of $50.1 million, or $2.03 diluted earnings per share, for the year ended December 31, 2022.
| Years Ended December 31, | ||||||||||||||||||||
| PERFORMANCE RATIOS | 2023 | 2022 | 2021 | |||||||||||||||||
| Return on Average Assets | 0.53 | % | 1.21 | % | 0.76 | % | ||||||||||||||
| Return on Average Shareholders' Equity | 6.79 | % | 14.30 | % | 7.92 | % | ||||||||||||||
| Portfolio Loans to Deposit Ratio | 94.20 | % | 86.69 | % | 76.03 | % | ||||||||||||||
| Allowance for Credit Losses to Total Portfolio Loans | 2.77 | % | 2.98 | % | 3.41 | % | ||||||||||||||
| Nonperforming Loans to Total Portfolio Loans | 8.83 | % | 0.21 | % | 0.26 | % | ||||||||||||||
Net Interest Income
Our principal source of revenue is net interest income. Net interest income represents the difference between the interest and fees earned on interest-earning assets and the interest paid on interest-bearing liabilities. Net interest income is affected by changes in the average balance of interest-earning assets, interest-bearing liabilities, as well as changes in interest rates and spreads. The level and mix of interest-earning assets and interest-bearing liabilities is managed by our Asset and Liability Committee (“ALCO”), in order to mitigate interest rate and liquidity risks of the balance sheet. A variety of ALCO strategies were implemented, within prescribed ALCO risk parameters, to produce what the Company believes is an acceptable level of net interest income.
Net interest income and the net interest margin are presented on an FTE basis. The FTE basis (non-GAAP) adjusts net interest income and net interest margin for the tax benefit of income on certain tax-exempt loans and securities using the applicable federal statutory tax rate for each period (which was 21% for the periods presented) and the dividend-received deduction for equity securities. The Company believes this FTE basis presentation provides a relevant comparison between taxable and non-taxable sources of interest income. Refer to the “Explanation of Use of Non-GAAP Financial Measures” above for additional discussion regarding the non-GAAP measures used in this Annual Report on Form 10-K.
The following table reconciles interest and dividend income (GAAP), yield on interest-earning assets (GAAP), net interest margin (GAAP) and net interest income per the Consolidated Statements of Income to interest and dividend income on an FTE
39
CARTER BANKSHARES, INC. AND SUBSIDIARIES
ITEM 7. MANAGEMENT’S DISCUSSION AND ANALYSIS OF FINANCIAL CONDITION AND RESULTS OF OPERATIONS - (continued)
basis (non-GAAP), yield on interest-earning assets on an FTE basis (non-GAAP), net interest margin on an FTE basis (non-GAAP) and net interest income on an FTE basis (non-GAAP), respectively, for the periods presented:
| (Dollars in Thousands) | Years Ended December 31, | |||||||||||||||||||
| 2023 | 2022 | 2021 | ||||||||||||||||||
| Interest and Dividend Income (GAAP) | $ | 196,420 | $ | 160,182 | $ | 133,897 | ||||||||||||||
| Tax Equivalent Adjustment | 1,004 | 1,143 | 1,492 | |||||||||||||||||
| Interest and Dividend Income (FTE) (Non-GAAP) | 197,424 | 161,325 | 135,389 | |||||||||||||||||
| Average Earning Assets | 4,293,838 | 4,023,634 | 3,971,640 | |||||||||||||||||
| Yield on Interest-earning Assets (GAAP) | 4.57 | % | 3.98 | % | 3.37 | % | ||||||||||||||
| Yield on Interest-earning Assets (FTE) (Non-GAAP) | 4.60 | % | 4.01 | % | 3.41 | % | ||||||||||||||
| Net Interest Income (GAAP) | 122,310 | 139,928 | 111,183 | |||||||||||||||||
| Tax Equivalent Adjustment | 1,004 | 1,143 | 1,492 | |||||||||||||||||
| Net Interest Income (FTE) (Non-GAAP) | $ | 123,314 | $ | 141,071 | $ | 112,675 | ||||||||||||||
| Average Earning Assets | 4,293,838 | 4,023,634 | 3,971,640 | |||||||||||||||||
| Net Interest Margin (GAAP) | 2.85 | % | 3.48 | % | 2.80 | % | ||||||||||||||
| Net Interest Margin (FTE) (Non-GAAP) | 2.87 | % | 3.51 | % | 2.84 | % | ||||||||||||||
Average Balance Sheet and Net Interest Income Analysis (FTE)
Total net interest income decreased $17.6 million, or 12.6% to $122.3 million for the year ended December 31, 2023 compared to the same period in 2022. The decrease for the year ended December 31, 2023 compared to the same period in 2022 was a result of the higher funding costs in 2023 as a result of the higher interest rate environment and the $30.0 million negative impact on interest income during the year ended December 31, 2023 related to the Company placing its largest lending relationship with an aggregate principal balance of $301.9 million on nonaccrual status in the second quarter of 2023. These decreases were partially offset by higher yields on new loan originations and investment securities.
Net interest income, on an FTE basis (non-GAAP), decreased $17.8 million, or 12.6%, to $123.3 million for the year ended December 31, 2023 compared to $141.1 million for the same period in 2022. The decreases in net interest income, on an FTE basis (non-GAAP), was driven by higher interest expense of $53.9 million for the year ended December 31, 2023 when compared to the same period in 2022, offset by an increase in interest income of $36.1 million. Net interest margin decreased 63 basis points to 2.85% for the year ended December 31, 2023 compared to 3.48% for the same period in 2022. Net interest margin, on an FTE basis (non-GAAP), decreased 64 basis points to 2.87% for the year ended December 31, 2023 compared to 3.51% for the same period in 2022.
The Company’s net interest income and net interest margin will continue to be negatively impacted in future periods by the Company’s largest lending relationship being placed on nonaccrual status until it is ultimately resolved.
During 2023, there has been more pressure on our cost of funds due to the shift from non-maturing deposits to higher yielding money market and certificates of deposits and higher-cost borrowings, which has negatively impacted our net interest margin. We believe this trend is beginning to stabilize and will continue to stabilize in the coming quarters. Our balance sheet is currently exhibiting characteristics of a slightly liability sensitive balance sheet due to the short-term nature of our deposit portfolio. Specifically, 75.9% of our time deposit portfolio will mature and reprice over the next twelve months which gives us flexibility to manage the structure and pricing of our deposit portfolio to reduce funding costs, should the Federal Open Market Committee (“FOMC”) begin cutting short-term rates during 2024.
During the year ended December 31, 2023, the Company’s yield on earning assets continued to benefit from the higher interest rate environment. However, the impacts of higher yields on earning assets may not be sufficient to offset the negative impacts of increased funding costs in the higher rate environment and the negative impacts on interest income related to the Company’s largest lending relationship being placed in nonaccrual status.
Positively impacting the year ended December 31, 2023 was the asset sensitivity of our balance sheet for the majority of the year. Yields on a large portion of our loan and securities portfolios adjusted upward as rates rise at a quicker rate than the rates on our deposits and other funding sources adjusted upward during the recent rising interest rate cycle. Yields on our loan
40
CARTER BANKSHARES, INC. AND SUBSIDIARIES
ITEM 7. MANAGEMENT’S DISCUSSION AND ANALYSIS OF FINANCIAL CONDITION AND RESULTS OF OPERATIONS - (continued)
portfolio consist of 24.8% floating rates and 41.9% variable rates, while 47.2% of the securities portfolio is floating rate and adjust as interest rates increase. This positively impacts revenue and helps mitigate increased funding costs.
The following table provides information regarding the average balances, interest and rates earned on interest-earning assets and the average balances, interest and rates paid on interest-bearing liabilities for the years ended December 31:
| (Dollars in Thousands) | 2023 | 2022 | 2021 | |||||||||||||||||||||||||||||||||||||||||||||||||||||
| Average Balance | Income/ Expense | Yield/Rate | Average Balance | Income/ Expense | Yield/Rate | Average Balance(3) | Income/ Expense | Yield/Rate | ||||||||||||||||||||||||||||||||||||||||||||||||
| ASSETS | ||||||||||||||||||||||||||||||||||||||||||||||||||||||||
| Interest-Bearing Deposits with Banks | $ | 20,414 | $ | 1,066 | 5.22 | % | $ | 50,797 | $ | 341 | 0.67 | % | $ | 194,492 | $ | 271 | 0.14 | % | ||||||||||||||||||||||||||||||||||||||
Tax-Free Investment Securities (2) | 27,271 | 803 | 2.94 | % | 30,109 | 877 | 2.91 | % | 34,171 | 1,116 | 3.27 | % | ||||||||||||||||||||||||||||||||||||||||||||
| Taxable Investment Securities | 900,972 | 30,804 | 3.42 | % | 950,557 | 20,330 | 2.14 | % | 798,672 | 12,442 | 1.56 | % | ||||||||||||||||||||||||||||||||||||||||||||
| Total Securities | 928,243 | 31,607 | 3.41 | % | 980,666 | 21,207 | 2.16 | % | 832,843 | 13,558 | 1.63 | % | ||||||||||||||||||||||||||||||||||||||||||||
Tax-Free Loans (1)(2) | 123,847 | 3,978 | 3.21 | % | 144,617 | 4,568 | 3.16 | % | 189,716 | 5,991 | 3.16 | % | ||||||||||||||||||||||||||||||||||||||||||||
Taxable Loans (1) | 3,200,992 | 159,317 | 4.98 | % | 2,844,303 | 135,055 | 4.75 | % | 2,751,169 | 115,448 | 4.20 | % | ||||||||||||||||||||||||||||||||||||||||||||
| Total Loans | 3,324,839 | 163,295 | 4.91 | % | 2,988,920 | 139,623 | 4.67 | % | 2,940,885 | 121,439 | 4.13 | % | ||||||||||||||||||||||||||||||||||||||||||||
| Federal Home Loan Bank Stock | 20,342 | 1,456 | 7.16 | % | 3,251 | 154 | 4.74 | % | 3,420 | 121 | 3.54 | % | ||||||||||||||||||||||||||||||||||||||||||||
| Total Interest-Earning Assets | 4,293,838 | $ | 197,424 | 4.60 | % | 4,023,634 | $ | 161,325 | 4.01 | % | 3,971,640 | $ | 135,389 | 3.41 | % | |||||||||||||||||||||||||||||||||||||||||
| Noninterest Earning Assets | 89,833 | 117,135 | 170,856 | |||||||||||||||||||||||||||||||||||||||||||||||||||||
| Total Assets | $ | 4,383,671 | $ | 4,140,769 | $ | 4,142,496 | ||||||||||||||||||||||||||||||||||||||||||||||||||
| LIABILITIES AND SHAREHOLDERS' EQUITY | ||||||||||||||||||||||||||||||||||||||||||||||||||||||||
| Interest-Bearing Demand | $ | 483,048 | $ | 2,729 | 0.56 | % | $ | 489,298 | $ | 1,578 | 0.32 | % | $ | 413,714 | $ | 1,007 | 0.24 | % | ||||||||||||||||||||||||||||||||||||||
| Money Market | 448,324 | 8,868 | 1.98 | % | 521,269 | 1,842 | 0.35 | % | 383,391 | 1,130 | 0.29 | % | ||||||||||||||||||||||||||||||||||||||||||||
| Savings | 544,938 | 586 | 0.11 | % | 720,682 | 742 | 0.10 | % | 663,382 | 682 | 0.10 | % | ||||||||||||||||||||||||||||||||||||||||||||
| Certificates of Deposit | 1,428,646 | 40,445 | 2.83 | % | 1,271,548 | 14,454 | 1.14 | % | 1,484,436 | 19,427 | 1.31 | % | ||||||||||||||||||||||||||||||||||||||||||||
| Total Interest-Bearing Deposits | 2,904,956 | 52,628 | 1.81 | % | 3,002,797 | 18,616 | 0.62 | % | 2,944,923 | 22,246 | 0.76 | % | ||||||||||||||||||||||||||||||||||||||||||||
| FHLB Borrowings | 402,675 | 20,822 | 5.17 | % | 29,849 | 1,163 | 3.90 | % | 25,986 | 313 | 1.20 | % | ||||||||||||||||||||||||||||||||||||||||||||
| Federal Funds Purchased | 7,023 | 368 | 5.24 | % | 5,711 | 188 | 3.29 | % | — | — | — | % | ||||||||||||||||||||||||||||||||||||||||||||
| Other Borrowings | 6,337 | 292 | 4.61 | % | 5,885 | 287 | 4.88 | % | 3,167 | 155 | 4.89 | % | ||||||||||||||||||||||||||||||||||||||||||||
| Total Borrowings | 416,035 | 21,482 | 5.16 | % | 41,445 | 1,638 | 3.95 | % | 29,153 | 468 | 1.61 | % | ||||||||||||||||||||||||||||||||||||||||||||
| Total Interest-Bearing Liabilities | 3,320,991 | 74,110 | 2.23 | % | 3,044,242 | 20,254 | 0.67 | % | 2,974,076 | 22,714 | 0.76 | % | ||||||||||||||||||||||||||||||||||||||||||||
| Noninterest-Bearing Liabilities | 718,113 | 746,117 | 769,401 | |||||||||||||||||||||||||||||||||||||||||||||||||||||
| Shareholders' Equity | 344,567 | 350,410 | 399,019 | |||||||||||||||||||||||||||||||||||||||||||||||||||||
| Total Liabilities and Shareholders' Equity | $ | 4,383,671 | $ | 4,140,769 | $ | 4,142,496 | ||||||||||||||||||||||||||||||||||||||||||||||||||
Net Interest Income (2) | $ | 123,314 | $ | 141,071 | $ | 112,675 | ||||||||||||||||||||||||||||||||||||||||||||||||||
Net Interest Margin (2) | 2.87 | % | 3.51 | % | 2.84 | % | ||||||||||||||||||||||||||||||||||||||||||||||||||
(1)Nonaccruing loans are included in the daily average loan amounts outstanding.
(2)Tax-exempt income is on an FTE basis using the statutory federal corporate income tax rate of 21 percent.
(3)Loan and deposit balances include held-for-sale transactions in connection with sale of Bank branches.
41
CARTER BANKSHARES, INC. AND SUBSIDIARIES
ITEM 7. MANAGEMENT’S DISCUSSION AND ANALYSIS OF FINANCIAL CONDITION AND RESULTS OF OPERATIONS - (continued)
Interest income increased $36.2 million, or 22.6% for 2023 compared to 2022. Interest income, on an FTE basis (non-GAAP), increased $36.1 million, or 22.4%, for 2023 compared to 2022. The change was primarily due to increases in average interest-earning assets of $270.2 million for 2023, and higher interest rate yields on interest-earning assets of 59 basis points compared to 2022 due to the higher interest rate environment in fiscal year 2023. These changes were offset by the negative impact of $30.0 million to interest income for the year ended December 31, 2023 related to the Company placing its largest lending relationship on nonaccrual status, as noted above. Average interest-bearing deposits with banks decreased $30.4 million in 2023, and the average rate paid increased 455 basis points for 2023 compared to 2022 as funds were deployed into higher yielding loans.
Average loan balances increased $335.9 million primarily influenced by the consistent loan growth in 2023 as compared to 2022. Loans provide the greatest impact on interest income and the yield on earning assets as they have the largest balance and the highest yield within major earning asset categories. The average rate earned on loans increased 24 basis points for the year ended December 31, 2023 compared to the same period in 2022 despite the negative impact caused by the Company placing its largest lending relationship on nonaccrual status, as noted above. At December 31, 2023, the loan portfolio was comprised of 24.8% floating rate loans which reprice monthly, 41.9% variable rate loans that reprice at least once during the life of the loan and 33.3% fixed rate loans that do not reprice during the life of the loan.
Average investment securities decreased $52.4 million and the average rate earned increased 125 basis points for 2023 compared to 2022. The change in investment securities is the result of active balance sheet management to deploy the proceeds from securities maturities and principal payments into higher yielding loans, rather than reinvesting those proceeds back into the securities portfolio. The portfolio has been diversified as to bond types, maturities, and interest rate structures. As of December 31, 2023, the securities portfolio was comprised of 47.2% variable rate securities with approximately 99.3% that will reprice at least once over the next 12 months. We believe having a significant percentage of variable rate securities is an important strategy during times of rising interest rates because fixed-rate bond prices generally fall when interest rates increase, which can result in unrealized losses. However, variable rate securities do not carry as much interest rate risk so there is much less price volatility. This variable rate strategy is expected to limit the impact of rising rates on the Company’s unrealized losses on debt securities.
Interest expense increased $53.9 million for 2023 compared to 2022. The increase was primarily due to increases in the cost of all interest-bearing liability categories, except savings accounts, in the higher rate environment. Also contributing to the increased interest expense was the shift to higher cost deposits and borrowings due to a decline and change in mix of deposits and the Company’s use of higher-cost borrowings to fund growth in the loan portfolio, including a $97.8 million decline in average interest-bearing deposits for the year ended December 31, 2023 compared to the same period in 2022. Interest expense on deposits increased $34.0 million for 2023 compared to 2022 primarily due to the rates on these deposits increasing 119 basis points to 1.81%. The increase in rates for the year ended December 31, 2023 compared to the same period last year included interest-bearing demand deposits up by 24 basis points, money market accounts up by 163 basis points, and CDs up by 169 basis points, in response to competitive pressures from higher market rates compared to the same period in 2022.
The average balance on borrowings increased $374.6 million for the year ended December 31, 2023 compared to the year ended 2022. The cost of borrowings increased 121 basis points for the year ended December 31, 2023 compared to the same period in 2022, largely due to increased balances and the higher interest rate environment.
42
CARTER BANKSHARES, INC. AND SUBSIDIARIES
ITEM 7. MANAGEMENT’S DISCUSSION AND ANALYSIS OF FINANCIAL CONDITION AND RESULTS OF OPERATIONS - (continued)
The following table sets forth for the periods presented a summary of the changes in interest earned and interest paid resulting from changes in volume and changes in rates:
| 2023 Compared to 2022 | 2022 Compared to 2021 | |||||||||||||||||||||||||||||||||||||
| (Dollars in Thousands) | Volume(3) | Rate(3) | Increase/ (Decrease) | Volume(3) | Rate(3) | Increase/ (Decrease) | ||||||||||||||||||||||||||||||||
| Interest Earned on: | ||||||||||||||||||||||||||||||||||||||
| Interest-Bearing Deposits with Banks | $ | (316) | $ | 1,041 | $ | 725 | $ | (324) | $ | 394 | $ | 70 | ||||||||||||||||||||||||||
Tax-free Investment Securities(2) | (83) | 9 | (74) | (125) | (114) | (239) | ||||||||||||||||||||||||||||||||
| Taxable Investment Securities | (1,111) | 11,585 | 10,474 | 2,664 | 5,224 | 7,888 | ||||||||||||||||||||||||||||||||
| Total Securities | (1,194) | 11,594 | 10,400 | 2,539 | 5,110 | 7,649 | ||||||||||||||||||||||||||||||||
Tax-free Loans(1)(2) | (666) | 76 | (590) | (1,425) | 3 | (1,422) | ||||||||||||||||||||||||||||||||
Taxable Loans(1) | 17,526 | 6,736 | 24,262 | 4,013 | 15,593 | 19,606 | ||||||||||||||||||||||||||||||||
| Total Loans | 16,860 | 6,812 | 23,672 | 2,588 | 15,596 | 18,184 | ||||||||||||||||||||||||||||||||
| Federal Home Loan Bank Stock | 1,187 | 115 | 1,302 | (6) | 39 | 33 | ||||||||||||||||||||||||||||||||
| Total Interest-Earning Assets | $ | 16,537 | $ | 19,562 | $ | 36,099 | $ | 4,797 | $ | 21,139 | $ | 25,936 | ||||||||||||||||||||||||||
| Interest Paid on: | ||||||||||||||||||||||||||||||||||||||
| Interest-Bearing Demand | $ | (20) | $ | 1,171 | $ | 1,151 | $ | 205 | $ | 366 | $ | 571 | ||||||||||||||||||||||||||
| Money Market | (293) | 7,319 | 7,026 | 458 | 254 | 712 | ||||||||||||||||||||||||||||||||
| Savings | (188) | 32 | (156) | 59 | 1 | 60 | ||||||||||||||||||||||||||||||||
| Certificates of Deposit | 1,990 | 24,001 | 25,991 | (2,595) | (2,378) | (4,973) | ||||||||||||||||||||||||||||||||
| Total Interest-Bearing Deposits | 1,489 | 32,523 | 34,012 | (1,873) | (1,757) | (3,630) | ||||||||||||||||||||||||||||||||
| Federal Home Loan Bank Borrowings | 19,157 | 502 | 19,659 | 188 | — | 188 | ||||||||||||||||||||||||||||||||
| Federal Funds Purchased | 50 | 130 | 180 | 53 | 797 | 850 | ||||||||||||||||||||||||||||||||
| Other Borrowings | 21 | (16) | 5 | 133 | (1) | 132 | ||||||||||||||||||||||||||||||||
| Total Borrowings | 19,228 | 616 | 19,844 | 374 | 796 | 1,170 | ||||||||||||||||||||||||||||||||
| Total Interest-Bearing Liabilities | $ | 20,717 | $ | 33,139 | $ | 53,856 | $ | (1,499) | $ | (961) | $ | (2,460) | ||||||||||||||||||||||||||
| Change in Net Interest Margin | $ | (4,180) | $ | (13,577) | $ | (17,757) | $ | 6,296 | $ | 22,100 | $ | 28,396 | ||||||||||||||||||||||||||
(1) Nonaccruing loans are included in the daily average loan amounts outstanding.
(2) Tax-exempt income is on an FTE basis (non-GAAP) using the statutory federal corporate income tax rate of 21 percent.
(3) Changes to rate/volume are allocated to both rate and volume on a proportionate dollar basis.
Provision for Credit Losses
The Company recognizes provision for the ACL based on the difference between the existing balance of ACL reserves and the ACL reserve balance necessary to adequately absorb expected credit losses associated with the Company’s financial instruments. Similarly, the Company recognizes provision (recovery) for unfunded commitments based on the difference between the existing balance of reserves for unfunded commitments and the reserve balance for unfunded commitments necessary to adequately absorb expected credit losses associated with those commitments.
The ACL as a percentage of total portfolio loans was 2.77% at December 31, 2023 and 2.98% at December 31, 2022. The provision for credit losses increased $3.1 million to $5.5 million for the year ended 2023 compared to $2.4 million for the year ended 2022. The increase in the provision for credit losses was primarily driven by loan growth.
The provision for unfunded commitments for the full year 2023 was a provision of $0.9 million compared to a provision of $0.5 million for the full year 2022, an increase of $0.4 million primarily due to an increase in construction commitments.
Net charge-offs were $2.3 million for the full year 2023 compared to $4.5 million for the full year 2022. During 2023, net charge-offs were concentrated in the other consumer loan segment. As a percentage of average portfolio loans, on an annualized basis, net charge-offs were 0.07% and 0.15% for the years ended 2023 and 2022, respectively. See the “Allowance for Credit Losses” section of this MD&A for additional details regarding our charge-offs.
43
CARTER BANKSHARES, INC. AND SUBSIDIARIES
ITEM 7. MANAGEMENT’S DISCUSSION AND ANALYSIS OF FINANCIAL CONDITION AND RESULTS OF OPERATIONS - (continued)
Nonperforming loans (“NPLs”) increased at December 31, 2023 by $302.9 million to $309.5 million compared to $6.6 million at December 31, 2022. During the second quarter of 2023, the Company placed commercial loans that reside in the Other segment of the Company’s loan portfolio, relating to a single lending relationship which has an aggregate principal amount of $301.9 million, on nonaccrual status due to loan maturities and failure to pay in full. In connection with our adoption of Topic 326 “Financial Instruments – Credit Losses” on January 1, 2021, the bank segmented this relationship in the CECL model, along with select other loans, into a segment labeled Other. As of December 31, 2023 and December 31, 2022, those Other segment reserves were $54.4 million and $54.7 million, respectively. As of December 31, 2023, the Company utilized discounted cash flow valuation techniques to evaluate the current condition of certain of the borrowers’ operating businesses, those borrowers’ capacity to repay and scenarios through which the Company may ultimately resolve this nonaccrual relationship, which resulted in individually evaluated reserves related to that single lending relationship. The bank established a reserve of $51.3 million for this relationship as of January 1, 2021 with the adoption of CECL. As a result of the discounted cash flow analysis and the reserves that were established for this relationship as of December 31, 2022, the classification of these commercial loans in nonaccrual status did not have a significant impact on the Company’s provision for credit losses during the year ended December 31, 2023. NPLs as a percentage of total portfolio loans were 8.83% at December 31, 2023 compared to 0.21% at December 31, 2022. See the “Credit Quality” section of this MD&A for more detail on our NPLs.
Discussion of net interest income for the year ended December 31, 2021 has been omitted as such discussion was provided in Part II, Item 7. “Management’s Discussion and Analysis of Financial Condition and Results of Operations,” under the heading “Net Interest Income” in the Company’s Annual Report on Form 10-K for the year ended December 31, 2021, which was filed with the SEC on March 11, 2022, and is incorporated herein by reference.
Noninterest Income
| Years Ended December 31, | ||||||||||||||||||||||||||
| (Dollars in Thousands) | 2023 | 2022 | $ Change | % Change | ||||||||||||||||||||||
| (Losses) Gains on Sales of Securities, net | $ | (1,521) | $ | 46 | $ | (1,567) | NM | |||||||||||||||||||
| Service Charges, Commissions and Fees | 7,155 | 7,168 | (13) | (0.2) | % | |||||||||||||||||||||
| Debit Card Interchange Fees | 7,828 | 7,427 | 401 | 5.4 | % | |||||||||||||||||||||
| Insurance Commissions | 1,945 | 1,961 | (16) | (0.8) | % | |||||||||||||||||||||
| Bank Owned Life Insurance Income | 1,381 | 1,357 | 24 | 1.8 | % | |||||||||||||||||||||
| Gains on Sales and Write-downs of Bank Premises, net | — | 73 | (73) | (100.0) | % | |||||||||||||||||||||
| Commercial Loan Swap Fee Income | 139 | 774 | (635) | (82.0) | % | |||||||||||||||||||||
| Other | 1,351 | 2,912 | (1,561) | (53.6) | % | |||||||||||||||||||||
| Total Noninterest Income | $ | 18,278 | $ | 21,718 | $ | (3,440) | (15.8) | % | ||||||||||||||||||
NM - percentage not meaningful | ||||||||||||||||||||||||||
For the full year 2023, total noninterest income was $18.3 million, a decrease of $3.4 million, or 15.8%, from the full year 2022. The decrease was primarily related to net losses on sales of securities of $1.5 million, a decrease of $1.6 million in other noninterest income, a decrease of $0.6 million in commercial loan swap fee income, as well as a decrease of $0.1 million in gains on sales and write-downs of bank premises, net. These decreases were offset by an increase of $0.4 million in debit card interchange fees due to higher volume during 2023.
The net losses on sales of securities were driven by the sale of approximately $30.0 million of available-for-sale securities during the fourth quarter of 2023 to reposition the securities portfolio and reinvest the proceeds in higher earning assets. The decrease within other noninterest income related to the unwind of two completed historic tax credit partnerships, which resulted in a gain of $1.2 million during the fourth quarter of 2022 and lower fair value adjustment of our interest rate swap contracts with commercial customers. The decrease in commercial loan swap fee income was due to the changing interest rate environment.
Discussion of noninterest income for the year ended December 31, 2021 has been omitted as such discussion was provided in Part II, Item 7. “Management’s Discussion and Analysis of Financial Condition and Results of Operations,” under the heading “Noninterest Income” in the Company’s Annual Report on Form 10-K for the year ended December 31, 2021, which was filed with the SEC on March 11, 2022, and is incorporated herein by reference.
44
CARTER BANKSHARES, INC. AND SUBSIDIARIES
ITEM 7. MANAGEMENT’S DISCUSSION AND ANALYSIS OF FINANCIAL CONDITION AND RESULTS OF OPERATIONS - (continued)
Noninterest Expense
| (Dollars in Thousands) | Years Ended December 31, | |||||||||||||||||||||||||
| 2023 | 2022 | $ Change | % Change | |||||||||||||||||||||||
| Salaries and Employee Benefits | $ | 55,856 | $ | 52,399 | $ | 3,457 | 6.6 | % | ||||||||||||||||||
| Occupancy Expense, net | 14,028 | 13,527 | 501 | 3.7 | % | |||||||||||||||||||||
| FDIC Insurance Expense | 4,904 | 2,015 | 2,889 | 143.4 | % | |||||||||||||||||||||
| Other Taxes | 3,282 | 3,319 | (37) | (1.1) | % | |||||||||||||||||||||
| Advertising Expense | 1,693 | 1,434 | 259 | 18.1 | % | |||||||||||||||||||||
| Telephone Expense | 1,842 | 1,781 | 61 | 3.4 | % | |||||||||||||||||||||
| Professional and Legal Fees | 6,210 | 5,818 | 392 | 6.7 | % | |||||||||||||||||||||
| Data Processing | 3,920 | 4,051 | (131) | (3.2) | % | |||||||||||||||||||||
| Losses on Sales and Write-downs of Other Real Estate Owned, net | 1,100 | 432 | 668 | 154.6 | % | |||||||||||||||||||||
| Debit Card Expense | 2,875 | 2,750 | 125 | 4.5 | % | |||||||||||||||||||||
| Tax Credit Amortization | — | 621 | (621) | (100.0) | % | |||||||||||||||||||||
| Other | 9,756 | 8,854 | 902 | 10.2 | % | |||||||||||||||||||||
| Total Noninterest Expense | $ | 105,466 | $ | 97,001 | $ | 8,465 | 8.7 | % | ||||||||||||||||||
For the full year 2023, total noninterest expense was $105.5 million, an increase of $8.5 million, or 8.7%, from the full year 2022 primarily due to higher salaries and employee benefits of $3.5 million, an increase of $2.9 million in FDIC insurance expenses, an increase of $0.9 million in other noninterest expense, an increase in losses on sales and write-downs of other real estate owned, (“OREO”), net of $0.7 million, an increase in occupancy expenses of $0.5 million, an increase in professional and legal fees of $0.4 million, and an increase in advertising expenses of $0.3 million. Offsetting these increases was a decline in tax credit amortization of $0.6 million and a decrease on $0.1 million in data processing expenses.
The increase in salaries and employee benefits was primarily related to higher salary expense of $4.5 million due to fewer open positions in retail, job grade assessment increases and normal merit increases, increases of $0.2 million in restricted stock expense, increased Federal Insurance Contributions Act expenses of $0.4 million, offset by a decrease in medical claims of $0.3 million and lower performance based incentives of $1.4 million in 2023.
The increase in FDIC insurance expenses was due to a final rule adopted by the FDIC to all insured depository institutions, to increase initial base deposit insurance assessment rate schedules uniformly by two basis points, beginning in the first quarterly assessment period of 2023, as well as the deterioration in asset quality as a direct result of the large NPL relationship, which is a component used to determine the assessment.
The increase in other noninterest expense relates to immaterial amounts resulting from various operating and administrative expenses including business development expenses (i.e. travel and entertainment, donations and club dues), insurance, supplies and printing, equipment rent, and software support and maintenance.
The increase in losses on sales and write-downs of OREO, net related to three legacy OREO properties that sold in the fourth quarter of 2023, and $0.5 million in write-downs on three closed retail branches. These branches were closed in 2023, transferred to OREO and marketed for sale.
The increases in occupancy expenses primarily related to additional seasonal services performed during the year ended 2023. The increase in professional and legal fees relates to higher legal expenses incurred from the large NPL relationship and new consulting engagements. Advertising expenses increased due to marketing initiatives during the full year 2023.
The decline in tax credit amortization was due to the early adoption of Accounting Standard Update 2023-02 Investments Equity Method and Joint Ventures (Topic 323): Accounting for Investments in Tax Credit Structures Using the Proportional Amortization Method. Under the proportional amortization modified retrospective basis, the amortization of tax credit investments is recorded as a component of income tax expense instead of through noninterest expense as previously recorded in 2022. The decrease in data processing expenses related to additional expenses incurred during the full year 2022 for our online banking platform.
45
CARTER BANKSHARES, INC. AND SUBSIDIARIES
ITEM 7. MANAGEMENT’S DISCUSSION AND ANALYSIS OF FINANCIAL CONDITION AND RESULTS OF OPERATIONS - (continued)
Discussion of noninterest expense for the year ended December 31, 2021 has been omitted as such discussion was provided in Part II, Item 7. “Management’s Discussion and Analysis of Financial Condition and Results of Operations,” under the heading “Noninterest Expense” in the Company’s Annual Report on Form 10-K for the year ended December 31, 2021, which was filed with the SEC on March 11, 2022, and is incorporated herein by reference.
Provision for Income Taxes
The provision for income taxes decreased $6.3 million to $5.3 million for the year ended December 31, 2023 compared to $11.6 million for December 31, 2022. Pre-tax income decreased $33.0 million for the year ended 2023 compared to 2022. Our effective tax rate was 18.6% for the year ended December 31, 2023 compared to 18.8% for December 31, 2022. The decrease in the effective tax rate for the year ended December 31, 2023 compared to the same period in 2022 was primarily related to changes in pre-tax income, partially offset by increases to the valuation allowance in 2023. The Company ordinarily generates an annual effective tax rate that is less than the statutory rate of 21% due to benefits resulting from tax-exempt interest income, tax credit projects and bank owned life insurance (“BOLI”).
Discussion of provision for income taxes for the year ended December 31, 2021 has been omitted as such discussion was provided in Part II, Item 7. “Management’s Discussion and Analysis of Financial Condition and Results of Operations,” under the heading “Provision for Income Taxes” in the Company’s Annual Report on Form 10-K for the year ended December 31, 2021, which was filed with the SEC on March 11, 2022, and is incorporated herein by reference.
Financial Condition
December 31, 2023
Total assets increased $308.0 million, to $4.5 billion at December 31, 2023 compared to $4.2 billion at December 31, 2022. Total portfolio loans increased $357.0 million, or 11.3% to $3.5 billion at December 31, 2023 compared to December 31, 2022 primarily due to loan growth in the CRE, residential mortgage and construction segments during the year ended December 31, 2023. The variances in loan segments for portfolio loans related to increases of $200.1 million in commercial real estate loans, $130.0 million in residential mortgages, $82.8 million in construction loans, offset by decreases of $38.3 million in commercial and industrial (“C&I”) loans, $10.3 million in other consumer loans and $7.3 million in the other category.
The securities portfolio decreased $57.3 million and is currently 17.3% of total assets at December 31, 2023 compared to 19.9% of total assets at December 31, 2022. The decrease is due to $92.2 million in security sales, curtailments and maturities deployed into higher yielding loan growth or to curtail wholesale funding, partially offset by security purchases of $24.9 million and the positive changes in fair value of securities during 2023. As of December 31, 2023, the securities portfolio was comprised of 47.2% variable rate securities with approximately 99.3% that will reprice at least once over the next 12 months. At December 31, 2023, total gross unrealized gains in the available-for-sale portfolio were $0.7 million, offset by $92.3 million of gross unrealized losses. Refer to the “Securities Activity” section below for further discussion of unrealized losses in the available-for-sale securities portfolio.
Federal Home Loan Bank (“FHLB”) stock, at cost increased $11.9 million to $21.6 million at December 31, 2023 compared to December 31, 2022. The increase is due to the FHLB requirement to hold a specified level of stock based upon level of borrowings. OREO decreased $5.9 million at December 31, 2023 compared to December 31, 2022 due to the sale of one OREO property in June 2023. During the year ended 2023, the Bank closed three retail banking offices and moved $1.4 million at fair value to OREO. These properties are currently being marketed for sale. Closed retail bank offices had a book value of $2.3 million at December 31, 2023 and $1.1 million at December 31, 2022.
Total deposits increased $89.4 million to $3.7 billion at December 31, 2023 compared to December 31, 2022. The increase primarily related to an increase of $325.1 million in certificate of deposits (“CDs”) and an increase of $29.4 million in money market accounts offset by declines of $265.1 million in savings and demand deposits due to customers migrating to higher-yielding CD products driven by high market interest rates. At December 31, 2023, noninterest-bearing deposits comprised 18.4% of total deposits compared to 19.4% at December 31, 2022. CDs comprised 42.6% and 34.7% of total deposits at December 31, 2023 and December 31, 2022, respectively. As of December 31, 2023, based on assumptions that the Bank uses to prepare its regulatory call report, approximately 82.6% of our total deposits of $3.7 billion were insured under standard FDIC insurance coverage limits, and approximately 17.4% of our total deposits were uninsured deposits over the standard FDIC
46
CARTER BANKSHARES, INC. AND SUBSIDIARIES
ITEM 7. MANAGEMENT’S DISCUSSION AND ANALYSIS OF FINANCIAL CONDITION AND RESULTS OF OPERATIONS - (continued)
insurance coverage limit. The Company’s deposit base is diversified and granular and is comprised of approximately 78.9% of retail deposits.
Total capital of $351.2 million at December 31, 2023, reflects an increase of $22.6 million compared to $328.6 million at December 31, 2022. The increase in total capital from December 31, 2022 is primarily due to net income of $23.4 million for the year ended December 31, 2023, other comprehensive income of $14.2 million increased due to changes in fair value of investment securities, an increase of $1.5 million related to restricted stock activity during the year, as well as, the transitional adjustment of $0.1 million, net of tax for the adoption of ASU 2023-02. Offsetting these increases was a decrease of $16.6 million related to the repurchase of common stock and the 1% excise tax on stock repurchases.
The ACL was 2.77% of total portfolio loans at December 31, 2023 compared to 2.98% as of December 31, 2022. General reserves as a percentage of total portfolio loans were 1.22% at December 31, 2023 compared to 2.96% at December 31, 2022. The decrease in the general reserves as a percentage of total portfolio loans was primarily driven by the largest lending relationship’s movement from the general pool to the individually evaluated loans due to the transfer to nonaccrual during the second quarter of 2023, offset by loan growth. Management believes the ACL is adequate to absorb expected losses inherent in the loan portfolio. See the sections of this MD&A titled “Provision for Credit Losses,” “Credit Quality” and “Allowance for Credit Losses” for information about the factors that impacted the ACL and the provision for credit losses.
The Company remains well capitalized. The Tier 1 capital ratio decreased to 11.08% at December 31, 2023 compared to 12.61% at December 31, 2022. The leverage ratio was 9.48% at December 31, 2023, compared to 10.29% at December 31, 2022 and the total risk-based capital ratio was 12.34% at December 31, 2023 compared to 13.86% at December 31, 2022. The decrease is related to the aforementioned repurchase of common stock of $16.6 million and the 1% excise tax on stock repurchases and loan growth during the year ended December 31, 2023. Another significant factor driving the ratios downward was the Company placing the above mentioned large lending relationship on nonaccrual status, which resulted in a $30.0 million year-to-date negative impact on interest income, combined with the movement of nonaccrual assets to higher risk rating categories.
The Bank also remained well capitalized as of December 31, 2023. The Bank’s Tier 1 capital ratio was 10.99% at December 31, 2023 compared to 12.42% at December 31, 2022. The Bank’s leverage ratio was 9.41% at December 31, 2023 compared to 10.13% at December 31, 2022. The Bank’s total risk-based capital ratio was 12.25% at December 31, 2023 compared to 13.68% at December 31, 2022.
47
CARTER BANKSHARES, INC. AND SUBSIDIARIES
ITEM 7. MANAGEMENT’S DISCUSSION AND ANALYSIS OF FINANCIAL CONDITION AND RESULTS OF OPERATIONS - (continued)
Securities
The following table presents the composition of available-for-sale securities for the periods presented:
| (Dollars in Thousands) | 2023 | 2022 | $ Change | |||||||||||||||||
| U.S. Treasury Securities | $ | — | $ | 17,866 | $ | (17,866) | ||||||||||||||
| U.S. Government Agency Securities | 43,827 | 49,764 | (5,937) | |||||||||||||||||
| Residential Mortgage-Backed Securities | 99,150 | 103,685 | (4,535) | |||||||||||||||||
| Commercial Mortgage-Backed Securities | 31,163 | 34,675 | (3,512) | |||||||||||||||||
| Other Commercial Mortgage-Backed Securities | 21,856 | 22,399 | (543) | |||||||||||||||||
| Asset Backed Securities | 140,006 | 141,383 | (1,377) | |||||||||||||||||
| Collateralized Mortgage Obligations | 161,533 | 176,622 | (15,089) | |||||||||||||||||
| States and Political Subdivisions | 222,108 | 228,146 | (6,038) | |||||||||||||||||
| Corporate Notes | 59,360 | 61,733 | (2,373) | |||||||||||||||||
| Total Debt Securities | $ | 779,003 | $ | 836,273 | $ | (57,270) | ||||||||||||||
The balances and average rates of our securities portfolio are presented below as of December 31:
| (Dollars in Thousands) | 2023 | 2022 | ||||||||||||||||||||||||
| Balance | Weighted- Average Yield | Balance | Weighted- Average Yield | |||||||||||||||||||||||
| U.S. Treasury Securities | $ | — | — | % | $ | 17,866 | 1.43 | % | ||||||||||||||||||
| U.S. Government Agency Securities | 43,827 | 5.79 | % | 49,764 | 4.29 | % | ||||||||||||||||||||
| Residential Mortgage-Backed Securities | 99,150 | 3.62 | % | 103,685 | 2.90 | % | ||||||||||||||||||||
| Commercial Mortgage-Backed Securities | 31,163 | 5.95 | % | 34,675 | 4.52 | % | ||||||||||||||||||||
| Other Commercial Mortgage-Backed Securities | 21,856 | 2.74 | % | 22,399 | 2.65 | % | ||||||||||||||||||||
| Asset Backed Securities | 140,006 | 4.49 | % | 141,383 | 4.04 | % | ||||||||||||||||||||
| Collateralized Mortgage Obligations | 161,533 | 4.39 | % | 176,622 | 3.56 | % | ||||||||||||||||||||
| States and Political Subdivisions | 222,108 | 2.36 | % | 228,146 | 2.38 | % | ||||||||||||||||||||
| Corporate Notes | 59,360 | 3.87 | % | 61,733 | 3.87 | % | ||||||||||||||||||||
| Total Securities Available-for-Sale | $ | 779,003 | 3.73 | % | $ | 836,273 | 3.24 | % | ||||||||||||||||||
The Company invests in various securities in order to maintain a source of liquidity, to satisfy various pledging requirements, to increase net interest income and as a tool of the ALCO to diversify and reposition the balance sheet for interest rate risk purposes. Securities are subject to market risks that could negatively affect the level of liquidity available to us. Security purchases are subject to our investment policy that is approved annually by our Board and administered through ALCO and our treasury function.
The securities portfolio decreased $57.3 million to $779.0 million at December 31, 2023 compared to $836.3 million at December 31, 2022. Securities comprise 17.3% of total assets at December 31, 2023 compared to 19.9% at December 31, 2022. The decrease is primarily due to $92.2 million in security sales, curtailments and maturities deployed into higher yielding loan growth or to curtail wholesale funding, partially offset by security purchases of $24.9 million and the positive changes in fair value of securities during 2023. As of December 31, 2023, the securities portfolio was comprised of 47.2% variable rate securities with approximately 99.3% that will reprice at least once over the next 12 months.
At December 31, 2023, total gross unrealized gains in the available-for-sale portfolio were $0.7 million offset by $92.3 million of gross unrealized losses. At December 31, 2022, total gross unrealized gains in the available-for-sale portfolio were $0.3 million offset by $109.7 million of gross unrealized losses.
The unrealized losses on debt securities are believed to be temporary primarily because these unrealized losses are due to reductions in market value caused by upward movement in interest rates since the securities purchase (as applicable), and not related to the credit quality of these securities. Our portfolio consists of 48.7% of securities issued by United States government
48
CARTER BANKSHARES, INC. AND SUBSIDIARIES
ITEM 7. MANAGEMENT’S DISCUSSION AND ANALYSIS OF FINANCIAL CONDITION AND RESULTS OF OPERATIONS - (continued)
sponsored entities and carry an implicit government guarantee. States and political subdivisions comprise 28.5% of the portfolio and are largely general obligations or essential purpose revenue bonds, which have performed very well historically over all business cycles, and are rated AA and AAA. We have the ability to hold these securities to maturity and expect full recovery of the amortized cost. From time to time we may sell securities to take advantage of market opportunities or as part of a strategic initiative.
The Company’s investment securities with intermediate and long-term maturities were the largest driver of these gross unrealized losses, as the market values of these securities are significantly impacted by the Treasury yield curve for similar durations (i.e., 5- and 10-year Treasury securities). This portion of the Treasury yield curve has moved lower over the past three months, driving unrealized losses on these securities lower. The Company believes that the Federal Reserve System, (“FRB”) is at or near the end of its aggressive strategy of raising short-term interest rates to combat inflation. Some market information indicates that the FRB may start lowering short-term interest rates in 2024. Changes in short-term interest rates can affect the yield on floating rate securities. Therefore, yields on floating rate securities may begin to fall should the FRB begin lowering short rates. Changes in intermediate and long-term interest rates, which are market driven, affect the market value of fixed rate securities with similar maturities. Thus, the Company expects that market values on the Bank’s intermediate and long-term maturity holdings will continue to fluctuate in large part driven by treasury yield changes.
At December 31, 2023 the 5-year and 10-year U.S. Treasury yields were 3.84% and 3.88%, respectively. At December 31, 2022, those same bond yields were 3.99% and 3.88%, respectively. The flatness in 10-year treasury yields was neutral to bond market values, while the decrease of 15 basis points in the 5-year treasury in the intermediate part of the yield curve helped drive the decrease in unrealized losses for the year ended December 31, 2023. The effects were generally greater for longer maturity bonds, such as municipal bonds. On the other hand, floating rate bonds largely held consistent values, as those interest rates adjust in line with Federal Reserve interest rate hikes.
Should the impairment of any of these securities become credit related, the impairment will be recognized by establishing an ACL through provision for credit losses in the period the credit related impairment is identified, while any non-credit loss will be recognized in accumulated other comprehensive loss, net of applicable taxes. At December 31, 2023 and December 31, 2022, the Company had no credit related impairment.
The Basel rules also permit most banking organizations to retain, through a one-time election, existing treatment for accumulated other comprehensive loss, which currently does not affect regulatory capital. The Company elected to retain this treatment which reduces the volatility of regulatory capital levels.
The following table sets forth the maturities of securities at December 31, 2023 and the weighted average yields of such securities.
Available-for-Sale Securities
| (Dollars in Thousands) | Maturing | |||||||||||||||||||||||||||||||||||||||||||||||||
| Within One Year | After One But Within Five Years | After Five But Within Ten Years | After Ten Years | |||||||||||||||||||||||||||||||||||||||||||||||
| Amount | Yield | Amount | Yield | Amount | Yield | Amount | Yield | |||||||||||||||||||||||||||||||||||||||||||
| U.S. Government Agency Securities | $ | — | — | % | $ | 2,898 | 6.07 | % | $ | 40,929 | 5.77 | % | $ | — | — | % | ||||||||||||||||||||||||||||||||||
Residential Mortgage-Backed Securities(2) | — | — | % | — | — | % | — | — | % | 99,150 | 3.62 | % | ||||||||||||||||||||||||||||||||||||||
Commercial Mortgage-Backed Securities(2) | — | — | % | 1,069 | 7.32 | % | 7,358 | 4.52 | % | 22,736 | 6.38 | % | ||||||||||||||||||||||||||||||||||||||
Other Commercial Mortgage-Backed Securities(2) | — | — | % | — | — | % | 1,967 | 1.52 | % | 19,889 | 2.87 | % | ||||||||||||||||||||||||||||||||||||||
Asset Backed Securities(2) | — | — | % | 25,606 | 1.89 | % | 64,773 | 4.43 | % | 49,627 | 6.00 | % | ||||||||||||||||||||||||||||||||||||||
Collateralized Mortgage Obligations(2) | — | — | % | — | — | % | 4,409 | 1.40 | % | 157,124 | 4.48 | % | ||||||||||||||||||||||||||||||||||||||
| States and Political Subdivisions | — | — | % | 8,948 | 1.99 | % | 127,827 | 2.28 | % | 85,333 | 2.52 | % | ||||||||||||||||||||||||||||||||||||||
| Corporate Notes | — | — | % | — | — | % | 59,360 | 3.87 | % | — | — | % | ||||||||||||||||||||||||||||||||||||||
| Total | $ | — | $ | 38,521 | $ | 306,623 | $ | 433,859 | ||||||||||||||||||||||||||||||||||||||||||
Weighted Average Yield(1) | — | % | 2.34 | % | 3.48 | % | 4.04 | % | ||||||||||||||||||||||||||||||||||||||||||
(1)Weighted -average yields are calculated on a taxable-equivalent basis using the federal statutory tax rate of 21 percent.
(2) Securities not due at a single maturity date
49
CARTER BANKSHARES, INC. AND SUBSIDIARIES
ITEM 7. MANAGEMENT’S DISCUSSION AND ANALYSIS OF FINANCIAL CONDITION AND RESULTS OF OPERATIONS - (continued)
At December 31, 2023 the Company had no held-to-maturity securities; however, if at a future date we classify securities as held-to-maturity, our disclosures will show the weighted average yield for each range of maturities.
At December 31, 2023, the Company held 52.8% fixed rate and 47.2% floating rate securities. The floating rate securities may have a stated maturity greater than ten years, but the interest rate generally adjusts monthly. Therefore, the duration on these securities is short, generally less than one year, and will therefore not be as sensitive to interest rate changes.
Refer to Note 4, Investment Securities, in the Notes to Consolidated Financial Statements in Item 8 of this Annual Report on Form 10-K for additional information related to our securities.
Loan Composition
The following table summarizes our loan portfolio as of the periods presented:
| December 31, | ||||||||||||||||||||||||||||||||
| (Dollars in Thousands) | 2023 | 2022 | 2021 | 2020 | 2019 | |||||||||||||||||||||||||||
| Commercial | ||||||||||||||||||||||||||||||||
| Commercial Real Estate | $ | 1,670,631 | $ | 1,470,562 | $ | 1,323,252 | $ | 1,453,799 | $ | 1,365,310 | ||||||||||||||||||||||
| Commercial and Industrial | 271,511 | 309,792 | 345,376 | 557,164 | 621,667 | |||||||||||||||||||||||||||
| Total Commercial Loans | 1,942,142 | 1,780,354 | 1,668,628 | 2,010,963 | 1,986,977 | |||||||||||||||||||||||||||
| Consumer | ||||||||||||||||||||||||||||||||
| Residential Mortgages | 787,929 | 657,948 | 457,988 | 472,170 | 514,538 | |||||||||||||||||||||||||||
| Other Consumer | 34,277 | 44,562 | 44,666 | 57,647 | 73,688 | |||||||||||||||||||||||||||
| Total Consumer Loans | 822,206 | 702,510 | 502,654 | 529,817 | 588,226 | |||||||||||||||||||||||||||
| Construction | 436,349 | 353,553 | 282,947 | 406,390 | 309,563 | |||||||||||||||||||||||||||
| Other | 305,213 | 312,496 | 357,900 | — | — | |||||||||||||||||||||||||||
| Total Portfolio Loans | 3,505,910 | 3,148,913 | 2,812,129 | 2,947,170 | 2,884,766 | |||||||||||||||||||||||||||
| Loans Held-for-Sale | — | — | 228 | 25,437 | 19,714 | |||||||||||||||||||||||||||
| Loans Held-for-Sale in Connection with Sale of Bank Branches, at the lower of cost or fair value | — | — | — | 9,835 | — | |||||||||||||||||||||||||||
| Total Loans | $ | 3,505,910 | $ | 3,148,913 | $ | 2,812,357 | $ | 2,982,442 | $ | 2,904,480 | ||||||||||||||||||||||
Our loan portfolio represents our most significant source of interest income. The risk that borrowers are unable to pay such obligations is inherent in the loan portfolio. Other conditions such as downturns in the borrower's industry or the overall economic climate can significantly impact the borrower’s ability to pay. For a discussion of the risk factors relevant to our business and operations, please refer to Part I, Item 1A, “Risk Factors,” contained in this Annual Report on Form 10-K for the year ended December 31, 2023.
Total portfolio loans increased $357.0 million, or 11.3%, to $3.5 billion at December 31, 2023 compared to December 31, 2022 with strong production primarily in our CRE, residential mortgage and construction portfolios. The CRE portfolio is monitored for potential concentrations of credit risk by market, property type and tenant concentrations. Given the continued rising rate environment our mortgage portfolio experienced more modest growth in 2023 compared to 2022. At December 31, 2023, the loan portfolio was comprised of 24.8% floating rates which reprice monthly, 41.9%, variable rates that reprice at least once during the life of the loan and the remaining 33.3% are fixed rate loans. The Company continues to carefully monitor the loan portfolio during 2023, including in light of market conditions that impact our borrowers and the interest rate environment.
Total CRE represented 47.7% of total portfolio loans at December 31, 2023 compared to 46.7% at December 31, 2022. The Company’s CRE loan portfolio is concentrated predominantly in North Carolina, Virginia, South Carolina, West Virginia and Georgia within the retail, multifamily, hospitality, warehouse and office metrics.
50
CARTER BANKSHARES, INC. AND SUBSIDIARIES
ITEM 7. MANAGEMENT’S DISCUSSION AND ANALYSIS OF FINANCIAL CONDITION AND RESULTS OF OPERATIONS - (continued)
The following table presents the Company's CRE breakout by segment, the segment amounts included in special mention and substandard and the related percentages by segment to total CRE and total portfolio loans as of the periods indicated:
| December 31, | ||||||||||||||||||||||||||||||||||||||||||||||||||
| 2023 | 2022 | |||||||||||||||||||||||||||||||||||||||||||||||||
| (Dollars in Thousands) | CRE Portfolio | CRE Balance in Special Mention/Substandard Risk Rating | % of Each Segment to Total CRE Loans | % of Each Segment to Total Portfolio Loans | CRE Portfolio | CRE Balance in Special Mention/Substandard Risk Rating | % of Each Segment to Total CRE Loans | % of Each Segment to Total Portfolio Loans | ||||||||||||||||||||||||||||||||||||||||||
| Commercial Real Estate | ||||||||||||||||||||||||||||||||||||||||||||||||||
| Retail | $ | 396,831 | $ | 62 | 23.8 | % | 11.3 | % | $ | 319,557 | $ | 155 | 21.7 | % | 10.1 | % | ||||||||||||||||||||||||||||||||||
| Multifamily | 386,123 | — | 23.1 | % | 11.0 | % | 289,667 | 9,964 | 19.7 | % | 9.2 | % | ||||||||||||||||||||||||||||||||||||||
| Warehouse | 373,812 | — | 22.4 | % | 10.7 | % | 264,705 | 85 | 18.0 | % | 8.4 | % | ||||||||||||||||||||||||||||||||||||||
| Hospitality | 289,553 | 72 | 17.3 | % | 8.3 | % | 308,856 | — | 21.0 | % | 9.8 | % | ||||||||||||||||||||||||||||||||||||||
| Office | 222,160 | 1,349 | 13.3 | % | 6.3 | % | 225,930 | 2,898 | 15.4 | % | 7.2 | % | ||||||||||||||||||||||||||||||||||||||
| Other | 2,152 | 119 | 0.1 | % | 0.1 | % | 61,847 | 120 | 4.2 | % | 2.0 | % | ||||||||||||||||||||||||||||||||||||||
| Total CRE Loans | $ | 1,670,631 | $ | 1,602 | 100.0 | % | 47.7 | % | $ | 1,470,562 | $ | 13,222 | 100.0 | % | 46.7 | % | ||||||||||||||||||||||||||||||||||
CRE loans represent a portfolio concentration risk. The majority of our CRE loans are made in the above noted geographies and granted to experienced developers and sponsors with loan guaranty structures that provide recourse to individuals with access to financial resources. We believe our knowledge of CRE and our operating knowledge at the local and regional level of these markets allows us to effectively manage concentration risk. Our operating knowledge at the local and regional level is derived from our front-line connection to the customer and our understanding of their business model. We also have access to research tools that inform us about market statistics such as occupancy, lease growth rates and new construction starts. This data is reviewed frequently by our credit officers and disseminated to our lenders. The bank’s underwriting process includes multiple shock scenarios primarily focused on cash flow and leverage in order to determine a supportable loan amount.
We attempt to limit our exposure to credit risk by diversifying our loan portfolio by segment, geography, collateral and industry while actively managing concentrations. When concentrations exist in certain segments, we seek to mitigate this risk by reviewing the relevant economic indicators and internal risk rating trends of the loans in these segments. The Company established transaction, relationship and specific loan segment limits in its loan policy. Total commercial real estate balances should not exceed the combination of 300% of total risk-based capital and growth in excess of 50% over the previous thirty-six months and construction loan balances should not exceed 100% of total risk-based capital. Investment real estate property types and purchased loan programs have individual dollar limits that should not be exceeded in the portfolio and are based on management’s risk tolerance relative to capital. In addition, there are specific targets for various categories of real estate loans with respect to debt service coverage ratios, loan-to-value ratios, loan terms, and amortization periods. We also have policy limits on loan-to-cost for construction projects. Although leverage is important, the Company also focuses on cash flow generation and employs stress testing to calculate a supportable loan amount.
Aggregate commitments to our top 10 credit relationships were $636.7 million at December 31, 2023. The Other segment represents 47.4% of the top 10 credit relationships and the Company has since transferred its largest lending relationship of $301.9 million to nonaccrual during the second quarter of 2023, as described in more detail below under “Credit Quality” in this MD&A.
51
CARTER BANKSHARES, INC. AND SUBSIDIARIES
ITEM 7. MANAGEMENT’S DISCUSSION AND ANALYSIS OF FINANCIAL CONDITION AND RESULTS OF OPERATIONS - (continued)
The following table summarizes our top 10 relationships and a description of industries represented for the periods presented:
| For the Periods Ending | ||||||||||||||||||||||||||||||||
| Dollars in Thousands | 12/31/2023 | 12/31/2022 | Change | 2023 % of Gross Loans | 2023 % of RBC | |||||||||||||||||||||||||||
| 1. Hospitality, Agriculture & Energy | $ | 301,913 | $ | 309,107 | $ | (7,194) | 8.61 | % | 62.26 | % | ||||||||||||||||||||||
| 2. Retail Real Estate & Food Services | 53,576 | 55,625 | (2,049) | 1.53 | % | 11.05 | % | |||||||||||||||||||||||||
| 3. Multifamily Development | 40,000 | 40,000 | — | 1.14 | % | 8.25 | % | |||||||||||||||||||||||||
| 4. Retail Real Estate | 38,972 | 37,679 | 1,293 | 1.11 | % | 8.04 | % | |||||||||||||||||||||||||
| 5. Hospitality | 37,502 | 35,255 | 2,247 | 1.07 | % | 7.73 | % | |||||||||||||||||||||||||
| 6. Industrial & Retail Real Estate | 33,885 | 41,725 | (7,840) | 0.97 | % | 6.99 | % | |||||||||||||||||||||||||
| 7. Non-Owner Occupied / Commercial Real Estate | 33,752 | 17,308 | 16,444 | 0.96 | % | 6.96 | % | |||||||||||||||||||||||||
| 8. Multifamily & student housing | 32,747 | 33,998 | (1,251) | 0.94 | % | 6.75 | % | |||||||||||||||||||||||||
| 9. Hospitality | 32,328 | 33,587 | (1,259) | 0.92 | % | 6.66 | % | |||||||||||||||||||||||||
| 10. Multifamily / Commercial Real Estate | 32,000 | 24,000 | 8,000 | 0.91 | % | 6.60 | % | |||||||||||||||||||||||||
| Top Ten (10) Relationships | 636,675 | 628,284 | 8,391 | 18.16 | % | 131.29 | % | |||||||||||||||||||||||||
| Total Gross Loans | 3,505,910 | 3,148,913 | 356,997 | |||||||||||||||||||||||||||||
| % of Total Gross Loans | 18.16 | % | 19.95 | % | (1.79) | % | ||||||||||||||||||||||||||
| Concentration (25% of RBC) | $ | 121,231 | $ | 120,863 | ||||||||||||||||||||||||||||
Unfunded commitments on lines of credit were $568.7 million at December 31, 2023 as compared to $512.7 million at December 31, 2022. The majority of unused commitments are for construction projects that will be drawn as the construction completes. Total utilization was 53.8% at December 31, 2023 and 50.3% at December 31, 2022. Unfunded commitments on commercial operating lines of credit was 53.7% at December 31, 2023 and 49.7% at December 31, 2022.
Unsecured loans pose higher risk for the Company due to the lack of a well-defined secondary source of repayment. Commercial unsecured loans are reserved for the best quality customers with well-established businesses that operate with low financial and operating leverage. The repayment capacity of the borrower should exceed the policy and guidelines for secured loans. The Company significantly increased the standards for consumer unsecured lending by adjusting upward the required qualifying Fair Isaac Corporation (“FICO”) scores and restricting loan amounts at lower FICO scores.
Deferred costs and fees included in the portfolio balances above were $7.2 million and $8.2 million at December 31, 2023 and December 31, 2022, respectively. Discounts on purchased 1-4 family loans included in the portfolio balances above were $133.4 thousand and $161.2 thousand at December 31, 2023 and December 31, 2022, respectively.
52
CARTER BANKSHARES, INC. AND SUBSIDIARIES
ITEM 7. MANAGEMENT’S DISCUSSION AND ANALYSIS OF FINANCIAL CONDITION AND RESULTS OF OPERATIONS - (continued)
The following tables present the maturity schedule of portfolio loan types at December 31, 2023:
| Maturity | ||||||||||||||||||||||||||||||||
| (Dollars in Thousands) | Within One Year | After One But Within Five Years | After Five But Within 15 Years | After 15 Years | Total | |||||||||||||||||||||||||||
| Fixed interest rates | ||||||||||||||||||||||||||||||||
| Commercial Real Estate | $ | 729 | $ | 423,118 | $ | 169,944 | $ | 9,096 | $ | 602,887 | ||||||||||||||||||||||
| Commercial and Industrial | 28 | 69,343 | 154,602 | 2,941 | 226,914 | |||||||||||||||||||||||||||
| Residential Mortgages | 48 | 18,861 | 69,610 | 22,447 | 110,966 | |||||||||||||||||||||||||||
| Other Consumer | 8 | 29,775 | 4,140 | — | 33,923 | |||||||||||||||||||||||||||
| Construction | 5,299 | 208,150 | 3,030 | — | 216,479 | |||||||||||||||||||||||||||
| Other | — | — | — | — | — | |||||||||||||||||||||||||||
| Portfolio Loans with Fixed Interest Rates | $ | 6,112 | $ | 749,247 | $ | 401,326 | $ | 34,484 | $ | 1,191,169 | ||||||||||||||||||||||
| Variable interest rates | ||||||||||||||||||||||||||||||||
| Commercial Real Estate | $ | — | $ | 87,036 | $ | 711,014 | $ | 269,694 | $ | 1,067,744 | ||||||||||||||||||||||
| Commercial and Industrial | 308 | 23,464 | 18,638 | 2,187 | 44,597 | |||||||||||||||||||||||||||
| Residential Mortgages | 7 | 1,747 | 27,942 | 647,267 | 676,963 | |||||||||||||||||||||||||||
| Other Consumer | — | 354 | — | — | 354 | |||||||||||||||||||||||||||
| Construction | 6,847 | 204,912 | 6,541 | 1,570 | 219,870 | |||||||||||||||||||||||||||
| Other | 301,913 | — | — | 3,300 | 305,213 | |||||||||||||||||||||||||||
| Portfolio Loans with Variable Interest Rates | $ | 309,075 | $ | 317,513 | $ | 764,135 | $ | 924,018 | $ | 2,314,741 | ||||||||||||||||||||||
| Total Portfolio Loans | $ | 315,187 | $ | 1,066,760 | $ | 1,165,461 | $ | 958,502 | $ | 3,505,910 | ||||||||||||||||||||||
Refer to Note 5, Loans and Loans Held-For-Sale, in the Notes to Consolidated Financial Statements in Item 8 of this Annual Report on Form 10-K for additional information related to our loans.
Credit Quality
On a monthly basis, a Criticized Asset Committee meets to review certain watch, special mention and substandard risk rated loans within prescribed policy thresholds. These loans typically represent the highest risk of loss to the Company. Action plans are established and these loans are monitored through regular contact with the borrower and loan officer, review of current financial information and other documentation, review of all loan or potential loan restructures or modifications and the regular re-evaluation of assets held as collateral.
On a quarterly basis, the Credit Risk Committee of the Board meets to review our loan portfolio metrics, approve segment limits, approve the adequacy of ACL, and review the findings from Loan Review identified in the previous quarter. Annually, this same committee approves credit related policy changes and policy enhancements as they become available.
Additional credit risk management practices include continuous reviews of trends in our lending footprint and our lending policies and procedures to support sound underwriting practices, concentrations, delinquencies and annual portfolio stress testing. Our Loan Review department serves as a mechanism to independently monitor credit quality and assess the effectiveness of credit risk management practices to provide oversight of all lending activities. The loan review function has the primary responsibility for assessing commercial credit administration and credit decision functions of consumer and mortgage underwriting, as well as determining the appropriateness of risk ratings for those loans reviewed and providing input to the loan risk rating process. Our policy is to place loans in all categories in nonaccrual status when collection of interest or principal is doubtful, or generally when interest or principal payments are 90 days or more past due based on contractual terms. Consumer unsecured loans and secured loans are evaluated for charge-off after the loan becomes 90 days past due. Loans past due 90 days are automatically transferred to nonaccrual status. Management reserves the right to exercise discretion at the individual loan level. For example, we may elect to transfer a loan to nonaccrual regardless of the delinquency status if we believe the collection in full of both principal and interest to be unlikely. We may also elect to retain a loan that is 90 or more days’ delinquent in accrual status if we believe the loan is well secured and in the process of collection. Unsecured loans are fully charged-off and secured loans are charged-off to the estimated fair value of the collateral less the cost to sell.
53
CARTER BANKSHARES, INC. AND SUBSIDIARIES
ITEM 7. MANAGEMENT’S DISCUSSION AND ANALYSIS OF FINANCIAL CONDITION AND RESULTS OF OPERATIONS - (continued)
The ability of borrowers to repay commercial loans is dependent upon the success of their business and general economic conditions. Due to the greater potential for loss within our commercial portfolio, we monitor the commercial loan portfolio through an internal risk rating system. Loan risk ratings are assigned based upon the creditworthiness of the borrower and are reviewed on an ongoing basis according to our internal policies. Loans rated special mention or substandard have potential or well-defined weaknesses not generally found in high quality, performing loans, and require attention from management to limit loss.
Nonperforming assets consist of nonaccrual loans and OREO. The following table summarizes nonperforming assets for the dates presented:
| (Dollars in Thousands) | December 31, 2023 | December 31, 2022 | Change | |||||||||||||||||
| Nonaccrual Loans | ||||||||||||||||||||
| Commercial Real Estate | $ | 1,324 | $ | 2,304 | $ | (980) | ||||||||||||||
| Commercial and Industrial | 52 | 204 | (152) | |||||||||||||||||
| Residential Mortgages | 3,283 | 3,265 | 18 | |||||||||||||||||
| Other Consumer | 59 | 8 | 51 | |||||||||||||||||
| Construction | 2,904 | 864 | 2,040 | |||||||||||||||||
| Other | 301,913 | — | 301,913 | |||||||||||||||||
| Total Nonperforming Loans | 309,535 | 6,645 | 302,890 | |||||||||||||||||
| Other Real Estate Owned | 2,463 | 8,393 | (5,930) | |||||||||||||||||
| Total Nonperforming Assets | $ | 311,998 | $ | 15,038 | $ | 296,960 | ||||||||||||||
| Nonperforming Loans to Total Portfolio Loans | 8.83 | % | 0.21 | % | ||||||||||||||||
| Nonperforming Assets to Total Portfolio Loans plus Other Real Estate Owned | 8.89 | % | 0.48 | % | ||||||||||||||||
Nonperforming assets increased $297.0 million to $312.0 million at December 31, 2023 compared to December 31, 2022. During the second quarter of 2023, the Company placed commercial loans that resided in the Other segment of the Company’s loan portfolio, relating to the Bank’s largest lending relationship which has an aggregate principal amount of $301.9 million, on nonaccrual status due to loan maturities and failure to pay in full. These nonperforming loans are 97.5% of the Company's total nonperforming loans and 96.8% of the Company's total nonperforming assets.
Based on analyses of the credit relationship and various discounted cash flow valuation techniques utilized in the alternative modeling, which resulted in a valuation allowance with respect to these loans of $54.3 million at December 31, 2023, representing 18.0% of these loans aggregate principal amount. At December 31, 2023, all of the Bank’s loans related to this lending relationship are on nonaccrual status.
The Company believes it is well secured based on the net carrying value of the credit relationship and appropriately reserved for potential losses with respect to all such loans based on information currently available. As the borrowers on these loans operate in the hospitality, agriculture, and energy sectors, this credit relationship is secured by, among other collateral, commercial real estate properties in these sectors including but not limited to top-tier hospitality properties. When evaluating the net carrying value of this credit relationship at December 31, 2023, the Company utilized discounted cash flow valuation techniques to estimate the timing and magnitude of potential recoveries resulting from various collection processes.
The following is an analysis of nonperforming loans by loan portfolio segment for the dates presented, and each segment’s relative contribution to total nonperforming loans:
| December 31, 2023 | December 31, 2022 | |||||||||||||||||||||||||
| (Dollars in Thousands) | Amount | % of NPLs | Amount | % of NPLs | ||||||||||||||||||||||
| Commercial Real Estate | $ | 1,324 | 0.4 | % | $ | 2,304 | 34.7 | % | ||||||||||||||||||
| Commercial and Industrial | 52 | — | % | 204 | 3.1 | % | ||||||||||||||||||||
| Residential Mortgages | 3,283 | 1.1 | % | 3,265 | 49.1 | % | ||||||||||||||||||||
| Other Consumer | 59 | — | % | 8 | 0.1 | % | ||||||||||||||||||||
| Construction | 2,904 | 1.0 | % | 864 | 13.0 | % | ||||||||||||||||||||
| Other | 301,913 | 97.5 | % | — | — | % | ||||||||||||||||||||
| Balance End of Period | $ | 309,535 | 100.0 | % | $ | 6,645 | 100.0 | % | ||||||||||||||||||
54
CARTER BANKSHARES, INC. AND SUBSIDIARIES
ITEM 7. MANAGEMENT’S DISCUSSION AND ANALYSIS OF FINANCIAL CONDITION AND RESULTS OF OPERATIONS - (continued)
The Company has initiated collection processes with respect to such loans and intends to explore all alternatives for repayment. However, we cannot give any assurance as to the timing or amount of future payments or collections on such loans or that we will ultimately collect all amounts contractually due under the terms of such loans. For a discussion of collection proceedings with respect to these loans, see the information contained in Part II, Item 8. Financial Statements and Supplementary Data – Note 18, “Commitments and Contingencies,” under the heading “Legal Proceedings” of this Annual Report on Form 10-K.
Closed retail bank offices have a remaining book value of $2.3 million at December 31, 2023 and $1.1 million at December 31, 2022, and are recorded in OREO on the Company’s balance sheet. During the year ended 2023, the Bank closed three retail banking offices and moved $1.4 million at fair value to OREO. These properties were marketed for sale as of December 31, 2023.
Past Company legacy underwriting standards relied heavily on loan to value and did not necessarily consider the income characteristics of the borrower or the repayment capacity of collateral with respect to speculative land financing. An overreliance on value as a primary repayment source can become compromised during real estate cycles. As a result, management has worked through these legacy credits and has installed a number of underwriting guardrails that consider the global cash flows and repayment capability of borrowers and/or guarantors, the proportion of speculation, transaction limits and introduced sensitivity analysis in order to determine supportable loan amounts. While these guardrails do not insulate the Company from credit cycles, we believe it should reduce the experience of defaults.
Closed-end installment loans, amortizing loans secured by real estate and any other loans with payments scheduled monthly are reported past due when the borrower is in arrears two or more monthly payments. Other multi-payment obligations with payments scheduled other than monthly are reported past due when one scheduled payment is due and unpaid for 30 days or more. We monitor delinquency on a monthly basis, including loans that are at risk for becoming delinquent and early stage delinquencies in order to identify emerging patterns and potential problem loans.
The following table summarizes past due loans for the dates presented:
| (Dollars in Thousands) | December 31, | |||||||||||||
| 2023 | 2022 | |||||||||||||
| Loans 30 to 89 Days Past Due | ||||||||||||||
| Commercial | ||||||||||||||
| Commercial Real Estate | $ | 319 | $ | 104 | ||||||||||
| Commercial and Industrial | 39 | 283 | ||||||||||||
| Total Commercial Loans | 358 | 387 | ||||||||||||
| Consumer | ||||||||||||||
| Residential Mortgages | 1,881 | 445 | ||||||||||||
| Other Consumer | 405 | 541 | ||||||||||||
| Total Consumer Loans | 2,286 | 986 | ||||||||||||
| Construction | 3,388 | 3,464 | ||||||||||||
| Other | — | — | ||||||||||||
| Total Loans 30 to 89 Days Past Due | $ | 6,032 | $ | 4,837 | ||||||||||
Portfolio loans past due 30 to 89 days and still accruing increased $1.2 million to $6.0 million at December 31, 2023 compared to December 31, 2022, primarily in the residential mortgage segment. There were no loans during the year ended December 31, 2023 and December 31, 2022 that were past due more than 90 days and still accruing.
55
CARTER BANKSHARES, INC. AND SUBSIDIARIES
ITEM 7. MANAGEMENT’S DISCUSSION AND ANALYSIS OF FINANCIAL CONDITION AND RESULTS OF OPERATIONS - (continued)
The following tables represent credit exposures by internally assigned risk ratings as of December 31, 2023 and 2022:
| December 31, 2023 | ||||||||||||||||||||||||||||||||||||||||||||
| (Dollars in Thousands) | Commercial Real Estate | Commercial & Industrial | Residential Mortgages | Other Consumer | Construction | Other | Total | |||||||||||||||||||||||||||||||||||||
| Pass | $ | 1,669,029 | $ | 268,622 | $ | 784,090 | $ | 34,202 | $ | 433,321 | $ | 3,300 | $ | 3,192,564 | ||||||||||||||||||||||||||||||
| Special Mention | 278 | 2,837 | 525 | — | 60 | — | 3,700 | |||||||||||||||||||||||||||||||||||||
| Substandard | 1,324 | 52 | 3,314 | 75 | 2,968 | 301,913 | 309,646 | |||||||||||||||||||||||||||||||||||||
| Total Portfolio Loans | $ | 1,670,631 | $ | 271,511 | $ | 787,929 | $ | 34,277 | $ | 436,349 | $ | 305,213 | $ | 3,505,910 | ||||||||||||||||||||||||||||||
| Performing Loans | $ | 1,669,307 | $ | 271,459 | $ | 784,646 | $ | 34,218 | $ | 433,445 | $ | 3,300 | $ | 3,196,375 | ||||||||||||||||||||||||||||||
| Nonaccrual Loans | 1,324 | 52 | 3,283 | 59 | 2,904 | 301,913 | 309,535 | |||||||||||||||||||||||||||||||||||||
| Total Portfolio Loans | $ | 1,670,631 | $ | 271,511 | $ | 787,929 | $ | 34,277 | $ | 436,349 | $ | 305,213 | $ | 3,505,910 | ||||||||||||||||||||||||||||||
| December 31, 2022 | ||||||||||||||||||||||||||||||||||||||||||||
| (Dollars in Thousands) | Commercial Real Estate | Commercial & Industrial | Residential Mortgages | Other Consumer | Construction | Other | Total | |||||||||||||||||||||||||||||||||||||
| Pass | $ | 1,457,340 | $ | 303,893 | $ | 653,044 | $ | 44,495 | $ | 352,516 | $ | 180,745 | $ | 2,992,033 | ||||||||||||||||||||||||||||||
| Special Mention | 10,796 | 2,887 | 983 | — | 69 | — | 14,735 | |||||||||||||||||||||||||||||||||||||
| Substandard | 2,426 | 3,012 | 3,921 | 67 | 968 | 131,751 | 142,145 | |||||||||||||||||||||||||||||||||||||
| Total Portfolio Loans | $ | 1,470,562 | $ | 309,792 | $ | 657,948 | $ | 44,562 | $ | 353,553 | $ | 312,496 | $ | 3,148,913 | ||||||||||||||||||||||||||||||
| Performing Loans | $ | 1,468,258 | $ | 309,588 | $ | 654,683 | $ | 44,554 | $ | 352,689 | $ | 312,496 | $ | 3,142,268 | ||||||||||||||||||||||||||||||
| Nonaccrual Loans | 2,304 | 204 | 3,265 | 8 | 864 | — | 6,645 | |||||||||||||||||||||||||||||||||||||
| Total Portfolio Loans | $ | 1,470,562 | $ | 309,792 | $ | 657,948 | $ | 44,562 | $ | 353,553 | $ | 312,496 | $ | 3,148,913 | ||||||||||||||||||||||||||||||
At December 31, 2023 and December 31, 2022, the Company had no loans that were risk rated as doubtful. Special mention and substandard loans at December 31, 2023 increased $156.5 million to $313.3 million compared to December 31, 2022, with an increase of $167.5 million in substandard and a decrease of $11.0 million in special mention. The increase of $167.5 million in substandard loans is primarily related to the above mentioned $301.9 million nonaccrual lending relationship in the other loan category. The $301.9 million of loans related to the Bank’s largest lending relationship was nonperforming and rated as substandard at December 31, 2023. At December 31, 2022 the largest lending relationship in the other segment loans were all accruing and totaled $309.1 million of which, $177.3 million of those loans were pass-rated and $131.8 million of those loans were substandard-rated. The decrease of $11.0 million in special mention is primarily due to the upgrade of a CRE credit totaling $9.9 million to a pass rating.
Refer to Note 6, Allowance for Credit Losses, in the Notes to Consolidated Financial Statements in Item 8 of this Annual Report on Form 10-K for additional information related to our nonperforming loans and OREO.
Troubled Debt Restructuring Disclosures Prior to Our Adoption of ASU No. 2022-02
Prior to our adoption of ASU No. 2022-02, the Company accounted for Troubled Debt Restructuring (“TDR”) as a loan which, for economic or legal reasons related to a borrower’s financial difficulties, granted a concession to the borrower that we would not otherwise grant. The Company strived to identify borrowers in financial difficulty early and work with them to modify terms and conditions before their loan defaults and/or is transferred to nonaccrual status. Modified terms that might have been considered a TDR generally included extension of maturity dates at a stated interest rate lower than the current market rate for a new loan with similar characteristics, reductions in contractual interest rates or principal deferment. While unusual, there may have been instances of principal forgiveness. Short-term modifications that were considered insignificant were generally not considered a TDR unless there were other concessions granted. On April 1, 2022, the Company adopted ASU 2022-02, which eliminated TDR accounting prospectively for all restructurings occurring on or after January 1, 2022. Refer to Note 1, Summary of Significant Accounting Polices, in the Notes to Consolidated Financial Statements in Item 8 of this Annual Report on Form 10-K for additional information related to ASU No. 2022-02.
Generally, the Company individually evaluates all loans that are nonaccrual or considered a restructured loan, with a commitment equal to $1.0 million or greater and/or based on management’s discretion; for individually evaluated loan reserves.
56
CARTER BANKSHARES, INC. AND SUBSIDIARIES
ITEM 7. MANAGEMENT’S DISCUSSION AND ANALYSIS OF FINANCIAL CONDITION AND RESULTS OF OPERATIONS - (continued)
In addition, the Company may individually evaluate credits that have complex loan structures, even if the commitment is less than $1.0 million. Nonaccrual loans can be returned to accruing status if the ultimate collectability of all contractual amounts due, according to the restructured agreement, is not in doubt and there is a period of a minimum of six months of satisfactory payment performance by the borrower either immediately before or after the restructuring.
Allowance for Credit Losses
The following summarizes our allowance for credit loss experience at December 31 for each of the years presented:
| (Dollars in Thousands) | 2023 | 2022 | 2021 | |||||||||||||||||
| Balance Beginning of Year | $ | 93,852 | $ | 95,939 | $ | 54,074 | ||||||||||||||
| Impact of CECL Adoption | — | — | 61,642 | |||||||||||||||||
| Provision for Credit Losses | 5,500 | 2,419 | 3,350 | |||||||||||||||||
| Charge-offs: | ||||||||||||||||||||
| Commercial Real Estate | — | — | 19,662 | |||||||||||||||||
| Commercial and Industrial | 63 | 3,436 | 374 | |||||||||||||||||
| Residential Mortgages | 203 | 46 | 273 | |||||||||||||||||
| Other Consumer | 2,665 | 1,677 | 2,256 | |||||||||||||||||
| Construction | 42 | — | 1,859 | |||||||||||||||||
| Other | — | — | — | |||||||||||||||||
| Total Charge-offs | 2,973 | 5,159 | 24,424 | |||||||||||||||||
| Recoveries: | ||||||||||||||||||||
| Commercial Real Estate | — | — | 159 | |||||||||||||||||
| Commercial and Industrial | 88 | 1 | 291 | |||||||||||||||||
| Residential Mortgages | 110 | 99 | 168 | |||||||||||||||||
| Other Consumer | 475 | 404 | 586 | |||||||||||||||||
| Construction | — | 149 | 93 | |||||||||||||||||
| Other | — | — | — | |||||||||||||||||
| Total Recoveries | 673 | 653 | 1,297 | |||||||||||||||||
| Total Net Charge-offs | 2,300 | 4,506 | 23,127 | |||||||||||||||||
| Balance End of Year | $ | 97,052 | $ | 93,852 | $ | 95,939 | ||||||||||||||
| Net Charge-offs to Average Portfolio Loans | 0.07% | 0.15% | 0.79% | |||||||||||||||||
| Allowance for Credit Losses to Total Portfolio Loans | 2.77% | 2.98% | 3.41% | |||||||||||||||||
Total net charge-offs decreased to $2.3 million for the year ended December 31, 2023 compared to $4.5 million for the year ended December 31, 2022 primarily in the C&I segment. The largest charge-off in 2022 was $3.4 million on a purchased syndicated C&I loan in the amount of $4.9 million, which was previously reserved for $2.6 million, transferred to held-for-sale in the third quarter of 2022 in the amount of $1.5 million and then sold in the fourth quarter of 2022. The net charge-offs of $23.1 million for the full year 2021 was primarily attributable to the resolution of five problem relationships during 2021, in which the majority of losses were anticipated and previously reserved.
57
CARTER BANKSHARES, INC. AND SUBSIDIARIES
ITEM 7. MANAGEMENT’S DISCUSSION AND ANALYSIS OF FINANCIAL CONDITION AND RESULTS OF OPERATIONS - (continued)
The following is the allocation of the ACL balance by segment as of December 31 for the years presented below:
| 2023 | 2022 | |||||||||||||||||||||||||
| (Dollars in Thousands) | Amount | % of Loans in each Category to Total Portfolio Loans | Amount | % of Loans in each Category to Total Portfolio Loans | ||||||||||||||||||||||
| Commercial Real Estate | $ | 19,873 | 47.7 | % | $ | 17,992 | 46.7 | % | ||||||||||||||||||
| Commercial & Industrial | 3,286 | 7.7 | % | 3,980 | 9.9 | % | ||||||||||||||||||||
| Residential Mortgages | 10,879 | 22.5 | % | 8,891 | 20.9 | % | ||||||||||||||||||||
| Other Consumer | 868 | 1.0 | % | 1,329 | 1.4 | % | ||||||||||||||||||||
| Construction | 7,792 | 12.4 | % | 6,942 | 11.2 | % | ||||||||||||||||||||
| Other | 54,354 | 8.7 | % | 54,718 | 9.9 | % | ||||||||||||||||||||
| Balance End of Year | $ | 97,052 | 100.0 | % | $ | 93,852 | 100.0 | % | ||||||||||||||||||
The increase in the ACL was primarily due to increases in the CRE, residential mortgage and construction segments as a result of loan growth in these segments during 2023. The ACL was $97.1 million, or 2.77%, of total portfolio loans at December 31, 2023 compared to $93.9 million, or 2.98% of total portfolio loans at December 31, 2022.
The following table summarizes the credit quality ratios and their components as of December 31 for the years presented below:
| (Dollars in Thousands) | 2023 | 2022 | ||||||||||||
| Allowance for Credit Losses to Total Portfolio Loans | ||||||||||||||
| Allowance for Credit Losses | $ | 97,052 | $ | 93,852 | ||||||||||
| Total Portfolio Loans | 3,505,910 | 3,148,913 | ||||||||||||
| Allowance for Credit Losses to Total Portfolio Loans | 2.77 | % | 2.98 | % | ||||||||||
| Nonperforming Loans to Total Portfolio Loans | ||||||||||||||
| Nonperforming Loans | $ | 309,535 | $ | 6,645 | ||||||||||
| Total Portfolio Loans | 3,505,910 | 3,148,913 | ||||||||||||
| Nonperforming Loans to Total Portfolio Loans | 8.83 | % | 0.21 | % | ||||||||||
| Allowance for Credit Losses to Nonperforming Loans | ||||||||||||||
| Allowance for Credit Losses | $ | 97,052 | $ | 93,852 | ||||||||||
| Nonperforming Loans | 309,535 | 6,645 | ||||||||||||
| Allowance for Credit Losses to Nonperforming Loans | 31.35 | % | 1,412.37 | % | ||||||||||
| Net Charge-offs to Average Portfolio Loans | ||||||||||||||
| Net Charge-offs | $ | 2,300 | $ | 4,506 | ||||||||||
| Average Total Portfolio Loans | 3,324,757 | 2,988,785 | ||||||||||||
| Net Charge-offs to Average Portfolio Loans | 0.07 | % | 0.15 | % | ||||||||||
The provision for credit losses, which includes a provision for losses on loans and on unfunded commitments, is a charge to earnings to maintain the ACL at a level consistent with management's assessment of expected losses in the loan portfolio at the balance sheet date. The provision for credit losses increased $3.1 million to $5.5 million for the year ended 2023 compared to the same period in 2022. The increase in the provision for credit losses was primarily driven by loan growth, net charge-offs and an increase in the other segment reserve related to the large NPL relationship.
The provision for unfunded commitments increased $0.4 million to $0.9 million for the year ended 2023 when compared to a provision of $0.5 million for the year ended 2022. The increase was primarily due to an increase in construction commitments. The reserve for unfunded commitments is largely comprised of unfunded commitments related to real estate construction loans and pressure on the reserve rates. There are three basic factors that influence the reserve rates associated with unfunded commitments for real estate construction loans. First, the reserve rate is extrapolated from the reserve rates calculated for certain commercial real estate funded loans within the ACL model. These reserve rates are influenced by the same factors cited in the ACL model such as economic forecasts, average portfolio life, etc. Refer to Note 1, Summary of Significant Accounting Policies, in the Notes to Consolidated Financial Statements in Item 8 of this Annual Report on Form 10-K for additional
58
CARTER BANKSHARES, INC. AND SUBSIDIARIES
ITEM 7. MANAGEMENT’S DISCUSSION AND ANALYSIS OF FINANCIAL CONDITION AND RESULTS OF OPERATIONS - (continued)
information related to the ACL Policy and the discussion of these factors. Second, since the category of construction is generic, management applies a weighting of the reserve rates associated with certain CRE loans. The proportion of these segments affect the weighting. Third, volume changes impact the total reserve calculation.
As a percentage of average portfolio loans net charge-offs were 0.07% for the year ended 2023 and 0.15% for the same period in 2022. At December 31, 2023 NPLs increased $302.9 million at December 31, 2023 since December 31, 2022. NPLs as a percentage of total portfolio loans were 8.83% and 0.21% as of December 31, 2023 and December 31, 2022, respectively.
Refer to Note 6, Allowance for Credit Losses, in the Notes to Consolidated Financial Statements in Item 8 of this Annual Report on Form 10-K for additional information related to our ACL.
Deposits
The daily average balance of deposits and rates paid on deposits are summarized in the following table for the years ended December 31:
| 2023 | 2022 | |||||||||||||||||||||||||
| (Dollars in Thousands) | Average Balance | Rate | Average Balance | Rate | ||||||||||||||||||||||
| Noninterest-Bearing Demand | $ | 680,889 | — | $ | 716,645 | — | ||||||||||||||||||||
| Interest-Bearing Demand | 483,048 | 0.56 | % | 489,298 | 0.32 | % | ||||||||||||||||||||
| Money Market | 448,324 | 1.98 | % | 521,269 | 0.35 | % | ||||||||||||||||||||
| Savings | 544,938 | 0.11 | % | 720,682 | 0.10 | % | ||||||||||||||||||||
| Certificate of Deposits | 1,428,646 | 2.83 | % | 1,271,548 | 1.14 | % | ||||||||||||||||||||
| Total Interest-Bearing Deposits | 2,904,956 | 1.81 | % | 3,002,797 | 0.62 | % | ||||||||||||||||||||
| Total Average Deposits | $ | 3,585,845 | 1.47 | % | $ | 3,719,442 | 0.50 | % | ||||||||||||||||||
For the year ended December 31, 2023, total average deposits declined $133.6 million, which included decreases in average savings accounts of $175.7 million, or 24.4%, a decrease in money market accounts of $72.9 million, or 14.0%, a decline in average noninterest-bearing demand deposits of $35.8 million and a decrease in average interest-bearing deposits of $6.3 million, or 1.3% offset by an average increase in CDs of $157.1 million, or 12.4%. The decrease in average deposits was primarily due to the banking industry disruption in March 2023 and inflationary pressures on customers. Additionally, customers preferences have shifted to higher-yielding deposit products as interest rates increased.
The following table presents additional information about our year-end deposits:
| (Dollars in Thousands) | 2023 | 2022 | ||||||||||||
| Deposits from the Certificate of Deposit Account Registry Services ("CDARS") | $ | — | $ | 922 | ||||||||||
| Noninterest-Bearing Public Funds Deposits | 51,506 | 27,086 | ||||||||||||
| Interest-Bearing Public Funds Deposits | 127,100 | 180,243 | ||||||||||||
Total Deposits not Covered by Deposit Insurance(1) | 647,154 | 691,266 | ||||||||||||
| Certificates of Deposits not Covered by Deposit Insurance | 304,968 | 159,030 | ||||||||||||
| Deposits for Certain Directors, Executive Officers and their Affiliates | 1,799 | 2,910 | ||||||||||||
(1) These deposits are presented on an estimated basis. This estimate was determined based on the same methodologies and assumptions used for regulatory reporting requirements.
59
CARTER BANKSHARES, INC. AND SUBSIDIARIES
ITEM 7. MANAGEMENT’S DISCUSSION AND ANALYSIS OF FINANCIAL CONDITION AND RESULTS OF OPERATIONS - (continued)
Maturities of CDs over $250,000 or more, excluding brokered deposits, not covered by deposit insurance at December 31, 2023 are summarized as follows:
| (Dollars in Thousands) | Amount | Percent | ||||||||||||
| Three Months or Less | $ | 94,424 | 31.0 | % | ||||||||||
| Over Three Months Through Twelve Months | 109,217 | 35.8 | % | |||||||||||
| Over Twelve Months Through Three Years | 80,122 | 26.3 | % | |||||||||||
| Over Three Years | 21,205 | 6.9 | % | |||||||||||
| Total | $ | 304,968 | 100.0 | % | ||||||||||
Refer to Note 12, Deposits, in the Notes to Consolidated Financial Statements in Item 8 of this Annual Report on Form 10-K for additional information related to our deposits.
Federal Home Loan Bank (“FHLB”) Borrowings and Federal Funds Purchased
Information pertaining to FHLB borrowings and federal funds purchased at December 31 is summarized in the table below:
| (Dollars in Thousands) | 2023 | 2022 | 2021 | |||||||||||||||||
| Balance at Period End | ||||||||||||||||||||
| Federal Home Loan Bank Borrowings | $ | 393,400 | $ | 180,550 | $ | 7,000 | ||||||||||||||
| Federal Funds Purchased | — | 17,870 | — | |||||||||||||||||
| Average Balance during the Period | ||||||||||||||||||||
| Federal Home Loan Bank Borrowings | $ | 402,675 | $ | 29,849 | $ | 25,986 | ||||||||||||||
| Federal Funds Purchased | 7,023 | 5,711 | — | |||||||||||||||||
| Average Interest Rate during the Period | ||||||||||||||||||||
| Federal Home Loan Bank Borrowings | 5.17 | % | 3.90 | % | 1.20 | % | ||||||||||||||
| Federal Funds Purchased | 5.24 | % | 3.29 | % | — | % | ||||||||||||||
| Maximum Month-end Balance during the Period | ||||||||||||||||||||
| Federal Home Loan Bank Borrowings | $ | 525,135 | $ | 180,550 | $ | 35,000 | ||||||||||||||
| Federal Funds Purchased | 46,965 | 23,020 | — | |||||||||||||||||
| Average Interest Rate at Period End | ||||||||||||||||||||
| Federal Home Loan Bank Borrowings | 5.20 | % | 4.48 | % | 1.61 | % | ||||||||||||||
| Federal Funds Purchased | — | % | 4.65 | % | — | % | ||||||||||||||
The Company had $393.4 million of FHLB borrowings at December 31, 2023 an increase of $212.9 million compared to December 31, 2022. The Company had no overnight federal funds purchased at December 31, 2023 and had $17.9 million outstanding overnight federal funds purchased at December 31, 2022. The level and composition of borrowed funds fluctuates over time based on many factors including market conditions, loan growth, investment securities, deposit growth and capital considerations. We manage our borrowed funds to provide a reliable source of liquidity.
The Company held FHLB of Atlanta stock of $21.6 million and $9.7 million at December 31, 2023 and December 31, 2022, respectively. Dividends recorded on this restricted stock were $1.5 million and $0.2 million for the years ended December 31, 2023 and December 31, 2022, respectively. The investment is carried at cost and evaluated for impairment based on the ultimate recoverability of the par value. We hold FHLB stock because we are a member of the FHLB of Atlanta. The FHLB requires members to purchase and hold a specified level of FHLB stock based upon the members’ asset values, level of borrowings and participation in other programs offered. Stock in the FHLB is non-marketable and is redeemable at the discretion of the FHLB. Members do not purchase stock in the FHLB for the same reasons that traditional equity investors acquire stock in an investor-owned enterprise. Rather, members purchase stock to obtain access to the products and services offered by the FHLB. Unlike equity securities of traditional for-profit enterprises, the stock of the FHLB does not provide its holders with an opportunity for capital appreciation because, by regulation, FHLB stock can only be purchased, redeemed and transferred at par value.
Refer to Note 13, Federal Home Loan Bank Borrowings and Federal Funds Purchased, in the Notes to Consolidated Financial Statements in Item 8 of this Annual Report on Form 10-K for additional information related to our borrowings.
60
CARTER BANKSHARES, INC. AND SUBSIDIARIES
ITEM 7. MANAGEMENT’S DISCUSSION AND ANALYSIS OF FINANCIAL CONDITION AND RESULTS OF OPERATIONS - (continued)
Capital Resources
The following table summarizes ratios for the Company and Bank for December 31:
| 2023 | 2022 | |||||||||||||
| Leverage Ratio | ||||||||||||||
| Carter Bankshares, Inc. | 9.48 | % | 10.29 | % | ||||||||||
| Carter Bank and Trust | 9.41 | % | 10.13 | % | ||||||||||
| Common Equity Tier 1 | ||||||||||||||
| Carter Bankshares, Inc. | 11.08 | % | 12.61 | % | ||||||||||
| Carter Bank and Trust | 10.99 | % | 12.42 | % | ||||||||||
| Tier 1 Ratio | ||||||||||||||
| Carter Bankshares, Inc. | 11.08 | % | 12.61 | % | ||||||||||
| Carter Bank and Trust | 10.99 | % | 12.42 | % | ||||||||||
| Total Risk-Based Capital Ratio | ||||||||||||||
| Carter Bankshares, Inc. | 12.34 | % | 13.86 | % | ||||||||||
| Carter Bank and Trust | 12.25 | % | 13.68 | % | ||||||||||
Total capital of $351.2 million at December 31, 2023, reflects an increase of $22.6 million compared to $328.6 million at December 31, 2022. The increase in total capital from December 31, 2022 is primarily due to net income of $23.4 million for the year ended December 31, 2023, other comprehensive income of $14.2 million increased due to changes in fair value of investment securities, an increase of $1.5 million related to restricted stock activity during the year, as well as, the transitional adjustment of $0.1 million, net of tax for the adoption of ASU 2023-02. Offsetting these increases was a decrease of $16.6 million related to the repurchase of common stock and the 1% excise tax on stock repurchases.
The Company and the Bank are subject to various capital requirements administered by the federal banking regulators. Failure to meet the minimum capital requirements can initiate certain mandatory and possibly additional discretionary actions by regulators that, if undertaken, could have a direct material effect on our financial statements. Under capital adequacy guidelines and the regulatory framework for prompt corrective action, we must meet specific capital guidelines that involve quantitative measures of assets, liabilities and certain off-balance sheet items as calculated under regulatory accounting practices. The capital amounts and classifications are also subject to qualitative judgments by the regulators about components, risk weightings and other factors. Prompt corrective action provisions are not applicable to bank holding companies. Quantitative measures established by regulations to ensure capital adequacy require us to maintain minimum amounts and ratios.
Prompt corrective action regulations provide five classifications: well capitalized, adequately capitalized, undercapitalized, significantly undercapitalized, and critically undercapitalized, although these terms are not used to represent overall financial condition. If adequately capitalized, regulatory approval is required to accept brokered deposits. If undercapitalized, capital distributions are limited, as is asset growth and expansion, and capital restoration plans are required. At December 31, 2023 and December 31, 2022, the most recent regulatory notifications categorized the Bank as well-capitalized under the regulatory framework for prompt corrective action. There are no conditions or events since that notification that management believes have changed the institution’s category.
The Company continues to maintain its capital position with a leverage ratio of 9.48% as compared to the regulatory guideline of 5.00% to be well-capitalized and a risk-based Common Equity Tier 1 ratio of 11.08% compared to the regulatory guideline of 6.50% to be well-capitalized. Our risk-based Tier 1 and Total Capital ratios were 11.08% and 12.34%, respectively, which places the Company above the federal bank regulatory agencies’ well-capitalized guidelines of 8.00% and 10.00%, respectively. We believe that we have the ability to raise additional capital, if necessary.
The Basel rules also permit banking organizations with less than $15.0 billion in assets to retain, through a one-time election, existing treatment for accumulated other comprehensive income, which currently does not affect regulatory capital. The Company elected to retain this treatment which reduces the volatility of regulatory capital levels.
The Basel III Capital Rules require the Company and the Bank to maintain minimum Common Equity Tier 1, Tier 1 and Total Capital ratios, along with a capital conservation buffer, effectively resulting in new minimum capital ratios. The capital conservation buffer is designed to absorb losses during periods of economic stress. Banking institutions with a ratio of Common
61
CARTER BANKSHARES, INC. AND SUBSIDIARIES
ITEM 7. MANAGEMENT’S DISCUSSION AND ANALYSIS OF FINANCIAL CONDITION AND RESULTS OF OPERATIONS - (continued)
Equity Tier 1 capital to risk-weighted assets above the minimum but below the conservation buffer (or below the combined capital conservation buffer and countercyclical capital buffer, when the latter is applied) will face constraints on dividends, equity repurchases and compensation based on the amount of the shortfall. The Basel III Capital Rules also provide for a “countercyclical capital buffer” that is applicable to only certain covered institutions and does not have any current applicability to the Company or the Bank.
In December 2018, the Office of the Comptroller of the Currency, (the “OCC”), the FRB, and the FDIC, approved a final rule to address changes to credit loss accounting under GAAP, including banking organizations’ implementation of CECL. The final rule provides banking organizations the option to phase in over a three-year period the Day 1 adverse effects on regulatory capital that may result from the adoption of the new accounting standard. On March 27, 2020, the regulators issued interim final rule (“IFR”), “Regulatory Capital Rule: Revised Transition of the Current Expected Credit Losses Methodology for Allowances” in response to the disrupted economic activity from the spread of COVID-19. The IFR maintains the three-year transition option in the previous rule and provides banks the option to delay for two years an estimate of CECL’s effect on regulatory capital, relative to the incurred loss methodology’s effect on regulatory capital, followed by a three-year transition period (five-year transition option). We adopted CECL effective January 1, 2021 and elected to implement the capital transition relief over the permissible three-year period.
Refer to Note 21, Capital Adequacy, in the Notes to Consolidated Financial Statements in Item 8 of this Annual Report on Form 10-K for additional information related to our capital.
Contractual Obligations
In the normal course of business, we have entered into contractual obligations that represent future cash commitments and liabilities under agreements with third parties and exclude contingent contractual liabilities for which we cannot reasonably predict future payments. The Company has various financial obligations, including contractual obligations and commitments that may require future cash payments. Refer to the accompanying Notes to Consolidated Financial Statements in Item 8 of this Annual Report on Form 10-K for the expected timing of such payments as of December 31, 2023. These include payments related to (i) operating and finance leases referenced in Note 8, Right-of-Use (“ROU”) Assets and Lease Liabilities, (ii) time deposits with stated maturity dates in Note 12 – Deposits, (iii) Federal Home Loan Borrowings in Note 13, Federal Home Loan Bank Borrowings and Federal Funds Purchased, and (iv) commitments to extend credit, standby letters of credit and purchase obligations in Note 18, Commitments and Contingencies in Item 8 of this Annual Report on Form 10-K. Purchase obligations primarily represent obligations under agreement with our third-party data processing provider.
Off-Balance Sheet Arrangements
In the normal course of business, the Company offers our customers lines of credit and letters of credit to meet their financing objectives. The undrawn or unfunded portion of these facilities do not represent outstanding balances and therefore are not reflected in our financial statements as loans receivable. The Company provides lines of credit to our clients to memorialize the commitment to finance the completion of construction projects and revolving lines of credit to operating companies to finance their working capital needs. Lines of credit for construction projects represent $452.2 million, or 64.4% and $373.2 million, or 59.2% of the commitments to extend credit identified in the table below at December 31, 2023 and December 31, 2022, respectively. The Company provides letters of credit, generally, for the benefit or our customers to provide assurance to various municipalities that construction projects will be completed according to approved plans and specifications. These instruments involve elements of credit and interest rate risk and our exposure to credit loss, in the event the customer does not satisfy the terms of the agreement, could be equal to the contractual amount of the obligation less the value of any collateral. The Company analyzes this risk and calculates a reserve for unfunded commitments. The same credit policies are applied in granting these facilities as those used for underwriting loans. Lines of credit to finance construction projects include a construction end date, at which time the loan is expected to convert to a mini-perm loan. A department independent of our lending group monitors construction commitments of $1.0 million or greater and/or based on management’s discretion.. Lines of credit to operating companies to finance working capital include a maturity date and may include various financial covenants. Letters of credit include an expiration date unless it is a standby letter of credit which automatically renews but generally provide for a termination clause on an annual basis given sufficient notice to the beneficiary. The Company typically
62
CARTER BANKSHARES, INC. AND SUBSIDIARIES
ITEM 7. MANAGEMENT’S DISCUSSION AND ANALYSIS OF FINANCIAL CONDITION AND RESULTS OF OPERATIONS - (continued)
charges an annual fee for the issuance of letters of credit. Because letters of credit are expected to expire without being drawn upon, these commitments do not necessarily represent future cash requirements of the Company.
The following table sets forth the commitments and letters of credit as of December 31:
| (Dollars in Thousands) | 2023 | 2022 | ||||||||||||
| Commitments to Extend Credit | $ | 702,301 | $ | 630,619 | ||||||||||
| Standby Letters of Credit | 19,643 | 25,739 | ||||||||||||
| Total | $ | 721,944 | $ | 656,358 | ||||||||||
Estimates of the fair value of these off-balance sheet items were not made because of the short-term nature of these arrangements and the credit standing of the counterparties.
For more details, see Note 18, Commitments and Contingencies, in Item 8 of this Annual Report on Form 10-K.
Liquidity
Liquidity is defined as a financial institution’s ability to meet its cash and collateral obligations at a reasonable cost. This includes the ability to satisfy the financial needs of depositors who want to withdraw funds or borrowers needing to access funds to meet their credit needs. In order to manage liquidity risk the Company’s Board has delegated authority to ALCO for formulation, implementation and oversight of liquidity risk management for the Company. The ALCO’s goal is to maintain adequate levels of liquidity at a reasonable cost to meet funding needs in both a normal operating environment and for potential liquidity stress events. The ALCO closely monitors and manages liquidity by reviewing cash flow projections, performing balance sheet stress tests and by maintaining a detailed contingency funding plan that includes specific liquidity measures that are reviewed by the ALCO monthly. Our liquidity policy and contingency funding plan provide graduated risk tolerance levels for multiple liquidity measures and potential liquidity environments. If our liquidity position moves to a level that has been defined as high risk, specific actions are required, such as increased monitoring or the development of an action plan to reduce the risk position.
The Company’s primary funding and liquidity source is a stable customer deposit base. Management believes that we have the ability to retain existing deposits and attract new deposits, mitigating any potential funding dependency on other more volatile sources. Although deposits are the primary source of funds, the Company has identified various other funding sources that can be used as part of our normal funding program when either a structure or cost efficiency has been identified. Additional funding sources accessible to the Company include borrowing availability at the FHLB, equal to 25% of the Company’s assets or approximating $1.1 billion, subject to the amount of eligible collateral pledged, of which the Company is eligible to borrow up to an additional $480.3 million. The Company has unsecured facilities with three other correspondent financial institutions totaling $50.0 million, access to the institutional CD market, and the brokered deposit market. The Company did not have outstanding borrowings on these fed funds lines as of December 31, 2023. In addition to the above funding resources, the Company also has $563.5 million of unpledged available-for-sale investment securities, at fair value, as an additional source of liquidity. Please refer to the Liquidity Sources table below for available funding with the FHLB and our unsecured lines of credit with correspondent banks.
The Company closely monitors changes in the industry and market conditions that may impact the Company’s liquidity and will use other borrowing means or other liquidity and funding strategies sources to fund its liquidity needs as needed. The Company is also closely tracking the potential impacts on the Company’s liquidity of declines in the fair value of the Company’s securities portfolio due to rising market interest rates and developments in the banking industry that may change the availability of traditional sources of liquidity or market expectations with respect to available sources and amounts of additional liquidity.
An important component of our ability to effectively respond to potential liquidity stress events is maintaining a cushion of highly liquid assets. Highly liquid assets are those that can be converted to cash quickly, with little or no loss in value, to meet financial obligations. ALCO policy guidelines define a ratio of highly liquid assets to total assets by graduated risk tolerance levels of minimal, moderate and high. At December 31, 2023, the Bank had $578.4 million in highly liquid assets, which consisted of Federal Reserve Board excess reserves and interest-bearing deposits in other financial institutions of $14.9 million
63
CARTER BANKSHARES, INC. AND SUBSIDIARIES
ITEM 7. MANAGEMENT’S DISCUSSION AND ANALYSIS OF FINANCIAL CONDITION AND RESULTS OF OPERATIONS - (continued)
and $563.5 million in unpledged securities. This resulted in highly liquid assets to total assets ratio of 12.8% at December 31, 2023.
If an extended recession caused large numbers of our deposit customers to withdraw their funds, we might become more reliant on volatile or more expensive sources of funding.
The following table provides detail of liquidity sources as of December 31:
| (Dollars in Thousands) | 2023 | 2022 | ||||||||||||
| Cash and Due From Banks, including Interest-bearing Deposits | $ | 54,529 | $ | 46,869 | ||||||||||
| Unpledged Investment Securities | 563,537 | 611,845 | ||||||||||||
| Excess Pledged Securities | 61,774 | 46,305 | ||||||||||||
| FHLB Borrowing Availability | 480,266 | 676,746 | ||||||||||||
| Unsecured Lines of Credit Availability | 50,000 | 127,130 | ||||||||||||
| Total Liquidity Sources | $ | 1,210,106 | $ | 1,508,895 | ||||||||||
The following table provides total liquidity sources and ratios as of December 31:
| (Dollars in Thousands) | 2023 | 2022 | ||||||||||||
| Total Liquidity Sources | $ | 1,210,106 | $ | 1,508,895 | ||||||||||
Highly Liquid Assets(1) to Total Assets | 12.8 | % | 14.7 | % | ||||||||||
Highly Liquid Assets(1) to Uninsured Deposits | 89.4 | % | 89.2 | % | ||||||||||
| Total Available Liquidity to Uninsured Deposits | 187.0 | % | 218.3 | % | ||||||||||
(1 Highly liquid assets consist of $14.9 million in Federal Reserve Board excess reserves and interest-bearing deposits in other financial institutions and $563.5 million in unpledged securities.
Inflation
Management is aware of the significant effect inflation has on interest rates and can have on financial performance. The Company’s ability to cope with this is best determined by analyzing its capability to respond to changing interest rates and its ability to manage noninterest income and expense. The mix of interest-rate sensitive assets and liabilities is monitored through ALCO in order to reduce the impact of inflation on net interest income. The effects of inflation are controlled by reviewing the prices of our products and services, by introducing new products and services and by controlling overhead expenses. Unlike most industrial companies, virtually all the assets and liabilities of a financial institution are monetary in nature. As a result, interest rates have a more significant impact on a financial institution’s performance than the effects of general levels of inflation.
Stock Repurchase Plan
On March 29, 2023, the Company announced that its Board of Directors (the “Board”) has authorized, effective May 1, 2023, a common share repurchase program to purchase up to 1,000,000 shares of the Company’s common stock in the aggregate over a period of twelve months, (the “2023 Program”) subject to receipt of non-objection from the Federal Reserve Bank of Richmond, which was received on April 24, 2023. The 2023 Program authorizes the purchase of the Company’s common stock in open market transactions or privately negotiated transactions, including pursuant to a trading plan in accordance with Rule 10b-18 promulgated under the Securities Exchange Act of 1934, as amended. The authorization permits management to repurchase shares of the Company’s common stock from time to time at management’s discretion. The actual means and timing of any shares purchased under the 2023 Program will depend on a variety of factors, including the market price of the Company’s common stock, general market and economic conditions, management’s evaluation of the Company’s financial condition and liquidity position and applicable legal and regulatory requirements. The 2023 Program is authorized through May 1, 2024, although it may be modified or terminated by the Board at any time. The 2023 Program does not obligate the Company to purchase any particular number of shares, and was exhausted as of August 31, 2023. During the year ended December 31,
64
CARTER BANKSHARES, INC. AND SUBSIDIARIES
ITEM 7. MANAGEMENT’S DISCUSSION AND ANALYSIS OF FINANCIAL CONDITION AND RESULTS OF OPERATIONS - (continued)
2023, the 1,000,000 shares of common stock had been repurchased under this program at a total cost of $14.2 million, or an average price of $14.16 per share.
Previously on June 28, 2022, the Company announced that its Board authorized, effective August 1, 2022, a common share repurchase program to purchase up to 750,000 shares of the Company’s common stock in the aggregate over a period of twelve months, subject to non-objection from the Federal Reserve Bank of Richmond, which was received in July 2022 (the “2022 Program”). The 2022 Program authorized the purchase of the Company’s common stock in open market transactions or privately negotiated transactions, including pursuant to a trading plan in accordance with Rule 10b-18 promulgated under the Exchange Act. The authorization permitted management to repurchase shares of the Company’s common stock from time to time at management’s discretion. The 2022 Program was originally authorized through August 1, 2023, did not obligate the Company to purchase any particular number of shares, and was exhausted as of March 10, 2023.
Previously on December 13, 2021, the Company announced that its Board authorized, effective December 10, 2021, a common share repurchase program to purchase up to 2,000,000 shares of the Company’s common stock in the aggregate over a period of twelve months (the “2021 Program”). The 2021 Program was originally authorized through December 9, 2022, did not obligate the Company to purchase any particular number of shares, and was exhausted as of April 28, 2022.
65
CARTER BANKSHARES, INC. AND SUBSIDIARIES
ITEM 7A. QUANTITATIVE AND QUALITATIVE DISCLOSURES ABOUT MARKET RISK
Market Risk
Market risk is defined as the degree to which changes in interest rates, foreign exchange rates, commodity prices, or equity prices can adversely affect a financial institution’s earnings or capital. For financial institutions, market risk arises primarily from interest rate risk inherent in lending, investment, and deposit-taking activities. Interest rate risk can arise from timing differences in the repricing and maturities of interest-earning assets and interest-bearing liabilities (repricing risk), changes in the expected maturities of assets and liabilities arising from embedded options, such as borrowers’ ability to prepay home mortgage loans at any time, depositors’ ability to redeem certificates of deposit before maturity (option risk), changes in the shape of the yield curve, where interest rates increase or decrease in a non-parallel fashion (yield curve risk), and changes in spread relationships between different yield curves, such as U.S. Treasuries and SOFR (basis risk).
Interest rate fluctuations affect earnings by changing net interest income and other interest-sensitive income and expense levels. Interest rate changes affect capital by changing the net present value of a financial institution’s future cash flows, and the cash flows themselves, as rates change. Accepting this risk is a normal part of banking and can be an important source of profitability and enhancement of shareholder value. However, excessive interest rate risk can threaten a financial institution’s earnings, capital, liquidity, and solvency. The Company’s ALCO is responsible for the reviewing the interest rate sensitivity position of the institution, establishing policies to monitor and limit exposure to this type of risk, and employing strategies to ensure our asset-liability structure produces the maximum yield-cost spread available based on current market conditions. The Company’s Investment / Interest Rate Risk Committee, a committee of the Board of Directors, reviews and approves the policies established by ALCO.
Earnings Simulation Modeling
The ALCO uses an asset liability model (“ALM”) to forecast earning simulations that measure the sensitivity of net interest income to changes in interest rates. The ALM calculates an earnings estimate based on current and projected balances and rates. This method is subject to the accuracy of the assumptions that support the ALM process. The ALCO derives the assumptions used in the ALM from historical trends and management’s outlook, including expected loan growth, loan prepayment rates, deposit growth rates, changes to deposit product betas and non-maturity deposit decay rates, and projected yields and rates. The ALM assumes that all maturities, calls, and prepayments in the securities portfolio are reinvested in like instruments. These assumptions may not be realized and unanticipated events and circumstances may also occur that cause the assumptions to be inaccurate. The ALM also does not take into account any future actions management may take to mitigate the impact of unforeseen interest rate changes. A sensitivity analysis for deposit betas, deposit decay rates and loan prepayment speeds is performed at least annually within the ALM to help ALCO better understand the impact of these critical assumptions on the ALM results. The ALCO reviews the assumptions of the ALM at least quarterly and periodically adjusts them when deemed appropriate.
The ALCO also uses different interest rate scenarios and shifts in yield curve shapes to measure the sensitivity of earnings to various interest rate environments. Interest rates on unique asset and liability accounts move differently when the short-term market rate changes. These differences are reflected in the different rate scenarios utilized by the ALM. For earning simulations, our policy guidelines limit the change in net interest income over a 12-month and 24-month horizon using rate shocks of +/- 100, 200, 300, 400 basis points and for non-parallel yield curve shift scenarios. We have temporarily suspended the + 300 and + 400 basis point rate shock analyses. Due to FOMC’s slowing future rate increase projections coupled with the recent increase in the Fed Funds Target Rate of 5.25% since March 17, 2022, we believe the impact to net interest income when evaluating the + 300 and +400 basis point rate shock scenarios do not provide meaningful insight into our interest rate risk position nor does it project a probable interest rate environment for the foreseeable future.
66
CARTER BANKSHARES, INC. AND SUBSIDIARIES
ITEM 7A. QUANTITATIVE AND QUALITATIVE DISCLOSURES ABOUT MARKET RISK
The following tables reflect the earnings simulation results for the periods presented utilizing a forecasted static balance sheet over the next twelve months. All percentage changes presented are within prescribed ranges set by ALCO.
| December 31, 2023 | December 31, 2022 | |||||||||||||
| Change in Interest Rate (basis points) | % Change in Pretax Net Interest Income | % Change in Pretax Net Interest Income | ||||||||||||
| 200 | (1.1)% | 7.7% | ||||||||||||
| 100 | (0.3)% | 4.1% | ||||||||||||
| -100 | 2.4% | (5.1)% | ||||||||||||
| -200 | 4.4% | (10.7)% | ||||||||||||
| -300 | 5.6% | (17.3)% | ||||||||||||
| -400 | 6.7% | (23.5)% | ||||||||||||
The results from the earnings simulation imply that the Company’s balance sheet has shifted from an asset sensitive balance sheet at December 31, 2022 to a slightly liability sensitive balance sheet when at December 31, 2023. The above table indicates that, in a rising interest rate environment, the Company is positioned to have a minimum increase in net interest income for the same asset and liability mix due to the balance sheet composition, related maturity structures, and repricing correlations to market interest rates for assets and liabilities. However, in a declining interest rate environment, we are positioned to have a slightly more advantageous increase in net interest income for the same reasons discussed above.
Based on the ALM results presented above for the quarters ending December 31, 2023 and December 31, 2022, the Company’s balance sheet is slightly liability sensitive at December 31, 2023 versus assets sensitive at December 31, 2022. This migration from asset sensitivity to slightly liability sensitivity is due to 1) lower yielding, floating rate excess cash positions held in federal reserve bank and interest-bearing deposits in other financial institutions, that are more sensitive to future market interest rate changes which were deployed into higher yielding, fixed and variable rate securities and portfolio loans that are less sensitive to future market interest rate changes, 2) the addition of the Company’s largest lending relationship, with an aggregate principal amount of $301.9 million being placed on nonaccrual status as of June 30, 2023, 3) shortening maturities of the time deposit portfolio due to shorter term time deposit promotional campaigns related to the inverted yield curve, and 4) the recent shifts in the shape of the yield curve between the two periods presented above.
Economic Value of Equity Modeling
Economic value of equity simulation is used to calculate the estimated fair value of assets and liabilities over different interest rate environments. The ALM calculates the economic value of equity based on discounted cash flow analysis. The net economic value of equity is the economic value of all assets minus the economic value of all liabilities. The change in net economic value of equity over different rate environments is an indication of the longer-term earnings capability of the balance sheet. The Company uses the same assumptions in the economic value of equity simulation model as in the earnings simulation model. The economic value of equity simulation model uses instantaneous rate shocks to the balance sheet. For economic value of equity simulation, our policy guidelines limit the change in economic value of equity given changes in rates of +/- 100, 200, 300, 400 basis points and for non-parallel yield curve shift scenarios. We have temporarily suspended the + 300 and + 400 basis point rate shock analyses. Due to FOMC’s slowing future rate increase projections coupled with the recent increase in the Fed Funds Target Rate of 5.25% since March 17, 2022, we believe the impact to net interest income when evaluating the + 300 and +400 basis point rate shock scenarios do not provide meaningful insight into our interest rate risk position nor does it project a probable interest rate environment for the foreseeable future.
Results for the economic value of equity modeling are driven primarily by the shape of the underlying yield curves and option-adjusted spreads used to discount the projected cash flows of assets and liabilities, and the assumed life span of the assets and liabilities being discounted.
67
CARTER BANKSHARES, INC. AND SUBSIDIARIES
ITEM 7A. QUANTITATIVE AND QUALITATIVE DISCLOSURES ABOUT MARKET RISK - (continued)
The following tables reflect the economic value of equity analyses results for the periods presented. All percentage changes presented are within prescribed ranges set by management.
| December 31, 2023 | December 31, 2022 | |||||||||||||
| Change in Interest Rate (basis points) | % Change in Economic Value of Equity | % Change in Economic Value of Equity | ||||||||||||
| 200 | (4.7)% | (0.2)% | ||||||||||||
| 100 | (1.8)% | 0.8% | ||||||||||||
| -100 | 0.9% | (3.4)% | ||||||||||||
| -200 | 0.5% | (8.5)% | ||||||||||||
| -300 | (2.7)% | (16.0)% | ||||||||||||
| -400 | (10.9)% | (28.0)% | ||||||||||||
68
CARTER BANKSHARES, INC. AND SUBSIDIARIES
ITEM 8. FINANCIAL STATEMENTS AND SUPPLEMENTARY DATA
Consolidated Financial Statements
69
CARTER BANKSHARES, INC. AND SUBSIDIARIES
ITEM 8. FINANCIAL STATEMENTS AND SUPPLEMENTARY DATA - (continued)
CONSOLIDATED BALANCE SHEETS
| (Dollars in Thousands Except per Share Data) | December 31, 2023 | December 31, 2022 | ||||||||||||
| ASSETS | ||||||||||||||
Cash and Due From Banks, including Interest-Bearing Deposits of $ | $ | $ | ||||||||||||
Securities Available-for-Sale, at Fair Value (amortized cost of $ | ||||||||||||||
| Loans Held-for-Sale | ||||||||||||||
| Portfolio Loans | ||||||||||||||
| Allowance for Credit Losses | ( | ( | ||||||||||||
| Portfolio Loans, net | ||||||||||||||
| Bank Premises and Equipment, net | ||||||||||||||
| Other Real Estate Owned, net | ||||||||||||||
| Federal Home Loan Bank Stock, at Cost | ||||||||||||||
| Bank Owned Life Insurance | ||||||||||||||
| Other Assets | ||||||||||||||
| Total Assets | $ | $ | ||||||||||||
| LIABILITIES | ||||||||||||||
| Deposits: | ||||||||||||||
| Noninterest-Bearing Demand | $ | $ | ||||||||||||
| Interest-Bearing Demand | ||||||||||||||
| Money Market | ||||||||||||||
| Savings | ||||||||||||||
| Certificates of Deposit | ||||||||||||||
| Total Deposits | ||||||||||||||
| Federal Home Loan Bank Borrowings | ||||||||||||||
| Federal Funds Purchased | ||||||||||||||
| Reserve for Unfunded Loan Commitments | ||||||||||||||
| Other Liabilities | ||||||||||||||
| Total Liabilities | ||||||||||||||
| SHAREHOLDERS’ EQUITY | ||||||||||||||
Common Stock, Par Value $ | ||||||||||||||
Outstanding - | ||||||||||||||
| Additional Paid-in Capital | ||||||||||||||
| Retained Earnings | ||||||||||||||
| Accumulated Other Comprehensive Loss | ( | ( | ||||||||||||
| Total Shareholders’ Equity | ||||||||||||||
| Total Liabilities and Shareholders’ Equity | $ | $ | ||||||||||||
See accompanying notes to audited Consolidated Financial Statements.
70
CARTER BANKSHARES, INC. AND SUBSIDIARIES
ITEM 8. FINANCIAL STATEMENTS AND SUPPLEMENTARY DATA - (continued)
CONSOLIDATED STATEMENTS OF INCOME
| Years Ended December 31, | ||||||||||||||||||||
| (Dollars in Thousands Except per Share Data) | 2023 | 2022 | 2021 | |||||||||||||||||
| INTEREST INCOME | ||||||||||||||||||||
| Loans, including fees | ||||||||||||||||||||
| Taxable | $ | $ | $ | |||||||||||||||||
| Non-Taxable | ||||||||||||||||||||
| Investment Securities | ||||||||||||||||||||
| Taxable | ||||||||||||||||||||
| Non-Taxable | ||||||||||||||||||||
| Federal Reserve Bank Excess Reserves | ||||||||||||||||||||
| Interest on Bank Deposits | ||||||||||||||||||||
| Dividend Income | ||||||||||||||||||||
| Total Interest Income | ||||||||||||||||||||
| Interest Expense | ||||||||||||||||||||
| Interest Expense on Deposits | ||||||||||||||||||||
| Interest Expense on Federal Funds Purchased | ||||||||||||||||||||
| Interest on Other Borrowings | ||||||||||||||||||||
| Total Interest Expense | ||||||||||||||||||||
| NET INTEREST INCOME | ||||||||||||||||||||
| Provision for Credit Losses | ||||||||||||||||||||
| Provision (Recovery) for Unfunded Commitments | ( | |||||||||||||||||||
| Net Interest Income After Provision (Recovery) for Credit Losses | ||||||||||||||||||||
| NONINTEREST INCOME | ||||||||||||||||||||
| (Losses) Gains on Sales of Securities, net | ( | |||||||||||||||||||
| Service Charges, Commissions and Fees | ||||||||||||||||||||
| Debit Card Interchange Fees | ||||||||||||||||||||
| Insurance Commissions | ||||||||||||||||||||
| Bank Owned Life Insurance Income | ||||||||||||||||||||
| Gains on Sales and Write-downs of Bank Premises, net | ||||||||||||||||||||
| Commercial Loan Swap Fee Income | ||||||||||||||||||||
| Other | ||||||||||||||||||||
| Total Noninterest Income | ||||||||||||||||||||
| NONINTEREST EXPENSE | ||||||||||||||||||||
| Salaries and Employee Benefits | ||||||||||||||||||||
| Occupancy Expense, net | ||||||||||||||||||||
| FDIC Insurance Expense | ||||||||||||||||||||
| Other Taxes | ||||||||||||||||||||
| Advertising Expense | ||||||||||||||||||||
| Telephone Expense | ||||||||||||||||||||
| Professional and Legal Fees | ||||||||||||||||||||
| Data Processing | ||||||||||||||||||||
| Losses on Sales and Write-downs of Other Real Estate Owned, net | ||||||||||||||||||||
| Debit Card Expense | ||||||||||||||||||||
| Tax Credit Amortization | ||||||||||||||||||||
| Other | ||||||||||||||||||||
| Total Noninterest Expense | ||||||||||||||||||||
| Income Before Income Taxes | ||||||||||||||||||||
| Income Tax Provision | ||||||||||||||||||||
| Net Income | $ | $ | $ | |||||||||||||||||
| Earnings per Common Share: | ||||||||||||||||||||
| Basic Earnings per Common Share | $ | $ | $ | |||||||||||||||||
| Diluted Earnings per Common Share | $ | $ | $ | |||||||||||||||||
| Average Shares Outstanding-Basic | ||||||||||||||||||||
| Average Shares Outstanding-Diluted | ||||||||||||||||||||
See accompanying notes to audited Consolidated Financial Statements.
71
CARTER BANKSHARES, INC. AND SUBSIDIARIES
ITEM 8. FINANCIAL STATEMENTS AND SUPPLEMENTARY DATA - (continued)
CONSOLIDATED STATEMENTS OF COMPREHENSIVE INCOME (LOSS)
| Years Ended December 31, | ||||||||||||||||||||
| (Dollars in Thousands) | 2023 | 2022 | 2021 | |||||||||||||||||
| Net Income | $ | $ | $ | |||||||||||||||||
| Other Comprehensive Income (Loss): | ||||||||||||||||||||
| Net Unrealized Gains (Losses) on Securities Available-for-Sale: | ||||||||||||||||||||
| Net Unrealized Gains (Losses) Arising during the Period | ( | ( | ||||||||||||||||||
| Reclassification Adjustment for Losses (Gains) included in Net Income | ( | ( | ||||||||||||||||||
| Tax Effect | ( | |||||||||||||||||||
| Net Unrealized Gains (Losses) Recognized in Other Comprehensive Income (Loss) | ( | ( | ||||||||||||||||||
| Other Comprehensive Income (Loss): | ( | ( | ||||||||||||||||||
| Comprehensive Income (Loss) | $ | $ | ( | $ | ||||||||||||||||
See accompanying notes to audited Consolidated Financial Statements.
72
CARTER BANKSHARES, INC. AND SUBSIDIARIES
ITEM 8. FINANCIAL STATEMENTS AND SUPPLEMENTARY DATA - (continued)
CONSOLIDATED STATEMENTS OF CHANGES IN SHAREHOLDERS’ EQUITY
| Years Ended December 31, | ||||||||||||||||||||||||||||||||
| (Dollars in Thousands) | Common Stock | Additional Paid-in Capital | Retained Earnings | Accumulated Other Comprehensive Income (Loss) | Total Shareholder's Equity | |||||||||||||||||||||||||||
| Balance at December 31, 2020 | $ | $ | $ | $ | $ | |||||||||||||||||||||||||||
| — | — | ( | — | ( | ||||||||||||||||||||||||||||
| Balance January 1, 2021 | $ | $ | $ | $ | $ | |||||||||||||||||||||||||||
| Net Income | — | — | — | |||||||||||||||||||||||||||||
| Other Comprehensive Loss, Net of Tax | — | — | — | ( | ( | |||||||||||||||||||||||||||
Repurchase of Common Stock ( | ( | ( | — | — | ( | |||||||||||||||||||||||||||
Forfeiture of Restricted Stock ( | ( | — | — | |||||||||||||||||||||||||||||
Issuance of Restricted Stock ( | ( | — | — | |||||||||||||||||||||||||||||
| Recognition of Restricted Stock Compensation Expense | — | — | — | |||||||||||||||||||||||||||||
| Balance December 31, 2021 | $ | $ | $ | $ | $ | |||||||||||||||||||||||||||
| Net Income | — | — | — | |||||||||||||||||||||||||||||
| Other Comprehensive Loss, Net of Tax | — | — | — | ( | ( | |||||||||||||||||||||||||||
Repurchase of Common Stock ( | ( | ( | — | — | ( | |||||||||||||||||||||||||||
Forfeiture of Restricted Stock ( | ( | ( | — | — | ( | |||||||||||||||||||||||||||
Issuance of Restricted Stock ( | ( | — | — | |||||||||||||||||||||||||||||
| Recognition of Restricted Stock Compensation Expense | — | — | — | |||||||||||||||||||||||||||||
| Balance December 31, 2022 | $ | $ | $ | $ | ( | $ | ||||||||||||||||||||||||||
| — | — | — | ||||||||||||||||||||||||||||||
| Balance at January 1, 2023 | ( | |||||||||||||||||||||||||||||||
| Net Income | — | — | — | |||||||||||||||||||||||||||||
| Other Comprehensive Income, Net of Tax | — | — | — | |||||||||||||||||||||||||||||
| 1% Excise Tax on Stock Buybacks | — | ( | — | — | ( | |||||||||||||||||||||||||||
Repurchase of Common Stock ( | ( | ( | — | — | ( | |||||||||||||||||||||||||||
Forfeiture of Restricted Stock ( | ( | ( | — | — | ( | |||||||||||||||||||||||||||
Issuance of Restricted Stock ( | ( | — | — | |||||||||||||||||||||||||||||
| Recognition of Restricted Stock Compensation Expense | — | — | — | |||||||||||||||||||||||||||||
| Balance December 31, 2023 | $ | $ | $ | $ | ( | $ | ||||||||||||||||||||||||||
See accompanying notes to audited Consolidated Financial Statements.
73
CARTER BANKSHARES, INC. AND SUBSIDIARIES
ITEM 8. FINANCIAL STATEMENTS AND SUPPLEMENTARY DATA - (continued)
CONSOLIDATED STATEMENTS OF CASH FLOWS
| Years Ended December 31, | ||||||||||||||||||||
| (Dollars in Thousands) | 2023 | 2022 | 2021 | |||||||||||||||||
| OPERATING ACTIVITIES | ||||||||||||||||||||
| Net Income | $ | $ | $ | |||||||||||||||||
| Adjustments to Reconcile Net Income to Net Cash Provided by Operating Activities | ||||||||||||||||||||
| Provision for Credit Losses, including Provision (Recovery) for Unfunded Commitments | ||||||||||||||||||||
| Origination of Loans Held-for-Sale | ( | ( | ( | |||||||||||||||||
| Proceeds From Loans Held-for-Sale | ||||||||||||||||||||
| Depreciation/Amortization of Bank Premises and Equipment | ||||||||||||||||||||
| Provision for Deferred Taxes | ||||||||||||||||||||
| Net Amortization of Securities | ||||||||||||||||||||
| Tax Credit Amortization | ||||||||||||||||||||
| Gains on Sales of Loans Held-for-Sale | ( | ( | ( | |||||||||||||||||
| Losses (Gains) on Sales of Securities, net | ( | ( | ||||||||||||||||||
| Write-downs of Other Real Estate Owned | ||||||||||||||||||||
| (Gains) Losses on Sales of Other Real Estate Owned, net | ( | ( | ||||||||||||||||||
| Losses (Gains) on Sales and Write-downs of Bank Premises, net | ( | |||||||||||||||||||
| Commercial Loan Swap Derivative Income | ( | ( | ||||||||||||||||||
| Premiums on Branch Sales | ( | |||||||||||||||||||
| Increase in the Value of Life Insurance Contracts | ( | ( | ( | |||||||||||||||||
| Recognition of Restricted Stock Compensation Expense | ||||||||||||||||||||
| (Increase) Decrease in Other Assets | ( | ( | ||||||||||||||||||
| Increase (Decrease) in Other Liabilities | ( | |||||||||||||||||||
| Net Cash Provided By Operating Activities | ||||||||||||||||||||
| INVESTING ACTIVITIES | ||||||||||||||||||||
| Securities Available-for-Sale: | ||||||||||||||||||||
| Proceeds from Sales | ||||||||||||||||||||
| Proceeds from Maturities, Redemptions, and Pay-downs | ||||||||||||||||||||
| Purchases | ( | ( | ( | |||||||||||||||||
| Purchase of Bank Premises and Equipment, Net | ( | ( | ( | |||||||||||||||||
| Proceeds from Sales of Bank Premises and Equipment, net | ||||||||||||||||||||
| Net Cash Paid in Branch Sales | ( | |||||||||||||||||||
| Proceeds from Sale of Portfolio Loans | ||||||||||||||||||||
| (Purchase) Redemption of Federal Home Loan Bank Stock, net | ( | ( | ||||||||||||||||||
| Loan (Originations) and Payments, net | ( | ( | ||||||||||||||||||
| Proceeds from Sales and Payments of Other Real Estate Owned | ||||||||||||||||||||
| Net Cash Used In Investing Activities | ( | ( | ( | |||||||||||||||||
| FINANCING ACTIVITIES | ||||||||||||||||||||
| Net Change in Demand, Money Markets and Savings Accounts | ( | |||||||||||||||||||
| Increase (Decrease) in Certificates of Deposits | ( | ( | ||||||||||||||||||
| Proceeds (Repayments) from Federal Home Loan Bank Borrowings, net | ( | |||||||||||||||||||
| (Repayments) Proceeds from Federal Funds Purchased, net | ( | |||||||||||||||||||
| Repurchase of Common Stock | ( | ( | ( | |||||||||||||||||
| Net Cash Provided By Financing Activities | ||||||||||||||||||||
| Net Increase (Decrease) in Cash and Cash Equivalents | ( | |||||||||||||||||||
| Cash and Cash Equivalents at Beginning of Period | ||||||||||||||||||||
| Cash and Cash Equivalents at End of Period | $ | $ | $ | |||||||||||||||||
See accompanying notes to audited Consolidated Financial Statements.
74
CARTER BANKSHARES, INC. AND SUBSIDIARIES
ITEM 8. FINANCIAL STATEMENTS AND SUPPLEMENTARY DATA - (continued)
CONSOLIDATED STATEMENTS OF CASH FLOWS - (continued)
| Years Ended December 31, | ||||||||||||||||||||
| (Dollars in Thousands) | 2023 | 2022 | 2021 | |||||||||||||||||
| SUPPLEMENTARY DATA | ||||||||||||||||||||
| Cash Interest Paid | $ | $ | $ | |||||||||||||||||
| Cash Paid for Income Taxes | ||||||||||||||||||||
| Transfer from Loans to Other Real Estate Owned | ||||||||||||||||||||
| Transfer from Fixed Assets to Other Real Estate Owned | ||||||||||||||||||||
| Right-of-use Asset Recorded in Exchange for Lease Liabilities | ||||||||||||||||||||
| Stock Repurchase Excise Tax Settled in Subsequent Period | ( | |||||||||||||||||||
| Stock Repurchases Settled in Subsequent Period | ( | |||||||||||||||||||
| Loans Transferred to Held-for-Sale | ||||||||||||||||||||
See accompanying notes to audited Consolidated Financial Statements.
75
NOTE 1 – SUMMARY OF SIGNIFICANT ACCOUNTING POLICIES
Nature of Operations and Principles of Consolidation: Carter Bankshares, Inc. (the “Company”) is a holding company headquartered in Martinsville, Virginia. The Company is the parent company of its wholly owned subsidiary of Carter Bank & Trust (the “Bank”). The holding company is regulated by the Federal Reserve Bank (“FRB”). The Bank is an insured, Virginia state-chartered commercial bank which operates branches in Virginia and North Carolina. The Bank is regulated by the Federal Deposit Insurance Corporation (“FDIC”) and Bureau of Financial Institutions of the Virginia State Corporation Commission. The Bank has one wholly owned subsidiary, CB&T Investment Company (the “Investment Company”).
Our market coverage is primarily in Virginia and North Carolina, including Fredericksburg, Charlottesville, Lynchburg, Roanoke, Christiansburg, Martinsville, Danville, Greensboro, Fayetteville, and Charlotte. The Company provides a full range of financial services with retail and commercial banking products and insurance.
Accounting Policies: Our financial statements have been prepared in accordance with U.S. Generally Accepted Accounting Principles (“GAAP”). In preparing the financial statements, management is required to make estimates and assumptions that affect the reported amounts of assets and liabilities and disclosures of contingent assets and liabilities as of the dates of the balance sheets and revenues and expenses for the periods then ended. Actual results could differ from those estimates. Our significant accounting policies are described below.
Principles of Consolidation: The Consolidated Financial Statements include the accounts of Carter Bankshares, Inc. and its wholly owned subsidiary. The Investment Company is a subsidiary of the Bank. All significant intercompany transactions have been eliminated in consolidation.
Reclassification: Amounts in prior years' financial statements and footnotes are reclassified whenever necessary to conform to the current year’s presentation. Reclassifications had no material effect on prior year net income or shareholders’ equity.
Use of Estimates: To prepare financial statements in conformity with GAAP, management makes estimates and assumptions based on available information. These estimates and assumptions affect the amounts reported in the Consolidated Financial Statements and the disclosures provided, and actual results could differ from those estimates. Information available which could affect these judgments include, but are not limited to, changes in interest rates, changes in the performance of the economy, and changes in the financial condition of borrowers.
Operating Segments: The chief decision-makers of our operating segments monitor the revenue streams of the various products and services, operations are managed and financial performance is evaluated on a Company-wide basis, and operating segments are aggregated into one as operating results for all segments are similar. Accordingly, all of the financial service operations are considered by management to be aggregated in one reportable operating segment.
Cash and Cash Equivalents: The Company considers all cash on hand, amounts due from banks, federal funds sold, and FRB excess reserves as cash equivalents for the purposes of the Consolidated Statements of Cash Flows with all items having original maturities fewer than 90 days. Federal funds are customarily sold for one-day periods. The FRB pays the target fed funds rate on the FRB excess reserves.
Restrictions on Cash: Cash on hand or on deposit with the FRB is required to meet regulatory reserve and clearing requirements.
Loan Commitments and Related Financial Instruments: Financial instruments include off-balance sheet credit instruments, such as commitments to make loans and financial standby and performance letters of credit, issued to meet customer financing needs. The face amount for these items represents the exposure to loss, before considering customer collateral or ability to repay. Such financial instruments are recorded when they are funded.
Comprehensive Income (Loss): Comprehensive income (loss) consists of net income and other comprehensive income (loss). Other comprehensive income (loss) includes unrealized gains (losses) on securities available-for-sale, net of tax.
Securities: The Company classifies securities into either the held-to-maturity or available-for-sale categories at the time of purchase. All securities were classified as available-for-sale at December 31, 2023 and December 31, 2022. Securities classified
76
CARTER BANKSHARES, INC. AND SUBSIDIARIES
NOTES TO CONSOLIDATED FINANCIAL STATEMENTS - (continued)
as available-for-sale include securities which can be sold for liquidity, investment management, or similar reasons even if there is not a present intention of such a sale. Available-for-sale securities are reported at fair value, with unrealized gains (losses), net of tax included in other comprehensive income (loss).
Premium amortization is deducted from, and discount accretion is added to, interest income on securities using the level yield method without anticipating prepayments, except for mortgage-backed securities where prepayments are anticipated. Gains and losses are recognized upon the sale of specific identified securities on the completed trade date.
Management evaluates debt securities for impairment on at least a quarterly basis, and more frequently when economic or market conditions warrant such an evaluation. In determining impairment, management considers many factors, including: (1) the length of time and the extent to which the fair value has been less than cost, (2) the financial condition and near-term prospects of the issuer, (3) whether the market decline was affected by macroeconomic conditions, and (4) whether the Company has the intent to sell the debt security or more likely than not will be required to sell the debt security before its anticipated recovery. The assessment of whether an impairment decline exists involves a high degree of subjectivity and judgment and is based on the information available to management at a point in time.
Loans Held-for-Sale: Loans held-for-sale arise primarily from two sources. First, we purchase mortgage loans on a short-term basis from a partner financial institution that have fully executed sales contracts to end investors. Second, we originate and close mortgages with fully executed contracts with investors to purchase shortly after closing. We then hold these mortgage loans from both sources until funded by the investor, typically a two-week period. Gains and losses on sales of mortgage loans held-for-sale are determined using the specific identification method and are included in other noninterest income in the Consolidated Statements of Net Income.
From time to time, certain loans are transferred from the loan portfolio to loans held-for-sale, which are carried at the lower of cost or fair value. If a loan is transferred from the loan portfolio to the held-for-sale category, any write-down in the carrying amount of the loan at the date of transfer is recorded as a charge-off against the ACL. Subsequent declines in fair value are recognized as a charge to noninterest income. The remaining unamortized fees and costs are recognized as part of the cost basis of the loan at the time it is sold. Gains and losses on sales of loans held-for-sale are included in other noninterest income in the Consolidated Statements of Net Income.
Loans: Loans that management have the intent and ability to hold for the foreseeable future or until maturity or payoff are reported at the principal balance outstanding, net of deferred loan fees and costs, discounts, and an allowance for credit losses. Interest income is accrued on the unpaid principal balance. Loan origination fees, net of certain direct origination costs, are deferred and recognized in interest income using the level-yield method without anticipating prepayments.
An individually evaluated loan analysis is conducted for loans that are either or both nonperforming or a restructured loan with a commitment of $1.0 million or greater and/or based on management’s discretion. Loans, including individually evaluated loans, are generally classified as nonaccrual if they are past due as to maturity or payment of principal or interest for a period of more than 90 days based on contractual terms, unless such loans are well-secured and in the process of collection. If a loan or a portion of a loan is classified as doubtful or is partially charged off, the loan is generally classified as nonaccrual. Loans that are on a current payment status or past due less than 90 days may also be classified as nonaccrual, if repayment in full of principal and/or interest is unlikely. Any interest that is accrued, but not collected is reversed against interest income when a loan is placed on nonaccrual status, which typically occurs prior to charging off all, or a portion, of a loan.
77
CARTER BANKSHARES, INC. AND SUBSIDIARIES
NOTES TO CONSOLIDATED FINANCIAL STATEMENTS - (continued)
While a loan is classified as nonaccrual and the probability of collecting the recorded loan balance is doubtful, collections of interest and principal are generally applied as a reduction to principal outstanding. Payments collected on a nonaccrual loan are first applied to principal, secondly to any existing charge-offs, thirdly to interest, and lastly to any outstanding fees owed to the Company.
Loans may be returned to accrual status when all principal and interest amounts contractually due are reasonably assured of repayment within an acceptable period of time, and there is a period of a minimum of six months of satisfactory payment performance by the borrower in accordance with the contractual terms of interest and principal.
Allowance for Credit Losses: The allowance for credit losses represents management’s estimate of expected credit losses inherent in the loan portfolio, and consists of an allowance for credit losses for pooled loans. Management estimates the allowance for credit losses for pooled loans utilizing a Discounted Cash Flow (“DCF”) method. The ACL related to loans individually evaluated is primarily based on the excess of the loan's current outstanding principal balance compared to the estimated fair value of the related collateral, less cost to sell. For a loan that is not collateral-dependent, the allowance is recorded at the amount by which the outstanding principal balance exceeds the current estimate of the present value of future cash flows on the loan discounted at the loan's original effective interest rate.
Our CECL methodology introduced a modified discounted cash flow methodology based on expected cash flow changes in the future for the Other segment. A significant population of the Other segment was not impaired under the probable incurred loss model and therefore not subject to a collateral dependent specific reserve analysis. For the population of the Other segment that was impaired under the incurred loss model, based on collateral values, the specific reserves totaled zero. The CECL model was developed with subjective assumptions that is driven by the following key factors: prepayment speeds, timing of prepayments, loss given defaults as well as other factors including the discount rate based upon the cost of capital and ultimately the timing of future cash flows.
For more details, see Note 6 - Allowance for Credit Losses, in Item 8 of this Annual Report on Form 10-K.
Allowance for Credit Losses Policy
The Company’s methodology for estimating the ACL includes:
Segmentation. The Company’s loan portfolio is segmented by homogeneous loan types that behave similarly to economic cycles.
Specific Analysis. A specific reserve analysis is applied to certain individually evaluated loans. These loans are evaluated quarterly generally based on collateral value, observable market value or the present value of expected future cash flows. A specific reserve is established if the fair value is less than the loan balance. A charge-off is recognized when the loss is quantifiable and confirmed. Individually evaluated loans not specifically analyzed receive a quantitative and qualitative analysis, as described below.
Quantitative Analysis. The Company elected to use Discounted Cash Flow (“DCF”). Economic forecasts include but are not limited to unemployment, the Consumer Price Index, the Housing Price Index and Gross Domestic Product. These forecasts are assumed to revert to the long-term average and are utilized in the model to estimate the probability of default and loss given default through regression. Model assumptions include, but are not limited to the discount rate, prepayments and curtailments. The product of the probability of default and the loss given default is the estimated loss rate, which varies over time. The estimated loss rate is applied within the appropriate periods in the cash flow model to determine the net present value. Net present value is also impacted by assumptions related to the duration between default and recovery. The reserve is based on the difference between the summation of the principal balances taking amortized costs into consideration and the summation of the net present values.
Qualitative Analysis. Based on management’s review and analysis of internal, external and model risks, management may adjust the model output. Management reviews the peaks and troughs of the model’s calibration, taking into account economic forecasts to develop guardrails that serve as the basis for determining the reasonableness of the model’s output and makes adjustments as necessary. This process challenges unexpected variability resulting from outputs beyond the model’s calibration that appear to be unreasonable. Additionally, management may adjust the economic forecast if it is incompatible with known market conditions based on management’s experience and perspective.
78
CARTER BANKSHARES, INC. AND SUBSIDIARIES
NOTES TO CONSOLIDATED FINANCIAL STATEMENTS - (continued)
“Other” Segmented Pool
CECL provides for the flexibility to model loans differently compared to the prior model. With the adoption of CECL management elected to evaluate certain loans based on shared but unique risk attributes. The loans included in the Other segment of the model were underwritten and approved based on standards that are inconsistent with our current underwriting standards. The model for the Other segment was developed with subjective assumptions that may cause volatility driven by the following key factors: prepayment speeds, timing of contractual payments, discount rate, as well as other factors. The discount rate is reflective of the inherent risk in the Other segment. A substantial change in these assumptions could cause a significant impact to the model causing volatility. Management reviews the model output for appropriateness and subjectively makes adjustments as needed. The analysis applied to this pool resulted in an allowance of $51.3 million at adoption on January 1, 2021 and is disclosed in the Other segment line item.
Our charge-off policy for loans requires that loans and other obligations that are not collectible be promptly charged-off when the loss becomes probable, regardless of the delinquency status of the loan. The Company may elect to recognize a partial charge-off when management has determined that the value of collateral is less than the remaining investment in the loan. A loan or obligation does not need to be charged-off, regardless of delinquency status, if (i) management has determined there exists sufficient collateral to protect the remaining loan balance and (ii) there exists a strategy to liquidate the collateral. Management may also consider a number of other factors to determine when a charge-off is appropriate. These factors may include, but are not limited to:
•The status of a bankruptcy proceeding
•The value of collateral and probability of successful liquidation; and/or
•The status of adverse proceedings or litigation that may result in collection
Consumer unsecured loans and secured loans are evaluated for charge-off after the loan becomes 90 days past due. Unsecured loans are fully charged-off and secured loans are charged-off to the estimated fair value of the collateral less the cost to sell.
Closed-end installment loans, amortizing loans secured by real estate and any other loans with payments scheduled monthly are reported past due when the borrower is in arrears two or more monthly payments. Other multi-payment obligations with payments scheduled other than monthly are reported past due when one scheduled payment is due and unpaid for 30 days or more. We monitor delinquency on a monthly basis, including early stage delinquencies of 30 to 89 days past due for early identification of potential problem loans.
Refer to the “Credit Quality” and the “Allowance for Credit Losses” sections in the MD&A and Note 6, Allowance for Credit Losses, in the Notes to Consolidated Financial Statements of this Annual Report on Form 10-K for more details.
Concentration of Credit Risk: The majority of the Company's loans, commitments and lines of credit have been granted to customers in the Company's market area. The concentrations of credit by loan classification are set forth in Note 5.
Bank Owned Life Insurance: The Company has purchased life insurance policies on certain executive officers and associates. We receive the cash surrender value of each policy upon its termination or benefits are payable to us upon the death of the insured. Changes in net cash surrender value are recognized in noninterest income in the Consolidated Statements of Income.
79
CARTER BANKSHARES, INC. AND SUBSIDIARIES
NOTES TO CONSOLIDATED FINANCIAL STATEMENTS - (continued)
| Land and Land Improvements | Non-depreciating assets | |||||||||||||
| Buildings | - | |||||||||||||
| Furniture and Fixtures | ||||||||||||||
| Computer Equipment and Software | ||||||||||||||
| Other Equipment | ||||||||||||||
| Vehicles | ||||||||||||||
| Leasehold Improvements | Lesser of estimated useful life of the asset (generally | |||||||||||||
Federal Home Loan Bank (“FHLB”) Stock: The Company is a member of the FHLB. Members are required to own a certain amount of stock based on the level of borrowings and other factors such as asset base. FHLB stock is carried at cost, classified as a restricted security, and periodically evaluated for impairment based on ultimate recovery of par value. Cash dividends are reported as dividend income in the Consolidated Statements of Income.
Income Taxes: Income tax expense is the total of the current year income tax due or refundable and the change in deferred tax assets and liabilities. Deferred taxes are provided on a liability method whereby deferred tax assets are recognized for
80
CARTER BANKSHARES, INC. AND SUBSIDIARIES
NOTES TO CONSOLIDATED FINANCIAL STATEMENTS - (continued)
deductible temporary differences, operating losses, and tax credit carryforwards. Deferred tax liabilities are recognized for taxable temporary differences. Temporary differences are the differences between the reported amounts of assets and liabilities and their tax basis. Deferred tax assets are reduced by a valuation allowance when, in the opinion of management, it is more likely than not that some portion or all of the deferred tax assets will not be realized. Deferred tax assets and liabilities are adjusted for the effects of changes in tax laws and rates on the date of enactment.
When tax returns are filed, it is highly certain that some positions taken would be sustained upon examination by the taxing authorities, while others are subject to uncertainty about the merits of the position taken or the amount of the position that would be ultimately sustained. The benefit of a tax position is recognized in the financial statements in the period during which, based on all available evidence, management believes it is more likely than not that the position will be sustained upon examination, including the resolution of appeals or litigation processes, if any. Tax positions taken are not offset or aggregated with other positions. Tax positions that meet the more-likely-than-not recognition threshold are measured as the largest amount of tax benefit that is more than 50 percent likely of being realized upon settlement with the applicable taxing authority. The portion of the benefits associated with tax positions taken that exceeds the amount measured as described above is reflected as a liability for unrecognized tax benefits in the accompanying Consolidated Balance Sheets along with any associated interest and penalties that would be payable to the taxing authorities upon examination. Interest and penalties associated with unrecognized tax benefits are classified as additional income taxes in the Consolidated Statements of Income.
The Company is a limited partner in several tax-advantaged limited partnerships whose purpose is to invest in approved new market and historic rehabilitation projects. During 2023, the Company adopted the proportional amortization method of accounting for all qualifying equity investments within these limited partnerships. These investments are included in other assets on the Consolidated Balance Sheets. These partnership investments generate a return through the realization of federal income tax credits, as well as other tax benefits, such as tax deductions from net operating losses of the investments over a period of time. The investments are accounted for under the equity method, with the expense included within provision for income taxes on the Consolidated Statements of Income. All of the Company's tax credit investments are evaluated for impairment at the end of each reporting period.
Transfer of Financial Assets: Transfers of financial assets are accounted for as sales, when control over the assets has been surrendered. Control over transferred assets is deemed to be surrendered when (1) the assets have been isolated from the Company, (2) the transferee obtains the right (free of conditions that constrain it from taking advantage of that right) to pledge or exchange the transferred assets, and (3) the Company does not maintain effective control over the transferred assets through an agreement to repurchase them before their maturity, or the ability to unilaterally cause the transferee to return specific assets.
Retirement Benefits: The Company has established an employee benefit plan as described in Note 14. The Company does not provide any other post-retirement benefits.
Allowance for Unfunded Commitments: In the normal course of business, we offer off-balance sheet credit arrangements to enable our customers to meet their financing objectives. These instruments involve, to varying degrees, elements of credit and interest rate risk in excess of the amount recognized in the financial statements. Our exposure to credit loss, in the event the customer does not satisfy the terms of the agreement, equals the contractual amount of the obligation less the value of any collateral. We apply the same credit policies in making commitments and standby and performance letters of credit that are used for the underwriting of loans to customers. Commitments generally have fixed expiration dates, annual renewals or other termination clauses and may require payment of a fee. Because many of the commitments are expected to expire without being drawn upon, the total commitment amounts do not necessarily represent future cash requirements. The ACL on off-balance sheet credit exposures is estimated by loan segment at each balance sheet date under the current expected credit loss model using the same methodologies as portfolio loans, taking into consideration the likelihood that funding will occur, and is included in other liabilities on the Company’s Consolidated Balance Sheets.
Stock-Based Compensation: The Company has issued both restricted stock to executive officers, associates and non-associate directors and performance based stock units to its executive officers. Compensation expense for restricted stock awards is based on the fair value of these awards at the date of the grant. The market price of the Company’s common stock at the date of the grant is the fair value of the award.
Compensation cost is recognized over the required service period, generally defined as the vesting period. For awards with graded vesting, compensation cost is recognized on a straight-line basis over the requisite service period for the entire award. The Company recognizes forfeitures as they occur.
81
CARTER BANKSHARES, INC. AND SUBSIDIARIES
NOTES TO CONSOLIDATED FINANCIAL STATEMENTS - (continued)
For the performance stock units (“PSUs”), management evaluates the criteria quarterly to determine the probability of the performance goals being met and recognizes compensation based upon the evaluation. The PSUs vest on the third anniversary of the grant date.
Loss Contingencies: As disclosed in Note 18 to the Consolidated Financial Statements, the Company and its subsidiaries are involved in various legal proceedings incidental to their business in the ordinary course, and the disclosure set forth in Note 18 relating to certain legal matters is incorporated by reference.
Fair Value Measurements
The Company uses fair value measurements when recording and disclosing certain financial assets and liabilities. Securities available-for-sale and derivative financial instruments are recorded at fair value on a recurring basis. Additionally, from time to time, we may be required to record other assets at fair value on a nonrecurring basis, such as loans held-for-sale, individually evaluated loans, OREO, and certain other assets.
Fair value is the price that would be received to sell an asset or paid to transfer a liability in the principal or most advantageous market in an orderly transaction between market participants at the measurement date. An orderly transaction is a transaction that assumes exposure to the market for a period prior to the measurement date to allow for marketing activities that are usual and customary for transactions involving such assets or liabilities; it is not a forced transaction. In determining fair value, we use various valuation approaches, including market, income and cost approaches. The fair value standard establishes a hierarchy for inputs used in measuring fair value that maximizes the use of observable inputs and minimizes the use of unobservable inputs by requiring that observable inputs be used when available. Observable inputs are inputs that market participants would use in pricing an asset or liability, which are developed based on market data we have obtained from independent sources. Unobservable inputs reflect our estimates of assumptions that market participants would use in pricing an asset or liability, which are developed based on the best information available in the circumstances.
The fair value hierarchy gives the highest priority to unadjusted quoted market prices in active markets for identical assets or liabilities (Level 1 measurement) and the lowest priority to unobservable inputs (Level 3 measurement). There are three levels of inputs that may be used to measure fair values:
Level 1: Quoted prices (unadjusted) for identical assets or liabilities in active markets that an entity has the ability to access as of the measurement date, or observable inputs.
Level 2: Significant other observable inputs other than Level 1 prices, such as quoted prices for similar assets or liabilities, quoted prices in markets that are not active, and other inputs that are observable or can be corroborated by observable market data.
Level 3: Significant unobservable inputs that reflect an entity’s own assumptions about the assumptions that market participants would use in pricing an asset or liability.
A financial instrument’s level within the fair value hierarchy is based on the lowest level of input that is significant to the fair value measurement. We recognize transfers between any of the fair value hierarchy levels at the end of the reporting period in which the transfer occurred.
The following are descriptions of the valuation methodologies that the Company uses for financial instruments recorded at fair value on either a recurring or nonrecurring basis.
Recurring Basis
Securities Available-for-Sale: The fair values of securities available-for-sale are determined by obtaining quoted prices on nationally recognized securities exchanges, if available. This valuation method is classified as Level 1 in the fair value hierarchy. For securities where quoted prices are not available, fair values are calculated on market prices of similar securities, or matrix pricing, which is a mathematical technique, used widely in the industry to value debt securities without relying exclusively on quoted prices for the specific securities but rather by relying on the securities’ relationship to other benchmark quoted securities. Matrix pricing relies on the securities’ relationship to similarly traded securities, benchmark curves, and the benchmarking of like securities. Matrix pricing utilizes observable market inputs such as benchmark yields, reported trades,
82
CARTER BANKSHARES, INC. AND SUBSIDIARIES
NOTES TO CONSOLIDATED FINANCIAL STATEMENTS - (continued)
broker/dealer quotes, issuer spreads, two-sided markets, benchmark securities, bids, offers, reference data, and industry and economic events. In instances where broker quotes are used, these quotes are obtained from market makers or broker-dealers recognized to be market participants. This valuation method is classified as Level 2 in the fair value hierarchy. For securities where quoted prices or market prices of similar securities are not available, fair values are calculated using discounted cash flows or other market indicators. This valuation method is classified as Level 3 in the fair value hierarchy.
Derivative Financial Instruments and Hedging Activities: The Company uses derivative instruments such as interest rate swaps for commercial loans with our customers. Upon entering into swaps with the borrower, the Company entered into offsetting positions with counterparties to minimize risk to the Company. The back-to-back swaps qualify as derivatives, but are not designated as hedging instruments. Interest rate swap contracts involve the risk of dealing with borrower and counterparties and their ability to meet contractual terms. We calculate the fair value for derivatives using accepted valuation techniques, including discounted cash flow analysis on the expected cash flows of each derivative. Each valuation considers the contractual terms of the derivative, including the period to maturity, and uses observable market-based inputs, such as interest rate curves and implied volatilities. When the fair value of a derivative instrument contract is positive, this generally indicates that the counterparty or customer owes the Company, and results in credit risk to the Company. When the fair value of a derivative instrument contract is negative, the Company owes the customer or counterparty, and, therefore, has no risk. Accordingly, interest rate swaps for commercial loans are classified as Level 2.
The Company also enters into commitments to originate mortgage loans whereby the interest rate on the loan is determined prior to funding (rate lock commitments). Rate lock commitments on mortgage loans to be held-for-sale are considered to be derivatives. The period of time between issuance of a loan commitment and closing and sale of the loan generally ranges from 15 to 90 days. The Company protects itself from changes in interest rates through the use of best efforts forward delivery commitments, whereby the Company commits to sell a loan at the time the borrower commits to an interest rate with the intent that the buyer has assumed interest rate risk on rate lock commitments due to changes in interest rates.
Nonrecurring Basis
Individually Evaluated Loans: Individually evaluated loans with commitments of $1.0 million or greater and/or based on management’s discretion are evaluated for potential specific reserves and adjusted, if a shortfall exists, to fair value less costs to sell. Fair value is measured based on the value of the underlying collateral securing the loan if repayment is expected solely from the sale or operation of the collateral or present value of estimated future cash flows discounted at the loan’s contractual interest rate if the loan is not determined to be collateral dependent. All loans with a specific reserve are classified as Level 3 in the fair value hierarchy.
Fair value for individually evaluated loans is determined using several methods. Generally, the fair value of real estate is determined based on appraisals by qualified licensed appraisers. These appraisals may utilize a single valuation approach or a combination of approaches including comparable sales and the income approach. Adjustments are routinely made in the appraisal process by the appraisers to adjust for differences between the comparable sales and income data available. These routine adjustments are made to adjust the value of a specific property relative to comparable properties for variations in qualities such as location, size, and income production capacity relative to the subject property of the appraisal. Such adjustments are typically significant and result in a Level 3 classification of the inputs for determining fair value.
Subsequent to the initial impairment date, existing individually evaluated loans are reevaluated quarterly for additional impairment and adjustments to fair value less costs to sell are made, where appropriate. For individually evaluated loans, the first stage of our impairment analysis involves inspection of the property in question to affirm the condition has not deteriorated since the previous impairment analysis date. Management also engages in conversations with local real estate professionals and market participants to determine the likely marketing time and value range for the property. The second stage involves an assessment of current trends in the regional market. After thorough consideration of these factors, management will order a new appraisal.
For non-individually evaluated loans, the fair value is determined by updating the present value of estimated future cash flows using the loan’s existing rate to reflect the payment schedule for the remaining life of the loan.
OREO is evaluated at the time of acquisition and is recorded at fair value as determined by an appraisal or evaluation, less costs to sell. After acquisition, most OREO assets are revalued every twelve months, or more frequently when deemed necessary by management based upon changes in market or collateral conditions. For smaller OREO assets with existing
83
CARTER BANKSHARES, INC. AND SUBSIDIARIES
NOTES TO CONSOLIDATED FINANCIAL STATEMENTS - (continued)
carrying values less than $0.5 million, management may elect to re-value the assets, at minimum, once every twenty-four months based on the size of the exposure. Fair value, when recorded, is generally based upon appraisals by approved, independent state certified appraisers. Appraisals on OREO may be discounted based on our historical knowledge, changes in market conditions from the time of appraisal or other information available to us. OREO and other repossessed assets marked to fair value are classified as Level 3. At December 31, 2023 OREO assets were in compliance with the OREO policy as set forth above, and substantially all of the assets were listed for sale with credible third-party real estate brokers.
Financial Instruments
In addition to financial instruments recorded at fair value in our financial statements, fair value accounting guidance requires disclosure of the fair value of all of an entity’s assets and liabilities that are considered financial instruments. The majority of our assets and liabilities are considered financial instruments. Many of these instruments lack an available trading market as characterized by a willing buyer and willing seller engaged in an exchange transaction. Also, it is our general practice and intent to hold our financial instruments to maturity and to not engage in trading or sales activities with respect to such financial instruments. For fair value disclosure purposes, we substantially utilize the fair value measurement criteria as required and explained above. In cases where quoted fair values are not available, we use present value methods to determine the fair value of our financial instruments.
Recent Accounting Pronouncements and Developments
Newly Adopted Pronouncements in 2023
In March 2023, the Financial Accounting Standards Board (“FASB”) issued Accounting Standards (“ASU”) No. 2023-02, Investments Equity Method and Joint Ventures (Topic 323): Accounting for Investments in Tax Credit Structures Using the Proportional Amortization Method. The amendments in this ASU expands the use of the proportional amortization method of accounting, previously only allowable for Low Income Tax Housing Credits, (“LITHC”) investments, to equity investments in other tax credit structures that meet certain criteria. This guidance is effective for public business entities for fiscal years including interim periods within those fiscal years, beginning after December 15, 2023. Early adoption is permitted in any interim period. The Company reviewed its existing tax equity investment portfolios and evaluated the impact of the updated guidance on its Consolidated Financial Statements and elected to early adopt the amendments in this ASU as of June 30, 2023 on a modified retrospective basis, effective dated as of January 1, 2023. As a result, the Company recorded a transitional adjustment of $0.1 million to retained earnings.
The Company makes equity investments as a limited partner in various partnerships that sponsor historic tax credits (“HTC”) as a strategic tax initiative designed to receive tax credits and other tax benefits, such as deductible flow-through losses. The Company has evaluated all of the proportional amortization method qualifying criteria and has elected to apply the proportional amortization method at the HTC program level. The Company records the investment in the HTC as a component of other assets and uses the proportional amortization method to account for the investments in the HTC partnerships. Amortization related to these HTC investments is recorded on a net basis as a component of the provision for income taxes on the Consolidated Statements of Income. Prior to the ASU adoption, amortization was recorded as a component of noninterest expense on the Consolidated Statements of Income. The amendments in this ASU did not materially impact our Consolidated Financial Statements.
In March 2020, the FASB issued ASU No. 2020-04, Reference Rate Reform (Topic 848): Facilitation of the Effects of Reference Rate Reform on Financial Reporting. The amendments in this ASU provide optional guidance for a limited period of time to ease the potential burden in accounting for, or recognizing the effects of reference rate reform on financial reporting. The ASU also provides optional expedients and exceptions for applying GAAP to loan and lease agreements, derivative contracts, and other transactions affected by the anticipated transition away from the London Interbank Offered Rate (“LIBOR”) toward new interest rate benchmarks. Modified contracts that meet certain scope guidance are eligible for relief from the modification accounting requirements in GAAP. The optional guidance generally allows for the modified contract to be accounted for as a continuation of the existing contract and does not require contract remeasurement at the modification date or reassessment of a previous accounting determination. The amendments in this ASU are effective for all entities between March 12, 2020 and December 31, 2022. In December 2022, the FASB issued ASU No 2022-06, Reference Rate Reform (Topic 848): Deferral of the Sunset Date of Topic 848. The amendments in this ASU defer the sunset date for applying the reference rate reform relief by two years to December 31, 2024, and can be adopted at any time during this period. The Company ceased originating new LIBOR based variable rate loans as of December 31, 2021 per the ARRC’s guidance. The
84
CARTER BANKSHARES, INC. AND SUBSIDIARIES
NOTES TO CONSOLIDATED FINANCIAL STATEMENTS - (continued)
Company created an internal team in 2021 to identify and modify loans and other financial instruments with attributes that were either directly or indirectly influenced by LIBOR. The Company has selected one-month term Secured Overnight Financing Rate, (“SOFR”), (published by the CME Group) as the replacement benchmark for LIBOR based loans. The financial impact regarding pricing, valuation and operations of the transition have been evaluated and were not material in nature. The transition team was fully committed to working within the guidelines established by the United Kingdom’s Financial Conduct Authority and the Federal Reserve System of New York’s Alternative Reference Rate Committee to complete a smooth transition away from LIBOR. For LIBOR-based loans, remediation efforts were completed by September 30, 2023.
Accounting Statements Issued but Not Yet Adopted
On December 14, 2023, the FASB issued ASU 2023-09, Income Taxes (Topic 740): Improvements to Income Tax Disclosures, which enhances the required disclosures primarily related to the income tax rate reconciliation and income taxes paid. The ASU requires an entity’s income tax rate reconciliation to provide additional information for reconciling items meeting a quantitative threshold, and to disclose certain selected categories within the income tax rate reconciliation. The ASU also requires entities to disclose the amount of income taxes paid, disaggregated by federal, state and foreign taxes. The ASU is effective for annual periods beginning after December 15, 2024, though early adoption is permitted. We are currently evaluating the impact of this guidance on our Consolidated Financial Statements.
NOTE 2 – EARNINGS PER COMMON SHARE
Basic earnings per common share is calculated by dividing net income allocated to common shareholders by the weighted average number of shares of common stock outstanding during the period. Diluted earnings per common share reflects the potential dilution that could occur if securities or other contracts to issue common stock were exercised or converted into common stock or resulted in the issuance of common stock that then shared in the earnings of the entity.
The following table reconciles the numerators and denominators of basic and diluted earnings per common share calculations for the periods presented:
| Years ended December 31, | ||||||||||||||||||||
| (Dollars in Thousands, except share and per share data) | 2023 | 2022 | 2021 | |||||||||||||||||
| Numerator for Earnings per Common Share – Basic and Diluted | ||||||||||||||||||||
| Net Income | $ | $ | $ | |||||||||||||||||
| Less: Income allocated to participating shares | ||||||||||||||||||||
| Net Income Allocated to Common Shareholders - Basic & Diluted | $ | $ | $ | |||||||||||||||||
| Denominator: | ||||||||||||||||||||
| Weighted Average Shares Outstanding, including Shares Considered Participating Securities | ||||||||||||||||||||
| Less: Average Participating Securities | ||||||||||||||||||||
| Weighted Average Common Shares Outstanding - Basic & Diluted | $ | $ | $ | |||||||||||||||||
| Earnings per Common Share – Basic | $ | $ | $ | |||||||||||||||||
| Earnings per Common Share – Diluted | $ | $ | $ | |||||||||||||||||
All outstanding unvested restricted stock awards are considered participating securities for the earnings per share calculation. As such, these shares have been allocated to a portion of net income and are excluded from the diluted earnings per common share calculation.
85
CARTER BANKSHARES, INC. AND SUBSIDIARIES
NOTES TO CONSOLIDATED FINANCIAL STATEMENTS - (continued)
NOTE 3 - RESTRICTIONS ON CASH AND DUE FROM BANK ACCOUNTS
NOTE 4 - INVESTMENT SECURITIES
The following tables present the amortized cost and fair value of available-for-sale securities as of the dates presented:
| December 31, 2023 | ||||||||||||||||||||||||||
| (Dollars in Thousands) | Amortized Cost | Gross Unrealized Gains | Gross Unrealized Losses | Fair Value | ||||||||||||||||||||||
| U.S. Government Agency Securities | $ | $ | $ | ( | $ | |||||||||||||||||||||
| Residential Mortgage-Backed Securities | ( | |||||||||||||||||||||||||
| Commercial Mortgage-Backed Securities | ( | |||||||||||||||||||||||||
| Other Commercial Mortgage-Backed Securities | ( | |||||||||||||||||||||||||
| Asset Backed Securities | ( | |||||||||||||||||||||||||
| Collateralized Mortgage Obligations | ( | |||||||||||||||||||||||||
| States and Political Subdivisions | ( | |||||||||||||||||||||||||
| Corporate Notes | ( | |||||||||||||||||||||||||
| Total Debt Securities | $ | $ | $ | ( | $ | |||||||||||||||||||||
| December 31, 2022 | ||||||||||||||||||||||||||
| (Dollars in Thousands) | Amortized Cost | Gross Unrealized Gains | Gross Unrealized Losses | Fair Value | ||||||||||||||||||||||
| U.S. Treasury Securities | $ | $ | $ | ( | $ | |||||||||||||||||||||
| U.S. Government Agency Securities | ( | |||||||||||||||||||||||||
| Residential Mortgage-Backed Securities | ( | |||||||||||||||||||||||||
| Commercial Mortgage-Backed Securities | ( | |||||||||||||||||||||||||
| Other Commercial Mortgage-Backed Securities | ( | |||||||||||||||||||||||||
| Asset Backed Securities | ( | |||||||||||||||||||||||||
| Collateralized Mortgage Obligations | ( | |||||||||||||||||||||||||
| States and Political Subdivisions | ( | |||||||||||||||||||||||||
| Corporate Notes | ( | |||||||||||||||||||||||||
| Total Debt Securities | $ | $ | $ | ( | $ | |||||||||||||||||||||
The Company did no
The following table shows the composition of gross and net realized gains and losses for the periods presented:
| Years ended December 31, | ||||||||||||||||||||
| (Dollars in Thousands) | 2023 | 2022 | 2021 | |||||||||||||||||
| Proceeds from Sales of Securities Available-for-Sale | $ | $ | $ | |||||||||||||||||
| Gross Realized Gains | $ | $ | $ | |||||||||||||||||
| Gross Realized Losses | ( | ( | ( | |||||||||||||||||
| Net Realized (Losses) Gains | $ | ( | $ | $ | ||||||||||||||||
| Tax Impact | $ | ( | $ | $ | ||||||||||||||||
Gains or losses are recognized in earnings on the trade date using the amortized cost of the specific security sold. The net realized (losses) gains above reflect reclassification adjustments in the calculation of Other Comprehensive Income (Loss). The net realized (losses) gains are included in noninterest income as (losses) gains on sales of securities, net in the Consolidated Statements of Income. The tax impact is included in income tax provision in the Consolidated Statements of Income.
86
CARTER BANKSHARES, INC. AND SUBSIDIARIES
NOTES TO CONSOLIDATED FINANCIAL STATEMENTS - (continued)
The amortized cost and fair value of available-for-sale debt securities are shown below by contractual maturity as of the date presented. Expected maturities may differ from contractual maturities if borrowers have the right to call or prepay obligations with or without call or prepayment penalties. Securities not due at a single maturity date are shown separately.
| December 31, 2023 | ||||||||||||||
| (Dollars in Thousands) | Amortized Cost | Fair Value | ||||||||||||
| Due in One Year or Less | $ | $ | ||||||||||||
| Due after One Year through Five Years | ||||||||||||||
| Due after Five Years through Ten Years | ||||||||||||||
| Due after Ten Years | ||||||||||||||
| Residential Mortgage-Backed Securities | ||||||||||||||
| Commercial Mortgage-Backed Securities | ||||||||||||||
| Other Commercial Mortgage-Backed Securities | ||||||||||||||
| Collateralized Mortgage Obligations | ||||||||||||||
| Asset Backed Securities | ||||||||||||||
| Total Securities | $ | $ | ||||||||||||
At December 31, 2023 and December 31, 2022, there were no holdings of securities of any one issuer, other than those securities issued by or collateralized by the U.S. Government and its Agencies, in an amount greater than 10% of shareholders’ equity. The carrying value of securities pledged for various regulatory and legal requirements was $215.5 million at December 31, 2023 and $224.5 million at December 31, 2022.
Available-for-sale securities with unrealized losses at December 31, 2023 and December 31, 2022, aggregated by investment category and length of time the individual securities have been in a continuous unrealized loss position, were as follows:
| December 31, 2023 | ||||||||||||||||||||||||||||||||||||||||||||||||||||||||
| Less Than 12 Months | 12 Months or More | Total | ||||||||||||||||||||||||||||||||||||||||||||||||||||||
| (Dollars in Thousands) | Number of Securities | Fair Value | Unrealized Losses | Number of Securities | Fair Value | Unrealized Losses | Number of Securities | Fair Value | Unrealized Losses | |||||||||||||||||||||||||||||||||||||||||||||||
| U.S. Government Agency Securities | $ | $ | ( | $ | $ | ( | $ | $ | ( | |||||||||||||||||||||||||||||||||||||||||||||||
| Residential Mortgage-Backed Securities | ( | ( | ||||||||||||||||||||||||||||||||||||||||||||||||||||||
| Commercial Mortgage-Backed Securities | ( | ( | ( | |||||||||||||||||||||||||||||||||||||||||||||||||||||
| Other Commercial Mortgage-Backed Securities | ( | ( | ||||||||||||||||||||||||||||||||||||||||||||||||||||||
| Asset Backed Securities | ( | ( | ( | |||||||||||||||||||||||||||||||||||||||||||||||||||||
| Collateralized Mortgage Obligations | ( | ( | ||||||||||||||||||||||||||||||||||||||||||||||||||||||
| States and Political Subdivisions | ( | ( | ||||||||||||||||||||||||||||||||||||||||||||||||||||||
| Corporate Notes | ( | ( | ||||||||||||||||||||||||||||||||||||||||||||||||||||||
| Total Debt Securities | $ | $ | ( | $ | $ | ( | $ | $ | ( | |||||||||||||||||||||||||||||||||||||||||||||||
87
CARTER BANKSHARES, INC. AND SUBSIDIARIES
NOTES TO CONSOLIDATED FINANCIAL STATEMENTS - (continued)
| December 31, 2022 | ||||||||||||||||||||||||||||||||||||||||||||||||||||||||
| Less Than 12 Months | 12 Months or More | Total | ||||||||||||||||||||||||||||||||||||||||||||||||||||||
| (Dollars in Thousands) | Number of Securities | Fair Value | Unrealized Losses | Number of Securities | Fair Value | Unrealized Losses | Number of Securities | Fair Value | Unrealized Losses | |||||||||||||||||||||||||||||||||||||||||||||||
| U.S. Treasury Securities | $ | $ | ( | $ | $ | ( | $ | $ | ( | |||||||||||||||||||||||||||||||||||||||||||||||
| U.S. Government Agency Securities | ( | ( | ( | |||||||||||||||||||||||||||||||||||||||||||||||||||||
| Residential Mortgage-Backed Securities | ( | ( | ( | |||||||||||||||||||||||||||||||||||||||||||||||||||||
| Commercial Mortgage-Backed Securities | ( | ( | ( | |||||||||||||||||||||||||||||||||||||||||||||||||||||
| Other Commercial Mortgage-Backed Securities | ( | ( | ( | |||||||||||||||||||||||||||||||||||||||||||||||||||||
| Asset Backed Securities | ( | ( | ( | |||||||||||||||||||||||||||||||||||||||||||||||||||||
| Collateralized Mortgage Obligations | ( | ( | ( | |||||||||||||||||||||||||||||||||||||||||||||||||||||
| States and Political Subdivisions | ( | ( | ( | |||||||||||||||||||||||||||||||||||||||||||||||||||||
| Corporate Notes | ( | ( | ( | |||||||||||||||||||||||||||||||||||||||||||||||||||||
| Total Debt Securities | $ | $ | ( | $ | $ | ( | $ | $ | ( | |||||||||||||||||||||||||||||||||||||||||||||||
The Company adopted Topic 326, Financial Instruments—Credit Losses (Topic 326) on January 1, 2021 and did no no
As of December 31, 2023, management does not intend to sell any security in an unrealized loss position and it is not more than likely that it will be required to sell any such security before the recovery of its amortized cost basis. The unrealized losses on debt securities are primarily the result of interest rate changes, credit spread fluctuations on agency-issued mortgage-related securities, general financial market uncertainty and market volatility. These conditions should not prohibit the Company from receiving its contractual principal and interest payments on its debt securities. The fair value is expected to recover as the securities approach their maturity date or repricing date.
88
CARTER BANKSHARES, INC. AND SUBSIDIARIES
NOTES TO CONSOLIDATED FINANCIAL STATEMENTS - (continued)
NOTE 5 – LOANS AND LOANS HELD-FOR-SALE
The composition of the loan portfolio by dollar amount is shown in the table below:
| December 31, | ||||||||||||||
| (Dollars in Thousands) | 2023 | 2022 | ||||||||||||
| Commercial | ||||||||||||||
| Commercial Real Estate | $ | $ | ||||||||||||
| Commercial and Industrial | ||||||||||||||
| Total Commercial Loans | ||||||||||||||
| Consumer | ||||||||||||||
| Residential Mortgages | ||||||||||||||
| Other Consumer | ||||||||||||||
| Total Consumer Loans | ||||||||||||||
| Construction | ||||||||||||||
| Other | ||||||||||||||
| Total Portfolio Loans | ||||||||||||||
| Loans Held-for-Sale | ||||||||||||||
| Total Loans | $ | $ | ||||||||||||
We attempt to limit our exposure to credit risk by diversifying our loan portfolio by segment, geography, collateral and industry while actively managing concentrations. When concentrations exist in certain segments, this risk is mitigated by reviewing the relevant economic indicators and internal risk rating trends of the loans in these segments. The Company established transaction, relationship and specific loan segment limits in its loan policy. Total commercial real estate balances should not exceed the combination of 300 % of total risk-based capital and growth in excess of 50 % over the previous thirty-six months and construction loan balances should not exceed 100 % of total risk-based capital. Investment real estate property types and purchased loan programs have individual dollar limits that should not be exceeded in the portfolio and are based on management’s risk tolerance relative to capital. In addition, there are specific targets for various categories of real estate loans with respect to debt service coverage ratios, loan-to-value ratios, loan terms, and amortization periods. We also have policy limits on loan-to-cost for construction projects. Although leverage is important, the Company is also focused on cash flow generation and employs stress testing to calculate a supportable loan amount. Supportable loan amounts have generally been more challenging given the increases in commodities pricing and the average loan to cost has decreased over time.
Unsecured loans pose higher risk for the Company due to the lack of a well-defined secondary source of repayment. Commercial unsecured loans are reserved for the best quality customers with well-established businesses that operate with low financial and operating leverage. The repayment capacity of the borrower should exceed the policy and guidelines for secured loans. The Company significantly increased the standards for consumer unsecured lending by adjusting upward the required qualifying Fair Isaac Corporation (“FICO”) scores and restricting loan amounts at lower FICO scores.
Deferred costs and fees included in the portfolio balances above were $7.2 million and $8.2 million at December 31, 2023 and December 31, 2022, respectively. Discounts on purchased 1-4 family loans included in the portfolio balances above were $133.4 thousand and $161.2 thousand at December 31, 2023 and December 31, 2022, respectively.
The Company had no
Loan Restructurings
On April 1, 2022, the Company adopted the accounting guidance in ASU No. 2022-02, effective as of January 1, 2022, which eliminates the recognition and measurement of a TDR. Due to the removal of the TDR designation, the Company evaluates all loan restructurings according to the accounting guidance for loan modifications to determine if the restructuring results in a new loan or a continuation of the existing loan. Loan modifications to borrowers experiencing financial difficulty that result in a direct change in the timing or amount of contractual cash flows include situations where there is principal forgiveness, interest rate reductions, other-than-insignificant payment delays, term extensions, and combinations of the listed modifications. Therefore, the disclosures related to loan restructurings are only for modifications that directly affect cash flows.
A loan that is considered a restructured loan may be subject to the individually evaluated loan analysis if the commitment is $1.0 million or greater and/or based on management’s discretion; otherwise, the restructured loan remains in the appropriate
89
CARTER BANKSHARES, INC. AND SUBSIDIARIES
NOTES TO CONSOLIDATED FINANCIAL STATEMENTS - (continued)
segment in the ACL model. For a discussion with respect to reserve calculations regarding individually evaluated loans refer to the “Nonrecurring Basis” section in Note 7, Fair Value Measurements, in the Notes to Consolidated Financial Statements in Item 8 of this Annual Report on Form 10-K.
The following table shows the amortized cost basis as of December 31, 2023 and December 31, 2022 for the loans restructured during the twelve months ended December 31, 2023 and December 31, 2022 to borrowers experiencing financial difficulty, disaggregated by portfolio segment:
| Restructured Loans | Restructured Loans | |||||||||||||||||||||||||||||||||||||
| Twelve Months Ended December 31, 2023 | Twelve Months Ended December 31, 2022 | |||||||||||||||||||||||||||||||||||||
| (Dollars in Thousands) | Number of Contracts | Amortized Cost Basis(1) | % of Total Class of Financing Receivable | Number of Contracts | Amortized Cost Basis(1) | % of Total Class of Financing Receivable | ||||||||||||||||||||||||||||||||
| Accruing Restructured Loans | ||||||||||||||||||||||||||||||||||||||
| Commercial Real Estate | $ | % | $ | % | ||||||||||||||||||||||||||||||||||
| Commercial and Industrial | % | % | ||||||||||||||||||||||||||||||||||||
| Residential Mortgages | % | % | ||||||||||||||||||||||||||||||||||||
| Other Consumer | % | % | ||||||||||||||||||||||||||||||||||||
| Construction | % | % | ||||||||||||||||||||||||||||||||||||
| Other | % | % | ||||||||||||||||||||||||||||||||||||
| Total Accruing Restructured Loans | % | % | ||||||||||||||||||||||||||||||||||||
| Nonaccrual Restructured Loans | ||||||||||||||||||||||||||||||||||||||
| Commercial Real Estate | $ | % | $ | % | ||||||||||||||||||||||||||||||||||
| Commercial and Industrial | % | % | ||||||||||||||||||||||||||||||||||||
| Residential Mortgages | % | % | ||||||||||||||||||||||||||||||||||||
| Other Consumer | % | % | ||||||||||||||||||||||||||||||||||||
| Construction | % | % | ||||||||||||||||||||||||||||||||||||
| Other | % | % | ||||||||||||||||||||||||||||||||||||
| Total Nonaccrual Restructured Loans | % | % | ||||||||||||||||||||||||||||||||||||
| Total Restructured Loans | % | % | ||||||||||||||||||||||||||||||||||||
(1) Excludes accrued interest receivable of $1.5 thousand on restructured loans for the year ended 2022.
The Company had no loans that were restructured during the three and twelve months ended December 31, 2023. During the third quarter of 2022 the Bank modified a construction loan and considered it a restructured loan as a result of financial difficulty. The borrower is a single family home builder. The purpose of the loan was to finance the construction of a speculative home. The loan matured and was incomplete. The Bank extended the maturity and completion date for five (5 ) months in order to provide time to complete and sell the home. However, the Bank became aware of a mechanic’s lien filed by one of the borrower’s subcontractors. This issue was resolved and the loan was restored to accrual status on September 30, 2022. Subsequently, the home was sold and the Bank was paid in full on December 9, 2022. This loan was not considered significant and remained in the general pool of the Bank’s ACL model for reserve purposes until it was paid in full. These loans are not considered significant and are included in the Bank’s ACL model in the general pool of the construction and commercial real estate (“CRE”) segments for reserve purposes.
90
CARTER BANKSHARES, INC. AND SUBSIDIARIES
NOTES TO CONSOLIDATED FINANCIAL STATEMENTS - (continued)
The Bank closely monitors the performance of the loans that are modified to borrowers experiencing financial difficulty to understand the effectiveness of its modification efforts. The following table depicts the performance of loans that have been modified during the year ended December 31, 2022:
| Payment Status (Amortized Cost Basis) | ||||||||||||||||||||
| (Dollars in Thousands) | Current | 30-89 Days Past Due | 90+ Days Past Due | |||||||||||||||||
| Accruing Restructured Loans | ||||||||||||||||||||
| Commercial Real Estate | $ | $ | $ | |||||||||||||||||
| Commercial and Industrial | ||||||||||||||||||||
| Residential Mortgages | ||||||||||||||||||||
| Other Consumer | ||||||||||||||||||||
| Construction | ||||||||||||||||||||
| Other | ||||||||||||||||||||
| Total Accruing Restructured Loans | $ | $ | $ | |||||||||||||||||
| Nonaccrual Restructured Loans | ||||||||||||||||||||
| Commercial Real Estate | $ | $ | $ | |||||||||||||||||
| Commercial and Industrial | ||||||||||||||||||||
| Residential Mortgages | ||||||||||||||||||||
| Other Consumer | ||||||||||||||||||||
| Construction | ||||||||||||||||||||
| Other | ||||||||||||||||||||
| Total Nonaccrual Restructured Loans | $ | $ | $ | |||||||||||||||||
Total Restructured Loans(1) | $ | $ | $ | |||||||||||||||||
(1)Excludes accrued interest receivable of $1.5 thousand at December 31, 2022.
As of December 31, 2023 and December 31, 2022, the Bank had no commitments to lend any additional funds on restructured loans. As of December 31, 2023 and December 31, 2022 the Bank had no loans that defaulted during the period and had been modified preceding the payment default when the borrower was experiencing financial difficulty at the time of modification. For purposes of this disclosure, a default occurs when, within 12 months of the original modification, either a full or partial charge-off occurs or the loan becomes 90 days or more past due.
As of December 31, 2023 and December 31, 2022, the Company had $2.0 million and $0.9 million, respectively, of residential real estate in the process of foreclosure. We also had $62 thousand at December 31, 2023 and $133 thousand at December 31, 2022 in residential real estate included in OREO.
Loans to principal officers, directors and their affiliates during 2023 were as follows:
| (Dollars in Thousands) | 2023 | |||||||
| Beginning Balance | $ | |||||||
| Principal Additions | ||||||||
| Repayments | ( | |||||||
| Balance at End of Year | $ | |||||||
91
CARTER BANKSHARES, INC. AND SUBSIDIARIES
NOTES TO CONSOLIDATED FINANCIAL STATEMENTS - (continued)
NOTE 6 - ALLOWANCE FOR CREDIT LOSSES
The Company maintains an ACL at a level determined to be adequate to absorb expected credit losses associated with the Company’s financial instruments over the life of those instruments as of the balance sheet date. The Company develops and documents a systematic ACL methodology based on the following portfolio segments: 1) CRE, 2) Commercial and Industrial, (“C&I”), 3) Residential Mortgages, 4) Other Consumer, 5) Construction and 6) Other. The Company’s loan portfolio is segmented by homogeneous loan types that behave similarly to economic cycles. The following is a discussion of the key risks by portfolio segment that management assesses in preparing the ACL.
CRE loans are secured by commercial purpose real estate, including both owner occupied properties and investment properties, for various purposes such as hotels, strip malls and apartments. Operations of the individual projects as well as global cash flows of the debtors are the primary sources of repayment for these loans. The condition of the local economy is an important indicator of risk, but there are also more specific risks depending on the collateral type as well as the business.
C&I loans are made to operating companies or manufacturers for the purpose of production, operating capacity, accounts receivable, inventory or equipment financing. Cash flow from the operations of the borrower is the primary source of repayment for these loans. The condition of the local economy is an important indicator of risk, but there are also more specific risks depending on the industry of the borrower. Collateral for these types of loans often do not have sufficient value in a distressed or liquidation scenario to satisfy the outstanding debt. These loans are also made to local and state municipalities for various purposes including refinancing existing obligations, infrastructure up-fit and expansion, or to purchase new equipment. These loans may be secured by general obligations from the municipal authority or revenues generated by infrastructure and equipment financed by the Company. The primary repayment source for these loans include the tax base of the municipality, specific revenue streams related to the infrastructure financed, and other business operations of the municipal authority. The health and stability of state and local economies directly impacts each municipality’s tax basis and are important indicators of risk for this segment. The ability of each municipality to increase taxes and fees to offset debt service requirements give this type of loan a very low risk profile in the continuum of the Company’s loan portfolio.
Residential Mortgages are loans secured by first and second liens such as home equity loans, home equity lines of credit and 1-4 family residential mortgages, including purchased money mortgages. The primary source of repayment for these loans is the income of the borrower. The condition of the local economy, in particular the unemployment rate, is an important indicator of risk for this segment. The state of the local housing market can also have a significant impact on this segment because low demand and/or declining home values can limit the ability of borrowers to sell a property and satisfy the debt.
Other Consumer loans are made to individuals and may be either secured by assets other than 1-4 family residences or unsecured. This segment includes auto loans and unsecured loans and lines. The primary source of repayment for these loans is the income and assets of the borrower. The condition of the local economy, in particular the unemployment rate, is an important indicator of risk for this segment. The value of the collateral, if there is any, is less likely to be a source of repayment due to less certain collateral values.
Construction loans include both commercial and consumer. Commercial loans are made to finance construction of buildings or other structures, as well as to finance the acquisition and development of raw land for various purposes. While the risk of these loans is generally confined to the construction period, if there are problems, the project may not be completed, and as such, may not provide sufficient cash flow on its own to service the debt or have sufficient value in a liquidation to cover the outstanding principal. The condition of the local economy is an important indicator of risk, but there are also more specific risks depending on the type of project and the experience and resources of the developer. Consumer loans are made for the construction of residential homes for which a binding sales contract exists and generally are for a period of time sufficient to complete construction. Residential construction loans to individuals generally provide for the payment of interest only during the construction phase. Credit risk for residential real estate construction loans can arise from construction delays, cost overruns, failure of the contractor to complete the project to specifications and economic conditions that could impact demand for or supply of the property being constructed.
Other loans include unique risk attributes considered inconsistent with our current underwriting standards.
The ACL reserve for the Other segment is based on a discounted cash flow methodology and reserves will fluctuate based on expected cash flow changes in the future. These inconsistencies may include, but are not limited to i) transaction and/or relationship sizes that exceed limits established in 2018, ii) overreliance on secondary, tertiary or guarantor cash flow, iii) land
92
CARTER BANKSHARES, INC. AND SUBSIDIARIES
NOTES TO CONSOLIDATED FINANCIAL STATEMENTS - (continued)
acquisition loans without a defined source of amortization, iv) loan structures on operating lines of credit dependent on the value of real estate rather than trading assets, and v) indirect liabilities of certain guarantees resulting from the nonpayment of financial obligations. Management continuously assesses underwriting standards, but significantly enhanced these standards in 2018.
Our model is based on our best estimate of facts known with the most current information. Certain portions of the CECL model are inherently subjective and include, but are not limited to estimates with respect to: prepayment speeds, the timing of prepayments, potential losses given default, discount rates and the timing of future cash flows. Management utilizes widely published economic forecasts as the basis for the regression analysis used to estimate the probability of default in the baseline model. The peaks and troughs of these forecasts serve as guardrails for potential subjective adjustments. In addition to considering the outcomes based on the range of forecasts, management recognizes that the assumptions used in economic forecasts may not perfectly align with our market area, risk profile or unique attributes of our portfolio along with other important considerations. Severe changes in forecasts can also create significant variability and management must assess not only the absolute balance of reserves but also consider the appropriateness of the velocity of change. Therefore, management developed a framework to assess the tolerance and reasonableness of the CECL modeling process by challenging certain elements of the forecasts, when appropriate. These outcomes, known as “challenger models,” provide opportunities to examine and subjectively adjust the CECL model output and are designed to be counter cyclical, thereby reducing variability.
Credit Quality Indicators:
The Company’s portfolio grading analysis estimates the capability of the borrower to repay the contractual obligations of the loan agreements as scheduled or at all. The Company’s internal credit risk grading system is based on debt service coverage, collateral values and other subjective factors. Mortgage and consumer loans are defaulted to a pass grade until a loan migrates to past due status.
The Company has a loan review policy and annual scope report that details the level of loan review for loans in a given year. The annual loan review provides the Credit Risk Committee with an independent analysis of the following: 1) credit quality of the loan portfolio, 2) compliance with the loan policy, 3) adequacy of documentation in credit files and 4) validity of risk ratings. Since 2020 and continuing through 2023, the Company used a five step approach for loan review in the following categories:
•Individual reviews of the top twenty large loan relationships (“LLRs”), which are defined as any individual commercial loan or aggregate commercial relationship totaling $2.0 million or more;
•A sampling of small LLRs, which are defined as individual commercial loans or relationships with aggregate exposure of $2.0 million or more but not included in the top twenty LLRs;
•A sampling review of Credit Risk Committee modifications, including new and existing loans to provide perspective on the appropriateness of the modification in relation to established policies and procedures;
•A sampling review of non-organic commercial loans and those commercial loans approved outside of the Credit Risk Committee; and
•Focus reviews of office and land development to evaluate segment risk rather than individual loan risk. Focus reviews are performed annually on a rotational basis.
The Company’s internally assigned grades are as follows:
Pass – The Company uses six grades of pass, including its watch rating. Generally, a pass rating indicates that the loan is currently performing and is of high quality.
Special Mention – Assets with potential weaknesses that warrant management’s close attention and if left uncorrected, these potential weaknesses may result in deterioration of the repayment prospects for the asset or in the institution’s credit position at some future date.
Substandard – Assets that are inadequately protected by the current sound worth and paying capacity of the obligor or by the collateral pledged, if any. Assets so classified have a well-defined weakness, or weaknesses that jeopardize the
93
CARTER BANKSHARES, INC. AND SUBSIDIARIES
NOTES TO CONSOLIDATED FINANCIAL STATEMENTS - (continued)
liquidation of the debt. Such assets are characterized by the distinct possibility that the institution will sustain some loss if the deficiencies are not corrected.
Doubtful – Assets with all the weaknesses inherent in one classified substandard with the added characteristic that the weaknesses make collection or liquidation in full, on the basis of currently known facts, conditions, and values, highly questionable and improbable.
Loss – Assets considered of such little value that its continuance on the books is not warranted. This classification does not mean that the asset has absolutely no recovery or salvage value, but rather it is not practical or desirable to defer writing off this basically worthless asset even though partial recovery may be affected in the future.
The ability of borrowers to repay commercial loans is dependent upon the success of their business and general economic conditions. Due to the greater potential for loss within our commercial portfolio, we monitor the commercial loan portfolio through an internal risk rating system. Loan risk ratings are assigned based upon the creditworthiness of the borrower and are reviewed on an ongoing basis according to our internal policies. Loans rated special mention or substandard have potential or well-defined weaknesses not generally found in high quality, performing loans, and require attention from management to limit loss.
94
CARTER BANKSHARES, INC. AND SUBSIDIARIES
NOTES TO CONSOLIDATED FINANCIAL STATEMENTS - (continued)
The following table presents loan balances by year of origination and internally assigned risk rating for our portfolio segments as of December 31:
| Risk Rating | ||||||||||||||||||||||||||||||||||||||||||||||||||
| (Dollars in Thousands) | 2023 | 2022 | 2021 | 2020 | 2019 | 2018 and Prior | Revolving | Total Portfolio Loans | ||||||||||||||||||||||||||||||||||||||||||
| Commercial Real Estate | ||||||||||||||||||||||||||||||||||||||||||||||||||
| Pass | $ | $ | $ | $ | $ | $ | $ | $ | ||||||||||||||||||||||||||||||||||||||||||
| Special Mention | ||||||||||||||||||||||||||||||||||||||||||||||||||
| Substandard | ||||||||||||||||||||||||||||||||||||||||||||||||||
| Doubtful | ||||||||||||||||||||||||||||||||||||||||||||||||||
| Total Commercial Real Estate | $ | $ | $ | $ | $ | $ | $ | $ | ||||||||||||||||||||||||||||||||||||||||||
| YTD Gross Charge-offs | ||||||||||||||||||||||||||||||||||||||||||||||||||
| Commercial and Industrial | ||||||||||||||||||||||||||||||||||||||||||||||||||
| Pass | $ | $ | $ | $ | $ | $ | $ | $ | ||||||||||||||||||||||||||||||||||||||||||
| Special Mention | ||||||||||||||||||||||||||||||||||||||||||||||||||
| Substandard | ||||||||||||||||||||||||||||||||||||||||||||||||||
| Doubtful | ||||||||||||||||||||||||||||||||||||||||||||||||||
| Total Commercial and Industrial | $ | $ | $ | $ | $ | $ | $ | $ | ||||||||||||||||||||||||||||||||||||||||||
| YTD Gross Charge-offs | ||||||||||||||||||||||||||||||||||||||||||||||||||
| Residential Mortgages | ||||||||||||||||||||||||||||||||||||||||||||||||||
| Pass | $ | $ | $ | $ | $ | $ | $ | $ | ||||||||||||||||||||||||||||||||||||||||||
| Special Mention | ||||||||||||||||||||||||||||||||||||||||||||||||||
| Substandard | ||||||||||||||||||||||||||||||||||||||||||||||||||
| Doubtful | ||||||||||||||||||||||||||||||||||||||||||||||||||
| Total Residential Mortgages | $ | $ | $ | $ | $ | $ | $ | $ | ||||||||||||||||||||||||||||||||||||||||||
| YTD Gross Charge-offs | ||||||||||||||||||||||||||||||||||||||||||||||||||
| Other Consumer | ||||||||||||||||||||||||||||||||||||||||||||||||||
| Pass | $ | $ | $ | $ | $ | $ | $ | $ | ||||||||||||||||||||||||||||||||||||||||||
| Special Mention | ||||||||||||||||||||||||||||||||||||||||||||||||||
| Substandard | ||||||||||||||||||||||||||||||||||||||||||||||||||
| Doubtful | ||||||||||||||||||||||||||||||||||||||||||||||||||
| Total Other Consumer | $ | $ | $ | $ | $ | $ | $ | $ | ||||||||||||||||||||||||||||||||||||||||||
| YTD Gross Charge-offs | ||||||||||||||||||||||||||||||||||||||||||||||||||
| Construction | ||||||||||||||||||||||||||||||||||||||||||||||||||
| Pass | $ | $ | $ | $ | $ | $ | $ | $ | ||||||||||||||||||||||||||||||||||||||||||
| Special Mention | ||||||||||||||||||||||||||||||||||||||||||||||||||
| Substandard | ||||||||||||||||||||||||||||||||||||||||||||||||||
| Doubtful | ||||||||||||||||||||||||||||||||||||||||||||||||||
| Total Construction | $ | $ | $ | $ | $ | $ | $ | $ | ||||||||||||||||||||||||||||||||||||||||||
| YTD Gross Charge-offs | ||||||||||||||||||||||||||||||||||||||||||||||||||
| Other | ||||||||||||||||||||||||||||||||||||||||||||||||||
| Pass | $ | $ | $ | $ | $ | $ | $ | $ | ||||||||||||||||||||||||||||||||||||||||||
| Special Mention | ||||||||||||||||||||||||||||||||||||||||||||||||||
| Substandard | ||||||||||||||||||||||||||||||||||||||||||||||||||
| Doubtful | ||||||||||||||||||||||||||||||||||||||||||||||||||
| Total Other Loans | $ | $ | $ | $ | $ | $ | $ | $ | ||||||||||||||||||||||||||||||||||||||||||
| YTD Gross Charge-offs | ||||||||||||||||||||||||||||||||||||||||||||||||||
| Total Portfolio Loans | ||||||||||||||||||||||||||||||||||||||||||||||||||
| Pass | $ | $ | $ | $ | $ | $ | $ | $ | ||||||||||||||||||||||||||||||||||||||||||
| Special Mention | ||||||||||||||||||||||||||||||||||||||||||||||||||
| Substandard | ||||||||||||||||||||||||||||||||||||||||||||||||||
| Doubtful | ||||||||||||||||||||||||||||||||||||||||||||||||||
| Total Portfolio Loans | $ | $ | $ | $ | $ | $ | $ | $ | ||||||||||||||||||||||||||||||||||||||||||
| Current YTD Period: | ||||||||||||||||||||||||||||||||||||||||||||||||||
| YTD Gross Charge-offs | $ | $ | $ | $ | $ | $ | $ | $ | ||||||||||||||||||||||||||||||||||||||||||
95
CARTER BANKSHARES, INC. AND SUBSIDIARIES
NOTES TO CONSOLIDATED FINANCIAL STATEMENTS - (continued)
| Risk Rating | ||||||||||||||||||||||||||||||||||||||||||||||||||
| (Dollars in Thousands) | 2022 | 2021 | 2020 | 2019 | 2018 | 2017 and Prior | Revolving | Total Portfolio Loans | ||||||||||||||||||||||||||||||||||||||||||
| Commercial Real Estate | ||||||||||||||||||||||||||||||||||||||||||||||||||
| Pass | $ | $ | $ | $ | $ | $ | $ | $ | ||||||||||||||||||||||||||||||||||||||||||
| Special Mention | ||||||||||||||||||||||||||||||||||||||||||||||||||
| Substandard | ||||||||||||||||||||||||||||||||||||||||||||||||||
| Total Commercial Real Estate | $ | $ | $ | $ | $ | $ | $ | $ | ||||||||||||||||||||||||||||||||||||||||||
| YTD Gross Charge-offs | ||||||||||||||||||||||||||||||||||||||||||||||||||
| Commercial and Industrial | ||||||||||||||||||||||||||||||||||||||||||||||||||
| Pass | $ | $ | $ | $ | $ | $ | $ | $ | ||||||||||||||||||||||||||||||||||||||||||
| Special Mention | ||||||||||||||||||||||||||||||||||||||||||||||||||
| Substandard | ||||||||||||||||||||||||||||||||||||||||||||||||||
| Total Commercial and Industrial | $ | $ | $ | $ | $ | $ | $ | $ | ||||||||||||||||||||||||||||||||||||||||||
| YTD Gross Charge-offs | ||||||||||||||||||||||||||||||||||||||||||||||||||
| Residential Mortgages | ||||||||||||||||||||||||||||||||||||||||||||||||||
| Pass | $ | $ | $ | $ | $ | $ | $ | $ | ||||||||||||||||||||||||||||||||||||||||||
| Special Mention | ||||||||||||||||||||||||||||||||||||||||||||||||||
| Substandard | ||||||||||||||||||||||||||||||||||||||||||||||||||
| Total Residential Mortgages | $ | $ | $ | $ | $ | $ | $ | $ | ||||||||||||||||||||||||||||||||||||||||||
| YTD Gross Charge-offs | ||||||||||||||||||||||||||||||||||||||||||||||||||
| Other Consumer | ||||||||||||||||||||||||||||||||||||||||||||||||||
| Pass | $ | $ | $ | $ | $ | $ | $ | $ | ||||||||||||||||||||||||||||||||||||||||||
| Special Mention | ||||||||||||||||||||||||||||||||||||||||||||||||||
| Substandard | ||||||||||||||||||||||||||||||||||||||||||||||||||
| Total Other Consumer | $ | $ | $ | $ | $ | $ | $ | $ | ||||||||||||||||||||||||||||||||||||||||||
| YTD Gross Charge-offs | ||||||||||||||||||||||||||||||||||||||||||||||||||
| Construction | ||||||||||||||||||||||||||||||||||||||||||||||||||
| Pass | $ | $ | $ | $ | $ | $ | $ | $ | ||||||||||||||||||||||||||||||||||||||||||
| Special Mention | ||||||||||||||||||||||||||||||||||||||||||||||||||
| Substandard | ||||||||||||||||||||||||||||||||||||||||||||||||||
| Total Construction | $ | $ | $ | $ | $ | $ | $ | $ | ||||||||||||||||||||||||||||||||||||||||||
| YTD Gross Charge-offs | ||||||||||||||||||||||||||||||||||||||||||||||||||
| Other | ||||||||||||||||||||||||||||||||||||||||||||||||||
| Pass | $ | $ | $ | $ | $ | $ | $ | $ | ||||||||||||||||||||||||||||||||||||||||||
| Special Mention | ||||||||||||||||||||||||||||||||||||||||||||||||||
| Substandard | ||||||||||||||||||||||||||||||||||||||||||||||||||
| Total Other Loans | $ | $ | $ | $ | $ | $ | $ | $ | ||||||||||||||||||||||||||||||||||||||||||
| YTD Gross Charge-offs | ||||||||||||||||||||||||||||||||||||||||||||||||||
| Total Portfolio Loans | ||||||||||||||||||||||||||||||||||||||||||||||||||
| Pass | $ | $ | $ | $ | $ | $ | $ | $ | ||||||||||||||||||||||||||||||||||||||||||
| Special Mention | ||||||||||||||||||||||||||||||||||||||||||||||||||
| Substandard | ||||||||||||||||||||||||||||||||||||||||||||||||||
| Total Portfolio Loans | $ | $ | $ | $ | $ | $ | $ | $ | ||||||||||||||||||||||||||||||||||||||||||
| Current YTD Period: | ||||||||||||||||||||||||||||||||||||||||||||||||||
| YTD Gross Charge-offs | $ | $ | $ | $ | $ | $ | $ | $ | ||||||||||||||||||||||||||||||||||||||||||
At December 31, 2023 and December 31, 2022, the Company had no loans that were risk rated as doubtful. Special mention and substandard loans at December 31, 2023 increased $156.5 million to $313.3 million compared to December 31, 2022, with an increase of $167.5 million in substandard and a decrease of $11.0 million in special mention. The increase of $167.5 million in substandard loans is primarily related to the above mentioned large nonaccrual lending relationship in the other loan category. The $301.9 million of loans related to the Bank’s largest lending relationship were nonperforming and rated as substandard at December 31, 2023. At December 31, 2022 the largest lending relationship in the other segment loans were all accruing and totaled $309.1 million of which, $177.3 million of those loans were pass-rated and $131.8 million of those loans were substandard-rated. The decrease of $11.0 million in special mention is primarily due to the upgrade of a CRE credit totaling $9.9 million to a pass rating.
96
CARTER BANKSHARES, INC. AND SUBSIDIARIES
NOTES TO CONSOLIDATED FINANCIAL STATEMENTS - (continued)
The following table presents loan balances by year of origination and performing and nonperforming status for our portfolio segments as of December 31:
| (Dollars in Thousands) | 2023 | 2022 | 2021 | 2020 | 2019 | 2018 and Prior | Revolving | Total Portfolio Loans | ||||||||||||||||||||||||||||||||||||||||||
| Commercial Real Estate | ||||||||||||||||||||||||||||||||||||||||||||||||||
| Performing | $ | $ | $ | $ | $ | $ | $ | $ | ||||||||||||||||||||||||||||||||||||||||||
| Nonperforming | ||||||||||||||||||||||||||||||||||||||||||||||||||
| Total Commercial Real Estate | $ | $ | $ | $ | $ | $ | $ | $ | ||||||||||||||||||||||||||||||||||||||||||
| Commercial and Industrial | ||||||||||||||||||||||||||||||||||||||||||||||||||
| Performing | $ | $ | $ | $ | $ | $ | $ | $ | ||||||||||||||||||||||||||||||||||||||||||
| Nonperforming | ||||||||||||||||||||||||||||||||||||||||||||||||||
| Total Commercial and Industrial | $ | $ | $ | $ | $ | $ | $ | $ | ||||||||||||||||||||||||||||||||||||||||||
| Residential Mortgages | ||||||||||||||||||||||||||||||||||||||||||||||||||
| Performing | $ | $ | $ | $ | $ | $ | $ | $ | ||||||||||||||||||||||||||||||||||||||||||
| Nonperforming | ||||||||||||||||||||||||||||||||||||||||||||||||||
| Total Residential Mortgages | $ | $ | $ | $ | $ | $ | $ | $ | ||||||||||||||||||||||||||||||||||||||||||
| Other Consumer | ||||||||||||||||||||||||||||||||||||||||||||||||||
| Performing | $ | $ | $ | $ | $ | $ | $ | $ | ||||||||||||||||||||||||||||||||||||||||||
| Nonperforming | ||||||||||||||||||||||||||||||||||||||||||||||||||
| Total Other Consumer | $ | $ | $ | $ | $ | $ | $ | $ | ||||||||||||||||||||||||||||||||||||||||||
| Construction | ||||||||||||||||||||||||||||||||||||||||||||||||||
| Performing | $ | $ | $ | $ | $ | $ | $ | $ | ||||||||||||||||||||||||||||||||||||||||||
| Nonperforming | ||||||||||||||||||||||||||||||||||||||||||||||||||
| Total Construction | $ | $ | $ | $ | $ | $ | $ | $ | ||||||||||||||||||||||||||||||||||||||||||
| Other | ||||||||||||||||||||||||||||||||||||||||||||||||||
| Performing | $ | $ | $ | $ | $ | $ | $ | $ | ||||||||||||||||||||||||||||||||||||||||||
| Nonperforming | ||||||||||||||||||||||||||||||||||||||||||||||||||
| Total Other Loans | $ | $ | $ | $ | $ | $ | $ | $ | ||||||||||||||||||||||||||||||||||||||||||
| Total Portfolio Loans | ||||||||||||||||||||||||||||||||||||||||||||||||||
| Performing | $ | $ | $ | $ | $ | $ | $ | $ | ||||||||||||||||||||||||||||||||||||||||||
| Nonperforming | ||||||||||||||||||||||||||||||||||||||||||||||||||
| Total Portfolio Loans | $ | $ | $ | $ | $ | $ | $ | $ | ||||||||||||||||||||||||||||||||||||||||||
97
CARTER BANKSHARES, INC. AND SUBSIDIARIES
NOTES TO CONSOLIDATED FINANCIAL STATEMENTS - (continued)
| (Dollars in Thousands) | 2022 | 2021 | 2020 | 2019 | 2018 | 2017 and Prior | Revolving | Total Portfolio Loans | ||||||||||||||||||||||||||||||||||||||||||
| Commercial Real Estate | ||||||||||||||||||||||||||||||||||||||||||||||||||
| Performing | $ | $ | $ | $ | $ | $ | $ | $ | ||||||||||||||||||||||||||||||||||||||||||
| Nonperforming | ||||||||||||||||||||||||||||||||||||||||||||||||||
| Total Commercial Real Estate | $ | $ | $ | $ | $ | $ | $ | $ | ||||||||||||||||||||||||||||||||||||||||||
| Commercial and Industrial | ||||||||||||||||||||||||||||||||||||||||||||||||||
| Performing | $ | $ | $ | $ | $ | $ | $ | $ | ||||||||||||||||||||||||||||||||||||||||||
| Nonperforming | ||||||||||||||||||||||||||||||||||||||||||||||||||
| Total Commercial and Industrial | $ | $ | $ | $ | $ | $ | $ | $ | ||||||||||||||||||||||||||||||||||||||||||
| Residential Mortgages | ||||||||||||||||||||||||||||||||||||||||||||||||||
| Performing | $ | $ | $ | $ | $ | $ | $ | $ | ||||||||||||||||||||||||||||||||||||||||||
| Nonperforming | ||||||||||||||||||||||||||||||||||||||||||||||||||
| Total Residential Mortgages | $ | $ | $ | $ | $ | $ | $ | $ | ||||||||||||||||||||||||||||||||||||||||||
| Other Consumer | ||||||||||||||||||||||||||||||||||||||||||||||||||
| Performing | $ | $ | $ | $ | $ | $ | $ | $ | ||||||||||||||||||||||||||||||||||||||||||
| Nonperforming | ||||||||||||||||||||||||||||||||||||||||||||||||||
| Total Other Consumer | $ | $ | $ | $ | $ | $ | $ | $ | ||||||||||||||||||||||||||||||||||||||||||
| Construction | ||||||||||||||||||||||||||||||||||||||||||||||||||
| Performing | $ | $ | $ | $ | $ | $ | $ | $ | ||||||||||||||||||||||||||||||||||||||||||
| Nonperforming | ||||||||||||||||||||||||||||||||||||||||||||||||||
| Total Construction | $ | $ | $ | $ | $ | $ | $ | $ | ||||||||||||||||||||||||||||||||||||||||||
| Other | ||||||||||||||||||||||||||||||||||||||||||||||||||
| Performing | $ | $ | $ | $ | $ | $ | $ | $ | ||||||||||||||||||||||||||||||||||||||||||
| Nonperforming | ||||||||||||||||||||||||||||||||||||||||||||||||||
| Total Other Loans | $ | $ | $ | $ | $ | $ | $ | $ | ||||||||||||||||||||||||||||||||||||||||||
| Total Portfolio Loans | ||||||||||||||||||||||||||||||||||||||||||||||||||
| Performing | $ | $ | $ | $ | $ | $ | $ | $ | ||||||||||||||||||||||||||||||||||||||||||
| Nonperforming | ||||||||||||||||||||||||||||||||||||||||||||||||||
| Total Portfolio Loans | $ | $ | $ | $ | $ | $ | $ | $ | ||||||||||||||||||||||||||||||||||||||||||
Age Analysis of Past-Due Loans by Class
The following tables include an aging analysis of the recorded investment of past-due portfolio loans as the periods presented:
| December 31, 2023 | ||||||||||||||||||||||||||||||||||||||||||||
| (Dollars in Thousands) | Current Loans | Loans 30-59 Days Past Due | Loans 60-89 Days Past Due | Total 30-89 Days Past Due | Past Due 90+ Days Still Accruing | Nonaccrual Loans | Total Portfolio Loans | |||||||||||||||||||||||||||||||||||||
| Commercial Real Estate | $ | $ | $ | $ | $ | $ | $ | |||||||||||||||||||||||||||||||||||||
| Commercial & Industrial | ||||||||||||||||||||||||||||||||||||||||||||
| Residential Mortgages | ||||||||||||||||||||||||||||||||||||||||||||
| Other Consumer | ||||||||||||||||||||||||||||||||||||||||||||
| Construction | ||||||||||||||||||||||||||||||||||||||||||||
| Other | ||||||||||||||||||||||||||||||||||||||||||||
| Total | $ | $ | $ | $ | $ | $ | $ | |||||||||||||||||||||||||||||||||||||
98
CARTER BANKSHARES, INC. AND SUBSIDIARIES
NOTES TO CONSOLIDATED FINANCIAL STATEMENTS - (continued)
| December 31, 2022 | ||||||||||||||||||||||||||||||||||||||
| (Dollars in Thousands) | Current Loans | Loans 30-59 Days Past Due | Loans 60-89 Days Past Due | Total 30-89 Days Past Due | Nonaccrual Loans | Total Portfolio Loans | ||||||||||||||||||||||||||||||||
| Commercial Real Estate | $ | $ | $ | $ | $ | $ | ||||||||||||||||||||||||||||||||
| Commercial & Industrial | ||||||||||||||||||||||||||||||||||||||
| Residential Mortgages | ||||||||||||||||||||||||||||||||||||||
| Other Consumer | ||||||||||||||||||||||||||||||||||||||
| Construction | ||||||||||||||||||||||||||||||||||||||
| Other | ||||||||||||||||||||||||||||||||||||||
| Total | $ | $ | $ | $ | $ | $ | ||||||||||||||||||||||||||||||||
Loans past due 90 days or more and still accruing were zero 1.2 million to $6.0 million at December 31, 2023 compared to $4.8 million at December 31, 2022, primarily in the residential mortgage segment due to two relationships with an aggregate principal balance of $2.9 million.
There were no
The following table presents loans on nonaccrual status and loans past due 90 days or more and still accruing by portfolio segment of loan as of December 31, 2023. There were no loans at December 31, 2023 that were past due more than 90 days and still accruing.
| As of and for the year ended December 31, 2023 | As of and for the year ended December 31, 2022 | |||||||||||||||||||||||||||||||||||||||||||||||||
| (Dollars in Thousands) | Nonaccrual without an Allowance for Credit Losses | Nonaccrual with an Allowance for Credit Losses | Total Nonaccrual Loans | Past Due 90+ Days Still Accruing | Nonaccrual without an Allowance for Credit Losses | Nonaccrual with an Allowance for Credit Losses | Total Nonaccrual Loans | Past Due 90+ Days Still Accruing | ||||||||||||||||||||||||||||||||||||||||||
| Commercial Real Estate | $ | $ | $ | $ | $ | $ | $ | $ | ||||||||||||||||||||||||||||||||||||||||||
| Commercial and Industrial | ||||||||||||||||||||||||||||||||||||||||||||||||||
| Residential Mortgages | ||||||||||||||||||||||||||||||||||||||||||||||||||
| Other Consumer | ||||||||||||||||||||||||||||||||||||||||||||||||||
| Construction | ||||||||||||||||||||||||||||||||||||||||||||||||||
| Other | ||||||||||||||||||||||||||||||||||||||||||||||||||
| Total Portfolio Loans | $ | $ | $ | $ | $ | $ | $ | $ | ||||||||||||||||||||||||||||||||||||||||||
A loan is considered nonperforming when we transfer the interest methodology from accrual to nonaccrual. Nonaccrual status recognizes that the collection in full of both principal and interest is unlikely. Without applying additional scrutiny at a granular level, we believe delinquency to be a leading indicator with respect to the likelihood of collection in full of both principal and interest. Accordingly, we automatically transfer loans to nonaccrual status if they are 90 or more days’ delinquent. Management reserves the right to exercise discretion at the individual loan level. For example, we may elect to transfer a loan to nonaccrual regardless of the delinquency status if we believe the collection in full of both principal and interest to be unlikely. We may also elect to retain a loan that is 90 or more days’ delinquent in accrual status if we believe the loan is well secured and in the process of collection. Nonaccrual loans, and loans that have been characterized as Restructured Loans may be individually evaluated for credit losses in the Allowance for Credit Losses model if the loan commitment is $1.0 million or greater and/or based on management’s discretion; unless we elect to maintain the loan in the general pool. During the years ended December 31, 2023 and December 31, 2022, respectively, no material amount of interest income was recognized on nonperforming loans subsequent to their classification as nonperforming loans.
99
CARTER BANKSHARES, INC. AND SUBSIDIARIES
NOTES TO CONSOLIDATED FINANCIAL STATEMENTS - (continued)
The following table presents the amortized cost basis of individually evaluated loans as of the periods presented. Changes in the fair value of the types of collateral and discounted cash flow modeling for individually evaluated loans, as applicable, are reported as provision for credit loss on loans in the period of change.
| December 31, 2023 | December 31, 2022 | |||||||||||||||||||||||||
| (Dollars in Thousands) | Fair Value - Real Estate | Discounted Cash Flow | Total | Fair Value - Real Estate | ||||||||||||||||||||||
| Commercial Real Estate | $ | $ | $ | |||||||||||||||||||||||
| Commercial and Industrial | ||||||||||||||||||||||||||
| Residential Mortgages | ||||||||||||||||||||||||||
| Other Consumer | ||||||||||||||||||||||||||
| Construction | ||||||||||||||||||||||||||
| Other | ||||||||||||||||||||||||||
| Total | $ | $ | $ | |||||||||||||||||||||||
The following tables presents activity in the ACL for the periods presented:
| December 31, 2023 | ||||||||||||||||||||||||||||||||||||||||||||
| (Dollars in Thousands) | Commercial Real Estate | Commercial & Industrial | Residential Mortgages | Other Consumer | Construction | Other | Total | |||||||||||||||||||||||||||||||||||||
| Allowance for Credit Losses on Loans: | ||||||||||||||||||||||||||||||||||||||||||||
| Balance, Beginning of Year | $ | $ | $ | $ | $ | $ | $ | |||||||||||||||||||||||||||||||||||||
| Provision (Recovery) for Credit Losses on Loans | ( | ( | ||||||||||||||||||||||||||||||||||||||||||
| Charge-offs | ( | ( | ( | ( | ( | |||||||||||||||||||||||||||||||||||||||
| Recoveries | ||||||||||||||||||||||||||||||||||||||||||||
| Net (Charge-offs) / Recoveries | ( | ( | ( | ( | ||||||||||||||||||||||||||||||||||||||||
| Balance, End of Year | $ | $ | $ | $ | $ | $ | $ | |||||||||||||||||||||||||||||||||||||
| December 31, 2022 | ||||||||||||||||||||||||||||||||||||||||||||
| (Dollars in Thousands) | Commercial Real Estate | Commercial & Industrial | Residential Mortgages | Other Consumer | Construction | Other | Total | |||||||||||||||||||||||||||||||||||||
| Allowance for Credit Losses on Loans: | ||||||||||||||||||||||||||||||||||||||||||||
| Balance, Beginning of Year | $ | $ | $ | $ | $ | $ | $ | |||||||||||||||||||||||||||||||||||||
| Provision (Recovery) for Credit Losses on Loans | ( | ( | ||||||||||||||||||||||||||||||||||||||||||
| Charge-offs | ( | ( | ( | ( | ||||||||||||||||||||||||||||||||||||||||
| Recoveries | ||||||||||||||||||||||||||||||||||||||||||||
| Net (Charge-offs) / Recoveries | ( | ( | $ | ( | ||||||||||||||||||||||||||||||||||||||||
| Balance, End of Year | $ | $ | $ | $ | $ | $ | $ | |||||||||||||||||||||||||||||||||||||
| December 31, 2021 | ||||||||||||||||||||||||||||||||||||||||||||
| (Dollars in Thousands) | Commercial Real Estate | Commercial & Industrial | Residential Mortgages | Other Consumer | Construction | Other(1) | Total | |||||||||||||||||||||||||||||||||||||
| Allowance for Credit Losses on Loans: | ||||||||||||||||||||||||||||||||||||||||||||
| Balance, Beginning of Year | $ | $ | $ | $ | $ | $ | $ | |||||||||||||||||||||||||||||||||||||
| Impact of CECL Adoption | ( | ( | ||||||||||||||||||||||||||||||||||||||||||
| (Recovery) Provision for Credit Losses on Loans | ( | ( | ( | |||||||||||||||||||||||||||||||||||||||||
| Charge-offs | ( | ( | ( | ( | ( | ( | ||||||||||||||||||||||||||||||||||||||
| Recoveries | ||||||||||||||||||||||||||||||||||||||||||||
| Net (Charge-offs) / Recoveries | ( | ( | ( | ( | ( | ( | ||||||||||||||||||||||||||||||||||||||
| Balance, End of Year | $ | $ | $ | $ | $ | $ | $ | |||||||||||||||||||||||||||||||||||||
(1) In connection with our adoption of Topic 326, we made changes to our loan portfolio segments to align with the methodology applied in determining the allowance under CECL. Our new segmentation breaks out Other loans from our original loan segments: CRE, C&I, residential mortgages and construction. The allowance balance at the beginning of period was reclassified to Other from their original loan segments: CRE, C&I, residential mortgages and construction to conform to current presentation.
100
CARTER BANKSHARES, INC. AND SUBSIDIARIES
NOTES TO CONSOLIDATED FINANCIAL STATEMENTS - (continued)
NOTE 7 - FAIR VALUE MEASUREMENTS
The following tables present the Company’s financial assets and liabilities that are measured at fair value on a recurring basis by fair value hierarchy level at the dates presented:
| December 31, 2023 | ||||||||||||||||||||||||||
| (Dollars in Thousands) | Carrying Value | Quoted Prices In Active Markets for Identical Assets (Level 1) | Significant Other Observable Inputs (Level 2) | Significant Unobservable Inputs (Level 3) | ||||||||||||||||||||||
| Assets | ||||||||||||||||||||||||||
| Securities Available-for-Sale: | ||||||||||||||||||||||||||
| U.S. Government Agency Securities | ||||||||||||||||||||||||||
| Residential Mortgage-Backed Securities | ||||||||||||||||||||||||||
| Commercial Mortgage-Backed Securities | ||||||||||||||||||||||||||
| Other Commercial Mortgage-Backed Securities | ||||||||||||||||||||||||||
| Asset Backed Securities | ||||||||||||||||||||||||||
| Collateralized Mortgage Obligations | ||||||||||||||||||||||||||
| States and Political Subdivisions | ||||||||||||||||||||||||||
| Corporate Notes | ||||||||||||||||||||||||||
| Total Securities Available-for-Sale | ||||||||||||||||||||||||||
| Derivatives | ||||||||||||||||||||||||||
| Total | $ | $ | $ | $ | ||||||||||||||||||||||
| Liabilities | ||||||||||||||||||||||||||
| Derivatives | $ | $ | $ | $ | ||||||||||||||||||||||
| Total | $ | $ | $ | $ | ||||||||||||||||||||||
| December 31, 2022 | ||||||||||||||||||||||||||
| (Dollars in Thousands) | Carrying Value | Quoted Prices In Active Markets for Identical Assets (Level 1) | Significant Other Observable Inputs (Level 2) | Significant Unobservable Inputs (Level 3) | ||||||||||||||||||||||
| Assets | ||||||||||||||||||||||||||
| Securities Available-for-Sale: | ||||||||||||||||||||||||||
| U.S. Treasury Securities | $ | $ | $ | $ | ||||||||||||||||||||||
| U.S. Government Agency Securities | ||||||||||||||||||||||||||
| Residential Mortgage-Backed Securities | ||||||||||||||||||||||||||
| Commercial Mortgage-Backed Securities | ||||||||||||||||||||||||||
| Other Commercial Mortgage-Backed Securities | ||||||||||||||||||||||||||
| Asset Backed Securities | ||||||||||||||||||||||||||
| Collateralized Mortgage Obligations | ||||||||||||||||||||||||||
| States and Political Subdivisions | ||||||||||||||||||||||||||
| Corporate Notes | ||||||||||||||||||||||||||
| Total Securities Available-for-Sale | ||||||||||||||||||||||||||
| Derivatives | ||||||||||||||||||||||||||
| Total | $ | $ | $ | $ | ||||||||||||||||||||||
| Liabilities | ||||||||||||||||||||||||||
| Derivatives | $ | $ | $ | $ | ||||||||||||||||||||||
| Total | $ | $ | $ | $ | ||||||||||||||||||||||
101
CARTER BANKSHARES, INC. AND SUBSIDIARIES
NOTES TO CONSOLIDATED FINANCIAL STATEMENTS - (continued)
We have invested in subordinated debt of other financial institutions. We have two securities totaling $7.3 million that are considered to be Level 3 securities at December 31, 2023 and two totaling $7.5 million at December 31, 2022. The change in the fair value of Level 3 securities available-for-sale from $7.5 million at December 31, 2022 to $7.3 million at December 31, 2023 is attributable to the calculated change in fair value of $0.2 million. The Level 3 fair value is benchmarked to other securities that have observable market values in Level 2 using comparable financial ratio analysis specific to the industry in which the underlying company operates. The underwriting includes considerations of capital adequacy, asset quality trends, management’s ability to continue efficient and profitable operations, the institution’s core earnings ability, liquidity management platform and current on and off-balance sheet interest rate risk exposures.
Financial assets measured at fair value on a nonrecurring basis at December 31, 2023 and 2022 are summarized below:
| December 31, 2023 | ||||||||||||||||||||||||||
| (Dollars in Thousands) | Level 1 | Level 2 | Level 3 | Fair Value | ||||||||||||||||||||||
| OREO | $ | $ | $ | $ | ||||||||||||||||||||||
| Individually Evaluated Loans | $ | $ | $ | $ | ||||||||||||||||||||||
| December 31, 2022 | ||||||||||||||||||||||||||
| (Dollars in Thousands) | Level 1 | Level 2 | Level 3 | Fair Value | ||||||||||||||||||||||
| OREO | $ | $ | $ | $ | ||||||||||||||||||||||
| Individually Evaluated Loans | $ | $ | $ | $ | ||||||||||||||||||||||
The Company had no individually evaluated loans measured at fair value on a nonrecurring basis as of December 31, 2023. Individually evaluated loans had a net carrying amount of $2.6 million at December 31, 2022, including a valuation allowance of $0.7 million. The Company’s largest lending relationship is classified at December 31, 2023 as an individually evaluated loan with a net carrying amount totaling $247.6 million. The Company utilized various cash flow and discounting assumptions in the alternative modeling, instead of fair value, which resulted in a valuation allowance of $54.3 million at December 31, 2023. When evaluating the net carrying value of this credit relationship at December 31, 2023, the Company utilized discounted cash flow valuation techniques to estimate the timing and magnitude of potential recoveries resulting from various collection processes.
OREO, which is measured at the lower of carrying or fair value less costs to sell, had a net carrying amount of $2.5 million as of December 31, 2023, compared with $8.4 million at December 31, 2022, primarily due to sales, write-downs on OREO and payments, offset by $1.4 million in fair value of closed retail offices transferred to OREO. Write-downs of $1.1 million were recorded on OREO for the year ended December 31, 2023 compared to $0.7 million for the year ended December 31, 2022.
The following tables summarize the Company’s assets that were measured at fair value on a nonrecurring basis as of December 31, 2023 and 2022:
| December 31, 2023 | ||||||||||||||||||||||||||||||||||||||
| (Dollars in Thousands) | Fair Value | Valuation Technique | Unobservable Inputs | Weighted Range | Average | |||||||||||||||||||||||||||||||||
| Assets | ||||||||||||||||||||||||||||||||||||||
| OREO | $ | Appraisals | Estimated Selling Costs | % | ||||||||||||||||||||||||||||||||||
| OREO | Internal Valuations | Estimated Selling Costs | % | |||||||||||||||||||||||||||||||||||
| OREO | Discounted Internal Valuations | Management's Subject Discount | — | % | ||||||||||||||||||||||||||||||||||
| Total OREO | $ | |||||||||||||||||||||||||||||||||||||
102
CARTER BANKSHARES, INC. AND SUBSIDIARIES
NOTES TO CONSOLIDATED FINANCIAL STATEMENTS - (continued)
| December 31, 2022 | ||||||||||||||||||||||||||||||||||||||
| (Dollars in Thousands) | Fair Value | Valuation Technique | Unobservable Inputs | Weighted Range | Average | |||||||||||||||||||||||||||||||||
| Assets | ||||||||||||||||||||||||||||||||||||||
| Individually Evaluated Loans | $ | Discounted Internal Valuations | Management's Discount & Estimated Selling Costs | % | ||||||||||||||||||||||||||||||||||
| Individually Evaluated Loans | Discounted Appraisals | Estimated Selling Costs | % | |||||||||||||||||||||||||||||||||||
| Total Individually Evaluated Loans | $ | |||||||||||||||||||||||||||||||||||||
| OREO | $ | Appraisals | Estimated Selling Costs | % | ||||||||||||||||||||||||||||||||||
| OREO | Internal Valuations | Estimated Selling Costs | % | |||||||||||||||||||||||||||||||||||
| OREO | Discounted Internal Valuations | Management’s Discount & Estimated Selling Costs | — | % | ||||||||||||||||||||||||||||||||||
| Total OREO | $ | |||||||||||||||||||||||||||||||||||||
A baseline discount rate has been established for impairment measurement. This baseline discount rate was back tested against historical OREO sales and therefore represents an average recovery rate based on the transaction sizes and asset types in the population examined. Management considers the unique attributes and characteristics of each specific individually evaluated loan and may use judgment to adjust the baseline discount rate when appropriate.
The carrying values and estimated fair values of our financial instruments at December 31, 2023 and December 31, 2022 are presented in the following tables. Fair values for December 31, 2023 and December 31, 2022 are estimated under the exit price notion in accordance with ASU 2016-01, “Recognition and Measurement of Financial Assets and Financial Liabilities.”
GAAP requires disclosure of fair value information about financial instruments carried at book value on the Consolidated Balance Sheet. In cases where quoted market prices are not available, fair values are based on estimates using present value or other valuation techniques. Those techniques are significantly affected by the assumptions used, including the discount rate and estimates of future cash flows. In that regard, the derived fair value estimates cannot be substantiated by comparison to independent markets and, in many cases, could not be realized in immediate settlement of the instruments. Accordingly, the aggregate fair value amounts presented do not represent the underlying value of the Company.
| Fair Value Measurements at December 31, 2023 | ||||||||||||||||||||||||||||||||
| (Dollars in Thousands) | Carrying Value | Level 1 | Level 2 | Level 3 | Total | |||||||||||||||||||||||||||
| Financial Assets: | ||||||||||||||||||||||||||||||||
| Cash and Cash Equivalents | $ | $ | $ | $ | $ | |||||||||||||||||||||||||||
| Securities Available-for-Sale | ||||||||||||||||||||||||||||||||
| Portfolio Loans, net | ||||||||||||||||||||||||||||||||
| Federal Home Loan Bank Stock, at Cost | NA | NA | ||||||||||||||||||||||||||||||
| Other Assets- Interest Rate Derivatives | ||||||||||||||||||||||||||||||||
| Accrued Interest Receivable | ||||||||||||||||||||||||||||||||
| Financial Liabilities: | ||||||||||||||||||||||||||||||||
| Deposits | $ | $ | $ | $ | $ | |||||||||||||||||||||||||||
| Other Liabilities- Interest Rate Derivatives | ||||||||||||||||||||||||||||||||
| FHLB Borrowings | ||||||||||||||||||||||||||||||||
| Federal Funds Purchased | ||||||||||||||||||||||||||||||||
| Accrued Interest Payable | ||||||||||||||||||||||||||||||||
103
CARTER BANKSHARES, INC. AND SUBSIDIARIES
NOTES TO CONSOLIDATED FINANCIAL STATEMENTS - (continued)
| Fair Value Measurements at December 31, 2022 | ||||||||||||||||||||||||||||||||
| (Dollars in Thousands) | Carrying Value | Level 1 | Level 2 | Level 3 | Total | |||||||||||||||||||||||||||
| Financial Assets: | ||||||||||||||||||||||||||||||||
| Cash and Cash Equivalents | $ | $ | $ | $ | $ | |||||||||||||||||||||||||||
| Securities Available-for-Sale | ||||||||||||||||||||||||||||||||
| Portfolio Loans, net | ||||||||||||||||||||||||||||||||
| Federal Home Loan Bank Stock, at Cost | NA | NA | ||||||||||||||||||||||||||||||
| Other Assets- Interest Rate Derivatives | ||||||||||||||||||||||||||||||||
| Accrued Interest Receivable | ||||||||||||||||||||||||||||||||
| Financial Liabilities: | ||||||||||||||||||||||||||||||||
| Deposits | $ | $ | $ | $ | $ | |||||||||||||||||||||||||||
| Other Liabilities- Interest Rate Derivatives | ||||||||||||||||||||||||||||||||
| FHLB Borrowings | ||||||||||||||||||||||||||||||||
| Federal Funds Purchased | ||||||||||||||||||||||||||||||||
| Accrued Interest Payable | ||||||||||||||||||||||||||||||||
NOTE 8 - RIGHT-OF-USE (“ROU”) ASSETS AND LEASE LIABILITIES
The Company has seven lease contracts, including five finance leases and two operating leases at December 31, 2023. These leases are for our branch and loan production facilities. There was one new lease agreement entered into in 2023.
The following table presents our lease expense for finance and operating leases for the periods presented:
| December 31, | ||||||||||||||||||||
| (Dollars in Thousands) | 2023 | 2022 | 2021 | |||||||||||||||||
| Operating Lease Expense | $ | $ | $ | |||||||||||||||||
| Amortization of ROU Assets - finance leases | ||||||||||||||||||||
| Interest on lease liabilities - finance leases | ||||||||||||||||||||
| Total Lease Expense | $ | $ | $ | |||||||||||||||||
ROU assets are included in in the Consolidated Balance Sheets. The following table presents our ROU assets, cash flows, weighted average lease terms, discount rates for finance and operating leases and ROU assets obtained in exchange for lease liabilities for the periods presented:
| December 31, | ||||||||||||||
| (Dollars in Thousands) | 2023 | 2022 | ||||||||||||
| Operating Leases | ||||||||||||||
| ROU assets | $ | $ | ||||||||||||
| Operating cash flows | $ | $ | ||||||||||||
| Finance Leases | ||||||||||||||
| ROU assets | $ | $ | ||||||||||||
| Operating cash flows | $ | $ | ||||||||||||
| Financing cash flows | $ | $ | ||||||||||||
| Weighted Average Lease Term - Years | ||||||||||||||
| Operating leases | — | |||||||||||||
| Finance leases | ||||||||||||||
| Weighted Average Discount Rate | ||||||||||||||
| Operating leases | % | % | ||||||||||||
| Finance leases | % | % | ||||||||||||
| ROU Assets obtained in exchange for Lease Liabilities | ||||||||||||||
| Operating leases | $ | $ | ||||||||||||
| Finance leases | $ | $ | ||||||||||||
104
CARTER BANKSHARES, INC. AND SUBSIDIARIES
NOTES TO CONSOLIDATED FINANCIAL STATEMENTS - (continued)
Lease liabilities are included in in the Consolidated Balance Sheets. The following table presents the maturity analysis of lease liabilities for finance and operating leases as of December 31, 2023:
| (Dollars in Thousands) | Finance | Operating | Total | |||||||||||||||||
| Maturity Analysis | ||||||||||||||||||||
| 2024 | $ | $ | $ | |||||||||||||||||
| 2025 | ||||||||||||||||||||
| 2026 | ||||||||||||||||||||
| 2027 | ||||||||||||||||||||
| 2028 | ||||||||||||||||||||
| Thereafter | ||||||||||||||||||||
| Total | 0 | |||||||||||||||||||
| Less: Present value discount | ( | ( | ( | |||||||||||||||||
| Lease Liabilities | $ | $ | $ | |||||||||||||||||
NOTE 9 - PREMISES AND EQUIPMENT
Premises and equipment are stated at cost less accumulated depreciation as follows:
| December 31, | ||||||||||||||
| (Dollars in Thousands) | 2023 | 2022 | ||||||||||||
| Land | $ | $ | ||||||||||||
| Bank Premises | ||||||||||||||
| Furniture and Equipment | ||||||||||||||
| Leasehold Improvements | ||||||||||||||
| Total Premises and Equipment | ||||||||||||||
| Accumulated Depreciation | ( | ( | ||||||||||||
| Total | $ | $ | ||||||||||||
At both December 31, 2023 and December 31, 2022, we had no
Depreciation expense is included under occupancy expense, net in the Consolidated Statements of Income totaling $6.2 million in 2023, $6.1 million in 2022, and $6.2 million in 2021.
Real estate on closed branches were valued based on recent comparative market values received from a real estate broker. The Company had $0.5 million in write-downs in 2023 and write-downs in the amount of $0.6 million and $3.2 million were recognized during 2022 and 2021, respectively. These write-downs on closed branches are included in losses and write-downs on OREO, net in the Consolidated Statements of Income. The net remaining carrying value of $2.3 million and $1.1 million is classified as held-for-sale in OREO in the Consolidated Balance Sheets as of December 31, 2023 and 2022, respectively.
NOTE 10 - OTHER REAL ESTATE OWNED
The following table presents OREO activity as of the dates presented:
| Year Ended December 31, | ||||||||||||||||||||
| (Dollars in Thousands) | 2023 | 2022 | 2021 | |||||||||||||||||
| Beginning of Year Balance | $ | $ | $ | |||||||||||||||||
| Loans Transferred to OREO | ||||||||||||||||||||
| Transfer of Closed Retail Offices to OREO | ||||||||||||||||||||
| Capitalized Expenditures | ||||||||||||||||||||
| Direct Write-Downs | ( | ( | ( | |||||||||||||||||
| Cash Proceeds from Pay-downs | ( | ( | ( | |||||||||||||||||
| Sales of OREO | ( | ( | ( | |||||||||||||||||
| End of Year Balance | $ | $ | $ | |||||||||||||||||
105
CARTER BANKSHARES, INC. AND SUBSIDIARIES
NOTES TO CONSOLIDATED FINANCIAL STATEMENTS - (continued)
At December 31, 2023, 2022, and 2021, the balance of OREO includes $0.2 million, $7.3 million, and $9.9 million, respectively, of foreclosed properties recorded as a result of obtaining physical possession of the asset. At December 31, 2023 and 2022, the recorded investment of foreclosed residential real estate was $62 thousand and $133 thousand, respectively. At December 31, 2023 and 2022, the recorded investment of consumer mortgage loans secured by residential real estate properties for which formal foreclosure proceeds are in process is $2.0 million and $0.9 million, respectively.
Income and expenses applicable to foreclosed assets include the following:
| Year Ended December 31, | ||||||||||||||||||||
| (Dollars in Thousands) | 2023 | 2022 | 2021 | |||||||||||||||||
| Provision for Losses | $ | $ | $ | |||||||||||||||||
| Operating Expenses, net of Rental Income | ||||||||||||||||||||
| Net (Gain) Loss on Sales | ( | ( | ||||||||||||||||||
| OREO Expense | $ | $ | $ | |||||||||||||||||
NOTE 11 – DERIVATIVE INSTRUMENTS AND HEDGING ACTIVITIES
In accordance with applicable accounting guidance for derivatives and hedging, all derivatives are recognized as either or on the Consolidated Balance Sheet at fair value. Interest rate swaps are contracts in which a series of interest rate flows (fixed and variable) are exchanged over a prescribed period. The notional amounts on which the interest payments are based are not exchanged. These derivative positions relate to transactions in which the Company enters into an interest rate swap with a commercial customer while at the same time entering into an offsetting interest rate swap with another financial institution, or counterparty. In connection with each transaction, the Company originates a floating rate loan to the customer at a notional amount. In turn, the customer contracts with the counterparty to swap the stream of cash flows associated with the floating interest rate loan with the Company for a stream of fixed interest rate cash flows based on the same notional amount as the Company’s loan. The transaction allows the customer to effectively convert a variable rate loan to a fixed rate loan with the Company receiving a variable rate. These agreements could have floors or caps on the contracted interest rates.
Pursuant to agreements with various financial institutions, the Company may receive collateral or may be required to post collateral based upon mark-to-market positions. Beyond unsecured threshold levels, collateral in the form of cash or securities may be made available to counterparties of interest rate swap transactions. Based upon current positions and related future collateral requirements relating to them, management believes any effect on our cash flow or liquidity position to be immaterial.
Derivatives contain an element of credit risk, the possibility that the Company will incur a loss because a counterparty, which may be a financial institution or a customer, fails to meet its contractual obligations. All derivative contracts with financial institutions may be executed only with counterparties approved by the Asset and Liability Committee (“ALCO”) and all derivatives with customers are approved by a team of members from senior management who have been trained to understand the risk associated with interest rate swaps and have past industry experience. Interest rate swaps are considered derivatives but are not accounted for using hedge accounting. As such, changes in the estimated fair value of the derivatives are recorded in current earnings in the Consolidated Statements of Income.
The following table indicates the amounts representing the fair value of derivative assets and derivative liabilities at December 31:
| Fair Values of Derivative Instruments Asset Derivatives (Included in Other Assets) | ||||||||||||||||||||||||||||||||||||||
| (Dollars in Thousands) | 2023 | 2022 | ||||||||||||||||||||||||||||||||||||
| Number of Transactions | Notional Amount | Fair Value | Number of Transactions | Notional Amount | Fair Value | |||||||||||||||||||||||||||||||||
| Derivatives not Designated as Hedging Instruments | ||||||||||||||||||||||||||||||||||||||
| Interest Rate Lock Commitments – Mortgage Loans | $ | $ | $ | $ | $ | |||||||||||||||||||||||||||||||||
| Interest Rate Swap Contracts – Commercial Loans | ||||||||||||||||||||||||||||||||||||||
| Total Derivatives not Designated as Hedging Instruments | $ | $ | $ | $ | ||||||||||||||||||||||||||||||||||
106
CARTER BANKSHARES, INC. AND SUBSIDIARIES
NOTES TO CONSOLIDATED FINANCIAL STATEMENTS - (continued)
| Fair Values of Derivative Instruments Liability Derivatives (Included in Other Liabilities) | ||||||||||||||||||||||||||||||||||||||
| (Dollars in Thousands) | 2023 | 2022 | ||||||||||||||||||||||||||||||||||||
| Number of Transactions | Notional Amount | Fair Value | Number of Transactions | Notional Amount | Fair Value | |||||||||||||||||||||||||||||||||
| Derivatives not Designated as Hedging Instruments | ||||||||||||||||||||||||||||||||||||||
| Forward Sale Contracts – Mortgage Loans | $ | $ | $ | $ | ||||||||||||||||||||||||||||||||||
| Interest Rate Swap Contracts – Commercial Loans | ||||||||||||||||||||||||||||||||||||||
| Total Derivatives not Designated as Hedging Instruments | $ | $ | $ | $ | ||||||||||||||||||||||||||||||||||
The following table indicates the (loss) income recognized in the Consolidated Statements of Income for derivatives for the years ended December 31:
| (Dollars in Thousands) | 2023 | 2022 | 2021 | |||||||||||||||||
| Derivatives not Designated as Hedging Instruments | ||||||||||||||||||||
| Interest Rate Lock Commitments – Mortgage Loans | $ | $ | $ | |||||||||||||||||
| Forward Sale Contracts – Mortgage Loans | ( | ( | ||||||||||||||||||
| Interest Rate Swap Contracts – Commercial Loans | ( | |||||||||||||||||||
| Total Derivative (Loss) Income | $ | ( | $ | $ | ||||||||||||||||
Presenting offsetting derivatives that are subject to legally enforceable netting arrangements with the same party is permitted. For example, we may have a derivative asset and a derivative liability with the same counterparty to a swap transaction and are permitted to offset the asset position and the liability position resulting in a net presentation.
The following table indicates the gross amounts of commercial loan swap derivative assets and derivative liabilities, the amounts offset and the carrying values included in the Consolidated Balance Sheets at December 31:
| Asset Derivatives (Included in Other Assets) | Liability Derivatives (Included in Other Liabilities) | |||||||||||||||||||||||||
| (Dollars in Thousands) | 2023 | 2022 | 2023 | 2022 | ||||||||||||||||||||||
| Derivatives not Designated as Hedging Instruments | ||||||||||||||||||||||||||
| Gross Amounts Recognized | $ | $ | $ | $ | ||||||||||||||||||||||
| Gross Amounts Offset | ||||||||||||||||||||||||||
| Net Amounts Presented in the Consolidated Balance Sheets | ||||||||||||||||||||||||||
Gross Amounts Not Offset (1) | ||||||||||||||||||||||||||
| Net Amount | $ | $ | $ | $ | ||||||||||||||||||||||
(1) Amounts represent collateral posted for the periods presented.
NOTE 12 – DEPOSITS
The following table presents the composition of deposits at December 31:
| (Dollars in Thousands) | 2023 | 2022 | ||||||||||||
| Noninterest-Bearing Demand | $ | $ | ||||||||||||
| Interest-Bearing Demand | ||||||||||||||
| Money Market | ||||||||||||||
| Savings | ||||||||||||||
| Certificates of Deposits | ||||||||||||||
| Total | $ | $ | ||||||||||||
All deposit accounts are insured by the FDIC up to the maximum amount allowed by law. The Dodd-Frank Act, signed into law on July 21, 2010, makes permanent the $250,000 limit for federal deposit insurance and the coverage limit applies per
107
CARTER BANKSHARES, INC. AND SUBSIDIARIES
NOTES TO CONSOLIDATED FINANCIAL STATEMENTS - (continued)
depositor, per insured depository institution for each account ownership. Certificates of deposits that exceed the FDIC Insurance limit of $250,000 at year-end 2023 and 2022 were $305.0 million and $159.0 million, respectively.
At December 31, 2023 and December 31, 2022, total brokered deposits (excluding the CDARS and ICS two-way) were $70.0 million and zero , respectively.
Certificates of Deposit maturing as of December 31:
| (Dollars in Thousands) | 2023 | |||||||
| 2024 | $ | |||||||
| 2025 | ||||||||
| 2026 | ||||||||
| 2027 | ||||||||
| 2028 | ||||||||
| Thereafter | ||||||||
| Total | $ | |||||||
Overdrafts reclassified to loans were $0.3
Total deposit dollars from executive officers, directors, and their related interests at December 31, 2023 and 2022, respectively, were $1.8 million and $2.9 million.
NOTE 13 – FEDERAL HOME LOAN BANK BORROWINGS AND FEDERAL FUNDS PURCHASED
Borrowings serve as an additional source of liquidity for the Company. The Company had $393.4 million FHLB borrowings at December 31, 2023 and $180.6 million at December 31, 2022. FHLB borrowings are fixed and variable rate advances for various terms and are secured by a blanket lien on select residential mortgages, select multifamily loans, and select commercial real estate loans. Total loans pledged as collateral were $1.5 no
At December 31, 2023, funding sources accessible to the Company include borrowing availability at the FHLB, equal to 25 % of the Company’s assets or approximately $1.1 billion, subject to the amount of eligible collateral pledged, of which the Company is eligible to borrow up to an additional $480.3 million. The Company has unsecured facilities with three other correspondent financial institutions totaling $50.0 million and access to the institutional CD and brokered deposit markets. The Company did not have outstanding borrowings on these fed funds lines as of December 31, 2023. The Company had the capacity to borrow up to an additional $676.7 million from the FHLB at December 31, 2022.
The Company had no overnight federal funds purchased at December 31, 2023. There were $17.9 million outstanding overnight federal funds purchased at December 31, 2022.
The following table represents the balance of FHLB borrowings, the weighted average interest rate, the interest expense and the borrowing availability for the years ended December 31:
| (Dollars in Thousands) | 2023 | 2022 | 2021 | |||||||||||||||||
| FHLB Borrowings | $ | $ | $ | |||||||||||||||||
| Weighted Average Interest Rate | % | % | % | |||||||||||||||||
| Interest Expense | $ | $ | $ | |||||||||||||||||
| FHLB Availability | $ | $ | $ | |||||||||||||||||
108
CARTER BANKSHARES, INC. AND SUBSIDIARIES
NOTES TO CONSOLIDATED FINANCIAL STATEMENTS - (continued)
The following table represents the balance of federal funds purchased, the weighted average interest rate, the interest expense and the borrowing availability for the years ended December 31:
| (Dollars in Thousands) | 2023 | 2022 | 2021 | |||||||||||||||||
| Federal Funds Purchased | $ | $ | $ | |||||||||||||||||
| Weighted Average Interest Rate | % | % | % | |||||||||||||||||
| Interest Expense | $ | $ | $ | |||||||||||||||||
| Federal Funds Purchased Availability | $ | $ | $ | |||||||||||||||||
Scheduled annual maturities and weighted average interest rates for FHLB borrowings for each of the five years subsequent to December 31, 2023 and thereafter are as follows:
| (Dollars in Thousands) | Balance | Weighted Average Rate | ||||||||||||
| 2024 | $ | % | ||||||||||||
| 2025 | % | |||||||||||||
| 2026 | % | |||||||||||||
| 2027 | % | |||||||||||||
| 2028 | % | |||||||||||||
| Thereafter | % | |||||||||||||
| Total FHLB Borrowings | $ | % | ||||||||||||
NOTE 14 - EMPLOYEE BENEFIT PLANS
The Company has adopted an integrated profit sharing plan, which allows for elective deferrals and non-elective profit sharing contributions. Associates become eligible for the elective deferrals at the beginning of the quarter after they have been employed at least a month and have reached the age of twenty years and six months. Associates are eligible for the non-elective profit sharing contributions at the beginning of the quarter after they have been employed six months and have reached the age of twenty years and six months. Vesting for the non-elective profit sharing contribution is based on years of service to the Company, with a year being any year an employee works a minimum of 1,000 hours.
The following table details the vesting schedule based on years of service for participants:
| 1 Year of Service | ||||||||||||||
| 2 Years of Service | ||||||||||||||
| 3 Years of Service | ||||||||||||||
| 4 Years of Service | ||||||||||||||
| 5 Years of Service | ||||||||||||||
Any participant who has reached the age of 62 is fully vested regardless of length of service. Each participant in the plan (who has not reached age 62) becomes 100 % vested after five (5 ) years of service. The non-elective contribution to the plan is determined each year by the Company’s Board of Directors (the “Board”) and thus may fluctuate in amount from year to year. The contribution by the Company, which includes contributions to the nonqualified plan discussed below, was $0.4 million in 2023, $1.0 million in 2022 and $0.9 million in 2021. These amounts are included in salaries and employee benefits in the Consolidated Statements of Income.
Beginning in 2019, our integrated profit sharing plan includes a Company match based upon an associate’s elective deferral. This elective deferral is subject to dollar limits announced annually by the Internal Revenue Service (“IRS”). Elective deferrals are matched equal to 100 % of the first 3 % deferred and 50 % of the next 2 %, producing a maximum 4 % match. Expense for this deferral match was $1.4 million, $1.3 million and $1.3 million for the years ended December 31, 2023, 2022 and 2021, respectively.
The Bank entered into a Nonqualified Profit Sharing Plan originally on December 30, 1996, which was subsequently amended and restated effective December 20, 2007. The purpose of the Nonqualified Profit Sharing Plan was to provide additional benefits to be paid to the executive upon the occurrence of a “Distributable Event,” which is either termination or death. The
109
CARTER BANKSHARES, INC. AND SUBSIDIARIES
NOTES TO CONSOLIDATED FINANCIAL STATEMENTS - (continued)
board of directors of the Bank (the “Bank Board”) approved the amended plan on December 20, 2007. Since its inception, the Bank’s former Chairman and Chief Executive Officer was the only executive who participated in the Nonqualified Profit Sharing Plan. In April 2017, a Distributable Event occurred, in which distributions will occur over 45 quarterly payments. The value of the plan was $0.6 million as of December 31, 2023, and was solely comprised of cash. The quarterly distributions began on January 1, 2018 and will continue to be paid out in equal quarterly installments approximating $30 thousand.
On December 15, 2020, the Bank adopted an unfunded, nonqualified deferred compensation plan, called the Nonqualified Deferred Compensation Plan, to provide (i) certain key executives of the Bank (beginning after the date of adoption) the opportunity to defer to a later year on a pre-tax basis certain compensation without being subject to the dollar limits that apply to these associates under the Bank’s tax-qualified integrated profit-sharing plan and (ii) the Bank’s non-employee directors (beginning in January 2022) the opportunity to defer to a later year on a pre-tax basis certain director fees. The compensation and fees (and related earnings) deferred under this plan are held in a grantor trust until paid to the participants and remain subject to the claims of the creditors of the Bank and Company until paid to the participants. The balance in the nonqualified deferred compensation plan at December 31, 2023 and December 31, 2022 was $447.8 thousand and $269.6 thousand, respectively.
NOTE 15 – INCENTIVE AND RESTRICTED STOCK PLAN
The Bank Board adopted the Carter Bank & Trust 2018 Omnibus Equity Incentive Plan on March 29, 2018 based on the recommendation of the Bank’s Nominating and Compensation Committee (now, a committee of the Company, the “Committee”), which became effective on June 27, 2018. In connection with the Reorganization, the Company adopted and assumed the Carter Bank & Trust 2018 Omnibus Equity Incentive Plan as its own (now the Carter Bankshares, Inc. Amended and Restated 2018 Omnibus Equity Incentive Plan, or, for purposes of this discussion, the “Plan”). The Plan reserves a total 2,000,000 shares of common stock for issuance and provides for the grant to key associates and non-employee directors of the Company and its subsidiaries of awards that may include one or more of the following: stock options, restricted stock, restricted stock units, stock appreciation rights, stock awards, performance units and performance cash awards (collectively, the “awards”). Subject to accelerated vesting under certain circumstances, the Plan requires a minimum vesting period of one year for awards subject to time-based conditions and a minimum performance period of one year for awards subject to achievement or satisfaction of performance goals. These minimums are applicable to awards other than those granted as part of a retainer for the service of non-employee directors. The Committee will determine the vesting period on the awards. No awards may be granted under the Plan more than ten years from the effective date of the Plan. As of December 31, 2023, 1,538,804 shares of common stock were available for issuance under the Plan. For purposes of this Note 15, references to the “Company” mean the “Bank” with respect to actions prior to the Reorganization.
Restricted Stock
The Company periodically issues restricted stock to non-employee directors and key associates pursuant to the Plan. As of December 31, 2023, 478,969 shares of restricted stock had been granted under the Plan.
The Company granted 116,325 and 108,855 shares of restricted stock to key associates under the Plan during 2023 and 2022, respectively. These grants were approved by the Committee as compensation for substantial contributions to the Company’s performance. The time-based shares of restricted stock granted in 2023 to executives vest in one-third annual installments over three years under the short-term incentive plan. The time-based shares of restricted stock granted in 2022 to executives vest on the fifth anniversary of the grant date under the long-term incentive plan. The time-based shares of restricted stock to non-executives vest in one-third annual installments over three years . The closing price of our stock was used to determine the fair value on the date of the grant prior to September 1, 2023. Beginning September 1, 2023 the Company utilizes a 90-day look back period to estimate the average stock price to resolve issues of rapid stock price fluctuations.
The Company granted 20,772 and 18,500 shares of restricted stock to non-employee directors under the Plan during 2023 and 2022, respectively. These grants were approved by the Committee as compensation for Board service. The time-based shares of restricted stock granted in 2023 and 2022 fully vest one year
If any award granted under the Plan terminates, expires, or lapses for any reason other than by virtue of exercise or settlement of the award, or if shares issued pursuant to awards are forfeited, any stock subject to such award again shall be available for future awards under the Plan.
110
CARTER BANKSHARES, INC. AND SUBSIDIARIES
NOTES TO CONSOLIDATED FINANCIAL STATEMENTS - (continued)
Compensation expense for restricted stock is recognized ratably over the period of service, generally the entire vesting period, based on fair value on the grant date. The Company recognized compensation expense of $1.6 million, $1.3 million and $1.0 million for 2023, 2022, and 2021, respectively, related to restricted stock.
As of December 31, 2023 and 2022, there was $2.1 million and $1.6 million, respectively, of total unrecognized compensation cost related to restricted stock that will be recognized as compensation expense over a weighted average period of 2.01 years and 2.30 years, respectively.
The following table provides information about restricted stock granted under the Plan for the years ended December 31:
| Restricted Shares | Weighted Average Grant Date Fair Value | |||||||||||||
| Non-vested at December 31, 2021 | $ | |||||||||||||
| Granted | ||||||||||||||
| Forfeited/Vested | ( | |||||||||||||
| Non-vested at December 31, 2022 | ||||||||||||||
| Granted | ||||||||||||||
| Forfeited/Vested | ( | |||||||||||||
| Non-vested at December 31, 2023 | $ | |||||||||||||
Performance Units
The Company periodically grants performance units to executive officers pursuant to the Plan. The Company did not grant performance units during 2023 but granted 27,848 target amounts of performance units in aggregate to executive officers under the Plan during 2022. The closing price of $15.81 was used during 2022 to determine the fair value on the date of the grant. These grants are approved by the Committee as compensation for substantial contributions to the Company’s performance.
The performance units can be earned up to a maximum of 110 % of the target amount. They are subject to a three-year performance period and, if the performance criteria are met, will vest on the payment date which is within 70 days following the end of the performance period. The payout for the performance units will be determined based on three weighted performance based goals: (1) the Company's return on average assets (“ROAA”) performance during the performance period compared to its selected peer group, (2) the Company's core efficiency ratio during the performance period compared to its selected peer group, and (3) the Company’s nonperforming assets ratio performance during the performance period compared to its selected peer group. If the performance criteria are met, the Company will pay the performance units that have vested in shares of the Company’s common stock.
If any award granted under the Plan terminates, expires, or lapses for any reason other than by virtue of exercise or settlement of the award, or if shares issued pursuant to awards are forfeited, any stock subject to such award again shall be available for future awards under the Plan.
Compensation expense for performance units is based on fair value on the grant date. The performance units are subject to the probability of attainment of meeting the above referenced performance criteria and service requirement. Management has evaluated the performance-based criteria and has determined that, as of December 31, 2023 the criteria was not probable of being met at target, and at December 31, 2022, the criteria were probable of being met at target. The Company reversed compensation expense of $0.3 million for 2023 and recognized compensation expense $0.3 million for 2022 related to performance units.
111
CARTER BANKSHARES, INC. AND SUBSIDIARIES
NOTES TO CONSOLIDATED FINANCIAL STATEMENTS - (continued)
NOTE 16 - FED ERAL AND STATE INCOME TAXES
The components of the provision for income tax expense were as follows:
| (Dollars in Thousands) | 2023 | 2022 | 2021 | |||||||||||||||||
| Current | $ | $ | $ | |||||||||||||||||
| Deferred | ( | |||||||||||||||||||
| Change in Valuation Allowance | ( | ( | ||||||||||||||||||
| Income Tax Provision | $ | $ | $ | |||||||||||||||||
The following is a reconciliation of the differences between the provision for income taxes and the amount computed by applying the statutory federal income tax rate to income before taxes:
| 2023 | 2022 | 2021 | ||||||||||||||||||||||||||||||||||||
| (Dollars in Thousands) | Amount | Percent | Amount | Percent | Amount | Percent | ||||||||||||||||||||||||||||||||
| Federal Income Tax at Statutory Rate | $ | $ | $ | |||||||||||||||||||||||||||||||||||
| State Income Tax, net of Federal Benefit | ||||||||||||||||||||||||||||||||||||||
| Tax-exempt Interest, net of Disallowance | ( | ( | ( | ( | ( | ( | ||||||||||||||||||||||||||||||||
| Federal Tax Credits, net of Basis Reduction | ( | ( | ( | ( | ( | ( | ||||||||||||||||||||||||||||||||
| Change in Valuation Allowance | ( | ( | ( | ( | ||||||||||||||||||||||||||||||||||
| Income from Bank Owned Life Insurance | ( | ( | ( | ( | ( | ( | ||||||||||||||||||||||||||||||||
| Tax Credit Amortization | ||||||||||||||||||||||||||||||||||||||
| Other | ( | ( | ||||||||||||||||||||||||||||||||||||
| Income Tax Provision and Effective Income Tax Rate | $ | $ | $ | |||||||||||||||||||||||||||||||||||
The provision for income taxes differs from the amount computed by applying the statutory federal income tax rate to income before taxes. The Company ordinarily generates an annual effective tax rate that is less than the statutory rate of 21% due to benefits resulting from tax-exempt interest, tax-exempt income from bank owned life insurance, and tax benefits resulting from certain partnership investments.
The Company elected to adopt the proportional amortization method of accounting for all qualifying equity investments within the HTC program. The Company makes equity investments as a limited partner in various partnerships that sponsor HTC as a strategic tax initiative designed to receive income tax credits and other income tax benefits, such as deductible flow-through losses. As of December 31, 2023, the Company recognized $1.8 million in HTC equity investments recorded as a component of other assets on the Consolidated Balance Sheets.
The Company records income tax credits and other income tax benefits received from its HTC investments as a component of the provision for income taxes on the Consolidated Statements of Income and as a component of operating activities on the Consolidated Statements of Cash Flows.
Investments accounted for using the proportional amortization method are amortized and recorded as a component of the provision for income taxes on the Consolidated Statements of Income.
The Company records non-income-tax-related activity and other returns received from its HTC investments as a component of other noninterest income on the Consolidated Statements of Income and as a component of operating activities on the Consolidated Statements of Cash Flows. As of December 31, 2023, the Company has not recognized any non-income-tax-related activity from its HTC investments.
112
CARTER BANKSHARES, INC. AND SUBSIDIARIES
NOTES TO CONSOLIDATED FINANCIAL STATEMENTS - (continued)
Deferred income taxes reflect the net tax effects of temporary differences between the carrying amounts of assets and liabilities for financial reporting purposes and the amount used for income tax purposes. Significant components of the Company’s deferred tax assets and liabilities are as follows:
| (Dollars in Thousands) | 2023 | 2022 | ||||||||||||
| Deferred Tax Assets | ||||||||||||||
| Allowance for Credit Losses | $ | $ | ||||||||||||
| Net Unrealized Loss on Available-for-sale Securities | ||||||||||||||
| Valuation Adjustments on Other Real Estate Owned | ||||||||||||||
| Capital Loss Carryforward | ||||||||||||||
| Operating Lease Liabilities | ||||||||||||||
| Other | ||||||||||||||
| Gross Deferred Tax Assets | ||||||||||||||
| Less: Valuation Allowance | ( | |||||||||||||
| Total Deferred Tax Assets | $ | $ | ||||||||||||
| (Dollars in Thousands) | 2023 | 2022 | ||||||||||||
| Deferred Tax Liabilities | ||||||||||||||
| Fixed Asset Depreciation | $ | ( | $ | ( | ||||||||||
| Acquisition-Related Fair Value Adjustments | ( | ( | ||||||||||||
| Deferred Loan Income | ( | ( | ||||||||||||
| Operating Lease Right-of-Use Assets | ( | ( | ||||||||||||
| Equity Investment in Partnerships | ( | ( | ||||||||||||
| Other | ( | ( | ||||||||||||
| Total Deferred Tax Liabilities | ( | ( | ||||||||||||
| Net Deferred Tax Assets | $ | $ | ||||||||||||
Management assesses all available positive and negative evidence to estimate whether sufficient future taxable income of the appropriate character will be generated to utilize existing deferred tax assets. Based on this evaluation, as of December 31, 2023, a valuation allowance of $0.9 million has been recorded on deferred tax assets related to capital loss carryforwards resulting from exits of equity investments in partnerships and sales of securities. The Company has not identified prudent and feasible strategies to generate future capital gains to offset the entirety of the capital loss carryforward prior to their expiration in 2028.
At December 31, 2023 and 2022, the Company had no ASC 740-10 unrecognized tax benefits or accrued interest and penalties recorded. The Company does not expect the total amount of unrecognized tax benefits to significantly increase within the next twelve months. The Company recognizes interest and penalties on unrecognized tax benefits in noninterest expense.
The Company is subject to U.S. federal income tax as well as various other state and local jurisdictions. The Company is generally no longer subject to examination by federal, state and local taxing authorities for years prior to December 31, 2020.
113
CARTER BANKSHARES, INC. AND SUBSIDIARIES
NOTES TO CONSOLIDATED FINANCIAL STATEMENTS - (continued)
NOTE 17 – TAX EFFECTS ON OTHER COMPREHENSIVE INCOME (LOSS)
The following table presents the change in components of other comprehensive income (loss) for the years ended December 31, net of tax effects:
| (Dollars in Thousands) | Pre-Tax Amount | Tax (Expense) Benefit | Net of Tax Amount | |||||||||||||||||
| 2023 | ||||||||||||||||||||
| Net Unrealized Gains Arising during the Period | $ | $ | ( | $ | ||||||||||||||||
| Reclassification Adjustment for Losses included in Net Income | ( | |||||||||||||||||||
| Other Comprehensive Income | $ | $ | ( | $ | ||||||||||||||||
| 2022 | ||||||||||||||||||||
| Net Unrealized Losses Arising during the Period | $ | ( | $ | $ | ( | |||||||||||||||
| Reclassification Adjustment for Gains included in Net Income | ( | ( | ||||||||||||||||||
| Other Comprehensive Loss | $ | ( | $ | $ | ( | |||||||||||||||
| 2021 | ||||||||||||||||||||
| Net Unrealized Losses Arising during the Period | $ | ( | $ | $ | ( | |||||||||||||||
| Reclassification Adjustment for Gains included in Net Income | ( | ( | ||||||||||||||||||
| Other Comprehensive Loss | $ | ( | $ | $ | ( | |||||||||||||||
NOTE 18 – COMMITMENTS AND CONTINGENCIES
Commitments to extend credit, which amounted to $702.3 million at December 31, 2023 and $630.6 million at December 31, 2022, represent agreements to lend to customers with fixed expiration dates or other termination clauses. The Company provides lines of credit to our clients to finance the completion of construction projects and revolving lines of credit to operating companies to finance their working capital needs. Lines of credit for construction projects represented $452.2 million, or 64.4 %, and $373.2 million, or 59.2 %, of the commitments to extend credit at December 31, 2023 and December 31, 2022, respectively. Standby letters of credit are conditional commitments issued by the Company guaranteeing the performance of a customer to a third-party. Those guarantees are primarily issued to support public and private borrowing arrangements. The Company had outstanding letters of credit totaling $19.6 million at December 31, 2023 and $25.7 million at December 31, 2022.
Our exposure to credit loss in the event of nonperformance by the other party to the financial instrument for commitments to extend credit and standby letters of credit is represented by the contractual amount of those instruments. The Company uses the same credit policies in making commitments and unconditional obligations as it does for on-balance sheet instruments. Unless noted otherwise, collateral or other security is required to support financial instruments with credit risk.
Life-of-Loss Reserve on Unfunded Loan Commitments
We maintain a life-of-loss reserve on unfunded commercial lending commitments and letters of credit to provide for the risk of loss inherent in these arrangements. The life-of-loss reserve is computed using a methodology similar to that used to determine
114
CARTER BANKSHARES, INC. AND SUBSIDIARIES
NOTES TO CONSOLIDATED FINANCIAL STATEMENTS - (continued)
the ACL for loans, modified to take into account the probability of a draw-down on the commitment. The life-of-loan reserve for unfunded commitments is included in other liabilities on our Consolidated Balance Sheets.
The following table presents activity in the life-of-loss reserve on unfunded loan commitments as of and for the years ended December 31:
| (Dollars in Thousands) | December 31, 2023 | December 31, 2022 | ||||||||||||
| Life-of-Loss Reserve on Unfunded Loan Commitments | ||||||||||||||
| Balance at beginning of period | $ | $ | ||||||||||||
| Provision for Unfunded Commitments | ||||||||||||||
| Balance at end of period | $ | $ | ||||||||||||
Amounts are added or subtracted to the provision for unfunded commitments through a charge or credit to current earnings in the provision for unfunded commitments. An expense of $0.9 million was recorded for the year ended December 31, 2023 for the provision for unfunded commitments, which resulted in an increase of $0.4 million compared to the provision of $0.5 million for the year ended December 31, 2022.
We have a future commitment with a third party vendor for data processing charges, which is a ten year contract that will expire at the end of 2028. Data processing expense was $3.9 million, $4.1 million and $3.8 million for 2023, 2022 and 2021, respectively.
Legal Proceedings
In the normal course of business, the Company is subject to various legal and administrative proceedings and claims. Legal and administrative proceedings are subject to inherent uncertainties and unfavorable rulings could occur, and the timing and outcome of any legal or administrative proceeding cannot be predicted with certainty. Further, estimating an amount or range of possible losses that may result from legal or administrative proceedings and claims is inherently difficult and requires an extensive degree of judgment, particularly where the matters involve indeterminate claims for monetary damages, may involve awards that are discretionary in amount, present novel legal theories or policies, are in the early stages of the proceedings, or are subject to appeal. In addition, because legal proceedings may be resolved over an extended period of time, potential losses are subject to change due to the outcome of intermediate procedural and substantive rulings, actions by other parties which may be influenced by their settlement posture or their evaluation of the strength or weakness of their case, and other factors.
For these reasons, the Company cannot reasonably estimate the ultimate outcome or timing of, or possible losses resulting from, the matters described below, and cannot conclude if the outcome of any of these matters would have a material impact to the Company.
Other than as set forth below, as of December 31, 2023, the Company is not involved in any other material pending legal proceedings other than proceedings occurring in the ordinary course of business.
Justice Collection Actions
The Bank is engaged in a variety of collection proceedings (the “Collection Actions”) against various related entities that are owned and/or controlled by James C. Justice, II, Cathy L. Justice and James C. Justice, III (such entities, the “Justice Entities” and collectively with the individuals, the “Collection Defendants”). On April 20, 2023 and May 15, 2023, the Bank filed in the Circuit Court of the City of Martinsville, Virginia (the “Martinsville Circuit Court”) confessions of judgment against the Collection Defendants with respect to amounts owed on matured promissory notes made or guaranteed by the Collection Defendants with an aggregate principal balance of approximately $301 million. On May 12, 2023 and June 7, 2023, the Collection Defendants filed motions to set aside the confessions of judgment on the basis that the Bank allegedly (i) violated anti-tying provisions of the Bank Holding Company Act of 1956, as amended, (ii) breached contractual obligations and fiduciary duties to the Collection Defendants and (iii) tortiously interfered with the Collection Defendants’ business expectancies and relationships, among other allegations. On December 11, 2023, the Martinsville Circuit Court heard oral arguments on the motions to set aside the confessions of judgment filed by the Collection Defendants. On January 22, 2024, the Martinsville Circuit Court issued a letter opinion denying such motions. On February 21, 2024, the Martinsville Circuit Court issued final orders denying such motions. On February 26, 2024, the Collection Defendants filed a notice of appeal regarding the Martinsville Circuit Court’s order denying such motions.
115
CARTER BANKSHARES, INC. AND SUBSIDIARIES
NOTES TO CONSOLIDATED FINANCIAL STATEMENTS - (continued)
Pursuant to the confessions of judgment that were upheld by the Martinsville Circuit Court, the Bank has initiated collection processes against the Collection Defendants (see “—Justice Foreclosure Litigation”).
The Company and the Bank intend to pursue vigorously the Collection Actions and enforce the confessions of judgment and related agreements, including but not limited to release and affirmation agreements and indemnification agreements. The Company and the Bank vigorously deny the allegations contained in the Collection Defendants’ motions to set aside the confessions of judgment and, based on consultation with legal counsel, the Company believes that the Bank has meritorious defenses to all allegations that it understands may be asserted on appeal. However, the Company cannot reasonably estimate the ultimate outcome or timing of, or possible losses resulting from, the Collection Actions or any related legal proceedings that may commence, and cannot conclude if the outcome of any of these matters would have a material impact to the Company.
Justice Federal Court Litigation
On November 10, 2023, the Company, the Bank, and the individual directors of the Company and the Bank were named as defendants in a lawsuit (the “Justice Federal Court Litigation”) filed in the United States District Court for the Southern District of West Virginia by the Collection Defendants. The allegations contained in the Justice Federal Court Litigation relate to the matured promissory notes made or guaranteed by the Collection Defendants that are the subject of the Collection Actions. In the Justice Federal Court Litigation, as plaintiffs the Collection Defendants allege that the Company, the Bank and to a vicarious and limited extent, the individual directors (i) breached an implied covenant of good faith and fair dealing, (ii) breached fiduciary duties, (iii) tortiously interfered with business relations and (iv) violated anti-tying restrictions of the Bank Holding Company Act of 1956, as amended, and allege that the individual directors aided and abetted the same. As plaintiffs in the Justice Federal Court Litigation, the Collection Defendants seek monetary damages of not less than $1.0 billion, additional punitive damages and interest on damages as allowed by law, payment of costs, expenses and attorneys’ fees, and a declaratory judgment from the court that certain confessions of judgment, and certain guarantees, be declared void and unenforceable. The Company and the Bank deny the allegations contained in the Justice Federal Court Litigation and intend to vigorously defend the matter and the validity and enforceability of the confessions of judgment and of each of the Bank’s loan documents, including the guarantees. Based on information presently available to the Company and the Bank and based on consultation with legal counsel, the Company believes that the Company, the Bank and the individual defendants have meritorious defenses to all allegations contained in the Justice Federal Court Litigation.
Because the Justice Federal Court Litigation is in its early stages, the Company cannot reasonably estimate the ultimate outcome or timing of, or possible losses resulting from, the Justice Federal Court Litigation or any related legal proceedings that may commence, and cannot conclude if the outcome of any of these matters would have a material impact to the Company.
Justice Foreclosure Litigation
On February 7, 2024, the Bank was named as a defendant in a lawsuit (the “Justice Foreclosure Litigation”) filed in the Circuit Court of Greenbrier County, West Virginia (the “Greenbrier Circuit Court”) by Greenbrier Sporting Club Development Co., Inc. and The Greenbrier Sporting Club, Inc. (collectively, “Sporting Club”). The Justice Foreclosure Litigation relates to a deed of trust (the “Trust Deed”) granted by Sporting Club in favor of the Bank. The trustee under this deed of trust was also named as a defendant. In the Justice Foreclosure Litigation, Sporting Club requests the Greenbrier Circuit Court to issue declaratory judgments that the Trust Deed is invalid and unenforceable, the Notice of Sale (defined below) is invalid and of no effect, and that the trustee and the Bank may not sell the property described in the Notice of Sale. Sporting Club also requests the Greenbrier Circuit Court to issue a declaratory judgment that the debts secured by the Trust Deed are not payable and therefore no trustee sale is permitted, or alternatively that Sporting Club is entitled to final adjudication of the Justice Federal Court Litigation before any sale of property by the trustee under the Trust Deed may proceed.
On or about February 6, 2024, a notice of sale (the “Notice of Sale”) was published in multiple newspapers regarding the proposed sale by the Trustee of certain real estate encumbered by the Trust Deed. The debts secured by the Trust Deed matured on April 15, 2023 and the Bank filed confessions of judgment with respect to such debts in the Martinsville Circuit Court. See the description of the Justice Collection Litigation above. On February 16, 2024, the Bank cancelled the proposed sale by the Trustee of the real estate encumbered by the Trust Deed.
The Bank disputes all allegations contained in the Justice Foreclosure Litigation and intends to defend vigorously the matter and the validity and enforceability of the Trust Deed, the validity and collectability of the debts owed to the Bank by the Sporting Club. The Bank intends to oppose vigorously the injunctive relief requested by Sporting Club in the Justice
116
CARTER BANKSHARES, INC. AND SUBSIDIARIES
NOTES TO CONSOLIDATED FINANCIAL STATEMENTS - (continued)
Foreclosure Litigation. Based on information presently available to the Company and the Bank and based on consultation with legal counsel, the Company believes that the Bank has meritorious defenses to all allegations contained in the Justice Foreclosure Litigation.
Because the Justice Foreclosure Litigation is in its early stages, the Company cannot reasonably estimate the ultimate outcome or timing of, or possible losses resulting from, the Justice Foreclosure Litigation or any related legal proceedings that may commence, and cannot conclude if the outcome of any of these matters would have a material impact to the Company.
GLAS Federal Court Litigation
On February 12, 2024, the Bank was named as a defendant in a lawsuit (the “GLAS Federal Court Litigation”) filed in the United States District Court for the Western District of Virginia by GLAS Trust Company LLC (“GLAS”). The allegations contained in the GLAS Federal Court Litigation relate to a series of financing transactions that occurred in 2018 between Bluestone Resources, Inc. (“Bluestone Resources”), its subsidiary Bluestone Coal Sales Corporation (“Bluestone Sales”, and together with Bluestone Resources and their respective affiliates, the “Bluestone Entities”), and Greensill (UK) Limited, Ltd. (“Greensill”). The Bluestone Entities are owned and controlled by James C. Justice, II, Cathy L. Justice and James C. Justice, III. In the GLAS Federal Court Litigation, GLAS alleges that it serves as trustee for investors that acquired notes via a series of securities transactions that repackaged the Bluestone Entities’ obligations to repay Greensill and sold them to those investors. In the GLAS Federal Court Litigation, GLAS alleges that certain transfers to the Bank executed during 2018 by the Bluestone Entities or Greensill, which in the aggregate total approximately $226 million, each constitute either a fraudulent conveyance, or a voluntary conveyance, under Virginia law. In the GLAS Federal Court Litigation, GLAS seeks an award equal to the full amount of such fraudulent conveyances and/or voluntary conveyances plus interest and payment of attorneys’ fees and costs.
The Company and the Bank deny the allegations contained in the GLAS Federal Court Litigation and intend to defend vigorously all claims asserted in the GLAS Federal Court Litigation. Based on information presently available to the Company and the Bank and based on consultation with legal counsel, the Company believes that the Bank has meritorious defenses to all allegations contained in the GLAS Federal Court Litigation.
During the course of the Bank’s lending transactions with James C. Justice, II, Cathy L. Justice and James C. Justice, III, and various Justice Entities, each of James C. Justice, II, Cathy L. Justice and James C. Justice, III and certain Justice Entities agreed (the “Justice Indemnity Agreement”) to indemnify, defend and hold harmless the Bank from damages, claims, liabilities, losses, and expenses incurred in connection with certain claims that may be asserted against the Bank, including the claims that are asserted in the GLAS Federal Court Litigation. These indemnity obligations are supported by substantial pledged collateral. The Company and the Bank intend to pursue vigorously all remedies afforded to the Bank under the Justice Indemnity Agreement.
Because the GLAS Federal Court Litigation is in its early stages, the Company cannot reasonably estimate the ultimate outcome or timing of, or possible losses resulting from, the GLAS Federal Court Litigation or any related legal proceedings that may commence, and cannot conclude if the outcome of any of these matters would have a material impact to the Company.
NOTE 19 – REVENUE FROM CONTRACTS WITH CUSTOMERS
Topic 606 does not apply to revenue associated with financial instruments, including revenue from loans and securities. In addition, certain noninterest income streams such as fees associated with mortgage servicing rights, financial guarantees, derivatives, and certain credit card fees are also not in scope of the new guidance. Topic 606 is applicable to noninterest revenue streams such as trust and asset management income, deposit related fees, interchange fees, merchant income, and annuity and insurance commissions and return on investment. However, the recognition of these revenue streams did not change significantly upon adoption of Topic 606. Substantially all of the Company’s revenue is generated from contracts with customers. Noninterest revenue streams in-scope of Topic 606 are discussed below.
Service Charges on Deposit Accounts: Service charges on deposit accounts consist of overdraft fees, service charges on returned checks, stop payment fees, check chargeback fees, minimum balance fees, and other deposit account related fees. Overdraft fees are recognized at the point in time that the overdraft occurs. Service charges on returned checks are recognized at the point in time that a check is returned. Transaction-based fees, which include services such as stop payment fees, check chargeback fees, and other deposit account related fees are recognized at the point in time the Company fulfills the customer’s
117
CARTER BANKSHARES, INC. AND SUBSIDIARIES
NOTES TO CONSOLIDATED FINANCIAL STATEMENTS - (continued)
request. Minimum balance fees are system-assessed at the point in time that a customer’s balance is below the required minimum for the product. Service charges on deposits are withdrawn from the customer’s account balance.
Other Fees and Other Income: Other fees and other income consists of safe deposit rents, money order fees, check cashing and cashiers’ check fees, wire transfer fees, letter of credit fees, check order income, and other miscellaneous fees. These fees are largely transaction-based; therefore, the Company’s performance obligation is satisfied and the resultant revenue is recognized at the point in time the service is rendered. Payments for transaction-based fees are generally received immediately or in the following month by a direct charge to a customer’s account.
Debit Card Interchange Fees: The Company earns interchange fees from debit cardholder transactions conducted through a card payment network. Interchange fees from cardholder transactions represent a percentage of the underlying transaction value and are recognized daily, concurrently with the transaction processing services provided to the cardholder.
Insurance: Commission income is earned based on customer transactions. The commission income is recognized when the transaction is complete. The Company also receives a return on its investment in Bankers Insurance, LLC on an annual basis based on the equity insurance company and percentage of ownership.
OREO Income: The Company owns properties acquired through foreclosure that are included in other real estate owned, net on the Consolidated Balance Sheet. If the Company rents any of those properties, the resultant income is recognized at the point of receipt since the performance obligation has been satisfied. The rents are generally received monthly.
Gains/Losses on Sales of OREO: The Company records a gain or loss from the sale of OREO when control of the property transfers to the buyer, which generally occurs at the time of an executed deed. When the Company finances the sale of OREO to the buyer, the Company assesses whether the buyer is committed to perform their obligations under the contract and whether collectability of the transaction price is probable. Once these criteria are met, the OREO asset is disposed and the gain or loss on sale is recorded upon the transfer of control of the property to the buyer. In determining the gain or loss on the sale, the Company adjusts the transaction price and related gain (loss) on sale if a significant financing component is present.
The following table summarizes the point of revenue recognition and the income recognized for each of the revenue streams for the years ended December 31:
| (Dollars in Thousands) | Point of Revenue Recognition | 2023 | 2022 | 2021 | ||||||||||||||||||||||
| In-Scope Revenue Streams | ||||||||||||||||||||||||||
| Service Charges on Deposit Accounts | At a point in time | $ | $ | $ | ||||||||||||||||||||||
| Other Fees and Other Income | At a point in time | |||||||||||||||||||||||||
| Debit Card Interchange Fees | At a point in time | |||||||||||||||||||||||||
| Insurance | ||||||||||||||||||||||||||
| Customer Commissions | At a point in time | |||||||||||||||||||||||||
| Annual Commission on Investment | Over time | |||||||||||||||||||||||||
| Special Production Payout | Over time | |||||||||||||||||||||||||
| Other Real Estate Owned Income | At a point in time | |||||||||||||||||||||||||
| Gains on Sales and Write-downs of Bank Premises, net | At a point in time | |||||||||||||||||||||||||
| Gains (Losses) on Sale of Other Real Estate Owned | At a point in time | *** | *** | *** | ||||||||||||||||||||||
| Total In-Scope Revenue Streams | ||||||||||||||||||||||||||
| Out of Scope Revenue Streams | ||||||||||||||||||||||||||
| (Losses) Gain on Sales of Securities, net | ( | |||||||||||||||||||||||||
| Bank Owned Life Insurance Income | ||||||||||||||||||||||||||
| Commercial Loan Swap Fee Income | ||||||||||||||||||||||||||
| Other | ||||||||||||||||||||||||||
| Total Noninterest Income | $ | $ | $ | |||||||||||||||||||||||
***Reported net with Losses on Sales and Write-downs of Other Real Owned in Noninterest Expense
118
CARTER BANKSHARES, INC. AND SUBSIDIARIES
NOTES TO CONSOLIDATED FINANCIAL STATEMENTS - (continued)
NOTE 20 – PARENT COMPANY CONDENSED FINANCIAL INFORMATION
Balance Sheets
| December 31, | ||||||||||||||
| (Dollars in Thousands) | 2023 | 2022 | ||||||||||||
| ASSETS | ||||||||||||||
| Cash | $ | $ | ||||||||||||
| Investment in Bank Subsidiary | ||||||||||||||
| Other Assets | ||||||||||||||
| Total Assets | $ | $ | ||||||||||||
| LIABILITIES | ||||||||||||||
| Other Liabilities | $ | $ | ||||||||||||
| Total Shareholders’ Equity | ||||||||||||||
| Total Liabilities and Shareholders’ Equity | $ | $ | ||||||||||||
Statements of Net Income
| December 31, | ||||||||||||||||||||
| (Dollars in Thousands) | 2023 | 2022 | 2021 | |||||||||||||||||
| Dividends from Subsidiaries | $ | $ | $ | |||||||||||||||||
| Total Income | ||||||||||||||||||||
| Total Expenses | ( | ( | ( | |||||||||||||||||
| Income Before Income Tax Benefit and Undistributed Net Income of Bank Subsidiary | ||||||||||||||||||||
| Income Tax Benefit | ( | ( | ( | |||||||||||||||||
| Income Before Undistributed Net Income of Bank Subsidiary | ||||||||||||||||||||
| Equity in Undistributed Net Income of Bank Subsidiary | ||||||||||||||||||||
| Net Income | $ | $ | $ | |||||||||||||||||
| Comprehensive Income (Loss) | $ | $ | ( | $ | ||||||||||||||||
Statements of Cash Flows
| December 31, | ||||||||||||||||||||
| (Dollars in Thousands) | 2023 | 2022 | 2021 | |||||||||||||||||
| OPERATING ACTIVITIES | ||||||||||||||||||||
| Net Income | $ | $ | $ | |||||||||||||||||
| Equity in Undistributed Net Income of Bank Subsidiary | ( | ( | ( | |||||||||||||||||
| Adjustments to Reconcile Net Income to Net Cash Provided by | ||||||||||||||||||||
| Operating Activities | ||||||||||||||||||||
| Stock Compensation Expense | ||||||||||||||||||||
| Decrease (Increase) in Other Assets | ( | ( | ||||||||||||||||||
| Decrease in Other Liabilities | ( | ( | ||||||||||||||||||
| Decrease in Intercompany Liability | ( | |||||||||||||||||||
| Net Cash Provided by Operating Activities | ||||||||||||||||||||
| INVESTING ACTIVITIES | ||||||||||||||||||||
| Equity Investment in Non-Subsidiary, net of distributions | ( | ( | ||||||||||||||||||
| Net Cash Used in Investing Activities | ( | ( | ||||||||||||||||||
| FINANCING ACTIVITIES | ||||||||||||||||||||
| Repurchase of Common Stock | ( | ( | ( | |||||||||||||||||
| Net Cash Used In Financing Activities | ( | ( | ( | |||||||||||||||||
| Net (Decrease) Increase in Cash | ( | ( | ||||||||||||||||||
| Cash at Beginning of Year | ||||||||||||||||||||
| Cash at End of Year | $ | $ | $ | |||||||||||||||||
119
CARTER BANKSHARES, INC. AND SUBSIDIARIES
NOTES TO CONSOLIDATED FINANCIAL STATEMENTS - (continued)
NOTE 21 - CAPITAL ADEQUACY
The Company and the Bank are subject to various capital requirements administered by the federal banking regulators. Failure to meet the minimum capital requirements can initiate certain mandatory and possibly additional discretionary actions by regulators that, if undertaken, could have a direct material effect on the Company’s financial statements. Under capital adequacy guidelines and the regulatory framework for prompt corrective action, the Company must meet specific capital guidelines that involve quantitative measures of assets, liabilities and certain off-balance sheet items as calculated under regulatory accounting practices. The capital amounts and classifications are also subject to qualitative judgments by the regulators about components, risk weightings and other factors. Prompt corrective action provisions are not applicable to bank holding companies. Quantitative measures established by regulations to ensure capital adequacy require the Company to maintain minimum amounts and ratios.
The Basel rules also permit banking organizations with less than $15.0 billion in assets to retain, through a one-time election, existing treatment for accumulated other comprehensive loss, which currently does not affect regulatory capital. The Company elected to retain this treatment which reduces the volatility of regulatory capital levels.
The Basel III Capital Rules require the Company and the Bank to maintain minimum Common Equity Tier 1, Tier 1 and Total Capital ratios, along with a capital conservation buffer, effectively resulting in new minimum capital ratios (which are shown in the table below). The capital conservation buffer is designed to absorb losses during periods of economic stress. Banking institutions with a ratio of Common Equity Tier 1 capital to risk-weighted assets above the minimum but below the conservation buffer (or below the combined capital conservation buffer and countercyclical capital buffer, when the latter is applied) will face constraints on dividends, equity repurchases and compensation based on the amount of the shortfall. The Basel III Capital Rules also provide for a 2.5% “countercyclical capital buffer” that is applicable to only certain covered institutions and does not have any current applicability to the Company or the Bank. Management believes as of December 31, 2023, the Company and the Bank met all capital adequacy requirements to which the Company is subject and satisfied the applicable capital conservation buffer requirements.
Prompt corrective action regulations provide five classifications: well capitalized, adequately capitalized, undercapitalized, significantly undercapitalized, and critically undercapitalized, although these terms are not used to represent overall financial condition. If adequately capitalized, regulatory approval is required to accept brokered deposits. If undercapitalized, capital distributions are limited, as is asset growth and expansion, and capital restoration plans are required. At year-end 2023 and 2022, the most recent regulatory notifications categorized the Bank as well-capitalized under the regulatory framework for prompt corrective action. There are no conditions or events since that notification that management believes have changed the institution’s category.
120
CARTER BANKSHARES, INC. AND SUBSIDIARIES
NOTES TO CONSOLIDATED FINANCIAL STATEMENTS - (continued)
The following table summarizes risk-based capital amounts and ratios for the Company and the Bank, excluding the 2.5% capital conservation buffer:
| Actual | Minimum Regulatory Capital Requirements | To be Well Capitalized Under Prompt Corrective Action Provisions | ||||||||||||||||||||||||||||||||||||
| (Dollars in Thousands) | Amount | Ratio | Amount | Ratio | Amount | Ratio | ||||||||||||||||||||||||||||||||
| As of December 31, 2023 | ||||||||||||||||||||||||||||||||||||||
| Leverage Ratio | ||||||||||||||||||||||||||||||||||||||
| Carter Bankshares, Inc. | $ | % | $ | % | NA | NA | ||||||||||||||||||||||||||||||||
| Carter Bank & Trust | % | % | $ | % | ||||||||||||||||||||||||||||||||||
| Common Equity Tier 1 (to Risk-Weighted Assets) | ||||||||||||||||||||||||||||||||||||||
| Carter Bankshares, Inc. | $ | % | $ | % | NA | NA | ||||||||||||||||||||||||||||||||
| Carter Bank & Trust | % | % | $ | % | ||||||||||||||||||||||||||||||||||
| Tier 1 Capital (to Risk-Weighted Assets) | ||||||||||||||||||||||||||||||||||||||
| Carter Bankshares, Inc. | $ | % | $ | % | NA | NA | ||||||||||||||||||||||||||||||||
| Carter Bank & Trust | % | % | $ | % | ||||||||||||||||||||||||||||||||||
| Total Capital (to Risk-Weighted Assets) | ||||||||||||||||||||||||||||||||||||||
| Carter Bankshares, Inc. | $ | % | $ | % | NA | NA | ||||||||||||||||||||||||||||||||
| Carter Bank & Trust | % | % | $ | % | ||||||||||||||||||||||||||||||||||
| As of December 31, 2022 | ||||||||||||||||||||||||||||||||||||||
| Leverage Ratio | ||||||||||||||||||||||||||||||||||||||
| Carter Bankshares, Inc. | $ | % | $ | % | NA | NA | ||||||||||||||||||||||||||||||||
| Carter Bank & Trust | % | % | $ | % | ||||||||||||||||||||||||||||||||||
| Common Equity Tier 1 (to Risk-Weighted Assets) | ||||||||||||||||||||||||||||||||||||||
| Carter Bankshares, Inc. | $ | % | $ | % | NA | NA | ||||||||||||||||||||||||||||||||
| Carter Bank & Trust | % | % | $ | % | ||||||||||||||||||||||||||||||||||
| Tier 1 Capital (to Risk-Weighted Assets) | ||||||||||||||||||||||||||||||||||||||
| Carter Bankshares, Inc. | $ | % | $ | % | NA | NA | ||||||||||||||||||||||||||||||||
| Carter Bank & Trust | % | % | $ | % | ||||||||||||||||||||||||||||||||||
| Total Capital (to Risk-Weighted Assets) | ||||||||||||||||||||||||||||||||||||||
| Carter Bankshares, Inc. | $ | % | $ | % | NA | NA | ||||||||||||||||||||||||||||||||
| Carter Bank & Trust | % | % | $ | % | ||||||||||||||||||||||||||||||||||
121

Independent Member Crowe Global
REPORT OF INDEPENDENT REGISTERED PUBLIC ACCOUNTING FIRM
Shareholders and the Board of Directors of Carter Bankshares, Inc. and Subsidiaries
Martinsville, Virginia
Martinsville, Virginia
Opinions on the Financial Statements and Internal Control over Financial Reporting
We have audited the accompanying consolidated balance sheets of Carter Bankshares, Inc. and Subsidiaries (the "Company") as of December 31, 2023 and 2022, the related consolidated statements of income, comprehensive income (loss), changes in shareholders’ equity, and cash flows for each of the years in the three-year period ended December 31, 2023, and the related notes (collectively referred to as the "financial statements"). We also have audited the Company’s internal control over financial reporting as of December 31, 2023, based on criteria established in Internal Control – Integrated Framework: (2013) issued by the Committee of Sponsoring Organizations of the Treadway Commission (COSO).
In our opinion, the financial statements referred to above present fairly, in all material respects, the financial position of the Company as of December 31, 2023 and 2022, and the results of its operations and its cash flows for each of the years in the three-year period ended December 31, 2023 in conformity with accounting principles generally accepted in the United States of America. Also in our opinion, the Company maintained, in all material respects, effective internal control over financial reporting as of December 31, 2023, based on criteria established in Internal Control – Integrated Framework: (2013) issued by COSO.
Basis for Opinions
The Company’s management is responsible for these financial statements, for maintaining effective internal control over financial reporting, and for its assessment of the effectiveness of internal control over financial reporting, included in the accompanying Management’s Report on Internal Control over Financial Reporting. Our responsibility is to express an opinion on the Company’s financial statements and an opinion on the Company’s internal control over financial reporting based on our audits. We are a public accounting firm registered with the Public Company Accounting Oversight Board (United States) ("PCAOB") and are required to be independent with respect to the Company in accordance with the U.S. federal securities laws and the applicable rules and regulations of the Securities and Exchange Commission and the PCAOB.
We conducted our audits in accordance with the standards of the PCAOB. Those standards require that we plan and perform the audits to obtain reasonable assurance about whether the financial statements are free of material misstatement, whether due to error or fraud, and whether effective internal control over financial reporting was maintained in all material respects.
Our audits of the financial statements included performing procedures to assess the risks of material misstatement of the financial statements, whether due to error or fraud, and performing procedures that respond to those risks. Such
122
procedures included examining, on a test basis, evidence regarding the amounts and disclosures in the financial statements. Our audits also included evaluating the accounting principles used and significant estimates made by management, as well as evaluating the overall presentation of the financial statements. Our audit of internal control over financial reporting included obtaining an understanding of internal control over financial reporting, assessing the risk that a material weakness exists, and testing and evaluating the design and operating effectiveness of internal control based on the assessed risk. Our audits also included performing such other procedures as we considered necessary in the circumstances. We believe that our audits provide a reasonable basis for our opinions.
Definition and Limitations of Internal Control Over Financial Reporting
A company’s internal control over financial reporting is a process designed to provide reasonable assurance regarding the reliability of financial reporting and the preparation of financial statements for external purposes in accordance with generally accepted accounting principles. A company’s internal control over financial reporting includes those policies and procedures that (1) pertain to the maintenance of records that, in reasonable detail, accurately and fairly reflect the transactions and dispositions of the assets of the company; (2) provide reasonable assurance that transactions are recorded as necessary to permit preparation of financial statements in accordance with generally accepted accounting principles, and that receipts and expenditures of the company are being made only in accordance with authorizations of management and directors of the company; and (3) provide reasonable assurance regarding prevention or timely detection of unauthorized acquisition, use, or disposition of the company’s assets that could have a material effect on the financial statements.
Because of its inherent limitations, internal control over financial reporting may not prevent or detect misstatements. Also, projections of any evaluation of effectiveness to future periods are subject to the risk that controls may become inadequate because of changes in conditions, or that the degree of compliance with the policies or procedures may deteriorate.
Critical Audit Matter
The critical audit matter communicated below is a matter arising from the current period audit of the financial statements that was communicated or required to be communicated to the audit committee and that: (1) relates to accounts or disclosures that are material to the financial statements and (2) involved our especially challenging, subjective, or complex judgments. The communication of the critical audit matter does not alter in any way our opinion on the financial statements, taken as a whole, and we are not, by communicating the critical audit matter below, providing a separate opinion on the critical audit matter or on the accounts or disclosures to which it relates.
Allowance for Credit Losses – Individually Evaluated Other Pool Loans
The Company’s methodology for estimating the allowance for credit losses includes segmentation, quantitative analysis, qualitative analysis, and individually evaluated loans. The Company’s loan portfolio is segmented by homogeneous loan types that behave similarly to economic cycles. Further, management elected to evaluate certain loans based on shared but unique risk attributes by segmenting into the Other pool. The loans included in the Other pool of the model were underwritten and approved based on standards that are inconsistent with the Company’s current underwriting standards. During 2023, $302 million of the $305 million, or 98.9%, of the Other pool loans were transferred to individually evaluated. The allowance for credit losses as of December 31, 2023 was $97.1 million. The reserves associated with these individually evaluated loans are $54.4 million and represent 56% of the overall allowance for credit losses.
The reserves for the individually evaluated loans within the Other pool are based upon discounted cash flow valuation techniques to estimate the timing and magnitude of potential recoveries resulting from various collection processes. The techniques were developed with subjective assumptions, including the timing and magnitude of collections, discount rate, as well as other factors. The discount rate is reflective of the inherent risk in the Other pool. A substantial change in these assumptions could cause a significant impact to the model causing volatility. Management reviews the model output for appropriateness and subjectively adjusts as needed.
123
We identified the allowance for credit losses – individually evaluated Other pool loans as a critical audit matter because of the extent of auditor judgment applied and significant audit effort to evaluate the significant subjective and complex judgments made by management in the development of the estimate.
The primary procedures performed to address this critical audit matter include:
Testing the effectiveness of internal controls over:
•The Company’s affirmation of the key assumptions used in the model, including the discount rate, timing and magnitude of collections, and other adjustments
•The completeness and accuracy of data used in the model
Substantively testing management’s estimate, which included:
•Assessing the reasonableness of management’s selection of discount rate, timing and magnitude of collections, and other adjustments
•Evaluating the mathematical accuracy of the discounted cash flow model used for the Other pool, including evaluating the completeness and accuracy of loan data used in the model
| /s/ Crowe LLP | |||||
| We have served as the Company's auditor since 2019. | |||||
| March 8, 2024 | |||||
124
ITEM 9. CHANGES IN AND DISAGREEMENTS WITH ACCOUNTANTS ON ACCOUNTING AND FINANCIAL DISCLOSURES
None.
ITEM 9A. CONTROLS AND PROCEDURES
Disclosure Controls and Procedures
Under the supervision and with the participation of the Company’s Chief Executive Officer (“CEO”) and Chief Financial Officer (“CFO”) (its principal executive officer and principal financial officer, respectively), management has evaluated the effectiveness of the design and operation of the Company’s disclosure controls and procedures as of December 31, 2023. In designing and evaluating the disclosure controls and procedures, management recognizes that any controls and procedures, no matter how well designed and operated, can provide only reasonable assurance of achieving the desired control objectives.
We maintain disclosure controls and procedures that are designed to ensure that information required to be disclosed by us in the reports that we file or submit under the Securities Exchange Act of 1934, as amended, is recorded, processed, summarized and reported within the time periods required by the Securities and Exchange Commission, or the SEC, and that such information is accumulated and communicated to the Company’s management, including our CEO and CFO as appropriate, to allow timely decisions regarding required disclosure.
Based on and as of the date of such evaluation, our CEO and CFO concluded that the design and operation of our disclosure controls and procedures were effective in all material respects, as of the end of the period covered by this Report.
Management’s Report on Internal Control over Financial Reporting
Our management is responsible for establishing and maintaining adequate internal control over financial reporting, (as defined in Exchange Act Rule 13a-15(f)). Our internal control over financial reporting is a process designed by or under the supervision of, our CEO and CFO to provide reasonable assurance to our management and Board of Directors regarding the reliability of financial reporting and the preparation of financial statements for external purposes in accordance with U.S. generally accepted accounting principles. A Company’s internal control over financial reporting includes those policies and procedures that (i) pertain to the maintenance of records that, in reasonable detail, accurately and fairly reflect the transactions and dispositions of the assets of the Company; (ii) provide reasonable assurance that transactions are recorded as necessary to permit preparation of financial statements in accordance with generally accepted accounting principles, and that receipts and expenditures of the Company are being made only in accordance with authorizations of management and directors of the Company; and (iii) provide reasonable assurance regarding prevention or timely detection of unauthorized acquisition, use, or disposition of the Company’s assets that could have a material effect on the financial statements. Because of its inherent limitations, internal control over financial reporting may not prevent or detect misstatements. Also, projections of any evaluation of the effectiveness of specific controls or internal control over financial reporting overall to future periods are subject to the risk that controls may become inadequate because of changes in conditions or that the degree of compliance with the policies or procedures may deteriorate.
Based on this assessment, management concludes that, as of December 31, 2023, the Company’s system of internal control over financial reporting is effective and meets the criteria of the “Internal Control Integrated Framework (2013).” Crowe LLP, our independent registered public accounting firm, has issued a report on the effectiveness of Company’s internal control over financial reporting as of December 31, 2023, which is included herein.
Changes in Internal Control Over Financial Reporting
No other changes were made to our internal control over financial reporting (as defined in Rule 13a-15(f) under the Exchange Act) that occurred during the quarter ended December 31, 2023 that materially affected, or are reasonably likely to materially affect, the Company’s internal control over financial reporting.
125
CARTER BANKSHARES, INC. AND SUBSIDIARIES
ITEM 9B. OTHER INFORMATION
During the three months ended December 31, 2023, none of our directors or officers (as defined in Rule 16a-1(f) of the Securities Exchange Act of 1934, as amended) adopted terminated
ITEM 9C. DISCLOSURES REGARDING FOREIGN JURISDICTIONS THAT PREVENT INSPECTIONS
Not applicable
126
CARTER BANKSHARES, INC. AND SUBSIDIARIES
PART III
ITEM 10. DIRECTORS, EXECUTIVE OFFICERS AND CORPORATE GOVERNANCE
Except as set forth below, the information required by Part III, Item 10 of Form 10-K is incorporated herein from the sections entitled – “Delinquent Section 16(a) Reports” (if applicable), “Proposal 1 -- Election of Directors,” “Independence and Committee Memberships,” “Executive Officers of the Registrant,” and "Corporate Governance - Meetings and Committee of the Board of Directors" in our proxy statement relating to our May 22, 2024 annual meeting of shareholders.
Code of Ethics
The Company has adopted a Code of Conduct (the “Code”) that applies to its directors, executive officers and associates and is available on the Company’s website at www.CBTCares.com under “Investor – Corporate Information – Governance Documents.” The Company intends to provide any required disclosure of any amendment to or waiver of the Code that applies to its principal executive officer, principal financial officer, principal accounting officer or controller, or persons performing similar functions, on www.CBTCares.com under “Investor – Corporate Information – Governance Documents” promptly following the amendment or waiver. The information contained on or connected to the Company’s website is not incorporated by reference in this Annual Report on Form 10-K and should not be considered part of this or any other report or document that we file or furnish to the SEC.
ITEM 11. EXECUTIVE COMPENSATION
The information required by Part III, Item 11 of Form 10-K is incorporated herein from the sections entitled “Executive Compensation” and “Director Compensation” in our proxy statement relating to our May 22, 2024 annual meeting of shareholders.
ITEM 12. SECURITY OWNERSHIP OF CERTAIN BENEFICIAL OWNERS AND MANAGEMENT AND RELATED STOCKHOLDER MATTERS
Except as set forth below, the information required by Part III, Item 12 of Form 10-K is incorporated herein from the sections entitled “Principal Beneficial Owners of Carter Bankshares, Inc. Common Stock” and “Beneficial Ownership of Carter Bankshares, Inc. Common Stock by Directors and Officers” in our proxy statement relating to our May 22, 2024 annual meeting of shareholders.
Equity Compensation Plan Information
The following table provides summary information as of December 31, 2023 related to the Carter Bankshares, Inc. Amended and Restated 2018 Omnibus Equity Plan, the only equity compensation plan under which the Company’s securities are authorized for issuance.
| (a) | (b) | (c) | ||||||||||||||||||
| Number of securities to be issued upon exercise of outstanding options, warrants and rights | Weighted average exercise price of outstanding options, warrants and rights (1) | Number of securities remaining available for future issuance under equity compensation plan (excluding securities reflected in column (a)) | ||||||||||||||||||
| Equity compensation plan approved by shareholders | 30,630 | (2) | $— | 1,538,804 | ||||||||||||||||
| Equity compensation plans not approved by shareholders | — | — | ||||||||||||||||||
| Total | 30,630 | $— | 1,538,804 | |||||||||||||||||
(1) The weighted average exercise price does not take into account the outstanding performance unit awards noted in footnote (2) of this table. Performance unit awards do not have an exercise price and are delivered without any payment by the award recipient.
(2) The amount shown reflects the maximum number of shares that may be issued under outstanding performance units if maximum performance goals are achieved. However, the actual number of shares issued under the performance units will depend on the level of performance achieved during a three-year performance period. The award recipient may receive less than the maximum number of shares under the outstanding performance units and may receive no payout under the outstanding performance units.
127
CARTER BANKSHARES, INC. AND SUBSIDIARIES
ITEM 13. CERTAIN RELATIONSHIPS AND RELATED TRANSACTIONS, AND DIRECTOR INDEPENDENCE
The information required by Part III, Item 13 of Form 10-K is incorporated herein from the sections entitled “Related Person Transactions” and “Corporate Governance -- Director Independence” in our proxy statement relating to our May 22, 2024 annual meeting of shareholders.
ITEM 14. PRINCIPAL ACCOUNTANT FEES AND SERVICES
The information required by Part III, Item 14 of Form 10-K is incorporated herein from the section entitled “Independent Registered Public Accounting Firm” in our proxy statement relating to our May 22, 2024 annual meeting of shareholders.
128
CARTER BANKSHARES, INC. AND SUBSIDIARIES
PART IV
ITEM 15. EXHIBITS AND FINANCIAL STATEMENT SCHEDULES
(a)The following documents are filed as part of this Annual Report on Form 10-K and are incorporated by reference and found where noted below.
Consolidated Financial Statements: The following Consolidated Financial Statements are included in Part II, Item 8 of this Annual Report on Form 10-K. No financial statement schedules are being filed because the required information is inapplicable or is presented in the Consolidated Financial Statements or related notes.
(b)Exhibits
129
CARTER BANKSHARES, INC. AND SUBSIDIARIES
ITEM 15. EXHIBITS AND FINANCIAL STATEMENT SCHEDULES – (continued)
130
CARTER BANKSHARES, INC. AND SUBSIDIARIES
ITEM 15. EXHIBITS AND FINANCIAL STATEMENT SCHEDULES – (continued)
131
CARTER BANKSHARES, INC. AND SUBSIDIARIES
ITEM 15. EXHIBITS AND FINANCIAL STATEMENT SCHEDULES – (continued)
| 101.INS | Inline XBRL Instance Document - the instance document does not appear in the Interactive Data File because its XBRL tags are embedded within the Inline XBRL document | ||||
| 101.SCH | Inline XBRL Taxonomy Extension Schema | ||||
| 101.CAL | Inline XBRL Taxonomy Extension Calculation Linkbase | ||||
| 101.DEF | Inline XBRL Taxonomy Extension Definition Linkbase | ||||
| 101.LAB | Inline XBRL Taxonomy Extension Label Linkbase | ||||
| 101.PRE | Inline XBRL Taxonomy Extension Presentation Linkbase | ||||
| 104 | Cover Page Interactive Data File (formatted as Inline XBRL and contained in Exhibits 101) | ||||
* Denotes management contract.
ITEM 16. FORM 10-K SUMMARY
None.
132
CARTER BANKSHARES, INC. AND SUBSIDIARIES
SIGNATURES
Pursuant to the requirements of Section 13 or 15(d) of the Securities Exchange Act of 1934, the registrant has duly caused this report to be signed on its behalf by the undersigned, thereunto duly authorized.
| CARTER BANKSHARES, INC. | ||||||||
| (Registrant) | ||||||||
| By: | /s/ Litz H. Van Dyke | |||||||
| Name: | Litz H. Van Dyke | |||||||
| Title: | Chief Executive Officer (Principal Executive Officer) | |||||||
| Date: | March 8, 2024 | |||||||
| By: | /s/ Wendy S. Bell | |||||||
| Name: | Wendy S. Bell | |||||||
| Title: | Chief Financial Officer (Principal Financial and Accounting Officer) | |||||||
| Date: | March 8, 2024 | |||||||
Pursuant to the requirements of the Securities Exchange Act of 1934, this report has been signed below by the following persons on behalf of the registrant and in the capacities and on the dates indicated.
| By: | /s/ James W. Haskins | By: | /s/ Litz H. Van Dyke | |||||||||||
| Name: | James W. Haskins | Name: | Litz H. Van Dyke | |||||||||||
| Title: | Chairman of the Board | Title: | Director and Chief Executive Officer | |||||||||||
| Date: | March 8, 2024 | Date: | March 8, 2024 | |||||||||||
| By: | /s/ Phyllis Q. Karavatakis | By: | /s/ Michael R. Bird | |||||||||||
| Name: | Phyllis Q. Karavatakis | Name: | Michael R. Bird | |||||||||||
| Title: | Vice Chairman of the Board | Title: | Director | |||||||||||
| Date: | March 8, 2024 | Date: | March 8, 2024 | |||||||||||
| By: | /s/ Kevin S. Bloomfield | By: | /s/ Robert M. Bolton | |||||||||||
| Name: | Kevin S. Bloomfield | Name: | Robert M. Bolton | |||||||||||
| Title: | Director | Title: | Director | |||||||||||
| Date: | March 8, 2024 | Date: | March 8, 2024 | |||||||||||
| By: | /s/ Gregory W. Feldmann | By: | /s/ Jacob A. Lutz III | |||||||||||
| Name: | Gregory W. Feldmann | Name: | Jacob A. Lutz III | |||||||||||
| Title: | Director | Title: | Director | |||||||||||
| Date: | March 8, 2024 | Date: | March 8, 2024 | |||||||||||
| By: | /s/ E. Warren Matthews | By: | /s/ Catharine L. Midkiff | |||||||||||
| Name: | E. Warren Matthews | Name: | Catharine L. Midkiff | |||||||||||
| Title: | Director | Title: | Director | |||||||||||
| Date: | March 8, 2024 | Date: | March 8, 2024 | |||||||||||
133
CARTER BANKSHARES, INC. AND SUBSIDIARIES
| By: | /s/ Curtis E. Stephens | By: | /s/ Elizabeth Lester Walsh | |||||||||||
| Name: | Curtis E. Stephens | Name: | Elizabeth Lester Walsh | |||||||||||
| Title: | Director | Title: | Director | |||||||||||
| Date: | March 8, 2024 | Date: | March 8, 2024 | |||||||||||
134