UNITED STATES
SECURITIES AND EXCHANGE COMMISSION
Washington, D.C. 20549

FORM 10-Q
For the quarterly period ended March 31, 2024
OR
For the transition period from to
Commission File Number: 1-768
(Exact name of registrant as specified in its charter)
| (State or other jurisdiction of incorporation) | (IRS Employer I.D. No.) | |||||||||||||
| (Address of principal executive offices) | (Zip Code) | |||||||||||||
Registrant’s telephone number, including area code: (972 ) 891-7700
Former Name, Former Address and Former Fiscal Year, if Changed Since Last Report: N/A
Securities registered pursuant to Section 12(b) of the Act:
| Title of each class | Trading Symbol (s) | Name of each exchange on which registered | |||||||||
| ¹ | |||||||||||
¹ In addition to the New York Stock Exchange, Caterpillar common stock is also listed on stock exchanges in France and Switzerland.
Indicate by check mark whether the registrant (1) has filed all reports required to be filed by Section 13 or 15(d) of the Securities Exchange Act of 1934 during the preceding 12 months (or for such shorter period that the registrant was required to file such reports), and (2) has been subject to such filing requirements for the past 90 days. Yes ☒ No ☐
Indicate by check mark whether the registrant has submitted electronically every Interactive Data File required to be submitted pursuant to Rule 405 of Regulation S-T (§232.405 of this chapter) during the preceding 12 months (or for such shorter period that the registrant was required to submit such files). Yes ☒ No ☐
Indicate by check mark whether the registrant is a large accelerated filer, an accelerated filer, a non-accelerated filer, smaller reporting company, or an emerging growth company. See definitions of “large accelerated filer,” “accelerated filer,” “smaller reporting company,” and “emerging growth company” in Rule 12b-2 of the Exchange Act.
| ☒ | Accelerated filer | ☐ | |||||||||
| Non-accelerated filer | ☐ | Smaller reporting company | |||||||||
| Emerging growth company | |||||||||||
If an emerging growth company, indicate by check mark if the registrant has elected not to use the extended transition period for complying with any new or revised financial accounting standards provided pursuant to Section 13(a) of the Exchange Act. ☐
Indicate by check mark whether the registrant is a shell company (as defined in Rule 12b-2 of the Exchange Act). Yes ☐ No ☒
At March 31, 2024, 489,272,920 shares of common stock of the registrant were outstanding.
Table of Contents
Unregistered Sales of Equity Securities and Use of Proceeds | ||||||||
| Item 3. | Defaults Upon Senior Securities | * | ||||||
| Item 4. | Mine Safety Disclosures | * | ||||||
| Item 5. | Other Information | 76 | ||||||
* Item omitted because no answer is called for or item is not applicable.
2
Part I. FINANCIAL INFORMATION
Item 1. Financial Statements
Caterpillar Inc.
Consolidated Statement of Results of Operations
(Unaudited)
(Dollars in millions except per share data)
| Three Months Ended March 31, | |||||||||||
| 2024 | 2023 | ||||||||||
| Sales and revenues: | |||||||||||
| Sales of Machinery, Energy & Transportation | $ | $ | |||||||||
| Revenues of Financial Products | |||||||||||
| Total sales and revenues | |||||||||||
| Operating costs: | |||||||||||
| Cost of goods sold | |||||||||||
| Selling, general and administrative expenses | |||||||||||
| Research and development expenses | |||||||||||
| Interest expense of Financial Products | |||||||||||
| Other operating (income) expenses | |||||||||||
| Total operating costs | |||||||||||
| Operating profit | |||||||||||
| Interest expense excluding Financial Products | |||||||||||
| Other income (expense) | |||||||||||
| Consolidated profit before taxes | |||||||||||
| Provision (benefit) for income taxes | |||||||||||
| Profit of consolidated companies | |||||||||||
| Equity in profit (loss) of unconsolidated affiliated companies | |||||||||||
| Profit of consolidated and affiliated companies | |||||||||||
| Less: Profit (loss) attributable to noncontrolling interests | ( | ( | |||||||||
Profit 1 | $ | $ | |||||||||
| Profit per common share | $ | $ | |||||||||
Profit per common share – diluted 2 | $ | $ | |||||||||
| Weighted-average common shares outstanding (millions) | |||||||||||
| – Basic | |||||||||||
– Diluted 2 | |||||||||||
1 Profit attributable to common shareholders.
2 Diluted by assumed exercise of stock-based compensation awards using the treasury stock method.
See accompanying notes to Consolidated Financial Statements.
3
Caterpillar Inc.
Consolidated Statement of Comprehensive Income
(Unaudited)
(Dollars in millions)
| Three Months Ended March 31, | |||||||||||
| 2024 | 2023 | ||||||||||
| Profit of consolidated and affiliated companies | $ | $ | |||||||||
| Other comprehensive income (loss), net of tax (Note 13): | |||||||||||
| Foreign currency translation: | ( | ||||||||||
| Pension and other postretirement benefits: | ( | ( | |||||||||
| Derivative financial instruments: | |||||||||||
| Available-for-sale securities: | ( | ||||||||||
| Total other comprehensive income (loss), net of tax | ( | ||||||||||
| Comprehensive income | |||||||||||
| Less: comprehensive income attributable to the noncontrolling interests | ( | ( | |||||||||
| Comprehensive income attributable to shareholders | $ | $ | |||||||||
See accompanying notes to Consolidated Financial Statements.
4
Caterpillar Inc.
Consolidated Statement of Financial Position
(Unaudited)
(Dollars in millions)
| March 31, 2024 | December 31, 2023 | ||||||||||
| Assets | |||||||||||
| Current assets: | |||||||||||
| Cash and cash equivalents | $ | $ | |||||||||
| Receivables – trade and other | |||||||||||
| Receivables – finance | |||||||||||
| Prepaid expenses and other current assets | |||||||||||
| Inventories | |||||||||||
| Total current assets | |||||||||||
| Property, plant and equipment – net | |||||||||||
| Long-term receivables – trade and other | |||||||||||
| Long-term receivables – finance | |||||||||||
| Noncurrent deferred and refundable income taxes | |||||||||||
| Intangible assets | |||||||||||
| Goodwill | |||||||||||
| Other assets | |||||||||||
| Total assets | $ | $ | |||||||||
| Liabilities | |||||||||||
| Current liabilities: | |||||||||||
| Short-term borrowings: | |||||||||||
| Financial Products | $ | $ | |||||||||
| Accounts payable | |||||||||||
| Accrued expenses | |||||||||||
| Accrued wages, salaries and employee benefits | |||||||||||
| Customer advances | |||||||||||
| Dividends payable | |||||||||||
| Other current liabilities | |||||||||||
| Long-term debt due within one year: | |||||||||||
| Machinery, Energy & Transportation | |||||||||||
| Financial Products | |||||||||||
| Total current liabilities | |||||||||||
| Long-term debt due after one year: | |||||||||||
| Machinery, Energy & Transportation | |||||||||||
| Financial Products | |||||||||||
| Liability for postemployment benefits | |||||||||||
| Other liabilities | |||||||||||
| Total liabilities | |||||||||||
| Commitments and contingencies (Notes 11 and 14) | |||||||||||
| Shareholders’ equity | |||||||||||
Common stock of $ | |||||||||||
Authorized shares: Issued shares: (3/31/24 and 12/31/23 – | |||||||||||
Treasury stock: (3/31/24 – | ( | ( | |||||||||
| Profit employed in the business | |||||||||||
| Accumulated other comprehensive income (loss) | ( | ( | |||||||||
| Noncontrolling interests | |||||||||||
| Total shareholders’ equity | |||||||||||
| Total liabilities and shareholders’ equity | $ | $ | |||||||||
See accompanying notes to Consolidated Financial Statements.
5
Caterpillar Inc.
Consolidated Statement of Changes in Shareholders’ Equity
(Unaudited)
(Dollars in millions)
| Common stock | Treasury stock | Profit employed in the business | Accumulated other comprehensive income (loss) | Noncontrolling interests | Total | ||||||||||||||||||||||||||||||
| Three Months Ended March 31, 2023 | |||||||||||||||||||||||||||||||||||
| Balance at December 31, 2022 | $ | $ | ( | $ | $ | ( | $ | $ | |||||||||||||||||||||||||||
| Profit (loss) of consolidated and affiliated companies | — | — | — | ( | |||||||||||||||||||||||||||||||
| Foreign currency translation, net of tax | — | — | — | — | |||||||||||||||||||||||||||||||
| Pension and other postretirement benefits, net of tax | — | — | — | ( | — | ( | |||||||||||||||||||||||||||||
| Derivative financial instruments, net of tax | — | — | — | — | |||||||||||||||||||||||||||||||
| Available-for-sale securities, net of tax | — | — | — | — | |||||||||||||||||||||||||||||||
Common shares issued from treasury stock for stock-based compensation: | ( | — | — | — | ( | ||||||||||||||||||||||||||||||
| Stock-based compensation expense | — | — | — | — | |||||||||||||||||||||||||||||||
Common shares repurchased: | — | ( | — | — | — | ( | |||||||||||||||||||||||||||||
| Other | ( | — | — | — | |||||||||||||||||||||||||||||||
| Balance at March 31, 2023 | $ | $ | ( | $ | $ | ( | $ | $ | |||||||||||||||||||||||||||
| Three Months Ended March 31, 2024 | |||||||||||||||||||||||||||||||||||
| Balance at December 31, 2023 | $ | $ | ( | $ | $ | ( | $ | $ | |||||||||||||||||||||||||||
| Profit (loss) of consolidated and affiliated companies | — | — | — | ( | |||||||||||||||||||||||||||||||
| Foreign currency translation, net of tax | — | — | — | ( | — | ( | |||||||||||||||||||||||||||||
| Pension and other postretirement benefits, net of tax | — | — | — | ( | — | ( | |||||||||||||||||||||||||||||
| Available-for-sale securities, net of tax | — | — | — | ( | — | ( | |||||||||||||||||||||||||||||
| Dividends declared | — | — | — | — | |||||||||||||||||||||||||||||||
Common shares issued from treasury stock for stock-based compensation: | ( | — | — | — | ( | ||||||||||||||||||||||||||||||
| Stock-based compensation expense | — | — | — | — | |||||||||||||||||||||||||||||||
Common shares repurchased: | — | ( | — | — | — | ( | |||||||||||||||||||||||||||||
| Outstanding authorized accelerated stock repurchases | ( | — | — | — | — | ( | |||||||||||||||||||||||||||||
| Other | ( | — | — | ( | ( | ||||||||||||||||||||||||||||||
| Balance at March 31, 2024 | $ | $ | ( | $ | $ | ( | $ | $ | |||||||||||||||||||||||||||
1 See Note 12 for additional information.
See accompanying notes to Consolidated Financial Statements.
6
Caterpillar Inc.
Consolidated Statement of Cash Flow
(Unaudited)
(Millions of dollars)
| Three Months Ended March 31, | |||||||||||
| 2024 | 2023 | ||||||||||
| Cash flow from operating activities: | |||||||||||
| Profit of consolidated and affiliated companies | $ | $ | |||||||||
| Adjustments to reconcile profit to net cash provided by operating activities: | |||||||||||
| Depreciation and amortization | |||||||||||
| Provision (benefit) for deferred income taxes | ( | ( | |||||||||
| (Gain) loss on divestiture | ( | ||||||||||
| Other | ( | ||||||||||
| Changes in assets and liabilities, net of acquisitions and divestitures: | |||||||||||
| Receivables – trade and other | ( | ( | |||||||||
| Inventories | ( | ( | |||||||||
| Accounts payable | |||||||||||
| Accrued expenses | ( | ||||||||||
| Accrued wages, salaries and employee benefits | ( | ( | |||||||||
| Customer advances | |||||||||||
| Other assets – net | |||||||||||
| Other liabilities – net | |||||||||||
| Net cash provided by (used for) operating activities | |||||||||||
| Cash flow from investing activities: | |||||||||||
| Capital expenditures – excluding equipment leased to others | ( | ( | |||||||||
| Expenditures for equipment leased to others | ( | ( | |||||||||
| Proceeds from disposals of leased assets and property, plant and equipment | |||||||||||
| Additions to finance receivables | ( | ( | |||||||||
| Collections of finance receivables | |||||||||||
| Proceeds from sale of finance receivables | |||||||||||
| Investments and acquisitions (net of cash acquired) | ( | ||||||||||
| Proceeds from sale of businesses and investments (net of cash sold) | ( | ||||||||||
| Proceeds from maturities and sale of securities | |||||||||||
| Investments in securities | ( | ( | |||||||||
| Other – net | |||||||||||
| Net cash provided by (used for) investing activities | ( | ||||||||||
| Cash flow from financing activities: | |||||||||||
| Dividends paid | ( | ( | |||||||||
| Common stock issued, including treasury shares reissued | ( | ( | |||||||||
| Common shares repurchased | ( | ( | |||||||||
| Proceeds from debt issued (original maturities greater than three months): | |||||||||||
| Financial Products | |||||||||||
| Payments on debt (original maturities greater than three months): | |||||||||||
| Machinery, Energy & Transportation | ( | ( | |||||||||
| Financial Products | ( | ( | |||||||||
| Short-term borrowings – net (original maturities three months or less) | ( | ( | |||||||||
| Net cash provided by (used for) financing activities | ( | ( | |||||||||
| Effect of exchange rate changes on cash | ( | ( | |||||||||
| Increase (decrease) in cash, cash equivalents and restricted cash | ( | ( | |||||||||
| Cash, cash equivalents and restricted cash at beginning of period | |||||||||||
| Cash, cash equivalents and restricted cash at end of period | $ | $ | |||||||||
Cash equivalents primarily represent short-term, highly liquid investments with original maturities of generally three months or less.
See accompanying notes to Consolidated Financial Statements.
7
NOTES TO CONSOLIDATED FINANCIAL STATEMENTS
(Unaudited)
1. A. Nature of operations
Information in our financial statements and related commentary are presented in the following categories:
Machinery, Energy & Transportation (ME&T) – We define ME&T as Caterpillar Inc. and its subsidiaries, excluding Financial Products. ME&T’s information relates to the design, manufacturing and marketing of our products.
Financial Products – We define Financial Products as our finance and insurance subsidiaries, primarily Caterpillar Financial Services Corporation (Cat Financial) and Caterpillar Insurance Holdings Inc. (Insurance Services). Financial Products’ information relates to the financing to customers and dealers for the purchase and lease of Caterpillar and other equipment.
B. Basis of presentation
In the opinion of management, the accompanying unaudited financial statements include all adjustments, consisting only of normal recurring adjustments, necessary for a fair statement of (a) the consolidated results of operations for the three months ended March 31, 2024 and 2023, (b) the consolidated comprehensive income for the three months ended March 31, 2024 and 2023, (c) the consolidated financial position at March 31, 2024 and December 31, 2023, (d) the consolidated changes in shareholders’ equity for the three months ended March 31, 2024 and 2023 and (e) the consolidated cash flow for the three months ended March 31, 2024 and 2023. The financial statements have been prepared in conformity with generally accepted accounting principles in the United States of America (U.S. GAAP) and pursuant to the rules and regulations of the Securities and Exchange Commission (SEC).
Interim results are not necessarily indicative of results for a full year. The information included in this Form 10-Q should be read in conjunction with the audited financial statements and notes thereto included in our company’s annual report on Form 10-K for the year ended December 31, 2023 (2023 Form 10-K).
The December 31, 2023 financial position data included herein is derived from the audited consolidated financial statements included in the 2023 Form 10-K but does not include all disclosures required by U.S. GAAP. Certain amounts for prior periods have been reclassified to conform to the current period financial statement presentation.
2. New accounting guidance
A. Adoption of new accounting standards
We consider the applicability and impact of all ASUs. We adopted the following ASUs effective January 1, 2024, none of which had a material impact on our financial statements:
| ASU | Description | ||||
| 2022-03 | Fair value measurement – Equity securities subject to contractual sale restrictions | ||||
| 2023-01 | Leases – Common control arrangements | ||||
| 2023-02 | Accounting for Investments in Tax Credit Structures Using the Proportional Amortization Method | ||||
B. Accounting standards issued but not yet adopted
Segment reporting (ASU 2023-07) — In November 2023, the Financial Accounting Standards Board (FASB) issued accounting guidance that requires incremental disclosures related to reportable segments which includes significant segment expense categories and amounts for each reportable segment. The expanded annual disclosures are effective
8
for our year ending December 31, 2024, and the expanded interim disclosures are effective in 2025 and will be applied retrospectively to all prior periods presented. We are in the process of evaluating the effect of this new guidance on the related disclosures.
Income tax reporting (ASU 2023-09) — In December 2023, the FASB issued accounting guidance to expand the annual disclosure requirements for income taxes, primarily related to the rate reconciliation and income taxes paid. This guidance is effective January 1, 2025, with early adoption permitted. This guidance can be applied prospectively or retrospectively. We are in the process of evaluating the effect of this new guidance on the related disclosures.
All other ASUs issued but not yet adopted were assessed and determined that they either were not applicable or were not expected to have a material impact on our financial statements.
3. Sales and revenue contract information
Trade receivables represent amounts due from dealers and end users for the sale of our products, and include amounts due from wholesale inventory financing provided by Cat Financial for a dealer’s purchase of inventory. We recognize trade receivables from dealers and end users in Receivables – trade and other and Long-term receivables – trade and other in the Consolidated Statement of Financial Position. Trade receivables from dealers and end users were $7,860 million, $7,923 million and $7,551 million as of March 31, 2024, December 31, 2023 and December 31, 2022, respectively. Long-term trade receivables from dealers and end users were $604 million, $589 million and $506 million as of March 31, 2024, December 31, 2023 and December 31, 2022, respectively.
For certain contracts, we invoice for payment when contractual milestones are achieved. We recognize a contract asset when a sale is recognized before achieving the contractual milestones for invoicing. We reduce the contract asset when we invoice for payment and recognize a corresponding trade receivable. Contract assets are included in Prepaid expenses and other current assets in the Consolidated Statement of Financial Position. Contract assets were $196 million, $246 million and $247 million as of March 31, 2024, December 31, 2023 and December 31, 2022, respectively.
As of March 31, 2024, we have entered into contracts with dealers and end users for which sales have not been recognized as we have not satisfied our performance obligations and transferred control of the products. The dollar amount of unsatisfied performance obligations for contracts with an original duration greater than one year is $12.5 billion, with about one-half of the amount expected to be completed and revenue recognized in the twelve months following March 31, 2024. We have elected the practical expedient not to disclose unsatisfied performance obligations with an original contract duration of one year or less. Contracts with an original duration of one year or less are primarily sales to dealers for machinery, engines and replacement parts.
See Note 16 for further disaggregated sales and revenues information.
4. Stock-based compensation
Accounting for stock-based compensation requires that the cost resulting from all stock-based payments be recognized in the financial statements based on the grant date fair value of the award. Our stock-based compensation consists of stock options, restricted stock units (RSUs) and performance-based restricted stock units (PRSUs).
We recognized pretax stock-based compensation expense of $44
9
The following table illustrates the type and fair value of the stock-based compensation awards granted during the three months ended March 31, 2024 and 2023, respectively:
| Three Months Ended March 31, 2024 | Three Months Ended March 31, 2023 | ||||||||||||||||||||||||||||||||||
| Shares Granted | Weighted-Average Fair Value Per Share | Weighted-Average Grant Date Stock Price | Shares Granted | Weighted-Average Fair Value Per Share | Weighted-Average Grant Date Stock Price | ||||||||||||||||||||||||||||||
| Stock options | $ | $ | $ | $ | |||||||||||||||||||||||||||||||
| RSUs | $ | $ | $ | $ | |||||||||||||||||||||||||||||||
| PRSUs | $ | $ | $ | $ | |||||||||||||||||||||||||||||||
The fair value of our stock options was estimated using the Black-Scholes option-pricing model. The following table provides the assumptions used in determining the fair value of the stock-options granted in the three months ended March 31, 2024 and 2023, respectively:
| Grant Year | |||||||||||
| 2024 | 2023 | ||||||||||
| Weighted-average dividend yield | |||||||||||
| Weighted-average volatility | |||||||||||
| Range of volatilities | |||||||||||
| Range of risk-free interest rates | |||||||||||
| Weighted-average expected lives | |||||||||||
The PRSUs granted in 2024 contain a market condition and a Monte Carlo simulation was utilized to estimate the fair value of the awards. The following table provides the assumptions used in determining the fair value of the PRSUs granted in the three months ended March 31, 2024:
| Grant Year | |||||
| 2024 | |||||
| Expected volatility of the Company's stock | |||||
| Risk-free interest rate | |||||
5. Derivative financial instruments and risk management
Our earnings and cash flow are subject to fluctuations due to changes in foreign currency exchange rates, interest rates, commodity prices, and certain deferred compensation plan liabilities. Our Risk Management Policy (policy) allows for the use of derivative financial instruments to prudently manage foreign currency exchange rate, interest rate, commodity price and certain deferred compensation plan liability exposures. Our policy specifies that derivatives are not to be used for speculative purposes. Derivatives that we use are primarily foreign currency forward, option and cross currency contracts, interest rate contracts, commodity forward and option contracts and total return swap contracts. Our derivative activities are subject to the management, direction and control of our senior financial officers. We present at least annually to the Audit Committee of the Board of Directors on our risk management practices, including our use of financial derivative instruments.
10
We recognize all derivatives at their fair value on the Consolidated Statement of Financial Position. On the date the derivative contract is entered into, we designate the derivative as (1) a hedge of the fair value of a recognized asset or liability (fair value hedge), (2) a hedge of a forecasted transaction or the variability of cash flow (cash flow hedge) or (3) an undesignated instrument. We record in current earnings changes in the fair value of a derivative that is qualified, designated and highly effective as a fair value hedge, along with the gain or loss on the hedged recognized asset or liability that is attributable to the hedged risk. We record in AOCI changes in the fair value of a derivative that is qualified, designated and highly effective as a cash flow hedge, to the extent effective, on the Consolidated Statement of Financial Position until we reclassify them to earnings in the same period or periods during which the hedged transaction affects earnings. We report changes in the fair value of undesignated derivative instruments in current earnings. We classify cash flows from designated derivative financial instruments within the same category as the item being hedged on the Consolidated Statement of Cash Flow. We include cash flows from undesignated derivative financial instruments in the investing category on the Consolidated Statement of Cash Flow.
We formally document all relationships between hedging instruments and hedged items, as well as the risk-management objective and strategy for undertaking various hedge transactions. This process includes linking all derivatives that are designated as fair value hedges to specific assets and liabilities on the Consolidated Statement of Financial Position and linking cash flow hedges to specific forecasted transactions or variability of cash flow.
We also formally assess, both at the hedge’s inception and on an ongoing basis, whether the designated derivatives that are used in hedging transactions are highly effective in offsetting changes in fair values or cash flow of hedged items. When a derivative is determined not to be highly effective as a hedge or the underlying hedged transaction is no longer probable, we discontinue hedge accounting prospectively, in accordance with the derecognition criteria for hedge accounting.
Foreign Currency Exchange Rate Risk
Foreign currency exchange rate movements create a degree of risk by affecting the U.S. dollar value of sales made and costs incurred in foreign currencies. Movements in foreign currency rates also affect our competitive position as these changes may affect business practices and/or pricing strategies of non-U.S.-based competitors. Additionally, we have balance sheet positions denominated in foreign currencies, thereby creating exposure to movements in exchange rates.
Our ME&T operations purchase, manufacture and sell products in many locations around the world. As we have a diversified revenue and cost base, we manage our future foreign currency cash flow exposure on a net basis. We use foreign currency forward and option contracts to manage unmatched foreign currency cash inflow and outflow. Our objective is to minimize the risk of exchange rate movements that would reduce the U.S. dollar value of our foreign currency cash flow. Our policy allows for managing anticipated foreign currency cash flow for up to approximately five years . As of March 31, 2024, the maximum term of these outstanding contracts at inception was approximately 60 months.
We generally designate as cash flow hedges at inception of the contract any foreign currency forward or option contracts that meet the requirements for hedge accounting and the maturity extends beyond the current quarter-end. We perform designation on a specific exposure basis to support hedge accounting. The remainder of ME&T foreign currency contracts are undesignated.
In managing foreign currency risk for our Financial Products operations, our objective is to minimize earnings volatility resulting from conversion and the remeasurement of net foreign currency balance sheet positions and future transactions denominated in foreign currencies. Our policy allows the use of foreign currency forward, option and cross currency contracts to offset the risk of currency mismatch between our assets and liabilities and exchange rate risk associated with future transactions denominated in foreign currencies. Our foreign currency forward and option contracts are primarily undesignated. We designate fixed-to-fixed cross currency contracts as cash flow hedges to protect against movements in exchange rates on foreign currency fixed-rate assets and liabilities.
Interest Rate Risk
Interest rate movements create a degree of risk by affecting the amount of our interest payments and the value of our fixed-rate debt. Our practice is to use interest rate contracts to manage our exposure to interest rate changes.
11
Our ME&T operations generally use fixed-rate debt as a source of funding. Our objective is to minimize the cost of borrowed funds. Our policy allows us to enter into fixed-to-floating interest rate contracts and forward rate agreements to meet that objective. We designate fixed-to-floating interest rate contracts as fair value hedges at inception of the contract, and we designate certain forward rate agreements as cash flow hedges at inception of the contract.
Financial Products operations has a match-funding policy that addresses interest rate risk by aligning the interest rate profile (fixed or floating rate and duration) of Cat Financial’s debt portfolio with the interest rate profile of our receivables portfolio within predetermined ranges on an ongoing basis. In connection with that policy, we use interest rate derivative instruments to modify the debt structure to match assets within the receivables portfolio. This matched funding reduces the volatility of margins between interest-bearing assets and interest-bearing liabilities, regardless of which direction interest rates move.
Our policy allows us to use fixed-to-floating, floating-to-fixed and floating-to-floating interest rate contracts to meet the match-funding objective. We designate fixed-to-floating interest rate contracts as fair value hedges to protect debt against changes in fair value due to changes in the benchmark interest rate. We designate most floating-to-fixed interest rate contracts as cash flow hedges to protect against the variability of cash flows due to changes in the benchmark interest rate.
We have, at certain times, liquidated fixed-to-floating and floating-to-fixed interest rate contracts at both ME&T and Financial Products. We amortize the gains or losses associated with these contracts at the time of liquidation into earnings over the original term of the previously designated hedged item.
Commodity Price Risk
Commodity price movements create a degree of risk by affecting the price we must pay for certain raw materials. Our policy is to use commodity forward and option contracts to manage the commodity risk and reduce the cost of purchased materials.
Our ME&T operations purchase base and precious metals embedded in the components we purchase from suppliers. Our suppliers pass on to us price changes in the commodity portion of the component cost. In addition, we are subject to price changes on energy products such as natural gas and diesel fuel purchased for operational use.
Our objective is to minimize volatility in the price of these commodities. Our policy allows us to enter into commodity forward and option contracts to lock in the purchase price of a portion of these commodities within a five-year horizon. All such commodity forward and option contracts are undesignated.
Deferred Compensation Plan Liability Risk
We are also exposed to variability in compensation expense related to certain non-qualified deferred compensation obligations to employees. We utilize total return swaps to economically hedge this exposure to offset the related compensation expense. All such total return swap contracts are undesignated.
12
The location and fair value of derivative instruments reported in the Consolidated Statement of Financial Position were as follows:
| (Millions of dollars) | Fair Value | ||||||||||||||||||||||
| March 31, 2024 | December 31, 2023 | ||||||||||||||||||||||
Assets 1 | Liabilities 2 | Assets 1 | Liabilities 2 | ||||||||||||||||||||
| Designated derivatives | |||||||||||||||||||||||
| Foreign exchange contracts | $ | $ | ( | $ | $ | ( | |||||||||||||||||
| Interest rate contracts | ( | ( | |||||||||||||||||||||
| Total | $ | $ | ( | $ | $ | ( | |||||||||||||||||
| Undesignated derivatives | |||||||||||||||||||||||
| Foreign exchange contracts | $ | $ | ( | $ | $ | ( | |||||||||||||||||
| Commodity contracts | ( | ( | |||||||||||||||||||||
| Total return swap contracts | |||||||||||||||||||||||
| Total | $ | $ | ( | $ | $ | ( | |||||||||||||||||
1 Assets are classified on the Consolidated Statement of Financial Position as Receivables - trade and other or Long-term receivables - trade and other. | |||||||||||||||||||||||
2 Liabilities are classified on the Consolidated Statement of Financial Position as Accrued expenses or Other liabilities. | |||||||||||||||||||||||
The total notional amounts of the derivative instruments as of March 31, 2024 and December 31, 2023 were $24.2 billion and $25.6 billion, respectively. The notional amounts of the derivative financial instruments do not represent amounts exchanged by the parties. We calculate the amounts exchanged by the parties by referencing the notional amounts and by other terms of the derivatives, such as foreign currency exchange rates, interest rates, commodity prices or certain deferred compensation plan liabilities.
Gains (Losses) on derivative instruments are categorized as follows:
| (Millions of dollars) | Three Months Ended March 31, | ||||||||||||||||||||||||||||||||||
| Fair Value / Undesignated Hedges | Cash Flow Hedges | ||||||||||||||||||||||||||||||||||
Gains (Losses) Recognized on the Consolidated Statement of Results of Operations 1 | Gains (Losses) Recognized in AOCI | Gains (Losses) Reclassified from AOCI 2 | |||||||||||||||||||||||||||||||||
| 2024 | 2023 | 2024 | 2023 | 2024 | 2023 | ||||||||||||||||||||||||||||||
| Foreign exchange contracts | $ | $ | ( | $ | $ | $ | $ | ( | |||||||||||||||||||||||||||
| Interest rate contracts | ( | ( | ( | ||||||||||||||||||||||||||||||||
| Commodity contracts | ( | ||||||||||||||||||||||||||||||||||
| Total return swap contracts | |||||||||||||||||||||||||||||||||||
| Total | $ | $ | ( | $ | $ | $ | $ | ( | |||||||||||||||||||||||||||
1 Foreign exchange contract, Commodity contract and Total return swap contract gains (losses) are included in Other income (expense) in the Consolidated Statement of Financial Position. Interest rate contract gains (losses) are included in Interest expense of Financial Products and Interest expense excluding Financial Products on the Consolidated Statement of Financial Position. | |||||||||||||||||||||||||||||||||||
2 Foreign exchange contract gains (losses) are primarily included in Other income (expense) on the Consolidated Statement of Financial Position. Interest rate contract gains (losses) are primarily included in Interest expense of Financial Products on the Consolidated Statement of Financial Position. | |||||||||||||||||||||||||||||||||||
13
The following amounts were recorded on the Consolidated Statement of Financial Position related to cumulative basis adjustments for fair value hedges:
| (Millions of dollars) | Carrying Value of the Hedged Liabilities | Cumulative Amount of Fair Value Hedging Adjustment Included in the Carrying Value of the Hedged Liabilities | |||||||||||||||||||||
| March 31, 2024 | December 31, 2023 | March 31, 2024 | December 31, 2023 | ||||||||||||||||||||
| Long-term debt due within one year | $ | $ | $ | ( | $ | ( | |||||||||||||||||
| Long-term debt due after one year | ( | ( | |||||||||||||||||||||
| Total | $ | $ | $ | ( | $ | ( | |||||||||||||||||
We enter into International Swaps and Derivatives Association (ISDA) master netting agreements within ME&T and Financial Products that permit the net settlement of amounts owed under their respective derivative contracts. Under these master netting agreements, net settlement generally permits the company or the counterparty to determine the net amount payable for contracts due on the same date and in the same currency for similar types of derivative transactions. The master netting agreements may also provide for net settlement of all outstanding contracts with a counterparty in the case of an event of default or a termination event.
Collateral is typically not required of the counterparties or of our company under the master netting agreements. As of March 31, 2024 and December 31, 2023, no cash collateral was received or pledged under the master netting agreements.
The effect of the net settlement provisions of the master netting agreements on our derivative balances upon an event of default or termination event was as follows:
| (Millions of dollars) | March 31, 2024 | December 31, 2023 | |||||||||||||||||||||
| Assets | Liabilities | Assets | Liabilities | ||||||||||||||||||||
| Gross Amounts Recognized | $ | $ | ( | $ | $ | ( | |||||||||||||||||
| Financial Instruments Not Offset | ( | ( | |||||||||||||||||||||
| Net Amount | $ | $ | ( | $ | $ | ( | |||||||||||||||||
6. Inventories
Inventories (principally using the last-in, first-out (LIFO) method) were comprised of the following:
| (Millions of dollars) | March 31, 2024 | December 31, 2023 | |||||||||
| Raw materials | $ | $ | |||||||||
| Work-in-process | |||||||||||
| Finished goods | |||||||||||
| Supplies | |||||||||||
| Total inventories | $ | $ | |||||||||
14
7. Intangible assets and goodwill
A. Intangible assets
Intangible assets were comprised of the following:
| March 31, 2024 | |||||||||||||||||
| (Millions of dollars) | Gross Carrying Amount | Accumulated Amortization | Net | ||||||||||||||
| Customer relationships | $ | $ | ( | $ | |||||||||||||
| Intellectual property | ( | ||||||||||||||||
| Other | ( | ||||||||||||||||
| Total finite-lived intangible assets | $ | $ | ( | $ | |||||||||||||
| December 31, 2023 | |||||||||||||||||
| Gross Carrying Amount | Accumulated Amortization | Net | |||||||||||||||
| Customer relationships | $ | $ | ( | $ | |||||||||||||
| Intellectual property | ( | ||||||||||||||||
| Other | ( | ||||||||||||||||
| Total finite-lived intangible assets | $ | $ | ( | $ | |||||||||||||
Amortization expense for the three months ended March 31, 2024 and 2023 was $44 million and $66 million, respectively. Amortization expense related to intangible assets is expected to be:
| (Millions of dollars) | ||||||||||||||||||||||||||||||||
| Remaining Nine Months of 2024 | 2025 | 2026 | 2027 | 2028 | Thereafter | |||||||||||||||||||||||||||
| $ | $ | $ | $ | $ | $ | |||||||||||||||||||||||||||
B. Goodwill
15
The changes in carrying amount of goodwill by reportable segment for the three months ended March 31, 2024 were as follows:
| (Millions of dollars) | December 31, 2023 | Other Adjustments 1 | March 31, 2024 | |||||||||||||||||
| Construction Industries | ||||||||||||||||||||
| Goodwill | $ | $ | ( | $ | ||||||||||||||||
| Impairments | ( | — | ( | |||||||||||||||||
| Net goodwill | ( | |||||||||||||||||||
| Resource Industries | ||||||||||||||||||||
| Goodwill | ( | |||||||||||||||||||
| Impairments | ( | — | ( | |||||||||||||||||
| Net goodwill | ( | |||||||||||||||||||
| Energy & Transportation | ||||||||||||||||||||
| Goodwill | ( | |||||||||||||||||||
| Impairments | ( | — | ( | |||||||||||||||||
| Net goodwill | ( | |||||||||||||||||||
All Other 2 | ||||||||||||||||||||
| Goodwill | ( | |||||||||||||||||||
| Consolidated total | ||||||||||||||||||||
| Goodwill | ( | |||||||||||||||||||
| Impairments | ( | — | ( | |||||||||||||||||
| Net goodwill | $ | $ | ( | $ | ||||||||||||||||
1 Other adjustments are comprised primarily of foreign currency translation.
2 Includes All Other Segment (See Note 16).
8. Investments in debt and equity securities
We have investments in certain debt and equity securities, which we record at fair value and primarily include in Other assets in the Consolidated Statement of Financial Position.
We classify debt securities primarily as available-for-sale. We include the unrealized gains and losses arising from the revaluation of available-for-sale debt securities, net of applicable deferred income taxes, in equity (AOCI in the Consolidated Statement of Financial Position). We include the unrealized gains and losses arising from the revaluation of the equity securities in Other income (expense) in the Consolidated Statement of Results of Operations. We generally determine realized gains and losses on sales of investments using the specific identification method for available-for-sale debt and equity securities and include them in Other income (expense) in the Consolidated Statement of Results of Operations.
The cost basis and fair value of available-for-sale debt securities with unrealized gains and losses included in equity (AOCI in the Consolidated Statement of Financial Position) were as follows:
16
Available-for-sale debt securities | March 31, 2024 | December 31, 2023 | |||||||||||||||||||||||||||||||||
| (Millions of dollars) | Cost Basis | Unrealized Pretax Net Gains (Losses) | Fair Value | Cost Basis | Unrealized Pretax Net Gains (Losses) | Fair Value | |||||||||||||||||||||||||||||
| Government debt securities | |||||||||||||||||||||||||||||||||||
| U.S. treasury bonds | $ | $ | $ | $ | $ | $ | |||||||||||||||||||||||||||||
| Other U.S. and non-U.S. government bonds | ( | ( | |||||||||||||||||||||||||||||||||
| Corporate debt securities | |||||||||||||||||||||||||||||||||||
| Corporate bonds and other debt securities | ( | ( | |||||||||||||||||||||||||||||||||
| Asset-backed securities | ( | ( | |||||||||||||||||||||||||||||||||
| Mortgage-backed debt securities | |||||||||||||||||||||||||||||||||||
| U.S. governmental agency | ( | ( | |||||||||||||||||||||||||||||||||
| Residential | ( | ( | |||||||||||||||||||||||||||||||||
| Commercial | ( | ( | |||||||||||||||||||||||||||||||||
| Total available-for-sale debt securities | $ | $ | ( | $ | $ | $ | ( | $ | |||||||||||||||||||||||||||
| Available-for-sale debt securities in an unrealized loss position: | |||||||||||||||||||||||||||||||||||
| March 31, 2024 | |||||||||||||||||||||||||||||||||||
Less than 12 months 1 | 12 months or more 1 | Total | |||||||||||||||||||||||||||||||||
| (Millions of dollars) | Fair Value | Unrealized Losses | Fair Value | Unrealized Losses | Fair Value | Unrealized Losses | |||||||||||||||||||||||||||||
| Government debt securities | |||||||||||||||||||||||||||||||||||
| Other U.S. and non-U.S. government bonds | $ | $ | $ | $ | $ | $ | |||||||||||||||||||||||||||||
| Corporate debt securities | |||||||||||||||||||||||||||||||||||
| Corporate bonds | |||||||||||||||||||||||||||||||||||
| Asset-backed securities | |||||||||||||||||||||||||||||||||||
| Mortgage-backed debt securities | |||||||||||||||||||||||||||||||||||
| U.S. governmental agency | |||||||||||||||||||||||||||||||||||
| Commercial | |||||||||||||||||||||||||||||||||||
| Total | $ | $ | $ | $ | $ | $ | |||||||||||||||||||||||||||||
| December 31, 2023 | |||||||||||||||||||||||||||||||||||
Less than 12 months 1 | 12 months or more 1 | Total | |||||||||||||||||||||||||||||||||
| (Millions of dollars) | Fair Value | Unrealized Losses | Fair Value | Unrealized Losses | Fair Value | Unrealized Losses | |||||||||||||||||||||||||||||
| Government debt securities | |||||||||||||||||||||||||||||||||||
| Other U.S. and non-U.S. government bonds | $ | $ | $ | $ | $ | $ | |||||||||||||||||||||||||||||
| Corporate debt securities | |||||||||||||||||||||||||||||||||||
| Corporate bonds | |||||||||||||||||||||||||||||||||||
| Asset-backed securities | |||||||||||||||||||||||||||||||||||
| Mortgage-backed debt securities | |||||||||||||||||||||||||||||||||||
| U.S. governmental agency | |||||||||||||||||||||||||||||||||||
| Commercial | |||||||||||||||||||||||||||||||||||
| Total | $ | $ | $ | $ | $ | $ | |||||||||||||||||||||||||||||
1 Indicates the length of time that individual securities have been in a continuous unrealized loss position. | |||||||||||||||||||||||||||||||||||
17
The unrealized losses on our investments in government debt securities, corporate debt securities, and mortgage-backed debt securities relate to changes in underlying interest rates and credit spreads since time of purchase. We do not intend to sell the investments, and it is not likely that we will be required to sell the investments before recovery of their respective amortized cost basis. In addition, we did not expect credit-related losses on these investments as of March 31, 2024.
The cost basis and fair value of available-for-sale debt securities at March 31, 2024, by contractual maturity, are shown below. Expected maturities will differ from contractual maturities because borrowers may have the right to prepay and creditors may have the right to call obligations.
| March 31, 2024 | |||||||||||
| (Millions of dollars) | Cost Basis | Fair Value | |||||||||
| Due in one year or less | $ | $ | |||||||||
| Due after one year through five years | |||||||||||
| Due after five years through ten years | |||||||||||
| Due after ten years | |||||||||||
| U.S. governmental agency mortgage-backed securities | |||||||||||
| Residential mortgage-backed securities | |||||||||||
| Commercial mortgage-backed securities | |||||||||||
| Total debt securities – available-for-sale | $ | $ | |||||||||
| Sales of available-for-sale debt securities: | |||||||||||
| Three Months Ended March 31, | |||||||||||
| (Millions of dollars) | 2024 | 2023 | |||||||||
| Proceeds from the sale of available-for-sale securities | $ | $ | |||||||||
| Gross gains from the sale of available-for-sale securities | $ | $ | |||||||||
| Gross losses from the sale of available-for-sale securities | $ | $ | |||||||||
In addition, we had $400 million and $1,900 million of investments in time deposits classified as held-to-maturity debt securities as of March 31, 2024 and December 31, 2023. All these investments mature within one year and we include them in Prepaid expenses and other current assets in the Consolidated Statement of Financial Position. We record held-to-maturity debt securities at amortized cost, which approximates fair value.
For the three months ended March 31, 2024 and 2023, the net unrealized gains (losses) for equity securities held at March 31, 2024 and 2023 were $17 million and $(8 ) million, respectively.
18
9. Postretirement benefits
A. Pension and postretirement benefit costs
U.S. Pension Benefits | Non-U.S. Pension Benefits | Other Postretirement Benefits | |||||||||||||||||||||||||||||||||
| March 31, | March 31, | March 31, | |||||||||||||||||||||||||||||||||
| (Millions of dollars) | 2024 | 2023 | 2024 | 2023 | 2024 | 2023 | |||||||||||||||||||||||||||||
| For the three months ended: | |||||||||||||||||||||||||||||||||||
| Components of net periodic benefit cost: | |||||||||||||||||||||||||||||||||||
| Service cost | $ | $ | $ | $ | $ | $ | |||||||||||||||||||||||||||||
| Interest cost | |||||||||||||||||||||||||||||||||||
| Expected return on plan assets | ( | ( | ( | ( | ( | ( | |||||||||||||||||||||||||||||
| Amortization of prior service cost (credit) | ( | ( | |||||||||||||||||||||||||||||||||
Net periodic benefit cost (benefit) 1 | $ | ( | $ | ( | $ | ( | $ | $ | $ | ||||||||||||||||||||||||||
1 The service cost component is included in Operating costs in the Consolidated Statement of Results of Operations. All other components are included in Other income (expense) in the Consolidated Statement of Results of Operations.
We made $113 million of contributions to our pension and other postretirement plans during the three months ended March 31, 2024, respectively. We currently anticipate full-year 2024 contributions of approximately $273 million.
B. Defined contribution benefit costs
Total company costs related to our defined contribution plans, which are included in Operating Costs in the Consolidated Statement of Results of Operations, were as follows:
| Three Months Ended March 31, | |||||||||||
| (Millions of dollars) | 2024 | 2023 | |||||||||
U.S. Plans 1 | $ | $ | |||||||||
| Non-U.S. Plans | |||||||||||
| $ | $ | ||||||||||
1 Includes costs related to our non-qualified deferred compensation plans. We utilize total return swaps to economically hedge this exposure to offset the related costs. See Note 5 for additional information.
10. Leases
Revenues from finance and operating leases, primarily included in on the Consolidated Statement of Results of Operations, were as follows:
| Three Months Ended March 31, | |||||||||||
| (Millions of dollars) | 2024 | 2023 | |||||||||
| Finance lease revenue | $ | $ | |||||||||
| Operating lease revenue | |||||||||||
| Total | $ | $ | |||||||||
19
11. Guarantees and product warranty
We have provided various guarantees that have varying terms and limit potential payment. Under the guarantees, non-performance by the third-parties could require Caterpillar to satisfy the contractual obligation by providing goods, services or financial compensation. The maximum potential amount of future payments (undiscounted and without reduction for any amounts possibly recoverable) that we could be required to make under the guarantees was $319 million and $353 million at March 31, 2024 and December 31, 2023, respectively.
We have dealer performance guarantees and third-party performance guarantees that do not limit potential payment to end users related to indemnities and other commercial contractual obligations. In addition, we have entered into contracts involving industry standard indemnifications that do not limit potential payment. For these unlimited guarantees, we are unable to estimate a maximum potential amount of future payments that could result from claims made.
No significant loss has been experienced or is anticipated under any of these guarantees.
Cat Financial provides guarantees to purchase certain loans of Caterpillar dealers from a special-purpose corporation (SPC) that qualifies as a variable interest entity. Cat Financial receives a fee for providing this guarantee. The purpose of the SPC is to provide short-term working capital loans to Caterpillar dealers. This SPC issues commercial paper and uses the proceeds to fund its loan program. Cat Financial is the primary beneficiary of the SPC as its guarantees result in Cat Financial having both the power to direct the activities that most significantly impact the SPC’s economic performance and the obligation to absorb losses, and therefore Cat Financial has consolidated the financial statements of the SPC. As of March 31, 2024 and December 31, 2023, the SPC’s assets of $1.33 billion and $1.35 billion, respectively, were primarily comprised of loans to dealers, and the SPC’s liabilities of $1.33 billion and $1.35 billion, respectively, were primarily comprised of commercial paper. The assets of the SPC are not available to pay Cat Financial’s creditors. Cat Financial may be obligated to perform under the guarantee if the SPC experiences losses. No loss has been experienced or is anticipated under this loan purchase agreement.
The reconciliation of the change in our product warranty liability balances for the three months ended March 31 was as follows:
| Three Months Ended March 31, | |||||||||||
| (Millions of dollars) | 2024 | 2023 | |||||||||
| Warranty liability, beginning of period | $ | $ | |||||||||
| Reduction in liability (payments) | ( | ( | |||||||||
| Increase in liability (new warranties) | |||||||||||
| Warranty liability, end of period | $ | $ | |||||||||
20
12. Profit per share
| Computations of profit per share: | Three Months Ended March 31, | ||||||||||||||||
| (Dollars in millions except per share data) | 2024 | 2023 | |||||||||||||||
Profit for the period (A) 1 | $ | $ | |||||||||||||||
| Determination of shares (in millions): | |||||||||||||||||
| Weighted-average number of common shares outstanding (B) | |||||||||||||||||
| Shares issuable on exercise of stock awards, net of shares assumed to be purchased out of proceeds at average market price | |||||||||||||||||
Average common shares outstanding for fully diluted computation (C) 2 | |||||||||||||||||
| Profit per share of common stock: | |||||||||||||||||
| Assuming no dilution (A/B) | $ | $ | |||||||||||||||
Assuming full dilution (A/C) 2 | $ | $ | |||||||||||||||
| Shares outstanding as of March 31, (in millions) | |||||||||||||||||
1 Profit attributable to common shareholders. | |||||||||||||||||
2 Diluted by assumed exercise of stock-based compensation awards using the treasury stock method. | |||||||||||||||||
For the three months ended March 31, 2024 and 2023, we excluded 0.3 million and 0.8 million of outstanding stock options, respectively, from the computation of diluted earnings per share because the effect would have been antidilutive.
For the three months ended March 31, 2024 and 2023, we repurchased 11.3 million and 1.7 million shares of Caterpillar common stock, respectively, at an aggregate cost of $3,705 million and $400 million, respectively. We made these purchases through the combination of accelerated stock repurchase (ASR) agreements with third-party financial institutions and open market transactions in 2024 and open market transactions in 2023.
In February 2024, we entered into ASR agreements to repurchase an aggregate of $3.50 billion of common stock. We advanced the $3.50 billion and received approximately 7.6 million shares of Caterpillar common stock with a value of $2.45 billion. The ASR agreements may last for up to nine months . The final number of shares to ultimately be purchased will be based on the average of the daily volume-weighted average prices of our common stock during the term of the ASR agreements, less a discount and subject to adjustments pursuant to the terms and conditions of the ASR agreements. The remaining $1.05 billion was evaluated as an unsettled forward contract and was classified as a reduction to Common stock within the Consolidated Statement of Financial Position.
21
13. Accumulated other comprehensive income (loss)
We present comprehensive income and its components in the Consolidated Statement of Comprehensive Income. Changes in the balances for each component of AOCI were as follows:
| Three Months Ended March 31, | |||||||||||
| (Millions of dollars) | 2024 | 2023 | |||||||||
| Foreign currency translation: | |||||||||||
| Beginning balance | $ | ( | $ | ( | |||||||
| Gains (losses) on foreign currency translation | ( | ||||||||||
| Less: Tax provision /(benefit) | ( | ||||||||||
| Net gains (losses) on foreign currency translation | ( | ||||||||||
| (Gains) losses reclassified to earnings | ( | ||||||||||
| Less: Tax provision /(benefit) | |||||||||||
| Net (gains) losses reclassified to earnings | ( | ||||||||||
| Other comprehensive income (loss), net of tax | ( | ||||||||||
| Ending balance | $ | ( | $ | ( | |||||||
| Pension and other postretirement benefits | |||||||||||
| Beginning balance | $ | ( | $ | ( | |||||||
| Current year prior service credit (cost) | |||||||||||
| Less: Tax provision /(benefit) | |||||||||||
| Net current year prior service credit (cost) | |||||||||||
| Amortization of prior service (credit) cost | ( | ( | |||||||||
| Less: Tax provision /(benefit) | ( | ||||||||||
| Net amortization of prior service (credit) cost | ( | ( | |||||||||
| Other comprehensive income (loss), net of tax | ( | ( | |||||||||
| Ending balance | $ | ( | $ | ( | |||||||
| Derivative financial instruments | |||||||||||
| Beginning balance | $ | $ | |||||||||
| Gains (losses) deferred | |||||||||||
| Less: Tax provision /(benefit) | |||||||||||
| Net gains (losses) deferred | |||||||||||
| (Gains) losses reclassified to earnings | ( | ||||||||||
| Less: Tax provision /(benefit) | ( | ||||||||||
| Net (gains) losses reclassified to earnings | ( | ||||||||||
| Other comprehensive income (loss), net of tax | |||||||||||
| Ending balance | $ | $ | |||||||||
| Available-for-sale securities | |||||||||||
| Beginning balance | $ | ( | $ | ( | |||||||
| Gains (losses) deferred | ( | ||||||||||
| Less: Tax provision /(benefit) | ( | ||||||||||
| Net gains (losses) deferred | ( | ||||||||||
| (Gains) losses reclassified to earnings | |||||||||||
| Less: Tax provision /(benefit) | |||||||||||
| Net (gains) losses reclassified to earnings | |||||||||||
| Other comprehensive income (loss), net of tax | ( | ||||||||||
| Ending balance | $ | ( | $ | ( | |||||||
Total AOCI Ending Balance at March 31, | $ | ( | $ | ( | |||||||
22
14. Environmental and legal matters
The Company is regulated by federal, state and international environmental laws governing its use, transport and disposal of substances and control of emissions. In addition to governing our manufacturing and other operations, these laws often impact the development of our products, including, but not limited to, required compliance with air emissions standards applicable to internal combustion engines. We have made, and will continue to make, significant research and development and capital expenditures to comply with these emissions standards.
We are engaged in remedial activities at a number of locations, often with other companies, pursuant to federal and state laws. When it is probable we will pay remedial costs at a site, and those costs can be reasonably estimated, we accrue the investigation, remediation, and operating and maintenance costs against our earnings. We accrue costs based on consideration of currently available data and information with respect to each individual site, including available technologies, current applicable laws and regulations, and prior remediation experience. Where no amount within a range of estimates is more likely, we accrue the minimum. Where multiple potentially responsible parties are involved, we consider our proportionate share of the probable costs. In formulating the estimate of probable costs, we do not consider amounts expected to be recovered from insurance companies or others. We reassess these accrued amounts on a quarterly basis. The amount recorded for environmental remediation is not material and is included in Accrued expenses. We believe there is no more than a remote chance that a material amount for remedial activities at any individual site, or at all the sites in the aggregate, will be required.
In addition, we are involved in other unresolved legal actions that arise in the normal course of business. The most prevalent of these unresolved actions involve disputes related to product design, manufacture and performance liability (including claimed asbestos exposure), contracts, employment issues, environmental matters, intellectual property rights, taxes (other than income taxes) and securities laws. The aggregate range of reasonably possible losses in excess of accrued liabilities, if any, associated with these unresolved legal actions is not material. In some cases, we cannot reasonably estimate a range of loss because there is insufficient information regarding the matter. However, we believe there is no more than a remote chance that any liability arising from these matters would be material. Although it is not possible to predict with certainty the outcome of these unresolved legal actions, we believe that these actions will not individually or in the aggregate have a material adverse effect on our consolidated results of operations, financial position or liquidity.
Perkins Engines Company Limited (Perkins), a subsidiary of Caterpillar Inc., acquired the small diesel engine business of IHI Agri-Tech Corporation (IAT) in 2019. During the integration process, Perkins identified potential compliance concerns with engines manufactured and sold by IAT in California that failed to comply with the requirements of Cal. Code Regs. Tit. 13, § 2423. Perkins then submitted a voluntary self-disclosure to the California Air Resources Board (CARB) on October 15, 2019. On March 14, 2024, CARB and Perkins entered into a settlement agreement regarding the matter. Consistent with the terms of the settlement agreement, Perkins paid a civil penalty of $205,313 to CARB along with a contribution of $205,312 to a Supplemental Environmental Project entitled To Reduce Contaminated Waste & Emissions Throughout Bay View Hunters Point Community.
15. Income taxes
The effective tax rate for the three months ended March 31, 2024 was 19.5 percent compared to 26.9 percent for the three months ended March 31, 2023. The decrease primarily resulted from nontaxable gains in the first quarter of 2024 compared to nondeductible losses in the first quarter of 2023 related to divestitures.
16. Segment information
A. Basis for segment information
Our Executive Office is comprised of a Chief Executive Officer (CEO), Chief Operating Officer (COO), four Group Presidents, a Chief Financial Officer (CFO), a Chief Legal Officer and General Counsel and a Chief Human Resources Officer. The COO, Group Presidents and CFO are accountable for a related set of end-to-end businesses that they manage. The Chief Legal Officer and General Counsel leads the Law, Security and Public Policy Division. The Chief Human Resources Officer leads the Human Resources Organization. The CEO allocates resources and manages performance at the COO/Group President/CFO level. As such, the CEO serves as our Chief Operating Decision Maker, and operating segments are primarily based on the COO/Group President/CFO reporting structure.
23
B. Description of segments
We have five operating segments, of which four are reportable segments. Following is a brief description of our reportable segments and the business activities included in the All Other Segment:
Construction Industries: A segment primarily responsible for supporting customers using machinery in infrastructure and building construction applications. Responsibilities include business strategy, product design, product management and development, manufacturing, marketing and sales and product support. The product portfolio includes asphalt pavers; backhoe loaders; cold planers; compactors; compact track loaders; forestry machines; material handlers; motor graders; pipelayers; road reclaimers; skid steer loaders; telehandlers; track-type loaders; track-type tractors (small, medium); track excavators (mini, small, medium, large); wheel excavators; wheel loaders (compact, small, medium); and related parts and work tools. Inter-segment sales are a source of revenue for this segment.
Resource Industries: A segment primarily responsible for supporting customers using machinery in mining, heavy construction and quarry and aggregates. Responsibilities include business strategy, product design, product management and development, manufacturing, marketing and sales and product support. The product portfolio includes large track-type tractors; large mining trucks; hard rock vehicles; electric rope shovels; draglines; hydraulic shovels; rotary drills; large wheel loaders; off-highway trucks; articulated trucks; wheel tractor scrapers; wheel dozers; landfill compactors; soil compactors; wide-body trucks; select work tools; machinery components; electronics and control systems and related parts. In addition to equipment, Resource Industries also develops and sells technology products and services to provide customers fleet management, equipment management analytics, autonomous machine capabilities, safety services and mining performance solutions. Resource Industries also manages areas that provide services to other parts of the company, including strategic procurement, lean center of excellence, integrated manufacturing, research and development for hydraulic systems, automation, electronics and software for Caterpillar machines and engines. Inter-segment sales are a source of revenue for this segment.
Energy & Transportation: A segment primarily responsible for supporting customers using reciprocating engines, turbines, diesel-electric locomotives and related services across industries serving Oil and Gas, Power Generation, Industrial and Transportation applications, including marine- and rail-related businesses as well as product support of on-highway engines. Responsibilities include business strategy, product design, product management, development and testing, manufacturing, marketing and sales and product support. The product and services portfolio includes turbines, centrifugal gas compressors, and turbine-related services; reciprocating engine-powered generator sets; integrated systems and solutions used in the electric power generation industry; reciprocating engines, drivetrain and integrated systems and solutions for the marine and oil and gas industries; reciprocating engines, drivetrain and integrated systems and solutions supplied to the industrial industry as well as Caterpillar machines; electrified powertrain and zero-emission power sources and service solutions development; and diesel-electric locomotives and components and other rail-related products and services, including remanufacturing and leasing. Responsibilities also include the remanufacturing of Caterpillar reciprocating engines and components and remanufacturing services for other companies. Inter-segment sales are a source of revenue for this segment.
Financial Products Segment: Provides financing alternatives to customers and dealers around the world for Caterpillar products and services, as well as financing for power generation facilities that, in most cases, incorporate Caterpillar products. Financing plans include operating and finance leases, revolving charge accounts, installment sale contracts, repair/rebuild financing, working capital loans and wholesale financing plans. The segment also provides insurance and risk management products and services that help customers and dealers manage their business risk. Insurance and risk management products offered include physical damage insurance, inventory protection plans, extended service coverage and maintenance plans for machines and engines, and dealer property and casualty insurance. The various forms of financing, insurance and risk management products offered to customers and dealers help support the purchase and lease of Caterpillar equipment. The segment also earns revenues from ME&T, but the related costs are not allocated to operating segments. Financial Products’ segment profit is determined on a pretax basis and includes other income/expense items.
24
All Other Segment: Primarily includes activities such as: business strategy; product management and development; manufacturing and sourcing of wear and maintenance components primarily for Cat® products; parts distribution; integrated logistics solutions; distribution services responsible for dealer development and administration, including a wholly owned dealer in Japan; dealer portfolio management and ensuring the most efficient and effective distribution of machines, engines and parts; brand management and marketing strategy; and digital investments for new customer and dealer solutions that integrate data analytics with state-of-the-art digital technologies while transforming the buying experience. Results for the All Other Segment are included as a reconciling item between reportable segments and consolidated external reporting.
C. Segment measurement and reconciliations
There are several methodology differences between our segment reporting and our external reporting. The following is a list of the more significant methodology differences:
•ME&T segment net assets generally include inventories, receivables, property, plant and equipment, goodwill, intangibles, accounts payable and customer advances. We generally manage at the corporate level liabilities other than accounts payable and customer advances, and we do not include these in segment operations. Financial Products Segment assets generally include all categories of assets.
•We value segment inventories and cost of sales using a current cost methodology.
•We amortize goodwill allocated to segments using a fixed amount based on a 20 -year useful life. This methodology difference only impacts segment assets. We do not include goodwill amortization expense in segment profit. In addition, we have allocated to segments only a portion of goodwill for certain acquisitions made in 2011 or later.
•We generally manage currency exposures for ME&T at the corporate level and do not include in segment profit the effects of changes in exchange rates on results of operations within the year. We report the net difference created in the translation of revenues and costs between exchange rates used for U.S. GAAP reporting and exchange rates used for segment reporting as a methodology difference.
•We do not include stock-based compensation expense in segment profit.
•Postretirement benefit expenses are split; segments are generally responsible for service costs, with the remaining elements of net periodic benefit cost included as a methodology difference.
•We determine ME&T segment profit on a pretax basis and exclude interest expense and most other income/expense items. We determine Financial Products Segment profit on a pretax basis and include other income/expense items.
Reconciling items are created based on accounting differences between segment reporting and our consolidated external reporting. Please refer to pages 26 to 28 for financial information regarding significant reconciling items. Most of our reconciling items are self-explanatory given the above explanations. For the reconciliation of profit, we have grouped the reconciling items as follows:
•Corporate costs: These costs are related to corporate requirements primarily for compliance and legal functions for the benefit of the entire organization.
•Restructuring costs: May include costs for employee separation, long-lived asset impairments, contract terminations and (gains)/losses on divestitures. These costs are included in Other operating (income) expenses except for defined-benefit plan curtailment losses and special termination benefits, which are included in Other income (expense). Restructuring costs also include other exit-related costs, which may consist of accelerated depreciation, inventory write-downs, building demolition, equipment relocation and project management costs and LIFO inventory decrement benefits from inventory liquidations at closed facilities, all of which are primarily included in Cost of goods sold. See Note 20 for more information.
•Methodology differences: See previous discussion of significant accounting differences between segment reporting and consolidated external reporting.
25
For the three months ended March 31, 2024 and 2023, sales and revenues by geographic region reconciled to consolidated sales and revenues were as follows:
| Sales and Revenues by Geographic Region | ||||||||||||||||||||||||||||||||||||||||||||
| (Millions of dollars) | North America | Latin America | EAME | Asia/ Pacific | External Sales and Revenues | Intersegment Sales and Revenues | Total Sales and Revenues | |||||||||||||||||||||||||||||||||||||
| Three Months Ended March 31, 2024 | ||||||||||||||||||||||||||||||||||||||||||||
| Construction Industries | $ | $ | $ | $ | $ | $ | $ | |||||||||||||||||||||||||||||||||||||
| Resource Industries | ||||||||||||||||||||||||||||||||||||||||||||
| Energy & Transportation | ||||||||||||||||||||||||||||||||||||||||||||
| Financial Products Segment | 1 | |||||||||||||||||||||||||||||||||||||||||||
| Total sales and revenues from reportable segments | ||||||||||||||||||||||||||||||||||||||||||||
| All Other Segment | ( | |||||||||||||||||||||||||||||||||||||||||||
| Corporate Items and Eliminations | ( | ( | ( | ( | ( | ( | ( | |||||||||||||||||||||||||||||||||||||
| Total Sales and Revenues | $ | $ | $ | $ | $ | $ | — | $ | ||||||||||||||||||||||||||||||||||||
| Three Months Ended March 31, 2023 | ||||||||||||||||||||||||||||||||||||||||||||
| Construction Industries | $ | $ | $ | $ | $ | $ | $ | |||||||||||||||||||||||||||||||||||||
| Resource Industries | ||||||||||||||||||||||||||||||||||||||||||||
| Energy & Transportation | ||||||||||||||||||||||||||||||||||||||||||||
| Financial Products Segment | 1 | |||||||||||||||||||||||||||||||||||||||||||
| Total sales and revenues from reportable segments | ||||||||||||||||||||||||||||||||||||||||||||
| All Other Segment | ||||||||||||||||||||||||||||||||||||||||||||
| Corporate Items and Eliminations | ( | ( | ( | ( | ( | ( | ( | |||||||||||||||||||||||||||||||||||||
| Total Sales and Revenues | $ | $ | $ | $ | $ | $ | — | $ | ||||||||||||||||||||||||||||||||||||
1 Includes revenues from Construction Industries, Resource Industries, Energy & Transportation and All Other Segment of $177 million and $162 million in the three months ended March 31, 2024 and 2023, respectively.
For the three months ended March 31, 2024 and 2023, Energy & Transportation segment sales by end user application were as follows:
| Energy & Transportation External Sales | ||||||||||||||
| Three Months Ended March 31, | ||||||||||||||
| (Millions of dollars) | 2024 | 2023 | ||||||||||||
| Oil and gas | $ | $ | ||||||||||||
| Power generation | ||||||||||||||
| Industrial | ||||||||||||||
| Transportation | ||||||||||||||
| Energy & Transportation External Sales | $ | $ | ||||||||||||
26
| Reconciliation of Consolidated profit before taxes: | |||||||||||
| (Millions of dollars) | Three Months Ended March 31, | ||||||||||
| 2024 | 2023 | ||||||||||
| Profit from reportable segments: | |||||||||||
| Construction Industries | $ | $ | |||||||||
| Resource Industries | |||||||||||
| Energy & Transportation | |||||||||||
| Financial Products Segment | |||||||||||
| Total profit from reportable segments | |||||||||||
| Profit from All Other Segment | |||||||||||
| Cost centers | |||||||||||
| Corporate costs | ( | ( | |||||||||
| Timing | ( | ( | |||||||||
| Restructuring costs | ( | ||||||||||
| Methodology differences: | |||||||||||
| Inventory/cost of sales | ( | ||||||||||
| Postretirement benefit expense | ( | ( | |||||||||
| Stock-based compensation expense | ( | ( | |||||||||
| Financing costs | ( | ( | |||||||||
| Currency | ( | ||||||||||
| Other income/expense methodology differences | ( | ( | |||||||||
| Other methodology differences | ( | ( | |||||||||
| Total consolidated profit before taxes | $ | $ | |||||||||
| Reconciliation of Assets: | |||||||||||
| (Millions of dollars) | March 31, 2024 | December 31, 2023 | |||||||||
| Assets from reportable segments: | |||||||||||
| Construction Industries | $ | $ | |||||||||
| Resource Industries | |||||||||||
| Energy & Transportation | |||||||||||
| Financial Products Segment | |||||||||||
| Total assets from reportable segments | |||||||||||
| Assets from All Other Segment | |||||||||||
| Items not included in segment assets: | |||||||||||
| Cash and cash equivalents | |||||||||||
| Deferred income taxes | |||||||||||
| Goodwill and intangible assets | |||||||||||
| Property, plant and equipment – net and other assets | |||||||||||
| Inventory methodology differences | ( | ( | |||||||||
| Liabilities included in segment assets | |||||||||||
| Other | ( | ( | |||||||||
| Total assets | $ | $ | |||||||||
27
| Reconciliation of Depreciation and amortization: | |||||||||||
| (Millions of dollars) | |||||||||||
| Three Months Ended March 31, | |||||||||||
| 2024 | 2023 | ||||||||||
| Depreciation and amortization from reportable segments: | |||||||||||
| Construction Industries | $ | $ | |||||||||
| Resource Industries | |||||||||||
| Energy & Transportation | |||||||||||
| Financial Products Segment | |||||||||||
| Total depreciation and amortization from reportable segments | |||||||||||
| Items not included in segment depreciation and amortization: | |||||||||||
| All Other Segment | |||||||||||
| Cost centers | |||||||||||
| Other | ( | ||||||||||
| Total depreciation and amortization | $ | $ | |||||||||
| Reconciliation of Capital expenditures: | |||||||||||
| (Millions of dollars) | |||||||||||
| Three Months Ended March 31, | |||||||||||
| 2024 | 2023 | ||||||||||
| Capital expenditures from reportable segments: | |||||||||||
| Construction Industries | $ | $ | |||||||||
| Resource Industries | |||||||||||
| Energy & Transportation | |||||||||||
| Financial Products Segment | |||||||||||
| Total capital expenditures from reportable segments | |||||||||||
| Items not included in segment capital expenditures: | |||||||||||
| All Other Segment | |||||||||||
| Cost centers | |||||||||||
| Timing | |||||||||||
| Other | ( | ( | |||||||||
| Total capital expenditures | $ | $ | |||||||||
17. Cat Financial financing activities
Allowance for credit losses
Portfolio segments
A portfolio segment is the level at which Cat Financial develops a systematic methodology for determining its allowance for credit losses. Cat Financial's portfolio segments and related methods for estimating expected credit losses are as follows:
Customer
Cat Financial provides loans and finance leases to end-user customers primarily for the purpose of financing new and used Caterpillar machinery, engines and equipment for commercial use. Cat Financial also provides financing for power generation facilities that, in most cases, incorporate Caterpillar products. The average original term of Cat Financial's customer finance receivable portfolio was approximately 51 months with an average remaining term of approximately 27 months as of March 31, 2024.
28
Cat Financial typically maintains a security interest in financed equipment and generally requires physical damage insurance coverage on the financed equipment, both of which provide Cat Financial with certain rights and protections. If Cat Financial's collection efforts fail to bring a defaulted account current, Cat Financial generally can repossess the financed equipment, after satisfying local legal requirements, and sell it within the Caterpillar dealer network or through third-party auctions.
Cat Financial estimates the allowance for credit losses related to its customer finance receivables based on loss forecast models utilizing probabilities of default and the estimated loss given default based on past loss experience adjusted for current conditions and reasonable and supportable forecasts capturing country and industry-specific economic factors.
During the three months ended March 31, 2024, Cat Financial's forecasts reflected a continuation of the trend of relatively low unemployment rates as well as low delinquencies within their portfolio. However, industry delinquencies show an increasing trend as the central bank actions aimed at reducing inflation have weakened global economic growth. The company believes the economic forecasts employed represent reasonable and supportable forecasts, followed by a reversion to long-term trends.
Dealer
Cat Financial provides financing to Caterpillar dealers in the form of wholesale financing plans. Cat Financial's wholesale financing plans provide assistance to dealers by financing their mostly new Caterpillar equipment inventory and rental fleets on a secured and unsecured basis. In addition, Cat Financial provides a variety of secured and unsecured loans to Caterpillar dealers.
Cat Financial estimates the allowance for credit losses for dealer finance receivables based on historical loss rates with consideration of current economic conditions and reasonable and supportable forecasts.
In general, Cat Financial's Dealer portfolio segment has not historically experienced large increases or decreases in credit losses based on changes in economic conditions due to its close working relationships with the dealers and their financial strength. Therefore, Cat Financial made no adjustments to historical loss rates during the three months ended March 31, 2024.
Classes of finance receivables
Cat Financial further evaluates portfolio segments by the class of finance receivables, which is defined as a level of information (below a portfolio segment) in which the finance receivables have the same initial measurement attribute and a similar method for assessing and monitoring credit risk. Cat Financial's classes, which align with management reporting for credit losses, are as follows:
•North America - Finance receivables originated in the United States and Canada.
•EAME - Finance receivables originated in Europe, Africa, the Middle East and Eurasia.
•Asia/Pacific - Finance receivables originated in Australia, New Zealand, China, Japan, Southeast Asia and India.
•Mining - Finance receivables related to large mining customers worldwide.
•Latin America - Finance receivables originated in Mexico and Central and South American countries.
•Power - Finance receivables originated worldwide related to Caterpillar electrical power generation, gas compression and co-generation systems and non-Caterpillar equipment that is powered by these systems.
Receivable balances, including accrued interest, are written off against the allowance for credit losses when, in the judgment of management, they are considered uncollectible (generally upon repossession of the collateral). Generally, the amount of the write-off is determined by comparing the fair value of the collateral, less cost to sell, to the amortized cost of the receivable. Subsequent recoveries, if any, are credited to the allowance for credit losses when received.
29
An analysis of the allowance for credit losses was as follows:
| (Millions of dollars) | Three Months Ended March 31, 2024 | Three Months Ended March 31, 2023 | |||||||||||||||||||||||||||||||||
| Customer | Dealer | Total | Customer | Dealer | Total | ||||||||||||||||||||||||||||||
| Beginning balance | $ | $ | $ | $ | $ | $ | |||||||||||||||||||||||||||||
| Write-offs | ( | ( | ( | ( | ( | ||||||||||||||||||||||||||||||
| Recoveries | |||||||||||||||||||||||||||||||||||
Provision for credit losses 1 | |||||||||||||||||||||||||||||||||||
| Other | ( | ( | |||||||||||||||||||||||||||||||||
| Ending balance | $ | $ | $ | $ | $ | $ | |||||||||||||||||||||||||||||
| Finance Receivables | $ | $ | $ | $ | $ | $ | |||||||||||||||||||||||||||||
1 Excludes provision for credit losses on unfunded commitments and other miscellaneous receivables. | |||||||||||||||||||||||||||||||||||
Gross write-offs by origination year for the Customer portfolio segment were as follows:
| (Millions of dollars) | Three Months Ended March 31, 2024 | ||||||||||||||||||||||||||||||||||||||||||||||
| 2024 | 2023 | 2022 | 2021 | 2020 | Prior | Revolving Finance Receivables | Total | ||||||||||||||||||||||||||||||||||||||||
| North America | $ | $ | $ | $ | $ | $ | $ | $ | |||||||||||||||||||||||||||||||||||||||
| EAME | |||||||||||||||||||||||||||||||||||||||||||||||
| Asia/Pacific | |||||||||||||||||||||||||||||||||||||||||||||||
| Latin America | |||||||||||||||||||||||||||||||||||||||||||||||
| Total | $ | $ | $ | $ | $ | $ | $ | $ | |||||||||||||||||||||||||||||||||||||||
| Three Months Ended March 31, 2023 | |||||||||||||||||||||||||||||||||||||||||||||||
| 2023 | 2022 | 2021 | 2020 | 2019 | Prior | Revolving Finance Receivables | Total | ||||||||||||||||||||||||||||||||||||||||
| North America | $ | $ | $ | $ | $ | $ | $ | $ | |||||||||||||||||||||||||||||||||||||||
| EAME | |||||||||||||||||||||||||||||||||||||||||||||||
| Asia/Pacific | |||||||||||||||||||||||||||||||||||||||||||||||
| Latin America | |||||||||||||||||||||||||||||||||||||||||||||||
| Total | $ | $ | $ | $ | $ | $ | $ | $ | |||||||||||||||||||||||||||||||||||||||
All $47 million of gross write-offs in the Dealer portfolio segment for the three months ended March 31, 2024 were in Latin America and originated prior to 2019.
Credit quality of finance receivables
At origination, Cat Financial evaluates credit risk based on a variety of credit quality factors including prior payment experience, customer financial information, credit ratings, loan-to-value ratios, probabilities of default, industry trends, macroeconomic factors and other internal metrics. On an ongoing basis, Cat Financial monitors credit quality based on past-due status as there is a meaningful correlation between the past-due status of customers and the risk of loss. In determining past-due status, Cat Financial considers the entire finance receivable past due when any installment is over 30 days past due.
30
Customer
The tables below summarize the aging category of Cat Financial's amortized cost of finance receivables in the Customer portfolio segment by origination year:
| (Millions of dollars) | March 31, 2024 | ||||||||||||||||||||||||||||||||||||||||||||||
| 2024 | 2023 | 2022 | 2021 | 2020 | Prior | Revolving Finance Receivables | Total Finance Receivables | ||||||||||||||||||||||||||||||||||||||||
| North America | |||||||||||||||||||||||||||||||||||||||||||||||
| Current | $ | $ | $ | $ | $ | $ | $ | $ | |||||||||||||||||||||||||||||||||||||||
| 31-60 days past due | |||||||||||||||||||||||||||||||||||||||||||||||
| 61-90 days past due | |||||||||||||||||||||||||||||||||||||||||||||||
| 91+ days past due | |||||||||||||||||||||||||||||||||||||||||||||||
| EAME | |||||||||||||||||||||||||||||||||||||||||||||||
| Current | |||||||||||||||||||||||||||||||||||||||||||||||
| 31-60 days past due | |||||||||||||||||||||||||||||||||||||||||||||||
| 61-90 days past due | |||||||||||||||||||||||||||||||||||||||||||||||
| 91+ days past due | |||||||||||||||||||||||||||||||||||||||||||||||
| Asia/Pacific | |||||||||||||||||||||||||||||||||||||||||||||||
| Current | |||||||||||||||||||||||||||||||||||||||||||||||
| 31-60 days past due | |||||||||||||||||||||||||||||||||||||||||||||||
| 61-90 days past due | |||||||||||||||||||||||||||||||||||||||||||||||
| 91+ days past due | |||||||||||||||||||||||||||||||||||||||||||||||
| Mining | |||||||||||||||||||||||||||||||||||||||||||||||
| Current | |||||||||||||||||||||||||||||||||||||||||||||||
| 31-60 days past due | |||||||||||||||||||||||||||||||||||||||||||||||
| 61-90 days past due | |||||||||||||||||||||||||||||||||||||||||||||||
| 91+ days past due | |||||||||||||||||||||||||||||||||||||||||||||||
| Latin America | |||||||||||||||||||||||||||||||||||||||||||||||
| Current | |||||||||||||||||||||||||||||||||||||||||||||||
| 31-60 days past due | |||||||||||||||||||||||||||||||||||||||||||||||
| 61-90 days past due | |||||||||||||||||||||||||||||||||||||||||||||||
| 91+ days past due | |||||||||||||||||||||||||||||||||||||||||||||||
| Power | |||||||||||||||||||||||||||||||||||||||||||||||
| Current | |||||||||||||||||||||||||||||||||||||||||||||||
| 31-60 days past due | |||||||||||||||||||||||||||||||||||||||||||||||
| 61-90 days past due | |||||||||||||||||||||||||||||||||||||||||||||||
| 91+ days past due | |||||||||||||||||||||||||||||||||||||||||||||||
| Totals by Aging Category | |||||||||||||||||||||||||||||||||||||||||||||||
| Current | $ | $ | $ | $ | $ | $ | $ | $ | |||||||||||||||||||||||||||||||||||||||
| 31-60 days past due | |||||||||||||||||||||||||||||||||||||||||||||||
| 61-90 days past due | |||||||||||||||||||||||||||||||||||||||||||||||
| 91+ days past due | |||||||||||||||||||||||||||||||||||||||||||||||
| Total Customer | $ | $ | $ | $ | $ | $ | $ | $ | |||||||||||||||||||||||||||||||||||||||
31
| (Millions of dollars) | December 31, 2023 | ||||||||||||||||||||||||||||||||||||||||||||||
| 2023 | 2022 | 2021 | 2020 | 2019 | Prior | Revolving Finance Receivables | Total Finance Receivables | ||||||||||||||||||||||||||||||||||||||||
| North America | |||||||||||||||||||||||||||||||||||||||||||||||
| Current | $ | $ | $ | $ | $ | $ | $ | $ | |||||||||||||||||||||||||||||||||||||||
| 31-60 days past due | |||||||||||||||||||||||||||||||||||||||||||||||
| 61-90 days past due | |||||||||||||||||||||||||||||||||||||||||||||||
| 91+ days past due | |||||||||||||||||||||||||||||||||||||||||||||||
| EAME | |||||||||||||||||||||||||||||||||||||||||||||||
| Current | |||||||||||||||||||||||||||||||||||||||||||||||
| 31-60 days past due | |||||||||||||||||||||||||||||||||||||||||||||||
| 61-90 days past due | |||||||||||||||||||||||||||||||||||||||||||||||
| 91+ days past due | |||||||||||||||||||||||||||||||||||||||||||||||
| Asia/Pacific | |||||||||||||||||||||||||||||||||||||||||||||||
| Current | |||||||||||||||||||||||||||||||||||||||||||||||
| 31-60 days past due | |||||||||||||||||||||||||||||||||||||||||||||||
| 61-90 days past due | |||||||||||||||||||||||||||||||||||||||||||||||
| 91+ days past due | |||||||||||||||||||||||||||||||||||||||||||||||
| Mining | |||||||||||||||||||||||||||||||||||||||||||||||
| Current | |||||||||||||||||||||||||||||||||||||||||||||||
| 31-60 days past due | |||||||||||||||||||||||||||||||||||||||||||||||
| 61-90 days past due | |||||||||||||||||||||||||||||||||||||||||||||||
| 91+ days past due | |||||||||||||||||||||||||||||||||||||||||||||||
| Latin America | |||||||||||||||||||||||||||||||||||||||||||||||
| Current | |||||||||||||||||||||||||||||||||||||||||||||||
| 31-60 days past due | |||||||||||||||||||||||||||||||||||||||||||||||
| 61-90 days past due | |||||||||||||||||||||||||||||||||||||||||||||||
| 91+ days past due | |||||||||||||||||||||||||||||||||||||||||||||||
| Power | |||||||||||||||||||||||||||||||||||||||||||||||
| Current | |||||||||||||||||||||||||||||||||||||||||||||||
| 31-60 days past due | |||||||||||||||||||||||||||||||||||||||||||||||
| 61-90 days past due | |||||||||||||||||||||||||||||||||||||||||||||||
| 91+ days past due | |||||||||||||||||||||||||||||||||||||||||||||||
| Totals by Aging Category | |||||||||||||||||||||||||||||||||||||||||||||||
| Current | $ | $ | $ | $ | $ | $ | $ | $ | |||||||||||||||||||||||||||||||||||||||
| 31-60 days past due | |||||||||||||||||||||||||||||||||||||||||||||||
| 61-90 days past due | |||||||||||||||||||||||||||||||||||||||||||||||
| 91+ days past due | |||||||||||||||||||||||||||||||||||||||||||||||
| Total Customer | $ | $ | $ | $ | $ | $ | $ | $ | |||||||||||||||||||||||||||||||||||||||
Finance receivables in the Customer portfolio segment are substantially secured by collateral, primarily in the form of Caterpillar and other equipment. For those contracts where the borrower is experiencing financial difficulty, repayment of the outstanding amounts is generally expected to be provided through the operation or repossession and sale of the equipment.
32
Dealer
As of March 31, 2024, Cat Financial's total amortized cost of finance receivables within the Dealer portfolio segment was current. As of December 31, 2023, Cat Financial's total amortized cost of finance receivables within the Dealer portfolio segment was current, with the exception of $44 million that was 91+ days past due in Latin America, all of which originated prior to 2019.
Non-accrual finance receivables
Recognition of income is suspended and the finance receivable is placed on non-accrual status when management determines that collection of future income is not probable. Contracts on non-accrual status are generally more than 120 days past due. Recognition is resumed and previously suspended income is recognized when collection is considered probable. Payments received while the finance receivable is on non-accrual status are applied to interest and principal in accordance with the contractual terms. Interest earned but uncollected prior to the receivable being placed on non-accrual status is written off through Provision for credit losses when, in the judgment of management, it is considered uncollectible.
In Cat Financial's Customer portfolio segment, finance receivables which were on non-accrual status and finance receivables over 90 days past due and still accruing income were as follows:
(Millions of dollars) | March 31, 2024 | December 31, 2023 | |||||||||||||||||||||
| Amortized Cost | Amortized Cost | ||||||||||||||||||||||
| Non-accrual With an Allowance | 91+ Still Accruing | Non-accrual With an Allowance | 91+ Still Accruing | ||||||||||||||||||||
| North America | $ | $ | $ | $ | |||||||||||||||||||
| EAME | |||||||||||||||||||||||
| Asia/Pacific | |||||||||||||||||||||||
| Mining | |||||||||||||||||||||||
| Latin America | |||||||||||||||||||||||
| Power | |||||||||||||||||||||||
| Total | $ | $ | $ | $ | |||||||||||||||||||
There were no finance receivables in Cat Financial's Dealer portfolio segment on non-accrual status as of March 31, 2024. There were $44 million in finance receivables in Cat Financial's Dealer portfolio segment on non-accrual status as of December 31, 2023, all of which were in Latin America.
Modifications
Cat Financial periodically modifies the terms of their finance receivable agreements in response to borrowers’ financial difficulty. Typically, the types of modifications granted are payment deferrals, interest-only payment periods and/or term extensions. Many modifications Cat Financial grants are for commercial reasons or for borrowers experiencing some form of short-term financial stress and may result in insignificant payment delays. Cat Financial does not consider these borrowers to be experiencing financial difficulty. Modifications for borrowers Cat Financial does consider to be experiencing financial difficulty typically result in payment deferrals and/or reduced payments for a period of four months or longer, term extension of six months or longer or a combination of both.
During the three months ended March 31, 2024 and 2023, there were no 3 million and $8 million, respectively. Total modifications with borrowers experiencing financial difficulty represented 0.01 percent and 0.04 percent of Cat Financial's finance receivable portfolio for the same periods, respectively.
For the three months ended March 31, 2024 and 2023, the financial effects of term extensions for borrowers experiencing financial difficulty added a weighted average of 10 and 28 months, respectively, to the terms of modified
33
contracts. For both the three months ended March 31, 2024 and 2023, the financial effects of payment delays for borrowers experiencing financial difficulty resulted in weighted average payment deferrals and/or interest only payment periods of 9
After Cat Financial modifies a finance receivable, they continue to track its performance under its most recent modified terms. As of March 31, 2024, all finance receivables modified with borrowers experiencing financial difficulty in the past 12 months are current except for in EAME where there was $2 million past due and Asia/Pacific where there was $1 million past due. As of March 31, 2023, all finance receivables modified with borrowers experiencing financial difficulty in the past 12 months were current.
The effect of most modifications made to finance receivables for borrowers experiencing financial difficulty is already included in the allowance for credit losses based on the methodologies used to estimate the allowance; therefore, a change to the allowance for credit losses is generally not recorded upon modification. On rare occasions when principal forgiveness is provided, the amount forgiven is written off against the allowance for credit losses.
18. Fair value disclosures
A. Fair value measurements
The guidance on fair value measurements defines fair value as the exchange price that would be received for an asset or paid to transfer a liability (an exit price) in the principal or most advantageous market for the asset or liability in an orderly transaction between market participants. This guidance also specifies a fair value hierarchy based upon the observability of inputs used in valuation techniques. Observable inputs (highest level) reflect market data obtained from independent sources, while unobservable inputs (lowest level) reflect internally developed market assumptions. In accordance with this guidance, fair value measurements are classified under the following hierarchy:
•Level 1 — Quoted prices for identical instruments in active markets.
•Level 2 — Quoted prices for similar instruments in active markets; quoted prices for identical or similar instruments in markets that are not active; and model-derived valuations in which all significant inputs or significant value-drivers are observable in active markets.
•Level 3 — Model-derived valuations in which one or more significant inputs or significant value-drivers are unobservable.
When available, we use quoted market prices to determine fair value, and we classify such measurements within Level 1. In some cases where market prices are not available, we make use of observable market based inputs to calculate fair value, in which case the measurements are classified within Level 2. If quoted or observable market prices are not available, fair value is based upon valuations in which one or more significant inputs are unobservable, including internally developed models that use, where possible, current market-based parameters such as interest rates, yield curves and currency rates. These measurements are classified within Level 3.
We classify fair value measurements according to the lowest level input or value-driver that is significant to the valuation. We may therefore classify a measurement within Level 3 even though there may be significant inputs that are readily observable.
Fair value measurement includes the consideration of nonperformance risk. Nonperformance risk refers to the risk that an obligation (either by a counterparty or Caterpillar) will not be fulfilled. For financial assets traded in an active market (Level 1 and certain Level 2), the nonperformance risk is included in the market price. For certain other financial assets and liabilities (certain Level 2 and Level 3), our fair value calculations have been adjusted accordingly.
Investments in debt and equity securities
We have investments in certain debt and equity securities that are recorded at fair value. Fair values for our U.S. treasury bonds and large capitalization value and smaller company growth equity securities are based upon valuations for identical instruments in active markets. Fair values for other government debt securities, corporate debt securities and mortgage-backed debt securities are based upon models that take into consideration such market-based factors as
34
recent sales, risk-free yield curves and prices of similarly rated bonds.
We also have investments in time deposits classified as held-to-maturity debt securities. The fair value of these investments is based upon valuations observed in less active markets than Level 1. These investments have a maturity of less than one year and are recorded at amortized costs, which approximate fair value.
In addition, Insurance Services has an equity investment in a real estate investment trust (REIT) which is recorded at fair value based on the net asset value (NAV) of the investment and is not classified within the fair value hierarchy.
See Note 8 for additional information on our investments in debt and equity securities.
Derivative financial instruments
The fair value of interest rate contracts is primarily based on a standard industry accepted valuation model that utilizes the appropriate market-based forward swap curves and zero-coupon interest rates to determine discounted cash flows. The fair value of foreign currency and commodity forward, option and cross currency contracts is based on standard industry accepted valuation models that discount cash flows resulting from the differential between the contract price and the market-based forward rate. The fair value of total return swap contracts is primarily based on valuing the underlying securities or funds using pricing by industry providers and the average Secured Overnight Financing Rate (SOFR) plus a spread.
See Note 5 for additional information.
Assets and liabilities measured on a recurring basis at fair value included in our Consolidated Statement of Financial Position as of March 31, 2024 and December 31, 2023 were as follows:
| March 31, 2024 | |||||||||||||||||||||||||||||
(Millions of dollars) | Level 1 | Level 2 | Level 3 | Measured at NAV | Total Assets / Liabilities, at Fair Value | ||||||||||||||||||||||||
| Assets | |||||||||||||||||||||||||||||
| Debt securities | |||||||||||||||||||||||||||||
| Government debt securities | |||||||||||||||||||||||||||||
| U.S. treasury bonds | $ | $ | $ | $ | $ | ||||||||||||||||||||||||
| Other U.S. and non-U.S. government bonds | |||||||||||||||||||||||||||||
| Corporate debt securities | |||||||||||||||||||||||||||||
| Corporate bonds and other debt securities | |||||||||||||||||||||||||||||
| Asset-backed securities | |||||||||||||||||||||||||||||
| Mortgage-backed debt securities | |||||||||||||||||||||||||||||
| U.S. governmental agency | |||||||||||||||||||||||||||||
| Residential | |||||||||||||||||||||||||||||
| Commercial | |||||||||||||||||||||||||||||
| Total debt securities | |||||||||||||||||||||||||||||
| Equity securities | |||||||||||||||||||||||||||||
| Large capitalization value | |||||||||||||||||||||||||||||
| Smaller company growth | |||||||||||||||||||||||||||||
| REIT | |||||||||||||||||||||||||||||
| Total equity securities | |||||||||||||||||||||||||||||
| Derivative financial instruments - assets | |||||||||||||||||||||||||||||
| Foreign currency contracts - net | |||||||||||||||||||||||||||||
| Total return swap contracts - net | |||||||||||||||||||||||||||||
| Total assets | $ | $ | $ | $ | $ | ||||||||||||||||||||||||
| Liabilities | |||||||||||||||||||||||||||||
| Derivative financial instruments - liabilities | |||||||||||||||||||||||||||||
| Interest rate contracts - net | $ | $ | $ | $ | $ | ||||||||||||||||||||||||
| Commodity contracts - net | |||||||||||||||||||||||||||||
| Total liabilities | $ | $ | $ | $ | $ | ||||||||||||||||||||||||
35
| December 31, 2023 | |||||||||||||||||||||||||||||
(Millions of dollars) | Level 1 | Level 2 | Level 3 | Measured at NAV | Total Assets / Liabilities, at Fair Value | ||||||||||||||||||||||||
| Assets | |||||||||||||||||||||||||||||
| Debt securities | |||||||||||||||||||||||||||||
| Government debt securities | |||||||||||||||||||||||||||||
| U.S. treasury bonds | $ | $ | $ | $ | $ | ||||||||||||||||||||||||
| Other U.S. and non-U.S. government bonds | |||||||||||||||||||||||||||||
| Corporate debt securities | |||||||||||||||||||||||||||||
| Corporate bonds and other debt securities | |||||||||||||||||||||||||||||
| Asset-backed securities | |||||||||||||||||||||||||||||
| Mortgage-backed debt securities | |||||||||||||||||||||||||||||
| U.S. governmental agency | |||||||||||||||||||||||||||||
| Residential | |||||||||||||||||||||||||||||
| Commercial | |||||||||||||||||||||||||||||
| Total debt securities | |||||||||||||||||||||||||||||
| Equity securities | |||||||||||||||||||||||||||||
| Large capitalization value | |||||||||||||||||||||||||||||
| Smaller company growth | |||||||||||||||||||||||||||||
| REIT | |||||||||||||||||||||||||||||
| Total equity securities | |||||||||||||||||||||||||||||
| Derivative financial instruments - assets | |||||||||||||||||||||||||||||
| Foreign currency contracts - net | |||||||||||||||||||||||||||||
| Commodity contracts - net | |||||||||||||||||||||||||||||
| Total Assets | $ | $ | $ | $ | $ | ||||||||||||||||||||||||
| Liabilities | |||||||||||||||||||||||||||||
| Derivative financial instruments - liabilities | |||||||||||||||||||||||||||||
| Interest rate contracts - net | $ | $ | $ | $ | $ | ||||||||||||||||||||||||
| Total liabilities | $ | $ | $ | $ | $ | ||||||||||||||||||||||||
In addition to the amounts above, certain Cat Financial loans are subject to measurement at fair value on a nonrecurring basis and are classified as Level 3 measurements. A loan is measured at fair value when management determines that collection of contractual amounts due is not probable and the loan is individually evaluated. In these cases, an allowance for credit losses may be established based either on the present value of expected future cash flows discounted at the receivables’ effective interest rate, the fair value of the collateral for collateral-dependent receivables, or the observable market price of the receivable. In determining collateral value, Cat Financial estimates the current fair market value of the collateral less selling costs. Cat Financial had loans carried at fair value of $52 million and $55 million as of March 31, 2024 and December 31, 2023, respectively.
B. Fair values of financial instruments
In addition to the methods and assumptions we use to record the fair value of financial instruments as discussed in the Fair value measurements section above, we use the following methods and assumptions to estimate the fair value of our financial instruments:
Cash and cash equivalents
Carrying amount approximates fair value. We classify cash and cash equivalents as Level 1. See Consolidated Statement of Financial Position.
Restricted cash and short-term investments
Carrying amount approximates fair value. We include restricted cash and short-term investments in Prepaid expenses and other current assets in the Consolidated Statement of Financial Position. We classify these instruments as Level 1
36
except for time deposits which are Level 2, and certain corporate debt securities which are Level 3. See Note 8 for additional information.
Finance receivables
We estimate fair value by discounting the future cash flows using current rates, representative of receivables with similar remaining maturities.
Wholesale inventory receivables
We estimate fair value by discounting the future cash flows using current rates, representative of receivables with similar remaining maturities.
Short-term borrowings
Carrying amount approximates fair value. We classify short-term borrowings as Level 1. See Consolidated Statement of Financial Position.
Long-term debt
We estimate fair value for fixed and floating rate debt based on quoted market prices.
Our financial instruments not carried at fair value were as follows:
| March 31, 2024 | December 31, 2023 | |||||||||||||||||||||||||||||||||||||
| (Millions of dollars) | Carrying Amount | Fair Value | Carrying Amount | Fair Value | Fair Value Levels | Reference | ||||||||||||||||||||||||||||||||
| Assets | ||||||||||||||||||||||||||||||||||||||
Finance receivables – net (excluding finance leases 1 ) | $ | $ | $ | $ | 3 | Note 17 | ||||||||||||||||||||||||||||||||
Wholesale inventory receivables – net (excluding finance leases 1) | 3 | |||||||||||||||||||||||||||||||||||||
| Liabilities | ||||||||||||||||||||||||||||||||||||||
Long-term debt (including amounts due within one year) | ||||||||||||||||||||||||||||||||||||||
| Machinery, Energy & Transportation | 2 | |||||||||||||||||||||||||||||||||||||
| Financial Products | 2 | |||||||||||||||||||||||||||||||||||||
1 Represents finance leases and failed sale leasebacks of $6,715 million and $6,953 million at March 31, 2024 and December 31, 2023, respectively.
19. Other income (expense)
| Three Months Ended March 31, | |||||||||||
| (Millions of dollars) | 2024 | 2023 | |||||||||
| Investment and interest income | $ | $ | |||||||||
Foreign exchange gains (losses) 1 | ( | ||||||||||
| License fee income | |||||||||||
| Net periodic pension and OPEB income (cost), excluding service cost | ( | ||||||||||
| Gains (losses) on securities | ( | ||||||||||
| Miscellaneous income (loss) | ( | ||||||||||
| Total | $ | $ | |||||||||
1 Includes gains (losses) from foreign exchange derivative contracts. See Note 5 for further details.
37
20. Restructuring costs
Our accounting for employee separations is dependent upon how the particular program is designed. For voluntary programs, we recognize eligible separation costs at the time of employee acceptance unless the acceptance requires explicit approval by the company. For involuntary programs, we recognize eligible costs when management has approved the program, the affected employees have been properly notified and the costs are estimable.
Restructuring costs for the three months ended March 31, 2024 and 2023 were as follows:
| (Millions of dollars) | Three Months Ended March 31, | ||||||||||
| 2024 | 2023 | ||||||||||
Employee separations 1 | $ | $ | |||||||||
Divestitures 1 | ( | ||||||||||
Long-lived asset impairments 1 | |||||||||||
Other 2 | |||||||||||
| Total restructuring (income) costs | $ | ( | $ | ||||||||
1 Recognized in Other operating (income) expenses. | |||||||||||
2 Represents costs related to our restructuring programs, primarily for inventory write-downs, accelerated depreciation, project management and equipment relocation, all of which are primarily included in Cost of goods sold. | |||||||||||
The restructuring income for the three months ended March 31, 2024 was primarily related to the divestiture of a non-US mining entity. The restructuring costs for the three months ended March 31, 2023 were primarily related to the divestiture of the company's Longwall business within Resource Industries. The divestiture closed on February 1, 2023 and resulted in a pre-tax loss of approximately $586 million, primarily a non-cash item driven by the release of $494 million of accumulated foreign currency translation.
In 2024 and 2023, all restructuring costs are excluded from segment profit.
21. Supplier finance programs
We facilitate voluntary supplier finance programs (the “Programs”) through participating financial institutions. The Programs are available to a wide range of suppliers and allow them the option to manage their cash flow. We are not a party to the agreements between the participating financial institutions and the suppliers in connection with the Programs. The range of payment terms, typically 60 -90 days, we negotiate with our suppliers is consistent, irrespective of whether a supplier participates in the Programs. The amount of obligations outstanding that are confirmed as valid to the participating financial institutions for suppliers who voluntarily participate in the Programs, included in Accounts payable in the Consolidated Statement of Financial Position, were $833 million and $803 million at March 31, 2024 and December 31, 2023, respectively.
38
Item 2. Management’s Discussion and Analysis of Financial Condition and Results of Operations
The following Management’s Discussion and Analysis of Financial Condition and Results of Operations (MD&A) is intended to provide information that will assist the reader in understanding the company’s Consolidated Financial Statements, the changes in certain key items in those financial statements between select periods and the primary factors that accounted for those changes. In addition, we discuss how certain accounting principles, policies and critical estimates affect our Consolidated Financial Statements. Our discussion also contains certain forward-looking statements related to future events and expectations as well as a discussion of the many factors that we believe may have an impact on our business on an ongoing basis. This MD&A should be read in conjunction with our discussion of cautionary statements and significant risks to the company’s business under Part I, Item 1A. Risk Factors of the 2023 Form 10-K.
Highlights for the first quarter of 2024 include:
•Total sales and revenues for the first quarter of 2024 were $15.799 billion, a decrease of $63 million, or about flat, compared with $15.862 billion in the first quarter of 2023. In the three primary segments, sales were higher in Energy & Transportation and lower in Construction Industries and Resource Industries.
•Operating profit margin was 22.3 percent for the first quarter of 2024, compared with 17.2 percent for the first quarter of 2023. Adjusted operating profit margin was 22.2 percent for the first quarter of 2024, compared with 21.1 percent for the first quarter of 2023.
•First-quarter 2024 profit per share was $5.75, and excluding the items in the table below, adjusted profit per share was $5.60. First-quarter 2023 profit per share was $3.74, and excluding the items in the table below, adjusted profit per share was $4.91.
•Caterpillar ended the first quarter of 2024 with $5.0 billion of enterprise cash.
•Enterprise operating cash flow was $2.1 billion in the first quarter of 2024.
•In order for our results to be more meaningful to our readers, we have separately quantified the impact of several significant items. A detailed reconciliation of GAAP to non-GAAP financial measures is included on pages 53-54.
| Three Months Ended March 31, 2024 | Three Months Ended March 31, 2023 | ||||||||||||||||
| (Dollars in millions except per share data) | Profit Before Taxes | Profit Per Share | Profit Before Taxes | Profit Per Share | |||||||||||||
| Profit | $ | 3,532 | $ | 5.75 | $ | 2,634 | $ | 3.74 | |||||||||
| Restructuring (income) - non-US mining entity divestiture | (64) | (0.24) | — | — | |||||||||||||
| Other restructuring (income) costs | 58 | 0.09 | 25 | 0.04 | |||||||||||||
Restructuring costs - Longwall divestiture | — | — | 586 | 1.13 | |||||||||||||
| Adjusted profit | $ | 3,526 | $ | 5.60 | $ | 3,245 | $ | 4.91 | |||||||||
Overview
Total sales and revenues for the first quarter of 2024 were $15.799 billion, a decrease of $63 million, or about flat, compared with $15.862 billion in the first quarter of 2023. Lower sales volume and unfavorable currency impacts, primarily related to the Australian dollar, were mostly offset by favorable price realization and higher Financial Products' revenues. The decrease in sales volume was primarily driven by lower sales of equipment to end users; there was not a significant impact from changes in dealer inventories.
First-quarter 2024 profit per share was $5.75, compared with $3.74 profit per share in the first quarter of 2023. In the first quarter of 2024 and 2023, profit per share included restructuring income/costs. Profit for the first quarter of 2024 was $2.856 billion, an increase of $913 million, or 47 percent, compared with $1.943 billion for the first quarter of 2023. The increase was primarily due to the absence of the impact of the divestiture of the company's Longwall business in 2023 and favorable price realization, partially offset by the profit impact of lower sales volume.
Trends and Economic Conditions
Outlook for Key End Markets
Overall, we expect a continuation of healthy demand across most of our end markets for our products and services.
In Construction Industries, we continue to expect North America to remain healthy in 2024 for both non-residential and residential construction after a strong 2023. We anticipate non-residential construction in North America to remain at similar to slightly higher demand levels to 2023 due to government-related infrastructure and construction projects. Residential construction demand is expected to be flat to slightly down compared to 2023, which remains strong relative to historical levels. In Asia Pacific, outside of China, we expect some softening in economic conditions. We anticipate China will remain at a
39
relatively low level in the excavator industry above 10-tons. In EAME, we anticipate that economic weakness in Europe will continue, partially offset by strong construction demand in the Middle East. Construction activity in Latin America remains mixed, but overall, we are expecting modest growth. In addition, we anticipate the ongoing benefit of our services initiatives will positively impact Construction Industries in 2024.
In Resource Industries, in 2024, for both mining and heavy construction and quarry and aggregates, we anticipate lower sales volume compared to strong 2023 performance, primarily in off-highway and articulated trucks. We anticipate a small decrease in dealer inventory in 2024, as compared to a slight increase in 2023. While we continue to see a high level of quoting activity overall, we anticipate lower order rates as customers display capital discipline. Customer product utilization remains high, the number of parked trucks remains low, the age of the fleet remains elevated, and our autonomous solutions continue to have strong customer acceptance. We expect higher services revenues, including robust rebuild activity in 2024. We continue to believe the energy transition will support increased commodity demand over time, expanding our total addressable market and providing further opportunities for long-term profitable growth.
In Energy & Transportation, we expect reciprocating engines and services for Oil & Gas to be about flat in 2024 after strong 2023 performance. We expect reciprocating gas compression demand to be higher in 2024 than it was in 2023. Well servicing for reciprocating engines in North America is expected to soften. Power Generation reciprocating engine demand is expected to remain strong, largely due to continued data center growth relating to cloud computing and generative artificial intelligence (AI). For Solar Turbines, backlog and quoting activity remains strong for Oil & Gas and Power Generation. Industrial demand is expected to soften relative to a strong 2023. In Transportation, we anticipate high-speed marine to increase as customers continue to upgrade aging fleets.
Full-Year 2024 Company Trends and Expectations
For the full-year 2024, we continue to anticipate sales and revenues will be broadly similar to 2023. We do not anticipate a significant change in machine dealer inventories during 2024, compared to a $0.7 billion increase in machine dealer inventories during 2023. We expect slightly favorable price realization in 2024 as compared to 2023. Services revenues grew in the first quarter of 2024, and we expect continued growth in 2024 across each of our three primary segments.
In Construction Industries, we expect sales of equipment to end users to be slightly lower compared to 2023 due to softer economic conditions in Europe. We expect demand in North America to remain at healthy levels in Construction Industries. Resource Industries' sales in 2024 are expected to be lower, driven by lower sales volume primarily in off-highway and articulated trucks. We also expect an unfavorable impact from changes in dealer inventories in Construction Industries and Resource Industries. Within Energy & Transportation, we expect slightly higher sales compared to 2023, including a seasonal increase throughout the year.
In 2024, we expect a benefit from price realization during the first half of the year. We expect manufacturing costs to be about flat compared to 2023. We anticipate favorable freight to be partially offset by unfavorable cost absorption. We also anticipate shipping a more normal mix of products, which we expect to drive a slight unfavorable impact to operating profit. Selling, general and administrative (SG&A) and research and development (R&D) expenses are expected to increase throughout the year as we continue to invest in strategic initiatives aimed at future long-term profitable growth, such as services growth and technology, including autonomy, alternative fuels, connectivity and digital and electrification. We also expect a benefit of lower short-term incentive compensation expense in 2024 as compared to 2023. In 2024, we expect restructuring costs to be between $300 million and $450 million and expect capital expenditures to be in the range of $2.0 to $2.5 billion. We expect the annual effective tax rate, excluding discrete items, to be 22.5 percent.
Second-Quarter 2024 Company Trends and Expectations
In the second quarter of 2024, we expect lower sales and revenues as compared to the second quarter of 2023. We anticipate an unfavorable impact from changes in machine dealer inventories, as machine dealer inventory is expected to decline during the second quarter of 2024 compared to a $0.2 billion increase during the second quarter of 2023. In the second quarter of 2024, price realization is expected to remain favorable as compared to the second quarter of 2023.
We expect lower Construction Industries' sales as compared to the second quarter of 2023 due to the impact from changes in dealer inventories, partially offset by favorable price realization. Resource Industries' sales are expected to be lower driven by lower sales volume, partially offset by favorable price realization. In Energy & Transportation, we expect sales to be about flat as compared to the second quarter of 2023.
In the second quarter of 2024, we expect a benefit from price realization primarily from price actions taken in the second half of 2023. We expect manufacturing costs to be about flat compared to the second quarter of 2023, as we anticipate favorable freight to be partially offset by unfavorable cost absorption. We expect an increase in SG&A/R&D expenses in the second quarter of 2024 as compared to the second quarter of 2023 due to investments in strategic initiatives, which is expected to be offset by lower short-term incentive compensation expense.
40
Within Construction Industries and Resource Industries in the second quarter of 2024 as compared to the second quarter of 2023, we expect favorable price realization to be offset by the profit impact of lower sales volume. In Energy & Transportation, we anticipate favorable price realization and a favorable mix of products to be partially offset by higher manufacturing costs and SG&A/R&D expenses due to investments in strategic initiatives. Within corporate items and eliminations, we anticipate increased expenses due to timing differences in the second quarter of 2024 as compared to the second quarter of 2023.
Global Business Conditions
We continue to monitor a variety of external factors around the world, such as supply chain disruptions, inflationary cost and labor pressures. Areas of particular focus include transportation, certain components and raw materials. We continue to work to minimize supply chain challenges that may impact our ability to meet customer demand. We continue to assess the environment to determine if additional actions need to be taken.
Risk Factors
Risk factors are disclosed within Item 1A. Risk Factors of the 2023 Form 10-K.
Notes:
•Glossary of terms is included on pages 47-49; first occurrence of terms shown in bold italics.
•Information on non-GAAP financial measures is included on pages 53-54.
•Certain amounts may not add due to rounding.
41
Consolidated Results of Operations
THREE MONTHS ENDED MARCH 31, 2024 COMPARED WITH THREE MONTHS ENDED MARCH 31, 2023
CONSOLIDATED SALES AND REVENUES
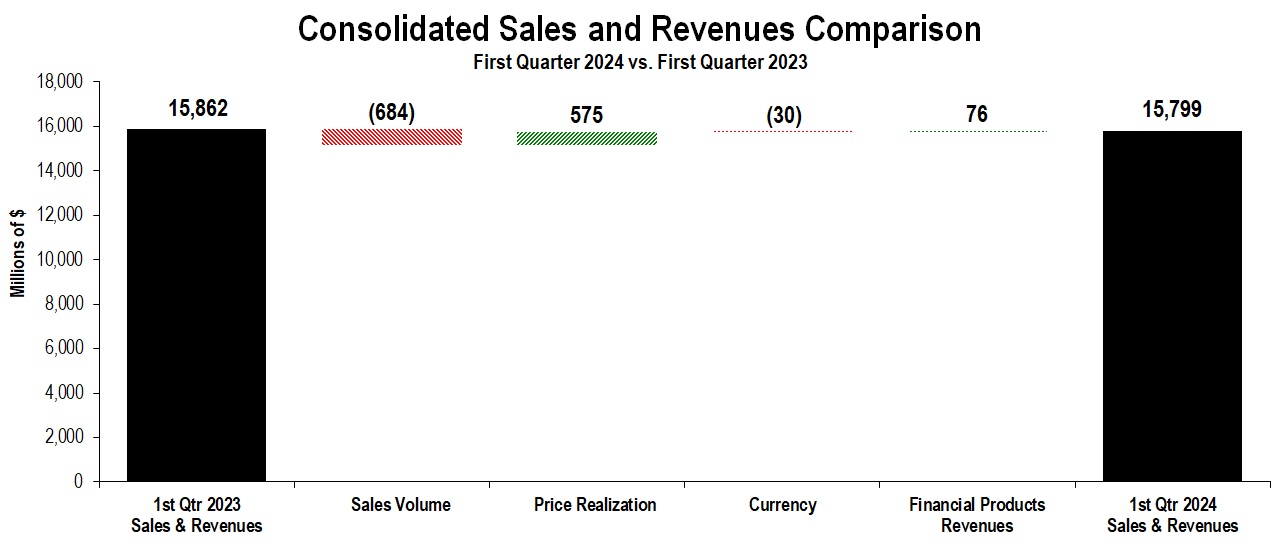
The chart above graphically illustrates reasons for the change in consolidated sales and revenues between the first quarter of 2023 (at left) and the first quarter of 2024 (at right). Caterpillar management utilizes these charts internally to visually communicate with the company’s board of directors and employees.
Total sales and revenues for the first quarter of 2024 were $15.799 billion, a decrease of $63 million, or about flat, compared with $15.862 billion in the first quarter of 2023. Lower sales volume of $684 million and unfavorable currency impacts of $30 million, primarily related to the Australian dollar, were mostly offset by favorable price realization of $575 million and higher Financial Products' revenues of $76 million. The decrease in sales volume was primarily driven by lower sales of equipment to end users; there was not a significant impact from changes in dealer inventories.
In the three primary segments, sales were higher in Energy & Transportation and lower in Construction Industries and Resource Industries.
North America sales increased 7 percent primarily due to favorable price realization and higher sales volume. The increase in sales volume was primarily driven by the impact from changes in dealer inventories. Dealer inventory increased more during the first quarter of 2024 than during the first quarter of 2023.
Sales increased 2 percent in Latin America mainly due to higher sales volume. The increase in sales volume was primarily driven by higher services sales volume.
EAME sales decreased 17 percent primarily due to lower sales volume. The decrease in sales volume was primarily driven by lower sales of equipment to end users.
Asia/Pacific sales decreased 5 percent mainly due to lower sales volume. The decrease in sales volume was primarily driven by the impact from changes in dealer inventories. Dealer inventory increased more during the first quarter of 2023 than during the first quarter of 2024.
Total dealer inventory increased by $1.4 billion during the first quarter of 2024, compared with an increase of $1.4 billion during the first quarter of 2023. Dealers are independent, and the reasons for changes in their inventory levels vary, including their expectations of future demand and product delivery times. Dealers’ demand expectations take into account seasonal changes, macroeconomic conditions, machine rentals and other factors. Delivery times can vary based on availability of product from Caterpillar factories and product distribution centers.
42
| Sales and Revenues by Segment | |||||||||||||||||||||||||||||||||||||||||||||||
| (Millions of dollars) | First Quarter 2023 | Sales Volume | Price Realization | Currency | Inter-Segment / Other | First Quarter 2024 | $ Change | % Change | |||||||||||||||||||||||||||||||||||||||
| Construction Industries | $ | 6,746 | $ | (464) | $ | 199 | $ | (22) | $ | (35) | $ | 6,424 | $ | (322) | (5 | %) | |||||||||||||||||||||||||||||||
| Resource Industries | 3,427 | (425) | 173 | (11) | 29 | 3,193 | (234) | (7 | %) | ||||||||||||||||||||||||||||||||||||||
| Energy & Transportation | 6,254 | 231 | 202 | (1) | (5) | 6,681 | 427 | 7 | % | ||||||||||||||||||||||||||||||||||||||
| All Other Segment | 111 | (1) | — | — | (1) | 109 | (2) | (2 | %) | ||||||||||||||||||||||||||||||||||||||
| Corporate Items and Eliminations | (1,439) | (25) | 1 | 4 | 12 | (1,447) | (8) | ||||||||||||||||||||||||||||||||||||||||
Machinery, Energy & Transportation Sales | 15,099 | (684) | 575 | (30) | — | 14,960 | (139) | (1 | %) | ||||||||||||||||||||||||||||||||||||||
| Financial Products Segment | 902 | — | — | — | 89 | 991 | 89 | 10 | % | ||||||||||||||||||||||||||||||||||||||
| Corporate Items and Eliminations | (139) | — | — | — | (13) | (152) | (13) | ||||||||||||||||||||||||||||||||||||||||
| Financial Products Revenues | 763 | — | — | — | 76 | 839 | 76 | 10 | % | ||||||||||||||||||||||||||||||||||||||
| Consolidated Sales and Revenues | $ | 15,862 | $ | (684) | $ | 575 | $ | (30) | $ | 76 | $ | 15,799 | $ | (63) | — | % | |||||||||||||||||||||||||||||||
| Sales and Revenues by Geographic Region | ||
| North America | Latin America | EAME | Asia/Pacific | External Sales and Revenues | Inter-Segment | Total Sales and Revenues | |||||||||||||||||||||||||||||||||||||||||||||||||||||||||||||||||||||||||||||
| (Millions of dollars) | $ | % Chg | $ | % Chg | $ | % Chg | $ | % Chg | $ | % Chg | $ | % Chg | $ | % Chg | |||||||||||||||||||||||||||||||||||||||||||||||||||||||||||||||||||||
| First Quarter 2024 | |||||||||||||||||||||||||||||||||||||||||||||||||||||||||||||||||||||||||||||||||||
| Construction Industries | $ | 3,833 | 6 | % | $ | 595 | (1 | %) | $ | 996 | (25 | %) | $ | 993 | (14 | %) | $ | 6,417 | (4 | %) | $ | 7 | (83 | %) | $ | 6,424 | (5 | %) | |||||||||||||||||||||||||||||||||||||||||||||||||||||||
| Resource Industries | 1,264 | (3 | %) | 476 | — | % | 465 | (22 | %) | 891 | (9 | %) | 3,096 | (8 | %) | 97 | 43 | % | 3,193 | (7 | %) | ||||||||||||||||||||||||||||||||||||||||||||||||||||||||||||||
| Energy & Transportation | 2,951 | 15 | % | 408 | 7 | % | 1,294 | (7 | %) | 834 | 16 | % | 5,487 | 9 | % | 1,194 | — | % | 6,681 | 7 | % | ||||||||||||||||||||||||||||||||||||||||||||||||||||||||||||||
| All Other Segment | 18 | — | % | (1) | — | % | 4 | — | % | 13 | — | % | 34 | (3 | %) | 75 | (1 | %) | 109 | (2 | %) | ||||||||||||||||||||||||||||||||||||||||||||||||||||||||||||||
| Corporate Items and Eliminations | (58) | (2) | (11) | (3) | (74) | (1,373) | (1,447) | ||||||||||||||||||||||||||||||||||||||||||||||||||||||||||||||||||||||||||||
| Machinery, Energy & Transportation Sales | 8,008 | 7 | % | 1,476 | 2 | % | 2,748 | (17 | %) | 2,728 | (5 | %) | 14,960 | (1 | %) | — | — | % | 14,960 | (1 | %) | ||||||||||||||||||||||||||||||||||||||||||||||||||||||||||||||
| Financial Products Segment | 659 | 15 | % | 101 | (3 | %) | 123 | 8 | % | 108 | (1 | %) | 991 | 1 | 10 | % | — | — | % | 991 | 10 | % | |||||||||||||||||||||||||||||||||||||||||||||||||||||||||||||
| Corporate Items and Eliminations | (94) | (18) | (19) | (21) | (152) | — | (152) | ||||||||||||||||||||||||||||||||||||||||||||||||||||||||||||||||||||||||||||
| Financial Products Revenues | 565 | 15 | % | 83 | (3 | %) | 104 | 8 | % | 87 | (2 | %) | 839 | 10 | % | — | — | % | 839 | 10 | % | ||||||||||||||||||||||||||||||||||||||||||||||||||||||||||||||
| Consolidated Sales and Revenues | $ | 8,573 | 8 | % | $ | 1,559 | 1 | % | $ | 2,852 | (17 | %) | $ | 2,815 | (5 | %) | $ | 15,799 | — | % | $ | — | — | % | $ | 15,799 | — | % | |||||||||||||||||||||||||||||||||||||||||||||||||||||||
| First Quarter 2023 | |||||||||||||||||||||||||||||||||||||||||||||||||||||||||||||||||||||||||||||||||||
| Construction Industries | $ | 3,608 | $ | 599 | $ | 1,336 | $ | 1,161 | $ | 6,704 | $ | 42 | $ | 6,746 | |||||||||||||||||||||||||||||||||||||||||||||||||||||||||||||||||||||
| Resource Industries | 1,308 | 474 | 599 | 978 | 3,359 | 68 | 3,427 | ||||||||||||||||||||||||||||||||||||||||||||||||||||||||||||||||||||||||||||
| Energy & Transportation | 2,572 | 380 | 1,384 | 719 | 5,055 | 1,199 | 6,254 | ||||||||||||||||||||||||||||||||||||||||||||||||||||||||||||||||||||||||||||
| All Other Segment | 18 | — | 4 | 13 | 35 | 76 | 111 | ||||||||||||||||||||||||||||||||||||||||||||||||||||||||||||||||||||||||||||
| Corporate Items and Eliminations | (48) | — | (1) | (5) | (54) | (1,385) | (1,439) | ||||||||||||||||||||||||||||||||||||||||||||||||||||||||||||||||||||||||||||
| Machinery, Energy & Transportation Sales | 7,458 | 1,453 | 3,322 | 2,866 | 15,099 | — | 15,099 | ||||||||||||||||||||||||||||||||||||||||||||||||||||||||||||||||||||||||||||
| Financial Products Segment | 575 | 104 | 114 | 109 | 902 | 1 | — | 902 | |||||||||||||||||||||||||||||||||||||||||||||||||||||||||||||||||||||||||||
| Corporate Items and Eliminations | (83) | (18) | (18) | (20) | (139) | — | (139) | ||||||||||||||||||||||||||||||||||||||||||||||||||||||||||||||||||||||||||||
| Financial Products Revenues | 492 | 86 | 96 | 89 | 763 | — | 763 | ||||||||||||||||||||||||||||||||||||||||||||||||||||||||||||||||||||||||||||
| Consolidated Sales and Revenues | $ | 7,950 | $ | 1,539 | $ | 3,418 | $ | 2,955 | $ | 15,862 | $ | — | $ | 15,862 | |||||||||||||||||||||||||||||||||||||||||||||||||||||||||||||||||||||
1 Includes revenues from Machinery, Energy & Transportation of $177 million and $162 million in the first quarter of 2024 and 2023, respectively.
43
CONSOLIDATED OPERATING PROFIT
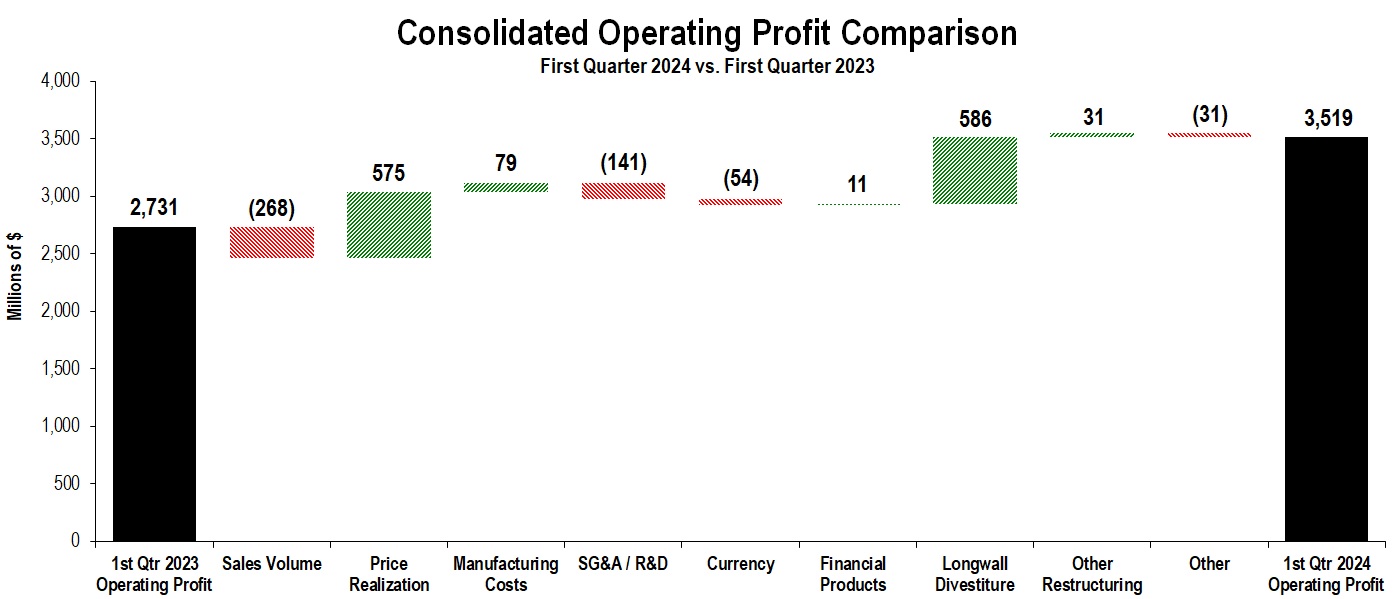
The chart above graphically illustrates reasons for the change in consolidated operating profit between the first quarter of 2023 (at left) and the first quarter of 2024 (at right). Caterpillar management utilizes these charts internally to visually communicate with the company’s board of directors and employees. The bar titled Other includes consolidating adjustments and Machinery, Energy & Transportation's other operating (income) expenses.
Operating profit for the first quarter of 2024 was $3.519 billion, an increase of $788 million, or 29 percent, compared with $2.731 billion in the first quarter of 2023. The increase was primarily due to the absence of the impact of the divestiture of the company's Longwall business in 2023 of $586 million and favorable price realization of $575 million, partially offset by the profit impact of lower sales volume of $268 million.
Operating profit margin was 22.3 percent for the first quarter of 2024, compared with 17.2 percent for the first quarter of 2023.
| Profit (Loss) by Segment | |||||||||||||||||||||||
| (Millions of dollars) | First Quarter 2024 | First Quarter 2023 | $ Change | % Change | |||||||||||||||||||
| Construction Industries | $ | 1,764 | $ | 1,790 | $ | (26) | (1 | %) | |||||||||||||||
| Resource Industries | 730 | 764 | (34) | (4 | %) | ||||||||||||||||||
| Energy & Transportation | 1,301 | 1,057 | 244 | 23 | % | ||||||||||||||||||
| All Other Segment | 24 | 11 | 13 | 118 | % | ||||||||||||||||||
| Corporate Items and Eliminations | (415) | (1,008) | 593 | ||||||||||||||||||||
| Machinery, Energy & Transportation | 3,404 | 2,614 | 790 | 30 | % | ||||||||||||||||||
| Financial Products Segment | 293 | 232 | 61 | 26 | % | ||||||||||||||||||
| Corporate Items and Eliminations | (25) | 25 | (50) | ||||||||||||||||||||
| Financial Products | 268 | 257 | 11 | 4 | % | ||||||||||||||||||
| Consolidating Adjustments | (153) | (140) | (13) | ||||||||||||||||||||
| Consolidated Operating Profit | $ | 3,519 | $ | 2,731 | $ | 788 | 29 | % | |||||||||||||||
44
Other Profit/Loss and Tax Items
▪Interest expense excluding Financial Products in the first quarter of 2024 was $143 million, compared with $129 million in the first quarter of 2023. The increase was due to higher average borrowing rates.
▪Other income (expense) in the first quarter of 2024 was income of $156 million, compared with income of $32 million in the first quarter of 2023. The change was primarily driven by favorable impacts from foreign currency exchange.
▪The effective tax rate for the first quarter of 2024 was 19.5 percent compared to 26.9 percent for the first quarter of 2023. Excluding the discrete items discussed below, the first quarter 2024 estimated annual tax rate was 22.5 percent compared with 23.0 percent for the first quarter of 2023.
The 2024 estimated annual tax rate excludes the impact of nontaxable gains of $64 million for the divestiture of a non-U.S. mining entity along with a related tax benefit of $54 million. The estimated annual tax rate in the first quarter of 2023 excluded the impact of the nondeductible loss of $586 million related to the divestiture of the company’s Longwall business. In addition, a discrete tax benefit of $38 million was recorded in the first quarter of 2024, compared with a $32 million benefit in the first quarter of 2023, for the settlement of stock-based compensation awards with associated tax deductions in excess of cumulative U.S. GAAP compensation expense.
Please see a reconciliation of GAAP to non-GAAP financial measures on pages 53-54.
Construction Industries
Construction Industries’ total sales were $6.424 billion in the first quarter of 2024, a decrease of $322 million, or 5 percent, compared with $6.746 billion in the first quarter of 2023. The decrease was primarily due to lower sales volume of $464 million, partially offset by favorable price realization of $199 million. The decrease in sales volume was mainly driven by lower sales of equipment to end users.
▪In North America, sales increased primarily due to favorable price realization.
▪Sales in Latin America were about flat.
▪In EAME, sales decreased mainly due to lower sales volume. Lower sales volume was primarily driven by lower sales of equipment to end users.
▪Sales decreased in Asia/Pacific primarily due to lower sales volume. Lower sales volume was mainly driven by the impact from changes in dealer inventories. Dealer inventory increased more during the first quarter of 2023 than during the first quarter of 2024.
Construction Industries’ segment profit was $1.764 billion in the first quarter of 2024, a decrease of $26 million, or 1 percent, compared with $1.790 billion in the first quarter of 2023. The decrease was mainly due to the profit impact of lower sales volume of $278 million, higher SG&A/R&D expenses of $26 million and unfavorable other segment items of $7 million, partially offset by favorable price realization of $199 million and favorable manufacturing costs of $86 million. Favorable manufacturing costs largely reflected lower freight.
Construction Industries’ segment profit as a percent of total sales was 27.5 percent in the first quarter of 2024, compared with 26.5 percent in the first quarter of 2023.
Resource Industries
Resource Industries’ total sales were $3.193 billion in the first quarter of 2024, a decrease of $234 million, or 7 percent, compared with $3.427 billion in the first quarter of 2023. The decrease was primarily due to lower sales volume of $425 million, partially offset by favorable price realization of $173 million. The decrease in sales volume was mainly driven by lower sales of equipment to end users.
Resource Industries’ segment profit was $730 million in the first quarter of 2024, a decrease of $34 million, or 4 percent, compared with $764 million in the first quarter of 2023. The decrease was mainly due to the profit impact of lower sales volume of $217 million and unfavorable other segment items of $24 million, partially offset by favorable price realization of $173 million and favorable manufacturing costs of $38 million. Unfavorable other segment items primarily consisted of unfavorable currency impacts. Favorable manufacturing costs largely reflected lower freight.
Resource Industries’ segment profit as a percent of total sales was 22.9 percent in the first quarter of 2024, compared with 22.3 percent in the first quarter of 2023.
45
Energy & Transportation
| Sales by Application | ||||||||||||||||||||||||||
| (Millions of dollars) | First Quarter 2024 | First Quarter 2023 | $ Change | % Change | ||||||||||||||||||||||
| Oil and Gas | $ | 1,568 | $ | 1,314 | $ | 254 | 19 | % | ||||||||||||||||||
| Power Generation | 1,618 | 1,284 | 334 | 26 | % | |||||||||||||||||||||
| Industrial | 989 | 1,255 | (266) | (21 | %) | |||||||||||||||||||||
| Transportation | 1,312 | 1,202 | 110 | 9 | % | |||||||||||||||||||||
| External Sales | 5,487 | 5,055 | 432 | 9 | % | |||||||||||||||||||||
| Inter-segment | 1,194 | 1,199 | (5) | — | % | |||||||||||||||||||||
| Total Sales | $ | 6,681 | $ | 6,254 | $ | 427 | 7 | % | ||||||||||||||||||
Energy & Transportation’s total sales were $6.681 billion in the first quarter of 2024, an increase of $427 million, or 7 percent, compared with $6.254 billion in the first quarter of 2023. Sales increased across all applications except Industrial. The increase in sales was primarily due to higher sales volume of $231 million and favorable price realization of $202 million.
▪Oil and Gas – Sales increased for turbines and turbine-related services. Sales also increased in reciprocating engines used in gas compression applications.
▪Power Generation – Sales increased in large reciprocating engines, primarily data center applications.
▪Industrial – Sales decreased primarily in EAME and North America.
▪Transportation – Sales increased in rail services. International locomotive deliveries were also higher.
Energy & Transportation’s segment profit was $1.301 billion in the first quarter of 2024, an increase of $244 million, or 23 percent, compared with $1.057 billion in the first quarter of 2023. The increase was mainly due to favorable price realization of $202 million.
Energy & Transportation’s segment profit as a percent of total sales was 19.5 percent in the first quarter of 2024, compared with 16.9 percent in the first quarter of 2023.
Financial Products Segment
Financial Products’ segment revenues were $991 million in the first quarter of 2024, an increase of $89 million, or 10 percent, compared with $902 million in the first quarter of 2023. The increase was primarily due to a $69 million favorable impact from higher average financing rates across all regions and a $32 million favorable impact from higher average earning assets driven by North America.
Financial Products’ segment profit was $293 million in the first quarter of 2024, an increase of $61 million, or 26 percent, compared with $232 million in the first quarter of 2023. The increase was mainly due to a $33 million insurance settlement and a $27 million favorable impact from equity securities.
At the end of the first quarter of 2024, past dues at Cat Financial were 1.78 percent, compared with 2.00 percent at the end of the first quarter of 2023. Write-offs, net of recoveries, were $55 million for the first quarter of 2024, compared with $10 million for the first quarter of 2023. As of March 31, 2024, Cat Financial's allowance for credit losses totaled $281 million, or 1.01 percent of finance receivables, compared with $331 million, or 1.18 percent of finance receivables at December 31, 2023.
Corporate Items and Eliminations
Expense for corporate items and eliminations was $440 million in the first quarter of 2024, a decrease of $543 million from the first quarter of 2023, primarily driven by the absence of the impact of the divestiture of the company's Longwall business in 2023.
46
RESTRUCTURING COSTS
In 2024, we expect to incur about $300 million to $450 million of restructuring costs. We expect that prior restructuring actions will result in an incremental benefit to operating costs, primarily Cost of goods sold and SG&A expenses, of about $25 million in 2024 compared with 2023.
Additional information related to restructuring costs is included in Note 20 – "Restructuring costs" of Part I, Item 1 "Financial Statements."
GLOSSARY OF TERMS
1.Adjusted Operating Profit Margin – Operating profit excluding restructuring income/costs as a percent of sales and revenues.
2.Adjusted Profit Per Share – Profit per share excluding restructuring income/costs.
3.All Other Segment – Primarily includes activities such as: business strategy; product management and development; manufacturing and sourcing of wear and maintenance components primarily for Cat® products; parts distribution; integrated logistics solutions; distribution services responsible for dealer development and administration, including a wholly owned dealer in Japan; dealer portfolio management and ensuring the most efficient and effective distribution of machines, engines and parts; brand management and marketing strategy; and digital investments for new customer and dealer solutions that integrate data analytics with state-of-the-art digital technologies while transforming the buying experience.
4.Consolidating Adjustments – Elimination of transactions between Machinery, Energy & Transportation and Financial Products.
5.Construction Industries – A segment primarily responsible for supporting customers using machinery in infrastructure and building construction applications. Responsibilities include business strategy, product design, product management and development, manufacturing, marketing and sales and product support. The product portfolio includes asphalt pavers; backhoe loaders; cold planers; compactors; compact track loaders; forestry machines; material handlers; motor graders; pipelayers; road reclaimers; skid steer loaders; telehandlers; track-type loaders; track-type tractors (small, medium); track excavators (mini, small, medium, large); wheel excavators; wheel loaders (compact, small, medium); and related parts and work tools.
6.Corporate Items and Eliminations – Includes corporate-level expenses, timing differences (as some expenses are reported in segment profit on a cash basis), methodology differences between segment and consolidated external reporting, certain restructuring costs and inter-segment eliminations.
7.Currency – With respect to sales and revenues, currency represents the translation impact on sales resulting from changes in foreign currency exchange rates versus the U.S. dollar. With respect to operating profit, currency represents the net translation impact on sales and operating costs resulting from changes in foreign currency exchange rates versus the U.S. dollar. Currency only includes the impact on sales and operating profit for the Machinery, Energy & Transportation line of business; currency impacts on Financial Products revenues and operating profit are included in the Financial Products portions of the respective analyses. With respect to other income/expense, currency represents the effects of forward and option contracts entered into by the company to reduce the risk of fluctuations in exchange rates (hedging) and the net effect of changes in foreign currency exchange rates on our foreign currency assets and liabilities for consolidated results (translation).
8.Dealer Inventories – Represents dealer machine and engine inventories, excluding aftermarket parts.
9.EAME – A geographic region including Europe, Africa, the Middle East and Eurasia.
10.Earning Assets – Assets consisting primarily of total finance receivables net of unearned income, plus equipment on operating leases net of accumulated depreciation at Cat Financial.
47
11.Energy & Transportation – A segment primarily responsible for supporting customers using reciprocating engines, turbines, diesel-electric locomotives and related services across industries serving Oil and Gas, Power Generation, Industrial and Transportation applications, including marine- and rail-related businesses as well as product support of on-highway engines. Responsibilities include business strategy, product design, product management, development and testing, manufacturing, marketing and sales and product support. The product and services portfolio includes turbines, centrifugal gas compressors, and turbine-related services; reciprocating engine-powered generator sets; integrated systems and solutions used in the electric power generation industry; reciprocating engines, drivetrain and integrated systems and solutions for the marine and oil and gas industries; reciprocating engines, drivetrain and integrated systems and solutions supplied to the industrial industry as well as Caterpillar machines; electrified powertrain and zero-emission power sources and service solutions development; and diesel-electric locomotives and components and other rail-related products and services, including remanufacturing and leasing. Responsibilities also include the remanufacturing of Caterpillar reciprocating engines and components and remanufacturing services for other companies.
12.Financial Products – The company defines Financial Products as our finance and insurance subsidiaries, primarily Caterpillar Financial Services Corporation (Cat Financial) and Caterpillar Insurance Holdings Inc. (Insurance Services). Financial Products’ information relates to the financing to customers and dealers for the purchase and lease of Caterpillar and other equipment.
13.Financial Products Segment – Provides financing alternatives to customers and dealers around the world for Caterpillar products and services, as well as financing for power generation facilities that, in most cases, incorporate Caterpillar products. Financing plans include operating and finance leases, revolving charge accounts, installment sale contracts, repair/rebuild financing, working capital loans and wholesale financing plans. The segment also provides insurance and risk management products and services that help customers and dealers manage their business risk. Insurance and risk management products offered include physical damage insurance, inventory protection plans, extended service coverage and maintenance plans for machines and engines, and dealer property and casualty insurance. The various forms of financing, insurance and risk management products offered to customers and dealers help support the purchase and lease of Caterpillar equipment. The segment also earns revenues from Machinery, Energy & Transportation, but the related costs are not allocated to operating segments. Financial Products’ segment profit is determined on a pretax basis and includes other income/expense items.
14.Latin America – A geographic region including Central and South American countries and Mexico.
15.Machinery, Energy & Transportation (ME&T) – The company defines ME&T as Caterpillar Inc. and its subsidiaries, excluding Financial Products. ME&T’s information relates to the design, manufacturing and marketing of its products.
16.Machinery, Energy & Transportation Other Operating (Income) Expenses – Comprised primarily of gains/losses on disposal of long-lived assets, gains/losses on divestitures and legal settlements and accruals.
17.Manufacturing Costs – Manufacturing costs exclude the impacts of currency and represent the volume-adjusted change for variable costs and the absolute dollar change for period manufacturing costs. Variable manufacturing costs are defined as having a direct relationship with the volume of production. This includes material costs, direct labor and other costs that vary directly with production volume, such as freight, power to operate machines and supplies that are consumed in the manufacturing process. Period manufacturing costs support production but are defined as generally not having a direct relationship to short-term changes in volume. Examples include machinery and equipment repair, depreciation on manufacturing assets, facility support, procurement, factory scheduling, manufacturing planning and operations management.
18.Mark-to-market gains/losses – Represents the net gain or loss of actual results differing from the company’s assumptions and the effects of changing assumptions for our defined benefit pension and OPEB plans. These gains and losses are immediately recognized through earnings upon the annual remeasurement in the fourth quarter, or on an interim basis as triggering events warrant remeasurement.
19.Pension and Other Postemployment Benefits (OPEB) – The company’s defined-benefit pension and postretirement benefit plans.
20.Price Realization – The impact of net price changes excluding currency and new product introductions. Price realization includes geographic mix of sales, which is the impact of changes in the relative weighting of sales prices between geographic regions.
48
21.Resource Industries – A segment primarily responsible for supporting customers using machinery in mining, heavy construction and quarry and aggregates. Responsibilities include business strategy, product design, product management and development, manufacturing, marketing and sales and product support. The product portfolio includes large track-type tractors; large mining trucks; hard rock vehicles; electric rope shovels; draglines; hydraulic shovels; rotary drills; large wheel loaders; off-highway trucks; articulated trucks; wheel tractor scrapers; wheel dozers; landfill compactors; soil compactors; wide-body trucks; select work tools; machinery components; electronics and control systems and related parts. In addition to equipment, Resource Industries also develops and sells technology products and services to provide customers fleet management, equipment management analytics, autonomous machine capabilities, safety services and mining performance solutions. Resource Industries also manages areas that provide services to other parts of the company, including strategic procurement, lean center of excellence, integrated manufacturing, research and development for hydraulic systems, automation, electronics and software for Caterpillar machines and engines.
22.Restructuring Costs – May include costs for employee separation, long-lived asset impairments, contract terminations and (gains)/losses on divestitures. These costs are included in Other operating (income) expenses except for defined-benefit plan curtailment losses and special termination benefits, which are included in Other income (expense). Restructuring costs also include other exit-related costs, which may consist of accelerated depreciation, inventory write-downs, building demolition, equipment relocation and project management costs and LIFO inventory decrement benefits from inventory liquidations at closed facilities, all of which are primarily included in Cost of goods sold.
23.Sales Volume – With respect to sales and revenues, sales volume represents the impact of changes in the quantities sold for Machinery, Energy & Transportation as well as the incremental sales impact of new product introductions, including emissions-related product updates. With respect to operating profit, sales volume represents the impact of changes in the quantities sold for Machinery, Energy & Transportation combined with product mix as well as the net operating profit impact of new product introductions, including emissions-related product updates. Product mix represents the net operating profit impact of changes in the relative weighting of Machinery, Energy & Transportation sales with respect to total sales. The impact of sales volume on segment profit includes inter-segment sales.
24.Services – Enterprise services include, but are not limited to, aftermarket parts, Financial Products revenues and other service-related revenues. Machinery, Energy & Transportation segments exclude most Financial Products revenues.
LIQUIDITY AND CAPITAL RESOURCES
Sources of funds
We generate significant capital resources from operating activities, which are the primary source of funding for our ME&T operations. Funding for these businesses is also available from commercial paper and long-term debt issuances. Financial Products’ operations are funded primarily from commercial paper, term debt issuances and collections from its existing portfolio. On a consolidated basis, we had positive operating cash flow in the first three months of 2024 and ended the first quarter with $4.96 billion of cash, a decrease of $2.02 billion from year-end 2023. In addition, ME&T has invested in available-for-sale debt securities and bank time deposits that are considered highly liquid and are available for current operations. These ME&T securities were $2.19 billion as of March 31, 2024 and are included in Prepaid expenses and other current assets and Other assets in the Consolidated Statement of Financial Position. We intend to maintain a strong cash and liquidity position.
Consolidated operating cash flow for the first three months of 2024 was $2.05 billion, up $479 million compared to the same period a year ago. The increase was primarily due to higher profit before taxes including reconciling adjustments and lower working capital requirements, excluding changes in accrued wages, salaries and benefits, which were a partial offset due to higher payments for short-term incentive compensation. Within working capital, changes in inventory favorably impacted cash flow as inventory increased less in the first quarter of 2024 compared to the prior year period, partially offset by unfavorable changes in accounts payable.
Total debt as of March 31, 2024 was $37.85 billion, a decrease of $25 million from year-end 2023. Debt related to ME&T decreased $31 million in the first three months of 2024 while debt related to Financial Products increased $14 million.
As of March 31, 2024, we had three global credit facilities with a syndicate of banks totaling $10.50 billion (Credit Facility) available in the aggregate to both Caterpillar and Cat Financial for general liquidity purposes. Based on management’s allocation decision, which can be revised from time to time, the portion of the Credit Facility available to ME&T as of March 31, 2024 was $2.75 billion. Information on our Credit Facility is as follows:
•The 364-day facility of $3.15 billion (of which $825 million is available to ME&T) expires in August 2024.
49
•The three-year facility, as amended in August 2023, of $2.73 billion (of which $715 million is available to ME&T) expires in August 2026.
•The five-year facility, as amended in August 2023, of $4.62 billion (of which $1.21 billion is available to ME&T) expires in August 2028.
At March 31, 2024, Caterpillar’s consolidated net worth was $17.70 billion, which was above the $9.00 billion required under the Credit Facility. The consolidated net worth is defined in the Credit Facility as Caterpillar's consolidated shareholders’ equity including preferred stock but excluding the pension and other postretirement benefits balance within Accumulated other comprehensive income (loss).
At March 31, 2024, Cat Financial’s covenant interest coverage ratio was 1.70 to 1. This was above the 1.15 to 1 minimum ratio calculated as (1) profit excluding income taxes, interest expense and net gain (loss) from interest rate derivatives to (2) interest expense calculated at the end of each fiscal quarter for the prior four consecutive fiscal quarter period, required by the Credit Facility.
In addition, at March 31, 2024, Cat Financial’s six-month covenant leverage ratio was 6.90 to 1. This was below the maximum ratio of debt to net worth of 10 to 1, calculated (1) on a monthly basis as the average of the leverage ratios determined on the last day of each of the six preceding calendar months and (2) at each December 31, required by the Credit Facility.
In the event Caterpillar or Cat Financial does not meet one or more of their respective financial covenants under the Credit Facility in the future (and are unable to obtain a consent or waiver), the syndicate of banks may terminate the commitments allocated to the party that does not meet its covenants. Additionally, in such event, certain of Cat Financial’s other lenders under other loan agreements where similar financial covenants or cross default provisions are applicable may, at their election, choose to pursue remedies under those loan agreements, including accelerating the repayment of outstanding borrowings. At March 31, 2024, there were no borrowings under the Credit Facility.
The aforementioned financial covenants are being reported as calculated under the Credit Facility and not pursuant to U.S. GAAP. Please refer to the credit agreements governing the Credit Facility filed as an exhibit to our periodic reports for further information related to the calculation thereof. For risks related to our indebtedness and compliance with these covenants, please refer to the risk factor "Restrictive covenants in our debt agreements could limit our financial and operating flexibility" set forth in Part I, Item 1A of our most recent annual report on Form 10-K.
Our total credit commitments and available credit as of March 31, 2024 were:
| March 31, 2024 | |||||||||||||||||
| (Millions of dollars) | Consolidated | Machinery, Energy & Transportation | Financial Products | ||||||||||||||
| Credit lines available: | |||||||||||||||||
| Global credit facilities | $ | 10,500 | $ | 2,750 | $ | 7,750 | |||||||||||
| Other external | 4,142 | 626 | 3,516 | ||||||||||||||
| Total credit lines available | 14,642 | 3,376 | 11,266 | ||||||||||||||
| Less: Commercial paper outstanding | (3,016) | — | (3,016) | ||||||||||||||
| Less: Utilized credit | (763) | — | (763) | ||||||||||||||
| Available credit | $ | 10,863 | $ | 3,376 | $ | 7,487 | |||||||||||
The other external consolidated credit lines with banks as of March 31, 2024 totaled $4.14 billion. These committed and uncommitted credit lines, which may be eligible for renewal at various future dates or have no specified expiration date, are used primarily by our subsidiaries for local funding requirements. Caterpillar or Cat Financial may guarantee subsidiary borrowings under these lines.
50
We receive debt ratings from the major credit rating agencies. Fitch maintains a "high-A" debt rating, while Moody’s and S&P maintain a “mid-A” debt rating. A downgrade of our credit ratings by any of the major credit rating agencies could result in increased borrowing costs and could make access to certain credit markets more difficult. In the event economic conditions deteriorate such that access to debt markets becomes unavailable, ME&T’s operations would rely on cash flow from operations, use of existing cash balances, borrowings from Cat Financial and access to our committed credit facilities. Our Financial Products’ operations would rely on cash flow from its existing portfolio, existing cash balances, access to our committed credit facilities and other credit line facilities of Cat Financial, and potential borrowings from Caterpillar. In addition, we maintain a support agreement with Cat Financial, which requires Caterpillar to remain the sole owner of Cat Financial and may, under certain circumstances, require Caterpillar to make payments to Cat Financial should Cat Financial fail to maintain certain financial ratios.
We facilitate voluntary supplier finance programs (the “Programs”) through participating financial institutions. We account for the payments made under the Programs, the same as other accounts payable, as a reduction to our cash flows from operations. We do not believe that changes in the availability of the programs will have a significant impact on our liquidity. Additional information related to the programs is included in Note 21 – "Supplier finance programs" of Part I, Item 1 "Financial Statements."
Machinery, Energy & Transportation
Net cash provided by operating activities was $1.77 billion in the first three months of 2024, compared with net cash provided of $1.78 billion for the same period in 2023. The decrease was primarily due to changes in accrued wages, salaries, and employee benefits mostly due to higher payments for short term incentive compensation in 2024, partially offset by lower working capital requirements, excluding the impact of changes in accrued wages, salaries, and employee benefits. Within working capital, changes in inventories favorably impacted cash flow but were partially offset by changes in accounts payable, accounts receivable and customer advances.
Net cash provided by investing activities in the first three months of 2024 was $1.23 billion, compared with net cash used of $670 million in the first three months of 2023. The change was due to higher proceeds from maturities and sale of securities, primarily due to time deposit maturities in 2024, and lower investments in securities.
Net cash used for financing activities during the first three months of 2024 was $5.12 billion, compared with net cash used of $1.14 billion in the same period of 2023. The change was primarily due to higher share repurchases in the first three months of 2024.
While our short-term priorities for the use of cash may vary from time to time as business needs and conditions dictate, our long-term cash deployment strategy is focused on the following priorities. Our top priority is to maintain a strong financial position in support of a mid-A rating. Next, we intend to fund operational requirements and commitments. Then, we intend to fund priorities that profitably grow the company and return capital to shareholders through dividend growth and share repurchases. Additional information on cash deployment is as follows:
Strong financial position – Our top priority is to maintain a strong financial position in support of a mid-A rating. We track a diverse group of financial metrics that focus on liquidity, leverage, cash flow and margins which align with our cash deployment actions and the various methodologies used by the major credit rating agencies.
Operational excellence and commitments – Capital expenditures were $502 million during the first three months of 2024, compared to $414 million for the same period in 2023. We expect ME&T’s capital expenditures in 2024 to be about $2.0 billion to $2.5 billion. We made $113 million of contributions to our pension and other postretirement benefit plans during the first three months of 2024. We currently anticipate full-year 2024 contributions of approximately $273 million. In comparison, we made $208 million of contributions to our pension and other postretirement benefit plans during the first three months of 2023.
Fund strategic growth initiatives and return capital to shareholders – We intend to utilize our liquidity and debt capacity to fund targeted investments that drive long-term profitable growth focused in the areas of expanded offerings, services and sustainability, including acquisitions.
51
As part of our capital allocation strategy, ME&T free cash flow is a liquidity measure we use to determine the cash generated and available for financing activities including debt repayments, dividends and share repurchases. We define ME&T free cash flow as cash from ME&T operations less capital expenditures, excluding discretionary pension and other postretirement benefit plan contributions. A goal of our capital allocation strategy is to return substantially all ME&T free cash flow to shareholders over time in the form of dividends and share repurchases, while maintaining our mid-A rating.
Our share repurchase plans are subject to the company’s cash deployment priorities and are evaluated on an ongoing basis considering the financial condition of the company, corporate cash flow, the company’s liquidity needs, the economic outlook, and the health and stability of global credit markets. The timing and amount of future repurchases may vary depending on market conditions and investing priorities. In May 2022, the Board approved a share repurchase authorization (the 2022 Authorization) of up to $15.0 billion of Caterpillar common stock effective August 1, 2022, with no expiration. In the first three months of 2024, we repurchased $4.46 billion of Caterpillar common stock, with $3.37 billion remaining under the 2022 Authorization as of March 31, 2024. Our basic shares outstanding as of March 31, 2024 were approximately 489 million.
Each quarter, our Board of Directors reviews the company’s dividend for the applicable quarter. The Board evaluates the financial condition of the company and considers corporate cash flow, the company’s liquidity needs, the economic outlook, and the health and stability of global credit markets to determine whether to maintain or change the quarterly dividend. In April 2024, the Board of Directors approved maintaining our quarterly dividend representing $1.30 per share, and we continue to expect our strong financial position to support the dividend. Dividends paid totaled $648 million in the first three months of 2024.
Financial Products
Net cash provided by operating activities was $308 million in the first three months of 2024, compared with $302 million for the same period in 2023. Net cash used for investing activities was $291 million in the first three months of 2024, compared with net cash used of $444 million for the same period in 2023. The change was primarily due to portfolio related activity. Net cash provided by financing activities was $117 million in the first three months of 2024, compared with net cash used of $43 million for the same period in 2023. The change was due to a higher net inflow from external borrowings and the absence of dividends paid to Caterpillar.
RECENT ACCOUNTING PRONOUNCEMENTS
For a discussion of recent accounting pronouncements, see Note 2 – “New accounting guidance” of Part I, Item 1 "Financial Statements."
CRITICAL ACCOUNTING ESTIMATES
For a discussion of the company’s critical accounting estimates, see Part II, Item 7. Management’s Discussion and Analysis of Financial Condition and Results of Operations in our 2023 Annual Report on Form 10-K. There have been no significant changes to our critical accounting estimates since our 2023 Annual Report on Form 10-K.
OTHER MATTERS
Information related to legal proceedings appears in Note 14 – "Environmental and legal matters" of Part I, Item 1 “Financial Statements.”
Order Backlog
At the end of the first quarter of 2024, the dollar amount of backlog believed to be firm was approximately $27.9 billion, about $0.4 billion higher than the fourth quarter of 2023. The order backlog increased primarily within the Energy and Transportation segment. Of the total backlog at March 31, 2024, approximately $6.0 billion was not expected to be filled in the following twelve months.
52
NON-GAAP FINANCIAL MEASURES
We provide the following definitions for the non-GAAP financial measures used in this report. These non-GAAP financial measures have no standardized meaning prescribed by U.S. GAAP and therefore are unlikely to be comparable to the calculation of similar measures for other companies. Management does not intend these items to be considered in isolation or as a substitute for the related GAAP measures.
We believe it is important to separately quantify the profit impact of three significant items in order for our results to be meaningful to our readers. These items consist of (i) restructuring income related to the divestiture of a non-US mining entity, (ii) other restructuring income/costs and (iii) restructuring costs related to the divestiture of the company's Longwall business in 2023. We do not consider these items indicative of earnings from ongoing business activities and believe the non-GAAP measure provides investors with useful perspective on underlying business results and trends and aids with assessing our period-over-period results.
Reconciliations of adjusted results to the most directly comparable GAAP measures are as follows:
| (Dollars in millions except per share data) | Operating Profit | Operating Profit Margin | Profit Before Taxes | Provision (Benefit) for Income Taxes | Profit | Profit per Share | ||||||||||||||||||||||||||||||||
Three Months Ended March 31, 2024 - U.S. GAAP | $ | 3,519 | 22.3 | % | $ | 3,532 | $ | 688 | $ | 2,856 | $ | 5.75 | ||||||||||||||||||||||||||
| Restructuring (income) - non-US mining entity divestiture | (64) | (0.5) | % | (64) | 54 | (118) | (0.24) | |||||||||||||||||||||||||||||||
| Other restructuring (income) costs | 58 | 0.4 | % | 58 | 14 | 44 | 0.09 | |||||||||||||||||||||||||||||||
Three Months Ended March 31, 2024 - Adjusted | $ | 3,513 | 22.2 | % | $ | 3,526 | $ | 756 | $ | 2,782 | $ | 5.60 | ||||||||||||||||||||||||||
Three Months Ended March 31, 2023 - U.S. GAAP | $ | 2,731 | 17.2 | % | $ | 2,634 | $ | 708 | $ | 1,943 | $ | 3.74 | ||||||||||||||||||||||||||
| Restructuring costs - Longwall divestiture | 586 | 3.7 | % | 586 | — | 586 | 1.13 | |||||||||||||||||||||||||||||||
| Other restructuring (income) costs | 25 | 0.2 | % | 25 | 5 | 20 | 0.04 | |||||||||||||||||||||||||||||||
Three Months Ended March 31, 2023 - Adjusted | $ | 3,342 | 21.1 | % | $ | 3,245 | $ | 713 | $ | 2,549 | $ | 4.91 | ||||||||||||||||||||||||||
We believe it is important to separately disclose our annual effective tax rate, excluding discrete items for our results to be meaningful to our readers. The annual effective tax rate, excluding discrete items for the three months ended March 31, 2024, and 2023 is discussed using non-GAAP financial measures that exclude the effects of amounts associated with discrete items recorded fully in the quarter they occur. These items consist of (i) restructuring income related to the divestiture of a non-US mining entity, (ii) restructuring costs related to the divestiture of the company's Longwall business in 2023 and (iii) settlement of stock-based compensation awards with associated tax deductions in excess of cumulative U.S. GAAP compensation expense. We believe the non-GAAP measures will provide investors with useful perspective on underlying business results and trends and aids with assessing the company's period-over-period results.
53
A reconciliation of our effective tax rate to annual effective tax rate, excluding discrete items is below:
| (Dollars in millions) | Profit Before Taxes | Provision (Benefit) for Income Taxes | Effective Tax Rate | |||||||||||||||||
Three Months Ended March 31, 2024 - U.S. GAAP | $ | 3,532 | $ | 688 | 19.5 | % | ||||||||||||||
| Restructuring (income) - non-US mining entity divestiture | (64) | 54 | ||||||||||||||||||
| Excess stock-based compensation | — | 38 | ||||||||||||||||||
| Annual effective tax rate, excluding discrete items | $ | 3,468 | $ | 780 | 22.5 | % | ||||||||||||||
| Excess stock-based compensation | — | (38) | ||||||||||||||||||
| Other restructuring (income) costs | 58 | 14 | ||||||||||||||||||
Three Months Ended March 31, 2024 - Adjusted | $ | 3,526 | $ | 756 | ||||||||||||||||
Three Months Ended March 31, 2023 - U.S. GAAP | $ | 2,634 | $ | 708 | 26.9 | % | ||||||||||||||
| Restructuring costs - Longwall divestiture | 586 | — | ||||||||||||||||||
| Excess stock-based compensation | — | 32 | ||||||||||||||||||
| Annual effective tax rate, excluding discrete items | $ | 3,220 | $ | 740 | 23.0 | % | ||||||||||||||
| Excess stock-based compensation | — | (32) | ||||||||||||||||||
| Other restructuring (income) costs | 25 | 5 | ||||||||||||||||||
Three Months Ended March 31, 2023 - Adjusted | $ | 3,245 | $ | 713 | ||||||||||||||||
In addition, we provide a calculation of ME&T free cash flow as we believe it is an important measure for investors to determine the cash generation available for financing activities including debt repayments, dividends and share repurchases.
Reconciliations of ME&T free cash flow to the most directly comparable GAAP measure, net cash provided by operating activities are as follows:
| (Millions of dollars) | Three Months Ended March 31, | ||||||||||
| 2024 | 2023 | ||||||||||
ME&T net cash provided by operating activities 1 | $ | 1,771 | $ | 1,779 | |||||||
| ME&T capital expenditures | (502) | (414) | |||||||||
| ME&T free cash flow | $ | 1,269 | $ | 1,365 | |||||||
1 See reconciliation of ME&T net cash provided by operating activities to consolidated net cash provided by operating activities on pages 60 - 61. | |||||||||||
54
Supplemental Consolidating Data
We are providing supplemental consolidating data for the purpose of additional analysis. The data has been grouped as follows:
Consolidated – Caterpillar Inc. and its subsidiaries.
Machinery, Energy & Transportation – We define ME&T as it is presented in the supplemental data as Caterpillar Inc. and its subsidiaries, excluding Financial Products. ME&T’s information relates to the design, manufacturing and marketing of our products.
Financial Products – We define Financial Products as it is presented in the supplemental data as our finance and insurance subsidiaries, primarily Caterpillar Financial Services Corporation (Cat Financial) and Caterpillar Insurance Holdings Inc. (Insurance Services). Financial Products’ information relates to the financing to customers and dealers for the purchase and lease of Caterpillar and other equipment.
Consolidating Adjustments – Eliminations of transactions between ME&T and Financial Products.
The nature of the ME&T and Financial Products businesses is different, especially with regard to the financial position and cash flow items. Caterpillar management utilizes this presentation internally to highlight these differences. We believe this presentation will assist readers in understanding our business.
Pages 56 to 61 reconcile ME&T and Financial Products to Caterpillar Inc. consolidated financial information. Certain amounts for prior periods have been reclassified to conform to the current period presentation.
55
Caterpillar Inc.
Supplemental Data for Results of Operations
For the Three Months Ended March 31, 2024
(Unaudited)
(Millions of dollars)
| Supplemental Consolidating Data | ||||||||||||||||||||||||||
| Consolidated | Machinery, Energy & Transportation | Financial Products | Consolidating Adjustments | |||||||||||||||||||||||
| Sales and revenues: | ||||||||||||||||||||||||||
| Sales of Machinery, Energy & Transportation | $ | 14,960 | $ | 14,960 | $ | — | $ | — | ||||||||||||||||||
| Revenues of Financial Products | 839 | — | 1,029 | (190) | 1 | |||||||||||||||||||||
| Total sales and revenues | 15,799 | 14,960 | 1,029 | (190) | ||||||||||||||||||||||
| Operating costs: | ||||||||||||||||||||||||||
| Cost of goods sold | 9,662 | 9,664 | — | (2) | 2 | |||||||||||||||||||||
| Selling, general and administrative expenses | 1,577 | 1,413 | 178 | (14) | 2 | |||||||||||||||||||||
| Research and development expenses | 520 | 520 | — | — | ||||||||||||||||||||||
| Interest expense of Financial Products | 298 | — | 298 | — | ||||||||||||||||||||||
| Other operating (income) expenses | 223 | (41) | 285 | (21) | 2 | |||||||||||||||||||||
| Total operating costs | 12,280 | 11,556 | 761 | (37) | ||||||||||||||||||||||
| Operating profit | 3,519 | 3,404 | 268 | (153) | ||||||||||||||||||||||
| Interest expense excluding Financial Products | 143 | 143 | — | — | ||||||||||||||||||||||
| Other income (expense) | 156 | (20) | 23 | 153 | 3 | |||||||||||||||||||||
| Consolidated profit before taxes | 3,532 | 3,241 | 291 | — | ||||||||||||||||||||||
| Provision (benefit) for income taxes | 688 | 615 | 73 | — | ||||||||||||||||||||||
| Profit of consolidated companies | 2,844 | 2,626 | 218 | — | ||||||||||||||||||||||
| Equity in profit (loss) of unconsolidated affiliated companies | 10 | 10 | — | — | ||||||||||||||||||||||
| Profit of consolidated and affiliated companies | 2,854 | 2,636 | 218 | — | ||||||||||||||||||||||
| Less: Profit (loss) attributable to noncontrolling interests | (2) | (3) | 1 | — | ||||||||||||||||||||||
Profit 4 | $ | 2,856 | $ | 2,639 | $ | 217 | $ | — | ||||||||||||||||||
1Elimination of Financial Products’ revenues earned from ME&T.
2Elimination of net expenses recorded between ME&T and Financial Products.
3Elimination of discount recorded by ME&T on receivables sold to Financial Products and of interest earned between ME&T and Financial Products as well as dividends paid by Financial Products to ME&T.
4Profit attributable to common shareholders.
56
Caterpillar Inc.
Supplemental Data for Results of Operations
For the Three Months Ended March 31, 2023
(Unaudited)
(Millions of dollars)
| Supplemental Consolidating Data | ||||||||||||||||||||||||||
| Consolidated | Machinery, Energy & Transportation | Financial Products | Consolidating Adjustments | |||||||||||||||||||||||
| Sales and revenues: | ||||||||||||||||||||||||||
| Sales of Machinery, Energy & Transportation | $ | 15,099 | $ | 15,099 | $ | — | $ | — | ||||||||||||||||||
| Revenues of Financial Products | 763 | — | 935 | (172) | 1 | |||||||||||||||||||||
| Total sales and revenues | 15,862 | 15,099 | 935 | (172) | ||||||||||||||||||||||
| Operating costs: | ||||||||||||||||||||||||||
| Cost of goods sold | 10,103 | 10,104 | — | (1) | 2 | |||||||||||||||||||||
| Selling, general and administrative expenses | 1,463 | 1,320 | 158 | (15) | 2 | |||||||||||||||||||||
| Research and development expenses | 472 | 472 | — | — | ||||||||||||||||||||||
| Interest expense of Financial Products | 217 | — | 217 | — | ||||||||||||||||||||||
| Other operating (income) expenses | 876 | 589 | 303 | (16) | 2 | |||||||||||||||||||||
| Total operating costs | 13,131 | 12,485 | 678 | (32) | ||||||||||||||||||||||
| Operating profit | 2,731 | 2,614 | 257 | (140) | ||||||||||||||||||||||
| Interest expense excluding Financial Products | 129 | 129 | — | — | ||||||||||||||||||||||
| Other income (expense) | 32 | (14) | (19) | 65 | 3 | |||||||||||||||||||||
| Consolidated profit before taxes | 2,634 | 2,471 | 238 | (75) | ||||||||||||||||||||||
| Provision (benefit) for income taxes | 708 | 648 | 60 | — | ||||||||||||||||||||||
| Profit of consolidated companies | 1,926 | 1,823 | 178 | (75) | ||||||||||||||||||||||
| Equity in profit (loss) of unconsolidated affiliated companies | 16 | 19 | — | (3) | 4 | |||||||||||||||||||||
| Profit of consolidated and affiliated companies | 1,942 | 1,842 | 178 | (78) | ||||||||||||||||||||||
| Less: Profit (loss) attributable to noncontrolling interests | (1) | — | 2 | (3) | 5 | |||||||||||||||||||||
Profit 6 | $ | 1,943 | $ | 1,842 | $ | 176 | $ | (75) | ||||||||||||||||||
1Elimination of Financial Products’ revenues earned from ME&T.
2Elimination of net expenses recorded by ME&T paid to Financial Products.
3Elimination of discount recorded by ME&T on receivables sold to Financial Products and of interest earned between ME&T and Financial Products as well as dividends paid by Financial Products to ME&T.
4Elimination of equity profit (loss) earned from Financial Products’ subsidiaries partially owned by ME&T subsidiaries.
5Elimination of noncontrolling interest profit (loss) recorded by Financial Products for subsidiaries partially owned by ME&T subsidiaries.
6Profit attributable to common shareholders.
57
Caterpillar Inc.
Supplemental Data for Financial Position
At March 31, 2024
(Unaudited)
(Millions of dollars)
| Supplemental Consolidating Data | ||||||||||||||||||||||||||
| Consolidated | Machinery, Energy & Transportation | Financial Products | Consolidating Adjustments | |||||||||||||||||||||||
| Assets | ||||||||||||||||||||||||||
| Current assets: | ||||||||||||||||||||||||||
| Cash and cash equivalents | $ | 4,959 | $ | 3,963 | $ | 996 | $ | — | ||||||||||||||||||
| Receivables – trade and other | 9,296 | 3,814 | 658 | 4,824 | 1,2 | |||||||||||||||||||||
| Receivables – finance | 9,446 | — | 14,509 | (5,063) | 2 | |||||||||||||||||||||
| Prepaid expenses and other current assets | 3,010 | 2,665 | 379 | (34) | 3 | |||||||||||||||||||||
| Inventories | 16,953 | 16,953 | — | — | ||||||||||||||||||||||
| Total current assets | 43,664 | 27,395 | 16,542 | (273) | ||||||||||||||||||||||
| Property, plant and equipment – net | 12,538 | 8,647 | 3,891 | — | ||||||||||||||||||||||
| Long-term receivables – trade and other | 1,200 | 538 | 57 | 605 | 1,2 | |||||||||||||||||||||
| Long-term receivables – finance | 12,531 | — | 13,191 | (660) | 2 | |||||||||||||||||||||
| Noncurrent deferred and refundable income taxes | 2,860 | 3,382 | 138 | (660) | 4 | |||||||||||||||||||||
| Intangible assets | 516 | 516 | — | — | ||||||||||||||||||||||
| Goodwill | 5,277 | 5,277 | — | — | ||||||||||||||||||||||
| Other assets | 5,155 | 4,081 | 2,117 | (1,043) | 5 | |||||||||||||||||||||
| Total assets | $ | 83,741 | $ | 49,836 | $ | 35,936 | $ | (2,031) | ||||||||||||||||||
| Liabilities | ||||||||||||||||||||||||||
| Current liabilities: | ||||||||||||||||||||||||||
| Short-term borrowings | $ | 3,568 | $ | — | $ | 3,568 | $ | — | ||||||||||||||||||
| Accounts payable | 7,778 | 7,699 | 337 | (258) | 6,7 | |||||||||||||||||||||
| Accrued expenses | 4,821 | 4,287 | 534 | — | ||||||||||||||||||||||
| Accrued wages, salaries and employee benefits | 1,291 | 1,262 | 29 | — | ||||||||||||||||||||||
| Customer advances | 2,194 | 2,173 | 2 | 19 | 7 | |||||||||||||||||||||
| Other current liabilities | 3,265 | 2,601 | 725 | (61) | 4,8 | |||||||||||||||||||||
| Long-term debt due within one year | 9,454 | 1,045 | 8,409 | — | ||||||||||||||||||||||
| Total current liabilities | 32,371 | 19,067 | 13,604 | (300) | ||||||||||||||||||||||
| Long-term debt due after one year | 24,831 | 8,594 | 16,292 | (55) | 9 | |||||||||||||||||||||
| Liability for postemployment benefits | 4,068 | 4,068 | — | — | ||||||||||||||||||||||
| Other liabilities | 4,826 | 3,979 | 1,553 | (706) | 4 | |||||||||||||||||||||
| Total liabilities | 66,096 | 35,708 | 31,449 | (1,061) | ||||||||||||||||||||||
| Commitments and contingencies | ||||||||||||||||||||||||||
| Shareholders’ equity | ||||||||||||||||||||||||||
| Common stock | 5,663 | 5,663 | 905 | (905) | 10 | |||||||||||||||||||||
| Treasury stock | (40,039) | (40,039) | — | — | ||||||||||||||||||||||
| Profit employed in the business | 54,108 | 49,422 | 4,674 | 12 | 10 | |||||||||||||||||||||
| Accumulated other comprehensive income (loss) | (2,093) | (926) | (1,167) | — | ||||||||||||||||||||||
| Noncontrolling interests | 6 | 8 | 75 | (77) | 10 | |||||||||||||||||||||
| Total shareholders’ equity | 17,645 | 14,128 | 4,487 | (970) | ||||||||||||||||||||||
| Total liabilities and shareholders’ equity | $ | 83,741 | $ | 49,836 | $ | 35,936 | $ | (2,031) | ||||||||||||||||||
1 Elimination of receivables between ME&T and Financial Products.
2 Reclassification of ME&T’s trade receivables purchased by Financial Products and Financial Products’ wholesale inventory receivables.
3 Elimination of ME&T’s insurance premiums that are prepaid to Financial Products.
4 Reclassification reflecting required netting of deferred tax assets/liabilities by taxing jurisdiction.
5 Elimination of other intercompany assets between ME&T and Financial Products.
6 Elimination of payables between ME&T and Financial Products.
7 Reclassification of Financial Products' payables to accrued expenses or customer advances.
8 Elimination of prepaid insurance in Financial Products’ other liabilities.
9 Elimination of debt between ME&T and Financial Products.
10 Eliminations associated with ME&T’s investments in Financial Products’ subsidiaries.
58
Caterpillar Inc.
Supplemental Data for Financial Position
At December 31, 2023
(Unaudited)
(Millions of dollars)
| Supplemental Consolidating Data | ||||||||||||||||||||||||||
| Consolidated | Machinery, Energy & Transportation | Financial Products | Consolidating Adjustments | |||||||||||||||||||||||
| Assets | ||||||||||||||||||||||||||
| Current assets: | ||||||||||||||||||||||||||
| Cash and cash equivalents | $ | 6,978 | $ | 6,106 | $ | 872 | $ | — | ||||||||||||||||||
| Receivables – trade and other | 9,310 | 3,971 | 570 | 4,769 | 1,2 | |||||||||||||||||||||
| Receivables – finance | 9,510 | — | 14,499 | (4,989) | 2 | |||||||||||||||||||||
| Prepaid expenses and other current assets | 4,586 | 4,327 | 341 | (82) | 3 | |||||||||||||||||||||
| Inventories | 16,565 | 16,565 | — | — | ||||||||||||||||||||||
| Total current assets | 46,949 | 30,969 | 16,282 | (302) | ||||||||||||||||||||||
| Property, plant and equipment – net | 12,680 | 8,694 | 3,986 | — | ||||||||||||||||||||||
| Long-term receivables – trade and other | 1,238 | 565 | 85 | 588 | 1,2 | |||||||||||||||||||||
| Long-term receivables – finance | 12,664 | — | 13,299 | (635) | 2 | |||||||||||||||||||||
| Noncurrent deferred and refundable income taxes | 2,816 | 3,360 | 148 | (692) | 4 | |||||||||||||||||||||
| Intangible assets | 564 | 564 | — | — | ||||||||||||||||||||||
| Goodwill | 5,308 | 5,308 | — | — | ||||||||||||||||||||||
| Other assets | 5,257 | 4,218 | 2,082 | (1,043) | 5 | |||||||||||||||||||||
| Total assets | $ | 87,476 | $ | 53,678 | $ | 35,882 | $ | (2,084) | ||||||||||||||||||
| Liabilities | ||||||||||||||||||||||||||
| Current liabilities: | ||||||||||||||||||||||||||
| Short-term borrowings | $ | 4,643 | $ | — | $ | 4,643 | $ | — | ||||||||||||||||||
| Accounts payable | 7,906 | 7,827 | 314 | (235) | 6,7 | |||||||||||||||||||||
| Accrued expenses | 4,958 | 4,361 | 597 | — | ||||||||||||||||||||||
| Accrued wages, salaries and employee benefits | 2,757 | 2,696 | 61 | — | ||||||||||||||||||||||
| Customer advances | 1,929 | 1,912 | 2 | 15 | 7 | |||||||||||||||||||||
| Dividends payable | 649 | 649 | — | — | ||||||||||||||||||||||
| Other current liabilities | 3,123 | 2,583 | 647 | (107) | 4,8 | |||||||||||||||||||||
| Long-term debt due within one year | 8,763 | 1,044 | 7,719 | — | ||||||||||||||||||||||
| Total current liabilities | 34,728 | 21,072 | 13,983 | (327) | ||||||||||||||||||||||
| Long-term debt due after one year | 24,472 | 8,626 | 15,893 | (47) | 9 | |||||||||||||||||||||
| Liability for postemployment benefits | 4,098 | 4,098 | — | — | ||||||||||||||||||||||
| Other liabilities | 4,675 | 3,806 | 1,607 | (738) | 4 | |||||||||||||||||||||
| Total liabilities | 67,973 | 37,602 | 31,483 | (1,112) | ||||||||||||||||||||||
| Commitments and contingencies | ||||||||||||||||||||||||||
| Shareholders’ equity | ||||||||||||||||||||||||||
| Common stock | 6,403 | 6,403 | 905 | (905) | 10 | |||||||||||||||||||||
| Treasury stock | (36,339) | (36,339) | — | — | ||||||||||||||||||||||
| Profit employed in the business | 51,250 | 46,783 | 4,457 | 10 | 10 | |||||||||||||||||||||
| Accumulated other comprehensive income (loss) | (1,820) | (783) | (1,037) | — | ||||||||||||||||||||||
| Noncontrolling interests | 9 | 12 | 74 | (77) | 10 | |||||||||||||||||||||
| Total shareholders’ equity | 19,503 | 16,076 | 4,399 | (972) | ||||||||||||||||||||||
| Total liabilities and shareholders’ equity | $ | 87,476 | $ | 53,678 | $ | 35,882 | $ | (2,084) | ||||||||||||||||||
1 Elimination of receivables between ME&T and Financial Products.
2 Reclassification of ME&T’s trade receivables purchased by Financial Products and Financial Products’ wholesale inventory receivables.
3 Elimination of ME&T’s insurance premiums that are prepaid to Financial Products.
4 Reclassification reflecting required netting of deferred tax assets/liabilities by taxing jurisdiction.
5 Elimination of other intercompany assets between ME&T and Financial Products.
6 Elimination of payables between ME&T and Financial Products.
7 Reclassification of Financial Products' payables to accrued expenses or customer advances.
8 Elimination of prepaid insurance in Financial Products' other liabilities.
9 Elimination of debt between ME&T and Financial Products.
10 Eliminations associated with ME&T’s investments in Financial Products’ subsidiaries.
59
Caterpillar Inc.
Supplemental Data for Cash Flow
For the Three Months Ended March 31, 2024
(Unaudited)
(Millions of dollars)
| Supplemental Consolidating Data | ||||||||||||||||||||||||||
| Consolidated | Machinery, Energy & Transportation | Financial Products | Consolidating Adjustments | |||||||||||||||||||||||
| Cash flow from operating activities: | ||||||||||||||||||||||||||
| Profit of consolidated and affiliated companies | $ | 2,854 | $ | 2,636 | $ | 218 | $ | — | ||||||||||||||||||
| Adjustments to reconcile profit to net cash provided by operating activities: | ||||||||||||||||||||||||||
| Depreciation and amortization | 524 | 328 | 196 | — | ||||||||||||||||||||||
| Provision (benefit) for deferred income taxes | (54) | (23) | (31) | — | ||||||||||||||||||||||
| (Gain) loss on divestiture | (64) | (64) | — | — | ||||||||||||||||||||||
| Other | (5) | (16) | (120) | 131 | 1 | |||||||||||||||||||||
| Changes in assets and liabilities, net of acquisitions and divestitures: | ||||||||||||||||||||||||||
| Receivables – trade and other | (81) | 111 | (40) | (152) | 1,2 | |||||||||||||||||||||
| Inventories | (439) | (434) | — | (5) | 1 | |||||||||||||||||||||
| Accounts payable | 203 | 179 | 30 | (6) | 1 | |||||||||||||||||||||
| Accrued expenses | (38) | (47) | 9 | — | ||||||||||||||||||||||
| Accrued wages, salaries and employee benefits | (1,454) | (1,422) | (32) | — | ||||||||||||||||||||||
| Customer advances | 279 | 279 | — | — | ||||||||||||||||||||||
| Other assets – net | 60 | 102 | 3 | (45) | 1 | |||||||||||||||||||||
| Other liabilities – net | 267 | 142 | 75 | 50 | 1 | |||||||||||||||||||||
| Net cash provided by (used for) operating activities | 2,052 | 1,771 | 308 | (27) | ||||||||||||||||||||||
| Cash flow from investing activities: | ||||||||||||||||||||||||||
| Capital expenditures – excluding equipment leased to others | (500) | (493) | (8) | 1 | 1 | |||||||||||||||||||||
| Expenditures for equipment leased to others | (236) | (9) | (233) | 6 | 1 | |||||||||||||||||||||
| Proceeds from disposals of leased assets and property, plant and equipment | 155 | 5 | 152 | (2) | 1 | |||||||||||||||||||||
| Additions to finance receivables | (3,256) | — | (3,573) | 317 | 2 | |||||||||||||||||||||
| Collections of finance receivables | 3,140 | — | 3,572 | (432) | 2 | |||||||||||||||||||||
| Net intercompany purchased receivables | — | — | (137) | 137 | 2 | |||||||||||||||||||||
| Proceeds from sale of finance receivables | 13 | — | 13 | — | ||||||||||||||||||||||
| Net intercompany borrowings | — | — | 3 | (3) | 3 | |||||||||||||||||||||
| Proceeds from sale of businesses and investments (net of cash sold) | 42 | 42 | — | — | ||||||||||||||||||||||
| Proceeds from maturities and sale of securities | 1,867 | 1,797 | 70 | — | ||||||||||||||||||||||
| Investments in securities | (275) | (148) | (127) | — | ||||||||||||||||||||||
| Other – net | 8 | 31 | (23) | — | ||||||||||||||||||||||
| Net cash provided by (used for) investing activities | 958 | 1,225 | (291) | 24 | ||||||||||||||||||||||
| Cash flow from financing activities: | ||||||||||||||||||||||||||
| Dividends paid | (648) | (648) | — | — | ||||||||||||||||||||||
| Common stock issued, including treasury shares reissued | (8) | (8) | — | — | ||||||||||||||||||||||
| Common shares repurchased | (4,455) | (4,455) | — | — | ||||||||||||||||||||||
| Net intercompany borrowings | — | (3) | — | 3 | 3 | |||||||||||||||||||||
| Proceeds from debt issued (original maturities greater than three months) | 2,731 | — | 2,731 | — | ||||||||||||||||||||||
| Payments on debt (original maturities greater than three months) | (1,570) | (6) | (1,564) | — | ||||||||||||||||||||||
| Short-term borrowings – net (original maturities three months or less) | (1,050) | — | (1,050) | — | ||||||||||||||||||||||
| Net cash provided by (used for) financing activities | (5,000) | (5,120) | 117 | 3 | ||||||||||||||||||||||
| Effect of exchange rate changes on cash | (30) | (20) | (10) | — | ||||||||||||||||||||||
| Increase (decrease) in cash, cash equivalents and restricted cash | (2,020) | (2,144) | 124 | — | ||||||||||||||||||||||
| Cash, cash equivalents and restricted cash at beginning of period | 6,985 | 6,111 | 874 | — | ||||||||||||||||||||||
| Cash, cash equivalents and restricted cash at end of period | $ | 4,965 | $ | 3,967 | $ | 998 | $ | — | ||||||||||||||||||
1 Elimination of non-cash adjustments and changes in assets and liabilities related to consolidated reporting.
2 Reclassification of Financial Products’ cash flow activity from investing to operating for receivables that arose from the sale of inventory.
3 Elimination of net proceeds and payments to/from ME&T and Financial Products.
60
Caterpillar Inc.
Supplemental Data for Cash Flow
For the Three Months Ended March 31, 2023
(Unaudited)
(Millions of dollars)
| Supplemental Consolidating Data | ||||||||||||||||||||||||||
| Consolidated | Machinery, Energy & Transportation | Financial Products | Consolidating Adjustments | |||||||||||||||||||||||
| Cash flow from operating activities: | ||||||||||||||||||||||||||
| Profit of consolidated and affiliated companies | $ | 1,942 | $ | 1,842 | $ | 178 | $ | (78) | 1,5 | |||||||||||||||||
| Adjustments to reconcile profit to net cash provided by operating activities: | ||||||||||||||||||||||||||
| Depreciation and amortization | 532 | 342 | 190 | — | ||||||||||||||||||||||
| Provision (benefit) for deferred income taxes | (191) | (169) | (22) | — | ||||||||||||||||||||||
| (Gain) loss on divestiture | 572 | 572 | — | — | ||||||||||||||||||||||
| Other | 117 | 124 | (143) | 136 | 2 | |||||||||||||||||||||
| Changes in assets and liabilities, net of acquisitions and divestitures: | ||||||||||||||||||||||||||
| Receivables – trade and other | (329) | 205 | 14 | (548) | 2,3 | |||||||||||||||||||||
| Inventories | (1,403) | (1,402) | — | (1) | 2 | |||||||||||||||||||||
| Accounts payable | 477 | 465 | 34 | (22) | 2 | |||||||||||||||||||||
| Accrued expenses | 38 | 6 | 32 | — | ||||||||||||||||||||||
| Accrued wages, salaries and employee benefits | (950) | (928) | (22) | — | ||||||||||||||||||||||
| Customer advances | 365 | 365 | — | — | ||||||||||||||||||||||
| Other assets – net | 107 | 223 | 4 | (120) | 2 | |||||||||||||||||||||
| Other liabilities – net | 296 | 134 | 37 | 125 | 2 | |||||||||||||||||||||
| Net cash provided by (used for) operating activities | 1,573 | 1,779 | 302 | (508) | ||||||||||||||||||||||
| Cash flow from investing activities: | ||||||||||||||||||||||||||
| Capital expenditures – excluding equipment leased to others | (422) | (414) | (9) | 1 | 2 | |||||||||||||||||||||
| Expenditures for equipment leased to others | (328) | — | (330) | 2 | 2 | |||||||||||||||||||||
| Proceeds from disposals of leased assets and property, plant and equipment | 184 | 7 | 179 | (2) | 2 | |||||||||||||||||||||
| Additions to finance receivables | (3,020) | — | (3,462) | 442 | 3 | |||||||||||||||||||||
| Collections of finance receivables | 3,169 | — | 3,437 | (268) | 3 | |||||||||||||||||||||
| Net intercompany purchased receivables | — | — | (258) | 258 | 3 | |||||||||||||||||||||
| Proceeds from sale of finance receivables | 24 | — | 24 | — | ||||||||||||||||||||||
| Net intercompany borrowings | — | — | 2 | (2) | 4 | |||||||||||||||||||||
| Investments and acquisitions (net of cash acquired) | (5) | (5) | — | — | ||||||||||||||||||||||
| Proceeds from sale of businesses and investments (net of cash sold) | (14) | (14) | — | — | ||||||||||||||||||||||
| Proceeds from sale of securities | 239 | 162 | 77 | — | ||||||||||||||||||||||
| Investments in securities | (536) | (433) | (103) | — | ||||||||||||||||||||||
| Other – net | 26 | 27 | (1) | — | ||||||||||||||||||||||
| Net cash provided by (used for) investing activities | (683) | (670) | (444) | 431 | ||||||||||||||||||||||
| Cash flow from financing activities: | ||||||||||||||||||||||||||
| Dividends paid | (620) | (620) | (75) | 75 | 5 | |||||||||||||||||||||
| Common stock issued, including treasury shares reissued | (25) | (25) | — | — | ||||||||||||||||||||||
| Common shares repurchased | (400) | (400) | — | — | ||||||||||||||||||||||
| Net intercompany borrowings | — | (2) | — | 2 | 4 | |||||||||||||||||||||
| Proceeds from debt issued (original maturities greater than three months) | 1,517 | — | 1,517 | — | ||||||||||||||||||||||
| Payments on debt (original maturities greater than three months) | (1,475) | (90) | (1,385) | — | ||||||||||||||||||||||
| Short-term borrowings – net (original maturities three months or less) | (103) | (3) | (100) | — | ||||||||||||||||||||||
| Net cash provided by (used for) financing activities | (1,106) | (1,140) | (43) | 77 | ||||||||||||||||||||||
| Effect of exchange rate changes on cash | (1) | 4 | (5) | — | ||||||||||||||||||||||
| Increase (decrease) in cash, cash equivalents and restricted cash | (217) | (27) | (190) | — | ||||||||||||||||||||||
| Cash, cash equivalents and restricted cash at beginning of period | 7,013 | 6,049 | 964 | — | ||||||||||||||||||||||
| Cash, cash equivalents and restricted cash at end of period | $ | 6,796 | $ | 6,022 | $ | 774 | $ | — | ||||||||||||||||||
1 Elimination of equity profit earned from Financial Products' subsidiaries partially owned by ME&T subsidiaries.
2 Elimination of non-cash adjustments and changes in assets and liabilities related to consolidated reporting.
3 Reclassification of Financial Products’ cash flow activity from investing to operating for receivables that arose from the sale of inventory.
4 Elimination of net proceeds and payments to/from ME&T and Financial Products.
5 Elimination of dividend activity between Financial Products and ME&T.
61
Forward-looking Statements
Certain statements in this Form 10-Q relate to future events and expectations and are forward-looking statements within the meaning of the Private Securities Litigation Reform Act of 1995. Words such as “believe,” “estimate,” “will be,” “will,” “would,” “expect,” “anticipate,” “plan,” “forecast,” “target,” “guide,” “project,” “intend,” “could,” “should” or other similar words or expressions often identify forward-looking statements. All statements other than statements of historical fact are forward-looking statements, including, without limitation, statements regarding our outlook, projections, forecasts or trend descriptions. These statements do not guarantee future performance and speak only as of the date they are made, and we do not undertake to update our forward-looking statements.
Caterpillar’s actual results may differ materially from those described or implied in our forward-looking statements based on a number of factors, including, but not limited to: (i) global and regional economic conditions and economic conditions in the industries we serve; (ii) commodity price changes, material price increases, fluctuations in demand for our products or significant shortages of material; (iii) government monetary or fiscal policies; (iv) political and economic risks, commercial instability and events beyond our control in the countries in which we operate; (v) international trade policies and their impact on demand for our products and our competitive position, including the imposition of new tariffs or changes in existing tariff rates; (vi) our ability to develop, produce and market quality products that meet our customers’ needs; (vii) the impact of the highly competitive environment in which we operate on our sales and pricing; (viii) information technology security threats and computer crime; (ix) inventory management decisions and sourcing practices of our dealers and our OEM customers; (x) a failure to realize, or a delay in realizing, all of the anticipated benefits of our acquisitions, joint ventures or divestitures; (xi) union disputes or other employee relations issues; (xii) adverse effects of unexpected events; (xiii) disruptions or volatility in global financial markets limiting our sources of liquidity or the liquidity of our customers, dealers and suppliers; (xiv) failure to maintain our credit ratings and potential resulting increases to our cost of borrowing and adverse effects on our cost of funds, liquidity, competitive position and access to capital markets; (xv) our Financial Products segment’s risks associated with the financial services industry; (xvi) changes in interest rates or market liquidity conditions; (xvii) an increase in delinquencies, repossessions or net losses of Cat Financial’s customers; (xviii) currency fluctuations; (xix) our or Cat Financial’s compliance with financial and other restrictive covenants in debt agreements; (xx) increased pension plan funding obligations; (xxi) alleged or actual violations of trade or anti-corruption laws and regulations; (xxii) additional tax expense or exposure, including the impact of U.S. tax reform; (xxiii) significant legal proceedings, claims, lawsuits or government investigations; (xxiv) new regulations or changes in financial services regulations; (xxv) compliance with environmental laws and regulations; (xxvi) catastrophic events, including global pandemics such as the COVID-19 pandemic; and (xxvii) other factors described in more detail under the section entitled "Part I - Item 1A. Risk Factors" of Caterpillar's Annual Report on Form 10-K for the fiscal year ended December 31, 2023, as such factors may be updated from time to time in Caterpillar's periodic filings with the Securities and Exchange Commission.
Item 3. Quantitative and Qualitative Disclosures About Market Risk
The information required by this Item is incorporated by reference from Note 5 – “Derivative financial instruments and risk management” included in Part I, Item 1 and Management’s Discussion and Analysis included in Part I, Item 2 of this Form 10-Q.
Item 4. Controls and Procedures
Evaluation of disclosure controls and procedures
An evaluation was performed under the supervision and with the participation of the company’s management, including the Chief Executive Officer (CEO) and Chief Financial Officer (CFO), of the effectiveness of the design and operation of the company’s disclosure controls and procedures, as that term is defined in Rule 13a-15(e) under the Securities Exchange Act of 1934, as amended, as of the end of the period covered by this quarterly report. Based on that evaluation, the CEO and CFO concluded that the company’s disclosure controls and procedures were effective as of the end of the period covered by this quarterly report.
Changes in internal control over financial reporting
During the first quarter of 2024, there has been no change in the company’s internal control over financial reporting that has materially affected, or is reasonably likely to materially affect, the company’s internal control over financial reporting.
62
PART II. OTHER INFORMATION
Item 1. Legal Proceedings
The information required by this Item is incorporated by reference from Note 14 – “Environmental and legal matters” included in Part I, Item 1 of this Form 10-Q.
Item 1A. Risk Factors
There have been no material changes to the risk factors we previously disclosed in our Annual Report on Form 10-K for the year ended December 31, 2023.
Item 2. Unregistered Sales of Equity Securities and Use of Proceeds
Issuer Purchases of Equity Securities
| Period | Total Number of Shares Purchased | Average Price Paid per Share | Total Number of Shares Purchased as Part of Publicly Announced Program | Approximate Dollar Value of Shares that May Yet be Purchased under the Program (in billions)1 | ||||||||||||||||||||||
| January 1-31, 2024 | 1,807,341 | $ | 290.48 | 1,807,341 | $ | 7.300 | ||||||||||||||||||||
| February 1-29, 2024 | 9,087,832 | $ | 317.80 | 9,087,832 | 2 | $ | 3.520 | |||||||||||||||||||
| March 1-31, 2024 | 433,314 | $ | 346.15 | 433,314 | $ | 3.370 | ||||||||||||||||||||
| Total | 11,328,487 | $ | 314.53 | 11,328,487 | ||||||||||||||||||||||
1 In May 2022, the Board approved a share repurchase authorization (the 2022 Authorization) of up to $15.0 billion of Caterpillar common stock effective August 1, 2022, with no expiration. As of March 31, 2024, approximately $3.4 billion remained available under the 2022 Authorization. | ||||||||||||||||||||||||||
2 Includes shares acquired pursuant to the accelerated share repurchase agreements entered into during the fourth quarter of 2023 and first quarter of 2024. | ||||||||||||||||||||||||||
Non-U.S. Employee Stock Purchase Plans
As of March 31, 2024, we had 32 employee stock purchase plans (the “EIP Plans”) that are administered outside the United States for our non-U.S. employees, which had approximately 15,000 active participants in the aggregate. During the first quarter of 2024, approximately 54,000 shares of Caterpillar common stock were purchased by the EIP Plans pursuant to the terms of such plans.
Item 5. Other Information
On February 29, 2024 , Cheryl Johnson , the Company's Chief Human Resources Officer , entered into a Rule 10b5-1 3,016 shares of our common stock have been sold under the plan.
63
Item 6. Exhibits
| 10.1 | ||||||||
| 10.2 | ||||||||
| 10.3 | ||||||||
| 10.4 | ||||||||
| 10.5 | ||||||||
| 31.1 | ||||||||
| 31.2 | ||||||||
| 32 | ||||||||
| 101.INS | Inline XBRL Instance Document (the instance document does not appear in the Interactive Data File because its XBRL tags are embedded within the Inline XBRL document) | |||||||
| 101.SCH | Inline XBRL Taxonomy Extension Schema Document | |||||||
| 101.CAL | Inline XBRL Taxonomy Extension Calculation Linkbase Document | |||||||
| 101.DEF | Inline XBRL Taxonomy Extension Definition Linkbase Document | |||||||
| 101.LAB | Inline XBRL Taxonomy Extension Label Linkbase Document | |||||||
| 101.PRE | Inline XBRL Taxonomy Extension Presentation Linkbase Document | |||||||
| 104 | Cover Page Interactive File (embedded within the Inline XBRL document and included in Exhibit 101) | |||||||
*Management contracts and compensatory plans and arrangements required to be filed as exhibits pursuant to Item 6 of this report.
The agreements and other documents filed as exhibits to this report are not intended to provide factual information or other disclosure other than with respect to the terms of the agreements or other documents themselves, and you should not rely on them for that purpose. In particular, any representations and warranties made by us in these agreements or other documents were made solely within the specific context of the relevant agreement or document and may not describe the actual state of affairs as of the date they were made or at any other time.
64
SIGNATURES
Pursuant to the requirements of the Securities Exchange Act of 1934, the Registrant has duly caused this report to be signed on its behalf by the undersigned thereunto duly authorized.
| CATERPILLAR INC. | ||||||||
| May 1, 2024 | /s/ D. James Umpleby III | Chairman of the Board and Chief Executive Officer | ||||||
| D. James Umpleby III | ||||||||
| May 1, 2024 | /s/ Andrew R.J. Bonfield | Chief Financial Officer | ||||||
| Andrew R.J. Bonfield | ||||||||
| May 1, 2024 | /s/ Derek Owens | Chief Legal Officer and General Counsel | ||||||
| Derek Owens | ||||||||
| May 1, 2024 | /s/ William E. Schaupp | Vice President and Chief Accounting Officer | ||||||
| William E. Schaupp | ||||||||
65