UNITED STATES
SECURITIES AND EXCHANGE COMMISSION
Washington, D.C. 20549
FORM
FOR THE FISCAL YEAR ENDED
Or
FOR THE TRANSITION PERIOD FROM ____________ TO _______________
COMMISSION FILE NO.
(Exact Name of Registrant as Specified in Its Charter)
(State or Other Jurisdiction of Incorporation or Organization) |
|
(I.R.S. Employer Identification No.) |
|
|
|
|
||
(Address of Principal Executive Offices) |
|
(Zip Code) |
Registrant’s telephone number, including area code:
Securities registered pursuant to Section 12(b) of the Act:
Securities registered under Section 12(b) of the Act:
Title of each Class |
|
Trading Symbol(s) |
|
Name of each exchange on which registered |
|
|
|
Securities registered pursuant to Section 12(g) of the Act: None
Indicate by check mark if the registrant is a well-known seasoned issuer, as defined in Rule 405 of the Securities Act.
|
|
Yes ☐ |
Indicate by check mark if the registrant is not required to file reports pursuant to Section 13 or Section 15(d) of the Act.
|
|
Yes ☐ |
Indicate by check mark whether the registrant (1) has filed all reports required to be filed by Section 13 or 15(d) of the Securities Exchange Act of 1934 during the preceding 12 months (or for such shorter period that the registrant was required to file such reports), and (2) has been subject to such filing requirements for the past 90 days.
|
|
|
No ☐ |
Indicate by check mark whether the registrant has submitted electronically every Interactive Data File required to be submitted pursuant to Rule 405 of Regulation S-T (§ 232.405 of this chapter) during the preceding 12 months (or for such shorter period that the registrant was required to submit such files).
|
|
|
No ☐ |
Indicate by check mark whether the registrant is a large accelerated filer, an accelerated filer, a non-accelerated filer, smaller reporting company, or an emerging growth company. See the definitions of “large accelerated filer,” “accelerated filer,” “smaller reporting company,” and "emerging growth company" in Rule 12b-2 of the Exchange Act.
|
|
|
||||
Large accelerated filer |
|
☐ |
|
|
☒ |
|
Non-accelerated filer |
|
☐ |
|
Smaller Reporting Company |
|
|
|
|
|
|
Emerging growth company |
|
|
|
|
|
|
|
|
|
If an emerging growth company, indicate by check mark if the registrant has elected not to use the extended transition period for complying with any new or revised financial accounting standards provided pursuant to Section 13(a) of the Exchange Act. ☐
Indicate by check mark whether the registrant has filed a report on and attestation to its management’s assessment of the effectiveness of its internal control over financial reporting under Section 404(b) of the Sarbanes-Oxley Act (15 U.S.C. 7262(b) by the registered public accounting firm that prepared or issued its audit report.
|
|
Yes |
No ☐ |
If securities are registered pursuant to Section 12(b) of the Act, indicate by check mark whether the financial statements of the registrant included in the filing reflect the correction of an error to previously issued financial statements.
Indicate by check mark whether any of those error corrections are restatements that required a recovery analysis of incentive-based compensation received by any of the registrant’s executive officers during the relevant recovery period pursuant to §240.10D-1(b). ☐
Indicate by check mark whether the registrant is a shell company (as defined in Rule 12b-2 of the Exchange Act).
|
|
Yes |
No ☒ |
The aggregate market value of the 18,663,002 shares of CBL & Associates Properties, Inc.'s common stock, $0.001 par value, held by non-affiliates of the registrant as of June 30, 2023 was $
Indicate by check mark whether the registrant has filed all documents and reports required to be filed by Section 12, 13 or 15(d) of the Securities Exchange Act of 1934 subsequent to the distribution of securities under a plan confirmed by a court.
|
|
Yes |
No ☐ |
As of February 26, 2024,
DOCUMENTS INCORPORATED BY REFERENCE
Portions of CBL & Associates Properties, Inc.’s Proxy Statement for the 2024 Annual Meeting of Shareholders are incorporated by reference in Part III.
TABLE OF CONTENTS
|
||
|
|
|
|
|
Page Number |
|
|
|
1 |
||
|
|
|
|
||
|
|
|
1. |
2 |
|
1A. |
7 |
|
1B. |
28 |
|
1C. |
28 |
|
2. |
29 |
|
3. |
42 |
|
4. |
42 |
|
|
|
|
|
||
|
|
|
5. |
43 |
|
6. |
44 |
|
7. |
Management’s Discussion and Analysis of Financial Condition and Results of Operations |
45 |
7A. |
63 |
|
8. |
63 |
|
9. |
Changes in and Disagreements With Accountants on Accounting and Financial Disclosure |
63 |
9A. |
63 |
|
9B. |
66 |
|
9C. |
Disclosure Regarding Foreign Jurisdictions that Prevent Inspections |
66 |
|
|
|
|
||
|
|
|
10. |
67 |
|
11. |
67 |
|
12. |
Security Ownership of Certain Beneficial Owners and Management and Related Stockholder Matters |
67 |
13. |
Certain Relationships and Related Transactions, and Director Independence |
67 |
14. |
67 |
|
|
|
|
|
||
|
|
|
15. |
68 |
|
16. |
68 |
|
125 |
||
130 |
||
Cautionary Statement Regarding Forward-Looking Statements
Certain statements included or incorporated by reference in this Annual Report on Form 10-K may be deemed “forward looking statements” within the meaning of the federal securities laws. All statements other than statements of historical fact should be considered to be forward-looking statements. In many cases, these forward looking statements may be identified by the use of words such as “will,” “may,” “should,” “could,” “believes,” “expects,” “anticipates,” “estimates,” “intends,” “projects,” “goals,” “objectives,” “targets,” “predicts,” “plans,” “seeks,” and variations of these words and similar expressions. Any forward-looking statement speaks only as of the date on which it is made and is qualified in its entirety by reference to the factors discussed throughout this report.
Although we believe the expectations reflected in any forward-looking statements are based on reasonable assumptions, forward-looking statements are not guarantees of future performance or results and we can give no assurance that these expectations will be attained. It is possible that actual results may differ materially from those indicated by these forward-looking statements due to a variety of known and unknown risks and uncertainties. In addition to the risk factors discussed in Part I, Item 1A of this report, and those factors noted above, such known risks and uncertainties include, without limitation:
This list of risks and uncertainties is only a summary and is not intended to be exhaustive. We disclaim any obligation to update or revise any forward-looking statements to reflect actual results or changes in the factors affecting the forward-looking information.
1
PART I
ITEM 1. BUSINESS
This Annual Report on Form 10-K (this "Annual Report") is being filed by CBL & Associates Properties, Inc. (the "Company," "CBL," "we," "us" and "our"), a Delaware corporation. As described below, we refer to the post-emergence reorganized company as the “Successor” and the pre-emergence company as the “Predecessor.” Unless stated otherwise or the context otherwise requires, references to the “Company,” “we,” “us” and “our” also includes our subsidiaries.
The Company’s Business
We are a self-managed, self-administered, fully integrated real estate investment trust ("REIT"). We own, develop, acquire, lease, manage, and operate regional shopping malls, outlet centers, lifestyle centers, open-air centers and other properties. Our properties are located in 22 states, but are primarily in the southeastern and midwestern United States. We have elected to be taxed as a REIT for federal income tax purposes.
We conduct substantially all our business through CBL & Associates Limited Partnership (the "Operating Partnership"), which is a variable interest entity ("VIE"). We are the 100% owner of two qualified REIT subsidiaries, CBL Holdings I, Inc. and CBL Holdings II, Inc. CBL Holdings I, Inc. is the sole general partner of the Operating Partnership. At December 31, 2023, CBL Holdings I, Inc. owned a 1.0% general partner interest and CBL Holdings II, Inc. owned an 98.98% limited partner interest in the Operating Partnership, for a combined interest held by us of 99.98%. As of December 31, 2023, third parties owned a 0.02% limited partner interest in the Operating Partnership.
See Note 1 to the consolidated financial statements for information on our properties as of December 31, 2023. Our malls, lifestyle centers and outlet centers (the “Malls”) and our open-air centers and other property types (the "All Other" or "All Other Properties") are collectively referred to as the “properties” and individually as a “property.” The "other" property type is made up of office buildings, outparcels and hotels.
We conduct our property management and development activities through CBL & Associates Management, Inc. (the "Management Company") to comply with certain requirements of the Internal Revenue Code of 1986, as amended (the "Internal Revenue Code"). The Operating Partnership owns 100% of the Management Company’s outstanding stock.
Rental revenues are primarily derived from leases with retail tenants and generally include fixed minimum rents, percentage rents based on tenants’ sales volumes and reimbursements from tenants for expenditures related to real estate taxes, insurance, common area maintenance ("CAM") and other recoverable operating expenses, as well as certain capital expenditures. We also generate revenues from management, leasing and development fees, sponsorships, sales of peripheral land at our properties and from sales of operating real estate assets when it is determined that we can realize an appropriate value for the assets. Proceeds from such sales are generally used to retire related indebtedness, reduce outstanding balances on our indebtedness and for general corporate purposes.
The following terms used in this Annual Report on Form 10-K will have the meanings described below:
2
Significant Markets and Tenants
Top Five Markets
Our top five markets, based on percentage of total revenues, were as follows for the year ended December 31, 2023:
Market |
|
Percentage of |
|
|
St. Louis, MO |
|
|
6.8 |
% |
Chattanooga, TN |
|
|
4.6 |
% |
Laredo, TX |
|
|
4.3 |
% |
Lexington, KY |
|
|
4.2 |
% |
Greensboro, NC |
|
|
3.8 |
% |
Top 25 Tenants
Our top 25 tenants based on percentage of total revenues were as follows for the year ended December 31, 2023:
|
|
Tenant |
|
Number of |
|
|
Square |
|
|
Percentage |
|
|||
1 |
|
Signet Jewelers Ltd. (2) |
|
|
108 |
|
|
|
164,271 |
|
|
|
2.73 |
% |
2 |
|
Victoria's Secret & Co. |
|
|
49 |
|
|
|
400,863 |
|
|
|
2.71 |
% |
3 |
|
Foot Locker, Inc. |
|
|
73 |
|
|
|
357,594 |
|
|
|
2.35 |
% |
4 |
|
Dick's Sporting Goods, Inc. (3) |
|
|
25 |
|
|
|
1,462,150 |
|
|
|
2.32 |
% |
5 |
|
American Eagle Outfitters, Inc. |
|
|
63 |
|
|
|
382,073 |
|
|
|
2.16 |
% |
6 |
|
Bath & Body Works, Inc. |
|
|
58 |
|
|
|
239,031 |
|
|
|
1.95 |
% |
7 |
|
Finish Line, Inc. |
|
|
38 |
|
|
|
210,745 |
|
|
|
1.61 |
% |
8 |
|
Genesco Inc. (4) |
|
|
76 |
|
|
|
152,215 |
|
|
|
1.54 |
% |
9 |
|
The Buckle, Inc. |
|
|
36 |
|
|
|
186,133 |
|
|
|
1.24 |
% |
10 |
|
Luxottica Group S.P.A. (5) |
|
|
79 |
|
|
|
178,795 |
|
|
|
1.22 |
% |
11 |
|
The Gap, Inc. |
|
|
44 |
|
|
|
537,209 |
|
|
|
1.19 |
% |
12 |
|
Cinemark Corp. |
|
|
9 |
|
|
|
467,190 |
|
|
|
1.17 |
% |
13 |
|
Hot Topic, Inc. |
|
|
100 |
|
|
|
249,881 |
|
|
|
1.04 |
% |
14 |
|
Shoe Show, Inc. |
|
|
29 |
|
|
|
379,954 |
|
|
|
0.94 |
% |
15 |
|
Spencer Spirit Holdings, Inc. |
|
|
48 |
|
|
|
112,483 |
|
|
|
0.91 |
% |
16 |
|
Claire's Stores, Inc. |
|
|
69 |
|
|
|
86,502 |
|
|
|
0.91 |
% |
17 |
|
The TJX Companies, Inc. (6) |
|
|
18 |
|
|
|
520,475 |
|
|
|
0.90 |
% |
18 |
|
Express Fashions |
|
|
30 |
|
|
|
246,437 |
|
|
|
0.89 |
% |
19 |
|
Barnes & Noble, Inc. |
|
|
16 |
|
|
|
457,337 |
|
|
|
0.84 |
% |
20 |
|
H & M Hennes & Mauritz AB |
|
|
38 |
|
|
|
803,797 |
|
|
|
0.81 |
% |
21 |
|
Ulta Salon, Cosmetics & Fragrance, Inc. |
|
|
23 |
|
|
|
237,961 |
|
|
|
0.75 |
% |
22 |
|
The Children's Place, Inc. |
|
|
34 |
|
|
|
147,763 |
|
|
|
0.73 |
% |
23 |
|
Focus Brands LLC (7) |
|
|
66 |
|
|
|
47,095 |
|
|
|
0.72 |
% |
24 |
|
Abercrombie & Fitch, Co. |
|
|
28 |
|
|
|
189,942 |
|
|
|
0.71 |
% |
25 |
|
Chick-fil-A, Inc. |
|
|
27 |
|
|
|
54,895 |
|
|
|
0.64 |
% |
|
|
|
|
|
1,184 |
|
|
|
8,272,791 |
|
|
|
33.02 |
% |
3
Operating Strategy
We operate a diverse portfolio of dynamic properties including enclosed regional malls, outlet centers, lifestyle centers and open-air centers. Our locations are in strong mid-tier markets with a focus in the growing southeast and midwest. Approximately 30% of our 2023 same-center net operating income ("NOI") was generated by non-enclosed mall assets. Our primary objective is to operate our portfolio to maximize the long-term value of our company by generating increasing levels of NOI and improving free cash flow through a variety of methods as further discussed below.
NOI is a non-GAAP measure. For a description of NOI, a reconciliation from net income (loss) to NOI, and an explanation of why we believe this is a useful performance measure, see Non-GAAP Measure – Same-center Net Operating Income in “Results of Operations.”
Internal Growth
We look to generate internal growth through a variety of strategies. We incorporate contractual rent increases in our leases and negotiate increases in rental rates as leases mature, when possible. We aggressively pursue new tenants to maintain and grow occupancy, enhance our tenant mix to meet changing consumer demand and improve the credit quality of our tenant base. We actively manage our properties including a focus on controlling operating expenses with a goal of maintaining or improving operating margins and enhancing cash flows, while providing a high-quality customer experience. We pursue opportunities to generate ancillary revenues at our properties when space is available for shorter terms through temporary leases and license agreements, as well as advertising including sponsorships and promotional activities. These programs allow us to maximize revenues in our centers during downtime between permanent leases, as well as monetize other aspects of the property.
Asset Densification
Our strategy of owning a diverse portfolio of dynamic properties in strong mid-tier markets has served the company well as CBL’s dominant locations generate significant demand from retail and non-retail users alike. We actively evaluate unused parking fields and available land for primarily non-retail densification projects, which provides us with the opportunity to capitalize on the embedded equity value of our land and increase the overall value of our properties. We believe the addition of non-retail users drives new and additional traffic and sales to our centers, which may preserve or enhance their dominant position in the market.
Through redevelopment we capitalize on opportunities to increase the productivity of previously occupied space and enhance the overall value of the centers by re-tenanting and/or changing the use of the space, as well as aesthetic upgrades. Redevelopments may result from acquiring or regaining possession of Anchor space (such as former department stores) and re-leasing to a single user, subdividing it into multiple spaces or razing the building for new development. When evaluating a redevelopment project, we review the stand-alone cost and returns, terminal value and co-tenancy, as well as the impact that the project and new tenant(s) is expected to have on the rest of the property including the aesthetic impact and improvements to traffic, sales and leasing demand.
See Liquidity and Capital Resources section in Item 7 of this Annual Report for information on the projects completed during 2023 and under construction at December 31, 2023.
Active Portfolio Management and Asset Recycling
We actively manage our asset base with the goal of enhancing the overall quality and value of our portfolio. We regularly review our portfolio to identify assets that no longer fit our strategy or where we believe it appropriate to redeploy resources into investments with higher growth or higher return opportunities. We also selectively acquire properties, including available anchors or parcels, we believe will provide resilient cash flows or that can appreciate in value by increasing NOI through our redevelopment, leasing and management expertise.
Balance Sheet Strategy
Our balance sheet strategy is focused on reducing overall debt, extending our debt maturity schedule, limiting exposure to recourse loans and lowering our overall cost of borrowings to limit maturity risk, improve free cash flow and enhance enterprise value.
We also pursue opportunities to improve the terms of our secured property-level, mortgage loans including refinancing loans at lower interest rates and longer-term maturities. We are exploring refinancing opportunities in the open lending market, as appropriate, in addition to working with our current lenders toward favorable modifications of existing loans.
4
Environmental, Social and Governance (ESG)/Green Building Practices
CBL’s ESG efforts are led by the ESG Steering Committee, a dedicated leadership committee that focuses on ESG factors including Sustainability, Social Governance and Corporate Governance as well as reporting to CBL’s board of directors, on our website and in public filings. The members that make up this committee represent various departments within CBL, such as Management, Investor Relations, People & Culture, Public Relations and Operations Services with day-to-day efforts led by our Vice President - ESG. The Nominating/Corporate Governance Committee of CBL's board of directors is responsible for oversight of the Company’s ESG efforts. Part of our efforts includes regularly reviewing existing policies and procedures to incorporate current best practices and working to ensure compliance with new regulations including related reporting and disclosures. More information on our sustainability, diversity, equity, inclusion and belonging ("DEIB"), social responsibility and community involvement initiatives is available in the Human Capital section below and on dedicated web pages at cblproperties.com/esg-commitment/overview. The information on our web site is not, and should not be considered, a part of this Form 10-K.
Environmental Matters
A discussion of the current effects and potential impacts on our business and properties of compliance with federal, state and local environmental regulations is presented in Item 1A of this Annual Report on Form 10-K under the subheading “Risks Related to Real Estate Investments and Our Business.”
Competition
Our properties compete with various shopping facilities in attracting retailers to lease space. In addition, retailers at our properties face competition from online shopping alternatives, discount shopping centers, outlet centers, wholesale clubs, direct mail, television shopping networks and other retail shopping developments. The extent of the retail and non-retail competition varies from market to market. We work aggressively to attract customers through marketing promotions and social media campaigns. Many of our retailers have adopted an omni-channel approach which leverages sales through both digital and traditional retailing channels.
Seasonality
The shopping center business is, to some extent, seasonal in nature with tenants typically achieving the highest levels of sales during the fourth quarter due to the holiday season, which generally results in higher percentage rent income in the fourth quarter. Additionally, the Malls earn most of their “temporary” rents (rents from short-term tenants) during the holiday period. Thus, occupancy levels and revenues are generally the highest in the fourth quarter of each year. Results of operations realized in any one quarter may not be indicative of the results likely to be experienced over the course of our fiscal year.
Emergence from Bankruptcy
Beginning on November 1, 2020, CBL and the Operating Partnership, together with certain of its direct and indirect subsidiaries (collectively, the “Debtors”), filed voluntary petitions (the “Chapter 11 Cases”) under chapter 11 of title 11 (“Chapter 11”) of the United States Code (the “Bankruptcy Code”) in the United States Bankruptcy Court for the Southern District of Texas (the “Bankruptcy Court”). The Bankruptcy Court authorized the Debtors to continue to operate their businesses and manage their properties as debtors-in-possession pursuant to the Bankruptcy Code. The Chapter 11 Cases are being jointly administered for procedural purposes only under the caption In re CBL & Associates Properties, Inc., et al., Case No. 20-35226.
In connection with the Chapter 11 Cases, on August 11, 2021, the Bankruptcy Court entered an order, Docket No.1397 (Confirmation Order), confirming the Debtors’ Third Amended Joint Chapter 11 Plan of CBL & Associates Properties, Inc. and its Affiliated Debtors (With Technical Modifications) (as modified at Docket No. 1521, the “Plan”).
On November 1, 2021 (the “Effective Date”), the conditions to effectiveness of the Plan were satisfied and the Debtors emerged from the Chapter 11 Cases. The Company filed a notice of the Effective Date of the Plan with the Bankruptcy Court on November 1, 2021.
Equity
Common Stock
Our authorized common stock consists of 200,000,000 shares at $0.001 par value per share. We had 31,975,645 shares of common stock issued and outstanding as of December 31, 2023. In connection with the Company's emergence from Chapter 11 reorganization on the Effective Date, all equity interests of the Company issued and outstanding immediately prior to the Effective Date were deemed cancelled, discharged and of no force or effect.
5
Preferred Stock
Our authorized preferred stock consists of 15,000,000 shares at $0.001 par value per share. No shares of preferred stock were issued and outstanding as of December 31, 2023.
Financial Information about Segments
See Note 11 to the consolidated financial statements for information about our reportable segments.
Human Capital
We believe our people are critical to the success of our company. We are committed to providing a work environment that attracts, develops, and retains high-performing team members and to promoting a culture that allows each team member to feel respected, included and empowered. We engage with our employees regularly and in 2023 completed an employee engagement assessment. The survey netted a 77% response rate and secured CBL Great Place to Work Certification™, with 95% of employees saying it is a great place to work.
CBL does not have any employees other than its statutory officers. As of December 31, 2023, our Management Company had 396 full-time and 73 part-time employees that represented the following demographics:
CBL benefits from low voluntary turnover, which remained at 8% year-over-year. 80% of employees who left voluntarily completed our exit interview process with 100% stating they would recommend working at CBL to family and friends. While we support freedom of association, we enjoy direct relationships as none of our employees are represented by a union.
To attract, retain and develop our high-performing team members, we offer compensation programs that include a mix of salaries, variable incentive bonuses and equity-based awards. To help ensure pay for performance alignment, CBL team members and their direct managers participate in an annual performance evaluation process. The evaluation process includes interactive goal setting and feedback designed to enhance performance, engagement, and professional development. Annually, we conduct a compensation analysis to ensure any pay gaps (gender, race) are reviewed and addressed. Our compensation programs are supplemented by comprehensive employment benefits as well as training and educational programs. Certain benefits are also available to part-time CBL team members.
We provide our team with learning and development opportunities including conferences, leadership programs, and other ad hoc training programs. Programs cover a variety of topics such as career development and skills training; health, well-being, and safety; DEIB; and more. We also mandate annual cybersecurity training and ethics training for all full-time employees. In 2023, CBL team members completed 6,885 hours of training.
We continued our outreach efforts in recruiting through several partnerships including:
We have long maintained several employee-led programs, including CBL Community, CBL Cares, CBL Fit and CBL Social.
CBL Community is focused on initiatives that emphasize the importance and focus we place on people, the driving force behind CBL. CBL Community is pursuing internal and external endeavors to improve organizational impacts on DEIB, through education, engagement initiatives, and the creation of opportunities and partnerships with underrepresented groups. To help us identify the best approach to support these efforts, we continued to engage a third-party consulting firm that specializes in inclusive leadership practices. In 2023 CBL Community continued its Fireside Chats program, which allows team members to learn about various DEIB topics from their peers as well as subject matter experts. A strong focus in 2023 was on the mental wellbeing of our workforce. Finally, the entire CBL team participated in unconscious bias training in the first quarter of 2023.
6
CBL Cares partners with and supports local charitable organizations that contribute to the growth and development of the communities we serve. In 2023 we increased the number of hours CBL team members volunteer through our CBL Cares volunteer program, with team members volunteering 947 hours with non-profit organizations, an increase over 2022. In total, through volunteer hours, corporate donations and CBL Cares funds, we provided support valued at nearly $200,000 to organizations across our portfolio that work to meet the diverse needs of our communities. Lastly, through our annual United Way workplace campaign, our team contributed more than $117,500 to United Way.
CBL Fit provides advocacy of wellness for the whole person at work and CBL Social provides engagement opportunities and interconnectivity through team-based events.
Corporate Offices
Our principal executive offices are located at CBL Center, 2030 Hamilton Place Boulevard, Suite 500, Chattanooga, Tennessee, 37421 and our telephone number is (423) 855-0001.
Available Information
There is additional information about us on our web site at cblproperties.com. Electronic copies of our Annual Report on Form 10-K, quarterly reports on Form 10-Q and current reports on Form 8-K, as well as any amendments to those reports, are available free of charge by visiting the “Investor Relations” section of our web site. These reports are posted as soon as reasonably practical after they are electronically filed with, or furnished to, the SEC. The information on our web site is not, and should not be considered, a part of this Form 10-K.
ITEM 1A. RISK FACTORS
Set forth below are certain factors that may adversely affect our business, financial condition, results of operations and cash flows. Any one or more of the following factors may cause our actual results for various financial reporting periods to differ materially from those expressed in any forward-looking statements made by us, or on our behalf. See “Cautionary Statement Regarding Forward-Looking Statements” contained herein on page 1.
RISK FACTOR SUMMARY
The following is a summary of the most significant risks relating to our business activities that we have identified. If any of these risks occur, our business, financial condition or results of operation, including our ability to generate cash and make distributions, could be materially adversely affected. For a more complete understanding of our material risk factors, this summary should be read in conjunction with the detailed description of our risk factors which follows this summary.
Risks Related to Real Estate Investments and Our Business
7
Risks Related to Debt and Financial Markets
Risks Related to Dividends and Our Stock
Risks Related to Geographic Concentrations
Risks Related to Federal Income Tax Laws
8
Risks Related to Our Organizational Structure
RISKS RELATED TO REAL ESTATE INVESTMENTS AND OUR BUSINESS
Real property investments are subject to various risks, many of which are beyond our control, which could cause declines in the operating revenues and/or the underlying value of one or more of our properties.
A number of factors may decrease the income generated by a retail shopping center property, including:
In addition, other factors may adversely affect the value of our properties without affecting their current revenues, including:
9
Illiquidity of real estate investments could significantly affect our ability to respond to adverse changes in the performance of our properties and harm our financial condition.
Substantially all our consolidated assets consist of investments in real estate properties. Because real estate investments are relatively illiquid, our ability to quickly sell one or more properties in our portfolio in response to changing economic, financial and investment conditions is limited. The real estate market is affected by many factors, such as general economic conditions, availability of financing, interest rates and other factors, including supply and demand for space, that are beyond our control. We cannot predict whether we will be able to sell any property for the price or on the terms we set, or whether any price or other terms offered by a prospective purchaser would be acceptable to us. We also cannot predict the length of time needed to find a willing purchaser and to close the sale of a property. In addition, current economic and capital market conditions might make it more difficult for us to sell properties or might adversely affect the price we receive for properties that we do sell, as prospective buyers might experience increased costs of debt financing or other difficulties in obtaining debt financing.
Moreover, there are some limitations under federal income tax laws applicable to REITs that limit our ability to sell assets. In addition, because many of our properties are mortgaged to secure our debts, we may not be able to obtain a release of a lien on a mortgaged property without the payment of the associated debt or release price, and/or a substantial prepayment penalty, or transfer of debt to a buyer, which restricts our ability to dispose of a property, even though the sale might otherwise be desirable. Furthermore, the number of prospective buyers interested in purchasing shopping centers is limited. Therefore, if we want to sell one or more of our properties, we may not be able to dispose of it in the desired time period and may receive less consideration than we originally invested in the property.
Before a property can be sold, we may be required to make expenditures to correct defects or to make improvements. We cannot assure you that we will have funds available to correct those defects or to make those improvements, and if we cannot do so, we might not be able to sell the property, or might be required to sell the property on unfavorable terms. In acquiring a property, we might agree to provisions that materially restrict us from selling that property for a period of time or impose other restrictions, such as limitations on the amount of debt that can be placed or repaid on that property. These factors and any others that would impede our ability to respond to adverse changes in the performance of our properties could adversely affect our financial condition and results of operations.
We may elect not to proceed with certain developments, redevelopments or expansion projects once they have been undertaken, resulting in charges that could have a material adverse effect on our results of operations for the period in which the charge is taken.
We will incur various risks in connection with any developments, redevelopments or property expansions, including the risk that developments, redevelopments or expansion opportunities explored by us may be abandoned for various reasons including, but not limited to, credit disruptions that require the Company to conserve its cash until the capital markets stabilize or alternative credit or funding arrangements can be made. Developments, redevelopments or expansions also include the risk that construction costs of a project may exceed original estimates, possibly making the project unprofitable. Other risks include the risk that we may not be able to refinance construction loans which are generally with full recourse to us, the risk that occupancy rates and rents at a completed project will not meet projections and will be insufficient to make the project profitable, and the risk that we will not be able to obtain Anchor, mortgage lender and property partner approvals for certain expansion activities.
When we elect not to proceed with a development opportunity, the development costs ordinarily are charged against income for the then-current period. Any such charge could have a material adverse effect on our results of operations for the period in which the charge is taken.
Certain of our properties are subject to ownership interests held by third parties, whose interests may conflict with ours and thereby constrain us from taking actions concerning these properties which otherwise would be in the best interests of the Company and our stockholders.
We own partial interests in 7 malls, 5 outlet centers, 1 lifestyle center, 12 open-air centers, 2 office buildings, a hotel and a hotel development. Of those interests, 2 malls, 3 outlet centers, 3 open-air centers, a hotel and a hotel development are all owned by unconsolidated joint ventures and are managed by a property manager that is affiliated with the third-party partner, which receives a fee for its services. The third-party partner of each of these properties controls the cash flow distributions, although our approval is required for certain major decisions. We have interests in two outlet centers that are owned by consolidated joint ventures and managed by a property manager that is affiliated with the third-party partner, which receives a fee for its services.
10
Where we serve as managing general partner (or equivalent) of the entities that own our properties, we may have certain fiduciary responsibilities to the other owners of those entities. In certain cases, the approval or consent of the other owners is required before we may sell, finance, expand or make other significant changes in the operations of such properties. To the extent such approvals or consents are required, we may experience difficulty in, or may be prevented from, implementing our plans with respect to expansion, development, financing or other similar transactions with respect to such properties.
With respect to those properties for which we do not serve as managing general partner (or equivalent), we do not have day-to-day operational control or control over certain major decisions, including leasing and the timing and amount of distributions, which could result in decisions by the managing entity that do not fully reflect our interests. This includes decisions relating to the requirements that we must satisfy in order to maintain our status as a REIT for tax purposes. However, decisions relating to sales, expansion and disposition of all or substantially all of the assets and financings are subject to approval by the Operating Partnership.
Inflation has impacted and may continue to impact our financial condition and results of operations.
Inflationary pressures pose risks to the Company’s business, tenants and the U.S. economy. Inflationary price increases could have an adverse effect on consumer spending, which could impact our tenants’ sales and, in turn, our tenants’ business operations. This could affect our tenants’ ability to pay rent and, to the extent their leases provide for additional rent based on a percentage of sales, could have either positive (based on increased prices) or negative (based on decreased consumer spending) effects on such rent. Also, inflation has caused increases in operating expenses, which could increase occupancy costs for tenants and, to the extent that we are unable to recover operating expenses from tenants, could increase operating expenses for us. In addition, if the rate of inflation exceeds the scheduled rent increases included in our leases, then our net operating income and our profitability would decrease. Further, inflationary pricing may have a negative effect on the construction costs necessary to complete our development and redevelopment projects, including, but not limited to, costs of construction materials, labor and services from third-party contractors and suppliers. Inflation also has resulted in increases in market interest rates, which not only negatively impact consumer spending and tenant investment decisions, but also increases the borrowing costs associated with our existing or any future variable-rate debt, to the extent such rates are not effectively hedged or fixed, or any future debt that we incur. Inflation might also inhibit our ability to obtain new financing or refinancing.
Increased operating expenses, decreased occupancy rates, tenants converting to gross leases and requesting deferrals and rent abatements may not allow us to recover the majority of our CAM, real estate taxes and other operating expenses from our tenants, which could adversely affect our financial position, results of operations and funds available for future distributions.
Energy costs, repairs, maintenance and capital improvements to common areas of our properties, janitorial services, administrative, property and liability insurance costs and security costs are typically allocable to our properties’ tenants. Our lease agreements typically provide that the tenant is responsible for a portion of the CAM and other operating expenses. The majority of our current leases require an equal periodic tenant reimbursement amount for our cost recoveries, which serves to fix our tenants’ CAM contributions to us. In these cases, a tenant will pay a fixed amount, or a set expense reimbursement amount, subject to annual increases, regardless of the actual amount of operating expenses. The tenant’s payment remains the same regardless of whether operating expenses increase or decrease, causing us to be responsible for any excess amounts or to benefit from any declines. As a result, the CAM and tenant reimbursements that we receive may or may not allow us to recover a substantial portion of these operating costs.
There is also a trend of more tenants moving to gross leases with periodic increases, which provide that the tenant pays a single specified amount, with no additional payments for reimbursements of the tenant’s portion of operating expenses. As a result, we are responsible for any increases in operating expenses, and benefit from any decreases in operating expenses.
Additionally, in the event that our properties are not fully occupied, we would be required to pay the portion of any operating, redevelopment or renovation expenses allocable to the vacant space(s) that would otherwise typically be paid by the residing tenant(s).
11
Bankruptcy of joint venture partners could impose delays and costs on us with respect to the jointly owned retail properties.
In addition to the possible effects on our joint ventures of our having gone through the bankruptcy process, the bankruptcy of one of the other investors in any of our jointly owned shopping centers could materially and adversely affect the relevant property or properties. Under the bankruptcy laws, we would be precluded from taking some actions affecting the estate of the other investor without prior approval of the bankruptcy court, which would, in most cases, entail prior notice to other parties and a hearing in the bankruptcy court. At a minimum, the requirement to obtain court approval may delay the actions we would or might want to take. If the relevant joint venture through which we have invested in a property has incurred recourse obligations, the discharge in bankruptcy of one of the other investors might result in our ultimate liability for a greater portion of those obligations than we would otherwise bear.
We may be unable to lease space in our properties on favorable terms, or at all.
Our results of operations depend on our ability to continue to lease space in our properties, including vacant space and re-leasing space in properties where leases are expiring, optimizing our tenant mix, or leasing properties on economically favorable terms. Because we have leases expiring annually, we are continually focused on leasing our properties. Similarly, we are pursuing a strategy of replacing expiring short-term leases with long-term leases. For more information on lease expirations see Mall, Lifestyle Center and Outlet Center Lease Expirations and All Other Properties Lease Expirations.
There can be no assurance that our leases will be renewed or that vacant space will be re-leased at rates equal to or above the current average net effective rental rates or that substantial rent abatements, tenant improvements, early termination rights or below market renewal options will not be offered to attract new tenants or retain existing tenants. If the rental rates decrease, if our existing tenants do not renew their leases or if we do not re-lease a significant portion of our available space and space for which leases will expire, our financial condition and results of operations could be adversely affected.
We face possible risks associated with climate change.
We may become subject to laws or regulations related to climate change, which could cause our business, results of operations and financial condition to be impacted adversely. The federal government has enacted, and some of the states and localities in which we operate may enact, certain climate change laws and regulations or have begun regulating carbon footprints and greenhouse gas emissions. Although these laws and regulations have not had any known material adverse effects on our business to date, they could result in substantial costs, including compliance costs, increased energy costs, retrofit costs and construction costs, including monitoring and reporting costs, and capital expenditures for environmental control facilities and other new equipment. We have implemented strategies to support our continued effort to reduce energy and water consumption, greenhouse gas emissions and waste production across our portfolio. We cannot predict how future laws and regulations, or future interpretations of current laws and regulations, related to climate change will affect our business, results of operations and financial condition. Additionally, the potential physical impacts of climate change on our operations are highly uncertain, and would be particular to the geographic circumstances in areas in which we operate. These may include changes to global weather patterns, which could include local changes in rainfall and storm patterns and intensities, water shortages, changing sea levels and changing temperature averages or extremes. These impacts may adversely affect our properties, our business, financial condition and results of operations.
An increased focus on metrics and reporting related to ESG factors, may impose additional costs and expose us to new risks.
Investors and other stakeholders have become more focused on understanding how companies address a variety of ESG factors. As they evaluate investment decisions, many investors look not only at company disclosures but also to ESG rating systems that have been developed by third parties to allow ESG comparisons among companies. Although we participate in a number of these ratings systems, we do not participate in all such systems. The criteria used in these ratings systems may conflict and change frequently, and we cannot predict how these third parties will score us, nor can we have any assurance that they score us accurately or other companies accurately or that other companies have provided them with accurate data. We supplement our participation in ratings systems with published disclosures of our ESG activities, but some investors may desire other disclosures that we do not provide. In addition, the SEC is currently evaluating potential rule making that could mandate additional ESG disclosure and impose other requirements on us. Failure to participate in certain of the third-party ratings systems, failure to score well in those ratings systems or failure to provide certain ESG disclosures could result in reputational harm when investors compare us to other companies, and could cause certain investors to be unwilling to invest in our stock which could adversely impact our stock price.
12
We may incur significant costs related to compliance with environmental laws, which could have a material adverse effect on our results of operations, cash flows and the funds available to us to pay dividends.
Under various federal, state and local laws, ordinances and regulations, a current or previous owner or operator of real estate may be liable for the costs of removal or remediation of petroleum, certain hazardous or toxic substances on, under or in such real estate. Such laws typically impose such liability without regard to whether the owner or operator knew of, or was responsible for, the presence of such substances. The costs of remediation or removal of such substances may be substantial. The presence of such substances, or the failure to promptly remove or remediate such substances, may adversely affect the owner’s or operator’s ability to lease or sell such real estate or to borrow using such real estate as collateral. Persons who arrange for the disposal or treatment of hazardous or toxic substances may also be liable for the costs of removal or remediation of such substances at the disposal or treatment facility, regardless of whether such facility is owned or operated by such person. Certain laws also impose requirements on conditions and activities that may affect the environment or the impact of the environment on human health. Failure to comply with such requirements could result in the imposition of monetary penalties (in addition to the costs to achieve compliance) and potential liabilities to third parties. Among other things, certain laws require abatement or removal of friable and certain non-friable asbestos-containing materials in the event of demolition or certain renovations or remodeling. Certain laws regarding asbestos-containing materials require building owners and lessees, among other things, to notify and train certain employees working in areas known or presumed to contain asbestos-containing materials. Certain laws also impose liability for release of asbestos-containing materials into the air and third parties may seek recovery from owners or operators of real properties for personal injury or property damage associated with asbestos-containing materials. In connection with the ownership and operation of properties, we may be potentially liable for all or a portion of such costs or claims.
All our properties (but not properties for which we hold an option to purchase but do not yet own) have been subject to Phase I environmental assessments or updates of existing Phase I environmental assessments. Such assessments generally consisted of a visual inspection of the properties, review of federal and state environmental databases and certain information regarding historic uses of the property and adjacent areas and the preparation and issuance of written reports. Some of our properties contain, or contained, underground storage tanks used for storing petroleum products or wastes typically associated with automobile service or other operations conducted at our properties. Certain of our properties contain, or contained, dry-cleaning establishments utilizing solvents. Where believed to be warranted, samplings of building materials or subsurface investigations were undertaken. At certain of our properties, where warranted by the conditions, we have developed and implemented an operations and maintenance program that establishes operating procedures with respect to asbestos-containing materials. The cost associated with the development and implementation of such programs was not material. We have also obtained environmental insurance coverage at certain of our properties.
We believe that our properties are in compliance in all material respects with all federal, state and local ordinances and regulations regarding the handling, discharge and emission of hazardous or toxic substances. As of December 31, 2023, we have recorded in our consolidated financial statements a liability of $2.5 million related to potential future asbestos abatement activities at our properties which are not expected to have a material impact on our financial condition or results of operations. We have not been notified by any governmental authority, and are not otherwise aware, of any material noncompliance, liability or claim relating to hazardous or toxic substances in connection with any of our present or former properties. Therefore, we have not recorded any liability related to hazardous or toxic substances. Nevertheless, it is possible that the environmental assessments available to us do not reveal all potential environmental liabilities. It is also possible that subsequent investigations will identify material contamination, that adverse environmental conditions have arisen subsequent to the performance of the environmental assessments, or that there are material environmental liabilities of which management is unaware. Moreover, no assurances can be given that (i) future laws, ordinances or regulations will not impose any material environmental liability or (ii) the current environmental condition of our properties has not been or will not be affected by tenants and occupants of our properties, by the condition of properties in the vicinity of our properties or by third parties unrelated to us, the Operating Partnership or the relevant property’s partnership.
13
Possible terrorist activity or other acts of violence could adversely affect our financial condition and results of operations.
Future terrorist attacks in the United States, and other acts of violence, including domestic or international terrorism or war, might result in declining consumer confidence and spending, which could harm the demand for goods and services offered by our tenants and the values of our properties, and might adversely affect an investment in our securities. A decrease in retail demand could make it difficult for us to renew or re-lease our properties at lease rates equal to or above historical rates and, to the extent our tenants are affected, could adversely affect their ability to continue to meet obligations under their existing leases. Terrorist activities also could directly affect the value of our properties through damage, destruction or loss. Furthermore, terrorist acts might result in increased volatility in national and international financial markets, which could limit our access to capital or increase our cost of obtaining capital.
Social unrest and acts of vandalism or violence could adversely affect our business operations.
Our business may be adversely affected by social, political, and economic instability, unrest, or disruption, including protests, demonstrations, strikes, riots, civil disturbance, disobedience, insurrection and looting in geographic regions where our properties are located. Such events may result in property damage and destruction and in restrictions, curfews, or other governmental actions that could give rise to significant changes in economic conditions and cycles, which may adversely affect our financial condition and operations.
Over the last few years, there have been demonstrations and protests, some of which involved violence, looting, arson and property destruction, in cities throughout the United States. While the majority of protests have been peaceful, looting, vandalism and fires have taken place in certain places, which led to the imposition of mandatory curfews and, in some locations, deployment of the National Guard. Governmental actions taken to protect people and property, including curfews and restrictions on business operations, may disrupt operations, harm perceptions of personal well-being and increase the need for additional expenditures on security resources. The effect and frequency of the demonstrations, protests or other factors is uncertain, and we cannot assure there will not be further political or social instability in the future or that there will not be other events that could lead to further social, political and economic instability. If such events or disruptions persist for a prolonged period of time, our overall business and results of operations may be adversely affected.
Clauses in leases with certain tenants in our properties may include inducements, such as reduced rent and tenant allowance payments or other clauses such as co-tenancy or sales-based kick-out provisions, which can reduce our rents and Funds From Operations (“FFO”), and adversely impact our financial condition and results of operation and the value of our properties. This impact could be exacerbated by the loss of one or more significant tenants, due to bankruptcies or as a result of consolidations in the retail industry.
We could be adversely affected by the bankruptcy, early termination, sales performance, or closing of tenants and Anchors. Certain of our lease agreements include co-tenancy and/or sales-based kick-out provisions which allow a tenant to pay a reduced rent amount and, in certain instances, terminate the lease, if we fail to maintain certain occupancy levels or retain specified named Anchors, or if the tenant does not achieve certain specified sales targets. If occupancy or tenant sales do not meet or fall below certain thresholds, rents we are entitled to receive from our tenants could be reduced. Additionally, some tenants may have rent abatement clauses that delay rent commencement or reduce contractual rents for a prolonged period of time after initial occupancy. The effect of these clauses reduces our rents and FFO while they are applicable. We expect to continue to offer co-tenancy and rent abatement clauses in the future to attract tenants to our properties. As a result, our financial condition and results of operations may be adversely impacted.
The bankruptcy of a tenant could result in the termination of its lease and potentially trigger co-tenancy or other clauses in other tenants’ leases, which would lower the amount of cash generated by that property. Replacing tenants with better performing, emerging retailers may take longer than our historical experience of re-tenanting due to their lack of infrastructure and limited experience in opening stores as well as the significant competition for such emerging brands. In addition, when a department store operating as an Anchor at one of our properties has ceased operating, in certain instances we have experienced difficulty and delay and incurred significant expense in replacing the Anchor, re-tenanting, or otherwise re-merchandising the use of the Anchor space. This difficulty can be, and in some instances has been, exacerbated if the Anchor space is owned by a third party and we are not able to acquire the space, if the third party’s plans to lease or redevelop the space do not align with our interests or the third party does not act in a timely manner to lease or redevelop the space. In addition, the Anchor’s closing may, and in some instances has, lead to reduced customer traffic and lower mall tenant sales. As a result, we may, and in some instances have, also experience difficulty or delay in leasing spaces in areas adjacent to the vacant Anchor space. The early termination or closing of tenants or Anchors for reasons other than bankruptcy could have a similar impact on the operations of our properties, although in the case of early terminations we may benefit in the short-term from lease termination income.
14
Certain traditional department stores have experienced challenges including limited opportunities for new investment/openings and declining sales, which lead department stores to close stores or seek rent reductions. Department stores’ market share is declining, and their ability to drive traffic has substantially decreased. Despite traffic to our Malls, Lifestyle Centers and Outlet Centers traditionally being driven by department store Anchors, in the event of a need for replacement, it has become necessary to consider non-department store Anchors. Certain of these non-department store Anchors may demand higher allowances or other less favorable terms than a standard mall tenant due to the nature of the services/products they provide.
We are in a competitive business.
There are numerous shopping facilities that compete with our properties in attracting retailers to lease space. Our ability to attract tenants to our properties and lease space is important to our success, and difficulties in doing so can materially impact our properties’ performance. The existence of competing shopping centers could have a material adverse impact on our ability to develop, redevelop or operate properties, lease space to desirable Anchors and tenants, and on the level of rents that can be achieved. In addition, retailers at our properties face continued competition from shopping through various means and channels, including via the internet, lifestyle centers, value and outlet centers, wholesale and discount shopping clubs, and television shopping networks. Competition of this type could adversely affect our revenues and cash available for distribution to shareholders.
As new technologies emerge, the relationship among customers, retailers, and shopping centers are evolving on a rapid basis and we may not be able to adapt to such new technologies and relationships on a timely basis. Our relative size may limit the capital and resources we are willing to allocate to invest in strategic technology to enhance the mall experience, which may make our Malls relatively less desirable to anchors, mall tenants, and consumers. Additionally, a small but increasing number of tenants utilize our Malls as showrooms or as part of an omni-channel strategy (allowing customers to shop seamlessly through various sales channels). As a result, customers may make purchases through other sales channels during or immediately after visiting our Malls, with such sales not being captured currently in our tenant sales figures or monetized in our minimum or overage rents.
We compete with other major real estate investors with significant capital for attractive investment opportunities. These competitors include other REITs, investment banking firms, and private and institutional investors, some of whom have greater financial resources or have different investment criteria than we do. In particular, there is competition to acquire, develop, or redevelop highly productive retail properties. This could become even more severe as competitors gain size and economies of scale as a result of merger and consolidation activity. This competition may impair our ability to acquire, develop, or redevelop suitable properties, and to attract key retailers, on favorable terms in the future.
Many of our tenants are omni-channel retailers who also distribute their products through online sales and provide options to consumers like buy online pick up in store, buy online ship to store or buy online return to store. Our business currently is predominantly reliant on consumer demand for shopping at physical stores, and our business could be materially and adversely affected if we are unsuccessful in adapting our business to evolving consumer purchasing habits. The increased popularity of digital and mobile technologies has accelerated the transition of a percentage of market share from shopping at physical stores to web-based shopping, and the COVID-19 pandemic and restrictions intended to prevent its spread significantly increased the utilization of e-commerce and may, particularly in certain market segments, accelerate the long-term penetration of pure online retail. Although a brick-and-mortar presence may have a positive impact on retailers’ online sales, the increased utilization of pure online shopping may lead to the closure of underperforming stores by retailers, which could impact our occupancy levels and the rates that tenants are willing to pay to lease our space. Additionally, the increase in online shopping may result in certain tenants underreporting sales at our properties which may materially and adversely impact our collection of overage rent. Examples may include, retailers and restaurants not reporting curbside pick-up sales or online sales fulfilled with store inventory, and tenants reducing store sales by including online returns processed in the store.
Our properties may be subject to impairment charges which could adversely affect our financial results.
We monitor events or changes in circumstances that could indicate the carrying value of a long-lived asset may not be recoverable. We use significant judgement in assessing events or circumstances which might indicate impairment, including but not limited to, changes in our intent to hold a long-lived asset over its previously estimated useful life. Changes in our intent to hold a long-lived asset has a significant impact on the estimated undiscounted cash flows expected to result from the use and eventual disposition of a long-lived asset and whether a potential impairment loss shall be measured. When indicators of potential impairment are present that suggest that the carrying amounts of a long-lived asset may not be recoverable, we assess the recoverability of the asset by determining whether the asset’s carrying value will be recovered through the estimated undiscounted future cash flows expected from our use and its eventual disposition. In the event that such undiscounted future cash flows do not exceed the carrying value, we adjust the carrying value of the long-lived asset to its estimated fair value and recognize an impairment loss. The estimated fair value is calculated based on the following
15
information, in order of preference, depending upon availability: (Level 1) recently quoted market prices, (Level 2) market prices for comparable properties, or (Level 3) the present value of future cash flows, including estimated salvage value. Certain of our long-lived assets may be carried at more than an amount that could be realized in a current disposition transaction. Projections of expected future operating cash flows require that we estimate future market rental income amounts subsequent to expiration of current lease agreements, property operating expenses, the number of months it takes to re-lease the property, and the number of years the property is held for investment, among other factors. As these assumptions are subject to economic and market uncertainties, they are difficult to predict and are subject to future events that may alter the assumptions used or management’s estimates of future possible outcomes. Therefore, the future cash flows estimated in our impairment analyses may not be achieved.
Breaches or other adverse cybersecurity incidents on our systems or those of our service providers or business partners could expose us to liability and lead to the loss or compromise of our information, including confidential information, sensitive information and intellectual property, and could result in a material adverse effect on our business and financial condition.
As a regular part of our business operations, we rely on information technology systems and network infrastructure, including the internet, to process, transmit and store electronic information and to manage or support a variety of our business processes, including financial transactions and maintenance of records. We rely on our own systems and also outsource some of our business requirements through service providers and other business partners pursuant to agreements. The risk of a security breach or disruption, particularly through cyber attack or cyber intrusion, including by internal actors, computer hackers, foreign governments and cyber terrorists, has generally increased as the number, intensity and sophistication of attempted attacks and intrusions from around the world have increased. Our IT networks and related systems and infrastructure – and those of our providers/partners – are essential to the operation of our business and our ability to perform day-to-day operations (including managing our building systems) and, in some cases, may be critical to the operations of certain of our tenants.
We have experienced adverse security incidents. All incidents experienced to date have been minor in scope and impact, were resolved quickly, had no material impact on the Company’s reputation, financial performance, customer or vendor relationships, and posed no material risk of potential litigation or regulatory investigations or actions. We expect unauthorized parties to continue to attempt to gain access to our systems or information, and/or those of our business partners and service providers. Cyber attacks targeting our infrastructure could result in a full or partial disruption of our operations, as well as those of our tenants.
A security incident, breach or other significant disruption involving our information technology networks and related systems could occur due to a virus or other harmful circumstance, intentional penetration or disruption of our information technology resources by a third party, natural disaster, hardware or software corruption or failure or error or poor product or vendor/developer selection (including a failure of security controls incorporated into or applied to such hardware or software), telecommunications system failure, service provider error or failure, intentional or unintentional personnel actions (including the failure to follow our security protocols), or lost connectivity to our networked resources. Such occurrences could disrupt the proper functioning of our networks and systems; result in disruption of business operations and loss of service to our tenants and customers; result in significantly decreased revenues; result in increased costs associated in obtaining and maintaining cybersecurity investigations and testing, as well as implementing protective measures and systems; result in increased insurance premiums and operating costs; result in misstated financial reports and/or missed reporting deadlines; result in our inability to properly monitor our compliance with the rules and regulations regarding our qualification as a REIT; result in the unauthorized access to, and destruction, loss, theft, misappropriation or release of proprietary, confidential, sensitive or otherwise valuable information of ours or others, which others could use to compete against us or for disruptive, destructive or otherwise harmful purposes and outcomes; result in our inability to maintain the building systems relied upon by our tenants for the efficient use of their leased space; require significant management attention and resources to remedy any damages that result; subject us to claims for breach of contract, damages, credits, penalties or termination of leases or other agreements; subject us to regulatory investigations and actions; cause harm to our competitive position and business value; and damage our reputation among our tenants and investors generally. Moreover, cyber attacks perpetrated against our Anchors and tenants, including unauthorized access to customers’ credit card data and other confidential information, could subject us to significant litigation, liability and costs, adversely impact our reputation, or diminish consumer confidence and consumer spending and negatively impact our business.
16
The compromise of our or our business partners’ or service providers’ technology systems resulting in the loss, disclosure, misappropriation of, or access to, our information or that of our tenants, employees or business partners or failure to comply with ever-evolving regulatory obligations or contractual obligations with respect to such information could result in legal claims or proceedings, liability or regulatory penalties under laws protecting the privacy of personal information, disruption to our operations and damage to our reputation, any or all of which could adversely affect our business. The costs to remediate breaches and similar system compromises that do occur could be material. In addition, as cybercriminals become more sophisticated, the cost of proactive defensive measures continues to increase.
Although we and our service providers/business partners have implemented processes, procedures and controls to help mitigate these risks, there can be no assurance that these measures, as well as our increased awareness of the risk of cyber incidents, will be effective or that attempted or actual security incidents, breaches or system disruptions that could be damaging to us or others will not occur. Even the most well protected information, networks, systems and facilities remain potentially vulnerable because the techniques used in such attempted security breaches evolve and generally are not recognized until launched against a target, and in some cases are designed not to be detected and, in fact, may not be detected. Accordingly, we may be unable to anticipate these techniques or to implement adequate security barriers or other preventative measures, and thus it is impossible for us to entirely mitigate this risk. Lastly, while we have cybersecurity insurance, damages and claims arising from such incidents may not be covered, or may exceed the amount of any insurance coverage.
If a third-party vendor fails to provide agreed upon services, we may suffer losses.
We are dependent and rely on third-party vendors, including cloud providers, for redundancy of our network, system data, security and data integrity. If a vendor fails to provide services as agreed, suffers outages, business interruptions, financial difficulties or bankruptcy, we may experience service interruption, delays, or loss of information. Cloud computing is dependent upon having access to an internet connection in order to retrieve data. If a natural disaster, blackout or other unforeseen event were to occur that disrupted the ability to obtain an internet connection, we may experience a slowdown or delay in our operations. We conduct appropriate due diligence on all services providers and restrict access, use and disclosure of personal information. We engage vendors with formal written agreements clearly defining the roles of the parties and specifying privacy and data security responsibilities.
Declines in economic conditions, including increased volatility in the capital and credit markets, could adversely affect our business, results of operations and financial condition.
An economic recession can result in extreme volatility and disruption of our capital and credit markets. The resulting economic environment may be affected by dramatic declines in the stock and housing markets, increases in foreclosures, unemployment and costs of living, as well as limited access to credit. This economic situation can, and most often will, impact consumer spending levels, which can result in decreased revenues for our tenants and related decreases in the values of our properties. A sustained economic downward trend could impact our tenants’ ability to meet their lease obligations due to poor operating results, lack of liquidity, bankruptcy or other reasons. Our ability to lease space and negotiate rents at advantageous rates could also be affected in this type of economic environment. Additionally, access to capital and credit markets could be disrupted over an extended period, which may make it difficult to obtain the financing we may need for future growth and/or to meet our debt service obligations as they mature. Any of these events could harm our business, results of operations and financial condition.
Future litigation could have a material adverse effect on our business, financial condition and results of operation.
We may from time to time be a defendant in lawsuits and regulatory proceedings relating to our business. Such litigation and proceedings may result in defense costs, settlements, fines or judgments against us, some of which may not be covered by insurance. Due to the inherent uncertainties of litigation and regulatory proceedings, we cannot accurately predict the ultimate outcome of any such litigation or proceedings. An unfavorable outcome may result in our having to pay significant fines, judgments or settlements, which, if uninsured, or if exceeding insurance coverage, could adversely impact our financial condition, cash flows, results of operations and the trading price of our common stock. Additionally, certain proceedings or the resolution of certain proceedings may affect the availability or cost of some of our insurance coverage and expose us to increased risks that would be uninsured.
17
Our success depends, in part, on our ability to attract and retain talented employees, and the loss of any one of our key personnel could adversely impact our business.
The success of our business depends, in part, on the leadership and performance of our executive management team and key employees, and our ability to attract, retain and motivate talented employees could significantly impact our future performance. Competition for these individuals is intense, and we cannot assure you that we will retain our executive management team and key employees or that we will be able to attract and retain other highly qualified individuals for these positions in the future. Losing any one or more of these persons could have a material adverse effect on our results of operations, financial condition and cash flows.
Compliance with the Americans with Disabilities Act and fire, safety and other regulations may require us to make expenditures that could adversely affect our cash flows.
All the properties in our portfolio are required to comply with the Americans with Disabilities Act (the “ADA”). Compliance with the ADA requirements could require removal of access barriers, and non-compliance could result in the imposition of fines by the United States government, awards of damages to private litigants, or both. While the tenants to whom our portfolio is leased are obligated to comply with ADA provisions, within their leased premises, if required changes within their leased premises involve greater expenditures than anticipated, or if the changes must be made on a more accelerated basis than anticipated, the ability of tenants to cover costs could be adversely affected. Furthermore, we are required to comply with ADA requirements within the common areas of the properties in our portfolio and we may not be able to pass on to our tenants any costs necessary to remediate any common area ADA issues. In addition, we are required to operate the properties in compliance with fire and safety regulations, building codes and other land use regulations, as they may be adopted by governmental agencies and bodies and become applicable to our portfolio. We may be required to make substantial capital expenditures to comply with, and we may be restricted in our ability to renovate or redevelop the properties subject to, those requirements and to comply with the provisions of the ADA. The resulting expenditures and restrictions could have a material adverse effect on our financial condition and operating results.
Uninsured losses could adversely affect our financial condition, and in the future our insurance may not include coverage for acts of terrorism.
We carry a comprehensive blanket policy for general liability, property casualty (including fire, earthquake, flood and wind) and rental loss covering all of our properties, with specifications and insured limits customarily carried for similar properties. However, even insured losses could result in a serious disruption to our business and delay our receipt of revenue. Furthermore, there are some types of losses, including lease and other contract claims, as well as some types of environmental losses, that generally are not insured or are not economically insurable. If an uninsured loss or a loss in excess of insured limits occurs, we could lose all or a portion of the capital we have invested in a property, as well as the anticipated future revenues from the property. If this happens, we, or the applicable property’s partnership, may still remain obligated under guarantees provided to the lender for any mortgage debt, secured debt or other financial obligations related to the property.
We believe that the general liability and property casualty insurance policies on our properties currently include adequate coverage for losses resulting from acts of terrorism, as defined by TRIPRA. The cost of coverage for acts of terrorism is currently mitigated by the Terrorism Risk Insurance Act (“TRIA”). In January 2015, Congress reinstated TRIA under the Terrorism Risk Insurance Program Reauthorization Act of 2015 (“TRIPRA”) and extended the program through December 31, 2020. Under TRIPRA, the amount of terrorism-related insurance losses triggering the federal insurance threshold was raised from $180 million in 2019 to $200 million in 2020. Additionally, the bill increased insurers’ co-payments for losses exceeding their deductibles, in annual steps, from 19% in 2019 to 20% in 2020. Each of these changes may have the effect of increasing the cost to insure against acts of terrorism for property owners, such as the Company, notwithstanding the other provisions of TRIPRA. In December 2019, Congress further extended TRIPRA through December 31, 2027. If TRIPRA is not continued beyond 2027 or is significantly modified, we may incur higher insurance costs and experience greater difficulty in obtaining insurance that covers terrorist-related damages. Our tenants may also have similar difficulties.
Our historical financial information may not be indicative of our future financial performance.
Our capital structure was significantly altered by the Plan. Under fresh-start reporting rules, our assets and liabilities were adjusted to fair values and our accumulated deficit was restated to zero. Accordingly, under fresh-start reporting rules, our financial condition and results of operations following our emergence from Chapter 11 will not be comparable to the financial condition and results of operations reflected in our historical financial statements.
18
Any significant resurgence of the COVID-19 pandemic or a similar threat, and governmental responses thereto, could once again materially and adversely impact or disrupt our financial condition, results of operations, cash flows and performance, as could any future outbreak of another highly infectious or contagious disease.
The COVID-19 pandemic had a material negative impact on economic and market conditions around the world, and specifically in the retail real estate sector. As the impact of the COVID-19 pandemic continued to evolve, governments and other authorities imposed measures intended to control its spread, including restrictions on freedom of movement, group gatherings and business operations such as travel bans, border closings, business closures, quarantines, stay-at-home orders, shelter-in-place orders, density limitations and social distancing measures. While these restrictions have long since been lifted, it remains possible that a significant resurgence of the threat from COVID-19, or any similar future public health emergency, could result in governments and other authorities reinstituting these measures or imposing new, more restrictive measures, in response to our tenants’ and consumers’ perception of the related risks.
Demand for retail space and the profitability of our properties depends, in part, on the ability and willingness of tenants to enter into and perform obligations under leases. Any significant resurgence of COVID-19, or a similar future public health emergency, could once again reduce the willingness of customers to visit our properties and adversely impact our tenants’ businesses based on many factors, including local transmission rates, the emergence of new variants, the development, availability, distribution, effectiveness and acceptance of existing and new vaccines, and the effectiveness and availability of cures or treatments.
The impact of a future public health emergency on our business, financial condition, results of operations, cash flows, liquidity and ability to satisfy our debt service obligations and make distributions to our shareholders could depend on additional factors, including:
To the extent any of these risks and uncertainties adversely impact us in the ways described above or otherwise, they may also have the effect of heightening many of the other risks described herein.
19
RISKS RELATED TO DEBT AND FINANCIAL MARKETS
A deterioration of the capital and credit markets could adversely affect our ability to access funds and the capital needed to refinance debt or obtain new debt.
We are significantly dependent upon external financing to fund the growth of our business and ensure that we meet our debt servicing requirements. Our access to financing depends on the willingness of lending institutions to grant credit to us and conditions in the capital markets in general. An economic recession may cause extreme volatility and disruption in the capital and credit markets. This may make it difficult to obtain the financing we may need for future growth and/or to meet our debt service obligations as they mature. Although, we successfully obtained debt for refinancings and retirement of our maturing debt, acquisitions and the construction of new developments and redevelopments in the past, we cannot make any assurances as to whether we will be able to obtain debt in the future, or that the financing options available to us will be on favorable or acceptable terms.
Our indebtedness is substantial and could impair our ability to obtain additional financing.
At December 31, 2023, our pro-rata share of consolidated and unconsolidated debt outstanding, excluding debt discounts and deferred financing costs, was approximately $2,656.3 million. Our total share of consolidated and unconsolidated debt, excluding debt discounts and deferred financing costs, maturing in 2024, 2025 and 2026 giving effect to all maturity extensions, is approximately $106.8 million, $288.1 million and $710.1 million, respectively. Additionally, we have $69.8 million of debt, at our share, which matured prior to December 31, 2023. Two loans comprise the $69.8 million of debt that matured prior to December 31, 2023 and the property secured by each loan was placed into receivership in connection with the foreclosure process. See Note 7 and Note 8 to the consolidated financial statements for additional information.
Our leverage and the limitations imposed on us by our financing arrangements and debt service obligations could have important consequences. For example, it could:
If any of the foregoing occurs, our business, financial condition, liquidity, results of operations and prospects could be materially and adversely affected, and the trading price of our common stock or other securities could decline significantly.
Rising interest rates could both increase our borrowing costs, thereby adversely affecting our cash flows and the amounts available for distributions to our stockholders, and decrease our stock price, if investors seek higher yields through other investments.
An environment of rising interest rates could lead holders of our securities to seek higher yields through other investments, which could adversely affect the market price of our stock. One of the factors that has likely influenced the price of our stock in public markets is the annual distribution rate we pay as compared with the yields on alternative investments. In addition, increases in market interest rates could result in increased borrowing costs for us, which could be expected to adversely affect our cash flow and the amounts available for distributions to our stockholders and the Operating Partnership’s unitholders. Further, numerous other factors, such as governmental regulatory action and tax laws, could have a significant impact on the future market price of our stock.
20
As of December 31, 2023, our total share of consolidated and unconsolidated variable-rate debt, excluding debt discounts and deferred financing costs, was $1,073.7 million. Increases in interest rates will increase our cash interest payments on the variable-rate debt we have outstanding from time to time. If we do not have sufficient cash flow from operations, we might not be able to make all required payments of principal and interest on our debt, which could result in a default or have a material adverse effect on our financial condition and results of operations, and which might have further adverse effects on our cash flow and our ability to make distributions to shareholders. These significant debt payment obligations might also require us to use a significant portion of our cash flow from operations to make interest and principal payments on our debt rather than for other purposes such as working capital, capital expenditures or distributions to holders of our equity securities.
We may not be able to raise capital through financing activities.
Many of our assets are encumbered by property-level indebtedness; therefore, we may be limited in our ability to raise additional capital through property-level or other financings. In addition, our ability to raise additional capital could be limited to refinancing existing secured mortgages before their maturity date which may result in yield maintenance or other prepayment penalties to the extent that the mortgage is not open for prepayment at par.
The agreements governing our debt contain various covenants that impose restrictions on us that may affect our ability to operate our business.
Other agreements that we enter into governing our debt have or will contain covenants that impose restrictions on us. These restrictions on our ability to operate our business could harm our business by, among other things, limiting our ability to take advantage of corporate opportunities. Various risks, uncertainties and events beyond our control could affect our ability to comply with these covenants. Failure to comply with any of the covenants in our existing or future financing agreements could result in a default under those agreements and under other agreements containing cross-default provisions.
We may not be able to generate sufficient cash flow to meet our debt service obligations.
Our ability to meet our debt service obligations on, and to refinance, our indebtedness, and to fund our operations, working capital, acquisitions, capital expenditures and other important business uses, depends on our ability to generate sufficient cash flow in the future. To a certain extent, our cash flow is subject to general economic, industry, financial, competitive, operating, legislative, regulatory and other factors, many of which are beyond our control.
We cannot be certain that our business will generate sufficient cash flow from operations or that future sources of cash will be available to us in an amount sufficient to enable us to meet our debt service obligations on our indebtedness, or to fund our other important business uses. Additionally, if we incur additional indebtedness in connection with future acquisitions or development projects or for any other purpose, our debt service obligations could increase significantly and our ability to meet those obligations could depend, in large part, on the returns from such acquisitions or projects, as to which no assurance can be given.
We may need to refinance all or a portion of our indebtedness, at or prior to maturity. Our ability to refinance our indebtedness or obtain additional financing will depend on, among other things:
As a result, we may not be able to refinance any of our indebtedness, on favorable terms, or at all.
If we do not generate sufficient cash flow from operations, and additional borrowings or refinancings are not available to us, we may be unable to meet all our debt service obligations. As a result, we would be forced to take other actions to meet those obligations, such as selling properties, raising equity or delaying capital expenditures, any of which could have a material adverse effect on us. Furthermore, we cannot be certain that we will be able to effect any of these actions on favorable terms, or at all.
Despite our substantial outstanding indebtedness, we may still incur significantly more indebtedness in the future, which would exacerbate any or all the risks described above.
We may be able to incur substantial additional indebtedness in the future. To the extent that we incur substantial additional indebtedness in the future, the risks associated with our substantial leverage described above, including our inability to meet our debt service obligations, would be exacerbated.
21
Federal and state statutes allow courts, under specific circumstances, to void guarantees and require holders of indebtedness and lenders to return payments received from guarantors.
Under the federal bankruptcy law and comparable provisions of state fraudulent transfer laws, a guarantee could be voided and required to be returned to the guarantor, or to a fund for the benefit of the creditors of the guarantor, if, among other things, the guarantor, at the time it incurred the indebtedness evidenced by its guarantee (i) received less than reasonably equivalent value or fair consideration for the incurrence of the guarantee and (ii) one of the following was true with respect to the guarantor:
In addition, any claims in respect of a guarantee could be subordinated to all other debts of that guarantor under principles of “equitable subordination,” which generally require that the claimant must have engaged in some type of inequitable conduct, the misconduct must have resulted in injury to the creditors of the debtor or conferred an unfair advantage on the claimant, and equitable subordination must not be inconsistent with other provisions of the U.S. Bankruptcy Code.
The measures of insolvency for purposes of these fraudulent transfer laws will vary depending upon the law applied in any proceeding to determine whether a fraudulent transfer has occurred. Generally, however, a guarantor would be considered insolvent if:
The court might also void such guarantee, without regard to the above factors, if it found that a guarantor entered into its guarantee with actual or deemed intent to hinder, delay, or defraud its creditors.
A court would likely find that a guarantor did not receive reasonably equivalent value or fair consideration for its guarantee unless it benefited directly or indirectly from the issuance or incurrence of such indebtedness. If a court voided such guarantee, holders of the indebtedness and lenders would no longer have a claim against such guarantor or the benefit of the assets of such guarantor constituting collateral that purportedly secured such guarantee. In addition, the court might direct holders of the indebtedness and lenders to repay any amounts already received from a guarantor.
RISKS RELATED TO DIVIDENDS AND OUR STOCK
We may change the dividend policy for our common stock in the future.
Depending upon our liquidity needs, we reserve the right to pay any or all of a dividend in a combination of cash and shares of common stock, to the extent permitted by any applicable revenue procedures of the Internal Revenue Service (“IRS”). In the event that we should pay a portion of any future dividends in shares of our common stock pursuant to such procedures, taxable U.S. stockholders would be required to pay tax on the entire amount of the dividend, including the portion paid in shares of common stock, in which case such stockholders may have to use cash from other sources to pay such tax. If a U.S. stockholder sells any common stock it receives as a dividend in order to pay its taxes, the sales proceeds may be less than the amount included in income with respect to the dividend, depending on the market price of our common stock at the time of the sale. Furthermore, with respect to non-U.S. stockholders, we may be required to withhold federal tax with respect to any future dividends, including any dividends that are paid in common stock. In addition, if a significant number of our stockholders sell shares of our common stock in order to pay taxes owed on any future dividends, such sales would put downward pressure on the market price of our common stock.
22
The decision to declare and pay dividends on any outstanding shares of our common stock, as well as the timing, amount and composition of any such future dividends, will be at the sole discretion of our board of directors and will depend on our earnings, taxable income, FFO, liquidity, financial condition, capital requirements, contractual prohibitions or other limitations under our then-current indebtedness, the annual distribution requirements under the REIT provisions of the Internal Revenue Code, Delaware law and such other factors as our board of directors deems relevant. Any dividends payable will be determined by our board of directors based upon the circumstances at the time of declaration. Any change in our future dividend policy could have a material adverse effect on the market price of our future outstanding common stock.
Since we conduct substantially all our operations through our Operating Partnership, our ability to pay dividends on our common stock depends on the distributions we receive from our Operating Partnership.
Because we conduct substantially all our operations through our Operating Partnership, our ability to service our debt obligations, as well as our ability to pay any future dividends on our common stock will depend almost entirely upon the earnings and cash flows of the Operating Partnership and the ability of the Operating Partnership to make distributions to us on our ownership interests in our Operating Partnership. Under the Delaware Revised Uniform Limited Partnership Act, the Operating Partnership is prohibited from making any distribution to us to the extent that at the time of the distribution, after giving effect to the distribution, all liabilities of the Operating Partnership (other than some non-recourse liabilities and some liabilities to the partners) exceed the fair value of the assets of the Operating Partnership.
Additionally, the terms of our secured term loan provide a waterfall calculation for distributions of excess cash flow generated by the properties secured as collateral on the term loan. The waterfall calculation generally provides that the excess cash flow be used for additional payments of principal on the secured term loan before distributions may be made for other purposes. In the event of a default, no amounts may be distributed other than to repay the outstanding balance on the secured term loan. This in turn may limit our ability to make some types of payments, including payment of dividends to our stockholders. Any inability to make cash distributions from the Operating Partnership could jeopardize our ability to pay any future dividends to our stockholders for one or more dividend periods which, in turn, could jeopardize our ability to maintain qualification as a REIT.
Distributions paid by REITs do not qualify for the reduced tax rates that apply to other corporate distributions.
The maximum tax rate for "qualified dividends" paid by corporations to non-corporate stockholders generally is 20%. Distributions paid by REITs to non-corporate stockholders generally are taxed at rates lower than ordinary income rates, but those rates are higher than the 20% tax rate on qualified dividend income paid by corporations. Although this does not adversely affect the taxation of REITs or dividends payable by REITs, to the extent that the preferential rates continue to apply to regular corporate qualified dividends, the more favorable rates for corporate dividends may cause non-corporate investors to perceive that an investment in a REIT is less attractive than an investment in a non-REIT entity that pays dividends, thereby reducing the demand and market price of shares of our common stock.
RISKS RELATED TO GEOGRAPHIC CONCENTRATIONS
Since our properties are located principally in the southeastern and midwestern United States, our financial position, results of operations and funds available for distribution to shareholders are subject generally to economic conditions in these regions and, in particular, to adverse economic developments affecting the operating results of properties in our five largest markets.
Our properties are located principally in the southeastern and midwestern United States. Our properties located in the southeastern United States accounted for approximately 51.2% of our total pro-rata share of revenues from all properties for the year ended December 31, 2023 and currently include 19 malls, 4 lifestyle centers, 2 outlet centers, 18 open-air centers, 3 office buildings and a hotel. Our properties located in the midwestern United States accounted for approximately 22.3% of our total pro-rata share of revenues from all properties for the year ended December 31, 2023 and currently include 15 malls and 2 open-air centers. Further, our properties located in our five largest metropolitan area markets – St. Louis, MO; Laredo, TX; Chattanooga, TN; Lexington, KY; and Greensboro, NC – accounted for approximately 6.8%, 4.3%, 4.6%, 4.2% and 3.8%, respectively, of our total pro-rata share of revenues for the year ended December 31, 2023. No other market accounted for more than 3.5% of our total pro-rata share of revenues for the year ended December 31, 2023.
23
Our results of operations and funds available for distribution to shareholders therefore will be impacted generally by economic conditions in the southeastern and midwestern United States, and particularly by the results experienced at properties located in our five largest market areas. While we have properties located in six states across the southwestern, northeastern and western regions, we will continue to look for opportunities to geographically diversify our portfolio in order to minimize dependency on any particular region; however, the expansion of the portfolio through both acquisitions and developments is contingent on many factors including consumer demand, competition and economic conditions.
RISKS RELATED TO FEDERAL INCOME TAX LAWS
We conduct a portion of our business through taxable REIT subsidiaries, which are subject to certain tax risks.
We have established several taxable REIT subsidiaries including CBL Holdings I, LLC, the general partner of the Operating Partnership, and our Management Company. Despite our qualification as a REIT, our taxable REIT subsidiaries must pay income tax on their taxable income. In addition, we must comply with various tests to continue to qualify as a REIT for federal income tax purposes, and our income from and investments in our taxable REIT subsidiaries generally do not constitute permissible income and investments for these tests. While we will attempt to ensure that our dealings with our taxable REIT subsidiaries will not adversely affect our REIT qualification, we cannot provide assurance that we will successfully achieve that result. Furthermore, we may be subject to a 100% penalty tax, or our taxable REIT subsidiaries may be denied deductions, to the extent our dealings with our taxable REIT subsidiaries are not deemed to be arm’s length in nature.
If we fail to qualify as a REIT in any taxable year, our funds available for distribution to stockholders will be reduced.
We intend to continue to operate so as to qualify as a REIT under the Internal Revenue Code. Although we believe that we are organized and operate in such a manner, no assurance can be given that we currently qualify and, in the future, will continue to qualify as a REIT. Such qualification involves the application of highly technical and complex Internal Revenue Code provisions for which there are only limited judicial or administrative interpretations. The determination of various factual matters and circumstances not entirely within our control may affect our ability to qualify. In addition, no assurance can be given that legislation, new regulations, administrative interpretations or court decisions will not significantly change the tax laws with respect to qualification or its corresponding federal income tax consequences. Any such change could have a retroactive effect.
If in any taxable year we were to fail to qualify as a REIT, we would not be allowed a deduction for distributions to stockholders in computing our taxable income and we would be subject to federal income tax on our taxable income at regular corporate rates. Unless entitled to relief under certain statutory provisions, we also would be disqualified from treatment as a REIT for the four taxable years following the year during which qualification was lost. As a result, the funds available for distribution to our stockholders would be reduced for each of the years involved. This would likely have a significant adverse effect on the value of our securities and our ability to raise additional capital. In addition, we would no longer be required to make distributions to our stockholders. We currently intend to operate in a manner designed to qualify as a REIT. However, it is possible that future economic, market, legal, tax or other considerations may cause our board of directors to revoke the REIT election.
If the Operating Partnership fails to qualify as a partnership for U.S. federal income tax purposes, we would fail to qualify as a REIT and would suffer adverse consequences.
As a partnership, the Operating Partnership is not subject to federal income tax on its income. Instead, each of its partners, including us, is allocated, and may be required to pay tax with respect to, such partner's share of its income. We cannot assure you that the Internal Revenue Service (the "IRS") will not challenge the status of the Operating Partnership or any other subsidiary partnership or limited liability company in which we own an interest as a disregarded entity or partnership for federal income tax purposes, or that a court would not sustain such a challenge. If the IRS were successful in treating the Operating Partnership or any such other subsidiary as an entity taxable as a corporation for federal income tax purposes, we would fail to meet the gross income tests and certain of the asset tests applicable to REITs and, accordingly, we would likely cease to qualify as a REIT. Also, the failure of the Operating Partnership or any subsidiary partnerships or limited liability company to qualify as a disregarded entity or partnership for applicable income tax purposes could cause it to become subject to federal and state corporate income tax, which would reduce significantly the amount of cash available for debt service and for distribution to its partners or members, including us.
Any issuance or transfer of our capital stock to any person in excess of the applicable limits on ownership necessary to maintain our status as a REIT would be deemed void ab initio, and those shares would automatically be transferred to the Company as trustee of a charitable trust.
To maintain our status as a REIT under the Internal Revenue Code, not more than 50% in value of our outstanding capital stock may be owned, directly or indirectly, by five or fewer individuals (as defined in the Internal Revenue Code to include certain entities) at any time during the last half of a taxable year. Our Certificate of Incorporation generally prohibits
24
ownership of more than 9.9% of the outstanding shares of our capital stock by any single stockholder, either directly or constructively as determined through the application of applicable provisions of the Internal Revenue Code. The approval of our board of directors and the affirmative vote of the holders of a majority of our outstanding voting stock is required to amend this provision.
Our board of directors may, subject to certain conditions, waive the applicable ownership limit upon receipt of a ruling from the IRS or an opinion of counsel to the effect that such ownership will not jeopardize our status as a REIT. Historically, our board of directors has granted such waivers to certain institutional investors based upon the receipt of such opinions from the Company’s tax counsel. Absent any such waiver, however, any issuance or transfer of our capital stock to any person in excess of the applicable ownership limit or any issuance or transfer of shares of such stock which would cause us to be beneficially owned by fewer than 100 persons, will be null and void and the intended transferee will acquire no rights to the stock. Instead, such issuance or transfer with respect to that number of shares that would be owned by the transferee in excess of the ownership limit provision would be deemed void ab initio and those shares would automatically be transferred to a trust with the Company or its designated successor serving as trustee, for the exclusive benefit of a charitable beneficiary to be designated by us. Any acquisition of our capital stock and continued holding or ownership of our capital stock constitutes, under our Certificate of Incorporation, a continuous representation of compliance with the applicable ownership limit.
In order to maintain our status as a REIT and avoid the imposition of certain additional taxes under the Internal Revenue Code, we must satisfy minimum requirements for distributions to shareholders, which may limit the amount of cash we might otherwise have been able to retain for use in growing our business.
To maintain our status as a REIT under the Internal Revenue Code, we generally will be required each year to distribute to our stockholders at least 90% of our taxable income after certain adjustments. However, to the extent that we do not distribute all our net capital gains or distribute at least 90% but less than 100% of our REIT taxable income, as adjusted, we will be subject to tax on the undistributed amount at regular corporate tax rates, as the case may be. Also, our cash flows from operations may be insufficient to fund required distributions as a result of differences in timing between the actual receipt of income and the payment of expenses and the recognition of income and expenses for federal income tax purposes, or the effect of nondeductible expenditures, such as capital expenditures, payments of compensation for which Section 162(m) of the Code denies a deduction, interest expense deductions limited by Section 163(j) of the Code, the creation of reserves or required debt service or amortization payments. If we are unable to distribute 90% of our taxable income, we would potentially need to borrow funds, in certain limited cases distribute a combination of cash and stock (at our shareholders' election but subject to an aggregate cash limit established by us), and/or liquidate or sell a portion of our properties or investments (potentially at disadvantageous or unfavorable prices) or find another alternative source of funds. These alternatives could increase our costs or reduce our equity. In addition, to the extent we borrow funds to pay distributions, the amount of cash available to us in future periods will be decreased by the amount of cash flow we will need to service principal and interest on the amounts we borrow, which will limit cash flow available to us for other investments or business opportunities. In addition, we will be subject to a 4% nondeductible excise tax on the amount, if any, by which certain distributions paid by us during each calendar year are less than the sum of 85% of our ordinary income for such calendar year, 95% of our capital gain net income for the calendar year and any amount of such income that was not distributed in prior years. In the case of property acquisitions, including our initial formation, where individual properties are contributed to our Operating Partnership for Operating Partnership units, we have assumed the tax basis and depreciation schedules of the entities contributing properties. The relatively low tax basis of such contributed properties may have the effect of increasing the cash amounts we are required to distribute as dividends, thereby potentially limiting the amount of cash we might otherwise have been able to retain for use in growing our business. This low tax basis may also have the effect of reducing or eliminating the portion of distributions made by us that are treated as a non-taxable return of capital.
25
Complying with REIT requirements might cause us to forego otherwise attractive opportunities.
In order to qualify as a REIT for U.S. federal income tax purposes, we must satisfy tests concerning, among other things, our sources of income, the nature of our assets, the amounts we distribute to our shareholders and the ownership of our stock. We may also be required to make distributions to our shareholders at disadvantageous times or when we do not have funds readily available for distribution. Thus, compliance with REIT requirements may cause us to forego opportunities we would otherwise pursue. In addition, the REIT provisions of the Internal Revenue Code impose a 100% tax on income from “prohibited transactions.” “Prohibited transactions” generally include sales of assets that constitute inventory or other property held for sale in the ordinary course of business, other than foreclosure property. This 100% tax could impact our desire to sell assets and other investments at otherwise opportune times if we believe such sales could be considered “prohibited transactions.”
Partnership tax audit rules could have a material adverse effect on us.
Under the rules applicable to U.S. federal income tax audits of partnerships, subject to certain exceptions, any audit adjustment to items of income, gain, loss, deduction, or credit of a partnership (and any partner’s distributive share thereof) is determined, and taxes, interest, or penalties attributable thereto could be assessed and collected, at the partnership level. Absent available elections, it is possible that a partnership in which we directly or indirectly invest could be required to pay additional taxes, interest and penalties as a result of an audit adjustment, and we, as a direct or indirect partner of these partnerships, could be required to bear the economic burden of those taxes, interest, and penalties even though we may not otherwise have been required to pay additional taxes had we owned the assets of the partnership directly. The partnership tax audit rules apply to the Operating Partnership and its subsidiaries that are classified as partnerships for U.S. federal income tax purposes. There can be no assurance that these rules will not have a material adverse effect on us.
Transfers of our equity, or issuances of equity, may impair our ability to utilize the existing tax basis in our assets, our federal income tax net operating loss carryforwards and other tax attributes during the current year and in future years.
Under certain provisions of the Internal Revenue Code (the “Code”), and similar state provisions, a corporation is generally permitted to offset net taxable income in a given year with net operating losses carried forward from prior years, and its existing adjusted tax basis in its assets may be used to offset future gains or to generate annual cost recovery deductions.
In order to qualify for taxation as a REIT, we must meet various requirements including a requirement to distribute 90% of our taxable income; and, to avoid paying corporate income tax, we must distribute 100% of our taxable income. Our ability to utilize future tax deductions, net operating loss carryforwards and other tax attributes to offset future taxable income is subject to certain requirements and restrictions. We experienced an “ownership change,” as defined in section 382 of the Internal Revenue Code, in connection with our emergence from the Chapter 11 Cases, that may substantially limit our ability to use future tax deductions, net operating loss carryforwards and other tax attributes to offset future taxable income, which could have a negative impact on our financial position and results of operations. Generally, there is an “ownership change” under section 382 of the Code if one or more stockholders owning 5% or more of a corporation’s common stock have aggregate increases in their ownership of such stock of more than 50 percentage points over a prescribed testing period. Under section 382 and section 383 of the Code, absent an applicable exception, if a corporation undergoes an “ownership change”, certain future tax deductions (through “recognized built-in losses” arising when a company has a “net unrealized built-in loss” (NUBIL) if they are recognized within five years of the “ownership change”), net operating loss carryforwards and other tax attributes that may be utilized to offset future taxable income generally are subject to an annual limitation.
We have a significant NUBIL in our assets, as well as net operating loss carryforwards and other tax attributes at the date of emergence from the Chapter 11 Cases, that would be subject to limitation under section 382.
Whether or not future tax deductions, net operating loss carryforwards and other tax attributes are subject to limitation under section 382, net operating loss carryforwards and other tax attributes are expected to be further reduced by the amount of discharge of indebtedness arising in our Chapter 11 Cases under section 108 of the Internal Revenue Code.
26
RISKS RELATED TO OUR ORGANIZATIONAL STRUCTURE
The ownership limit described above, as well as certain provisions in our Certificate of Incorporation and Bylaws, may hinder any attempt to acquire us.
There are certain provisions of Delaware law (which we have opted out of having apply to the Company), our Certificate of Incorporation and our Bylaws, which may have the effect of delaying, deferring or preventing a third party from making an acquisition proposal for us. These provisions may also inhibit a change in control that some, or a majority, of our stockholders might believe to be in their best interest or that could give our stockholders the opportunity to realize a premium over the then-prevailing market prices for their shares. These provisions and agreements are summarized as follows:
27
Our Certificate of Incorporation contains a provision renouncing our interest and expectancy in certain corporate opportunities identified by our non-employee directors and their affiliates.
Certain of our non-employee directors and their affiliates engage in the same or similar business activities or lines of business in which we operate and may make investments in properties or businesses that directly or indirectly compete with certain portions of our business. As set forth in our Certificate of Incorporation, such non-employee directors and their affiliates shall not have any duty, to the fullest extent permitted by law, to refrain from (x) engaging in the same or similar business activities or lines of business in which we operate or propose to operate, (y) making investments in any kind of property in which we make or may make investments or (z) otherwise competing with us or any of our affiliates. Our Certificate of Incorporation also provides that if our non-employee directors or their affiliates acquire knowledge of a potential transaction that could be a corporate opportunity, they have no duty to communicate or offer such corporate opportunity to us or our affiliates, unless such corporate opportunity is expressly offered to the non-employee director solely in his or her capacity as one of our directors (or officers, if applicable).
Therefore, a non-employee director of our company may pursue certain acquisition opportunities that may be complementary to our business and, as a result, such acquisition opportunities may not be available to us. In addition, in the event that any of our non-employee directors or his or her affiliates acquires knowledge of a corporate opportunity or is offered a corporate opportunity, provided that this knowledge was not acquired solely in such person’s capacity as a director or officer of the Company, then to the fullest extent permitted by law such person is deemed to have fully satisfied such person’s fiduciary duties owed to us and is not liable to us if such director or its affiliates pursues or acquires the corporate opportunity or if such person did not present the corporate opportunity to us. These potential conflicts of interest could have a material adverse effect on our business, financial condition, results of operations, or prospects if attractive corporate opportunities are allocated by such non-employee directors to themselves or their other affiliates instead of to us.
ITEM 1B. UNRESOLVED STAFF COMMENTS
None.
ITEM 1C. CYBERSECURITY
We face risks associated with security breaches through cyber attacks, cyber intrusions or otherwise, and other significant disruptions of information technology networks and related systems. Refer to Risk Factors in Part I, Item 1A for a disclosure of our cybersecurity risks. We have not experienced a material information security breach and as a result, we have not incurred any material expenses. We continue to monitor cybersecurity risks to prevent and mitigate materially negative impacts on the Company’s reputation, financial performance, customer or vendor relationships and potential litigation or regulatory investigations or actions.
As part of its regular oversight of risk management, our audit committee is responsible for the oversight of cybersecurity risk and threat mitigation related to our information technology and information systems including protection and security of employee and customer data. Our Vice President – Technology Solutions is responsible for the day-to-day management of our cybersecurity program and reports directly to our President. Our Vice President – Technology Solutions has served in this role for over three years and has more than 25 years of experience in the aggregate, including ten years with the Company, in various information technology roles. Our audit committee is responsible for overseeing cybersecurity risks, and our management team reports to our audit committee on the Company’s cybersecurity program, current cybersecurity projects and industry trends and efforts to mitigate cybersecurity risk on at least a semi-annual basis.
We have a comprehensive program designed to mitigate cybersecurity risk. We have adopted and require employees to abide by our personally identifiable information policy to help protect personal employee, vendor and tenant information. Employees are required to complete regular cybersecurity training and education annually, which is followed-up with quarterly testing and re-training, as necessary. We also maintain an incident response plan which outlines our response and action in the event of a major cybersecurity incident. The cybersecurity incident response plan sets forth a process for detecting and responding to cybersecurity incidents, determining their scope and risk, developing an appropriate response to mitigate and remediate the incident, communicating effectively to all stakeholders and participants and reducing the likelihood of similar future incidents. In the event of a real or perceived cybersecurity incident, the Vice President – Technology Solutions would, as soon as practicable, inform management’s technology solutions steering committee, the members of which would then collaborate with the Vice President – Technology Solutions to manage material risks.
28
We contract with a third party to perform a cybersecurity risk and vulnerability assessment annually. We regularly test areas of potential vulnerability, utilizing penetration testing, ransomware-focused disaster recovery tests as well as testing exercises for other higher risk areas. We have also implemented most of the voluntary practices recommended under the National Institute of Standards and Technology cybersecurity framework. Additionally, the Company maintains cybersecurity risk insurance coverage.
ITEM 2. PROPERTIES
Refer to Management’s Discussion and Analysis of Financial Condition and Results of Operations included in Item 7 for additional information pertaining to our properties’ performance.
Malls, Lifestyle Centers and Outlet Centers
We owned a controlling interest in 40 malls, 4 lifestyle centers and 2 outlet centers as of December 31, 2023. We owned a non-controlling interest in 7 malls, 1 lifestyle center and 3 outlet centers as of December 31, 2023. Our malls, lifestyle centers and outlet centers generally have strong competitive positions because they are the only, or the dominant, regional property in their respective trade areas. The malls, lifestyle centers and outlet centers are generally anchored by two or more anchors or junior anchors and a wide variety of smaller stores. Anchor and junior anchor tenants own or lease their stores and non-anchor stores lease their locations.
We own the land underlying each property in fee simple interest, except for Brookfield Square, Dakota Square Mall, Meridian Mall, St. Clair Square, Stroud Mall and WestGate Mall. We lease all or a portion of the land at each of these properties subject to long-term ground leases.
The following table summarizes certain information for our portfolio of malls, lifestyle centers and outlet centers as of December 31, 2023 (dollars in thousands, except for sales per square foot amounts):
|
|
Number of |
|
Total Center |
|
|
Total |
|
|
In-Line |
|
|
Percentage |
|||
Malls |
|
47 |
|
|
40,943,587 |
|
|
|
13,096,851 |
|
|
$ |
402 |
|
|
89% |
Lifestyle Centers |
|
5 |
|
|
4,244,080 |
|
|
|
1,660,345 |
|
|
$ |
478 |
|
|
92% |
Outlet Centers |
|
5 |
|
|
1,880,089 |
|
|
|
1,743,796 |
|
|
$ |
451 |
|
|
92% |
Total Malls, Lifestyle Centers and Outlet Centers |
|
57 |
|
|
47,067,756 |
|
|
|
16,500,992 |
|
|
$ |
416 |
|
|
90% |
The following table sets forth certain information for each of the malls, lifestyle centers and outlet centers as of December 31, 2023 (dollars in thousands, except for sales per square foot amounts):
Property / Location |
|
Year of |
|
Year of |
|
Our |
|
Total Center |
|
|
Total |
|
|
In-Line |
|
|
Percentage |
|
|
Anchors & Junior |
||||
Malls: |
|
|
|
|
|
|
|
|
|
|
|
|
|
|
|
|
|
|
|
|
||||
Arbor Place |
|
1999 |
|
N/A |
|
100% |
|
|
1,163,791 |
|
|
|
308,868 |
|
|
|
382 |
|
|
|
95 |
% |
|
Belk, Conn's Home Plus, Dillard's, Forever 21, H&M, JC Penney, Macy's, former Overstock Furniture and Mattress, Regal Cinemas, former Sears (6) |
Brookfield Square (7) |
|
1967/2001 |
|
2008 |
|
100% |
|
|
865,347 |
|
|
|
307,314 |
|
|
|
218 |
|
|
|
68 |
% |
|
Barnes & Noble, former Boston Store (6), H&M, JC Penney, Movie Tavern by Marcus, Whirlyball |
CherryVale Mall |
|
1973/2001 |
|
2007 |
|
100% |
|
|
870,696 |
|
|
|
348,280 |
|
|
|
318 |
|
|
|
88 |
% |
|
Barnes & Noble, Galleria Furniture and Mattress, JC Penney, Macy's, Tilt Studio |
Coastal Grand Mall (8) |
|
2004 |
|
2007 |
|
50% |
|
|
1,117,231 |
|
|
|
341,665 |
|
|
|
448 |
|
|
|
98 |
% |
|
Future Crunch Fitness (9), Belk, Cinemark, Dick's Sporting Goods, Dillard's, H&M, JC Penney, former Sears, Stars & Strikes |
CoolSprings Galleria (8) |
|
1991 |
|
2015 |
|
50% |
|
|
1,167,654 |
|
|
|
432,308 |
|
|
|
636 |
|
|
|
94 |
% |
|
Belk Men's & Kid's, Belk Women's & Home, Dillard's, H&M, JC Penney, King's Dining & Entertainment, Macy's |
Cross Creek Mall |
|
1975/2003 |
|
2013 |
|
100% |
|
|
821,839 |
|
|
|
299,586 |
|
|
|
509 |
|
|
|
93 |
% |
|
Belk, H&M, JC Penney, Macy's, Main Event, Rooms to Go |
Dakota Square Mall |
|
1980/2012 |
|
2016 |
|
100% |
|
|
740,765 |
|
|
|
222,473 |
|
|
|
314 |
|
|
|
82 |
% |
|
AMC Theatres, Barnes & Noble, JC Penney, Scheels, Sleep Inn & Suites, Target, Tilt Studio |
East Towne Mall |
|
1971/2001 |
|
2004 |
|
100% |
|
|
801,260 |
|
|
|
211,971 |
|
|
|
303 |
|
|
|
89 |
% |
|
Barnes & Noble, former Boston Store (6), Dick's Sporting Goods, Flix Brewhouse, former |
29
Property / Location |
|
Year of |
|
Year of |
|
Our |
|
Total Center |
|
|
Total |
|
|
In-Line |
|
|
Percentage |
|
|
Anchors & Junior |
||||
Malls: |
|
|
|
|
|
|
|
|
|
|
|
|
|
|
|
|
|
|
|
|
||||
|
|
|
|
|
|
|
|
|
|
|
|
|
|
|
|
|
|
|
|
|
|
|
|
Gordman's, H&M, JC Penney, former Sears |
Eastland Mall |
|
1967/2005 |
|
N/A |
|
100% |
|
|
732,651 |
|
|
|
247,509 |
|
|
|
293 |
|
|
|
60 |
% |
|
Former Bergner's, Kohl's, former Macy's, Planet Fitness, former Sears |
Fayette Mall |
|
1971/2001 |
|
2014 |
|
100% |
|
|
1,159,381 |
|
|
|
461,104 |
|
|
|
490 |
|
|
|
98 |
% |
|
Dick's Sporting Goods, Dillard's, H&M, JC Penney, Macy's |
Frontier Mall |
|
1981 |
|
1997 |
|
100% |
|
|
523,699 |
|
|
|
203,579 |
|
|
|
314 |
|
|
|
88 |
% |
|
Former AMC Theatres, Dillard's, former Dillard's, Jax Outdoor Gear (6), JC Penney (6) |
Governor's Square (8)(10) |
|
1986 |
|
1999 |
|
47.5% |
|
|
685,143 |
|
|
|
238,261 |
|
|
|
398 |
|
|
|
96 |
% |
|
AMC Theatres, Belk, Best Buy, Dick's Sporting Goods, Dillard's, JC Penney, Ross Dress for Less, partial former Sears |
Hamilton Place |
|
1987 |
|
2016 |
|
90% |
|
|
1,160,594 |
|
|
|
330,973 |
|
|
|
471 |
|
|
|
93 |
% |
|
Barnes & Noble, Belk for Men, Kids & Home, Belk for Women, future Crunch Fitness, Dave & Buster's, Dick's Sporting Goods, Dillard's for Men, Kids & Home, Dillard's for Women, former Forever 21, H&M, JC Penney |
Hanes Mall |
|
1975/2001 |
|
1990 |
|
100% |
|
|
1,435,062 |
|
|
|
468,360 |
|
|
|
393 |
|
|
|
91 |
% |
|
Belk, Dave & Buster's, Dillard's, Encore, H&M, JC Penney, future Novant Health (6)(11), Truliant Federal Credit Union (6) |
Harford Mall |
|
1973/2003 |
|
2007 |
|
100% |
|
|
367,019 |
|
|
|
179,602 |
|
|
|
336 |
|
|
|
80 |
% |
|
Encore, Macy's, Macy's Furniture Gallery, future grocer (6)(12) |
Imperial Valley Mall |
|
2005 |
|
N/A |
|
100% |
|
|
762,736 |
|
|
|
214,096 |
|
|
|
422 |
|
|
|
98 |
% |
|
Cinemark, Dillard's, JC Penney, Macy's, former Sears (6) |
Jefferson Mall |
|
1978/2001 |
|
1999 |
|
100% |
|
|
783,558 |
|
|
|
225,011 |
|
|
|
339 |
|
|
|
95 |
% |
|
Dillard's, H&M, JC Penney, former Overstock Furniture and Mattress, Round1 Bowling & Amusement, Ross Dress for Less, partial former Sears |
Kentucky Oaks Mall (8)(10) |
|
1982/2001 |
|
1995 |
|
50% |
|
|
775,064 |
|
|
|
286,805 |
|
|
|
307 |
|
|
|
68 |
% |
|
Best Buy, Burlington (6), Dick's Sporting Goods, former Dillard's, former Dillard's Home Store, HomeGoods, JC Penney, Ross Dress for Less (6), Vertical Jump Park |
Kirkwood Mall |
|
1970/2012 |
|
2017 |
|
100% |
|
|
832,677 |
|
|
|
228,813 |
|
|
|
349 |
|
|
|
98 |
% |
|
H&M, I. Keating Furniture, JC Penney, Scheels, Target, Tilt |
Laurel Park Place |
|
1989/2005 |
|
1994 |
|
100% |
|
|
491,215 |
|
|
|
198,071 |
|
|
|
279 |
|
|
|
85 |
% |
|
Dunham Sports, Von Maur |
Layton Hills Mall |
|
1980/2006 |
|
1998 |
|
100% |
|
|
481,844 |
|
|
|
212,398 |
|
|
|
376 |
|
|
|
97 |
% |
|
Dick's Sporting Goods, Dillard's, JC Penney |
Mall del Norte |
|
1977/2004 |
|
1993 |
|
100% |
|
|
1,219,314 |
|
|
|
408,321 |
|
|
|
469 |
|
|
|
93 |
% |
|
Former Beall's, Cinemark, Dillard's, Foot Locker, H&M, JC Penney, Macy's, Macy's Home Store, Main Event, former Sears, TruFit Athletic Club |
Meridian Mall (13) |
|
1969/1998 |
|
2001 |
|
100% |
|
|
946,072 |
|
|
|
284,979 |
|
|
|
258 |
|
|
|
84 |
% |
|
Future Schuler Books & Music (14), Dick's Sporting Goods, H&M, High Caliber Karting, JC Penney, Launch Trampoline Park, Macy's, Planet Fitness, Schuler Books & Music, former Younkers |
Mid Rivers Mall |
|
1987/2007 |
|
2015 |
|
100% |
|
|
1,035,816 |
|
|
|
286,699 |
|
|
|
314 |
|
|
|
94 |
% |
|
Dick's Sporting Goods, Dillard's, H&M, JC Penney, Macy's, Marcus Theatres, former Sears, V-Stock |
Monroeville Mall |
|
1969/2004 |
|
2014 |
|
100% |
|
|
986,136 |
|
|
|
447,440 |
|
|
|
275 |
|
|
|
86 |
% |
|
Barnes & Noble, Cinemark, Dick's Sporting Goods, Forever 21, H&M, JC Penney, Macy's |
Northgate Mall |
|
1972/2011 |
|
2014 |
|
100% |
|
|
643,025 |
|
|
|
177,745 |
|
|
|
324 |
|
|
|
74 |
% |
|
Belk, former Burlington, former JC Penney (6), former Sears (6) |
Northpark Mall |
|
1972/2004 |
|
1996 |
|
100% |
|
|
896,044 |
|
|
|
278,320 |
|
|
|
348 |
|
|
|
81 |
% |
|
Dunham's Sports, H&M, JC Penney, Jo-Ann Fabrics & Crafts, former Macy's Children's & Home, former Macy's Women & Men's, former Sears, T.J. Maxx, Tilt, Vintage Stock |
Northwoods Mall |
|
1972/2001 |
|
1995 |
|
100% |
|
|
748,094 |
|
|
|
255,846 |
|
|
|
382 |
|
|
|
96 |
% |
|
Belk, Books-A-Million, Burlington (6), Dillard's, JC Penney, Planet Fitness |
Oak Park Mall (8) |
|
1974/2005 |
|
1998 |
|
50% |
|
|
1,516,526 |
|
|
|
429,356 |
|
|
|
501 |
|
|
|
98 |
% |
|
Barnes & Noble, Dillard's for Women, Dillard's for Men, Children & Home, Forever 21, |
30
Property / Location |
|
Year of |
|
Year of |
|
Our |
|
Total Center |
|
|
Total |
|
|
In-Line |
|
|
Percentage |
|
|
Anchors & Junior |
||||
Malls: |
|
|
|
|
|
|
|
|
|
|
|
|
|
|
|
|
|
|
|
|
||||
|
|
|
|
|
|
|
|
|
|
|
|
|
|
|
|
|
|
|
|
|
|
|
|
H&M, JC Penney, Macy's, Nordstrom |
Old Hickory Mall |
|
1967/2001 |
|
1994 |
|
100% |
|
|
538,668 |
|
|
|
161,573 |
|
|
|
331 |
|
|
|
75 |
% |
|
Belk, JC Penney, former Macy's, former Sears |
Parkdale Mall |
|
1972/2001 |
|
2018 |
|
100% |
|
|
1,088,002 |
|
|
|
294,013 |
|
|
313 |
|
|
|
89 |
% |
|
Former Ashley HomeStore, former Beall's, Crunch Fitness, Dick's Sporting Goods, Dillard's, Forever 21, H&M, HomeGoods, JC Penney, former Macy's, former Sears, Tilt, 2nd & Charles |
|
Parkway Place |
|
1957/1998 |
|
2002 |
|
100% |
|
|
647,838 |
|
|
|
278,660 |
|
|
|
424 |
|
|
|
91 |
% |
|
Belk, Dillard's |
Post Oak Mall |
|
1982 |
|
1985 |
|
100% |
|
|
788,279 |
|
|
|
300,754 |
|
|
|
312 |
|
|
|
93 |
% |
|
Former Bealls, City of College Station, Conn's Home Plus (6), Dillard's Men & Home, Dillard's Women & Children, Encore, JC Penney, future Murdoch's Farm & Ranch (6) |
Richland Mall |
|
1980/2002 |
|
1996 |
|
100% |
|
|
693,497 |
|
|
|
191,919 |
|
|
|
404 |
|
|
|
98 |
% |
|
Dick's Sporting Goods, Dillard's for Men, Kids & Home, Dillard's for Women (6), former Dillard's for Women, JC Penney, Tilt Studio |
South County Center |
|
1963/2007 |
|
2001 |
|
100% |
|
|
979,389 |
|
|
|
267,166 |
|
|
|
320 |
|
|
|
81 |
% |
|
Dick's Sporting Goods, Dillard's, JC Penney, Macy's, former Sears |
Southpark Mall |
|
1989/2003 |
|
2007 |
|
100% |
|
|
676,589 |
|
|
|
213,182 |
|
|
|
408 |
|
|
|
92 |
% |
|
Dick's Sporting Goods, Dick's Sporting Goods Fulfillment Center, H&M, JC Penney, Macy's, Regal Cinemas |
St. Clair Square (15) |
|
1974/1996 |
|
1993 |
|
100% |
|
|
1,068,343 |
|
|
|
291,088 |
|
|
|
359 |
|
|
|
97 |
% |
|
Dillard's, JC Penney, Macy's, former Sears |
Stroud Mall (16) |
|
1977/1998 |
|
2005 |
|
100% |
|
|
414,427 |
|
|
|
136,100 |
|
|
|
200 |
|
|
|
79 |
% |
|
Cinemark, EFO Furniture Outlet, JC Penney, Reaching Out For Jesus Christian Center, ShopRite |
Sunrise Mall |
|
1979/2003 |
|
2015 |
|
100% |
|
|
911,500 |
|
|
|
242,175 |
|
|
|
472 |
|
|
|
96 |
% |
|
Former Beall's, Cinemark, Dick's Sporting Goods, Dillard's, JC Penney, Main Event (6), TruFit (6), Wave Fashion |
Turtle Creek Mall |
|
1994 |
|
1995 |
|
100% |
|
|
844,980 |
|
|
|
191,593 |
|
|
|
344 |
|
|
|
94 |
% |
|
At Home, Belk, Dillard's, JC Penney, former Sears, Southwest Theaters, Urban Planet |
Valley View Mall |
|
1985/2003 |
|
2007 |
|
100% |
|
|
864,137 |
|
|
|
337,377 |
|
|
|
379 |
|
|
|
95 |
% |
|
Barnes & Noble, Belk, JC Penney, Macy's, Macy's for Home & Children, former Sears |
Volusia Mall |
|
1974/2004 |
|
2013 |
|
100% |
|
|
1,060,340 |
|
|
|
253,564 |
|
|
|
310 |
|
|
|
84 |
% |
|
Dillard's for Men & Home, Dillard's for Women, Dillard's for Juniors & Children, H&M, JC Penney, former Macy's, former Sears (6) |
West County Center (8) |
|
1969/2007 |
|
2002 |
|
50% |
|
|
1,199,168 |
|
|
|
385,218 |
|
|
|
803 |
|
|
|
92 |
% |
|
Barnes & Noble, Dick's Sporting Goods, Forever 21, H&M, JC Penney, Macy's, Nordstrom |
West Towne Mall |
|
1970/2001 |
|
2013 |
|
100% |
|
|
773,400 |
|
|
|
282,278 |
|
|
|
371 |
|
|
|
88 |
% |
|
Dave & Buster's (6), Dick's Sporting Goods, Forever 21, Hobby Lobby (6), JC Penney, Total Wine & More (6), Von Maur (6) |
Westmoreland Mall |
|
1977/2002 |
|
1994 |
|
100% |
|
|
976,584 |
|
|
|
286,853 |
|
|
|
319 |
|
|
|
95 |
% |
|
H&M, JC Penney, Live! Casino Pittsburgh, Macy's, Macy's Home Store, Old Navy, former Sears |
York Galleria |
|
1989/1999 |
|
N/A |
|
100% |
|
|
756,707 |
|
|
|
225,858 |
|
|
|
284 |
|
|
|
73 |
% |
|
Boscov's (6), H&M, Hollywood Casino, Life Storage (6), Marshalls, PA Fitness |
Total Malls |
|
|
|
|
|
|
|
|
40,012,101 |
|
|
|
12,875,124 |
|
|
$ |
402 |
|
|
|
89 |
% |
|
|
31
Property / Location |
|
Year of |
|
Year of |
|
Our |
|
Total Center |
|
|
Total |
|
|
In-Line |
|
|
Percentage |
|
|
Anchors & Junior |
||||
Lifestyle Centers: |
|
|
|
|
|
|
|
|
|
|
|
|
|
|
|
|
|
|
|
|
||||
Alamance Crossing West |
|
2011 |
|
N/A |
|
100% |
|
|
224,554 |
|
|
|
30,366 |
|
|
N/A |
|
|
|
100 |
% |
|
BJ's Wholesale Club, Dick's Sporting Goods, Kohl's |
|
Friendly Center and The Shops at Friendly (8) |
|
1957/ 2006/ 2007 |
|
2016 |
|
50% |
|
|
1,361,339 |
|
|
|
597,198 |
|
|
|
595 |
|
|
|
91 |
% |
|
Barnes & Noble, Belk, Belk Home Store, Harris Teeter, Macy's, O2 Fitness, Regal Cinemas, REI, Sears, Truist, Whole Foods (6) |
Mayfaire Town Center |
|
2004/2015 |
|
2017 |
|
100% |
|
|
671,653 |
|
|
|
330,272 |
|
|
|
433 |
|
|
|
95 |
% |
|
Barnes & Noble, Belk, Flip N Fly, The Fresh Market, H&M, Michaels, Regal Cinemas |
Pearland Town Center (17) |
|
2008 |
|
N/A |
|
100% |
|
|
711,659 |
|
|
|
306,072 |
|
|
|
373 |
|
|
|
93 |
% |
|
Barnes & Noble, Dick's Sporting Goods, Dillard's, Hospital Corporation of America, Macy's |
Southaven Towne Center |
|
2005 |
|
2013 |
|
100% |
|
|
607,519 |
|
|
|
184,423 |
|
|
|
316 |
|
|
|
81 |
% |
|
Dillard's, Havertys Furniture, JC Penney, Overstock Furniture and Mattress, Sportsman's Warehouse (6), Urban Air Adventure Park |
Total Lifestyle Centers |
|
|
|
|
|
|
|
|
3,576,724 |
|
|
|
1,448,331 |
|
|
$ |
478 |
|
|
|
92 |
% |
|
|
Property / Location |
|
Year of |
|
Year of |
|
Our |
|
Total Center |
|
|
Total |
|
|
In-Line |
|
|
Percentage |
|
|
Anchors & Junior |
||||
Outlet Centers: |
|
|
|
|
|
|
|
|
|
|
|
|
|
|
|
|
|
|
|
|
||||
The Outlet Shoppes at Atlanta (8)(10) |
|
2013 |
|
2015 |
|
50% |
|
|
410,697 |
|
|
|
385,890 |
|
|
|
509 |
|
|
|
96 |
% |
|
Saks Fifth Ave OFF 5TH |
The Outlet Shoppes at El Paso (8)(10) |
|
2007/2012 |
|
2014 |
|
50% |
|
|
433,246 |
|
|
|
411,207 |
|
|
|
597 |
|
|
|
94 |
% |
|
H&M |
The Outlet Shoppes at Gettysburg (10) |
|
2000/2012 |
|
N/A |
|
50% |
|
|
249,937 |
|
|
|
249,937 |
|
|
|
233 |
|
|
|
83 |
% |
|
None |
The Outlet Shoppes at Laredo (10) |
|
2017 |
|
N/A |
|
65% |
|
|
358,135 |
|
|
|
315,388 |
|
|
|
336 |
|
|
|
84 |
% |
|
H&M, Nike Factory Store |
The Outlet Shoppes of the Bluegrass (8)(10) |
|
2014 |
|
2015 |
|
65% |
|
|
428,074 |
|
|
|
381,374 |
|
|
|
418 |
|
|
|
97 |
% |
|
H&M, former Restoration Hardware Outlet |
Total Outlet Centers |
|
|
|
|
|
|
|
|
1,880,089 |
|
|
|
1,743,796 |
|
|
$ |
451 |
|
|
|
92 |
% |
|
|
|
|
|
|
|
|
|
|
|
|
|
|
|
|
|
|
|
|
|
|
|
||||
Total Malls, Lifestyle Centers and Outlet Centers |
|
|
45,468,914 |
|
|
|
16,067,251 |
|
|
$ |
416 |
|
|
|
90 |
% |
|
|
||||||
Excluded Properties (18) |
|
|
|
|
|
|
|
|
|
|
|
|
|
|
|
|
|
|
||
Property / Location |
|
Year of |
|
Year of |
|
Our |
|
Total Center |
|
|
Total |
|
|
In-Line |
|
Percentage |
|
Anchors & Junior |
||
Malls: |
|
|
|
|
|
|
|
|
|
|
|
|
|
|
|
|
|
|
||
WestGate Mall (19) |
|
1975/1995 |
|
1996 |
|
100% |
|
|
931,486 |
|
|
|
221,727 |
|
|
N/A |
|
N/A |
|
Former Bed Bath & Beyond, Belk, Dillard's, H&M, JC Penney, Overstock Furniture and Mattress, former Regal Cinemas, former Sears |
|
|
|
|
|
|
|
|
|
|
|
|
|
|
|
|
|
|
|
||
Lifestyle Centers: |
|
|
|
|
|
|
|
|
|
|
|
|
|
|
|
|
|
|
||
Alamance Crossing East |
|
2007 |
|
N/A |
|
100% |
|
|
667,356 |
|
|
|
212,014 |
|
|
N/A |
|
N/A |
|
Barnes & Noble, Belk, Carousel Cinemas, Dillard's, Hobby Lobby, JC Penny |
|
|
|
|
|
|
|
|
|
|
|
|
|
|
|
|
|
|
|
||
Total Excluded Properties |
|
|
|
|
|
|
|
|
1,598,842 |
|
|
|
433,741 |
|
|
|
|
|
|
|
32
Inline and Adjacent Freestanding Stores
The Malls have approximately 4,665 inline and adjacent freestanding stores. National and regional retail chains (excluding local franchises) lease approximately 69.8% of the occupied inline and adjacent freestanding store GLA. Although inline and adjacent freestanding stores occupy only 35.1% of the total Malls GLA (the remaining 64.9% is occupied by Anchors and Junior Anchors and a small percentage is vacant), the Malls received 83.4% of their total revenues from inline and adjacent freestanding stores for the year ended December 31, 2023.
Mall, Lifestyle Center and Outlet Center Lease Expirations
The following table summarizes the scheduled lease expirations for inline and adjacent freestanding stores as of December 31, 2023:
Year Ending |
|
Number of |
|
Annualized |
|
|
GLA of |
|
|
Average |
|
|
Expiring |
|
|
Expiring |
|
|||||
2024 |
|
686 |
|
$ |
54,871,208 |
|
|
|
1,758,822 |
|
|
$ |
31.20 |
|
|
|
13.4 |
% |
|
|
14.9 |
% |
2025 |
|
933 |
|
|
108,930,584 |
|
|
|
3,364,860 |
|
|
|
32.37 |
|
|
|
26.6 |
% |
|
|
28.5 |
% |
2026 |
|
634 |
|
|
81,873,673 |
|
|
|
2,238,618 |
|
|
|
36.57 |
|
|
|
20.0 |
% |
|
|
19.0 |
% |
2027 |
|
413 |
|
|
54,919,251 |
|
|
|
1,511,331 |
|
|
|
36.34 |
|
|
|
13.4 |
% |
|
|
12.8 |
% |
2028 |
|
353 |
|
|
51,211,164 |
|
|
|
1,253,720 |
|
|
|
40.85 |
|
|
|
12.5 |
% |
|
|
10.6 |
% |
2029 |
|
159 |
|
|
23,137,071 |
|
|
|
701,253 |
|
|
|
32.99 |
|
|
|
5.6 |
% |
|
|
5.9 |
% |
2030 |
|
92 |
|
|
14,595,537 |
|
|
|
377,509 |
|
|
|
38.66 |
|
|
|
3.6 |
% |
|
|
3.2 |
% |
2031 |
|
66 |
|
|
6,399,593 |
|
|
|
223,687 |
|
|
|
28.61 |
|
|
|
1.6 |
% |
|
|
1.9 |
% |
2032 |
|
53 |
|
|
6,754,156 |
|
|
|
162,231 |
|
|
|
41.63 |
|
|
|
1.6 |
% |
|
|
1.4 |
% |
2033 |
|
47 |
|
|
7,219,964 |
|
|
|
198,201 |
|
|
|
36.43 |
|
|
|
1.8 |
% |
|
|
1.7 |
% |
See page 51 for a comparison between rents on leases that expired in the current reporting period compared to rents on new and renewal leases executed in 2023.
Tenant Occupancy Costs
Occupancy cost is a tenant’s total cost of occupying its space, divided by its sales. Inline and adjacent freestanding store sales represent total sales amounts received from reporting tenants with space of less than 10,000 square feet.
33
The following table summarizes tenant occupancy costs as a percentage of total inline and adjacent freestanding store sales for reporting tenants less than 10,000 square feet, excluding license agreements, for each of the past three years:
|
|
Year Ended December 31, (1) |
|
|||||||||
|
|
2023 |
|
|
2022 |
|
|
2021 |
|
|||
In-line store sales (in millions) |
|
$ |
3,750 |
|
|
$ |
3,920 |
|
|
$ |
3,802 |
|
In-line tenant occupancy costs |
|
|
10.89 |
% |
|
|
10.41 |
% |
|
|
10.65 |
% |
Debt on Malls, Lifestyle Centers and Outlet Centers
Please see the table entitled “Mortgage Loans Outstanding at December 31, 2023” included herein for information regarding any liens or encumbrances related to the malls, lifestyle centers and outlet centers.
All Other Properties
All Other Properties include the following categories:
See Note 1 to the consolidated financial statements for additional information on the number of consolidated and unconsolidated properties in each of the above categories related to our other property types. The following tables set forth certain information for each of our other property types at December 31, 2023:
Property / Location |
|
Year of |
|
Company's |
|
Total |
|
|
Total |
|
|
Percentage |
|
Anchors & |
||
Open-Air Centers: |
|
|
|
|
|
|
|
|
|
|
|
|
|
|
||
Ambassador Town Center (4)(5) |
|
2016 |
|
65% |
|
|
419,904 |
|
|
|
265,931 |
|
|
100% |
|
Costco (6), Dick's Sporting Goods, Marshalls, Nordstrom Rack |
Annex at Monroeville |
|
1986 |
|
100% |
|
|
185,517 |
|
|
|
185,517 |
|
|
100% |
|
Dick's Sporting Goods, Full Throttle Adrenaline Park |
Coastal Grand Crossing (4) |
|
2005 |
|
50% |
|
|
37,234 |
|
|
|
37,234 |
|
|
100% |
|
PetSmart |
CoolSprings Crossing |
|
1992 |
|
100% |
|
|
366,451 |
|
|
|
78,810 |
|
|
100% |
|
American Signature Furniture (6), Electronic Express (6), Gabe's (7), Target (6), Urban Air Adventure Park (7) |
Courtyard at Hickory Hollow |
|
1979 |
|
100% |
|
|
68,468 |
|
|
|
68,468 |
|
|
100% |
|
AMC Theatres |
Fremaux Town Center (4)(5) |
|
2014/2015 |
|
65% |
|
|
621,432 |
|
|
|
493,432 |
|
|
95% |
|
Best Buy, Dick's Sporting Goods, Dillard's (6), Kohl's, LA Fitness, Marshalls, Michaels, T.J. Maxx |
Frontier Square |
|
1985 |
|
100% |
|
|
186,547 |
|
|
|
16,522 |
|
|
100% |
|
Ross Dress for Less (7), Target (6), T.J. Maxx (7) |
Governor's Square Plaza (4)(5) |
|
1985/1988 |
|
50% |
|
|
169,918 |
|
|
|
73,349 |
|
|
100% |
|
Hickory Farms, Jo-Ann Fabrics & Crafts, Target (6) |
Gunbarrel Pointe |
|
2000 |
|
100% |
|
|
273,913 |
|
|
|
147,913 |
|
|
100% |
|
Kohl's, Target (6), Whole Foods |
Hamilton Corner |
|
1990/2005 |
|
90% |
|
|
67,310 |
|
|
|
67,310 |
|
|
100% |
|
None |
Hamilton Crossing |
|
1987/2005 |
|
92% |
|
|
192,074 |
|
|
|
98,961 |
|
|
100% |
|
Electronic Express (7), HomeGoods (7), Michaels (7), T.J. Maxx |
Hammock Landing (4) |
|
2009/2015 |
|
50% |
|
|
569,535 |
|
|
|
345,568 |
|
|
100% |
|
Academy Sports + Outdoors, AMC Theatres, HomeGoods, Kohl's (6), Marshalls, Michaels, Ross Dress for Less, Target (6) |
Harford Annex |
|
1973/2003 |
|
100% |
|
|
107,656 |
|
|
|
107,656 |
|
|
100% |
|
Best Buy, Office Depot, PetSmart |
34
Property / Location |
|
Year of |
|
Company's |
|
Total |
|
|
Total |
|
|
Percentage |
|
Anchors & |
||
Open-Air Centers: |
|
|
|
|
|
|
|
|
|
|
|
|
|
|
||
The Landing at Arbor Place |
|
1999 |
|
100% |
|
|
162,958 |
|
|
|
113,717 |
|
|
88% |
|
Ben's Furniture and Antiques, Ollie's Bargain Outlet, One Life Fitness (7) |
Layton Hills Convenience Center |
|
1980 |
|
100% |
|
|
100,987 |
|
|
|
100,987 |
|
|
100% |
|
Tuesday Morning |
Layton Hills Plaza |
|
1989 |
|
100% |
|
|
18,836 |
|
|
|
18,836 |
|
|
92% |
|
None |
Parkdale Crossing |
|
2002 |
|
100% |
|
|
88,064 |
|
|
|
88,064 |
|
|
89% |
|
Barnes & Noble |
The Pavilion at Port Orange (4) |
|
2010 |
|
50% |
|
|
398,018 |
|
|
|
398,018 |
|
|
88% |
|
Belk, HomeGoods, Marshalls, Michaels, Regal Cinemas |
The Plaza at Fayette |
|
2006 |
|
100% |
|
|
209,535 |
|
|
|
209,535 |
|
|
89% |
|
Cinemark, Sports Center |
The Promenade |
|
2009/2014 |
|
100% |
|
|
621,526 |
|
|
|
404,566 |
|
|
100% |
|
Ashley Furniture HomeStore, Best Buy, Burlington, Dick's Sporting Goods, Kohl's (6), Marshalls, Michaels, Ross Dress for Less, Target (6) |
The Shoppes at Eagle Point (4) |
|
2018 |
|
50% |
|
|
243,805 |
|
|
|
243,805 |
|
|
99% |
|
Academy Sports + Outdoors, Publix, Ross Dress for Less |
The Shoppes at Hamilton Place |
|
2003 |
|
92% |
|
|
132,079 |
|
|
|
132,079 |
|
|
79% |
|
Former Bed Bath & Beyond, Marshalls, Ross Dress for Less |
The Shoppes at St. Clair Square |
|
2007 |
|
100% |
|
|
84,383 |
|
|
|
84,383 |
|
|
86% |
|
Barnes & Noble |
Sunrise Commons |
|
2001 |
|
100% |
|
|
205,656 |
|
|
|
104,211 |
|
|
100% |
|
Hobby Lobby (7), Marshalls, Ross Dress for Less |
The Terrace |
|
1997 |
|
92% |
|
|
158,109 |
|
|
|
158,109 |
|
|
100% |
|
Academy Sports + Outdoors, Nordstrom Rack, Party City |
West Towne Crossing |
|
1980 |
|
100% |
|
|
461,905 |
|
|
|
170,008 |
|
|
94% |
|
Barnes & Noble, Best Buy, Crunch Fitness (6), Kohl's (6), Metcalf's Markets (7), Nordstrom Rack, Office Max (7), Spare Time Entertainment (7) |
WestGate Crossing |
|
1985/1999 |
|
100% |
|
|
158,262 |
|
|
|
158,262 |
|
|
100% |
|
Big Air Trampoline Park, Hamricks, Jo-Ann Fabrics & Crafts |
Westmoreland Crossing |
|
2002 |
|
100% |
|
|
279,073 |
|
|
|
279,073 |
|
|
98% |
|
AMC Theatres, Dick's Sporting Goods, Levin Furniture, Michaels (7), T.J. Maxx (7) |
York Town Center (4) |
|
2007 |
|
50% |
|
|
297,371 |
|
|
|
247,371 |
|
|
85% |
|
Best Buy, Bob's Discount Furniture, Burlington, former Christmas Tree Shops, Dick's Sporting Goods (6), Ross Dress for Less |
Total Open-Air Centers |
|
|
|
|
|
|
6,886,526 |
|
|
|
4,897,695 |
|
|
96% |
|
|
35
Property / Location |
|
Year of |
|
Company's |
|
Total |
|
|
Total |
|
|
Percentage |
|
Anchors & |
||
Other: |
|
|
|
|
|
|
|
|
|
|
|
|
|
|
||
840 Greenbrier Circle Office |
|
1983 |
|
100% |
|
|
49,869 |
|
|
|
49,869 |
|
|
50% |
|
None |
Aloft Hotel (4)(5) |
|
2021 |
|
50% |
|
|
89,674 |
|
|
N/A |
|
|
N/A |
|
None |
|
CBL Center (8) |
|
2001 |
|
92% |
|
|
131,569 |
|
|
|
131,569 |
|
|
94% |
|
None |
CBL Center II (8) |
|
2008 |
|
92% |
|
|
70,770 |
|
|
|
70,770 |
|
|
61% |
|
None |
Pearland Office |
|
2009 |
|
100% |
|
|
66,915 |
|
|
|
66,915 |
|
|
87% |
|
None |
Total Other |
|
|
|
|
|
|
408,797 |
|
|
|
319,123 |
|
|
78% |
|
|
|
|
|
|
|
|
|
|
|
|
|
|
|
|
|
||
Total All Other Properties |
|
|
7,295,323 |
|
|
|
5,216,818 |
|
|
95% |
|
|
||||
All Other Properties Lease Expirations
The following table summarizes the scheduled lease expirations for tenants in occupancy at All Other Properties as of December 31, 2023:
Year Ending |
|
Number of |
|
|
Annualized |
|
|
GLA of |
|
|
Average |
|
|
Expiring |
|
|
Expiring |
|
||||||
2024 |
|
|
56 |
|
|
$ |
5,709,067 |
|
|
|
152,911 |
|
|
$ |
37.34 |
|
|
|
9.2 |
% |
|
|
6.3 |
% |
2025 |
|
|
70 |
|
|
|
10,649,077 |
|
|
|
400,027 |
|
|
|
26.62 |
|
|
|
17.2 |
% |
|
|
16.4 |
% |
2026 |
|
|
58 |
|
|
|
7,288,847 |
|
|
|
421,767 |
|
|
|
17.28 |
|
|
|
11.8 |
% |
|
|
17.3 |
% |
2027 |
|
|
49 |
|
|
|
11,152,642 |
|
|
|
477,879 |
|
|
|
23.34 |
|
|
|
18.0 |
% |
|
|
19.6 |
% |
2028 |
|
|
47 |
|
|
|
8,113,756 |
|
|
|
330,523 |
|
|
|
24.55 |
|
|
|
13.1 |
% |
|
|
13.5 |
% |
2029 |
|
|
26 |
|
|
|
6,014,966 |
|
|
|
216,388 |
|
|
|
27.80 |
|
|
|
9.7 |
% |
|
|
8.9 |
% |
2030 |
|
|
16 |
|
|
|
2,864,511 |
|
|
|
75,780 |
|
|
|
37.80 |
|
|
|
4.6 |
% |
|
|
3.1 |
% |
2031 |
|
|
17 |
|
|
|
5,505,741 |
|
|
|
194,136 |
|
|
|
28.36 |
|
|
|
8.9 |
% |
|
|
8.0 |
% |
2032 |
|
|
14 |
|
|
|
2,361,076 |
|
|
|
86,547 |
|
|
|
27.28 |
|
|
|
3.8 |
% |
|
|
3.5 |
% |
2033 |
|
|
13 |
|
|
|
2,340,721 |
|
|
|
84,015 |
|
|
|
27.86 |
|
|
|
3.8 |
% |
|
|
3.4 |
% |
Debt on All Other Properties
Please see the table entitled “Mortgage Loans Outstanding at December 31, 2023” included herein for information regarding any liens or encumbrances related to our All Other Properties.
36
Anchors and Junior Anchors
Anchors and Junior Anchors are an important factor in a property’s successful performance. However, over the past several years the number of traditional department store anchors have declined, providing us the opportunity to redevelop these spaces to attract new uses such as restaurants, entertainment, fitness centers, casinos, grocery stores and lifestyle retailers that engage consumers and encourage them to spend more time at our properties. Anchors are generally a department store or, increasingly, other large format tenants, including retailers whose merchandise appeals to a broad range of shoppers, and non-retail uses. Anchors play a significant role in generating customer traffic and creating a desirable location for the property's tenants.
Anchors and Junior Anchors may own their stores and the land underneath, as well as the adjacent parking areas, or may enter into long-term leases with respect to their stores. Rental rates for Anchor tenants are significantly lower than the rents charged to non-anchor tenants. Total revenues from Anchors and Junior Anchors accounted for 16.6% of the total revenues from our properties in 2023. Each Anchor and Junior Anchor that owns its store has entered into an operating and reciprocal easement agreement with us covering items such as operating covenants, reciprocal easements, property operations, initial construction and future expansion.
During 2023, the following Anchors and Junior Anchors were added to our properties:
Name |
|
Property |
|
Location |
Appliance Factory Mattress Kingdom (Owned by Others) |
|
Frontier Mall |
|
Cheyenne, WY |
Bob's Discount Furniture |
|
York Town Center |
|
York, PA |
Burlington |
|
York Town Center |
|
York, PA |
Conn's Home Plus (Owned by Others) |
|
Arbor Place |
|
Atlanta (Douglasville), GA |
Crunch Fitness (Owned by Others) |
|
Parkdale Mall |
|
Beaumont, TX |
Dick's Sporting Goods Fulfillment Center |
|
Southpark Mall |
|
Colonial Heights, VA |
Hickory Farms |
|
Governor's Square Plaza |
|
Clarksville, TN |
Hobby Lobby (Owned by Others) |
|
Sunrise Commons |
|
Brownsville, TX |
Main Event |
|
Cross Creek Mall |
|
Fayetteville, NC |
Marshalls |
|
Fremaux Town Center |
|
Slidell, LA |
Nordstrom Rack |
|
The Terrace |
|
Chattanooga, TN |
Stars and Strikes |
|
Coastal Grand Mall |
|
Myrtle Beach, SC |
Tilt |
|
Kirkwood Mall |
|
Bismarck, ND |
Truliant Federal Credit Union (Owned by Others) |
|
Hanes Mall |
|
Winston-Salem, NC |
Tuesday Morning |
|
Layton Hills Convenience Center |
|
Layton, UT |
As of December 31, 2023, our properties had a total of 447 Anchors and Junior Anchors, including 53 vacant Anchor and Junior Anchor locations, and excluding Anchors and Junior Anchors at Excluded Malls. The Anchors and Junior Anchors and the amount of GLA leased or owned by each as of December 31, 2023 is as follows:
|
|
Number of Stores |
|
Gross Leasable Area |
|
|
||||||||||
|
|
|
|
Anchor Owned |
|
|
|
|
|
Anchor Owned |
|
|
||||
Anchor/Junior Anchor |
|
Leased |
|
Owned |
|
Ground |
|
Total |
|
Leased |
|
Owned |
|
Ground |
|
Total Gross Leased Area |
JC Penney |
|
17 |
|
20 |
|
4 |
|
41 |
|
1,828,329 |
|
2,528,291 |
|
586,030 |
|
4,942,650 |
Dillard's |
|
— |
|
30 |
|
3 |
|
33 |
|
— |
|
4,225,177 |
|
559,612 |
|
4,784,789 |
Macy's |
|
8 |
|
12 |
|
3 |
|
23 |
|
905,442 |
|
1,943,839 |
|
658,388 |
|
3,507,669 |
Belk |
|
5 |
|
11 |
|
3 |
|
19 |
|
430,017 |
|
1,495,213 |
|
300,995 |
|
2,226,225 |
Sears |
|
— |
|
— |
|
1 |
|
1 |
|
— |
|
— |
|
147,766 |
|
147,766 |
Academy Sports + Outdoors |
|
3 |
|
— |
|
— |
|
3 |
|
199,091 |
|
— |
|
— |
|
199,091 |
AMC Theatres |
|
4 |
|
— |
|
1 |
|
5 |
|
160,295 |
|
— |
|
56,255 |
|
216,550 |
American Signature Furniture |
|
— |
|
1 |
|
— |
|
1 |
|
— |
|
61,620 |
|
— |
|
61,620 |
Appliance Factory Mattress Kingdom |
|
— |
|
1 |
|
— |
|
1 |
|
— |
|
59,314 |
|
— |
|
59,314 |
Ashley HomeStore |
|
1 |
|
— |
|
— |
|
1 |
|
20,000 |
|
— |
|
— |
|
20,000 |
At Home |
|
— |
|
1 |
|
— |
|
1 |
|
— |
|
124,700 |
|
— |
|
124,700 |
37
|
|
Number of Stores |
|
Gross Leasable Area |
|
|
||||||||||
|
|
|
|
Anchor Owned |
|
|
|
|
|
Anchor Owned |
|
|
||||
Anchor/Junior Anchor |
|
Leased |
|
Owned |
|
Ground |
|
Total |
|
Leased |
|
Owned |
|
Ground |
|
Total Gross Leased Area |
Barnes & Noble |
|
15 |
|
— |
|
— |
|
15 |
|
450,537 |
|
— |
|
— |
|
450,537 |
Ben's Furniture and Antiques |
|
1 |
|
— |
|
— |
|
1 |
|
35,895 |
|
— |
|
— |
|
35,895 |
Best Buy |
|
6 |
|
— |
|
1 |
|
7 |
|
216,640 |
|
— |
|
45,070 |
|
261,710 |
Big Air Trampoline Park |
|
1 |
|
— |
|
— |
|
1 |
|
33,938 |
|
— |
|
— |
|
33,938 |
BJ's Wholesale Club |
|
1 |
|
— |
|
— |
|
1 |
|
85,188 |
|
— |
|
— |
|
85,188 |
Bob's Discount Furniture |
|
1 |
|
— |
|
— |
|
1 |
|
20,308 |
|
— |
|
— |
|
20,308 |
Books-A-Million, Inc.: |
|
|
|
|
|
|
|
|
|
|
|
|
|
|
|
|
Books-A-Million |
|
1 |
|
— |
|
— |
|
1 |
|
20,642 |
|
— |
|
— |
|
20,642 |
2nd & Charles |
|
1 |
|
— |
|
— |
|
1 |
|
23,538 |
|
— |
|
— |
|
23,538 |
Books-A-Million, Inc. Subtotal |
|
2 |
|
— |
|
— |
|
2 |
|
44,180 |
|
— |
|
— |
|
44,180 |
Boscov's |
|
— |
|
1 |
|
— |
|
1 |
|
— |
|
150,000 |
|
— |
|
150,000 |
Burlington |
|
2 |
|
2 |
|
— |
|
4 |
|
51,437 |
|
94,049 |
|
— |
|
145,486 |
Cinemark |
|
7 |
|
— |
|
— |
|
7 |
|
382,506 |
|
— |
|
— |
|
382,506 |
City of College Station |
|
— |
|
1 |
|
— |
|
1 |
|
— |
|
103,888 |
|
— |
|
103,888 |
Conn's Home Plus |
|
— |
|
2 |
|
— |
|
2 |
|
— |
|
88,312 |
|
— |
|
88,312 |
Costco |
|
— |
|
1 |
|
— |
|
1 |
|
— |
|
153,973 |
|
— |
|
153,973 |
Crunch Fitness |
|
— |
|
2 |
|
— |
|
2 |
|
— |
|
128,067 |
|
— |
|
128,067 |
Dave & Buster's |
|
2 |
|
1 |
|
— |
|
3 |
|
61,316 |
|
26,509 |
|
— |
|
87,825 |
Dick's Sporting Goods Inc.: |
|
|
|
|
|
|
|
|
|
|
|
|
|
|
|
|
Dick's Sporting Goods |
|
23 |
|
1 |
|
1 |
|
25 |
|
1,368,063 |
|
50,000 |
|
80,515 |
|
1,498,578 |
Dick's Warehouse |
|
1 |
|
— |
|
— |
|
1 |
|
77,117 |
|
— |
|
— |
|
77,117 |
Dick's Sporting Goods Inc. Subtotal |
|
24 |
|
1 |
|
1 |
|
26 |
|
1,445,180 |
|
50,000 |
|
80,515 |
|
1,575,695 |
Dunham's Sports |
|
2 |
|
— |
|
— |
|
2 |
|
125,551 |
|
— |
|
— |
|
125,551 |
EFO Furniture & Mattress Outlet |
|
1 |
|
— |
|
— |
|
1 |
|
43,171 |
|
— |
|
— |
|
43,171 |
Electronic Express |
|
— |
|
2 |
|
— |
|
2 |
|
— |
|
87,573 |
|
— |
|
87,573 |
Encore |
|
3 |
|
— |
|
— |
|
3 |
|
76,096 |
|
— |
|
— |
|
76,096 |
Flip N Fly |
|
1 |
|
— |
|
— |
|
1 |
|
27,972 |
|
— |
|
— |
|
27,972 |
Flix Brewhouse |
|
1 |
|
— |
|
— |
|
1 |
|
39,150 |
|
— |
|
— |
|
39,150 |
Foot Locker |
|
1 |
|
— |
|
— |
|
1 |
|
22,847 |
|
— |
|
— |
|
22,847 |
Forever 21 |
|
6 |
|
— |
|
— |
|
6 |
|
157,141 |
|
— |
|
— |
|
157,141 |
Full Throttle Adrenaline Park |
|
1 |
|
— |
|
— |
|
1 |
|
64,135 |
|
— |
|
— |
|
64,135 |
The Fresh Market |
|
1 |
|
— |
|
— |
|
1 |
|
21,442 |
|
— |
|
— |
|
21,442 |
Gabe's |
|
— |
|
1 |
|
— |
|
1 |
|
— |
|
29,596 |
|
— |
|
29,596 |
Galleria Furniture and Mattress |
|
1 |
|
— |
|
— |
|
1 |
|
128,330 |
|
— |
|
— |
|
128,330 |
H&M |
|
27 |
|
— |
|
— |
|
27 |
|
594,150 |
|
— |
|
— |
|
594,150 |
Hamrick's |
|
1 |
|
— |
|
— |
|
1 |
|
40,000 |
|
— |
|
— |
|
40,000 |
Harris Teeter |
|
— |
|
— |
|
1 |
|
1 |
|
— |
|
— |
|
72,757 |
|
72,757 |
Havertys Furniture |
|
1 |
|
— |
|
— |
|
1 |
|
25,080 |
|
— |
|
— |
|
25,080 |
Hickory Farms |
|
1 |
|
— |
|
— |
|
1 |
|
23,708 |
|
— |
|
— |
|
23,708 |
High Caliber Karting |
|
1 |
|
— |
|
— |
|
1 |
|
100,683 |
|
— |
|
— |
|
100,683 |
Hobby Lobby |
|
— |
|
2 |
|
— |
|
2 |
|
— |
|
163,104 |
|
— |
|
163,104 |
Hollywood Casino |
|
1 |
|
— |
|
— |
|
1 |
|
79,500 |
|
— |
|
— |
|
79,500 |
Hospital Corporation of America |
|
1 |
|
— |
|
— |
|
1 |
|
48,000 |
|
— |
|
— |
|
48,000 |
I. Keating Furniture |
|
1 |
|
— |
|
— |
|
1 |
|
103,994 |
|
— |
|
— |
|
103,994 |
Jax Outdoor Gear |
|
— |
|
1 |
|
— |
|
1 |
|
— |
|
83,055 |
|
— |
|
83,055 |
Jo-Ann Fabrics & Crafts |
|
3 |
|
— |
|
— |
|
3 |
|
73,738 |
|
— |
|
— |
|
73,738 |
Kings Dining & Entertainment |
|
1 |
|
— |
|
— |
|
1 |
|
22,678 |
|
— |
|
— |
|
22,678 |
Kohl's |
|
2 |
|
4 |
|
1 |
|
7 |
|
142,205 |
|
312,731 |
|
83,000 |
|
537,936 |
LA Fitness |
|
1 |
|
— |
|
— |
|
1 |
|
41,000 |
|
— |
|
— |
|
41,000 |
Launch Trampoline Park |
|
1 |
|
— |
|
— |
|
1 |
|
31,989 |
|
— |
|
— |
|
31,989 |
Levin Furniture |
|
1 |
|
— |
|
— |
|
1 |
|
55,314 |
|
— |
|
— |
|
55,314 |
Life Storage |
|
— |
|
1 |
|
— |
|
1 |
|
— |
|
131,915 |
|
— |
|
131,915 |
Live! Casino Pittsburgh |
|
1 |
|
— |
|
— |
|
1 |
|
129,552 |
|
— |
|
— |
|
129,552 |
LIVE Ventures, Inc.: |
|
|
|
|
|
|
|
|
|
|
|
|
|
|
|
|
V-Stock |
|
1 |
|
— |
|
— |
|
1 |
|
23,058 |
|
— |
|
— |
|
23,058 |
Vintage Stock |
|
1 |
|
— |
|
— |
|
1 |
|
46,108 |
|
— |
|
— |
|
46,108 |
LIVE Ventures, Inc. Subtotal |
|
2 |
|
— |
|
— |
|
2 |
|
69,166 |
|
— |
|
— |
|
69,166 |
Macy's Furniture Gallery |
|
1 |
|
— |
|
— |
|
1 |
|
24,599 |
|
— |
|
— |
|
24,599 |
38
|
|
Number of Stores |
|
Gross Leasable Area |
|
|
||||||||||
|
|
|
|
Anchor Owned |
|
|
|
|
|
Anchor Owned |
|
|
||||
Anchor/Junior Anchor |
|
Leased |
|
Owned |
|
Ground |
|
Total |
|
Leased |
|
Owned |
|
Ground |
|
Total Gross Leased Area |
Main Event |
|
2 |
|
1 |
|
— |
|
3 |
|
99,344 |
|
64,103 |
|
— |
|
163,447 |
Marcus Theatres |
|
1 |
|
— |
|
— |
|
1 |
|
57,500 |
|
— |
|
— |
|
57,500 |
Metcalfe's Market |
|
— |
|
1 |
|
— |
|
1 |
|
— |
|
67,365 |
|
— |
|
67,365 |
Michaels |
|
6 |
|
1 |
|
— |
|
7 |
|
132,595 |
|
23,645 |
|
— |
|
156,240 |
Movie Tavern by Marcus |
|
1 |
|
— |
|
— |
|
1 |
|
40,585 |
|
— |
|
— |
|
40,585 |
Nickels and Dimes, Inc.: |
|
|
|
|
|
|
|
|
|
|
|
|
|
|
|
|
Tilt |
|
1 |
|
— |
|
— |
|
1 |
|
22,484 |
|
— |
|
— |
|
22,484 |
Tilt Studio |
|
5 |
|
— |
|
— |
|
5 |
|
347,046 |
|
— |
|
— |
|
347,046 |
Nickels and Dimes, Inc. Subtotal |
|
6 |
|
— |
|
— |
|
6 |
|
369,530 |
|
— |
|
— |
|
369,530 |
Nike Factory Store |
|
1 |
|
— |
|
— |
|
1 |
|
22,479 |
|
— |
|
— |
|
22,479 |
Nordstrom |
|
— |
|
— |
|
2 |
|
2 |
|
— |
|
— |
|
385,000 |
|
385,000 |
Nordstrom Rack |
|
3 |
|
— |
|
— |
|
3 |
|
80,131 |
|
— |
|
— |
|
80,131 |
O2 Fitness |
|
1 |
|
— |
|
— |
|
1 |
|
27,048 |
|
— |
|
— |
|
27,048 |
Office Depot |
|
1 |
|
— |
|
— |
|
1 |
|
23,425 |
|
— |
|
— |
|
23,425 |
OfficeMax |
|
— |
|
1 |
|
— |
|
1 |
|
— |
|
24,606 |
|
— |
|
24,606 |
Old Navy |
|
1 |
|
— |
|
— |
|
1 |
|
20,257 |
|
— |
|
— |
|
20,257 |
Ollie's Bargain Outlet |
|
1 |
|
— |
|
— |
|
1 |
|
28,446 |
|
— |
|
— |
|
28,446 |
One Life Fitness |
|
— |
|
1 |
|
— |
|
1 |
|
— |
|
49,241 |
|
— |
|
49,241 |
Overstock Furniture and Mattress |
|
1 |
|
— |
|
— |
|
1 |
|
59,360 |
|
— |
|
— |
|
59,360 |
PA Fitness |
|
1 |
|
— |
|
— |
|
1 |
|
30,664 |
|
— |
|
— |
|
30,664 |
Party City |
|
1 |
|
— |
|
— |
|
1 |
|
20,841 |
|
— |
|
— |
|
20,841 |
PetSmart |
|
2 |
|
— |
|
— |
|
2 |
|
46,248 |
|
— |
|
— |
|
46,248 |
Planet Fitness |
|
3 |
|
— |
|
— |
|
3 |
|
63,509 |
|
— |
|
— |
|
63,509 |
Publix |
|
1 |
|
— |
|
— |
|
1 |
|
45,600 |
|
— |
|
— |
|
45,600 |
Reaching Out For Jesus Christian Center |
|
1 |
|
— |
|
— |
|
1 |
|
43,632 |
|
— |
|
— |
|
43,632 |
Regal Cinemas |
|
3 |
|
1 |
|
1 |
|
5 |
|
188,365 |
|
57,854 |
|
60,400 |
|
306,619 |
REI |
|
1 |
|
— |
|
— |
|
1 |
|
24,427 |
|
— |
|
— |
|
24,427 |
Rooms To Go |
|
— |
|
1 |
|
— |
|
1 |
|
— |
|
45,000 |
|
— |
|
45,000 |
Ross Dress for Less |
|
8 |
|
2 |
|
— |
|
10 |
|
215,747 |
|
70,981 |
|
— |
|
286,728 |
Round1 Bowling & Amusement |
|
1 |
|
— |
|
— |
|
1 |
|
50,000 |
|
— |
|
— |
|
50,000 |
Saks Fifth Avenue OFF 5TH |
|
1 |
|
— |
|
— |
|
1 |
|
24,807 |
|
— |
|
— |
|
24,807 |
Scheel's |
|
1 |
|
— |
|
1 |
|
2 |
|
141,840 |
|
— |
|
81,296 |
|
223,136 |
Schuler Books & Music |
|
1 |
|
— |
|
— |
|
1 |
|
24,116 |
|
— |
|
— |
|
24,116 |
ShopRite |
|
1 |
|
— |
|
— |
|
1 |
|
87,381 |
|
— |
|
— |
|
87,381 |
Sleep Inn & Suites |
|
— |
|
— |
|
1 |
|
1 |
|
— |
|
— |
|
123,506 |
|
123,506 |
Southwest Theaters |
|
1 |
|
— |
|
— |
|
1 |
|
29,830 |
|
— |
|
— |
|
29,830 |
Spare Time Entertainment |
|
— |
|
1 |
|
— |
|
1 |
|
— |
|
21,200 |
|
— |
|
21,200 |
Sports Center |
|
1 |
|
— |
|
— |
|
1 |
|
60,000 |
|
— |
|
— |
|
60,000 |
Sportsman's Warehouse |
|
— |
|
1 |
|
— |
|
1 |
|
— |
|
48,171 |
|
— |
|
48,171 |
Stars and Strikes |
|
1 |
|
— |
|
— |
|
1 |
|
52,727 |
|
— |
|
— |
|
52,727 |
Target |
|
— |
|
8 |
|
— |
|
8 |
|
— |
|
948,730 |
|
— |
|
948,730 |
The TJX Companies, Inc.: |
|
|
|
|
|
|
|
|
|
|
|
|
|
|
|
|
HomeGoods |
|
4 |
|
1 |
|
— |
|
5 |
|
97,277 |
|
26,355 |
|
— |
|
123,632 |
Marshalls |
|
8 |
|
— |
|
— |
|
8 |
|
229,182 |
|
— |
|
— |
|
229,182 |
T.J. Maxx |
|
4 |
|
1 |
|
— |
|
5 |
|
109,031 |
|
28,081 |
|
— |
|
137,112 |
The TJX Companies, Inc. Subtotal |
|
16 |
|
2 |
|
— |
|
18 |
|
435,490 |
|
54,436 |
|
— |
|
489,926 |
Total Wine and More |
|
— |
|
1 |
|
— |
|
1 |
|
— |
|
28,350 |
|
— |
|
28,350 |
TruFit |
|
1 |
|
1 |
|
— |
|
2 |
|
45,179 |
|
43,145 |
|
— |
|
88,324 |
Truist |
|
— |
|
— |
|
1 |
|
1 |
|
— |
|
— |
|
60,000 |
|
60,000 |
Truliant Federal Credit Union |
|
— |
|
1 |
|
— |
|
1 |
|
— |
|
150,447 |
|
— |
|
150,447 |
Tuesday Morning |
|
1 |
|
— |
|
— |
|
1 |
|
32,586 |
|
— |
|
— |
|
32,586 |
Urban Air Adventure Park |
|
1 |
|
1 |
|
— |
|
2 |
|
33,860 |
|
30,404 |
|
— |
|
64,264 |
Urban Planet |
|
1 |
|
— |
|
— |
|
1 |
|
30,463 |
|
— |
|
— |
|
30,463 |
Vertical Trampoline Park |
|
1 |
|
— |
|
— |
|
1 |
|
24,972 |
|
— |
|
— |
|
24,972 |
Von Maur |
|
— |
|
2 |
|
— |
|
2 |
|
— |
|
232,377 |
|
— |
|
232,377 |
Wave Fashion |
|
1 |
|
— |
|
— |
|
1 |
|
27,978 |
|
— |
|
— |
|
27,978 |
WhirlyBall |
|
1 |
|
— |
|
— |
|
1 |
|
27,094 |
|
— |
|
— |
|
27,094 |
Whole Foods |
|
1 |
|
— |
|
1 |
|
2 |
|
26,841 |
|
— |
|
34,320 |
|
61,161 |
39
|
|
Number of Stores |
|
Gross Leasable Area |
|
|
||||||||||
|
|
|
|
Anchor Owned |
|
|
|
|
|
Anchor Owned |
|
|
||||
Anchor/Junior Anchor |
|
Leased |
|
Owned |
|
Ground |
|
Total |
|
Leased |
|
Owned |
|
Ground |
|
Total Gross Leased Area |
|
|
|
|
|
|
|
|
|
|
|
|
|
|
|
|
|
Vacant Anchor/Junior Anchor: |
|
|
|
|
|
|
|
|
|
|
|
|
|
|
|
|
Vacant - former AMC Theaters (Carmike Cinema) |
|
1 |
|
— |
|
— |
|
1 |
|
31,119 |
|
— |
|
— |
|
31,119 |
Vacant - former Ashley HomeStore |
|
1 |
|
— |
|
— |
|
1 |
|
20,487 |
|
— |
|
— |
|
20,487 |
Vacant - former Bealls |
|
4 |
|
— |
|
— |
|
4 |
|
151,209 |
|
— |
|
— |
|
151,209 |
Vacant - former Bed Bath & Beyond |
|
1 |
|
— |
|
— |
|
1 |
|
28,000 |
|
— |
|
— |
|
28,000 |
Vacant - former Bergner's |
|
1 |
|
— |
|
— |
|
1 |
|
131,616 |
|
— |
|
— |
|
131,616 |
Vacant - former Boston Store |
|
— |
|
2 |
|
— |
|
2 |
|
— |
|
354,205 |
|
— |
|
354,205 |
Vacant - former Burlington |
|
1 |
|
— |
|
— |
|
1 |
|
63,013 |
|
— |
|
— |
|
63,013 |
Vacant - former Christmas Tree Shops |
|
1 |
|
— |
|
— |
|
1 |
|
33,992 |
|
— |
|
— |
|
33,992 |
Vacant - former Dillard's |
|
2 |
|
1 |
|
— |
|
3 |
|
116,376 |
|
99,828 |
|
— |
|
216,204 |
Vacant - former Forever 21 (1) |
|
— |
|
1 |
|
— |
|
1 |
|
— |
|
57,500 |
|
— |
|
57,500 |
Vacant - former Gordman's |
|
1 |
|
— |
|
— |
|
1 |
|
47,943 |
|
— |
|
— |
|
47,943 |
Vacant - former JC Penney |
|
— |
|
1 |
|
— |
|
1 |
|
— |
|
158,771 |
|
— |
|
158,771 |
Vacant - former Macy's |
|
4 |
|
2 |
|
— |
|
6 |
|
361,246 |
|
242,530 |
|
— |
|
603,776 |
Vacant - former Overstock Furniture and Mattress |
|
2 |
|
— |
|
— |
|
2 |
|
119,775 |
|
— |
|
— |
|
119,775 |
Vacant - former Restoration Hardware Outlet |
|
1 |
|
— |
|
— |
|
1 |
|
24,558 |
|
— |
|
— |
|
24,558 |
Vacant - former Sears |
|
5 |
|
11 |
|
3 |
|
19 |
|
551,078 |
|
1,436,277 |
|
476,059 |
|
2,463,414 |
Vacant - former Younkers |
|
1 |
|
— |
|
— |
|
1 |
|
93,597 |
|
— |
|
— |
|
93,597 |
|
|
|
|
|
|
|
|
|
|
|
|
|
|
|
|
|
Current Developments: |
|
|
|
|
|
|
|
|
|
|
|
|
|
|
|
|
Crunch Fitness (2)(3) |
|
2 |
|
— |
|
— |
|
2 |
|
60,135 |
|
— |
|
— |
|
60,135 |
Future grocer (4) |
|
— |
|
1 |
|
— |
|
1 |
|
— |
|
161,358 |
|
— |
|
161,358 |
Murdoch's Farm & Ranch |
|
— |
|
1 |
|
— |
|
1 |
|
— |
|
60,241 |
|
— |
|
60,241 |
Novant Health (5) |
|
— |
|
1 |
|
— |
|
1 |
|
— |
|
174,643 |
|
— |
|
174,643 |
Schuler Books & Music (6) |
|
1 |
|
— |
|
— |
|
1 |
|
30,432 |
|
— |
|
— |
|
30,432 |
|
|
|
|
|
|
|
|
|
|
|
|
|
|
|
|
|
Total Anchors/Junior Anchors |
|
272 |
|
146 |
|
29 |
|
447 |
|
13,340,963 |
|
16,746,334 |
|
3,810,969 |
|
33,898,266 |
40
Mortgage Loans Outstanding at December 31, 2023 (in thousands):
Property |
|
Our |
|
|
Stated |
|
|
Principal |
|
|
2024 |
|
|
Maturity |
|
Optional |
|
|
Balloon |
|
|
Footnote |
|||||||
Consolidated Debt |
|
|
|
|
|
|
|
|
|
|
|
|
|
|
|
|
|
|
|
|
|
|
|
||||||
Malls: |
|
|
|
|
|
|
|
|
|
|
|
|
|
|
|
|
|
|
|
|
|
|
|
||||||
Arbor Place |
|
|
100 |
% |
|
|
5.10 |
% |
|
$ |
93,452 |
|
|
$ |
7,942 |
|
|
May-26 |
|
|
— |
|
|
$ |
85,754 |
|
|
|
|
Cross Creek Mall |
|
|
100 |
% |
|
|
8.19 |
% |
|
|
92,363 |
|
|
|
12,000 |
|
|
Jun-25 |
|
|
— |
|
|
|
85,315 |
|
|
|
|
Fayette Mall |
|
|
100 |
% |
|
|
4.25 |
% |
|
|
119,303 |
|
|
|
4,922 |
|
|
May-24 |
|
May-26 |
|
|
|
116,470 |
|
|
(3) |
|
|
Hamilton Place |
|
|
90 |
% |
|
|
4.36 |
% |
|
|
91,649 |
|
|
|
6,400 |
|
|
Jun-26 |
|
|
— |
|
|
|
85,535 |
|
|
|
|
Jefferson Mall |
|
|
100 |
% |
|
|
4.75 |
% |
|
|
53,526 |
|
|
|
4,456 |
|
|
Jun-26 |
|
|
— |
|
|
|
48,722 |
|
|
|
|
Northwoods Mall |
|
|
100 |
% |
|
|
5.08 |
% |
|
|
54,086 |
|
|
|
4,743 |
|
|
Apr-26 |
|
|
— |
|
|
|
49,421 |
|
|
|
|
Parkdale Mall & Crossing |
|
|
100 |
% |
|
|
5.85 |
% |
|
|
58,216 |
|
|
|
7,241 |
|
|
Mar-26 |
|
|
— |
|
|
|
49,380 |
|
|
|
|
Southpark Mall |
|
|
100 |
% |
|
|
4.85 |
% |
|
|
51,719 |
|
|
|
4,240 |
|
|
Jun-26 |
|
|
— |
|
|
|
47,368 |
|
|
|
|
Volusia Mall |
|
|
100 |
% |
|
|
4.56 |
% |
|
|
36,613 |
|
|
|
2,249 |
|
|
May-26 |
|
|
— |
|
|
|
35,190 |
|
|
|
|
|
|
|
|
|
|
|
|
|
650,927 |
|
|
|
54,193 |
|
|
|
|
|
|
|
|
603,155 |
|
|
|
|
|||
Outlet Centers: |
|
|
|
|
|
|
|
|
|
|
|
|
|
|
|
|
|
|
|
|
|
|
|
||||||
The Outlet Shoppes at Gettysburg |
|
|
50 |
% |
|
|
4.80 |
% |
|
|
20,646 |
|
|
|
1,323 |
|
|
Oct-25 |
|
|
— |
|
|
|
20,044 |
|
|
|
|
The Outlet Shoppes at Laredo |
|
|
65 |
% |
|
|
8.84 |
% |
|
|
33,780 |
|
|
|
4,001 |
|
|
Jun-25 |
|
|
— |
|
|
|
31,980 |
|
|
|
|
|
|
|
|
|
|
|
|
|
54,426 |
|
|
|
5,324 |
|
|
|
|
|
|
|
|
52,024 |
|
|
|
|
|||
|
|
|
|
|
|
|
|
|
|
|
|
|
|
|
|
|
|
|
|
|
|
|
|
||||||
Open-Air Centers, Outparcels and Other: |
|
|
|
|
|
|
|
|
|
|
|
|
|
|
|
|
|
|
|
|
|
|
|
||||||
Brookfield Square Anchor Redevelopment |
|
|
100 |
% |
|
|
8.24 |
% |
|
|
15,339 |
|
|
|
1,299 |
|
|
Dec-24 |
|
|
— |
|
|
|
15,339 |
|
|
(4)(5) |
|
Hamilton Place open-air centers loan |
|
90% - 92% |
|
|
|
5.85 |
% |
|
|
65,000 |
|
|
|
3,803 |
|
|
Jun-32 |
|
|
— |
|
|
|
58,208 |
|
|
|
|
|
Open-air centers and outparcels loan |
|
|
100 |
% |
|
|
8.20 |
% |
|
|
358,360 |
|
|
|
31,939 |
|
|
Jun-27 |
|
Jun-29 |
|
|
|
358,360 |
|
|
(6) |
|
|
|
|
|
|
|
|
|
|
|
438,699 |
|
|
|
37,041 |
|
|
|
|
|
|
|
|
431,907 |
|
|
|
|
|||
Corporate Debt: |
|
|
|
|
|
|
|
|
|
|
|
|
|
|
|
|
|
|
|
|
|
|
|
||||||
Secured term loan |
|
|
100 |
% |
|
|
8.21 |
% |
|
|
799,914 |
|
|
|
85,530 |
|
|
Nov-25 |
|
Nov-26/Nov-27 |
|
|
|
749,621 |
|
|
|
|
|
|
|
|
|
|
|
|
|
|
|
|
|
|
|
|
|
|
|
|
|
|
|
|
|
||||||
Total Consolidated Debt |
|
|
|
|
|
|
|
$ |
1,943,966 |
|
|
$ |
182,088 |
|
|
|
|
|
|
|
$ |
1,836,707 |
|
|
|
|
|||
|
|
|
|
|
|
|
|
|
|
|
|
|
|
|
|
|
|
|
|
|
|
|
|
||||||
Unconsolidated Debt |
|
|
|
|
|
|
|
|
|
|
|
|
|
|
|
|
|
|
|
|
|
|
|
||||||
Malls: |
|
|
|
|
|
|
|
|
|
|
|
|
|
|
|
|
|
|
|
|
|
|
|
||||||
Coastal Grand Mall |
|
|
50 |
% |
|
|
4.09 |
% |
|
$ |
97,014 |
|
|
$ |
4,383 |
|
|
Aug-24 |
|
|
— |
|
|
$ |
95,249 |
|
|
|
|
CoolSprings Galleria |
|
|
50 |
% |
|
|
4.84 |
% |
|
|
140,276 |
|
|
|
9,803 |
|
|
May-28 |
|
|
— |
|
|
|
125,774 |
|
|
|
|
Oak Park Mall |
|
|
50 |
% |
|
|
3.97 |
% |
|
|
257,098 |
|
|
|
15,755 |
|
|
Oct-25 |
|
|
— |
|
|
|
247,061 |
|
|
|
|
West County Center |
|
|
50 |
% |
|
|
3.40 |
% |
|
|
152,383 |
|
|
|
9,441 |
|
|
Dec-24 |
|
Dec-26 |
|
|
|
148,136 |
|
|
|
|
|
|
|
|
|
|
|
|
|
|
646,771 |
|
|
|
39,382 |
|
|
|
|
|
|
|
|
616,220 |
|
|
|
|
|||
Outlet Centers: |
|
|
|
|
|
|
|
|
|
|
|
|
|
|
|
|
|
|
|
|
|
|
|
||||||
The Outlet Shoppes at Atlanta |
|
|
50 |
% |
|
|
7.85 |
% |
|
|
79,330 |
|
|
|
6,331 |
|
|
Oct-33 |
|
|
— |
|
|
|
79,330 |
|
|
|
|
The Outlet Shoppes at El Paso |
|
|
50 |
% |
|
|
5.10 |
% |
|
|
68,743 |
|
|
|
4,888 |
|
|
Oct-28 |
|
|
— |
|
|
|
61,342 |
|
|
|
|
The Outlet Shoppes of the Bluegrass |
|
|
65 |
% |
|
|
4.05 |
% |
|
|
63,098 |
|
|
|
4,299 |
|
|
Dec-24 |
|
|
— |
|
|
|
61,316 |
|
|
|
|
|
|
|
|
|
|
|
|
|
211,171 |
|
|
|
15,518 |
|
|
|
|
|
|
|
|
201,988 |
|
|
|
|
|||
|
|
|
|
|
|
|
|
|
|
|
|
|
|
|
|
|
|
|
|
|
|
|
|
||||||
Lifestyle Centers: |
|
|
|
|
|
|
|
|
|
|
|
|
|
|
|
|
|
|
|
|
|
|
|
||||||
Friendly Center |
|
|
50 |
% |
|
|
6.44 |
% |
|
|
146,747 |
|
|
|
11,577 |
|
|
May-28 |
|
|
— |
|
|
|
137,038 |
|
|
|
|
|
|
|
|
|
|
|
|
|
|
|
|
|
|
|
|
|
|
|
|
|
|
|
|
||||||
Open-Air Centers, Outparcels and Other: |
|
|
|
|
|
|
|
|
|
|
|
|
|
|
|
|
|
|
|
|
|
|
|
||||||
Ambassador Town Center |
|
|
65 |
% |
|
|
4.35 |
% |
|
|
41,047 |
|
|
|
2,809 |
|
|
Jun-29 |
|
|
— |
|
|
|
34,953 |
|
|
|
|
Ambassador Town Center Infrastructure Improvements |
|
|
65 |
% |
|
|
3.00 |
% |
|
|
5,749 |
|
|
|
1,485 |
|
|
Mar-25 |
|
|
— |
|
|
|
2,859 |
|
|
(4) |
|
Coastal Grand Mall - Dick's Sporting Goods |
|
|
50 |
% |
|
|
5.05 |
% |
|
|
6,749 |
|
|
|
424 |
|
|
Nov-24 |
|
|
— |
|
|
|
6,652 |
|
|
|
|
Coastal Grand Mall Outparcel |
|
|
50 |
% |
|
|
4.09 |
% |
|
|
4,681 |
|
|
|
212 |
|
|
Aug-24 |
|
|
— |
|
|
|
4,596 |
|
|
|
|
Fremaux Town Center |
|
|
65 |
% |
|
|
3.70 |
% |
|
|
57,954 |
|
|
|
4,480 |
|
|
Jun-26 |
|
|
— |
|
|
|
52,130 |
|
|
|
|
Friendly Center Medical Office |
|
|
25 |
% |
|
|
6.11 |
% |
|
|
83 |
|
|
|
5 |
|
|
Jun-30 |
|
|
— |
|
|
|
83 |
|
|
(4) |
|
Hamilton Place Aloft Hotel |
|
|
50 |
% |
|
|
7.90 |
% |
|
|
16,170 |
|
|
|
1,401 |
|
|
Nov-24 |
|
|
— |
|
|
|
15,871 |
|
|
|
|
Hammock Landing - Phase I |
|
|
50 |
% |
|
|
8.09 |
% |
|
|
35,337 |
|
|
|
4,525 |
|
|
Feb-25 |
|
Feb-26 |
|
|
|
33,215 |
|
|
(7) |
|
|
Hammock Landing - Phase II |
|
|
50 |
% |
|
|
8.09 |
% |
|
|
11,106 |
|
|
|
1,222 |
|
|
Feb-25 |
|
Feb-26 |
|
|
|
10,686 |
|
|
(7) |
|
|
Northgate Mall Developments |
|
|
50 |
% |
|
|
8.25 |
% |
|
|
4,787 |
|
|
|
372 |
|
|
Nov-25 |
|
|
— |
|
|
|
4,787 |
|
|
|
|
The Pavilion at Port Orange |
|
|
50 |
% |
|
|
8.09 |
% |
|
|
47,148 |
|
|
|
6,387 |
|
|
Feb-25 |
|
Feb-26 |
|
|
|
44,048 |
|
|
(7) |
|
|
The Shoppes at Eagle Point |
|
|
50 |
% |
|
|
5.40 |
% |
|
|
39,117 |
|
|
|
2,695 |
|
|
May-32 |
|
|
— |
|
|
|
32,998 |
|
|
|
|
41
Property |
|
Our |
|
|
Stated |
|
|
Principal |
|
|
2024 |
|
|
Maturity |
|
Optional |
|
|
Balloon |
|
|
Footnote |
|||||||
York Town Center |
|
|
50 |
% |
|
|
4.75 |
% |
|
|
29,809 |
|
|
|
2,190 |
|
|
Mar-25 |
|
|
— |
|
|
|
28,900 |
|
|
|
|
|
|
|
|
|
|
|
|
|
299,737 |
|
|
|
28,207 |
|
|
|
|
|
|
|
|
271,778 |
|
|
|
|
|||
|
|
|
|
|
|
|
|
|
|
|
|
|
|
|
|
|
|
|
|
|
|
|
|
||||||
Excluded Malls: |
|
|
|
|
|
|
|
|
|
|
|
|
|
|
|
|
|
|
|
|
|
|
|
||||||
Alamance Crossing |
|
|
100 |
% |
|
|
5.83 |
% |
|
|
41,122 |
|
|
|
— |
|
|
Jul-21 |
|
|
— |
|
|
|
41,122 |
|
|
(8) |
|
WestGate Mall |
|
|
100 |
% |
|
|
4.99 |
% |
|
|
28,661 |
|
|
|
— |
|
|
Jul-22 |
|
|
— |
|
|
|
28,661 |
|
|
(8) |
|
|
|
|
|
|
|
|
|
|
69,783 |
|
|
|
— |
|
|
|
|
|
|
|
|
69,783 |
|
|
|
|
|||
|
|
|
|
|
|
|
|
|
|
|
|
|
|
|
|
|
|
|
|
|
|
|
|
||||||
Total Unconsolidated Debt |
|
|
|
|
|
|
|
$ |
1,374,209 |
|
|
$ |
94,684 |
|
|
|
|
|
|
|
$ |
1,296,807 |
|
|
|
|
|||
Total Consolidated and Unconsolidated Debt |
|
|
|
|
|
|
|
$ |
3,318,175 |
|
|
$ |
276,772 |
|
|
|
|
|
|
|
$ |
3,133,514 |
|
|
|
|
|||
Company's Pro-Rata Share of Total Debt |
|
|
|
|
|
|
|
$ |
2,656,348 |
|
|
$ |
228,363 |
|
|
|
|
|
|
|
|
|
|
(9) |
|
||||
The following is a reconciliation of consolidated debt to our pro rata share of total debt, including debt discounts and unamortized deferred financing costs (in thousands):
Total consolidated debt |
|
$ |
1,943,966 |
|
Noncontrolling interests' share of consolidated debt |
|
|
(36,844 |
) |
Company's share of unconsolidated debt |
|
|
679,443 |
|
Other debt (1) |
|
|
69,783 |
|
Unamortized deferred financing costs |
|
|
(16,169 |
) |
Unamortized debt discounts |
|
|
(38,236 |
) |
Company's pro rata share of total debt |
|
$ |
2,601,943 |
|
See Note 7 and Note 8 to the consolidated financial statements for additional information regarding property-specific indebtedness.
ITEM 3. LEGAL PROCEEDINGS
The information in response to this Item 3 is incorporated by reference herein from Note 14. Contingencies.
ITEM 4. MINE SAFETY DISCLOSURES
Not applicable.
42
PART II
ITEM 5. MARKET FOR REGISTRANT’S COMMON EQUITY, RELATED STOCKHOLDER MATTERS AND ISSUER PURCHASES OF EQUITY SECURITIES
Market Information
Our common stock trades on the New York Stock Exchange under the symbol "CBL".
Holders
There were approximately 543 shareholders of record for our common stock as of February 26, 2024. A substantially greater number of holders of our common stock are “street name” or beneficial holders, whose shares of record are held by banks, brokers and other financial institutions.
Dividends
The decision to declare and pay dividends on any outstanding shares of our common stock, as well as the timing, amount and composition of any such future dividends, will be at the sole discretion of our board of directors and will depend on our earnings, taxable income, FFO, liquidity, financial condition, capital requirements, contractual prohibitions or other limitations under our then-current indebtedness, the annual distribution requirements under the REIT provisions of the Internal Revenue Code, Delaware law and such other factors as our board of directors deems relevant. Our actual results of operations will be affected by a number of factors, including the revenues received from our properties, our operating expenses, interest expense, unanticipated capital expenditures and the ability of the anchors and tenants at our properties to meet their obligations for payment of rents and tenant reimbursements. For additional information, see discussion presented under the subheading “Dividends” in Note 9 of this report.
Issuances Under Equity Compensation Plans
See Part III, Item 12 contained herein for information regarding securities authorized for issuance under equity compensation plans.
Issuer Purchases of Equity Securities
The table below presents information with respect to repurchases of common stock made by us during the three months ended December 31, 2023. Subsequent to December 31, 2023, we repurchased common stock as part of our share repurchase program. See Note 20 for additional information.
Period |
|
Total |
|
|
Average |
|
|
Total Number of |
|
|
Approximate Dollar |
|
||||
October 1–31, 2023 |
|
|
10,304 |
|
|
$ |
21.09 |
|
|
|
10,304 |
|
|
$ |
23,893,054 |
|
November 1–30, 2023 |
|
|
— |
|
|
|
— |
|
|
|
— |
|
|
|
23,893,054 |
|
December 1–31, 2023 |
|
|
56,882 |
|
(2) |
|
23.97 |
|
(3) |
|
— |
|
|
|
23,893,054 |
|
Total |
|
|
67,186 |
|
|
|
|
|
|
10,304 |
|
|
|
|
||
43
Performance Graph
The graph that follows compares the cumulative total stockholder return on the Company’s common stock with the cumulative total return on the Russell 3000 Index and the FTSE NAREIT All Equity REITs Index. The results are based on an assumed $100 invested on November 2, 2021 (the first day of trading on the NYSE following the Company’s emergence from Chapter 11 reorganization and the NYSE listing), at the market close, through December 31, 2023, with all dividends reinvested. Share price performance presented below is not necessarily indicative of future results.
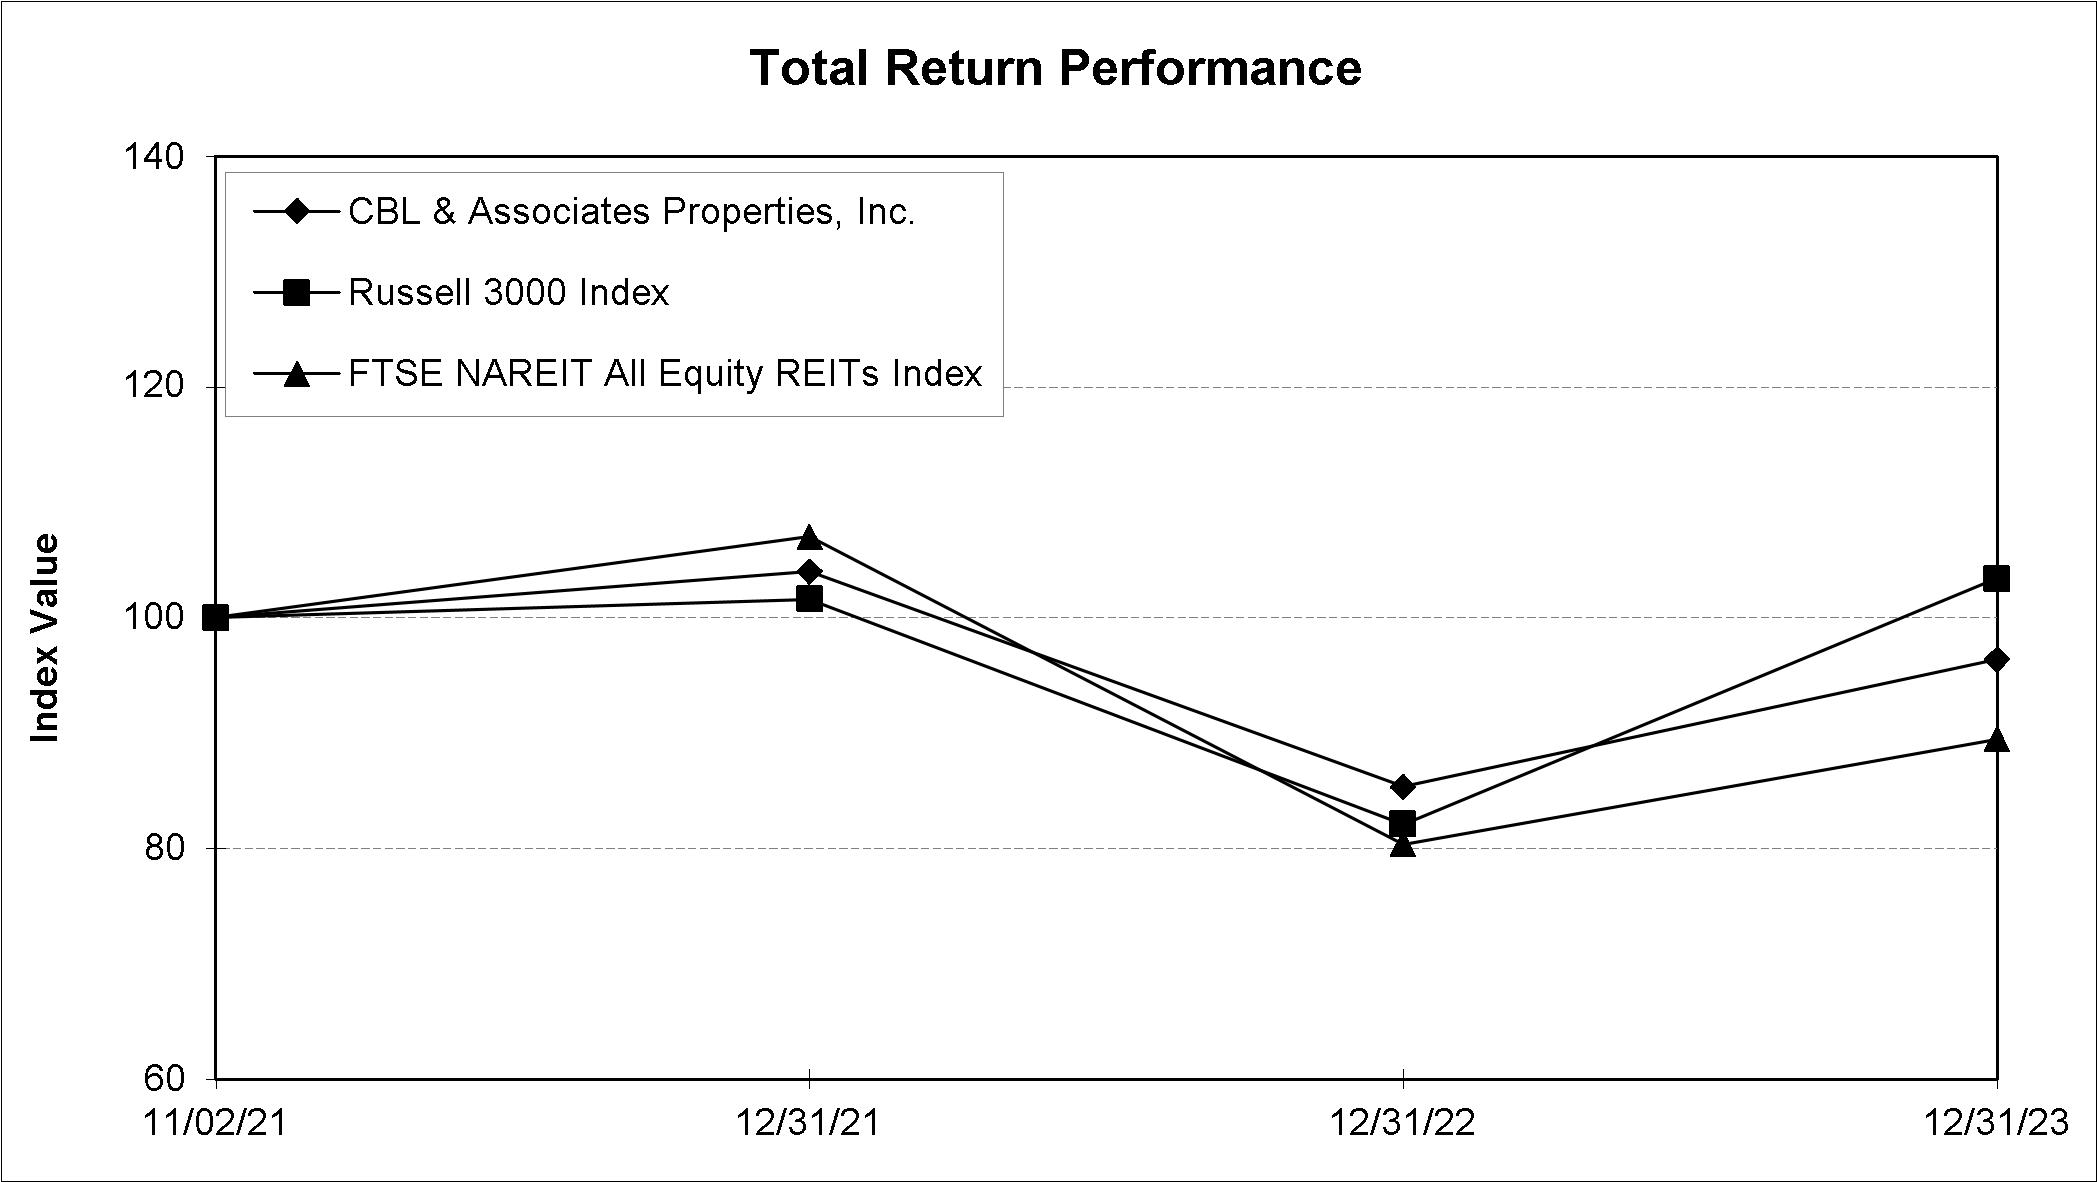
|
|
Period Ending |
|
|||||||||||||
Index |
|
11/02/21 |
|
|
12/31/21 |
|
|
12/31/22 |
|
|
12/31/23 |
|
||||
CBL & Associates Properties, Inc. |
|
$ |
100.00 |
|
|
$ |
104.00 |
|
|
$ |
85.32 |
|
|
$ |
96.38 |
|
Russell 3000 Index |
|
|
100.00 |
|
|
|
101.61 |
|
|
|
82.09 |
|
|
|
103.40 |
|
FTSE NAREIT All Equity REITs Index |
|
|
100.00 |
|
|
|
107.05 |
|
|
|
80.34 |
|
|
|
89.47 |
|
ITEM 6. [RESERVED]
44
ITEM 7. MANAGEMENT'S DISCUSSION AND ANALYSIS OF FINANCIAL CONDITION AND RESULTS OF OPERATIONS
The following discussion and analysis of financial condition and results of operations should be read in conjunction with the consolidated financial statements and accompanying notes that are included in this annual report. Capitalized terms used, but not defined, in this Management’s Discussion and Analysis of Financial Condition and Results of Operations have the same meanings as defined in the notes to the consolidated financial statements.
This section of this annual report on Form 10-K generally discusses 2023 and 2022 items and year-to-year comparisons between 2023 and 2022. See Part II, Item 7. Management’s Discussion and Analysis of Financial Condition and Results of Operations in our annual report on Form 10-K for the year ended December 31, 2022 for a similar discussion and for the financial information for the Successor period from November 1, 2021 through December 31, 2021 and the Predecessor period from January 1, 2021 through October 31, 2021.
Fresh Start Accounting
Upon emergence from bankruptcy, we qualified for and adopted fresh start accounting in accordance with Accounting Standards Codification 852, which resulted in our becoming a new entity for financial reporting purposes. As a result, our financial results for the years ended December 31, 2023 and 2022 and the period from November 1, 2021 through December 31, 2021 are referred to as those of the "Successor." Our financial results for the period from January 1, 2021 through October 31, 2021 are referred to as those of the “Predecessor." Our results of operations as reported in our consolidated financial statements for these periods are prepared in accordance with GAAP. See Note 19 for additional information.
Executive Overview
We are a self-managed, self-administered, fully integrated REIT that is engaged in the ownership, development, acquisition, leasing, management and operation of regional shopping malls, outlet centers, lifestyle centers, open-air centers and other properties. We own interests in 91 properties, consisting of 47 malls, 29 open-air centers, five outlet centers, five lifestyle centers and five other properties, including single-tenant and multi-tenant outparcels. Our shopping centers are located in 22 states, and are primarily in the southeastern and midwestern United States. We have elected to be taxed as a REIT for federal income tax purposes.
We conduct substantially all our business through the Operating Partnership. The Operating Partnership consolidates the financial statements of all entities in which it has a controlling financial interest or where it is the primary beneficiary of a VIE. See Item 2 for a description of our properties owned and under development as of December 31, 2023.
The following summarizes our net income (loss) and net income (loss) attributable to common shareholders (in thousands):
|
|
Successor |
|
|||||
|
|
Year Ended December 31, |
|
|||||
|
|
2023 |
|
|
2022 |
|
||
Net income (loss) |
|
$ |
3,204 |
|
|
$ |
(99,515 |
) |
Net income (loss) attributable to common shareholders |
|
$ |
5,433 |
|
|
$ |
(96,019 |
) |
Significant items that affected comparability between the years include:
45
Our focus is on continuing to execute our strategy to improve occupancy, drive rent growth and transform the offerings available at our diverse portfolio of properties to include a targeted mix of retail, service, dining, entertainment and other non-retail uses, primarily through the re-tenanting of former anchor locations as well as diversification of in-line tenancy. This operational strategy is also supported by our balance sheet strategy. This strategy focuses on reducing overall debt, extending our debt maturity schedule and lowering our overall cost of borrowings to limit maturity risk, as well as improving net cash flow and enhancing enterprise value. While the industry and our Company continue to face challenges, some of which may not be in our control, we believe that the strategies in place to improve occupancy, diversify our tenant mix and redevelop our properties will contribute to stabilization of our portfolio and revenues in future years.
Voluntary Reorganization Under Chapter 11
Beginning on November 1, 2020, CBL and the Operating Partnership, together with the Debtors, filed the Chapter 11 Cases under Chapter 11 of the Bankruptcy Code in the Bankruptcy Court. The Bankruptcy Court authorized the Debtors to continue to operate their businesses and manage their properties as debtors-in-possession pursuant to the Bankruptcy Code.
In connection with the Chapter 11 Cases, on August 11, 2021, the Bankruptcy Court entered an order, Docket No.1397 (Confirmation Order), confirming the Debtors’ Plan.
On the Effective Date, the conditions to effectiveness of the Plan were satisfied and the Debtors emerged from the Chapter 11 Cases. The Company filed a notice of the Effective Date of the Plan with the Bankruptcy Court on November 1, 2021. See Note 18 and Note 19 to our consolidated financial statements for more information.
Results of Operations
Properties that were in operation for the entire year during both 2023 and 2022 are referred to as the “2023 Comparable Properties.” The tables below summarize deconsolidations and dispositions of properties that impact the results of operations of the Successor and Predecessor periods.
Deconsolidations
Property |
|
Location |
|
Date of Deconsolidation |
Greenbrier Mall (1)(2) |
|
Chesapeake, VA |
|
March 2022 |
Alamance Crossing East (1) |
|
Burlington, NC |
|
February 2023 |
WestGate Mall (1) |
|
Spartanburg, SC |
|
September 2023 |
Comparison of the Results of Operations for the Successor Years Ended December 31, 2023 and 2022
Revenues
(in thousands)
|
|
Successor |
|
|||||||||||||||||||||||||
|
|
Year Ended December 31, |
|
|
|
|
|
Comparable |
|
|
|
|
|
|
|
|||||||||||||
|
|
2023 |
|
|
2022 |
|
|
Change |
|
|
Core |
|
|
Non-core |
|
|
Deconsolidation |
|
|
Dispositions |
|
|||||||
Rental revenues |
|
$ |
513,957 |
|
|
$ |
542,247 |
|
|
$ |
(28,290 |
) |
|
$ |
(18,807 |
) |
|
$ |
66 |
|
|
$ |
(9,182 |
) |
|
$ |
(367 |
) |
Management, development and leasing fees |
|
|
7,917 |
|
|
|
7,158 |
|
|
|
759 |
|
|
|
759 |
|
|
|
— |
|
|
|
— |
|
|
|
— |
|
Other |
|
|
13,412 |
|
|
|
13,606 |
|
|
|
(194 |
) |
|
|
84 |
|
|
|
— |
|
|
|
(273 |
) |
|
|
(5 |
) |
Total revenues |
|
$ |
535,286 |
|
|
$ |
563,011 |
|
|
$ |
(27,725 |
) |
|
$ |
(17,964 |
) |
|
$ |
66 |
|
|
$ |
(9,455 |
) |
|
$ |
(372 |
) |
Rental revenues from the Comparable Properties were lower primarily due to lower percentage rents and an unfavorable variance in the estimate for uncollectable revenues as compared to the prior year due to recoveries recognized in the prior year.
46
Operating Expenses
(in thousands)
|
|
Successor |
|
|||||||||||||||||||||||||
|
|
Year Ended December 31, |
|
|
|
|
|
Comparable |
|
|
|
|
|
|
|
|||||||||||||
|
|
2023 |
|
|
2022 |
|
|
Change |
|
|
Core |
|
|
Non-core |
|
|
Deconsolidation |
|
|
Dispositions |
|
|||||||
Property operating |
|
$ |
(90,996 |
) |
|
$ |
(92,126 |
) |
|
$ |
1,130 |
|
|
$ |
(740 |
) |
|
$ |
(42 |
) |
|
$ |
1,789 |
|
|
$ |
123 |
|
Real estate taxes |
|
|
(54,807 |
) |
|
|
(57,119 |
) |
|
|
2,312 |
|
|
|
1,519 |
|
|
|
(133 |
) |
|
|
903 |
|
|
|
23 |
|
Maintenance and repairs |
|
|
(41,336 |
) |
|
|
(42,485 |
) |
|
|
1,149 |
|
|
|
410 |
|
|
|
(30 |
) |
|
|
767 |
|
|
|
2 |
|
Property operating expenses |
|
|
(187,139 |
) |
|
|
(191,730 |
) |
|
|
4,591 |
|
|
|
1,189 |
|
|
|
(205 |
) |
|
|
3,459 |
|
|
|
148 |
|
Depreciation and amortization |
|
|
(190,505 |
) |
|
|
(256,310 |
) |
|
|
65,805 |
|
|
|
62,622 |
|
|
|
(250 |
) |
|
|
3,446 |
|
|
|
(13 |
) |
General and administrative |
|
|
(64,066 |
) |
|
|
(67,215 |
) |
|
|
3,149 |
|
|
|
3,149 |
|
|
|
— |
|
|
|
— |
|
|
|
— |
|
Loss on impairment |
|
|
— |
|
|
|
(252 |
) |
|
|
252 |
|
|
|
— |
|
|
|
— |
|
|
|
— |
|
|
|
252 |
|
Litigation settlement |
|
|
2,310 |
|
|
|
304 |
|
|
|
2,006 |
|
|
|
2,006 |
|
|
|
— |
|
|
|
— |
|
|
|
— |
|
Other |
|
|
(221 |
) |
|
|
(834 |
) |
|
|
613 |
|
|
|
613 |
|
|
|
— |
|
|
|
— |
|
|
|
— |
|
Total operating expenses |
|
$ |
(439,621 |
) |
|
$ |
(516,037 |
) |
|
$ |
76,416 |
|
|
$ |
69,579 |
|
|
$ |
(455 |
) |
|
$ |
6,905 |
|
|
$ |
387 |
|
Total property operating expenses at the Comparable Properties decreased primarily due to lower real estate taxes, as well as lower utility, janitorial and security costs. The decrease was partially offset by the completion of previously delayed maintenance projects and the timing of certain third-party contracts.
Depreciation and amortization expense at the Comparable Properties decreased primarily due to assets becoming fully depreciated or amortized since the prior-year period related to the shorter useful lives that were implemented upon the adoption of fresh start accounting when we emerged from bankruptcy.
General and administrative expenses decreased primarily due to professional fees associated with loan modifications and extensions, and fees incurred to obtain credit ratings on our secured term loan in the prior-year period. The decrease was partially offset by higher compensation and share-based compensation expenses as compared to the prior-year period.
Litigation settlement expense decreased during the year ended December 31, 2023 as compared to the prior-year period. The decrease results from a revision to the estimate of amounts to be paid out under the terms of the class action settlement agreement that was executed in 2019.
Other Income and Expenses
Interest and other income increased $8.3 million during the year ended December 31, 2023 as compared to the prior-year period primarily due to holding U.S. Treasury securities that carry higher interest rates in the current-year period.
Interest expense decreased $44.4 million during the year ended December 31, 2023 as compared to the prior-year period. The decrease was primarily due to $87.0 million less accretion of property-level debt discounts as certain discounts became fully accreted since the prior-year period. The property-level debt discounts were recognized in conjunction with recording our property-level debt at fair value upon the adoption of fresh start accounting. Also, the decrease includes $17.3 million of interest expense in the prior-year period on the secured notes that were fully redeemed in 2022. The decrease in interest expense was partially offset by an increase of $38.4 million in the current period related to the open-air centers and outparcels loan that was entered into during the second quarter of 2022 and higher interest expense on the term loan due to increased variable rates. Additionally, default interest was $1.0 million during 2023, which represented an increase of $21.2 million as compared to the prior-year period due to a reversal in 2022 of previously recognized default interest expense when forbearance/waiver agreements were obtained.
For the year ended December 31, 2023, we recorded a $3.3 million gain on extinguishment of debt related to a reduction in the outstanding principal of the loan secured by The Outlet Shoppes at Laredo. For the year ended December 31, 2022, we recorded a $7.3 million gain on extinguishment of debt related to a reduction in the outstanding principal of the loan secured by The Outlet Shoppes at Gettysburg.
For the year ended December 31, 2023, we recorded a $47.9 million gain on deconsolidation related to Alamance Crossing East and WestGate Mall. These properties were deconsolidated due to a loss of control when they were placed into receivership in connection with the foreclosure process. For the year ended December 31, 2022, we recorded a $36.3 million gain on deconsolidation related to Greenbrier Mall that was deconsolidated due to a loss of control when the mall was placed into receivership in connection with the foreclosure process.
47
Equity in earnings of unconsolidated affiliates decreased $7.9 million for the year ended December 31, 2023 as compared to the prior-year period. The decrease primarily relates to an increase in contributions made by us during the current-year period and a decline in distributions as compared to the prior-year period attributable to certain investments in unconsolidated affiliates in which our investment is below zero.
Non-GAAP Measure
Same-center Net Operating Income
NOI is a supplemental non-GAAP measure of the operating performance of our shopping centers and other properties. We define NOI as property operating revenues (rental revenues, tenant reimbursements and other income) less property operating expenses (property operating, real estate taxes and maintenance and repairs). We also exclude the impact of lease termination fees and certain non-cash items such as straight-line rents and reimbursements, write-offs of landlord inducements and net amortization of acquired above and below market leases.
We compute NOI based on the Operating Partnership's pro rata share of both consolidated and unconsolidated properties. We believe that presenting NOI and same-center NOI (described below) based on our Operating Partnership’s pro rata share of both consolidated and unconsolidated properties is useful since we conduct substantially all our business through our Operating Partnership and, therefore, it reflects the performance of our properties in absolute terms regardless of the ratio of ownership interests of our common shareholders and the noncontrolling interest in the Operating Partnership. Our definition of NOI may be different than that used by other companies, and accordingly, our calculation of NOI may not be comparable to that of other companies.
Since NOI includes only those revenues and expenses related to the operations of our shopping center properties, we believe that same-center NOI provides a measure that reflects trends in occupancy rates, rental rates, sales at our properties and operating costs and the impact of those trends on our results of operations. Our calculation of same-center NOI excludes lease termination income, straight-line rent adjustments, and amortization of above- and below-market lease intangibles in order to enhance the comparability of results from one period to another.
We include a property in our same-center pool when we have owned all or a portion of the property since January 1 of the preceding calendar year and it has been in operation for both the entire preceding calendar year ended December 31, 2022 and the current year ended December 31, 2023. New properties are excluded from same-center NOI, until they meet these criteria. Properties excluded from the same-center pool, which would otherwise meet these criteria, are properties where we intend to renegotiate the terms of the debt secured by the related property or return the property to the lender. Alamance Crossing East and WestGate Mall were classified as Excluded Properties as of December 31, 2023.
48
Due to the exclusions noted above, same-center NOI should only be used as a supplemental measure of our performance and not as an alternative to GAAP operating income (loss) or net income (loss). A reconciliation of our same-center NOI to net income (loss) for the years ended December 31, 2023 and 2022 is as follows (in thousands):
|
|
Successor |
||
|
|
Year Ended December 31, |
||
|
|
2023 |
|
2022 |
Net income (loss) |
|
$3,204 |
|
$(99,515) |
Adjustments: (1) |
|
|
|
|
Depreciation and amortization, including our share of unconsolidated affiliates and net of noncontrolling interests' share |
|
205,471 |
|
273,625 |
Interest expense, including our share of unconsolidated affiliates and net of noncontrolling interests' share |
|
238,616 |
|
297,713 |
Abandoned projects expense |
|
39 |
|
834 |
Gain on sales of real estate assets, net of taxes and noncontrolling interests' share |
|
(4,839) |
|
(5,345) |
Gain on sales of real estate assets of unconsolidated affiliates |
|
(768) |
|
(1,036) |
Adjustment for unconsolidated affiliates with negative investment |
|
(7,242) |
|
(37,645) |
Gain on extinguishment of debt |
|
(3,270) |
|
(7,344) |
Gain on deconsolidation |
|
(47,879) |
|
(36,250) |
Loss on available-for-sale securities |
|
— |
|
39 |
Loss on impairment |
|
— |
|
252 |
Litigation settlement |
|
(2,310) |
|
(304) |
Reorganization items, net |
|
— |
|
(298) |
Income tax provision |
|
894 |
|
3,079 |
Lease termination fees |
|
(3,504) |
|
(5,115) |
Straight-line rent and above- and below-market lease amortization |
|
13,896 |
|
8,233 |
Net loss attributable to noncontrolling interests in other consolidated subsidiaries |
|
3,344 |
|
5,999 |
General and administrative expenses |
|
64,066 |
|
67,215 |
Management fees and non-property level revenues |
|
(19,087) |
|
(4,433) |
Operating Partnership's share of property NOI |
|
440,631 |
|
459,704 |
Non-comparable NOI |
|
(2,119) |
|
(14,328) |
Total same-center NOI |
|
$438,512 |
|
$445,376 |
(1) Adjustments are based on our Operating Partnership's pro rata ownership share, including our share of unconsolidated affiliates and excluding noncontrolling interests' share of consolidated properties.
Same-center NOI decreased 1.5% for the Successor year ended December 31, 2023 as compared to the prior-year period. The $6.9 million decrease for the year ended December 31, 2023 compared to the prior-year period primarily consisted of a $9.9 million decrease in revenues offset by a $3.0 million decrease in operating expenses. Rental revenues were $9.6 million lower primarily due to decreased percentage rents and an unfavorable variance in the estimate for uncollectable revenues in the current-year period as compared to the prior-year period. Property operating expenses decreased primarily due to lower real estate taxes, as well as lower utility, janitorial and security costs. The decrease was partially offset by the completion of previously delayed maintenance projects and the timing of certain third-party contracts.
Operational Review
The shopping center business is, to some extent, seasonal in nature with tenants typically achieving the highest levels of sales during the fourth quarter due to the holiday season, which generally results in higher percentage rents in the fourth quarter. Additionally, the Malls earn a large portion of their rents from short-term tenants during the holiday period. Thus, occupancy levels and revenue production are generally the highest in the fourth quarter of each year. Results of operations realized in any one quarter may not be indicative of the results likely to be experienced over the course of the fiscal year.
We derive the majority of our revenues from the Malls. The sources of our revenues by property type were as follows:
|
|
Successor |
|
|||||
|
|
Year Ended December 31, |
|
|||||
|
|
2023 |
|
|
2022 |
|
||
Malls, lifestyle centers and outlet centers |
|
|
85.6 |
% |
|
|
86.1 |
% |
All Other Properties |
|
|
14.4 |
% |
|
|
13.9 |
% |
49
Inline and Adjacent Freestanding Store Sales
Inline and adjacent freestanding store sales include reporting mall, lifestyle center and outlet center tenants of 10,000 square feet or less for the Malls and exclude license agreements, which are retail leases that are temporary or short-term in nature and generally last more than three months but less than twelve months. The following is a comparison of our same-center sales per square foot for mall, lifestyle center and outlet center tenants of 10,000 square feet or less (Excluded Properties are not included in sales metrics):
|
|
Sales Per Square Foot for the Trailing Twelve Months Ended December 31, |
|
|
|
|||||
|
|
2023 |
|
|
2022 |
|
|
% Change |
||
Malls, lifestyle centers and outlet centers same-center sales per square foot |
|
$ |
416 |
|
|
$ |
435 |
|
|
(4.4)% |
In-Line Store Occupancy
Our portfolio in-line store occupancy is summarized in the below table (Excluded Properties are not included in occupancy metrics). Occupancy for the Malls represents percentage of in-line gross leasable area under 20,000 square feet occupied. Occupancy for open-air centers represents percentage of gross leasable area occupied.
|
|
As of December 31, |
||
|
|
2023 |
|
2022 |
Total portfolio |
|
90.9% |
|
91.0% |
Malls, lifestyle centers and outlet centers: |
|
|
|
|
Total malls |
|
89.3% |
|
89.1% |
Total lifestyle centers |
|
91.5% |
|
92.7% |
Total outlet centers |
|
91.9% |
|
90.8% |
Total same-center malls, lifestyle centers and outlet centers |
|
89.8% |
|
89.6% |
All Other Properties: |
|
|
|
|
Total open-air centers |
|
95.6% |
|
95.3% |
Total other |
|
78.2% |
|
93.0% |
Leasing
The following is a summary of the total square feet of leases signed in the year ended December 31, 2023 as compared to the prior year:
|
|
Year Ended December 31, |
|
|||||
|
|
2023 |
|
|
2022 |
|
||
Operating portfolio: |
|
|
|
|
|
|
||
New leases |
|
|
1,485,375 |
|
|
|
1,257,659 |
|
Renewal leases |
|
|
2,865,969 |
|
|
|
2,855,587 |
|
Development portfolio: |
|
|
|
|
|
|
||
New leases |
|
|
25,151 |
|
|
|
15,703 |
|
Total leased |
|
|
4,376,495 |
|
|
|
4,128,949 |
|
50
Average annual base rents per square foot are computed based on contractual rents in effect as of December 31, 2023 and 2022, including the impact of any rent concessions. Average annual base rents per square foot for comparable small shop space of less than 10,000 square feet were as follows for each property type (1):
|
|
Year Ended December 31, |
|
|||||
|
|
2023 |
|
|
2022 |
|
||
Total portfolio (1) |
|
$ |
25.56 |
|
|
$ |
25.14 |
|
Malls, lifestyle centers and outlet centers: |
|
|
|
|
|
|
||
Total same-center malls, lifestyle centers and outlet centers |
|
|
30.19 |
|
|
|
29.58 |
|
Total malls |
|
|
30.40 |
|
|
|
30.01 |
|
Total lifestyle centers |
|
|
30.53 |
|
|
|
29.30 |
|
Total outlet centers |
|
|
28.36 |
|
|
|
26.68 |
|
All Other Properties: |
|
|
|
|
|
|
||
Total open-air centers |
|
|
15.37 |
|
|
|
15.21 |
|
Total other |
|
|
20.37 |
|
|
|
19.22 |
|
Results from new and renewal leasing of comparable in-line space of less than 10,000 square feet during the year ended December 31, 2023 for spaces that were previously occupied, based on the contractual terms of the related leases inclusive of the impact of any rent concessions, are as follows:
Property Type |
|
Square |
|
|
Prior Gross |
|
|
New Initial |
|
|
% Change |
|
|
New Average |
|
|
% Change |
|
||||||
All Property Types (2) |
|
|
2,713,874 |
|
|
$ |
37.36 |
|
|
$ |
36.92 |
|
|
|
(1.2 |
)% |
|
$ |
37.37 |
|
|
|
0.0 |
% |
Malls, lifestyle centers and outlet centers |
|
|
2,511,082 |
|
|
|
38.59 |
|
|
|
37.76 |
|
|
|
(2.2 |
)% |
|
|
38.19 |
|
|
|
(1.0 |
)% |
New leases |
|
|
157,325 |
|
|
|
34.17 |
|
|
|
41.01 |
|
|
|
20.0 |
% |
|
|
43.11 |
|
|
|
26.2 |
% |
Renewal leases |
|
|
2,353,757 |
|
|
|
38.89 |
|
|
|
37.54 |
|
|
|
(3.5 |
)% |
|
|
37.86 |
|
|
|
(2.6 |
)% |
New and renewal leasing activity of comparable in-line space of less than 10,000 square feet for the year ended December 31, 2023, based on commencement date inclusive of the impact of any rent concessions, are as follows:
|
|
Number |
|
|
Square |
|
|
Term |
|
|
Initial |
|
|
Average |
|
|
Expiring |
|
|
Initial Rent |
|
|
Average Rent |
|
||||||||||||||||
Commencement 2023: |
|
|
|
|
|
|
|
|
|
|
|
|
|
|
|
|
|
|
|
|
|
|
|
|
|
|
|
|
|
|
||||||||||
New |
|
|
68 |
|
|
|
197,719 |
|
|
|
6.56 |
|
|
$ |
39.21 |
|
|
$ |
41.32 |
|
|
$ |
32.74 |
|
|
$ |
6.47 |
|
|
|
19.8 |
% |
|
$ |
8.58 |
|
|
|
26.2 |
% |
Renewal |
|
|
632 |
|
|
|
2,030,791 |
|
|
|
2.68 |
|
|
|
36.65 |
|
|
|
37.04 |
|
|
|
37.22 |
|
|
|
(0.57 |
) |
|
|
(1.5 |
)% |
|
|
(0.18 |
) |
|
|
(0.5 |
)% |
Commencement 2023 Total |
|
|
700 |
|
|
|
2,228,510 |
|
|
|
3.06 |
|
|
|
36.88 |
|
|
|
37.42 |
|
|
|
36.82 |
|
|
|
0.06 |
|
|
|
0.2 |
% |
|
|
0.60 |
|
|
|
1.6 |
% |
|
|
|
|
|
|
|
|
|
|
|
|
|
|
|
|
|
|
|
|
|
|
|
|
|
|
|
|
|
|
|
||||||||||
Commencement 2024: |
|
|
|
|
|
|
|
|
|
|
|
|
|
|
|
|
|
|
|
|
|
|
|
|
|
|
|
|
|
|
||||||||||
New |
|
|
17 |
|
|
|
64,786 |
|
|
|
6.90 |
|
|
|
30.42 |
|
|
|
31.82 |
|
|
|
23.48 |
|
|
|
6.94 |
|
|
|
29.6 |
% |
|
|
8.34 |
|
|
|
35.5 |
% |
Renewal |
|
|
260 |
|
|
|
862,866 |
|
|
|
2.70 |
|
|
|
34.91 |
|
|
|
35.16 |
|
|
|
36.59 |
|
|
|
(1.68 |
) |
|
|
(4.6 |
)% |
|
|
(1.43 |
) |
|
|
(3.9 |
)% |
Commencement 2024 Total |
|
|
277 |
|
|
|
927,652 |
|
|
|
2.96 |
|
|
|
34.60 |
|
|
|
34.92 |
|
|
|
35.67 |
|
|
|
(1.07 |
) |
|
|
(3.0 |
)% |
|
|
(0.75 |
) |
|
|
(2.1 |
)% |
|
|
|
|
|
|
|
|
|
|
|
|
|
|
|
|
|
|
|
|
|
|
|
|
|
|
|
|
|
|
|
||||||||||
Total 2023/2024 |
|
|
977 |
|
|
|
3,156,162 |
|
|
|
3.03 |
|
|
$ |
36.21 |
|
|
$ |
36.69 |
|
|
$ |
36.49 |
|
|
$ |
(0.28 |
) |
|
|
(0.8 |
)% |
|
$ |
0.20 |
|
|
|
0.5 |
% |
Liquidity and Capital Resources
As of December 31, 2023, we had $296.3 million available in unrestricted cash and U.S. Treasury securities. Our total pro rata share of debt, excluding unamortized deferred financing costs and debt discounts, at December 31, 2023 was $2,656.3 million. We had $50.2 million in restricted cash at December 31, 2023 related to cash held in escrow accounts for insurance, real estate taxes, capital expenditures and tenant allowances as required by the terms of certain mortgage notes payable, as well as amounts related to cash management agreements with lenders of certain property-level mortgage indebtedness, which are designated for debt service and operating expense obligations. We also had restricted cash of $38.7 million related to the properties that secure the corporate term loan and the open-air centers and outparcels loan of which we may receive a portion via distributions semiannually and quarterly in accordance with the provisions of the term loan and the open-air centers and outparcels loan, respectively.
51
During the year ended December 31, 2023, we continued to reinvest the cash from maturing U.S. Treasury securities into new U.S. Treasury securities. We designated our U.S. Treasury securities as available-for-sale. As of December 31, 2023, our U.S. Treasury securities have maturities through July 2024. Subsequent to December 31, 2023, we redeemed U.S. Treasury securities. See Note 20 for additional information.
During the year ended December 31, 2023, we extended the maturity dates on five loans, which had a combined outstanding balance of $339.8 million at our share as of December 31, 2023. In April 2023, the Company and its joint venture partner entered into a new $148.0 million loan secured by Friendly Center and The Shops at Friendly Center and the $7.2 million loan secured by The Outlet Shoppes of the Bluegrass - Phase II was paid off. In October 2023, the loans secured by The Outlet Shoppes at Atlanta were paid off using proceeds from a new $79.3 million, ten-year, 7.85% fixed interest rate, non-recourse loan. In October 2023, the Company and its joint venture partner modified the loan secured by The Outlet Shoppes at Laredo. The principal balance was reduced to $34.0 million, the interest rate remains unchanged at SOFR plus 325 basis points and the maturity date was extended to June 2025. In November 2023, the limited guaranty provided by the Operating Partnership on the secured term loan was eliminated pursuant to the terms of the loan agreement. See Note 7 and Note 8 for additional information. Subsequent to December 31, 2023, the loan secured by Brookfield Square Anchor Redevelopment was paid off. See Note 20 for additional information.
In May 2023, the Operating Partnership entered into an interest rate swap with a notional amount of $32.0 million to fix the interest rate at 7.3975% on $32.0 million of the variable rate portion of the open-air centers and outparcels loan. The swap has a maturity date of June 7, 2027. We designated the swap as a cash flow hedge on our variable rate debt. See Note 8 for more information.
In February 2023, we deconsolidated Alamance Crossing East as a result of losing control when the property was placed in receivership. The loan secured by Alamance Crossing East had an outstanding balance of $41.1 million as of December 31, 2023. In September 2023, we deconsolidated WestGate Mall as a result of losing control when the property was placed in receivership. The loan secured by WestGate Mall had an outstanding balance of $28.7 million as of December 31, 2023.
We paid common stock dividends of $0.375 per share in all four quarters of 2023. Additionally, our board of directors declared a special dividend of $2.20 per share of common stock, which was paid in cash on January 18, 2023, to stockholders of record as of the close of business on December 12, 2022. The special dividend was made to ensure that we met the minimum requirement for 2022 to maintain our status as a REIT. Subsequent to December 31, 2023, our board of directors declared a $0.40 per share regular quarterly dividend for the first quarter of 2024. See Note 20.
During the year ended December 31, 2023, we sold eight land parcels which generated approximately $9.6 million in gross proceeds at our share.
We extended, refinanced or retired all loans that were set to mature during 2023. Our total share of consolidated, unconsolidated and other outstanding debt, excluding debt discounts and deferred financing costs, that matured prior to 2023, which remains outstanding at December 31, 2023, is $69.8 million, consisting of two property loans that are in receivership.
Unconsolidated Affiliates
We have ownership interests in 26 unconsolidated affiliates as of December 31, 2023. See Note 7 to the consolidated financial statements for more information. The unconsolidated affiliates are accounted for using the equity method of accounting and are reflected in the accompanying consolidated balance sheets as investments in unconsolidated affiliates.
The following are circumstances when we may consider entering into a joint venture with a third party:
52
Guarantees
We may guarantee the debt of a joint venture primarily because it allows the joint venture to obtain funding at a lower cost than could be obtained otherwise. This results in a higher return for the joint venture on its investment, and a higher return on our investment in the joint venture. We may receive a fee from the joint venture for providing the guaranty. Additionally, when we issue a guaranty, the terms of the joint venture agreement typically provide that we may receive indemnification from the joint venture partner or have the ability to increase our ownership interest.
See Note 14 to the consolidated financial statements for information related to our guarantees of unconsolidated affiliates' debt as of December 31, 2023 and 2022.
Material Cash Requirements
The following table summarizes our material cash requirements as of December 31, 2023 (in thousands):
|
|
Payments Due By Period |
|
|||||||||||||||||
|
|
Total |
|
|
Less Than 1 |
|
|
1-3 |
|
|
3-5 |
|
|
More Than 5 |
|
|||||
Long-term debt: |
|
|
|
|
|
|
|
|
|
|
|
|
|
|
|
|||||
Consolidated debt service (1) |
|
$ |
2,247,917 |
|
|
$ |
312,596 |
|
|
$ |
1,480,343 |
|
|
$ |
380,764 |
|
|
$ |
74,214 |
|
Noncontrolling interests' share in other consolidated subsidiaries |
|
|
(42,794 |
) |
|
|
(3,026 |
) |
|
|
(32,668 |
) |
|
|
(783 |
) |
|
|
(6,317 |
) |
Other debt (2) |
|
|
69,783 |
|
|
|
69,783 |
|
|
|
— |
|
|
|
— |
|
|
|
— |
|
Our share of unconsolidated affiliates debt service (3) |
|
|
791,843 |
|
|
|
224,933 |
|
|
|
273,701 |
|
|
|
193,557 |
|
|
|
99,652 |
|
Our share of total debt service obligations |
|
|
3,066,749 |
|
|
|
604,286 |
|
|
|
1,721,376 |
|
|
|
573,538 |
|
|
|
167,549 |
|
|
|
|
|
|
|
|
|
|
|
|
|
|
|
|
|
|||||
Operating leases: (4) |
|
|
|
|
|
|
|
|
|
|
|
|
|
|
|
|||||
Ground leases on properties |
|
|
15,721 |
|
|
|
364 |
|
|
|
741 |
|
|
|
750 |
|
|
|
13,866 |
|
|
|
|
|
|
|
|
|
|
|
|
|
|
|
|
|
|||||
Purchase obligations: (5) |
|
|
|
|
|
|
|
|
|
|
|
|
|
|
|
|||||
Construction contracts on consolidated properties |
|
|
726 |
|
|
|
726 |
|
|
|
— |
|
|
|
— |
|
|
|
— |
|
Our share of construction contracts on unconsolidated properties |
|
|
1,895 |
|
|
|
1,895 |
|
|
|
— |
|
|
|
— |
|
|
|
— |
|
Our share of total purchase obligations |
|
|
2,621 |
|
|
|
2,621 |
|
|
|
— |
|
|
|
— |
|
|
|
— |
|
|
|
|
|
|
|
|
|
|
|
|
|
|
|
|
|
|||||
Other contractual obligations: (6) |
|
|
82,668 |
|
|
|
33,067 |
|
|
|
49,601 |
|
|
|
— |
|
|
|
— |
|
|
|
|
|
|
|
|
|
|
|
|
|
|
|
|
|
|||||
Total material cash requirements |
|
$ |
3,167,759 |
|
|
$ |
640,338 |
|
|
$ |
1,771,718 |
|
|
$ |
574,288 |
|
|
$ |
181,415 |
|
53
Liquidity Sources
We derive the majority of our revenues from leases with retail tenants, which have historically been the primary source for funding short-term liquidity and capital needs such as operating expenses, debt service, tenant construction allowances, recurring capital expenditures, dividends and distributions. We believe that the combination of cash flows generated from our operations, combined with cash on hand and our investment in U.S. Treasury securities will, for the foreseeable future, provide adequate liquidity to meet our cash needs. In addition to these factors, we have options available to us to generate additional liquidity, including but not limited to, joint venture investments, financing of currently unencumbered properties and decreasing expenditures related to tenant construction allowances and other capital expenditures. We also generate revenues from sales of peripheral land at our properties and from sales of real estate assets when it is determined that we can realize an optimal value for the assets.
Cash Flows - Operating, Investing and Financing Activities
There was $123.1 million of cash, cash equivalents and restricted cash as of December 31, 2023, a decrease of $18.9 million from December 31, 2022. Of this amount, $34.2 million was unrestricted cash as of December 31, 2023. Also, at December 31, 2023, we had $262.1 million in U.S. Treasuries with maturities through July 2024. Our net cash flows are summarized as follows (in thousands):
|
|
Successor |
|
|||||
|
|
Year Ended December 31, |
|
|||||
|
|
2023 |
|
|
2022 |
|
||
Net cash provided by operating activities |
|
$ |
183,516 |
|
|
$ |
208,234 |
|
Net cash provided by (used in) investing activities |
|
|
1,701 |
|
|
|
(156,685 |
) |
Net cash used in financing activities |
|
|
(204,090 |
) |
|
|
(145,798 |
) |
Net cash flows |
|
$ |
(18,873 |
) |
|
$ |
(94,249 |
) |
Cash Provided by Operating Activities
Cash provided by operating activities decreased primarily due to lower percentage rents and higher interest expense resulting from rising variable interest rates.
Cash Provided by (Used in) Investing Activities
Cash provided by investing activities increased primarily due to more net redemptions of U.S. Treasury securities during the current-year period as compared to the prior-year period. The increase was partially offset by a decrease in distributions from unconsolidated affiliates.
Cash Used in Financing Activities
Cash used in financing activities increased primarily due to the payment of a first, second, third and fourth quarter 2023 common stock dividend and the special dividend that was declared during the fourth quarter of 2022. There were no dividends paid during the first quarter of 2022. Also, the increase was attributable to a reduction in net proceeds from new loans during the current-year period as compared to the prior-year period. The increase was partially offset by a reduction in principal payments during the current-year period as compared to the prior-year period.
Debt
CBL has no indebtedness. Either the Operating Partnership or one of its consolidated subsidiaries, that it has a direct or indirect ownership interest in, is the borrower on all our debt, substantially all of which is secured by real estate assets.
54
The following tables summarize debt based on our pro rata ownership share, including our pro rata share of unconsolidated affiliates and excluding noncontrolling investors’ share of consolidated properties. Prior to consideration of unamortized deferred financing costs or debt discounts, of our $2,656.3 million in outstanding debt at December 31, 2023, $2,588.3 million constituted non-recourse debt obligations and $68.0 million constituted recourse debt obligations. We believe the tables below provide investors and lenders a clearer understanding of our total debt obligations and liquidity (in thousands):
December 31, 2023: |
|
Consolidated |
|
|
Noncontrolling |
|
|
Other Debt (1) |
|
|
Unconsolidated |
|
|
Total |
|
|
Weighted- |
|
|||||
Fixed-rate debt: |
|
|
|
|
|
|
|
|
|
|
|
|
|
|
|
|
|
|
|||||
Non-recourse loans on operating properties |
|
$ |
736,573 |
|
|
$ |
(25,021 |
) |
|
$ |
69,783 |
|
|
$ |
616,337 |
|
|
$ |
1,397,672 |
|
|
5.05% |
|
Open-air centers and outparcels loan |
|
|
179,180 |
|
|
|
— |
|
|
|
— |
|
|
|
— |
|
|
|
179,180 |
|
|
6.95% |
(3) |
Recourse loans on operating properties |
|
|
— |
|
|
|
— |
|
|
|
— |
|
|
|
5,832 |
|
|
|
5,832 |
|
|
3.04% |
|
Total fixed-rate debt |
|
|
915,753 |
|
|
|
(25,021 |
) |
|
|
69,783 |
|
|
|
622,169 |
|
|
|
1,582,684 |
|
|
5.26% |
|
Variable-rate debt: |
|
|
|
|
|
|
|
|
|
|
|
|
|
|
|
|
|
|
|||||
Non-recourse loans on operating properties |
|
|
33,780 |
|
|
|
(11,823 |
) |
|
|
— |
|
|
|
10,478 |
|
|
|
32,435 |
|
|
8.56% |
|
Recourse loans on operating properties |
|
|
15,339 |
|
|
|
— |
|
|
|
— |
|
|
|
46,796 |
|
|
|
62,135 |
|
|
8.13% |
|
Open-air centers and outparcels loan |
|
|
179,180 |
|
|
|
— |
|
|
|
— |
|
|
|
— |
|
|
|
179,180 |
|
|
9.44% |
(3) |
Secured term loan |
|
|
799,914 |
|
|
|
— |
|
|
|
— |
|
|
|
— |
|
|
|
799,914 |
|
|
8.21% |
|
Total variable-rate debt |
|
|
1,028,213 |
|
|
|
(11,823 |
) |
|
|
— |
|
|
|
57,274 |
|
|
|
1,073,664 |
|
|
8.42% |
|
Total fixed-rate and variable-rate debt |
|
|
1,943,966 |
|
|
|
(36,844 |
) |
|
|
69,783 |
|
|
|
679,443 |
|
|
|
2,656,348 |
|
|
6.54% |
|
Unamortized deferred financing costs |
|
|
(13,221 |
) |
|
|
249 |
|
|
|
— |
|
|
|
(3,197 |
) |
|
|
(16,169 |
) |
|
|
|
Debt discounts (4) |
|
|
(41,942 |
) |
|
|
3,706 |
|
|
|
— |
|
|
|
— |
|
|
|
(38,236 |
) |
|
|
|
Total mortgage and other indebtedness, net |
|
$ |
1,888,803 |
|
|
$ |
(32,889 |
) |
|
$ |
69,783 |
|
|
$ |
676,246 |
|
|
$ |
2,601,943 |
|
|
|
|
December 31, 2022: |
|
Consolidated |
|
|
Noncontrolling |
|
|
Unconsolidated |
|
|
Total |
|
|
Weighted- |
|
||||
Fixed-rate debt: |
|
|
|
|
|
|
|
|
|
|
|
|
|
|
|
||||
Non-recourse loans on operating properties |
|
$ |
843,634 |
|
|
$ |
(25,420 |
) |
|
$ |
611,215 |
|
|
$ |
1,429,429 |
|
|
4.57% |
|
Open-air centers and outparcels loan |
|
|
180,000 |
|
|
|
— |
|
|
|
— |
|
|
|
180,000 |
|
|
6.95% |
(2) |
Recourse loans on operating properties |
|
|
— |
|
|
|
— |
|
|
|
10,427 |
|
|
|
10,427 |
|
|
3.67% |
|
Total fixed-rate debt |
|
|
1,023,634 |
|
|
|
(25,420 |
) |
|
|
621,642 |
|
|
|
1,619,856 |
|
|
4.83% |
|
Variable-rate debt: |
|
|
|
|
|
|
|
|
|
|
|
|
|
|
|
||||
Non-recourse loans on operating properties |
|
|
38,250 |
|
|
|
(13,387 |
) |
|
|
2,393 |
|
|
|
27,256 |
|
|
7.36% |
|
Recourse loans on operating properties (3) |
|
|
18,240 |
|
|
|
— |
|
|
|
69,191 |
|
|
|
87,431 |
|
|
6.92% |
|
Open-air centers and outparcels loan |
|
|
180,000 |
|
|
|
— |
|
|
|
— |
|
|
|
180,000 |
|
|
8.22% |
(2) |
Secured term loan |
|
|
829,452 |
|
|
|
— |
|
|
|
— |
|
|
|
829,452 |
|
|
6.87% |
|
Total variable-rate debt |
|
|
1,065,942 |
|
|
|
(13,387 |
) |
|
|
71,584 |
|
|
|
1,124,139 |
|
|
7.10% |
|
Total fixed-rate and variable-rate debt |
|
|
2,089,576 |
|
|
|
(38,807 |
) |
|
|
693,226 |
|
|
|
2,743,995 |
|
|
5.76% |
|
Unamortized deferred financing costs |
|
|
(17,101 |
) |
|
|
317 |
|
|
|
(2,142 |
) |
|
|
(18,926 |
) |
|
|
|
Debt discounts (4) |
|
|
(72,289 |
) |
|
|
7,448 |
|
|
|
— |
|
|
|
(64,841 |
) |
|
|
|
Total mortgage and other indebtedness, net |
|
$ |
2,000,186 |
|
|
$ |
(31,042 |
) |
|
$ |
691,084 |
|
|
$ |
2,660,228 |
|
|
|
|
55
The following table presents our pro rata share of consolidated and unconsolidated debt as of December 31, 2023, excluding unamortized deferred financing costs and debt discounts, that is scheduled to mature in 2024 based on the original maturity date (in thousands):
|
|
Balance |
|
|
|
Consolidated Properties: |
|
|
|
|
|
Fayette Mall |
|
$ |
119,303 |
|
(1) |
Brookfield Square Anchor Redevelopment |
|
|
15,339 |
|
(2) |
|
|
|
134,642 |
|
|
Unconsolidated Properties: |
|
|
|
|
|
Coastal Grand Mall |
|
|
48,507 |
|
|
Coastal Grand Mall Outparcel |
|
|
2,341 |
|
|
Coastal Grand Mall - Dick's Sporting Goods |
|
|
3,374 |
|
|
Hamilton Place Aloft Hotel |
|
|
8,085 |
|
|
The Outlet Shoppes of the Bluegrass |
|
|
41,014 |
|
|
West County Center |
|
|
76,192 |
|
(3) |
|
|
|
179,513 |
|
|
Total 2024 maturities at our pro rata share |
|
$ |
314,155 |
|
|
Additionally, we have two loans, with an aggregate principal balance of $69.8 million at our share as of December 31, 2023, secured by Alamance Crossing East and WestGate Mall that are past their maturity dates. Both properties have been placed into receivership in connection with the foreclosure process.
The weighted-average remaining term of our total share of consolidated and unconsolidated debt, excluding debt discounts and deferred financing costs, was 2.4 years at both December 31, 2023 and December 31, 2022. The weighted-average remaining term of our pro rata share of fixed-rate debt, excluding debt discounts and deferred financing costs, was 2.7 years and 2.3 years at December 31, 2023 and December 31, 2022, respectively.
As of December 31, 2023, our pro rata share of consolidated and unconsolidated variable-rate debt, excluding debt discounts and deferred financing costs, represented 40.4% of our total pro rata share of debt, excluding debt discounts and deferred financing costs. As of December 31, 2022, our pro rata share of consolidated and unconsolidated variable-rate debt, excluding debt discounts and deferred financing costs, represented 41.0% of our total pro rata share of debt, excluding debt discounts and deferred financing costs.
See Note 7 and Note 8 to the consolidated financial statements for additional information concerning the amount and terms of our outstanding indebtedness as of December 31, 2023.
Equity
We paid common stock dividends of $0.375 per share in each quarter of 2023. Additionally, our board of directors declared a special dividend of $2.20 per share of common stock, which was paid in cash on January 18, 2023, to stockholders of record as of the close of business on December 12, 2022. The decision to declare and pay dividends on any outstanding shares of our common stock, as well as the timing, amount and composition of any such future dividends, will be at the sole discretion of our board of directors and will depend on our earnings, taxable income, FFO, liquidity, financial condition, capital requirements, contractual prohibitions or other limitations under our then-current indebtedness, the annual distribution requirements under the REIT provisions of the Internal Revenue Code, Delaware law and such other factors as our board of directors deems relevant. Any dividends payable will be determined by our board of directors based upon the circumstances at the time of declaration. For additional information, see discussion presented under the subheading “Dividends” in Note 9 of this report. Our actual results of operations will be affected by a number of factors, including the revenues received from our properties, our operating expenses, interest expense, capital expenditures and the ability of the anchors and tenants at our properties to meet their obligations for payment of rents and tenant reimbursements. Subsequent to December 31, 2023, our board of directors declared a $0.40 per share regular quarterly dividend for the first quarter of 2024. See Note 20.
In August 2023, our board of directors authorized the repurchase of up to $25.0 million of our outstanding common stock. See Part II, Item 5 for additional information regarding our repurchases of common stock during 2023.
On September 8, 2022, our board of directors adopted a short-term rights plan (the “Rights Plan”). Pursuant to the Rights Plan, the board of directors authorized a dividend of one share purchase right (a “Right”) for each outstanding share of our common stock. If a person or group of affiliated or associated persons acquired beneficial ownership of 10.0% or more of our outstanding common shares, subject to certain exceptions (including exceptions for existing holders who do
56
not increase their holdings as provided in the Rights Plan), each Right would effectively entitle its holder (other than the acquiring person or group of affiliated or associated persons) to purchase additional common shares at a substantial discount to the public market price. In addition, under certain circumstances, we could exchange the Rights (other than Rights beneficially owned by the acquiring person or group of affiliated or associated persons), in whole or in part, for common shares on a one-for-one basis, or we could redeem the Rights for cash at a price of $0.001 per Right. On September 8, 2023, the Rights Plan expired pursuant to its terms.
Capital Expenditures
The following table, which excludes expenditures for developments and expansions, summarizes capital expenditures, including our share of unconsolidated affiliates' capital expenditures, for the years ended December 31, 2023 and 2022, (in thousands):
|
|
Successor |
|
|||||
|
|
Year Ended December 31, |
|
|||||
|
|
2023 |
|
|
2022 |
|
||
Tenant allowances |
|
$ |
17,079 |
|
|
$ |
19,885 |
|
|
|
|
|
|
|
|
||
Maintenance capital expenditures: |
|
|
|
|
|
|
||
Parking area and parking area lighting |
|
|
5,331 |
|
|
|
5,528 |
|
Roof replacements |
|
|
3,319 |
|
|
|
1,048 |
|
Other capital expenditures |
|
|
16,246 |
|
|
|
10,839 |
|
Total maintenance capital expenditures |
|
|
24,896 |
|
|
|
17,415 |
|
|
|
|
|
|
|
|
||
Capitalized overhead |
|
|
1,797 |
|
|
|
1,599 |
|
|
|
|
|
|
|
|
||
Capitalized interest |
|
|
453 |
|
|
|
618 |
|
|
|
|
|
|
|
|
||
Total capital expenditures |
|
$ |
44,225 |
|
|
$ |
39,517 |
|
Annual capital expenditures budgets are prepared for each of our properties that are intended to provide for all necessary recurring and non-recurring capital expenditures. We believe that property operating cash flows, which include reimbursements from tenants for certain expenses, will provide the necessary funding for these expenditures.
Developments and Redevelopments
Developments Completed During the Year Ended December 31, 2023
(Dollars in thousands)
|
|
|
|
|
|
|
|
|
CBL's Share of |
|
|
|
|
|
||||||||||
Property |
|
Location |
|
CBL |
|
Total |
|
|
Total |
|
|
Cost to |
|
|
2023 |
|
|
Opening |
|
Initial |
||||
Mall Expansion: |
|
|
|
|
|
|
|
|
|
|
|
|
|
|
|
|
|
|
|
|
||||
Sunrise Mall - Bubba's 33 |
|
Brownsville, TX |
|
100% |
|
|
7,575 |
|
|
$ |
1,049 |
|
|
$ |
1,252 |
|
|
$ |
1,052 |
|
|
Q3 '23 |
|
18.0% |
|
|
|
|
|
|
|
|
|
|
|
|
|
|
|
|
|
|
|
|
|
||||
Redevelopments: |
|
|
|
|
|
|
|
|
|
|
|
|
|
|
|
|
|
|
|
|
||||
Kirkwood Mall - Five Below |
|
Bismarck, ND |
|
100% |
|
|
19,478 |
|
|
|
2,323 |
|
|
|
1,694 |
|
|
|
1,691 |
|
|
Q3 '23 |
|
16.3% |
The Terrace - Nordstrom Rack (former Staples) |
|
Chattanooga, TN |
|
92% |
|
|
24,155 |
|
|
|
2,513 |
|
|
|
1,841 |
|
|
|
219 |
|
|
Q2 '23 |
|
13.0% |
York Town Center - Burlington (former Bed Bath & Beyond) |
|
York, PA |
|
50% |
|
|
28,000 |
|
|
|
1,247 |
|
|
|
1,266 |
|
|
|
279 |
|
|
Q1 '23 |
|
18.5% |
|
|
|
|
|
|
|
71,633 |
|
|
|
6,083 |
|
|
|
4,801 |
|
|
|
2,189 |
|
|
|
|
|
Open-Air Center: |
|
|
|
|
|
|
|
|
|
|
|
|
|
|
|
|
|
|
|
|
||||
Fremaux Town Center - Marshall's |
|
Slidell, LA |
|
65% |
|
|
22,132 |
|
|
|
2,356 |
|
|
|
2,688 |
|
|
|
2,625 |
|
|
Q4 '23 |
|
10.5% |
|
|
|
|
|
|
|
|
|
|
|
|
|
|
|
|
|
|
|
|
|
||||
Total Properties Completed |
|
|
|
|
|
|
101,340 |
|
|
$ |
9,488 |
|
|
$ |
8,741 |
|
|
$ |
5,866 |
|
|
|
|
|
57
Properties under Development at December 31, 2023
(Dollars in thousands)
|
|
|
|
|
|
|
|
|
CBL's Share of |
|
|
|
|
|
||||||||||
Property |
|
Location |
|
CBL |
|
Total |
|
|
Total |
|
|
Cost to |
|
|
2023 |
|
|
Expected Opening |
|
Initial |
||||
Outparcel Development: |
|
|
|
|
|
|
|
|
|
|
|
|
|
|
|
|
|
|
|
|
||||
Mayfaire Town Center - hotel development |
|
Wilmington, NC |
|
49% |
|
|
83,021 |
|
|
$ |
15,435 |
|
|
$ |
3,197 |
|
|
$ |
2,025 |
|
|
Summer '25 |
|
11.0% |
|
|
|
|
|
|
|
|
|
|
|
|
|
|
|
|
|
|
|
|
|
||||
Redevelopments: |
|
|
|
|
|
|
|
|
|
|
|
|
|
|
|
|
|
|
|
|
||||
Hamilton Place - Crunch Fitness |
|
Chattanooga, TN |
|
100% |
|
|
36,640 |
|
|
|
2,648 |
|
|
|
1,855 |
|
|
|
1,837 |
|
|
Winter '24 |
|
23.3% |
|
|
|
|
|
|
|
|
|
|
|
|
|
|
|
|
|
|
|
|
|
||||
Total Properties Under Development |
|
|
|
|
|
|
119,661 |
|
|
$ |
18,083 |
|
|
$ |
5,052 |
|
|
$ |
3,862 |
|
|
|
|
|
We are continually pursuing new redevelopment opportunities and have projects in various stages of pre-development. Except for the projects presented above, we did not have any other material capital commitments as of December 31, 2023.
Critical Accounting Policies and Estimates
Our consolidated financial statements are prepared in accordance with GAAP. In preparing our financial statements, we are required to make assumptions and estimates about future events, and apply judgments that affect the reported amounts of assets, liabilities, revenues, expenses and the related disclosures. We base our assumptions, estimates and judgments on historical experience, current trends and other factors that management believes to be relevant at the time our consolidated financial statements are prepared. On a regular basis, we review the accounting policies, assumptions, estimates and judgments to ensure that our financial statements are presented fairly and in accordance with GAAP. However, because future events and their effects cannot be determined with certainty, actual results could differ from our assumptions and estimates, and such differences could be material.
An accounting policy is deemed to be critical if it requires an accounting estimate to be made based on assumptions about matters that are highly uncertain at the time the estimate is made and if different estimates that are reasonably likely to occur could materially impact the financial statements. Management believes that the following critical accounting policies discussed in this section reflect its more significant estimates and assumptions used in preparation of the consolidated financial statements. We have reviewed these critical accounting estimates and related disclosures with the audit committee of our board of directors. See Note 2 of the consolidated financial statements, included in Item 8 of this Annual Report on Form 10-K for a discussion of our significant accounting policies.
Revenue Recognition and Accounts Receivable
Receivables include amounts billed and currently due from tenants pursuant to lease agreements and receivables attributable to straight-line rents associated with those lease agreements. Individual leases where the collection of rents is in dispute are assessed for collectability based on management’s best estimate of collection considering the anticipated outcome of the dispute. Individual leases that are not in dispute are assessed for collectability and upon the determination that the collection of rents over the remaining lease term is not probable, accounts receivable are reduced as an adjustment to rental revenues. Revenue from leases where collection is deemed to be less than probable is recorded on a cash basis until collectability is determined to be probable. Further, management assesses whether operating lease receivables, at a portfolio level, are appropriately valued based upon an analysis of balances outstanding, historical collection levels and current economic trends. An allowance for the uncollectable portion of the portfolio is recorded as an adjustment to rental revenues.
We review current economic considerations each reporting period, including the effects of tenant bankruptcies. Additionally, our assessment also takes into consideration the type of tenant and current discussions with the tenants regarding matters such as billing disputes, lease negotiations and executed deferrals or abatements, as well as recent rent payment and credit history. Evaluating and estimating uncollectable lease payments and related receivables requires a significant amount of judgment by management and is based on the best information available to management at the time of evaluation.
58
Carrying Value of Long-Lived Assets
We monitor events or changes in circumstances that could indicate the carrying value of a long-lived asset may not be recoverable. We use significant judgement in assessing events or circumstances which might indicate impairment, including but not limited to, changes in our intent to hold a long-lived asset over its previously estimated useful life. Changes in our intent to hold a long-lived asset have a significant impact on the estimated undiscounted cash flows expected to result from the use and eventual disposition of a long-lived asset and whether a potential impairment loss shall be measured. When indicators of potential impairment are present that suggest that the carrying amounts of a long-lived asset may not be recoverable, we assess the recoverability of the asset by determining whether the asset’s carrying value will be recovered through the estimated undiscounted future cash flows expected from our use and its eventual disposition. In the event that such undiscounted future cash flows do not exceed the carrying value, we adjust the carrying value of the long-lived asset to its estimated fair value and recognize an impairment loss. The estimated fair value is calculated based on the following information, in order of preference, depending upon availability: (Level 1) recently quoted market prices, (Level 2) market prices for comparable properties, or (Level 3) the present value of future cash flows, including estimated salvage value. Certain of our long-lived assets may be carried at more than an amount that could be realized in a current disposition transaction. We estimate future operating cash flows, the terminal capitalization rate and the discount rate, among other factors. As these assumptions are subject to economic and market uncertainties, they are difficult to predict and are subject to future events that may alter the assumptions used or management’s estimates of future possible outcomes. Therefore, the future cash flows estimated in our impairment analyses may not be achieved.
Investments in Unconsolidated Affiliates
On a periodic basis, we assess whether there are any indicators that the fair value of our investments in unconsolidated affiliates may be impaired. An investment is impaired only if our estimate of the fair value of the investment is less than the carrying value of the investment, and such decline in value is deemed to be other than temporary. To the extent impairment has occurred, the loss is measured as the excess of the carrying amount of the investment over the fair value of the investment. Our estimates of fair value for each investment are based on a number of assumptions such as future leasing expectations, operating forecasts, discount rates and capitalization rates, among others. These assumptions are subject to economic and market uncertainties including, but not limited to, demand for space, competition for tenants, changes in market rental rates, and operating costs. As these factors are difficult to predict and are subject to future events that may alter our assumptions, the fair values estimated in the impairment analyses may not be realized.
Application of Fresh Start Accounting
As described in Note 19 to the consolidated financial statements, we applied Financial Accounting Standards Board (“FASB”) ASC 852 in preparing the consolidated financial statements. For periods subsequent to the filing of the Chapter 11 Cases and before emergence, ASC 852 requires distinguishing transactions associated with the reorganization separate from activities related to the ongoing operations of the business. Upon the effectiveness of the Plan and the emergence of the Debtors from the Chapter 11 Cases, the Company determined it qualified for fresh start accounting under ASC 852, which resulted in the Company becoming a new entity for financial reporting purposes on the Effective Date. We elected to apply fresh start accounting using a convenience date of October 31, 2021. We evaluated and concluded that the events on November 1, 2021 were not material to our financial reporting on both a quantitative and qualitative basis.
Enterprise Value
With the assistance of third-party valuation advisors, we determined the enterprise and corresponding equity value of the Successor using a calculation of the present value of future cash flows based on our financial projections. The enterprise value and corresponding equity value are dependent upon achieving the future financial results set forth in our valuations, as well as the realization of certain other assumptions. All estimates, assumptions, valuations and financial projections, including the fair value adjustments, the financial projections, the enterprise value and equity value projections, are inherently subject to significant uncertainties and the resolution of contingencies beyond our control. Accordingly, we cannot assure you that the estimates, assumptions, valuations or financial projections will be realized, and actual results could vary materially.
59
Real Estate Assets
In developing the fair value estimates for the portfolio of our retail properties, all three traditional approaches to valuation were considered including the income approach, the sales comparison (market) approach and the cost approach. These valuation approaches have long been recognized as acceptable in the appropriate circumstances and in valuations of this type. Accordingly, all applicable properties were identified, investigated and examined by the valuation provider along with all intangible assets and liabilities associated with our properties. Furthermore, the valuation provider estimated the fair values and remaining useful lives ("RUL") of the related intangible assets and liabilities at the property-level, as applicable. In most cases, our properties included the following intangible assets/liabilities:
For the valuation of the tangible assets of each property, all pertinent information such as blueprints and drawings, property tax statements, prior appraisals and cost segregation reports were utilized. In terms of methodology, our properties were valued via the income approach in order to estimate building values. Separate values for the underlying land and site improvements were developed via the cost approach. As part of the allocation process, the fair value of the following tangible components was estimated:
Investment in Unconsolidated Affiliates
The fair value of our investment in unconsolidated affiliates for fresh start accounting was determined by valuing the underlying real estate assets associated with each unconsolidated joint venture in the same manner as all real estate assets, described above. We then calculated the net asset or liability value of each joint venture by applying the net working capital balance to the fair value of the real estate assets and the amount outstanding under any associated mortgage notes. The percentage of ownership interest in each joint venture was applied to the net asset or liability value which resulted in the fair value of each unconsolidated affiliate. See Note 2 for further information related to the equity method of accounting.
Right-of-Use Assets and Lease Liabilities
The fair value of lease liabilities was measured as the present value of the remaining lease payments, as if the lease were a new lease as of the Effective Date. We used our incremental borrowing rate (“IBR”) as the discount rate in determining the present value of the remaining lease payments, which was determined by a third-party valuation advisor using a fundamental credit rating analysis and an implied market yield analysis based on the newly issued secured notes. Based upon the corresponding lease term, the IBR was approximately 12%.
Mortgage Notes Payable
The fair value of the mortgage notes payable was estimated by a third-party valuation advisor based on an analysis of the Company’s collateral coverage, financial metrics and interest rate for each mortgage note payable relative to market rates. If there is a reasonable expectation that the debtor will be able to meet the financial obligations of the mortgage note payable, or the mortgage note payable is a recourse loan, then the value of the mortgage note is equal to the present value of the future mortgage note payments discounted at a rate of return commensurate with the risk associated with the mortgage note payments. If the debtor is unable, or if there is uncertainty if the debtor will be able, to meet the financial obligations of the mortgage note, then the value of the mortgage note payable is equal to the expected proceeds to be received through a liquidation of the underlying property at fair value.
Recent Accounting Pronouncements
See Note 2 to the consolidated financial statements for information on recently issued accounting pronouncements.
60
Non-GAAP Measures
Funds from Operations
FFO is a widely used non-GAAP measure of the operating performance of real estate companies that supplements net income (loss) determined in accordance with GAAP. The National Association of Real Estate Investment Trusts (“NAREIT”) defines FFO as net income (loss) (computed in accordance with GAAP) excluding gains or losses on sales of depreciable operating properties and impairment losses of depreciable properties, plus depreciation and amortization, and after adjustments for unconsolidated partnerships and joint ventures and noncontrolling interests. Adjustments for unconsolidated partnerships and joint ventures and noncontrolling interests are calculated on the same basis. We define FFO as defined above by NAREIT. Our method of calculating FFO may be different from methods used by other REITs and, accordingly, may not be comparable to such other REITs.
We believe that FFO provides an additional indicator of the operating performance of our properties without giving effect to real estate depreciation and amortization, which assumes the value of real estate assets declines predictably over time. Since values of real estate assets have historically risen or fallen with market conditions, we believe that FFO enhances investors’ understanding of our operating performance. The use of FFO as an indicator of financial performance is influenced not only by the operations of our properties and interest rates, but also by our capital structure.
We believe FFO allocable to Operating Partnership common unitholders is a useful performance measure since we conduct substantially all our business through our Operating Partnership and, therefore, it reflects the performance of our properties in absolute terms regardless of the ratio of ownership interests of our common shareholders and the noncontrolling interest in our Operating Partnership.
In our reconciliation of net income (loss) attributable to common shareholders to FFO allocable to Operating Partnership common unitholders that is presented below, we make an adjustment to add back noncontrolling interest in income (loss) of our Operating Partnership in order to arrive at FFO of the Operating Partnership common unitholders.
FFO does not represent cash flows from operations as defined by GAAP, is not necessarily indicative of cash available to fund all cash flow needs and should not be considered as an alternative to net income (loss) for purposes of evaluating our operating performance or to cash flow as a measure of liquidity.
We believe that it is important to identify the impact of certain significant items on our FFO measures for a reader to have a complete understanding of our results of operations. Therefore, we have also presented adjusted FFO measures excluding these significant items from the applicable periods. Please refer to the reconciliation of net loss attributable to common shareholders to FFO allocable to Operating Partnership common unitholders below for a description of these adjustments.
61
The reconciliation of net income (loss) attributable to common shareholders to FFO allocable to Operating Partnership common unitholders is as follows (in thousands):
|
|
Successor |
|
|||||
|
|
Year Ended December 31, |
|
|||||
|
|
2023 |
|
|
2022 |
|
||
Net income (loss) attributable to common shareholders |
|
$ |
5,433 |
|
|
$ |
(96,019 |
) |
Noncontrolling interest in income (loss) of Operating Partnership |
|
|
2 |
|
|
|
(34 |
) |
Earnings allocable to unvested restricted stock |
|
|
1,113 |
|
|
|
2,537 |
|
Depreciation and amortization expense of: |
|
|
|
|
|
|
||
Consolidated properties |
|
|
190,505 |
|
|
|
256,310 |
|
Unconsolidated affiliates |
|
|
17,408 |
|
|
|
20,813 |
|
Non-real estate assets |
|
|
(905 |
) |
|
|
(1,050 |
) |
Noncontrolling interests' share of depreciation and amortization in other consolidated subsidiaries |
|
|
(2,442 |
) |
|
|
(3,498 |
) |
Loss on impairment, net of taxes |
|
|
— |
|
|
|
186 |
|
Gain on depreciable property |
|
|
— |
|
|
|
(629 |
) |
FFO allocable to Operating Partnership common unitholders |
|
|
211,114 |
|
|
|
178,616 |
|
Debt discount accretion, including our share of unconsolidated affiliates and net of noncontrolling interests' share (1) |
|
|
61,788 |
|
|
|
176,055 |
|
Adjustment for unconsolidated affiliates with negative investment (2) |
|
|
(7,242 |
) |
|
|
(37,645 |
) |
Senior secured notes fair value adjustment (3) |
|
|
— |
|
|
|
(395 |
) |
Litigation settlement (4) |
|
|
(2,310 |
) |
|
|
(304 |
) |
Non-cash default interest expense (5) |
|
|
972 |
|
|
|
(28,953 |
) |
Gain on deconsolidation (6) |
|
|
(47,879 |
) |
|
|
(36,250 |
) |
Loss on available-for-sale securities |
|
|
— |
|
|
|
39 |
|
Reorganization items, net (7) |
|
|
— |
|
|
|
(298 |
) |
Gain on extinguishment of debt (8) |
|
|
(3,270 |
) |
|
|
(7,344 |
) |
FFO allocable to Operating Partnership common unitholders, as adjusted |
|
$ |
213,173 |
|
|
$ |
243,521 |
|
FFO of the Operating Partnership increased to $211.1 million for the Successor year ended December 31, 2023 from $178.6 million for the prior-year period. Excluding the adjustments noted above, FFO of the Operating Partnership, as adjusted, decreased to $213.2 million for the Successor year ended December 31, 2023 from $243.5 million for the prior-year period. The decrease in FFO, as adjusted, for the Successor year ended December 31, 2023 was primarily driven by lower percentage rents, an unfavorable variance in the estimate for uncollectable revenues in the current-year period as compared to the prior-year period and higher interest expense due to rising variable interest rates. The decrease was partially offset by increased interest income on our U.S. Treasury securities and lower real estate taxes, as well as lower utility, janitorial and security costs.
62
ITEM 7A. QUANTITATIVE AND QUALITATIVE DISCLOSURES ABOUT MARKET RISK
We are exposed to various market risk exposures, including interest rate risk. The following discussion regarding our risk management activities includes forward-looking statements that involve risk and uncertainties. Estimates of future performance and economic conditions are reflected assuming certain changes in interest rates. Caution should be used in evaluating our overall market risk from the information presented below, as actual results may differ.
Interest Rate Risk
Based on our proportionate share of consolidated and unconsolidated variable-rate debt at December 31, 2023, a 0.5% increase or decrease in interest rates on variable-rate debt would increase or decrease annual interest expense by approximately $5.4 million.
Based on our proportionate share of total consolidated and unconsolidated debt at December 31, 2023, a 0.5% increase in interest rates would decrease the fair value of debt by approximately $12.6 million, while a 0.5% decrease in interest rates would increase the fair value of debt by approximately $13.0 million.
ITEM 8. FINANCIAL STATEMENTS AND SUPPLEMENTARY DATA
Reference is made to the Index to Financial Statements and Schedules contained in Item 15 on page 68.
ITEM 9. CHANGES IN AND DISAGREEMENTS WITH ACCOUNTANTS ON ACCOUNTING AND FINANCIAL DISCLOSURE
None.
ITEM 9A. CONTROLS AND PROCEDURES
Conclusion Regarding Effectiveness of Disclosure Controls and Procedures
Because of its inherent limitations, internal control over financial reporting may not prevent or detect misstatements. Also, projections of any evaluation of its effectiveness to future periods are subject to the risk that controls may become inadequate because of changes in conditions, or that the degree of compliance with the policies or procedures may deteriorate.
Under the supervision and with the participation of the Company's management, including its Chief Executive Officer and Chief Financial Officer, the Company has evaluated the effectiveness of its disclosure controls and procedures, as defined in Rule 13a-15(e) under the Securities Exchange Act of 1934, as amended, as of the end of the period covered by this report, to ensure that the information required to be disclosed by the Company in the reports that the Company files or submits under the Securities Exchange Act of 1934 is recorded, processed, summarized and reported within the time periods specified in the SEC rules and forms, and is accumulated and communicated to our management, including the Company's Chief Executive Officer and Chief Financial Officer, as appropriate, to allow timely decisions regarding required disclosure.
Management's Report on Internal Control over Financial Reporting
Management is responsible for establishing and maintaining adequate internal control over financial reporting, as defined in Rule 13a-15(f) under the Securities Exchange Act of 1934, as amended. The Company assessed the effectiveness of its internal control over financial reporting, based on criteria established in Internal Control – Integrated Framework (2013) issued by the Committee of Sponsoring Organizations of the Treadway Commission, and concluded that, as of December 31, 2023, the Company maintained effective internal control over financial reporting, as stated in its report which is included herein.
Report of Management on Internal Control over Financial Reporting
Management is responsible for establishing and maintaining adequate internal control over financial reporting. The Company’s internal control over financial reporting is a process designed under the supervision of the Company’s Chief Executive Officer and Chief Financial Officer to provide reasonable assurance regarding the reliability of financial reporting and the preparation of the Company’s financial statements for external reporting purposes in accordance with U.S. generally accepted accounting principles.
63
Management recognizes that there are inherent limitations in the effectiveness of internal control over financial reporting, including the potential for human error or the circumvention or overriding of internal controls. Accordingly, even effective internal control over financial reporting cannot provide absolute assurance with respect to financial statement preparation. Because of such limitations, there is a risk that material misstatements may not be prevented or detected on a timely basis by internal control over financial reporting. In addition, any projection of the evaluation of effectiveness to future periods is subject to the risk that controls may become inadequate because of changes in conditions, or that the degree of compliance with the polices or procedures may deteriorate.
Management assessed the effectiveness of the Company’s internal control over financial reporting based on the framework established in Internal Control — Integrated Framework (2013) issued by the Committee of Sponsoring Organizations of the Treadway Commission and concluded that, as of December 31, 2023, the Company maintained effective internal control over financial reporting.
Deloitte & Touche LLP, the Company’s independent registered public accounting firm, has audited the Company's internal control over financial reporting as of December 31, 2023, as stated in their report which is included below.
Changes in Internal Control over Financial Reporting
There were no changes in the Company's internal control over financial reporting during the quarter ended December 31, 2023 that have materially affected, or are reasonably likely to materially affect, the Company's internal control over financial reporting.
64
REPORT OF INDEPENDENT REGISTERED PUBLIC ACCOUNTING FIRM
To the stockholders and the board of directors of CBL & Associates Properties, Inc.
Opinion on Internal Control over Financial Reporting
We have audited the internal control over financial reporting of CBL & Associates Properties, Inc. and subsidiaries (the “Company”) as of December 31, 2023, based on criteria established in Internal Control —Integrated Framework (2013) issued by the Committee of Sponsoring Organizations of the Treadway Commission (COSO). In our opinion, the Company maintained, in all material respects, effective internal control over financial reporting as of December 31, 2023, based on criteria established in Internal Control — Integrated Framework (2013) issued by COSO.
We have also audited, in accordance with the standards of the Public Company Accounting Oversight Board (United States) (PCAOB), the consolidated financial statements as of and for the year ended December 31, 2023, of the Company and our report dated February 29, 2024, expressed an unqualified opinion on those financial statements.
Basis for Opinion
The Company’s management is responsible for maintaining effective internal control over financial reporting and for its assessment of the effectiveness of internal control over financial reporting, included in the accompanying Report of Management on Internal Control over Financial Reporting. Our responsibility is to express an opinion on the Company’s internal control over financial reporting based on our audit. We are a public accounting firm registered with the PCAOB and are required to be independent with respect to the Company in accordance with the U.S. federal securities laws and the applicable rules and regulations of the Securities and Exchange Commission and the PCAOB.
We conducted our audit in accordance with the standards of the PCAOB. Those standards require that we plan and perform the audit to obtain reasonable assurance about whether effective internal control over financial reporting was maintained in all material respects. Our audit included obtaining an understanding of internal control over financial reporting, assessing the risk that a material weakness exists, testing and evaluating the design and operating effectiveness of internal control based on the assessed risk, and performing such other procedures as we considered necessary in the circumstances. We believe that our audit provides a reasonable basis for our opinion.
Definition and Limitations of Internal Control over Financial Reporting
A company’s internal control over financial reporting is a process designed to provide reasonable assurance regarding the reliability of financial reporting and the preparation of financial statements for external purposes in accordance with generally accepted accounting principles. A company’s internal control over financial reporting includes those policies and procedures that (1) pertain to the maintenance of records that, in reasonable detail, accurately and fairly reflect the transactions and dispositions of the assets of the company; (2) provide reasonable assurance that transactions are recorded as necessary to permit preparation of financial statements in accordance with generally accepted accounting principles, and that receipts and expenditures of the company are being made only in accordance with authorizations of management and directors of the company; and (3) provide reasonable assurance regarding prevention or timely detection of unauthorized acquisition, use, or disposition of the company’s assets that could have a material effect on the financial statements.
Because of its inherent limitations, internal control over financial reporting may not prevent or detect misstatements. Also, projections of any evaluation of effectiveness to future periods are subject to the risk that controls may become inadequate because of changes in conditions, or that the degree of compliance with the policies or procedures may deteriorate.
/s/ Deloitte & Touche LLP
Atlanta, Georgia
February 29, 2024
65
ITEM 9B. OTHER INFORMATION
ITEM 9C. DISCLOSURE REGARDING FOREIGN JURISDICTIONS THAT PREVENT INSPECTIONS
Not applicable.
66
PART III
ITEM 10. DIRECTORS, EXECUTIVE OFFICERS AND CORPORATE GOVERNANCE
Incorporated herein by reference to the sections entitled “ELECTION OF DIRECTORS–General,” “ELECTION OF DIRECTORS–Director Nominees," "ELECTION OF DIRECTORS–Additional Executive Officers,” “CORPORATE GOVERNANCE MATTERS–Code of Business Conduct and Ethics,” “CORPORATE GOVERNANCE MATTERS–Board of Directors’ Meetings and Committees – The Audit Committee,” and “Delinquent Section 16(a) Reports” in our definitive proxy statement which will be filed with the SEC within 120 days of December 31, 2023, with respect to our Annual Meeting of Shareholders to be held on May 22, 2024.
Our board of directors has determined that each of Marjorie L. Bowen, David J. Contis, Robert G. Gifford and Michael A. Torres, each, an independent director and member of the audit committee, qualifies as an “audit committee financial expert” as such term is defined by the rules of the SEC.
ITEM 11. EXECUTIVE COMPENSATION
Incorporated herein by reference to the sections entitled “DIRECTOR COMPENSATION,” “EXECUTIVE COMPENSATION,” “REPORT OF THE COMPENSATION COMMITTEE OF THE BOARD OF DIRECTORS” and “Compensation Committee Interlocks and Insider Participation” in our definitive proxy statement which will be filed with the SEC within 120 days of December 31, 2023, with respect to our Annual Meeting of Shareholders to be held on May 22, 2024.
ITEM 12. SECURITY OWNERSHIP OF CERTAIN BENEFICIAL OWNERS AND MANAGEMENT AND RELATED STOCKHOLDER MATTERS
Incorporated herein by reference to the sections entitled “SECURITY OWNERSHIP OF CERTAIN BENEFICIAL OWNERS AND MANAGEMENT” and “Equity Compensation Plan Information as of December 31, 2023”, in our definitive proxy statement which will be filed with the SEC within 120 days of December 31, 2023, with respect to our Annual Meeting of Shareholders to be held on May 22, 2024.
Incorporated herein by reference to the sections entitled “CORPORATE GOVERNANCE MATTERS–Director Independence” and “CERTAIN RELATIONSHIPS AND RELATED PERSON TRANSACTIONS”, in our definitive proxy statement which will be filed with the SEC within 120 days of December 31, 2023, with respect to our Annual Meeting of Shareholders to be held on May 22, 2024.
ITEM 14. PRINCIPAL ACCOUNTING FEES AND SERVICES
Incorporated herein by reference to the section entitled “Independent Registered Public Accountants’ Fees and Services” under “RATIFICATION OF THE SELECTION OF INDEPENDENT REGISTERED PUBLIC ACCOUNTANTS” in our definitive proxy statement which will be filed with the SEC within 120 days of December 31, 2023, with respect to our Annual Meeting of Shareholders to be held on May 22, 2024.
67
PART IV
ITEM 15. EXHIBITS, FINANCIAL STATEMENT SCHEDULES
(1) |
Consolidated Financial Statements |
Page Number |
|
|
|
|
69 |
|
|
|
|
|
PCAOB ID: |
|
|
|
|
|
Consolidated Balance Sheets as of December 31, 2023 and 2022 |
71 |
|
|
|
|
72 |
|
|
|
|
|
73 |
|
|
|
74 |
|
|
|
|
76 |
|
|
|
|
|
|
|
|
77 |
|
|
|
|
(2) |
Consolidated Financial Statement Schedules |
|
|
|
|
|
119 |
|
|
|
|
|
124 |
|
|
|
|
|
Financial statement schedules not listed herein are either not required or are not present in amounts sufficient to require submission of the schedule or the information required to be included therein is included in our consolidated financial statements in Item 15 or are reported elsewhere. |
|
|
|
|
(3) |
Exhibits |
|
|
125 |
|
ITEM 16. FORM 10-K SUMMARY
None.
68
REPORT OF INDEPENDENT REGISTERED PUBLIC ACCOUNTING FIRM
To the shareholders and the board of directors of CBL & Associates Properties, Inc.
Opinion on the Financial Statements
We have audited the accompanying consolidated balance sheets of CBL & Associates Properties, Inc. and subsidiaries (the "Company") as of December 31, 2023 and 2022, the related consolidated statements of operations, comprehensive income (loss), equity, and cash flows, for the two years in the period ended December 31, 2023 and the two months ended December 31, 2021 (Successor Company operations), and the ten months ended October 31, 2021 (Predecessor Company operations), and the related notes and the schedules listed in the Index at Item 15 (collectively referred to as the "financial statements"). In our opinion, the Successor Company financial statements present fairly, in all material respects, the financial position of the Company as of December 31, 2023 and 2022, and the results of its operations and its cash flows for the two years in the period ended December 31, 2023 and the two months ended December 31, 2021, in conformity with accounting principles generally accepted in the United States of America. Further in our opinion, the Predecessor Company financial statements present fairly, in all material respects, the results of its operations and its cash flows for the ten months ended October 31, 2021, in conformity with accounting principles generally accepted in the United States of America.
We have also audited, in accordance with the standards of the Public Company Accounting Oversight Board (United States) (PCAOB), the Company's internal control over financial reporting as of December 31, 2023, based on criteria established in Internal Control — Integrated Framework (2013) issued by the Committee of Sponsoring Organizations of the Treadway Commission and our report dated February 29, 2024, expressed an unqualified opinion on the Company's internal control over financial reporting.
Fresh-Start Accounting
As discussed in Note 18 to the financial statements, the Bankruptcy Court entered an order confirming the plan of reorganization which became effective on November 1, 2021. Accordingly, the accompanying financial statements have been prepared in conformity with FASB Accounting Standards Codification 852, Reorganizations, for the Successor Company as a new entity with assets, liabilities and a capital structure having carrying values not comparable with prior periods as described in Note 19 to the financial statements.
Basis for Opinion
These financial statements are the responsibility of the Company's management. Our responsibility is to express an opinion on the Company's financial statements based on our audits. We are a public accounting firm registered with the PCAOB and are required to be independent with respect to the Company in accordance with the U.S. federal securities laws and the applicable rules and regulations of the Securities and Exchange Commission and the PCAOB.
We conducted our audits in accordance with the standards of the PCAOB. Those standards require that we plan and perform the audit to obtain reasonable assurance about whether the financial statements are free of material misstatement, whether due to error or fraud. Our audits included performing procedures to assess the risks of material misstatement of the financial statements, whether due to error or fraud, and performing procedures that respond to those risks. Such procedures included examining, on a test basis, evidence regarding the amounts and disclosures in the financial statements. Our audits also included evaluating the accounting principles used and significant estimates made by management, as well as evaluating the overall presentation of the financial statements. We believe that our audits provide a reasonable basis for our opinion.
Critical Audit Matter
The critical audit matter communicated below is a matter arising from the current-period audit of the financial statements that was communicated or required to be communicated to the audit committee and that (1) relates to accounts or disclosures that are material to the financial statements and (2) involved our especially challenging, subjective, or complex judgments. The communication of critical audit matters does not alter in any way our opinion on the financial statements, taken as a whole, and we are not, by communicating the critical audit matter below, providing a separate opinion on the critical audit matter or on the accounts or disclosures to which it relates.
69
Real Estate Assets – Change in Management’s Intent — Refer to Note 2 to the financial statements
Critical Audit Matter Description
As of December 31, 2023, the Company owned controlling interests in 67 regional malls/open-air and lifestyle and outlet centers and 4 other properties and had a total net investment in real estate assets of $1.58 billion. The Company performs an impairment analysis on these long-lived assets if events or changes in circumstances indicate that the carrying value of any of its long-lived assets may not be recoverable. The Company uses significant judgement in assessing events or circumstances which might indicate impairment, including but not limited to, changes in management’s intent to hold a long-lived asset over its previously estimated useful life. Changes in management’s intent to hold a long-lived asset has a significant impact on the estimated undiscounted cash flows expected to result from the use and eventual disposition of a long-lived asset and whether a potential impairment loss shall be measured.
The Company’s use of judgement in the determination of its current intentions with respect to its long-lived assets as part of their impairment indicator assessment is subjective and requires judgment. Because of this, auditing these judgements required a high degree of auditor judgment and extensive auditor effort, especially given the inherent unpredictability involved in the timing of a sale or other disposition significantly before the end of its previously estimated useful life.
How the Critical Audit Matter Was Addressed in the Audit
Our audit procedures related to changes in management’s intent with respect to its long-lived assets included the following, among others:
/s/
February 29, 2024
We have served as the Company's auditor since 2002.
70
CBL & Associates Properties, Inc.
Consolidated Balance Sheets
(In thousands, except share data)
|
|
Successor |
|
|||||
|
|
December 31, |
|
|
December 31, |
|
||
ASSETS (1) |
|
2023 |
|
|
2022 |
|
||
Real estate assets: |
|
|
|
|
|
|
||
Land |
|
$ |
|
|
$ |
|
||
Buildings and improvements |
|
|
|
|
|
|
||
|
|
|
|
|
|
|
||
Accumulated depreciation |
|
|
( |
) |
|
|
( |
) |
|
|
|
|
|
|
|
||
Developments in progress |
|
|
|
|
|
|
||
Net investment in real estate assets |
|
|
|
|
|
|
||
Cash and cash equivalents |
|
|
|
|
|
|
||
Restricted cash |
|
|
|
|
|
|
||
Available-for-sale securities - at fair value (amortized cost of $ |
|
|
|
|
|
|
||
Receivables: |
|
|
|
|
|
|
||
Tenant |
|
|
|
|
|
|
||
Other |
|
|
|
|
|
|
||
Investments in unconsolidated affiliates |
|
|
|
|
|
|
||
In-place leases, net |
|
|
|
|
|
|
||
Above market leases, net |
|
|
|
|
|
|
||
Intangible lease assets and other assets |
|
|
|
|
|
|
||
|
|
$ |
|
|
$ |
|
||
LIABILITIES AND EQUITY |
|
|
|
|
|
|
||
Mortgage and other indebtedness, net |
|
$ |
|
|
$ |
|
||
Below market leases, net |
|
|
|
|
|
|
||
Accounts payable and accrued liabilities |
|
|
|
|
|
|
||
Total liabilities (1) |
|
|
|
|
|
|
||
Shareholders' equity: |
|
|
|
|
|
|
||
Common stock, $ |
|
|
|
|
|
|||
Additional paid-in capital |
|
|
|
|
|
|
||
Accumulated other comprehensive income (loss) |
|
|
|
|
|
( |
) |
|
Accumulated deficit |
|
|
( |
) |
|
|
( |
) |
Total shareholders' equity |
|
|
|
|
|
|
||
Noncontrolling interests |
|
|
( |
) |
|
|
( |
) |
Total equity |
|
|
|
|
|
|
||
|
|
$ |
|
|
$ |
|
||
The accompanying notes are an integral part of these consolidated statements.
71
CBL & Associates Properties, Inc.
Consolidated Statements of Operations
(In thousands, except per share amounts)
|
|
Successor |
|
|
|
Predecessor |
|
||||||||||
|
|
Year Ended December 31, |
|
|
Period from November 1, through December 31, |
|
|
|
Period from January 1, through October 31, |
|
|||||||
|
|
2023 |
|
|
2022 |
|
|
2021 |
|
|
|
2021 |
|
||||
REVENUES: |
|
|
|
|
|
|
|
|
|
|
|
|
|
||||
Rental revenues |
|
$ |
|
|
$ |
|
|
$ |
|
|
|
$ |
|
||||
Management, development and leasing fees |
|
|
|
|
|
|
|
|
|
|
|
|
|
||||
Other |
|
|
|
|
|
|
|
|
|
|
|
|
|
||||
Total revenues |
|
|
|
|
|
|
|
|
|
|
|
|
|
||||
EXPENSES: |
|
|
|
|
|
|
|
|
|
|
|
|
|
||||
Property operating |
|
|
( |
) |
|
|
( |
) |
|
|
( |
) |
|
|
|
( |
) |
Depreciation and amortization |
|
|
( |
) |
|
|
( |
) |
|
|
( |
) |
|
|
|
( |
) |
Real estate taxes |
|
|
( |
) |
|
|
( |
) |
|
|
( |
) |
|
|
|
( |
) |
Maintenance and repairs |
|
|
( |
) |
|
|
( |
) |
|
|
( |
) |
|
|
|
( |
) |
General and administrative |
|
|
( |
) |
|
|
( |
) |
|
|
( |
) |
|
|
|
( |
) |
Loss on impairment |
|
|
— |
|
|
|
( |
) |
|
|
— |
|
|
|
|
( |
) |
Litigation settlement |
|
|
|
|
|
|
|
|
|
|
|
|
|
||||
Other |
|
|
( |
) |
|
|
( |
) |
|
|
( |
) |
|
|
|
( |
) |
Total expenses |
|
|
( |
) |
|
|
( |
) |
|
|
( |
) |
|
|
|
( |
) |
OTHER INCOME (EXPENSES): |
|
|
|
|
|
|
|
|
|
|
|
|
|
||||
Interest and other income |
|
|
|
|
|
|
|
|
|
|
|
|
|
||||
Interest expense |
|
|
( |
) |
|
|
( |
) |
|
|
( |
) |
|
|
|
( |
) |
Gain on extinguishment of debt |
|
|
|
|
|
|
|
|
— |
|
|
|
|
— |
|
||
Gain on deconsolidation |
|
|
|
|
|
|
|
|
|
|
|
|
|
||||
Loss on available-for-sale securities |
|
|
— |
|
|
|
( |
) |
|
|
— |
|
|
|
|
— |
|
Gain (loss) on sales of real estate assets |
|
|
|
|
|
|
|
|
( |
) |
|
|
|
|
|||
Reorganization items, net |
|
|
— |
|
|
|
|
|
|
( |
) |
|
|
|
( |
) |
|
Income tax (provision) benefit |
|
|
( |
) |
|
|
( |
) |
|
|
|
|
|
|
( |
) |
|
Equity in earnings (losses) of unconsolidated affiliates |
|
|
|
|
|
|
|
|
|
|
|
|
( |
) |
|||
Total other expenses |
|
|
( |
) |
|
|
( |
) |
|
|
( |
) |
|
|
|
( |
) |
Net income (loss) |
|
|
|
|
|
( |
) |
|
|
( |
) |
|
|
|
( |
) |
|
Net (income) loss attributable to noncontrolling interests in: |
|
|
|
|
|
|
|
|
|
|
|
|
|
||||
Operating Partnership |
|
|
( |
) |
|
|
|
|
|
— |
|
|
|
|
|
||
Other consolidated subsidiaries |
|
|
|
|
|
|
|
|
|
|
|
|
|
||||
Net income (loss) attributable to the Company |
|
|
|
|
|
( |
) |
|
|
( |
) |
|
|
|
( |
) |
|
Dividends allocable to unvested restricted stock |
|
|
( |
) |
|
|
( |
) |
|
|
— |
|
|
|
|
— |
|
Net income (loss) attributable to common shareholders |
|
$ |
|
|
$ |
( |
) |
|
$ |
( |
) |
|
|
$ |
( |
) |
|
Basic and diluted per share data attributable to common shareholders: |
|
|
|
|
|
|
|
|
|
|
|
|
|
||||
Basic and diluted earnings per share |
|
$ |
|
|
$ |
( |
) |
|
$ |
( |
) |
|
|
$ |
( |
) |
|
Weighted-average basic and diluted shares |
|
|
|
|
|
|
|
|
|
|
|
|
|
||||
The accompanying notes are an integral part of these consolidated statements.
72
CBL & Associates Properties, Inc.
Consolidated Statements of Comprehensive Income (Loss)
(In thousands, except per share amounts)
|
|
Successor |
|
|
|
Predecessor |
|
||||||||||
|
|
Year Ended December 31, |
|
|
Period from November 1, through December 31, |
|
|
|
Period from January 1, through October 31, |
|
|||||||
|
|
2023 |
|
|
2022 |
|
|
2021 |
|
|
|
2021 |
|
||||
Net income (loss) |
|
$ |
|
|
$ |
( |
) |
|
$ |
( |
) |
|
|
$ |
( |
) |
|
|
|
|
|
|
|
|
|
|
|
|
|
|
|
||||
Other comprehensive gain (loss): |
|
|
|
|
|
|
|
|
|
|
|
|
|
||||
Unrealized gain on interest rate swap |
|
|
|
|
|
— |
|
|
|
— |
|
|
|
|
— |
|
|
Unrealized gain (loss) on available-for-sale securities |
|
|
|
|
|
( |
) |
|
|
( |
) |
|
|
|
( |
) |
|
Comprehensive income (loss) |
|
|
|
|
|
( |
) |
|
|
( |
) |
|
|
|
( |
) |
|
Comprehensive (income) loss attributable to noncontrolling interests in: |
|
|
|
|
|
|
|
|
|
|
|
|
|
||||
Operating Partnership |
|
|
( |
) |
|
|
|
|
|
— |
|
|
|
|
|
||
Other consolidated subsidiaries |
|
|
|
|
|
|
|
|
|
|
|
|
|
||||
Comprehensive income (loss) attributable to the Company |
|
|
|
|
|
( |
) |
|
|
( |
) |
|
|
|
( |
) |
|
Earnings allocable to unvested restricted stock |
|
|
( |
) |
|
|
( |
) |
|
|
— |
|
|
|
|
— |
|
Comprehensive income (loss) attributable to common shareholders |
|
$ |
|
|
$ |
( |
) |
|
$ |
( |
) |
|
|
$ |
( |
) |
|
73
CBL & Associates Properties, Inc.
Consolidated Statements of Equity
(in thousands, except share data)
|
|
Equity |
|
|||||||||||||||||||||||||||||||||
|
|
Shareholders' Equity |
|
|
|
|
|
|
|
|||||||||||||||||||||||||||
|
|
Redeemable Noncontrolling Interests |
|
|
Preferred Stock |
|
|
Common |
|
|
Additional |
|
|
Accumulated |
|
|
Accumulated Deficit |
|
|
Total |
|
|
Noncontrolling |
|
|
Total |
|
|||||||||
Balance, December 31, 2020 (Predecessor) |
|
$ |
( |
) |
|
$ |
|
|
$ |
|
|
$ |
|
|
$ |
|
|
$ |
( |
) |
|
$ |
|
|
$ |
|
|
$ |
|
|||||||
Net loss |
|
|
( |
) |
|
|
— |
|
|
|
— |
|
|
|
— |
|
|
|
— |
|
|
|
( |
) |
|
|
( |
) |
|
|
( |
) |
|
|
( |
) |
Other comprehensive income |
|
|
— |
|
|
|
— |
|
|
|
— |
|
|
|
— |
|
|
|
( |
) |
|
|
— |
|
|
|
( |
) |
|
|
— |
|
|
|
( |
) |
Cancellation of |
|
|
— |
|
|
|
— |
|
|
|
( |
) |
|
|
( |
) |
|
|
— |
|
|
|
— |
|
|
|
( |
) |
|
|
— |
|
|
|
( |
) |
Conversion of |
|
|
— |
|
|
|
— |
|
|
|
|
|
|
|
|
|
— |
|
|
|
— |
|
|
|
|
|
|
( |
) |
|
|
— |
|
|||
Amortization of deferred compensation |
|
|
— |
|
|
|
— |
|
|
|
— |
|
|
|
|
|
|
— |
|
|
|
— |
|
|
|
|
|
|
— |
|
|
|
|
|||
Performance stock units |
|
|
— |
|
|
|
— |
|
|
|
— |
|
|
|
|
|
|
— |
|
|
|
— |
|
|
|
|
|
|
— |
|
|
|
|
|||
Adjustment for noncontrolling interests |
|
|
|
|
|
— |
|
|
|
— |
|
|
|
( |
) |
|
|
— |
|
|
|
— |
|
|
|
( |
) |
|
|
|
|
|
( |
) |
||
Contributions from noncontrolling interests |
|
|
— |
|
|
|
|
|
|
|
|
|
— |
|
|
|
— |
|
|
|
— |
|
|
|
— |
|
|
|
( |
) |
|
|
( |
) |
||
Distributions to noncontrolling interests |
|
|
— |
|
|
|
|
|
|
|
|
|
— |
|
|
|
— |
|
|
|
— |
|
|
|
— |
|
|
|
|
|
|
|
||||
Cancellation of |
|
|
|
|
|
( |
) |
|
|
( |
) |
|
|
( |
) |
|
|
— |
|
|
|
|
|
|
( |
) |
|
|
|
|
|
( |
) |
|||
Fresh start accounting adjustments to noncontrolling interest |
|
|
— |
|
|
|
— |
|
|
|
— |
|
|
|
— |
|
|
|
— |
|
|
|
— |
|
|
|
— |
|
|
|
|
|
|
|
||
Issuance of |
|
|
— |
|
|
|
— |
|
|
|
|
|
|
|
|
|
— |
|
|
|
— |
|
|
|
|
|
|
— |
|
|
|
|
||||
Issuance of |
|
|
— |
|
|
|
— |
|
|
|
|
|
|
|
|
|
— |
|
|
|
— |
|
|
|
|
|
|
|
|
|
|
|||||
Balance, October 31, 2021 (Predecessor) |
|
$ |
— |
|
|
$ |
— |
|
|
$ |
|
|
$ |
|
|
$ |
— |
|
|
$ |
— |
|
|
$ |
|
|
$ |
|
|
$ |
|
|||||
|
|
|
|
|
|
|
|
|
|
|
|
|
|
|
|
|
|
|
|
|
|
|
|
|
|
|
|
|||||||||
|
|
|
|
|
|
|
|
|
|
|
|
|
|
|
|
|
|
|
|
|
|
|
|
|
|
|
|
|||||||||
Balance, November 1, 2021 (Successor) |
|
$ |
— |
|
|
$ |
— |
|
|
$ |
|
|
$ |
|
|
$ |
— |
|
|
$ |
— |
|
|
$ |
|
|
$ |
|
|
$ |
|
|||||
Net loss |
|
|
— |
|
|
|
— |
|
|
|
— |
|
|
|
— |
|
|
|
— |
|
|
|
( |
) |
|
|
( |
) |
|
|
( |
) |
|
|
( |
) |
Other comprehensive loss |
|
|
— |
|
|
|
— |
|
|
|
— |
|
|
|
— |
|
|
|
( |
) |
|
|
— |
|
|
|
( |
) |
|
|
— |
|
|
|
( |
) |
Amortization of deferred compensation |
|
|
— |
|
|
|
— |
|
|
|
— |
|
|
|
|
|
|
— |
|
|
|
— |
|
|
|
|
|
|
— |
|
|
|
|
|||
Issuance of |
|
|
— |
|
|
|
— |
|
|
|
|
|
|
( |
) |
|
|
— |
|
|
|
— |
|
|
|
— |
|
|
|
— |
|
|
|
— |
|
|
Balance, December 31, 2021 (Successor) |
|
|
— |
|
|
|
— |
|
|
|
|
|
|
|
|
|
( |
) |
|
|
( |
) |
|
|
|
|
|
|
|
|
|
|||||
Net loss |
|
|
— |
|
|
|
— |
|
|
|
— |
|
|
|
— |
|
|
|
— |
|
|
|
( |
) |
|
|
( |
) |
|
|
( |
) |
|
|
( |
) |
Other comprehensive loss |
|
|
— |
|
|
|
— |
|
|
|
— |
|
|
|
— |
|
|
|
( |
) |
|
|
— |
|
|
|
( |
) |
|
|
— |
|
|
|
( |
) |
Dividends declared - common stock |
|
|
— |
|
|
|
— |
|
|
|
— |
|
|
|
— |
|
|
|
— |
|
|
|
( |
) |
|
|
( |
) |
|
|
— |
|
|
|
( |
) |
Issuance of |
|
|
— |
|
|
|
— |
|
|
|
— |
|
|
|
— |
|
|
|
— |
|
|
|
— |
|
|
|
— |
|
|
|
— |
|
|
|
— |
|
Adjustment for noncontrolling interests |
|
|
— |
|
|
|
— |
|
|
|
— |
|
|
|
|
|
|
— |
|
|
|
— |
|
|
|
|
|
|
( |
) |
|
|
— |
|
||
Contributions from noncontrolling interests |
|
|
— |
|
|
|
— |
|
|
|
— |
|
|
|
— |
|
|
|
— |
|
|
|
— |
|
|
|
— |
|
|
|
|
|
|
|
||
Distributions to noncontrolling interests |
|
|
— |
|
|
|
— |
|
|
|
— |
|
|
|
— |
|
|
|
— |
|
|
|
— |
|
|
|
— |
|
|
|
( |
) |
|
|
( |
) |
Cancellation of |
|
|
— |
|
|
|
— |
|
|
|
— |
|
|
|
( |
) |
|
|
— |
|
|
|
— |
|
|
|
( |
) |
|
|
— |
|
|
|
( |
) |
Amortization of deferred compensation |
|
|
— |
|
|
|
— |
|
|
|
— |
|
|
|
|
|
|
— |
|
|
|
— |
|
|
|
|
|
|
— |
|
|
|
|
|||
Compensation expense related to performance stock units |
|
|
— |
|
|
|
— |
|
|
|
— |
|
|
|
|
|
|
— |
|
|
|
— |
|
|
|
|
|
|
— |
|
|
|
|
|||
Conversion of exchangeable notes into |
|
|
— |
|
|
|
— |
|
|
|
|
|
|
|
|
|
— |
|
|
|
— |
|
|
|
|
|
|
— |
|
|
|
|
||||
Balance, December 31, 2022 (Successor) |
|
$ |
— |
|
|
$ |
— |
|
|
$ |
|
|
$ |
|
|
$ |
( |
) |
|
$ |
( |
) |
|
$ |
|
|
$ |
( |
) |
|
$ |
|
||||
74
CBL & Associates Properties, Inc.
Consolidated Statements of Equity
(Continued)
(in thousands, except share data)
|
|
Equity |
|
|||||||||||||||||||||||||
|
|
Shareholders' Equity |
|
|
|
|
|
|
|
|||||||||||||||||||
|
|
Common |
|
|
Additional |
|
|
Accumulated |
|
|
Accumulated |
|
|
Total |
|
|
Noncontrolling |
|
|
Total |
|
|||||||
Balance, December 31, 2022 (Successor) |
|
$ |
|
|
$ |
|
|
$ |
( |
) |
|
$ |
( |
) |
|
$ |
|
|
$ |
( |
) |
|
$ |
|
||||
Net income (loss) |
|
|
— |
|
|
|
— |
|
|
|
— |
|
|
|
|
|
|
|
|
|
( |
) |
|
|
|
|||
Other comprehensive income |
|
|
— |
|
|
|
— |
|
|
|
|
|
|
— |
|
|
|
|
|
|
— |
|
|
|
|
|||
Dividends declared - common stock |
|
|
— |
|
|
|
— |
|
|
|
— |
|
|
|
( |
) |
|
|
( |
) |
|
|
— |
|
|
|
( |
) |
Issuance of |
|
|
— |
|
|
|
— |
|
|
|
— |
|
|
|
— |
|
|
|
— |
|
|
|
— |
|
|
|
— |
|
Issuance of |
|
|
— |
|
|
|
( |
) |
|
|
— |
|
|
|
— |
|
|
|
( |
) |
|
|
— |
|
|
|
( |
) |
Distributions to noncontrolling interests |
|
|
— |
|
|
|
— |
|
|
|
— |
|
|
|
— |
|
|
|
— |
|
|
|
( |
) |
|
|
( |
) |
Amortization of deferred compensation |
|
|
— |
|
|
|
|
|
|
— |
|
|
|
— |
|
|
|
|
|
|
— |
|
|
|
|
|||
Compensation expense related to performance stock units |
|
|
— |
|
|
|
|
|
|
— |
|
|
|
— |
|
|
|
|
|
|
— |
|
|
|
|
|||
Cancellation of |
|
|
— |
|
|
|
( |
) |
|
|
— |
|
|
|
— |
|
|
|
( |
) |
|
|
— |
|
|
|
( |
) |
Repurchases of |
|
|
— |
|
|
|
( |
) |
|
|
— |
|
|
|
— |
|
|
|
( |
) |
|
|
— |
|
|
|
( |
) |
Adjustment for noncontrolling interests |
|
|
— |
|
|
|
( |
) |
|
|
— |
|
|
|
— |
|
|
|
( |
) |
|
|
|
|
|
— |
|
|
Contributions from noncontrolling interests |
|
|
— |
|
|
|
— |
|
|
|
— |
|
|
|
— |
|
|
|
— |
|
|
|
|
|
|
|
||
Redemption of |
|
|
— |
|
|
|
— |
|
|
|
— |
|
|
|
— |
|
|
|
— |
|
|
|
( |
) |
|
|
( |
) |
Balance, December 31, 2023 (Successor) |
|
$ |
|
|
$ |
|
|
$ |
|
|
$ |
( |
) |
|
$ |
|
|
$ |
( |
) |
|
$ |
|
|||||
The accompanying notes are an integral part of these consolidated statements.
75
CBL & Associates Properties, Inc.
Consolidated Statements of Cash Flows
(In thousands)
|
|
Successor |
|
|
|
Predecessor |
|
||||||||||
|
|
Year Ended December 31, |
|
|
Period from November 1, through December 31, |
|
|
|
Period from January 1, through October 31, |
|
|||||||
|
|
2023 |
|
|
2022 |
|
|
2021 |
|
|
|
2021 |
|
||||
CASH FLOWS FROM OPERATING ACTIVITIES: |
|
|
|
|
|
|
|
|
|
|
|
|
|
||||
Net income (loss) |
|
$ |
|
|
$ |
( |
) |
|
$ |
( |
) |
|
|
$ |
( |
) |
|
Adjustments to reconcile net income (loss) to net cash provided by operating activities: |
|
|
|
|
|
|
|
|
|
|
|
|
|
||||
Depreciation and amortization |
|
|
|
|
|
|
|
|
|
|
|
|
|
||||
Net amortization of deferred financing costs, discounts on available-for-sale securities and debt discounts |
|
|
|
|
|
|
|
|
|
|
|
|
|
||||
Reorganization items (non-cash) |
|
|
— |
|
|
|
— |
|
|
|
— |
|
|
|
|
|
|
Net amortization of intangible lease assets and liabilities |
|
|
|
|
|
|
|
|
|
|
|
|
|
||||
(Gain) loss on sales of real estate assets |
|
|
( |
) |
|
|
( |
) |
|
|
|
|
|
|
( |
) |
|
Loss (gain) on insurance proceeds |
|
|
|
|
|
( |
) |
|
|
( |
) |
|
|
|
— |
|
|
Gain on deconsolidation |
|
|
( |
) |
|
|
( |
) |
|
|
( |
) |
|
|
|
( |
) |
Loss on available-for-sale securities |
|
|
— |
|
|
|
|
|
|
— |
|
|
|
|
— |
|
|
Write-off of development projects |
|
|
|
|
|
|
|
|
|
|
|
|
|
||||
Share-based compensation expense |
|
|
|
|
|
|
|
|
|
|
|
|
|
||||
Loss on impairment |
|
|
— |
|
|
|
|
|
|
— |
|
|
|
|
|
||
Gain on extinguishment of debt |
|
|
( |
) |
|
|
( |
) |
|
|
— |
|
|
|
|
— |
|
Equity in (earnings) losses of unconsolidated affiliates |
|
|
( |
) |
|
|
( |
) |
|
|
( |
) |
|
|
|
|
|
Distributions of earnings from unconsolidated affiliates |
|
|
|
|
|
|
|
|
|
|
|
|
|
||||
Change in estimate of uncollectable revenues |
|
|
|
|
|
( |
) |
|
|
|
|
|
|
|
|||
Change in deferred tax accounts |
|
|
( |
) |
|
|
|
|
|
( |
) |
|
|
|
— |
|
|
Changes in: |
|
|
|
|
|
|
|
|
|
|
|
|
|
||||
Tenant and other receivables |
|
|
( |
) |
|
|
( |
) |
|
|
( |
) |
|
|
|
|
|
Other assets |
|
|
|
|
|
( |
) |
|
|
|
|
|
|
|
|||
Accounts payable and accrued liabilities |
|
|
( |
) |
|
|
( |
) |
|
|
|
|
|
|
|
||
Net cash provided by operating activities |
|
|
|
|
|
|
|
|
|
|
|
|
|
||||
CASH FLOWS FROM INVESTING ACTIVITIES: |
|
|
|
|
|
|
|
|
|
|
|
|
|
||||
Additions to real estate assets |
|
|
( |
) |
|
|
( |
) |
|
|
( |
) |
|
|
|
( |
) |
Acquisitions of real estate assets |
|
|
— |
|
|
|
( |
) |
|
|
— |
|
|
|
|
— |
|
Proceeds from sales of real estate assets |
|
|
|
|
|
|
|
|
— |
|
|
|
|
|
|||
Purchases of available-for-sale securities |
|
|
( |
) |
|
|
( |
) |
|
|
( |
) |
|
|
|
( |
) |
Redemptions of available-for-sale securities |
|
|
|
|
|
|
|
|
|
|
|
|
|
||||
Proceeds from disposal of investments |
|
|
— |
|
|
|
— |
|
|
|
|
|
|
|
— |
|
|
Proceeds from insurance |
|
|
|
|
|
|
|
|
— |
|
|
|
|
|
|||
Additional investments in and advances to unconsolidated affiliates |
|
|
( |
) |
|
|
( |
) |
|
|
( |
) |
|
|
|
|
|
Distributions in excess of equity in earnings of unconsolidated affiliates |
|
|
|
|
|
|
|
|
|
|
|
|
|
||||
Changes in other assets |
|
|
( |
) |
|
|
( |
) |
|
|
( |
) |
|
|
|
( |
) |
Net cash provided by (used in) investing activities |
|
|
|
|
|
( |
) |
|
|
( |
) |
|
|
|
|
||
CASH FLOWS FROM FINANCING ACTIVITIES: |
|
|
|
|
|
|
|
|
|
|
|
|
|
||||
Proceeds from mortgage and other indebtedness |
|
|
— |
|
|
|
|
|
|
— |
|
|
|
|
|
||
Principal payments on mortgage and other indebtedness |
|
|
( |
) |
|
|
( |
) |
|
|
( |
) |
|
|
|
( |
) |
Additions to deferred financing costs |
|
|
( |
) |
|
|
( |
) |
|
|
( |
) |
|
|
|
( |
) |
Repurchases of common stock |
|
|
( |
) |
|
|
— |
|
|
|
— |
|
|
|
|
— |
|
Contributions from noncontrolling interests |
|
|
|
|
|
|
|
|
— |
|
|
|
|
|
|||
Payment of tax withholdings for restricted stock awards and performance stock units |
|
|
( |
) |
|
|
( |
) |
|
|
— |
|
|
|
|
( |
) |
Distributions to and redemptions of noncontrolling interests |
|
|
( |
) |
|
|
( |
) |
|
|
— |
|
|
|
|
( |
) |
Dividends paid to common shareholders |
|
|
( |
) |
|
|
( |
) |
|
|
— |
|
|
|
|
— |
|
Net cash used in financing activities |
|
|
( |
) |
|
|
( |
) |
|
|
( |
) |
|
|
|
( |
) |
NET CHANGE IN CASH, CASH EQUIVALENTS AND RESTRICTED CASH |
|
|
( |
) |
|
|
( |
) |
|
|
( |
) |
|
|
|
|
|
CASH, CASH EQUIVALENTS AND RESTRICTED CASH, beginning of period |
|
|
|
|
|
|
|
|
|
|
|
|
|
||||
CASH, CASH EQUIVALENTS AND RESTRICTED CASH, end of period |
|
$ |
|
|
$ |
|
|
$ |
|
|
|
$ |
|
||||
Reconciliation from consolidated statements of cash flows to consolidated balance sheets: |
|
|
|
|
|
|
|
|
|
|
|
|
|
||||
Cash and cash equivalents |
|
$ |
|
|
$ |
|
|
$ |
|
|
|
$ |
|
||||
Restricted cash: |
|
|
|
|
|
|
|
|
|
|
|
|
|
||||
Restricted cash |
|
|
|
|
|
|
|
|
|
|
|
|
|
||||
Mortgage escrows |
|
|
|
|
|
|
|
|
|
|
|
|
|
||||
CASH, CASH EQUIVALENTS AND RESTRICTED CASH, end of period |
|
$ |
|
|
$ |
|
|
$ |
|
|
|
$ |
|
||||
|
|
|
|
|
|
|
|
|
|
|
|
|
|
||||
SUPPLEMENTAL INFORMATION |
|
|
|
|
|
|
|
|
|
|
|
|
|
||||
Cash paid for interest, net of amounts capitalized |
|
$ |
|
|
$ |
|
|
$ |
|
|
|
$ |
|
||||
Cash paid for reorganization items |
|
$ |
— |
|
|
$ |
|
|
$ |
|
|
|
$ |
|
|||
The accompanying notes are an integral part of these consolidated statements.
76
NOTES TO CONSOLIDATED FINANCIAL STATEMENTS
(In thousands, except share and unit data)
NOTE 1. ORGANIZATION
CBL & Associates Properties, Inc. ("CBL"), a Delaware corporation, is a self-managed, self-administered, fully-integrated real estate investment trust ("REIT") that is engaged in the ownership, development, acquisition, leasing, management and operation of regional shopping malls, lifestyle centers, open-air centers, outlet centers, office buildings and other properties, including single-tenant and multi-tenant outparcels. Its properties are located in
CBL conducts substantially all its business through CBL & Associates Limited Partnership (the "Operating Partnership"), which is a variable interest entity ("VIE"). The Operating Partnership consolidates the financial statements of all entities in which it has a controlling financial interest or where it is the primary beneficiary of a VIE.
|
|
Malls (1) |
|
|
Outlet Centers (1) |
|
|
Lifestyle Centers (1)(2) |
|
|
Open-Air Centers (3) |
|
|
Other (3)(4) |
|
|
Total |
|
||||||
Consolidated Properties |
|
|
|
|
|
|
|
|
|
|
|
|
|
|
|
|
|
|
||||||
Unconsolidated Properties (5) |
|
|
|
|
|
|
|
|
|
|
|
|
|
|
|
|
|
|
||||||
Total |
|
|
|
|
|
|
|
|
|
|
|
|
|
|
|
|
|
|
||||||
The malls, outlet centers, lifestyle centers, open-air centers and other properties are collectively referred to as the “properties” and individually as a “property.”
CBL is the
As used herein, the term "Company" includes CBL & Associates Properties, Inc. and its subsidiaries, including CBL & Associates Limited Partnership and its subsidiaries, unless the context indicates otherwise. The term "Operating Partnership" refers to CBL & Associates Limited Partnership and its subsidiaries.
The Operating Partnership conducts the Company's property management and development activities through its wholly owned subsidiary, CBL & Associates Management, Inc. (the “Management Company"), to comply with certain requirements of the Internal Revenue Code.
Fresh Start Accounting and Reorganizations
As discussed in Note 19,
77
During the Predecessor period, the Company applied Accounting Standards Codification (“ASC”) 852 - Reorganizations (“ASC 852”) in preparing the consolidated financial statements. ASC 852 requires the financial statements, for periods subsequent to the commencement of the Chapter 11 Cases, to distinguish transactions and events that are directly associated with the reorganization from the ongoing operations of the business. In addition, the Company classified all expenses, gains and losses that were incurred as a result of the Chapter 11 proceedings since filing as “Reorganization items, net” in the consolidated statements of operations.
Reclassifications
For the Successor year ended December 31, 2022 and the Successor period from November 1, 2021 through December 31, 2021, the Successor Company reclassified payments received on notes receivable of $
The Successor Company reclassified restricted cash of $
NOTE 2. SUMMARY OF SIGNIFICANT ACCOUNTING POLICIES
Basis of Presentation
The accompanying consolidated financial statements include the consolidated accounts of the Successor Company and the Predecessor Company, as well as entities in which the Successor Company or the Predecessor Company has a controlling financial interest or entities where the Successor Company or the Predecessor Company is deemed to be the primary beneficiary of a VIE. For entities in which the Successor Company or the Predecessor Company has less than a controlling financial interest or entities where the Company is not deemed to be the primary beneficiary of a VIE, the entities are accounted for using the equity method of accounting. Accordingly, the Successor Company's or the Predecessor Company’s share of the net earnings or losses of these entities is included in consolidated net income (loss). The accompanying consolidated financial statements have been prepared in accordance with GAAP. All intercompany transactions have been eliminated.
Accounting Guidance Adopted
In March 2020, the Financial Accounting Standards Board ("FASB") issued Accounting Standards Update ("ASU") 2020-04, Reference Rate Reform, which provides temporary optional expedients and exceptions to the US GAAP guidance on contract modifications and hedge accounting to ease the financial reporting burdens of the market transition from LIBOR and other interbank offered rates to alternative reference rates. Additional optional expedients, exceptions and clarifications were created in ASU 2021-01. The guidance was effective upon issuance and generally can be applied to any contract modifications or existing and new hedging relationships through December 31, 2024. The Successor Company elected the expedients in conjunction with transitioning certain debt instruments to alternative benchmark indexes. During the year ended December 31, 2023, there was no impact on the Successor Company's consolidated financial statements at adoption through the use of the expedient.
Accounting Guidance Not Yet Adopted
On November 27, 2023, the FASB issued ASU 2023-07, Segment Reporting, which amends the existing standard's disclosure requirements. Among other things, ASU 2023-07 will require companies to disclose significant segment expenses by reportable segment if they are regularly provided to the Chief Operating Decision Maker ("CODM") and disclosures of the CODM's title and position, as well as details of how the CODM uses the reported measures. The amendments in ASU 2023-07 are effective for fiscal years beginning after December 15, 2023 and for interim periods beginning after December 15, 2024. The adoption of ASU 2023-07 is not expected to have a material impact on the Successor Company's financial statements.
78
Real Estate Assets
The Company capitalizes predevelopment project costs paid to third parties. All previously capitalized predevelopment costs are expensed when it is no longer probable that the project will be completed. Once development of a project commences, all direct costs incurred to construct the project, including interest and real estate taxes, are capitalized. Additionally, certain general and administrative expenses are allocated to the projects and capitalized based on the amount of time applicable personnel work on the development project. Ordinary repairs and maintenance are expensed as incurred. Major replacements and improvements are capitalized and depreciated over their estimated useful lives.
All real estate assets acquired prior to and after the Effective Date have been accounted for using the acquisition method of accounting and accordingly, the results of operations are included in the consolidated statements of operations from the respective dates of acquisition. The Company allocates the purchase price to (i) tangible assets, consisting of land, buildings and improvements, as if vacant, and tenant improvements, and (ii) identifiable intangible assets and liabilities, generally consisting of above-market leases, in-place leases and tenant relationships, which are included in intangible lease assets and other assets, and below-market leases, which are included in accounts payable and accrued liabilities. The Company uses estimates of fair value based on estimated cash flows, using appropriate discount rates, and other valuation techniques to allocate the purchase price to the acquired tangible and intangible assets. Liabilities assumed generally consist of mortgage debt on the real estate assets acquired. Assumed debt is recorded at its fair value based on estimated market interest rates at the date of acquisition. The Successor Company expects its future acquisitions will be accounted for as acquisitions of assets in which related transaction costs will be capitalized.
Depreciation is computed on a straight-line basis over estimated lives of
The Successor Company’s intangibles and their balance sheet classifications as of December 31, 2023 and 2022, respectively, are summarized as follows:
|
|
Successor |
|
|||||||||||||
|
|
December 31, 2023 |
|
|
December 31, 2022 |
|
||||||||||
|
|
Cost |
|
|
Accumulated |
|
|
Cost |
|
|
Accumulated |
|
||||
Above-market leases |
|
$ |
|
|
$ |
( |
) |
|
$ |
|
|
$ |
( |
) |
||
In-place leases |
|
|
|
|
|
( |
) |
|
|
|
|
|
( |
) |
||
Intangible lease assets and other assets: |
|
|
|
|
|
|
|
|
|
|
|
|
||||
Tenant relationships |
|
|
|
|
|
( |
) |
|
|
|
|
|
( |
) |
||
Below-market leases |
|
|
|
|
|
( |
) |
|
|
|
|
|
( |
) |
||
These intangibles are related to specific tenant leases. Should a termination occur earlier than the date indicated in the lease, the related unamortized intangible assets or liabilities, if any, related to the lease are recorded as expense or income, as applicable. The total net amortization expense of the above intangibles for the Successor Company for the years ended December 31, 2023 and 2022, was $
The Successor Company capitalized interest expense of $
79
Accounts Receivable
Receivables include amounts billed and currently due from tenants pursuant to lease agreements and receivables attributable to straight-line rents associated with those lease agreements. Individual leases where the collection of rents is in dispute are assessed for collectability based on management’s best estimate of collection considering the anticipated outcome of the dispute. Individual leases that are not in dispute are assessed for collectability and upon the determination that the collection of rents over the remaining lease term is not probable, accounts receivable is reduced as an adjustment to rental revenues. Revenue from leases where collection is deemed to be less than probable is recorded on a cash basis until collectability is determined to be probable. Further, management assesses whether operating lease receivables, at a portfolio level, are appropriately valued based upon an analysis of balances outstanding, historical collection levels and current economic trends. An allowance for the uncollectable portion of the portfolio is recorded as an adjustment to rental revenues.
Management’s collection assessment took into consideration the type of retailer, billing disputes, lease negotiation status and executed deferral or abatement agreements, as well as recent rent collection experience and tenant bankruptcies based on the best information available to management at the time of evaluation.
For the Successor year ended December 31, 2023, the Successor Company recorded $
Carrying Value of Long-Lived Assets
The Company monitors events or changes in circumstances that could indicate the carrying value of a long-lived asset may not be recoverable. The Company uses significant judgement in assessing events or circumstances which might indicate impairment, including but not limited to, changes in management’s intent to hold a long-lived asset over its previously estimated useful life. Changes in management’s intent to hold a long-lived asset have a significant impact on the estimated undiscounted cash flows expected to result from the use and eventual disposition of a long-lived asset and whether a potential impairment loss shall be measured. When indicators of potential impairment are present that suggest that the carrying amounts of a long-lived asset may not be recoverable, the Company assesses the recoverability of the asset by determining whether the asset’s carrying value will be recovered through the estimated undiscounted future cash flows expected from the Company’s use and its eventual disposition. In the event that such undiscounted future cash flows do not exceed the carrying value, the Company adjusts the carrying value of the long-lived asset to its estimated fair value and recognizes an impairment loss. The estimated fair value is calculated based on the following information, in order of preference, depending upon availability: (Level 1) recently quoted market prices, (Level 2) market prices for comparable properties, or (Level 3) the present value of future cash flows, including estimated salvage value. Certain of the Company’s long-lived assets may be carried at more than an amount that could be realized in a current disposition transaction. The Company estimates future operating cash flows, the terminal capitalization rate and the discount rate, among other factors. As these assumptions are subject to economic and market uncertainties, they are difficult to predict and are subject to future events that may alter the assumptions used or management’s estimates of future possible outcomes. Therefore, the future cash flows estimated in the Company’s impairment analyses may not be achieved. See Note 15 for information related to the impairment of long-lived assets in 2023, 2022 and 2021.
Cash and Cash Equivalents
The Company considers all highly liquid investments with original maturities of three months or less as cash equivalents.
Restricted Cash
As of December 31, 2023 and 2022, restricted cash was related to cash held in escrow accounts for insurance, real estate taxes, capital expenditures and tenant allowances as required by the terms of certain mortgage notes payable, as well as amounts related to cash management agreements with the Company’s lenders that are designated for debt service and operating expense obligations. As of December 31, 2023 and 2022, restricted cash was also related to properties that secure the corporate term loan and the open-air centers and outparcels loan of which we may receive a portion via distributions semiannually and quarterly in accordance with the provisions of the term loan and the open-air centers and outparcels loan, respectively.
80
Investments in Unconsolidated Affiliates
The Company evaluates its joint venture arrangements to determine whether they should be recorded on a consolidated basis. The percentage of ownership interest in the joint venture, an evaluation of control and whether a VIE exists are all considered in the Company’s consolidation assessment.
Initial investments in joint ventures that are in economic substance a capital contribution to the joint venture are recorded in an amount equal to the cash contributed by the Company and the fair value of any real estate contributed. Initial investments in joint ventures that are in economic substance the sale of a portion of the Company’s interest in the real estate are accounted for as a contribution of real estate recorded in an amount equal to the fair value of the ownership interest retained and as a sale of real estate with profit recognized to the extent of the other joint venture partners’ interests in the joint venture. Profit recognition assumes the Company has no commitment to reinvest with respect to the percentage of the real estate sold and the accounting requirements of the full accrual method are met.
The Company accounts for its investment in joint ventures where it owns a noncontrolling interest or where it is not the primary beneficiary of a VIE using the equity method of accounting. Under the equity method, the Company’s cost of investment is adjusted for additional contributions to and distributions from the unconsolidated affiliate, as well as its share of equity in the earnings of the unconsolidated affiliate. Generally, distributions of cash flows from operations and capital events are first made to partners to pay cumulative unpaid preferences on unreturned capital balances and then to the partners in accordance with the terms of the joint venture agreements.
On a periodic basis, the Company assesses whether there are any indicators that the fair value of the Company's investments in unconsolidated affiliates may be impaired. An investment is impaired only if the Company’s estimate of the fair value of the investment is less than the carrying value of the investment and such decline in value is deemed to be other than temporary. To the extent impairment has occurred, the loss is measured as the excess of the carrying amount of the investment over the estimated fair value of the investment. The Company's estimates of fair value for each investment are based on a number of assumptions that are subject to economic and market uncertainties including, but not limited to, demand for space, competition for tenants, changes in market rental rates, and operating costs. As these factors are difficult to predict and are subject to future events that may alter the Company’s assumptions, the fair values estimated in the impairment analyses may not be realized.
Deferred Financing Costs
Unamortized financing costs of $
Gain on Sales of Real Estate Assets
Gains on the sale of real estate assets, like all non-lease related revenue, are subject to a five-step model requiring that the Company identify the contract with the customer, identify the performance obligations in the contract, determine the transaction price, allocate the transaction price to the performance obligations in the contract, and recognize revenue upon satisfaction of the performance obligations. In circumstances where the Company contracts to sell a property with material post-sale involvement, such involvement must be accounted for as a separate performance obligation in the contract and a portion of the sales price allocated to each performance obligation. When the post-sale involvement performance obligation is satisfied, the portion of the sales price allocated to it will be recognized as gain on sale of real estate assets. Property dispositions with no continuing involvement will continue to be recognized upon closing of the sale.
81
Income Taxes
The Company is qualified as a REIT under the provisions of the Internal Revenue Code. To maintain qualification as a REIT, the Company is required to distribute at least 90% of its taxable income to shareholders and meet certain other requirements.
As a REIT, the Company is generally not liable for federal corporate income taxes. If the Company fails to qualify as a REIT in any taxable year, the Company will be subject to federal and state income taxes on its taxable income at regular corporate tax rates. Even if the Company maintains its qualification as a REIT, the Company may be subject to certain state and local taxes on its income and property, and to federal income and excise taxes on its undistributed income. For the years ended December 31, 2023 and 2022 and for the period November 1, 2021 through December 31, 2021, the Successor Company had state tax expense of $
The Company has also elected taxable REIT subsidiary status for some of its subsidiaries. This enables the Company to receive income and provide services that would otherwise be impermissible for REITs. For these entities, deferred tax assets and liabilities are established for temporary differences between the financial reporting basis and the tax basis of assets and liabilities at the enacted tax rates expected to be in effect when the temporary differences reverse. A valuation allowance for deferred tax assets is provided if the Company believes all or some portion of the deferred tax asset may not be realized. An increase or decrease in the valuation allowance that results from the change in circumstances that causes a change in the Company’s judgment about the realizability of the related deferred tax asset is included in income or expense, as applicable.
The Successor and Predecessor Company recorded an income tax (provision) benefit as follows:
|
|
Successor |
|
|
|
Predecessor |
|
||||||||||
|
|
Year Ended December 31, |
|
|
Period from November 1, through December 31, |
|
|
|
Period from January 1, through October 31, |
|
|||||||
|
|
2023 |
|
|
2022 |
|
|
2021 |
|
|
|
2021 |
|
||||
Current tax provision |
|
$ |
( |
) |
|
$ |
( |
) |
|
$ |
( |
) |
|
|
$ |
( |
) |
Deferred tax benefit (provision) |
|
|
|
|
|
( |
) |
|
|
|
|
|
|
— |
|
||
Income tax (provision) benefit |
|
$ |
( |
) |
|
$ |
( |
) |
|
$ |
|
|
|
$ |
( |
) |
|
The Successor Company had a net deferred tax asset of $
The Company reports any income tax penalties attributable to its properties as property operating expenses and any corporate-related income tax penalties as general and administrative expenses in its consolidated statements of operations. In addition, any interest incurred on tax assessments is reported as interest expense. The Successor Company incurred nominal interest and penalty amounts during the years ended December 31, 2023 and 2022 and for the period from November 1, 2021 through December 31, 2021. The Predecessor Company incurred nominal interest and penalty amounts during the period from January 1, 2021 through October 31, 2021.
Concentration of Credit Risk
The Company’s tenants include national, regional and local retailers. Financial instruments that subject the Company to concentrations of credit risk consist primarily of tenant receivables. The Company generally does not obtain collateral or other security to support financial instruments subject to credit risk, but it monitors the credit standing of tenants. The Company derives a substantial portion of its rental income from various national and regional retail companies; however, no single tenant collectively accounted for more than
Earnings per Share
Earnings per share ("EPS") is calculated under the two-class method. Under the two-class method, all earnings (distributed and undistributed) are allocated to common stock and participating securities. The Company grants restricted stock awards to certain employees under its share-based compensation program, which entitle recipients to receive nonforfeitable dividends during the vesting period on a basis equivalent to the dividends paid to holders of common stock. These unvested restricted stock awards meet the definition of participating securities based on their respective rights to receive nonforfeitable dividends.
82
Diluted EPS incorporates the potential impact of contingently issuable shares. Diluted EPS is calculated under both the two-class and treasury stock methods, and the more dilutive amount is reported. Performance stock units ("PSUs") and unvested restricted stock awards are contingently issuable common shares and are included in diluted EPS if the effect is dilutive. See Note 16 for a description of the long-term incentive program that these units relate to.
The following table presents the calculation of basic and diluted EPS (in thousands, except per share amounts):
|
|
Successor |
|
|
|
Predecessor |
|
||||||||||
|
|
Year Ended December 31, |
|
|
Period from November 1, through December 31, |
|
|
|
Period from January 1, through October 31, |
|
|||||||
|
|
2023 |
|
|
2022 |
|
|
2021 |
|
|
|
2021 |
|
||||
Basic earnings per share |
|
|
|
|
|
|
|
|
|
|
|
|
|
||||
Net income (loss) attributable to the Company |
|
$ |
|
|
$ |
( |
) |
|
$ |
( |
) |
|
|
$ |
( |
) |
|
Less: Dividends allocable to unvested restricted stock |
|
|
( |
) |
|
|
( |
) |
|
|
— |
|
|
|
|
— |
|
Net income (loss) attributable to common shareholders |
|
$ |
|
|
$ |
( |
) |
|
$ |
( |
) |
|
|
$ |
( |
) |
|
Weighted-average basic shares outstanding |
|
|
|
|
|
|
|
|
|
|
|
|
|
||||
Net income (loss) per share attributable to common shareholders |
|
$ |
|
|
$ |
( |
) |
|
$ |
( |
) |
|
|
$ |
( |
) |
|
|
|
|
|
|
|
|
|
|
|
|
|
|
|
||||
Diluted earnings per share (1) |
|
|
|
|
|
|
|
|
|
|
|
|
|
||||
Net income (loss) attributable to common shareholders |
|
$ |
|
|
$ |
( |
) |
|
$ |
( |
) |
|
|
$ |
( |
) |
|
Weighted-average basic shares outstanding |
|
|
|
|
|
|
|
|
|
|
|
|
|
||||
Net income (loss) per share attributable to common shareholders |
|
$ |
|
|
$ |
( |
) |
|
$ |
( |
) |
|
|
$ |
( |
) |
|
Use of Estimates
The preparation of financial statements in conformity with GAAP requires management to make estimates and assumptions that affect the reported amounts of assets and liabilities and disclosure of contingent assets and liabilities at the date of the financial statements, and the reported amounts of revenues and expenses during the reported period. Actual results could differ from those estimates.
83
NOTE 3. REVENUES
Revenues
The following table presents the Company's revenues disaggregated by revenue source:
|
|
Successor |
|
|
|
Predecessor |
|
||||||||||
|
|
Year Ended December 31, |
|
|
Period from November 1, through December 31, |
|
|
|
Period from January 1, through October 31, |
|
|||||||
|
|
2023 |
|
|
2022 |
|
|
2021 |
|
|
|
2021 |
|
||||
Rental revenues |
|
$ |
|
|
$ |
|
|
$ |
|
|
|
$ |
|
||||
Revenues from contracts with customers (ASC 606): |
|
|
|
|
|
|
|
|
|
|
|
|
|
||||
Operating expense reimbursements |
|
|
|
|
|
|
|
|
|
|
|
|
|
||||
Management, development and leasing fees (1) |
|
|
|
|
|
|
|
|
|
|
|
|
|
||||
Marketing revenues (2) |
|
|
|
|
|
|
|
|
|
|
|
|
|
||||
|
|
|
|
|
|
|
|
|
|
|
|
|
|
||||
|
|
|
|
|
|
|
|
|
|
|
|
|
|
||||
Other revenues |
|
|
|
|
|
|
|
|
|
|
|
|
|
||||
Total revenues (3) |
|
$ |
|
|
$ |
|
|
$ |
|
|
|
$ |
|
||||
See Note 11 for information on the Company's segments.
Revenue from Contracts with Customers
Operating expense reimbursements
Under operating and other agreements with third parties, which own anchor or outparcel buildings at the Company's properties and pay no rent, the Company receives reimbursements for certain operating expenses such as ring road and parking area maintenance, landscaping and other fees. These arrangements are primarily either set at a fixed rate with rate increases typically every five years or are on a variable (pro rata) basis, typically as a percentage of costs allocated based on square footage or sales. The majority of these contracts have an initial term and one or more extension options, which cumulatively approximate 50 or more years as historically the initial term and any extension options are typically reasonably certain of being executed by the third party. The standalone selling price of each performance obligation is determined based on the terms of the contract, which typically assigns a price to each performance obligation that directly relates to the value the customer receives for the services being provided. Revenue is recognized as services are transferred to the customer. Variable consideration is based on historical experience and is generally recognized over time using the cost-to-cost method of measurement because it most accurately depicts the Company's performance in satisfying the performance obligation. The cumulative catch-up method is used to recognize any adjustments in variable consideration estimates. Under this method, any adjustment is recognized in the period it is identified.
Management, development and leasing fees
The Company earns revenue from contracts with third parties and unconsolidated affiliates for property management, leasing, development and other services. These contracts are accounted for on a month-to-month basis if the agreement does not contain substantive penalties for termination. The majority of the Company's contracts with customers are accounted for on a month-to-month basis. The standalone selling price of each performance obligation is determined based on the terms of the contract, which typically assigns a price to each performance obligation that directly relates to the value the customer receives for the services being provided. These contracts generally are for the following:
84
Development and leasing fees received from an unconsolidated affiliate are recognized as revenue only to the extent of the third-party partner’s ownership interest. The Company's share of such fees are recorded as a reduction to the Company’s investment in the unconsolidated affiliate.
Marketing revenues
The Company earns marketing revenues from advertising and sponsorship agreements. These fees may be for tangible items in which the Company provides advertising services and creates signs and other promotional materials for the tenant or may be arrangements in which the customer sponsors a play area or event and receives specified brand recognition and other benefits over a set period of time. Revenue related to advertising services is recognized as goods and services are provided to the customer. Sponsorship revenue is recognized on a straight-line basis over the time period specified in the contract.
Performance obligations
A performance obligation is a promise in a contract to transfer a distinct good or service to a customer. If the contract does not specify the revenue by performance obligation, the Company allocates the transaction price to each performance obligation based on its relative standalone selling price. Such prices are generally determined using prices charged to customers or using the Company’s expected cost plus margin. Revenue is recognized as the Company’s performance obligations are satisfied over time, as services are provided, or at a point in time, such as leasing a space to earn a commission. Open performance obligations are those in which the Company has not fully or has partially provided the applicable good or services to the customer as specified in the contract. If consideration is received in advance of the Company’s performance, including amounts which are refundable, recognition of revenue is deferred until the performance obligation is satisfied or amounts are no longer refundable.
Outstanding Performance Obligations
The Company has outstanding performance obligations related to certain noncancellable contracts with customers for which it will receive fixed operating expense reimbursements for providing certain maintenance and other services as described above.
Performance obligation |
|
Less than |
|
|
|
|
|
Over |
|
|
Total |
|
||||
Fixed operating expense reimbursements |
|
$ |
|
|
$ |
|
|
$ |
|
|
$ |
|
||||
The Company evaluates its performance obligations each period and makes adjustments to reflect any known additions or cancellations. Performance obligations related to variable consideration, which is based on sales, are constrained.
NOTE 4. LEASES
Lessor
Rental Revenues
The majority of the Company’s revenues are earned through the lease of space at its properties. All the Company's leases with tenants for the use of space at its properties are classified as operating leases. Rental revenues include minimum rent, percentage rent, other rents and reimbursements from tenants for real estate taxes, insurance, common area maintenance ("CAM") and other operating expenses as provided in the lease agreements. The option to extend or terminate the Company’s leases is specific to each underlying tenant lease agreement. Typically, the Company's leases contain penalties for early termination. The Company does not have any leases that convey the right for the lessee to purchase the leased asset.
85
Minimum rental revenue from operating leases is recognized on a straight-line basis over the initial terms of the related leases. Certain tenants are required to pay percentage rent if their sales volumes exceed thresholds specified in their lease agreements. Percentage rent is recognized as revenue when the thresholds are achieved and the amounts become determinable.
The Company receives reimbursements from tenants for real estate taxes, insurance, CAM and other recoverable operating expenses as provided in the lease agreements. Any tenant reimbursements that require fixed payments are recognized on a straight-line basis over the initial terms of the related leases, whereas any variable payments are recognized when earned in accordance with the tenant lease agreements. Tenant reimbursements related to certain capital expenditures are billed to tenants over periods of
The components of rental revenues are as follows:
|
|
|
|
|
|
||||||||||||
|
|
Year Ended December 31, |
|
|
Period from November 1, through December 31, |
|
|
|
Period from January 1, through October 31, |
|
|||||||
|
|
2023 |
|
|
2022 |
|
|
2021 |
|
|
|
2021 |
|
||||
Fixed lease payments |
|
$ |
|
|
$ |
|
|
$ |
|
|
|
$ |
|
||||
Variable lease payments |
|
|
|
|
|
|
|
|
|
|
|
|
|
||||
Total rental revenues |
|
$ |
|
|
$ |
|
|
$ |
|
|
|
$ |
|
||||
The undiscounted future fixed lease payments to be received under the Company's operating leases as of December 31, 2023, are as follows:
Years Ending December 31, |
|
Operating Leases |
|
|
2024 |
|
$ |
|
|
2025 |
|
|
|
|
2026 |
|
|
|
|
2027 |
|
|
|
|
2028 |
|
|
|
|
Thereafter |
|
|
|
|
Total undiscounted lease payments |
|
$ |
|
|
NOTE 5. ACQUISITIONS
The Company's acquisitions of shopping center and other properties are accounted for as acquisitions of assets. The Company includes the results of operations of real estate assets acquired in the consolidated statements of operations from the date of the related acquisition.
2023 Acquisitions
There were
2022 Acquisitions
In July 2022, the Successor Company acquired the JC Penney parcel located at CoolSprings Galleria for $
2021 Acquisitions
There were
NOTE 6. DISPOSITIONS AND HELD FOR SALE
Based on its analysis, the Company determined that the dispositions described below do not meet the criteria for classification as discontinued operations and are not considered to be significant disposals based on its quantitative and qualitative evaluation. Thus, the results of operations of the properties described below, as well as any related gain or loss, are included in net income (loss) for all periods presented, as applicable.
86
2023 Dispositions
For the year ended December 31, 2023, the Successor Company realized a gain of $
2022 Dispositions
For the year ended December 31, 2022, the Successor Company realized a gain of $
2021 Dispositions
The Predecessor Company realized a gain of $
Held-for-Sale
As of December 31, 2023 and 2022, there were
NOTE 7. UNCONSOLIDATED AFFILIATES
Although the Company had majority ownership of certain joint ventures during 2023, 2022 and 2021, it evaluated the investments and concluded that the other partners or owners in these joint ventures had substantive participating rights or the ability to direct the activities that most significantly affect the economic performance of VIEs, such as approvals of:
As a result of these considerations, the Company accounts for these investments using the equity method of accounting.
At December 31, 2023, the Company had investments in
2023 Activity - Unconsolidated Affiliates
Alamance Crossing CMBS, LLC
In February 2023, the Successor Company deconsolidated Alamance Crossing East as a result of the Company losing control when the property was placed in receivership. As of December 31, 2023, the loan secured by Alamance Crossing East had an outstanding balance of $
Atlanta Outlet Shoppes CMBS, LLC
In October 2023, the joint venture entered into a new $
87
CBL-TRS Med OFC Holding, LLC
In June 2023, the Successor Company and its joint venture partner in Friendly Center and The Shops at Friendly entered into a new 50/50 joint venture, CBL-TRS Med OFC Holding, LLC, for the purpose of entering into a joint venture, CBL DMC I, LLC, with a third party to develop a medical office building on a parcel of land adjacent to those centers. CBL-TRS Med OFC Holding, LLC contributed the parcel of land valued at $
CBL-TRS Joint Venture, LLC
In April 2023, the Successor Company and its joint venture partner entered into a new $
Louisville Outlet Shoppes, LLC
In April 2023, the $
West County Mall CMBS, LLC
In March 2023, the loan secured by West County Mall was extended through December 2024, with one two-year conditional extension available upon meeting certain requirements.
Westgate Mall CMBS, LLC
In September 2023, the Successor Company deconsolidated WestGate Mall as a result of the Company losing control when the property was placed in receivership. As of December 31, 2023, the loan secured by WestGate Mall had an outstanding balance of $
2022 Activity - Unconsolidated Affiliates
Ambassador Town Center J.V., LLC
In June 2022, the joint venture entered into a new $
Asheville Mall CBMS, LLC
In August 2022, the Successor Company transferred title to the mall to the mortgage holder in satisfaction of the non-recourse debt secured by the property, which had a balance of $
Atlanta Outlet JV, LLC
In February 2022, the joint venture entered into a forbearance agreement with the lender regarding the default triggered by the filing of the Chapter 11 Cases related to the loan secured by The Outlet Shoppes at Atlanta.
BI Development, LLC and BI Development II, LLC
In August 2022, the Successor Company and another joint venture member bought out a third member's interest increasing the Successor Company's interest from
Bullseye, LLC
In March 2022, the joint venture sold its income-producing property, which generated gross proceeds of $
EastGate Mall CMBS, LLC
In September 2022, the Successor Company transferred title to the mall to the mortgage holder in satisfaction of the non-recourse debt secured by the property, which had a balance of $
Fremaux Town Center JV, LLC
In March 2022, the joint venture entered into a forbearance agreement with the lender regarding the default triggered by the Chapter 11 Cases related to the loan secured by Fremaux Town Center.
88
Greenbrier Mall II, LLC
In March 2022, the Successor Company deconsolidated Greenbrier Mall as a result of the Successor Company losing control when the property was placed in receivership. For the year ended December 31, 2022, the Successor Company recognized a gain on deconsolidation of $
Louisville Outlet Shoppes, LLC
In May 2022, the joint venture entered into a forbearance agreement with the lender regarding the default triggered by the Chapter 11 Cases related to the loan secured by The Outlet Shoppes of the Bluegrass. In August 2022, the joint venture notified the lender of its election to extend the loan secured by The Outlet Shoppes of the Bluegrass - Phase II through April 15, 2023.
Mall of South Carolina, LP and Mall of South Carolina Outparcel, LP
In March 2022, the joint ventures entered into forbearance agreements with the lenders regarding the default triggered by the Chapter 11 Cases related to the loans secured by Coastal Grand Mall and Coastal Grand Crossing.
Shoppes at Eagle Point, LLC
In April 2022, the joint venture entered into a new $
Vision-CBL Mayfaire TC Hotel, LLC
In August 2022, the joint venture entered into an agreement to acquire, develop and operate a hotel adjacent to Mayfaire Town Center. In December 2022, the Successor Company recorded a $
York Town Center Holding, LP
In March 2022, the joint venture entered into a $
2021 Activity - Unconsolidated Affiliates
Ambassador Infrastructure, LLC
The joint venture reached an agreement with the lender to modify the loan secured by Ambassador Infrastructure. The agreement provides an additional
Asheville Mall CMBS, LLC and Park Plaza Mall CMBS, LLC
During the period from January 1, 2021 through October 31, 2021, the Predecessor Company deconsolidated Asheville Mall and Park Plaza as a result of the Predecessor Company losing control of these properties when each was placed in receivership as part of the foreclosure process. The Predecessor Company adjusted the negative equity in each of the two entities to
Continental 425 Fund LLC
In December 2021, the Successor Company sold its interest in the Continental 425 Fund LLC joint venture. This joint venture owned the Springs at Port Orange, which was secured by a $
89
EastGate Mall CMBS, LLC
In December 2021, the Successor Company deconsolidated EastGate Mall as a result of the Successor Company losing control of the property when it was placed in receivership as part of the foreclosure process. The Successor Company evaluated the loss of control and determined that it was no longer the primary beneficiary of the wholly owned subsidiary that owns this property. As a result, the Successor Company adjusted the negative equity in the entity to
EastGate Storage, LLC, Hamilton Place Self Storage, LLC, Parkdale Self Storage, LLC and Self-Storage at Mid Rivers, LLC
In December 2021, EastGate Mall Self Storage, Hamilton Place Self Storage, Mid Rivers Mall Self Storage and Parkdale Mall Self Storage were sold, which generated $
Port Orange I, LLC
In March 2021, the joint venture reached an agreement with the lender to modify the loan secured by The Pavilion at Port Orange. The agreement provides an additional
West Melbourne I, LLC
In March 2021, the joint venture reached agreements with the lender to modify the loans secured by Hammock Landing Phases I & II. Each agreement provides an additional
Condensed Combined Financial Statements - Unconsolidated Affiliates
Condensed combined financial statement information of the unconsolidated affiliates is as follows:
|
|
December 31, |
|
|
December 31, |
|
||
ASSETS: |
|
|
|
|
|
|
||
Investment in real estate assets |
|
$ |
|
|
$ |
|
||
Accumulated depreciation |
|
|
( |
) |
|
|
( |
) |
|
|
|
|
|
|
|
||
Developments in progress |
|
|
|
|
|
|
||
Net investment in real estate assets |
|
|
|
|
|
|
||
Other assets |
|
|
|
|
|
|
||
Total assets |
|
$ |
|
|
$ |
|
||
LIABILITIES: |
|
|
|
|
|
|
||
Mortgage and other indebtedness, net |
|
$ |
|
|
$ |
|
||
Other liabilities |
|
|
|
|
|
|
||
Total liabilities |
|
|
|
|
|
|
||
OWNERS' EQUITY (DEFICIT): |
|
|
|
|
|
|
||
The Company |
|
|
|
|
|
|
||
Other investors |
|
|
( |
) |
|
|
( |
) |
Total owners' deficit |
|
|
( |
) |
|
|
( |
) |
Total liabilities and owners’ deficit |
|
$ |
|
|
$ |
|
||
90
|
|
Year Ended December 31, |
|
|||||||||
|
|
2023 |
|
|
2022 |
|
|
2021 |
|
|||
Total revenues |
|
$ |
|
|
$ |
|
|
$ |
|
|||
Net income (1) |
|
$ |
|
|
$ |
|
|
$ |
|
|||
Variable Interest Entities
The Operating Partnership and certain of its subsidiaries are deemed to have the characteristics of a VIE primarily because the limited partners of these entities do not collectively possess substantive kick-out or participating rights.
Generally, a VIE is a legal entity in which the equity investors do not have the characteristics of a controlling financial interest or the equity investors lack sufficient equity at risk for the entity to finance its activities without additional subordinated financial support. A limited partnership is considered a VIE when the majority of the limited partners unrelated to the general partner possess neither the right to remove the general partner without cause, nor proportionate rights to participate in the decisions that most significantly affect the financial results of the partnership. The Company consolidates the Operating Partnership, which is a VIE, for which the Company is the primary beneficiary. The Company, through the Operating Partnership, consolidates all VIEs for which it is the primary beneficiary. In determining whether the Company is the primary beneficiary of a VIE, the Company considers qualitative and quantitative factors, including, but not limited to: which activities most significantly impact the VIE’s economic performance and which party controls such activities; the amount and characteristics of the Company's investment; the obligation or likelihood for the Company or other investors to provide financial support; and the similarity with and significance to the Company's business activities and the business activities of the other investors.
As of December 31, 2023, the Company had investments in 10 consolidated VIEs with ownership interests ranging from
See Note 14 for a description of guarantees the Operating Partnership has issued related to the unconsolidated affiliates.
NOTE 8. MORTGAGE AND OTHER INDEBTEDNESS, NET
CBL has no indebtedness. Either the Operating Partnership or one of its consolidated subsidiaries that it has a direct or indirect ownership interest in is the borrower on all the Company's debt, substantially all of which is secured by real estate assets.
91
The Company's mortgage and other indebtedness, net, consisted of the following:
|
|
December 31, 2023 |
|
|
December 31, 2022 |
|
||||||||||
|
|
Amount |
|
|
Weighted- |
|
|
Amount |
|
|
Weighted- |
|
||||
Fixed-rate debt: |
|
|
|
|
|
|
|
|
|
|
|
|
||||
Open-air centers and outparcels loan (2) |
|
$ |
|
|
|
% |
|
$ |
|
|
|
% |
||||
Non-recourse loans on operating properties |
|
|
|
|
|
% |
|
|
|
|
|
% |
||||
Total fixed-rate debt |
|
|
|
|
|
% |
|
|
|
|
|
% |
||||
Variable-rate debt: |
|
|
|
|
|
|
|
|
|
|
|
|
||||
Secured term loan |
|
|
|
|
|
% |
|
|
|
|
|
% |
||||
Open-air centers and outparcels loan (2) |
|
|
|
|
|
% |
|
|
|
|
|
% |
||||
Non-recourse loans on operating properties |
|
|
|
|
|
% |
|
|
|
|
|
% |
||||
Recourse loan on an operating property |
|
|
|
|
|
% |
|
|
|
(3) |
|
% |
||||
Total variable-rate debt |
|
|
|
|
|
% |
|
|
|
|
|
% |
||||
Total fixed-rate and variable-rate debt |
|
|
|
|
|
% |
|
|
|
|
|
% |
||||
Unamortized deferred financing costs |
|
|
( |
) |
|
|
|
|
|
( |
) |
|
|
|
||
Debt discounts (4) |
|
|
( |
) |
|
|
|
|
|
( |
) |
|
|
|
||
Total mortgage and other indebtedness, net |
|
$ |
|
|
|
|
|
$ |
|
|
|
|
||||
Non-recourse and recourse loans on operating properties, the open-air centers and outparcels loan and the secured term loan include loans that are secured by properties owned by the Company that have a carrying value of $
Certain of the Company’s properties that are pledged as collateral on non-recourse mortgage loans are subject to cash management agreements with the lenders, which restrict the cash balances associated with those properties to only be used for debt service, capital expenditures and operating expense obligations.
Corporate Debt
Exit Credit Agreement
On the Effective Date, CBL & Associates HoldCo I, LLC (“HoldCo I”), a wholly owned subsidiary of the Operating Partnership, entered into an amended and restated credit agreement (the “exit credit agreement”), providing for an $
92
The exit credit agreement is secured by first-priority liens on substantially all the personal and real property assets of HoldCo I and its direct and indirect subsidiaries, including without limitation, HoldCo I’s and the subsidiary guarantors’ ownership interests in the capital stock, membership interests or partnership interests in the subsidiary guarantors. HoldCo I consists of
Secured Notes Indenture
On the Effective Date, CBL & Associates HoldCo II, LLC ("HoldCo II") entered into a secured notes indenture relating to the secured notes in an aggregate principal amount of $
The secured notes were secured by first priority perfected liens on certain personal and real property assets owned as of the Effective Date by HoldCo II and certain secured notes subsidiary guarantors and certain assets of HoldCo II and each secured notes subsidiary guarantor acquired after the Effective Date.
HoldCo II could redeem the secured notes at its option, subject to satisfaction of customary conditions thereof, including payment of accrued and unpaid interest through the date of such optional redemption and any applicable premium.
Exchangeable Notes Indenture
On the Effective Date, HoldCo II entered into a secured exchangeable notes indenture relating to the issuance of the exchangeable notes in an aggregate principal amount of $
The exchangeable notes were secured by first priority perfected liens on certain personal and real property assets owned as of the Effective Date by Holdco II and certain of its subsidiaries and certain assets of HoldCo II and each of its subsidiaries acquired after the Effective Date.
In December 2021, the Company announced that HoldCo II exercised its optional exchange right with respect to all the $
Fixed-Rate Property Debt
As of December 31, 2023, fixed-rate loans on operating properties bear interest at stated rates ranging from
2023 Activity
In February 2023, the Company exercised its first option to extend the loan secured by Fayette Mall through. The interest rate remains fixed at
93
In May 2023, the Operating Partnership entered into an interest rate swap with a notional amount of $
In June 2023, the loan secured by Cross Creek Mall was modified for an extended maturity date of . The interest rate is fixed at
In November 2023, the Company closed on a loan modification with the existing lender to extend the loan secured by Volusia Mall. Escrow balances were applied to pay down the principal amount by $
2022 Activity
In February 2022, the loan secured by Fayette Mall was modified to reduce the fixed interest rate to
In March 2022, the Company deconsolidated Greenbrier Mall as a result of the Company losing control when the property was placed in receivership. See Note 7 for additional information.
In May 2022, the loan secured by Arbor Place was extended for
In May 2022, the loan secured by Northwoods Mall was extended for
In May 2022, the Company entered into a new $
In June 2022, the Company entered into a new $
In June 2022, the Company paid off the $
In August 2022, the loan secured by Parkdale Mall and Crossing was extended to March 2026.
In October 2022, the loan secured by The Outlet Shoppes at Gettysburg was modified after the lender's claim against the general unsecured claim pool related to the Chapter 11 Cases was allowed. The loan balance was reduced to $
In October 2022, the Company entered into a short-term extension with the lender regarding the loan secured by Cross Creek Mall. This action extended the maturity date to
In October 2022, the Company reached an agreement with the lender to extend the loan secured by Southpark Mall through June 2026, as well as waive the default triggered by the Company's bankruptcy filing.
In October 2022, the Company entered into a loan reinstatement and reaffirmation agreement with the lender regarding the loan secured by Jefferson Mall, which waived the default triggered by the Company's bankruptcy filing.
Variable-Rate Property Debt
The Company's variable-rate debt bears interest at a rate indexed to SOFR. At December 31, 2023, the interest rates ranged from
94
2023 Activity
In April 2023, the Company exercised its extension option on the loan secured by The Outlet Shoppes at Laredo for an extended maturity date of June 2024. In October 2023, after the lender's claim against the general unsecured claim pool related to the Chapter 11 Cases was allowed, the Company and its joint venture partner modified the loan secured by The Outlet Shoppes at Laredo, which resulted in the recognition of gain on extinguishment of debt of $
In October 2023, the Company exercised the optional
Other
Several of the Company’s properties are owned by special purpose entities, created as a requirement under certain loan agreements that are included in the Company’s consolidated financial statements. The sole business purpose of the special purpose entities is to own and operate these properties. The real estate and other assets owned by these special purpose entities are restricted under the loan agreements in that they are not available to settle other debts of the Company. However, so long as the loans are not under an event of default, as defined in the loan agreements, the cash flows from these properties, after payments of debt service, operating expenses and reserves, are available for distribution to the Company.
Scheduled Principal Payments
As of December 31, 2023, the scheduled principal amortization and balloon payments of the Company’s consolidated debt, excluding extensions available at the Company’s option, on all mortgage and other indebtedness, are as follows:
2024 |
|
$ |
|
|
2025 |
|
|
|
|
2026 |
|
|
|
|
2027 |
|
|
|
|
2028 |
|
|
|
|
Thereafter |
|
|
|
|
Total mortgage and other indebtedness |
|
$ |
|
Of the $
Interest Rate Hedge Instruments
The Company may use derivative financial instruments, including interest rate swaps, caps, options, floors and other interest rate derivative contracts, to hedge all or a portion of the interest rate risk associated with its borrowings. The principal objective of such arrangements is to minimize the risks and/or costs associated with the Company’s operating and financial structure as well as to hedge specific anticipated transactions. The Company does not intend to utilize derivatives for speculative or other purposes other than interest rate risk management. The use of derivative financial instruments carries certain risks, including the risk that the counterparties to these contractual arrangements are not able to perform under the agreements. To mitigate this risk, the Company only enters into derivative financial instruments with counterparties with high credit ratings and with major financial institutions with which the Company and its affiliates may also have other financial relationships. The Company does not anticipate that its counterparty will fail to meet their obligation.
The Company records its derivative instruments in its consolidated balance sheets at fair value. The accounting for changes in the fair value of derivatives depends on the intended use of the derivative, whether the derivative has been designated as a hedge and, if so, whether the hedge has met the criteria necessary to apply hedge accounting.
The Company’s objectives in using interest rate derivatives are to add stability to interest expense and to manage its exposure to interest rate movements. To accomplish these objectives, the Company primarily uses interest rate swaps as part of its interest rate risk management strategy. Interest rate swaps designated as cash flow hedges involve the receipt of variable-rate amounts from a counterparty in exchange for the Company making fixed-rate payments over the life of the agreements without exchange of the underlying notional amount.
95
The effective portion of changes in the fair value of derivatives designated as, and that qualify as, cash flow hedges is recorded in accumulated other comprehensive income (loss) and is subsequently reclassified into earnings in the period that the hedged forecasted transaction affects earnings. Such derivatives were used to hedge the variable cash flows associated with variable-rate debt.
Instrument Type |
|
Location in the Consolidated Balance Sheet |
|
Notional |
|
|
Index |
|
Fair Value at December 31, 2023 |
|
|
Maturity Date |
||
Pay fixed/Receive variable swap |
|
Intangible lease assets and other assets |
|
$ |
|
|
1-month USD-SOFR CME |
|
$ |
|
|
|||
|
|
Gain Recognized in Other Comprehensive Income (Loss) |
|
|
|
|
Gain Recognized in Earnings |
|
||||||||||
|
|
Year Ended December 31, |
|
|
|
|
Year Ended December 31, |
|
||||||||||
Hedging Instrument |
|
2023 |
|
|
2022 |
|
|
Location of Gain Reclassified from Accumulated Other Comprehensive Income (Loss) into Earnings |
|
2023 |
|
|
2022 |
|
||||
Interest rate swap |
|
$ |
|
|
$ |
— |
|
|
Interest Expense |
|
$ |
|
|
$ |
— |
|
||
Amounts reported in accumulated other comprehensive income (loss) related to derivatives will be reclassified to interest expense as interest payments are made on the Company’s variable-rate debt. During the next twelve months, the Company estimates that $
The Company has an agreement with each derivative counterparty that contains a provision where if the Company either defaults or is capable of being declared in default on any of its indebtedness, then the Company could also be declared in default on its derivative obligations.
As of December 31, 2023, the Company did
Common Stock and Common Units
The Successor Company's authorized common stock consists of
The Company may repurchase shares of CBL's common stock, as authorized by the board of directors. The timing and amount of repurchase activity is based on market conditions and other considerations, including the level of available cash, alternative uses for cash and the Company's stock price. In August 2023, the board of directors authorized the repurchase of up to $
On September 8, 2022, the Successor Company's board of directors adopted a short-term rights plan (the “Rights Plan”). Pursuant to the Rights Plan, the board of directors authorized a dividend of one share purchase right (a “Right”) for each outstanding share of the Successor Company's common stock. If a person or group of affiliated or associated persons acquired beneficial ownership of
96
Successor Company could redeem the Rights for cash at a price of $
Partners in the Operating Partnership hold their ownership through common units of limited partnership interest, hereinafter referred to as "common units." A common unit and a share of CBL's common stock have essentially the same economic characteristics, as they effectively participate equally in the net income and distributions of the Operating Partnership. For each share of common stock issued by CBL, the Operating Partnership has issued a corresponding number of common units to CBL in exchange for the proceeds from the stock issuance.
Each limited partner in the Operating Partnership has the right to exchange all or a portion of its common units for shares of CBL's common stock, or at the Company's election, their cash equivalent. When an exchange for common stock occurs, the Company assumes the limited partner's common units in the Operating Partnership. The number of shares of common stock received by a limited partner of the Operating Partnership upon exercise of its exchange rights will be equal, on a one-for-one basis, to the number of common units exchanged by the limited partner. If the Company elects to pay cash, the amount of cash paid by the Operating Partnership to redeem the limited partner's common units will be based on the five-day trailing average of the trading price, at the time of exchange, of the shares of common stock that would otherwise have been received by the limited partner in the exchange. Neither the common units nor the shares of CBL's common stock are subject to any right of mandatory redemption.
During 2023, the Company paid cash of $
Dividends
In June 2022, the board of directors established a regular quarterly dividend. The Successor Company paid common stock dividends of $
In November 2022, the board of directors declared a special dividend of $
The decision to declare and pay dividends on any outstanding shares of our common stock, as well as the timing, amount and composition of any such future dividends, will be at the sole discretion of the Company's board of directors and will depend on the Company's earnings, taxable income, cash flows, liquidity, financial condition, capital requirements, contractual prohibitions or other limitations under the Company's then-current indebtedness, the annual distribution requirements under the REIT provisions of the Internal Revenue Code, Delaware law and such other factors as the Company's board of directors deems relevant. Any dividends payable will be determined by the Company's board of directors based upon the circumstances at the time of declaration. The Company's actual results of operations will be affected by a number of factors, including the revenues received from its properties, its operating expenses, interest expense, unanticipated capital expenditures and the ability of its anchors and tenants at its properties to meet their obligations for payment of rents and tenant reimbursements.
The allocations of dividends declared and paid for income tax purposes for the Successor years ended December 31, 2023 and 2022 are as follows (income tax allocations were not applicable in 2021 due to the Company not paying any dividends during the year):
|
|
Year Ended December 31, |
|
|||||
|
|
2023 |
|
|
2022 |
|
||
Dividends declared: |
|
|
|
|
|
|
||
Common stock |
|
$ |
|
|
$ |
|
||
Allocations: |
|
|
|
|
|
|
||
Common stock |
|
|
|
|
|
|
||
Ordinary income |
|
|
% |
|
|
% |
||
Capital gains |
|
|
% |
|
|
% |
||
Return of capital |
|
|
— |
% |
|
|
— |
% |
Total |
|
|
% |
|
|
% |
||
97
NOTE 10. NONCONTROLLING INTERESTS
Noncontrolling Interests of the Company
Third parties held rights to convert noncontrolling interests in the Operating Partnership to
The assets and liabilities allocated to the Operating Partnership’s noncontrolling interests are based on their ownership percentages of the Operating Partnership at December 31, 2023 and 2022. The ownership percentages are determined by dividing the number of common units held by each of the noncontrolling interests at December 31, 2023 and 2022 by the total common units outstanding at December 31, 2023 and 2022, respectively. The noncontrolling interest ownership percentage in assets and liabilities of the Successor Operating Partnership was
Income is allocated to the Operating Partnership’s noncontrolling interests based on their weighted-average ownership during the year. The ownership percentages are determined by dividing the weighted-average number of common units held by each of the noncontrolling interests by the total weighted-average number of common units outstanding during the year.
A change in the number of shares of common stock or common units changes the percentage ownership of all partners of the Operating Partnership. A common unit is considered to be equivalent to a share of common stock since it generally is exchangeable for shares of the Company’s common stock or, at the Company’s election, their cash equivalent. As a result, an allocation is made between shareholders’ equity and noncontrolling interests in the Operating Partnership in the Company's accompanying balance sheets to reflect the change in ownership of the Operating Partnership’s underlying equity when there is a change in the number of shares and/or common units outstanding. During the period January 1, 2021 through October 31, 2021, the Predecessor Company allocated $
The total noncontrolling interest in the Successor Operating Partnership was $
Noncontrolling Interests in Other Consolidated Subsidiaries
The Successor Company had
The assets and liabilities allocated to noncontrolling interests in other consolidated subsidiaries of the Successor Company are based on the third parties’ ownership percentages in each subsidiary at December 31, 2023 and 2022, respectively. Income is allocated to noncontrolling interests in other consolidated subsidiaries based on the third parties’ weighted-average ownership in each subsidiary during the year.
Variable Interest Entities (VIE)
The Operating Partnership and certain of its subsidiaries are deemed to have the characteristics of a VIE primarily because the limited partners of these entities do not collectively possess substantive kick-out or participating rights.
Generally, a VIE is a legal entity in which the equity investors do not have the characteristics of a controlling financial interest or the equity investors lack sufficient equity at risk for the entity to finance its activities without additional subordinated financial support. A limited partnership is considered a VIE when the majority of the limited partners unrelated to the general partner possess neither the right to remove the general partner without cause, nor proportionate rights to participate in the decisions that most significantly affect the financial results of the partnership. The Company consolidates the Operating Partnership, which is a VIE, for which the Company is the primary beneficiary. The Company, through the Operating Partnership, consolidates all VIEs for which it is the primary beneficiary. In determining whether the Company is the primary beneficiary of a VIE, the Company considers qualitative and quantitative factors, including, but not limited to: which activities most significantly impact the VIE’s economic performance and which party controls such activities; the amount and characteristics of the Company's investment; the obligation or likelihood for the Company or other investors to provide financial support; and the similarity with and significance to the Company's business activities and the business activities of the other investors.
98
The table below lists the Successor Company's consolidated VIEs as of December 31, 2023 and 2022, which does not reflect the elimination of any internal debt the consolidated VIE has with the Operating Partnership:
|
|
As of December 31, |
|
|
As of December 31, |
|
||||||||||
|
|
2023 |
|
|
2022 |
|
||||||||||
|
|
Assets |
|
|
Liabilities |
|
|
Assets |
|
|
Liabilities |
|
||||
Consolidated VIEs: |
|
|
|
|
|
|
|
|
|
|
|
|
||||
Atlanta Outlet Outparcels, LLC |
|
$ |
|
|
$ |
— |
|
|
$ |
|
|
$ |
— |
|
||
CBL Terrace LP |
|
|
|
|
|
|
|
|
|
|
|
|
||||
Gettysburg Outlet Center Holding, LLC |
|
|
|
|
|
|
|
|
|
|
|
|
||||
Gettysburg Outlet Center, LLC |
|
|
|
|
|
— |
|
|
|
|
|
|
— |
|
||
Jarnigan Road LP |
|
|
|
|
|
|
|
|
|
|
|
|
||||
Jarnigan Road II, LLC |
|
|
|
|
|
|
|
|
|
|
|
|
||||
Laredo Outlet JV, LLC |
|
|
|
|
|
|
|
|
|
|
|
|
||||
Lebcon Associates |
|
|
|
|
|
|
|
|
|
|
|
|
||||
Lebcon I, Ltd |
|
|
|
|
|
|
|
|
|
|
|
|
||||
Louisville Outlet Outparcels, LLC |
|
|
|
|
|
— |
|
|
|
|
|
|
— |
|
||
Statesboro Crossing, LLC |
|
|
— |
|
|
|
— |
|
|
|
|
|
|
— |
|
|
|
|
$ |
|
|
$ |
|
|
$ |
|
|
$ |
|
||||
The table below lists the Successor Company's unconsolidated VIEs as of December 31, 2023:
Unconsolidated VIEs: |
|
Investment in |
|
|
Maximum |
|
||
Alamance Crossing CMBS, LLC (1) |
|
$ |
— |
|
|
$ |
— |
|
Ambassador Infrastructure, LLC (2) |
|
|
— |
|
|
|
|
|
Atlanta Outlet JV, LLC |
|
|
— |
|
|
|
— |
|
BI Development, LLC |
|
|
|
|
|
|
||
BI Development II, LLC |
|
|
|
|
|
|
||
CBL-T/C, LLC |
|
|
— |
|
|
|
— |
|
CBL-TRS Med OFC Holding, LLC (3) |
|
|
|
|
|
|
||
El Paso Outlet Center Holding, LLC |
|
|
— |
|
|
|
— |
|
Fremaux Town Center JV, LLC |
|
|
— |
|
|
|
— |
|
Louisville Outlet Shoppes, LLC |
|
|
— |
|
|
|
— |
|
Mall of South Carolina L.P. |
|
|
— |
|
|
|
— |
|
Vision - CBL Hamilton Place, LLC |
|
|
|
|
|
|
||
Vision - CBL Mayfaire TC Hotel, LLC |
|
|
|
|
|
|
||
Westgate Mall CMBS, LLC (1) |
|
|
— |
|
|
|
— |
|
|
|
$ |
|
|
$ |
|
||
99
NOTE 11. SEGMENT INFORMATION
The Company measures performance and allocates resources according to property type, which is determined based on certain criteria such as type of tenants, capital requirements, economic risks, leasing terms, and short- and long-term returns on capital. Rental income and tenant reimbursements from tenant leases provide the majority of revenues from all segments. The accounting policies of the reportable segments are the same as those described in Note 2.
Information on the Company’s reportable segments is presented as follows:
Year Ended December 31, 2023 (Successor) |
|
Malls (1) |
|
|
All |
|
|
Total |
|
|||
Revenues (3) |
|
$ |
|
|
$ |
|
|
$ |
|
|||
Property operating expenses (4) |
|
|
( |
) |
|
|
( |
) |
|
|
( |
) |
Interest expense |
|
|
( |
) |
|
|
( |
) |
|
|
( |
) |
Gain on sales of real estate assets |
|
|
— |
|
|
|
|
|
|
|
||
Other expense |
|
|
— |
|
|
|
( |
) |
|
|
( |
) |
Segment profit (loss) |
|
$ |
|
|
$ |
( |
) |
|
|
|
||
Depreciation and amortization |
|
|
|
|
|
|
|
|
( |
) |
||
General and administrative expense |
|
|
|
|
|
|
|
|
( |
) |
||
Litigation settlement |
|
|
|
|
|
|
|
|
|
|||
Interest and other income |
|
|
|
|
|
|
|
|
|
|||
Gain on extinguishment of debt |
|
|
|
|
|
|
|
|
|
|||
Gain on deconsolidation |
|
|
|
|
|
|
|
|
|
|||
Income tax provision |
|
|
|
|
|
|
|
|
( |
) |
||
Equity in earnings of unconsolidated affiliates |
|
|
|
|
|
|
|
|
|
|||
Net income |
|
|
|
|
|
|
|
$ |
|
|||
Total assets |
|
$ |
|
|
$ |
|
|
$ |
|
|||
Capital expenditures (5) |
|
$ |
|
|
$ |
|
|
$ |
|
|||
Year Ended December 31, 2022 (Successor) |
|
Malls (1) |
|
|
All |
|
|
Total |
|
|||
Revenues (3) |
|
$ |
|
|
$ |
|
|
$ |
|
|||
Property operating expenses (4) |
|
|
( |
) |
|
|
( |
) |
|
|
( |
) |
Interest expense |
|
|
( |
) |
|
|
( |
) |
|
|
( |
) |
Gain on sales of real estate assets |
|
|
— |
|
|
|
|
|
|
|
||
Other expense |
|
|
— |
|
|
|
( |
) |
|
|
( |
) |
Segment profit (loss) |
|
$ |
|
|
$ |
( |
) |
|
|
|
||
Depreciation and amortization |
|
|
|
|
|
|
|
|
( |
) |
||
General and administrative expense |
|
|
|
|
|
|
|
|
( |
) |
||
Litigation settlement |
|
|
|
|
|
|
|
|
|
|||
Interest and other income |
|
|
|
|
|
|
|
|
|
|||
Gain on extinguishment of debt |
|
|
|
|
|
|
|
|
|
|||
Loss on available-for-sale securities |
|
|
|
|
|
|
|
|
( |
) |
||
Reorganization items, net |
|
|
|
|
|
|
|
|
|
|||
Loss on impairment |
|
|
|
|
|
|
|
|
( |
) |
||
Gain on deconsolidation |
|
|
|
|
|
|
|
|
|
|||
Income tax provision |
|
|
|
|
|
|
|
|
( |
) |
||
Equity in earnings of unconsolidated affiliates |
|
|
|
|
|
|
|
|
|
|||
Net loss |
|
|
|
|
|
|
|
$ |
( |
) |
||
Total assets |
|
$ |
|
|
$ |
|
|
$ |
|
|||
Capital expenditures (5) |
|
$ |
|
|
$ |
|
|
$ |
|
|||
100
For the Period from November 1, 2021 through December 31, 2021 (Successor) |
|
Malls (1) |
|
|
All |
|
|
Total |
|
|||
Revenues (3) |
|
$ |
|
|
$ |
|
|
$ |
|
|||
Property operating expenses (4) |
|
|
( |
) |
|
|
( |
) |
|
|
( |
) |
Interest expense |
|
|
( |
) |
|
|
( |
) |
|
|
( |
) |
Gain (loss) on sales of real estate assets |
|
|
|
|
|
( |
) |
|
|
( |
) |
|
Other expense |
|
|
— |
|
|
|
( |
) |
|
|
( |
) |
Segment loss |
|
$ |
( |
) |
|
$ |
( |
) |
|
|
( |
) |
Depreciation and amortization |
|
|
|
|
|
|
|
|
( |
) |
||
General and administrative expense |
|
|
|
|
|
|
|
|
( |
) |
||
Litigation settlement |
|
|
|
|
|
|
|
|
|
|||
Interest and other income |
|
|
|
|
|
|
|
|
|
|||
Gain on deconsolidation |
|
|
|
|
|
|
|
|
|
|||
Reorganization items |
|
|
|
|
|
|
|
|
( |
) |
||
Income tax benefit |
|
|
|
|
|
|
|
|
|
|||
Equity in earnings of unconsolidated affiliates |
|
|
|
|
|
|
|
|
|
|||
Net loss |
|
|
|
|
|
|
|
$ |
( |
) |
||
Total assets |
|
$ |
|
|
$ |
|
|
$ |
|
|||
Capital expenditures (5) |
|
$ |
|
|
$ |
|
|
$ |
|
|||
Period from January 1, through October 31, 2021 (Predecessor) |
|
Malls (1) |
|
|
All |
|
|
Total |
|
|||
Revenues (3) |
|
$ |
|
|
$ |
|
|
$ |
|
|||
Property operating expenses (4) |
|
|
( |
) |
|
|
( |
) |
|
|
( |
) |
Interest expense |
|
|
( |
) |
|
|
( |
) |
|
|
( |
) |
Gain on sales of real estate assets |
|
|
|
|
|
|
|
|
|
|||
Other expense |
|
|
( |
) |
|
|
( |
) |
|
|
( |
) |
Segment profit |
|
$ |
|
|
$ |
|
|
|
|
|||
Depreciation and amortization |
|
|
|
|
|
|
|
|
( |
) |
||
General and administrative expense |
|
|
|
|
|
|
|
|
( |
) |
||
Litigation settlement |
|
|
|
|
|
|
|
|
|
|||
Interest and other income |
|
|
|
|
|
|
|
|
|
|||
Reorganization items, net |
|
|
|
|
|
|
|
|
( |
) |
||
Gain on deconsolidation |
|
|
|
|
|
|
|
|
|
|||
Loss on impairment |
|
|
|
|
|
|
|
|
( |
) |
||
Income tax provision |
|
|
|
|
|
|
|
|
( |
) |
||
Equity in losses of unconsolidated affiliates |
|
|
|
|
|
|
|
|
( |
) |
||
Net loss |
|
|
|
|
|
|
|
$ |
( |
) |
||
Capital expenditures (5) |
|
$ |
|
|
$ |
|
|
$ |
|
|||
101
NOTE 12. SUPPLEMENTAL AND NONCASH INFORMATION
The Company’s noncash investing and financing activities for the years ended December 31, 2023 and 2022, the Successor period from November 1, 2021 to December 31, 2021, and the Predecessor period from January 1, 2021 to October 31, 2021 were as follows:
|
|
Successor |
|
|
|
Predecessor |
|
||||||||||
|
|
Year Ended December 31, |
|
|
Period from November 1, through December 31, |
|
|
|
Period from January 1, through October 31, |
|
|||||||
|
|
2023 |
|
|
2022 |
|
|
2021 |
|
|
|
2021 |
|
||||
Additions to real estate assets accrued but not yet paid |
|
$ |
|
|
$ |
|
|
$ |
|
|
|
$ |
|
||||
Accrued dividends and distributions payable |
|
|
— |
|
|
|
|
|
|
— |
|
|
|
|
— |
|
|
Deconsolidation upon loss of control (1): |
|
|
|
|
|
|
|
|
|
|
|
|
|
||||
Decrease in real estate assets |
|
|
( |
) |
|
|
( |
) |
|
|
( |
) |
|
|
|
( |
) |
Decrease in mortgage and other indebtedness |
|
|
|
|
|
|
|
|
|
|
|
|
|
||||
Decrease in operating assets and liabilities |
|
|
|
|
|
|
|
|
|
|
|
|
|
||||
Decrease in intangible lease and other assets |
|
|
( |
) |
|
|
( |
) |
|
|
— |
|
|
|
|
( |
) |
Settlement of mortgage debt obligations (2): |
|
|
|
|
|
|
|
|
|
|
|
|
|
||||
Decrease in mortgage and other indebtedness |
|
|
|
|
|
|
|
|
— |
|
|
|
|
— |
|
||
Decrease in operating assets and liabilities |
|
|
— |
|
|
|
|
|
|
— |
|
|
|
|
— |
|
|
Conversion of exchangeable notes: |
|
|
|
|
|
|
|
|
|
|
|
|
|
||||
Decrease in mortgage and other indebtedness |
|
|
— |
|
|
|
|
|
|
— |
|
|
|
|
— |
|
|
Decrease in operating assets and liabilities |
|
|
— |
|
|
|
|
|
|
— |
|
|
|
|
— |
|
|
Increase in shareholders' equity |
|
|
— |
|
|
|
( |
) |
|
|
— |
|
|
|
|
— |
|
The Management Company provides management, development and leasing services to the Company’s unconsolidated affiliates and other affiliated partnerships. The Successor Company recognized revenues for these services in the amount of $
NOTE 14. CONTINGENCIES
Securities Litigation
The Company and certain of its officers and directors were named as defendants in three putative securities class action lawsuits (collectively, the “Securities Class Action Litigation”), each filed in the United States District Court for the Eastern District of Tennessee, on behalf of all persons who purchased or otherwise acquired the Company’s securities during a specified period of time. Those cases were consolidated on July 17, 2019, under the caption In re CBL & Associates Properties, Inc. Securities Litigation, 1:19-cv-00149-JRG-CHS, and a consolidated amended complaint was filed on November 5, 2019, seeking to represent a class of purchasers from July 29, 2014 through March 26, 2019.
The operative complaint filed in the Securities Class Action Litigation alleged violations of the securities laws, including, among other things, that the defendants made certain materially false and misleading statements and omissions regarding the Company’s contingent liabilities, business, operations, and prospects during the period of time specified above. On May 3, 2022, the court dismissed the Company from the Securities Class Action Litigation but declined to dismiss the individual defendants. The court also lifted the stay of the proceedings and, on June 9, 2022, entered a scheduling order. Plaintiffs’ motion for class certification, which was opposed, was fully briefed and pending as of December 31, 2022. Following mediation on January 31, 2023, before a private mediator, the parties reached an agreement in principle to resolve the Securities Class Action Litigation, subject to documentation and court approval. On April 24, 2023, the court entered an order preliminarily approving the proposed settlement, subject to a final fairness hearing in August 2023. On August 23, 2023, after conducting a final fairness hearing, the court entered an order granting final approval of the settlement. The deadline to appeal the order granting final approval of the settlement has expired and the settlement is final. The settlement was fully funded by directors and officers' liability insurance, with no contribution from the Company or the individual defendants. By agreeing to resolve the matter, neither the Company nor any of the individual defendants have admitted any liability or wrongdoing, and they have expressly denied both. Rather, defendants entered into the settlement to eliminate the risks, costs, and distractions associated with further litigation of this matter.
102
On January 12, 2023, a purported shareholder filed a putative class action lawsuit captioned John Haynes v. Charles B. Lebovitz, et al., C.A. No. 2023-0033-NAC, in the Delaware Court of Chancery (the “Delaware Action”), naming the Company and certain directors as defendants. The Delaware Action alleged a claim against the Company for violation of Delaware General Corporation Law § 213(a) due to an improper record date for the 2022 annual meeting, and a claim for breach of fiduciary duty against the director defendants. The Delaware Action sought, among other things, a declaration that the directors breached their fiduciary duties, an equitable accounting, unspecified monetary relief, and attorneys’ fees. Defendants denied that any such relief was warranted, and on February 15, 2023, the Delaware Action was voluntarily dismissed.
The Company is currently involved in certain other litigation that arises in the ordinary course of business, most of which is expected to be covered by liability insurance. Management makes assumptions and estimates concerning the likelihood and amount of any potential loss relating to these matters using the latest information available. The Company records a liability for litigation if an unfavorable outcome is probable and the amount of loss or range of loss can be reasonably estimated. If an unfavorable outcome is probable and a reasonable estimate of the loss is a range, the Company accrues the best estimate within the range. If no amount within the range is a better estimate than any other amount, the Company accrues the minimum amount within the range. If an unfavorable outcome is probable but the amount of the loss cannot be reasonably estimated, the Company discloses the nature of the litigation and indicates that an estimate of the loss or range of loss cannot be made. If an unfavorable outcome is reasonably possible and the estimated loss is material, the Company discloses the nature and estimate of the possible loss of the litigation. Based on current expectations, such matters, both individually and in the aggregate, are not expected to have a material adverse effect on the liquidity, results of operations, business or financial condition of the Company.
Environmental Contingencies
The Company evaluates potential loss contingencies related to environmental matters using the same criteria described above related to litigation matters. Based on current information, an unfavorable outcome concerning such environmental matters, both individually and in the aggregate, is considered to be reasonably possible. However, the Company believes its maximum potential exposure to loss would not be material to its results of operations or financial condition. The Company has a master insurance policy that provides coverage through 2027 for certain environmental claims up to $
Guarantees
The Operating Partnership may guarantee the debt of a joint venture primarily because it allows the joint venture to obtain funding at a lower cost than could be obtained otherwise. This results in a higher return for the joint venture on its investment, and a higher return on the Operating Partnership's investment in the joint venture. The Operating Partnership may receive a fee from the joint venture for providing the guaranty. Additionally, when the Operating Partnership issues a guaranty, the terms of the joint venture agreement typically provide that the Operating Partnership may receive indemnification from the joint venture partner or have the ability to increase its ownership interest. The guarantees expire upon repayment of the debt, unless noted otherwise.
The following table represents the Operating Partnership's guarantees of unconsolidated affiliates' debt as reflected in the accompanying consolidated balance sheets as of December 31, 2023 and 2022:
|
|
As of December 31, 2023 |
|
Obligation |
|
|||||||||||||||||
Unconsolidated Affiliate |
|
Company's |
|
Outstanding |
|
|
Percentage |
|
Maximum |
|
|
Debt |
|
December 31, 2023 |
|
|
December 31, 2022 |
|
||||
West Melbourne I, LLC - Phase I |
|
|
$ |
|
|
|
$ |
|
|
Feb-2025 |
(2) |
$ |
|
|
$ |
|
||||||
West Melbourne I, LLC - Phase II |
|
|
|
|
|
|
|
|
|
Feb-2025 |
(2) |
|
|
|
|
|
||||||
Port Orange I, LLC |
|
|
|
|
|
|
|
|
|
Feb-2025 |
(2) |
|
|
|
|
|
||||||
Ambassador Infrastructure, LLC |
|
|
|
|
|
|
|
|
|
Mar-2025 |
|
|
|
|
|
|
||||||
CBL-TRS Med OFC Holding, LLC (3) |
|
|
|
|
|
|
|
|
|
Jun-2030 |
|
|
|
|
|
— |
|
|||||
Total guaranty liability |
|
|
|
|
|
|
|
|
|
|
|
|
|
$ |
|
|
$ |
|
||||
103
For the years ended December 31, 2023 and 2022 and for the period November 1, 2021 through December 31, 2021, the Successor Company evaluated each guaranty, listed in the table above, individually by looking at the debt service ratio, cash flow forecasts and the performance of each loan. The result of the analysis was that each loan is current. The Successor Company did not record a credit loss related to the guarantees listed in the table above for the years ended December 31, 2023 and 2022 and for the period from November 1, 2021 through December 31, 2021.
For the period from January 1, 2021 through October 31, 2021, the Predecessor Company evaluated each guaranty, listed in the table above, individually by looking at the debt service ratio, cash flow forecasts, the performance of each loan and, where applicable, the collateral value in relation to the outstanding amount of the loan. The result of the analysis was that each loan is current, performing and, where applicable, the collateral value was greater than the outstanding amount of the loan. The Predecessor Company did not record a credit loss related to the guarantees listed in the table above for the period from January 1, 2021 through October 31, 2021.
NOTE 15. FAIR VALUE MEASUREMENTS
The Company has categorized its financial assets and financial liabilities that are recorded at fair value into a hierarchy in accordance with ASC 820, Fair Value Measurements and Disclosure, ("ASC 820") based on whether the inputs to valuation techniques are observable or unobservable. The fair value hierarchy contains three levels of inputs that may be used to measure fair value as follows:
Level 1 - Inputs represent quoted prices in active markets for identical assets and liabilities as of the measurement date.
Level 2 - Inputs, other than those included in Level 1, represent observable measurements for similar instruments in active markets, or identical or similar instruments in markets that are not active, and observable measurements or market data for instruments with substantially the full term of the asset or liability.
Level 3 - Inputs represent unobservable measurements, supported by little, if any, market activity, and require considerable assumptions that are significant to the fair value of the asset or liability. Market valuations must often be determined using discounted cash flow methodologies, pricing models or similar techniques based on the Company’s assumptions and best judgment.
The asset or liability's fair value within the fair value hierarchy is based on the lowest level of any input that is significant to the fair value measurement. Under ASC 820, fair value measurements are determined based on the assumptions that market participants would use in pricing the asset or liability in an orderly transaction at the measurement date and under current market conditions. Valuation techniques used maximize the use of observable inputs and minimize the use of unobservable inputs and consider assumptions such as inherent risk, transfer restrictions and risk of nonperformance.
The carrying values of cash and cash equivalents, receivables, accounts payable and accrued liabilities are reasonable estimates of their fair values because of the short-term nature of these financial instruments. The estimated fair value of mortgage and other indebtedness was $
Fair Value Measurements on a Recurring Basis
The following table sets forth information regarding the Successor Company's interest rate swap that was designated as a cash flow hedge of interest risk for the year ended December 31, 2023:
|
|
|
|
|
Fair Value Measurements at Reporting Date Using |
|
||||||||||
Asset |
|
Fair Value at December 31, 2023 |
|
|
Quoted Prices in |
|
|
Significant |
|
|
Significant |
|
||||
Interest rate swap |
|
$ |
|
|
$ |
— |
|
|
$ |
|
|
$ |
— |
|
||
104
During the year ended December 31, 2023, the Successor Company has continued to reinvest the cash from maturing U.S. Treasury securities into new U.S. Treasury securities. The Successor Company designated the U.S. Treasury securities as available-for-sale (“AFS”).
AFS Security (1) |
|
Amortized |
|
|
Allowance |
|
|
Total unrealized gain |
|
|
Fair value as of December 31, 2023 (3) |
|
||||
U.S. Treasury securities |
|
$ |
|
|
$ |
— |
|
|
$ |
|
|
$ |
|
|||
The following table sets forth information regarding the Successor Company’s AFS securities that were measured at fair value for the year ended December 31, 2022:
AFS Security |
|
Amortized |
|
|
Allowance |
|
|
Total unrealized loss |
|
|
Fair value as of December 31, 2022 (2) |
|
||||
U.S. Treasury securities |
|
$ |
|
|
$ |
— |
|
|
$ |
( |
) |
|
$ |
|
||
Fair Value Measurements on a Nonrecurring Basis
The Company measures the fair value of certain long-lived assets on a nonrecurring basis, through quarterly impairment testing or when events or changes in circumstances indicate that the carrying amount of the assets may not be recoverable. The Company’s evaluation of the recoverability of long-lived assets involves the comparison of undiscounted future cash flows expected to be generated by each property over the Company’s expected remaining holding period to the respective carrying amount. The determination of whether the carrying value is recoverable also requires management to make estimates related to probability weighted scenarios impacting undiscounted cash flow models. The Company considers both quantitative and qualitative factors in its impairment analysis of long-lived assets. Significant quantitative factors include historical and forecasted information for each property such as net operating income, occupancy statistics and sales levels. Significant qualitative factors used include market conditions, age and condition of the property and tenant mix. The quantitative and qualitative factors impact the selection of the terminal capitalization rate which is used in both an undiscounted and discounted cash flow model and the discount rate used in a discounted cash flow model. Due to the significant unobservable estimates and assumptions used in the valuation of long-lived assets that experience impairment, the Company classifies such long-lived assets under Level 3 in the fair value hierarchy. Level 3 inputs primarily consist of sales and market data, independent valuations and discounted cash flow models. See below for a description of the estimates and assumptions the Company used in its impairment analysis. See Note 2 for additional information describing the Company's impairment review process.
See Note 19 for information regarding the fair value adjustments associated with Fresh Start Accounting.
Long-lived Assets Measured at Fair Value in 2023
During the year ended December 31, 2023, the Successor Company adjusted the negative equity in WestGate Mall and Alamance Crossing East to
Long-lived Assets Measured at Fair Value in 2022
During the year ended December 31, 2022, the Successor Company adjusted the negative equity in Greenbrier Mall to
During the year ended December 31, 2022, the Successor Company sold an outparcel at the Pavilion at Port Orange. Gross sales proceeds amounted to $
105
Long-lived Assets Measured at Fair Value in 2021
Impairment |
|
Property |
|
Location |
|
Segment |
|
Loss on |
|
|
Fair |
|
||
March |
|
Eastland Mall (1) |
|
Bloomington, IL |
|
Malls |
|
$ |
|
|
$ |
|
||
March |
|
Old Hickory Mall (2) |
|
Jackson, TN |
|
Malls |
|
|
|
|
|
|
||
March |
|
Stroud Mall (3) |
|
Stroudsburg, PA |
|
Malls |
|
|
|
|
|
|
||
July |
|
The Landing at Arbor Place - Outparcel (4) |
|
Douglasville, GA |
|
All Other |
|
|
|
|
|
|
||
September |
|
Laurel Park Place (5) |
|
Livonia, MI |
|
Malls |
|
|
|
|
|
|
||
September |
|
Parkdale Mall and Crossing (6) |
|
Beaumont, TX |
|
Malls/All Other |
|
|
|
|
|
|
||
October |
|
The Outlet Shoppes at Gettysburg (7) |
|
Gettysburg, PA |
|
Malls |
|
|
|
|
|
|
||
October |
|
Vacant land (8) |
|
El Centro, CA |
|
All Other |
|
|
|
|
|
|
||
|
|
|
|
|
|
|
|
$ |
|
|
$ |
|
||
During the period from November 1, 2021 through December 31, 2021, the Successor Company adjusted the negative equity in EastGate Mall to zero upon deconsolidation, which represented the estimated fair value of the Company’s investment in that property. During the period from January 1, 2021 through October 31, 2021, the Predecessor Company adjusted the negative equity in each of Asheville Mall and Park Plaza to
106
NOTE 16. SHARE-BASED COMPENSATION
Successor Company
2021 Equity Incentive Plan
Following the Effective Date, the board of directors of the Successor Company adopted the CBL & Associates Properties, Inc. 2021 Equity Incentive Plan (the “EIP”). The EIP authorizes the grant of equity awards to eligible participants based on the new common stock, in the form of stock options, stock appreciation rights, restricted stock, restricted stock units and other equity awards. Awards under the EIP may be granted to officers, employees, directors, consultants and independent contractors of the reorganized company. Initially,
In accordance with the provisions of ASU 2016-09, which are designed to simplify the accounting for share-based payments transactions, the Successor Company accounts for forfeitures of share-based payments as they occur rather than estimating them in advance.
Restricted Stock Awards
Restricted stock awards granted to the Successor Company’s executive officers vest annually over a
A summary of the status of the Company’s nonvested restricted stock awards as of December 31, 2023, and changes during the year ended December 31, 2023, is presented below:
|
|
Shares |
|
|
Weighted- |
|
||
Nonvested at January 1, 2023 |
|
|
|
|
$ |
|
||
Granted |
|
|
|
|
$ |
|
||
Vested |
|
|
( |
) |
|
$ |
|
|
Forfeited |
|
|
( |
) |
|
$ |
|
|
Nonvested at December 31, 2023 |
|
|
|
|
$ |
|
||
Compensation expense is recognized on a straight-line basis over the requisite service period. The share-based compensation cost related to restricted stock awards was $
The total grant-date fair value of restricted stock awards granted during the years ended December 31, 2023 and 2022 and the period from November 1, 2021 through December 31, 2021 was $
As of December 31, 2023, there was $
107
Performance Stock Unit Awards
In February 2022, the compensation committee approved the terms of new awards of PSUs. The PSUs are earned over a
In February 2023, the compensation committee established a long-term incentive program (“LTIP”) under the EIP and approved 2023 LTIP awards consisting of both a PSU component (
Compensation cost for the PSUs granted in February 2023 is recognized on a straight-line basis over the service period since it is longer than the performance period. The resulting expense is recorded regardless of whether any PSU awards are earned as long as the required service period is met. For the PSUs granted in February 2022, each quarter, management assesses the probability that the measures associated with the Company's outstanding PSU awards will be attained. The Company begins recognizing compensation expense on a straight-line basis over the remaining service period once the PSU award measures are deemed probable of achievement. Share-based compensation expense related to the 2022 and 2023 PSUs granted under the EIP was $
A summary of the status of the Company’s outstanding PSU awards as of December 31, 2023, and changes during the year ended December 31, 2023, are presented below:
|
|
PSUs |
|
|
Weighted- |
|
||
Outstanding at January 1, 2023 |
|
|
|
|
$ |
|
||
2023 PSUs granted |
|
|
|
|
$ |
|
||
Incremental PSUs granted (1) |
|
|
|
|
$ |
|
||
Vested |
|
|
( |
) |
|
$ |
|
|
Forfeited |
|
|
( |
) |
|
$ |
|
|
Outstanding at December 31, 2023 |
|
|
|
|
$ |
|
||
108
The following table summarizes the assumptions used in the Monte Carlo simulation pricing model related to the Successor Company’s PSUs:
|
|
2023 PSUs |
|
|
2022 PSUs |
|
||
Grant date |
|
February 17, 2023 |
|
|
February 16, 2022 |
|
||
Fair value per share on valuation date (1) |
|
$ |
|
|
$ |
|
||
Risk-free interest rate (2) |
|
|
% |
|
|
% |
||
Expected share price volatility (3) |
|
|
% |
|
|
% |
||
Predecessor Company
Prior to the Effective Date, the Company had outstanding awards under the CBL & Associates Properties, Inc. 2012 Stock Incentive Plan ("the 2012 Plan"), which permitted the Company to issue stock options and common stock to selected officers, employees and non-employee directors of the Company up to a total of
Restricted Stock Awards
Under the 2012 Plan, common stock could be awarded either alone, in addition to, or in tandem with other granted stock awards. The compensation committee had the authority to determine eligible persons to whom common stock would be awarded, the number of shares to be awarded and the duration of the vesting period, as defined. Generally, an award of common stock vested either immediately at grant or in equal installments over a period of five years. Stock awarded to independent directors was fully vested upon grant; however, the independent directors could not transfer such shares during their board term. The compensation committee could also provide for the issuance of common stock under the 2012 Plan on a deferred basis pursuant to deferred compensation arrangements. The fair value of common stock awarded under the 2012 Plan was determined based on the market price of CBL’s common stock on the grant date and the related compensation expense was recognized over the vesting period on a straight-line basis.
As of the Effective Date and pursuant to the 2012 Plan, nonvested restricted stock of the Predecessor Company was deemed vested and the 2012 Plan was terminated. A summary of the Predecessor Company’s restricted stock awards as of October 31, 2021, and changes during the period from January 1, 2021 through October 31, 2021, is presented below:
|
|
Shares |
|
|
Weighted- |
|
||
Nonvested at January 1, 2021 |
|
|
|
|
$ |
|
||
Vested |
|
|
( |
) |
|
$ |
|
|
Forfeited |
|
|
( |
) |
|
$ |
|
|
Nonvested at October 31, 2021 |
|
|
— |
|
|
$ |
— |
|
In conjunction with the vesting of the restricted stock on the Effective Date, the Predecessor Company accelerated the share-based compensation cost and recorded $
The total fair value of shares vested during 2021 was $
109
Long-Term Incentive Program
The Predecessor Company had an LTIP (the "Predecessor LTIP") for its named executive officers, which consisted of PSU awards and annual restricted stock awards, that could be issued under the 2012 Plan. The number of shares related to the PSU awards that each named executive officer could receive upon the conclusion of a three-year performance period was determined based on the Company's achievement of specified levels of long-term TSR performance relative to the NAREIT Retail Index, provided that at least a "Threshold" level must be attained for any shares to be earned.
Annual Restricted Stock Awards
Under the Predecessor LTIP, annual restricted stock awards consisted of shares of time-vested restricted stock awarded based on a qualitative evaluation of the performance of the Company and the named executive officer during the fiscal year. Annual restricted stock awards under the Predecessor LTIP, which are included in the totals reflected in the preceding table, vested
Performance Stock Units
The Predecessor Company granted the following PSUs in the first quarter of the respective years. A summary of PSU activity as of October 31, 2021, and changes during the period from January 1, 2021 through October 31, 2021, is presented below:
|
|
PSUs |
|
|
Weighted-Average |
|
||
2019 PSUs granted (1) |
|
|
|
|
$ |
|
||
2020 PSUs granted (2) |
|
|
|
|
$ |
|
||
2020 PSUs cancelled (3) |
|
|
( |
) |
|
$ |
|
|
Outstanding at January 1, 2021 |
|
|
|
|
$ |
|
||
2019 PSUs cancelled (4) |
|
|
( |
) |
|
$ |
|
|
Outstanding at October 31, 2021 |
|
|
— |
|
|
$ |
— |
|
Compensation cost was recognized on a tranche-by-tranche basis using the accelerated attribution method. The resulting expense was recorded regardless of whether any PSU awards were earned as long as the required service period was met.
Share-based compensation expense related to the PSUs was $
NOTE 17. EMPLOYEE BENEFIT PLANS
401(k) Plan
The Management Company maintains a 401(k) profit sharing plan, which is qualified under Section 401(a) and Section 401(k) of the Code to cover employees of the Management Company. All employees who have attained the age of
110
NOTE 18. EMERGENCE FROM VOLUNTARY REORGANIZATION UNDER CHAPTER 11
Voluntary Reorganization Under Chapter 11
On August 18, 2020, the Company entered into a Restructuring Support Agreement, (the “Original RSA”) with the Consenting Noteholders representing in excess of
On October 28, 2020, the Operating Partnership was notified by the administrative agent and lenders that they elected to exercise their rights pursuant to the terms of the secured credit facility to (i) require that rents payable by tenants at the properties that are collateral to the secured credit facility be paid directly to the administrative agent and (ii) exercise all voting rights and other ownership rights in respect of all the equity interests in the subsidiaries of the Operating Partnership that are guarantors of the secured credit facility.
Beginning on November 1, 2020, the Debtors filed the Chapter 11 Cases under Chapter 11 of the Bankruptcy Code in the Bankruptcy Court. The Bankruptcy Court authorized the Debtors to continue to operate their businesses and manage their properties as debtors-in-possession pursuant to the Bankruptcy Code. The Chapter 11 Cases are being jointly administered for procedural purposes only under the caption In re CBL & Associates Properties, Inc., et al., Case No. 20-35226.
The filing of the Chapter 11 Cases constituted an event of default with respect to certain property-level debt of the Operating Partnership’s subsidiaries. See Note 7 and Note 8 for further discussion.
In connection with the Chapter 11 Cases, on August 11, 2021, the Bankruptcy Court entered an order, Docket No.1397 (Confirmation Order), confirming the Plan.
On the Effective Date, the conditions to effectiveness of the Plan were satisfied and the Debtors emerged from the Chapter 11 Cases. The Company filed a notice of the Effective Date of the Plan with the Bankruptcy Court on November 1, 2021.
On the Effective Date, in exchange for their approximately $
On the Effective Date, the Company reserved an additional (i) approximately
On the Effective Date, all prior equity interests of the Company issued and outstanding immediately prior to the Effective Date, including (1) CBL’s common stock, par value $
Registration Rights Agreement
Pursuant to the Plan, on the Effective Date, the Company and certain holders of the newly issued shares of common stock, par value $
111
Pursuant to the registration rights agreement, the Company agreed to file with the SEC an initial shelf registration statement on Form S-11 as soon as practicable after the filing with the SEC of the Company’s Annual Report on Form 10-K for the year ending December 31, 2021 (including any portions thereof that are incorporated by reference into such Form 10-K from the Company’s definitive proxy statement for the Company’s 2022 annual meeting of shareholders), and to use reasonable best efforts to substitute this with a shelf registration on Form S-3 as soon as reasonably practicable following the Company’s becoming eligible to use such form. Any holder or group of holders will have the right to request that the Company include some or all the shares of new common stock held by them, including shares of new common stock issuable upon conversion of the exchangeable notes, in such initial shelf registration statement or shelf registration statement. The Company also agreed to file a “demand” shelf registration statement, or to facilitate a “takedown” of registrable securities in the form of an underwritten offering under any existing shelf registration statement, to the extent that (1) the registrable securities sought to be sold equal at least
On May 6, 2022, the Company filed a resale registration statement on Form S-11 covering the offer and sale, from time to time, of up to
2021 Equity Incentive Plan
Following the Effective Date, the board of directors of the Company adopted the EIP. See Note 16 for additional information.
Fifth Amended and Restated Operating Partnership Agreement
On the Effective Date, under the terms of the Plan, affiliates of the Company entered into a Fifth Amended and Restated Agreement of Limited Partnership for the Operating Partnership (the “New OP Agreement”) with CBL (solely for purposes of acknowledging the provisions thereof) and the remaining holders of the old limited partnership preferred interests (the “Old LP Interests”) who elected to remain limited partners of the Operating Partnership following emergence.
Pursuant to the Plan, the New OP Agreement supersedes and replaces in its entirety the Operating Partnership’s Fourth Amended and Restated Agreement of Limited Partnership, as amended (the “Old OP Agreement”), and all of the common units, special common units and preferred units of limited partnership of the Operating Partnership outstanding under the Old OP Agreement were cancelled and new common units (which, as of the Effective Date, are the only class of equity of the Operating Partnership outstanding) were issued to certain holders, as described in Note 9. The New OP Agreement also eliminated the terms of all the classes of preferred units, as well as all the classes of special common units, that were defined in the Old OP Agreement.
Second Amended and Restated Certificate of Incorporation
In connection with the Company’s reorganization and emergence from its Chapter 11 Proceedings, as provided in the Plan, effective as of the Effective Date, CBL adopted a Second Amended and Restated Certificate of Incorporation (the “Updated COI”), which replaced and superseded the CBL’s Amended and Restated Certificate of Incorporation as it existed immediately prior to the Effective Date (the “Prior COI”), and also adopted the Fourth Amended and Restated Bylaws for CBL (the “Updated Bylaws”), which replaced and superseded CBL’s Third Amended and Restated Bylaws as they existed immediately prior to the Effective Date (the “Prior Bylaws”).
Delisting of Common Stock and Depositary Shares
On November 2, 2020, the NYSE announced that (i) it had suspended trading in the Company’s stock and (ii) it had determined to commence proceedings to delist the Company’s common stock, as well as the depositary shares each representing a 1/10th fractional share of the Company’s
112
CBLAQ, CBLDQ and CBLEQ, respectively. On November 2, 2021, the newly issued common stock of the reorganized company commenced trading on the NYSE under the symbol CBL.
Reorganization Items
Any expenses, gains and losses that were realized or incurred as of or subsequent to November 1, 2020, and as a direct result of the Chapter 11 Cases, were recorded in the line item “Reorganization items, net” in the Company’s consolidated statements of operations. For the Successor year ended December 31, 2022 and the Successor period from November 1, 2021 through December 31, 2021, reorganization items, net, was $
NOTE 19. FRESH START ACCOUNTING
Fresh Start
The reorganization value derived from the range of equity values associated with the Plan was allocated to the Company’s identifiable tangible and intangible assets and liabilities based on their fair values. The Effective Date fair values of the Company’s assets and liabilities differ materially from their recorded values as reflected on the historical balance sheets.
Reorganization Value
Under ASC 852, the Successor determined a value to be assigned to the equity of the emerging entity as of the date of adoption of fresh start accounting. Based on the Company’s revised projections filed with the SEC on a Form 8-K on May 6, 2021, management and its investment bankers reassessed the value of the Company, resulting in an estimated range of shareholders’ equity between $
Management concluded that the best point estimate of shareholders’ equity was $
113
The following table reconciles the enterprise value to the estimated fair value of the Successor’s common shares as of the Effective Date:
Enterprise value, less cash |
|
$ |
|
|
Less: Fair value of noncontrolling interest in consolidated subsidiaries |
|
|
( |
) |
Enterprise value of the Company's interests, less cash |
|
|
|
|
Plus: Cash, cash equivalents and restricted cash |
|
|
|
|
Less: Fair value of mortgage and other indebtedness |
|
|
( |
) |
Less: Fair value of 10% senior secured notes |
|
|
( |
) |
Fair value of Successor total shareholders' equity |
|
$ |
|
|
Shares and units issued upon emergence |
|
|
|
|
Per share value |
|
$ |
|
The following table reconciles the enterprise value to the reorganization value of the Successor’s assets to be allocated to the Company’s individual assets as of the Effective Date:
Enterprise value, less cash |
|
$ |
|
|
Plus: Cash, cash equivalents and restricted cash |
|
|
|
|
Plus: Accounts payable and accrued liabilities |
|
|
|
|
Reorganization value of Successor's assets |
|
$ |
|
The enterprise value and corresponding equity value are dependent upon achieving the future financial results set forth in the Company’s projections, as well as the realization of certain other assumptions. All estimates, assumptions, valuations and financial projections, including the fair value adjustments, the financial projections, the enterprise value and equity value projections, are inherently subject to significant uncertainties and the resolution of contingencies beyond the Company’s control. Accordingly, the Company cannot assure that the estimates, assumptions, valuations or financial projections will be realized and actual results could vary materially.
Real Estate Assets
In developing the fair value estimates for the portfolio of retail properties, all three traditional approaches to valuation were considered including the income approach, the sales comparison (market) approach and the cost approach. These valuation approaches have long been recognized as acceptable in the appropriate circumstances and in valuations of this type. Accordingly, all applicable properties were identified, investigated and examined by the valuation provider along with all intangible assets and liabilities associated with the properties. Furthermore, the valuation provider estimated the fair values and remaining useful lives ("RUL") of the related intangible assets and liabilities at the property-level, as applicable. In most cases, the properties included the following intangible assets/liabilities:
For the valuation of the tangible assets of each property, all pertinent information such as blueprints and drawings, property tax statements, prior appraisals and cost segregation reports were utilized. In terms of methodology, the properties were valued via the income approach in order to estimate building values. Separate values for the underlying land and site improvements were developed via the cost approach. As part of the allocation process, the fair value of the following tangible components was estimated:
114
Investment in Unconsolidated Affiliates
The fair value of the Company’s investment in unconsolidated affiliates for fresh start accounting was determined by valuing the underlying real estate assets associated with each unconsolidated joint venture in the same manner as all real estate assets, described above. The Company then calculated the net asset or liability value of each joint venture by applying the net working capital balance to the fair value of the real estate assets and the amount outstanding under any associated mortgage notes. The percentage of ownership interest in each joint venture was applied to the net asset or liability value which resulted in the fair value of each unconsolidated affiliate. See Note 2 for further information related to the equity method of accounting.
Right-of-Use Assets and Lease Liabilities
The fair value of lease liabilities was measured as the present value of the remaining lease payments, as if the lease were a new lease as of the Effective Date. The Company used its incremental borrowing rate (“IBR”) as the discount rate in determining the present value of the remaining lease payments, which was determined by a third-party valuation advisor using a fundamental credit rating analysis and an implied market yield analysis based on the newly issued secured notes. Based upon the corresponding lease term, the IBR was approximately
Mortgage Notes Payable
The fair value of the mortgage notes payable was estimated by a third-party valuation advisor based on an analysis of the Company’s collateral coverage, financial metrics and interest rate for each mortgage note payable relative to market rates. If there is a reasonable expectation that the debtor will be able to meet the financial obligations of the mortgage note payable, or the mortgage note payable is a recourse loan, then the value of the mortgage note is equal to the present value of the future mortgage note payments discounted at a rate of return commensurate with the risk associated with the mortgage note payments. If the debtor is unable, or if there is uncertainty if the debtor will be able, to meet the financial obligations of the mortgage note, then the value of the mortgage note payable is equal to the expected proceeds to be received through a liquidation of the underlying property at fair value.
Consolidated Balance Sheet
The adjustments included in the following fresh start consolidated balance sheet reflect the effects of the transactions contemplated by the Plan and executed by the Company on the Effective Date (reflected in the column “Reorganization Adjustments”), and fair value and other required accounting adjustments resulting from the adoption of fresh start accounting (reflected in the column “Fresh Start Accounting Adjustments”). The explanatory notes provide additional information regarding the adjustments recorded.
115
|
|
October 31, 2021 |
|
|||||||||||||||
|
|
Predecessor |
|
|
Reorganization |
|
|
|
Fresh Start |
|
|
|
Successor |
|
||||
ASSETS (1) |
|
|
|
|
|
|
|
|
|
|
|
|
|
|
||||
Real estate assets: |
|
|
|
|
|
|
|
|
|
|
|
|
|
|
||||
Land |
|
$ |
|
|
$ |
— |
|
|
|
$ |
( |
) |
(15) |
|
$ |
|
||
Buildings and improvements |
|
|
|
|
|
— |
|
|
|
|
( |
) |
(15) |
|
|
|
||
|
|
|
|
|
|
— |
|
|
|
|
( |
) |
|
|
|
|
||
Accumulated depreciation |
|
|
( |
) |
|
|
— |
|
|
|
|
|
(15) |
|
|
— |
|
|
|
|
|
|
|
|
— |
|
|
|
|
( |
) |
|
|
|
|
||
Developments in progress |
|
|
|
|
|
— |
|
|
|
|
— |
|
|
|
|
|
||
Net investment in real estate assets |
|
|
|
|
|
— |
|
|
|
|
( |
) |
|
|
|
|
||
Cash and cash equivalents |
|
|
|
|
|
( |
) |
(1) |
|
|
— |
|
|
|
|
|
||
Receivables: |
|
|
|
|
|
|
|
|
|
|
|
|
|
|
||||
Tenant |
|
|
|
|
|
— |
|
|
|
|
( |
) |
(16) |
|
|
|
||
Other |
|
|
|
|
|
|
(2) |
|
|
— |
|
|
|
|
|
|||
Mortgage and other notes receivable |
|
|
|
|
|
— |
|
|
|
|
— |
|
|
|
|
|
||
Investments in unconsolidated affiliates |
|
|
|
|
|
— |
|
|
|
|
( |
) |
(17) |
|
|
|
||
In-place leases, net |
|
|
|
|
|
— |
|
|
|
|
|
(18) |
|
|
|
|||
Above market leases, net |
|
|
|
|
|
— |
|
|
|
|
|
(18) |
|
|
|
|||
Intangible lease assets and other assets |
|
|
|
|
|
— |
|
|
|
|
( |
) |
(19) |
|
|
|
||
|
|
$ |
|
|
$ |
( |
) |
|
|
$ |
( |
) |
|
|
$ |
|
||
LIABILITIES, REDEEMABLE NONCONTROLLING INTERESTS AND EQUITY |
|
|
|
|
|
|
|
|
|
|
|
|
|
|
||||
Mortgage and other indebtedness, net |
|
$ |
|
|
$ |
|
(3) |
|
$ |
( |
) |
(20) |
|
$ |
|
|||
10% senior secured notes - at fair value (carrying amount of $ |
|
|
— |
|
|
|
|
(4) |
|
|
— |
|
|
|
|
|
||
Below market leases, net |
|
|
|
|
|
— |
|
|
|
|
|
(18) |
|
|
|
|||
Accounts payable and accrued liabilities |
|
|
|
|
|
( |
) |
(5) |
|
|
( |
) |
(21) |
|
|
|
||
Total liabilities not subject to compromise (1) |
|
|
|
|
|
|
|
|
|
( |
) |
|
|
|
|
|||
|
|
|
|
|
|
|
|
|
|
|
|
|
|
|
||||
Liabilities subject to compromise |
|
|
|
|
|
( |
) |
(6) |
|
|
— |
|
|
|
|
— |
|
|
|
|
|
|
|
|
|
|
|
|
|
|
|
|
|
||||
|
|
|
|
|
|
|
|
|
|
|
|
|
|
|||||
Redeemable noncontrolling interests |
|
|
( |
) |
|
|
|
(7) |
|
|
— |
|
|
|
|
— |
|
|
Shareholders' equity: |
|
|
|
|
|
|
|
|
|
|
|
|
|
|
||||
Successor common stock, $ |
|
|
— |
|
|
|
(8) |
|
|
— |
|
|
|
|
|
|||
Predecessor preferred stock, $ |
|
|
|
|
|
|
|
|
|
|
|
|
|
|
||||
|
|
|
|
|
( |
) |
(9) |
|
|
— |
|
|
|
|
— |
|
||
|
|
|
|
|
( |
) |
(10) |
|
|
— |
|
|
|
|
— |
|
||
Predecessor common stock, $ |
|
|
|
|
|
( |
) |
(11) |
|
|
— |
|
|
|
|
— |
|
|
Additional paid-in capital |
|
|
|
|
|
|
(12) |
|
|
( |
) |
(22) |
|
|
|
|||
Retained earnings (dividends in excess of cumulative earnings) |
|
|
( |
) |
|
|
|
(13) |
|
|
|
(22) |
|
|
— |
|
||
Total shareholders' equity |
|
|
|
|
|
|
|
|
|
( |
) |
|
|
|
|
|||
Noncontrolling interests |
|
|
( |
) |
|
|
|
(14) |
|
|
|
(23) |
|
|
|
|||
Total equity |
|
|
|
|
|
|
|
|
|
( |
) |
|
|
|
|
|||
|
|
$ |
|
|
$ |
( |
) |
|
|
$ |
( |
) |
|
|
$ |
|
||
116
Proceeds from exchangeable notes |
|
$ |
|
|
Payment for the settlement to allowed unsecured claim holders |
|
|
( |
) |
Payment for the settlement of the Predecessor secured credit facility |
|
|
( |
) |
Payment of deferred financing fees for the exit credit agreement |
|
|
( |
) |
Payment of expensed financing fees for the exchangeable notes and the secured notes |
|
|
( |
) |
Payment of professional fees |
|
|
( |
) |
Redemption of secured notes |
|
|
( |
) |
|
|
$ |
( |
) |
Issuance of exit credit agreement |
|
$ |
|
|
Issuance of exchangeable notes |
|
|
|
|
Capitalization of deferred financing costs related to the exit credit agreement |
|
|
( |
) |
|
|
$ |
|
Liabilities subject to compromise |
|
$ |
|
|
Issuance of exit credit agreement |
|
|
( |
) |
Issuance of secured notes |
|
|
( |
) |
Equity issued on the Effective Date in settlement of liabilities subject to compromise |
|
|
( |
) |
Payment to various creditors |
|
|
( |
) |
Gain on settlement of liabilities subject to compromise |
|
$ |
|
Conversion of Predecessor equity |
|
$ |
|
|
Cancellation of Predecessor common stock |
|
|
( |
) |
Net change in Predecessor common stock |
|
$ |
( |
) |
Issuance of Successor common stock to creditors |
|
$ |
|
|
Issuance of Successor common stock to Predecessor equity holders |
|
|
( |
) |
Cancellation of Predecessor common stock and preferred stock |
|
|
|
|
Other adjustments |
|
|
( |
) |
|
|
$ |
|
Gain on settlement of liabilities subject to compromise |
|
$ |
|
|
Payment of certain professional fees |
|
|
( |
) |
|
|
$ |
|
117
Intangible lease assets |
|
$ |
( |
) |
Corporate assets |
|
|
|
|
Right-of-use lease assets |
|
|
( |
) |
|
|
$ |
( |
) |
Investment in unconsolidated affiliates |
|
$ |
( |
) |
Write-off of deferred revenue |
|
|
( |
) |
Lease liabilities |
|
|
( |
) |
|
|
$ |
( |
) |
NOTE 20. SUBSEQUENT EVENTS
In February 2024, the Company redeemed U.S. Treasury securities and used the proceeds to payoff the $
On February 12, 2024, the Company's board of directors declared a $
In February 2024, the Company repurchased
118
Schedule III
CBL & ASSOCIATES PROPERTIES, INC.
REAL ESTATE ASSETS AND ACCUMULATED DEPRECIATION
At December 31, 2023
(In thousands)
|
|
|
|
|
Initial Cost (1) |
|
|
|
|
|
|
|
|
|
|
|
Gross Carry Amounts at Close of Period |
|
|
|
||||||||||||||||||||||
Description /Location |
|
Encumbrances |
|
|
Land |
|
|
Buildings |
|
|
Costs |
|
|
Sales of |
|
|
Fresh Start |
|
|
Land |
|
|
Buildings |
|
|
Total (3) |
|
|
Accumulated |
|
|
Date of |
||||||||||
MALLS: |
|
|
|
|
|
|
|
|
|
|
|
|
|
|
|
|
|
|
|
|
|
|
|
|
|
|
|
|
|
|
|
|
||||||||||
Alamance Crossing West |
|
$ |
|
|
$ |
|
|
$ |
|
|
$ |
|
|
$ |
( |
) |
|
$ |
( |
) |
|
$ |
|
|
$ |
|
|
$ |
|
|
$ |
( |
) |
|
2007 |
|||||||
Arbor Place |
|
|
|
|
|
|
|
|
|
|
|
|
|
|
— |
|
|
|
( |
) |
|
|
|
|
|
|
|
|
|
|
|
( |
) |
|
1998-1999 |
|||||||
Brookfield Square |
|
|
|
|
|
|
|
|
|
|
|
|
|
|
( |
) |
|
|
( |
) |
|
|
|
|
|
|
|
|
|
|
|
( |
) |
|
2001 |
|||||||
CherryVale Mall |
|
|
— |
|
(5) |
|
|
|
|
|
|
|
|
|
|
( |
) |
|
|
( |
) |
|
|
|
|
|
|
|
|
|
|
|
( |
) |
|
2001 |
||||||
Cross Creek Mall |
|
|
|
|
|
|
|
|
|
|
|
|
|
|
— |
|
|
|
( |
) |
|
|
|
|
|
|
|
|
|
|
|
( |
) |
|
2003 |
|||||||
Dakota Square Mall |
|
|
— |
|
|
|
|
|
|
|
|
|
|
|
|
— |
|
|
|
( |
) |
|
|
|
|
|
|
|
|
|
|
|
( |
) |
|
2012 |
||||||
East Towne Mall |
|
|
— |
|
(5) |
|
|
|
|
|
|
|
|
|
|
( |
) |
|
|
( |
) |
|
|
|
|
|
|
|
|
|
|
|
( |
) |
|
2002 |
||||||
Eastland Mall |
|
|
— |
|
|
|
|
|
|
|
|
|
( |
) |
|
|
( |
) |
|
|
( |
) |
|
|
|
|
|
|
|
|
|
|
|
( |
) |
|
2005 |
|||||
Fayette Mall |
|
|
|
|
|
|
|
|
|
|
|
|
|
|
— |
|
|
|
( |
) |
|
|
|
|
|
|
|
|
|
|
|
( |
) |
|
2001 |
|||||||
Frontier Mall |
|
|
— |
|
(5) |
|
|
|
|
|
|
|
|
|
|
( |
) |
|
|
( |
) |
|
|
|
|
|
|
|
|
|
|
|
( |
) |
|
1984-1985 |
||||||
Hamilton Place |
|
|
|
|
|
|
|
|
|
|
|
|
|
|
( |
) |
|
|
( |
) |
|
|
|
|
|
|
|
|
|
|
|
( |
) |
|
1986-1987 |
|||||||
Hanes Mall |
|
|
— |
|
(5) |
|
|
|
|
|
|
|
|
|
|
( |
) |
|
|
( |
) |
|
|
|
|
|
|
|
|
|
|
|
( |
) |
|
2001 |
||||||
Harford Mall |
|
|
— |
|
|
|
|
|
|
|
|
|
|
|
|
— |
|
|
|
( |
) |
|
|
|
|
|
|
|
|
|
|
|
( |
) |
|
2003 |
||||||
Imperial Valley Mall |
|
|
— |
|
(5) |
|
|
|
|
|
|
|
|
|
|
— |
|
|
|
( |
) |
|
|
|
|
|
|
|
|
|
|
|
( |
) |
|
2012 |
||||||
Jefferson Mall |
|
|
|
|
|
|
|
|
|
|
|
|
|
|
( |
) |
|
|
( |
) |
|
|
|
|
|
|
|
|
|
|
|
( |
) |
|
2001 |
|||||||
Kirkwood Mall |
|
|
— |
|
(5) |
|
|
|
|
|
|
|
|
|
|
— |
|
|
|
( |
) |
|
|
|
|
|
|
|
|
|
|
|
( |
) |
|
2012 |
||||||
Laurel Park Place |
|
|
— |
|
|
|
|
|
|
|
|
|
( |
) |
|
|
— |
|
|
|
( |
) |
|
|
|
|
|
|
|
|
|
|
|
( |
) |
|
2005 |
|||||
Layton Hills Mall |
|
|
— |
|
(5) |
|
|
|
|
|
|
|
( |
) |
|
|
( |
) |
|
|
( |
) |
|
|
|
|
|
|
|
|
|
|
|
( |
) |
|
2005 |
|||||
Mall del Norte |
|
|
— |
|
(5) |
|
|
|
|
|
|
|
|
|
|
( |
) |
|
|
( |
) |
|
|
|
|
|
|
|
|
|
|
|
( |
) |
|
2004 |
||||||
119
Schedule III
CBL & ASSOCIATES PROPERTIES, INC.
REAL ESTATE ASSETS AND ACCUMULATED DEPRECIATION
At December 31, 2023
(In thousands)
|
|
|
|
|
Initial Cost (1) |
|
|
|
|
|
|
|
|
|
|
|
Gross Carry Amounts at Close of Period |
|
|
|
||||||||||||||||||||||
Description /Location |
|
Encumbrances |
|
|
Land |
|
|
Buildings |
|
|
Costs |
|
|
Sales of |
|
|
Fresh Start |
|
|
Land |
|
|
Buildings |
|
|
Total (3) |
|
|
Accumulated |
|
|
Date of |
||||||||||
Mayfaire Town Center |
|
$ |
— |
|
(5) |
$ |
|
|
$ |
|
|
$ |
|
|
$ |
— |
|
|
$ |
( |
) |
|
$ |
|
|
$ |
|
|
$ |
|
|
$ |
( |
) |
|
2015 |
||||||
Meridian Mall |
|
|
— |
|
|
|
|
|
|
|
|
|
|
|
|
— |
|
|
|
( |
) |
|
|
|
|
|
|
|
|
|
|
|
( |
) |
|
1998 |
||||||
Mid Rivers Mall |
|
|
— |
|
|
|
|
|
|
|
|
|
( |
) |
|
|
( |
) |
|
|
( |
) |
|
|
|
|
|
|
|
|
|
|
|
( |
) |
|
2007 |
|||||
Monroeville Mall |
|
|
— |
|
|
|
|
|
|
|
|
|
( |
) |
|
|
— |
|
|
|
( |
) |
|
|
|
|
|
|
|
|
|
|
|
( |
) |
|
2004 |
|||||
Northgate Mall |
|
|
— |
|
(5) |
|
|
|
|
|
|
|
|
|
|
( |
) |
|
|
( |
) |
|
|
|
|
|
|
|
|
|
|
|
( |
) |
|
2011 |
||||||
Northpark Mall |
|
|
— |
|
|
|
|
|
|
|
|
|
|
|
|
— |
|
|
|
( |
) |
|
|
|
|
|
|
|
|
|
|
|
( |
) |
|
2004 |
||||||
Northwoods Mall |
|
|
|
|
|
|
|
|
|
|
|
|
|
|
( |
) |
|
|
( |
) |
|
|
|
|
|
|
|
|
|
|
|
( |
) |
|
2001 |
|||||||
Old Hickory Mall |
|
|
— |
|
|
|
|
|
|
|
|
|
( |
) |
|
|
( |
) |
|
|
( |
) |
|
|
|
|
|
|
|
|
|
|
|
( |
) |
|
2001 |
|||||
The Outlet Shoppes at Gettysburg |
|
|
|
|
|
|
|
|
|
|
|
( |
) |
|
|
— |
|
|
|
( |
) |
|
|
|
|
|
|
|
|
|
|
|
( |
) |
|
2012 |
||||||
The Outlet Shoppes at Laredo |
|
|
|
|
|
|
|
|
|
|
|
( |
) |
|
|
— |
|
|
|
( |
) |
|
|
|
|
|
|
|
|
|
|
|
( |
) |
|
2017 |
||||||
Parkdale Mall and Crossing |
|
|
|
|
|
|
|
|
|
|
|
( |
) |
|
|
( |
) |
|
|
( |
) |
|
|
|
|
|
|
|
|
|
|
|
( |
) |
|
2001 |
||||||
Parkway Place |
|
|
— |
|
|
|
|
|
|
|
|
|
|
|
|
— |
|
|
|
( |
) |
|
|
|
|
|
|
|
|
|
|
|
( |
) |
|
2010 |
||||||
Pearland Town Center |
|
|
— |
|
(5) |
|
|
|
|
|
|
|
|
|
|
( |
) |
|
|
( |
) |
|
|
|
|
|
|
|
|
|
|
|
( |
) |
|
2008 |
||||||
Post Oak Mall |
|
|
— |
|
(5) |
|
|
|
|
|
|
|
|
|
|
( |
) |
|
|
( |
) |
|
|
|
|
|
|
|
|
|
|
|
( |
) |
|
1984-1985 |
||||||
Richland Mall |
|
|
— |
|
(5) |
|
|
|
|
|
|
|
|
|
|
( |
) |
|
|
( |
) |
|
|
|
|
|
|
|
|
|
|
|
( |
) |
|
2002 |
||||||
South County Center |
|
|
— |
|
|
|
|
|
|
|
|
|
|
|
|
— |
|
|
|
( |
) |
|
|
|
|
|
|
|
|
|
|
|
( |
) |
|
2007 |
||||||
Southaven Towne Center |
|
|
— |
|
(5) |
|
|
|
|
|
|
|
|
|
|
— |
|
|
|
( |
) |
|
|
|
|
|
|
|
|
|
|
|
( |
) |
|
2005 |
||||||
Southpark Mall |
|
|
|
|
|
|
|
|
|
|
|
|
|
|
— |
|
|
|
( |
) |
|
|
|
|
|
|
|
|
|
|
|
( |
) |
|
2003 |
|||||||
St. Clair Square |
|
|
— |
|
|
|
|
|
|
|
|
|
|
|
|
— |
|
|
|
( |
) |
|
|
|
|
|
|
|
|
|
|
|
( |
) |
|
1996 |
||||||
Stroud Mall |
|
|
— |
|
|
|
|
|
|
|
|
|
( |
) |
|
|
— |
|
|
|
( |
) |
|
|
|
|
|
|
|
|
|
|
|
( |
) |
|
1998 |
|||||
Sunrise Mall |
|
|
— |
|
(5) |
|
|
|
|
|
|
|
|
|
|
— |
|
|
|
( |
) |
|
|
|
|
|
|
|
|
|
|
|
( |
) |
|
2003 |
||||||
Turtle Creek Mall |
|
|
— |
|
(5) |
|
|
|
|
|
|
|
|
|
|
— |
|
|
|
( |
) |
|
|
|
|
|
|
|
|
|
|
|
( |
) |
|
1993-1995 |
||||||
Valley View Mall |
|
|
— |
|
(5) |
|
|
|
|
|
|
|
|
|
|
— |
|
|
|
( |
) |
|
|
|
|
|
|
|
|
|
|
|
( |
) |
|
2003 |
||||||
120
Schedule III
CBL & ASSOCIATES PROPERTIES, INC.
REAL ESTATE ASSETS AND ACCUMULATED DEPRECIATION
At December 31, 2023
(In thousands)
|
|
|
|
|
Initial Cost (1) |
|
|
|
|
|
|
|
|
|
|
|
Gross Carry Amounts at Close of Period |
|
|
|
||||||||||||||||||||||
Description /Location |
|
Encumbrances |
|
|
Land |
|
|
Buildings |
|
|
Costs |
|
|
Sales of |
|
|
Fresh Start |
|
|
Land |
|
|
Buildings |
|
|
Total (3) |
|
|
Accumulated |
|
|
Date of |
||||||||||
Volusia Mall |
|
$ |
|
|
$ |
|
|
$ |
|
|
$ |
|
|
$ |
( |
) |
|
$ |
( |
) |
|
$ |
|
|
$ |
|
|
$ |
|
|
$ |
( |
) |
|
2004 |
|||||||
West Towne Mall |
|
|
— |
|
(5) |
|
|
|
|
|
|
|
|
|
|
— |
|
|
|
( |
) |
|
|
|
|
|
|
|
|
|
|
|
( |
) |
|
2002 |
||||||
Westmoreland Mall |
|
|
— |
|
(5) |
|
|
|
|
|
|
|
|
|
|
( |
) |
|
|
( |
) |
|
|
|
|
|
|
|
|
|
|
|
( |
) |
|
2002 |
||||||
York Galleria |
|
|
— |
|
|
|
|
|
|
|
|
|
|
|
|
— |
|
|
|
( |
) |
|
|
|
|
|
|
|
|
|
|
|
( |
) |
|
1995 |
||||||
OTHER PROPERTIES: |
|
|
|
|
|
|
|
|
|
|
|
|
|
|
|
|
|
|
|
|
|
|
|
|
|
|
|
|
|
|
|
|
||||||||||
840 Greenbrier Circle |
|
|
— |
|
|
|
|
|
|
|
|
|
|
|
|
— |
|
|
|
( |
) |
|
|
|
|
|
|
|
|
|
|
|
( |
) |
|
2007 |
||||||
Annex at Monroeville |
|
|
— |
|
|
|
— |
|
|
|
|
|
|
|
|
|
— |
|
|
|
( |
) |
|
|
|
|
|
|
|
|
|
|
|
( |
) |
|
2004 |
|||||
CBL Center |
|
|
— |
|
|
|
|
|
|
|
|
|
|
|
|
— |
|
|
|
( |
) |
|
|
|
|
|
|
|
|
|
|
|
( |
) |
|
2001 |
||||||
CBL Center II |
|
|
— |
|
|
|
|
|
|
|
|
|
|
|
|
— |
|
|
|
( |
) |
|
|
|
|
|
|
|
|
|
|
|
( |
) |
|
2008 |
||||||
CoolSprings Crossing |
|
|
|
|
|
|
|
|
|
|
|
( |
) |
|
|
— |
|
|
|
( |
) |
|
|
|
|
|
|
|
|
|
|
|
( |
) |
|
1991-1993 |
||||||
CoolSprings JC Penney |
|
|
— |
|
|
|
|
|
|
|
|
|
— |
|
|
|
— |
|
|
|
— |
|
|
|
|
|
|
|
|
|
|
|
|
( |
) |
|
2022 |
|||||
Courtyard at Hickory Hollow |
|
|
|
|
|
|
|
|
|
|
|
|
|
|
( |
) |
|
|
( |
) |
|
|
|
|
|
|
|
|
|
|
|
( |
) |
|
1998 |
|||||||
Frontier Square |
|
|
|
|
|
|
|
|
|
|
|
|
|
|
( |
) |
|
|
|
|
|
|
|
|
|
|
|
|
|
|
( |
) |
|
1985 |
||||||||
Gunbarrel Pointe |
|
|
|
|
|
|
|
|
|
|
|
|
|
|
— |
|
|
|
( |
) |
|
|
|
|
|
|
|
|
|
|
|
( |
) |
|
2000 |
|||||||
Hamilton Corner |
|
|
|
|
|
|
|
|
|
|
|
|
|
|
— |
|
|
|
( |
) |
|
|
|
|
|
|
|
|
|
|
|
( |
) |
|
1986-1987 |
|||||||
Hamilton Crossing |
|
|
|
|
|
|
|
|
|
|
|
|
|
|
( |
) |
|
|
( |
) |
|
|
|
|
|
|
|
|
|
|
|
( |
) |
|
1987 |
|||||||
Harford Annex |
|
|
|
|
|
|
|
|
|
|
|
|
|
|
— |
|
|
|
( |
) |
|
|
|
|
|
|
|
|
|
|
|
( |
) |
|
2003 |
|||||||
The Landing at Arbor Place |
|
|
|
|
|
|
|
|
|
|
|
|
|
|
( |
) |
|
|
( |
) |
|
|
|
|
|
|
|
|
|
|
|
( |
) |
|
1998-1999 |
|||||||
Layton Convenience Center |
|
|
— |
|
(5) |
|
— |
|
|
|
|
|
|
|
|
|
— |
|
|
|
|
|
|
|
|
|
|
|
|
|
|
|
( |
) |
|
2005 |
||||||
Layton Hills Plaza |
|
|
— |
|
(5) |
|
— |
|
|
|
|
|
|
|
|
|
— |
|
|
|
|
|
|
|
|
|
|
|
|
|
|
|
( |
) |
|
2005 |
||||||
Parkdale Corner |
|
|
|
|
|
|
|
|
|
|
|
|
|
|
— |
|
|
|
( |
) |
|
|
|
|
|
|
|
|
|
|
|
( |
) |
|
2002 |
|||||||
Pearland Office |
|
|
— |
|
(5) |
|
— |
|
|
|
|
|
|
|
|
|
— |
|
|
|
( |
) |
|
|
— |
|
|
|
|
|
|
|
|
|
( |
) |
|
2009 |
||||
The Plaza at Fayette |
|
|
|
|
|
|
|
|
|
|
|
|
|
|
— |
|
|
|
( |
) |
|
|
|
|
|
|
|
|
|
|
|
( |
) |
|
2006 |
|||||||
121
Schedule III
CBL & ASSOCIATES PROPERTIES, INC.
REAL ESTATE ASSETS AND ACCUMULATED DEPRECIATION
At December 31, 2023
(In thousands)
|
|
|
|
|
Initial Cost (1) |
|
|
|
|
|
|
|
|
|
|
|
Gross Carry Amounts at Close of Period |
|
|
|
||||||||||||||||||||||
Description /Location |
|
Encumbrances |
|
|
Land |
|
|
Buildings |
|
|
Costs |
|
|
Sales of |
|
|
Fresh Start |
|
|
Land |
|
|
Buildings |
|
|
Total (3) |
|
|
Accumulated |
|
|
Date of |
||||||||||
The Promenade D'lberville |
|
$ |
— |
|
|
$ |
|
|
$ |
|
|
$ |
|
|
$ |
( |
) |
|
$ |
( |
) |
|
$ |
|
|
$ |
|
|
$ |
|
|
$ |
( |
) |
|
2009 |
||||||
The Shoppes at Hamilton Place |
|
|
|
|
|
|
|
|
|
|
|
|
|
|
— |
|
|
|
( |
) |
|
|
|
|
|
|
|
|
|
|
|
( |
) |
|
2003 |
|||||||
The Shoppes at St. Clair Square |
|
|
|
|
|
|
|
|
|
|
|
|
|
|
( |
) |
|
|
( |
) |
|
|
|
|
|
|
|
|
|
|
|
( |
) |
|
2007 |
|||||||
Sunrise Commons |
|
|
|
|
|
|
|
|
|
|
|
|
|
|
— |
|
|
|
( |
) |
|
|
|
|
|
|
|
|
|
|
|
( |
) |
|
2003 |
|||||||
The Terrace |
|
|
|
|
|
|
|
|
|
|
|
|
|
|
— |
|
|
|
( |
) |
|
|
|
|
|
|
|
|
|
|
|
( |
) |
|
1997 |
|||||||
West Towne Crossing |
|
|
|
|
|
|
|
|
|
|
|
|
|
|
— |
|
|
|
|
|
|
|
|
|
|
|
|
|
|
|
( |
) |
|
1998 |
||||||||
WestGate Crossing |
|
|
|
|
|
|
|
|
|
|
|
|
|
|
— |
|
|
|
( |
) |
|
|
|
|
|
|
|
|
|
|
|
( |
) |
|
1997 |
|||||||
Westmoreland Crossing |
|
|
— |
|
(5) |
|
|
|
|
|
|
|
|
|
|
— |
|
|
|
( |
) |
|
|
|
|
|
|
|
|
|
|
|
( |
) |
|
2002 |
||||||
OUTPARCELS: |
|
|
|
|
|
|
|
|
|
|
|
|
|
|
|
|
|
— |
|
|
|
|
|
|
|
|
|
— |
|
|
|
|
|
|
||||||||
Outparcel properties |
|
|
|
|
|
|
|
|
|
|
|
|
|
|
— |
|
|
|
|
|
|
|
|
|
|
|
|
|
|
|
( |
) |
|
Various |
||||||||
DISPOSITIONS: |
|
|
|
|
|
|
|
|
|
|
|
|
|
|
|
|
|
|
|
|
|
|
|
|
|
|
— |
|
|
|
|
|
|
|||||||||
Westgate Mall |
|
|
— |
|
|
|
|
|
|
|
|
|
|
|
|
( |
) |
|
|
( |
) |
|
|
— |
|
|
|
— |
|
|
|
— |
|
|
|
— |
|
|
1995 |
|||
Alamance Crossing |
|
|
— |
|
|
|
|
|
|
|
|
|
|
|
|
( |
) |
|
|
( |
) |
|
|
— |
|
|
|
— |
|
|
|
— |
|
|
|
— |
|
|
2007 |
|||
Other |
|
|
— |
|
|
|
|
|
|
|
|
|
( |
) |
|
|
( |
) |
|
|
|
|
|
|
|
|
|
|
|
|
|
|
( |
) |
|
Various |
||||||
Developments in progress consisting of construction and development properties |
|
|
— |
|
|
|
— |
|
|
|
— |
|
|
|
|
|
|
— |
|
|
|
— |
|
|
|
— |
|
|
|
|
|
|
|
|
|
— |
|
|
|
|||
TOTALS |
|
$ |
|
|
$ |
|
|
$ |
|
|
$ |
|
|
$ |
( |
) |
|
$ |
( |
) |
|
$ |
|
|
$ |
|
|
$ |
|
|
$ |
( |
) |
|
|
|||||||
122
Schedule III
CBL & ASSOCIATES PROPERTIES, INC.
REAL ESTATE ASSETS AND ACCUMULATED DEPRECIATION
At December 31, 2023
(In thousands)
The changes in real estate assets and accumulated depreciation for the Successor years ended December 31, 2023 and 2022, the Successor period ended December 31, 2021 and the Predecessor period ended October 31, 2021 (in thousands):
|
|
Successor |
|
|
|
Predecessor |
|
||||||||||
|
|
As of December 31, |
|
|
|
As of October 31, |
|
||||||||||
|
|
2023 |
|
|
2022 |
|
|
2021 |
|
|
|
2021 |
|
||||
REAL ESTATE ASSETS: |
|
|
|
|
|
|
|
|
|
|
|
|
|
||||
Balance at beginning of period |
|
$ |
|
|
$ |
|
|
$ |
|
|
|
$ |
|
||||
Additions during the period: |
|
|
|
|
|
|
|
|
|
|
|
|
|
||||
Additions and improvements |
|
|
|
|
|
|
|
|
|
|
|
|
|
||||
Acquisitions of real estate assets |
|
|
— |
|
|
|
|
|
|
— |
|
|
|
|
— |
|
|
Deductions during the period: |
|
|
|
|
|
|
|
|
|
|
|
|
|
||||
Disposals, deconsolidations and accumulated depreciation on impairments |
|
|
( |
) |
|
|
( |
) |
|
|
( |
) |
|
|
|
( |
) |
Fresh start accounting adjustments |
|
|
— |
|
|
|
— |
|
|
|
— |
|
|
|
|
( |
) |
Transfers from real estate assets |
|
|
— |
|
|
|
( |
) |
|
|
— |
|
|
|
|
( |
) |
Impairment of real estate assets |
|
|
— |
|
|
|
— |
|
|
|
— |
|
|
|
|
( |
) |
Balance at end of period |
|
$ |
|
|
$ |
|
|
$ |
|
|
|
$ |
|
||||
|
|
|
|
|
|
|
|
|
|
|
|
|
|
||||
ACCUMULATED DEPRECIATION: |
|
|
|
|
|
|
|
|
|
|
|
|
|
||||
Balance at beginning of period |
|
$ |
|
|
$ |
|
|
$ |
— |
|
|
|
$ |
|
|||
Depreciation expense |
|
|
|
|
|
|
|
|
|
|
|
|
|
||||
Fresh start accounting adjustments |
|
|
— |
|
|
|
— |
|
|
|
— |
|
|
|
|
( |
) |
Transfers from real estate assets |
|
|
— |
|
|
|
|
|
|
— |
|
|
|
|
— |
|
|
Accumulated depreciation on real estate assets sold, retired, deconsolidated or impaired |
|
|
( |
) |
|
|
( |
) |
|
|
( |
) |
|
|
|
( |
) |
Balance at end of period |
|
$ |
|
|
$ |
|
|
$ |
|
|
|
$ |
— |
|
|||
123
Schedule IV
CBL & ASSOCIATES PROPERTIES, INC.
MORTGAGE NOTES RECEIVABLE ON REAL ESTATE
At December 31, 2023
(In thousands)
The changes in mortgage notes receivable were as follows (in thousands):
|
|
Successor |
|
|
|
Predecessor |
|
||||||||||
|
|
Year Ended December 31, |
|
|
Period from November 1, 2021 through December 31, |
|
|
|
Period from January 1, 2021 through October 31, |
|
|||||||
|
|
2023 |
|
|
2022 |
|
|
2021 |
|
|
|
2021 |
|
||||
Beginning balance |
|
$ |
— |
|
|
$ |
— |
|
|
$ |
— |
|
|
|
$ |
|
|
Payments |
|
|
— |
|
|
|
— |
|
|
|
— |
|
|
|
|
— |
|
Write-Offs |
|
|
— |
|
|
|
— |
|
|
|
— |
|
|
|
|
( |
) |
Ending balance |
|
$ |
— |
|
|
$ |
— |
|
|
$ |
— |
|
|
|
$ |
— |
|
124
EXHIBIT INDEX
Exhibit Number |
|
Description |
2.1 |
|
|
|
|
|
2.2 |
|
|
|
|
|
2.3 |
|
|
|
|
|
3.1 |
|
|
|
|
|
3.2 |
|
|
|
|
|
3.3 |
|
|
|
|
|
4.1 |
|
See Second Amended and Restated Certificate of Incorporation of the CBL & Associates Properties, Inc and Fifth Amended and Restated Bylaws of CBL & Associates Properties, Inc relating to the Common Stock, Exhibits 3.1 and 3.2 above. |
|
|
|
4.2 |
|
|
|
|
|
4.3 |
|
|
|
|
|
10.1 |
|
|
|
|
|
10.2.1 |
|
|
|
|
|
10.2.2 |
|
|
|
|
|
10.2.3 |
|
|
|
|
|
10.2.4 |
|
|
|
|
|
10.2.5 |
|
125
Exhibit Number |
|
Description |
|
|
|
10.2.6 |
|
|
|
|
|
10.2.7 |
|
|
|
|
|
10.2.8 |
|
|
|
|
|
10.2.9 |
|
|
|
|
|
10.2.10 |
|
|
|
|
|
10.2.11 |
|
|
|
|
|
10.2.12 |
|
|
|
|
|
10.2.13 |
|
|
|
|
|
10.2.14 |
|
|
|
|
|
10.2.15 |
|
|
|
|
|
10.2.16 |
|
|
|
|
|
10.2.17 |
|
|
|
|
|
10.2.18 |
|
|
|
|
|
10.2.19 |
|
|
|
|
|
126
Exhibit Number |
|
Description |
10.2.20 |
|
|
|
|
|
10.2.21 |
|
|
|
|
|
10.3 |
|
|
|
|
|
10.4.1 |
|
|
|
|
|
10.4.2 |
|
|
|
|
|
10.5 |
|
Option Agreement relating to Outparcels (incorporated by reference to Post-Effective Amendment No. 1 to the Company's Registration Statement on Form S-11 (No. 33-67372), as filed with the Commission on January 27, 1994. Exhibit originally filed in paper format and as such, a hyperlink is not available). |
|
|
|
10.6.1 |
|
|
|
|
|
10.6.2 |
|
|
|
|
|
10.6.3 |
|
|
|
|
|
10.6.4 |
|
|
|
|
|
10.6.5 |
|
|
|
|
|
10.6.6 |
|
|
|
|
|
10.6.7 |
|
|
|
|
|
127
Exhibit Number |
|
Description |
10.6.8 |
|
|
|
|
|
10.7 |
|
|
|
|
|
10.8.1 |
|
|
|
|
|
10.8.2 |
|
|
|
|
|
10.8.3 |
|
|
|
|
|
10.9 |
|
|
|
|
|
10.10 |
|
|
|
|
|
10.11 |
|
|
|
|
|
10.12.1 |
|
|
|
|
|
10.12.2 |
|
|
|
|
|
10.12.3 |
|
|
|
|
|
21 |
|
|
|
|
|
23 |
|
|
|
|
|
24 |
|
|
|
|
|
31.1 |
|
|
|
|
|
128
Exhibit Number |
|
Description |
31.2 |
|
|
|
|
|
32.1 |
|
|
|
|
|
32.2 |
|
|
|
|
|
97 |
|
CBL & Associates Properties, Inc. Amended and Restated Clawback Policy |
|
|
|
101.INS |
|
XBRL Instance Document - the instance document does not appear in the Interactive Data File because its XBRL tags are embedded within the Inline XBRL document. (Filed herewith.) |
|
|
|
101.SCH |
|
Inline XBRL Taxonomy Extension Schema With Embedded Linkbase Documents. (Filed herewith.) |
|
|
|
104 |
|
Cover Page Interactive Data File (formatted as Inline XBRL with applicable taxonomy extension information contained in Exhibits 101.*). (Filed herewith.) |
† A management contract or compensatory plan or arrangement required to be filed pursuant to Item 15(b) of this report.
129
SIGNATURES
Pursuant to the requirements of Section 13 or 15(d) of the Securities Exchange Act of 1934, the Registrant has duly caused this report to be signed on its behalf by the undersigned, thereunto duly authorized.
CBL & ASSOCIATES PROPERTIES, INC. |
|
(Registrant) |
|
|
|
By: |
/s/ Benjamin W. Jaenicke |
|
Benjamin W. Jaenicke |
|
Executive Vice President - Chief Financial Officer |
Dated: February 29, 2024
Pursuant to the requirements of the Securities Exchange Act of 1934, this report has been signed below by the following persons on behalf of the Registrant and in the capacities and on the dates indicated.
Signature |
|
Title |
|
Date |
|
|
|
|
|
/s/ David J. Contis* |
|
Chairman of the Board |
|
February 29, 2024 |
David J. Contis |
|
|
|
|
|
|
|
|
|
/s/ Stephen D. Lebovitz |
|
Director and Chief Executive Officer (Principal Executive Officer) |
|
February 29, 2024 |
Stephen D. Lebovitz |
|
|
|
|
|
|
|
|
|
/s/ Benjamin W. Jaenicke |
|
Executive Vice President - Chief Financial Officer (Principal Financial Officer and Principal Accounting Officer) |
|
February 29, 2024 |
Benjamin W. Jaenicke |
|
|
|
|
|
|
|
|
|
/s/ Marjorie L. Bowen* |
|
Director |
|
February 29, 2024 |
Marjorie L. Bowen |
|
|
|
|
|
|
|
|
|
/s/ David M. Fields* |
|
Director
|
|
February 29, 2024 |
David M. Fields
|
|
|
|
|
/s/ Jeffrey Kivitz* |
|
Director |
|
February 29, 2024 |
Jeffrey Kivitz
|
|
|
|
|
/s/ Robert G. Gifford* |
|
Director |
|
February 29, 2024 |
Robert G. Gifford |
|
|
|
|
/s/ Michael A. Torres* |
|
Director |
|
February 29, 2024 |
Michael A. Torres |
|
|
|
|
|
|
|
|
|
*By: /s/ Benjamin W. Jaenicke |
|
Attorney-in-Fact |
|
February 29, 2024 |
Benjamin W. Jaenicke |
|
|
|
130