Table of Contents
REGISTRATION STATEMENT PURSUANT TO SECTION 12(b) OR (g) OF THE SECURITIES EXCHANGE ACT OF 1934 |
ANNUAL REPORT PURSUANT TO SECTION 13 OR 15(d) OF THE SECURITIES EXCHANGE ACT OF 1934 |
TRANSITION REPORT PURSUANT TO SECTION 13 OR 15(d) OF THE SECURITIES EXCHANGE ACT OF 1934 |
SHELL COMPANY REPORT PURSUANT TO SECTION 13 OR 15(d) OF THE SECURITIES EXCHANGE ACT OF 1934 |
Title of each class |
Name of each exchange on which registered | |
| Ordinary H Shares of par value RMB1.00 per share represented by American Depositary Shares |
N/A* |
| * | On January 23, 2023, the Company filed a Form 25 to delist its American Depositary Shares from the New York Stock Exchange. The delisting became effective on February 3, 2023, and the American Depositary Receipt program was terminated o n March 6, 2023. |
☒ |
Accelerated filer |
☐ |
Non-accelerated filer |
☐ |
Emerging growth company |
U.S. GAAP ☐ |
|
Other ☐ | ||||||
| by the International Accounting Standards Board ☒ |
Table of Contents
TABLE OF CONTENTS
i
Table of Contents
ii
Table of Contents
FORWARD-LOOKING STATEMENTS
This Annual Report includes forward-looking statements for the purpose of the safe harbor provided by Section 27A of the Securities Act of 1933 and Section 21E of the Securities Exchange Act of 1934, or the Exchange Act. These statements appear in a number of different places in this Annual Report. A forward-looking statement is usually identified by the use in this Annual Report of certain terminology such as “estimate”, “project”, “expect”, “intend”, “believe”, “plan”, “anticipate”, “may”, or their negatives or other comparable words. Also look for discussions of strategy that involve risks and uncertainties. Forward-looking statements include statements regarding the outlook for our future operations, forecasts of future costs and expenditures, evaluation of market conditions, the outcome of legal proceedings (if any), the adequacy of reserves, and other business plans. Forward-looking statements are, by their nature, subject to inherent risks and uncertainties, some of which are beyond our control, and are based on assumptions and analyses made by us in light of our experience and our perception of historical trends, current conditions and expected future developments, as well as other factors we believe are appropriate in particular circumstances. We caution you that a number of risks and assumptions could cause actual outcomes to differ, or differ materially, from those expressed in any forward-looking statements.
These risks and assumptions, in addition to those identified under Item 3. “Key Information-Risk Factors,” include:
| • | general economic and business conditions in markets where our Company operates, including changes in interest rates; |
| • | the effects of competition on the demand for and price of our services; |
| • | natural phenomena; |
| • | the impact of unusual events on our business and operations, including COVID-19 and other pandemics, and the effect of governmental actions taken in response; |
| • | actions by government authorities, including changes in government regulations, and changes in CAAC’s regulatory policies; |
| • | our relationship with China Southern Air Holding Company Limited; |
| • | uncertainties associated with potential legal proceedings; |
| • | technological development; |
| • | our ability to attract key personnel and attract new talent; |
| • | future decisions by management in response to changing conditions; |
| • | the Company’s ability to execute prospective business plans; |
| • | the availability of qualified flight personnel and airport facilities; and |
| • | misjudgments in the course of preparing forward-looking statements. |
Our Company advises you that these cautionary remarks expressly qualify in their entirety all forward-looking statements attributable to our Company, our Group and persons acting on their behalf.
1
Table of Contents
INTRODUCTORY NOTE
In this Annual Report, unless the context indicates otherwise, “we”, “us”, “our”, “the Company” and “our Company” refer to China Southern Airlines Company Limited, a joint stock company incorporated in China on March 25, 1995, our “Group” means our Company and our consolidated subsidiaries, and “CSAH” means China Southern Air Holding Company Limited, our Company’s parent company which directly and indirectly held 66.52% interest in our Company as of March 31, 2023.
References to “China” or the “PRC” are to the People’s Republic of China, excluding, for purpose of this Annual Report, Hong Kong, Macau and Taiwan. References to “Renminbi” or “RMB” are to the currency of China, references to “U.S. dollars”, “USD”, “$” or “US$” are to the currency of the United States of America (the “U.S.” or “United States”), and references to “HK$” are to the currency of Hong Kong. References to the “Chinese government” are to the national government of China. References to “Hong Kong” or “Hong Kong SAR” are to the Hong Kong Special Administrative Region of the PRC. References to “Macau” or “Macau SAR” are to the Macau Special Administrative Region of the PRC.
Our Group presents our consolidated financial statements in Renminbi. The consolidated financial statements of our Group have been prepared in accordance with all applicable International Financial Reporting Standards (“IFRSs”), which collective term include all applicable individual IFRSs, International Accounting Standards (“IASs”) and Interpretations issued by the International Accounting Standards Board (the “IASB”).
Solely for the convenience of the readers, this Annual Report contains conversions of certain Renminbi into U.S. dollars at the rate of US$1.00 = RMB6.9646, which was the average of the buying and selling rates as quoted by the People’s Bank of China at the close of business on December 30, 2022. No representation is made that the Renminbi amounts or U.S. dollar amounts included in this Annual Report could have been or could be converted into U.S. dollars or Renminbi, as the case may be, at any particular rate or at all.
Any discrepancies in the tables included herein between the amounts listed and the totals are due to rounding.
2
Table of Contents
GLOSSARY OF AIRLINE INDUSTRY TERMS
In this Annual Report, unless the context indicates otherwise, the following terms have the respective meanings set forth below.
| Capacity | ||
| “available seat kilometers” or “ASK” | the number of seats made available for sale multiplied by the kilometers flown | |
| “available ton kilometers” or “ATK” | the tons of capacity available for the transportation of revenue load (passengers and cargo) multiplied by the kilometers flown | |
| Traffic | ||
| “revenue passenger kilometers” or “RPK” | i.e. passenger traffic volume, the number of passengers carried multiplied by the kilometers flown | |
| “revenue ton kilometers” or “RTK” | i.e. total traffic volume, the load (passenger and cargo) in tons multiplied by the kilometers flown | |
| “revenue ton kilometers-cargo” or “RFTK” | i.e. cargo and mail traffic volume, the load for cargo and mail in tonnes multiplied by the kilometers flown | |
| “revenue ton kilometers-passenger” | the load for passenger in tons multiplied by the kilometers flown | |
| “ton” | a metric ton, equivalent to 1,000 kilograms | |
| Yield | ||
| “yield per RFTK” | revenue from cargo operations divided by RFTK | |
| “yield per RPK” | revenue from passenger operations divided by RPK | |
| “yield per RTK” | revenue from airline operations (passenger and cargo) divided by RTK | |
| Cost | ||
| “operating cost per ATK” | operating expenses divided by ATK | |
| Load Factors | ||
| “overall load factor” | RTK expressed as a percentage of ATK | |
| “passenger load factor” | RPK expressed as a percentage of ASK | |
| Utilization | ||
| “utilization rates” | flight hours that aircraft can service during specified time | |
| Equipment | ||
| “expendables” | aircraft parts that are ordinarily used up and replaced with new parts | |
3
Table of Contents
| “rotables” | aircraft parts that are ordinarily repaired and reused | |
| Others | ||
| “ADS” | American Depositary Share | |
| “A Shares” | Shares issued by our Company to investors in the PRC for subscription in RMB, with par value of RMB1.00 each | |
| “Board” | board of directors of the Company | |
| “CAAC” | Civil Aviation Administration of China | |
| “CAOSC” | China Aviation Oil Supplies Company | |
| “CSAH” | China Southern Air Holding Company Limited | |
| “CSRC” | China Securities Regulatory Commission | |
| “Hong Kong Stock Exchange” | The Stock Exchange of Hong Kong Limited | |
| “Hong Kong Listing Rules” | The Rules Governing the Listing of Securities on The Stock Exchange of Hong Kong Limited | |
| “H Shares” | Shares issued by our Company, listed on The Stock Exchange of Hong Kong Limited and subscribed for and traded in Hong Kong dollars, with par value of RMB1.00 each | |
| “Nan Lung” | Nan Lung Holding Limited (a wholly-owned subsidiary of CSAH) | |
| “NDRC” | National Development and Reform Commission of China | |
| “SAFE” | State Administration of Foreign Exchange of China | |
| “Finance Company” | China Southern Airlines Group Finance Company Limited | |
| “SASAC” | State-owned Assets Supervision and Administration Commission of the State Council | |
| “SEC” | United States Securities and Exchange Commission | |
| “SPVs” | special purpose vehicles exclusively set up by the Company and its subsidiaries for leased aircraft | |
4
Table of Contents
PART I
ITEM 1. IDENTITY OF DIRECTORS, SENIOR MANAGEMENT AND ADVISERS
Not applicable.
ITEM 2. OFFER STATISTICS AND EXPECTED TIMETABLE
Not applicable.
ITEM 3. KEY INFORMATION
A. SELECTED FINANCIAL DATA
The following tables present selected financial data for the five-year period ended December 31, 2022. The selected consolidated income statement data (other than ADS data) for the three-year period ended December 31, 2020, 2021 and 2022 and selected consolidated statement of financial position data as of December 31, 2021 and 2022 are derived from the audited consolidated financial statements of us, included elsewhere in this Annual Report. The selected consolidated income statement data (other than ADS data) for the years ended December 31, 2018 and 2019 and selected consolidated statement of financial position data as of December 31, 2018, 2019 and 2020 are derived from our audited consolidated financial statements that are not included in this Annual Report.
Moreover, the selected financial data should be read in conjunction with the rest of the Annual Report, including our audited consolidated financial statements together with accompanying notes and “Item 5. Operating and Financial Review and Prospects” which are included elsewhere in this Annual Report. Our consolidated financial statements are prepared and presented in accordance with International Financial Reporting Standards as issued by the International Accounting Standards Board, or IFRSs.
We have initially applied IFRS 16 on January 1, 2019 and IFRS 15 and IFRS 9 on January 1, 2018. According to the adopted transition plan, the comparative data has not been restated.
| Year ended December 31, | ||||||||||||||||||||||||
| 2022 US$ |
2022 RMB |
2021 RMB |
2020 RMB |
2019 RMB |
2018 RMB |
|||||||||||||||||||
| (in million, except per share and per ADS data) | ||||||||||||||||||||||||
| Consolidated Income Statement Data |
||||||||||||||||||||||||
| Operating revenue |
12,500 | 87,059 | 101,644 | 92,561 | 154,322 | 143,623 | ||||||||||||||||||
| Operating expenses |
(16,550 | ) | (115,262 | ) | (116,340 | ) | (109,111 | ) | (148,608 | ) | (140,242 | ) | ||||||||||||
| Operating (loss)/profit |
(3,237 | ) | (22,542 | ) | (9,929 | ) | (11,864 | ) | 10,838 | 8,819 | ||||||||||||||
| (Loss)/profit before income tax |
(4,530 | ) | (31,550 | ) | (13,910 | ) | (15,195 | ) | 4,055 | 4,364 | ||||||||||||||
| (Loss)/profit for the year |
(4,841 | ) | (33,716 | ) | (11,016 | ) | (11,827 | ) | 3,084 | 3,364 | ||||||||||||||
5
Table of Contents
| (Loss)/profit attributable to: |
||||||||||||||||||||||||
| Equity shareholders of our Company |
(4,695 | ) | (32,699 | ) | (12,106 | ) | (10,847 | ) | 2,640 | 2,895 | ||||||||||||||
| Non-controlling interests |
(146 | ) | (1,017 | ) | 1,090 | (980 | ) | 444 | 469 | |||||||||||||||
| Basic and diluted (loss)/earnings per share |
(0.27 | ) | (1.90 | ) | (0.75 | ) | (0.77 | ) | 0.22 | 0.27 | ||||||||||||||
| Basic and diluted (loss)/earnings per ADS (1) |
(13.64 | ) | (95.03 | ) | (37.36 | ) | (38.58 | ) | 10.76 | 13.50 | ||||||||||||||
| Other Financial Data |
||||||||||||||||||||||||
| Cash dividends declared per share |
— | — | — | — | — | 0.05 |
| (1) | Basic and diluted earnings per share have been computed by dividing profit attributable to our equity shareholders by the weighted average number of shares in issue. Basic and diluted earnings per ADS have been computed as if all of our issued or potential ordinary shares, including A Shares and H Shares, are represented by ADSs during each of the years presented. Each ADS represents 50 H Shares. |
| As of December 31, | ||||||||||||||||||||||||
| 2022 US$ |
2022 RMB |
2021 RMB |
2020 RMB |
2019 RMB |
2018 RMB |
|||||||||||||||||||
| (in million, except per share and per ADS data) | ||||||||||||||||||||||||
| Consolidated Statement of Financial Position Data: |
||||||||||||||||||||||||
| Cash and cash equivalents |
2,856 | 19,889 | 21,456 | 25,419 | 1,849 | 6,928 | ||||||||||||||||||
| Total current assets, excluding cash and cash equivalents |
1,948 | 13,565 | 16,410 | 13,566 | 14,889 | 17,144 | ||||||||||||||||||
| Property, plant and equipment, net |
12,997 | 90,517 | 91,186 | 86,146 | 84,788 | 170,692 | ||||||||||||||||||
| Right-of-use assets |
18,946 | 131,954 | 138,439 | 151,065 | 153,211 | — | ||||||||||||||||||
| Total assets |
44,833 | 312,246 | 323,211 | 326,383 | 306,928 | 246,949 | ||||||||||||||||||
| Current borrowings |
12,253 | 85,336 | 57,913 | 40,099 | 37,543 | 38,741 | ||||||||||||||||||
| Current portion of obligations under finance leases |
— | — | — | — | — | 9,555 | ||||||||||||||||||
| Non-current borrowings |
4,946 | 34,444 | 38,354 | 38,134 | 13,637 | 15,676 | ||||||||||||||||||
| Obligations under finance leases, excluding current portion |
— | — | — | — | — | 62,666 | ||||||||||||||||||
| Lease liabilities |
13,606 | 94,762 | 102,749 | 121,213 | 134,074 | — | ||||||||||||||||||
| Total equity |
7,949 | 55,359 | 84,508 | 85,131 | 77,329 | 78,469 | ||||||||||||||||||
| Number of shares (in million) |
18,121 | 18,121 | 16,948 | 15,329 | 12,267 | 12,267 | ||||||||||||||||||
6
Table of Contents
Selected Operating Data
The operating data and comparison below is calculated and disclosed in accordance with the statistical standards, which have been implemented by our Group since January 1, 2001. See “Glossary of Airline Industry Terms” at the front of this Annual Report for definitions of certain terms used herein.
| Year ended December 31, | ||||||||||||||||||||
| 2022 | 2021 | 2020 | 2019 | 2018 | ||||||||||||||||
| Capacity |
||||||||||||||||||||
| ASK (million) |
153,845 | 213,922 | 214,722 | 344,062 | 314,421 | |||||||||||||||
| ATK (million) |
26,222 | 33,518 | 33,892 | 46,434 | 42,728 | |||||||||||||||
| Kilometers flown (thousand) |
994,380 | 1,317,850 | 1,304,667 | 1,875,520 | 1,762,920 | |||||||||||||||
| Hours flown (thousand) |
1,557 | 2,110 | 2,077 | 2,951 | 2,773 | |||||||||||||||
| Number of landing and take-offs |
601,540 | 843,320 | 822,459 | 1,117,880 | 1,069,430 | |||||||||||||||
| Traffic |
||||||||||||||||||||
| RPK (million) |
102,078 | 152,426 | 153,440 | 284,921 | 259,194 | |||||||||||||||
| RTK (million) |
16,384 | 21,209 | 20,805 | 32,625 | 30,334 | |||||||||||||||
| Passengers carried (thousand) |
62,636 | 98,505 | 96,856 | 151,632 | 139,885 | |||||||||||||||
| Cargo and mail carried (tons) |
1,326,640 | 1,141,950 | 1,460,825 | 1,763,560 | 1,732,280 | |||||||||||||||
| Load Factors |
||||||||||||||||||||
| Passenger load factor (RPK/ASK) (%) |
66.4 | 71.3 | 71.5 | 82.8 | 82.4 | |||||||||||||||
| Overall load factor (RTK/ATK) (%) |
62.5 | 63.3 | 61.4 | 70.3 | 71.0 | |||||||||||||||
| Yield |
||||||||||||||||||||
| Yield per RPK (RMB) |
0.59 | 0.49 | 0.46 | 0.49 | 0.49 | |||||||||||||||
| Yield per RFTK (RMB) |
2.83 | 2.58 | 2.27 | 1.27 | 1.33 | |||||||||||||||
| Yield per RTK (RMB) |
4.94 | 4.49 | 4.18 | 4.54 | 4.55 | |||||||||||||||
| Fleet |
||||||||||||||||||||
| - Boeing |
466 | 469 | 469 | 467 | 460 | |||||||||||||||
| - Airbus |
402 | 391 | 383 | 375 | 354 | |||||||||||||||
| - Others |
26 | 18 | 15 | 20 | 26 | |||||||||||||||
| Total aircraft in service at period end |
894 | 878 | 867 | 862 | 840 | |||||||||||||||
| Average daily utilization rate (hours per day) |
5.04 | 6.96 | 7.02 | 9.96 | 9.73 | |||||||||||||||
B. CAPITALIZATION AND INDEBTEDNESS
Not applicable.
C. REASONS FOR THE OFFER AND USE OF PROCEEDS
Not applicable.
D. RISK FACTORS
Summary of Risk Factors
Below please find a summary of the principal risks we face, organized under relevant headings.
Risks Relating to the PRC
| • | The enactment of the Holding Foreign Companies Accountable Act and identification of the Company by the SEC will result in enhanced disclosure requirements for us. |
| • | We have significant exposure to foreign currency risk as part of our lease liabilities are denominated in foreign currencies. Due to rigid foreign exchange control by Chinese government, we may face difficulties in obtaining sufficient foreign exchange to pay dividends or satisfy our foreign exchange liabilities. |
7
Table of Contents
| • | Uncertainties with respect to the PRC legal system may cause significant uncertainties to our operations. |
| • | Any actions by the Chinese government may cause us to make material changes to our operations and could significantly limit or completely hinder our ability to offer or continue to offer securities to investors and cause the value of such securities to significantly decline or be worthless. |
Risks Relating to our Business
| • | The outbreak and global spread of the COVID-19 pandemic have had a material adverse effect on our business. The duration and severity of the pandemic, and similar public health threats or a large-scale natural disaster we may face in the future, could result in additional adverse effects on our business. |
| • | We are indirectly majority owned by the Chinese government, which may exert influence in a manner that may conflict with the interests of holders of ADSs, H Shares and A Shares. |
| • | Any disruption of the provision of services by CSAH or its affiliates could affect our operations and financial condition. |
| • | Due to a high degree of operating leverage and high fixed costs, a decrease in our revenue could result in a disproportionately higher decrease in our profit. |
| • | The results of our operations are also significantly exposed to fluctuations in foreign exchange rates. |
| • | We have significant committed capital expenditures in the next three years, and may face challenges and difficulties in maintaining our liquidity. |
| • | Unfavorable economic conditions, in China and globally, could affect the demand for air travel. |
| • | Lack of adequate documentation for land use rights and ownership of buildings may subject us to challenges and claims by third parties. |
| • | The travel industry continues to face on-going security concerns and cost burdens. |
| • | We may suffer losses in the event of an accident involving our aircraft or the aircraft of any other airline. |
| • | The mandatory grounding of our Boeing 737 Max fleet may have a material adverse effect on our business, operating results and financial condition. |
| • | We are subject to stringent laws and contractual obligations related to data privacy and cybersecurity, and we may be exposed to risks related to our management of personal information and other data. |
| • | Evolving data security and cybersecurity requirements could increase our costs, and any significant data security incident could disrupt our operations, harm our reputation, expose us to legal risks and otherwise materially adversely affect our business, results of operations and financial condition. |
8
Table of Contents
| • | We may be unable to retain our senior management team or other key employees. |
| • | Our results of operations may be negatively impacted by any jet fuel shortages or any fluctuation in domestic prices for jet fuel. |
| • | Our profit for the year may suffer from unexpected volatility caused by any fluctuation in the level of fuel surcharges. |
Risks Relating to the Chinese Commercial Aviation Industry
| • | Our business is subject to extensive government regulations. |
| • | Our results of operations tend to be volatile and fluctuate due to seasonality. |
| • | Our operations may be adversely affected by insufficient aviation infrastructure in the Chinese commercial aviation industry. |
| • | We face increasingly intense competition in both domestic and international markets. |
| • | We expect to face substantial competition from alternative means of transportation, especially as a result of the rapid development of the Chinese rail network. |
| • | Limitations on foreign ownership of Chinese airlines may affect our access to funding in the international equity capital markets. |
| • | The commercial aviation industry is subject to risks associated with climate change, including the increasingly stringent environmental regulation to protest against emissions. Failure to comply with existing or future environmental regulations or to otherwise manage the risks of climate change effectively could have a material adverse effect on our business. |
| • | We may utilize fuel hedging arrangements which may result in losses. |
Risks Relating to the PRC
The enactment of the Holding Foreign Companies Accountable Act and identification of the Company by the SEC will result in enhanced disclosure requirements for us.
On December 18, 2020, the Holding Foreign Companies Accountable Act, or HFCAA, was signed into law. The HFCAA requires the SEC to identify each issuer required to file reports under section 13 or 15(d) of the Exchange Act that has retained a registered public accounting firm to issue an audit report where the firm has a branch or office located in a foreign jurisdiction, and the Public Company Accounting Oversight Board, or the PCAOB, has determined that it is unable to inspect or investigate completely because of a position taken by an authority in the foreign jurisdiction. Registrants so identified, or Commission-Identified Issuers, are required to submit documentation to the SEC that establishes that they are not owned or controlled by a governmental entity in that foreign jurisdiction. In addition, if the registrant is determined to be a Commission-Identified Issuer for three consecutive “non-inspection” years, it will be delisted from U.S. exchanges and its securities will be prohibited from trading in the United States. Commission-Identified Issuers that are foreign issuers will also be subject to enhanced disclosure requirements, including disclosure on government ownership or control of the issuer, the name of each official of the Chinese Communist Party who is a member of the issuer’s board of directors, and whether the issuer’s articles of incorporation contain any charter of the Chinese Communist Party.
9
Table of Contents
On March 24, 2021, the SEC adopted interim final amendments to implement the disclosure and submission requirements of the HFCAA. On December 2, 2021, the SEC adopted amendments to finalize its rules implementing the HFCAA.
On December 16, 2021, the PCAOB issued a report on its determinations that it was unable to inspect or investigate completely PCAOB-registered public accounting firms headquartered in mainland China and Hong Kong because of positions taken by PRC authorities in those jurisdictions (“PCAOB-Identified Firm”).
Our auditor is an independent public accounting firm registered with the PCAOB that is headquartered in mainland China, and was therefore a PCAOB-Identified Firm under the PCAOB 2021 determinations. On May 26, 2022, we were identified in the conclusive list of issuers under the HFCAA as our auditor was a PCAOB-Identified Firm, and we will be required to comply with the submission and disclosure requirements in the annual report for each year in which we are identified.
On August 26, 2022, the PCAOB, the CSRC and the Ministry of Finance of the PRC signed a Statement of Protocol governing inspections and investigations of audit firms based in mainland China and Hong Kong, which established a framework to make possible complete inspections and investigations by the PCAOB of audit firms headquartered in mainland China and Hong Kong.
On December 15, 2022, the PCAOB determined that it was able to inspect and investigate completely registered public accounting firms headquartered in mainland China and Hong Kong in 2022, and vacated its previous 2021 determinations to the contrary. However, whether the PCAOB will continue to be able to conduct complete inspections and investigations of registered public accounting firms headquartered in mainland China and Hong Kong is subject to uncertainties and depends on a number of factors out of our control. The PCAOB has indicated that it will act immediately to issue new determinations pursuant to the HFCAA if needed.
On December 29, 2022, the President signed the Consolidated Appropriations Act, 2023, which, among other things, amended the HFCAA to reduce the number of consecutive years, from three years to two years, an issuer can be identified as a Commission-Identified Issuer before the SEC must impose an initial trading prohibition on the issuer’s securities. Therefore, once an issuer is identified as a Commission-Identified Issuer for two consecutive years, the SEC is required under the HFCAA to prohibit the trading of the issuer’s securities on a national securities exchange and in the over-the-counter market.
Based on the latest PCAOB determination in 2022, our auditor is no longer a PCAOB-Identified Firm and we do not expect to be identified by the SEC under the HFCAA in 2023 after filing of this annual report. In addition, we have voluntarily delisted our ADSs from the NYSE, which has become effective from February 3, 2023, and have terminated our ADS program, which has become effective from March 6, 2023. We also intend to file Form 15F to deregister our ADSs and the underlying H Shares and terminate our reporting obligations under the Exchange Act once the criteria for deregistration have been satisfied. Therefore, we do not expect to be subject to the submission and disclosure requirements in the annual report for the year of 2023, even if we have not filed a Form 15F before April 30, 2024 and are still required to file the annual report for the year of 2023, or to be subject to the trading prohibitions under the HFCAA as our ADSs are already no longer traded in U.S. from March 6, 2023. However, we cannot guarantee you that the SEC will not continue to identify us under the HFCAA or that Form 15F to be filed will not be delayed, withdrawn or denied. If, before the deregistration of our ADS and underlying H Shares become effective, the PCAOB issues new determination to re-identify our auditor as the PCAOB-Identified Firm or the SEC continues to identify us under the HFCAA in the future, we may still be subject to the submission and disclosure requirements for the annual report for each year in which we are so identified.
Whether our investors in the U.S. who rely on our auditor’s audit reports will have the benefit of PCAOB oversight in the future is subject to uncertainty.
Auditors of companies that are registered with the SEC and traded publicly in the United States, including our independent registered public accounting firm, must be registered with the PCAOB, and are required by the laws of the United States to undergo regular inspections by the PCAOB to assess their compliance with the laws of the United States and professional standards. The PCAOB has at times identified deficiencies in the audit procedures and quality control procedures of accounting firms during its inspections of these firms. Such deficiencies may be addressed in those accounting firms’ future inspection process to improve their audit quality. However, in the past, the PCAOB was unable to inspect a registered public accounting firm’s audit work relating to a company’s operations in China where the documentation of such audit work was located in China. Accordingly, our independent registered public accounting firm’s audit of our operations in China was not subject to PCAOB inspection.
10
Table of Contents
On August 26, 2022, the PCAOB, the CSRC and the Ministry of Finance of the PRC signed a Statement of Protocol governing inspections and investigations of audit firms based in mainland China and Hong Kong, which established a framework to make possible complete inspections and investigations by the PCAOB of audit firms headquartered in mainland China and Hong Kong.
On December 15, 2022, the PCAOB determined that it was able to inspect and investigate completely registered public accounting firms headquartered in mainland China and Hong Kong in 2022, and vacated its previous 2021 determinations to the contrary. However, whether the PCAOB will continue to be able to conduct complete inspections and investigations of registered public accounting firms headquartered in mainland China and Hong Kong is subject to uncertainties and depends on a number of factors out of our control. The PCAOB has indicated that it will act immediately to issue new determinations pursuant to the HFCAA if needed. Therefore it remains unclear whether our investors will continue to have the benefit of PCAOB oversight.
If additional remedial measures are imposed against four PRC-based accounting firms, including our independent registered public accounting firm, in administrative proceedings brought by the SEC, it could result in our financial statements being determined to not be in compliance with the requirements of the Securities Exchange Act of 1934.
In December 2012, the SEC instituted administrative proceedings against four PRC-based accounting firms, including our independent registered public accounting firm, alleging that they had refused to produce audit work papers related to their audit of certain PRC-based companies that are publicly traded in the United States. On January 22, 2014, an initial administrative law decision was issued, which determined that the four PRC-based accounting firms should be censured and barred from practicing before the SEC for a period of six months. The four PRC-based accounting firms appealed the initial administrative law decision to the SEC. The initial law decision is neither final nor legally effective unless and until it is endorsed by the full SEC. In February 2015, each of the four PRC-based accounting firms agreed to a censure and to pay a fine to the SEC to settle the dispute and avoid suspension of their ability to practice before the SEC. The settlement requires the firms to follow detailed procedures to provide the SEC with access to PRC-based firms’ audit documents via the CSRC.
We were not and are not the subject of any SEC investigations nor are we involved in the proceedings brought by the SEC against the accounting firms. If the firms do not follow these procedures or if there is a failure in the process between the SEC and the CSRC, the SEC could impose penalties such as suspensions, or it could restart the administrative proceedings. If the accounting firms including our independent registered public accounting firm were denied, temporarily or permanently, the ability to practice before the SEC, and we were unable to find another registered public accounting firm in a timely manner to audit and issue a report on our financial statements, our financial statements could be determined to not be in compliance with the requirements of the Exchange Act. Such a determination could ultimately lead to our deregistration from the SEC.
We have significant exposure to foreign currency risk as part of our lease liabilities are denominated in foreign currencies. Due to rigid foreign exchange control by Chinese government, we may face difficulties in obtaining sufficient foreign exchange to pay dividends or satisfy our foreign exchange liabilities.
Under current Chinese foreign exchange regulations, the Renminbi is fully convertible for current account transactions, but is not freely convertible for capital account transactions. All foreign exchange transactions involving Renminbi must take place either through the People’s Bank of China or other institutions authorized to buy and sell foreign exchange or at a swap center.
11
Table of Contents
We have significant exposure to foreign currency risk as the majority of our lease liabilities and certain bank and other loans are denominated in foreign currencies, principally U.S. dollars, Euros and Japanese Yen. Depreciation or appreciation of the Renminbi against foreign currencies affects our results significantly because our foreign currency liabilities generally exceed our foreign currency assets. We are not able to hedge our foreign currency exposure effectively other than by retaining our foreign currency denominated earnings and receipts to the extent permitted by SAFE, or subject to certain restrictive conditions, entering into foreign exchange forward option contracts with authorized banks. However, SAFE may limit or eliminate our ability to purchase and retain foreign currencies in the future. In addition, foreign currency transactions under the capital account are still subject to limitations and require approvals from SAFE. This may affect our ability to obtain foreign exchange through debt or equity financing, including by means of loans or capital contributions. No assurance can be given that we will be able to obtain sufficient foreign exchange to pay dividends or satisfy our foreign exchange liabilities.
Uncertainties with respect to the PRC legal system may cause significant uncertainties to our operations.
Our Company and our major subsidiaries are organized under the laws of China. The Chinese legal system is based on written statutes and is a system, unlike common law systems, in which decided legal cases have little precedential value. Since 1979, the Chinese government has been developing a comprehensive system of commercial laws and considerable progress has been made in the promulgation of laws and regulations dealing with economic matters, such as corporate organization and governance, foreign investments, commerce, taxation and trade. As these laws, regulations and legal requirements are relatively recent and the PRC legal system continues to evolve quickly, these laws, regulations and legal requirements, like other laws, regulations and legal requirements in China (including with respect to the commercial aviation industry), can change quickly and their interpretation and enforcement involve significant uncertainties.
Any actions by the Chinese government, including any decision to influence our operations or to exert more oversight and control over any offering of securities conducted overseas and/or foreign investment in China-based issuers, may cause us to make material changes to our operations and could significantly limit or completely hinder our ability to offer or continue to offer securities to investors and cause the value of such securities to significantly decline or be worthless.
The Chinese government has exercised and continues to exercise significant oversight and regulation over almost every sector of the Chinese economy, including the commercial aviation industry, and has discretion over many aspects in which it exercises such authority. Our operations are subject to various regulatory requirements. The Chinese government, including various political and regulatory entities, may also impose new and stricter regulations or impose new interpretations of existing regulations and take other actions that may influence our operations, and may seek to exert more oversight and control over any offering of securities conducted overseas and/or foreign investment in China-based issuers such as ourselves. These government actions, including changes in laws and regulations, particularly those relating to aviation, overseas listing, taxation, land use rights and foreign investment, may result in a material change in our operations and the value of our securities. See also Item 5. “- Key Factors Affecting Results of Operations — Political and economic conditions and regulations”.
Holders of H Shares and ADSs generally are required to resolve disputes with us, our senior management and holders of our A Shares only through arbitration in Hong Kong or China.
In accordance with the rules applicable to Chinese overseas listed companies, our articles of association provide that, with certain limited exceptions, all disputes or claims based on our articles of association, PRC company law or other relevant laws or administrative rules, and concerning matters between holders of H Shares and ADSs and holders of A Shares, us, or our directors, supervisors, president, vice presidents or other senior officers, must be submitted for arbitration at either the China International Economic and Trade Arbitration Commission or the Hong Kong International Arbitration Center. If an applicant chooses to have the dispute arbitrated at the Hong Kong International Arbitration Center, either party may request that the venue be changed to Shenzhen, a city in China near Hong Kong. The governing law for any such disputes or claims is Chinese law, unless Chinese law itself provides otherwise. Pursuant to an arrangement of mutual enforcement of arbitration awards between the PRC courts and the Hong Kong courts, Hong Kong arbitration awards are enforceable in China, subject to the satisfaction of certain legal requirements. However, due to the limited number of actions that have been brought in China by holders of shares issued by a Chinese company to enforce an arbitral award, we are uncertain as to the outcome of any action brought in China to enforce a Hong Kong arbitral award made in favor of holders of H Shares and ADSs.
12
Table of Contents
PRC laws differ from the laws in the United States and may afford less protection to our minority shareholders.
Although Chinese company law provides that shareholders of a Chinese company may, under certain circumstances, sue the company’s directors, supervisors and senior management in the interests of the company, limited detailed implementation rules or court interpretations have been issued in this regard. Also, class action lawsuits are generally uncommon in China. In addition, PRC company law imposes limited obligations on a controlling shareholder with respect to protection of the interests of minority shareholders, although overseas listed joint stock companies, such as ourselves, are required to adopt certain provisions in their articles of association that are designed to protect minority shareholder rights. These mandatory provisions provide, among other things, that the rights of any class of shares, including H shares, may not be varied without a resolution approved by holders of shares in the affected class holding no less than two-thirds of the shares of the affected class entitled to vote, and provide that in connection with a merger or division involving our company, a dissenting shareholder may require us to purchase the dissenters’ shares at a fair price. Disputes arising from these protective provisions would likely need to be resolved by arbitration. See “Holders of H Shares and ADSs generally are required to resolve disputes with us, our senior management and holders of our A Shares only through arbitration in Hong Kong or China”.
The PRC tax law may have negative tax impact on holders of our H Shares or ADSs, by requiring the imposition of a withholding tax on dividends paid by a Chinese company to a non-resident enterprise.
The current tax law generally provides for a withholding tax on dividends paid by a Chinese company to a non-resident enterprise at a rate of 10%.
Caishui Notice [2014] No. 81 provides that for dividends derived by Mainland individual investors from investing in H shares listed on the Hong Kong Stock Exchange through Shanghai Hong Kong Stock Connect, H-Share companies shall apply to the China Securities Depository and Clearing Corporation Limited (CSDC) to obtain and CSDC shall provide the list of Mainland individual investors to H-Share companies who shall withhold individual income tax at a tax rate of 20%. For Mainland securities investment funds investing in shares listed on the Hong Kong Stock Exchange through Shanghai Hong Kong Stock Connect, the above rules shall also apply and individual income tax shall be levied on dividends derived therefrom.
Caishui Notice [2014] No. 81 further provides that “dividends derived by Mainland enterprise investors from investing in shares listed on the Hong Kong Stock Exchange through Shanghai Hong Kong Stock Connect shall be included in their gross income and subject to enterprise income tax. For dividends derived by Mainland enterprises where the relevant H shares have been continuously held for no less than 12 months, enterprise income tax may be exempt according to the tax law. H-share companies listed on the Hong Kong Stock Exchange shall apply to CSDC to obtain the list of Mainland enterprise investors from CSDC. H-Share companies are not required to withhold income tax on dividends to Mainland enterprise investors which shall report the income and make the tax payment by themselves.”
In addition, to date, relevant tax authorities have not collected capital gains tax on the gains realized upon the sale or other disposition of overseas shares in Chinese enterprise held by foreign individuals. If relevant tax authorities promulgate implementation rules on the taxation of capital gains realized by individuals upon the sale or other disposition of the shares, individual holders of the shares may be required to pay capital gains tax.
You may experience difficulties in effecting service of legal process, enforcing foreign judgments or bringing original actions in the PRC based on U.S. or other foreign laws against us, our management and some of the experts named in the annual report.
13
Table of Contents
We are a company incorporated under the laws of China, and substantially all of our assets are located in China. In addition, most of our directors, supervisors, executive officers and some of the experts named in this Annual Report reside within China, and substantially all of the assets of these persons are located within China. As a result, it may not be possible to effect service of process within the United States or elsewhere outside China upon our directors, supervisors or executive officers or some of the experts named in this Annual Report, including with respect to matters arising under U.S. federal securities laws or applicable state securities laws. Our PRC legal counsel has advised us that China does not have treaties providing for the reciprocal recognition and enforcement of judgments of courts with the United States, the United Kingdom, Japan or many other countries. Our Hong Kong legal adviser has also advised us that Hong Kong has no statutory arrangement for the reciprocal enforcement of judgments with the United States although it may be possible for a civil action to be brought in Hong Kong based on a monetary judgment of the courts of the United States. As a result, recognition and enforcement in China or Hong Kong of judgments of a court in the United States and any of the other jurisdictions mentioned above in relation to any matter may be difficult or impossible. Furthermore, an original action may be brought in the PRC against us, our directors, supervisors, executive officers or the experts named in this Annual Report only if the actions are not required to be arbitrated under PRC law and our articles of association, and only if the facts alleged in the complaint give rise to a cause of action under PRC law. In connection with any such original action, a PRC court may award civil liability, including monetary damages.
Due to jurisdictional limitations and various other factors, the U.S. Securities and Exchange Commission, the U.S. Department of Justice and other U.S. authorities may also be limited in their ability to pursue companies and individuals in China, in connection with any alleged violation of U.S. securities and other laws.
Recent international geopolitical tensions could materially and adversely affect our business, financial condition and results of operations.
Economic conditions in China are sensitive to global economic conditions. The global financial markets have experienced significant disruptions in the past, including international trade disputes and tariff actions announced by the United States, the PRC and certain other countries. The U.S. administration has imposed a significant amount of tariffs on Chinese goods, and the PRC government has imposed tariffs on certain goods manufactured in the United States. The United States and China signed the first phase of a trade deal in January 2020 and began the implementation of the phase one trade deal. However, there is no assurance that the trade deal will continue to be successfully implemented, or the list of goods impacted by additional tariffs will not be expanded or the tariffs will not be increased materially in the future. It is also difficult to predict the impacts of PRC or U.S. government policies, in particular, the imposition of additional tariffs on bilateral imports, on economic conditions of both countries. If the list of goods is further expanded or the tariff is further increased, the volume of China-U.S. import and export trade would drop significantly, which will lead to deterioration in economic conditions of both countries and decrease of business and official activities between both countries. If any new tariffs, sanctions, legislation and/or regulations are implemented, or if existing trade agreements are renegotiated or, in particular, if the U.S. government takes retaliatory trade actions due to the recent U.S.-China geopolitical tensions, such changes could negatively affect the demand for air travel as well as cargo and mail volume, which may in turn have an adverse effect on our business, financial condition and results of operations.
Risks Relating to our Business
The outbreak and global spread of the COVID-19 pandemic have had a material adverse effect on our business. The duration and severity of the pandemic, and similar public health threats or a large-scale natural disaster we may face in the future, could result in additional adverse effects on our business.
An outbreak of a disease, a similar public health threat or a large-scale natural disaster that affects travel demand, travel behavior, or travel restrictions, could have a material adverse impact on our business, financial condition and operating results. Beginning from 2020, the outbreak and rapid spread of COVID-19 in China and worldwide, the persistence of the resulting pandemic, as well as the measures governments and private parties implemented to stem the spread of this pandemic, have had a material adverse effect on the demand for air travel in China and worldwide and consequently on our business, results of operations and financial condition.
| • | The demand in air travel has decreased due to the COVID-19 pandemic and the measures taken by governments around the world to contain the pandemic. |
Following the onset of the COVID-19 pandemic in January 2020, the central and local governments of China gave top priority to protecting people’s life and health and implemented corresponding COVID-19 control policies and measures including traveling restrictions and “stay at home” instructions and advisories. As a result, the demand for domestic air travel declined at a rapid pace in China, which is our primary market. See “Item 4. Information on the Company – Business Overview – Route Network” and “Item 5. Operating and Financial Review and Prospects – Operating Results” for additional discussion.
14
Table of Contents
Following the onset of the COVID-19 pandemic, governments around the world implemented various measures, including enhanced screenings, vaccination requirements, quarantine requirements, travel restrictions and border controls, in connection with the COVID-19 pandemic. On March 26, 2020, the CAAC placed restrictions on international flights from and to China and limited the number of international routes and flights each airline in China could operate. Governments of many countries that are markets for our business placed similar restrictions. Due to these measures, the international travel demand reduced significantly, which in turn had a significant adverse impact on our international route business.
As a result of such reduced demand of domestic and international air travel, our revenues, results of operations and financial condition in 2022 were materially adversely affected. The Group’s RTK for the year ended December 31, 2022 decreased by 22.75% as compared to 2021. In 2022, total passenger capacity (measured by ASK) and RPK of the Company decreased by 28.08% and 33.03%, respectively, as compared to 2021. Passenger capacity and RPK for international routes decreased by 3.02% and increased by 21.32%, respectively, as compared to 2021. Revenue per seat kilometer reduced. As a result, the Company recorded a loss in the operating results for the year of 2022.
| • | The mitigation measures we implemented in response to the pandemic have had negative consequences with respect to our business and operations. |
In response to the adverse changes in operational environment caused by the outbreak and duration of the COVID-19 pandemic, we have taken steps to mitigate the effects on our business, which themselves may have negative consequences with respect to our business and operations. Beginning in 2020, we implemented various measures to adjust our operational capacity. In addition, we intensified our efforts to fully implement precautionary measures. Those precautionary measures increased our operational cost. The mitigation and cost-saving measures that we implemented since 2020 have not made up, and may not in the future make up for our revenue loss as a result of the decreased ticket sales due to the pandemic.
| • | It is difficult to predict the duration and development of the pandemic as well as other potential impact it may have on our business. |
Since December 2022, the Chinese government has modified its COVID-19 control policy, and most of the travel restrictions and quarantine requirements have been lifted. On January 8, 2023, CAAC removed the restrictions on international flights from and to China and limitations on the number of international routes and flights each airline in China could operate. We have seen our recovery from the impact of the COVID-19 pandemic for both domestic and international markets, but we are not able to predict the pace of such recovery. The impact of COVID-19 pandemic on us in the future will depend on future developments which are highly unpredictable and beyond our control, such as the frequency, duration and severity of the resurgence of COVID-19 and the emergence of new variants, as well as the measures that may be taken by governments around the world in response to these developments, the impact of the pandemic on the global economy and the measures taken by governments to stimulate the general economy. Therefore, we cannot guarantee that the pandemic will not continue to have an adverse effect on our business and results of operations in the future, which may be material.
It is also uncertain the extent to which the COVID-19 pandemic may result in permanent changes to our customers’ behavior and perception of travel, including a permanent reduction in business travel as a result of increased usage of “virtual” meetings and “teleconferencing” products. A permanent change in customer’s behavior and perception of travel could have a material impact on our business.
15
Table of Contents
As discussed above, the extent of the impact of the COVID-19 pandemic on our future operational and financial performance will depend on future developments which are highly uncertain and cannot be predicted at this time. In addition, an outbreak of another disease or similar public health threat that affects travel demand, travel behavior or travel restrictions could result in additional adverse impact on our business, financial condition and operating results.
We are indirectly majority owned by the Chinese government, which may exert influence in a manner that may conflict with the interests of holders of ADSs, H Shares and A Shares.
CSAH, an entity wholly-owned by the Chinese government, directly and indirectly held and exercised the rights of ownership of 66.52% of our equity stake as of March 31, 2023. The ownership interest of the Chinese government in us and in other Chinese airlines could conflict with the interests of the holders of the ADSs, H Shares and A Shares. The public policy considerations of the Chinese government in regulating the Chinese commercial aviation industry could also conflict with its indirect ownership interest in us. In addition, subject to the approval of our shareholders, we may accept further capital injections from CSAH through non-public subscriptions from time to time to fulfill capital needs in our business operation or business development, which may dilute the stakes of other holders of ADSs, H Shares and A Shares. On August 10, 2022, a total number of 368,852,459 of H Shares were issued at HK$4.88 per share to Nan Lung, a wholly-owned subsidiary of CSAH, and on November 24, 2022, a total number of 803,571,428 A Shares were issued at RMB5.60 per share to CSAH. After these two issuances, CSAH’s interest in our Company, held directly or indirectly through Nan Lung, has been increased from 64.20% to 66.52%.
CSAH will continue to be our controlling shareholder, and our interests may conflict with those of CSAH. CSAH and certain of its affiliates will continue to provide certain important services to our Group. Any disruption of the provision of services by CSAH or its affiliates could affect our operations and financial condition.
CSAH will continue to be our controlling shareholder. CSAH and certain of its affiliates will continue to provide certain important services to us, including advertising services, property management services, leasing of properties and aircraft and financial services. The interests of CSAH may conflict with those of our Group. In addition, any disruption of the provision of services by CSAH’s affiliates or a default of CSAH on its obligations owed to our Group could affect our operations and financial condition. In particular, as part of our cash management system, subject to the approval of our independent shareholders (being shareholders other than CSAH or an affiliate of CSAH), we periodically place a certain amount of demand deposits with Finance Company, a PRC authorized financial institution controlled by CSAH. We have taken certain measures to monitor the fund flows between us and Finance Company and the placement of funds by Finance Company. Such monitoring measures may help to keep our deposits with Finance Company safe. In addition, we have received a letter of undertakings from CSAH dated March 31, 2009, in which, among other things, CSAH warranted that our deposits and loans with Finance Company were secure and that Finance Company would continue to operate in strict compliance with the relevant rules and regulations. However, the deposits may be exposed to risks associated with Finance Company’s business over which we do not have control. As of December 31, 2021 and 2022, we had deposits of RMB12,621 million and RMB14,118 million, respectively, with Finance Company.
Due to a high degree of operating leverage and high fixed costs, a decrease in our revenue could result in a disproportionately higher decrease in our profit.
The airline industry is generally characterized by a high degree of operating leverage. In addition, due to high fixed costs, the expenses relating to the operation of any flight do not vary proportionately with the number of passengers carried, while revenue generated from a flight are directly related to the number of passengers carried and the fare structure of such flight. Accordingly, a decrease in revenue could result in a disproportionately higher decrease in our profit.
The results of our operations are also significantly exposed to fluctuations in foreign exchange rates.
16
Table of Contents
As we have substantial liabilities denominated in foreign currencies, our results of operations are significantly affected by fluctuations in foreign exchange rates, particularly fluctuations in the Renminbi-U.S. dollar exchange rate. A net exchange loss of RMB3,619 million was recorded in 2022, as compared with a net exchange gain of RMB1,575 million in 2021. The net exchange loss in 2022 was primarily attributable to the exchange difference arising from the translation of lease liabilities denominated in USD resulting from the depreciation of RMB against USD.
We have significant committed capital expenditures in the next three years, and may face challenges and difficulties in maintaining our liquidity.
We have, and will continue to have a substantial amount of debt, lease and other liabilities in the future. As of December 31, 2022, our current liabilities exceeded our current assets by RMB108,004 million. The Group generated net cash inflow from operating activities of RMB7,688 million for the year ended December 31, 2021 and recorded net cash outflow of RMB2,450 million from operating activities for the year ended December 31, 2022. However, our substantial indebtedness and other liabilities may negatively impact our liquidity in the future. In addition, we have significant committed capital expenditures in the next three years, mainly due to aircraft acquisition. In 2022 and thereafter, our liquidity is primarily dependent on our ability to maintain adequate cash inflow from operations to meet our debt obligations as they fall due, and our ability to obtain adequate external financing to meet our committed future capital expenditures. If our operating cash flow is materially and adversely affected by factors, such as increased competition, significantly reduced demand for our services, or significantly increased jet fuel prices, our liquidity would be materially and adversely affected. Moreover, we may not be able to meet our debt obligations as they fall due and commit further capital expenditures if certain assumptions about the availability of external financing on acceptable terms are inaccurate. If we are unable to obtain adequate financing for our capital requirements, our liquidity and operations would be materially and adversely affected.
As of December 31, 2022, we had committed banking facilities with several PRC commercial banks and other financial institutions for providing loan financing up to approximately RMB320,530 million, of which approximately RMB223,729 million was unutilized. Our directors believe that sufficient financing will be available to our Group when needed. However, there can be no assurance that such loan financing will be available on terms acceptable to our Group or at all.
In addition, certain of our Group’s banking facilities are subject to the fulfilment of covenants relating to certain financial ratios, as are commonly found in lending arrangements with financial institutions. If our Group was to breach the covenants, the drawn down facilities would become payable on demand. We regularly monitor our compliance with these covenants. In 2021, our Group complied with all the financial covenants attached to certain of our borrowings. As at December 31, 2022, for short-term borrowings with an aggregate amount of RMB27,400 million, the loan covenants relating to certain financial ratios were breached. Our Group has obtained waiver from the respective financial institution, pursuant to which, such financial institution will not require us to repay the borrowings until the due dates and will maintain the credit facilities granted to us. However, there can be no assurance that we can always obtain such waiver if our Group was to breach the covenants in the future, and our liquidity and operations would be materially and adversely affected if we have to repay the borrowings on demand upon any potential breach of such covenants.
Further, our US dollar-denominated lease liabilities mainly bear interest at fluctuating interest rates, primarily based on the London interbank offered rate (LIBOR). LIBOR tends to fluctuate based on general short-term interest rates, rates set by the U.S. Federal Reserve and other central banks, the supply of and demand for credit in the London interbank market and general economic conditions. We have entered into interest rate swaps to mitigate our interest rate risk. We also had entered into cross currency swaps previously, which were all terminated in 2021. However, our interest expense for any particular period may still fluctuate based on LIBOR and other variable interest rates. To the extent the interest rates applicable to our floating rate debt significantly increase, our interest expense may increase, in which event we may have difficulties making interest payments and funding our other fixed costs, and our available cash flow for general corporate requirements may be adversely affected.
17
Table of Contents
On July 27, 2017, the U.K. Financial Conduct Authority (the authority that regulates the process of establishing LIBOR), or FCA, announced that the sustainability of LIBOR cannot be guaranteed. The ICE Benchmark Administration (the current administrator of LIBOR), or IBA, announced on March 5, 2021 that it will permanently cease to publish most LIBOR settings beginning on January 1, 2022 and cease to publish the overnight, one-month, three-month, six-month and 12-month U.S. dollar LIBOR settings on July 1, 2023. Accordingly, the FCA has stated that it does not intend to persuade or compel banks to submit to LIBOR after such respective dates. Until such time, however, FCA panel banks have agreed to continue to support LIBOR.
Significant recommendations as to alternative rates and as to protocols have been advanced, and continue to be advanced, by various regulators and market participants, including the Alternative Reference Rates Committee of the United States Federal Reserve (“ARRC”), the International Swaps and Derivatives Association (“ISDA”), the FCA and the U.S. Congress, and legislative action by the State of New York, but there can be no assurance that the various recommendations or legislative action will be effective at preventing or mitigating disruption as a result of the transition. In particular, for U.S. dollar LIBOR, the ARRC has selected the Secured Overnight Financing Rate (“SOFR”) as its preferred replacement benchmark and has formally recommended, in limited cases, a term rate based on SOFR; both ARRC and ISDA have taken significant steps toward implementing various fallback provisions and protocols. However, the market transition away from LIBOR to alternative reference rates, including SOFR, is complex and could result in disruptions, among other things, due to differences between LIBOR (an unsecured forward-looking term rate) and alternative rates that are based on historical measures of overnight secured rates; due to failure of market participants to fully accept such alternative rates; or due to difficulties in amending legacy LIBOR contracts or implementing processes for determining new alternative rates.
SOFR is a broad Treasury repo financing rate that represents overnight secured funding transactions and is not the economic equivalent of U.S. dollar LIBOR. While SOFR is a secured rate, U.S. dollar LIBOR is an unsecured rate. And, while SOFR is currently only an overnight rate, U.S. dollar LIBOR is a forward-looking rate that represents interbank funding for a specified term. As a result, there can be no assurance that SOFR will perform in the same way as U.S. dollar LIBOR would have at any time, including, without limitation, as a result of changes in interest and yield rates in the market, bank credit risk, market volatility or global or regional economic, financial, political, regulatory, judicial or other events. For the same reasons, SOFR is not expected to be a comparable replacement for U.S. dollar LIBOR.
On August 16, 2019, the People’s Bank of China announced a plan to improve and reform the loan prime rate (LPR) mechanism, which requires banks to adopt interest rates based on the LPR for the newly issued loans from the date of the announcement. In December 2019, the People’s Bank of China issued another announcement which requires that, starting from March 1, 2020, financial institutions should negotiate with their clients who have outstanding floating interest rate loans to replace the existing interest rates of such loans which are based on the benchmark lending rates to interest rates based on the LPRs. Such negotiation and replacement are required to be completed before August 31, 2020. While the intention of such plan is to reduce borrowing costs by better reflecting market changes on interest rates, it is not possible to predict the effect of these changes, other reforms or the establishment of alternative reference rates in the PRC, the United States or elsewhere. The discontinuance of LIBOR may result in uncertainty or differences in the calculation of the applicable interest rate or payment amount on certain assets or liabilities we hold whose value is tied to LIBOR, and adversely affect their value. Further, any uncertainty regarding the continued use and reliability of LIBOR as a benchmark interest rate could adversely affect the value of such assets or liabilities. See also the discussion of interest rate risk in Part I, Item 11. Quantitative and Qualitative Disclosures About Market Risk –“Interest Rate Risk.”
Unfavorable economic conditions, in China and globally, could affect the demand for air travel.
Our business and results of operations are affected by general factors affecting the industry that we operate in. Such general factors include, but are not limited to, China’s overall economic growth, changing government policies and the demand for air travel. In addition, the airline industry is highly cyclical, and the level of demand for air travel is affected by the global and domestic economic conditions. Although the Chinese economy grew by 3.0% in 2022 (8.4% in 2021 and 2.2% in 2020), the rate of growth was significantly lower than in previous years, and we can not assure you that growth will not continue to slow in the future. In particular, the outbreak of the COVID-19 pandemic in January 2020 and its continuing duration has adversely affected the economic conditions in China and globally and disrupted air travel. See “Item 3. Key Information – Risk Factors – The outbreak and global spread of the COVID-19 pandemic have had a material adverse effect on our business. The duration and severity of the pandemic, and similar public health threats or a large scale natural disaster we may face in the future, could result in additional adverse effects on our business”. Since December 2022, the Chinese government has modified its COVID-19 control policy, and most of the travel restrictions and quarantine requirements have been lifted. While we expect that these actions will reduce the impact of COVID-19 on the growth of Chinese economy, it remains uncertain as to the growth rate of the Chinese economy in the future. During periods of unfavorable or volatile economic conditions, demand for air travel can be impacted as business and leisure travelers choose not to travel, seek alternative forms of transportation for short trips or conduct business through videoconferencing. Long-term unfavorable economic conditions would reduce the demand of air travel and adversely affect our business, financial condition and results of operations. Chinese macroeconomic controls, such as financing adjustments, credit adjustments, taxation policies, price controls and exchange rate policies would also present unexpected changes to the aviation industry, which may in turn adversely affect our business, financial condition and results of operations.
18
Table of Contents
The global macroeconomic environment is also facing challenges. The outbreak of COVID-19 pandemic has had an adverse impact on global economic growth. If the global macroeconomic environment worsens, or trade disputes and conflicts continue, the demand of international travel may decrease, and our operations and financial condition may be materially and adversely affected.
Furthermore, the exit of the United Kingdom, or UK, from the Europe Union, or EU, brings uncertainties to the regional economy of Europe and the airline businesses in UK and Europe. UK formally withdrew from the EU on January 31, 2020, and the transition period ended on December 31, 2020. On December 24, 2020, UK and EU agreed on the EU-UK Trade and Cooperation Agreement, or the TCA, which has been effective from January 1, 2021 and covers a broad range of subjects, including air transport and aviation safety. As of the date of this Annual Report, because the existing bilateral air service agreement between UK and China governing the traffic rights continues to apply, the implementation of the TCA had not had a material impact on our business, but the long term impact of the TCA remains unclear. We cannot guarantee that the exit of the UK from EU will not have a negative impact on our operations, financial condition and results of operations in the future.
Lack of adequate documentation for land use rights and ownership of buildings may subject us to challenges and claims by third parties.
Although China has established a system for registration and transfer of land use rights and real property related rights, some of those rights cannot be registered in such system due to historical reasons. We lease certain properties and buildings, which are located in Guangzhou, Wuhan, Haikou and other PRC cities from CSAH. However, CSAH lacks adequate documentation evidencing CSAH’s rights to such land and buildings, and, consequently, the lease agreements between CSAH and us for such land have not been registered with the relevant authorities. As a result, such lease agreements may not be enforceable against a third party. Lack of adequate documentation for land use rights and ownership of buildings may subject us to challenges and claims by third parties with respect to our use of such land and buildings.
As of the date of this Annual Report, we had occupied all of the land and buildings mentioned above without any challenge or claim by third parties. However, we cannot assure that we would not be subject to any challenges in the future. If any challenges to the property ownership or other claims are successful, our operation and business may be materially and adversely affected. CSAH has agreed to indemnify us against any loss or damage caused by or arising from any challenge of, or interference with, our right to use such land and buildings.
19
Table of Contents
Terrorist attacks or the fear of such attacks, even if not made directly on the airline industry, could adversely affect us and the airline industry. The travel industry continues to face on-going security concerns and cost burdens.
The aviation industry has been beset with high-profile terrorist attacks, most notably the terrorist attack on September 11, 2001 in the United States. Terrorist attacks could also affect the aviation industry in China. Airlines in China have experienced several incidents of terrorist attacks or threats. For example, on March 7, 2008, on a China Southern Airlines flight boarding in Urumqi, crew members discovered a terrorist suspect. On July 14, 2010, a passenger jet en route from Urumqi to Guangzhou was forced to make an emergency landing after receiving an anonymous call claiming there was a bomb on the aircraft. On June 29, 2012, there was an attempted hijacking on a passenger flight operated by Tianjin Airlines between Hotan and Urumqi in China’s Xinjiang region. CAAC has enhanced security measures to prevent potential threats of terrorist attacks. Terrorist attacks, even if not made on or targeted directly at the airline industry, or the fear of or the precautions taken in anticipation of such attacks (including elevated threat warnings, travel restrictions, or selective cancellation or redirection of flights), could materially and adversely affect us and the aviation industry. Terrorist attacks may result in substantial flight disruption costs caused by grounding of fleet, a significant increase in security costs and associated passenger inconvenience, increased insurance costs, substantially higher ticket refunds and a significant decrease in traffic measured in revenue passenger kilometers. Additionally, increasingly strict security measures may cause inconvenience to passengers. These factors can have an uncertain impact on the development of the aviation industry and our business.
We may suffer losses in the event of an accident involving our aircraft or the aircraft of any other airline.
An accident involving an aircraft that we operate could expose us to additional repair or replacement expenses, temporary or permanent losses from the disruption of services and significant tort liabilities. Although we believe that we currently maintain liability insurance in amounts and of the types generally consistent with industry practice, the amounts of such coverage may not be adequate to fully cover the costs related to the accident or incident, which could result in a material adverse effect on our results of operations and financial condition. In addition, such an aircraft accident could create a public perception that our operations are not as safe or reliable as those of other airlines, which could harm our competitive position and cause a decrease in our operating revenue. Moreover, a major accident involving the aircraft of any of our competitors may adversely affect the public perception generally of the airline industry, reduce demand for air travel and/or lead to further regulation and costs imposed on the airline industry generally, which would adversely affect our results of operations and financial condition.
The mandatory grounding of our Boeing 737 Max fleet may have a material adverse effect on our business, operating results and financial condition.
On March 11, 2019, the CAAC issued the notice “CAAC Requesting Domestic Transportation Airlines to Suspend the Commercial Operation of the Boeing 737-8 Aircraft”, requiring domestic airlines to suspend the commercial operations of the Boeing 737-8 Aircraft, which is one of the models of Boeing 737 Max series aircraft. On March 13, 2019, the Federal Aviation Administration of the United States issued an emergency order prohibiting the operation of Boeing 737 Max series aircraft by U.S. certificated operators. By late March 2019, all 737 Max aircraft were grounded worldwide. As of December 31, 2022, we owned 34 Boeing 737 Max aircraft and had suspended their commercial operations in accordance with the requirements of the CAAC. As of the date of this Annual Report, the grounding of Boeing 737 Max fleet was lifted in several countries, including the U.S., EU, Canada, Brazil, Mexico and China. In December 2021, CAAC put forward instructions regarding the Boeing 737 Max aircraft that paved the way for the Boeing 737 Max’s return to service in China. As of the date of this Annual Report, we have completed all the preparation work for the Boeing 737 Max’s return to service as required by CAAC. We determine the number of the Boeing 737 Max aircraft returned to service based on our operational needs. We have incurred costs in connection with the grounding of our Boeing 737 Max fleet, as well as experienced delayed deliveries of 737 Max aircraft.
20
Table of Contents
In 2021, based on further negotiation between two parties, Boeing Company agreed to provide consideration in connection with the disruption of our Boeing 737 Max fleet. However, as of the date of this Annual Report, it remains uncertain whether such consideration can be fully provided by Boeing Company. If we are not able to pass on the costs or recover the losses incurred in connection with the grounding of Boeing 737 Max fleet, our financial condition and our results of operations may be negatively affected.
We are subject to stringent laws and contractual obligations related to data privacy and cybersecurity, and we may be exposed to risks related to our management of personal information and other data.
The regulatory environment in China and elsewhere as it relates to the collection, use, transfer, and other processing of data, “important data,” and personal data and other types of information is rapidly evolving and is likely to remain uncertain for the foreseeable future. Regulatory authorities in China have implemented a number of new laws and administrative measures that could impose significant obligations on us, adversely impact our operations or impede our ability to transfer or share information with foreign regulators and others inside and outside of China. For more information on such laws and measures, see “— Chinese Data Privacy and Cybersecurity Laws.”
We routinely receive, collect, store, process, transmit and maintain personal information along with other sensitive data. We may also receive, store, process, generate, control, or otherwise have access to “important data” in our businesses. As such, we are subject to the relevant PRC data security, cyber-security, and personal data protection privacy laws, regulations, and standards that apply to the collection, generation, use, retention, protection, disclosure, transfer and other processing of personal information and “important data”. Based on the size of our Company, the industry sectors in which we operate, and the fact that we are also listed abroad, we expect to be subject to heightened scrutiny and obligations with regard to cybersecurity, data security, and the protection of personal information once all the relevant regulations and rules have been promulgated. Under certain circumstances, we could become subject to cybersecurity review or data security review by the Cyberspace Administration of China, or the CAC, or other related governmental regulatory authorities. We are also subject to contractual obligations regarding the processing of personal information. Legal requirements regarding data protection and privacy continue to evolve and may result in ever-increasing public scrutiny and escalating levels of enforcement and sanctions and increased costs of compliance.
Due to, among other things, our Company’s size and importance in the aviation sector, our involvement in transportation infrastructure, and the fact that we routinely collect and transfer passenger data that may be considered personal information, we expect that we will become subject to a cybersecurity review or data security review in the normal course of regulatory oversight by the CAC or other authorities. However, as of the date of this report, there remains uncertainty about how and when such reviews will take place in practice, as the practical implementation of detailed requirements, procedures and standards of the cybersecurity review or data security review remain unclear and their interpretation and enforcement involve uncertainties. We will continue to assess the impact of cybersecurity and personal information protection laws on our business. We are not aware of any significant difficulties in obtaining relevant permits from the CAC or other related governmental regulatory authorities, including the government security assessment under the Measures for the Security Assessment of Cross-border Data Transmission, or MSACDT. If we become subject to a cybersecurity review or data security review, we may be required to suspend cross-border data transfer or take other preventative and risk-mitigating measures during the review process, which may affect our daily operations; moreover, we cannot guarantee that we will be able to obtain relevant permits, the government security assessment under the MSACDT, in a timely manner or at all. If we are subject to a cybersecurity review or data security review (including the government security assessment under the MSACDT), and are not able to obtain relevant permits in a timely manner or at all, this could significantly limit our ability to use and transfer personal, important and other information, and could also restrict or completely hinder our ability to offer or continue to offer our securities to investors and cause the value of our securities to significantly decline or become worthless. Furthermore, cybersecurity review and/or data security review processes could also result in negative publicity with respect to the Company and diversion of our managerial and financial resources, which could materially and adversely affect our business, financial condition, and results of operations.
21
Table of Contents
In addition, failure to comply with any of these laws, or failure or delay in the completion of the cybersecurity review or data security review procedures, could result in enforcement action against us, including investigations, civil, administrative, and criminal enforcement action, fines, administrative penalties, suspension of business, website closure, revocation of prerequisite licenses, imprisonment of company officers and public censure, claims for damages by customers and other affected individuals, damage to our reputation and loss of goodwill, any of which could have a material adverse effect on our business, financial condition and results of operations.
We have established procedures to protect the confidentiality of the personal information and “important data” we receive, store, process, generate, or otherwise have access to or control over. While we have adopted security policies and measures to protect our proprietary data, important data, and data subjects’ privacy, personal information or important information could be subject to leaks caused by hacking activities, human error, employee misconduct or negligence or system breakdown. We also cooperate with third parties including collaboration partners, airports, ground service agents, aviation sales agents and other third-party contractors and consultants for our operations. Any leakage or abuse of personal data or important data by our third-party partners may be perceived by relevant regulators or the data subjects to have resulted from a failure by us. Furthermore, any change in applicable laws and regulations or the enforcement thereof could affect our ability to use data we process as part of our operations and subject us to liability for the use of such data for previously permitted purposes. Any failure or perceived failure by us to prevent information security breaches or to comply with privacy policies or privacy-related legal obligations, or any compromise of information security that results in the unauthorized release or transfer of personally identifiable information, important data, or other data, could cause our customers or regulators to lose trust in us and could expose us to legal claims or other sanctions. See “- Evolving data security and privacy cybersecurity requirements could increase our costs, and any significant data security incident could disrupt our operations, harm our reputation, expose us to legal risks and otherwise materially adversely affect our business, results of operations and financial condition.”
As of March 31, 2023, we had not been involved in any reviews or investigations relating to cybersecurity or data security initiated by the CAC or related governmental regulatory authorities, and we had not received any inquiry, notice, warning, or sanction in such respect. We believe that we are currently in compliance with the regulations and policies that have been issued by the CAC governing the data privacy and cybersecurity.
The PRC Data Security Law, or the DSL, and the PRC Personal Information Protection Law, or the PIPL, also contain provisions restricting our ability to share personal, important, and other information with foreign regulatory or judicial authorities. These provisions could affect our ability to respond to requests or demands for information from such authorities, including the border control authorities of the country of destination, the SEC, or in judicial proceedings.
Evolving data security and cybersecurity requirements could increase our costs, and any significant data security incident could disrupt our operations, harm our reputation, expose us to legal risks and otherwise materially adversely affect our business, results of operations and financial condition.
Our business requires the secure processing and storage of sensitive information relating to our customers, employees, business partners and others. However, like any global enterprise operating in today’s digital business environment, we are subject to threats to the security of our networks and data, including threats potentially involving criminal hackers, hacktivists, state-sponsored actors, corporate espionage, employee malfeasance, and human or technological error. These threats continue to increase as the frequency, intensity and sophistication of attempted attacks and intrusions increase around the world. We were the target of cybersecurity attacks in the past and expect that we will continue to be in the future.
22
Table of Contents
A significant cybersecurity incident could result in a range of potentially material negative consequences for us, including unauthorized access to, disclosure, modification, misuse, loss or destruction of company systems or data; theft of sensitive, regulated or confidential data, such as personal information, important data or our intellectual property; the loss of functionality of critical systems through ransomware, denial of service or other attacks; and business delays, service or system disruptions, damage to equipment and injury to persons or property. The methods used to obtain unauthorized access, disable or degrade service or sabotage systems are constantly evolving and may be difficult to anticipate or to detect for long periods of time. The constantly changing nature of the threats means that we may not be able to prevent all data security breaches or misuse of data. Similarly, we depend on the ability of our key commercial partners, including our regional carriers, distribution partners and technology vendors, to conduct their businesses in a manner that complies with applicable security standards and assures their ability to perform on a timely basis.
In addition, the costs and operational consequences of defending against, preparing for, responding to and remediating an incident of cybersecurity breach may be substantial. As cybersecurity threats become more frequent, intense and sophisticated, costs of proactive defense measures may increase. Further, we could be exposed to litigation, regulatory enforcement or other legal action as a result of an incident, carrying the potential for damages, fines, sanctions or other penalties, as well as injunctive relief requiring costly compliance measures. A cybersecurity incident could also impact our brand, harm our reputation and adversely impact our relationship with our customers, employees and stockholders. Failure to appropriately address these issues could also give rise to potential legal risks and liabilities.
We could be adversely affected by a failure or disruption of our computer, communications or other technology systems.
We are increasingly dependent on technology to operate our business. To enhance our management of flight operations, we have launched and continued optimizing a new computer system to manage the whole flight operation process. The system utilizes advanced computer and telecommunications technology to manage our flights on a centralized, real-time basis. We believe that the system will enhance the efficiency of flight schedules, increase the utilization of aircraft and improve the coordination of our aircraft maintenance and ground servicing functions. Although we have designed and implemented a variety of security measures and backup plans to prevent or limit the effect of failure, the computer and communications systems on which we rely may be vulnerable to substantial or repeated disruptions due to various factors, some of which are beyond our control, including natural disasters, power failures, terrorist attacks, equipment or software failures and computer viruses and hackers. We cannot assure that the measures we have taken to reduce the risk of some of these potential disruptions are adequate to prevent disruptions to or failures of these systems. Any substantial or repeated failure of those systems could adversely affect our operations and customer services, and result in the loss of important data, loss of revenue and increased costs. Moreover, a failure of our vital systems could limit our ability to operate our flights for an extended period of time, which could have a material adverse effect on our operations and business.
U.S. Holders will be subject to adverse tax consequences if we are considered to be a passive foreign investment company, or PFIC, for U.S. federal income tax purposes
Depending upon the relative values of our passive assets and income as compared to our total assets and income each taxable year, we could be classified as a passive foreign investment company, or PFIC, by the United States Internal Revenue Service, or IRS, for U.S. federal income tax purposes. We believe that we were not a PFIC for the taxable year 2022. However, there is no assurance that the IRS will not take a contrary position and assert that we are a PFIC, and no assurances can be given that we will not become a PFIC at some point in the future. U.S. Holders are urged to consult their tax advisors regarding the effects of the PFIC rules.
We will be classified as a PFIC in any taxable year if either: (1) the average value during the taxable year of our assets that produce passive income, or are held for the production of passive income, is at least 50% of the average value of our total assets for such taxable year (the “Asset Test”) or (2) 75% or more of our gross income for the taxable year is passive income (such as certain dividends, interest or royalties) (the “Income Test”). For purposes of the Asset Test: (1) any cash, cash equivalents, and cash invested in short-term, interest bearing, debt instruments, or bank deposits that is readily convertible into cash, will generally count as producing passive income or as being held for the production of passive income and (2) the average values of our passive and total assets is calculated based on our market capitalization.
23
Table of Contents
If we were a PFIC, we would generally be subject to additional taxes and interest charges on certain “excess distributions” our Company makes regardless of whether we continue to be a PFIC in the year in which you receive an “excess distribution”. An “excess distribution” would be either (1) the excess amount of a distribution with respect to ADSs during a taxable year in which distributions to you exceed 125% of the average annual distributions to you over the preceding three taxable years or, if shorter, your holding period for the ADSs, or (2) 100% of the gain from the disposition of ADSs. For more information on the United States federal income tax consequences to you that would result from our classification as a PFIC, please see Item 10, “Taxation — United States Federal Income Taxation — U.S. Holders — Passive Foreign Investment Company”.
We may be unable to retain our senior management team or other key employees.
We are dependent to a large extent on the experience and industry knowledge of our senior management team and other key employees and we cannot assure that we will be able to retain them. As of the date of this Annual Report, we do not carry key personnel insurance for any of these personnel. We compete to attract and retain these key personnel with other airlines, some of which may offer better compensation arrangements. Furthermore, the negative impact of COVID-19 pandemic on the airline industry has made it more challenging for us to compete to attract and retain these key personnel with companies in other industries. Although we have not had difficulty in attracting and retaining qualified key personnel in the past, we cannot guarantee that this will continue to be the case. Any inability to attract and retain talented and highly qualified senior management team or other key employees could have a negative impact on us.
Our results of operations may be negatively impacted by any jet fuel shortages or any fluctuation in domestic prices for jet fuel.
The availability and cost of jet fuel have a significant impact on our financial condition and results of operations. Prior to 1993, jet fuel shortages regularly occurred in China, as a result of which we had to cancel or delay flights. Although we have not experienced jet fuel shortages since 1993, we cannot assure that such shortages would not occur again, and if such a shortage occurs and causes us to delay or cancel flights, our reputation among passengers as well as our operations may suffer.
Domestic prices for jet fuel have experienced fluctuations in the past few years and may continue to fluctuate in the future due to various factors. In March 2022, due to a number of factors including geopolitical conflicts, reduction of crude oil production and recovery of the economy, international oil prices climbed to the highest point since 2008. As a result, the international crude oil prices for the entire year of 2022 were at a relatively high level as compared to recent years. In 2022, our jet fuel cost accounted for 63.76% of our flight operation expenses, and such increase in the fuel price negatively affected our financial performance due to our sensitivity to fuel prices. For more information on jet fuel prices, please see “Item 4. Information on the Company — Business Overview — Jet Fuel” section below for further discussion.
In 2022, a reasonable possible increase or decrease of 10% in average jet fuel prices with the volume of fuel consumed and all other variables held constant, would have increased or decreased our annual fuel costs by approximately RMB3,267 million. Accordingly, even if the jet fuel supply remains stable, increases in jet fuel prices will nevertheless adversely impact our financial results.
24
Table of Contents
Our profit for the year may suffer from unexpected volatility caused by any fluctuation in the level of fuel surcharges.
The level of fuel surcharges, which is regulated by Chinese government, affects domestic customers’ air travel demands as well as our ability to generate profits. On January 14, 2009, the NDRC and the CAAC jointly announced that the collection of passenger fuel surcharges for domestic routes should be suspended from January 15, 2009 and onwards. Subsequently, in response to the increase in international fuel prices, the NDRC and CAAC issued a notice on November 11, 2009 to introduce a new pricing mechanism of fuel surcharges that linked it with airlines’ jet fuel costs, which was further adjusted subsequently. On October 14, 2011, the NDRC and the CAAC issued a notice to adjust such pricing mechanism. As a result of this adjustment, the maximum rates for fuel surcharges can be adjusted according to the pricing mechanism of fuel surcharges, if the aggregated change in jet fuel costs exceeds RMB250 per ton. Due to the decrease in the jet fuel cost, the fuel surcharges were suspended in February 5, 2015. In March 2015, the NDRC and the CAAC issued the “Notice on Adjusting the Base Oil Price of the Passenger Transportation Fuel Addition and Aviation Kerosene Price Linkage Mechanism of Civil Aviation Domestic Routes”, pursuant to which, when the domestic aviation kerosene comprehensive procurement cost exceeds RMB5,000 per ton, an air transport enterprise can collect a fuel surcharge according to the linkage mechanism. In accordance with the above regulations, we adjusted the fuel surcharges for domestic routes from June 5, 2018 (the date of issue), and, as a result, each passenger was charged RMB10 for domestic flight segments (including domestic segments of international routes) under 800 kilometers, 800 kilometers and above 800 kilometers. The fuel surcharges for domestic routes were suspended after January 5, 2019. We adjusted the fuel surcharges for domestic routes from November 5, 2021 (the date of issue), and, as a result, each passenger was charged RMB10 for domestic flight segments (including domestic segments of international routes) under 800 kilometers and 800 kilometers, and RMB20 for domestic flight segments (including domestic segments of international routes) above 800 kilometers. We cannot guarantee that fuel surcharges will not be adjusted further in the future or adjusted in our favor. If fuel surcharges are not adjusted in relation to the increase in jet fuel costs, our profit for the year may be materially adversely affected.
Risks Relating to the Chinese Commercial Aviation Industry
Our business is subject to extensive government regulations.
The Chinese commercial aviation industry is subject to extensive regulatory and legal oversight. The CAAC issues and implements several regulations and policies, which encompass substantially all aspects of the Chinese commercial aviation industry, such as the approval of route allocation, the administration of certain airport operations, air traffic control and pilot flight time limitations. From 2020 to 2022, in order to stem the spread of the COVID-19 pandemic, the CAAC issued various guidance, orders and notices with regard to the implementation of precautionary measures in airline operations, including cleaning and sanitizing procedures, face-covering and social distancing requirements and measures for reducing physical touch points. In addition, in response to the challenges faced by the Chinese commercial aviation industry due to the COIVD-19 pandemic, the CAAC also issued several policies to support Chinese airlines, including reduction or waiver of certain fees, funding support in respect of infrastructures, and simplification of certain approval procedures. On January 8, 2023, CAAC removed the restrictions on international flights from and to China and limitations on the number of international routes and flights each airline in China could operate. Starting from April 1, 2021, the Ministry of Finance reduced airlines’ contributions to the Civil Aviation Development Fund by 20%, on top of the 50% reduction that was implemented in July 2019. Since December 1, 2020, the CAAC and NDRC further expanded the scope of routes to which a market-oriented pricing policy may apply, with an additional 370 routes are covered by such expansion. The CAAC continues to implement extensive legal oversight and supervision on the commercial aviation industry, and as a result, we may face significant constraints on our flexibility and ability to conduct our business or maximize our profitability.
Our results of operations tend to be volatile and fluctuate due to seasonality.
The aviation industry is characterized by annual high and low travel seasons. Our operating revenue is substantially dependent on the passenger and cargo traffic volume carried, which is subject to seasonal and other changes in traffic patterns, the availability of appropriate time slots for our flights and alternative routes, the degree of competition from other airlines and alternate means of transportation, as well as other factors that may influence passenger travel demand and cargo and mail volume. In particular, our airline revenue is generally higher in the second half of the year than in the first half of the year due to the greater demand for air travel during the summer months, although such difference has become less notable during the period from 2020 to 2022 as the traditional seasonal travel pattern were affected by the COVID-19 pandemic. As a result, our results tend to be volatile and subject to rapid and unexpected change.
25
Table of Contents
Our operations may be adversely affected by insufficient aviation infrastructure in the Chinese commercial aviation industry.
The rapid increase in air traffic volume in China in recent years has put pressure on many components of the Chinese commercial aviation industry, including China’s air traffic control system, the availability of qualified flight personnel and airport facilities. Airlines, such as our Company, which have route networks that emphasize short- to medium-haul routes, are generally more affected by insufficient aviation infrastructure in terms of on-time performance and high operating costs due to fuel inefficiencies resulting from the relatively short segments flown, as well as the relatively high proportion of time on the ground during turnaround. All of these factors may adversely affect the perception of the service provided by an airline and, consequently, the airline’s operating results. In recent years, the CAAC placed increasing emphasis on the safety of Chinese airline operations and implemented measures aimed at improving the safety record of the industry. Our ability to increase utilization rates and to provide safe and efficient air transportation in the future will depend in part on factors such as the improvement of national air traffic control, navigation systems and ground control operations at Chinese airports, which are beyond our control.
In 2020, the Company completed the move of all flights in our previous Beijing hub, Beijing Capital International Airport, or Beijing Airport, to Beijing Daxing International Airport, or Daxing Airport. Because Daxing Airport is farther from the urban area of Beijing than Beijing Airport and a longer commute time is therefore required between the airport and the city, we had to implement certain promotion activities, including but not limited to lowering ticket prices and distributing discount coupons for ground transportation, to attract passengers to take our flights from the Daxing Airport. We expect to continue implementing such promotion activities for an extended period of time. These measures may have an adverse effect on our operating revenue and profits if we have to continue offering lower prices in the future.
We face increasingly intense competition in both domestic and international markets, which may materially and adversely affect our business.
Competition has become increasingly intense in recent years in our domestic market, due to a relaxation of certain regulations by the CAAC and increase in the capacity, routes and flights of Chinese airlines, as well as other factors. Beginning from 2020, the COVID-19 pandemic has intensified such competition in the domestic market as a significant amount of international routes capacity was transferred to domestic routes and led to an imbalance in the supply-demand in the domestic market.
We face varying degrees of competition on regional routes from certain Chinese airlines as well as Cathay Pacific and Air Macau, and on our international routes, primarily from non-Chinese airlines, most of which have significantly longer operating histories, substantially greater financial and technological resources and greater brand recognition than us. Many of our international competitors have larger sales networks, participate in more comprehensive and convenient reservation systems, or engage in more promotional activities, which may enhance their ability to attract international passengers.
We expect to face substantial competition from alternative means of transportation, especially as a result of the rapid development of the Chinese rail network.
For short-distance transportation, airplanes, trains and buses are alternatives to each other. Given the recent rapid development of high-speed trains, the construction of nationwide high-speed railway network and the improvement of inter-city expressway network, the commercial aviation sector as a whole faces increasing competition from those alternative means of transportation.
The PRC government is aggressively expanding its high speed rail network. The mileage of new railway lines put into operation in 2022 reached about 4,100 kilometers. As of December 31, 2022, China’s railway traffic mileage reached 155,000 kilometers, of which about 42,000 kilometers were covered by high-speed railway, ranking first around the world in terms of total high-speed railway traffic mileage. According to the latest development goal of China Railway, China’s railway traffic mileage will reach 200,000 kilometers by 2035, of which 70,000 kilometers will be covered by high-speed railway. The operating results of our air routes that are overlapping with the high-speed railway corridors (especially air routes with a distance of less than 800 kilometers) have been adversely affected, and we expect the continued development of the high speed rail network will continue to adversely affect our operating results in the future.
26
Table of Contents
Limitations on foreign ownership of Chinese airlines may affect our access to funding in the international equity capital markets.
The current Chinese government policies limit foreign ownership of Chinese airlines. Under these policies, non-PRC, Hong Kong, Macau, Taiwan residents can only hold up to 49% of equity interest in a Chinese airline. As of March 31, 2023, we estimate that no more than 11.01% of our total outstanding ordinary shares were held by non-PRC, Hong Kong, Macau and Taiwan residents. Through the Provisions on Domestic Investment in Civil Aviation Industry, effective on January 19, 2018, the Chinese government has loosened restrictions on state ownership of our total outstanding ordinary shares, which allows the percentage of state-owned shares to be under 50%. However, for so long as the limitation on foreign ownership is in force, we will have limited access to funding in the international equity capital markets.
The commercial aviation industry is subject to risks associated with climate change, including the increasingly stringent environmental regulation to protest against emissions. Failure to comply with existing or future environmental regulations or to otherwise manage the risks of climate change effectively could have a material adverse effect on our business.
As the climate change challenges remain a key focus area globally, the environmental regulation development and implementation have been constantly evolving and changing over the past decade. Our operations are subject to extensive and increasingly stringent national, local and international laws governing environment protection. Compliance with existing and future environmental laws and regulations could increase our operational costs, and violations of such laws and regulations could result in significant fines and penalties as well as reputational harm. Such regulation could also result in tax, regulatory or permitting requirements from multiple jurisdictions for the same operations and costs for the aviation industry, including us. In addition to direct costs, such regulation may increase fuel costs passed through from fuel suppliers regulated by any such regulations. For more details, see “Item 4. Information on the Company – Business overview – Regulation – Environment”.
For example, the European Emissions Trading Scheme may increase our operational cost. Starting on January 1, 2012, the aviation sector has been included in the European Emissions Trading Scheme (ETS), EU’s mandatory cap-and-trade system for reduction of greenhouse gas emissions. Airline operators in the EU has received tradable emission permits (aviation allowances) covering a certain level of their CO2 emissions per year for their flights operating to and from EU airports. If an airline fails to obtain free-of-charge emission permits from the EU, it will have to buy around EUR10 million (RMB100 million) worth of CO2 emissions allowances from other greener industries. Pursuant to this policy, Chinese airlines having flight points in Europe undertake the same carbon emission reductions obligation as the European local airlines, which will result in a significant increase in the operating cost of Chinese airlines in Europe, including our Company, and further have an adverse impact on the results of operations and financial condition. In March 2011, a group representing China’s largest airlines sent a formal notice to the EU expressing strong opposition to non-member-state airlines’ inclusion in the EU’s Emissions Trading Scheme. Also, in early February 2012, CAAC issued instructions to various airlines announcing that without approval from the relevant Chinese government authorities, the major airlines are prohibited from joining EU-ETS and the transport airlines are also prohibited from raising the freight price or increasing fee items under this reason. On November 12, 2012, the EU announced it was temporarily suspending the implementation of the ETS in the aviation sector in 2013 in order to forge a positive negotiation environment for all parties. In November 2014, CAAC issued a notification on the ETS. The notification provided that CAAC would not prohibit Chinese airlines to take part in the ETS if the relevant flights take off and land between the airports within the EU during 2012 and 2016. We have operated a few flights between airports within the EU since 2012, and expect to continue to operate a few flights between airports within the EU in the future. Therefore, we submitted emission reports and paid the quota between 2012 and 2016 for our flights between airports within the EU. In April 2015, our Company completed submission of emissions reports for the years 2012 to 2014 and fulfilled our obligations under the ETS. In 2016, our Company finished year 2015 compliance cycle. On year 2017-2018 compliance cycle, our Company had been in compliance with the requirements of relevant PRC laws and the ETS. The Company completed the compliance work on 2019 EU carbon trading and Guangdong carbon trading as scheduled, and sold 695,000 tonnes of Guangdong carbon quota accumulated over the years due to the improvement of flight emission efficiency through public auctions. For the year 2019-2020 compliance cycle, our Company had been in compliance with the requirements of relevant PRC laws and the ETS. In 2021, we also participated in the UK ETS in addition to the EU ETS. The compliance work for 2022 is ongoing and will be carried out pursuant to relevant requirements. During the reporting period, the Company continued to implement environmental protection measures. For more details, see “Item 4. Information on the Company – Business Overview – Environment”. However, there can be no assurance that the ETS will not have negative impact on our financial condition and result of operations.
27
Table of Contents
While the specific nature of future actions relate to climate change is hard to predict, it is likely that they could impose significant additional costs on our operations and affect our business.
We may utilize fuel hedging arrangements which may result in losses.
We may hedge a portion of our future fuel requirements through various financial derivative instruments linked to certain fuel commodities to lock in fuel costs within a hedged price range. We entered into fuel hedging contracts in March and April 2020, and we have not entered into any fuel hedging transactions since the fourth quarter of 2020. These hedging strategies may not always be effective and high fluctuations in aviation fuel prices exceeding the locked-in price ranges may result in losses. Significant declines in fuel prices may substantially increase the costs associated with our fuel hedging arrangements. In addition, while we seek to manage the risk of fuel price increases by using derivative contracts, we cannot assure you that, at any given point in time, our fuel hedging transactions will provide any particular level of protection against increased fuel costs.
ITEM 4. INFORMATION ON THE COMPANY
A. HISTORY AND DEVELOPMENT OF OUR COMPANY
We were incorporated under the PRC laws on March 25, 1995 as a joint stock company with limited liability under the name of China Southern Airlines Company Limited. The address of our principal place of business is 68 Qi Xin Road, Guangzhou 510403, People’s Republic of China. Our telephone number is +86 20 8611 2480 and our website is www.csair.com.
The information contained on or connected to our website is not incorporated by reference into this Annual Report and should not be considered part of this or any other report filed with the SEC. Our filings with the SEC, including reports, proxy and information statements, and other information regarding us that we file electronically with the SEC are available on the SEC’s websites at www.sec.gov.
Restructuring and Initial Public Offering
As part of China’s economic reforms in the 1980s, the PRC State Council directed the CAAC to separate its governmental, administrative and regulatory role from the commercial airline operations that were being conducted by the CAAC and its regional administrators. As a result, CSAH was established on January 26, 1991 for the purpose of assuming the airline and airline-related commercial operations of the Guangzhou Civil Aviation Administration, one of the then six regional bureaus of the CAAC.
CSAH was restructured in 1994 and 1995 in anticipation of our initial public offering. The restructuring was effected through the establishment of our Company and the execution of the De-merger Agreement on March 25, 1995 by and between CSAH and our Company. Upon the restructuring, our Company assumed substantially the entire airline and airline-related businesses, assets and liabilities of CSAH, and CSAH retained its non-airline-related businesses, assets and liabilities. All interests, rights, duties and obligations of CSAH, whenever created or accrued, were divided between our Company and CSAH based on the businesses, assets and liabilities assumed by each of them under the De-merger Agreement. Under the De-merger Agreement, CSAH agreed not to conduct, participate or hold any interest in, either directly or indirectly, any business, activity or entity in or outside China that competes or is likely to compete with the commercial interests of our Company, although CSAH may continue to hold and control its affiliates existing on the date of the De-merger Agreement and may continue to operate the businesses of such affiliates. Under the De-merger Agreement, CSAH and our Company also agreed to indemnify each other against any losses, claims, damage, debts or expenses arising out of or in connection with the restructuring. As of the date of this Annual Report, no indemnity has been provided by either CSAH or us.
28
Table of Contents
In July 1997, we completed a private placement of 32,200,000 H Shares to certain limited partnership investment funds affiliated with Goldman Sachs & Co. and an initial public offering of 1,141,978,000 H Shares, par value RMB1.00 per share, and the listing of the H Shares on the Hong Kong Stock Exchange and ADSs representing H Shares on the New York Stock Exchange. Prior to the private placement and the initial public offering, all of our issued and outstanding shares of capital stock, consisting of 2,200,000,000 non-tradable domestic shares (“Domestic Shares”), par value RMB1.00 per share, were owned by CSAH, which owned and exercised, on behalf of the Chinese government and under the supervision of the CAAC, the rights of ownership of such Domestic Shares. After giving effect to the private placement and the initial public offering, CSAH maintained its ownership of the 2,200,000,000 Domestic Shares (representing approximately 65.2% of the then total share capital of our Company), and became entitled to elect all the directors of our Company and to control the management and policies of our Group. The Domestic Shares and H Shares are both ordinary shares of our Company.
In July 2003, we issued 1,000,000,000 A Shares, par value of RMB1.00 per share, and listed these shares on the Shanghai Stock Exchange. Subsequent to the issuance of the A Shares, the shareholding of CSAH in our Company was reduced from 65.2% to 50.30%.
On January 23, 2023, we filed a Form 25 to delist our ADSs from the New York Stock Exchange. The delisting became effective on February 3, 2023, and our ADR program was terminated on March 6, 2023.
Share Reform Scheme
Pursuant to relevant PRC laws, we launched the share reform scheme in May 2007, whereby all the 2,200,000,000 non-tradable Domestic Shares held by CSAH were converted into tradable A Shares. Upon the completion of such scheme on June 20, 2008, all the non-tradable Domestic Shares have been successfully converted into tradable A Shares.
Bonus Shares Issuance by Conversion of Share Premium
On June 25, 2008, our shareholders approved the issuance of bonus shares by way of conversion of the share premium, and on August 14, 2008, the Ministry of Commerce approved the bonus share issuance. The issuance was effected by conversion of share premium on the basis of five new shares, credited as fully paid, for every 10 existing shares. Upon the completion of the bonus share issuance of 2,187,089,000 shares, as of December 31, 2007, the number of paid up shares increased from 4,374,178,000 shares to 6,561,267,000 shares.
Aircraft Acquisitions
On April 26, 2017, we entered into an aircraft purchase agreement with Airbus S.A.S to purchase 20 A350-900 series aircraft. The catalogue price of one A350 series aircraft is approximately US$299 million. The aggregate consideration for the purchase will be funded partly by internal sources of our Company and partly through commercial loans by commercial banks. Six A350-900 series aircraft were delivered to us in 2019 and two A350-900 series aircraft were delivered to our Company in 2020. In 2021, four A350-900 series aircraft were delivered to us. In 2022, four A350-900 series aircraft were delivered to us. The remaining four A350-900 aircraft were scheduled to be delivered to our Company during 2023.
On October 20, 2017, we entered into an aircraft purchase agreement with Boeing to purchase eight B777-300ER and 30 B737-8 series aircraft. The catalogue price of each B777-300ER series aircraft and each B737-8 series aircraft is approximately US$318 million and US$104 million, respectively. The aggregate consideration for the purchase will be funded partly by internal sources of our Company and partly through commercial loans by commercial banks. The aircraft were scheduled to be delivered in stages to our Company during the period from 2019 to 2020. On February 28, 2019, we entered into a supplemental Boeing aircraft purchase agreement with Boeing to amend the terms of the aforesaid aircraft purchase agreement to change the two B777-300ER aircraft originally agreed to be acquired by our Company to two B777F aircraft. These two B777F aircraft were delivered to us on schedule in 2020. None of Boeing 737-8 series aircraft was delivered to our Company from 2019 and 2021. As of the date of this Annual Report, the delivery schedule of the remaining Boeing 737-8 series aircraft had not been determined.
29
Table of Contents
On March 21, 2018, Xiamen Airlines entered into a Boeing Aircraft purchase agreement with Boeing to purchase the 20 B737-8 aircraft and 10 B737-10 aircraft. The catalogue price of each B737-8 series aircraft and B737-10 series aircraft is approximately US$104 million and US$116 million, respectively. The aggregate consideration for the purchase will be partially funded by financing arrangements with banks or other institutions. The aircraft were scheduled to be delivered in stages to Xiamen Airlines during the period from 2019 to 2022. One Boeing 737-8 was delivered to Xiamen Airlines in 2019 but no Boeing 737-8 series aircraft was delivered to Xiamen Airlines in 2020 and 2021. As of the date of this Annual Report, the delivery schedule of the remaining Boeing 737 series aircraft had not been determined.
On August 30, 2019, we entered into an aircraft purchase agreement with Commercial Aircraft Corporation of China Limited (“Comac”), pursuant to which we agreed to purchase 35 ARJ21-700 aircraft. The catalogue price of each ARJ21-700 aircraft is approximately US$38 million. The aggregate consideration for this purchase will be partially funded by financing arrangements with banks or other institutions. Three ARJ21-700 aircraft were delivered in stages to our Company in 2020, four ARJ21-700 aircraft were delivered in stages to our Company in 2021 and eight ARJ21-700 aircraft were delivered in stages to our Company in 2022. The remaining 20 ARJ21-700 aircraft were scheduled to be delivered to our Company during the period from 2023 to 2024.
On July 1, 2022, we entered into an aircraft purchase agreement with Airbus S.A.S to purchase 96 A320NEO family aircraft. The catalogue price of each A320NEO family aircraft is in the range between US$105 million and US$136 million. The aggregate consideration for this purchase will be partially funded by internal resources of the Group and partly through loans or other finance arrangement with banks or other institutions. The 96 A320NEO aircraft are scheduled to be delivered in stages to our Company during the period from 2024 to 2027, of which 30 aircraft will be delivered in 2024, 40 aircraft in 2025, 19 aircraft in 2026 and seven aircraft in 2027.
On September 22, 2022, Xiamen Airlines entered into an aircraft purchase agreement with Airbus S.A.S to purchase 40 A320NEO family aircraft. The catalogue price of each A320NEO family aircraft is in the range between US$105 million and US$136 million. The aggregate consideration for this purchase will be partially funded by internal resources of the Group and partly through loans or other finance arrangement with banks or other institutions. The 40 A320NEO aircraft are scheduled to be delivered in stages to Xiamen Airlines during the period from 2024 to 2027.
During the reporting period, our Group introduced 23 aircraft (including one operating leased aircraft, 12 financing leased aircraft and 10 self-purchased aircraft), and disposed of seven aircraft (including three A380 series aircraft, two B737 series aircraft and two B747 aircraft). As of the end of the reporting period, the fleet size of our Group reached 894 aircraft, an increase of 16 aircraft compared to the end of 2021.
We had also entered into a few other aircraft purchase agreements prior to 2017 and the delivery schedule of certain of the aircraft has not been determined. For more details on our previous aircraft acquisitions, please refer to the same section in the Annual Report for the fiscal year ended December 31, 2020 on the Form 20-F filed with the Securities and Exchange Commission on April 28, 2021.
Capital Expenditure
Our capital expenditures were RMB22,172 million, RMB21,760 million and RMB22,396 million in 2022, 2021 and 2020, respectively. Of such capital expenditures in 2022, RMB10,467 million was financed by leases, RMB10,390 million was financed by bank borrowings, and RMB875 million was financed by proceeds from issuance of shares and convertible bonds, while the remaining RMB431 million was financed by internal resources. The capital expenditures were primarily incurred as a result of additional investments in aircraft and flight equipment under our fleet expansion plans and, to a small extent, additional investments in other facilities and buildings for operations. As of December 31, 2022, we had total capital commitments for aircraft, engines and related equipment of approximately RMB97,329 million.
Non-Public Subscriptions
For detailed information about our non-public subscriptions, please refer to “Item 7 - Related Party Transactions – Non-Public Subscriptions”.
30
Table of Contents
B. BUSINESS OVERVIEW
General
We provide commercial airline services throughout Mainland China, Hong Kong, Macau and Taiwan regions, Southeast Asia and other parts of the world. Based on CAAC statistics, we are one of the largest Chinese airlines and, as of December 31, 2022, we ranked first in terms of number of passengers carried, number of scheduled flights per week, number of hours flown, number of routes and size of aircraft fleet. The COVID-19 pandemic has had a significant impact on our operations in recent years. During the three years ended December 31, 2022, our RPKs changed from 153,440 million in 2020 to 152,426 million in 2021 and 102,078 million in 2022, while our capacity, measured in terms of ASKs, changed from 214,722 million in 2020 to 213,926 million in 2021 and 153,845 million in 2022. In 2022, our Group carried 63 million passengers and had passenger revenue of RMB60,017 million (approximately US$8,617 million).
We conduct a portion of our airline operations through our airline subsidiaries, namely Xiamen Airlines, Shantou Airlines Company Limited (“Shantou Airlines”), Zhuhai Airlines Company Limited (“Zhuhai Airlines”), Guizhou Airlines Company Limited (“Guizhou Airlines”), Chongqing Airlines Company Limited (“Chongqing Airlines”) and China Southern Airlines Henan Airlines Company Limited (“Henan Airlines”) (collectively, the “Airline Subsidiaries”), all incorporated in China. In 2022, the Airline Subsidiaries carried 27 million passengers and had passenger revenue of RMB24,583 million (approximately US$3,530 million) and accounted for 43.8% and 40.96% of our passengers carried and passenger revenue, respectively.
We also provide air cargo and mail services. Since 2020 in response to the increased demand of freight following the outbreak of the COVID-19 pandemic and to seize the opportunity to increase cargo and mail revenue, we improved the utilization rate of freighters and organized flights by freighters converted from passenger aircraft. Our cargo and mail revenue increased by 71.53% as compared to 2019 to RMB16,493 million in 2020, by 20.58% as compared to 2020 to RMB19,887 million in 2021, and further increased by 5.01% to RMB20,884 million (approximately US$2,999 million) in 2022. Our airline operations, as well as air cargo and mail services, are fully integrated with our airline-related businesses, including aircraft maintenance, ground services and air catering operations.
Our operations primarily focus on the domestic market. In addition, we also operate regional routes and international flights. As of December 31, 2022, we operated 1,327 routes, of which 1,223 were domestic, 94 were international and 10 were regional. We operate the most extensive domestic route network among all Chinese airlines. Our route network covers commercial centers and rapidly developing economic regions in Mainland China. Our regional operations include flights between destinations in Mainland China, Hong Kong and Taiwan. Our international operations include scheduled services to cities in Australia, Bangladesh, Britain, Cambodia, Canada, Dutch, France, Germany, Indonesia, Italy, Japan, Kazakhstan, Kenya, Kyrgyzstan, Laos, Malaysia, Myanmar, Nepal, New Zealand, Pakistan, Philippines, Russia, Singapore, South Korea, Thailand, Turkey, The United Arab Emirates, the United States, Uzbekistan and Vietnam.
We have striven to build the “Guangzhou-Beijing Dual Hub” to establish a new profit model and development mode, and gradually to develop a network-based airline. In 2019, we commenced the operation of CSA base simultaneously with the opening of Beijing Daxing International Airport, and successfully completed the first flight to/from Beijing Daxing and the transition of the first 13 routes in 2019. Since 2020, we have cultivated in the Guangdong-Hong Kong-Macao Greater Bay Area and endeavored to build the Guangzhou hub into a model international aviation hub co-constructed with the province and city. Presently, we have over 50% of the market share in Guangzhou. Our Guangzhou hub has formed its route network featured with Europe and Oceania as its core, Southeast Asia, Southern Asia and Eastern Asia as its hinterlands, and with North America, Middle East and Africa covered. At the same time, we have completed the relocation of all flights in Beijing Airport to Beijing Daxing Airport, with utilized time slots accounting for 45%, becoming the largest main base airline in Beijing Daxing Airport, thus providing favorable conditions and resources for the development of our new Beijing hub. By comprehensively advancing the strategic layout of the “dual hubs”, we have further improved our institutional mechanisms and supporting resources to form a new development layout of CSA with Guangzhou Hub in the south and Beijing Hub in the north. In 2021, we further advanced the hub network strategy, and accelerated the construction of two comprehensive international hubs in Guangzhou and Beijing. In 2022, we continued to optimize our flight time slots at Beijing Daxing Airport and increase the number of flights departing from Beijing with a high contribution margin. Our market share at Beijing Daxing Airport reached 53.7% in 2022. We also continued to enhance our market-leading position in the Guangdong-Hong Kong-Macao Greater Bay Area and proactively pursue new time slots. We maintained a leading position in terms of market share for flights departing from Guangzhou, Shenzhen, Zhuhai and Huizhou.
31
Table of Contents
Our corporate headquarters and principal base of operations are located in Guangzhou, the capital of Guangdong Province and the largest city in southern China. Located in the rapidly developing Pearl River Delta region, Guangzhou is also the transportation hub of southern China and one of China’s major gateway cities. Guangzhou’s significance has increased as the transportation infrastructure of Guangdong Province has developed through the construction and development of expressways, an extensive rail network and the port cities of Guangzhou, Shenzhen, Zhanjiang, Zhuhai and Shantou. In 2022, the Company continued the construction integrating the Guangdong-Hong Kong-Macao Greater Bay Area, which drove the flow of people, logistics, information and capital in Guangdong Province and the entire Guangdong-Hong Kong-Macao Greater Bay Area, and enhanced the connectivity between the Guangdong-Hong Kong-Macao Greater Bay Area city cluster and major global city clusters.
As of December 31, 2022, we had a fleet of 894 aircraft, consisting primarily of Boeing 737, 777, 787 series, Airbus 320, 330, 350, 380 series, EMB 190 series and ARJ 21 series. The average age of our registered aircraft was 8.7 years as of December 31, 2022.
Impact of the COVID-19 Pandemic
The widespread and persistent impact of COVID-19 pandemic and the related travel restrictions and social distancing measures implemented throughout the world have significantly reduced demand for air travel. After initially impacting our business in domestic market significantly beginning in January 2020, the spread of the virus resulted in a global pandemic and has significantly affected our entire route network since March 2020. As a result, our business and results of operations in 2020, 2021 and 2022 were materially adversely affected.
32
Table of Contents
During the reporting period, we implemented the responsibilities for pandemic prevention and control, and continued to improve pandemic prevention and control working mechanism. With reference to the national pandemic prevention and control policies, we updated and improved the Company’s pandemic prevention system and measures in a timely manner; we put a premium on the prevention of imported pandemic from overseas, advanced pandemic prevention check points, adopted pandemic prevention management and control measures for inbound tourists and formulated guidelines for the whole-process pandemic prevention for international flight crew; and we actively coordinated with national pandemic prevention and control measures, and promoted full coverage of vaccination and 100% completion of booster injection for international flight crew and personnel in high-risk positions.
Route Network
Overview
We operate the most extensive route network among all Chinese airlines. As of December 31, 2022, we operated 1,327 routes consisting of 1,223 domestic routes, 10 regional routes and 94 international routes.
We continually evaluate our network of domestic, regional and international routes in light of our operating profitability and efficiency. We seek to coordinate flight schedules with the Airline Subsidiaries on shared routes to maximize load factors and utilization rates. The operation of domestic, regional and international routes is subject to approval of the CAAC, and the operation of regional and international routes is also subject to agreements between the Chinese government and the government of the Hong Kong SAR, the government of the Macau SAR, the government of Taiwan province and the government of the proposed foreign destination. Beginning in 2020, due to the COVID-19 pandemic and its negative impact on the air travel demand in domestic and international markets, as well as the various travel restrictions and border control measures implemented by government authorities of China and other countries, we had to make certain adjustments to our routes, including temporarily suspending or reducing the number of flights on some routes. Both of our international and domestic routes were significantly affected in 2022 and have been gradually recovering since the beginning of 2023.
In order to expand our route network, we have entered into code-sharing agreements with several international airlines, including Air France, American Airlines, Asiana Airlines, Inc., China Airlines/Mandarin Airlines, Czech Airlines, Delta Air Lines, Emirates, Etihad Airways, Finnair, ITA Airways, Japan Airlines, KLM Royal Dutch Airlines, Korean Air, Malaysia Airlines Berhad, Pakistan International Airlines, PT. Garuda Indonesia (Persero) Tbk., Qantas Airways Limited, Qatar Airways, Saudi Arabian Airlines, Vietnam Airlines and WestJet. Under the code-sharing agreements, the participating airlines are permitted to sell tickets on certain international routes operated by us to passengers using their codes. Similarly, we are permitted to sell tickets for the other participating airlines using the CZ code. The code-sharing agreements help increase the number of our international sales outlets. We continued the implementation of code-sharing during the reporting period.
The following table sets forth certain statistical information with respect to our passenger, cargo and mail traffic for the years indicated.
| Passenger carried | Cargo and mail carried (tons) |
Total traffic (tons kilometers) |
||||||||||||||||||||||
| Year | Total (in millions) |
Increase (decrease) over previous year (%) |
Total (in thousand tons) |
Increase (decrease) over previous year (%) |
Total (in millions) |
Increase (decrease) over previous year (%) |
||||||||||||||||||
| 2020 |
96.86 | (36.12 | ) | 1,461 | (17.17 | ) | 20,805 | (36.23 | ) | |||||||||||||||
| 2021 |
98.50 | 1.7 | 1,442 | (1.29 | ) | 21,209 | 1.94 | |||||||||||||||||
| 2022 |
62.64 | (36.41 | ) | 1,327 | (7.98 | ) | 16,384 | (22.75 | ) | |||||||||||||||
Route Bases
In addition to our main route bases including Guangzhou and Beijing as core hubs, we maintain regional route bases in Zhengzhou, Wuhan, Changsha, Shenzhen, Shenyang, Changchun, Dalian, Harbin, Haikou, Zhuhai, Shanghai, Xi’an, Nanning, Shantou, Guiyang, Urumqi, Chengdu, Kunming, Chongqing and Sanya. Most of our regional route bases are located in provincial capitals or major commercial centers in the PRC.
33
Table of Contents
We believe that our extensive network of route bases enables us to coordinate flights and deploy our aircraft more effectively and to provide more convenient connecting flight schedules and access service and maintenance facilities for our aircraft. We believe that the number and location of these route bases may enhance our ability to obtain the CAAC’s approval of requests by our Group to open new routes and provide additional flights between these bases and other destinations in China. Current regulations of the CAAC generally limit airlines to operations principally conducted from their respective route bases.
Domestic Routes
Our domestic routes network serves substantially all provinces and autonomous regions in China, including Guangdong, Fujian, Hubei, Hunan, Hainan, Guangxi, Guizhou, Henan, Heilongjiang, Jilin, Liaoning, Sichuan, Yunnan, Shannxi and Xinjiang and serves all four centrally-administered municipalities in China, namely, Beijing, Shanghai, Tianjin and Chongqing. In 2022, our most frequent domestic routes were: Shanghai Hongqiao-Shenzhen, Guangzhou-Hangzhou, Guangzhou-Beijing Daxing, Guangzhou-Shanghai Hongqiao, Beijing Daxing-Shenzhen, Shenzhen-Hangzhou, Chengdu-Beijing Daxing, Guangzhou-Chengdu, Guangzhou-Kunming and Guangzhou-Nanjing.
Regional Routes
We offer scheduled service between Hong Kong and Shenyang, Wuhan; and between Taipei and Shanghai. In 2022, we conducted a total of 1,838 flights on our regional routes.
Previously, direct flights between Mainland China and Taiwan were only available during certain festivals. Other than that, travelers between Mainland China and Taiwan had to make use of intermediate stops in Hong Kong or elsewhere. Since July 2008, however, the ban on direct flights was liberalized to allow direct charter flights on weekends. We were the first Chinese carrier to fly nonstop to Taiwan. On November 4, 2008, Mainland China and Taiwan agreed to have regular direct passenger charter flights across the Taiwan Strait. On August 31, 2009, Mainland China and Taiwan increased the number of regular cross-Strait direct passenger flights from 108 to 270 a week. In 2020, before the outbreak of the COVID-19 pandemic, we planned to operate 16 routes to Taiwan, which were reduced to one (Shanghai Pudong-Taipei) due to CAAC’s requirements in response to the COVID-19 pandemic. As of December 31, 2022, only one route (Shanghai Pudong-Taipei) was retained.
International Routes
We are the principal Chinese airline serving Southeast Asian destinations and Australasia, including Singapore and major cities in Australia, Bangladesh, Cambodia, Indonesia, Malaysia, New Zealand, Philippines, Thailand and Vietnam.
Our international operations include scheduled services to cities in Australia, Bangladesh, Britain, Cambodia, Canada, Dutch, France, Germany, Indonesia, Italy, Japan, Kazakhstan, Kenya, Kyrgyzstan, Laos, Malaysia, Myanmar, Nepal, New Zealand, Pakistan, Philippines, Russia, Singapore, South Korea, Thailand, Turkey, The United Arab Emirates, United States of American (USA), Uzbekistan and Vietnam.
In 2022, our most frequent international routes were: Guangzhou-Auckland, Guangzhou-Los Angeles, Guangzhou-Sydney, Wuhan-Islamabad, Guangzhou-Tokyo, Guangzhou-Seoul, Shenzhen-Jakarta and Guangzhou-Seoul. Beginning in 2020, our international operations were severely affected by the impact of the COVID-19 pandemic. See Item 3. “Key Information – Risk Factors – The outbreak and global spread of the COVID-19 pandemic have had a material adverse effect on our business. The duration and severity of the pandemic, and similar public health threats or a large scale natural disaster we may face in the future, could result in additional adverse effects on our business”.
34
Table of Contents
Aircraft Fleet
Our fleet plan in recent years emphasized expansion and modernization through the acquisition of new aircraft and the retirement of less efficient and old aircraft. As of December 31, 2022, we operated a fleet of 894 aircraft with an average age of 8.7 years. Most aircraft of our Group are Boeing and Airbus aircraft. We have the largest fleet among Chinese airline companies. Please see the table below for a list of our aircraft in terms of respective passenger capacity.
| Model | Number of Aircraft |
Passenger Capacity | ||||
| Airbus 380 series |
2 | 506 | ||||
| Airbus 350 series |
16 | 314 | ||||
| Airbus 330 series |
40 | 218/258/259/260/278/283/284/286 | ||||
| Airbus 320 series |
344 | 94/130/138/152/160/166/179/189/195/200/208 | ||||
| Boeing 787 series |
39 | 237/266/276/287/297 | ||||
| Boeing 777 series |
15 | 361 | ||||
| Boeing 737 series |
397 | 128/134/159/161/164/169/170/172/178/184 | ||||
| EMB190 |
6 | 98 | ||||
| ARJ21 Series |
20 | 90 | ||||
| Boeing 777 series Freighter |
15 | N/A | ||||
| Total |
894 | N/A | ||||
In 2022, we continued to expand and modernize our aircraft fleet. During 2022, we (i) took scheduled delivery of one B777F aircraft under purchase agreements; (ii) took scheduled delivery of 12 aircraft under finance lease, including four A350 aircraft and eight ARJ21-700 aircraft; (iii) took scheduled delivery of no aircraft under operating leases; (iv) returned one B-5113 aircraft under operating leases upon expiry; and (v) disposed of two B747F aircrafts, three A380 aircraft and one B737-800 aircraft.
In 2022, Xiamen Airlines (i) took scheduled delivery of one A321NEO aircraft under operating leases; (ii) took scheduled delivery of no aircraft under financing leases; and (iii) took scheduled delivery of no aircraft purchased with its own funds.
Aircraft Financing Arrangements
Overview
As of December 31, 2022, a significant portion of our aircraft is acquired under long-term leases with remaining terms to maturity mainly ranging from one to twelve years. As of December 31, 2022, of our Group’s 894 aircraft, 578 aircraft were operated under leases and 316 were either owned aircraft financed by long-term loans, or acquired either with cash or acquired by exercising the purchase options upon expiry of the relevant leases. Our planned acquisition of aircraft in the foreseeable future is generally expected to be made through acquisition financed by bank loans and our own funds or under lease arrangements. Our determination as to our acquisition strategy depends on our evaluation at the time of our capacity requirements, anticipated deliveries of aircraft, our capital structure and cash flow, prevailing interest rates and other general market conditions.
The following table sets forth, as of December 31, 2022, the number of aircraft operated by our Group pursuant to leases and the average remaining lease terms.
35
Table of Contents
| Financing Lease Number of Aircraft |
Operating Lease Number of Aircraft |
Average Year |
||||||||||
| Model | ||||||||||||
| Boeing 787 series |
25 | 10 | 4.16 | |||||||||
| Boeing 777 series |
14 | 0 | 3.24 | |||||||||
| Boeing 737 series |
68 | 191 | 1.46 | |||||||||
| Airbus 380 series |
0 | 0 | 0 | |||||||||
| Airbus 350 series |
10 | 0 | 7.96 | |||||||||
| Airbus 330 series |
27 | 7 | 1.84 | |||||||||
| Airbus 320 series |
81 | 124 | 2.23 | |||||||||
| EMB190 |
0 | 0 | 0 | |||||||||
| ARJ21 |
14 | 0 | 7.09 | |||||||||
| Boeing 777 series Freighter |
7 | 0 | 2.22 | |||||||||
| Total |
246 | 332 | 2.75 | |||||||||
Pursuant to the terms of the leases, our Group, as the lessee, is responsible during the lease term for the maintenance, service, insurance, repair and overhaul of the aircraft. Certain of our leases cover a significant portion of the relevant aircraft’s useful life and have an option to purchase the aircraft at or near the end of the lease term. For all other leases, we have no option to purchase the aircraft and are required to return the aircraft in the agreed condition at the end of the lease term.
Aircraft Flight Equipment
The jet engines used in our aircraft fleet are manufactured by General Electric Corporation, Rolls-Royce plc, United Technologies International, Inc., CFM International, Inc. International Aviation Engines Corporation and Honeywell International Inc. We had 164 and 131 spare jet engines for our fleet as of December 31, 2022 and 2021, respectively. We determine our requirements for jet engines based on all relevant considerations, including manufacturers’ recommendations, the performance history of the jet engines and the planned utilization of its aircraft. Acquisition of rotables and certain of the expendables for our aircraft are generally handled by Southern Airlines (Group) Import and Export Trading Company Limited (“SAIETC”), a subsidiary we acquired from CSAH in August 2016, in consideration of an agency fee. We arrange the ordering of aircraft, jet engines and other flight equipment for the Airline Subsidiaries and keep an inventory of rotables and expendables for the Airline Subsidiaries.
Aircraft Maintenance
A major part of the maintenance for our fleet other than overhauls of jet engines is performed by Guangzhou Aircraft Maintenance Engineering Company Limited (“GAMECO”), an entity jointly controlled by our Company, Hutchison Whampoa and South China International Aircraft Engineering Company Limited, consistent with our strategy to achieve fully integrated airline operations and to assure continued access to a stable source of high quality maintenance services. The remaining part of the maintenance for our fleet other than overhauls of jet engines is performed by service providers in China and overseas. GAMECO performs all types of maintenance services, ranging from maintenance inspections performed on aircraft (“line maintenance services”) to major overhaul performed at specified intervals. GAMECO was the first of three aircraft maintenance facilities in China that has been certified as a repair station by both the CAAC and the Federal Aviation Administration. In March 1998, GAMECO received the Joint Civil Aviation Authorities certificate, which was transferred to European Aviation Safety Agency certification in November 2004, for the repair and maintenance of aircraft.
We believe that GAMECO performs major maintenance checks on our aircraft within time periods generally consistent with those of large international airline maintenance centers. In 2022, 33.05% of the repair and maintenances including overhaul of our Company were performed by GAMECO. Although rotables for our aircraft are generally imported through SAIETC, a portion of expendables and other maintenance materials are directly imported by GAMECO. Our agreement with GAMECO usually has a term of one year.
Overhauls of jet engines are performed by MTU Maintenance Zhuhai Co., Ltd., or Zhuhai MTU, a jointly controlled entity of the Company and MTU Aero Engines GmbH, and also by domestic qualified service providers in Xiamen (TEXL), Hong Kong (HAESL) and Taiwan (EGAT), Beijing (AMECO) and by overseas qualified service providers in the United States, Germany, Korea, Singapore, France, Malaysia, United Kingdom and Poland.
36
Table of Contents
The amounts incurred by our Group for comprehensive maintenance services provided by GAMECO and Zhuhai MTU were RMB3,833 million, RMB4,598 million and RMB4,104 million for the years ended December 31, 2022, 2021 and 2020, respectively.
Safety
We endeavor to maintain strict compliance with all laws and regulations applicable to flight safety. In addition, we have adopted measures to eliminate or minimize factors that may impair flight safety, including specialized training programs and safety manuals. The Air Safety Management Department of our Company implements safety-related training programs on an on-going basis in all of our operations to raise the safety awareness of all employees. As a result, overall flight safety has gradually improved. For “incidents” which include various events and conditions prescribed by the CAAC that do not involve serious personal injury or material damage to flight equipment, our Group has kept the number consistently below what is prescribed by the CAAC. For example, our “Air Transportation Incidents Per Ten Thousands Hours Ratio” was 0, 0.0047 and 0 in 2022, 2021 and 2020, respectively. In comparison, CAAC’s published maximum acceptable airline’s Air Transportation Incidents Per Ten Thousands Hours Ratio was 0.6, 0.6 and 0.6 in 2022, 2021 and 2020, respectively. This ratio is defined as the number of occurrences of air transportation incident for every 10,000 hours of flight time. In 2008, we received the “Five-Star Flight Safety Award” from CAAC, being the first in domestic aviation industry to receive such a great honor. Subsequently in 2012, we were awarded the “Safe Flight Diamond Award” by CAAC for our 10,000,000 safety flight hours record. On June 15, 2018, our Company was honored with the 2-Star Flight Safety Diamond Award by the CAAC, becoming the leading Chinese carrier to maintain the highest safety records in China. By December 31, 2022, our continuous safe flight span was 27.863 million hours.
Jet Fuel
Jet fuel costs typically represent a major component of an airline’s operating expenses. Our jet fuel costs accounted for 28.3%, 21.9% and 17.2% of our operating expenses for the years ended December 31, 2022, 2021 and 2020, respectively. Like other Chinese airlines, we generally purchase our jet fuel from regional branches of CAOSC and Bluesky Oil Supplies Company, except at Shenzhen, Sanya, Haikou and Shanghai Pudong, where jet fuel is supplied by a Sino-foreign joint venture in which CAOSC is a joint venture partner. CAOSC is a state-owned organization controlled and supervised by the CAAC that controls the importation and distribution of jet fuel throughout China.
Jet fuel obtained from CAOSC’s regional branches is purchased at a market-adjusted price set within a specified range based on the guidance price issued by CAOSC with the approval of the CAAC and the pricing department of the NDRC. As a result, the costs of transportation and storage of jet fuel in all regions of China are spread among all domestic airlines. Jet fuel costs in China are influenced by costs at state-owned oil refineries and limitations in the transportation infrastructure, insufficient storage facilities for jet fuel in certain regions of China, and the prevailing fuel prices on the international market. In March 2022, due to a number of factors including geopolitical conflicts, reduction of crude oil production and recovery of the economy, international oil prices climbed to the highest point since 2008. As a result, the international crude oil prices for the entire year of 2022 were at a relatively high level as compared to recent years.
In addition to purchases of jet fuel from CAOSC, we also purchase a portion of our jet fuel requirements for our international flights from foreign fuel suppliers located outside China at prevailing international market prices. Jet fuel purchased from such sources accounted for approximately 12.90% and 9.33% of our total jet fuel consumption in 2022 and 2021, respectively.
Our jet fuel costs increased from RMB25,505 million in 2021 to RMB32,669 million in 2022, as a result of the increase in jet fuel prices in 2022.
37
Table of Contents
Fuel Surcharge
Our profit for any given year may be affected by an unexpected change in the fuel surcharge collection policies and other factors beyond our control. The level of fuel surcharges, which is regulated by Chinese government, affects domestic customers’ air travel demand as well as our ability to generate profits. On January 14, 2009, the NDRC and the CAAC jointly announced that the collection of passenger fuel surcharge for domestic routes should be suspended from January 15, 2009 onwards. Subsequently, in response to the increase in international fuel prices, the NDRC and CAAC issued a notice on November 11, 2009 to introduce a new pricing mechanism of fuel surcharge that links it with airlines’ jet fuel costs, which was further adjusted subsequently.
From April 1, 2015, the NDRC adjusted the benchmark oil price to RMB5,000 per ton, for every RMB100 by which the cost of jet fuel exceeds that price, the airlines are allowed to charge RMB0.00002566 per kilometer for the flight distance. Based on that rate, for every RMB100 by which the cost of jet fuel exceeds RMB5,000 per ton, the airlines are allowed to charge RMB0.0002566 per kilometer for the flight distance. The NDRC decreased the rate of fuel surcharge from RMB0.00002566 per kilometer to RMB0.00002454 per kilometer, from April 1, 2019. The NDRC adjusted the rate of fuel surcharge to RMB 0.00002748 per kilometer, starting from April 1, 2021 and further adjusted the rate of fuel surcharge to RMB0.00002731 per kilometer, starting from December 5, 2022. Based on that rate, for every RMB100 by which the cost of jet fuel exceeds RMB5,000 per ton, the airlines are allowed to charge to RMB0.00002731 per kilometer for the flight distance.
Our profit for the year may suffer from any unexpected change in the fuel surcharge collection policies and other factors beyond our control.
Flight Operations
Flight operations for our flights originating in Guangzhou are managed by our flight operations and marketing divisions, which are responsible for formulating flight plans and schedules consistent with route and flight approvals received from the CAAC. Our flight operations center in Guangzhou is responsible for the on-site administration of flights, including the dispatch and coordination of flights, deployment of aircraft, ground services and crew staffing. In addition, each of the Airline Subsidiaries maintains flight operations centers at all servicing airports for on-site administration of their flights. Our system operations control (SOC) are responsible for monitoring conditions of our route network, administering our flight plans, collecting and monitoring navigation data and analyzing and monitoring airport conditions.
To enhance our management of flight operations, we have launched and continued optimizing a new system to manage the whole flight operation process, covering flight plan production, aeronautical information processing, meteorological analysis, operation monitoring, flight deployment and other operational activities, which advanced our operation management in a more intelligent and digitalize way and improved our flight operation efficiency. We also established and improved the backup system to enhance our risk-resistance ability. We believe such system will assist us in preventing major operational risks, including from power failure, terrorist attack, hacker attack and equipment or software failure.
Training of Pilots and Flight Attendants
We believe that our pilot training program has significantly improved the quality of the training received by our pilots and has helped maintain the quality of our staff of pilots at a level consistent with the expansion of operations called for by our business strategy.
As part of the pilot training program, trainee pilots receive their initial training in the operation of a specific aircraft with Zhuhai Xiang Yi Aviation Technology Company Limited (“Zhuhai Xiang Yi”), a wholly-owned subsidiary of the Company, which also provides training to pilots from other Chinese airlines. Zhuhai Xiang Yi is equipped with simulators for the majority of models of aircraft currently operated by us and provides flight simulation training services to us.
Our pilots are required to be licensed by the CAAC, which requires an annual proficiency check. Our pilots attend courses in simulator training twice annually and in emergency survival training once annually. We also conduct regular advanced training courses for captains and captain candidates. Pilots advance in rank based on number of hours flown, types of aircraft flown and their performance history.
38
Table of Contents
We conduct theoretical and practical training programs for our flight attendants at our Flight Attendants Training Center in Guangzhou (the “Guangzhou Training Center”). The Guangzhou Training Center is equipped with computerized training equipment, as well as simulator cabins for all models of aircraft currently operated by us. At the Guangzhou Training Center, our flight attendants receive comprehensive training in in-flight service, emergency evacuation and water rescue.
Ground Services
We make arrangements with airport authorities, other airlines or ground services companies for substantially all ground facilities, including runway, ramp, terminal and support services buildings, at each airport that we serve. We pay landing, parking and other fees to such airports, including Guangzhou Baiyun International Airport. At domestic airports, such fees are generally determined by CAAC.
At Guangzhou Baiyun International Airport, we operate our own passenger check-in, cargo, mail and baggage handling, aircraft maintenance and cleaning services. We also provide such services to our customer airlines that operate in Guangzhou Baiyun International Airport.
Ground services at the airports, such as those in Shenzhen, Changsha, Wuhan, Zhengzhou, Haikou, Zhuhai, Xiamen, Jieyang, Guiyang, Shenyang, Harbin, Dalian, Changchun, Sanya, Nanning, Chongqing, Shanghai Hongqiao, Shanghai Pudong and Urumqi, are operated directly by the Group. Ground services at the airport in Beijing have been primarily provided by Beijing China Southern Airlines Ground Services Co., Ltd, which became a wholly-owned subsidiary of the Company in June 2009. Ground services at other airports in China are provided to us by local airport authorities or local airlines in accordance with relevant service agreements. Ground services and other services at airports outside China are provided to us by foreign services providers in accordance with relevant service agreements with such parties. All our such agreements are short-term and otherwise on customary terms in the industry.
Air Catering
We own a 70.5% equity interest in Guangzhou Nanland Air Catering Company Limited (“Nanland”). Nanland provides in-flight meals, snacks, drinks and related services for all of our flights originating from airports around China. We also contract with various air catering suppliers with respect to in-flight catering services for flights originating from other airports, generally on an annual basis and otherwise on customary terms in the industry.
Cargo and Mail
We also provide air cargo and mail services. A significant portion of these services are combined with passenger flights services. In 2022, we had 15 Boeing 777 freighters, mainly servicing 19 international cargo routes with an average of 61 flights in total per week, including:
Guangzhou - Chongqing - Amsterdam - Guangzhou, Guangzhou - Amsterdam - Guangzhou, Guangzhou - London - Frankfurt - Guangzhou, Guangzhou - London -Guangzhou, Guangzhou - London - Shenzhen, Guangzhou - Chongqing - Frankfurt - Guangzhou, Guangzhou - Frankfurt - Guangzhou, Guangzhou - Anchorage - LosAngeles - Guangzhou, Guangzhou - HoChiMinhCity - Hanoi - Guangzhou, ShanghaiPudong - Amsterdam - Chongqing - ShanghaiPudong, ShanghaiPudong - Amsterdam - ShanghaiPudong, ShanghaiPudong - Frankfurt - ShanghaiPudong, ShanghaiPudong - Anchorage - Chicago - ShanghaiPudong, ShanghaiPudong - Anchorage - Chicago - Shenzhen, ShanghaiPudong - LosAngeles - ShanghaiPudong, Shenzhen - Frankfurt - Shenzhen, Shenzhen-Frankfurt -Guangzhou, Shenzhen - Frankfurt - ShanghaiPudong and Shenzhen - Anchorage - Chicago - Shenzhen.
From 2020, following the onset of the COVID-19 pandemic, the demand for freight significantly increased. In 2022, we continued to take active measures to increase freight revenue, including improving the utilization rate of freighters, and organized 9,098 flight shifts by freighters converted from passenger aircraft, and achieved positive operating results. Cargo and mail revenue was RMB 20,884 million in 2022, representing an increase of 5.01% compared to 2021. We conduct our cargo business primarily through our cargo hubs in Guangzhou and Shanghai.
39
Table of Contents
Sales, Reservations and Marketing
Passenger Ticket Sales and Reservations
Our ticket sales and reservations are conducted by or through independent sales agents and our own network of exclusive sales offices, as well as the CAAC’s sales offices and CSAH’s affiliates. We have sales offices in Guangzhou and our other route bases. In addition, we maintain regional sales offices in other cities in China, including Beijing and Shanghai. We maintain international sales offices in many cities in all continents except for South America, including but not limited to Almaty, Amsterdam, Auckland, Bangkok, Busan, Chicago, Dubai (Sharjah), Frankfurt, Hanoi, Ho Chi Minh City, Islamabad, Istanbul, Kuala Lumpur, London, Los Angeles, Manila, Mexico City, Moscow, New York, Nairobi, Paris, Roma, Seoul, Singapore, Sydney, Toronto, Tokyo, Vancouver and Vientiane.
We have agency agreements with airlines in the Asia-Pacific region, Europe, the United States and Africa for the processing of ticket sales and reservations on a reciprocal basis. In 2022, over 55% of all ticket sales for our scheduled flights were made by our network of sales offices and CSAH’s affiliates. We also sell tickets and accept reservations through an extensive network of non-exclusive independent sales agents. Under the agency agreements with these sales agents, we pay commissions based on the value of tickets sold. In 2022, sales by independent sales agents accounted for less than 45% of our ticket sales of our scheduled flights.
Substantially all of our sales offices and agents in China are linked electronically to the TravelSky Technology Limited’s computerized ticketing and reservations system, which is in turn linked to all domestic airlines for flights throughout China. We have also entered into membership agreements with several international reservation systems, including ABACUS in Southeast Asia, SABRE and GALILEO in the United States, AMADEUS in Europe and INFINI in Japan. These systems facilitate reservations and sales of tickets for our international flights. Since 2016, we have been focusing on improving the digitalization and intelligence level. We have launched the “China Southern e Travel” strategy, which aims to explore the needs of passengers and plan and design products from the perspective of passengers. We have built a number of quality products such as flight dynamics, seat selection and check-in, electronic invoices, face recognition, full-channel self-service refund and meal service. Our vision of “a hassle-free journey with one mobile device” has become a reality in technology, and the digitalization of the entire process of passenger travel has been realized. In 2018, we released the “Internet +” strategy centering on “China Southern e Travel”, and formally built a one-stop service mobile application platform to provide passengers with excellent door-to-door service experience. We believe technology has become one of our core competitive advantages.
Cargo
Our cargo and mail services are promoted through our own cargo divisions and independent cargo agents both within and outside China that track available space among all airlines. In particular, our Company employs a number of cargo agents in the Pearl River Delta region. In 2022, we were not required to pay cargo agents commission for domestic and international services in the Pearl River Delta region.
Promotional and Marketing Activities
We engage in regular promotional and marketing activities. Our promotional and marketing activities for domestic routes emphasize safety, passenger comfort and the frequency of our flights. Our promotional and marketing activities with respect to international and regional passengers emphasize our quality of service, extensive route network in China and higher frequency of flights compared to other Chinese airlines. We were among the first in China to launch premium economy class seats. In addition, we also promote and market our regional and international routes on the basis of price competitiveness.
40
Table of Contents
We seek to increase our brand recognition by offering new services to passengers. For example, we were the first Chinese airline to provide off-airport check-in services. We also offer transfer and baggage “through-handling” services to passengers connecting to other airlines, including passengers connecting in Hong Kong for flights to Taiwan. We have widened our use of information technology and introduced new services such as cell phone check-in, SMS platforms and online meal booking. In 2017, our Company reached a strategic cooperation agreement with American Airlines. Under this agreement, American Airlines subscribed for our Company’s shares in August 2017 in the amount of USD200 million. Our Company and American Airlines also established a code sharing partnership on January 18, 2018 to provide more convenient and diversified trip options for passengers.
As an important strategic decision, we officially exited from SkyTeam Alliance from January 1, 2020 and focused on establishing cooperation with new strategic partners, while maintaining good relationships with the SkyTeam partners. We have had a Strategic Cooperation Agreement with American Airlines since 2017 and implemented full scope codeshare cooperation, Frequent Flyer Programs cooperation and lounge services since 2019. We have also entered into a Joint Business Agreement with British Airways and implemented enhanced codeshare cooperation in 2019. Although no longer a member of SkyTeam, CZ continues the codeshare cooperation with SkyTeam partners, including AirFrance-KLM, and other important joint business partners. We will continue to properly carry out the work of exit and fully guarantee the rights and interests of passengers. We will carry out bilateral and multilateral cooperation in a more targeted manner while deepening the cooperation with the existing partners such as France Airlines and KLM Royal Dutch Airlines, expand code sharing and frequent passenger cooperation with American Airlines, and launch strategic cooperation with numbers of internationally renowned airlines such as Finnair and Emirates to provide passengers with more convenient and high-quality travel options. At the same time, we continue to strengthen the coordinated development of the “China Southern Alliance” by gradually integrating with Xiamen Airlines and Sichuan Airlines in terms of capacity layout, route cooperation, resource sharing and customer collaboration. At present , we share codes with 21 international and regional airlines in 258 routes (including trunk routes and beyond routes). These arrangements enlarge our sales channels and flight route network.
Regulation
The Chinese commercial aviation industry is subject to a high degree of regulation and oversight by the CAAC. Regulations and policies issued or implemented by the CAAC encompass substantially all aspects of airline operations, including route allocation, pricing of domestic airfare, the administration of air traffic control systems and certain airports, air carrier certifications and air operator certification and aircraft, registration and aircraft airworthiness certification. The Civil Aviation Law, which became effective in March 1996, provides a framework for regulation of many of these aspects of commercial aviation activities. Although Chinese airlines operate under the supervision and regulation of the CAAC, they are accorded an increasingly significant degree of operational autonomy in the application for domestic, regional and international routes, the allocation of aircraft among routes, the purchase of flight equipment, the pricing of air fares within a certain range, the training and supervision of personnel and their day-to-day operations.
As an airline providing services on international routes, we are also subject to a variety of bilateral civil air transport agreements that provide for the exchange of air traffic rights between China and various other countries. In addition, China is a contracting state, as well as a permanent member, of the International Civil Aviation Organization (the “ICAO”), an agency of the United Nations established in 1947 to assist in the planning and development of international air transport, and is a party to many other international aviation conventions. The ICAO establishes technical standards for the international aviation industry. We believe that we, in all material respects, comply with all such technical standards.
41
Table of Contents
Environment
Our operations are subject to extensive and increasingly stringent national, local and international laws governing the protection of the environment. In recent years, a number of directives and other regulations have been issued by regulatory authorities in China and other countries to address, among other things, aircraft noise and carbon emissions, the use and handling of hazardous materials, aircraft age and environmental contamination remedial clean-up measures. For example, China has introduced energy intensity and carbon emissions-related targets for the aviation segment in the 14th Five-Year Plan, paving the way for the inclusion of a key transportation sector in the country’s carbon market. These requirements impose high compliance costs on airlines.
Existing laws and future regulatory action concerning climate change and aircraft emissions could have an impact on the aviation industry. For example, with an aim to achieve carbon neutral growth on a global scale, the ICAO formally adopted, in the 39th Session of the ICAO Assembly, a global market-based management scheme in the form of the Carbon Offsetting and Reduction Scheme for International Aviation (CORSIA), which obliges airlines to monitor and report their emissions from international aviation from 2019 and to purchase emission reduction units to cover any growth in CO2 emissions above 2020 levels from 2021. Certain CORSIA program implementation details remain unclear and thus the impact of CORSIA cannot be fully predicted at this time. However, CORSIA is expected to increase carbon emission management costs for airlines that operate internationally.
The European Union has set a binding target of achieving climate neutrality by 2050 and the intermediate step towards climate neutrality was to reduce emissions by at least 55% by 2030 as compared to that of 1990s. Therefore, the European Commission further introduced a set of proposals of “Fit for 55 Package” on July 14, 2021 and subsequently reached provisional agreements on the revision of ETS rules in December 2022. As part of the “Fit for 55 Package”, the free ETS quotas allocated to airlines will be phased out by 2026, which will further increase operating costs for airlines.
In accordance with the regulatory requirements on carbon emissions management issued by the relevant national and Guangzhou regulatory authorities, we are required to submit the monitoring plans and carbon emission reports, accept inspection for carbon emission, fulfil obligations of quota clearance as scheduled and improve our comprehensive capabilities of carbon emission management and trading.
Route Rights
Domestic Routes. The right of any Chinese airline to carry passengers or cargo on any domestic route must be obtained from the CAAC. Non-Chinese airlines are not permitted to provide domestic air service between destinations in China. The CAAC’s policy is to assign a domestic route to the Chinese airline that is best suited to serve the route based, in part, on the location of the airline’s main or regional base at the point of origin. Under current regulations, airlines are generally expected to operate mainly from their route bases, and flights within a particular region are expected to be served by airlines based in that region. We believe that these regulatory parameters benefit airlines, such as our Group, that have a large number of regional route bases. The CAAC also considers other factors that may make a particular airline suitable to operate a domestic route, including the applicant’s general operating authority, compliance with pricing regulations and regulations applicable to safety and service quality, market demand, the ability of the applicant in terms of its existing routes, airport facilities and related support services.
The CAAC considers market conditions for a domestic route in determining whether the route should be allocated to one or more airlines. Generally, the CAAC requires that the passenger load factor on a certain route should be above the average rate of the whole market in the last flight season before additional flights and participants may be put on that route.
Regional Routes. Hong Kong and Macau routes and landing rights are derived from agreements between the Chinese government and the government of the Hong Kong SAR, and between the Chinese government and the government of Macau SAR. The rights to fly between Beijing and Hong Kong, Beijing and Macau, Shanghai and Hong Kong and Shanghai and Macau are allocated by the CAAC among four different Chinese airlines. We understand that the criteria for determining whether a Hong Kong and Macau route will be allocated to a particular airline include market demand, the ability of the airline to service the route and the appropriateness of the airline’s aircraft for such route.
42
Table of Contents
Previously, direct flights between Taiwan and Mainland China were only available during certain festivals. Since July 4, 2008, however, the ban on direct flights has been liberalized to allow direct charter flights on weekends. On November 4, 2008, the Mainland China and Taiwan agreed to regular direct passenger charter flights across the Taiwan Strait. On August 31, 2009, the Mainland China and Taiwan extended the number of regular cross-Strait direct passenger flights from 108 to 270 a week. Cross-Strait direct passenger flights were further increased in the following years, but were significantly reduced since 2020 due to the COVID-19 pandemic.
International Routes. International route rights, as well as the corresponding landing rights, are derived from air services agreements negotiated between the Chinese government, through the CAAC, and the government of the relevant foreign country. Each government grants to the other the right to designate one or more domestic airlines to operate scheduled service between certain destinations within each of such countries. Upon entering into an air services agreement, the CAAC determines the airline to be awarded such routes based on various criteria, including the availability of appropriate aircraft, flight and management personnel, safety record, the overall size of the airline, financial condition and sufficiency of assets to bear civil liabilities in international air services. These route rights may be terminated by the CAAC under certain circumstances. On March 26, 2020, in response to the outbreak of the COVID-19 pandemic worldwide, CAAC issued a notice regarding the reduction of the number of international routes. Pursuant to the notice a PRC airline may only operate one route for flying to and from each foreign country, and no more than one flight can be operated each week for each such international route. Some international flights of the Company were canceled and the number of the international flights of the Company was substantially reduced following the notice. On January 8, 2023, CAAC removed the restrictions on international flights from and to China and limitations on the number of international routes and flights each airline in China could operate. We are in the process of restoring our international routes.
Air Fare Pricing Policy
In recent years, there were a series of air fare reform to deregulate the control on the air fare pricing policy step by step. Pursuant to “Pricing Reform of Domestic Civil Aviation” as approved by the State Council of the PRC effective on April 20, 2004, prices on domestic routes fluctuate freely within a predetermined range. Instead of direct supervision by setting prices of air tickets through a local price bureau, the government provides guidance on domestic flights and domestic civil aviation is controlled by the government indirectly. A market-oriented pricing policy was introduced and the pricing system has been adjusted as a result of the above pricing reform. The CAAC and NDRC issued a notice on April 13, 2010, pursuant to which, effective on June 1, 2010, airlines may set first-class and business-class airfares freely in accordance with market prices, subject to relevant PRC laws. The economy-class airfares remain subject to the predetermined range. The CAAC and NDRC further issued a notice, pursuant to which, effective on October 20, 2013, airlines are free to set domestic flights airfares not exceeding up to 25% above the bench mark prices where governmental pricing guidance is applicable; and to freely determine the airfares for domestic routes with the market-oriented pricing policy based on the market demand and supply situation.
On September 29, 2016, the CAAC and NDRC further issued the Notice on Deepening the Pricing Reform of Demotic Civil Aviation to expand further the scope of the routes with the market-oriented pricing policy: airfares for routes less than 800 kilometers or the routes more than 800 kilometers and in competing relationship with the high-speed rail EMU trains can be freely determined by airlines. Airlines may raise the non-discounted announced airfares for a certain number of routes with the market-oriented pricing policy. In principle, such number may be no more than 10 per flight season, and the accumulative increase rate of airfares shall be no more than 10 percent per route per flight season. On December 17, 2017, the CAAC and NDRC further issued the Notice on Further Deepening the Pricing Reform of Demotic Civil Aviation, pursuant to which the airlines were allowed to decide their own prices on domestic routes that have at least five carriers competing. Price increases of no more than 10% would also be allowed for each travel season.
For each airline, the total number of the routes which the airline can decide their own price may be no less than 10 and can generally not exceed 15% of the total number of routes with market-oriented pricing operated by such airline in one flight season. On April 13, 2018, the CAAC issued the Notice on Distributing the Catalog of Domestic Routes adopting Market Regulation Price. The catalog of domestic routes is published together with such notice.
43
Table of Contents
On November 26, 2020, the CAAC and NDRC issued the Notice on Further Deepening the Pricing Reform of the Domestic Routes of Demotic Civil Aviation to further expand the scope of routes that may adopt market-oriented pricing policy. Under the Notice, airlines are allowed to decide their own prices on domestic routes that have at least three competing carriers, rather than previous five competing carriers. The catalog of domestic routes that qualify for adopting market-oriented pricing as a result of the new requirement is published together with such notice. The notice became effective on December 1, 2020.
Published air fares of Chinese airlines for the Hong Kong and Macao routes are determined by the CAAC and the relevant civil aviation authorities in Hong Kong or Macao. Published air fares of Chinese airlines for Taiwan routes must be filed with CAAC and report to the relevant civil aviation authorities in Taiwan. Airlines may offer discounts on flights on their Hong Kong, Macao and Taiwan regional routes.
Published air fares of Chinese airlines for international routes (except for Japan) are determined by Chinese airlines at their own discretion, taking into account the international air fare standards established through the International Air Transport Association. For Japan routes, air fares must be approved by the relevant civil aviation authorities in Japan, and discounting of published international air fares is permitted. For Korea routes, air fares must be approved by the relevant civil aviation authorities in Korea, and the highest fare for each class may not exceed the relevant maximum rate as determined by the relevant civil aviation authorities in Korea.
Acquisition of Aircraft and Flight Equipment
If a Chinese airline plans to acquire an aircraft, the airline must first seek approval from the CAAC and NDRC. The airline must, as a condition of approval, provide specific acquisition plans, which are subject to modification by the CAAC and NDRC. If the CAAC and NDRC approve an aircraft acquisition, the airline negotiates the terms of the acquisition with the manufacturer together with China Aviation Suppliers Holding Company (“CASC”), an entity controlled by CAAC, because CASC possesses the license required to import or export aircraft, and CASC receives a commission in respect thereof. Most Chinese airlines are also required to acquire their aircraft engines, spare parts and other flight equipment through CASC. Our Company and a few other Chinese airlines are permitted to import jet engines and other flight equipment for their own use without the participation of CASC. In the case of our Company, SAIETC acts as our import agent and receives an agency fee for our services.
Jet Fuel Supply and Pricing
CAOSC and Bluesky Oil Supplies Company, companies supervised by the CAAC, are the only jet fuel supply companies in China, with the exception of the joint venture jet fuel supply companies that supply Shenzhen, Sanya, Haikou, Shanghai Pudong and other small airports. As a result, all Chinese airlines purchase their domestic jet fuel supply requirements (other than the above mentioned exceptions) from the seven regional branches of CAOSC. Jet fuel obtained from such regional branches is purchased at a market-adjusted price set within a specified range based on the guidance price issued by CAOSC with the approval of the CAAC and the pricing department of the NDRC.
Safety
The CAAC puts the improvement of air traffic safety in China on a high priority and is responsible for the establishment of operational safety, maintenance and training standards for all Chinese airlines. The Chinese airlines are required to provide monthly flight safety reports to the CAAC, including reports of flight or other incidents or accidents and other safety related problems involving such airline’s aircraft occurring during the relevant reporting period. The CAAC periodically conducts safety inspections on individual airlines.
Every pilot is required to pass CAAC-administered examinations before obtaining a pilot license and is subject to an annual recertification examination.
44
Table of Contents
All aircraft operated by Chinese airlines, other than a limited number of leased aircraft registered in foreign countries, are required to be registered with the CAAC. All aircraft operated by Chinese airlines must have a valid certificate of airworthiness, which is issued annually by the CAAC. In addition, maintenance permits are issued to a Chinese airline only after its maintenance capabilities have been examined and assessed by the CAAC. Such maintenance permits are renewed annually. All aircraft operated by Chinese airlines may be maintained and repaired only by CAAC-certified maintenance facilities, whether located within or outside China. Aircraft maintenance personnel must be certified by the CAAC before assuming aircraft maintenance positions.
Security
The CAAC establishes and supervises the implementation of security standards and regulations for the Chinese commercial aviation industry. Such standards and regulations are based on Chinese laws, as well as standards developed by international commercial aviation organizations. Each airline and airport in China is required to submit to the CAAC an aviation security handbook describing specific security procedures established by such airline or airport for the day-to-day operations of commercial aviation and procedures for staff training on security. Such security procedures must be based on relevant CAAC regulations and international commercial aviation treaties. Chinese airports and airlines that operate international routes must also adopt security measures in accordance with the requirements of the relevant international agreements.
Noise and Environmental Regulation
All airlines in China must comply with the noise and environmental regulations of the PRC State Environmental Protection Agency. Applicable regulations of the CAAC permit Chinese airports to refuse to grant take-off and landing rights to any aircraft that does not comply with noise regulations.
Chinese Airport Policy
The CAAC supervises and regulates all civilian airports in China. The local government of the PRC manages the administration of most civilian airports in China. Airports in China are also subject to regulation and ongoing review by the CAAC, which determines take-off and landing charges, as well as charges for the use of airports and airport services.
Chinese Data Privacy and Cybersecurity Laws
The regulatory environment in China and elsewhere as it relates to the collection, use, transfer, and other processing of data, “important data,” and personal data and other types of information is rapidly evolving and is likely to remain uncertain for the foreseeable future.
The PRC Cyber Security Law, or the CSL, became effective in June 2017 and created China’s first national-level data protection for different types of “network operators,” which may include all organizations in China that provide services over the internet or another information network. The DSL, which took effect in September 2021, provides for a cybersecurity review procedure for “data processors” when their data activities may affect national security and the protection scheme of “important data.” “Data processors” may include all organizations in China that collect, store, use, process, transfer, provide, disclose any data in electronic or other form. The DSL also sets up a framework that classifies and categorizes data collected and stored in China and regulates its storage and transfer based on the degree of importance of data in economic and social development, as well as the extent of damage caused to national security, public interests or the legitimate rights and interests of individuals and organizations once data are tampered with, destroyed, leaked or illegally obtained or illegally used. Certain categories of network operators and data processors processing certain types of data will also be subject to data localization requirements. The PIPL, which took effect from November 2021, provides a comprehensive set of data privacy and protection requirements that apply to the processing of personal information. The PIPL also clarifies the definition of personal information and sensitive personal information, the legal basis of personal information processing, the basic requirements of notice and consent and the restrictions of data cross-border transfer.
45
Table of Contents
Numerous regulations, guidelines and other administrative measures have been or are expected to be adopted under China’s three-pillar data protection regime framework made up of the CSL, the DSL and the PIPL. On December 28, 2021, the Cyberspace Administration of China, or the CAC, together with 12 other government departments of the PRC, jointly promulgated the revised Cybersecurity Review Measures, which became effective on February 15, 2022. The Cybersecurity Review Measures provide that certain network operators that intend to purchase network products and services and network platform operators engaging in data processing activities must be subject to cybersecurity review by a Cybersecurity Review Office, or the CRO, an administrative body within the CAC, if national security will or may be affected. The Cybersecurity Review Measures further require that if a network operator who possesses personal information of more than one million users plans to be listed in foreign countries, it must apply for cybersecurity review from the CRO. The Cybersecurity Review Measures also grant the CRO the discretion to start a cybersecurity review against any entity, if the CAC or any of 12 other government departments consider relevant products and services or data processing activities will or may affect national security. In respect of data cross-border transfer, on July 7, 2022, the CAC released the Measures on Outbound Data Transfer Security Assessments, or the Measures, which took effect on September 1, 2022. The Measures require large personal information controllers (those process over one million individuals’ personal information), data processor that transfers “important data” and other data processors to undergo a government security assessment before transferring data out of China. Any cross-border data transfer activities conducted in violation of the MSACDT before the effectiveness of these measures are required to be rectified by March 1, 2023. Though these measures have already taken effect, substantial uncertainties still exist with respect to the interpretation and implementation of these measures in practice and how they will affect our business operation.
In addition, certain industry-specific laws and regulations affect the collection and transfer of personal data in China. For example, the Order of the PRC Ministry of Transport regarding Provisions on the Administration of Passenger Services in Public Air Transport, which became effective and implemented on September 1, 2021, stipulates that carriers, airports, ground service agents, aviation sales agents, aviation sales network platform operators, and aviation information enterprises shall abide by the laws and regulations on the personal information protection, and shall not divulge, sell, illegally use or provide the personal information of passengers to others.
We routinely receive, collect, store, process, transmit and maintain personal information along with other sensitive data. We may also receive, store, process, generate, control, or otherwise have access to “important data” in our businesses. As such, we are subject to the relevant PRC data security, cyber-security, and personal data protection privacy laws, regulations, and standards that apply to the collection, generation, use, retention, protection, disclosure, transfer and other processing of personal information and “important data”. Based on the size of our company and the industry sections in which we operate, we expect to be subject to heightened scrutiny and obligations with regard to cybersecurity, data security, and the protection of personal information once all the relevant regulations and rules have been promulgated. Under certain circumstances, we could become subject to cybersecurity review or data security review by the Cyberspace Administration of China, or the CAC, or other related governmental regulatory authorities. Though some laws, regulations, and standards have already taken effect, substantial uncertainties still exist with respect to the interpretation and implementation of these measures in practice and how they will affect our business operation.
Competition
The CAAC’s extensive regulation of the Chinese commercial aviation industry has had the effect of managing competition among Chinese airlines. Nevertheless, competition has become increasingly intense in recent years due to a number of factors, including relaxation of certain regulations by the CAAC, an increase in the number of Chinese airlines and an increase in the capacity, routes and flights of Chinese airlines.
In the Chinese aviation industry, the three major airlines are our Group, Air China and China Eastern Airlines Corporation Limited (the “China Eastern Airlines”). In 2022, these three airlines together controlled approximately 56.94% of the commercial aviation market in China as measured by the number of passengers carried.
Most major Chinese airlines in recent years significantly expanded their fleets, while at the same time passenger traffic may not have increased proportionately. In some years, this resulted in a reduction in our passenger load factors. As a result, we are required to be more competitive with respect to, for example, the quality of service, including ticketing and reservations, in-flight services, flight scheduling and timeliness. See “Item 3, Key Information – Risk Factors – We face increasingly intense competition in both domestic and international markets, which may materially and adversely affect our business” for more discussion on competition.
46
Table of Contents
We also face competition from the increased use of high-speed railways. We expect that improvements in high-speed railways will continue to have an impact on the domestic aviation market. First, the “eight horizontal and eight vertical” high-speed railway corridors are gradually being developed. Second, in the future, the railway system will gradually release its own pricing, adopt flexible pricing and market pricing. Passengers will be able to get discounts on more routes. Third, one-third of high-speed railway will become faster, which may attract more passengers. The competition on passengers whose trip distance are from 800 kilometers to 1,000 kilometers is intense, and with increasing speed, high-speed railways may attract passengers who travel longer than 1,000 kilometers. In addition, the operational efficiency of high-speed railways and train capacity will increase. As of December 31, 2022, China’s railway traffic mileage reached 155,000 kilometers, among which about 42,000 kilometers were covered by high-speed railway. According to the latest development goal of the China Railway, China’s railway traffic mileage is expected to reach 200,000 kilometers by 2035, among which 70,000 kilometers will be covered by high-speed railway. Cities with populations of over 500,000 will be connected with high-speed rail lines so as to form the city connections within travel ranges of one, two and three hours respectively. The operating speed of high-speed rail has continued to increase since 2007, with the maximum operating speed increasing from 250 kilometers per hour to 350 kilometers per hour. Further improvements are expected in the future. We expect that the operating results of the Company’s routes that overlap with the high-speed rail network (especially routes with mileage of no more than 800 kilometers) will be impacted in the future.
We believe that our Company possesses certain competitive advantages as compared to other Chinese airlines. We have extensive route network and we are one of the Chinese airlines with the largest number of regional route bases, which we believe places us in a favorable position in the route allocation process. We also had the largest aircraft fleet among all Chinese airlines as of December 31, 2022, which, together with our planned aircraft acquisitions, will permit us to expand our operations and to improve the deployment of the aircraft in our fleet. We also believe that our dominant presence in the populous and economically developed southern and central regions of China provides us with a competitive advantage in attracting new customers, and our fully integrated flight training, aircraft and engine maintenance and air catering operations enable us to achieve and maintain high quality service to our customers. We have also launched the construction of an integrated service, built an international service brand, and continuously improved service quality. Our brand influence has continued to increase in China and abroad. In 2020, we were positioned to offer “affinity and refinement” service, broke down barriers between various systems and departments and have implemented a full-chain, systematic and integrated service management. With a series of new services, products and service measures rolled out, the service quality and flight on-time performance rate of the Company have increased, which we believe are among the strongest in the industry. The Company was re-awarded “National Benchmarking Enterprise of Customer Satisfaction”. In 2020, we comprehensively promoted the “Ecosphere strategy”, reinforced the construction of e-commerce platform, and created a one-stop service platform for mobile users. The concept of “a hassle-free journey with one mobile device” has been fully realized. Many key indicators, such as the number of APP activations and the number of the social media followers, continue to lead in the industry. In 2021, by providing “humanized, digitalized, refined, personalized and convenient” air travel quality service, we realized “people enjoying travelling, goods delivered smoothly”. In 2022, we set up self-help luggage service platform and developed 125 types of “home flavor” in-flight meals. The flight on-time performance rate of the Company has maintained a leading position in the industry for seven consecutive years.
The following table sets forth our market share of passengers carried, cargo and mail carried and total traffic of Chinese airlines for the years indicated based on the CAAC statistics briefing.
| Passengers Carried | Cargo and Mail Carried (tons) |
Total Traffic (tons kilometers) |
||||||||||||||||||||||
| Year |
Industry Total (in millions) |
Group’s Share (% of total) |
Industry Total (in thousands) |
Group’s Share (% of total) |
Industry Total (in billions) |
Group’s Share (% of total) |
||||||||||||||||||
| 2018 |
611.7 | 22.9 | 7,385 | 23.5 | 120.7 | 25.1 | ||||||||||||||||||
| 2019 |
659.9 | 23.0 | 7,532 | 23.4 | 129.3 | 25.2 | ||||||||||||||||||
| 2020 |
417.8 | 23.2 | 6,766 | 21.6 | 79.9 | 26.1 | ||||||||||||||||||
| 2021 |
440.6 | 22.4 | 7,318 | 19.7 | 85.7 | 24.7 | ||||||||||||||||||
| 2022 |
251.7 | 24.9 | 6,076 | 21.8 | 59.93 | 27.3 | ||||||||||||||||||
47
Table of Contents
Domestic Routes
We compete against our domestic competitors primarily on the basis of flight schedule, route network, quality of service, safety, type and age of aircraft and, to a lesser extent, price. We compete against other major Chinese airlines in our various domestic route markets. Of these competitors, the largest two are Air China and China Eastern Airlines, which are owned or controlled by the Chinese government. We also face competition from other airlines which are not state-owned such as Spring Airlines and Jixiang Airlines.
The following table sets forth our market share in terms of passengers carried, cargo and mail carried on departing flights and total departing flights at the 10 busiest airports in China in 2022 according to passenger volume data from the CAAC statistics briefing.
| Airport |
Passengers Carried (% of total) |
Cargo and Mail Carried (% of total) |
Departing Flight (% of total) | |||
| Guangzhou |
47.27 | 26.95 | 45.19 | |||
| Chongqing |
24.02 | 15.09 | 23.57 | |||
| Shenzhen |
31.08 | 11.57 | 26.12 | |||
| Kunming |
12.87 | 10.78 | 11.09 | |||
| Hangzhou |
32.67 | 8.77 | 26.04 | |||
| Chengdu Shuangliu |
15.26 | 6.97 | 12.84 | |||
| Shanghai Hongqiao |
13.44 | 16.47 | 13.14 | |||
| Shanghai Pudong |
14.85 | 7.62 | 9.92 | |||
| Xi’an |
17.21 | 12.14 | 15.21 | |||
| Chengdu Tianfu |
5.17 | 5.13 | 4.64 |
The following table sets forth our market share in terms of passengers carried, cargo and mail carried on departing flights and total departing flights at eight busiest airports in southern and central China (excluding Guangzhou and Shenzhen, which are included in the table above) in 2022 according to passenger volume data from the CAAC statistics briefing.
| Airport |
Passengers Carried (% of total) |
Cargo and Mail Carried (% of total) |
Departing Flight (% of total) | |||
| Changsha |
34.92 | 19.91 | 34.68 | |||
| Wuhan |
39.68 | 15.54 | 37.49 | |||
| Haikou |
23.66 | 27.76 | 22.35 | |||
| Sanya |
27.51 | 32.26 | 28.31 | |||
| Zhengzhou |
34.10 | 3.64 | 29.27 | |||
| Nanning |
25.99 | 13.05 | 22.38 | |||
| Zhuhai |
37.05 | 37.08 | 36.20 | |||
| Jieyang |
37.46 | 38.62 | 36.52 |
Regional Routes
In 2022, we conducted a total of 1,838 flights on our regional routes. We face less competition on regional routes than that on domestic and international routes, and earn a higher operating margin. Air China, China Eastern Airlines, Air Macau, Cathay Pacific, China Airlines and Eva Airways compete with our Group in the regional traffic markets.
International Routes
We compete with a number of Chinese airlines, including Air China and China Eastern Airlines and many well-established foreign airlines, on our international routes. Most of these international competitors have significantly longer operating histories, substantially greater financial and technological resources and greater brand recognition than us. Many of our international competitors have larger sales networks and participate in more comprehensive and convenient reservation systems, or engage in promotional activities that may enhance their ability to attract international passengers.
48
Table of Contents
In Southeast Asian routes, our competitors mainly include Thai Airways International, Singapore Airlines, Malaysian Airlines System, Vietnam Airlines, Garuda Indonesia, Philippine Airlines, Air China and China Eastern Airlines. In European routes, our competitors mainly include Air China, China Eastern Airlines, Cathay Pacific, Lufthansa German Airlines. In the United States routes, our competitors mainly include Air China, China Eastern Airlines, Cathay Pacific and United Airlines. In Australian routes, our competitors include Air China, China Eastern Airlines, Cathay Pacific and Qantas Airways. We compete in the international market primarily on the basis of safety, price, timeliness and convenience of scheduling.
Airline Subsidiaries
Our Airline Subsidiaries are joint ventures established by our Company and local companies in the provinces or special economic zones where our Airline Subsidiaries are based and are engaged in providing airline and related services. As of December 31, 2022, our Company owned a 55% or 60% equity interest in each of our Airline Subsidiaries.
As of December 31, 2022, Xiamen Airlines operated under the “MF” code with a fleet of 209 aircraft. In 2022, Xiamen Airlines carried a total of about 18.12 million passengers, or approximately 28.9% of the passengers carried by our Group in that year, and had RMB17,879 million in traffic revenue.
As of December 31, 2022, Shantou Airlines operated under “CZ” code with a fleet of 16 aircraft. In 2022, under the centralized allocation of flight routes of our Group, Shantou Airlines carried a total of about 1.53 million passengers, or 2.4% of the passengers carried by our Group in that year. Total traffic revenue of Shantou Airlines for the year ended December 31, 2022 was RMB1,081 million.
As of December 31, 2022, Zhuhai Airlines operated under the “CZ” code with a fleet of 16 aircraft. In 2022, under the centralized allocation of flight routes of our Group, Zhuhai Airlines carried a total of about 1.27 million passengers, or approximately 2.0% of the total number of passengers carried by our Group in that year. Total traffic revenue of Zhuhai Airlines for the year ended December 31, 2022 was RMB963 million.
As of December 31, 2022, Guizhou Airlines operated under the “CZ” code with a fleet of 20 aircraft. In 2022, under the centralized allocation of flight routes of our Group, Guizhou Airlines carried a total of about 1.81 million passengers, or approximately 2.9% of the total number of passengers carried by our Group in that year. Total traffic revenue of Guizhou Airlines was approximately RMB1,274 million for the year ended December 31, 2022.
As of December 31, 2022, Chongqing Airlines operated under the “OQ” code with a fleet of 30 aircraft. In 2022, under the centralized allocation of flight routes of our Group, Chongqing Airlines carried a total of about 2.56 million passengers, or 4.1% of the total number of passengers carried by our Group in that year. Total traffic revenue of Chongqing Airlines for the year ended December 31, 2022 was RMB1,809 million.
As of December 31, 2022, Henan Airlines operated under the “CZ” code with a fleet of 30 aircraft. In 2022, under the centralized allocation of flight routes of our Group, Henan Airlines carried a total of about 2.20 million passengers, or approximately 3.5% of the total number of passengers carried by our Group in that year. Total traffic revenue of Henan Airlines was approximately RMB1,577 million for the year ended December 31, 2021.
Southern Air Logistic Subsidiary
China Southern Air Logistics Co., Ltd., or Logistics Company, was established in June 2018 with registered capital of RMB1.8 billion. It mainly conducts logistics operations. In December 2020, the Company, Logistic Company and certain third party investors entered into a capital increase agreement. Pursuant to this agreement, the third party investors made capital contribution of approximately RMB3,355 million into the Logistic Company. After the capital contribution, the Company’s equity interests in the Southern Air Logistic Company decreased from 100% to 55%.
In 2022, Logistic Company had an operating revenue of RMB 21,538 million and a net profit of RMB 4,654 million, representing an increase of 9.56% and a decrease of 18.25%, respectively, from 2021. As at December 31, 2022, Logistic Company’s total assets amounted to RMB16,873 million and net assets amounted to RMB 13,288 million.
49
Table of Contents
On November 30, 2022, Logistics Company submitted an application to the Guangdong Regulatory Bureau of the CSRC for pre-listing tutoring for its planned listing on a stock exchange in the PRC. As at the date of this Annual Report, Logistics Company has not submitted any official application for listing to any relevant regulatory authorities in the PRC.
Environment
During the reporting period, the Company continued to push forward its Green Flight initiatives, advocated the concept of low carbon travel and sought to reduce environmental pollution by the use of market mechanisms.
1. Green Flight
During the reporting period, the Company continued to promote fuel saving, with a focus on improving single-engine sliding and fuel-efficient launching, retracting flap height, and replacing Auxiliary Power Units with bridge-mounted equipment. The Company pressed ahead meal-saving activities themed by “Green Flight” to encourage passengers to dine according to needs and avoid meals on voluntary basis.
2. Research on “Dual Carbon”
During the reporting period, the Company continued to carry out research on carbon peak and carbon neutrality and monitored ground carbon to get a clear picture of its emissions, and developed energy-saving and emission-reduction projects to manage carbon assets.
3. Reduce Impact of Carbon Emission on Climate Change by Market Mechanisms
The Company has been supporting and actively participating in Chinese government’s various projects on market mechanisms of carbon trading. During the reporting period, in accordance with the requirements of the CAAC, the Company fulfilled its performance for 2020 under the European Union carbon trading scheme in May 2021 and fulfilled its performance for 2020 under the Guangdong carbon trading scheme in June 2021. We fully completed the carbon dioxide emission report and verification of civil aviation flight activities in 2020 by using the self-developed flight carbon emission data monitoring, reporting and verification system (MRV system).
4. Establish and Improve Information System of Environmental Protection and Management
During the reporting period, the Company continued the building of an information management system to implement online reporting and processing of data and information regarding energy consumption and pollutant discharge, and online monitoring of environmental pollution sources, risk points, and prevention and control measures.
5. Establish and Improve the Emergency Management System for Environmental Contingencies
During the reporting period, the Company focused on emergency plans for environmental contingencies, which were supplemented by special management and plans for environmental impact assessment reports, environmental contingencies, fires, hazardous aviation chemicals, and hazardous wastes, and supported by emergency plans of each secondary unit, so as to establish a complete emergency management system for environmental contingencies.
6. Develop Passenger Carbon Account and Launch the Passenger Flight Carbon Calculator
In 2021, the Company opened carbon accounts for passengers, which will record the reduced carbon emission behaviors such as cancelling meals, and use of electronic check-in, and launched the passenger flight carbon calculator, which seeks to involve passengers in the reduction of flight carbon emissions.
50
Table of Contents
7. Control Plastic Pollution
During the reporting period, the Company prepared the overall plan for the treatment of plastic pollution, formulated the replacement standards for disposable non-degradable plastic products, implemented the standards of management and control in the production and procurement links, and carried out separate recycling and disposal.
8. Initiate the Prevention and Control Work for Voice Pollution
The Law of the People’s Republic of China on the Prevention and Control of Noise Pollution was published in December 2021 in the PRC and has been implemented since June 2022. During the reporting period, the Company initiated prevention and control work for voice pollution and studied countermeasures on voice reduction during taking off and landing of aircraft.
Insurance
The aviation insurance in the name of CHINA SOUTHERN AIRLINES COMPANY LIMITED as a member of CHINA CIVIL AVIATION GROUP INSURANCE FLEET, is placed with the PICC Property & Casualty Company Limited, China Pacific Property Insurance Co., Ltd., Ping An Property & Casualty Insurance Company of China, Ltd. and China Life Property and Casualty Insurance Company Limited as Insurers. We maintain aviation hull all risks, spares and airline liability insurance policy, aircraft hull “all risks” and spare engines deductible insurance policy, aviation hull and spares “war and allied perils” policy, aviation war, hijacking and other perils excess liability insurance policy, all of which we believe are in the amount customary in the Chinese aviation industry.
Under the relevant PRC laws, civil liability of Chinese airlines for death or injuries suffered by passengers on domestic flights is limited to RMB400,000 (approximately US$57,433) per passenger. As of July 31, 2005, the Convention for the Unification of Certain Rules for International Carriage by Air of 1999, or Montreal Convention, became effective in China. Under the Montreal Convention, carriers of international flights are strictly liable for proven damages up to 128,821 Special Drawing Rights and beyond that, carriers are only able to exclude liability if they can prove that the damage was not attributable to negligence or other wrongful act of the carrier (and its agents), or the damage arose solely from the negligence or other wrongful act of a third party. We believe that we maintain adequate insurance coverage for the civil liability that can be imposed in respect of death or injuries to passengers under Chinese law, the Montreal Convention and any agreement which we are subject to.
The insurance premiums payable in respect of the CAAC group insurance policy are allocated to each participating airline based on the value of the airline’s insured aircraft and insured spares, airlines traffic RPK, passenger number and cargo revenue.
Intellectual Property
Our businesses and operations, other than the businesses and operations of Xiamen Airlines and Chongqing Airlines, are conducted under the names “China Southern” and “China Southern Airlines” in both English and Chinese. We use a stylized rendition of a kapok plant as our logo. Xiamen Airlines conducts its businesses and operations under the name of “Xiamen Airlines” in English and Chinese and uses its own logo depicting a stylized rendition of an egret. Chongqing Airlines conducts its business and operations under the name of “Chongqing Airlines” in English and Chinese and uses its own logo depicting a cross of two rivers.
We own various trademarks and trade names related to our business. The names “China Southern” and “China Southern Airlines” contain Chinese words of common usage and are therefore not eligible for registration as trade names under current Chinese law. The kapok logo is a trademark registered in China and recorded with the International Air Transport Association (“IATA”), the rights to which are owned by CSAH. Our Company and CSAH have entered into a trademark license agreement (the “Trademark License Agreement”), pursuant to which CSAH has licensed to our Group the right to use the names “China Southern” and “China Southern Airlines” in both English and Chinese and granted our Company a ten-year renewable license from 1997 to use the kapok logo on a world-wide basis. CSAH has retained the right to use the kapok logo in connection with its non-airline related businesses conducted as of the date of the Trademark License Agreement and to permit its affiliates that do not compete, directly or indirectly, with our Group to use the kapok logo. Unless CSAH gives a written notice of termination three months before the expiration of the agreement, the agreement will be automatically renewed for another ten-year term. In May of 2017, the Trademark License Agreement was automatically renewed by the two parties for another ten-year term ending 2027. Xiamen Airlines owns all rights to its egret logo, which is a trademark registered in China, and recorded with the IATA. Chongqing Airlines also owns all rights to its logo, which is a trademark registered in China, and recorded with the IATA.
51
Table of Contents
Iran Sanctions Disclosure
Pursuant to Section 13(r) of the Securities Exchange Act of 1934, or the Exchange Act, if during 2022, our Company or any of our affiliates have engaged in certain transactions with Iran or with persons or entities designated under certain executive orders, our Company would be required to disclose information regarding such transactions in our Annual Report as required under Section 219 of the Iran Threat Reduction and Syria Human Rights Act of 2012, or ITRA. In 2022 and 2021, our Company did not operate air services to and from Iran. In 2020, our Company operated air services to and from Iran through the specifically designated route of “Beijing-Urumqi-Tehran-Urumqi-Beijing” (the “Iran Route”) and engaged in international traffic in passengers, cargo and mail. At the beginning of 2020, we carried out four round-trip flights per week of the “Iran Route”. However, due to the COVID-19 pandemic, the flights of the “Iran Route” have been suspended since February 2020.
In order to provide our aviation services in Iran, our Company has entered into certain ground service agreement with Iran Air whereby Iran Air provides our Company with ground service, maintenance and other support services in return for certain service fees to be paid by our Company in accordance with the agreement. Our Company does not provide, nor has it ever provided, any equipment, component, or technology to Iran. The services rendered by our Company to Iran are limited to the provision of international traffic for passengers, cargo and mail and those services provided by our local offices and agents to customers. Our Company did not operate flights within Iran in 2022.
Our Company’s international route rights, as well as the corresponding landing rights, are derived from air service agreements negotiated between the Chinese government, through the CAAC, and the governments of the relevant foreign countries. With respect to the Iran Route, our Company’s international route rights associated thereto are derived from and based on the bilateral air transport agreement (the “Bilateral Agreement”) entered into by and between the Chinese government and the Iranian government. Both parties are contracting parties to the Convention on International Civil Aviation, opened for signature at Chicago on December 7, 1944, and entered into the Bilateral Agreement with an aim to establish and operate scheduled air services between and beyond the two countries’ respective territories. The Bilateral Agreement, which has been registered with the International Civil Aviation Organization, sets forth general principles and specific rules governing our Company’s aviation services in Iran.
Our Company understands that Iran Air is Iran’s national airline carrier and is designated by the U.S. Department of the Treasury pursuant to Executive Order No. 13382. However, Executive Order No. 13382 only “prohibits all transactions between the designees and any U.S. person.” Our Company is incorporated in the People’s Republic of China and is a foreign issuer in the United States. As our Company is not a U.S. person, our transactions with Iran Air are not prohibited by Executive Order No. 13382. Our Company further understands that it has an obligation to disclose our transactions with Iran Air as described above under Exchange Act Section 13(r)(1)(D)(iii). Iran Air is Iran’s national airline carrier and is controlled or owned by the Government of Iran. Our Company believes that Iran Air can be identified as the Government of Iran under Section 560.304 of title 31, Code of Federal Registration (relating to the definition of the Government of Iran). Our Company has not obtained any specific authorization of a Federal department or agency of the United States concerning our transactions with Iran Air.
Our Company does not anticipate any significant change in our services to Iran, either by way of increasing significantly the size of or altering the nature of our operations in the territory. For the year ended December 31, 2022, the amount of assets of Iran office and revenue generated in connection with the air services to Iran was minimal. Therefore, our Company believes that our operations in Iran for the year ended December 31, 2022 were inconsequential and quantitatively immaterial to our business, financial condition and results of operations.
52
Table of Contents
C. ORGANIZATIONAL STRUCTURE
The following chart illustrates the corporate structure of our Group as of December 31, 2022 and the aggregate effective equity interest of our Company in each of our principal subsidiaries, associates and jointly controlled entities.
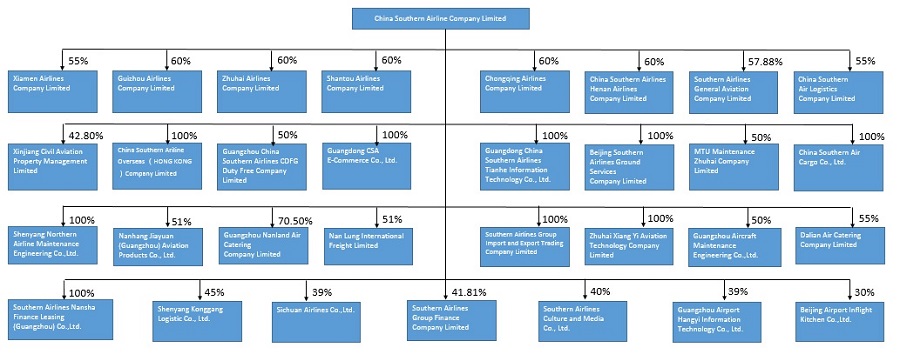
The particulars of our principal subsidiaries as of December 31, 2022 are as follows:
| Name of Company | Place and Date of Establishment/Operation |
Proportion of Ownership Interest Held by our Company |
||||||
| Xiamen Airlines Company Limited |
PRC August 11, 1984 | 55 | % | |||||
| Shantou Airlines Company Limited |
PRC July 20, 1993 | 60 | % | |||||
| Zhuhai Airlines Company Limited |
PRC May 8, 1995 | 60 | % | |||||
| Guizhou Airlines Company Limited |
PRC June 17, 1998 | 60 | % | |||||
| Chongqing Airlines Company Limited |
PRC May 30, 2007 | 60 | % | |||||
| China Southern Airlines Henan Airlines Company Limited |
PRC September 27, 2013 | 60 | % | |||||
| China Southern Air Logistics Co., Ltd. |
PRC June 8, 2018 | 55 | % | |||||
The particulars of our principal associates and joint ventures as of December 31, 2022 are as follows:
53
Table of Contents
| Proportion of Ownership Interest Held |
||||||||||||||||
| Name of Company | Place and Date of Establishment/Operation |
Group Effective Interest |
Our Company |
Subsidiaries | ||||||||||||
| Guangzhou Aircraft Maintenance Engineering Co., Ltd. |
PRC October 28, 1989 | 50 | % | 50 | % | — | ||||||||||
| China Southern Airlines Group Finance Company Limited |
PRC June 28, 1995 | 48.59 | % | 41.81 | % | 6.78 | % | |||||||||
| Sichuan Airlines Co., Ltd. |
PRC August 28, 2002 | 39 | % | 39 | % | — | ||||||||||
| Southern Airlines Culture and Media Co., Ltd. |
PRC May 13, 2004 | 40 | % | 40 | % | — | ||||||||||
| MTU Maintenance Zhuhai Co., Ltd. |
PRC March 1, 2001 | 50 | % | 50 | % | — | ||||||||||
D. PROPERTY, PLANTS AND EQUIPMENT
For a discussion of our aircraft, see Item 4 “Information on our Company-History and development of our Company-Aircraft Acquisitions.”
Our headquarters in Guangzhou occupy an area of approximately 2,063,073 square meters of land and a total gross floor area of approximately 1,118,375 square meters. We lease land in Guangzhou on which our headquarters and other facilities are located from CSAH. We also lease from CSAH certain buildings mainly at Haikou, Wuhan, Nanyang, Shenyang, Dalian, Jilin, Harbin, Xinjiang and other PRC cities.
Our principal properties are located at our headquarters site and at our route bases. The following table sets forth certain information with respect to our properties at our headquarters in Guangzhou and certain route bases as of the date hereof.
| Land (in square meters) | Building (in square meters) | |||||||||||||||
| Owned | Leased | Owned | Leased | |||||||||||||
| Guangzhou |
1,961,288 | 101,785 | 1,005,615 | 112,760 | ||||||||||||
| Shenzhen |
56,995 | — | 117,111 | 29,512 | ||||||||||||
| Zhuhai |
29,942 | — | 38,895 | — | ||||||||||||
| Changsha |
252,965 | — | 67,341 | 1,203 | ||||||||||||
| Haikou |
348,536 | — | 66,394 | — | ||||||||||||
| Wuhan |
277,638 | 38,082 | 80,869 | 23,783 | ||||||||||||
| Nanyang |
— | 1,855,907 | 13,353 | 33,635 | ||||||||||||
| Sanya |
96,343 | — | 41,410 | — | ||||||||||||
| Shenyang |
250,048 | 22,959 | 164,054 | 42,373 | ||||||||||||
| Dalian |
— | 158,240 | 47,787 | 38,496 | ||||||||||||
| Jilin |
134,488 | 46,056 | 103,737 | 7,168 | ||||||||||||
| Harbin |
30,969 | 174,537 | 68,960 | 24,079 | ||||||||||||
| Xinjiang |
18,246 | 526,900 | 167,199 | 15,300 | ||||||||||||
| Guangxi |
120,602 | — | 141,595 | — | ||||||||||||
| Beijing |
756,404 | — | 976,467 | — | ||||||||||||
| Shanghai |
42,292 | 7,898 | 94,043 | 11,816 | ||||||||||||
| Chengdu |
— | — | 1,786 | 4,020 | ||||||||||||
| Qingdao |
— | — | 767 | — | ||||||||||||
| Hefei |
— | — | 976 | — | ||||||||||||
| Sydney |
— | — | 1,151 | — | ||||||||||||
| Amsterdam |
— | — | 455 | — | ||||||||||||
| Xi’an |
54,277 | — | 4,364 | — | ||||||||||||
| Yunnan |
— | — | 1,967 | — | ||||||||||||
| Hangzhou |
— | — | 871 | — | ||||||||||||
| Nanjing |
— | — | 1,704 | — | ||||||||||||
The following table sets forth certain information with respect to the properties of the subsidiaries named below as of the date hereof.
54
Table of Contents
| Land (in square meters) | Building (in square meters) | |||||||||||||||
| Owned | Leased | Owned | Leased | |||||||||||||
| Xiamen Airlines |
1,051,000 | — | 1,063,200 | 17,396 | ||||||||||||
| Shantou Airlines |
262,324 | — | 86,262 | — | ||||||||||||
| Zhuhai Airlines |
120,006 | — | 75,023 | 762 | ||||||||||||
| Guizhou Airlines |
254,790 | — | 65,238 | — | ||||||||||||
| Chongqing Airlines |
82,449 | — | 68,681 | — | ||||||||||||
| Henan Airlines |
388,210 | — | 63,142 | — | ||||||||||||
| Zhuhai Xiang Yi Aviation Technology Co., Ltd. |
132,088 | — | 68,902 | |||||||||||||
We lease certain lands and buildings from CSAH, some of which are lacking adequate documentation evidencing CSAH’s rights to such land and buildings. As a consequence, the relevant lease agreements between CSAH and our Company for such land or building may not be registered with the relevant authorities. Lack of registration may affect the validity of such lease agreements against a third party. There are certain other parcels of land and buildings owned or used by us that lack adequate documentation. Lack of adequate documentation for land use rights and ownership of buildings may impair our ability to dispose of or mortgage such land use rights and buildings. As of the date of this Annual report, the Group was in the process of applying for the land use right certificates and property title certificates in respect of the properties located in several cities in which the Group has interests and for which such certificates have not been granted. Our directors are of the opinion that the use of and the conduct of operating activities at the properties referred to above are not affected by the fact that we have not yet obtained the relevant land use right certificates and property title certificates.
On August 14, 2007, we entered into an assets transfer agreement with CSAH, pursuant to which we purchased from CSAH certain assets including 19 buildings with aggregate area of 21,962.25 square meters. These buildings were not with a property title certificate at the time of our purchase. CSAH undertook to obtain the relevant property title certificate for these buildings by December 30, 2019 and obtained the certificates for 12 of these buildings as of December 20, 2019. CSAH was unable to obtain the certificates for the rest of the buildings due to restrictions imposed by PRC laws and regulations. With respect to these buildings which do not have the property title certificates, CSAH undertakes to (i) apply for such certificates at its cost if the restrictions imposed by PRC laws and regulations no longer exist, and (ii) indemnify us if we suffer any losses resulted from third party claims arising from the lack of property title certificates of these buildings or from our ordinary business operation being affected by the defects of title of these buildings.
ITEM 4A. UNRESOLVED STAFF COMMENTS
Not applicable.
ITEM 5. OPERATING AND FINANCIAL REVIEW AND PROSPECTS
The following discussion and analysis should be read in conjunction with our consolidated financial statements, which have been prepared in accordance with IFRSs, included elsewhere in this Annual Report.
Critical Accounting Estimates
We prepare our consolidated financial statements in accordance with IFRS, as issued by the IASB. In doing so, we need to make estimates and assumptions. Our critical accounting estimates are those estimates that involve a significant level of uncertainty at the time the estimate was made, and changes in them have had or are reasonably likely to have a material effect on our financial condition or results of operations. Accordingly, actual results could differ materially from our estimates. We base our estimates on past experience and other assumptions that we believe are reasonable under the circumstances, and we evaluate these estimates on an ongoing basis.
55
Table of Contents
Impairment of long-lived assets (other than goodwill)
As discussed in Note 2(l)(iii) to the consolidated financial statements included elsewhere in this Annual Report, at the end of each reporting period, the Group tests for impairment for long-lived assets or cash-generating units (“CGUs”) (a portion of which related to aircraft and other flight equipment including rotables in property, plant and equipment, aircraft and engines in right-of-use assets (“aircraft and related equipment”)) to determine whether the recoverable amounts have declined below the carrying amounts. If circumstances indicate that the carrying amount of long-lived assets or CGUs may not be recoverable, the assets or CGUs may be considered “impaired”, and an impairment loss may be recognized.
The recoverable amount of assets or CGUs are the higher of the fair value less costs of disposal and value in use. As the fair value of certain assets or CGUs may not be publicly available, the Group uses all readily available information in determining an amount that is a reasonable approximation of recoverable amount, including estimates based on reasonable and supportable assumptions for projections of traffic revenue and operating costs and discount rates. In particular, in determining the value in use of the Group’s aircraft and related equipment, significant judgments are required on the accounting estimates which are based on the assumptions relating to traffic revenue growth rates, operating costs growth rates and discount rates applied, among which, operating costs consist of jet fuel costs, landing and navigation fees, maintenance expenses, payroll and welfare.
Frequent flyer revenue
According to the frequent flyer award programs, the allocation of stand-alone selling price of the mileage awarded involves the estimation of the expected redemption rate. The expected redemption rate is estimated based on historical experience of mileage redemption, taking into consideration expected future mileage redemption patterns, which are associated with changes in the terms of mileage programs and customer behavior. Different estimates could significantly affect the estimated contract liabilities and the results of operations.
Income tax
Deferred tax assets associated with tax losses are recognized to the extent that it is probable that future taxable profits will be available against which the asset can be utilized. In determining the forecast of future taxable profits, significant judgements are required on the accounting estimates which are based on the assumptions relating to traffic revenue growth rates and related operating costs growth rates, among which, operating costs consist of jet fuel costs, landing and navigation fees, maintenance expenses, payroll and welfare. Different estimates could significantly affect the recognition of deferred tax assets associated with tax losses.
Depreciation and amortization
As disclosed in Note 2(i) and Note 2(k) to the consolidated financial statements, components related to engine overhaul costs under property, plant and equipment and right-of-use assets were depreciated on the units of production method based on flying hours. The expected flying hours of engines are based on the Group’s historical overhaul experience with similar engine models. Except for components related to engine overhaul costs, other property, plant and equipment and right-of-use assets are depreciated or amortized on a straight-line basis over the estimated useful lives or lease term, which is shorter, after taking into account the estimated residual value. The useful lives are based on the Group’s historical experience with similar assets and take into account anticipated technological changes. The Group reviews the estimated useful lives of assets annually in order to determine the amount of depreciation and amortization expense to be recorded during any financial year. The depreciation and amortization expense for future periods is adjusted if there are significant changes from previous estimates.
56
Table of Contents
Provision for major overhauls
As disclosed in Note 2(k) and Note 2(aa) to the consolidated financial statements, provision for the cost of major overhauls to fulfil the lease return conditions involves estimation of the expected overhaul cycles and overhaul costs, which are based on the historical experience of actual costs incurred for overhauls of airframes and engines of the same or similar types and current economic and airline-related developments. Different estimates could significantly affect the estimated provision and the results of operations.
Ticket breakage revenue
The Group recognizes, in proportion to the pattern of rights exercised by the customer, the breakage amount to which the Group expects to be entitled as ticket breakage revenue. Such portion is estimated based on the Group’s historical experiences, and the estimated revenue is recognized only to the extent that it is highly probable that a significant reversal in cumulative revenue recognized will not occur when the uncertainty is resolved. Different estimates could significantly affect the ticket breakage revenue recognized in the current financial year.
Recently Pronounced International Financial Reporting Standards
Information relating to the recently pronounced IFRSs is presented in Note 58 to the consolidated financial statements.
Key Factors Affecting Results of Operations
Our results of operations are affected by the factors discussed below.
COVID-19 Pandemic
The COVID-19 pandemic, along with the measures governments and private organizations worldwide have implemented in an attempt to contain the spread of this pandemic, resulted in a severe decline in demand for both domestic and international air travel since 2020, which in turn has adversely affected our business, results of operations and financial condition. We responded proactively to the pandemic to mitigate its effects on our business by taking various measures, including reducing capacity, delaying the delivery of new aircraft, seizing market opportunities to adopt various measures to increase passenger and freight revenue, and implementing expense management to better align our cost with our reduced schedule. Despite these steps, the cost-saving measures we implemented since 2020 have not entirely offset the loss in revenues as a result of decreased ticket sales due to the pandemic. The Company recorded a loss in the operating results of RMB22,542 million for the year 2022.
Since December 2022, the Chinese government has modified its COVID-19 control policy, and most of the travel restrictions and quarantine requirements have been lifted. On January 8, 2023, CAAC removed the restrictions on international flights from and to China and limitations on the number of international routes and flights each airline in China could operate. We have seen our recovery from the impact of the COVID-19 pandemic for both domestic and international markets, but we are not able to predict the pace of such recovery. The impact of COVID-19 pandemic on us in the future will depend on future developments which are highly unpredictable and beyond our control, such as the frequency, duration and severity of the resurgence of COVID-19 and the emergence of new variants, as well as the measures that may be taken by governments around the world in response to these developments, the impact of the pandemic on the global economy and the measures taken by governments to stimulate the general economy. Therefore, we cannot guarantee that the pandemic will not continue to have an adverse effect on our business and results of operations in the future, which may be material. See Item 3. Key Information – D. Risk Factors – “The outbreak and global spread of the COVID-19 pandemic have had a material adverse effect on our business. The duration and severity of the pandemic, and similar public health threats or a large scale natural disaster we may face in the future, could result in additional adverse effects on our business” and Item 4. Information of the Company – B. Business Overview – “Impact of the COVID-19 Pandemic” for additional discussion regarding the impact of the COVID-19 pandemic on our operation results and financial condition.
57
Table of Contents
Financial and operating leverage
Like most airlines, we are subject to a high degree of financial and operating leverage. A significant percentage of our operating expenses are fixed costs that do not vary proportionally with our yields or the load factors. These fixed costs include depreciation expense, jet fuel costs, landing and navigation fees, financing costs, operating lease payments, aircraft maintenance costs and labor costs for flight crew, cabin crew and ground personnel. Thus, a decrease in our yields or load factors could have a material adverse effect on our results of operations. In addition, certain of these expenses, primarily financing costs and labor costs and depreciations do not vary proportionally with the number of flights flown. Thus, even a minor change in aircraft utilization rates may affect our results of operations. We are and will continue to be highly leveraged with substantial liabilities denominated in foreign currencies and, accordingly, the results of our operations are significantly affected by fluctuations in foreign exchange rates, particularly for the U.S. dollar. A net exchange loss of RMB3,619 million was recorded in 2022, primarily attributable to the translation of balances of lease liabilities which are denominated in USD.
Political and economic conditions and regulations
A number of external factors, including political and economic conditions in China, tend to have a major impact on our performance. Our financial performance is also significantly affected by factors arising from operating in a regulated industry. As substantially all aspects of our airline operations are regulated by the PRC government, our operating revenue and expenses are directly affected by the PRC government’s policies with respect to domestic air fares, jet fuel prices and landing and navigation fees, among others. The nature and extent of airline competition and the ability of Chinese airlines to expand are also affected by CAAC’s control over route allocations. Any changes in the PRC government’s regulatory policies or any implementation of such policies could have a significant impact on our future operations and our ability to implement our operating strategy.
Foreign exchange risk
We finance our aircraft acquisitions mainly through leases or bank loans in U.S. dollars, and have a substantial amount of transactions and liabilities denominated in U.S. dollars in relation to our global purchases of jet fuel, lease and purchase of aviation equipment as well as major repairs, in addition to the landing fees of our international flights in the airports of other countries, and, as a result, our business will be affected by the Renminbi depreciation. Renminbi depreciation has caused exchange loss to our Group and increased our operating costs which are denominated in foreign currencies.
Seasonality
Our operating revenue is substantially dependent on the passenger and cargo traffic volume carried, which is subject to seasonal and other changes in traffic patterns, the availability of appropriate time slots for our flights and alternative routes, the degree of competition from other airlines and alternate means of transportation, as well as other factors that may influence passenger travel demand and cargo and mail volume. In particular, our airline revenue is generally higher in the second half of the year than in the first half of the year due to the greater demand for air travel during the summer months, although such traditional seasonal trends have been disrupted during the period from 2020 to 2022 due to the significantly reduced travel demand resulting from the COVID-19 pandemic. In 2022, our airline revenue was higher in the second half of the year than in the first half of the year as there have been more outbreaks of COVID-19 which resulted in restriction on travel during the first half of the year. See “Item 3. Key Information – Risk Factors – Our results of operations tend to be volatile and fluctuate due to seasonality” for additional discussion.
In addition, our future operations will be affected by, among other things, changes in the aviation market, the cost of jet fuel, aircraft acquisition and leasing costs, aircraft maintenance expenses, take-off and landing charges, wages, salaries and benefits and other operating expenses, foreign exchange rates and the rates of income taxes paid.
Certain Financial Information and Operating Data by Geographic Region
The following table sets forth certain financial information and operating data by geographic region for the years ended December 31, 2022, 2021 and 2020.
58
Table of Contents
| Year ended December 31, | 2022 vs. 2021% increase |
2021 vs. 2020% increase |
||||||||||||||||||
| Traffic | 2022 | 2021 | 2020 | (decrease) | (decrease) | |||||||||||||||
| RPK (million) |
||||||||||||||||||||
| Domestic |
96,988.77 | 148,223.63 | 140,135.20 | (34.57 | ) | 5.77 | ||||||||||||||
| Regional |
175.05 | 152.48 | 239.14 | 14.80 | (36.24 | ) | ||||||||||||||
| International |
4,913.87 | 4,050.18 | 13,065.78 | 21.32 | (69.00 | ) | ||||||||||||||
| Total |
102,077.70 | 152,426.29 | 153,440.11 | (33.03 | ) | (0.66 | ) | |||||||||||||
| RTK (million) |
||||||||||||||||||||
| Domestic |
9,593.64 | 14,389.54 | 13,720.92 | (33.33 | ) | 4.87 | ||||||||||||||
| Regional |
22.86 | 25.48 | 30.19 | (10.30 | ) | (15.60 | ) | |||||||||||||
| International |
6,767.24 | 6,793.68 | 7,053.76 | (0.39 | ) | (3.69 | ) | |||||||||||||
| Total |
16,383.74 | 21,208.71 | 20,804.88 | (22.75 | ) | 1.94 | ||||||||||||||
| Passengers carried (thousand) |
||||||||||||||||||||
| Domestic |
61,666.22 | 97,717.02 | 93,911.34 | (36.89 | ) | 4.05 | ||||||||||||||
| Regional |
157.23 | 147.75 | 213.22 | 6.42 | (30.71 | ) | ||||||||||||||
| International |
812.62 | 639.89 | 2,731.48 | 26.99 | (76.57 | ) | ||||||||||||||
| Total |
62,636.06 | 98,504.66 | 96,856.04 | (36.41 | ) | 1.70 | ||||||||||||||
| Cargo and mail carried (thousand tons) |
||||||||||||||||||||
| Domestic |
633.61 | 765.34 | 817.51 | (17.21 | ) | (6.38 | ) | |||||||||||||
| Regional |
6.87 | 12.19 | 9.12 | (43.68 | ) | 33.66 | ||||||||||||||
| International |
686.17 | 664.42 | 634.19 | 3.27 | 4.77 | |||||||||||||||
| Total |
1,326.64 | 1,441.95 | 1,460.83 | (8.00 | ) | (1.29 | ) | |||||||||||||
| Capacity |
||||||||||||||||||||
| ASK (million) |
||||||||||||||||||||
| Domestic |
145,655.54 | 205,437.17 | 193,935.93 | (29.10 | ) | 5.93 | ||||||||||||||
| Regional |
410.36 | 463.01 | 550.91 | (11.37 | ) | (15.96 | ) | |||||||||||||
| International |
7,779.24 | 8,021.64 | 20,235.13 | (3.02 | ) | (60.36 | ) | |||||||||||||
| Total |
153,845.14 | 213,921.82 | 214,721.97 | (28.08 | ) | (0.37 | ) | |||||||||||||
| ATK (million) |
||||||||||||||||||||
| Domestic |
16,139.92 | 23,431.06 | 22,182.70 | (31.12 | ) | 5.63 | ||||||||||||||
| Regional |
55.49 | 61.20 | 70.71 | (9.33 | ) | (13.46 | ) | |||||||||||||
| International |
10,026.34 | 10,025.45 | 11,638.87 | 0.01 | (13.86 | ) | ||||||||||||||
| Total |
26,221.74 | 33,517.70 | 33,892.28 | (21.77 | ) | (1.11 | ) | |||||||||||||
59
Table of Contents
| Load Factors | 2022 vs. (decrease) Percentage points |
2021 vs. (decrease) Percentage points |
||||||||||||||||||
| Passenger load factor (RPK/ASK) (%) |
||||||||||||||||||||
| Domestic |
66.59 | 72.15 | 72.26 | (5.56 | ) | (0.11 | ) | |||||||||||||
| Regional |
42.66 | 32.93 | 43.41 | 9.72 | (10.47 | ) | ||||||||||||||
| International |
63.17 | 50.49 | 64.57 | 12.68 | (14.08 | ) | ||||||||||||||
| Average |
66.35 | 71.25 | 71.46 | (4.90 | ) | (0.21 | ) | |||||||||||||
| Overall load factor (RTK/ATK) (%) |
||||||||||||||||||||
| Domestic |
59.44 | 61.41 | 61.85 | (1.97 | ) | (0.44 | ) | |||||||||||||
| Regional |
41.20 | 41.64 | 42.70 | (0.44 | ) | (1.06 | ) | |||||||||||||
| International |
67.49 | 67.76 | 60.61 | (0.27 | ) | 7.16 | ||||||||||||||
| Average |
62.48 | 63.28 | 61.39 | (0.79 | ) | 1.89 | ||||||||||||||
| Yield | 2022 vs. 2021% increase |
2021 vs. 2020% increase |
||||||||||||||||||
| Yield per RPK (RMB) | (decrease) | (decrease) | ||||||||||||||||||
| Domestic |
0.51 | 0.46 | 0.41 | 10.87 | 12.20 | |||||||||||||||
| Regional |
2.66 | 1.46 | 1.05 | 82.19 | 39.05 | |||||||||||||||
| International |
2.00 | 1.61 | 0.96 | 24.22 | 67.71 | |||||||||||||||
| Average |
0.59 | 0.49 | 0.46 | 20.41 | 6.52 | |||||||||||||||
| Yield per RTK (RMB) |
||||||||||||||||||||
| Domestic |
5.33 | 4.88 | 4.34 | 9.22 | 12.44 | |||||||||||||||
| Regional |
24.23 | 15.23 | 11.06 | 59.09 | 37.70 | |||||||||||||||
| International |
4.32 | 3.64 | 3.84 | 18.68 | (5.21 | ) | ||||||||||||||
| Average |
4.94 | 4.49 | 4.18 | 10.02 | 7.42 | |||||||||||||||
| Financial |
||||||||||||||||||||
| Passenger revenue (RMB million) |
||||||||||||||||||||
| Domestic |
49,723 | 68,656 | 57,793 | (27.58 | ) | 18.80 | ||||||||||||||
| Regional |
466 | 223 | 251 | 108.97 | (11.16 | ) | ||||||||||||||
| International |
9,828 | 6,513 | 12,490 | 50.90 | (47.85 | ) | ||||||||||||||
| Total |
60,017 | 75,392 | 70,534 | (20.39 | ) | 6.89 | ||||||||||||||
| Cargo and mail revenue (RMB million) |
20,884 | 19,887 | 16,493 | 5.01 | 20.58 | |||||||||||||||
60
Table of Contents
A. OPERATING RESULTS
The following discussion is based on our historical results of operations. Because of the factors discussed above, our results of operations may not be indicative of our future operating performance.
2022 compared with 2021
Net loss attributable to equity shareholders of the Company of RMB32,699 million was recorded in 2022 as compared to net loss attributable to equity shareholders of the Company of RMB12,106 million in 2021. The Group’s total operating revenue decreased by RMB14,585 million or 14.35% from RMB101,644 million in 2021 to RMB87,059 million in 2022. Passenger load factor decreased by 4.90 percentage point from 71.25% in 2021 to 66.35% in 2022. Yield per RPK increased by 20.41% from RMB0.49 in 2021 to RMB0.59 in 2022. Yield per RTK increased by 10.02% from RMB4.49 in 2021 to RMB4.94 in 2022. Operating expenses decreased by RMB1,078 million or 0.93% from RMB116,340 million in 2021 to RMB115,262 million in 2022. As a result of multiple adverse factors, including the impact of the COVID-19 pandemic on the aviation industry, an operating loss of RMB22,542 million was recorded in 2022 as compared to an operating loss of RMB9,929 million recorded in 2021.
Operating Revenue
The following table sets forth operating revenue for the years indicated:
| 2022 | 2021 | |||||||||||||||||||
| Operating revenue RMB million |
Percentage % |
Operating revenue RMB million |
Percentage % |
Changes in revenue % |
||||||||||||||||
| Traffic revenue |
80,901 | 92.93 | 95,279 | 93.74 | (15.09 | ) | ||||||||||||||
| Including: Passenger revenue |
60,017 | 75,392 | (20.39 | ) | ||||||||||||||||
| – Domestic |
49,723 | 68,656 | (27.58 | ) | ||||||||||||||||
| – Hong Kong, Macau and Taiwan |
466 | 223 | 108.97 | |||||||||||||||||
| – International |
9,828 | 6,513 | 50.90 | |||||||||||||||||
| Cargo and mail revenue |
20,884 | 19,887 | 5.01 | |||||||||||||||||
| Other operating revenue |
6,158 | 7.07 | 6,365 | 6.26 | (3.25 | ) | ||||||||||||||
| Mainly including: |
||||||||||||||||||||
| Commission income |
2,073 | 2,677 | (22.56 | ) | ||||||||||||||||
| Cargo handling income |
1,123 | 864 | 29.98 | |||||||||||||||||
| Ground services income |
282 | 326 | (13.50 | ) | ||||||||||||||||
| General aviation income |
431 | 572 | (24.65 | ) | ||||||||||||||||
| Hotel and tour operation income |
497 | 538 | (7.62 | ) | ||||||||||||||||
| Total operating revenue |
87,059 | 100.00 | 101,644 | 100.00 | (14.35 | ) | ||||||||||||||
| 2022 | 2021 | |||||||||||||||||||
| Traffic revenue RMB million |
Percentage % |
Traffic revenue RMB million |
Percentage % |
Changes in traffic revenue % |
||||||||||||||||
| Passenger revenue |
60,017 | 74.19 | 75,392 | 79.13 | (20.39 | ) | ||||||||||||||
| Cargo and mail revenue |
20,884 | 25.81 | 19,887 | 20.87 | 5.01 | |||||||||||||||
| Traffic revenue |
80,901 | 100.00 | 95,279 | 100.00 | (15.09 | ) | ||||||||||||||
61
Table of Contents
| 2022 | 2021 | |||||||||||||||||||
| Passenger revenue RMB million |
Percentage % |
Passenger revenue RMB million |
Percentage % |
Changes in passenger revenue % |
||||||||||||||||
| Domestic |
49,723 | 82.85 | 68,656 | 91.07 | (27.58 | ) | ||||||||||||||
| Hong Kong, Macau and Taiwan |
466 | 0.78 | 223 | 0.30 | 108.97 | |||||||||||||||
| International |
9,828 | 16.38 | 6,513 | 8.63 | 50.90 | |||||||||||||||
| Total |
60,017 | 100.00 | 75,392 | 100.00 | (20.39 | ) | ||||||||||||||
Substantially all of the Group’s operating revenue is attributable to airlines transport operations. Traffic revenue accounted for 93.74% and 92.93% of the total operating revenue in 2021 and 2022, respectively. Passenger revenue and cargo and mail revenue accounted for 74.19% and 25.81%, respectively, of the total traffic revenue in 2022. During the reporting period, the Group’s total traffic revenue was RMB80,901 million, representing a decrease of RMB14,378 million or 15.09% from prior year, mainly because of the decrease in passenger revenue. The other operating revenue of the Group is mainly derived from commission income, cargo handling income, ground services income, general aviation income and hotel and tour operation income.
The decrease in operating revenue was primarily due to a decrease in passenger revenue by 20.39% from RMB 75,392 million in 2021 to RMB60,017 million in 2022. The total number of passengers carried decreased by 36.41% from 98.50 million passengers in 2021 to 62.64 million passengers in 2022. RPKs decreased by 33.03% from 152,426 million in 2021 to 102,078 million in 2022, mainly due to the impact of the travel restrictions.
Domestic passenger revenue, which accounted for 82.85% of the total passenger revenue in 2022, decreased by 27.58% from RMB 68,656 million in 2021 to RMB49,723 million in 2022 mainly due to the decreased demand for domestic air travel resulting from COVID-19 prevention policies in the PRC and the number of passengers carried by domestic flight decreased by 36.89% as compared to 2021. Domestic passenger traffic in RPKs decreased by 34.57%, while passenger capacity in ASKs decreased by 29.10%, resulting in a decrease in passenger load factor by 5.56 percentage points from 72.15% in 2021 to 66.59% in 2022. Yield per RPK increased by 10.87% from RMB0.46 in 2021 to RMB0.51 in 2022.
Hong Kong, Macau and Taiwan passenger revenue, which accounted for 0.78% of total passenger revenue, increased by 108.97% from RMB 223 million in 2021 to RMB466 million in 2022, primarily due to the travel restrictions resulting from the COVID-19 pandemic. For Hong Kong, Macau and Taiwan flights, passenger traffic in RPKs increased by 14.80%, while passenger capacity in ASKs decreased by 11.37%, resulting in an increase in passenger load factor by 9.72 percentage points from 32.93% in 2021 to 42.66% in 2022. Passenger yield per RPK increased by 82.19% from RMB 1.46 in 2021 to RMB2.66 in 2022.
International passenger revenue, which accounted for 16.38% of total passenger revenue, increased by 50.90% from RMB6,513 million in 2021 to RMB9,828 million in 2022, primarily due to the increase in number of passengers carried. For international flights, passenger traffic in RPKs increased by 21.32%, while passenger capacity in ASKs decreased by 3.02%, resulting in an increase in passenger load factor by 12.68 percentage points from 50.49% in 2021 to 63.17% in 2022. Passenger yield per RPK increased by 24.22% from RMB1.61 in 2021 to RMB2.00 in 2022.
Cargo and mail revenue, which accounted for 25.81% of the Group’s total traffic revenue and 23.99% of total operating revenue, increased by 5.01% from RMB19,887 million in 2021 to RMB20,884 million in 2022. The increase was mainly attributable to the increase in demand for freight, especially international freight.
Other operating revenue decreased by 3.25% from RMB6,365 million in 2021 to RMB6,158 million in 2022, remaining at generally the same level as compared to 2021.
Operating Expenses
Total operating expenses in 2022 amounted to RMB115,262 million, representing a decrease of RMB1,078 million or 0.93% compared to that of 2021. Total operating expenses as a percentage of total operating revenue increased from 114.46% in 2021 to 132.40% in 2022.
62
Table of Contents
The table below sets forth our operating expenses for the years indicated:
| 2022 | 2021 | |||||||||||||||||||
| Operating expenses RMB million |
Percentage % |
Operating expenses RMB |
Percentage % |
Changes % |
||||||||||||||||
| Flight operation expenses |
51,241 | 44.46 | 45,569 | 39.17 | 12.45 | |||||||||||||||
| Mainly including: |
||||||||||||||||||||
| Jet fuel costs |
32,669 | 25,505 | 28.09 | |||||||||||||||||
| Aircraft operating lease charges |
791 | 920 | (14.02 | ) | ||||||||||||||||
| Flight personnel payroll and welfare |
10,602 | 10,763 | (1.5 | ) | ||||||||||||||||
| Maintenance expenses |
11,224 | 9.74 | 12,162 | 10.45 | (7.71 | ) | ||||||||||||||
| Aircraft and transportation service expenses |
17,506 | 15.19 | 21,147 | 18.18 | (17.22 | ) | ||||||||||||||
| Promotion and selling expenses |
4,355 | 3.78 | 4,705 | 4.04 | (7.44 | ) | ||||||||||||||
| General and administrative expenses |
3,511 | 3.05 | 3,663 | 3.15 | (4.15 | ) | ||||||||||||||
| Depreciation and amortization |
24,266 | 21.05 | 24,241 | 20.84 | 0.10 | |||||||||||||||
| Impairment losses on property, plant and equipment and right-of-use assets |
449 | 0.39 | 2,597 | 2.23 | (82.71 | ) | ||||||||||||||
| Hotel and tour operation expenses |
418 | 0.36 | 423 | 0.36 | (1.18 | ) | ||||||||||||||
| External air catering service expenses |
343 | 0.30 | 368 | 0.32 | (6.79 | ) | ||||||||||||||
| Financial institution charges |
72 | 0.06 | 74 | 0.06 | (2.7 | ) | ||||||||||||||
| Cargo handling expenses |
537 | 0.46 | 398 | 0.34 | 34.92 | |||||||||||||||
| Others |
1,340 | 1.16 | 993 | 0.86 | 34.94 | |||||||||||||||
| Total operating expenses |
115,262 | 100.00 | 116,340 | 100.00 | (0.93 | ) | ||||||||||||||
Flight operation expenses, which accounted for 44.46% of total operating expenses, increased by 12.45% from RMB45,569 million in 2021 to RMB 51,241 million in 2022, mainly resulting from the increase of jet fuel cost, which increased by 28.09% from RMB25,505 million in 2021 to RMB 32,669 million in 2022. The increase in jet fuel cost was caused by the increase in jet fuel price in 2022.
Maintenance expenses, which accounted for 9.74% of total operating expenses, decreased by 7.71% from RMB12,162 million in 2021 to RMB11,224 million in 2022, due to the decrease of flight volume.
Aircraft and transportation service expenses, which accounted for 15.19% of total operating expenses, decreased by 17.22% from RMB21,147 million in 2021 to RMB17,506 million in 2022. The decrease was primarily due to a decrease in the amounts of take-off and landing and navigation fees.
Promotion and selling expenses, which accounted for 3.78% of total operating expenses, decreased by 7.44% from RMB4,705 million in 2021 to RMB4,355 million in 2022.
General and administrative expenses, which accounted for 3.05% of the total operating expenses, remained at generally the same level as compared to 2021.
Depreciation and amortization, which accounted for 21.05% of the total operating expenses, remained at generally the same level as compared to 2021.
Impairment losses on property, plant and equipment, right-of-use assets and other assets, which accounted for 0.39% of the total operating expenses, decreased by 82.71% from RMB2,597 million in 2021 to RMB449 million in 2022, mainly due to the decrease of impairment provision for aircraft and related equipment.
Operating Loss
Operating loss of RMB22,542 million was recorded in 2022 as compared to an operating loss of RMB9,929 million in 2021.
63
Table of Contents
Other Net Income
Other net income increased by RMB894 million from RMB4,767 million in 2021 to RMB5,661 million in 2022, mainly due to an increase in government subsidies.
Interest Expense and Net Exchange Gain/(Loss)
Interest expense decreased by RMB196 million from RMB 6,202 million in 2021 to RMB6,006 million in 2022, mainly due to the decrease in interest expense on lease liabilities.
Net exchange loss of RMB3,619 million was recorded in 2022, as compared with a net exchange gain of RMB1,575 million in 2021. Net exchange loss was primarily attributable to exchange differences arising from the lease liabilities denominated in USD, along with the depreciation of Renminbi against the U.S. dollar.
Income Tax
Income tax expense of RMB2,166 million was recorded in 2022 as compared to an income tax credit of RMB2,894 million in 2021, mainly due to the increase in accumulated tax losses not recognized as deferred tax assets. The effective tax rate in 2022 was 6.87% as compared to 20.81% in 2021.
2021 compared with 2020
For a discussion of the comparison of our results of operation between 2020 and 2021, please see the section headed “Item 5. Operating and Financial Review and Prospects: A. Operating Results” in the Annual Report for the fiscal year ended December 31, 2021 on the Form 20-F filed with the Securities and Exchange Commission on April 28, 2022.
B. LIQUIDITY AND CAPITAL RESOURCES
Generally, we meet our working capital and capital expenditure requirements through cash from our operations, the proceeds from issuance of bonds, the proceeds of certain long-term and short-term bank loans and lease financing.
As of December 31, 2022, we had banking facilities with several PRC commercial banks for providing loan financing of up to approximately RMB320,530 million to our Group. As of December 31, 2022, approximately RMB223,729 million was unutilized. As of December 31, 2022 and 2021, our cash and cash equivalents were RMB19,889million and RMB21,456 million, respectively.
Net cash outflow from operating activities in 2022 amounted to RMB2,450 million. Net cash generated from operating activities in 2021 and 2020 amounted to RMB7,688 million and RMB2,698 million, respectively. Our Group’s operating cash inflows are primarily derived from the provision of air transportation and related services to customers. Operating cash outflows are primarily related to the recurring operating expenses, including flight operation, maintenance, aircraft and transportation services, and others. The Group recorded a net cash outflow of RMB2,450 million from operating activities in 2022 while the Group recorded a net cash inflow of RMB7,688 million in 2021, primarily due to the decline in passenger volume and the increase in fuel costs in the reporting period.
Net cash used in investing activities in 2022, 2021 and 2020 were RMB5,851 million, RMB15,820 million and RMB8,049 million, respectively. Cash capital expenditures in 2022, 2021 and 2020 were RMB11,696 million, RMB17,137 million and RMB11,061 million, respectively. Net cash used in investing activities decreased from RMB15,820 million in 2021 to RMB5,851 million in 2022, primarily representing the decrease in the purchase of aircrafts and the increase in the proceeds from disposal of long-term assets.
64
Table of Contents
Net cash generated from financing activities were RMB6,658 million in 2022, as compared to net cash generated from financing activities of RMB4,186 million in 2021. Net cash inflow from borrowings and repayments of borrowings amounted to RMB23,370 million in 2022, while net cash inflow from borrowings and repayments of borrowings amounted to RMB25,324 million in 2021. The borrowings were used for capital expenditures and general working capital. Capital element of lease rentals paid was RMB21,960 million in 2022 and RMB21,613 million in 2021, respectively.
Net cash generated in financing activities amounted to RMB RMB28,945 million in 2020. Net cash inflow from borrowings and repayments of borrowings amounted to RMB30,085 million in 2020. The borrowings were used for capital expenditures and general working capital. Repayment of capital leases amounted to RMB RMB20,670 million in 2020, resulting from the increase of aircraft acquisitions under capital leases.
On September 27, 2018, we issued 1,578,073,089 A Shares in total to CSAH at the issue price of RMB6.02 per A Share pursuant to the subscription agreement dated June 26, 2017 entered into between CSAH and us (as amended by the supplemental agreement dated September 19, 2017). The gross proceeds and net proceeds raised from such issuance are approximately RMB9,500 million and RMB9,488 million respectively, which were used for introducing aircraft and installation of lightweight seats for aircraft. As of December 31, 2020, the proceeds from this issuance have been fully utilized.
On February 21, 2019, we issued the first tranche of 2019 corporate bonds with an aggregate nominal value of RMB3,000 million at an interest rate of 3.45% per annum. On May 16, 2019, we issued the second tranche of 2019 corporate bonds with an aggregate nominal value of RMB2,000 million at an interest rate of 3.72% per annum. On November 20, 2019, Xiamen Airlines issued the first tranche of 2019 corporate bonds with an aggregate nominal value of RMB1,500 million at an interest rate of 3.58% per annum. On March 16, 2020, Xiamen Airlines issued the first tranche of 2020 corporate bonds with an aggregate nominal value of RMB1,000 million at an interest rate of 2.95% per annum. The 2019 and 2020 corporate bonds mature in three years. On February 22, 2022, we fully settled the principal and interest of the first tranche of 2019 corporate bonds. On May 17, 2022, we fully settled the principal and interest of the second tranche of 2019 corporate bonds. The proceeds from the issuance of the corporate bonds will be used to replenish working capital and repay corporate debts.
In November 2020, we received CSRC approval on our proposed public issuance of short-term corporate bonds to professional investors having a gross minimal value not exceeding RMB10,000 million. The short-term corporate bonds will be issued in multiple tranches. The issuance of the first tranche must be completed within 12 months from the date of the approval and the issuance of the remaining tranches must be completed within 24 months from the date of the approval. The proceeds from the issuance of the short-term corporate bonds will be used to replenish working capital and repay corporate debts.
In October 2020, we issued a total of 160,000,000 bonds convertible to A Shares, with a nominal value of RMB100 each and an aggregate value amounting to RMB16,000 million. The convertible bonds were issued at nominal value and the initial conversion price was RMB6.24 per share. The bonds have a term of six years from the date of the issuance, which commences from October 15, 2020 and ends on October 14, 2026. The bonds bear an interest at the rate of 0.2% in the first year, 0.4% in the second year, 0.6% in the third year, 0.8% in the fourth year, 1.5% in the fifth year and 2.0% in the sixth year. If the conversion rights are not exercised in five transaction days after maturity, the bond will be redeemed at 106.5% of par value (including the interest for the sixth year). With effect from November 28, 2022, the conversion price was adjusted to RMB6.17 per share. As of December 31, 2022, a total of 101,035,990 bonds had been converted into 1,619,166,428 A Shares. The use of proceeds utilized was consistent with the intended use of proceeds as previously disclosed.
65
Table of Contents
| Gross proceeds from the A Shares |
Intended use of the proceeds as previously disclosed |
Utilized proceeds as of December 31, 2022 (RMB) |
Unutilized proceeds as of December 31, 2022 (RMB) |
Expected timeline for the use of unutilized proceeds | ||||||||
| 16,000,000,000.00 |
Purchasing aircraft and aviation equipment |
7,451,330,906.36 | 3,092,044,501.64 | On or before December 31, | ||||||||
| Introduction of spare engines |
636,228,511.72 | — | Not applicable | |||||||||
| Supplementing working capital |
4,800,000,000.00 | — | Not applicable | |||||||||
Note: The total amounts of funds raised from 2020 public issuance of A Share Convertible Bonds were RMB16,000,000,000.00. After deducting the underwriting expenses of RMB17,691,726.00 (including VAT), the net cash subscription amount actually received was RMB15,982,308,274.00. After deducting other issuance expenses of RMB2,704,354.28 (including VAT) paid by the Company from the net cash subscription amounts, the actual net proceeds raised was RMB15,979,603,919.72.
On April 15, 2020, the Company issued 608,695,652 H Shares in total to Nan Lung at the issue price of HK$5.75 per H Share pursuant to the subscription agreement dated October 30, 2019 entered into between the Company and Nan Lung. The net price of each new H Share issued under this H Shares issuance was HK$5.74 per H Share. The gross proceeds and the net proceeds raised from this H Shares issuance was HK$3,499,999,999 and RMB3,175,094,454.53, respectively. As at December 31, 2022, all proceeds raised from this H Shares issuance have been utilized. The use of proceeds utilized was consistent with the intended use of proceeds as previously disclosed.
On June 18, 2020, the Company issued 2,453,434,457 A Shares in total to CSAH at the issue price of RMB5.21 per A Share pursuant to the subscription agreement dated October 30, 2019 entered into between the Company and CSAH. The net price of each new A Share issued under this A Shares issuance was RMB5.21 per A Share. The use of proceeds utilized was consistent with the intended use of proceeds as previously disclosed.
Gross proceeds and the use of proceeds from A Shares issuance:
| Gross proceeds from the A Shares Issuance |
Intended use of the proceeds as previously disclosed |
Utilized proceeds as of December 31, 2022 (RMB) |
Unutilized proceeds as of December 31, 2022 (RMB) |
Expected timeline for the use of unutilized proceeds | ||||||||
| 12,782,393,520.97 |
Procurement of aircraft |
8,070,415,000.31 | 1,205,670,313.11 | On or before December 31, 2024 | ||||||||
| Repayment of the Company’s borrowings |
3,500,000,000.00 | — | Not applicable | |||||||||
Note: The total amount of funds raised from 2020 non-public issuance of A Shares was RMB12,782,393,520.97. After deducting the underwriting expenses of RMB2,000,000.00 (including VAT), the net cash subscription amount actually received was RMB12,780,393,520.97. After deducting other issuance expenses of RMB4,308,207.55 (including VAT) paid by the Company from the net cash subscription amounts, the actual net proceeds raised was RMB12,776,085,313.42.
On August 10, 2022, the Company issued 368,852,459 H Shares in total to Nan Lung at the issue price of HK$4.88 per H Share pursuant to the subscription agreement dated October, 29 2021 entered into between the Company and Nan Lung. The net price of each new H Share issued under this H Shares issuance was HK$4.88 per H Share. The gross proceeds and the net proceeds raised from this H Shares issuance were HK$1,799,999,999.92 and HKD1,548,883,622.02, respectively. As at December 31, 2022, all proceeds raised from this H Shares issuance have been fully utilized. The use of proceeds utilized was consistent with the intended use of proceeds as previously disclosed.
66
Table of Contents
On November 24, 2022, the Company issued 803,571,428 A Shares in total to Nan Lung at the issue price of RMB5.60 per A Share pursuant to the subscription agreement dated October 29, 2021 entered into between the Company and Nan Lung. The net price of each new A Share issued under this A Shares issuance was RMB5.60 per A Share. The gross proceeds and the net proceeds raised from the 2022 A Share Issuance was RMB4,499,999,996.80 and RMB4,496,003,317.09, respectively. As at 31 December 2022, all proceeds raised from the 2022 A Share Issuance have been fully utilized. The use of proceeds utilized was consistent with the intended use of proceeds as previously disclosed.
As of December 31, 2022, our aggregate long-term borrowings and lease liabilities (including borrowings and lease liabilities due within one year) were RMB148,332 million, among which RMB40,925 million, RMB31,579 million, RMB26,551 million, RMB17,086 million and RMB32,191 million, respectively, is due in 2023, 2024, 2025, 2026 and thereafter. Lease liabilities are mainly denominated in U.S. dollars, Euro and Japanese Yen. In the normal course of business, we are exposed to fluctuations in foreign currency exchange. Our exposure to foreign currency exchange primarily resulted from our foreign currency liabilities. Depreciation or appreciation of the Renminbi against foreign currencies affects our results significantly because our foreign currency liabilities generally exceed our foreign currency assets. We are not able to hedge our foreign currency exposure effectively other than by retaining our foreign currency denominated earnings and receipts to the extent permitted by the SAFE, or subject to certain restrictive conditions, entering into forward foreign exchange contracts with authorized banks.
As of December 31, 2022, our short-term bank loans amounted to RMB53,674million, and our weighted average interest rate on short-term bank loans was 2.16% per annum. As of December 31, 2022, our outstanding ultra-short-term financing bills were RMB12,536million. The primary use of the proceeds of our short-term bank loans and ultra-short-term financing bills is to finance working capital and capital expenditure needs. We have generally been able to arrange short-term borrowings with domestic banks in China as necessary and believe we can continue to obtain them based on our well-established relationships with various lenders.
As of December 31, 2022, the amounts of our lease liabilities were RMB 94,762million, predominately for aircraft, out of which RMB21,799million, RMB17,412million, RMB14,456million, RMB11,717million and RMB29,378million, respectively, is due in 2023, 2024, 2025, 2026 and thereafter.
As of December 31, 2022, we had a working capital deficit of RMB108,004 million, as compared to a working capital deficit of RMB73,124 million as of December 31, 2021. Historically, we operated in a negative working capital position, relying on cash inflow from operating activities, proceeds from ultra short-term financing bills and short-term bank loans to meet our short-term liquidity and working capital needs. In 2021, 2022 and thereafter, our liquidity is primarily dependent on our ability to maintain adequate cash inflows from operations to meet our debt obligations as they fall due, and our ability to obtain adequate external financing to meet our committed future capital expenditure. As of December 31, 2022, we had banking facilities with several PRC commercial banks for providing loan financing up to approximately RMB320,530 million, of which approximately RMB223,729 million was unutilized, whereas in 2021, we received loan financing up to approximately RMB295,683 million, of which RMB204,051 million was unutilized.
As we are subject to a high degree of operating leverage, a minor decrease in our yield and/or load factor could result in a significant decrease in our operating revenue and hence our operating cash flows. This could occur when competition among Chinese airlines increases or where PRC aviation demand decreases. Similarly, a minor increase in the jet fuel prices, particularly in the domestic market, could result in a significant increase in our operating expenses and hence a significant decrease in our operating cash flows. This could be caused by fluctuations in supply and demand in international oil market. Certain of our Group’s banking facilities are subject to the fulfilment of covenants relating to our Group’s certain financial ratios, as are commonly found in lending arrangements with financial institutions. If our Group was to breach the covenants, the drawn down facilities would become payable on demand. We regularly monitor its compliance with these covenants. In 2021, our Group complied with all financial covenants attached to certain of our borrowings. As at December 31, 2022, for short-term borrowings with an aggregate amount of RMB27,400 million, the loan covenants relating to certain financial ratios were breached. Our Group has obtained waiver from the respective financial institution, pursuant to which, the financial institution will not require us to repay the borrowings until the due dates, and will maintain the credit facilities granted to us. In addition, as we are subject to a high degree of financial leverage, an adverse change in our operating cash flows could adversely affect our financial health and hence weaken our ability to obtain additional loans and lease facilities and to renew our short-term bank loans facilities as they fall due.
As of December 31, 2022, we had capital commitments as follows:
67
Table of Contents
| 2023 | 2024 | 2025 | 2026 | 2027 and onwards |
Total | |||||||||||||||||||
| RMB million |
RMB million |
RMB million |
RMB million |
RMB million |
RMB million |
|||||||||||||||||||
| Acquisition of aircraft and related equipment |
33,968 | 23,795 | 21,306 | 16,289 | 1,971 | 97,329 | ||||||||||||||||||
| Others |
3,718 | 2,560 | 1,271 | 1,171 | 595 | 9,315 | ||||||||||||||||||
| Total capital commitments |
37,686 | 26,355 | 22,577 | 17,460 | 2,566 | 106,644 | ||||||||||||||||||
Others mainly represent airport and office facilities and equipment, overhaul and maintenance bases and training facilities.
As of December 31, 2022, our cash and cash equivalents amounted to RMB19,889million, and 10.18% of which were denominated in U.S. Dollars, Hong Kong Dollars, Euro, Japanese Yen and other foreign currencies.
In view of the unutilized bank facilities of RMB223,729 million, we believe that our sources of liquidity are sufficient to meet our cash requirements for at least the next 12 months. However, additional cash may be required due to changing business conditions or other future developments, including any investments or acquisitions that we may decide to pursue.
C. RESEARCH AND DEVELOPMENT, PATENTS AND LICENSES, ETC.
None.
D. TREND INFORMATION
Other than as disclosed in the foregoing disclosures and elsewhere in this Annual Report, we are not aware of any other trends, uncertainties, demands, commitments or events for the year ended December 31, 2022 that are reasonably likely to have a material adverse effect on our net revenue, income, profitability, liquidity or capital resources, or that would cause our disclosed financial information to be not necessarily indicative of future operating results or financial conditions.
E. CRITICAL ACCOUNTING ESTIMATES
Not applicable.
| ITEM 6. | DIRECTORS, SENIOR MANAGEMENT AND EMPLOYEES |
A. DIRECTORS AND SENIOR MANAGEMENT
The following table sets forth certain information concerning our directors, senior management and supervisors. There were certain changes in our directors, senior management and supervisors as of March 31, 2023, details of which are set forth below.
| Name | Position | Gender | Age | |||
| Ma Xulun Han Wensheng |
Chairman of the Board and Executive Director Vice Chairman of the Board, Executive Director and President |
Male Male |
58 56 |
68
Table of Contents
| Luo Laijun | Executive Director | Male | 51 | |||
| Liu Changle | Independent Non-executive Director | Male | 71 | |||
| Gu Huizhong | Independent Non-executive Director | Male | 66 | |||
| Guo Wei | Independent Non-executive Director | Male | 60 | |||
| Cai Hongping | Independent Non-executive Director | Male | 68 | |||
| Ren Jidong | Chairman of the Supervisory Committee, Supervisor | Male | 58 | |||
| Lin Xiaochun | Supervisor | Male | 51 | |||
| Yang Bin | Supervisor | Male | 54 | |||
| Wu Yingxiang | Executive Vice President | Female | 49 | |||
| Yao Yong | Executive Vice President, Chief Accountant and Chief Financial Officer | Male | 53 | |||
| Gao Fei | Executive Vice President | Male | 46 | |||
| Wu Rongxin (1) | Executive Vice President | Male | 51 | |||
| Chen Weihua | Chief Legal Adviser, Joint Company Secretary and Secretary to the Board | Male | 56 | |||
| Liu Wei | Joint Company Secretary | Male | 65 | |||
| Li Shaobin | Chief Training Officer | Male | 58 | |||
| Xie Bing (2) | Chief Economist | Male | 49 | |||
| Wang Renjie | Chief Pilot | Male | 58 | |||
| Zhu Hailong | Chief Operation Officer | Male | 59 | |||
| Li Zhigang | Chief Engineer | Male | 54 | |||
| Li Ye | Chief Operation Officer (Flight Safety) | Male | 50 |
| (1) | Wu Rongxin ceased to be Chief Engineer since August 30, 2022. |
| (2) | Xie Bing ceased to be Company Secretary and Secretary to the Board since September 22, 2022. |
Directors
Ma Xulun, male, born in July 1964 (aged 58), graduated from the School of Mechanical Science & Engineering of Huazhong University of Science & Technology, majoring in industrial engineering. He has a master’s degree of engineering and is a certified public accountant and a member of the Chinese Communist Party. He started his career in August 1984. He has been the Vice President of China National Materials Storage and Transportation Corporation, the Deputy Director General of the Finance Department of the CAAC, the Vice President and Standing Member of Party Committee of Air China Corporation Limited. He was appointed as the Vice President of general affairs and the Deputy Party Secretary of Air China Corporation Limited in October 2002; and served as a director, the President and the Deputy Party Secretary of Air China Limited in September 2004. He served as a Party Member of China National Aviation Holding Company and a Director, the President and the Deputy Party Secretary of Air China Limited in December 2004, and the Vice President and a Party Member of China National Aviation Holding Company from February 2007. In December 2008, he was appointed as the Deputy Party Secretary of China Eastern Air Holding Company and the President and the Deputy Party Secretary of China Eastern Airlines Corporation Limited. He served as the Secretary to the Party Committee and the Vice President of China Eastern Air Holding Company and the President of China Eastern Airlines Corporation Limited in October 2011. In November 2016, he served as a Director, the President and the Deputy Party Secretary of China Eastern Air Holding Company, and the Vice Chairman, the President and the Deputy Party Secretary of China Eastern Airlines Corporation Limited in December 2016. In February 2019, he served as the Director, the President and the Deputy Party Secretary of CSAH. In March 2019, he acted as the President of the Company. In May 2019, he acted as the Vice Chairman of the Company. Since December 2020, he has served as the President and Party Secretary of CSAH and Chairman and President of the Company. Currently, he also acts as the vice chairman of China Chamber of International Commerce, member of China Council for the Promotion of International Trade and director of the board of International Air Transport Association.
69
Table of Contents
Han Wensheng, male, born in January 1967 (aged 56), graduated from the Management Department of Tianjin University, majoring in engineering management, with qualification of a master’s degree, a member of the Chinese Communist Party. He obtained a master’s degree of Engineering and is an economist. He began his career in August 1987. He served as the Deputy Director General of Cadre Training Center of the Company, the Director of The Research Bureau of the Company, the General Manager of the Labor Department and the Secretary of the CPC General Committee of the Company, the Deputy Director General and a member of Party Committee of the Commercial Steering Committee, the General Manager as well as the Deputy Party Secretary of the Sales and Marketing Department of the Company, and the General Manager and Deputy Party Secretary of Shanghai base. He acted as the Deputy Party Secretary and the Deputy Director General of the Commercial Steering Committee of the Company since December 2009 and the Party Secretary and the Deputy Director General of the Commercial Steering Committee of the Company since October 2011. He served as the Vice President and the Party Member of CSAH from October 2016. From November 2017, he served as the Vice President and the Party Member of CSAH and the Vice President and Party Member of the Company. He was appointed as a Director and the Deputy Party Secretary of CSAH and the Vice President of the Company in November 2018. From December 2018, he served as the Deputy Party Secretary of the Company. Since January 2019, he has served as a Director and Deputy Party Secretary of CSAH. Since May 2019, he has served as a Director of the Company. Since June 2021, he has served as the President and Vice Chairman of the Company. Since July 2021, he has served as the President of CSAH. Currently, he also acts as the deputy to the 14th National People’s Congress.
Luo Laijun, male, born in October 1971 (aged 51), graduated from Nanjing University of Aeronautics and Astronautics, majoring in Accounting and also obtained an Executive Master of Business Administration (EMBA) degree from Tsinghua University and is a member of the Chinese Communist Party. He began his career in July 1993. He served as the Manager of Finance Department in Shanghai Branch of the Company, Deputy Director of the Purchasing Office in Finance Department of the Company, Deputy Manager and Manager of Finance Department of Guizhou Airlines. He has acted as a member of the party committee, Chief Financial Officer and manager of Finance Department of Guizhou Airlines in June 2003; Director of Business Assessment Office of the Company in June 2005; Deputy Director of Commercial Steering Committee and General Manager and Party Member of Financing Plan Department of the Company in November 2005; General Manager and Deputy Party Secretary of Freight Department of the Company in February 2009; the General Manager and the Deputy Party Secretary of Dalian Branch of the Company in July 2012; Executive Deputy Director General and the Deputy Party Secretary of Commercial Steering Committee of the Company in November 2016; Director General and the Deputy Party Secretary of Commercial Steering Committee of the Company in August 2017; Executive Vice President and the Party Member of CSAH and Executive Vice President of the Company in March 2019; Deputy Party Secretary of CSAH, and Executive Vice President of the Company in September 2022; the Deputy Party Secretary of CSAH in November 2022; and a Director and the Deputy Party Secretary of CSAH and the Executive Director of the Company in December 2022. Currently, he also serves as a Non-executive Director of TravelSky Technology Limited, Vice President of the fifth Council of China Air Transport Association, Vice Chairman of the seventh Council of China Communications and Transportation Association, President of the Party School of CSAH, and the standing committee member of the 13th session of Guangdong Provincial Committee of Chinese People’s Political Consultative Conference, or the PCC (Deputy Director of the Foreign and Overseas Chinese Affairs Committee).
Liu Changle, male, born in November 1951 (aged 71), graduated from the Communication University of China with Bachelor’s degree. He was conferred an honorary doctoral degree in literature by the City University of Hong Kong and an honorary doctoral degree in management sciences by the University of South China. Liu Chang Le founded Phoenix Satellite Television in 1996. He had been the Executive Director, Chairman and Chief Executive Officer of Phoenix Media Investment (Holdings) Limited. Liu Chang Le was a member of the PCC and a member of the Tenth and Eleventh National Committee of the PCC. He served as the Vice Chairman of the Subcommittee on Education, Science, Culture, Health and Sport of the Eleventh National Committee of the PCC, and served as a member of Standing Committee of the Twelfth National Committee of the PCC and a member of the Standing Committee of the Thirteenth National Committee. Liu Chang Le was an Independent Non-executive Director of the Company from December 2011 to December 2017. Mr. Liu Chang Le has been serving as an Independent Non-executive Director of the Company since April 2021.
70
Table of Contents
Gu Huizhong, male, born in November 1956 (aged 66), graduated from Zhengzhou University of Aeronautics and holds a Master’s degree. He graduated with a Master’s degree from Beihang University majoring in International Finance and is a senior accountant at a professor level. Gu is a Chinese Communist Party member and began his career in 1974. He served as the Deputy Chief and Chief of the General Office of Financial Division of Aviation Industry Department, the Director of International Affairs Financial Division of Aviation Industry Corporation of China, the General Manager of Zhongzhen Accounting Consultative Corporation, the Vice Director-General of Financial Department of Aviation Industry Corporation of China and the Deputy Director-General of Financial Department of State Commission of Science, Technology and Industry for National Defence. From June 1999 to February 2005, he acted as a member of Party Leadership Group and the Vice President of NO.1 Aviation Industry Corporation of China. From February 2005 to August 2008, he acted as a member of the Party Leadership Group, the Vice President and the Chief Accountant of No.1 Aviation Industry Corporation of China. From August 2008 to January 2017, he acted as a member of Party Leadership Group, the Vice President and the Chief Accountant of Aviation Industry Corporation of China. He acted as the Chairman of AVIC I International Leasing the Chairman of AVIC I Financial Co., Ltd., the Chairman of CATIC International Holdings Limited, the Chairman of AVIC Capital Co., and the Chairman of AVIC International Vanke Company Limited. Currently, he is serving as an external director of Ansteel Group and the Vice Chairman of the Accounting Society of China. He has been serving as an Independent Non-executive Director of the Company since December 2017.
Guo Wei, male, born in February 1963 (aged 60), holds a Master’s degree. He graduated from the University of Science and Technology of China. Mr. Guo is a senior engineer and a Chinese Communist Party member. He began his career in 1988. Mr. Guo served as Executive Director and the Senior Vice President of the Lenovo Group. Currently, he is the Executive Director, Chairman of the Board of Directors and Chief Executive Officer of Digital China Holdings Limited, the Chairman of Digital China Group Co., Ltd and the Chairman of Digital China Information Service Co., Ltd. In addition, Mr. Guo also served in a number of positions, such as a member of the Eleventh and Twelfth National Committee of the PCC, a member of the Fourth Committee of the Advisory Committee for State Informatization, the first President of China Strategic Alliance of Smart City Industrial and Technology Innovation, the Vice President of Digital China Industry Alliance and the Vice President of the Society of Management Science of China. Mr. Guo was an Independent Non-executive Director of the Company from June 2015 to December 2017. He has been serving as an Independent Non-executive Director of the Company since April 2021.
Cai Hong Ping, male, born in December 1954 (aged 68), graduated from Fudan University with a bachelor’s degree in journalism. He served as the Office Director of Sinopec Shanghai Petrochemical Company Limited, a member of the Steering Group for Overseas Listing of Chinese Enterprises under the State Commission for Restructuring the Economic System of the State Council and Chairman of the Joint Meeting of Secretaries of the Boards of Directors of Chinese H-share Companies, Managing Director of Peregrine Investment Bank, Chairman of SBC (Asia), and Chairman of Deutsche Bank (Asia). He is currently the Chairman of Asia-Germany Industrial Promotion Capital, and the independent Director of China Eastern Airlines Corporation Limited, Shanghai Pudong Development Bank Co., LTD., and BYD Company Limited, as well as a supervisor of China Merchants Bank Company Limited. Mr. Cai served as an independent non-executive director of the Company since 28 December 2022.
Supervisors
Ren Jidong, male, born in January 1965 (aged 58), Bachelor of Engineering, graduated from Power Engineering Department of Nanjing University of Aeronautics and Astronautics with a bachelor’s degree, majoring in Aircraft Engine Design and obtained an Executive Master of Business Administration (EMBA) degree from Tsinghua University, and he is a senior engineer and a member of the Chinese Communist Party. Mr. Ren began his career in August 1986. He served as the Deputy Director (deputy general manager) and a member of the Standing Committee of the CPC of Urumqi Civil Aviation Administration (Xinjiang Airlines) and the Deputy General Manager and a member of the Standing Committee of the CPC of Xinjiang Airlines. He acted as the Party Secretary and Deputy General Manager of CSAH Xinjiang Company from June 2004, the Party Secretary and Deputy General Manager of Xinjiang Branch of the Company from January 2005, a member of the Standing Committee of the CPC of the Company from February 2005, Deputy General Manager and a member of the Standing Committee of the CPC of the Company from March 2005, a member of the Standing Committee of the CPC of the Company and the General Manager and Deputy Party Secretary of Xinjiang Branch from January 2007, a member of the Standing Committee of the CPC of the Company from April 2009, Deputy General Manager and a member of the Standing Committee of the CPC of the Company from May 2009, the Executive Vice President of the Company from July 2018, and the Chairman of the Labor Union of CSAH and the Company since August 2021; He served as the employees’ representative director of CSAH since November 2021 and Chairman of the Supervisory Committee of the Company since December 2021. Currently, he also acts as Vice Director General of Guangdong Lingnan Fund.
71
Table of Contents
Lin Xiaochun, male, born in May 1971 (aged 51), graduated from the Peking University Law School with a Bachelor’s degree of laws, majoring in international law. He obtained his Master of Business Administration from the Beijing University of Technology and the City University of the United States and his Executive Master of Business Administration (EMBA) from the Tsinghua University School of Economics and Management. He obtained qualifications as an Enterprise Legal Adviser and a corporate lawyer, and is a member of the Chinese Communist Party. He began his career in July 1995. He served as the Deputy Director of the legal department of the Company in October 2006, the Deputy General Manager of the legal department of the Company in January 2009, the Deputy Director of the legal department of CSAH and the Deputy General Manager of the legal department of the Company in December 2009, the Director of the legal department of CSAH in May 2013, and the General Manager of the Laws & Standards Division of CSAH and the General Manager of the Laws & Standards Division of the Company in April 2017. He has served as a Supervisor of the Company since May 2019.
Yang Bin, male, born in September 1968 (aged 54), Master of Business Administration. He is a qualified senior accountant and a member of the Chinese Communist Party. He began his career in November 1991. He had been the Deputy General Manager and the General Manager of the Finance Department of the Company, the General Manager of the Finance Department in CSAH, the General Manager of Hunan Branch of the Company. He served as the General Manager of Audit Department in the CSAH and the Company from August 2021. He served as Supervisor of the Company since November 2021. Currently he also serves as a Supervisor of Xiamen Airlines, the Deputy Director of the Financial Audit Committee of China Air Transport Association, a member of China Association of Internal Audit, and the Vice Chairman of Guangzhou Internal Audit Association.
Senior Management
Wu Yingxiang, female, born in November 1973 (aged 49), graduated from Business Administration Department of Central South University of Technology with a bachelor’s degree, majoring in International Accounting and obtained an Executive Master of Business Administration (EMBA) degree from Tsinghua University, and she is a qualified senior accountant, a certified public accountant, a Chartered Global Management Accountant and a member of the Chinese Communist Party. Ms. Wu began her career in July 1994. She served as Assistant Director of Finance Department of China Southern Airlines (Group) Company in March 2001; vice director of Finance Department of CSAH in September 2005; director of Finance Department of CSAH in September 2012; the head of Performance Appraisal Management Department of CSAH in February 2017; the General Manager of Comprehensive Performance Appraisal Department of CSAH and the Company in April 2017; the General Manager and Deputy Party Secretary of Shantou Airlines in September 2018; Party Secretary and Deputy Director General of the Marketing Management Committee of the Company in October 2019; Party Member of CSAH in May 2020; the Executive Vice President and Party Member of CSAH as well as the Executive Vice President of the Company in June 2020. Currently, she also serves as vice chairman of China National Aviation Corporation (Hong Kong) Limited.
Yao Yong, male, born in November 1969 (aged 53), graduated from National Economics and Management College of Sichuan University with a bachelor’s degree in economics, majoring in National Economic Management. He holds a Master of Business Administration degree from University of Electronic Science and Technology of China – Webster University. He is a qualified senior accountant, senior auditor, Chartered Certified Accountant of ACCA and a member of the Chinese Communist Party. He began his career in July 1991. He acted as a member of the Capital Construction Audit Department of Sichuan Provincial Audit Department, a deputy chief member and chief member of the Fixed Assets Investment Audit Department of Sichuan Provincial Audit Department. He acted as the Director of Financial Management Department of Ertan Hydropower Development Co Ltd. in March 2003. He served as the deputy chief accountant and director of the Finance Department of Ertan Hydropower Development Co Ltd in July 2007, and the chief accountant and director of the Finance Department of Ertan Hydropower Development Co Ltd in October 2010. He served as the chief accountant of Yalong Hydro in November 2012, the Director of Finance Department of State Development and Investment Corporation (renamed as State Development & Investment Corp., Ltd. in December 2017) in June 2017. He has served as the Party Member of CSAH since March 2021, the Executive Vice President, chief accountant and Chief Financial Officer of the Company since April 2021, and the chief accountant and the Party Member of CSAH since May 2022. Currently, he also serves as Director of China Southern Airlines Overseas (Hong Kong) Co. Ltd. and Chairman of Finance Company.
72
Table of Contents
Gao Fei, male, born in August 1976 (aged 46), graduated from the Flight School of Beijing Aeronautical and Space University with a bachelor’s degree in Flight Technology. He obtained a Master of Business Administration in Lingnan College, Sun Yat-sen University, and a Master of Science in Management Studies, Massachusetts Institute of Technology. Mr. Gao is a member of the Chinese Communist Party. Mr. Gao began his career in July 1998. He was the deputy General Manager of the Flight Management Division of the Company, the Vice President and a member of the Party Committee of Shenzhen Branch of the Company, and the deputy General Manager of Department of Security Supervision of CSAH, and the deputy General Manager of Department of Security Supervision of the Company. From October 2018, he has been the General Manager of Department of Security Supervision of CSAH, the General Manager of Department of Security Supervision of the Company. From December 2020, he has been the head of Chief Flight Corps Team and Deputy Party Secretary of the Company. In January 2023, he has been the Deputy General Manager and a Party Member of CSAH, and the head of Chief Flight Corps Team and Deputy Party Secretary of the Company. From February 2023, he served as the Deputy General Manager and the Party Member of CSAH and Deputy General Manager of the Company.
Wu Rongxin, male, born in January 1972 (aged 51), graduated from the China Civil Aviation Institute with a bachelor’s degree, majoring in thermal power machinery and equipment. He also obtained an Executive Master of Business Administration (EMBA) degree from Tsinghua University and is a member of the Chinese Communist Party. He began his career in July 1994. He served as Manager of Finance Department of Aircraft Engineering Department of the Company. In June 2008, he served as the Chief Financial Officer and Party Member of Guangzhou Aircraft Maintenance Engineering Co., Ltd., and Executive Vice President and Deputy Party Secretary of Guangzhou Aircraft Maintenance Engineering Co., Ltd. in April 2011. He served as Director of Planning and Investment Department of CSAH in November 2016, General Manager of Strategic Planning & Investment Division of CSAH and the Company in April 2017, General Manager and Deputy Party Secretary of Aircraft Engineering Department of the Company in March 2021, and General Manager and Deputy Party Secretary of Engineering Technology Branch (Aircraft Engineering Department) of the Company in September 2021. He has served as Chief Engineer of the Company since January 2022. From August 2022, he served as Assistant to the General Manager of CSAH, and Deputy General Manager of the Company. Currently, he also acts as Director of China Aviation Supplies Co., Ltd., Chairman of Guangzhou Aircraft Maintenance Engineering Co., Ltd., Chairman of MTU Maintenance Zhuhai Co., Ltd., and the Head of Civil Aviation Maintenance Association of China.
Chen Weihua, male, born in October 1966 (aged 56), graduated from the School of Law of Peking University with a bachelor’s degree, majoring in Law and obtained an Executive Master of Business Administration (EMBA) degree from Tsinghua University. He is an economist, a qualified lawyer in the PRC, a qualified corporate legal counselor and a member of the Chinese Communist Party. Mr. Chen began his career in July 1988. He successively served as Deputy Director of Legal Department of China Southern Airlines (Group) Corporation, Deputy Director of the Office (Director of the Legal Division) of the Company and China Southern Airlines (Group) Corporation. Mr. Chen was the Chief Legal Adviser of the Company and Director of the Legal Division of the Company from June 2004. Mr. Chen has been the Chief Legal Adviser and General Manager of the Legal Division of the Company since October 2008. He has served as Chief Legal Adviser of the Company since April 2017. Mr. Chen has been the Chief Legal Adviser and Secretary to the Board of the Company, in September 2022; He has served as Chief Compliance Officer of CSAH, Chief Legal Adviser and Secretary to the Board of the Company since December 2022. From March 2023 he served as Chief Compliance Officer, General Counsel and Secretary of the Board of Directors of CSAH, General Counsel and Secretary of the Board of directors of the Company. Currently, he also acts as Director of the Board of Xiamen Airlines , Vice President of Company Law Research Association of Guangzhou Law Society, and a member representative of the standing board of China Association for Public Companies.
Liu Wei, male, aged 65, graduated from the Northwest University of China, the China University of Political Science and Law and the University of Cambridge with a bachelor’s degree in Chinese literature, a master’s degree in law and a Ph.D. in Law, respectively. Dr. Liu also completed his Common Professional Examination (CPE) with the Manchester University in England, as well as the Postgraduate Certificate in Laws (PCLL) with the University of Hong Kong. Dr. Liu has PRC lawyer qualification and is a solicitor qualified to practice law in Hong Kong and in England. Dr. Liu is currently a partner of Jingtian & Gongcheng LLP and has extensive experience in providing effective and commercially-valuable legal services for market- leading enterprises relating to corporate finance, listing, regulatory and compliance matters. During the period from 26 November 2007 to 20 July 2015, Dr. Liu acted as a Joint Company Secretary.
73
Table of Contents
Li Shaobin, male, born in April 1964 (aged 58), graduated with a college degree from Chinese Language and Literature of Xiangtan Teachers’ College, and obtained a university degree from the Party School of the Central Committee of Communist Party of China majoring in economics and management. He is an expert of political science and a member of the Chinese Communist Party. He began his career in July 1984. He was an officer of Public Relationship Section of Political Department of the Hunan Bureau of Civil Aviation Administration, the Senior Staff Member of Publicity Division of Political Department of the Guangzhou Bureau of Civil Aviation Administration and the Principal Staff Member of Publicity Department of the Company. He served as the Deputy Director of Publicity Department of the China Southern Airlines (Group) Company in September 1994. He had been the Director of Political Division of Flight Department of the Company from December 1999. Mr. Li was the Deputy Party Secretary of Flight Department and Director of Political Division of the Company from May 2002. Subsequently, he was appointed as the Party Secretary of Guangzhou Flight Operations Division of the Company from May 2004. Mr. Li served as the Party Secretary and Vice President of Guangzhou Flight Operations Division of the Company from March 2006. Mr. Li has been the Chairman of the Labour Union of the Company since August 2012 and the Executive Director of the Company since January 2013. Mr. Li served as the President and Deputy Party Secretary of the Training Centre of the Company since April 2017. Mr. Li also has been the Chief Training Officer of the Company since June 2019.
Xie Bing, male, born in September 1973 (aged 49), graduated from Nanjing University of Aeronautics and Astronautics, majoring in Civil Aviation Management. He subsequently received a master’s degree of business administration from the Management School of Jinan University, a master’s degree of business administration (international banking and finance) from the University of Birmingham, Britain and a MBA, an Executive Master of Business Administration (EMBA) degree from Tsinghua University, respectively. Mr. Xie is a Senior Economist. Mr. Xie has the qualification for the Secretary to the Board of companies listed on the Shanghai Stock Exchange and also has the qualification for Company Secretary of companies listed on the Stock Exchange. Mr. Xie is a fellow member and FCS of The Hong Kong Chartered Governance Institute and a member of the Chinese Communist Party. Mr. Xie began his career in July 1995. He served as the Assistant of the Secretary to the Board of the Company. Mr. Xie has been the Secretary to the Board and Deputy Director of the Secretary Office of the Company from November 2007. From December 2009, Mr. Xie has been the Secretary to the Board and Director of the Secretary Office of the Company. From April 2017, he has been the Secretary to the Board of the Company, and Director of the Board Office of the Company. From September 2022, he has been the Chief Economist of the Company. For now, he also acts as the Vice Chairman, Deputy Secretary of the Party Committee and General Manager of Xiamen Airlines Co. Ltd., a Deputy to the 14th People’s Congress of Fujian Province, Deputy President of Central Enterprises Overseas Students Sodality, a Council Member of The Hong Kong Charted Governance Institute, and Vice President’s representative of China Group Companies Association.
Wang Renjie, male, born in October 1964 (aged 58), graduated from the First Air Force Flight Academy of the Chinese People’s Liberation Army with a bachelor’s degree in Aircraft Piloting and Aeronautical Theory, and obtained a master’s degree in Business Administration for Senior Executives from the School of Economics and Management of Tsinghua University. He is a first-class pilot, and a member of the Chinese Communist Party. Mr. Wang began his career in June 1983. He was the General Manager and Deputy Party Secretary of the Party Committee of Xi’an Branch of the Company, the General Manager of the Flight Management Division of CSAH and the General Manager of the Flight Management Division of the Company. He has been the Deputy Director of Operations of the Company since May 2018; and has been the Director of Operations of the Company, the Secretary of the CPC General Committee of the Laws & Standards Division of CSAH and the Secretary of the CPC General Committee of the Laws & Standards Division of the Company since September 2018. He has been the General Manager and Deputy Party Secretary of the Northern Branch of the Company since October 2019. He has been appointed as Chief Pilot of the Company since February 2023. For now, he also serves as Director and Chairman of Zhuhai Xiang Yi Aviation Technology Company Limited.
Zhu Hailong, male, born in December 1963 (aged 59), graduated from Civil Aviation Flight College of China majoring in Aircraft Piloting and possesses post-secondary qualifications. He graduated from the Flight College of Civil Aviation Flight University of China, majoring in aviation transportation with an on-job bachelor’s degree. Mr. Zhu holds the title of First Class Pilot and a member of the Chinese Communist Party. He began his career in January 1983. He was a pilot of the 15th Fleet of CAAC, a pilot in the Flight Department of CSA Hainan, vice-captain of the Second Squadron, leader of the B737 Squadron, the deputy general manager and general manager of the Flight Department. He served as general manager’s assistant and general manager of Haikou Flight Department in Hainan Branch of the Company. He served as deputy general manager and a member of the Party Committee of Shantou Airlines in June 2007; deputy general manager, manager of the Flight Department and a member of the Party Committee in Hubei Branch of the Company in March 2013; deputy general manager and a member of the Party Committee in Shenzhen Branch of the Company in September 2015; deputy general manager and Deputy Party Secretary of Guangzhou Flight Division of the Company in February 2018; the head of Chief Flight Corps Team and Deputy Party Secretary of the Company in May 2018. Since December 2020, he has been the Chief Operation Officer of the Company. For now, he also acts as the Vice Chairman of the fourth Council of China Airline Pilots Association.
74
Table of Contents
Li Zhigang, male, born in May 1968 (aged 54), graduated from the China Civil Aviation Institute with a master’s degree, majoring in thermal power machinery and equipment. He also obtained a master’s degree of Business Administration from Northeastern University and an Executive Master of Business Administration (EMBA) degree from Tsinghua University and is a member of the Chinese Communist Party. Mr. Li began his career in July 1990. He has been the Director of Aircraft Maintenance Base (Aircraft Engineering Department) in Northern Branch of CSAH. From June 2006, he has been the Deputy General Manager and a member of the Party Committee of Aircraft Engineering Department and the Director of Shenyang Maintenance Base of the Company. From February 2007, he has been the Deputy General Manager of Aircraft Engineering Department, Director and Deputy Party Secretary of Shenyang Aircraft Maintenance Base of the Company. From April 2009, he has been the Deputy General Manager and a member of the Party Committee in Shenzhen Branch of the Company. From December 2016, he has been the General Manager and Deputy Party Secretary of Aircraft Engineering Department of the Company. From March 2021, he has been the Party Secretary and Deputy General Manager of the Northern Branch of the Company. From August 2022, he has served as Chief Engineer of the Company. For now, he is also a member of the board of directors of the Aircraft Competitiveness Innovation Center.
Li Ye, male, born in March 1973 (aged 50), graduated from School of Economics and Management of Beijing Aeronautical and Space University with a master’s degree in Business Administration, and a Master of Business Administration. He is a first-class pilot, and a member of the Chinese Communist Party. Mr. Li began his career in August 1995. He was the Deputy General Manager and a member of the Party Committee of Guangzhou Flight Department of the Company. From December 2017, he has been the Deputy General Manager and a member of the Party Committee of Beijing Branch of the Company. From March 2021, he has been the General Manager of Department of Security Supervision of CSAH, and the General Manger of Department of Security Supervision of the Company. From February 2023, he has been the General Manager of Department of Security Supervision of CSAH, the Chief Operation Officer (Flight Safety) and General Manager of Department of Security Supervision of the Company. Currently, he is also a member of the Security Advisory Committee of International Aviation Association.
None of our Directors, supervisors or members of our senior management was selected or chosen as a result of any arrangement or understanding with any major shareholders, customers or suppliers. None of the above Directors or Supervisors, senior management of our Company has any family relationship with any Directors, Supervisors, senior management, substantial shareholders of our Company. None of our directors or senior management owns any shares or options in our Group as of March 31, 2023.
B. COMPENSATION
The aggregate compensation paid to all Directors, Supervisors and Senior Management for 2022 was RMB13.29 million. For the year ended December 31, 2022, we paid an aggregate of approximately RMB1.69 million on behalf of our executive Directors, Supervisors and Senior Management pursuant to the pension scheme and the retirement plans operated by various municipal and provincial governments in which we participate.
Details of the remuneration of Directors and Supervisors for the year ended December 31, 2022 are set out below:
75
Table of Contents
| Directors’ fees RMB’000 |
Salaries, allowances and benefits in kind RMB’000 |
Retirement scheme contributions RMB’000 |
Total RMB’000 |
|||||||||||||
| Executive Directors |
||||||||||||||||
| Ma Xulun |
— | — | — | — | ||||||||||||
| Han Wensheng |
— | — | — | — | ||||||||||||
| Luo Laijun |
— | — | — | — | ||||||||||||
| Independent Non-executive Directors |
||||||||||||||||
| Liu Changle |
200 | — | 0 | 200 | ||||||||||||
| Gu Huizhong |
200 | — | 0 | 200 | ||||||||||||
| Yan Yan |
167 | — | 0 | 167 | ||||||||||||
| Guo Wei |
200 | — | 0 | 200 | ||||||||||||
| Cai Hongping |
0 | — | 0 | 0 | ||||||||||||
| Supervisors |
||||||||||||||||
| Ren Jidong |
— | — | — | — | ||||||||||||
| Lin Xiaochun |
— | 687 | 157 | 844 | ||||||||||||
| Yang Bin |
— | 687 | 160 | 847 | ||||||||||||
| Total |
767 | 1,374 | 317 | 2,458 | ||||||||||||
C. BOARD PRACTICES
Each director’s service contract with our Company or any of its subsidiaries provides prorated monthly salary upon termination of employment in accordance with his contract. The director is entitled to paid leave under his contract. The term of office of a director is three years. The term of the ninth session of our Board will expire on April 29, 2024. A director may serve consecutive terms upon re-election.
Aviation Safety Committee
The Aviation Safety Committee comprises three members and is chaired by Ma Xulun, Chairman of the Board. The other two members are Han Wensheng, Vice Chairman of the Board and Guo Wei, an independent non-executive director.
The Aviation Safety Committee held two meetings in 2022, which were held in accordance with its rules and procedures, and considered a report on the safety production and operation plan of the Company in 2021 and the first quarter of 2022, the safety production and operation plan of the Company in 2022 and the safety work report of the Company in mid-2022.
Strategic and Investment Committee
The Strategic and Investment Committee comprises three members, Han Wensheng, Vice Chairman of the Board, Gu Huizhong, an independent non-executive Director and Cai Hongping, an independent non-executive Director. Han Wensheng is the Chairman of the Strategic and Investment Committee.
The Strategic and Investment Committee held two meeting in 2022 in accordance with its rules and procedures, and considered a report on the implementation of the major strategic investment matters of the Company.
76
Table of Contents
Audit and Risk Management Committee
The Audit and Risk Management Committee consists of three independent non-executive directors. The current members of the Audit and Risk Management Committee are Gu Huizhong, Guo Wei and Cai Hongping. Gu Huizhong is the Chairman of the Audit and Risk Management Committee. A member may serve consecutive terms upon re-election. At least once a year, the committee is required to meet with our Company’s external auditors without any executive members of our Board in attendance. The Audit and Risk Management Committee held seven meetings in 2022, which were attended by all members.
The primary responsibilities of the Audit and Risk Management Committee are to consider the appointment of auditors, review the Company’s periodical reports, related party transactions, and hedging and debt financing plans, review the efficiency of risk management and internal control system of the Company and review the internal audit plan. In addition, the Audit and Risk Management Committee also examines the effectiveness of our Company’s risk management internal control system, which involves regular reviews of the internal controls of various corporate structures and business processes on a continuous basis, and takes into account their respective potential risks and severity, in order to ensure the effectiveness of our Company’s business operations and the realization of our corporate objectives and strategies. The scope of such examinations and reviews includes finance, operations, regulatory compliance and risk management. The Audit and Risk Management Committee also reviews our Company’s internal audit plan, and submits relevant reports and concrete recommendations to our Board on a regular basis.
Our Company has an internal audit department which reviews procedures in all major financial and operational activities. This department is led by the head of internal audit.
Remuneration and Assessment Committee
The Remuneration and Assessment Committee is comprised of three members. Currently, the Remuneration and Assessment Committee is chaired by independent non-executive director Guo Wei with Han Wensheng, Vice Chairman of the Board, and Gu Huizhong, an independent non-executive director, as members. The term of office of each member is three years. A member may serve consecutive terms upon re-election. The Remuneration and Assessment Committee held two meetings in 2022, which were attended by all members. The Remuneration and Assessment Committee reviewed the resolutions including the performance contract for senior management and realization of annual remuneration of senior management.
The responsibilities of the Remuneration and Assessment Committee are to make recommendations on the remuneration policy and structure for directors and senior management of our Company, to establish regular and transparent procedures on remuneration policy development and improvement and submit our Company’s “Administrative Measures on Remuneration of Directors” and “Administrative Measures on Remuneration of Senior Management”. In particular, the Remuneration and Assessment Committee has the duty to ensure that the directors or any of their associates shall not be involved in the determination of their own remuneration packages.
The Remuneration and Assessment Committee consults, when appropriate, the Chairman and/or the President about its proposals relating to the remuneration of other executive directors. The Remuneration and Assessment Committee is also responsible for assessing the performance of executive directors and approving the terms of the executive directors’ service contracts. The Remuneration and Assessment Committee performed all its responsibilities under its terms of reference in 2022.
Nomination Committee
The Nomination Committee was established on June 28, 2007. Before that, nomination of directors and other senior management was mainly undertaken by our Board. According to the Articles of Association, our Board has the authority to appoint from time to time any person as director to fill a vacancy or as additional director. In selecting candidate directors, our Board focuses on their qualifications, technical skills, experience (in particular, the experience in the industry in which we operate in case of candidates of executive directors) and their contributions to the Board.
77
Table of Contents
The Nomination Committee is comprised of three members, including Gu Huizhong, an independent non-executive director, as the chairman of the committee, and Ma Xulun, the Chairman of the Board, and Liu Changle, an independent non-executive director, as members. The responsibilities of the Nomination Committee are to make recommendations to our Board in respect of the size and composition of our Board based on the operational activities, assets and shareholding structure of our Company; study the selection criteria and procedures of directors and executives and give advice to our Board; identify qualified candidates for directors and executives; and investigate and propose candidates for directors and managers and other senior management members to our Board.
In accordance with relevant laws and regulations, as well as the provisions of our Articles of Association, the Nomination Committee studies and determines the selection criteria, procedures and terms of office for directors and managers with reference to our Company’s actual situation. Any resolution made in this regard shall be filed with and proposed to our Board for approval.
The Nomination Committee held four meetings in 2022 and nominated Mr. Wu Rongxin as Chief Engineer and Deputy General Manager of the Company, Mr. Li Zhigang as Chief Engineer of the Company, Mr. Xie Bing as Chief Economist of the Company, Mr. Chen Weihua as Chief Legal Adviser and Secretary to the Board of the Company, Mr. Chen Weihua and Mr. Liu Wei as joint secretaries of the Company, Mr. Luo Laijun as candidates for Executive Director of the Company and Mr. Cai Hongping as candidates for independent Non-executive Director of the Company.
D. EMPLOYEES
As of December 31, 2020, 2021 and 2022, we had 100,431, 98,098 and 97,899 employees, respectively. The table below sets forth the number of our employees by activity as of December 31, 2022. During 2022, we employed 19,531 temporary employees.
Below is a breakdown of persons employed by main category of activity.
| Employees | % of Total | |||||||
| Flight |
10,501 | 11 | % | |||||
| Service |
35,061 | 36 | % | |||||
| Administration |
6,862 | 7 | % | |||||
| Navigational matters |
1,395 | 1 | % | |||||
| Maintenance |
11,770 | 12 | % | |||||
| Information |
1,519 | 2 | % | |||||
| Marketing |
4,287 | 4 | % | |||||
| Comprehensive |
20,441 | 21 | % | |||||
| Function |
6,063 | 6 | % | |||||
| total |
97,899 | 100 | % | |||||
Our employees are members of a trade union organized under the auspices of the All-China Federation of Trade Unions, which is established in accordance with the Trade Union Law of China. One representative of our Company labor union currently serves on the Supervisory Committee of our Company. Each of our subsidiaries has its own trade union. We have not experienced any strikes, slowdowns or labor disputes that have interfered with our operations, and we believe that our relations with our employees are good.
All employees of our Group receive cash remuneration and certain non-cash benefits. Cash remuneration consists of salaries, bonuses and cash subsidies provided by our Group. Salaries are determined in accordance with the national basic wage standards. The total amount of wages payable by our Group to our employees is subject to a maximum limit based on the profitability of our Group and other factors. Bonuses are based on the profitability of our Group. Cash subsidies are intended as a form of cost-of-living adjustment. In addition to cash compensation, our contract employees receive certain non-cash benefits, including housing, education and health services, and our temporary employees also receive certain health services, housing fund and education.
78
Table of Contents
Employee benefits
Employee benefits are all forms of considerations given and other related expenditures incurred in exchange for services rendered by employees. Except for termination benefits, employee benefits are recognized as a liability in the period in which the associated services are rendered by employees, with a corresponding increase in cost of relevant assets or expenses in the current period.
Retirement benefits
Our employees participate in several defined contribution retirement schemes organized separately by the PRC municipal and provincial governments in regions where our major operations are located. We are required to contribute to these schemes at rates ranging from 14% to 16% of salary costs, including certain allowances, in 2022, and from 14% to 16% in 2021. A member of the retirement schemes is entitled to pension benefits from the Local Labor and Social Security Bureau upon his/her retirement. The retirement benefit obligations of all retired staff of our Group are assumed by these schemes. We, at our sole discretion, have made certain welfare subsidy payments to these retirees.
In 2014, our Company and our major subsidiaries joined a newly defined contribution retirement scheme that was implemented by CSAH. The annual contribution to the Pension Scheme is based on a fixed specified percentage of prior year’s annual wage. There will be no further obligation beyond the annual contribution according to the Pension Scheme. The total contribution into the Pension Scheme in 2022 was approximately RMB884 million.
Housing fund and other social insurances
We contribute on a monthly basis to housing funds organized by municipal and provincial governments based on certain percentages of the salaries of employees. Our liability in respect of these funds is limited to the contributions payable in each year.
We also pay cash housing subsidies on a monthly basis to eligible employees. The monthly cash housing subsidies are reflected in the consolidated income statement.
Termination benefits
When we terminate the employment relationship with employees before the employment contracts expire, or provide compensation as an offer to encourage employees to accept voluntary redundancy, a provision for the termination benefits provided is recognized in the consolidated income statement when both of the following conditions are satisfied:
| • | We have a formal plan for the termination of employment or made an offer to employees for voluntary redundancy, which will be implemented shortly; and |
| • | We are not allowed to withdraw from termination plan or redundancy offer unilaterally. |
Workers’ Compensation
There is no workers’ compensation or other similar compensation scheme under the Chinese labor and employment system. As required by Chinese law, however, we, subject to certain conditions and limitations, pay for the medical expenses of any contract employee who suffers a work-related illness, injury or disability, and continue to pay the full salary of, and provide all standard cash subsidies to, such employee during the term of such illness, injury or disability. We also pay for certain medical expenses of our temporary employees.
79
Table of Contents
E. SHARE OWNERSHIP
None of our directors or senior management owns any shares or options in our Company as of March 31, 2023.
F. DISCLOSURE OF A REGISTRANT’S ACTION TO RECOVER ERRONEOUSLY AWARDED COMPENSATOPM
Not applicable.
ITEM 7. MAJOR SHAREHOLDERS AND RELATED PARTY TRANSACTIONS
A. MAJOR SHAREHOLDERS
The table below sets forth information regarding the ownership of our share capital as of March 31, 2023 by all persons who are known to us to be the beneficial owners of 5.0% or more of each class of our voting securities.
| Title of Shares | Identity of Person or Group | Beneficially Owned (1) |
Percentage of the Respective Class of Shares (2) |
Percentage of Total Shares (2) |
||||||||||
| A Shares |
CSAH | 9,404,468,936 | 69.78 | % | 51.90 | % | ||||||||
| H Shares |
HKSCC Nominees Limited | 1,750,872,837 | 37.70 | % | 9.66 | % | ||||||||
| H Shares |
CSAH (3) | 2,648,836,036 | 57.04 | % | 14.62 | % | ||||||||
| H Shares |
Nan Lung Holding Limited | 2,648,836,036 | 57.04 | % | 14.62 | % | ||||||||
| A Shares |
China National Aviation Fuel Group Corporation | 261,685,354 | 1.94 | % | 1.44 | % | ||||||||
| A Shares |
Hong Kong Securities Clearing Company Limited | 683,021,828 | 5.07 | % | 3.77 | % | ||||||||
| H Shares |
American Airlines Group Inc.(4) | 270,606,272 | 5.83 | % | 1.49 | % | ||||||||
| (1) | Beneficial ownership is determined in accordance with the rules of the SEC. |
| (2) | Percentage of A Shares and percentage of H Shares is based on 13,476,900,424 A Shares and 4,643,997,308 H Shares, respectively, issued as of March 31, 2023. Percentage of total shares is based on 18,120,897,732 shares issued as of March 31, 2023. |
| (3) | CSAH was deemed to be interested in an aggregate of 2,648,836,036 H Shares through its direct and indirect wholly-owned subsidiaries in Hong Kong, of which 31,150,000 H Shares were directly held by Perfect Lines (Hong Kong) Limited (representing approximately 0.67% of its then total issued H Shares) and 2,617,686,036 H Shares were directly held by Nan Lung (representing approximately 56.37% of its then total issued H Shares). As Perfect Lines (Hong Kong) Limited is a wholly-owned subsidiary of Nan Lung, Nan Lung was also deemed to be interested in the 31,150,000 H Shares held by Perfect Lines (Hong Kong) Limited. |
| (4) | American Airlines Group Inc. was deemed to be interested in 270,606,272 H Shares by virtue of its 100% control over American Airlines, Inc. |
Shareholders of H Shares and A Shares enjoy the same voting rights with respect to each of the H Shares and A Shares, as applicable. None of our major shareholders has voting rights that differ from the voting rights of other shareholders. We are not aware of any arrangement which may at a subsequent date result in a change of control of our Company.
As of March 6, 2023, the date on which our ADR program was terminated, there were 49 registered holders of 916,717 American Depositary Shares in the U.S., consisting of 0.99% of our outstanding H Shares. Since certain of the ADSs are held by nominees, the above number may not be representative of the actual number of U.S. beneficial holders of ADSs or the number of ADSs that were beneficially held by U.S. persons.
Our Company is currently a majority-owned subsidiary of CSAH, which is an entity wholly-owned by the Chinese government.
80
Table of Contents
B. RELATED PARTY TRANSACTIONS
CSAH is our controlling shareholder. We entered into certain transactions with CSAH and its affiliates in the year ended December 31, 2022. We also continued to carry out existing continuing transactions with CSAH and its affiliates in the year ended December 31, 2022. In particular, we believe the following arrangements are material to our operations. We believe that these arrangements have been entered into by us in the ordinary course of business and in accordance with the agreements governing such transactions. For a detailed description of our related party transactions, please see Note 50 to the consolidated financial statements.
Arrangements with CSAH
Trademark License Agreement
We entered into a ten-year trademark license agreement with CSAH on May 22, 1997, pursuant to which CSAH acknowledged that we have the right to use the name “南方航空(China Southern)” and “中国南方航空(China Southern Airlines)” in both Chinese and English, and grants us a renewable and royalty free license to use the kapok logo on a worldwide basis in connection with our airline and airline-related businesses. Unless CSAH gives a written notice of termination three months before the expiration of the agreement, the agreement will be automatically renewed for another ten-year term. In May 2017, the trademark license agreement entered into between us and CSAH was automatically renewed for 10 years.
Leases
We (as lessee) and CSAH or its subsidiaries (as lessor) entered into lease agreements as follows:
| (1) | We and CSAH entered into an indemnification agreement dated May 22, 1997 in which CSAH agreed to indemnify us against any loss or damage caused by or arising from any challenge of, or interference with, our right to use certain lands and buildings. |
| (2) | We and CSAH entered into an asset lease framework agreement on 21 December, 2020 for a term of three years commencing from January 1, 2021 to December 31, 2023 to renew lease transactions originally covered under the asset lease framework agreement dated January 26, 2018. Pursuant to such asset lease framework agreement, CSAH agreed to (i) lease certain properties, parking lots and equipment assets such as machinery equipment, transportation equipment and electronic equipment located in various cities, such as Nanyang, Wuhan, Changsha, Beijing, Urumqi, Guangzhou and Zhanjiang held by CSAH or its subsidiaries to our Company for the purposes of civil aviation and related businesses of our Company; and (ii) lease certain lands located in Nanyang, Wuhan, Guangzhou and Zhanjiang by leasing the land use rights of such lands to our Company for the purposes of civil aviation and related businesses of our Company. |
The annual aggregate amount of rent payable by our Company to CSAH under the new asset lease framework agreement for each of the three years ending December 31, 2021, 2022 and 2023 is RMB346.2905 million. For the year ended December 31, 2022, the rent incurred by our Group amounted to RMB323 million pursuant to the new asset lease framework agreement.
According to IFRS 16 – “Leases”, our Group, as the lessee, shall recognize a lease as a right-of-use asset and a lease liability in the consolidated statement of financial position of our Group. The aggregate value of the right-of-use asset recognized under the proposed lease transactions contemplated under the new asset lease framework agreement is RMB935 million.
| (3) | On December 30, 2019, we entered into a property and land lease framework agreement with CSAH to renew the property and land lease framework agreement dated December 16, 2016 for a term of three years commencing from January 1, 2020 to December 31, 2022. Pursuant to such property and land lease framework agreement, CSAH agreed to (i) lease to us certain properties, facilities and other infrastructure located in various cities such as Beijing, Shenyang, Chaoyang, Dalian, Changchun, Harbin, Jilin, Urumqi and overseas locations held by CSAH or its subsidiaries, (ii) lease certain lands located in Shenyang, Chaoyang, Dalian, Changchun, Harbin and Urumqi by leasing the land use rights of such land to us. |
81
Table of Contents
The amount of aggregate annual rental payable by us to CSAH under the new property and land lease framework agreement for each of the three years ending December 31, 2022 is RMB96.78 million. For the year ended December 31, 2022, the rents for property lease and land lease incurred by us under the property and land lease framework agreement amounted to RMB83 million.
According to IFRS 16 – “Leases”, we, as the lessee, shall recognize a lease as a right-of-use asset and a lease liability in our consolidated statement of financial position. The aggregate value of the right-of use asset recognized under the lease transactions under the property and land lease framework agreement is RMB259,335,413.67.
| (4) | On December 28, 2022, we entered into a new property and land lease framework agreement with CSAH to renew the property and land lease framework agreement dated December 30, 2019, for a term of three years commencing from January 1, 2023 to December 31, 2025. Pursuant to such property and land lease framework agreement, CSAH has agreed to: (i) lease certain properties, facilities and other infrastructure located in various cities, such as Beijing, Shenyang, Chaoyang, Dalian, Changchun, Harbin, Jilin, Urumqi and overseas locations held by CSAH or its subsidiaries, to the Company for office use related to the development of civil aviation business; and (ii) lease to the Company the land use right of lands located in Shenyang, Chaoyang, Dalian, Changchun, Harbin and Urumqi for the purposes of civil aviation and related businesses of the Company. |
The annual aggregate amount of rent payable by the Company to CSAH under the property and land lease framework agreement for each of the three years ending December 31, 2025 is RMB105.40 million.
According to IFRS 16 – “Leases”, we, as the lessee, shall recognize a lease as a right-of-use asset and a lease liability in our consolidated statement of financial position. The aggregate value of the right-of-use asset recognized under the proposed lease transactions contemplated under the property and land lease framework agreement is RMB281,086,012.70.
Southern Airlines Culture and Media Co., Ltd. (“SACM”), which is 60% owned by CSAH
We entered into a media services framework agreement on December 28, 2021 with SACM, to renew the media services provided by SACM to us under the original media service framework agreement entered into by our Company and SACM with a term of three years on December 27, 2018, for a further term of three years from January 1, 2022 to December 31, 2024. Pursuant to this agreement, SACM agrees to continue to provide us with (i) agency services for collecting, editing and distribution for our Group’s internal publicity media and platforms; (ii) exclusive advertising agency services for our Company and advertising agency services for our Company’s wholly-owned or controlled subsidiaries; (iii) agency services for the planning, procurement and production of entertainment content in the application software of our Group’s in-flight entertainment system; (iv) supply services for CSA Mall; (v) recruitment public relations services; newspaper placement services; and (vii) other media services. The service fees for media services provided by the SACM and its subsidiaries to members of our Group are determined by reference to market prices after arms-length negotiations between the parties. The market prices are determined in the following order: (a) the prices then charged by independent third parties providing similar services under normal trading conditions in or in the vicinity of the place where such services are provided; or (b) the prices then charged by independent third parties providing similar services under normal trading conditions within the PRC. Our Company will assign staff to check prices and terms offered by independent third parties for similar products or services (usually through online price comparison tools). Pursuant to the media services framework agreement, the annual caps for each of the financial years ending December 31, 2022, 2023 and 2024 were RMB240 million, RMB261 million and RMB282 million (excluding tax), respectively. For the year ended December 31, 2022, the transaction amount incurred by our Group for media services was RMB103 million.
82
Table of Contents
China Southern Airlines Group Finance Company Limited (“Finance Company”), which is 51.416% owned by CSAH
| (1) | On August 27, 2019, we entered into a financial services framework agreement with Finance Company to renew the financial services framework agreement dated August 29, 2016 for a term of three years commencing from January 1, 2020 to December 31, 2022. Pursuant to this financial services framework agreement, Finance Company provided to our Group, among other things, deposit services and loan services. Each of the maximum daily balance of deposits (including the corresponding interests accrued thereon) placed by our Group as well as the maximum amount of the outstanding loans provided by Finance Company to our Group (including the corresponding interests payable accrued thereon) for each of the three years ending December 31, 2022 did not exceed the cap which was set at RMB13.0 billion, RMB14.5 billion and RMB16.0 billion, respectively, on any given day. The deposit placed by our Group with Finance Company were RMB14,118 million on December 31, 2022 and did not exceed RMB16.0 billion on any given day during the year ending December 31, 2022. |
| (2) | On October 28, 2022, we entered into a new financial services framework agreement with Finance Company to renew the financial services provided by Finance Company to our Group under the original financial services framework agreement for a further term of three years from January 1, 2023 to December 31, 2025. Pursuant to this financial services framework agreement, Finance Company will provide to our Group, among other things, deposit services and loan services. The maximum daily deposit balance (including the relevant accrued interest) deposited by our Group and the maximum outstanding loan amount (including the relevant accrued interest payable) provided by the Finance Company to our Group at any particular date shall not exceed RMB20 billion, RMB21 billion and RMB22 billion for each of the three years ending December 31, 2023, 2024 and 2025, respectively. |
China Southern Airlines Group Property Management Company Limited (“CSAGPMC”), a wholly-owned subsidiary of CSAH
On December 21, 2020, we entered into a new property management framework agreement with CSAGPMC to renew the appointment of CSAGPMC for a term of three years from January 1, 2021 to December 31, 2023 for the provision of property management and maintenance services, including (i) ensuring that our Company’s facilities in the production area, office area and living area of the old Baiyun Airport area, the China Southern Airlines building, the new Baiyun Airport and their surroundings are kept in an ideal condition and that the equipment in those areas are in normal operation; (ii) managing and carrying out maintenance in the old Baiyun Airport area, the China Southern Airlines building and their surrounding properties; (iii) managing and carrying out maintenance in the properties rented by the Company in the China Southern Airlines base and the terminal building of the new Baiyun Airport; (iv) managing and carrying out maintenance in the 110KV electrical substation in the new Baiyun Airport; (v) managing the operation of and carrying out maintenance in the high and low voltage transformer and distribution equipment in the Guangzhou freight station; and (vi) providing the water and electricity charge agency services. The annual cap for the property management framework agreement is set at RMB167 million for each of the three years ending December 31, 2023, respectively.
On February 15, 2022, CSAH completed the disposal of 95% interest in CSAGPMC to China Merchants Property Operation & Service Co., Ltd., an independent third party to the Company. Subsequent to the disposal, CSAH only holds 5% of the interest in CSAGPMC and CSAGPMC ceased to be a connected person to the Company under the HKSE Listing Rules. As such, the transactions contemplated under the Property Management Framework Agreement ceased to be a continuing connected transaction of the Company following the disposal under the HKSE Listing Rules.
During the period from January 1, 2022 to February 15, 2022, the property management and maintenance services fee incurred by our Group amounted to RMB25 million pursuant to the property management framework agreement.
83
Table of Contents
CSA International Finance Leasing Co., Ltd. (the “CSA International”)
CSA International was previously wholly owned by CSAH, and became a joint venture of CSAH in 2019.
| (1) | We entered into a 2020-2022 finance and lease service framework agreement with CSA International on October 10, 2019 for a term of three years commencing from January 1, 2020 to December 31, 2022, pursuant to which CSA International agreed to provide to us finance leasing service in relation to the leased aircraft, leased aircraft related assets and leased aviation related equipment and operating lease service in relation to certain aircraft, helicopters and engines. |
The total rental fee (including principal and interest) and handling fee under the finance lease service related transactions are US$5,140 million, US$5,039 million and US$4,434 million for each of the three years ending December 31, 2022, respectively. Pursuant to IFRS 16, the finance lease transactions by us (including our wholly-owned or controlled subsidiaries or their wholly-owned or controlled subsidiaries) as lessee under the finance and lease service framework agreement will be recognized as right-of-use assets, and the annual caps for the finance lease for each of the three years ending December 31, 2022 under the finance and lease service framework agreement are US$3,922 million, US$3,833 million and US$3,385 million, respectively.
The total rental fee (including principal and interest) and handling fee for finance lease under the finance and lease service framework agreement was RMB4,157 million for the year ended December 31, 2022. The calculated right-of-use assets by discounting the above mentioned total rental fee (including principal and interest) and the handling fee was RMB3,579 million.
The maximum annual rental fee under the operating lease service related transactions are US$135 million, US$255 million and US$368 million for each of the three years ending December 31, 2022 respectively, and the maximum total rental fee under the operating lease transactions are US$1,385 million, US$1,213 million and US$1,201 million for each of the three years ending December 31, 2022 respectively. Pursuant to IFRS 16, the operating lease service related transactions by us as lessee under the finance and lease service framework agreement will be recognized as right-of-use assets, and the annual caps for the operating lease for each of the three years ending December 31, 2022 under the finance and lease service framework agreement are US$1,116 million, US$961 million and US$949 million, respectively.
We paid the rental fees (namely actual amount of rental fees payable to CSA International by us every year, including twelve-month rental fees for current aircraft, helicopters and engines as well as newly added aircraft, helicopters and engines during the year) of RMB517 million for the operating lease service related transactions under the finance and lease service framework agreement for the year ended December 31, 2022. The total amount of rental fees of newly added aircraft and helicopters (leased by the Company from CSA International on an annual basis under operating leases for a period of two to twelve years) and right of use assets calculated by discounting the aforementioned rental amounts were RMB1,089 million.
| (2) | We entered into a 2023-2025 finance and lease service framework agreement with CSA International on October 28, 2022 for a term of three years commencing from January 1, 2023 to December 31, 2025, pursuant to which CSA International agreed to continue to provide to us finance leasing service in relation to the leased aircraft, leased aircraft related assets and leased aviation related equipment and operating lease service in relation to certain aircraft, special equipments and engines. |
The total rental amount (including principal and interest) and handling fee under the finance lease service related transactions are US$4,133.27 million, US$4,132.98 million and US$3,628.68 million for each of the three years ending December 31, 2025, respectively. Pursuant to IFRS 16, the finance lease transactions by us (including our wholly-owned or controlled subsidiaries or their wholly-owned or controlled subsidiaries) as lessee under the finance and lease service framework agreement will be recognized as right-of-use assets, and the annual caps for the finance lease for each of the three years ending December 31, 2025 under the finance and lease service framework agreement are US$3,361 million, US$3,331 million and US$2,896 million, respectively.
84
Table of Contents
The maximum annual rental expenses under the operating lease service related transactions are US$197 million, US$356 million and US$486 million for each of the three years ending December 31, 2025, respectively, and the maximum total rental under the operating lease transactions are US$1,524 million, US$1,436 million and US$1,119 million for the three years ending December 31, 2025, respectively. Pursuant to IFRS 16, the operating lease service related transactions by us as lessee under the finance and lease service framework agreement will be recognized as right-of-use assets, and the annual caps for the operating lease for each of the three years ending December 31, 2025 under the finance and lease service framework agreement are US$1,262 million, US$1,174 million and US$916 million, respectively.
Shenzhen Air Catering Co., Ltd. (the “SACC”), which is 50.1% owned by CSAH
We entered into a catering services framework agreement on December 28, 2021 with SACC to renew the catering services provided by SACC to our Group under the original catering services framework agreement for a term of three years, commencing from January 1, 2022 to December 31, 2024. Pursuant to the catering services framework agreement, SACC agreed to provide to our Group the in-flight meal, in-flight supply and storage management services.
Pursuant to the catering services framework agreement, the annual caps for each of the three financial years ending December 31, 2022, 2023 and 2024 are RMB200 million, RMB230 million and RMB265 million, respectively. For the year ended December 31, 2022, the service fee incurred by our Group pursuant to the catering services framework agreement was RMB57 million.
Non-Public Subscriptions for Shares
| (1) | On October 30, 2019, we entered into a subscription agreement with CSAH pursuant to which CSAH agreed to subscribe in cash for not more than 2,453,434,457 new A Shares (including 2,453,434,457 A Shares). On the same day, we entered into a subscription agreement with Nan Lung, pursuant to which Nan Lung agreed to subscribe in cash for not more than 613,358,614 new H Shares (including 613,358,614 H Shares). These subscription agreements were approved in our extraordinary general meeting and the respective class meetings of shareholders of A and H Shares on December 27, 2019. On April 8, 2020, the CSRC approved the issuance of H Shares to Nan Lung. On April 15, 2020, we issued 608,695,652 H Shares at a price of HK$5.75 per H Share. Immediately after completion of such issuance of H Shares, the total amount of our outstanding shares was 12,875,867,938 Shares, comprised of 4,275,144,849 issued H Shares and 8,600,723,089 issued A Shares. We received the “Acceptance Notice of the Application for Administration Permission” issued by the CSRC for the A Shares issuance on January 6, 2020. On April 24, 2020, the Issuance Examination Committee of the CSRC reviewed the application for the A Shares Issuance and informed us that our application for the A Shares issuance was approved. On May 27, 2020, we received the written approval for the A Shares issuance from the CSRC. On June 17, 2020, we completed the issuance of 2,453,434,457 A Shares to CSAH at a price of RMB5.21 per A Share. These new A Shares are subject to a 36 month lock up period from the date of the completion of such issuance. Immediately after completion of such issuance of A Shares, the total amount of our outstanding shares was 15,329,302,395 Shares, comprised of 11,054,157,546 issued A Shares and 4,275,144,849 issued H Shares. |
On October 29, 2021, we entered into a subscription agreement with CSAH pursuant to which CSAH agreed to subscribe in cash for 803,571,428 new A Shares. On the same day, we entered into a subscription agreement with Nan Lung, pursuant to which Nan Lung agreed to subscribe in cash for not more than 855,028,969 new H Shares (including 855,028,969 H Shares). These subscription agreements were approved at our extraordinary general meeting on December 28, 2021.
On March 18, 2022, we announced that we received the written approval from the CSRC for the issuance of H Shares to Nan Lung. On August 10, 2022, we issued a total of 368,852,459 H Shares to Nan Lung at a price of HK$4.88 per H Share.
On October 10, 2022, we announced that we received the written approval for the A Shares issuance from the CSRC. On November 24, 2022, we completed the issuance of 803,571,428 A Shares to CSAH at a price of RMB5.60 per A Share. These new A Shares are subject to a 36 month lock up period from the date of the completion of such issuance. Immediately after completion of such issuance of A Shares, the total amount of our outstanding shares was 18,120,889,956 Shares, comprised of 13,476,892,648 issued A Shares and 4,643,997,308 issued H Shares.
85
Table of Contents
Subscription for A Share Convertible Bonds
On May 14, 2020, the Board considered and approved, among others, the issuance of convertible corporate bonds in the total amount of not exceeding RMB16 billion which are convertible into new A Shares and proposed to be issued by us within the PRC (the “A Share Convertible Bonds”) and the possible subscription for the A Share Convertible Bonds by CSAH. CSAH, being our controlling Shareholder, is entitled to pre-emptive rights to subscribe for the A Share Convertible Bonds under the issuance plan of the A Share Convertible Bonds, which is compliant with the relevant laws, regulations, normative documents and the Articles of Association. The terms of the subscription for A Share Convertible Bonds by CSAH are the same as the terms and conditions which are set out in the issuance plan of the A Share Convertible Bonds. On June 30, 2020, the aforesaid proposed issuance of A Share Convertible Bonds and possible subscription for the A Share Convertible Bonds by CSAH were considered and approved at the 2019 annual general meeting, 2020 first class meeting for holders of A Shares and 2020 first class meeting for holders of H Shares. On October 15, 2020, we completed the public issuance of 160 million A Share Convertible Bonds in the total amount of RMB16 billion with a nominal value of RMB100 each and the initial conversion price of RMB6.24 per share, out of which CSAH subscribed for 101,027,580 A Share Convertible Bonds. As of December 31, 2021, 101,034,070 A Share convertible bonds were converted to A Shares and all of the A Share convertible bonds held by CSAH were converted into A Shares on June 18, 2021.
Sichuan Airlines Co., Ltd. (“Sichuan Airline”), which is 39% owned by us
On August 30, 2019, we entered into a framework agreement on the use of facility with Sichuan Airline, pursuant to which Sichuan Airline will construct a multi-use building. Upon construction completion, Sichuan Airline will lease the building to us for a term of twenty years. The building is expected to be delivered to us by March 1, 2023.
Disposal of General Aviation Limited, which was then 57.9% owned by us
We entered into an agreement with CSAH on September 22, 2022, pursuant to which our Company agreed to sell and CSAH agreed to purchase approximately 57.9% of the equity interest in General Aviation Limited for a consideration of RMB1.18 billion. Completion of the disposal took place in September 2022. Upon completion, the Company ceased to have any interest in General Aviation Limited and General Aviation Limited ceased to be a subsidiary of our Company.
Provision of Guarantees
As of December 31, 2022, we and our subsidiaries, Xiamen Airlines and Chongqing Airlines, provided guarantees to 43 SPVs that were controlled and consolidated by us, which was approved at our general meeting. The total amount of such guarantee is US$5.37 billion.
During the reporting period, we have authorized Xiamen Airlines to provide guarantees to its subsidiaries, which are Hebei Airlines, Xiamen Airlines No. 1 (Xiamen) Aircraft Lease Company Limited to Xiamen Airlines No. 18 (Xiamen) Aircraft Lease Company Limited, or Xiamen Aircraft Lease SPVs, and Jiangxi Airlines, with an aggregate balance up to RMB9,590 million, RMB5,200 million, RMB2,600 million and RMB1,790 million or equivalent in foreign currency during the period from July 1, 2022 to June 30, 2023, respectively. As of December 31, 2022, the amount of such guarantee provided by Xiamen Airlines to Hebei Airlines, Xiamen Aircraft Lease SPVs and Jiangxi Airlines are RMB4,305 million, RMB1,703 million and RMB1,553 million, respectively.
86
Table of Contents
C. INTERESTS OF EXPERTS AND COUNSEL
Not applicable.
ITEM 8. FINANCIAL INFORMATION
A. CONSOLIDATED STATEMENTS AND OTHER FINANCIAL INFORMATION
Our audited consolidated financial statements are set forth beginning on page F-1, which can be found after Item 19.
Legal Proceedings
We are currently not a party to any legal, arbitration, or administrative proceedings that our management believes could have a material adverse effect on our business, financial position or results of operations. We may from time to time be subject to various legal or administrative claims and proceedings arising in the ordinary course of business or otherwise. Litigation or any other legal or administrative proceeding, regardless of the outcome, is likely to result in substantial cost and diversion of our resources, including our management’s time and attention.
Dividend Information
As the Company suffered an operating loss for year of 2022, which does not meet the conditions for profit distribution as required under the Articles of Association of the Company, the Board did not recommend any payment of cash dividend or conversion of capital reserve into share capital or other profit distribution of the Company for the year of 2022. The abovementioned proposal is still subject to the approval of the 2022 annual general meeting of the Company.
Our Board declares dividends, if any, in Renminbi with respect to H Shares on a per share basis and pays such dividends in Hong Kong dollars. Any final dividend for a fiscal year is subject to shareholders’ approval. Bank of New York Mellon, as depositary, converts the HK dollar dividend payments and distributes them to holders of ADSs in U.S. dollars, less expenses of conversion. Under the Company Law of the PRC and our Articles of Association, all of our shareholders have equal rights to dividends and distributions. The holders of the H Shares share proportionately on a per share basis in all dividends and other distributions declared by our Board, if any, based on the foreign exchange conversion rate published by the People’s Bank of China, or PBOC, on the date of the distribution of the cash dividend.
During the three years of 2020 to 2022, the aggregate cash dividends the Company distributed exceed the annual average profit distributable to shareholders as shown on the Company’s consolidated financial statements. This complies with the Articles of Association, which requires that the aggregate cash dividends distributed in the last three years shall not be less than 30% of the annual average distributable profit of the Company in the last three years.
We believe that our dividend policy strikes a balance between two important goals providing our shareholders with a competitive return on investment and assuring sufficient reinvestment of profits to enable us to achieve our strategic objectives. The declaration of dividends is subject to the discretion of our Board, which takes into account the following factors:
| • | our financial results; |
| • | capital requirements; |
| • | contractual restrictions on the payment of dividends by us to our shareholders or by our subsidiaries to us; |
| • | our shareholders’ interests; |
87
Table of Contents
| • | the effect on our creditworthiness; |
| • | general business and economic conditions; and |
| • | other factors our Board may deem relevant. |
Pursuant to PRC laws and regulations and our Articles of Association, dividends may only be distributed after allowance has been made for: (i) recovery of losses, if any, and (ii) allocations to the statutory surplus reserve. The allocation to the statutory surplus reserve is 10% of our net profit determined in accordance with PRC GAAP. Our distributable profits for the current fiscal year will be equal to our net profits determined in accordance with IFRSs, less allocations to the statutory surplus reserve.
B. SIGNIFICANT CHANGES
No significant changes have occurred since the date of the consolidated financial statements.
ITEM 9. THE OFFER AND LISTING
A. OFFER AND LISTING DETAILS
The principal trading market for our Company’s H Shares is the Hong Kong Stock Exchange, and our Company’s trading code is “1055”. Our Company completed our initial public offering of H Shares on July 30, 1997. Until February 3, 2023, we had ADS, each representing 50 H Shares, listed for trading on the New York Stock Exchange. On January 23, 2023, the Company filed a Form 25 to delist its ADSs from the New York Stock Exchange. The delisting became effective on February 3, 2023, and the American Depositary Receipt facility was terminated on March 6, 2023. Our H Shares will continue to be traded on the Hong Kong Stock Exchange.
The principal trading market for our Company’s A Shares is the Shanghai Stock Exchange with trading code of “600029”. On July 25, 2003, our Company completed our initial public offering of A Shares.
No significant trading suspension occurred in the prior three years.
B. PLAN OF DISTRIBUTION
Not applicable.
C. MARKETS
See “Offer and Listing Details” above.
D. SELLING SHAREHOLDERS
Not applicable.
E. DILUTION
Not applicable.
88
Table of Contents
F. EXPENSES OF THE ISSUE
Not applicable.
ITEM 10. ADDITIONAL INFORMATION
A. SHARE CAPITAL
Not applicable
B. MEMORANDUM AND ARTICLES OF ASSOCIATION
The following is a summary of certain provisions of our Articles of Association. As this is a summary, it does not contain all the information that may be important to you. You and your advisors should read the text of our most updated Articles of Association for further information, which is filed as an exhibit to this Annual Report.
General
Our Company is registered with and has obtained a business license from the State Administration Bureau of Industry and Commerce of the People’s Republic of China on March 25, 1995. On March 13, 2003, our Company obtained an approval certificate from the Ministry of Commerce to change to a permanent limited company with foreign investments.
Other Senior Administrative Officers
Pursuant to the Article 17 of the Articles of Association, other senior administrative officers of our Company refer to the Executive Vice President, Chief Financial Officer, Chief Pilot, COO Flight Safety, Chief Information Officer, Chief Economist, Chief Legal Adviser, Chief Engineer, COO Flight Operations, Company Secretary and other senior management appointed by the Board.
Objects and Purposes
Pursuant to the Article 19 of the Articles of Association, the scope of business of our Company includes: (1) provision of scheduled and non-scheduled domestic, regional and international air transportation services for passengers, cargo, mail and luggage; (2) undertaking general aviation services; (3) provision of aircraft repair and maintenance services; (4) acting as agent for other domestic and international airlines; (5) provision of air catering services; (6) engaging in other airline or airline related business, (limited to insurance agency business personal accident insurance); (7) provision of airline ground services; (8) aviation training; (9) asset leasing services; (10) project management and technical consultancy services; (11) sales of aviation equipment; (12) travel agency business; (13) merchandise retail and wholesale; (14) physical examination services (15) internet retail; (16) internet life service platform (including internet travel platform, internet accommodation platform and internet retail platform); (17) concurrent-business insurance agent services: property insurance, health insurance and life insurance; (18) trade agency; (19) professional design services; (20) telecom value-added services; (21) internet advertising services; (22) other advertising services; (23) internet data services; (24) internet information services; (25) information system integration services; (26) internet of things technical services; (27) economic and business consulting services; (28) information technology consulting services; and (29) other professional consulting and investigations; all subject to approval by company registration authorities.
89
Table of Contents
Directors
Pursuant to Article 175 of the Articles of Association, where a director is interested in any resolution proposed at a board meeting, such director shall abstain from voting and shall not have a right to vote. Such director shall not be counted in the quorum of the relevant meeting. Such directors also shall not vote on behalf of other directors. Board meetings may be convened by more than half of the directors who are not interested in the proposal. Resolutions of board meetings shall be passed by more than half of directors who are not interested in the proposal.
Pursuant to Article 245 of the Articles of Association, where a director of our Company is in any way, directly or indirectly, materially interested in a contract, transaction or arrangement or proposed contract, transaction or arrangement with the Company, (other than his contract of service with the Company), he shall declare the nature and extent of his interests to the Board at the earliest opportunity, whether or not the contract, transaction or arrangement or proposal therefor is otherwise subject to the approval of the Board. For the purposes of the Articles of Association, a director is deemed to be interested in a contract, transaction or agreement in which an associate of him is interested.
Pursuant to Article 253 of the Articles of Association, our Company shall, with the prior approval of shareholders in shareholders’ general meeting, enter into a contract in writing with a director wherein his emoluments are stipulated. The aforesaid emoluments include, emoluments in respect of his service as director, supervisor or senior administrative officer of our Company or any subsidiary of our Company, emoluments in respect of the provision of other services in connection with the management of the affairs of our Company and any of its subsidiaries, and payment by way of compensation for loss of office, or as consideration for or in connection with his retirement from office.
Pursuant to Article 248 of the Articles of Association, our Company shall not directly or indirectly make a loan to or provide any guarantee in connect with the making of a loan to a director of the Company. However, the following transactions are not subject to such prohibition: (1) the provision by the Company of a loan or a guarantee in connection with the making of a loan or any other funds to any of its directors to meet expenditure incurred or to be incurred by him for the purposes of the Company or for the purpose of enabling him to perform his duties properly, in accordance with the terms of a service contract approved by the shareholders in shareholders’ general meeting; (2) the Company may make a loan to or provide a guarantee in connection with the making of a loan to any of the relevant directors or their respective associates in the ordinary course of its business on normal commercial terms, provided that the ordinary course of business of the Company includes the lending of money or the giving of guarantees.
There is no specific provisions concerning a director’s power, in the absence of an independent quorum, to vote compensation to themselves or any members of their body, other than the above Article 175 with respect to a director’s voting power in matters he is materially interested. Directors are not required to hold shares of our Company. Our Articles do not contain any share requirements for the directors to retire by a specified age.
Ordinary Shares
Pursuant to Article 27 of the Articles of Association, subject to the approval of the securities authority of the State Council, our Company may issue and offer shares to domestic investors or foreign investors for subscription. Foreign investors are those investors of foreign countries and regions of Hong Kong, Macau and Taiwan who subscribe for shares issued by our Company. Domestic investors are those investors within the territory of the PRC (excluding investors of the regions referred to in the preceding sentence) who subscribe for shares issued by our Company.
Pursuant to Article 28 of the Articles of Association, shares issued by our Company to domestic investors for subscription in RMB shall be referred to as “Domestic Shares”. Shares issued by our Company to foreign investors for subscription in foreign currencies shall be referred to as “Foreign Shares”. Foreign Shares which are listed overseas are called “Overseas Listed Foreign Shares”. The foreign currencies mean the legal currencies (apart from RMB) of other countries or regions which are recognized by the foreign exchange control authority of the state and can be used to pay our Company for the share price.
90
Table of Contents
Pursuant to Article 29 of the Articles of Association, Domestic Shares issued by our Company shall be called “A Shares”. Overseas Listed Foreign Shares issued by our Company and listed in Hong Kong shall be called “H Shares”. H Shares are shares which have been admitted for listing on the Stock Exchange of Hong Kong Limited, the par value of which is denominated in RMB and which are subscribed for and traded in Hong Kong dollars. H Shares can also be listed on a stock exchange in the United States of America in the form of ADS. Shares issued by our Company, including Domestic Shares and Foreign Shares, are all ordinary shares.
Pursuant to Article 63 of the Articles of Association, the ordinary shareholders of our Company shall enjoy the following rights:
| (1) | the right to attend or appoint a proxy to attend shareholders’ general meetings and to vote thereat; |
| (2) | the right to dividends and other distributions in proportion to the number of shares held; |
| (3) | the right of supervisory management over the Company’s business operations, and the right to present proposals or enquiries; |
| (4) | the right to transfer, donate or pledge his shares in accordance with laws, administrative regulations and provisions of these Articles of Association; |
| (5) | the right of knowledge and decision making power with respect to important matters of the Company in accordance with laws, administrative regulations and these Articles of Association; |
| (6) | the right to obtain relevant information in accordance with the provisions of these Articles of Association, including: |
| (i). | the right to obtain a copy of these Articles of Association, subject to payment of the cost of such copy; |
| (ii). | the right to inspect and copy, subject to payment of a reasonable charge; |
| (iii). | all parts of the register of shareholders; |
| (a). | personal particulars of each of the Company’s directors, supervisors, president and other senior administrative officers, including: |
| (aa) | present name and alias and any former name or alias; |
| (bb) | principal address (residence); |
| (cc) | nationality; |
| (dd) | primary and all other part-time occupations and duties; |
| (ee) | identification documents and their relevant numbers; |
| (b). | state of the Company’s share capital; |
| (c). | reports showing the aggregate par value, quantity, highest and lowest price paid in respect of each class of shares repurchased by the Company since the end of last accounting year and the aggregate amount paid by the Company for this purpose; |
| (d). | minutes of shareholders’ general meetings and accountants’ report; and |
| (e). | interim and annual reports of the Company. |
91
Table of Contents
| (7) | in the event of the termination or liquidation of the Company, to participate in the distribution of surplus assets of the Company in accordance with the number of shares held; |
| (8) | the right to request the company to repurchase their shares as a result of disagreement on the resolutions passed by the shareholders’ general meeting on the merger or division of the Company; and |
| (9) | other rights conferred by laws, administrative regulations and these Articles of Association. According to Article 270, dividends shall be distributed in accordance with the proportion of shares held by shareholders. |
According to Article 38 of the Articles of Association, our Company may repurchase its issued shares under the following circumstances: (1) reduction of its capital; (2) merging with another company that holds shares in our Company; (3) use its shares for Employee Stock Ownership Plan or as stock incentives; (4) at the request of the dissenting shareholders; (5) use its shares for conversion of convertible corporate bonds issue by the Company; (6) where the repurchase is necessary for the Company to maintain its corporate value and protect the interests of the shareholders; and (7) other circumstances permitted by laws and administrative regulations.
According to Article 42 of the Articles of Association, unless our Company is in the course of liquidation, it must comply with the following provisions in relation to repurchase of its issued shares: (1) where our Company repurchases shares of our Company at par value, payment shall be made out of book surplus distributable profits of our Company or out of proceeds of a fresh issue of shares made for that purpose; (2) where our Company repurchases shares of our Company at a premium to its par value, payment up to the par value may be made out of the book surplus distributable profits of our Company or out of the proceeds of a fresh issue of shares made for that purpose: (i) If the shares being repurchased were issued at par value, payment shall be made out of the book surplus distributable profits of the Company; (ii) If the shares being repurchased were issued at a premium to its par value, payment shall be made out of the book surplus distributable profits of the Company or out of the proceeds of a fresh issue of shares made for that purpose, provided that the amount paid out of the proceeds of the fresh issue shall not exceed the aggregate of premiums received by the Company on the issue of the shares repurchased or the current amount (including the premiums on the fresh issue) of the Company’s premium account (or capital common reserve fund account) at the time of the repurchase; (3) payment by our Company in consideration of the following shall be made out of our Company’s distributable profits: (i) acquisition of rights to repurchase shares of our Company; (ii) variation of any contract to repurchase shares of our Company; and (iii) release of any of our Company’s obligation under any contract to repurchase shares of our Company; and (4) After our Company’s registered capital has been reduced by the total par value of the cancelled shares in accordance with the relevant provisions, the amount deducted from the distributable profits of our Company for paying up the par-value portion of the shares repurchased shall be transferred to our Company’s premium account (or capital common reserve fund account).
According to Article 68 of the Articles of Association, shareholders of our company have the obligation not to withdraw their shares unless required by laws and regulations; shareholders are not liable to make any further contribution to the share capital other than as agreed by the subscriber of the relevant shares on subscription.
According to Article 267 of the Articles of Association, when distributing each year’s after-tax profits, our Company shall set aside 10% of such profits for our Company’s statutory common reserve fund, except where the accumulated balance of the said fund has reached 50% of our Company’s registered capital. After our Company has allocated its after-tax profits to the statutory common reserve fund, we may, with the approval of the shareholders by way of resolution in a shareholders’ general meeting, further allocate its after-tax profits to the discretionary common reserve fund.
The Articles of Association does not have specific provisions discriminating against any existing or prospective holder of such securities as a result of other shareholders owning a substantial number of shares.
92
Table of Contents
Action Necessary to Change Rights of Shareholders
Pursuant to Article 152 of the Articles of Association, shareholders who hold different classes of shares are shareholders of different classes. The holders of the Domestic Shares and holders of Overseas Listed Foreign Shares are deemed to be shareholders of different classes.
Pursuant to Article 153 of the Articles of Association, rights conferred on any class of shareholders in the capacity of shareholders (“class rights”) may not be varied or abrogated unless approved by a special resolution of shareholders in general meeting and by holders of shares of that class at a separate meeting.
Pursuant to Article 155 of the Articles of Association, shareholders of the affected class, whether or not otherwise having the right to vote at shareholders’ general meetings, shall nevertheless have the right to vote at class meetings in respect of the following matters: (i) to effect an exchange of all or part of the shares of such class into shares of another class or to effect an exchange or create a right of exchange of all or part of the shares of another class into the shares of such class; (ii) to restrict the transfer or ownership of the shares of such class or add to such restriction; (iii) to restructure our Company where the proposed restructuring will result in different classes of shareholders bearing a disproportionate burden of such proposed restructuring; and (iv) to vary or abrogate the provisions of these Articles of Association. However, interested shareholder(s) shall not be entitled to vote at class meetings.
Pursuant to Article 156 of the Articles of Association, resolutions of a class of shareholders shall be passed by votes representing more than two-thirds of the voting rights of shareholders of that class represented at the relevant meeting who are entitled to vote at class meetings.
Pursuant to Article 157 of the Articles of Association, written notice of a class meeting shall be given forty-five days before the date of the class meeting to notify all of the shareholders in the share register of the class of the matters to be considered, the date and the place of the class meeting. A shareholder who intends to attend the class meeting shall deliver his written reply concerning attendance at the class meeting to our Company twenty days before the date of the class meeting. If the number of shares carrying voting rights at the meeting represented by the shareholders who intend to attend the class meeting reaches more than one half of the voting shares at the class meeting, our Company may hold the class meeting; if not, our Company shall within five (5) days notify the shareholders again by public notice of the matters to be considered, the date and the place for the class meeting. Our Company may then hold the class meeting after such publication of notice.
Pursuant to Article 158 of the Articles of Association, notice of class meetings need only be served on shareholders entitled to vote thereat. Meeting of any class of shareholders shall be conducted in a manner as similar as possible to that of general meetings of shareholders. The provisions of these Articles of Association relating to the manner to conduct any shareholders’ general meeting shall apply to any meeting of a class of shareholders.
Meetings of Shareholders
According to Article 79, shareholders’ general meetings are divided into annual general meetings and extraordinary general meetings. Shareholders’ general meetings shall be convened by our Board. Annual general meetings are held once every year and within six months from the end of the preceding financial year.
According to Article 80, under any of the following circumstances, our Board shall convene an extraordinary general meeting within two months: (1) the number of directors is less than that is required by the Company Law or two thirds of the number of directors specified in these Articles of Association; (2) the accrued losses of our Company amount to one third of the total amount of its share capital; (3) shareholder(s) individually or jointly holding 10% or more of our Company’s issued and outstanding shares carrying voting rights request(s) in writing the convening of an extraordinary general meeting; (4) it is deemed necessary by the Board or requested by the supervisory committee to convene an extraordinary general meeting; (5) more than one half of the independent directors propose to convene the meeting.
According to Article 92 of the Articles of Association, notice of a shareholders’ general meeting shall be given by way of announcement or by any other manner as provided in these Articles of Association (if necessary), not less than forty-five days (including forty-five days) before the date of the meeting to notify all of the shareholders in the share register of the matters to be considered, the date and the place of the meeting.
93
Table of Contents
According to Article 93 of the Articles of Association, our Company shall, based on the written replies received twenty days before the date of the shareholders’ general meeting from the shareholders, calculate the number of voting shares represented by the shareholders who intend to attend the meeting. If the number of voting shares represented by the shareholders who intend to attend the meeting reaches one half or more of our Company’s total voting shares, our Company may hold the meeting; if not, then our Company shall within five days notify the shareholders again by public notice of the matters to be considered, the place and date for, the meeting. Our Company may then hold the meeting after such publication of notice.
Limitation on Right to Own Securities
The Articles of Association does not specifically provide for the limitations on the rights to own securities by certain shareholders, however, the PRC Special Regulations on Overseas Offering and the Listing of Shares by Companies Limited by Share (the “Special Regulations”) and the Mandatory Provisions for Articles of Association of Companies to be Listed Overseas (the “Mandatory Provisions”) provide for different classes of shares to be subscribed for and traded by local and overseas investors respectively. Shares which can be traded by overseas investors must be in registered form and while denominated in Renminbi, they are traded in foreign currency with dividends payable in foreign currency. Local investors are prohibited from dealing in such shares.
Merger, Acquisition or Corporate Restructuring
Pursuant to Article 295 of the Articles of Association, in the event of the merger or division of our Company, a plan shall be presented by our Company’s Board and shall be approved in shareholders’ general meeting and the relevant examining and approving formalities shall be processed as required by law. A shareholder who objects to the plan of merger or division shall have the right to demand our Company or the shareholders who consent to the plan of merger or division to acquire that dissenting shareholder’s shareholding at a fair price. The contents of the resolution of merger or division of our Company shall be made into special documents for shareholders’ inspection. Such special documents shall be sent by mail to holders of Overseas-Listed Foreign Shares.
Ownership to Be Disclosed
The Articles of Association do not contain any provisions governing the ownership threshold above which shareholder ownership must be disclosed.
Certain Differences between PRC Company Law and Delaware Corporate Law
The PRC company law and other laws applicable to us differ in a number of respects from laws generally applicable to United States corporations and their shareholders. The description set forth below includes a summary of certain provisions of the PRC company law, Special Rules, Mandatory Provisions and the Guidelines applicable to companies listed both in the PRC and overseas, such as us, which differ from provisions of the corporate law of the State of Delaware.
General
We are a PRC joint stock company, which is a corporate entity organized under the PRC company law. Under the PRC company law, the registered capital of a joint stock company is divided into shares of equal par value. These shares are commonly called domestic ordinary shares. Each share of a joint stock company ranks equally with all other shares in its class as to voting rights (except for specified class voting rights) and rights to dividends and other distributions. Upon receiving approval from the relevant authorities, a joint stock company may offer its shares for sale to the public and seek to be listed on a stock exchange. The State Council may formulate separate regulations for the issuance of other classes of shares, including H shares. All of our issued shares are fully paid and nonassessable. Holders of H Shares may transfer their shares without the approval of other shareholders. Among other things, a joint stock company must have (1) a board of directors of not fewer than five and not more than 19 members, and (2) a board of supervisors of not fewer than three members.
94
Table of Contents
The shareholders’ meeting of a joint stock company is the highest authority of the company and exercises the powers of the company with respect to significant matters, subject to applicable law and the articles of association of the company. The business of a joint stock company is under the overall management of a board of directors, subject to the PRC company law, other applicable laws and regulations (which in our case include the PRC aviation law and regulations), the company’s articles of association and duly adopted resolutions of its shareholders. The day-to-day operations of a joint stock company are under the direction of its general manager or president, subject to applicable laws and regulations, the company’s articles of association and duly adopted resolutions of the directors and shareholders. In addition, the PRC company law provides for the establishment of a board of supervisors for each joint stock company. The supervisors perform and exercise the functions and powers described below, including examination of the joint stock company’s affairs and monitoring the actions of the directors and officers of the company. The directors, supervisors and officers are not required to hold any qualifying shares in the joint stock company.
A joint stock company may be liquidated involuntarily due to insolvency or voluntarily in accordance with the terms of its articles of association or duly adopted shareholders’ resolutions. The property of a joint stock company remaining after full payment of its liquidation expenses, wages, labor insurance premiums of its employees and statutory compensations, outstanding taxes and debts, is distributed in proportion to the holdings of its shareholders.
Meetings of shareholders
Under PRC law, shareholders are given the power to approve specified matters. In addition, the Mandatory Provisions provide that at shareholders’ meetings shareholders are entitled to consider any proposals made by shareholders holding in the aggregate at least 3% of voting power over the company’s shares. These proposals must fall within the scope of powers of the shareholder’s meeting, have a clear agenda and specific matters and comply with laws, administrative regulations and articles of association of the company.
Under Delaware law, the business and affairs of a Delaware corporation are, in general, managed by or under the direction of its board of directors. Only certain fundamental matters regarding the corporation are reserved by statute to be exercised by the shareholders. These matters include, in general, election or removal of directors, retention or dismissal of the corporation’s independent auditors, mergers or other business combinations involving the corporation, amendment of the corporation’s certificate of incorporation and liquidation or dissolution of the corporation.
Shareholders’ approval by written consent
PRC law does not provide shareholders of overseas listed joint stock companies with rights to approve corporate matters by written consent. Under Delaware law, unless otherwise provided in the certificate of incorporation, any action which is required or permitted to be taken at any shareholders’ meeting may be taken without a meeting, subject to various conditions.
Amendments of articles of association
Under PRC law, an amendment of the articles of association must be approved by an affirmative vote of two-thirds of shareholders attending a shareholders’ meeting. Amendments with respect to the Mandatory Provisions only become effective after approval by the relevant governmental department authorized by the State Council and the China Securities Regulatory Commission.
Under Delaware law, with certain exceptions, shareholder approvals must be obtained for any amendment to the certificate of incorporation. Board approvals are also required for any amendment to the certificate of incorporation, but no governmental approval is generally required.
95
Table of Contents
Powers and responsibilities of directors
Under PRC law, the board of directors is responsible for specified actions, including the following functions and powers of a joint stock company:
| • | convening shareholders’ meetings and reporting its work to shareholders at these meetings; |
| • | implementing shareholders’ resolutions; |
| • | determining the company’s business plans and investment proposals; |
| • | formulating the company’s annual financial budgets and final accounts; |
| • | formulating the company’s profit distribution plans and loss recovery plans; |
| • | formulating proposals for the increase or decrease in the company’s registered capital and the issue of debentures; |
| • | formulating major acquisition and disposal plans and plans for the merger, division or dissolution of the company; |
| • | to the extent authorized by the shareholders’ meeting, deciding on such matters as external investments, purchase or sale of assets, assets pledge and connected transactions of the company; |
| • | deciding on the company’s internal management structure and formulating its basic management system; and |
| • | appointing or removing the company’s principal executive officers; appointing and removing other senior officers based on the recommendation of the principal executive officer and deciding on the remuneration of the senior officers. |
In addition, the Mandatory Provisions provide that the board of directors has the authority to formulate any proposal to amend the articles of association and to exercise any other power conferred by a decision of the shareholders’ meeting.
Under Delaware law, the business and affairs of a Delaware corporation are managed by or under the direction of its board of directors. Their powers include fixing the remuneration of directors, except as otherwise provided by statute or in the certificate of incorporation or by-laws of the corporation.
Powers and responsibilities of supervisors
Under PRC law, a PRC joint stock company must have a board of supervisors consisting of shareholder representatives and one or more employee representatives. Supervisors attend board meetings as non-voting observers. Directors and officers may not serve as supervisors. The supervisors perform and exercise the following functions and powers:
| • | examining the company’s financial affairs; |
| • | monitoring compliance with laws, regulations, the articles of association of the company and the shareholders resolutions by the directors and officers of the company; and suggesting removing the directors and officers who violate these laws and regulations; |
96
Table of Contents
| • | requiring corrective action from directors and officers whose actions are contrary to the interests of the company; |
| • | examining the financial information, including financial statements, operation reports and plans for profit distribution, to be submitted by the board of directors to the shareholders’ meetings; and authorizing, in the company’s name, public certified accountants or licensed auditors to assist in the re-examination of such information, should any doubt arise in respect thereof; |
| • | proposing the holding of extraordinary shareholders’ meetings; |
| • | proposing new items to be inserted in the agenda of the shareholders’ meeting; |
| • | bringing lawsuits against directors or members of senior management, if they violate laws, regulations or articles of association of the company; and |
| • | exercising and performing other powers and functions provided for in the company’s articles of association. |
In addition, the Mandatory Provisions provide that supervisors of overseas listed joint stock companies are entitled to retain auditors in the name of the company to examine any financial or business reports or profit distribution proposals to be submitted by the directors to a meeting of the shareholders which the supervisors consider questionable, and negotiate or take legal action against any director or the directors in the name of the company. The fees and expenses of attorneys and other professionals incurred by the supervisors in connection with the discharge of their duties are to be paid by the company.
Delaware law makes no provision for a comparable corporate institution.
Duties of directors, supervisors and officers
Under PRC law, directors, supervisors and officers of a joint stock company are required to comply with relevant laws and regulations and the company’s articles of association. A director, supervisor or officer who contravenes any law, regulation or the company’s articles of association in the performance of his duties shall be personally liable to the company for any loss incurred by the company. Directors, supervisors and officers are required to carry out their duties honestly and diligently, and protect the interests of the company. They are also under a duty of confidentiality to the company and prohibited from divulging confidential information concerning the company, except as permitted by relevant laws and regulations or by a decision of a shareholders’ meeting. They may not use their position and authority in the company to seek personal gain. Directors and officers may not directly or indirectly engage in the same business as the company or in any other business detrimental to the interests of the company, and they are required to forfeit any profits from these activities to the company.
Under Delaware law, the business and affairs of a corporation are managed by or under the direction of its board of directors. In exercising their powers, directors are charged with a fiduciary duty of care to protect the interests of the corporation and a fiduciary duty of loyalty to act in the best interests of its shareholders.
Limitations on transactions with interested directors, supervisors and officers
Under PRC law, directors and officers of a joint stock company may not enter into any contracts or transactions with the company unless permitted by the articles of association or approved by the shareholders. A company may not provide any guarantees to shareholders or any de facto control person of the company unless such guarantees are approved by a majority of shareholders present at the shareholders’ meeting, excluding the shareholder who will be provided such guarantees. Under the Mandatory Provisions, a director, supervisor or officer is required to disclose to the board any transaction with the company in which he has a direct or indirect interest or in which there is a material conflict of interest between the company and himself. A director is not entitled to vote or be counted for quorum purposes in any board decision on any such transaction. A company may set aside any interested transaction which did not comply with these requirements, unless the other party to such transaction was honestly unaware of the breach of obligations by the interested director, supervisor or officer. A company may not loan or provide any guarantees to directors, supervisors or officers (including persons related to them), except for the loans made in accordance with employment contracts approved by the shareholders, or unless the company’s business scope allows for the provision of loans and guarantees and such loans or guarantees are made under regular commercial terms.
97
Table of Contents
Under Delaware law, an interested transaction is not voidable if (1) the material facts as to the interested director’s relationship or interests are disclosed or are known to the board of directors and the board in good faith authorizes the transaction by the affirmative vote of a majority of the disinterested directors, (2) such material facts are disclosed or are known to the shareholders entitled to vote on such transaction and the transaction is specifically approved in good faith by vote of the majority of shares entitled to vote thereon or (3) the transaction is fair as to the corporation as of the time it is authorized, approved or ratified. Under Delaware law, the interested director could be held liable for a transaction in which such a director derived an improper personal benefit.
Election and removal of directors
Under PRC law, the term of office of directors of a joint stock company must be specified in the articles of association, but may not exceed three years. Directors may be re-elected. No director may be removed from office without cause by shareholders prior to the expiration of the director’s term. PRC law does not contemplate a classified board of directors.
Under Delaware law, directors of a Delaware corporation can be removed from office with or without cause by the holders of a majority of shares then entitled to vote at an election of directors, provided that except where the certificate of incorporation of the Delaware corporation otherwise provides, a member of a classified board may be removed by shareholders only for cause, and in a corporation with cumulative voting, if less than all of the directors are removed, no director may be removed if the votes cast against the director’s removal is sufficient to elect the director if cumulatively voted at an election of directors. The Court of Chancery may remove a director who has been convicted of a felony or found by a court to have committed a breach of the duty of loyalty in connection with his or her duties to the corporation following application by the corporation or derivatively in the right of the corporation by any shareholder. The court may order the removal only if it determines that the director did not act in good faith in performing the acts resulting in the prior conviction or judgment and that removal is necessary to avoid irreparable harm to the corporation.
Dividend payments
Under PRC law, proposals for distribution of profits are formulated by the board of directors and submitted for shareholder approval at a shareholders’ meeting. Dividends may be distributed in the form of cash or shares.
Under Delaware law, the board of directors of a Delaware corporation may declare dividends out of distributable earnings and profits without the approval of the shareholders.
Amalgamations and business combinations; appraisal rights
Under PRC law, amalgamations and divisions involving joint stock companies are required to be approved by shareholders voting at a shareholders’ meeting. The Mandatory Provisions require an amalgamation or division involving the company to be approved by an affirmative vote of two-thirds of the votes present at the shareholders’ meeting called to consider the transaction. Any opposing shareholder may request the company or the consenting shareholders to purchase its shares at a fair price. In addition, a sale of fixed assets having a value exceeding 33% of the fixed assets as shown on the company’s latest balance sheet most recently reviewed by the shareholders’ meeting requires the approval of at least one third of the shareholders’ meeting.
Under Delaware law, with certain exceptions, a merger, consolidation or sale of all or substantially all the assets of a corporation must be approved by the board of directors and holders of a majority of the outstanding shares entitled to vote. A shareholder objecting to the merger is entitled to appraisal rights pursuant to which the shareholder may receive cash in the amount of the fair value of the shares held by such shareholder (as determined by a court) in lieu of the consideration the shareholder would otherwise receive in the transaction.
98
Table of Contents
Transactions with significant shareholders
Under Delaware law, a business combination between a Delaware corporation and an interested shareholder which takes place at any time during a period of three years commencing with the date the interested shareholder became an interested shareholder would need prior approval from the board of directors or a supermajority of the shareholders of the corporation, unless the corporation opted out of the relevant Delaware business combination statute. Under Delaware law, an interested shareholder of a corporation is someone who, together with its affiliates and associates, owns more than 15% of the outstanding common shares of the corporation. No such business combination statute or regulation applies to PRC joint stock companies.
Shareholders’ lawsuits
The PRC law provides that most disputes involving an H shareholder are to be resolved by final and binding arbitration.
Class actions and derivative actions generally are available to shareholders under Delaware law for, among other things, breach of fiduciary duty, corporate waste and actions not taken in accordance with applicable law.
Limitations on liability and indemnification of directors and officers
PRC law does not provide for any specific limitations on liability or indemnification of directors and officers.
Under Delaware law, a corporation may indemnify a current director or officer of the corporation against expenses (including attorneys’ fees), judgments, fines and amounts paid in settlement actually and reasonably incurred in defense of an action, suit or proceeding by reason of such position if (1) the director or officer acted in good faith and in a manner he reasonably believed to be in or not opposed to the best interests of the corporation and (2) with respect to any criminal action or proceeding, the director or officer had no reasonable cause to believe that his conduct was unlawful. Persons serving at the request of the corporation as directors, officers, employees or agents of another entity such as a subsidiary or an employee stock trust may receive advancement of expenses from the corporation. A corporation may not retroactively impair or eliminate indemnification or advancement rights by amending the corporation’s certificate of incorporation or bylaws after the occurrence of the act or omission that gives rise to indemnification or advancement rights, unless the provision contains, at the time of the act or omission, an explicit authorization of such elimination or limitation.
Shareholders’ rights of inspection of corporate records
Under PRC law, shareholders are entitled to inspect the articles of association, register of shareholders, corporate bond counter foils, minutes of shareholders’ meetings and board meetings and reports of the financial accounts of the company. In addition, the Mandatory Provisions provide that, after paying reasonable fees, shareholders are entitled to inspect the company’s shareholder list, certain personal information on the directors, supervisors and officers, the company’s capital position and certain information regarding share repurchases conducted by the company during the most recent fiscal year.
Delaware law permits any shareholder of a Delaware corporation to examine or obtain copies of or extracts from the corporation’s shareholder list and its other books and records for any purpose reasonably related to such person’s interest as a shareholder.
C. MATERIAL CONTRACTS
Other than contracts that are described under Item 4 “Information on the Company” and Item 7 “Major Shareholders and Related Party Transactions”, we have not entered into any material contracts outside the ordinary course of our business within the two years immediately preceding the date of this annual report.
99
Table of Contents
D. EXCHANGE CONTROLS
Under current Chinese foreign exchange regulations, Renminbi is fully convertible for current account transactions, but is not freely convertible for capital account transactions. Current account foreign currency transactions can be undertaken without prior approval from the relevant Chinese government agencies by producing commercial documents evidencing such transactions, provided that they are processed through Chinese banks licensed to engage in foreign currency transactions. Conversion from Renminbi into a foreign currency or vice versa for purposes of capital account transactions requires prior approvals of relevant Chinese government agencies. This restriction on capital account transactions could affect the ability of our Company to acquire foreign currency for capital expenditures.
Our Company is generally required by law to sell all its foreign currency revenue to Chinese banks. Our Company may purchase foreign currency directly from Chinese banks for any current account transactions, such as trade transactions in our usual and normal course of business, including acquisition of aircraft, jet fuel and flight equipment (such acquisition requires approvals from the relevant Chinese government agencies). Payment of dividends by our Company to holders of our Company’s H Shares is also considered a current account transaction under Chinese law. Therefore, there is no legal restriction on the conversion of Renminbi into foreign currency for the purpose of paying dividends to such holders of H Shares. In addition, our Company’s Articles of Association require our Company to pay dividends to holders of our Company’s H Shares in foreign currency.
The People’s Bank of China has decided to improve quotation of the central parity of RMB against US dollar. Effective from August 11, 2015, the quotes of central parity that market makers report to the China Foreign Exchange Trade System daily before market opens should refer to the closing rate of the inter-bank foreign exchange market on the previous day, in conjunction with demand and supply condition in the foreign exchange market and exchange rate movement of the major currencies. As a result, the RMB central parity entered a more market-oriented stage.
The PRC government has stated publicly that it intends to further liberalize its currency policy, which could result in a further and more significant change in the value of the Renminbi against the U.S. dollar. Any significant revaluation of the Renminbi may have a material adverse effect on our Company’s financial performance, and the value of, and any dividends payable on, our Company’s H Shares in foreign currency terms.
Other Limitations
There are no limitations on the right of non-resident or foreign owners to hold or vote H Shares imposed by Chinese law or by the Articles of Association or other constituent documents of our Company. However, under current Chinese law, foreign ownership of our Company may not exceed 49%.
E. TAXATION
Chinese Taxation
The following is a general summary of certain Chinese tax consequences of the acquisition, ownership and disposition of A Shares, H Shares and ADSs. This summary is based upon tax laws of China as in effect on the date of this Annual Report, including the income tax treaty between the United States and China (the “U.S.-PRC Tax Treaty”), all of which are subject to change or different interpretation.
In general, for Chinese tax purposes, holders of ADSs will be treated as the owners of the H Shares represented by those ADSs, and exchanges of H Shares for ADSs, and ADSs for H Shares, will not be subject to taxation under the laws of China.
This summary does not purport to address all material tax consequences for holders or prospective purchasers of A Shares, H Shares or ADSs, and does not take into account the specific circumstances of such investors. Investors should consult their own tax advisors as to Chinese or other tax consequences of the acquisition, ownership and disposition of A Shares, H Shares or ADSs.
100
Table of Contents
Dividends
The new corporate income tax law and its relevant regulations generally provide for the imposition of a withholding tax on dividends paid by a Chinese company to a non-resident enterprise at a rate of 10%.
China currently has double-taxation treaties with a number of countries, such as Australia, Canada, France, Germany, Japan, Malaysia, the Netherlands, Singapore, the United Kingdom and the United States. Under the U.S.-PRC Tax Treaty, China may tax a dividend paid by our Company to a U.S. holder up to a maximum of 10% of the gross amount of such dividend.
For individuals, Chinese tax law generally provides that an individual who receives dividends from Chinese companies is subject to a 20% individual income tax. Dividend income received by any foreign individual that holds overseas shares in Chinese enterprise is generally subject to individual income tax at a flat rate of 20%, subject to exemption or reduction by an applicable double-taxation treaty.
Where an individual acquires the stocks of a listed company from public offering of the company or from the stock market, if the stock holding period is one month or less, the incomes from dividends and bonuses shall be included into the taxable incomes in full amount and be taxed at a rate of 20%; if the stock holding period is more than one month up to one year, the incomes from dividends and bonuses shall be included into the taxable incomes at the reduced rate of 50% for the time being, namely, individual income tax shall be calculated at the tax rate of 20% ; and if the stock holding period is more than one year, the incomes from dividends and bonuses shall be temporarily exempted from individual income tax.
Capital Gains from Transfer or Disposition of Shares
The new corporate income tax law and its relevant regulations generally provides that a non-resident enterprise is subject to a 10% capital gains tax for the transfer or disposition of shares of a Chinese company.
For individual shareholders, Chinese tax law generally provide that an individual who transfers or otherwise disposes of a company’s shares of capital stock is subject to a 20% individual income tax on the capital gain, if any. Currently, all individuals are temporarily exempt from individual income tax on transfers of shares of joint stock companies listed on Shanghai Stock Exchange or Shenzhen Stock Exchange, such as our Company. Should such temporary exemption be discontinued, such holders may be subject to a 20% individual income tax on the capital gain, if any, unless reduced by an applicable double-taxation treaty.
Hong Kong Taxation
The following is a discussion of the material Hong Kong tax provisions relating to the ownership and disposition of H Shares or ADSs held by the investors as capital assets. This discussion does not address all of the tax considerations that may be relevant to specific investors in light of their particular circumstances or to investors subject to special treatment under the tax laws of Hong Kong. This discussion is based on the tax laws of Hong Kong as in effect on the date of this annual report, which are subject to change (or changes in interpretation), possibly with retroactive effect. This discussion does not address any aspects of Hong Kong taxation other than income taxation, capital taxation, stamp taxation and estate taxation. Prospective investors are urged to consult their tax advisers regarding Hong Kong and other tax consequences of owning and disposing of H Shares.
Tax on Dividends
Under current practice, no tax is payable in Hong Kong in respect of dividends paid by us.
101
Table of Contents
Tax on Gains from Sale
No tax is imposed in Hong Kong in respect of capital gains from the sale of property. However, trading gains from the sale of property by persons carrying on a trade, profession or business in Hong Kong where the gains are derived from or arise in Hong Kong from such trade, profession or business will be chargeable to Hong Kong profits tax, which is imposed at the rate of 16.5% on corporations and at a rate of 15% on unincorporated businesses for the year of assessment 2008/09 onwards. Commencing from the year of assessment 2018/19 (i.e. on or after 1 April 2018), the profits tax rate for the first HK$2,000,000 of profits of corporations will be lowered to 8.25% while the remaining profits will continue to be taxed at the rate of 16.5%; and the profits tax rate for the first HK$2,000,000 of profits of unincorporated businesses will be lowered to 7.5%, while the remaining profits will continue to be taxed at the rate of 15%.
Trading gains from sales of H shares effected on the Hong Kong Stock Exchange will be considered to be derived from or arise in Hong Kong. Liability for Hong Kong profits tax would thus arise in respect of trading gains from sales of H shares effected on the Hong Kong Stock Exchange realized by persons carrying on a business of trading or dealing in securities in Hong Kong.
There will be no liability for Hong Kong profits tax in respect of profits from the sale of ADSs, where purchases and sales of ADSs are effected outside Hong Kong, for example, on the New York Stock Exchange.
Stamp Duty
Hong Kong stamp duty, currently charged at the ad valorem rate of 0.1% on the higher of the consideration for, or the market value of, the H shares, will be payable by the purchaser on every purchase and by the seller on every sale of H shares (in other words, a total of 0.2% is currently payable on a typical sale and purchase transaction involving H shares). In addition, a fixed duty of HK$ 5.00 is currently payable on any instrument of transfer of H shares. If stamp duty is not paid on or before the due date, a penalty of up to 10 times the duty payable may be imposed.
The withdrawal of H Shares upon the surrender of ADRs, and the issuance of ADRs upon the deposit of H Shares, will also attract stamp duty at the rate described above for sale and purchase transactions unless such withdrawal or deposit does not result in a passing of the beneficial interest in the H Shares under Hong Kong law. The issuance of the ADRs upon the deposit of H Shares issued directly to the depositary of the ADSs, or for the account of the depositary, will not be subject to any stamp duty. No Hong Kong stamp duty is payable upon the transfer of ADSs outside Hong Kong.
Estate Duty
The Revenue (Abolition of Estate Duty) Ordinance 2005 came into effect on February 11, 2006 in Hong Kong. No Hong Kong estate duty is payable and no estate duty clearance papers are needed for an application for a grant of representation in respect of holders of H shares whose deaths occur on or after February 11, 2006.
United States Federal Income Taxation
This discussion describes general U.S. federal income tax consequences of the purchase, ownership and disposition of our Company’s ADSs for U.S. Holders. This discussion does not address any aspect of U.S. federal gift or estate tax (or tax consequences for any beneficiary receiving the Company’s ADSs from a deceased holder or by gift), or the state, local or foreign tax consequences of an investment in our Company’s ADSs. This discussion applies to you only if you hold and beneficially own our Company’s ADSs as capital assets for tax purposes. This discussion does not apply to you if you are a member of a class of holders subject to special rules, such as:
| • | dealers in securities or currencies; |
| • | traders in securities that elect to use a mark-to-market method of accounting for securities holdings; |
| • | banks or other financial institutions; |
102
Table of Contents
| • | insurance companies; |
| • | tax-exempt organizations, retirement plans, individual retirement accounts or tax deferred accounts; |
| • | partnerships or other pass-through entities (including entities treated as partnerships for U.S. federal income tax purposes) or persons holding ADSs through any such entities; |
| • | persons that hold ADSs as part of a hedge, straddle, constructive sale, conversion transaction or other integrated investment; |
| • | persons whose functional currency for tax purposes is not the U.S. dollar; |
| • | persons who are U.S. expatriates; |
| • | persons liable for alternative minimum tax; or |
| • | persons who directly, indirectly or constructively own 10% or more by vote or value of our Company’s shares including ADSs. |
This discussion is based on the U.S. Internal Revenue Code of 1986, as amended, which is referred to in this discussion as the Code, its legislative history, existing and proposed regulations promulgated thereunder, published rulings and court decisions, all as currently in effect. These laws are subject to change, possibly on a retroactive basis. In addition, this discussion relies on the assumptions regarding the value of our Company’s shares and the nature of our business over time. Finally, this discussion is based in part upon the representations of the depositary and the assumption that each obligation in the deposit agreement and any related agreement will be performed in accordance with its terms. For U.S. federal income tax purposes, as a holder of ADSs, you are treated as the owner of the underlying ordinary shares represented by such ADSs.
The discussions and comments included herein are only a general description of the tax aspects and they do not constitute a tax advice or opinion. Therefore, you should consult your own tax advisor concerning the particular U.S. federal income tax consequences to you of the purchase, ownership and disposition of our Company’s ADSs, as well as the consequences to you arising under the laws of any other taxing jurisdiction.
For purposes of the U.S. federal income tax discussion below, you are a “U.S. Holder” if you beneficially own ADSs and are:
| • | a citizen or resident of the United States for U.S. federal income tax purposes; |
| • | a corporation, or other entity taxable as a corporation, that was created or organized in or under the laws of the United States or any political subdivision thereof; |
| • | an estate the income of which is subject to U.S. federal income tax regardless of its source; or |
| • | a trust if (a) a court within the United States is able to exercise primary supervision over its administration and one or more U.S. persons have the authority to control all substantial decisions of the trust, or (b) the trust has a valid election in effect to be treated as a U.S. person. |
103
Table of Contents
U.S. Holders
Dividends on ADSs
Subject to the Passive Foreign Investment Company (“PFIC”) discussion below, if our Company makes distributions and you are a U.S. Holder, the gross amount of any distributions you receive on your ADSs (without reduction for any non-U.S. tax withheld from such distribution) will generally be treated as dividend income if the distributions are made from our Company’s current or accumulated earnings and profits, calculated according to U.S. federal income tax principles. Dividends will generally be subject to U.S. federal income tax as ordinary income on the day you actually or constructively receive such income. However, if you are an individual and have held your ADSs for a sufficient period of time, dividend distributions on our Company’s ADSs will generally constitute qualified dividend income taxed at a preferential rate as long as our Company is treated as a “qualified foreign corporation” and is not treated as a PFIC during the taxable year in which the distribution is made or the preceding taxable year and certain conditions apply. A non-U.S. corporation generally will be considered to be a qualified foreign corporation if it is eligible for the benefits of a comprehensive income tax treaty with the United States that the U.S. Treasury determines is satisfactory for purposes of this provision and that includes an exchange of information program. The Tax Treaty as currently in effect meets these requirements. The Company believes that it is currently eligible for the benefits of the Tax Treaty, but no assurance can be given that it will be so eligible at all times. Moreover, the IRS may disagree with the Company’s conclusion. Therefore, no assurance can be given that the Company will be treated as a qualified foreign corporation for these purposes and that such preferential rates of tax will apply to dividends paid on an ADS held by a U.S. Holder.
A non-U.S. corporation that is not otherwise treated as a qualified foreign corporation will be treated as a qualified foreign corporation with respect to any dividend paid in respect of stock of a non-U.S. corporation that is readily tradable on an established securities market in the United States. We have voluntarily delisted our ADSs form the NYSE, which has become effective from February 3, 2023. Following the delisting, our ADSs can no longer be regularly traded on an established market. Accordingly, this alternative for treating our dividends as qualifying dividend income is no longer available. You should consult your own tax adviser as to the rate of tax that will apply to you with respect to dividend distributions, if any, you receive from us.
Distributions in excess of current and accumulated earnings and profits, as determined for U.S. federal income tax purposes, will be treated as a non-taxable return of capital to the extent of your adjusted tax basis in the ADSs and thereafter as capital gain. However, our Company does not intend to maintain calculations of our earnings and profits in accordance with U.S. federal income tax principles, so each U.S. Holder should therefore assume that any distribution by our Company with respect to the ADSs will constitute dividend income. If you are a corporation, you will not be entitled to claim a dividends-received deduction with respect to distributions you receive from our Company. Dividends generally will constitute foreign source passive income for U.S. foreign tax credit limitation purposes. You should consult your own tax advisor to determine the foreign tax credit implications of owning ADSs.
Sales and other dispositions of ADSs
Subject to the PFIC discussion below, when you sell or otherwise dispose of our Company’s ADSs, you will generally recognize capital gain or loss in an amount equal to the difference between the amount realized on the sale or other disposition and your adjusted tax basis in the ADSs, both as determined in U.S. dollars. Your adjusted tax basis will generally equal the amount you paid for the ADSs. Any gain or loss you recognize is long-term capital gain or loss if your holding period in our Company’s ADSs is more than one year at the time of disposition. If you are an individual, any such long-term capital gain is eligible for preferential rates. Your ability to deduct capital losses is subject to various limitations.
Passive Foreign Investment Company
If our Company is currently or were to become a PFIC, as a U.S. Holder, you would generally be subject to adverse U.S. tax consequences, in the form of increased tax liabilities and special U.S. tax reporting requirements.
Our Company will be classified as a PFIC in any taxable year if either: (1) the average value during the taxable year of our assets that produce passive income, or are held for the production of passive income, is at least 50% of the average value of our total assets for such taxable year (the “Asset Test”); or (2) 75% or more of our gross income for the taxable year is passive income (such as certain dividends, interest or royalties) (the “Income Test”). For purposes of the Asset Test: (1) any cash, cash equivalents, and cash invested in short-term, interest bearing, debt instruments, or bank deposits that is readily convertible into cash, will generally count as producing passive income or as being held for the production of passive income; and (2) the average values of our Company’s passive and total assets is calculated based on our market capitalization. In the case of publicly traded corporations, fair market value must be used for purposes of applying the Asset Test. In addition, regarding the above two tests, there are complex look-through rules to consider with respect to the assets and activities of related corporations from which our Company either receives income or in which it holds an interest. More specifically, certain adjustments are made to exclude certain income received from a related party or to include income earned and assets held by a 25% or more owned subsidiary in determining whether our Company qualifies as a PFIC under the two tests.
104
Table of Contents
Our Company believes that we were not a PFIC for the taxable year 2022. However, there is no assurance that the IRS will not take a contrary position and assert that we are a PFIC, and no assurances can be given that we will not become a PFIC at some point in the future. For example, our Company would be a PFIC for the taxable year 2023 if the sum of our average market capitalization, which is our share price multiplied by the total amount of our outstanding shares, and our liabilities over that taxable year is not more than twice the value of our cash, cash equivalents, and other assets that are readily converted into cash. U.S. Holders are urged to consult their tax advisors regarding the effects of the PFIC rules.
If our Company were a PFIC, you would generally be subject to additional taxes and interest charges on certain “excess distributions” our Company makes regardless of whether our Company continues to be a PFIC in the year in which you receive an “excess distribution”. An “excess distribution” would be either (1) the excess amount of a distribution with respect to ADSs during a taxable year in which distributions to you exceed 125% of the average annual distributions to you over the preceding three taxable years or, if shorter, your holding period for the ADSs, or (2) 100% of the gain from the disposition of ADSs.
To compute the tax on “excess” distributions or any gain, (1) the “excess distribution” would be allocated ratably to each day in your holding period, (2) the amounts allocated to the current year and to any tax year before the first day on which our Company became a PFIC would be taxed as ordinary income in the current year, (3) the amount allocated to other taxable years would be taxable at the highest applicable marginal rate in effect for that year, and (4) an interest charge at the rate for underpayment of U.S. federal income tax for any period described under (3) above would be imposed with respect to any portion of the “excess” distribution that is allocated to such period. In addition, if our Company were a PFIC, no distribution that you receive from our Company would qualify for taxation at the preferential rate discussed in the “Dividends on ADSs” section above.
If our Company were a PFIC in any year, as a U.S. Holder, you would be required to make an annual return on IRS Form 8621 “Information Return by a Shareholder of a Passive Foreign Investment Company or a Qualified Electing Fund.” However, our Company does not intend to generate, or share with you, information that you might need to properly complete IRS Form 8621. You should consult with your own tax adviser regarding reporting requirements with regard to your ADSs.
If our Company were a PFIC in any year, you would generally be able to avoid the “excess” distribution rules described above by making a timely so-called “mark-to-market” election with respect to your ADSs provided our Company’s ADSs are “marketable”. We have voluntarily delisted our ADSs form the NYSE, which has become effective from February 3, 2023. Following the delisting, our ADSs can no longer be treated as marketable. Accordingly the mark-to-market election is no longer available.
Separately, if our Company were a PFIC in any year, you would be able to avoid the “excess” distribution rules by making a timely election to treat us as a so-called “Qualified Electing Fund” or “QEF”. You would then generally be required to include in gross income for any taxable year (1) as ordinary income, your pro rata share of our Company’s ordinary earnings for the taxable year, and (2) as long-term capital gain, your pro rata share of our Company’s net capital gain for the taxable year. However, our Company does not intend to provide you with the information you would need to make or maintain a “QEF” election and you will, therefore, not be able to make or maintain such an election with respect to your ADSs.
If the Company is a PFIC in any taxable year during which a U.S. Holder owns an ADS, such U.S. Holder (i) may also suffer adverse tax consequences under the PFIC rules described above with respect to any other PFIC in which the Company has a direct or indirect equity interest and (ii) generally will be required to file annually a statement setting forth certain information with its U.S. federal income tax returns. Currently, the effects of a mark-to-market election on, and the application of such an election to, lower-tier PFICs are not clear.
105
Table of Contents
Medicare Tax
In addition to regular U.S. federal income tax, certain U.S. Holders that are individuals, estates or trusts are subject to a 3.8% tax on all or a portion of their “net investment income,” which may include all or a portion of their income arising from a distribution with respect to an ADS and net gain from the sale, exchange or other disposition of an ADS.
Disclosure Requirements for Specified Foreign Financial Assets
Individual U.S. Holders (and certain U.S. entities specified in U.S. Treasury regulations) who, during any taxable year, hold any interest in any “specified foreign financial asset” generally will be required to file with their U.S. federal income tax returns certain information on IRS Form 8938 if the aggregate value of all such assets exceeds certain specified amounts. “Specified foreign financial asset” generally includes any financial account maintained with a non-U.S. financial institution and may also include an ADS if it is not held in an account maintained with a financial institution. Substantial penalties may be imposed, and the period of limitations on assessment and collection of U.S. federal income taxes may be extended, in the event of a failure to comply. U.S. Holders should consult their own tax advisors as to the possible application to them of this filing requirement.
Information Reporting and Backup Withholding
Under certain circumstances, information reporting and/or backup withholding may apply to U.S. Holders with respect to payments made on or proceeds from the sale, exchange or other disposition of an ADS, unless an applicable exemption is satisfied. Backup withholding is not an additional tax. Any amounts withheld under the backup withholding rules generally will be allowed as a refund or a credit against a U.S. Holder’s U.S. federal income tax liability if the required information is furnished by the U.S. Holder on a timely basis to the IRS.
HOLDERS OF OUR COMPANY’S ADSS SHOULD CONSULT WITH THEIR OWN TAX ADVISORS REGARDING THE APPLICATION OF THE U.S. FEDERAL INCOME TAX LAWS TO THEIR PARTICULAR SITUATIONS AS WELL AS ANY TAX CONSEQUENCES RESULTING FROM PURCHASING, HOLDING OR DISPOSING OF THE ADSS, INCLUDING THE APPLICABILITY AND EFFECT OF THE TAX LAWS OF ANY STATE, LOCAL OR FOREIGN JURISDICTION AND INCLUDING ESTATE, GIFT, AND INHERITANCE LAWS.
F. DIVIDENDS AND PAYING AGENTS
Not applicable.
G. STATEMENT BY EXPERTS
Not applicable.
H. DOCUMENTS ON DISPLAY
Our Company has filed this Annual Report on Form 20-F with the Securities and Exchange Commission under the Securities Exchange Act of 1934, as amended. Statements made in this Annual Report as to the contents of any document referred to are not necessarily complete. With respect to each such document filed as an exhibit to this Annual Report, reference is made to the exhibit for a more complete description of the matter involved, and each such statement shall be deemed qualified in its entirety by such reference.
Our Company is subject to the informational requirements of the Exchange Act and file reports and other information with the Securities and Exchange Commission. Reports and other information which our Company filed with the Securities and Exchange Commission, including this Annual Report on Form 20-F, may be inspected and copied at the public reference room of the Securities and Exchange Commission at 100 F Street, NE, Washington, D.C. 20549.
106
Table of Contents
You can also obtain copies of this Annual Report on Form 20-F by mail from the Public Reference Section of the Securities and Exchange Commission, 100 F Street, NE, Washington, D.C. 20549, at prescribed rates. Additionally, copies of this material may be obtained from the Securities and Exchange Commission’s Internet site at http://www.sec.gov. The Commission’s telephone number is 1-800-SEC-0330. Copies of this material may also be obtained for our Company’s website at http:// www.csair.com.
I. SUBSIDIARY INFORMATION
Not applicable.
ITEM 11. QUANTITATIVE AND QUALITATIVE DISCLOSURES ABOUT MARKET RISK
Fuel Price Fluctuation Risk
Our earnings are affected by changes in the price and availability of jet fuel. There are currently no effective means available to manage our exposure to the fluctuations in jet fuel prices. Our results of operations may be significantly affected by fluctuations in fuel prices which is a significant expense for our Group. A reasonable possible increase or decrease of 10% in jet fuel price, with volume of fuel consumed and all other variables held constant, would have increased or decreased the fuel costs by approximately RMB3,267 million. The sensitivity analysis of jet fuel price risk is disclosed in Note 4(e) to the consolidated financial statements.
Interest Rate Risk
We are subject to market risks due to fluctuations in interest rates. The majority of our borrowings and lease liabilities are in the form of long-term fixed-rate and variable-rate. Fluctuations in interest rates can lead to significant fluctuations in the fair value of such debt instruments.
Interest rate swaps, denominated in United States Dollars (“USD”), have been entered into to mitigate our cash flow interest rate risk. The interest rate swaps allow our Company to pay at fixed rate from 1.64% to 1.72% to receive LIBOR. The notional principal of the outstanding interest rate swap contracts as at December 31, 2022 amounted to USD123 million (December 31, 2021: USD190 million), and the fair value of the interest rate swaps was RMB29 million recognized in assets as of December 31, 2022 (December 31, 2021: RMB20 million recognized in liabilities).
The sensitivity analysis of interest rate risk is disclosed in Note 4(b) to the consolidated financial statements.
The following table provides information regarding our other financial instruments (excluding lease contracts in accordance with Item 305 of Regulation S-K) that are sensitive to changes in interest rate as of December 31, 2022 and 2021:
107
Table of Contents
| As of December 31, 2022 Expected Maturity Date |
As of December 31, 2021 |
|||||||||||||||||||||||||||||||||||||||
| (RMB Equivalent in million) | (RMB Equivalent in million) | |||||||||||||||||||||||||||||||||||||||
| 2023 | 2024 | 2025 | 2026 | 2027 | Thereafter | Total recorded amount |
Fair Value(2) |
Total Recorded amount |
Fair Value(2) |
|||||||||||||||||||||||||||||||
| Bank and other loans |
||||||||||||||||||||||||||||||||||||||||
| Fixed rate bank and other loans in US$ |
— | — | — | — | — | — | — | — | — | — | ||||||||||||||||||||||||||||||
| Average interest rate |
N/A | N/A | N/A | N/A | N/A | N/A | N/A | N/A | N/A | N/A | ||||||||||||||||||||||||||||||
| Variable rate bank and other loans in US$ |
1,394 | — | — | — | — | — | 1,394 | 1,394 | — | — | ||||||||||||||||||||||||||||||
| Average interest rate(1) |
3.50 | % | N/A | N/A | N/A | N/A | N/A | 3.50 | % | N/A | N/A | N/A | ||||||||||||||||||||||||||||
| Fixed rate bank and other loans in RMB |
83,818 | 14,045 | 11,844 | 5,245 | 10 | — | 114,962 | 114,962 | 93,192 | 93,192 | ||||||||||||||||||||||||||||||
| Average interest rate |
2.33 | % | 3.00 | % | 2.49 | % | 6.49 | % | 1.20 | % | N/A | 2.62 | % | N/A | 2.67 | % | N/A | |||||||||||||||||||||||
| Variable rate bank and other loans in RMB |
124 | 122 | 250 | 124 | 126 | 2,678 | 3,424 | 3,424 | 3,075 | 3,075 | ||||||||||||||||||||||||||||||
| Average interest rate(1) |
3.00 | % | 3.00 | % | 2.69 | % | 3.00 | % | 3.00 | % | 3.00 | % | 2.98 | % | N/A | 3.56 | % | N/A | ||||||||||||||||||||||
| (1) | Variable interest rates are calculated based on the year end indices. |
| (2) | Fair value of debt instruments was estimated based on the interest rates applicable to similar debt instruments as of December 31, 2022 and 2021. |
Foreign Currency Exchange Risk
We are also exposed to foreign currency risk as a result of our aircraft and flight equipment being sourced from overseas suppliers. Specifically, our foreign currency exposure relates primarily to our foreign currency lease liabilities and long-term bank and other loans used to finance such capital expenditures and our capital commitments. Subject to certain restrictive conditions imposed by the SAFE, we may, from time to time, enter into foreign exchange forward option contracts to mitigate our foreign currency exposures. The sensitivity analysis of foreign currency risk is disclosed in Note 4(c) to the consolidated Financial Statements.
The Group entered into forward foreign exchange and foreign exchange options contracts to mitigate its forward currency risk, and all the forward foreign exchange and foreign exchange options contracts have been settled in 2021. Forward foreign exchange contracts with the notional principal amounted to USD90 million, were entered into and settled in 2022.
As of December 31, 2022, we operated a total of 578 aircraft under leases. Certain of the leases are at rates that are substantially fixed. Such leases expose us to market risks. However, in accordance with Item 305 of Regulation S-K, such leases have been excluded from the following market risk tables.
The following table provides information regarding our material foreign currency sensitive financial instruments and capital commitments as of December 31, 2022 and 2021:
| As of December 31, 2022 Expected Maturity Date or Transaction Date (RMB Equivalent in million) |
As of December 31, 2021 (RMB Equivalent in million) |
|||||||||||||||||||||||||||||||||||||||
| 2023 | 2024 | 2025 | 2026 | 2027 | Thereafter | Total Recorded Amount |
Fair Value |
Total Recorded Amount |
Fair Value |
|||||||||||||||||||||||||||||||
| Variable rate bank and other loans in US$ |
1,394 | — | — | — | — | — | 1,394 | 1,394 | — | — | ||||||||||||||||||||||||||||||
| Capital commitment in US$ |
33,968 | 23,795 | 21,306 | 16,289 | 1,971 | — | 97,329 | 97,329 | 54,662 | 54,662 | ||||||||||||||||||||||||||||||
108
Table of Contents
ITEM 12. DESCRIPTION OF SECURITIES OTHER THAN EQUITY SECURITIES
For description of the rights of each class of securities that is registered under Section 12 of the Exchange Act as of December 31, 2022, please refer to Exhibit 2.3 of this Annual Report.
A. DEBT SECURITIES
None
B. WARRANTS AND RIGHTS
None
C. OTHER SECURITIES
None
D. AMERICAN DEPOSITARY SHARES
On January 23, 2023, the Company filed a Form 25 to delist its ADSs from the New York Stock Exchange. The delisting became effective on February 3, 2023, and the American Depositary Receipt facility was terminated on March 6, 2023.
The Bank of New York Mellon collects its fees for delivery and surrender of ADSs directly from investors depositing shares or surrendering ADSs for the purpose of withdrawal or from intermediaries acting for them. The Bank of New York Mellon collects fees for making distributions to investors by deducting those fees from the amounts distributed or by selling a portion of distributable property to pay the fees. The Bank of New York Mellon may collect its annual fee for depositary services by deductions from cash distributions, by directly billing investors, or by charging the book-entry system accounts of participants acting for them. The Bank of New York Mellon may generally refuse to provide fee-attracting services until its fees for those services are paid.
| Persons depositing or withdrawing shares must pay: | For: | |
| $5.00 (or less) per 100 ADSs (or portion of 100 ADSs) | • Issuance of ADSs, including issuances resulting from a distribution of shares or rights or other property
• Cancellation of ADSs for the purpose of withdrawal, including if the deposit agreement terminates | |
| $.02 (or less) per ADS | • Any cash distribution to ADS registered holders | |
| A fee equivalent to the fee that would be payable if securities distributed to you had been shares and the shares had been deposited for issuance of ADSs | • Distribution of securities to holders of deposited securities which are distributed by the depositary to ADS registered holders | |
| $.02 (or less) per ADSs per calendar year | • Depositary services | |
| Registration or transfer fees | • Transfer and registration of shares on our share register to or from the name of the depositary or its agent when you deposit or withdraw shares | |
| Expenses of the depositary | • Cable, telex and facsimile transmissions (when expressly provided in the deposit agreement)
• Converting foreign currency to U.S. dollars | |
| Taxes and other governmental charges the depositary or the custodian have to pay on any ADS or share underlying an ADS, for example, stock transfer taxes, stamp duty or withholding taxes | • As necessary | |
| Any charges incurred by the depositary or its agents for servicing the deposited securities | • As necessary | |
109
Table of Contents
Fees and Payments from the Depositary to Us
From January 1, 2022 to March 6, 2023, we received from the depositary a reimbursement of US$0 net of withholding tax, for continuing annual stock exchange listing fees and expenses incurred by our Company in connection with the administration and maintenance of the depositary receipt facility.
Indirect payments
As part of the service to our Company, The Bank of New York Mellon waived a total amount of US$85,319.13 for the standard costs associated with the administration of the ADS program from January 1, 2022 to March 6, 2023.
PART II
ITEM 13. DEFAULTS, DIVIDEND ARREARAGES AND DELINQUENCIES
None.
ITEM 14. MATERIAL MODIFICATIONS TO THE RIGHTS OF SECURITY HOLDERS AND USE OF PROCEEDS
A. MATERIAL MODIFICATIONS TO THE INSTRUMENTS DEFINING THE RIGHTS OF SECURITY HOLDERS
None.
B. MATERIAL MODIFICATIONS TO THE RIGHTS OF REGISTERED SECURITIES BY ISSUING OR MODIFYING ANY OTHER CLASS OF SECURITIES
None.
C. WITHDRAWAL OR SUBSTITUTION OF A MATERIAL AMOUNT OF THE ASSETS SECURING ANY REGISTERED SECURITIES
Not applicable.
110
Table of Contents
D. CHANGE OF TRUSTEES OR PAYING AGENTS FOR ANY REGISTERED SECURITIES
Not applicable.
E. USE OF PROCEEDS
Not applicable.
ITEM 15. CONTROLS AND PROCEDURES
Disclosure controls and procedures
Our President and Chief Financial Officer have evaluated the effectiveness of our disclosure controls and procedures (as defined in the Exchange Act Rules 13a-15(e) or 15d-15(e)), and concluded that, based on their evaluation, our disclosure controls and procedures were effective as of the end of the period covered by this Annual Report to ensure that information required to be disclosed by us in the reports that we file or submit under the Exchange Act is recorded, processed, summarized and reported, within the time periods specified in the SEC’s rules and forms, and were also effective to ensure that information required to be disclosed in the reports that we file or submit under the Exchange Act is accumulated and communicated to our management, including our President and Chief Financial Officer, to allow timely decisions regarding required disclosure.
Management’s annual report on internal control over financial reporting
Our management is responsible for establishing and maintaining adequate internal control over financial reporting as defined in Rules 13a-15(f) and 15d-15(f) under the Exchange Act. Internal control over financial reporting is a process designed to provide reasonable assurance regarding the reliability of financial reporting and the preparation of financial statements for external purposes in accordance with generally accepted accounting principles and includes those policies and procedures that (1) pertain to the maintenance of records that, in reasonable detail, accurately and fairly reflect the transactions and dispositions of a company’s assets, (2) provide reasonable assurance that transactions are recorded as necessary to permit preparation of consolidated financial statements in accordance with generally accepted accounting principles, and that a company’s receipts and expenditures are being made only in accordance with authorizations of a company’s management and directors, and (3) provide reasonable assurance regarding prevention or timely detection of unauthorized acquisition, use, or disposition of a company’s assets that could have a material effect on the consolidated financial statements. Our management has assessed the effectiveness of internal control over financial reporting based on the Internal Control—Integrated Framework (2013) issued by the Committee of Sponsoring Organizations of the Treadway Commission. Our management has concluded that our internal control over financial reporting was effective as of December 31, 2022.
Because of its inherent limitations, internal control over financial reporting may not prevent or detect misstatements. Also, projections of any evaluation of effectiveness to future periods are subject to the risk that controls may become inadequate because of changes in conditions, or that the degree of compliance with policies or procedures may deteriorate.
KPMG Huazhen LLP, an independent registered public accounting firm, has audited the consolidated financial statements included in this Annual Report, and, as part of the audit, has issued a report, included herein, on the effectiveness of our internal control over financial reporting.
Report of Independent Registered Public Accounting Firm
To the Shareholders and Board of Directors
China Southern Airlines Company Limited:
111
Table of Contents
Opinion on Internal Control Over Financial Reporting
We have audited China Southern Airlines Company Limited and subsidiaries’ (the “Company”) internal control over financial reporting as of December 31, 2022, based on criteria established in Internal Control – Integrated Framework (2013) issued by the Committee of Sponsoring Organizations of the Treadway Commission. In our opinion, the Company maintained, in all material respects, effective internal control over financial reporting as of December 31, 2022, based on criteria established in Internal Control – Integrated Framework (2013) issued by the Committee of Sponsoring Organizations of the Treadway Commission.
We also have audited, in accordance with the standards of the Public Company Accounting Oversight Board (United States) (PCAOB), the consolidated statements of financial position of the Company as of December 31, 2022 and 2021, the related consolidated income statements, consolidated statements of comprehensive income, consolidated statements of changes in equity, and consolidated cash flow statements for each of the years in the three-year period ended December 31, 2022, and the related notes (collectively, the consolidated financial statements), and our report dated April 27, 2023 expressed an unqualified opinion on those consolidated financial statements.
Basis for Opinion
The Company’s management is responsible for maintaining effective internal control over financial reporting and for its assessment of the effectiveness of internal control over financial reporting, included in the accompanying Management’s Annual Report on Internal Control over Financial Reporting. Our responsibility is to express an opinion on the Company’s internal control over financial reporting based on our audit. We are a public accounting firm registered with the PCAOB and are required to be independent with respect to the Company in accordance with the U.S. federal securities laws and the applicable rules and regulations of the Securities and Exchange Commission and the PCAOB.
We conducted our audit in accordance with the standards of the PCAOB. Those standards require that we plan and perform the audit to obtain reasonable assurance about whether effective internal control over financial reporting was maintained in all material respects. Our audit of internal control over financial reporting included obtaining an understanding of internal control over financial reporting, assessing the risk that a material weakness exists, and testing and evaluating the design and operating effectiveness of internal control based on the assessed risk. Our audit also included performing such other procedures as we considered necessary in the circumstances. We believe that our audit provides a reasonable basis for our opinion.
Definition and Limitations of Internal Control Over Financial Reporting
A company’s internal control over financial reporting is a process designed to provide reasonable assurance regarding the reliability of financial reporting and the preparation of financial statements for external purposes in accordance with generally accepted accounting principles. A company’s internal control over financial reporting includes those policies and procedures that (1) pertain to the maintenance of records that, in reasonable detail, accurately and fairly reflect the transactions and dispositions of the assets of the company; (2) provide reasonable assurance that transactions are recorded as necessary to permit preparation of financial statements in accordance with generally accepted accounting principles, and that receipts and expenditures of the company are being made only in accordance with authorizations of management and directors of the company; and (3) provide reasonable assurance regarding prevention or timely detection of unauthorized acquisition, use, or disposition of the company’s assets that could have a material effect on the financial statements.
112
Table of Contents
Because of its inherent limitations, internal control over financial reporting may not prevent or detect misstatements. Also, projections of any evaluation of effectiveness to future periods are subject to the risk that controls may become inadequate because of changes in conditions, or that the degree of compliance with the policies or procedures may deteriorate.
/s/ KPMG Huazhen LLP
Guangzhou, China
April 27, 2023
Changes in internal control over financial reporting
During the year ended December 31, 2022, there has been no changes in our internal control over financial reporting that have materially affected, or are reasonably likely to materially affect, our internal control over financial reporting.
ITEM 16A. AUDIT AND RISK MANAGEMENT COMMITTEE FINANCIAL EXPERT
Our Board has determined that Mr. Cai Hongping qualifies as an audit and risk management committee financial expert in accordance with the terms of Item 16A of Form 20-F. Mr. Cai Hongping satisfies as an “independent director” within the meaning of NYSE Manual Section 303A and meets the criteria for independence set forth in Section 10A(m)(3) of the U.S. Securities Exchange Act of 1934, as amended, or the Exchange Act, and Rule 10A-3 under the Exchange Act. See “Item 6. Directors, Senior Management and Employees”.
ITEM 16B. CODE OF ETHICS
We have adopted a code of ethics that applies to our principal executive officer, principal financial officer and principal accounting officer. The code of ethics is filed as Exhibit 11.1 to this Annual Report, and a copy of which will be provided to any person free of charge upon written request to Chen Weihua, Company Secretary, China Southern Airlines Company Limited at 68 Qi Xin Road, Guangzhou 510403, the People’s Republic of China.
ITEM 16C. PRINCIPAL ACCOUNTANT FEES AND SERVICES
KPMG Huazhen LLP, an independent registered public accounting firm, served as our principal accountant for the fiscal years ended December 31, 2021 and 2022. The following table sets forth the aggregate audit fees, audit-related fees, tax fees and other fees of our principal accountants for each of the fiscal years of 2021 and 2022:
| Audit Fees | Audit-Related Fees |
Tax Fees | Other Fees | |||||
| RMB (in million) | RMB (in million) | RMB (in million) | RMB (in million) | |||||
| 2021 |
13.7 | — | 1.1 | — | ||||
| 2022 |
14.7 | 0.8 | 0.1 | — |
Audit fees (VAT tax inclusive) include the aggregate fees in each of the fiscal years listed for professional services rendered by our independent registered public accounting firm for the audit of our annual financial statements or services that are normally provided by the auditors in connection with and regulatory filing or engagements.
Audit-related fees (VAT tax inclusive) represent the fees relating to circular services.
113
Table of Contents
Tax fees (VAT tax inclusive) consisted of fees for tax consultation and tax compliance services.
Our audit and risk management committee pre-approved all audit and non-audit services performed by our principal accountant for the fiscal years ended December 31, 2021 and 2022.
ITEM 16D. EXEMPTIONS FROM THE LISTING STANDARDS FOR AUDIT AND RISK MANAGEMENT COMMITTEE
Not applicable.
ITEM 16E. PURCHASES OF EQUITY SECURITIES BY THE ISSUER AND AFFILIATED PURCHASERS
None.
ITEM 16F. CHANGE IN REGISTRANT’S CERTIFYING ACCOUNTANT
Not applicable.
ITEM 16G. CORPORATE GOVERNANCE
Not applicable.
ITEM 16H. MINE SAFETY DISCLOSURE
Not applicable.
ITEM 16I. DISCLOSURE REGARDING FOREIGN JURISDICTIONS THAT PREVENT INSPECTIONS
For the fiscal years ended December 31, 2021 and 2022, KPMG Huazhen LLP served as our principal accountant, and issued audit reports on our consolidated financial statements.
On December 16, 2021, the PCAOB issued a report on its determinations that it was unable to inspect or investigate completely PCAOB-registered public accounting firms headquartered in mainland China and Hong Kong because of positions taken by PRC authorities in those jurisdictions (“PCAOB-Identified Firm”). KPMG Huazhen LLP is an independent public accounting firm registered with the PCAOB that is headquartered in mainland China, and was therefore a PCAOB-Identified Firm under the PCAOB 2021 determinations. As a result, in May 2022, we were conclusively listed by the SEC as a Commission-Identified Issuer under the HFCAA following the filing of our annual report on Form 20-F for the fiscal year ended December 31, 2021.
On December 15, 2022, the PCAOB determined that it was able to inspect and investigate completely registered public accounting firms headquartered in mainland China and Hong Kong in 2022, and vacated its previous 2021 determinations to the contrary. Accordingly, KPMG Huazhen LLP is no longer a PCAOB-Identified Firm under the latest PCAOB determination.
Chinese governmental entities, through their wholly-owned entity CSAH, indirectly held and exercised the rights of ownership of 66.52% of our equity stake as of March 31, 2023. Chinese governmental entities have a controlling financial interest with respect to us.
114
Table of Contents
The following list sets forth our current directors who are members of the Chinese Communist Party as of March 31, 2023.
| Name | Position | |
| Ma Xulun Han Wensheng |
Chairman of the Board Executive Director, Vice Chairman of the Board, President | |
| Luo Laijun | Executive Director | |
| Gu Huizhong | Independent Non-executive Director | |
| Guo Wei | Independent Non-executive Director |
Our articles of association contains the following provisions regarding the Chinese Communist Party:
| Article | Provisions | |
| 16 | According to the Constitution of the Communist Party of China, the Company shall establish an organization of the Communist Party of China. The Party committee shall perform the core leading and political functions, control the directions, manage the situation and ensure the implementation. The Company shall set up the working organs of the Party, which shall be equipped with sufficient personnel to handle Party affairs and provided with sufficient funds to operate the Party organization. | |
| 163 | Prior to making decisions on material issues of the Company, the Board shall first seek advice from the Party Committee of the Company. | |
| 256 | The Company shall establish the Party Committee consisting of one secretary and several other members. The chairman of the Board of Directors and the secretary of the Party Committee shall be assumed by the same person in principle and the Party Committee shall set up a special position of deputy secretary who mainly takes in charge of the work of Party’s building. Eligible members of the Party Committee may join the Board of Directors, the Supervisory Committee and the management through legal procedures, and eligible Party members in the Board of Directors, the Supervisory Committee and the management may join the Party Committee in accordance with relevant regulations and procedures. Meanwhile, the Company shall establish the Discipline Committee in accordance with relevant regulations. | |
| 257 | The Party Committee of the Company shall perform its duties in accordance with the regulations of the Party including the Constitution of Communist Party of China (《中国共产党章程》) and Regulations for the Work of the Communist Party of China (《中国共产党党委工作条例》).
(1) To monitor the implementation of the principles and policies of the Party and of the country within the Company, and to implement material strategic decisions made by the Central Committee of the Party and the State Council, as well as other important deployment of works assigned by the Party committee of the State-owned Assets Supervision and Administration Commission and Party organizations of higher levels.
(2) To persist in combining the principle of administration of officers by the Party with the legitimate selection by the Board of the managers and the legitimate use of human resources by the managers. The Party Committee shall consider and provide opinions on the candidates nominated by the Board of Directors or the general manager, or recommend nominees to the Board of Directors or the general manager; evaluate the proposed candidates in conjunction with the Board of Directors, collectively consider and make suggestions. | |
| (3) To consider and discuss the matters on the reform, development and stability of the Company, major operation and management matters as well as key issues involving the vital interests of employees, and make suggestions.
(4) To take full responsibility for the strict discipline of the Party. To take the lead on the ideological and political work, united front work, construction of spiritual civilization, construction of enterprise culture and the work of the trade union and the Communist Youth League and other mass groups and organizations. To take the lead on improving Party conduct and upholding integrity and to support the performance by the Discipline Committee of its supervision duties. | ||
115
Table of Contents
| ITEM 17. | FINANCIAL STATEMENTS |
We have elected to provide the financial statements and related information specified in Item 18 in lieu of Item 17.
| ITEM 18. | FINANCIAL STATEMENTS |
See F-pages following Item 19.
| ITEM 19. | EXHIBITS |
116
Table of Contents
117
Table of Contents
118
Table of Contents
119
Table of Contents
| 101. INS |
Inline XBRL Instance Document | |
| 101. SCH |
Inline XBRL Taxonomy Extension Schema Document | |
| 101. CAL |
Inline XBRL Taxonomy Extension Calculation Linkbase Document | |
| 101. DEF |
Inline XBRL Taxonomy Extension Definition Linkbase Document | |
| 101. LAB |
Inline XBRL Taxonomy Extension Labels Linkbase Document | |
| 101. PRE |
Inline XBRL Taxonomy Extension Presentation Linkbase Document | |
| 104 |
Cover Page Interactive Data File (formatted as inline XBRL and contained in Exhibit 101) | |
| * | Portions of this document have been omitted pursuant to a confidential treatment request, and the full, unredacted document has been separately submitted to the Securities and Exchange Commission with a confidential treatment request. | |
| ** | Portions of this document have been omitted because they are both not material and are the type that we treat as private or confidential. | |
| (1) | Incorporated by reference to the Exhibit 2.1 to our Form 20-F (File No. 001-14660) for the year ended December 31, 2012 filed with the Securities and Exchange Commission on April 26, 2013. | |
| (2) | Incorporated by reference to our Registration Statement on Form F-6 (File No. 333-07116), filed with the Securities and Exchange Commission on August 7, 2012. | |
| (3) | Incorporated by reference to the Exhibit 4.1 to our Form 20-F (File No. 001-14660) for the year ended December 31, 2005 filed with the Securities and Exchange Commission on June 30, 2006. | |
| (4) | Incorporated by reference to the Exhibit 4.2 to our Form 20-F (File No. 001-14660) for the year ended December 31, 2005 filed with the Securities and Exchange Commission on June 30, 2006. | |
| (5) | Incorporated by reference to the Exhibit 4.4 to our Form 20-F (File No. 001-14660) for the year ended December 31, 2012 filed with the Securities and Exchange Commission on April 26, 2013. | |
| (6) | Incorporated by reference to the Exhibit 4.6 to our Form 20-F (File No. 001-14660) for the year ended December 31, 2015 filed with the Securities and Exchange Commission on April 28, 2016. | |
| (7) | Incorporated by reference to the Exhibit 4.7 to our Form 20-F (File No. 001-14660) for the year ended December 31, 2015 filed with the Securities and Exchange Commission on April 28, 2016. | |
| (8) | Incorporated by reference to the Exhibit 4.8 to our Form 20-F (File No. 001-14660) for the year ended December 31, 2015 filed with the Securities and Exchange Commission on April 28, 2016. | |
| (9) | Incorporated by reference to the Exhibit 4.9 to our Form 20-F (File No. 001-14660) for the year ended December 31, 2015 filed with the Securities and Exchange Commission on April 28, 2016. | |
| (10) | Incorporated by reference to the Exhibit 4.11 to our Form 20-F (File No. 001-14660) for the year ended December 31, 2013 filed with the Securities and Exchange Commission on April 25, 2014. | |
| (11) | Incorporated by reference to the Exhibit 4.10 to our Form 20-F (File No. 001-14660) for the year ended December 31, 2008 filed with the Securities and Exchange Commission on June 25, 2009. | |
| (12) | Incorporated by reference to the Exhibit 4.11 to our Form 20-F (File No. 001-14660) for the year ended December 31, 2012 filed with the Securities and Exchange Commission on April 26, 2013. | |
| (13) | Incorporated by reference to the Exhibit 4.23 to our Form 20-F (File No. 001-14660) for the year ended December 31, 2014 filed with the Securities and Exchange Commission on April 30, 2015. | |
| (14) | Incorporated by reference to the Exhibit 4.35 to our Form 20-F (File No. 001-14660) for the year ended December 31, 2016 filed with the Securities and Exchange Commission on April 27, 2017. | |
| (15) | Incorporated by reference to the Exhibit 4.36 to our Form 20-F (File No. 001-14660) for the year ended December 31, 2016 filed with the Securities and Exchange Commission on April 27, 2017. | |
| (16) | Incorporated by reference to the Exhibit 4.37 to our Form 20-F (File No. 001-14660) for the year ended December 31, 2016 filed with the Securities and Exchange Commission on April 27, 2017. |
120
Table of Contents
| (17) | Incorporated by reference to the Exhibit 4.38 to our Form 20-F (File No. 001-14660) for the year ended December 31, 2016 filed with the Securities and Exchange Commission on April 27, 2017. | |
| (18) | Incorporated by reference to the Exhibit 4.39 to our Form 20-F (File No. 001-14660) for the year ended December 31, 2016 filed with the Securities and Exchange Commission on April 27, 2017. | |
| (19) | Incorporated by reference to the Exhibit 4.40 to our Form 20-F (File No. 001-14660) for the year ended December 31, 2016 filed with the Securities and Exchange Commission on April 27, 2017. | |
| (20) | Incorporated by reference to the Exhibit 4.41 to our Form 20-F (File No. 001-14660) for the year ended December 31, 2016 filed with the Securities and Exchange Commission on April 27, 2017. | |
| (21) | Incorporated by reference to the Exhibit 4.42 to our Form 20-F (File No. 001-14660) for the year ended December 31, 2016 filed with the Securities and Exchange Commission on April 27, 2017. | |
| (22) | Incorporated by reference to the Exhibit 4.43 to our Form 20-F (File No. 001-14660) for the year ended December 31, 2017 filed with the Securities and Exchange Commission on April 26, 2018. | |
| (23) | Incorporated by reference to the Exhibit 4.44 to our Form 20-F (File No. 001-14660) for the year ended December 31, 2017 filed with the Securities and Exchange Commission on April 26, 2018. | |
| (24) | Incorporated by reference to the Exhibit 4.45 to our Form 20-F (File No. 001-14660) for the year ended December 31, 2017 filed with the Securities and Exchange Commission on April 26, 2018. | |
| (25) | Incorporated by reference to the Exhibit 4.46 to our Form 20-F (File No. 001-14660) for the year ended December 31, 2017 filed with the Securities and Exchange Commission on April 26, 2018. | |
| (26) | Incorporated by reference to the Exhibit 4.47 to our Form 20-F (File No. 001-14660) for the year ended December 31, 2017 filed with the Securities and Exchange Commission on April 26, 2018. | |
| (27) | Incorporated by reference to the Exhibit 4.49 to our Form 20-F (File No. 001-14660) for the year ended December 31, 2017 filed with the Securities and Exchange Commission on April 26, 2018. | |
| (28) | Incorporated by reference to the Exhibit 4.29 to our Form 20-F (File No. 001-14660) for the year ended December 31, 2017 filed with the Securities and Exchange Commission on April 26, 2019. | |
| (29) | Incorporated by reference to the Exhibit 4.31 to our Form 20-F (File No. 001-14660) for the year ended December 31, 2018 filed with the Securities and Exchange Commission on April 26, 2019. | |
| (30) | Incorporated by reference to the Exhibit 4.32 to our Form 20-F (File No. 001-14660) for the year ended December 31, 2018 filed with the Securities and Exchange Commission on April 26, 2019. | |
| (31) | Incorporated by reference to the Exhibit 4.33 to our Form 20-F (File No. 001-14660) for the year ended December 31, 2018 filed with the Securities and Exchange Commission on April 26, 2019. | |
| (32) | Incorporated by reference to the Exhibit 4.34 to our Form 20-F (File No. 001-14660) for the year ended December 31, 2018 filed with the Securities and Exchange Commission on April 26, 2019. | |
| (33) | Incorporated by reference to the Exhibit 4.35 to our Form 20-F (File No. 001-14660) for the year ended December 31, 2018 filed with the Securities and Exchange Commission on April 26, 2019. | |
| (34) | Incorporated by reference to the Exhibit 4.34 to our Form 20-F (File No. 001-14660) for the year ended December 31, 2019 filed with the Securities and Exchange Commission on April 28, 2020. | |
| (35) | Incorporated by reference to the Exhibit 4.35 to our Form 20-F (File No. 001-14660) for the year ended December 31, 2019 filed with the Securities and Exchange Commission on April 28, 2020. | |
| (36) | Incorporated by reference to the Exhibit 4.36 to our Form 20-F (File No. 001-14660) for the year ended December 31, 2019 filed with the Securities and Exchange Commission on April 28, 2020. | |
| (37) | Incorporated by reference to the Exhibit 4.37 to our Form 20-F (File No. 001-14660) for the year ended December 31, 2019 filed with the Securities and Exchange Commission on April 28, 2020. | |
| (38) | Incorporated by reference to the Exhibit 4.38 to our Form 20-F (File No. 001-14660) for the year ended December 31, 2019 filed with the Securities and Exchange Commission on April 28, 2020. | |
| (39) | Incorporated by reference to the Exhibit 4.39 to our Form 20-F (File No. 001-14660) for the year ended December 31, 2019 filed with the Securities and Exchange Commission on April 28, 2020. | |
| (40) | Incorporated by reference to the Exhibit 4.40 to our Form 20-F (File No. 001-14660) for the year ended December 31, 2019 filed with the Securities and Exchange Commission on April 28, 2020. | |
| (41) | Incorporated by reference to the Exhibit 4.41 to our Form 20-F (File No. 001-14660) for the year ended December 31, 2019 filed with the Securities and Exchange Commission on April 28, 2020. | |
| (42) | Incorporated by reference to the Exhibit 4.42 to our Form 20-F (File No. 001-14660) for the year ended December 31, 2019 filed with the Securities and Exchange Commission on April 28, 2020. | |
| (43) | Incorporated by reference to the Exhibit 4.43 to our Form 20-F (File No. 001-14660) for the year ended December 31, 2019 filed with the Securities and Exchange Commission on April 28, 2020. | |
| (44) | Incorporated by reference to the Exhibit 4.42 to our Form 20-F (File No. 001-14660) for the year ended December 31, 2020 filed with the Securities and Exchange Commission on April 28, 2021. |
121
Table of Contents
| (45) | Incorporated by reference to the Exhibit 4.43 to our Form 20-F (File No. 001-14660) for the year ended December 31, 2020 filed with the Securities and Exchange Commission on April 28, 2021. | |
| (46) | Incorporated by reference to the Exhibit 4.44 to our Form 20-F (File No. 001-14660) for the year ended December 31, 2020 filed with the Securities and Exchange Commission on April 28, 2021. | |
| (47) | Incorporated by reference to the Exhibit 4.45 to our Form 20-F (File No. 001-14660) for the year ended December 31, 2021 filed with the Securities and Exchange Commission on April 28, 2022. | |
| (48) | Incorporated by reference to the Exhibit 4.46 to our Form 20-F (File No. 001-14660) for the year ended December 31, 2021 filed with the Securities and Exchange Commission on April 28, 2022. | |
| (49) | Incorporated by reference to the Exhibit 4.47 to our Form 20-F (File No. 001-14660) for the year ended December 31, 2021 filed with the Securities and Exchange Commission on April 28, 2022. | |
| (50) | Incorporated by reference to the Exhibit 4.48 to our Form 20-F (File No. 001-14660) for the year ended December 31, 2021 filed with the Securities and Exchange Commission on April 28, 2022. | |
| (51) | Incorporated by reference to the Exhibit 4.49 to our Form 20-F (File No. 001-14660) for the year ended December 31, 2021 filed with the Securities and Exchange Commission on April 28, 2022. | |
| (52) | Incorporated by reference to the Exhibit 11.1 to our Form 20-F (File No. 001-14660) for the year ended December 31, 2019 filed with the Securities and Exchange Commission on April 28, 2020. |
122
Table of Contents
SIGNATURES
The registrant hereby certifies that it meets all of the requirements for filing on Form 20-F and that it has duly caused and authorized the undersigned to sign this Annual Report on its behalf.
| CHINA SOUTHERN AIRLINES COMPANY LIMITED | ||||
| /s/ Ma Xulun | ||||
| Name: | Ma Xulun | |||
| Title: | Chairman of the Board and Executive Director | |||
Date: April 27, 2023
123
Table of Contents
| Page | ||||
| F-2 | ||||
| F-5 | ||||
| F-6 | ||||
| F-7 | ||||
| F-9 | ||||
| F-10 | ||||
| F-11 | ||||
/s/ |
We have served as the Company’s auditor since 2016. |
April 27, 2023 |
2022 |
2021 |
2020 |
||||||||||||
Note |
RMB million |
RMB million |
RMB million |
|||||||||||
Operating revenue |
5 |
|||||||||||||
Traffic revenue |
||||||||||||||
Other operating revenue |
||||||||||||||
Total operating revenue |
||||||||||||||
Operating expenses |
||||||||||||||
Flight operation expenses |
7 | |||||||||||||
Maintenance expenses |
8 | |||||||||||||
Aircraft and transportation service expenses |
9 | |||||||||||||
Promotion and selling expenses |
10 | |||||||||||||
General and administrative expenses |
11 | |||||||||||||
Depreciation and amortization |
12 | |||||||||||||
Impairment losses on property, plant and equipment, right-of-use |
19/21/30 | |||||||||||||
Others |
||||||||||||||
Total operating expenses |
||||||||||||||
Other net income |
14 | |||||||||||||
Operating losses |
( |
) | ( |
) | ( |
) | ||||||||
Interest income |
||||||||||||||
Interest expense |
15 | ( |
) | ( |
) | ( |
) | |||||||
Exchange (loss)/ gain, net |
37 | ( |
) | |||||||||||
Share of associates’ results |
24 | ( |
) | ( |
) | |||||||||
Share of joint ventures’ results |
25 | |||||||||||||
Changes in fair value of financial assets / liabilities |
28 | ( |
) | ( |
) | |||||||||
Gain/(loss) on disposal of subsidiaries |
23 | ( |
) | |||||||||||
Gain on disposal of associates |
24 | |||||||||||||
Loss before income tax |
( |
) | ( |
) | ( |
) | ||||||||
Income tax |
16 | ( |
) | |||||||||||
Loss for the year |
( |
) | ( |
) | ( |
) | ||||||||
Loss attributable to: |
||||||||||||||
Equity shareholders of the Company |
18 | ( |
) | ( |
) | ( |
) | |||||||
Non-controlling interests |
( |
) | ( |
) | ||||||||||
Loss for the year |
( |
) | ( |
) | ( |
) | ||||||||
Loss per share |
||||||||||||||
Basic and diluted (expressed in RMB per share) |
18 | ( |
) | ( |
) | ( |
) | |||||||
2022 |
2021 |
2020 |
||||||||||||
Note |
RMB million |
RMB million |
RMB million |
|||||||||||
| Loss for the year |
( |
) | ( |
) | ( |
) | ||||||||
| |
|
|
|
|
|
|||||||||
| Other comprehensive income: |
17 | |||||||||||||
| Items that will not be reclassified to profit or loss |
||||||||||||||
| - Equity investments at fair value through other comprehensive income – net movement in fair value reserve (non-recycling) |
( |
) | ( |
) | ||||||||||
| - Share of other comprehensive income of an associate |
— | ( |
) | ( |
) | |||||||||
| - Income tax effect of the above items |
( |
) | ||||||||||||
| Items that are or may be reclassified subsequently to profit or loss |
||||||||||||||
| - Cash flow hedge: fair value movement of derivative financial instrument |
— | ( |
) | |||||||||||
| - Differences resulting from the translation of foreign currency financial statements |
— | |||||||||||||
| - Share of other comprehensive income of an associate |
— | ( |
) | |||||||||||
| - Income tax effect of the above items |
— | ( |
) | |||||||||||
| |
|
|
|
|
|
|||||||||
| Other comprehensive income for the year |
( |
) | ( |
) | ||||||||||
| |
|
|
|
|
|
|||||||||
| Total comprehensive income for the year |
( |
) | ( |
) | ( |
) | ||||||||
| |
|
|
|
|
|
|||||||||
| Total comprehensive income attributable to: |
||||||||||||||
| Equity shareholders of the Company |
( |
) | ( |
) | ( |
) | ||||||||
| Non-controlling interests |
( |
) | ( |
) | ||||||||||
| |
|
|
|
|
|
|||||||||
| Total comprehensive income for the year |
( |
) | ( |
) | ( |
) | ||||||||
| |
|
|
|
|
|
|||||||||
December 31 |
December 31 |
|||||||||
2022 |
2021 |
|||||||||
Note |
RMB million |
RMB million |
||||||||
Non-current assets |
||||||||||
Property, plant and equipment, net |
19 | |||||||||
Construction in progress |
20 | |||||||||
Right-of-use |
21 | |||||||||
Goodwill |
22 | |||||||||
Interest in associates |
24 | |||||||||
Interest in joint ventures |
25 | |||||||||
Aircraft lease deposits |
||||||||||
Other equity instrument investments |
26 | |||||||||
Other non-current financial assets |
26 | |||||||||
Derivative financial assets |
27 | |||||||||
Amounts due from related companies |
42 | |||||||||
Deferred tax assets |
29(b) | |||||||||
Other assets |
30 | |||||||||
Current assets |
||||||||||
Inventories |
31 | |||||||||
Trade receivables |
32 | |||||||||
Other receivables |
33 | |||||||||
Cash and cash equivalents |
34 | |||||||||
Assets held for sale |
35 | |||||||||
Restricted bank deposits |
||||||||||
Prepaid expenses and other current assets |
||||||||||
Derivative financial assets |
27 | |||||||||
Amounts due from related companies |
42 | |||||||||
Current liabilities |
||||||||||
Derivative financial liabilities |
27 | |||||||||
Borrowings |
36 | |||||||||
Lease liabilities |
37 | |||||||||
Trade payables |
38 | |||||||||
Contract liabilities |
39 | |||||||||
Sales in advance of carriage |
40 | |||||||||
Current income tax |
||||||||||
Amounts due to related companies |
42 | |||||||||
Accrued expenses |
43 | |||||||||
Other liabilities |
44 | |||||||||
December 31 |
December 31 |
|||||||||||
2022 |
2021 |
|||||||||||
Note |
RMB million |
RMB million |
||||||||||
Non-current liabilities |
||||||||||||
Borrowings |
36 | |||||||||||
Lease liabilities |
37 | |||||||||||
Derivative financial liabilities |
27 | |||||||||||
Other non-current liabilities |
41 | |||||||||||
Amounts due to related companies |
42 |
|||||||||||
Provision for major overhauls |
45 | |||||||||||
Deferred benefits and gains |
46 | |||||||||||
Deferred tax liabilities |
29(b) | |||||||||||
Net assets |
||||||||||||
Capital and reserves |
||||||||||||
Share capital |
47 | |||||||||||
Reserves |
||||||||||||
Total equity attributable to equity shareholders of the Company |
||||||||||||
Non-controlling interests |
||||||||||||
Total equity |
||||||||||||
Ma Xu Lun |
Han Wen Sheng | |||
| Director | Director |
| Attributable to equity shareholders of the Company | ||||||||||||||||||||||||||||||||||||
| Share capital |
Share premium |
Fair value reserve (recycling) |
Fair value reserve (non-recycling) |
Other reserves |
Retained earnings/ (accumulated losses) |
Total | Non- controlling interests |
Total equity |
||||||||||||||||||||||||||||
| (Note 47) | (Note 48(b)) | (Note 48(c)) | (Note 48(d)) | |||||||||||||||||||||||||||||||||
| RMB | RMB | RMB | RMB | RMB | RMB | RMB | RMB | RMB | ||||||||||||||||||||||||||||
| million | million | million | million | million | million | million | million | million | ||||||||||||||||||||||||||||
| Balance at January 1, 2020 |
||||||||||||||||||||||||||||||||||||
| Changes in equity for 2020 |
||||||||||||||||||||||||||||||||||||
| Loss for the year |
— | — | — | — | — | ( |
) | ( |
) | ( |
) | ( |
) | |||||||||||||||||||||||
| Other comprehensive income |
— | — | ( |
) | ( |
) | — | ( |
) | ( |
) | ( |
) | |||||||||||||||||||||||
| Total comprehensive income |
— | — | ( |
) | ( |
) | ( |
) | ( |
) | ( |
) | ( |
) | ||||||||||||||||||||||
| Issuance of shares |
— | — | — | — | — | |||||||||||||||||||||||||||||||
| Acquisition of non-controlling interests in a subsidiary (Note23(vi)) |
— | — | — | — | ( |
) | — | ( |
) | ( |
) | ( |
) | |||||||||||||||||||||||
| Capital injection from non-controlling interests |
— | — | — | — | — | |||||||||||||||||||||||||||||||
| Distributions to non-controlling interests |
— | — | — | — | — | — | — | ( |
) | ( |
) | |||||||||||||||||||||||||
| Decrease in non-controlling interests as a result of loss of control of a subsidiary |
— | — | — | — | — | — | — | ( |
) | ( |
) | |||||||||||||||||||||||||
| Change in other reserves |
— | — | — | — | ( |
) | — | ( |
) | — | ( |
) | ||||||||||||||||||||||||
| |
|
|
|
|
|
|
|
|
|
|
|
|
|
|
|
|
|
|||||||||||||||||||
| Balance at December 31, 2020 and January 1, 2021 |
( |
) |
||||||||||||||||||||||||||||||||||
| |
|
|
|
|
|
|
|
|
|
|
|
|
|
|
|
|
|
|||||||||||||||||||
| Changes in equity for 2021 |
||||||||||||||||||||||||||||||||||||
| Loss for the year |
— | — | — | — | — | ( |
) | ( |
) | ( |
) | |||||||||||||||||||||||||
| Other comprehensive income |
— | — | ( |
) | — | — | ( |
) | ( |
) | ( |
) | ||||||||||||||||||||||||
| Total comprehensive income |
— | — | ( |
) | — | ( |
) | ( |
) | ( |
) | |||||||||||||||||||||||||
| |
|
|
|
|
|
|
|
|
|
|
|
|
|
|
|
|
|
|||||||||||||||||||
| Distributions to non-controlling interests |
— | — | — | — | — | — | — | ( |
) | ( |
) | |||||||||||||||||||||||||
| Conversion of convertible bonds to ordinary shares |
— | — | — | — | — | |||||||||||||||||||||||||||||||
| Capital injection from non-controlling interests |
— | — | — | — | — | — | — | |||||||||||||||||||||||||||||
| Decrease in non-controlling interests as a result of liquidation of a subsidiary |
— | — | — | — | — | — | — | ( |
) | ( |
) | |||||||||||||||||||||||||
| |
|
|
|
|
|
|
|
|
|
|
|
|
|
|
|
|
|
|||||||||||||||||||
| Balance at December 31, 2021 and January 1, 2022 |
— |
( |
) |
|||||||||||||||||||||||||||||||||
| |
|
|
|
|
|
|
|
|
|
|
|
|
|
|
|
|
|
|||||||||||||||||||
| Changes in equity for 2022 |
||||||||||||||||||||||||||||||||||||
| Loss for the year |
— | — | — | — | — | ( |
) | ( |
) | ( |
) | ( |
) | |||||||||||||||||||||||
| Other comprehensive income |
— | — | — | — | ||||||||||||||||||||||||||||||||
| Total comprehensive income |
— | — | — | ( |
) | ( |
) | ( |
) | ( |
) | |||||||||||||||||||||||||
| |
|
|
|
|
|
|
|
|
|
|
|
|
|
|
|
|
|
|||||||||||||||||||
| Distributions to non-controlling interests |
— | — | — | — | — | — | — | ( |
) | ( |
) | |||||||||||||||||||||||||
| |
|
|
|
|
|
|
|
|
|
|
|
|
|
|
|
|
|
|||||||||||||||||||
| Issuance of shares(Note 47(ii) & (iii) ) |
— | — | — | — | — | |||||||||||||||||||||||||||||||
| Capital injection from non-controlling interests |
— | — | — | — | — | |||||||||||||||||||||||||||||||
| Decrease in non-controlling interests as a result of disposal of subsidiaries |
— | — | — | — | — | — | — | ( |
) | ( |
) | |||||||||||||||||||||||||
| Disposal of an equity instrument investment |
— | — | — | — | ( |
) | — | — | — | |||||||||||||||||||||||||||
| |
|
|
|
|
|
|
|
|
|
|
|
|
|
|
|
|
|
|||||||||||||||||||
| Balance at December 31, 2022 |
— |
( |
) |
|||||||||||||||||||||||||||||||||
| |
|
|
|
|
|
|
|
|
|
|
|
|
|
|
|
|
|
|||||||||||||||||||
2022 |
2021 |
2020 |
||||||||||||
Note |
RMB million |
RMB million |
RMB million |
|||||||||||
Operating activities |
||||||||||||||
Cash generated from operating activities |
34(b) | |||||||||||||
Interest received |
||||||||||||||
Interest paid |
( |
) | ( |
) | ( |
) | ||||||||
Income tax paid |
( |
) | ( |
) | ( |
) | ||||||||
Net cash (used in)/ generated from operating activities |
( |
) | ||||||||||||
Investing activities |
||||||||||||||
Proceeds from disposal of property, plant and equipment and right-of-use |
||||||||||||||
Dividends received from associates |
||||||||||||||
Dividends received from joint ventures |
||||||||||||||
Dividends received from other equity instrument investments and other non-current financial assets |
||||||||||||||
Acquisition of term deposits |
( |
) | ( |
) | ( |
) | ||||||||
Proceeds from maturity of term deposits |
||||||||||||||
Acquisition of property, plant and equipment and other assets |
( |
) | ( |
) | ( |
) | ||||||||
Acquisition of an associate |
— | ( |
) | — | ||||||||||
Proceeds from disposal of subsidiaries |
— | — | ||||||||||||
Proceeds from disposal of associates |
— | — | ||||||||||||
Proceeds from disposal of other equity instrument investments and other non-current financial assets |
— | — | ||||||||||||
Proceeds from disposal of derivative financial instruments |
— | — | ||||||||||||
Net cash used in investing activities |
( |
) | ( |
) | ( |
) | ||||||||
Financing activities |
||||||||||||||
Proceeds from issuance of shares |
— | |||||||||||||
Proceeds from bank borrowings |
34(c) | |||||||||||||
Proceeds from ultra-short-term financing bills |
34(c) | |||||||||||||
Proceeds from corporate bond s |
34(c) |
|||||||||||||
Repayment of bank borrowings |
34(c) | ( |
) | ( |
) | ( |
) | |||||||
Repayment of ultra-short-term financing bills |
34(c) | ( |
) | ( |
) | ( |
) | |||||||
Repayment of corporate bonds |
34(c) | ( |
) | ( |
) | ( |
) | |||||||
Capital element of lease rentals paid |
34(c) | ( |
) | ( |
) | ( |
) | |||||||
Capital injections from non-controlling interests |
||||||||||||||
Payment for purchase of non-controlling interest |
— | — | ( |
) | ||||||||||
Refund of aircraft lease deposits |
||||||||||||||
Payments for aircraft lease deposits |
( |
) | ( |
) | — | |||||||||
Dividends paid to non-controlling interests |
( |
) | ( |
) | ( |
) | ||||||||
Net cash generated from financing activities |
||||||||||||||
Net (decrease)/ increase in cash and cash equivalents |
( |
) | ( |
) | ||||||||||
Cash and cash equivalents at January 1 |
||||||||||||||
Exchange gain/(loss) on cash and cash equivalents |
( |
) | ( |
) | ||||||||||
Cash and cash equivalents at December 31 |
34(a) | |||||||||||||
1 |
Corporate information |
2 |
Significant accounting policies |
(a) |
Basis of preparation |
| • | other equity instrument investments (see Note 2(f)); |
| • | other non-current financial assets (FVPL) (see Note 2(f)); and |
| • | derivative financial assets / liabilities (see Note 2(g)). |
2 |
Significant accounting policies (continued) |
(a) |
Basis of preparation (continued) |
(b) |
Changes in accounting policies |
(A) |
Amendments to IFRSs that are first effective for the year ended December 31, 2022 |
| • | Amendments to IAS 16 , Property, plant and equipment: Proceeds before intended use |
| • | Amendments to IAS 37, Provisions, contingent liabilities and contingent assets: Onerous contracts — cost of fulfilling a contract |
2 |
Significant accounting policies (continued) |
(b) |
Changes in accounting policies (continued) |
(B) |
Amendments to IFRSs that are first effective for the year ended December 31, 2021 |
| • | Amendments to IFRS 9, IAS 39, IFRS 7, IFRS 4 and IFRS 16, Interest rate benchmark reform — phase 2 |
| • | Amendment to IFRS 16, Covid-19-related |
2 |
Significant accounting policies (continued) |
(c) |
Subsidiaries and non-controlling interests |
2 |
Significant accounting policies (continued) |
(d) |
Associates and joint arrangements |
2 |
Significant accounting policies (continued) |
(e) |
Goodwill |
| (i) | the aggregate of the fair value of the consideration transferred, the amount of any non-controlling interest in the acquiree and the fair value of the Group’s previously held equity interest in the acquiree; over |
| (ii) | the net fair value of the acquiree’s identifiable assets and liabilities measured as at the acquisition date. |
(f) |
Other investments in debt and equity securities |
| (i) | Investments other than equity investments |
| • | amortized cost, if the investment is held for the collection of contractual cash flows which represent solely payments of principal and interest. Interest income from the investment is calculated using the effective interest method (Note 2(z)(ii)(c)). |
| • | fair value through other comprehensive income (FVOCI) - recycling, if the contractual cash flows of the investment comprise solely payments of principal and interest and the investment is held within a business model whose objective is achieved by both the collection of contractual cash flows and sale. Changes in fair value are recognized in other comprehensive income, except for the recognition in profit or loss of expected credit losses, interest income (calculated using the effective interest method) and foreign exchange gains and losses. When the investment is derecognized, the amount accumulated in other comprehensive income is recycled from equity to profit or loss. |
| • | fair value at profit or loss (FVPL) if the investment does not meet the criteria for being measured at amortized cost or FVOCI (recycling). Changes in the fair value of the investment (including interest) are recognized in profit or loss. |
2 |
Significant accounting policies (continued) |
(f) |
Other investments in debt and equity securities (continued) |
| (ii) | Equity investments |
(g) |
Derivative financial instruments |
| (i) | The effective portion of any gains or losses on remeasurement of the derivative financial instruments to fair value are recognized in other comprehensive income and accumulated separately in equity in the fair value reserve. The cumulative gain or loss on the derivative financial instruments recognized in other comprehensive income is reclassified from equity to profit or loss in the same period during which the hedged forecast cash flows affects profit or loss; and |
| (ii) | The ineffective portion of any gains or losses on remeasurement of the derivative financial instruments to fair value is recognized in the profit or loss immediately. |
2 |
Significant accounting policies (continued) |
(h) |
Investment properties |
(i) |
Other property, plant and equipment |
Buildings |
||||
Owned aircraft |
||||
Other flight equipment |
||||
– Jet engines |
||||
– Others, including rotables |
||||
Machinery, equipment and vehicles |
2 |
Significant accounting policies (continued) |
(j) |
Construction in progress |
(k) |
Leased assets |
| (i) | As a lessee |
2 |
Significant accounting policies (continued) |
(k) |
Leased assets (continued) |
| (i) | As a lessee (continued) |
2 |
Significant accounting policies (continued) |
(k) |
Leased assets (continued) |
| (i) | As a lessee (continued) |
| (ii) | As a lessor |
2 |
Significant accounting policies (continued) |
(l) |
Credit losses and impairment of assets |
| (i) | Credit losses from financial instruments and lease receivables |
| • | financial assets measured at amortized cost (including cash and cash equivalents and trade and other receivables); and |
| • | lease receivables. |
| • | fixed-rate financial assets, and trade and other receivables: effective interest rate determined at initial recognition or an approximation thereof; |
| • | variable-rate financial assets: current effective interest rate; |
| • | lease receivables: discount rate used in the measurement of the lease receivable. |
| • | 12-month ECLs: these are losses that are expected to result from possible default events within the 12 months after the reporting date; and |
| • | lifetime ECLs: these are losses that are expected to result from all possible default events over the expected lives of the items to which the ECL model applies. |
2 |
Significant accounting policies (continued) |
(l) |
Credit losses and impairment of assets (continued) |
| (i) | Credit losses from financial instruments and lease receivables (continued) |
| • | failure to make payments of principal or interest on their contractually due dates; |
| • | an actual or expected significant deterioration in a financial instrument’s external or internal credit rating (if available); |
| • | an actual or expected significant deterioration in the operating results of the debtor; and |
| • | existing or forecast changes in the technological, market, economic or legal environment that have a significant adverse effect on the debtor’s ability to meet its obligation to the Group. |
2 |
Significant accounting policies (continued) |
(l) |
Credit losses and impairment of assets (continued) |
| (i) | Credit losses from financial instruments and lease receivables (continued) |
| • | significant financial difficulties of the debtor; |
| • | a breach of contract, such as a default or delinquency in interest or principal payments; |
| • | it becoming probable that the borrower will enter into bankruptcy or other financial reorganization; |
| • | significant changes in the technological, market, economic or legal environment that have an adverse effect on the debtor; or |
| • | the disappearance of an active market for a security because of financial difficulties of the issuer. |
| (ii) | Credit losses from financial guarantees issued |
2 |
Significant accounting policies (continued) |
(l) |
Credit losses and impairment of assets (continued) |
| (ii) | Credit losses from financial guarantees issued (continued) |
| (iii) | Impairment of other non-current assets |
| • | Investment properties; |
| • | Other property, plant and equipment; |
| • | Right-of-use assets; |
| • | Construction in progress; |
| • | Goodwill; |
| • | Investments in associates and joint ventures. |
| • | Calculation of recoverable amount |
| • | Recognition of impairment losses |
| • | Reversals of impairment losses |
2 |
Significant accounting policies (continued) |
(m) |
Inventories |
(n) |
Contract liabilities |
(o) |
Trade and other receivables |
2 |
Significant accounting policies (continued) |
(p) |
Interest-bearing borrowings |
(q) |
Trade and other payables |
(r) |
Non-current assets held for sale |
2 |
Significant accounting policies (continued) |
(s) |
Cash and cash equivalents |
(t) |
Provisions and contingent liabilities |
(u) |
Dividend distribution |
(v) |
Share capital |
(w) |
Deferred benefits and gains |
2 |
Significant accounting policies (continued) |
(x) |
Convertible bonds |
| (i) | Convertible bonds that contain an equity component |
| (ii) | Other convertible bonds |
2 |
Significant accounting policies (continued) |
(y) |
Income tax |
2 |
Significant accounting policies (continued) |
(y) |
Income tax (continued) |
| • | in the case of current tax assets and liabilities, the Company or the Group intends either to settle on a net basis, or to realize the asset and settle the liability simultaneously; or |
| • | in the case of deferred tax assets and liabilities, if they relate to income taxes levied by the same taxation authority on either: |
| • | the same taxable entity; or |
| • | different taxable entities, which, in each future period in which significant amounts of deferred tax liabilities or assets are expected to be settled or recovered, intend to realize the current tax assets and settle the current tax liabilities on a net basis or realize and settle simultaneously. |
(z) |
Revenue and other income |
| (i) | Revenue from contracts with customers |
| (a) | Passenger, cargo and mail revenue |
2 |
Significant accounting policies (continued) |
(z) |
Revenue and other income (continued) |
| (b) | Frequent flyer revenue |
| (ii) | Revenue from other sources and other income |
| (a) | Rental income from operating leases |
| (b) | Dividends |
| • | Dividend income from unlisted investments is recognized when the shareholder’s right to receive payment is established. |
| • | Dividend income from listed investments is recognized when the share price of the investment goes ex-dividend. |
2 |
Significant accounting policies (continued) |
(z) |
Revenue and other income (continued) |
| (c) | Interest income |
| (d) | Government grants |
2 |
Significant accounting policies (continued) |
(aa) |
Maintenance and overhaul costs |
(ab) |
Borrowing costs |
(ac) |
Employee benefits |
(i) |
Short-term employee benefits and contributions to defined contribution retirement schemes |
(ii) |
Termination benefits |
(iii) |
Retirement benefits |
2 |
Significant accounting policies (continued) |
(ad) |
Translation of foreign currencies |
(ae) |
Related parties |
| (a) | A person, or a close member of that person’s family, is related to the Group if that person: |
| (i) | has control or joint control over the Group; |
| (ii) | has significant influence over the Group; or |
| (iii) | is a member of the key management personnel of the Group or the Group’s parent. |
2 |
Significant accounting policies (continued) |
(ae) |
Related parties (continued) |
| (b) | An entity is related to the Group if any of the following conditions applies: |
| (i) | The entity and the Group are members of the same group (which means that each parent, subsidiary and fellow subsidiary is related to the others). |
| (ii) | One entity is an associate or joint venture of the other entity (or an associate or joint venture of a member of a group of which the other entity is a member). |
| (iii) | Both entities are joint ventures of the same third party. |
| (iv) | One entity is a joint venture of a third entity and the other entity is an associate of the third entity. |
| (v) | The entity is a post-employment benefit plan for the benefit of employees of either the Group or an entity related to the Group. |
| (vi) | The entity is controlled or jointly controlled by a person identified in (a). |
| (vii) | A person identified in (a)(i) has significant influence over the entity or is a member of the key management personnel of the entity (or of a parent of the entity). |
| (viii) | The entity, or any member of a group of which it is a part, provides key management personnel services to the Group or to the Group’s parent. |
(af) |
Segment reporting |
3 |
Accounting estimates and judgements |
(a) |
Impairment of long-lived assets (other than goodwill) |
(b) |
Frequent flyer revenue |
(c) |
Income tax |
3 |
Accounting estimates and judgements (continued) |
(d) |
Depreciation and amortization |
(e) |
Provision for major overhauls |
(f) |
Ticket breakage revenue |
4 |
Financial risk management and fair values of financial instruments |
(a) |
Liquidity risk |
4 |
Financial risk management and fair values of financial instruments (continued) |
(a) |
Liquidity risk (continued) |
| 2022 Contractual undiscounted cash outflow | ||||||||||||||||||||||||
Within 1 year or on demand RMB million |
More than 1 year but less than 2 years RMB million |
More than 2 years but less than 5 years RMB million |
More than 5 years RMB million |
Total RMB million |
Carrying amount at December 31 RMB million |
|||||||||||||||||||
Borrowings |
||||||||||||||||||||||||
Lease liabilities |
||||||||||||||||||||||||
Trade and other payables and accrued charges |
||||||||||||||||||||||||
Long-term payables |
||||||||||||||||||||||||
| 2021 Contractual undiscounted cash outflow | ||||||||||||||||||||||||
Within 1 year or on demand RMB million |
More than 1 year but less than 2 years RMB million |
More than 2 years but less than 5 years RMB million |
More than 5 years RMB million |
Total RMB million |
Carrying amount at December 31 RMB million |
|||||||||||||||||||
Borrowings |
||||||||||||||||||||||||
Lease liabilities |
||||||||||||||||||||||||
Trade and other payables and accrued charges |
||||||||||||||||||||||||
Long-term payables |
||||||||||||||||||||||||
4 |
Financial risk management and fair values of financial instruments (continued) |
(b) |
Interest rate risk |
(c) |
Foreign currency risk |
4 |
Financial risk management and fair values of financial instruments (continued) |
(c) |
Foreign currency risk (continued) |
2022 |
||||||||
| Appreciation/(depreciation) of Renminbi against foreign currency |
Decrease/(increase) on loss after tax and increase/(decrease) on retained earnings RMB million |
|||||||
| USD |
% | |||||||
| ( |
%) | ( |
) | |||||
| Euro |
% | |||||||
| ( |
%) | ( |
) | |||||
| Japanese Yen |
% | |||||||
| ( |
%) | ( |
) | |||||
2021 |
||||||||
| Appreciation/(depreciation) of Renminbi against foreign currency |
Decrease/(increase) on loss after tax and increase/(decrease) on retained earnings RMB million |
|||||||
| USD |
% | |||||||
| ( |
%) | ( |
) | |||||
| Euro |
% | |||||||
| ( |
%) | ( |
) | |||||
| Japanese Yen |
% | |||||||
| ( |
%) | ( |
) | |||||
2020 |
||||||||
| Appreciation/(depreciation) of Renminbi against foreign currency |
Decrease/(increase) on loss after tax and increase/(decrease) on retained earnings RMB million |
|||||||
| USD |
% | |||||||
| ( |
%) | ( |
) | |||||
| Euro |
% | |||||||
| ( |
%) | ( |
) | |||||
| Japanese Yen |
% | |||||||
| ( |
%) | ( |
) | |||||
4 |
Financial risk management and fair values of financial instruments (continued) |
(d) |
Credit risk |
| December 31, 2022 | ||||||||||||
Expected loss rates |
Gross carrying amount |
Loss allowance |
||||||||||
| % | RMB million | RMB million | ||||||||||
Within 3 months |
% | |||||||||||
More than 3 months but less than 1 year |
% | |||||||||||
More than 1 year but less than 2 years |
% | |||||||||||
More than 2 years but less than 3 years |
% | |||||||||||
More than 3 years |
% | |||||||||||
4 |
Financial risk management and fair values of financial instruments (continued) |
(d) |
Credit risk (continued) |
| December 31, 2021 | ||||||||||||
| Expected loss rates |
Gross carrying amount |
Loss allowance |
||||||||||
| % | RMB million | RMB million | ||||||||||
Within 3 months |
% | |||||||||||
More than 3 months but less than 1 year |
% | |||||||||||
More than 1 year but less than 2 years |
% | |||||||||||
More than 2 years but less than 3 years |
% | |||||||||||
More than 3 years |
% | |||||||||||
| 2022 | 2021 | |||||||
| RMB million | RMB million | |||||||
Balance at January 1 |
||||||||
Amounts written off |
( |
) | ( |
) | ||||
Impairment losses reversed |
( |
) | ( |
) | ||||
Impairment losses recognized |
||||||||
Balance at December 31 |
||||||||
4 |
Financial risk management and fair values of financial instruments (continued) |
(d) |
Credit risk (continued) |
| 2022 | 2021 | |||||||||||||||||||||||||||||||
| Stage 1 | Stage 2 | Stage 3 | Total | Stage 1 | Stage 2 | Stage 3 | Total | |||||||||||||||||||||||||
| 12-month ECLs |
Lifetime ECLs (not credit- impaired) |
Lifetime ECLs (credit- impaired) |
12-month ECLs |
Lifetime ECLs (not credit- impaired) |
Lifetime ECLs (credit- impaired) |
|||||||||||||||||||||||||||
| RMB million |
RMB million |
RMB million |
RMB million |
RMB million |
RMB million |
RMB million |
RMB million |
|||||||||||||||||||||||||
| As at January 1 |
||||||||||||||||||||||||||||||||
| Accrual |
||||||||||||||||||||||||||||||||
| Reversal |
( |
) | ( |
) | ( |
) | ( |
) | ||||||||||||||||||||||||
| |
|
|
|
|
|
|
|
|
|
|
|
|
|
|
|
|||||||||||||||||
| As at December 31 |
||||||||||||||||||||||||||||||||
| |
|
|
|
|
|
|
|
|
|
|
|
|
|
|
|
|
|
|
|
|
|
|
|
|
|
|
|
|
|
|
|
|
(e) |
Jet fuel price risk |
4 |
Financial risk management and fair values of financial instruments (continued) |
(f) |
Capital management |
(g) |
Fair value |
(i) |
Financial instruments carried at fair value |
| • | Level 1 valuations: Fair value measured using only Level 1 inputs i.e. unadjusted quoted prices in active markets for identical assets or liabilities at the measurement date |
| • | Level 2 valuations: Fair value measured using Level 2 inputs i.e. observable inputs which fail to meet Level 1, and not using significant unobservable inputs. Unobservable inputs are inputs for which market data are not available |
| • | Level 3 valuations: Fair value measured using significant unobservable inputs |
Fair value measurements as at December 31, 2022 categorized into |
||||||||||||||||||
| Recurring fair value measurement |
Note |
Fair value at December 31, 2022 RMB million |
Level 1 RMB million |
Level 2 RMB million |
Level 3 RMB million |
|||||||||||||
| Financial assets/(liabilities): |
||||||||||||||||||
| Other equity instrument investments: |
||||||||||||||||||
| -Non-tradable listed shares |
26 | |||||||||||||||||
| Other non-current financial assets: |
||||||||||||||||||
| -Listed shares |
26 | |||||||||||||||||
| -Non-listed shares |
26 | |||||||||||||||||
| Derivative financial assets: |
||||||||||||||||||
| -Interest rate swaps |
27 | |||||||||||||||||
| Derivative financial liabilities: |
||||||||||||||||||
| -Derivative component of convertible bonds |
27 | ( |
) | ( |
) | |||||||||||||
4 |
Financial risk management and fair values of financial instruments (continued) |
(g) |
Fair value (continued) |
(i) |
Financial instruments carried at fair value (continued) |
Fair value measurements as at December 31, 2021 categorized into |
||||||||||||||||||
Recurring fair value measurement |
Note |
Fair value at December 31, 2021 RMB million |
Level 1 RMB million |
Level 2 RMB million |
Level 3 RMB million |
|||||||||||||
Financial assets/(liabilities): |
||||||||||||||||||
Other equity instrument investments: |
||||||||||||||||||
-Non-tradable listed shares |
26 | |||||||||||||||||
-Non-listed shares |
26 | |||||||||||||||||
Other non-current financial assets: |
||||||||||||||||||
-Listed shares |
26 | |||||||||||||||||
-Non-listed shares |
26 | |||||||||||||||||
Derivative financial liabilities: |
||||||||||||||||||
-Interest rate swaps |
27 | ( |
) | ( |
) | |||||||||||||
-Derivative component of convertible bonds |
27 | ( |
) | ( |
) | |||||||||||||
At December 31, 2022 |
At December 31, 2021 |
|||||||
Conversion price |
RMB |
RMB |
||||||
Stock price of A shares |
RMB |
RMB |
||||||
Stock market volatility |
||||||||
Risk-free interest rate |
||||||||
4 |
Financial risk management and fair values of financial instruments (continued) |
(g) |
Fair value (continued) |
(i) |
Financial instruments carried at fair value (continued) |
Valuation technique |
Significant unobservable inputs |
Range | ||||
Other equity instruments investments |
||||||
-Non-tradable listed shares (1)&(3) |
Market approach-valuation multiples |
Discount for lack of marketability | ||||
Other non-current financial assets |
||||||
-Non-listed shares (2) |
Income approach-discounted cash flow |
Expected profit growth rates during the projection period |
- | |||
Perpetual growth rates |
||||||
Perpetual dividend payout rates |
||||||
Expected dividend payout rates during the projection period |
||||||
Discount rates |
||||||
(1) |
The fair value of non-tradable listed shares are determined by market value adjusted for lack of marketability discount. The fair value measurement is negatively correlated to the discount for lack of marketability. |
In 2022, the valuation technique of non-tradable listed shares of other equity instrument investments was changed from income approach-discounted cash flow to market approach-valuation multiples, considering the market price of the shares is more appropriate. |
(2) |
The fair value of these non-listed shares is determined by discounting projected cash flow series associated with respective investments. The valuation takes into account the expected profit growth rates and expected dividend payout rate of the investees. The discount rates used have been adjusted to reflect specific risks relating to respective investees. The fair value measurement is positively correlated to the expected profit growth rates during the projection period, perpetual growth rate, perpetual dividend payout rate and expected dividend payout rates during the projection period of respective investees, and negatively correlated to the discount rates. |
(3) |
Any gain or loss arising from the remeasurement of the Group’s non-tradable equity securities held for strategic purposes are recognized in the fair value reserve (non-recycling) in other comprehensive income. Upon disposal of the equity securities, the amount accumulated in other comprehensive income is transferred directly to retained earnings. |
(ii) |
Financial instruments not carried at fair value |
5 |
Operating revenue |
| (i) | Disaggregation of revenue |
2022 |
2021 |
2020 |
||||||||||||
Note |
RMB million |
RMB million |
RMB million |
|||||||||||
| Revenue from contracts with customers within the scope of IFRS 15: |
||||||||||||||
| Disaggregated by service lines |
||||||||||||||
| -Traffic revenue |
||||||||||||||
| - Passenger |
||||||||||||||
| - Cargo and mail |
||||||||||||||
| -Commission income |
||||||||||||||
| -General aviation income |
||||||||||||||
| -Cargo handling income |
||||||||||||||
| -Hotel and tour operation income |
||||||||||||||
| -Ground services income |
||||||||||||||
| -Air catering service income |
||||||||||||||
| -Others |
||||||||||||||
| |
|
|
|
|
|
|||||||||
| Revenue from other sources: |
||||||||||||||
| -Rental income |
19( g ) |
|||||||||||||
| |
|
|
|
|
|
|||||||||
| |
|
|
|
|
|
|||||||||
| (ii) | Revenue expected to be recognized in the future arising from contracts with customers in existence at the reporting date |
6 |
Segment reporting |
(a) |
Business segments |
6 |
Segment reporting (continued) |
(a) |
Business segments (continued) |
Airline transportation operations |
Other segments |
Elimination |
Unallocated* |
Total |
||||||||||||||||
| RMB million | RMB million | RMB million | RMB million | RMB million | ||||||||||||||||
Disaggregated by timing of revenue recognition |
||||||||||||||||||||
Point in time |
( |
) | — | |||||||||||||||||
Over time |
( |
) | — | |||||||||||||||||
Revenue from external customers |
— | |||||||||||||||||||
Inter-segment sales |
( |
) | — | |||||||||||||||||
Reportable segment revenue |
( |
) | — | |||||||||||||||||
Reportable segment loss before taxation |
( |
) | ( |
) | ( |
) | ( |
) | ||||||||||||
Reportable segment loss after taxation |
( |
) | ( |
) | ( |
) | ( |
) | ||||||||||||
Other segment information |
||||||||||||||||||||
Income tax |
— | ( |
) | |||||||||||||||||
Interest income |
( |
) | — | |||||||||||||||||
Interest expense |
( |
) | — | |||||||||||||||||
Depreciation and amortization |
— | — | ||||||||||||||||||
Impairment loss es |
— | — | — | |||||||||||||||||
Credit losses |
( |
) | — | — | ( |
) | ||||||||||||||
Share of associates and joint ventures’ results |
— | — | — | |||||||||||||||||
Gain on disposal of subsidiaries and associates |
— | — | — | |||||||||||||||||
Changes in fair value of financial assets / liabilities |
— | — | — | ( |
) | ( |
) | |||||||||||||
Non-current assets additions during the year# |
( |
) | — | |||||||||||||||||
6 |
Segment reporting (continued) |
(a) |
Business segments (continued) |
Airline transportation operations |
Other segments |
Elimination |
Unallocated* |
Total |
||||||||||||||||
| RMB million | RMB million | RMB million | RMB million | RMB million | ||||||||||||||||
Disaggregated by timing of revenue recognition |
||||||||||||||||||||
Point in time |
( |
) | — | |||||||||||||||||
Over time |
( |
) | — | |||||||||||||||||
Revenue from external customers |
— | |||||||||||||||||||
Inter-segment sales |
( |
) | — | |||||||||||||||||
Reportable segment revenue |
( |
) | — | |||||||||||||||||
Reportable segment loss before taxation |
( |
) | ( |
) | ( |
) | ( |
) | ||||||||||||
Reportable segment loss after taxation |
( |
) | ( |
) | ( |
) | ||||||||||||||
Other segment information |
||||||||||||||||||||
Income tax |
( |
) | ( |
) | — | ( |
) | ( |
) | |||||||||||
Interest income |
( |
) | — | |||||||||||||||||
Interest expense |
( |
) | — | |||||||||||||||||
Depreciation and amortization |
— | — | ||||||||||||||||||
Impairment losses |
— | — | ||||||||||||||||||
Credit losses |
( |
) | — | — | ( |
) | ||||||||||||||
Share of associates and joint ventures’ results |
— | — | — | |||||||||||||||||
Changes in fair value of financial assets / liabilities |
— | — | — | ( |
) | ( |
) | |||||||||||||
Non-current assets additions during the year# |
( |
) | — | |||||||||||||||||
6 |
Segment reporting (continued) |
(a) |
Business segments (continued) |
Airline transportation operations |
Other segments |
Elimination |
Unallocated* |
Total |
||||||||||||||||
| RMB million | RMB million | RMB million | RMB million | RMB million | ||||||||||||||||
Disaggregated by timing of revenue recognition |
||||||||||||||||||||
Point in time |
( |
) | — | |||||||||||||||||
Over time |
( |
) | — | |||||||||||||||||
Revenue from external customers |
— | |||||||||||||||||||
Inter-segment sales |
( |
) | — | |||||||||||||||||
Reportable segment revenue |
( |
) | — | |||||||||||||||||
Reportable segment loss before taxation |
( |
) | ( |
) | ( |
) | ( |
) | ||||||||||||
Reportable segment loss after taxation |
( |
) | ( |
) | ( |
) | ( |
) | ||||||||||||
Other segment information |
||||||||||||||||||||
Income tax |
( |
) | ( |
) | — | ( |
) | |||||||||||||
Interest income |
( |
) | — | |||||||||||||||||
Interest expense |
( |
) | — | |||||||||||||||||
Depreciation and amortization |
— | — | ||||||||||||||||||
Impairment losses |
— | — | ||||||||||||||||||
Credit losses |
— | — | ||||||||||||||||||
Share of associates and joint ventures’ results |
— | — | — | ( |
) | ( |
) | |||||||||||||
Changes in fair value of financial assets / liabilities |
— | — | — | |||||||||||||||||
Non-current assets additions during the year# |
( |
) | — | |||||||||||||||||
6 |
Segment reporting (continued) |
(a) |
Business segments (continued) |
Airline transportation operations |
Other segments |
Elimination |
Unallocated* |
Total |
||||||||||||||||
| RMB million | RMB million | RMB million | RMB million | RMB million | ||||||||||||||||
As at December 31, 2022 |
||||||||||||||||||||
Reportable segment assets |
( |
) | ||||||||||||||||||
Reportable segment liabilities |
( |
) | ||||||||||||||||||
As at December 31, 2021 |
||||||||||||||||||||
Reportable segment assets |
( |
) | ||||||||||||||||||
Reportable segment liabilities |
( |
) | ||||||||||||||||||
| * | Unallocated assets primarily include interest in associates and joint ventures, derivative financial assets and equity securities. Unallocated liabilities primarily include derivative financial liabilities. Unallocated results primarily include the share of results of associates and joint ventures, gain on disposal of subsidiaries and associates, dividend income from equity securities, and the fair value movement of financial instruments recognized through profit or loss. |
| # | The additions of non-current assets do not include interests in associates and joint ventures, other equity instrument investments, other non-current financial assets, derivative financial assets and deferred tax assets. |
(b) |
Geographical information |
| (1) | Traffic revenue from services of both origin and destination within the PRC (excluding Hong Kong Special Administrative Region, Macau Special Administrative Region and Taiwan (“Hong Kong, Macau and Taiwan”)), is classified as domestic revenue. Traffic revenue with origin and destination among PRC, Hong Kong, Macau and Taiwan is classified as Hong Kong, Macau and Taiwan revenue; while that with origin from or destination to other overseas markets is classified as international revenue. |
6 |
Segment reporting (continued) |
(b) |
Geographical information (continued) |
| (2) | Revenue from commission income, general aviation, cargo handling, hotel and tour operation, ground services, air catering services and other miscellaneous services are classified on the basis of where the services are performed. |
2022 RMB million |
2021 RMB million |
2020 RMB million |
||||||||||
Domestic |
||||||||||||
International |
||||||||||||
Hong Kong, Macau and Taiwan |
||||||||||||
6 |
Segment reporting (continued) |
(c) |
Reconciliation of reportable segment loss before income tax, assets and liabilities to the consolidated figures as reported in the consolidated financial statements |
Note |
2022 RMB million |
2021 RMB million |
2020 RMB million |
|||||||||||||
Loss before income tax |
||||||||||||||||
Reportable segment loss before taxation |
6(a) | ( |
) | ( |
) | ( |
) | |||||||||
Capitalization of exchange difference of specific loans |
(i) | ( |
) | ( |
) | ( |
) | |||||||||
Government grants |
(ii) | — | ||||||||||||||
Consolidated loss before income tax |
( |
) | ( |
) | ( |
) | ||||||||||
December 31 |
December 31 |
|||||||||||
Note |
2022 RMB million |
2021 RMB million |
||||||||||
Assets |
||||||||||||
Reportable segment assets |
6(a) | |||||||||||
Capitalization of exchange difference of specific loans |
(i) | |||||||||||
Government grants |
(ii) | ( |
) | ( |
) | |||||||
Adjustments arising from business combinations under common control |
(iii) | |||||||||||
Others |
( |
) | ( |
) | ||||||||
Consolidated total assets |
||||||||||||
Liabilities |
6 |
Segment reporting (continued) |
(c) |
Reconciliation of reportable segment loss before income tax, assets and liabilities to the consolidated figures as reported in the consolidated financial statements (continued) |
| (i) |
| (ii) |
| (iii) | pooling-of-interest pooling-of-interest |
7 |
Flight operation expenses |
2022 |
2021 |
2020 |
||||||||||
RMB million |
RMB million |
RMB million |
||||||||||
Jet fuel costs |
||||||||||||
Flight personnel payroll and welfare |
||||||||||||
Air catering expenses |
||||||||||||
Civil Aviation Development Fund |
||||||||||||
Aircraft operating lease charges |
||||||||||||
Training expenses |
||||||||||||
Aircraft insurance |
||||||||||||
Others |
||||||||||||
8 |
Maintenance expenses |
2022 |
2021 |
2020 |
||||||||||
RMB million |
RMB million |
RMB million |
||||||||||
Aviation repair and maintenance charges |
||||||||||||
Staff payroll and welfare |
||||||||||||
Maintenance materials |
||||||||||||
9 |
Aircraft and transportation service expenses |
2022 |
2021 |
2020 |
||||||||||
RMB million |
RMB million |
RMB million |
||||||||||
Landing and navigation fees |
||||||||||||
Ground service and other charges |
||||||||||||
10 |
Promotion and selling expenses |
2022 |
2021 |
2020 |
||||||||||
RMB million |
RMB million |
RMB million |
||||||||||
Ticket office expenses |
||||||||||||
Sales commissions |
||||||||||||
Computer reservation services |
||||||||||||
Advertising and promotion |
||||||||||||
Others |
||||||||||||
| |
|
|
||||||||||
11 |
General and administrative expenses |
2022 |
2021 |
2020 |
||||||||||
RMB million |
RMB million |
RMB million |
||||||||||
General corporate expenses |
||||||||||||
Auditors’ remuneration |
||||||||||||
- Audit services |
||||||||||||
- Non-audit services |
||||||||||||
Credit losses |
( |
) | ( |
) | ||||||||
Other taxes and levies |
||||||||||||
| |
|
|
||||||||||
12 |
Depreciation and amortization |
2022 |
2021 |
2020 |
||||||||||
RMB million |
RMB million |
RMB million |
||||||||||
Depreciation of property, plant and equipment |
||||||||||||
Depreciation of right-of-use |
||||||||||||
Other amortization |
||||||||||||
13 |
Staff costs |
2022 |
2021 |
2020 |
||||||||||
RMB million |
RMB million |
RMB million |
||||||||||
Salaries, wages and welfare |
||||||||||||
Defined contribution retirement scheme |
||||||||||||
Termination benefits |
||||||||||||
14 |
Other net income |
2022 |
2021 |
2020 |
||||||||||
RMB million |
RMB million |
RMB million |
||||||||||
Government grants (Note) |
||||||||||||
Gains/(losses) on disposal of property, plant and equipment and right-of-use |
||||||||||||
-Aircraft and spare engines and construction in progress |
( |
) | ||||||||||
-Other property, plant and equipment and right-of-use |
||||||||||||
Others |
||||||||||||
| |
|
|
||||||||||
| Note: | Government grants mainly include subsidies granted by various local governments to encourage the Group to operate certain routes to cities where these governments are located. |
15 |
Interest expense |
2022 |
2021 |
2020 |
||||||||||
RMB million |
RMB million |
RMB million |
||||||||||
Interest on borrowings |
||||||||||||
Interest relating to lease liabilities (Note 21) |
||||||||||||
Total interest expense on financial liabilities not at fair value through profit or loss |
||||||||||||
Less: interest expense capitalized (Note) |
( |
) | ( |
) | ( |
) | ||||||
Interest rate swaps: cash flow hedge, reclassified from equity (Note 17) |
( |
) | ||||||||||
| |
|
|
||||||||||
| Note: | The weighted average interest rate used for interest capitalization was |
16 |
Income tax |
(a) |
Income tax expense/ (credit) in the consolidated income statement |
2022 |
2021 |
2020 |
||||||||||
RMB million |
RMB million |
RMB million |
||||||||||
PRC income tax |
||||||||||||
–Provision for the year |
||||||||||||
– (Over)/ under-provision in prior year |
( |
) | ||||||||||
Deferred tax (Note 29) |
||||||||||||
Origination and reversal of temporary differences |
( |
) | ( |
) | ||||||||
Income tax expense/ (credit) |
|
( |
) | ( |
) | |||||||
16 |
Income tax (continued) |
(b) |
Reconciliation between actual income tax expense/ (credit) and calculated tax based on accounting loss at applicable income tax rates |
2022 |
2021 |
2020 |
||||||||||
RMB million |
RMB million |
RMB million |
||||||||||
Loss before income tax |
( |
) | ( |
) | ( |
) | ||||||
Notional tax on loss before taxation, calculated at the rates applicable to loss in the tax jurisdictions concerned (Note 16(a)) |
( |
) | ( |
) | ( |
) | ||||||
Adjustments for tax effect of: |
||||||||||||
Non-deductible expenses |
||||||||||||
Share of results of associates and joint ventures and other non-taxable income |
( |
) | ( |
) | ||||||||
Unused tax losses and deductible temporary differences for which no deferred tax assets were recognized |
||||||||||||
Reversal of tax losses recognized as deferred tax assets in prior years |
||||||||||||
Utilization of unused tax losses and deductible temporary differences for which no deferred tax assets were recognized in prior years |
( |
) | ( |
) | ( |
) | ||||||
(Over)/ under-provision in prior year |
( |
) | ||||||||||
Super deduction of research and development expenses |
( |
) | ( |
) | ( |
) | ||||||
Income tax expense/ (credit) |
|
( |
) | ( |
) | |||||||
17 |
Other comprehensive income |
2022 |
2021 |
2020 |
||||||||||
RMB million |
RMB million |
RMB million |
||||||||||
Cash flow hedges: |
||||||||||||
Effective portion of changes in fair value of hedging instruments recognized during the year |
( |
) | ||||||||||
Reclassification adjustments for amounts transferred to profit or loss: |
||||||||||||
- interest expense (Note 15) |
( |
) | ||||||||||
Net deferred tax (debited)/ credited to other comprehensive income |
( |
) | ||||||||||
| ( |
) | |||||||||||
Equity investments measured at FVOCI: |
||||||||||||
Changes in fair value recognized during the year |
( |
) | ( |
) | ||||||||
Net deferred tax (debited)/credited to other comprehensive income |
( |
) | ||||||||||
| ( |
) | ( |
) | |||||||||
Share of other comprehensive income of associates |
||||||||||||
Will not be reclassified to profit or loss |
( |
) | ( |
) | ||||||||
Are or may be reclassified subsequently to profit or loss |
( |
) | ||||||||||
| ( |
) | |||||||||||
Differences resulting from the translation of foreign currency financial statements |
||||||||||||
Other comprehensive income for the year |
( |
) | ( |
) | ||||||||
18 |
Loss per share |
2022 |
2021 |
2020 |
||||||||||
million |
million |
million |
||||||||||
Issued ordinary shares at January 1 |
||||||||||||
Effect of issuance of shares |
||||||||||||
Weighted average number of ordinary shares at December 31 |
||||||||||||
19 |
Property, plant and equipment, net |
| Investment properties |
Buildings |
Aircraft |
Other flight equipment including rotables |
Machinery, equipment and vehicles |
Total |
|||||||||||||||||||
RMB million |
RMB million |
RMB million |
RMB million |
RMB million |
RMB million |
|||||||||||||||||||
| Cost: |
||||||||||||||||||||||||
| At January 1, 2021 |
||||||||||||||||||||||||
| Additions |
||||||||||||||||||||||||
| Transferred from construction in progress (Note 20) |
||||||||||||||||||||||||
| Reclassification on change of holding intention |
||||||||||||||||||||||||
| - transferred to other property, plant and equipment |
( |
) | ||||||||||||||||||||||
| - transferred from other property, plant and equipment |
( |
) | ||||||||||||||||||||||
| Transferred to assets held for sale |
( |
) | ( |
) | ( |
) | ||||||||||||||||||
| Transferred from right-of-use |
||||||||||||||||||||||||
| Others |
||||||||||||||||||||||||
| Disposals |
( |
) | ( |
) | ( |
) | ( |
) | ( |
) | ( |
) | ||||||||||||
| |
|
|
|
|
|
|
|
|
|
|
|
|||||||||||||
| At December 31, 2021 |
||||||||||||||||||||||||
| |
|
|
|
|
|
|
|
|
|
|
|
|||||||||||||
| At January 1, 2022 |
||||||||||||||||||||||||
| Additions |
||||||||||||||||||||||||
| Transferred from construction in progress (Note 20) |
||||||||||||||||||||||||
| Transferred from other assets (Note 30) |
||||||||||||||||||||||||
| Reclassification on change of holding intention |
||||||||||||||||||||||||
| - transferred to other property, plant and equipment |
( |
) | ||||||||||||||||||||||
| - transferred from other property, plant and equipment |
( |
) | ||||||||||||||||||||||
| Transferred from right-of-use |
||||||||||||||||||||||||
| Transferred from right-of-use |
||||||||||||||||||||||||
| Transferred to assets held for sale (e) |
( |
) | ( |
) | ||||||||||||||||||||
| |
|
|
|
|
|
|
|
|
|
|
|
|||||||||||||
| Disposals |
||||||||||||||||||||||||
| |
|
|
|
|
|
|
|
|
|
|
|
|||||||||||||
| - disposals (c) |
( |
) | ( |
) | ( |
) | ( |
) | ( |
) | ( |
) | ||||||||||||
| |
|
|
|
|
|
|
|
|
|
|
|
|||||||||||||
| - disposal of subsidiaries (d) |
( |
) | ( |
) | ( |
) | ( |
) | ||||||||||||||||
| |
|
|
|
|
|
|
|
|
|
|
|
|||||||||||||
| At December 31, 2022 |
||||||||||||||||||||||||
| |
|
|
|
|
|
|
|
|
|
|
|
|||||||||||||
19 |
Property, plant and equipment, net (continued) |
| Investment properties |
Buildings |
Aircraft |
Other flight equipment including rotables |
Machinery, equipment and vehicles |
Total |
|||||||||||||||||||
| RMB million |
RMB million |
RMB million |
RMB million |
RMB million |
RMB million |
|||||||||||||||||||
| Accumulated depreciation and impairment losses: |
||||||||||||||||||||||||
| At January 1, 2021 |
||||||||||||||||||||||||
| Depreciation charge for the year |
||||||||||||||||||||||||
| Reclassification on change of holding intention |
||||||||||||||||||||||||
| - transferred to other property, plant and equipment |
( |
) | ||||||||||||||||||||||
| - transferred from other property, plant and equipment |
( |
) | ||||||||||||||||||||||
| Transferred to assets held for sale |
( |
) | ( |
) | ( |
) | ||||||||||||||||||
| Transferred from right-of-use |
||||||||||||||||||||||||
| Disposals |
( |
) | ( |
) | ( |
) | ( |
) | ( |
) | ( |
) | ||||||||||||
| Provision for impairment losses |
||||||||||||||||||||||||
| Impairment losses transferred to assets held for sale |
( |
) | ( |
) | ( |
) | ||||||||||||||||||
| Impairment losses written-off on disposals |
( |
) | ( |
) | ||||||||||||||||||||
| At December 31, 2021 |
||||||||||||||||||||||||
| |
|
|
|
|
|
|
|
|
|
|
|
|||||||||||||
| At January 1, 2022 |
||||||||||||||||||||||||
| |
|
|
|
|
|
|
|
|
|
|
|
|||||||||||||
| Depreciation charge for the year |
||||||||||||||||||||||||
| Reclassification on change of holding intention |
||||||||||||||||||||||||
| - transferred to other property, plant and equipment |
( |
) | ||||||||||||||||||||||
| - transferred from other property, plant and equipment |
( |
) | ||||||||||||||||||||||
| Transferred from right-of- |
||||||||||||||||||||||||
| Transferred from right-of-use |
||||||||||||||||||||||||
| Transferred to assets held for sale (e) |
( |
) | ( |
) | ||||||||||||||||||||
| Disposals |
||||||||||||||||||||||||
| -disposals (c) |
( |
) | ( |
) | ( |
) | ( |
) | ( |
) | ( |
) | ||||||||||||
| -disposal of subsidiaries (d) |
( |
) | ( |
) | ( |
) | ( |
) | ||||||||||||||||
| |
|
|
|
|
|
|
|
|
|
|
|
|||||||||||||
| Provision for impairment losses (a) |
||||||||||||||||||||||||
| |
|
|
|
|
|
|
|
|
|
|
|
|||||||||||||
| Impairment losses transferred from right-of-use |
||||||||||||||||||||||||
| Impairment losses written-off on disposals (c) |
( |
) | ( |
) | ||||||||||||||||||||
| |
|
|
|
|
|
|
|
|
|
|
|
|||||||||||||
| At December 31, 2022 |
||||||||||||||||||||||||
| |
|
|
|
|
|
|
|
|
|
|
|
|||||||||||||
| Net book value: |
||||||||||||||||||||||||
| At December 31, 2022 |
||||||||||||||||||||||||
| |
|
|
|
|
|
|
|
|
|
|
|
|||||||||||||
| At December 31, 2021 |
||||||||||||||||||||||||
| |
|
|
|
|
|
|
|
|
|
|
|
|||||||||||||
19 |
Property, plant and equipment, net (continued) |
(a) |
As at December 31, 2022, the Group reported aircraft and related equipment in the amount of RMB |
(b) |
As at December 31, 2022, n il ). |
(c) |
During the year, the Group disposed certain aircraft directly and disposed certain aircraft through sale and leaseback agreement, against which cost, accumulated depreciation and impairment losses of the aircraft had been reduced with an aggregate amount of RMB |
(d) |
During the year, the Group lost control of Southern Airlines General Aviation Company Limited (“ General Aviation Limited ”) (Note 23(iii)) and certain property, plant and equipment, right-of-use General Aviation Limited with carrying value of approximately RMB |
(e) |
During the year, certain aircrafts with carrying amount of RMB |
(f) |
As at December 31, 2022 and up to the date of approval of these financial statements, the Group is in the process of applying for the property title certificates in respect of the certain properties located in mainland China, in which the Group has interests and for which such certificates have not been granted. As at December 31, 2022, carrying value of such properties of the Group amounted to RMB |
( g ) |
The Group leased out investment properties and facilities under operating leases. The leases typically run for an initial period of one to fifteen years, with an option to renew the leases after that date at which time all contract terms are renegotiated. In this connection, rental income totalling RMB |
2022 |
2021 |
|||||||
RMB million |
RMB million |
|||||||
| Within 1 year |
||||||||
| After 1 year but within 5 years |
||||||||
| After 5 years |
||||||||
| |
|
|
|
|||||
| |
|
|
|
|||||
19 |
Property, plant and equipment, net (continued) |
( h ) |
Components related to engine overhaul costs under property, plant and equipment and right-of-use |
| Components related to engine overhaul costs |
Before the change | After the change | ||
| Expected useful lives/Expected flying hours |
||||
| Estimated net residual rate |
— | — | ||
| Annual depreciation rate / Depreciation rate per thousand flying hours |
20 |
Construction in progress |
| Advance payment for aircraft and flight equipment |
Others |
Total |
||||||||||
RMB million |
RMB million |
RMB million |
||||||||||
| At January 1, 2021 |
||||||||||||
| Additions |
||||||||||||
| Transferred to property, plant and equipment (Note 19) |
( |
) | ( |
) | ( |
) | ||||||
| Transferred to right-of-use |
( |
) | ( |
) | ( |
) | ||||||
| Transferred to others |
( |
) | ( |
) | ||||||||
| |
|
|
|
|
|
|||||||
| At December 31, 2021 |
||||||||||||
| |
|
|
|
|
|
|||||||
| At January 1, 2022 |
||||||||||||
| Additions |
||||||||||||
| Transferred to property, plant and equipment (Note 19) |
( |
) | ( |
) | ( |
) | ||||||
| Transferred to right-of-use |
( |
) | ( |
) | ||||||||
| Transferred to others (Note 30) |
( |
) | ( |
) | ||||||||
| |
|
|
|
|
|
|||||||
| At December 31, 2022 |
||||||||||||
| |
|
|
|
|
|
|||||||
21 |
Right-of-use |
| Aircraft and engines |
Land use rights |
Buildings |
Others |
Total |
||||||||||||||||
| RMB million |
RMB million |
RMB million |
RMB million |
RMB million |
||||||||||||||||
| Cost: |
||||||||||||||||||||
| At January 1, 2021 |
||||||||||||||||||||
| Additions |
||||||||||||||||||||
| Transferred from construction in progress (Note 20) |
||||||||||||||||||||
| Transferred to property, plant and equipment on exercise of purchase option (Note 19) |
( |
) | ( |
) | ||||||||||||||||
| Transferred to assets held for sale |
( |
) | ( |
) | ||||||||||||||||
| Disposals |
( |
) | ( |
) | ( |
) | ( |
) | ( |
) | ||||||||||
| |
|
|
|
|
|
|
|
|
|
|||||||||||
| At December 31, 2021 |
||||||||||||||||||||
| |
|
|
|
|
|
|
|
|
|
|||||||||||
| At January 1, 2022 |
||||||||||||||||||||
| Additions |
||||||||||||||||||||
| Transferred from construction in progress (Note 20) |
||||||||||||||||||||
| Transferred from right-of-use |
( |
) | ( |
) | ||||||||||||||||
| Transferred to property, plant and equipment on exercise of purchase option (Note 19) |
( |
) | ( |
) | ( |
) | ||||||||||||||
| Disposals |
||||||||||||||||||||
| |
|
|
|
|
|
|
|
|
|
|||||||||||
| - disposals |
( |
) | ( |
) | ( |
) | ( |
) | ( |
) | ||||||||||
| |
|
|
|
|
|
|
|
|
|
|||||||||||
| - disposal of subsidiaries (Note 19(d)) |
( |
) | ( |
) | ( |
) | ( |
) | ||||||||||||
| |
|
|
|
|
|
|
|
|
|
|||||||||||
| At December 31, 2022 |
||||||||||||||||||||
| |
|
|
|
|
|
|
|
|
|
|||||||||||
21 |
Right-of-use assets (continued) |
| Aircraft and engines |
Land use rights |
Buildings |
Others |
Total |
||||||||||||||||
| RMB million |
RMB million |
RMB million |
RMB million |
RMB million |
||||||||||||||||
| Accumulated amortization and impairment losses: |
||||||||||||||||||||
| At January 1, 2021 |
||||||||||||||||||||
| Amortization charge for the year |
||||||||||||||||||||
| Transferred to property, plant and equipment on exercise of purchase option (Note 19) |
( |
) | ( |
) | ||||||||||||||||
| Transferred to assets held for sale |
( |
) | ( |
) | ||||||||||||||||
| Disposals |
( |
) | ( |
) | ( |
) | ( |
) | ||||||||||||
| Provision for impairment losses |
||||||||||||||||||||
| Impairment losses transferred to assets held for sale |
( |
) | ( |
) | ||||||||||||||||
| |
|
|
|
|
|
|
|
|
|
|||||||||||
| At December 31, 2021 |
||||||||||||||||||||
| |
|
|
|
|
|
|
|
|
|
|||||||||||
| At January 1, 2022 |
||||||||||||||||||||
| Amortization charge for the year |
||||||||||||||||||||
| Transferred to property, plant and equipment on exercise of purchase option (Note 19) |
( |
) | ( |
) | ( |
) | ||||||||||||||
| Transferred from right-of-use |
( |
) | ( |
) | ||||||||||||||||
| Disposals |
||||||||||||||||||||
| - disposals |
( |
) | ( |
) | ( |
) | ( |
) | ( |
) | ||||||||||
| - disposal of subsidiaries (Note 19(d)) |
( |
) | ( |
) | ( |
) | ( |
) | ||||||||||||
| Impairment losses transferred to property, plant and equipment (Note 19) |
( |
) | ( |
) | ||||||||||||||||
| Provision for impairment losses (Note 19(a)) |
||||||||||||||||||||
| |
|
|
|
|
|
|
|
|
|
|||||||||||
| At December 31, 2022 |
||||||||||||||||||||
| |
|
|
|
|
|
|
|
|
|
|||||||||||
| Net book value: |
||||||||||||||||||||
| At December 31, 2022 |
||||||||||||||||||||
| |
|
|
|
|
|
|
|
|
|
|||||||||||
| At December 31, 2021 |
||||||||||||||||||||
| |
|
|
|
|
|
|
|
|
|
|||||||||||
21 |
Right-of-use assets (continued) |
2022 |
2021 |
2020 |
||||||||||
RMB million |
RMB million |
RMB million |
||||||||||
| Interest on lease liabilities (Note 15) |
||||||||||||
| Interest rate swaps: cash flow hedge, reclassified from equity (Note 15) |
( |
) | ||||||||||
| Expense relating to short-term leases |
||||||||||||
| Expense relating to leases of variable lease payments not included in the measurement of lease liabilities |
||||||||||||
22 |
Goodwill |
2022 |
2021 |
|||||||
RMB million |
RMB million |
|||||||
Cost and carrying amount: |
||||||||
2022 |
2021 |
|||||||
RMB million |
RMB million |
|||||||
Southern Airlines Group Import and Export Trading Company (“SAIETC”) |
||||||||
Xiamen Airlines Culture and Media Co., Ltd. |
||||||||
Total |
||||||||
23 |
Subsidiaries |
Name of company |
Place of establishment/ operation |
Registered capital |
Proportion of ownership interest held by the Company |
Principal activity |
||||||||||
Xiamen Airlines Company Limited (“Xiamen Airlines”) (i) |
RMB |
% | | |||||||||||
China Southern Airlines Henan Airlines Company Limited (i) |
RMB |
% | | |||||||||||
Chongqing Airlines Company Limited (i) |
RMB |
% | | |||||||||||
Shantou Airlines Company Limited (i) |
RMB |
% | | |||||||||||
Zhuhai Airlines Company Limited (i) |
RMB |
% | | |||||||||||
Guizhou Airlines Company Limited (i) |
RMB |
% | | |||||||||||
China Southern Air Logistics Co., Ltd. (“Logistics Company”) (i) |
RMB |
% |
operations |
|||||||||||
Guangzhou Nanland Air Catering Company Limited (ii) |
RMB |
% | ||||||||||||
Beijing Southern Airlines Ground Services Company Limited (i) |
RMB |
% | services |
| ||||||||||
Nan Lung International Freight Limited |
HKD |
% | ||||||||||||
23 |
Subsidiaries (c ont inued) |
Name of company |
Place of establishment/ operation |
Registered capital |
Proportion of ownership interest held by the Company |
Principal activity | ||||||||
SAIETC (i) |
RMB |
% | agent services | |||||||||
Zhuhai Xiang Yi Aviation Technology Company Limited (i) |
RMB |
% | services | |||||||||
China Southern Airlines Xiongan Airlines Company Limited (i) |
RMB |
% | transportation | |||||||||
Shenyang Northern Aircraft Maintenance Co., Ltd. (i) |
RMB |
% | maintenance services | |||||||||
Guangdong Southern Airline Pearl Aviation Services Company Limited (i) |
RMB |
% | services | |||||||||
Southern Airlines Nansha Finance Leasing (Guangzhou) Co., Ltd. (i) |
RMB |
% | services | |||||||||
(i) |
These subsidiaries are PRC limited liability companies. |
(ii) |
This subsidiary is a sino-foreign equity joint venture company established in the PRC. |
(iii) |
General Aviation Limited |
RMB million |
||||
Cash consideration received from third parties on partial disposal of equity interests |
||||
Capital injection from third parties |
||||
Less: Portion of net assets of General Aviation Limited disposed |
||||
Other reserves in equity |
||||
23 |
Subsidiaries (continued) |
| (iv) | Logistics Company |
RMB million |
||||
Capital injection from third parties |
||||
Less: Portion of net assets of Logistics Company disposal |
||||
Other reserves in equity |
||||
| (v) | China Southern West Australian Flying College Pty Ltd. (“Flying College”) |
| (vi) | Guangzhou Baiyun International Logistic Company Limited (“Baiyun Logistic”) |
RMB million |
||||
Cash consideration paid |
||||
Less: Portion of net assets of Baiyun Logistic acquired |
||||
Other reserves in equity |
||||
23 |
Subsidiaries (continued) |
| (vii) | Material non-controlling interests |
| • | Set out below are the summarized financial information for Xiamen Airlines. |
2022 |
2021 |
|||||||
RMB million |
RMB million |
|||||||
Non-controlling interests percentage |
% | % | ||||||
Current assets |
||||||||
Non-current assets |
||||||||
Current liabilities |
( |
) | ( |
) | ||||
Non-current liabilities |
( |
) | ( |
) | ||||
Net assets |
||||||||
Carrying amount of non-controlling interests |
||||||||
Revenue |
||||||||
Loss for the year |
( |
) | ( |
) | ||||
Total comprehensive income |
( |
) | ( |
) | ||||
Loss allocated to non-controlling interests |
( |
) | ( |
) | ||||
Dividend paid to non-controlling interests |
||||||||
Net cash generated from operating activities |
||||||||
Net cash used in investing activities |
( |
) | ( |
) | ||||
Net cash used in financing activities |
( |
) | ( |
) | ||||
| • | Set out below are the summarized financial information for Logistics Company. |
2022 |
2021 |
|||||||
RMB million |
RMB million |
|||||||
Non-controlling interests percentage |
% | % | ||||||
Current assets |
||||||||
Non-current assets |
||||||||
Current liabilities |
( |
) | ( |
) | ||||
Non-current liabilities |
( |
) | ( |
) | ||||
Net assets |
||||||||
Carrying amount of non-controlling interests |
||||||||
Revenue |
||||||||
Profit for the year |
||||||||
Total comprehensive income |
||||||||
Profit allocated to non-controlling interests |
||||||||
Dividend paid to non-controlling interests |
||||||||
Net cash generated from operating activities |
||||||||
Net cash generated from/ (used) in investing activities |
( |
) | ||||||
Net cash used in financing activities |
( |
) | ( |
) | ||||
24 |
Interest in associates |
2022 |
2021 |
|||||||
RMB million |
RMB million |
|||||||
Share of net assets |
||||||||
| Proportion of ownership interest held by |
||||||||||||||||||||||||
Place of establishment / operation |
Group’s effective interest |
The Company |
Subsidiaries | Proportion of voting rights held by the Group |
Principal activity | |||||||||||||||||||
Southern Airlines Group Finance Co., Ltd. (“Finance Company”) |
% | % | % | % | | |||||||||||||||||||
Sichuan Airlines Co., Ltd. (“Sichuan Airlines”) |
% | % | % | | ||||||||||||||||||||
Southern Airlines Culture and Media Co., Ltd.(“SACM”) |
% | % | % | | ||||||||||||||||||||
Shenyang Konggang Logistic Co., Ltd. (“Shenyang Konggang”) |
% | % | % | |||||||||||||||||||||
Beijing Xingming Lake Jinyan Hotel Co., Ltd. |
% | % | % | |
accommodation services |
| ||||||||||||||||||
Shangzhou Aviation Logistics Co., Ltd. |
% | % | % | | ||||||||||||||||||||
Beijing Airport Inflight Kitchen Co., Ltd. |
% | % | % | | ||||||||||||||||||||
Xinjiang Civil Aviation Property Management Limited |
% | % | % | | ||||||||||||||||||||
24 |
Interest in associates (continued) |
2022 |
2021 |
2020 |
||||||||||
RMB million |
RMB million |
RMB million |
||||||||||
| Aggregate carrying amount of individually immaterial associates |
||||||||||||
| Aggregate amounts of the Group’s share of: |
||||||||||||
| (Loss)/profit from continuing operations |
( |
) | ( |
) | ||||||||
| Other comprehensive income |
( |
) | ||||||||||
| |
|
|
|
|
|
|||||||
| Total comprehensive income |
( |
) | ( |
) | ||||||||
| |
|
|
|
|
|
|||||||
| (i) | Disposal of associates |
25 |
Interest in joint ventures |
2022 |
2021 |
|||||||
RMB million |
RMB million |
|||||||
| Share of net assets |
||||||||
| |
|
|
|
|||||
| Proportion of ownership interest held by |
||||||||||||||||||||||
| Place of establishment/ operation |
Group’s effective interest |
The Company |
Subsidiaries | Proportion of voting rights held by the Group |
Principal activity |
|||||||||||||||||
| Guangzhou Aircraft Maintenance Engineering Co., Ltd. (“GAMECO”) |
% | % | |
and maintenance services |
| |||||||||||||||||
| MTU Maintenance Zhuhai Co., Ltd. (“MTU”) |
% | % | |
and maintenance services |
| |||||||||||||||||
2022 |
2021 |
2020 |
||||||||||
RMB million |
RMB million |
RMB million |
||||||||||
| Aggregate carrying amount of individually immaterial joint ventures |
||||||||||||
| Aggregate amounts of the Group’s share of: |
||||||||||||
| Profit from continuing operations and total comprehensive income |
||||||||||||
| |
|
|
|
|
|
|||||||
26 |
Financial assets |
2022 |
2021 |
|||||||||||
Notes |
RMB million |
RMB million |
||||||||||
| Other equity instrument investments (FVOCI) |
(i) | |||||||||||
| - Non-tradable listed shares |
|
|
|
|
|
|
|
|
|
|
|
|
| - Non-listed shares |
||||||||||||
| |
|
|
|
|||||||||
| |
|
|
|
|||||||||
| Other non-current financial assets (FVPL) |
(i) | |||||||||||
| - Listed shares |
||||||||||||
| - Non-listed shares |
||||||||||||
| Other non-current financial assets (amortized cost) |
(ii) | |||||||||||
| - Long-term receivables |
||||||||||||
| |
|
|
|
|||||||||
| |
|
|
|
|||||||||
| (i) | Dividend income generated from the investments amounted to RMB |
| (ii) | In 2022 and 2021, the Group derecognized certain aircraft under finance lease agreements as a lessor and recognized long-term receivables. As at December 31, 2022, long-term receivables (including the portion due within one year) was RMB million (December 31, 2021: RMB million was recorded in the amounts due from related companies (December 31, 2021: RMB |
27 |
Derivative financial assets/(liabilities) |
2022 |
2021 |
|||||||||||
Note |
RMB million |
RMB million |
||||||||||
| Derivative financial assets: |
||||||||||||
| Interest rate swaps |
(i | ) | ||||||||||
| - Non-current |
||||||||||||
| - Current |
|
|
|
|
|
|
|
|
|
|
|
|
| Derivative financial liabilities: |
||||||||||||
| Interest rate swaps |
(i | ) |
||||||||||
| - Non-current |
( |
) | ||||||||||
| Derivative component of convertible bonds |
||||||||||||
| - Current |
(ii | ) | ( |
) | ( |
) | ||||||
| (i) | In 2015, the Group entered into interest rate swaps to mitigate its cash flow interest rate risk. The interest rate swaps allow the Group to pay at fixed rate from |
| (ii) | In October 2020, the Group issued a total of |
28 |
Changes in fair value of financial assets/ liabilities |
2022 |
2021 |
|||||||
RMB million |
RMB million |
|||||||
| Other non-current financial assets (FVPL) |
( |
) | ||||||
| Interest rate swaps measured at FVPL |
||||||||
| Forward foreign exchange and foreign exchange options contracts |
( |
) | ||||||
| Derivative component of convertible bonds (Note 27(ii)) |
( |
) | ( |
) | ||||
| |
|
|
|
|||||
| ( |
) | ( |
) | |||||
| |
|
|
|
|||||
29 |
Deferred tax assets / (liabilities) |
(a) |
Movements of net deferred tax assets are as follows: |
| At December 31, 2021 |
(Charged)/ credited to consolidated income statement |
Charged to other comprehensive income |
(Charged)/ credited to retain earnings |
Disposal of subsidiaries |
At December 31, 2022 |
|||||||||||||||||||
| RMB million |
RMB million |
RMB Million |
RMB Million |
RMB Million |
RMB million |
|||||||||||||||||||
| For the year ended December 31, 2022 |
||||||||||||||||||||||||
| Deferred tax assets: |
||||||||||||||||||||||||
| Net effect on right-of-use |
( |
) | — | — | — | |||||||||||||||||||
| Accrued expenses |
— | — | — | |||||||||||||||||||||
| Provision for major overhauls |
— | — | — | |||||||||||||||||||||
| Contract liabilities/other non-current liabilities |
( |
) | — | — | — | |||||||||||||||||||
| Provision for impairment losses |
( |
) | — | — | — | |||||||||||||||||||
| Provision for tax losses |
( |
) | — | — | ||||||||||||||||||||
| Change in fair value of derivative financial instruments |
— | — | ||||||||||||||||||||||
| Change in fair value of other equity instrument investments |
— | ( |
) | ( |
) | — | ||||||||||||||||||
| Depreciation allowances under tax in excess of the related depreciation under accounting |
( |
) | — | — | — | |||||||||||||||||||
| Others |
— | — | ( |
) | ||||||||||||||||||||
| |
|
|
|
|
|
|
|
|
|
|
|
|||||||||||||
| ( |
) | ( |
) | — | ( |
) | ||||||||||||||||||
| |
|
|
|
|
|
|
|
|
|
|
|
|||||||||||||
| Deferred tax liabilities: |
||||||||||||||||||||||||
| Accrued expenses |
( |
) | — | — | — |
|||||||||||||||||||
| Depreciation allowances under tax in excess of the related depreciation under accounting |
( |
) | ( |
) | — | — | — | ( |
) | |||||||||||||||
| Change in fair value of other equity instrument investments |
( |
) | — | ( |
) | — | — | ( |
) | |||||||||||||||
| Change in fair value of other non-current financial assets |
( |
) | — | — | — | ( |
) | |||||||||||||||||
| Fair value re-measurement of identifiable assets in business combination |
( |
) | — | — | — | ( |
) | |||||||||||||||||
| Others |
( |
) | — | — | — | ( |
) | |||||||||||||||||
| |
|
|
|
|
|
|
|
|
|
|
|
|||||||||||||
| ( |
) | ( |
) | ( |
) | — | — | ( |
) | |||||||||||||||
| |
|
|
|
|
|
|
|
|
|
|
|
|||||||||||||
| Net deferred tax assets |
( |
) | ( |
) | — | ( |
) | |||||||||||||||||
| |
|
|
|
|
|
|
|
|
|
|
|
|||||||||||||
29 |
Deferred tax assets / (liabilities) (continued) |
(a) |
Movements of net deferred tax assets are as follows (continued): |
| At December 31, 2020 |
(Charged)/ credited to consolidated income statement |
(Charged)/ credited to other comprehensive income |
At December 31, 2021 |
|||||||||||||
RMB million |
RMB million |
RMB million |
RMB million |
|||||||||||||
| For the year ended December 31, 2021 |
||||||||||||||||
| Deferred tax assets: |
||||||||||||||||
| Net effect on right-of-use |
— | |||||||||||||||
| Accrued expenses |
— | |||||||||||||||
| Provision for major overhauls |
— | |||||||||||||||
| Contract liabilities/other non-current liabilities |
( |
) | — | |||||||||||||
| Provision for impairment losses |
— | |||||||||||||||
| Provision for tax losses |
— | |||||||||||||||
| Change in fair value of derivative financial instruments |
( |
) | ||||||||||||||
| Change in fair value of other equity instrument investments |
— | |||||||||||||||
| Depreciation allowances under tax in excess of the related depreciation under accounting |
— | |||||||||||||||
| Others |
— | |||||||||||||||
| |
|
|
|
|
|
|
|
|||||||||
| |
|
|
|
|
|
|
|
|||||||||
| Deferred tax liabilities: |
||||||||||||||||
| Accrued expenses |
( |
) | — | ( |
) | |||||||||||
| Depreciation allowances under tax in excess of the related depreciation under accounting |
( |
) | — | ( |
) | |||||||||||
| Change in fair value of other equity instrument investments |
( |
) | — | ( |
) | |||||||||||
| Change in fair value of other non-current financial assets |
( |
) | ( |
) | — | ( |
) | |||||||||
| Change in fair value of derivative financial liabilities |
( |
) | — | |||||||||||||
| Fair value re-measurement of identifiable assets in business combination |
( |
) | — | ( |
) | |||||||||||
| Others |
( |
) | — | ( |
) | |||||||||||
| |
|
|
|
|
|
|
|
|||||||||
| ( |
) | ( |
) | |||||||||||||
| |
|
|
|
|
|
|
|
|||||||||
| Net deferred tax assets |
||||||||||||||||
| |
|
|
|
|
|
|
|
|||||||||
29 |
Deferred tax assets / (liabilities) (continued) |
(b) |
Reconciliation to the consolidated statement of financial position: |
2022 |
2021 |
|||||||
RMB million |
RMB million |
|||||||
| Net deferred tax asset recognized in the statement of financial position |
||||||||
| Net deferred tax liability recognized in the statement of financial position |
( |
) | ( |
) | ||||
| |
|
|
|
|||||
| |
|
|
|
|||||
(c) |
Deferred tax assets not recognized |
2022 |
2021 |
|||||||
RMB million |
RMB million |
|||||||
| Expiring in : |
||||||||
| 2022 |
||||||||
| 2023 |
||||||||
| 2024 |
||||||||
| 2025 |
||||||||
| 2026 |
||||||||
| 2027 |
||||||||
| 2028 |
||||||||
| |
|
|
|
|||||
| |
|
|||||||
| |
|
|
|
|||||
30 |
Other assets |
Software |
Leasehold improvements |
Others |
Total |
|||||||||||||
| RMB million |
RMB million |
RMB Million |
RMB million |
|||||||||||||
(Note) |
||||||||||||||||
| At January 1, 2021 |
||||||||||||||||
| Additions |
||||||||||||||||
| Transferred from construction in progress |
||||||||||||||||
| Disposal |
( |
) | ( |
) | ( |
) | ||||||||||
| Amortization for the year |
( |
) | ( |
) | ( |
) | ( |
) | ||||||||
| Provision for impairment losses |
( |
) | ( |
) | ||||||||||||
| |
|
|
|
|
|
|
|
|||||||||
| At December 31, 2021 |
||||||||||||||||
| |
|
|
|
|
|
|
|
|||||||||
| At January 1, 2022 |
||||||||||||||||
| Additions |
||||||||||||||||
| Transferred from construction in progress (Note 20) |
||||||||||||||||
| Transferred to property, plant and equipment (Note 19) |
( |
) | ( |
) | ||||||||||||
| Transferred to others |
( |
) | ( |
) | ||||||||||||
| Disposal |
( |
) | ( |
) | ||||||||||||
| Disposal of subsidiaries (Note 19(d)) |
( |
) | ( |
) | ||||||||||||
| Amortization for the year |
( |
) | ( |
) | ( |
) | ( |
) | ||||||||
| |
|
|
|
|
|
|
|
|||||||||
| At December 31, 2022 |
||||||||||||||||
| |
|
|
|
|
|
|
|
|||||||||
| Note: | As at December 31, 2022, the amounts include prepayments of RMB Note 42(b)&50(c)). |
31 |
Inventories |
2022 |
2021 |
|||||||
RMB million |
RMB million |
|||||||
| Consumable spare parts and maintenance materials |
||||||||
| Other supplies |
||||||||
| |
|
|
|
|||||
| Less: provision |
( |
) | ( |
) | ||||
| |
|
|
|
|||||
| |
|
|
|
|||||
2022 |
2021 |
|||||||
RMB million |
RMB million |
|||||||
| At January 1 |
||||||||
| Provision for inventories |
||||||||
| Written-off upon disposal |
( |
) | ( |
) | ||||
| Disposal of subsidiaries |
( |
) | ||||||
| |
|
|
|
|||||
| At December 31 |
|
|||||||
| |
|
|
|
|||||
32 |
Trade receivables |
2022 |
2021 |
|||||||
RMB million |
RMB million |
|||||||
| Trade receivables |
||||||||
| Less: loss allowance |
( |
) | ( |
) | ||||
| |
|
|
|
|||||
| |
|
|
|
|||||
(a) |
Ageing analysis |
2022 |
2021 |
|||||||
RMB million |
RMB million |
|||||||
| Within 1 month |
||||||||
| More than 1 month but less than 3 months |
||||||||
| More than 3 months but less than 12 months |
||||||||
| More than 1 year |
||||||||
| |
|
|
|
|||||
| Less: loss allowance |
( |
) | ( |
) | ||||
| |
|
|
|
|||||
| |
|
|
|
|||||
32 |
Trade receivables (continued) |
(b) |
Trade receivables by currencies |
2022 |
2021 |
|||||||
RMB million |
RMB million |
|||||||
RMB |
||||||||
USD |
||||||||
EURO |
||||||||
HKD |
||||||||
AUD |
||||||||
BDT |
||||||||
Others |
||||||||
33 |
Other receivables |
2022 |
2021 |
|||||||||||
Notes |
RMB million |
RMB million |
||||||||||
VAT recoverable |
||||||||||||
Government grants receivables |
(i) | |||||||||||
Rebate receivables on aircraft acquisitions |
||||||||||||
Other deposits |
||||||||||||
Others |
(ii) | |||||||||||
Less: loss allowance |
(iii) | ( |
) | ( |
) | |||||||
| (i) | Government grants receivables are recognized as there is reasonable assurance that they will be received and the Group has complied with the conditions attaching to them. |
| (ii) | The amounts include term deposits of RMB |
| (iii) | The Group lost control of Flying College in December 2020 (Note 23 (v)). As at December 31, 2021 and 2020, prepayment of training expenses made to Flying College amounting to RMB million was fully impaired. In 2022, as the unsecured creditor, the Group received an interim amount of the liquidation distribution from Flying College in the amount of RMB |
34 |
Cash and cash equivalents |
(a) |
Cash and cash equivalents comprise: |
2022 |
2021 |
|||||||
RMB million |
RMB million |
|||||||
Deposits in banks and other financial institution |
||||||||
Cash at bank and other financial institution and on hand |
||||||||
Cash and cash equivalents in the consolidated statement of financial position |
||||||||
2022 |
2021 |
|||||||
RMB million |
RMB million |
|||||||
RMB |
||||||||
USD |
||||||||
EURO |
||||||||
AUD |
||||||||
JPY |
||||||||
HKD |
||||||||
Others |
||||||||
NOTES |
TO THE CONSOLIDATED FINANCIAL STATEMENTS |
34 |
Cash and cash equivalents (continued) |
(b) |
Reconciliation of loss before income tax to cash generated from operating activities |
Note |
2022 RMB million |
2021 RMB million |
2020 RMB million |
|||||||||||||
Loss before income tax |
( |
) | ( |
) | ( |
) | ||||||||||
Adjustments for: |
||||||||||||||||
Depreciation and amortization |
12 | |||||||||||||||
Impairment losses on property, plant and equipment |
19 | |||||||||||||||
Impairment losses on right-of-use |
21 | |||||||||||||||
Impairment losses on other assets |
30 | |||||||||||||||
Disposal of subsidiaries |
( |
) | — |
|||||||||||||
Disposal of associates |
( |
) | — |
— |
||||||||||||
Credit losses |
11 | ( |
) | ( |
) | |||||||||||
Share of associates’ results |
24 | ( |
) | |||||||||||||
Share of joint ventures’ results |
25 | ( |
) | ( |
) | ( |
) | |||||||||
Gain on disposal of property, plant and equipment and construction in progress |
14 | ( |
) | ( |
) | ( |
) | |||||||||
Changes in fair value of financial assets/ liabilities |
28 | ( |
) | |||||||||||||
Interest income |
( |
) | ( |
) | ( |
) | ||||||||||
Interest expense |
15 | |||||||||||||||
Dividends income from other non-current financial assets |
26 | ( |
) | ( |
) | ( |
) | |||||||||
Exchange loss/ (gain), net |
( |
) | ( |
) | ||||||||||||
Changes in working capital: |
||||||||||||||||
Decrease in inventories |
||||||||||||||||
Increase/ (decrease) in contract liabilities and other non-current liabilities |
( |
) | ( |
) | ||||||||||||
Decrease in sales in advance of carriage |
( |
) | ( |
) | ( |
) | ||||||||||
Increase/ (decrease) in deferred benefits and gains |
46 | ( |
) | ( |
) | |||||||||||
Decrease/ (increase) in operating receivables |
( |
) | ||||||||||||||
Increase/ (decrease) in operating payables |
( |
) | ||||||||||||||
Cash generated from operating activities |
||||||||||||||||
34 |
Cash and cash equivalents (continued) |
(c) |
Reconciliation of liabilities arising from financing activities: |
Bank loans and other borrowings |
Lease liabilities |
Interest rate swaps (liabilities/ (asset)) |
Derivative component of convertible bonds |
Total |
||||||||||||||||||||||||||
RMB million |
RMB million |
RMB million |
RMB million |
RMB million |
||||||||||||||||||||||||||
(Note 36) |
(Note 37) |
(Note 27) |
(Note 27) |
|||||||||||||||||||||||||||
At January 1, 2022 |
||||||||||||||||||||||||||||||
Changes from financing cash flows: |
||||||||||||||||||||||||||||||
Proceeds from bank borrowings |
— |
|||||||||||||||||||||||||||||
Proceeds from ultra-short-term financing bills |
— |
|||||||||||||||||||||||||||||
Proceeds from corporate bonds |
— |
|||||||||||||||||||||||||||||
Repayment of bank borrowings |
( |
) |
— |
( |
) | |||||||||||||||||||||||||
Repayment of ultra-short-term financing bills |
( |
) |
— |
( |
) | |||||||||||||||||||||||||
Repayment of corporate bonds |
( |
) |
— |
( |
) | |||||||||||||||||||||||||
Capital element of lease rentals paid(Note 34(d)) |
( |
) |
— |
( |
) | |||||||||||||||||||||||||
Total changes from financing cash flows |
( |
) |
— |
|||||||||||||||||||||||||||
Exchange adjustments |
( |
) |
— |
|||||||||||||||||||||||||||
Changes in fair value |
( |
) |
||||||||||||||||||||||||||||
Other changes: |
||||||||||||||||||||||||||||||
Increase in lease liabilities from entering into new leases during the year (Note 52) |
— |
|||||||||||||||||||||||||||||
Amortization amount of convertible bonds |
||||||||||||||||||||||||||||||
Impact of accrued interest expense |
( |
) |
— |
— |
— |
( |
) | |||||||||||||||||||||||
Total other changes |
||||||||||||||||||||||||||||||
At December 31, 2022 |
( |
) |
||||||||||||||||||||||||||||
34 |
Cash and cash equivalents (continued) |
(c) |
Reconciliation of liabilities arising from financing activities (continued) : |
| Bank loans and other borrowings RMB million |
Lease liabilities RMB million |
Interest rate swaps (liabilities/(assets)) RMB million |
Derivative component of convertible bonds RMB million |
Total RMB million |
||||||||||||||||
(Note 36) |
(Note 37) |
(Note 27) |
(Note 27) |
|||||||||||||||||
| At January 1, 2021 |
||||||||||||||||||||
| |
|
|
|
|
|
|
|
|
|
|||||||||||
| Changes from financing cash flows: |
||||||||||||||||||||
| Proceeds from bank borrowings |
— | |||||||||||||||||||
| Proceeds from ultra-short-term financing bills |
— | |||||||||||||||||||
| Proceeds from corporate bonds |
— | |||||||||||||||||||
| Repayment of bank borrowings |
( |
) | — | ( |
) | |||||||||||||||
| Repayment of ultra-short-term financing bills |
( |
) | — | ( |
) | |||||||||||||||
| Repayment of corporate bonds |
( |
) | — | ( |
) | |||||||||||||||
| Capital element of lease rentals paid (Note 34(d)) |
( |
) | — | ( |
) | |||||||||||||||
| |
|
|
|
|
|
|
|
|
|
|||||||||||
| Total changes from financing cash flows |
( |
) | — | |||||||||||||||||
| |
|
|
|
|
|
|
|
|
|
|||||||||||
| Exchange adjustments |
( |
) | — | ( |
) | |||||||||||||||
| |
|
|
|
|
|
|
|
|
|
|||||||||||
| Changes in fair value |
( |
) | ||||||||||||||||||
| |
|
|
|
|
|
|
|
|
|
|||||||||||
| Other changes: |
||||||||||||||||||||
| Increase in lease liabilities from entering into new leases during the year (Note 52) |
— | |||||||||||||||||||
| Conversion of convertible bonds to ordinary shares (Note 52) |
( |
) | — | — | ( |
) | ( |
) | ||||||||||||
| Amortization amount of convertible bonds |
||||||||||||||||||||
| Impact of accrued interest expense |
— | — | — | |||||||||||||||||
| |
|
|
|
|
|
|
|
|
|
|||||||||||
| Total other changes |
( |
) | ( |
) | ( |
) | ||||||||||||||
| |
|
|
|
|
|
|
|
|
|
|||||||||||
| At December 31, 2021 |
||||||||||||||||||||
| |
|
|
|
|
|
|
|
|
|
|||||||||||
34 |
Cash and cash equivalents (continued) |
(d) |
Total cash outflow for leases |
2022 RMB million |
2021 RMB million |
2020 RMB million |
||||||||||
| Within operating cash flows |
( |
) | ( |
) | ( |
) | ||||||
| Within investing cash flows |
( |
) | ( |
) | ( |
) | ||||||
| Within financing cash flows |
( |
) | ( |
) | ( |
) | ||||||
| |
|
|
|
|
|
|||||||
| ( |
) | ( |
) | ( |
) | |||||||
| |
|
|
|
|
|
|||||||
2022 RMB million |
2021 RMB million |
2020 RMB million |
||||||||||
| Lease rentals paid |
( |
) | ( |
) | ( |
) | ||||||
| Acquisition of land use rights |
( |
) | ( |
) | ( |
) | ||||||
| |
|
|
|
|
|
|||||||
| ( |
) | ( |
) | ( |
) | |||||||
| |
|
|
|
|
|
|||||||
35 |
Assets held for sale |
2022 RMB million |
2021 RMB million |
|||||||
| Aircraft and other flight equipment |
||||||||
| |
|
|
|
|||||
36 |
Borrowings |
| (a) | Borrowings are analyzed as follows: |
2022 RMB million |
2021 RMB million |
|||||||
| Non-current |
||||||||
| Long-term borrowings |
||||||||
| Corporate bonds (Note (ii)) |
||||||||
| Convertible bonds (Note 27(ii)) |
||||||||
| Medium-term notes (Note (iii)) |
||||||||
| |
|
|
|
|||||
| |
|
|
|
|||||
| Current |
||||||||
| Current portion of long-term borrowings |
||||||||
| Short-term borrowings |
||||||||
| Ultra-short-term financing bills |
||||||||
| Current portion of corporate bonds and medium-term notes (Notes (ii)&(iii)) |
||||||||
| Current portion of convertible bonds (Note 27(ii)) |
||||||||
| |
|
|
|
|||||
| Total borrowings |
||||||||
| |
|
|
|
|||||
| |
|
|
|
|
|
|
|
|
| The borrowings are repayable: |
||||||||
| Within one year |
||||||||
| In the second year |
||||||||
| In the third to fifth year |
||||||||
| After the fifth year |
||||||||
| |
|
|
|
|||||
| Total borrowings |
||||||||
| |
|
|
|
|||||
36 |
Borrowings (continued) |
| (a) | Borrowings are analyzed as follows (continued): |
| (i) | As at December 31, 2022, the Group did |
| (ii) | The Company issued corporate bonds with aggregate nominal value of RMB |
| (iii) | The Company issued medium-term notes with aggregate nominal value of RMB The medium-term notes were redeemed by the Company in 2022 upon maturity. |
| (b) | As at December 31, 2022, the Group’s weighted average interest rates on short-term borrowings were |
36 |
Borrowings (continued) |
| (c) | Details of borrowings with original maturity over one year are as follows: |
2022 RMB million |
2021 RMB million |
|||||||
| Renminbi denominated borrowings |
||||||||
| Fixed interest rate s at |
||||||||
| Corporate bond - Fixed interest rate at |
||||||||
| Convertible bond - Fixed interest rate (Note 27(ii)) |
||||||||
| Medium-term notes - Fixed interest rate s at |
||||||||
| Floating interest rates at |
||||||||
| |
|
|
|
|||||
| Less: borrowings due within one year classified as current liabilities |
( |
) | ( |
) | ||||
| |
|
|
|
|||||
| |
|
|
|
|||||
| (d) | The carrying amounts of the borrowings are denominated in the following currencies: |
2022 RMB million |
2021 RMB million |
|||||||
| Renminbi |
||||||||
| US Dollars |
||||||||
| |
|
|
|
|||||
| |
|
|
|
|||||
| (e) | The balance of short-term and long-term borrowings as at December 31, 2022 included entrusted loans from CSAH via Finance Company to the Group amounted to RMB million were repayable within one year (December 31, 2021: million were repayable over one year (December 31, 2021 : RMB |
| (f) | Certain of the Group’s banking facilities are subject to the fulfilment of covenants relating to the Group’s certain financial ratios, as are commonly found in lending arrangements with financial institutions. If the Group were to breach the covenants, the drawn down facilities would become payable on demand. The Group regularly monitors its compliance with these covenants. Further details of the Group’s management of liquidity risk are set out in Note 4(a). As at December 31, 2022, for short-term borrowings with an aggregate amount of RMB |
37 |
Lease liabilities |
2022 RMB million |
2021 RMB million |
|||||||
| Within 1 year |
||||||||
| After 1 year but within 2 years |
||||||||
| After 2 years but within 5 years |
||||||||
| After 5 years |
||||||||
| |
|
|
|
|||||
| |
|
|
|
|||||
Obligations by denominated currencies |
||||||||||||||||||||||||||||
| For the year ended December 31, 2022 |
Effective interest rate |
USD RMB million |
Japanese Yen RMB million |
Renminbi RMB million |
Euro RMB million |
Other currencies RMB million |
Total RMB million |
|||||||||||||||||||||
| Fixed interest rates |
||||||||||||||||||||||||||||
| Floating interest rates |
||||||||||||||||||||||||||||
| |
|
|
|
|
|
|
|
|
|
|
|
|||||||||||||||||
| |
|
|
|
|
|
|
|
|
|
|
|
|||||||||||||||||
Obligations by denominated currencies |
||||||||||||||||||||||||||||
| For the year ended December 31, 2021 |
Effective interest rate |
USD RMB million |
Japanese Yen RMB million |
Renminbi RMB million |
Euro RMB million |
Other currencies RMB million |
Total RMB million |
|||||||||||||||||||||
| Fixed interest rates |
||||||||||||||||||||||||||||
| Floating interest rates |
||||||||||||||||||||||||||||
| |
|
|
|
|
|
|
|
|
|
|
|
|||||||||||||||||
| |
|
|
|
|
|
|
|
|
|
|
|
|||||||||||||||||
38 |
Trade payables |
2022 RMB million |
2021 RMB million |
|||||||
| Within 1 month |
||||||||
| More than 1 month but less than 3 months |
||||||||
| More than 3 months but less than 6 months |
||||||||
| More than 6 months but less than 1 year |
||||||||
| More than 1 year |
||||||||
| |
|
|
|
|||||
| |
|
|
|
|||||
2022 RMB million |
2021 RMB million |
|||||||
| Renminbi |
||||||||
| USD |
||||||||
| Others |
||||||||
| |
|
|
|
|||||
| |
|
|
|
|||||
39 |
Contract liabilities |
2022 RMB million |
2021 RMB million |
|||||||
| Unredeemed credits under the frequent flyer award programs (Note) |
||||||||
| Others |
||||||||
| |
|
|
|
|||||
| |
|
|
|
|||||
2022 RMB million |
2021 RMB million |
|||||||
| Balance at January 1 |
||||||||
| -Current |
||||||||
| -Non-current |
||||||||
| Addition as a result of increase of the unredeemed credits under the frequent flyer award programs |
||||||||
| Reduction as a result of revenue recognized during the year |
( |
) | ( |
) | ||||
| -Recognized as revenue from opening balance of contract liabilities |
( |
) | ( |
) | ||||
| -Recognized as revenue from current year addition of contract liabilities |
( |
) | ( |
) | ||||
| Balance at December 31 |
||||||||
| |
|
|
|
|||||
| Representing: |
||||||||
| -Current |
||||||||
| -Non-current (Note 41) |
||||||||
40 |
Sales in advance of carriage |
41 |
Other non-current liabilities |
Note |
2022 RMB million |
2021 RMB million |
||||||||
| Unredeemed credits under the frequent flyer award programs |
39 | |||||||||
| Long-term payables (Note) |
||||||||||
| Others |
||||||||||
| |
|
|
|
|||||||
| |
|
|
|
|||||||
| Note: | In 2020 and 2022, the Group disposed certain aircraft through sale and leaseback agreement, and the long-term payables were additional financing provided by buyer-lessor to the Group in aircraft sale and leaseback transactions. As at December 31, 2022, long-term payables (including the portion due within one year) was RMB |
42 |
Balances with related companies |
(a) |
Amounts due from related companies |
Note |
2022 RMB million |
2021 RMB million |
||||||||||
| Current |
||||||||||||
| CSAH and its affiliates |
||||||||||||
| Associates |
||||||||||||
| Joint ventures |
||||||||||||
| Other related compan ies |
||||||||||||
| |
|
|
|
|||||||||
| 50(c) | ||||||||||||
| |
|
|
|
|||||||||
2022 |
2021 |
|||||||||||
RMB million |
RMB million |
|||||||||||
| Non-current |
||||||||||||
| Associates |
50(c) | |||||||||||
| |
|
|
|
|||||||||
(b) |
Prepayments to related companies for acquisition of long-term assets |
Note |
2022 RMB million |
2021 RMB million |
||||||||
| Non-current |
||||||||||
| CSAH and its affiliates |
||||||||||
| Associates |
||||||||||
| Joint ventures |
||||||||||
| |
|
|
|
|||||||
| 30&50(c) | ||||||||||
| |
|
|
|
|||||||
42 |
Balances with related companies (continued) |
(c) |
Amounts due to related companies |
Note |
2022 RMB million |
2021 RMB million |
||||||||
| Current |
||||||||||
| CSAH and its affiliates |
||||||||||
| Associates |
||||||||||
| Joint ventures |
||||||||||
| |
|
|
|
|||||||
| 50(c) | |
|||||||||
| |
|
|
|
|||||||
2022 RMB million |
2021 RMB million |
|||||||||
| Non-current |
||||||||||
| CSAH and its affiliates |
50(c) |
|||||||||
| |
|
|
|
|
|
|
|
|
|
|
43 |
Accrued expenses |
2022 RMB million |
2021 RMB million |
|||||||
| Repairs and maintenance |
||||||||
| Salaries and welfare |
||||||||
| Landing and navigation fees |
||||||||
| Jet fuel costs |
||||||||
| Computer reservation services |
||||||||
| Provision for major overhauls (Note 45) |
||||||||
| Air catering expenses |
||||||||
| Others |
||||||||
| |
|
|
|
|||||
| |
|
|
|
|||||
44 |
Other liabilities |
2022 RMB million |
2021 RMB million |
|||||||
| Payable for purchase of property, plant and equipment |
||||||||
| Civil Aviation Development Fund and airport tax payable |
||||||||
| Sales agent deposits |
||||||||
| Other taxes payable |
||||||||
| Deposit received for chartered flights |
||||||||
| Others |
||||||||
| |
|
|
|
|||||
| |
|
|
|
|||||
45 |
Provision for major overhauls |
2022 |
2021 |
|||||||
RMB million |
RMB million |
|||||||
At January 1 |
||||||||
Additional provision |
||||||||
Utilization |
( |
) | ( |
) | ||||
At December 31 |
||||||||
Less: current portion (Note 43) |
( |
) | ( |
) | ||||
46 |
Deferred benefits and gains |
2022 |
2021 |
|||||||
RMB million |
RMB million |
|||||||
Maintenance rebates |
||||||||
Government grants |
||||||||
Others |
||||||||
47 |
Share capital |
2022 |
2021 |
|||||||
RMB million |
RMB million |
|||||||
Registered, issued and paid - up capital: |
||||||||
Trade-restricted: |
||||||||
Tradable: |
||||||||
| (i) | All the A and H shares rank pari passu in all material respects. |
| (ii) | In November 2022, the Company issued |
| (iii) | In August 2022, the Company issued |
48 |
Reserves |
(a) |
Dividends |
(b) |
Share premium |
(c) |
Fair value reserve (non-recycling) |
(d) |
Other reserves |
49 |
Commitments |
(a) |
Capital commitments |
2022 |
2021 |
|||||||||||
RMB million |
RMB million |
|||||||||||
| Commitments in respect of aircraft, engines and flight equipment |
|
|
|
|
||||||||
| – authorized and contracted for |
|
|
|
|
||||||||
| |
|
|
|
|
|
|
|
|||||
| Investment commitments |
|
|
|
|
||||||||
| – authorized and contracted for |
|
|
|
|
||||||||
| -share of capital commitments of a joint venture |
|
|
|
|
||||||||
| -capital contributions for acquisition of interests in an associate |
|
|
|
|
||||||||
| – authorized but not contracted for |
|
|
|
|
||||||||
| -share of capital commitments of a joint venture |
|
|
|
|
||||||||
| |
|
|
|
|
|
|
|
|||||
| |
|
|
|
|
||||||||
| |
|
|
|
|
|
|
|
|||||
| Commitments for other property, plant and equipment |
|
|
|
|
||||||||
| – authorized and contracted for |
|
|
|
|
||||||||
| – authorized but not contracted for |
|
|
|
|
||||||||
| |
|
|
|
|
|
|
|
|||||
| |
|
|
|
|||||||||
| |
|
|
|
|
|
|
|
|||||
| |
|
|
|
|||||||||
| |
|
|
|
|
|
|
|
|||||
2022 |
2021 |
|||||||
RMB million |
RMB million |
|||||||
| 2022 |
|
|||||||
| 2023 |
||||||||
| 2024 |
||||||||
| 2025 |
||||||||
| 2026 and the years after 2026 |
||||||||
| |
|
|
|
|||||
| |
|
|
|
|||||
50 |
Material related party transactions |
(a) |
Key management personnel remuneration |
2022 |
2021 |
2020 |
||||||||||
RMB ’000 |
RMB ’000 |
RMB ’000 |
||||||||||
Salaries, wages and welfare |
||||||||||||
Retirement scheme contributions |
||||||||||||
2022 |
2021 |
2020 |
||||||||||
RMB ’000 |
RMB ’000 |
RMB ’000 |
||||||||||
Directors and supervisors (Note 5 7 ) |
||||||||||||
Senior management |
||||||||||||
50 |
Material related party transactions (continued) |
(b) |
Transactions with CSAH and its affiliates, associates, joint ventures and other related companies of the Group |
2022 |
2021 |
2020 |
||||||||||||
Note |
RMB million |
RMB million |
RMB million |
|||||||||||
Income from CSAH and its affiliates |
||||||||||||||
Rental income |
(i) | |||||||||||||
Aviation material sales income |
(ii) | |||||||||||||
Entrusted management income |
(iii) | |||||||||||||
Commission income |
(iv) | |||||||||||||
Others |
||||||||||||||
Purchase of goods and services from CSAH and its affiliates |
||||||||||||||
Commission expenses and service fee |
(v) | |||||||||||||
Maintenance material purchase expense and lease charges for maintenance materials |
(ii) | |||||||||||||
Air catering supplies expenses |
(i) | |||||||||||||
Lease charges for land and buildings |
(vi) | |||||||||||||
Property management fee |
(vii) | |||||||||||||
Construction fee |
(xx) | |||||||||||||
Others |
||||||||||||||
Purchase of goods and services from joint ventures and associates |
||||||||||||||
Repairing charges |
(viii) | |||||||||||||
Repairing charges and maintenance material purchase expenses |
(ix) | |||||||||||||
Ground service expenses |
(x) | |||||||||||||
Air catering supplies |
(xi) | |||||||||||||
Advertising expenses |
(xii) | |||||||||||||
Property management fee |
(xiii) | |||||||||||||
Lease charges for land and buildings |
(xiv) | |||||||||||||
Commission expenses |
(xv) | |||||||||||||
Others |
||||||||||||||
Income received from joint ventures and associates |
||||||||||||||
Maintenance material sales and handling income |
(xvi) | |||||||||||||
Entrustment income for advertising media business |
(xii) | |||||||||||||
Repairing income |
(xv) | |||||||||||||
Air catering supplies income |
(xv) | |||||||||||||
Pilot training income |
(xv) | |||||||||||||
Ground service income |
(xv) | |||||||||||||
Transfer of pilots income |
(xv) | |||||||||||||
Aircraft leasing income |
(xvii) | |||||||||||||
Others |
||||||||||||||
50 |
Material related party transactions (continued) |
(b) |
Transactions with CSAH and its affiliates, associates, joint ventures and other related companies of the Group (continued) |
Note |
2022 |
2021 |
2020 |
|||||||||||
RMB million |
RMB million |
RMB million |
||||||||||||
| Purchase of goods and services from other related companies |
||||||||||||||
| Computer reservation services |
(xviii) | |||||||||||||
| Aircraft related transactions with CSAH and its affiliates |
||||||||||||||
| Payment of lease charges on aircraft |
(xix) | |||||||||||||
| (i) | Shenzhen Air Catering Co., Ltd. (“SACC”) is an associate of CSAH. |
| (ii) | China Aviation Supplies Holding Company (“CASC”) is an associate of CSAH. |
| (iii) | China Northern Airlines Co., Ltd. (“CNAC”) is a wholly-owned subsidiary of CSAH. |
| (iv) | China Southern Airlines Insurance Brokerage Co., Ltd. (“SAIB”), is a wholly-owned subsidiary of CSAH. The Group provides certain website resources to SAIB for the sales of air insurance. |
| (v) | Commission is earned by Shenzhen Baiyun Air Service Co.,Ltd., a wholly-owned subsidiary of CSAH, in connection with the air tickets sold by them on behalf of the Group. Commission is calculated based on the rates stipulated by the Civil Aviation Administration of China and International Air Transportation Association. |
| Service fee is earned by Shenzhen Baiyun Air Service Co., Ltd., a wholly-owned subsidiary of CSAH, for providing transportation and accommodation services to the Group. Service fee is calculated based on the rates stipulated by the Civil Aviation Administration of China and International Air Transportation Association. |
| (vi) | The Group leases certain land and buildings in the PRC from CSAH and its affiliates. The amount represents rental expenses for land and buildings paid or payable to CSAH and its affiliates. |
(vii) |
China Merchants Property Operation & Service Co., Ltd (previous name: China Southern Airlines Group Property Management Co., Ltd.), became an associate of CSAH in 2022, provides property management services to the Group. |
(viii) |
MTU, a joint venture of the Group, provides comprehensive maintenance services to the Group. |
50 |
Material related party transactions (continued) |
(b) |
Transactions with CSAH and its affiliates, associates, joint ventures and other related companies of the Group (continued) |
(ix) |
GAMECO, a joint venture of the Group, provides comprehensive maintenance services to the Group. |
(x) |
Beijing Aviation Ground Services Co.,Ltd. and Shenyang Konggang, associates of the Group, provide ground services to the Group. |
(xi) |
Beijing Airport Inflight Kitchen Co.,Ltd. is an associate of the Group and provides air catering related services to the Group. |
(xii) |
SACM, an associate of the Group, provides advertising services to the Group. The Group provides certain media resources to SACM. |
(xiii) |
Xinjiang Civil Aviation Property Management Ltd., an associate of the Group, provides property management services to the Group. |
(xiv) |
Beijing Xingming Lake Jinyan Hotel Co., Ltd. an associate of the Group, provides land and buildings lease services to the Group. |
(xv) |
The Group provides repairing service and air catering supplies service to Sichuan Airlines. |
(xvi) |
The Group imports and sells maintenance materials to GAMECO and MTU, and earns maintenance materials sales and handling income. |
(xvii) |
The Group provides aircraft lease service to Sichuan Airlines and earns aircraft leasing income. |
(xviii) |
China Travel Sky Holding Company is a related party of the Group as a key management personnel of the Group was appointed as the director of China Travel Sky Holding Company. It provides computer reservation services to the Group. |
(xix) |
China Southern Airlines International Finance Leasing Co., Ltd. (“CSA International”), a joint venture of CSAH, provides aircraft and engines lease services to the Group. |
(xx) |
Guangzhou Southern Airlines Construction Co., Ltd., a wholly-owned subsidiary of CSAH, provides construction services to the Group. |
50 |
Material related party transactions (continued) |
(c) |
Balances with CSAH and its affiliates, associates, joint ventures and other related companies of the Group |
2022 |
2021 |
|||||||||
Note |
RMB million |
RMB million |
||||||||
| Current receivables: |
||||||||||
| CSAH and its affiliates |
||||||||||
| Associates |
||||||||||
| Joint ventures |
||||||||||
| Other related compan ies |
||||||||||
| |
|
|
|
|||||||
| 42(a) | ||||||||||
| |
|
|
|
|||||||
2022 |
2021 |
|||||||||
Note |
RMB million |
RMB million |
||||||||
| Long-term receivables: |
||||||||||
| Associates |
42(a) |
|||||||||
2022 |
2021 |
|||||||||
Note |
RMB million |
RMB million |
||||||||
| Prepayments of acquisition of long-term assets: |
||||||||||
| CSAH and its affiliates |
||||||||||
| Associates |
||||||||||
| Joint ventures |
||||||||||
| |
|
|
|
|||||||
| 30&42(b) | ||||||||||
| |
|
|
|
|||||||
2022 |
2021 |
|||||||||
Note |
RMB million |
RMB million |
||||||||
| Payables: |
||||||||||
| CSAH and its affiliates |
||||||||||
| Associates |
||||||||||
| Joint ventures |
||||||||||
| |
|
|
|
|||||||
| 42(c) | ||||||||||
| |
|
|
|
|||||||
2022 |
2021 |
|||||||||
Note |
RMB million |
RMB million |
||||||||
| Long-term payables: |
||||||||||
| CSAH and its affiliates |
42(c) |
|||||||||
50 |
Material related party transactions (continued) |
(c) |
Balances with CSAH and its affiliates, associates, joint ventures and other related companies of the Group (continued) |
2022 |
2021 |
|||||||
RMB million |
RMB million |
|||||||
| Accrued expenses: |
||||||||
| CSAH and its affiliates |
||||||||
| Associates |
||||||||
| Joint ventures |
||||||||
| Other related companies |
||||||||
| |
|
|
|
|||||
| |
|
|
|
|||||
| Lease liabilities: |
||||||||
| CSAH and its affiliates |
||||||||
| Associates |
||||||||
| |
|
|
|
|||||
| |
|
|
|
|||||
(d) |
Loans from and deposits placed with related parties |
(i) |
Loans from Finance Company |
2022 |
2021 |
|||||||
RMB million |
RMB million |
|||||||
| Within 1 year |
||||||||
| After 1 year but within 2 years |
||||||||
| |
|
|
|
|||||
| |
|
|
|
|||||
50 |
Material related party transactions (continued) |
(d) |
Loans from and deposits placed with related parties (continued) |
(ii) |
Entrusted loans from CSAH |
(iii) |
Convertible bonds subscribed by CSAH |
(iv) |
Medium-term notes subscribed by Finance Company |
(v) |
Deposits placed with Finance Company |
2022 |
2021 |
|||||||
RMB million |
RMB million |
|||||||
Deposits placed with Finance Company |
||||||||
51 |
Employee benefits plan |
(a) |
Retirement benefits |
(b) |
Housing benefits |
52 |
Supplementary information to the consolidated cash flow statement |
2022 |
2021 |
|||||||
RMB million |
RMB million |
|||||||
Lease of aircraft |
||||||||
Convertible bonds converted to A shares |
— | |||||||
53 |
Contingent liabilities |
(a) |
The Group leased certain properties and buildings from CSAH which were located in Guangzhou, Wuhan, Haikou, etc. Although such properties and buildings were used by CSAH before being leased to the Group, as known to the Group, such properties and buildings lack adequate documentation evidencing CSAH’s rights thereto. Pursuant to the indemnification agreement dated May 22, 1997 entered into between the Group and CSAH, CSAH has agreed to indemnify the Group against any loss or damage arising from any challenge of the Group’s right to use the aforementioned properties and buildings. |
(b) |
The Group entered into certain agreements with CSAH in prior years to acquire certain land use right and buildings from CSAH. The change of business registration of such land use right and buildings are still in progress. CSAH issued letters of commitment to the Company, committing to indemnify the Group against any claims from third parties to the Group, or any loss or damage in the Group’s operation activities due to lack adequate documentation of the certain properties and buildings, without recourse to the Group. |
(c) |
The Company and its subsidiary, Xiamen Airlines, entered into agreements with certain pilot trainees and certain banks to provide guarantees on personal bank loans amounting to RMB |
54 |
Immediate and ultimate controlling party |
55 |
Approval of financial statements |
56 |
Non-adjusting events after the financial year end |
5 7 |
Directors’ and supervisors’ emoluments |
| Name | Directors’ fees |
Salaries, wages and welfare |
Housing allowance |
Employer’s contribution to a retirement benefit scheme |
Total | |||||||||||||||
RMB ’000 |
RMB ’000 |
RMB ’000 |
RMB ’000 |
RMB ’000 |
||||||||||||||||
Executive directors |
||||||||||||||||||||
Ma Xu Lun (Note (i)) |
||||||||||||||||||||
Han Wen Sheng (Note (i)) |
||||||||||||||||||||
Luo Lai Jun (Note (i)&(v)) |
||||||||||||||||||||
Supervisors |
||||||||||||||||||||
Ren Ji Dong (Note (ii)) |
||||||||||||||||||||
Lin Xiao Chun |
||||||||||||||||||||
Yang Bin |
||||||||||||||||||||
Independent non-executive directors |
||||||||||||||||||||
Liu Chang Le |
||||||||||||||||||||
Guo Wei |
||||||||||||||||||||
Yan Yan (Note (iv)) |
||||||||||||||||||||
Gu Hui Zhong |
||||||||||||||||||||
Cai Hong Ping (Note (v)) |
||||||||||||||||||||
5 7 |
Directors’ and supervisors’ emoluments (continued) |
| Name | Directors’ fees |
Salaries, wages and welfare |
Housing allowance |
Employer’s contribution to a retirement benefit scheme |
Total | |||||||||||||||
RMB ’000 |
RMB ’000 |
RMB ’000 |
RMB ’000 |
RMB ’000 |
||||||||||||||||
Executive directors |
||||||||||||||||||||
Ma Xu Lun (Note (i)) |
||||||||||||||||||||
Han Wen Sheng (Note (i)) |
||||||||||||||||||||
Supervisors |
||||||||||||||||||||
Ren Ji Dong (Note (ii)&(xi)) |
||||||||||||||||||||
Lin Xiao Chun |
||||||||||||||||||||
Yang Bin (Note (ix)) |
||||||||||||||||||||
Li Jia Shi (Note (iii)&(x)) |
||||||||||||||||||||
Mao Juan (Note (viii)) |
||||||||||||||||||||
Independent non-executive directors |
||||||||||||||||||||
Liu Chang Le (Note (vii)) |
||||||||||||||||||||
Guo Wei (Note (vii)) |
||||||||||||||||||||
Yan Yan (Note (vii)) |
||||||||||||||||||||
Gu Hui Zhong |
||||||||||||||||||||
Tan Jin Song (Note (vi)) |
||||||||||||||||||||
Jiao Shu Ge (Note (vi)) |
||||||||||||||||||||
Zheng Fan (Note (vi)) |
||||||||||||||||||||
5 7 |
Directors’ and supervisors’ emoluments (continued) |
| Name | Directors’ fees |
Salaries, wages and welfare |
Housing allowance |
Employer’s contribution to a retirement benefit scheme |
Total | |||||||||||||||
RMB ’000 |
RMB ’000 |
RMB ’000 |
RMB ’000 |
RMB ’000 |
||||||||||||||||
Executive directors |
||||||||||||||||||||
Wang Chang Shun (Note (i)&(xii)) |
||||||||||||||||||||
Ma Xu Lun (Note (i)) |
||||||||||||||||||||
Han Wen Sheng (Note (i)) |
||||||||||||||||||||
Supervisors |
||||||||||||||||||||
Li Jia Shi (Note (iii)&(x)) |
||||||||||||||||||||
Mao Juan |
||||||||||||||||||||
Lin Xiao Chun |
||||||||||||||||||||
Independent non-executive directors |
||||||||||||||||||||
Tan Jin Song |
||||||||||||||||||||
Jiao Shu Ge |
||||||||||||||||||||
Zheng Fan (Note (xiii)) |
||||||||||||||||||||
Gu Hui Zhong (Note (xiii)) |
||||||||||||||||||||
Notes: |
(i) |
These directors did not receive any remuneration for their services in the capacity of the directors of the Company. They also held management positions in CSAH and their salaries were borne by CSAH. |
(ii) |
Mr. Ren Ji Dong did not receive any remuneration for his service in the capacity of the supervisor of the Company in 2022 and 2021 but received salary for his service in the capacity of the senior management in 2021. He also held management position in CSAH and his salary for his services was borne by CSAH since November 2021. |
(iii) |
Mr. Li Jia Shi did not receive any remuneration for his service in the capacity of the supervisor of the Company since February 1, 2018. He also held management position in CSAH and his salary was borne by CSAH. |
(iv) |
Resigned on October 28, 2022. |
(v) |
Appointed on December 28, 2022. |
(vi) |
Resigned on April 30, 2021. |
(vii) |
Appointed on April 30, 2021. |
(viii) |
Resigned on November 24, 2021. |
57 |
Directors’ and supervisors’ emoluments (continued) |
(ix) |
Appointed on November 24, 2021. |
(x) |
Resigned on December 28, 2021. |
(xi) |
Appointed on December 28, 2021. |
(xii) |
Mr. Wang Chang Shun retired on December 21, 2020. |
(xiii) |
In 2020, Mr. Zheng Fan and Mr. Gu Hui Zhong received remuneration in accordance with the relevant provisions of the PRC. |
5 8 |
Possible impact of amendments, new standards and interpretations issued but not yet effective for the year ended December 31, 2022 |
Effective for accounting periods beginning on or after |
||||
| IFRS 17, Insurance contracts |
||||
| Amendments to IAS 1, Presentation of financial statements Making materiality judgements: Disclosure of accounting policies |
||||
| Amendments to IAS 8, Accounting policies, changes in accounting estimates and errors: Definition of accounting estimates |
||||
| Amendments to IAS 12, Income taxes Deferred tax related to assets and liabilities arising from a single transaction |
||||
| Amendments to IAS 1, Presentation of financial statements: Classification of liabilities as current or non-current |
||||
Amendments to IAS 1, Presentation of financial statements: Non-current liabilities with covenants |
||||
Amendments to IFRS 16, Leases: Lease liability in a sale and leaseback |
||||