UNITED STATES
SECURITIES AND EXCHANGE COMMISSION
Washington, D.C. 20549
FORM | ||||||||
| ANNUAL REPORT PURSUANT TO SECTION 13 OR 15(d) OF THE SECURITIES EXCHANGE ACT OF 1934 | |||||
For the fiscal year ended December 31 , 2023
or
| TRANSITION REPORT PURSUANT TO SECTION 13 OR 15(d) OF THE SECURITIES EXCHANGE ACT OF 1934 | |||||
For the transition period from to
Commission File Number: 0-9286

(Exact name of registrant as specified in its charter)
| (State or other jurisdiction of incorporation or organization) | (I.R.S. Employer Identification No.) | |||||||||||||
| (Address of principal executive offices) | (Zip Code) | |||||||||||||
Registrant’s telephone number, including area code: (980 ) 392-8298
Securities registered pursuant to Section 12(b) of the Act:
| Title of each class | Trading Symbol(s) | Name of each exchange on which registered | ||||||
| Securities registered pursuant to Section 12(g) of the Act: None | ||||||||
Indicate by check mark if the registrant is a well-known seasoned issuer, as defined in Rule 405 of the Securities Act. Yes ☒ No ☐
Indicate by check mark if the registrant is not required to file reports pursuant to Section 13 or Section 15(d) of the Act. Yes ☐ No ☒
Indicate by check mark whether the registrant (1) has filed all reports required to be filed by Section 13 or 15(d) of the Securities Exchange Act of 1934 during the preceding 12 months (or for such shorter period that the registrant was required to file such reports), and (2) has been subject to such filing requirements for the past 90 days. Yes ☒ No ☐
Indicate by check mark whether the registrant has submitted electronically every Interactive Data File required to be submitted pursuant to Rule 405 of Regulation S-T (§232.405 of this chapter) during the preceding 12 months (or for such shorter period that the registrant was required to submit such files). Yes ☒ No ☐
Indicate by check mark whether the registrant is a large accelerated filer, an accelerated filer, a non-accelerated filer, a smaller reporting company, or an emerging growth company. See the definitions of “large accelerated filer,” “accelerated filer,” “smaller reporting company,” and “emerging growth company” in Rule 12b-2 of the Exchange Act.
☒ | Accelerated filer | ☐ | ||||||||||||
| Non-accelerated filer | ☐ | Smaller reporting company | ||||||||||||
| Emerging growth company | ||||||||||||||
If an emerging growth company, indicate by check mark if the registrant has elected not to use the extended transition period for complying with any new or revised financial accounting standards provided pursuant to Section 13(a) of the Exchange Act. ☐
Indicate by check mark whether the registrant has filed a report on and attestation to its management’s assessment of the effectiveness of its internal control over financial reporting under Section 404(b) of the Sarbanes-Oxley Act (15 U.S.C. 7262(b)) by the registered public accounting firm that prepared or issued its audit report. ☒
If securities are registered pursuant to Section 12(b) of the Act, indicate by check mark whether the financial statements of the registrant included in the filing reflect the correction of an error to previously issued financial statements. ☐
Indicate by check mark whether any of those error corrections are restatements that required a recovery analysis of incentive-based compensation received by any of the registrant’s executive officers during the relevant recovery period pursuant to §240.10D-1(b). ☐
Indicate by check mark whether the registrant is a shell company (as defined in Rule 12b-2 of the Act). Yes ☐ No ☒
State the aggregate market value of the voting and non-voting common equity held by non-affiliates computed by reference to the price at which the common equity was last sold, or the average bid and asked price of such common equity, as of the last business day of the registrant’s most recently completed second fiscal quarter.
Class | Market Value as of June 30, 2023 | |||||||
| Common Stock, par value $l.00 per share | $ | |||||||
| Class B Common Stock, par value $l.00 per share | * | |||||||
*No market exists for the Class B Common Stock, which is neither registered under Section 12 of the Act nor subject to Section 15(d) of the Act. The Class B Common Stock is convertible into Common Stock on a share-for-share basis at any time at the option of the holder.
Indicate the number of shares outstanding of each of the registrant’s classes of common stock, as of the latest practicable date.
Class | Outstanding as of January 26, 2024 | |||||||
| Common Stock, par value $1.00 per share | ||||||||
| Class B Common Stock, par value $1.00 per share | ||||||||
DOCUMENTS INCORPORATED BY REFERENCE
Portions of the registrant’s definitive proxy statement to be filed with the United States Securities and Exchange Commission in connection with the registrant’s 2024 Annual Meeting of Stockholders are incorporated by reference in Part III of this report to the extent described herein.
COCA‑COLA CONSOLIDATED, INC.
ANNUAL REPORT ON FORM 10‑K
FOR THE FISCAL YEAR ENDED DECEMBER 31, 2023
TABLE OF CONTENTS
| Page | ||||||||
i
PART I
Item 1.Business.
Introduction
Coca‑Cola Consolidated, Inc., a Delaware corporation (together with its majority-owned subsidiaries, “Coca‑Cola Consolidated,” the “Company,” “we,” “us” or “our”), distributes, markets and manufactures nonalcoholic beverages in territories spanning 14 states and the District of Columbia. The Company was incorporated in 1980 and, together with its predecessors, has been in the nonalcoholic beverage manufacturing and distribution business since 1902. We are the largest Coca‑Cola bottler in the United States. Approximately 85% of our total bottle/can sales volume to retail customers consists of products of The Coca‑Cola Company, which include some of the most recognized and popular beverage brands in the world. We also distribute products for several other beverage companies, including Keurig Dr Pepper Inc. (“Dr Pepper”) and Monster Energy Company (“Monster Energy”). Our Purpose is to honor God in all we do, to serve others, to pursue excellence and to grow profitably.
Ownership
As of December 31, 2023, J. Frank Harrison, III, Chairman of the Board of Directors and Chief Executive Officer of the Company, controlled 1,004,394 shares of the Company’s Class B Common Stock, which represented approximately 71% of the total voting power of the Company’s outstanding Common Stock and Class B Common Stock on a consolidated basis. As of December 31, 2023, The Coca‑Cola Company owned shares of the Company’s Common Stock representing approximately 9% of the total voting power of the Company’s outstanding Common Stock and Class B Common Stock on a consolidated basis. The number of shares of the Company’s Common Stock currently held by The Coca‑Cola Company gives it the right to have a designee proposed by the Company for nomination to the Company’s Board of Directors in the Company’s annual proxy statement. J. Frank Harrison, III and the trustees of certain trusts established for the benefit of certain relatives of the late J. Frank Harrison, Jr. have agreed to vote the shares of the Company’s Common Stock and Class B Common Stock that they control in favor of such designee. The Coca‑Cola Company does not own any shares of the Company’s Class B Common Stock.
Beverage Products
We offer a range of nonalcoholic beverage products and flavors, including both sparkling and still beverages, designed to meet the demands of our consumers. Sparkling beverages are carbonated beverages and the Company’s principal sparkling beverage is Coca‑Cola. Still beverages include energy products and noncarbonated beverages such as bottled water, ready to drink tea, ready to drink coffee, enhanced water, juices and sports drinks.
Our sales are divided into two main categories: (i) bottle/can sales and (ii) other sales. Bottle/can sales include products packaged primarily in plastic bottles and aluminum cans. Other sales include sales to other Coca‑Cola bottlers, post-mix sales, transportation revenue and equipment maintenance revenue. Post-mix products are dispensed through equipment that mixes fountain syrups with carbonated or still water, enabling fountain retailers to sell finished products to consumers in cups or glasses.
The following table sets forth some of our principal products, including products of The Coca‑Cola Company and products licensed to us by other beverage companies:
| Sparkling Beverages | Still Beverages | |||||||||||||||||||||||||
| The Coca-Cola Company Products: | ||||||||||||||||||||||||||
| Barqs Root Beer | Fanta Zero Sugar | BODYARMOR | Minute Maid | |||||||||||||||||||||||
| Coca-Cola | Fresca | Core Power | POWERade | |||||||||||||||||||||||
| Coca-Cola Cherry | Mello Yello | Dasani | Tum-E Yummies | |||||||||||||||||||||||
| Coca-Cola Vanilla | Pibb Xtra | fairlife | ||||||||||||||||||||||||
| Coca-Cola Zero Sugar | Seagrams Ginger Ale | glacéau smartwater | ||||||||||||||||||||||||
| Diet Coke | Sprite | glacéau vitaminwater | ||||||||||||||||||||||||
| Fanta | Sprite Zero Sugar | Gold Peak | ||||||||||||||||||||||||
| Products Licensed to Us by Other Beverage Companies: | ||||||||||||||||||||||||||
| Diet Dr Pepper | Sundrop | Bang Energy | Monster Energy | |||||||||||||||||||||||
| Diet Sundrop | Dunkin’ Coffee | NOS® | ||||||||||||||||||||||||
| Dr Pepper | Full Throttle | Reign/Reign Storm | ||||||||||||||||||||||||
1
Beverage Distribution and Manufacturing Agreements
We have rights to distribute, promote, market and sell certain nonalcoholic beverages of The Coca‑Cola Company pursuant to comprehensive beverage agreements (collectively, the “CBA”) with The Coca‑Cola Company and Coca‑Cola Refreshments USA, Inc. (“CCR”), a wholly owned subsidiary of The Coca‑Cola Company. The CBA relates to a multi-year series of transactions, which were completed in October 2017, through which the Company acquired and exchanged distribution territories and manufacturing plants. The CBA requires the Company to make quarterly acquisition related sub-bottling payments to CCR on a continuing basis in exchange for the grant of exclusive rights to distribute, promote, market and sell the authorized brands of The Coca‑Cola Company and related products in certain distribution territories the Company acquired from CCR. In addition to customary termination and default rights, the CBA requires us to make minimum, ongoing capital expenditures in our distribution business and to meet certain minimum volume requirements, gives The Coca‑Cola Company certain approval and other rights in connection with a sale of the Company or the distribution business of the Company and prohibits us from producing, manufacturing, preparing, packaging, distributing, selling, dealing in or otherwise using or handling any beverages, beverage components or other beverage products other than the beverages and beverage products of The Coca‑Cola Company and certain expressly permitted cross-licensed brands without the consent of The Coca-Cola Company.
We also have rights to manufacture, produce and package certain beverages bearing trademarks of The Coca‑Cola Company at our manufacturing plants pursuant to a regional manufacturing agreement with The Coca‑Cola Company entered into on March 31, 2017 (as amended, the “RMA”). We may distribute these beverages for our own account in accordance with the CBA or may sell them to certain other U.S. Coca‑Cola bottlers or to The Coca‑Cola Company in accordance with the RMA. For prices determined pursuant to the RMA, The Coca‑Cola Company unilaterally establishes from time to time the prices, or certain elements of the formulas used to determine the prices, that the Company charges for these sales to certain other U.S. Coca‑Cola bottlers or to The Coca‑Cola Company. The RMA contains provisions similar to those contained in the CBA restricting the sale of the Company or the manufacturing business of the Company, requiring minimum, ongoing capital expenditures in our manufacturing business, prohibiting us from manufacturing any beverages, beverage components or other beverage products other than the beverages and beverage products of The Coca‑Cola Company and certain expressly permitted cross-licensed brands without the consent of The Coca‑Cola Company and allowing for the termination of the RMA.
In addition to our agreements with The Coca‑Cola Company and CCR, we also have rights to manufacture and/or distribute certain beverage brands owned by other beverage companies, including Dr Pepper and Monster Energy, pursuant to agreements with such other beverage companies. Our distribution agreements with Dr Pepper permit us to distribute Dr Pepper beverage brands, as well as certain post-mix products of Dr Pepper. Certain of our agreements with Dr Pepper also authorize us to manufacture certain Dr Pepper beverage brands. Our distribution agreements with Monster Energy grant us the rights to distribute certain products offered, packaged and/or marketed by Monster Energy. Similar to the CBA, these beverage agreements contain restrictions on the use of trademarks and approved bottles, cans and labels and the sale of imitations or substitutes, as well as provisions for their termination for cause or upon the occurrence of other events defined in these agreements. Sales of beverages under these agreements with other beverage companies represented approximately 15%, 14% and 17% of our total bottle/can sales volume to retail customers in 2023, 2022 and 2021, respectively.
Finished Goods Supply Arrangements
We have finished goods supply arrangements with other U.S. Coca‑Cola bottlers to sell and buy finished goods bearing trademarks owned by The Coca‑Cola Company and produced by us in accordance with the RMA or produced by a selling U.S. Coca‑Cola bottler in accordance with a similar regional manufacturing authorization held by such bottler. Pursuant to the RMA, The Coca‑Cola Company unilaterally establishes from time to time the prices, or certain elements of the formulas used to determine the prices, for such finished goods. In most instances, the Company’s ability to negotiate the prices at which it sells finished goods bearing trademarks owned by The Coca‑Cola Company to, and the prices at which it purchases such finished goods from, other U.S. Coca‑Cola bottlers is limited pursuant to these pricing provisions.
Other Agreements Related to the Coca‑Cola System
We have other agreements with The Coca‑Cola Company, CCR and other Coca‑Cola bottlers regarding product supply, information technology services and other aspects of the North American Coca‑Cola system, as described below. Many of these agreements involve system governance structures that require the Company’s management to closely collaborate and align with other participating bottlers in order to successfully implement Coca‑Cola system plans and strategies.
Incidence-Based Pricing Agreement with The Coca‑Cola Company
The Company has an incidence-based pricing agreement with The Coca‑Cola Company, which establishes the prices charged by The Coca‑Cola Company to the Company for (i) concentrates of sparkling and certain still beverages produced by the Company and
2
(ii) certain purchased still beverages. Under the incidence-based pricing agreement, the prices charged by The Coca‑Cola Company are impacted by a number of factors, including the incidence rate in effect, our pricing and sales of finished products, the channels in which the finished products are sold, the package mix and, in the case of products sold by The Coca‑Cola Company to us in finished form, the cost of goods for certain elements used in such products. The Coca‑Cola Company has no rights under the incidence-based pricing agreement to establish the prices, or the elements of the formulas used to determine the prices, at which we sell products, but does have the right to establish certain pricing under other agreements, including the RMA.
National Product Supply Governance Agreement
We are a member of a national product supply group (the “NPSG”), which is comprised of The Coca‑Cola Company, the Company and certain other Coca‑Cola bottlers who are regional producing bottlers in The Coca‑Cola Company’s national product supply system (collectively with the Company, the “NPSG Members”), pursuant to a national product supply governance agreement executed in 2015 with The Coca‑Cola Company and certain other Coca‑Cola bottlers (as amended, the “NPSG Agreement”). The stated objectives of the NPSG include, among others, (i) Coca‑Cola system strategic infrastructure investment and divestment planning; (ii) network optimization of plant to distribution center sourcing; and (iii) new product or packaging infrastructure planning.
Under the NPSG Agreement, the NPSG Members established certain governance mechanisms, including a governing board (the “NPSG Board”) comprised of representatives of certain NPSG Members. The NPSG Board makes and/or oversees and directs certain key decisions regarding the NPSG. Subject to the terms and conditions of the NPSG Agreement, each NPSG Member is required to comply with certain key decisions made by the NPSG Board, which include decisions regarding strategic infrastructure investment and divestment planning, optimal national product supply sourcing and new product or packaging infrastructure planning. We are also obligated to pay a certain portion of the costs of operating the NPSG.
CONA Services LLC
Along with certain other Coca‑Cola bottlers, we are a member of CONA Services LLC (“CONA”), an entity formed to provide business process and information technology services to its members. We are party to an amended and restated master services agreement with CONA, pursuant to which CONA agreed to make available, and we became authorized to use, the Coke One North America system (the “CONA System”), a uniform information technology system developed to promote operational efficiency and uniformity among North American Coca‑Cola bottlers. As part of making the CONA System available to us, CONA provides us with certain business process and information technology services, including the planning, development, management and operation of the CONA System in connection with our direct store delivery and manufacture of products. In exchange for our rights to use the CONA System and receive CONA-related services, we are charged service fees by CONA, which we are obligated to pay even if we are not using the CONA System for all or any portion of our distribution and manufacturing operations.
Amended and Restated Ancillary Business Letter
On March 31, 2017, we entered into an amended and restated ancillary business letter with The Coca‑Cola Company (the “Ancillary Business Letter”), pursuant to which we were granted advance waivers to acquire or develop certain lines of business involving the preparation, distribution, sale, dealing in or otherwise using or handling of certain beverage products that would otherwise be prohibited under the CBA.
Under the Ancillary Business Letter, the consent of The Coca‑Cola Company, which consent may not be unreasonably withheld, would be required for us to acquire or develop (i) any grocery, quick service restaurant, or convenience and petroleum store business engaged in the sale of beverages, beverage components or other beverage products not otherwise authorized or permitted by the CBA or (ii) any other line of business for which beverage activities otherwise prohibited under the CBA represent more than a certain threshold of net sales (subject to certain limited exceptions).
3
Markets Served and Facilities
As of December 31, 2023, we served approximately 60 million consumers within our territories, which comprised five principal markets. Certain information regarding each of these markets follows:
| Market | Description | Manufacturing Plants | Number of Distribution Centers | |||||||||||||||||
| Carolinas | The majority of North Carolina and South Carolina and portions of southern Virginia, including Boone, Hickory, Mount Airy, Charlotte, Raleigh, Winston-Salem, Greensboro, Fayetteville, Greenville and New Bern, North Carolina, Conway, Marion, Charleston, Columbia, Greenville and Ridgeland, South Carolina and surrounding areas. | Charlotte, NC | 17 | |||||||||||||||||
| Central | A significant portion of northeastern Kentucky, the majority of West Virginia and portions of southern Ohio, southeastern Indiana and southwestern Pennsylvania, including Lexington, Louisville and Pikeville, Kentucky, Beckley, Bluefield, Clarksburg, Elkins, Parkersburg, Craigsville and Charleston, West Virginia, Cincinnati and Portsmouth, Ohio and surrounding areas. | Cincinnati, OH | 12 | |||||||||||||||||
| Mid-Atlantic | The entire state of Maryland, the majority of Virginia and Delaware, the District of Columbia and a portion of south-central Pennsylvania, including Easton, Salisbury, Capitol Heights, Baltimore, Hagerstown and Cumberland, Maryland, Norfolk, Staunton, Alexandria, Roanoke, Richmond, Yorktown and Fredericksburg, Virginia and surrounding areas. | Baltimore, MD Silver Spring, MD Roanoke, VA Sandston, VA | 11 | |||||||||||||||||
| Mid-South | A significant portion of central and southern Arkansas and Tennessee and portions of western Kentucky and northwestern Mississippi, including Little Rock and West Memphis, Arkansas, Cleveland, Cookeville, Johnson City, Knoxville, Memphis and Morristown, Tennessee, Paducah, Kentucky and surrounding areas. | West Memphis, AR Nashville, TN | 10 | |||||||||||||||||
| Mid-West | A significant portion of Indiana and Ohio and a portion of southeastern Illinois, including Anderson, Whitestown, Evansville, Fort Wayne, Indianapolis and South Bend, Indiana, Akron, Columbus, Dayton, Elyria, Lima, Mansfield, Toledo, Willoughby and Youngstown, Ohio and surrounding areas. | Indianapolis, IN Twinsburg, OH | 10 | |||||||||||||||||
| Total | 10 | 60 | ||||||||||||||||||
The Company is also a shareholder of South Atlantic Canners, Inc. (“SAC”), a manufacturing cooperative managed by the Company. SAC is located in Bishopville, South Carolina, and the Company utilizes a portion of the production capacity from the Bishopville manufacturing plant.
Raw Materials
In addition to concentrates purchased from The Coca‑Cola Company and other beverage companies for use in our beverage manufacturing, we also purchase sweetener, carbon dioxide, plastic bottles, cans, closures and other packaging materials, as well as equipment for the distribution, marketing and production of nonalcoholic beverages.
We purchase all of the plastic bottles used in our manufacturing plants from Southeastern Container and Western Container, two manufacturing cooperatives we co-own with several other Coca‑Cola bottlers, and all of our aluminum cans from two domestic suppliers.
Along with all other Coca‑Cola bottlers in the United States and Canada, we are a member of Coca-Cola Bottlers’ Sales & Services Company LLC (“CCBSS”), which was formed to provide certain procurement and other services with the intention of enhancing the efficiency and competitiveness of the Coca‑Cola bottling system. CCBSS negotiates the procurement for the majority of our raw materials, excluding concentrate, and we receive a rebate from CCBSS for the purchase of these raw materials.
We are exposed to price risk on commodities such as aluminum, corn and PET resin (a petroleum- or plant-based product), which affects the cost of raw materials used in the production of our finished products. We both produce and procure these finished products. Examples of the raw materials affected are aluminum cans and plastic bottles used for packaging and high fructose corn syrup used as a product ingredient. Further, we are exposed to commodity price risk on crude oil, which impacts our cost of fuel used in the movement and delivery of our products. We participate in commodity hedging and risk mitigation programs, including programs administered by CCBSS and programs we administer. In addition, other than as discussed above, there are no limits on the prices The Coca‑Cola Company and other beverage companies can charge for concentrate.
4
Customers and Marketing
The Company’s products are sold and distributed in the United States through various channels, which include selling directly to customers, including grocery stores, mass merchandise stores, club stores, convenience stores and drug stores, selling to on-premise locations, where products are typically consumed immediately, such as restaurants, schools, amusement parks and recreational facilities, and selling through other channels such as vending machine outlets.
The following table summarizes the percentage of the Company’s total bottle/can sales volume to its largest customers, as well as the percentage of the Company’s total net sales that such volume represents:
| Fiscal Year | ||||||||||||||
| 2023 | 2022 | |||||||||||||
| Approximate percent of the Company’s total bottle/can sales volume: | ||||||||||||||
| Wal-Mart Stores, Inc. | 21 | % | 20 | % | ||||||||||
| The Kroger Company | 14 | % | 12 | % | ||||||||||
| Total approximate percent of the Company’s total bottle/can sales volume | 35 | % | 32 | % | ||||||||||
| Approximate percent of the Company’s total net sales: | ||||||||||||||
| Wal-Mart Stores, Inc. | 17 | % | 16 | % | ||||||||||
| The Kroger Company | 11 | % | 10 | % | ||||||||||
| Total approximate percent of the Company’s total net sales | 28 | % | 26 | % | ||||||||||
The loss of Wal-Mart Stores, Inc. or The Kroger Company as a customer could have a material adverse effect on the operating and financial results of the Company. No other customer represented greater than 10% of the Company’s total net sales or would impose a material adverse effect on the operating or financial results of the Company should they cease to be a customer of the Company.
New brand and product introductions, packaging changes and sales promotions are the primary sales and marketing practices in the nonalcoholic beverage industry and have required, and are expected to continue to require, substantial expenditures. Recent introductions include new energy products, such as Bang Energy and Reign Storm, as well as new glacéau smartwater and BODYARMOR brands and the 12.9-ounce Discovery Contour bottle for our sparkling products.
We sell our products primarily in single-use, recyclable bottles and cans in varying package configurations from market to market. For example, there may be up to 25 different packages for Diet Coke within a single geographic area. Total bottle/can sales volume to retail customers during 2023 was approximately 49% bottles and 51% cans.
We rely extensively on advertising in various media outlets, primarily online, television and radio, for the marketing of our products. The Coca‑Cola Company, Dr Pepper and Monster Energy make substantial expenditures on advertising programs in our territories from which we benefit. Although The Coca‑Cola Company and other beverage companies have provided us with marketing funding support in the past, our beverage agreements generally do not obligate such funding.
We also expend substantial funds on our own behalf for extensive local sales promotions of our products. Historically, these expenses have been partially offset by marketing funding support provided to us by The Coca‑Cola Company and other beverage companies in support of a variety of marketing programs, such as point-of-sale displays and merchandising programs. We consider the funds we expend for marketing and merchandising programs necessary to maintain or increase revenue.
In addition to our marketing and merchandising programs, we believe a sustained and planned charitable giving program to support the communities we serve is an essential component to the success of our brand and, by extension, our net sales. In 2023, the Company made cash donations of approximately $49 million to various charities and donor-advised funds in light of the Company’s financial performance, distribution territory footprint and future business prospects. The Company intends to continue its charitable contributions in future years, subject to the Company’s financial performance and other business factors.
Seasonality
Business seasonality results primarily from higher unit sales of the Company’s products in the second and third quarters of the fiscal year, as sales of our products are typically correlated with warmer weather. We believe that we and other manufacturers from whom we purchase finished products have adequate production capacity to meet sales demand for sparkling and still beverages during these peak periods. See “Item 2. Properties” for information relating to utilization of our manufacturing plants. Sales volume can also be impacted by weather conditions. Fixed costs, such as depreciation expense, are not significantly impacted by business seasonality.
5
Competition
The nonalcoholic beverage industry is highly competitive for both sparkling and still beverages. Our competitors include bottlers and distributors of nationally and regionally advertised and marketed products, as well as bottlers and distributors of private label beverages. Our principal competitors include local bottlers of PepsiCo, Inc. products and, in some regions, local bottlers of Dr Pepper products.
The principal methods of competition in the nonalcoholic beverage industry are new brand and product introductions, point-of-sale merchandising, new vending and dispensing equipment, packaging changes, pricing, sales promotions, product quality, retail space management, customer service, frequency of distribution and advertising. We believe we are competitive in our territories with respect to these methods of competition.
Government Regulation
Our business is subject to various laws and regulations administered by federal, state and local government agencies of the United States, including laws and regulations governing the production, storage, distribution, sale, display, advertising, marketing, packaging, labeling, content, quality and safety of our products, our occupational health and safety practices and the transportation and use of many of our products.
We are required to comply with a variety of U.S. laws and regulations, including, but not limited to: the Federal Food, Drug and Cosmetic Act and various state laws governing food safety; the Food Safety Modernization Act; the Occupational Safety and Health Act; the Clean Air Act; the Clean Water Act; the Resource Conservation and Recovery Act; the Comprehensive Environmental Response, Compensation and Liability Act; the Federal Motor Carrier Safety Act; the Lanham Act; various federal and state laws and regulations governing competition and trade practices; various federal and state laws and regulations governing our employment practices, including those related to equal employment opportunity, such as the Equal Employment Opportunity Act and the National Labor Relations Act; and laws and regulations restricting the sale of certain of our products in schools.
As a manufacturer, distributor and seller of beverage products of The Coca‑Cola Company and other beverage companies in exclusive territories, we are subject to antitrust laws of general applicability. However, pursuant to the United States Soft Drink Interbrand Competition Act, soft drink bottlers, such as us, are permitted to have exclusive rights to manufacture, distribute and sell soft drink products in a defined geographic territory if that soft drink product is in substantial and effective competition with other products of the same general class in the market. We believe such competition exists in each of the exclusive geographic territories in the United States in which we operate.
In response to growing health, nutrition and wellness concerns for today’s youth, a number of state and local governments have regulations restricting the sale of soft drinks and other foods in schools, particularly elementary, middle and high schools. Many of these restrictions have existed for several years in connection with subsidized meal programs in schools. Additionally, legislation has been proposed by certain state and local governments to limit or restrict the sale of energy drinks to minors and/or persons below a specified age and/or to restrict the venues in which energy drinks can be sold. Restrictive legislation, if widely enacted, could have an adverse impact on our products, sales and reputation.
Most beverage products sold by the Company are classified as food or food products and are therefore eligible for purchase using supplemental nutrition assistance program (“SNAP”) benefits by consumers purchasing them for home consumption. Energy drinks with a nutrition facts label are also classified as food and are eligible for purchase for home consumption using SNAP benefits, whereas energy drinks classified as a supplement by the United States Food and Drug Administration (the “FDA”) are not. Regulators may restrict the use of benefit programs, including SNAP, to purchase certain beverages and foods currently classified as food or food products.
Certain jurisdictions in which our products are sold have imposed, or are considering imposing, taxes, labeling requirements or other limitations on, or regulations pertaining to, the sale of certain of our products, ingredients or substances contained in, or attributes of, our products or commodities used in the manufacture of our products, including certain of our products that contain added sugars or sodium, exceed a specified caloric count or include specified ingredients such as caffeine.
Legislation has been proposed in Congress and by certain state and local governments which would prohibit the sale of soft drink products in non-refillable bottles and cans or require a mandatory deposit as a means of encouraging the return of such containers, each in an attempt to reduce solid waste and litter. Similarly, we are aware of proposed legislation that would impose fees or taxes on various types of containers that are used in our business, implement new recycling regulations and the reduction of single-use plastics and place the onus on plastic suppliers to identify recycling solutions. We are not currently impacted by the policies in these types of
6
proposed legislation, but it is possible that similar or more restrictive legal requirements may be proposed or enacted within our distribution territories in the future.
We are also subject to federal, state and local environmental laws, including laws related to water consumption and treatment, wastewater discharge and air emissions. Our facilities must comply with the Clean Air Act, the Clean Water Act, the Comprehensive Environmental Response, Compensation and Liability Act, the Resource Conservation and Recovery Act and other federal, state and local laws regarding handling, storage, release and disposal of wastes generated on-site and sent to third-party owned and operated off-site licensed facilities.
We do not currently have any material commitments for environmental compliance or environmental remediation for any of our properties. We do not believe compliance with enacted or adopted federal, state and local provisions pertaining to the discharge of materials into the environment or otherwise relating to the protection of the environment will have a material adverse impact on our consolidated financial statements or our competitive position.
Human Capital Resources
At Coca-Cola Consolidated, our teammates are the heart of our business and the key to our success. As of December 31, 2023, we employed approximately 17,000 employees which we refer to as “teammates,” of which approximately 15,000 were full-time and approximately 2,000 were part-time. Approximately 15% of our workforce is covered by collective bargaining agreements. While the number of collective bargaining agreements that will expire in any given year varies, we have been successful in the past in negotiating renewals to expiring agreements without any material disruption to our operations, and management considers teammate relations to be good.
Purpose and Culture
We believe a strong and clear purpose is the foundation to a strong culture and critical to the long-term success of the business. At Coca‑Cola Consolidated, we strive to fulfill our Purpose – To honor God in all we do, to serve others, to pursue excellence and to grow profitably. As a waypoint to help guide us along this journey is our Operating Destination – One Coca‑Cola Consolidated Team, consistently generating strong cash flow, while empowering the next generation of diverse servant leaders. At the core of our culture is a focus on service. We want teammates to recognize and embrace a passion for serving each other along with our consumers, our customers and our communities. Through our Coke Cares program, we provide opportunities for our teammates to be involved in stewardship, charitable and community activities as a way to serve our communities.
We recognize the personal challenges and difficulties facing our teammates each day, and how it may be difficult for them to discuss their struggles with other teammates. Through our corporate chaplaincy program and our employee assistance program, we provide resources for our teammates to engage with a third party in a personal and confidential manner to discuss their personal challenges. These programs are administered by third parties and are valuable resources to help enhance emotional wellness, reduce stress and increase productivity.
Talent Acquisition, Development and Retention
The success and growth of our business depend in a large part on our ability to execute on our talent strategy, which is to be a purpose driven organization that attracts, engages and grows a highly talented, diverse workforce of servant leaders enabling our growth and performance. To meet our talent objectives, we utilize key strategies and processes related to recruitment, onboarding and learning development. Through our Total Rewards Program, we strive to offer competitive compensation, benefits and services to our full-time teammates, including incentive plans, recognition plans, defined contribution plans, healthcare benefits, tax-advantaged spending accounts, corporate chaplaincy, employee assistance programs and other programs. Management monitors market compensation and benefits to be able to attract, retain and promote teammates and to reduce turnover and its associated costs.
In recent years, the Company has faced periods of high teammate turnover, periodic labor shortages and wage inflation in our front-line workforce due to tight conditions in the labor market. The Company responded to these challenges by making certain investments in our teammates to reward them for their contributions in achieving strong operating results and to remain competitive in the current labor environment. The Company continues to reward teammates for their contributions to the Company’s strong operating results.
We are a learning organization committed to the goal of continuous improvement and the development of our teams and teammates. To empower our teammates to unlock their potential, we offer a wide range of learning experiences and resources. Our teammate onboarding experiences involve online learning, job-specific training and on-the-job development to learn about our Company, our products and our industry. Job-specific training includes activity-based classes that focus on how teammates can safely and efficiently sell, merchandise and display our products. After onboarding, our teammates may participate in numerous learning experiences offered by the Company to help them develop and improve their skills and capabilities to advance in their careers, including at one of
7
our two dedicated experiential learning centers where teammates can develop and grow their skills through a hands-on experience. We provide a leadership program designed to challenge and grow our future servant leaders through a series of learning experiences, including on-the-job training, mentorship, peer coaching and formal leadership courses. This program focuses on developing leadership skills, building cohesive teams and strengthening business acumen to prepare teammates for a leadership position at Coca‑Cola Consolidated. The Company also sponsors a scholarship program intended to support eligible teammates and their immediate family members in pursuing additional educational opportunities, including a two- or four-year college degree, license or certification, and to promote personal development and growth.
An important part of attracting and retaining top talent is teammate satisfaction, and we conduct an annual engagement survey administered and analyzed by an independent third party to assess teammate satisfaction and engagement and the effectiveness of our teammate development and compensation programs. In 2023, 81% of our teammates participated in the survey. This survey provides valuable insight to our leaders about how our teammates experience the Company and how we can better serve them and improve job performance, satisfaction and retention. Our executive officers review the survey results and develop and implement specific action plans to address key areas of opportunity. Additionally, leaders across our Company discuss the results with local managers to develop additional action plans to best address teammate feedback in different market units and functional areas.
Health and Safety
One of our top priorities is protecting the health and safety of our teammates. We are committed to operating in a safe, secure and responsible manner for the benefit of our consumers, customers, teammates and communities. We sponsor a number of programs and initiatives designed to reduce the frequency and severity of workplace injuries, incidents, risks and hazards, including safety committees, Company policies and procedures, coaching and training, and awareness through leadership engagement and messaging. Additionally, in 2023, we hired a Health & Wellness Director to further promote the overall physical, mental and emotional well-being of our teammates.
Diversity and Inclusion
We strive to cultivate diversity in our workforce and believe teammates with diverse backgrounds, experiences and viewpoints bring value to our organization. We have a diversity task force comprised of diverse teammates from across the organization and led by our President and Chief Operating Officer with a focus on cultivating diversity at Coca‑Cola Consolidated. This task force developed a diversity framework focused on four pillars – communication, accountability, empowerment and partnerships. The task force and discussion groups led by our senior executive leadership team strive to enhance Company-wide engagement on diversity, equity and inclusion (“DEI”), provide opportunities for teammates to discuss DEI, develop initiatives to support our diversity framework and monitor progress across these initiatives. In response to the annual engagement survey, as discussed above, the Company has continued to increase its focus on DEI, including developing a “seat at the table” framework coupled with additional education and training, creating a specific DEI manager role, launching a dedicated DEI site on the Company intranet and promoting expanded DEI celebrations for all teammates.
Exchange Act Reports
Our website is www.cokeconsolidated.com and we make available free of charge through the investor relations portion of our website our Annual Report on Form 10-K, Quarterly Reports on Form 10‑Q, Current Reports on Form 8‑K, and any amendments to these reports, as well as proxy statements and other information. These documents are available on our website as soon as reasonably practicable after such documents are electronically filed with, or furnished to, the United States Securities and Exchange Commission (the “SEC”). The information on our website or linked to or from our website is not incorporated by reference into, and does not constitute a part of, this report or any other documents we file with, or furnish to, the SEC.
We use our website to distribute information, including as a means of disclosing material, nonpublic information and for complying with our disclosure obligations under Regulation FD. We routinely post and make accessible financial and other information regarding the Company on our website. Accordingly, investors should monitor the investor relations portion of our website, in addition to our press releases, SEC filings and other public communications.
The SEC also maintains a website, www.sec.gov, that contains reports, proxy and information statements, and other information regarding issuers that file electronically with the SEC.
Item 1A.Risk Factors.
In addition to other information in this report, the following risk factors should be considered carefully in evaluating the Company’s business. The Company’s business, financial condition or results of operations could be materially and adversely affected by any of these risks.
8
Risks Related to Our Business
The Company’s business and results of operations may be adversely affected by increased costs, disruption of supply or unavailability or shortages of raw materials, fuel and other supplies.
Raw material costs, including the costs for plastic bottles, aluminum cans, PET resin, carbon dioxide and high fructose corn syrup, are subject to significant price volatility, which may be worsened by periods of increased demand, supply constraints or high inflation. International or domestic geopolitical or other events, including pandemics, armed conflict or the imposition of tariffs and/or quotas by the U.S. government on any of these raw materials, could adversely impact the supply and cost of these raw materials to the Company or render them unavailable at commercially favorable terms or at all. In addition, there are no limits on the prices The Coca‑Cola Company and other beverage companies can charge for concentrate. If the Company cannot offset higher raw material costs with higher selling prices, effective commodity price hedging, increased sales volume or reductions in other costs, the Company’s results of operations and profitability could be adversely affected.
The Company uses significant amounts of fuel for its delivery fleet and other vehicles used in the distribution of its products. International or domestic geopolitical or other events could impact the supply and cost of fuel and the timely delivery of the Company’s products to its customers. Although the Company strives to reduce fuel consumption and uses commodity hedges to manage the Company’s fuel costs, there can be no assurance the Company will succeed in limiting the impact of fuel price increases or price volatility on the Company’s business or future cost increases, which could reduce the profitability of the Company’s operations.
The Company uses a combination of internal and external freight shipping and transportation services to transport and deliver products. The Company’s freight cost and the timely delivery of its products may be adversely impacted by a number of factors that could reduce the profitability of the Company’s operations, including driver shortages, reduced availability of independent contractor drivers, higher fuel costs, weather conditions, traffic congestion, increased government regulation and other matters.
The Company continues to make significant reinvestments in its business in order to evolve its operating model and to accommodate future growth and portfolio expansion, including supply chain optimization. The increased costs associated with these reinvestments, the potential for disruption in manufacturing and distribution and the risk the Company may not realize a satisfactory return on its investments could adversely affect the Company’s business, financial condition or results of operations.
The reliance on purchased finished products from external sources could have an adverse impact on the Company’s profitability.
The Company does not, and does not plan to, manufacture all of the products it distributes and, therefore, remains reliant on purchased finished products from external sources to meet customer demand. As a result, the Company is subject to incremental risk, including, but not limited to, product quality and availability, price variability and production capacity shortfalls for externally purchased finished products, which could have an impact on the Company’s profitability and customer relationships. Particularly, the Company is subject to the risk of unavailability of still products that it acquires from other manufacturers, leading to an inability to meet consumer demand for these products. In most instances, the Company’s ability to negotiate the prices at which it purchases finished products from other U.S. Coca‑Cola bottlers is limited pursuant to The Coca‑Cola Company’s right to unilaterally establish the prices, or certain elements of the formulas used to determine the prices, for such finished products under the RMA, which could have an adverse impact on the Company’s profitability.
Changes in public and consumer perception and preferences, including concerns related to product safety and sustainability, artificial ingredients, brand reputation and obesity, could reduce demand for the Company’s products and reduce profitability.
Concerns about perceived negative safety and quality consequences of certain ingredients in the Company’s products, such as non-nutritive sweeteners or ingredients in energy drinks, may erode consumers’ confidence in the safety and quality of the Company’s products, whether or not justified. The Company’s business is also impacted by changes in consumer concerns or perceptions surrounding the product manufacturing processes and packaging materials, including single-use and other plastic packaging, and the environmental and sustainability impact of such manufacturing processes and packaging materials. Any of these factors may reduce consumers’ willingness to purchase the Company’s products and any inability on the part of the Company to anticipate or react to such changes could result in reduced demand for the Company’s products or erode the Company’s competitive and financial position and could adversely affect the Company’s business, reputation, financial condition or results of operations.
The Company’s success depends on its ability to maintain consumer confidence in the safety and quality of all of its products. The Company has rigorous product safety and quality standards. However, if beverage products taken to market are or become contaminated or adulterated, the Company may be required to conduct costly product recalls and may become subject to product liability claims and negative publicity, which could cause its business and reputation to suffer.
9
The Company’s success also depends in large part on its ability and the ability of The Coca‑Cola Company and other beverage companies it works with to maintain the brand image of existing products, build up brand image for new products and brand extensions and maintain its corporate reputation and social license to operate. Engagements by the Company’s executives in social and public policy debates may occasionally be the subject of criticism from advocacy groups that have differing points of view and could result in adverse media and consumer reaction, including product boycotts. Similarly, the Company’s sponsorship relationships and charitable giving program could subject the Company to negative publicity as a result of actual or perceived views of organizations the Company sponsors or supports financially. Likewise, negative postings or comments on social media or networking websites about the Company, The Coca‑Cola Company or one of the products the Company carries, even if inaccurate or malicious, could generate adverse publicity that could damage the reputation of the Company’s brands or the Company.
The Company’s business depends substantially on consumer tastes, preferences and shopping habits that change in often unpredictable ways. As a result of certain health and wellness trends, including concern over the public health consequences associated with obesity, consumer preferences over the past several years have shifted from sugar-sweetened sparkling beverages to diet sparkling beverages, tea, sports drinks, enhanced water and bottled water. As the Company distributes, markets and manufactures beverage brands owned by others, the success of the Company’s business depends in large measure on the ability of The Coca‑Cola Company and other beverage companies to develop and introduce product innovations to meet the changing preferences of the broad consumer market, and failure to satisfy these consumer preferences could adversely affect the Company’s profitability.
Changes in government regulations related to nonalcoholic beverages, including regulations related to obesity, public health, artificial ingredients and product safety and sustainability, could reduce demand for the Company’s products and reduce profitability.
The Company’s business and properties are subject to various federal, state and local laws and regulations, including those governing the production, packaging, quality, labeling and distribution of beverage products. Compliance with or changes in existing laws or regulations could require material expenses and negatively affect our financial results through lower sales or higher costs.
The production and marketing of beverages are subject to the rules and regulations of the FDA and other federal, state and local health agencies, and extensive changes in these rules and regulations could increase the Company’s costs or adversely impact its sales. The Company cannot predict whether any such rules or regulations will be enacted or, if enacted, the impact that such rules or regulations could have on its business.
In response to growing health, nutrition and wellness concerns for today’s youth, a number of state and local governments have regulations restricting the sale of soft drinks and other foods in schools, particularly elementary, middle and high schools. Many of these restrictions have existed for several years in connection with subsidized meal programs in schools. Additionally, legislation has been proposed by certain state and local governments to limit or restrict the sale of energy drinks to minors and/or persons below a specified age and/or to restrict the venues in which energy drinks can be sold. Restrictive legislation, if widely enacted, could have an adverse impact on the Company’s products, sales and reputation.
Legislation has been proposed in Congress and by certain state and local governments which would prohibit the sale of soft drink products in non-refillable bottles and cans or require a mandatory deposit as a means of encouraging the return of such containers, each in an attempt to reduce solid waste and litter. Similarly, the Company is aware of proposed legislation that would impose fees or taxes on various types of containers that are used in its business, implement new recycling regulations and the reduction of single-use plastics and place the onus on plastic suppliers to identify recycling solutions. The Company is not currently impacted by the policies in these types of proposed legislation, but it is possible that similar or more restrictive legal requirements may be proposed or enacted within its distribution territories in the future.
Concerns about perceived negative safety and quality consequences of certain ingredients in the Company’s products, such as non-nutritive sweeteners or ingredients in energy drinks, could result in additional governmental regulations concerning the production, marketing, labeling or availability of the Company’s products or the ingredients in such products, possible new taxes or negative publicity resulting from actual or threatened legal actions against the Company or other companies in the same industry, any of which could damage the reputation of the Company or reduce demand for the Company’s products, which could adversely affect the Company’s profitability.
The FDA occasionally proposes major changes to the nutrition labels required on all packaged foods and beverages, including those for most of the Company’s products, which could require the Company and its competitors to revise nutrition labels to include updated serving sizes, information about total calories in a beverage product container and information about any added sugars or nutrients. Any pervasive nutrition label changes could increase the Company’s costs and could inhibit sales of one or more of the Company’s major products.
10
Most beverage products sold by the Company are classified as food or food products and are therefore eligible for purchase using SNAP benefits by consumers purchasing them for home consumption. Energy drinks with a nutrition facts label are also classified as food and are eligible for purchase for home consumption using SNAP benefits, whereas energy drinks classified as a supplement by the FDA are not. Regulators may restrict the use of benefit programs, including SNAP, to purchase certain beverages and foods currently classified as food or food products.
The Company relies on The Coca‑Cola Company and other beverage companies to invest in the Company through marketing funding and to promote their own company brand identity through external advertising, marketing spending and product innovation. Decreases from historic levels of investment could negatively impact the Company’s business, financial condition and results of operations or profitability.
The Coca‑Cola Company and other beverage companies have historically provided financial support to the Company through marketing funding. While the Company does not believe there will be significant changes to the amount of marketing funding support provided by The Coca‑Cola Company and other beverage companies, the Company’s beverage agreements generally do not obligate such funding and there can be no assurance the historic levels will continue. Decreases in the level of marketing funding provided, material changes in the marketing funding programs’ performance requirements or the Company’s inability to meet the performance requirements for marketing funding could adversely affect the Company’s business, financial condition and results of operations or profitability.
In addition, The Coca‑Cola Company and other beverage companies have their own external advertising campaigns, marketing spending and product innovation programs, which directly impact the Company’s operations. Decreases in advertising, marketing and product innovation spending by The Coca‑Cola Company and other beverage companies, or advertising campaigns that are negatively perceived by the public, could adversely impact the sales volume growth and profitability of the Company. While the Company does not believe there will be significant changes in the level of external advertising and marketing spending by The Coca‑Cola Company and other beverage companies, there can be no assurance the historic levels will continue or that advertising campaigns will be positively perceived by the public. The Company’s volume growth is also dependent on product innovation by The Coca‑Cola Company and other beverage companies, and their ability to develop and introduce products that meet consumer preferences.
The Company is a participant in several Coca‑Cola system governance entities, and decisions made by these governance entities may be different than decisions that would have been made by the Company individually. Any failure of these governance entities to function efficiently or on the best behalf of the Company and any failure or delay of the Company to receive anticipated benefits from these governance entities could adversely affect the Company’s business, financial condition and results of operations.
The Company is a member of CONA and party to an amended and restated master services agreement with CONA, pursuant to which the Company is an authorized user of the CONA System, a uniform information technology system developed to promote operational efficiency and uniformity among North American Coca‑Cola bottlers. The Company relies on CONA to make necessary upgrades to and resolve ongoing or disaster-related technology issues with the CONA System, and it is limited in its authority and ability to timely resolve errors or to make changes to the CONA software. Any service interruptions of the CONA System could result in increased costs or adversely impact the Company’s results of operations. In addition, because other Coca‑Cola bottlers are also users of the CONA System and would likely experience similar service interruptions, the Company may not be able to have another bottler process orders on its behalf during any such interruption.
The Company is also a member of the NPSG, which is comprised of The Coca‑Cola Company, the Company and certain other Coca‑Cola bottlers who are regional producing bottlers in The Coca‑Cola Company’s national product supply system. Subject to the terms and conditions of the NPSG Agreement, the Company is required to comply with certain key decisions made by the NPSG Board, which include decisions regarding strategic infrastructure investment and divestment planning, optimal national product supply sourcing and new product or packaging infrastructure planning. Although the Company has a representative on the NPSG Board, the Company cannot exercise sole decision-making authority relating to the decisions of the NPSG Board, and the interests of other members of the NPSG Board may diverge from those of the Company. Any such divergence could have a material adverse effect on the operating and financial results of the Company.
Provisions in the CBA and the RMA with The Coca‑Cola Company could delay or prevent a change in control of the Company or a sale of the Company’s Coca‑Cola distribution or manufacturing businesses.
Provisions in the CBA and the RMA require the Company to obtain The Coca‑Cola Company’s prior approval of a potential buyer of the Company’s Coca‑Cola distribution or manufacturing businesses, which could delay or prevent a change in control of the Company or the Company’s ability to sell such businesses. The Company can obtain a list of pre-approved third-party buyers from The Coca‑Cola Company annually. In addition, the Company can seek buyer-specific approval from The Coca‑Cola Company upon receipt of a third-party offer to purchase the Company or its Coca‑Cola distribution or manufacturing businesses. If a change in control
11
or sale of one of our businesses is delayed or prevented by the provisions in the CBA and the RMA, the market price of our Common Stock could be negatively affected.
The concentration of the Company’s capital stock ownership with our Chairman and Chief Executive Officer limits other stockholders’ ability to influence corporate matters.
As of December 31, 2023, J. Frank Harrison, III, Chairman of the Board of Directors and Chief Executive Officer of the Company, controlled 1,004,394 shares of the Company’s Class B Common Stock, which represented approximately 71% of the total voting power of the Company’s outstanding Common Stock and Class B Common Stock on a consolidated basis. Mr. Harrison also has the right to acquire 292,386 shares of Class B Common Stock from the Company in exchange for an equivalent number of shares of Common Stock. In the event of such an exchange, Mr. Harrison would control 1,296,780 shares of the Company’s Class B Common Stock, which would represent approximately 76% of the total voting power of the Company’s outstanding Common Stock and Class B Common Stock on a consolidated basis. Furthermore, Mr. Harrison and another member of the Harrison family serve on the Company’s Board of Directors. As a result, Mr. Harrison has the ability to exert substantial influence or actual control over the Company’s management and affairs and over substantially all matters requiring action by the Company’s stockholders, including the election of directors and the approval of significant corporate transactions, such as a merger or other sale of the Company or its assets. This concentration of ownership could have the effect of delaying or preventing a change in control otherwise favored by the Company’s other stockholders and could depress the stock price or limit other stockholders’ ability to influence corporate matters, which could result in the Company making decisions that stockholders outside the Harrison family may not view as beneficial.
The Company’s inability to meet requirements under its beverage agreements could result in the loss of distribution and manufacturing rights.
Under the CBA and the RMA, which authorize the Company to distribute and/or manufacture products of The Coca‑Cola Company, and pursuant to the Company’s distribution agreements with other beverage companies, the Company must satisfy various requirements, such as making minimum capital expenditures or maintaining certain performance rates. Failure to satisfy these requirements could result in the loss of distribution and manufacturing rights for the respective products under one or more of these beverage agreements. The occurrence of other events defined in these agreements could also result in the termination of one or more beverage agreements.
The RMA also requires the Company to provide and sell covered beverages to other U.S. Coca‑Cola bottlers at prices established pursuant to the RMA. As the timing and quantity of such requests by other U.S. Coca‑Cola bottlers can be unpredictable, any failure by the Company to adequately plan for such demand could also constrain the Company’s supply chain network.
Changes in the inputs used to calculate the Company’s acquisition related contingent consideration liability could have a material adverse impact on the Company’s financial condition and results of operations.
The Company’s acquisition related contingent consideration liability, which totaled $669.3 million as of December 31, 2023, consists of the estimated amounts due to The Coca‑Cola Company as acquisition related sub-bottling payments under the CBA with The Coca‑Cola Company and CCR over the useful life of the related distribution rights. Changes in business conditions or other events could materially change both the future cash flow projections and the discount rate used in the calculation of the fair value of contingent consideration under the CBA. These changes could result in material changes to the fair value of the acquisition related contingent consideration liability and could materially impact the amount of non-cash expense (or income) recorded each reporting period.
General Risk Factors
Technology failures or cyberattacks on the Company’s information technology systems or the Company’s effective response to technology failures or cyberattacks on its customers’, suppliers’ or other third parties’ information technology systems could disrupt the Company’s operations and negatively impact the Company’s reputation, business, financial condition or results of operations.
The Company increasingly relies on information technology systems to process, transmit and store electronic information. Like most companies, the Company’s information technology systems are vulnerable to interruption due to a variety of events beyond the Company’s control, including, but not limited to, power outages, computer and telecommunications failures, computer viruses, other malicious computer programs and cyberattacks, denial-of-service attacks, security breaches, catastrophic events such as fires, tornadoes, earthquakes and hurricanes, usage errors by employees and other security issues. In addition, third-party providers of data hosting or cloud services, as well as other vendors, customers and suppliers, are vulnerable to cybersecurity incidents involving data the Company shares with them. While incidents at our third-party service providers have not materially impacted our business operations, one or more of these incidents could significantly impact the Company in the future.
12
The Company depends heavily upon the efficient operation of technological resources and a failure in these information technology systems or controls could negatively impact the Company’s business, financial condition or results of operations. In addition, the Company continuously upgrades and updates current technology or installs new technology. In order to address risks to its information technology systems, the Company continues to monitor networks and systems, to upgrade security policies and to train its employees, and it requires third-party service providers and business partners, customers, suppliers and other third parties to do the same. The inability to implement upgrades, updates or installations in a timely manner, to train employees effectively in the use of new or updated technology, or to obtain the anticipated benefits of the Company’s technology could adversely impact the Company’s business, financial condition, results of operations or profitability. Additionally, the failure of the Company to successfully migrate key data to new systems could lead to data integrity issues, service interruptions or delays and other increased costs that could adversely impact the Company’s business, financial condition or results of operations.
The Company has technology security initiatives and disaster recovery plans in place to mitigate its risk to these vulnerabilities; however, these measures may not be adequate or implemented properly to ensure that the Company’s operations are not disrupted. If the Company’s information technology systems, or those of its third-party service providers or business partners, are damaged, breached or cease to function properly, the Company may incur significant financial and other resources to mitigate, upgrade, repair or replace them, and the Company may suffer interruptions in its business operations, resulting in lost revenues and potential delays in reporting its financial results.
Further, misuse, leakage or falsification of the Company’s information could result in violations of data privacy laws and regulations and damage the reputation and credibility of the Company. The Company may suffer financial and reputational damage because of lost or misappropriated confidential information belonging to the Company, current or former employees, bottling partners, other customers, suppliers or consumers, and may become subject to legal action and increased regulatory oversight. The Company could also be required to spend significant financial and other resources to remedy the damage caused by a security breach or to repair or replace networks and information technology systems, including liability for stolen information, increased cybersecurity protection costs, litigation expense and increased insurance premiums.
The Company’s financial condition can be impacted by the stability of the general economy.
Unfavorable changes in general economic conditions or in the geographic markets in which the Company does business may have the temporary effect of reducing the demand for certain of the Company’s products. For example, economic forces may cause consumers to shift away from purchasing higher-margin products and packages sold through immediate consumption and other highly profitable channels. Periods of sustained high inflation may have adverse impacts on demand for the Company’s products and on the Company’s ability to sustain margins due to higher input costs. In addition, efforts by the government to curb inflation may cause a general economic slowdown. Adverse economic conditions could also increase the likelihood of customer delinquencies and bankruptcies, which would increase the risk of collectability of certain accounts. Each of these factors could adversely affect the Company’s overall business, financial condition and results of operations.
The Company’s capital structure, including its cash positions and borrowing capacity with banks or other financial institutions and financial markets, exposes it to the risk of default by or failure of counterparty financial institutions. The risk of counterparty default or failure may be heightened during economic downturns and periods of uncertainty in the financial markets. If one of the Company’s counterparties were to become insolvent or enter bankruptcy, the Company’s ability to recover losses incurred as a result of default or to retrieve assets that are deposited or held in accounts with such counterparty may be limited by the counterparty’s liquidity or the applicable laws governing the insolvency or bankruptcy proceedings. Consequently, the Company’s access to capital may be diminished. Any such event of default or failure could negatively impact the Company’s business, financial condition and results of operations.
The concentration risks among the Company’s customers and suppliers could impact our sales and our ability to access necessary product inputs at commercially advantageous prices.
The Company faces concentration risks related to a few customers comprising a large portion of the Company’s annual sales volume and net sales. The Company’s business, financial condition and results of operations could be adversely affected if net sales from one or more of these significant customers is materially reduced or if the cost of complying with the customers’ demands is significant. Additionally, if receivables from one or more of these significant customers become uncollectible, the Company’s financial condition and results of operations may be adversely impacted.
The Company’s largest customers, Wal-Mart Stores, Inc. and The Kroger Company, accounted for approximately 35% of the Company’s 2023 total bottle/can sales volume to retail customers and approximately 28% of the Company’s 2023 total net sales. These customers typically make purchase decisions based on a combination of price, product quality, consumer demand and customer service performance and generally do not enter into long-term contracts. The Company faces risks related to maintaining the volume
13
demanded on a short-term basis from these customers, which can also divert resources away from other customers. The loss of Wal‑Mart Stores, Inc. or The Kroger Company as a customer could have a material adverse effect on the business, financial condition and results of operations of the Company.
Moreover, the Company’s net sales are affected by promotion of the Company’s products by significant customers, such as in-store displays created by customers or the promotion of the Company’s products in customers’ periodic advertising. If the Company’s significant customers change the manner in which they market or promote the Company’s products, or if the marketing efforts by significant customers become ineffective, the Company’s sales volume and net sales could be adversely impacted.
Further, the suppliers of certain inputs of the Company’s key products, particularly plastic bottles and aluminum cans, are highly concentrated. This concentration could have an adverse effect on the Company’s ability to negotiate the lowest costs and, in light of the Company’s relatively low in-plant raw material inventory levels, has the potential for causing interruptions in the Company’s supply of raw materials and in its manufacture of finished goods.
The Company purchases all of the plastic bottles used in its manufacturing plants from Southeastern Container and Western Container, two manufacturing cooperatives the Company co-owns with several other Coca‑Cola bottlers, and all of its aluminum cans from two domestic suppliers. The inability of these suppliers to meet the Company’s requirements for containers could result in the Company not being able to fulfill customer orders and production demand until alternative sources of supply are located. The Company attempts to mitigate these risks by working closely with key suppliers and by purchasing business interruption insurance where appropriate. Failure of the plastic bottle or aluminum can suppliers to meet the Company’s purchase requirements could negatively impact inventory levels, customer confidence and results of operations, including sales levels and profitability.
The Company may not be able to respond successfully to changes in the marketplace.
The Company operates in the highly competitive nonalcoholic beverage industry and faces strong competition from other general and specialty beverage companies. The Company’s response to continued and increased customer and competitor consolidations and marketplace competition may result in lower than expected net pricing of the Company’s products. The Company’s ability to gain or maintain the Company’s share of sales or gross margins may be limited by the actions of the Company’s competitors, which may have advantages in setting prices due to lower raw material costs.
Competitive pressures in the markets in which the Company operates may cause channel and product mix to shift away from more profitable channels and packages. If the Company is unable to maintain or increase volume in higher-margin products and in packages sold through higher-margin channels, such as immediate consumption, pricing and gross margins could be adversely affected. Any related efforts by the Company to improve pricing and/or gross margin may result in lower than expected sales volume.
In addition, the Company’s sales of finished goods to The Coca‑Cola Company and other U.S. Coca‑Cola bottlers are governed by the RMA, pursuant to which the prices, or certain elements of the formulas used to determine the prices, for such finished goods are unilaterally established by The Coca‑Cola Company from time to time. This limits the Company’s ability to adjust pricing in response to changes in the marketplace, which could have an adverse impact on the Company’s business, financial condition and results of operations.
Changes in the Company’s level of debt, borrowing costs and credit ratings could impact the Company’s access to capital and credit markets, restrict the Company’s operating flexibility and limit the Company’s ability to obtain additional financing to fund future needs.
As of December 31, 2023, the Company had $599.2 million of debt outstanding. The Company’s level of debt requires a substantial portion of future cash flows from operations to be dedicated to the payment of principal and interest, which reduces funds available for other purposes. The Company’s debt level can negatively impact its operations by limiting the Company’s ability to, and/or increasing its cost to, access credit markets for working capital, capital expenditures and other general corporate purposes; increasing the Company’s vulnerability to economic downturns and adverse industry conditions by limiting the Company’s ability to react to changing economic and business conditions; and exposing the Company to increased risk that the Company will not be able to refinance the principal amount of debt as it becomes due or that a significant decrease in cash flows from operations could make it difficult for the Company to meet its debt service requirements and to comply with financial covenants in its debt agreements.
The Company’s acquisition related contingent consideration, revolving credit facility and pension and postretirement medical benefits are subject to changes in interest rates. If interest rates increase in the future, the Company’s borrowing costs could increase, which could negatively impact the Company’s financial condition and results of operations and limit the Company’s ability to spend in other areas of the business. Further, a decline in the interest rates used to discount the Company’s pension and postretirement medical benefits could increase the cost of these benefits and the amount of the liabilities.
14
In assessing the Company’s credit strength, credit rating agencies consider the Company’s capital structure, financial policies, consolidated balance sheet and other financial information, and may also consider financial information of other bottling and beverage companies. The Company’s credit ratings could be significantly impacted by the Company’s operating performance, changes in the methodologies used by rating agencies to assess the Company’s credit ratings, changes in The Coca‑Cola Company’s credit ratings and the rating agencies’ perception of the impact of credit market conditions on the Company’s current or future financial performance. Lower credit ratings could significantly increase the Company’s borrowing costs or adversely affect the Company’s ability to obtain additional financing at acceptable interest rates or to refinance existing debt.
Failure to attract, train and retain qualified employees while controlling labor costs, and other labor issues could have an adverse effect on the Company’s reputation, business, financial condition and results of operations or profitability.
The Company’s future growth and performance depend on its ability to attract, hire, train, develop, motivate and retain a highly skilled, diverse and properly credentialed workforce, including front-line employees. The Company’s ability to meet its labor needs while controlling labor costs is subject to many external factors, including competition for and availability of qualified personnel in a given market, unemployment levels within those markets, prevailing wage rates, minimum wage laws, health and other insurance costs and changes in employment and labor laws or other workplace regulations. The Company’s labor costs could be impacted by new or revised labor laws, rules or regulations or healthcare laws that are adopted or implemented. Any unplanned turnover or unsuccessful implementation of the Company’s succession plans could deplete the Company’s institutional knowledge base and erode its competitive advantage or result in increased costs due to increased competition for employees, higher employee turnover or increased employee benefit costs. Any of the foregoing could adversely affect the Company’s reputation, business, financial condition or results of operations.
The Company uses various insurance structures to manage costs related to workers’ compensation, auto liability, medical and other insurable risks. These structures consist of retentions, deductibles, limits and a diverse group of insurers that serve to strategically finance, transfer and mitigate the financial impact of losses to the Company. Losses are accrued using assumptions and procedures followed in the insurance industry, then adjusted for company-specific history and expectations. Although the Company has actively sought to control increases in these costs, there can be no assurance the Company will succeed in limiting future cost increases, which could reduce the profitability of the Company’s operations.
In addition, the Company’s profitability is substantially affected by the cost of pension retirement benefits, postretirement medical benefits and current employees’ medical benefits. Macroeconomic factors beyond the Company’s control, including increases in healthcare costs, declines in investment returns on pension assets and changes in discount rates used to calculate pension and related liabilities, could result in significant increases in these costs for the Company. Although the Company has actively sought to control increases in these costs, there can be no assurance the Company will succeed in limiting future cost increases, which could reduce the profitability of the Company’s operations.
Failure to maintain productive relationships with our employees covered by collective bargaining agreements, including failing to renegotiate collective bargaining agreements, could have an adverse effect on the Company’s business, financial condition and results of operations.
Approximately 15% of the Company’s employees are covered by collective bargaining agreements. Any inability of the Company to renegotiate subsequent agreements with labor unions on satisfactory terms and conditions could result in work interruptions or stoppages, which could have a material adverse impact on the Company’s profitability. In addition, the terms and conditions of existing or renegotiated agreements could increase costs or otherwise affect the Company’s ability to fully implement operational changes to improve overall efficiency.
Certain employees of the Company whose employment is covered under collective bargaining agreements participate in a multiemployer pension plan, the Employers-Teamsters Local Union Nos. 175 and 505 Pension Fund (the “Teamsters Plan”). Participating in the Teamsters Plan involves certain risks in addition to the risks associated with single employer pension plans, as contributed assets are pooled and may be used to provide benefits to employees of other participating employers. If a participating employer stops contributing to the Teamsters Plan, the unfunded obligations of the Teamsters Plan may be borne by the remaining participating employers. If the Company chooses to stop participating in the Teamsters Plan, the Company could be required to pay the Teamsters Plan a withdrawal liability based on the underfunded status of the Teamsters Plan.
Changes in tax laws, disagreements with tax authorities or additional tax liabilities could have a material adverse impact on the Company’s financial condition and results of operations.
The Company is subject to income taxes within the United States. The Company’s annual income tax rate is based upon the Company’s income, federal tax laws and various state and local tax laws within the jurisdictions in which the Company operates.
15
Changes in federal, state or local income tax rates and/or tax laws could have a material adverse impact on the Company’s financial results.
Excise or other taxes imposed on the sale of certain of the Company’s products by the federal government and certain state and local governments, particularly any taxes incorporated into shelf prices and passed along to consumers, could cause consumers to shift away from purchasing products of the Company, which could have a material adverse impact on the Company’s business and financial results.
In addition, an assessment of additional taxes resulting from audits of the Company’s tax filings could have an adverse impact on the Company’s profitability, cash flows and financial condition.
Litigation or legal proceedings could expose the Company to significant liabilities and damage the Company’s reputation.
The Company is from time to time a party to various lawsuits, claims and other legal proceedings that arise in the ordinary course of business, including, but not limited to, litigation claims and legal proceedings arising out of its advertising and marketing practices, product claims and labels, intellectual property and commercial disputes, and environmental and employment matters. With respect to all such lawsuits, claims and proceedings, the Company records reserves when it is probable a liability has been incurred and the amount of loss can be reasonably estimated. Although the Company does not believe a material amount of loss in excess of recorded amounts is reasonably possible as a result of these claims, the Company faces risk of an adverse effect on its results of operations, financial position or cash flows, depending on the outcome of the legal proceedings.
Natural disasters, changing weather patterns and unfavorable weather could negatively impact the Company’s business, financial condition and future results of operations or profitability.
Natural disasters or unfavorable weather conditions in the geographic regions in which the Company or its suppliers operate could have an adverse impact on the Company’s revenue and profitability. For instance, unusually cold or rainy weather during the summer months may have a temporary effect on the demand for the Company’s products and contribute to lower sales, which could adversely affect the Company’s profitability for such periods. Prolonged drought conditions could lead to restrictions on water use, which could adversely affect the Company’s cost and ability to manufacture and distribute products. Hurricanes or similar storms may have a negative sourcing impact or cause shifts in product mix to lower-margin products and packages.
Climate change may have a long-term adverse impact on our business and results of operations.
There is concern that a gradual increase in global average temperatures due to increased concentration of carbon dioxide and other greenhouse gases in the atmosphere could cause significant changes in weather patterns and an increase in the frequency or duration of extreme weather and climate events. These changes could adversely impact some of the Company’s facilities, the availability and cost of key raw materials used by the Company in production or the demand for the Company’s products. Public expectations for reductions in greenhouse gas emissions could result in increased energy, transportation and raw material costs, and may require the Company to make additional investments in facilities and equipment. In addition, federal, state or local governmental authorities may propose legislative and regulatory initiatives in response to concerns over climate change, which could directly or indirectly adversely affect the Company’s business, require additional investments or increase the cost of raw materials, fuel, ingredients and water. As a result, the effects of climate change could have a long-term adverse impact on the Company’s business and results of operations.
Item 1B.Unresolved Staff Comments.
None.
Item 1C.Cybersecurity.
Risk Management and Strategy
The Company is committed to maintaining robust processes to assess, identify and mitigate material risks from cybersecurity threats and to protect against, detect and respond to cybersecurity incidents. We integrate these processes into the Company’s overall risk management program and, through the Company’s Cybersecurity Incident Response Plan, we document the intended processes and the roles and responsibilities of teammates involved in assessing, identifying and managing material risks from cybersecurity threats. Periodically, the Company engages third parties to assist in the assessment and ongoing development of cybersecurity processes.
Our cybersecurity processes are grounded in the National Institute of Standards and Technology Cybersecurity Framework and include a number of different preventative measures. The Company performs periodic risk assessments of systems and applications to identify risks, vulnerabilities and threats in systems and software, performs an annual assessment of the effectiveness of the current
16
cybersecurity response process by conducting incident response tabletop exercises that involve participation by members of the management team, and requires all teammates to participate in user awareness training for information technology and cybersecurity.
Our systems are reasonably designed to enable the information technology infrastructure group to capture application, system and network alerts. In the event of a cybersecurity incident, the Cyber Incident Response Team (the “CIRT”), led by a designated Cyber Incident Coordinator (the “CIC”), is responsible for collecting and analyzing relevant data about the incident and its risks. Members of the CIRT, including the CIC, are selected based on their knowledge of either cybersecurity or the specific information systems or business function affected by the incident.
As part of planning for any suspected cybersecurity incident, the CIRT has developed certain incident response strategies to help collect and preserve forensic data, to mitigate the threat and to perform other activities to restore systems to normal operation. These strategies include many of the practices recommended by the U.S. Department of Homeland Security’s Industrial Control Systems Computer Emergency Response Team. In addressing and resolving a significant cybersecurity incident, the Company may engage external experts in relevant fields, such as legal or forensic services, as needed. The Company also has a process whereby the Chief Information Officer (the “CIO”) periodically meets with and assesses third-party service providers in order to help ensure the Company is made aware of any potential material cybersecurity threats or incidents in a timely manner. The Company’s largest external service provider is CONA, as further discussed in “Item 1A. Risk Factors” of this report.
During 2023, there were no identified cybersecurity risks or threats, including as a result of previous cybersecurity incidents, that had, or were reasonably likely to have, a material effect on our business strategy, results of operations or financial condition. While we maintain cybersecurity insurance, the costs related to cybersecurity incidents or disruptions may not be fully insured. See “Item 1A. Risk Factors” for a discussion of cybersecurity risks.
Governance
The Information Security Director, who reports to the CIO, is responsible for establishing basic policies and procedures related to cybersecurity. The Information Security Director is also responsible for selecting the CIRT and the CIC to lead the response to each incident. Established policies and procedures are employed by the CIRT in planning and executing a response to a cybersecurity incident. The CIO and the Information Security Director have over 55 combined years of information technology and program management experience and have served over 31 combined years in the Company’s corporate information security organization. They are familiar with the Company’s cybersecurity landscape, risks and best practices for mitigation of those risks identified.
The Company has developed a matrix to assist in determining if a cybersecurity incident is significant. The Information Security Director, with the help of the CIRT, determines whether an incident should be escalated to executive management, including to the Chief Executive Officer, the Chief Financial Officer and the General Counsel, based on its significance. Once escalated, executive management determines the appropriate incident handling strategy, with input from the Information Security Director, including whether the incident warrants immediate notification to the Audit Committee of the Board of Directors. After determining the incident handling approach, the CIC regularly updates executive management on incident response progress to ensure it is aware of the business risks posed by the incident until the incident is resolved.
The Board of Directors delegates oversight of information technology and cybersecurity to the Audit Committee of the Board of Directors. As part of this oversight, information technology leadership annually provides a detailed cybersecurity update to the Audit Committee. Additionally, on a quarterly basis, the Audit Committee receives a summarized cybersecurity update, including the results of teammate phishing testing programs and the results of the quarterly cybersecurity disclosure questionnaires. In the event of a material cybersecurity incident, the Audit Committee will report such incident to the full Board of Directors.
17
Item 2.Properties.
As of January 26, 2024, the principal properties of the Company included its corporate headquarters, subsidiary headquarters, 60 distribution centers and 10 manufacturing plants. The Company owns 47 distribution centers and nine manufacturing plants, and leases its corporate headquarters, subsidiary headquarters, 13 distribution centers and one manufacturing plant.
Following is a summary of the Company’s manufacturing plants and certain other properties:
| Facility Type | Location | Square Feet | Leased / Owned | Lease Expiration | ||||||||||||||||||||||
Distribution Center/Manufacturing Plant Combination(1) | Charlotte, NC | 650,000 | Owned | — | ||||||||||||||||||||||
| Distribution Center | Whitestown, IN | 415,000 | Owned | — | ||||||||||||||||||||||
| Manufacturing Plant | Indianapolis, IN | 400,000 | Owned | — | ||||||||||||||||||||||
| Warehouse | Charlotte, NC | 380,000 | Leased | 2028 | ||||||||||||||||||||||
| Manufacturing Plant | Cincinnati, OH | 368,000 | Owned | — | ||||||||||||||||||||||
| Warehouse | Chester, VA | 353,000 | Leased | 2028 | ||||||||||||||||||||||
| Manufacturing Plant | Sandston, VA | 326,000 | Owned | — | ||||||||||||||||||||||
| Manufacturing Plant | West Memphis, AR | 326,000 | Owned | — | ||||||||||||||||||||||
| Manufacturing Plant | Roanoke, VA | 310,000 | Owned | — | ||||||||||||||||||||||
| Distribution Center | Erlanger, KY | 301,000 | Leased | 2034 | ||||||||||||||||||||||
| Distribution Center | Louisville, KY | 300,000 | Leased | 2030 | ||||||||||||||||||||||
| Manufacturing Plant | Twinsburg, OH | 287,000 | Owned | — | ||||||||||||||||||||||
| Warehouse | Hanover, MD | 278,000 | Leased | 2027 | ||||||||||||||||||||||
| Distribution Center | Hanover, MD | 276,000 | Leased | 2034 | ||||||||||||||||||||||
| Distribution Center | Memphis, TN | 266,000 | Leased | 2025 | ||||||||||||||||||||||
| Distribution Center | Clayton, NC | 233,000 | Leased | 2026 | ||||||||||||||||||||||
| Manufacturing Plant | Nashville, TN | 220,000 | Leased | 2029 | ||||||||||||||||||||||
| Distribution Center | La Vergne, TN | 220,000 | Leased | 2026 | ||||||||||||||||||||||
| Distribution Center | Sandston, VA | 210,000 | Owned | — | ||||||||||||||||||||||
Corporate Headquarters(2)(3) | Charlotte, NC | 172,000 | Leased | 2029 | ||||||||||||||||||||||
| Manufacturing Plant | Baltimore, MD | 155,000 | Owned | — | ||||||||||||||||||||||
| Manufacturing Plant | Silver Spring, MD | 104,000 | Owned | — | ||||||||||||||||||||||
(1)Includes a 535,000-square foot manufacturing plant and an adjacent 115,000-square foot distribution center.
(2)Includes two adjacent buildings totaling approximately 172,000 square feet.
(3)The lease for this facility is with a related party.
The Company believes all of its facilities are in good condition and are adequate for the Company’s operations as presently conducted. The Company has production capacity to meet its current operational requirements. The estimated utilization percentage of the Company’s manufacturing plants, which fluctuates with the seasonality of the business, as of December 31, 2023, is indicated below:
| Location | Utilization(1) | Location | Utilization(1) | |||||||||||||||||
| Roanoke, VA | 94 | % | Cincinnati, OH | 80 | % | |||||||||||||||
| Nashville, TN | 83 | % | Charlotte, NC | 76 | % | |||||||||||||||
| Indianapolis, IN | 82 | % | West Memphis, AR | 72 | % | |||||||||||||||
| Silver Spring, MD | 81 | % | Sandston, VA | 72 | % | |||||||||||||||
| Baltimore, MD | 80 | % | Twinsburg, OH | 58 | % | |||||||||||||||
(1)Estimated production divided by capacity, based on expected operations of six days per week and 20 hours per day.
In addition to the facilities noted above, the Company utilizes a portion of the production capacity from the 261,000-square foot manufacturing plant owned by SAC, a manufacturing cooperative located in Bishopville, South Carolina.
The Company’s products are generally transported to distribution centers for storage pending sale. There were no changes to the number of distribution centers by market area between December 31, 2023 and January 26, 2024.
18
As of January 26, 2024, the Company owned and operated approximately 4,300 vehicles in the sale and distribution of the Company’s beverage products, of which approximately 2,700 were route delivery trucks. In addition, the Company owned approximately 452,000 beverage dispensing and vending machines for the sale of beverage products in the Company’s territories as of January 26, 2024.
Item 3.Legal Proceedings.
The Company is involved in various claims and legal proceedings which have arisen in the ordinary course of its business. Although it is difficult to predict the ultimate outcome of these claims and legal proceedings, management believes the ultimate disposition of these matters will not have a material adverse effect on the financial condition, results of operations or cash flows of the Company. No material amount of loss in excess of recorded amounts is believed to be reasonably possible as a result of these claims and legal proceedings.
Item 4.Mine Safety Disclosures.
Not applicable.
19
Information About Our Executive Officers
The following is a description of the names and ages of the executive officers of the Company, indicating all positions and offices with the Company held by each such person and each person’s principal occupation or employment during the past five years. Each executive officer of the Company is elected by the Board of Directors and holds office from the date of election until thereafter removed by the Board.
| Name | Position and Office | Age | ||||||||||||
| J. Frank Harrison, III | Chairman of the Board of Directors and Chief Executive Officer | 69 | ||||||||||||
| David M. Katz | President and Chief Operating Officer | 55 | ||||||||||||
| F. Scott Anthony | Executive Vice President and Chief Financial Officer | 60 | ||||||||||||
| Matthew J. Blickley | Senior Vice President, Financial Planning and Chief Accounting Officer | 42 | ||||||||||||
| Robert G. Chambless | Executive Vice President, Franchise Beverage Operations | 58 | ||||||||||||
| Donell W. Etheridge | Executive Vice President, Product Supply Operations | 55 | ||||||||||||
| Morgan H. Everett | Vice Chair of the Board of Directors | 42 | ||||||||||||
| E. Beauregarde Fisher III | Executive Vice President, General Counsel and Secretary | 55 | ||||||||||||
| Christine A. Motherwell | Senior Vice President, Human Resources | 45 | ||||||||||||
| N. Brent Tollison | Senior Vice President, Public Affairs, Communications, Community, and Sustainability | 50 | ||||||||||||
Mr. J. Frank Harrison, III was elected Chairman of the Board of Directors of the Company in December 1996 and Chief Executive Officer of the Company in May 1994. Mr. Harrison served as Vice Chairman of the Board of Directors of the Company from November 1987 to December 1996. He was first employed by the Company in 1977 and also served as a Division Sales Manager and as a Vice President.
Mr. David M. Katz was elected President and Chief Operating Officer of the Company in December 2018. Prior to that, he served in various positions within the Company, including Executive Vice President and Chief Financial Officer from January 2018 to December 2018, Executive Vice President, Product Supply and Culture & Stewardship from April 2017 to January 2018, Executive Vice President, Human Resources from April 2016 to April 2017 and Senior Vice President from January 2013 to March 2016. He held the position of Senior Vice President, Midwest Region for CCR, a wholly owned subsidiary of The Coca‑Cola Company, from November 2010 to December 2012. Previously, Mr. Katz was Vice President, Sales Operations for the East Business Unit of Coca‑Cola Enterprises Inc. (“CCE”), a distributor, marketer and manufacturer of nonalcoholic beverages primarily for The Coca‑Cola Company, from January 2010 to November 2010. From 2008 to 2010, he served as Chief Procurement Officer and as President and Chief Executive Officer of CCBSS, a company formed to provide certain procurement and other services with the intention of enhancing the efficiency and competitiveness of the Coca‑Cola bottling system. He began his Coca‑Cola career in 1993 with CCE as a Logistics Consultant.
Mr. F. Scott Anthony was elected Executive Vice President and Chief Financial Officer of the Company in December 2018. Prior to that, he served as Senior Vice President, Treasurer of the Company from November 2018 to December 2018. Before joining the Company, Mr. Anthony served as Executive Vice President, Chief Financial Officer of Ventura Foods, LLC, a privately held food solutions company, from April 2011 to September 2018. Previously, Mr. Anthony spent 21 years with CCE, a distributor, marketer and manufacturer of nonalcoholic beverages primarily for The Coca‑Cola Company, in a variety of roles, including Vice President, Chief Financial Officer of CCE’s North America division, Vice President, Investor Relations & Planning, and Director, Acquisitions & Investor Relations.
Mr. Matthew J. Blickley was elected Senior Vice President, Financial Planning and Chief Accounting Officer of the Company in July 2020, effective August 2020. Prior to that, he served as Vice President, Financial Planning and Analysis of the Company from April 2018 to August 2020, as Senior Director, Financial Planning and Analysis of the Company from April 2016 to March 2018 and as Corporate Controller of the Company from November 2014 to March 2016. Before joining the Company, Mr. Blickley was with Family Dollar Stores, Inc., an operator of general merchandise retail discount stores, from January 2011 to November 2014, where he served in various senior financial roles, including Divisional Vice President, Financial Planning & Analysis and Director, Financial Reporting. Mr. Blickley is a certified public accountant and began his career with PricewaterhouseCoopers LLP in 2004 where he advanced from Audit Associate to Audit Manager during his more than six years with that firm.
Mr. Robert G. Chambless was elected Executive Vice President, Franchise Beverage Operations of the Company in January 2018. Prior to that, he served in various positions within the Company, including Executive Vice President, Franchise Strategy and Operations from April 2016 to January 2018, Senior Vice President, Sales, Field Operations and Marketing from August 2010 to March 2016, Senior Vice President, Sales from June 2008 to July 2010, Vice President – Franchise Sales from 2003 to 2008, Region Sales Manager for the Company’s Southern Division from 2000 to 2003 and Sales Manager in the Company’s Columbia, South
20
Carolina branch from 1997 to 2000. He also served the Company in several other positions prior to 1997 and was first employed by the Company in 1986.
Mr. Donell W. Etheridge was elected Executive Vice President, Product Supply Operations of the Company in March 2021. Prior to that, he served in various positions within the Company, including Senior Vice President, Product Supply Operations from September 2016 to February 2021, Vice President, Product Supply Operations from December 2013 to September 2016, Senior Director, Manufacturing from August 2011 to November 2013, Director, Operations from April 2009 to July 2011 and Plant Manager from January 2003 to March 2009. He also served the Company in several other positions prior to 2003 and was first employed by the Company in 1990.
Ms. Morgan H. Everett was elected Vice Chair of the Board of Directors of the Company in May 2020. Prior to that, she was Senior Vice President of the Company from April 2019 to May 2020, Vice President of the Company from January 2016 to March 2019, and Community Relations Director of the Company from January 2009 to December 2015. Since December 2018, Ms. Everett has served as Chairman of Red Classic Services, LLC and Data Ventures, Inc., two of the Company’s operating subsidiaries. She has been an employee of the Company since October 2004.
Mr. E. Beauregarde Fisher III was elected Executive Vice President, General Counsel of the Company in February 2017 and Secretary of the Company in May 2017. Before joining the Company, he was a partner with the law firm of Moore & Van Allen PLLC where he served on the firm’s management committee and chaired its business law practice group. He was associated with the firm from 1998 to 2017 and concentrated his practice on mergers and acquisitions, corporate governance and general corporate matters. From 2011 to 2017, he served as the Company’s outside corporate counsel.
Ms. Christine A. Motherwell was elected Senior Vice President, Human Resources of the Company in September 2021, effective January 2022. Prior to that, she served in various positions within the Company, including Vice President, Human Resources Business Partner from October 2019 to December 2021, Vice President, Home Market Sales from April 2016 to September 2019, Vice President, Walmart/Club from April 2015 to March 2016 and Senior Director, Customer Development – Walmart from February 2013 to March 2015. Before joining the Company, Ms. Motherwell was National Account Executive, Publix of The Coca‑Cola Company, the world’s largest nonalcoholic beverage company, from December 2011 to February 2013. Prior to that, Ms. Motherwell was with CCR, a wholly owned subsidiary of The Coca‑Cola Company, where she served as Director, Sales from January 2011 to December 2011 and as Sales Center Manager from October 2009 to December 2010.
Mr. N. Brent Tollison was elected Senior Vice President, Public Affairs, Communications, Community, and Sustainability of the Company in May 2023, a role he had held in an interim capacity since November 2022. From June 2021 to August 2023, he served as Senior Vice President, Assistant to the President and Chief Operating Officer of the Company. Prior to that, Mr. Tollison was Vice President of Commercial Sales at W.W. Grainger, Inc., a broad line, business-to-business distributor of maintenance, repair and operating products and services with operations primarily in North America, Japan and the United Kingdom, from May 2014 to June 2021. Previously, he served in various roles of increasing responsibility within the Coca‑Cola system for approximately 18 years, including Vice President of Sales and Operations – Northeast of The Coca‑Cola Company, the world’s largest nonalcoholic beverage company, from June 2013 to April 2014, Vice President of Region Sales – New York Market Unit of CCR, a wholly owned subsidiary of The Coca‑Cola Company, from October 2011 to June 2013, Market Unit Vice President – Virginia of CCR from January 2011 to October 2011, Vice President of Convenience Retail – East Business Unit of CCE, a distributor, marketer and manufacturer of nonalcoholic beverages primarily for The Coca‑Cola Company, from November 2008 to January 2011 and Vice President of Convenience Retail – Southeast Business Unit of CCE from September 2007 to November 2008.
21
PART II
Item 5.Market for Registrant’s Common Equity, Related Stockholder Matters and Issuer Purchases of Equity Securities.
The Company has two classes of common stock outstanding, Common Stock and Class B Common Stock. The Common Stock is traded on The Nasdaq Global Select Market under the symbol “COKE.” There is no established public trading market for the Class B Common Stock. Shares of Class B Common Stock are convertible on a share-for-share basis into shares of Common Stock at any time at the option of the holder.
The Company’s Board of Directors determines the amount and frequency of dividends declared and paid by the Company in light of the earnings and financial condition of the Company at such time. No assurance can be given that dividends will be declared or paid in the future.
As of January 26, 2024, the number of stockholders of record of the Common Stock and the Class B Common Stock was 1,198 and six, respectively.
Stock Performance Graph
Presented below is a line graph comparing the yearly percentage change in the cumulative total return on the Company’s Common Stock to the cumulative total return of the Standard & Poor’s 500 Index and a peer group for the period commencing December 30, 2018 and ending December 31, 2023. The peer group is comprised of Keurig Dr Pepper Inc., National Beverage Corp., The Coca‑Cola Company, Primo Water Corporation (f/k/a Cott Corporation) and PepsiCo, Inc.
The graph assumes $100 was invested in the Company’s Common Stock, the Standard & Poor’s 500 Index and each of the companies within the peer group on December 30, 2018, and that all dividends were reinvested on a quarterly basis. Returns for the companies included in the peer group have been weighted on the basis of the total market capitalization for each company.
COMPARISON OF 5-YEAR CUMULATIVE TOTAL RETURN*
Among Coca-Cola Consolidated, Inc., the S&P 500 Index and a Peer Group
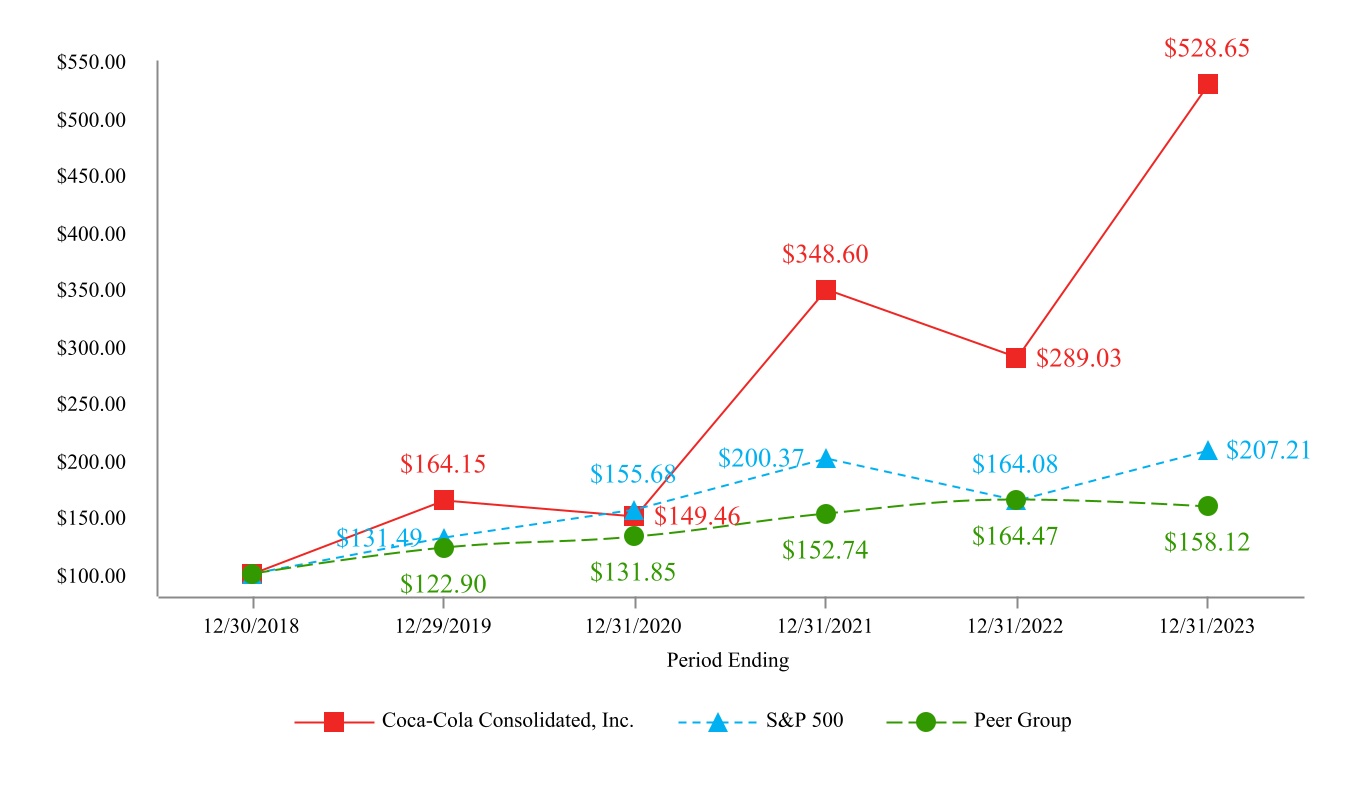
*Assumes $100 invested on 12/30/2018 in stock or index, including reinvestment of dividends.
Index calculated on a month-end basis.
Item 6.[Reserved]
22
Item 7.Management’s Discussion and Analysis of Financial Condition and Results of Operations.
The following Management’s Discussion and Analysis of Financial Condition and Results of Operations of the Company is intended to help the reader understand our financial condition and results of operations and is provided as an addition to, and should be read in conjunction with, our consolidated financial statements and the accompanying notes to the consolidated financial statements. The consolidated financial statements include the accounts and the consolidated operations of the Company and its majority-owned subsidiaries. All comparisons are to the prior year unless specified otherwise.
The periods presented are the fiscal years ended December 31, 2023 (“2023”) and December 31, 2022 (“2022”). Information concerning the fiscal year ended December 31, 2021 (“2021”) and a comparison of 2022 and 2021 may be found under “Item 7. Management’s Discussion and Analysis of Financial Condition and Results of Operations” in the Company’s Annual Report on Form 10‑K for 2022, filed with the SEC on February 22, 2023.
The Company manages its business on the basis of three operating segments. Nonalcoholic Beverages represents the vast majority of the Company’s consolidated net sales and income from operations. The additional two operating segments do not meet the quantitative thresholds for separate reporting, either individually or in the aggregate, and, therefore, have been combined into “All Other.”
Executive Summary
Net sales increased 7% to $6.65 billion in 2023, with standard physical case volume down 1.9% when compared to the prior year. The increase in net sales was driven primarily by price increases across our product portfolio during the second half of 2022 and the beginning of 2023. Volume continued to outperform the price elasticities we have historically experienced with higher pricing. Sparkling and Still net sales increased 10.5% and 6.4%, respectively, compared to 2022. While Sparkling volume decreased 0.3% in 2023, we experienced strong consumer demand for our multi-serve can packages as well as our Immediate Consumption products. Brands within the Sparkling category benefited from solid performance in our on-premise sales channels, as more consumers returned to pre-COVID work and leisure routines. Additionally, Sparkling sales at our Club store channels were strong as consumers sought value-oriented packages during 2023. Still volume decreased 6.1% in 2023, as the overall Sports Drinks category slowed considerably. Other Still categories such as Energy and Enhanced Water continued to perform well, with Monster Energy and glacéau smartwater both achieving solid growth in 2023.
Gross profit in 2023 increased $320.8 million, or 14%, while gross margin increased 240 basis points to 39.1%. The improvement in gross profit resulted primarily from higher prices for our products and a moderation of prices for certain commodities. Compared to 2022, gross margin also benefited from the increased mix of Sparkling beverages, which generally carry higher gross margins than Still packages.
Selling, delivery and administrative (“SD&A”) expenses in 2023 increased $127.4 million, or 8%. SD&A expenses as a percentage of net sales in 2023 increased 10 basis points to 26.5% as compared to 2022. The increase in SD&A expenses related primarily to an increase in labor costs and certain investments in our teammates, including incentive compensation expense, to reward their performance and contributions in achieving strong operating results.
Income from operations in 2023 increased $193.4 million to $834.5 million. Income tax expense in 2023 was $149.1 million, compared to $144.9 million in 2022. The effective income tax rate for 2023 was 26.7%, compared to 25.2% for 2022. The increase in the effective income tax rate was primarily the result of lower income before taxes and an increase in certain nondeductible amounts as compared to 2022.
Net income decreased $21.8 million in 2023 to $408.4 million as compared to 2022. Net income in 2023 was adversely impacted by fair value adjustments to our acquisition related contingent consideration liability, driven by changes in the discount rate and future cash flow projections used to calculate the fair value of the liability. Additionally, net income in 2023 included a non-cash charge of $112.8 million related to the full settlement of our primary pension plan benefit liabilities.
Cash flows provided by operations in 2023 were $810.7 million, compared to $554.5 million in 2022. Cash flows from operations reflected our strong operating performance during 2023. During 2023, we invested $282.3 million in capital expenditures as we continued to optimize our supply chain and invest for future growth.
23
Areas of Emphasis
Key priorities for the Company include executing our commercial strategy, executing our revenue management strategy, optimizing our supply chain, generating cash flow, determining the optimal route to market and creating a digitally enabled selling platform.
Commercial Execution: Our success is dependent on our ability to execute our commercial strategy within our customers’ stores. Our ability to obtain shelf space within stores and remain in-stock across our portfolio of brands and packages in a profitable manner will have a significant impact on our results. We are focused on execution at every step in our supply chain, including raw material and finished product procurement, manufacturing conversion, transportation, warehousing and distribution, to ensure in-store execution can occur. We continue to invest in tools and technology to enable our teammates to operate more effectively and efficiently with our customers and to drive long-term value in our business.
Revenue Management: Our revenue management strategy focuses on pricing our brands and packages optimally within product categories and channels, creating effective working relationships with our customers and making disciplined fact-based decisions. Pricing decisions are made considering a variety of factors, including brand strength, competitive environment, input costs, the roles certain brands play in our product portfolio and other market conditions.
Supply Chain Optimization: We are continually focused on optimizing our supply chain, which includes identifying nearby warehousing and distribution operations that can be consolidated into new facilities to increase capacity, expand production capabilities, reduce overall production costs and add automation to allow the Company to better serve its customers and consumers. The Company undertook significant capital expenditures to optimize our supply chain and to invest for future growth during 2023, and expects to continue to make significant investments during 2024.
Cash Flow Generation: We have several initiatives in place to optimize cash flow, improve profitability and prudently manage capital expenditures. We believe strengthening our balance sheet gives us the flexibility to make optimal capital allocation decisions for long-term value creation.
Optimal Route to Market: We are focused on implementing optimal methods of distribution of our products within our territory. Our typical direct store delivery method uses Company-owned vehicles and warehouses, but we are increasingly using alternative methods of distribution. For example, in instances of post-mix delivery for use in fountain machines, we have shifted our delivery method to alternative distributors in order to enhance customer service and profitability. In instances of bottle/can delivery, we are shifting certain products for certain customers and channels of business to alternative routes to market. These alternative routes to market include third-party distributors, the manufacturer of the product or the customer’s supply chain infrastructure. These bottle/can arrangements generally come with favorable commercial terms for the Company. In 2023, more than half of our post-mix gallons and less than 10% of our bottle/can volume was delivered through alternative routes to market.
Digitally Enabled Selling Platform: Through our investment in CONA, we, along with other Coca-Cola bottlers, are building a digitally enabled selling platform called MyCoke 360 that we believe will enable us to better serve our customers. This platform will enable a more seamless order and payment platform for certain customers and we expect this platform will enable us to enhance customer service and create more selling opportunities for our teammates. This platform is targeted to certain on-premise and small store customers.
24
Results of Operations
The Company’s results of operations for 2023 and 2022 are highlighted in the table below and discussed in the following paragraphs.
| Fiscal Year | ||||||||||||||||||||
| (in thousands) | 2023 | 2022 | Change | |||||||||||||||||
| Net sales | $ | 6,653,858 | $ | 6,200,957 | $ | 452,901 | ||||||||||||||
| Cost of sales | 4,055,147 | 3,923,003 | 132,144 | |||||||||||||||||
| Gross profit | 2,598,711 | 2,277,954 | 320,757 | |||||||||||||||||
| Selling, delivery and administrative expenses | 1,764,260 | 1,636,907 | 127,353 | |||||||||||||||||
| Income from operations | 834,451 | 641,047 | 193,404 | |||||||||||||||||
| Interest (income) expense, net | (918) | 24,792 | (25,710) | |||||||||||||||||
| Mark-to-market on acquisition related contingent consideration | 159,354 | 32,301 | 127,053 | |||||||||||||||||
| Pension plan settlement expense | 112,796 | — | 112,796 | |||||||||||||||||
| Other expense, net | 5,738 | 8,867 | (3,129) | |||||||||||||||||
| Income before taxes | 557,481 | 575,087 | (17,606) | |||||||||||||||||
| Income tax expense | 149,106 | 144,929 | 4,177 | |||||||||||||||||
| Net income | 408,375 | 430,158 | (21,783) | |||||||||||||||||
| Other comprehensive income, net of tax | 80,561 | 15,626 | 64,935 | |||||||||||||||||
| Comprehensive income | $ | 488,936 | $ | 445,784 | $ | 43,152 | ||||||||||||||
Net Sales
Net sales increased $452.9 million, or 7.3%, to $6.65 billion in 2023, as compared to $6.20 billion in 2022. The largest driver of the increase in net sales was higher average bottle/can sales price per unit charged to retail customers, which increased net sales by approximately $515 million. The increase in net sales was partially offset by lower case sales volume as compared to 2022, which decreased net sales by approximately $110 million.
Net sales by product category were as follows:
| Fiscal Year | ||||||||||||||||||||
| (in thousands) | 2023 | 2022 | % Change | |||||||||||||||||
| Bottle/can sales: | ||||||||||||||||||||
| Sparkling beverages | $ | 3,892,133 | $ | 3,521,273 | 10.5 | % | ||||||||||||||
| Still beverages | 2,149,639 | 2,020,100 | 6.4 | % | ||||||||||||||||
| Total bottle/can sales | 6,041,772 | 5,541,373 | 9.0 | % | ||||||||||||||||
| Other sales: | ||||||||||||||||||||
| Sales to other Coca‑Cola bottlers | 353,819 | 349,837 | 1.1 | % | ||||||||||||||||
| Post-mix sales and other | 258,267 | 309,747 | (16.6) | % | ||||||||||||||||
| Total other sales | 612,086 | 659,584 | (7.2) | % | ||||||||||||||||
| Total net sales | $ | 6,653,858 | $ | 6,200,957 | 7.3 | % | ||||||||||||||
The decline in post-mix sales and other in 2023 as compared to 2022 was related to a shift in how we deliver post-mix products to our customers. The Company has shifted to a broader use of alternative distributors, rather than Company-owned vehicles and warehouses, to deliver post-mix products to customers in our territory. We receive a fee from a vendor on these post-mix gallons delivered to locally managed customers in our territory, which is recorded as a reduction to cost of sales. This transition has occurred over the past several years but accelerated in 2023 and is expected to be more prevalent in 2024. More than half of the post-mix gallons sold to local customers in our franchise territory in 2023 were delivered using these alternative distribution methods.
25
Product category sales volume of standard physical cases (as defined below) and the percentage change by product category were as follows:
| Fiscal Year | ||||||||||||||||||||
| (in thousands) | 2023 | 2022 | % Change | |||||||||||||||||
| Bottle/can sales volume: | ||||||||||||||||||||
| Sparkling beverages | 263,872 | 264,735 | (0.3) | % | ||||||||||||||||
| Still beverages | 91,495 | 97,456 | (6.1) | % | ||||||||||||||||
| Total bottle/can sales volume | 355,367 | 362,191 | (1.9) | % | ||||||||||||||||
A standard physical case is a volume metric used to standardize differing package configurations in order to measure delivered cases on an equivalent basis. As the Company evaluates its volume metrics, it reassesses the way in which physical case volume is measured, which may lead to differences from previously presented results in order to conform with current period standard volume measurement techniques, as used by management. Additionally, as the Company introduces new products, it reassesses the category assigned to its products at the SKU level, therefore categorization could differ from previously presented results in order to conform with current period categorization. Any differences are not material.
The bottle/can sales volume above represents volume that is delivered directly to our customer outlets using Company-owned vehicles and warehouses. In order to serve our customers in the most efficient way, as well as in response to customer demands, the Company has, in certain circumstances, shifted the delivery of our products to third-party distributors, the manufacturer of the product or the customer’s supply chain infrastructure, rather than through Company-owned vehicles and warehouses.
As a result of not physically delivering the product, the sales volume delivered using these alternative methods of distribution is not reflected in our volume metrics. However, because we have the exclusive distribution rights for non-alcoholic beverages within our franchise territory, we receive fees for the delivery of qualified product in our territory. These fees are reported in net sales. Changes in the delivery of our products to our customers has impacted, and will continue to impact, our reported volume and net sales. This transition has occurred over the past several years but accelerated in 2023 and is expected to be more prevalent in 2024. Less than 10% of the bottle/can volume sold in our franchise territory in 2023 was delivered using these alternative routes to market.
The following table summarizes the percentage of the Company’s total bottle/can sales volume to its largest customers, as well as the percentage of the Company’s total net sales that such volume represents:
| Fiscal Year | ||||||||||||||
| 2023 | 2022 | |||||||||||||
| Approximate percent of the Company’s total bottle/can sales volume: | ||||||||||||||
| Wal-Mart Stores, Inc. | 21 | % | 20 | % | ||||||||||
| The Kroger Company | 14 | % | 12 | % | ||||||||||
| Total approximate percent of the Company’s total bottle/can sales volume | 35 | % | 32 | % | ||||||||||
| Approximate percent of the Company’s total net sales: | ||||||||||||||
| Wal-Mart Stores, Inc. | 17 | % | 16 | % | ||||||||||
| The Kroger Company | 11 | % | 10 | % | ||||||||||
| Total approximate percent of the Company’s total net sales | 28 | % | 26 | % | ||||||||||
Cost of Sales
Inputs representing a substantial portion of the Company’s cost of sales include: (i) purchases of finished products, (ii) raw material costs, including aluminum cans, plastic bottles, carbon dioxide and sweetener, (iii) concentrate costs and (iv) manufacturing costs, including labor, overhead and warehouse costs. In addition, cost of sales includes shipping, handling and fuel costs related to the movement of finished products from manufacturing plants to distribution centers, amortization expense of distribution rights, distribution fees of certain products and marketing credits and post-mix funding from brand companies. Raw material costs represent approximately 20% of total cost of sales on an annual basis.
Cost of sales increased $132.1 million, or 3.4%, to $4.06 billion in 2023, as compared to $3.92 billion in 2022. The increase in cost of sales was driven by higher input costs, including concentrate and manufacturing costs, which increased cost of sales by approximately $180 million. The increase in cost of sales was partially offset by lower case sales volume as compared to 2022, which decreased cost of sales by approximately $40 million.
26
The Company relies extensively on advertising and sales promotions in the marketing of its products. The Coca‑Cola Company and other beverage companies that supply concentrates, syrups and finished products to the Company make substantial marketing and advertising expenditures, including national advertising programs, to develop their brand identities and to promote sales in the Company’s territories. Certain of these marketing and advertising expenditures are made pursuant to annual arrangements. Total marketing funding support from The Coca‑Cola Company and other beverage companies, which includes both direct payments to the Company and payments to customers for marketing programs, was $164.5 million in 2023, as compared to $147.3 million in 2022.
Selling, Delivery and Administrative Expenses
SD&A expenses include the following: sales management labor costs, distribution costs resulting from transporting finished products from distribution centers to customer locations, distribution center overhead including depreciation expense, distribution center warehousing costs, delivery vehicles and cold drink equipment, point-of-sale expenses, advertising expenses, cold drink equipment repair costs, amortization of intangible assets and administrative support labor and operating costs.
SD&A expenses increased $127.4 million, or 7.8%, to $1.76 billion in 2023, as compared to $1.64 billion in 2022. SD&A expenses as a percentage of net sales increased to 26.5% in 2023 from 26.4% in 2022. Of the increase in SD&A expenses, approximately $72 million was related to an increase in labor costs and certain investments in our teammates, including incentive compensation expense, to reward their performance and contributions in achieving strong operating results. In addition, approximately $30 million of the increase in SD&A expenses was attributable to higher transportation costs, including fleet repairs, as well as changes in our fuel commodity hedge positions as compared to 2022. Approximately $12 million of the increase in SD&A expenses was driven by an increase in commitments to various charities and donor-advised funds in light of the Company’s financial performance.
Shipping and handling costs included in SD&A expenses were approximately $780 million in 2023 and approximately $757 million in 2022.
Interest (Income) Expense, Net
Interest (income) expense, net in 2023 totaled $0.9 million of interest income, net, as compared to $24.8 million of interest expense, net in 2022. The change in interest (income) expense, net was primarily a result of an increase in interest income due to higher cash and cash equivalent balances and increased yields as compared to 2022. The increase in yields was due to the rising rate environment and related to cash deposits and investments in money market funds and U.S. Treasury securities, which contributed to additional interest income as compared to the prior year.
Mark-to-Market on Acquisition Related Contingent Consideration
Mark-to-market on acquisition related contingent consideration increased $127.1 million to $159.4 million in 2023, as compared to $32.3 million in 2022.
Each reporting period, the Company adjusts its acquisition related contingent consideration liability related to the distribution territories subject to acquisition related sub-bottling payments to fair value. The fair value is determined by discounting future expected acquisition related sub-bottling payments required under the CBA, which extend through the life of the related distribution assets acquired in each distribution territory, using the Company’s estimated weighted average cost of capital (“WACC”), which is impacted by many factors, including long-term interest rates and future cash flow projections. The life of these distribution assets is generally 40 years. The Company is required to pay the current portion of the acquisition related sub-bottling payments on a quarterly basis.
The change in the fair value of the acquisition related contingent consideration liability in 2023 as compared to 2022 was primarily driven by changes in the discount rate and projections of future cash flows used to calculate the fair value of the liability.
Pension Plan Settlement Expense
During 2023, the Company recognized a non-cash charge of $112.8 million related to the full settlement of the primary Company-sponsored pension plan (the “Primary Plan”) benefit liabilities, including final premium adjustments, which was recorded as pension plan settlement expense in the consolidated statement of operations for that year. The charge related primarily to a reclassification of actuarial losses from accumulated other comprehensive loss. As of December 31, 2023, there were no gross actuarial losses included in accumulated other comprehensive loss associated with the Primary Plan. As of December 31, 2022, there were approximately $117 million of gross actuarial losses included in accumulated other comprehensive loss associated with the Primary Plan. See Note 17 to the consolidated financial statements for additional information related to the Company’s pension plans.
27
Other Expense, Net
Other expense, net decreased $3.1 million to $5.7 million in 2023, as compared to $8.9 million in 2022. The decrease in other expense, net was primarily driven by changes in the actuarial assumptions related to our pension and postretirement plan liabilities.
Income Tax Expense
The Company’s effective income tax rate was 26.7% for 2023 and 25.2% for 2022. The Company’s income tax expense increased $4.2 million, or 2.9%, to $149.1 million in 2023, as compared to $144.9 million in 2022. The increase in the effective income tax rate was primarily attributable to lower income before taxes and an increase in certain nondeductible amounts during 2023 as compared to 2022.
Other Comprehensive Income, Net of Tax
Other comprehensive income, net of tax was $80.6 million in 2023 and $15.6 million in 2022. As noted in the discussion of pension plan settlement expense above, the Company recognized a non-cash charge of $112.8 million during 2023 related to the full settlement of the Primary Plan benefit liabilities. A corresponding benefit was recognized within other comprehensive income, net of tax due to the reclassification of certain previously recognized actuarial losses from accumulated other comprehensive loss. See Note 17 to the consolidated financial statements for additional information related to the Company’s pension plans.
Segment Operating Results
The Company evaluates segment reporting in accordance with Financial Accounting Standards Board Accounting Standards Codification Topic 280, Segment Reporting, each reporting period, including evaluating the reporting package reviewed by the Chief Operating Decision Maker (the “CODM”). The Company has concluded the Chief Executive Officer, the Chief Operating Officer and the Chief Financial Officer, as a group, represent the CODM. Asset information is not provided to the CODM.
The Company believes three operating segments exist. Nonalcoholic Beverages represents the vast majority of the Company’s consolidated net sales and income from operations. The additional two operating segments do not meet the quantitative thresholds for separate reporting, either individually or in the aggregate, and, therefore, have been combined into “All Other.”
The Company’s segment results are as follows:
| Fiscal Year | ||||||||||||||
| (in thousands) | 2023 | 2022 | ||||||||||||
| Net sales: | ||||||||||||||
| Nonalcoholic Beverages | $ | 6,562,622 | $ | 6,081,357 | ||||||||||
| All Other | 370,748 | 399,359 | ||||||||||||
Eliminations(1) | (279,512) | (279,759) | ||||||||||||
| Consolidated net sales | $ | 6,653,858 | $ | 6,200,957 | ||||||||||
| Income from operations: | ||||||||||||||
| Nonalcoholic Beverages | $ | 841,491 | $ | 639,136 | ||||||||||
| All Other | (7,040) | 1,911 | ||||||||||||
| Consolidated income from operations | $ | 834,451 | $ | 641,047 | ||||||||||
(1)The entire net sales elimination represents net sales from the All Other segment to the Nonalcoholic Beverages segment. Sales between these segments are recognized at either fair market value or cost depending on the nature of the transaction.
Adjusted Results (Non-GAAP)
The Company reports its financial results in accordance with accounting principles generally accepted in the United States (“GAAP”). However, management believes that certain non-GAAP financial measures provide users of the financial statements with additional, meaningful financial information that should be considered, in addition to the measures reported in accordance with GAAP, when assessing the Company’s ongoing performance. Management also uses these non-GAAP financial measures in making financial, operating and planning decisions and in evaluating the Company’s performance. Non-GAAP financial measures should be viewed in addition to, and not as an alternative for, the Company’s reported results prepared in accordance with GAAP. The Company’s non-GAAP financial information does not represent a comprehensive basis of accounting.
28
The following tables reconcile reported results (GAAP) to adjusted results (non-GAAP):
| Fiscal Year 2023 | ||||||||||||||||||||||||||||||||||||||
| (in thousands, except per share data) | Gross profit | SD&A expenses | Income from operations | Income before taxes | Net income | Basic net income per share | ||||||||||||||||||||||||||||||||
| Reported results (GAAP) | $ | 2,598,711 | $ | 1,764,260 | $ | 834,451 | $ | 557,481 | $ | 408,375 | $ | 43.56 | ||||||||||||||||||||||||||
Fair value adjustment of acquisition related contingent consideration(1) | — | — | — | 159,354 | 119,834 | 12.78 | ||||||||||||||||||||||||||||||||
Fair value adjustments for commodity derivative instruments(2) | (1,220) | (2,281) | 1,061 | 1,061 | 798 | 0.09 | ||||||||||||||||||||||||||||||||
Supply chain optimization(3) | 1,296 | — | 1,296 | 1,296 | 975 | 0.10 | ||||||||||||||||||||||||||||||||
Pension plan settlement expense(4) | — | — | — | 112,796 | 84,823 | 9.05 | ||||||||||||||||||||||||||||||||
| Total reconciling items | 76 | (2,281) | 2,357 | 274,507 | 206,430 | 22.02 | ||||||||||||||||||||||||||||||||
| Adjusted results (non-GAAP) | $ | 2,598,787 | $ | 1,761,979 | $ | 836,808 | $ | 831,988 | $ | 614,805 | $ | 65.58 | ||||||||||||||||||||||||||
| Adjusted percentage change versus 2022 | 13.9 | % | 7.6 | % | 29.8 | % | ||||||||||||||
| Fiscal Year 2022 | ||||||||||||||||||||||||||||||||||||||
| (in thousands, except per share data) | Gross profit | SD&A expenses | Income from operations | Income before taxes | Net income | Basic net income per share | ||||||||||||||||||||||||||||||||
| Reported results (GAAP) | $ | 2,277,954 | $ | 1,636,907 | $ | 641,047 | $ | 575,087 | $ | 430,158 | $ | 45.88 | ||||||||||||||||||||||||||
Fair value adjustment of acquisition related contingent consideration(1) | — | — | — | 32,301 | 24,306 | 2.59 | ||||||||||||||||||||||||||||||||
Fair value adjustments for commodity derivative instruments(2) | 3,333 | 427 | 2,906 | 2,906 | 2,187 | 0.23 | ||||||||||||||||||||||||||||||||
Supply chain optimization(3) | 533 | (73) | 606 | 606 | 456 | 0.05 | ||||||||||||||||||||||||||||||||
| Total reconciling items | 3,866 | 354 | 3,512 | 35,813 | 26,949 | 2.87 | ||||||||||||||||||||||||||||||||
| Adjusted results (non-GAAP) | $ | 2,281,820 | $ | 1,637,261 | $ | 644,559 | $ | 610,900 | $ | 457,107 | $ | 48.75 | ||||||||||||||||||||||||||
Following is an explanation of non-GAAP adjustments:
(1)This non-cash fair value adjustment of acquisition related contingent consideration fluctuates based on factors such as long-term interest rates and future cash flow projections of the distribution territories subject to acquisition related sub-bottling payments.
(2)The Company enters into commodity derivative instruments from time to time to hedge some or all of its projected purchases of aluminum, PET resin, diesel fuel and unleaded gasoline in order to mitigate commodity price risk. The Company accounts for its commodity derivative instruments on a mark-to-market basis.
(3)This adjustment reflects expenses within the Nonalcoholic Beverages segment as the Company continues to optimize efficiency opportunities across its business.
(4)This non-cash settlement expense relates to the termination of the Primary Plan during 2023.
Financial Condition
Total assets increased $579.4 million to $4.29 billion on December 31, 2023, as compared to $3.71 billion on December 31, 2022. Net working capital, defined as current assets less current liabilities, was $613.8 million on December 31, 2023, which was an increase of $273.1 million from December 31, 2022.
Significant changes in net working capital as of December 31, 2023 as compared to December 31, 2022 were as follows:
•An increase in cash and cash equivalents of $437.6 million, primarily as a result of cash flows relating to our strong operating performance.
•An increase in accounts receivable, trade of $23.9 million, driven primarily by increased net sales and the timing of cash receipts.
•A decrease in inventories of $25.6 million, primarily due to lower inventory levels for certain manufacturing materials compared to December 31, 2022.
•An increase in accounts payable, trade of $31.8 million, primarily due to the timing of cash payments.
•A decrease in accounts payable to The Coca‑Cola Company of $23.3 million, primarily as a result of the timing of cash payments.
•An increase in other accrued liabilities of $37.0 million, primarily due to an increase in the current portion of the acquisition related contingent consideration liability.
29
Liquidity and Capital Resources
The Company’s sources of capital include cash flows from operations, available credit facilities and the issuance of debt and equity securities. As of December 31, 2023, the Company had $635.3 million in cash and cash equivalents. The Company’s cash equivalents balance at December 31, 2023 consisted predominantly of investments in money market funds and U.S. Treasury securities with maturities of 90 days or less. The Company has obtained its long-term debt from public markets, private placements and bank facilities. Management believes the Company has sufficient sources of capital available to finance its business plan, to meet its working capital requirements and to maintain an appropriate level of capital spending for at least the next 12 months from the issuance of the consolidated financial statements.
The Company’s long-term debt as of December 31, 2023 and December 31, 2022 was as follows:
| (in thousands) | Maturity Date | December 31, 2023 | December 31, 2022 | |||||||||||||||||
Senior bonds and unamortized discount on senior bonds(1) | 11/25/2025 | $ | 349,983 | $ | 349,974 | |||||||||||||||
Revolving credit facility(2)(3) | 7/9/2026 | — | — | |||||||||||||||||
| Senior notes | 10/10/2026 | 100,000 | 100,000 | |||||||||||||||||
| Senior notes | 3/21/2030 | 150,000 | 150,000 | |||||||||||||||||
| Debt issuance costs | (824) | (1,157) | ||||||||||||||||||
| Total long-term debt | $ | 599,159 | $ | 598,817 | ||||||||||||||||
(1)The senior bonds due in 2025 were issued at 99.975% of par.
(2)The Company’s revolving credit facility has an aggregate maximum borrowing capacity of $500 million. The Company currently believes all banks participating in the revolving credit facility have the ability to and will meet any funding requests from the Company.
(3)During 2023, the Company amended its revolving credit facility to complete the transition of the interest rate index from the London InterBank Offered Rate (LIBOR) to the Secured Overnight Financing Rate (SOFR), as contemplated in the revolving credit facility.
The indenture under which the Company’s senior bonds were issued does not include financial covenants, but does limit the incurrence of certain liens and encumbrances as well as indebtedness by the Company’s subsidiaries in excess of certain amounts. The agreements under which the Company’s nonpublic debt was issued include two financial covenants: a consolidated cash flow/fixed charges ratio and a consolidated funded indebtedness/cash flow ratio, each as defined in the respective agreement. The Company was in compliance with these covenants as of December 31, 2023. These covenants have not restricted, and are not expected to restrict, the Company’s liquidity or capital resources.
All outstanding long-term debt has been issued by the Company and none has been issued by any of its subsidiaries. There are no guarantees of the Company’s long-term debt.
The Company’s credit ratings are reviewed periodically by certain nationally recognized rating agencies. Changes in the Company’s operating results or financial position could result in changes in the Company’s credit ratings. Lower credit ratings could result in higher borrowing costs for the Company or reduced access to capital markets, which could have a material adverse impact on the Company’s operating results or financial position. As of December 31, 2023, the Company’s credit ratings and outlook for its long-term debt were as follows:
| Credit Rating | Rating Outlook | |||||||||||||
| Moody’s | Baa1 | Stable | ||||||||||||
| Standard & Poor’s | BBB+ | Stable | ||||||||||||
The Company’s Board of Directors has declared, and the Company has paid, dividends on the Common Stock and the Class B Common Stock and each class of common stock has participated equally in all dividends each quarter for more than 25 years. The amount and frequency of future dividends will be determined by the Company’s Board of Directors in light of the earnings and financial condition of the Company at such time, and no assurance can be given that dividends will be declared or paid in the future.
On December 5, 2023, the Company announced that its Board of Directors had declared (i) a regular quarterly cash dividend of $0.50 per share on the Common Stock and the Class B Common Stock of the Company and (ii) a special cash dividend of $16.00 per share on the Common Stock and the Class B Common Stock of the Company, each payable on February 9, 2024 to stockholders of record of
30
the Common Stock and the Class B Common Stock as of the close of business on January 26, 2024. The total dividends paid on February 9, 2024 were approximately $155 million.
We review supplier terms and conditions on an ongoing basis, and have negotiated payment term extensions in recent years in connection with our efforts to improve cash flow and working capital. Separate from those term extension actions, the Company has an agreement with a third-party financial institution to facilitate a supply chain finance (“SCF”) program, which allows qualifying suppliers to sell their receivables from the Company to the financial institution in order to negotiate shorter payment terms on outstanding receivable arrangements. The Company’s obligations to its suppliers, including amounts due and scheduled payment terms, are not impacted by a supplier’s participation in the SCF program. See Note 12 to the consolidated financial statements for additional information related to the Company’s SCF program.
The Company’s only Level 3 asset or liability is the acquisition related contingent consideration liability. There were no transfers from Level 1 or Level 2 in any period presented. Fair value adjustments were non-cash and, therefore, did not impact the Company’s liquidity or capital resources. Following is a summary of the Level 3 activity:
| Fiscal Year | ||||||||||||||
| (in thousands) | 2023 | 2022 | ||||||||||||
| Beginning balance - Level 3 liability | $ | 541,491 | $ | 542,105 | ||||||||||
| Payments of acquisition related contingent consideration | (28,208) | (36,515) | ||||||||||||
| Reclassification to current payables | (3,300) | 3,600 | ||||||||||||
| Increase in fair value | 159,354 | 32,301 | ||||||||||||
| Ending balance - Level 3 liability | $ | 669,337 | $ | 541,491 | ||||||||||
Cash Sources and Uses
A summary of cash-based activity is as follows:
| Fiscal Year | ||||||||||||||
| (in thousands) | 2023 | 2022 | ||||||||||||
| Cash Sources: | ||||||||||||||
Net cash provided by operating activities(1) | $ | 810,690 | $ | 554,506 | ||||||||||
| Proceeds from the sale of property, plant and equipment | 695 | 7,369 | ||||||||||||
| Total cash sources | $ | 811,385 | $ | 561,875 | ||||||||||
| Cash Uses: | ||||||||||||||
| Additions to property, plant and equipment | $ | 282,304 | $ | 298,611 | ||||||||||
| Cash dividends paid | 46,868 | 9,374 | ||||||||||||
| Payments of acquisition related contingent consideration | 28,208 | 36,515 | ||||||||||||
| Investment in equity method investees | 13,741 | 3,094 | ||||||||||||
| Payments on financing lease obligations | 2,303 | 2,988 | ||||||||||||
| Debt issuance fees | 340 | 310 | ||||||||||||
| Acquisition of distribution rights | — | 30,649 | ||||||||||||
| Payments on term loan facility and senior notes | — | 125,000 | ||||||||||||
| Total cash uses | $ | 373,764 | $ | 506,541 | ||||||||||
| Net increase in cash | $ | 437,621 | $ | 55,334 | ||||||||||
(1)Net cash provided by operating activities in 2023 included net income tax payments of $200.8 million and pension plan contributions of $16.3 million. Net cash provided by operating activities in 2022 included net income tax payments of $141.0 million, pension plan contributions of $26.0 million and payment of deferred payroll taxes under the Coronavirus Aid, Relief and Economic Security Act of $18.7 million.
Cash Flows From Operating Activities
During 2023, cash provided by operating activities was $810.7 million, which was an increase of $256.2 million as compared to 2022. The cash flows from operations were primarily the result of our strong operating performance. As a result of the Company’s strong cash flows from operations, the Company was able to invest in property, plant and equipment and to pay a special cash dividend, as further discussed in the following sections.
31
Cash Flows From Investing Activities
During 2023, cash used in investing activities was $295.4 million, which was a decrease of $29.6 million as compared to 2022. The decrease was partially a result of fewer additions to property, plant and equipment, which were $282.3 million during 2023 and $298.6 million during 2022. CCBCC Operations, LLC, a wholly owned subsidiary of the Company, purchased the Snyder Production Center and an adjacent sales facility in Charlotte, North Carolina during 2022 for a purchase price of $60.0 million, which was included in additions to property, plant and equipment for that period. There were $59.0 million and $44.8 million of additions to property, plant and equipment accrued in accounts payable, trade as of December 31, 2023 and December 31, 2022, respectively.
The decrease in cash used in investing activities as compared to 2022 was also driven by the acquisition of $30.1 million of additional BODYARMOR distribution rights during 2022. The decrease in cash used in investing activities as compared to 2022 was partially offset by an increase of approximately $11 million in our investment in equity method investees.
The additions to property, plant and equipment reflect the Company’s focus on optimizing its supply chain and investing for future growth. The Company anticipates additions to property, plant and equipment in 2024 to be in the range of approximately $300 million to $350 million.
Cash Flows From Financing Activities
During 2023, cash used in financing activities was $77.7 million, which was a decrease of $96.5 million as compared to 2022. The decrease was primarily a result of the repayment of $125.0 million of debt during 2022. This was partially offset by dividend payments of $46.9 million during 2023 (which included a special cash dividend of $3.00 per share), as compared to $9.4 million during 2022.
The Company had cash payments for acquisition related contingent consideration of $28.2 million during 2023 and $36.5 million during 2022. For the next five years, the Company anticipates that the amount it could pay annually under the acquisition related contingent consideration arrangements for the distribution territories subject to acquisition related sub-bottling payments will be in the range of approximately $50 million to $70 million.
Material Contractual Obligations
The Company had a number of contractual obligations and commercial obligations as of December 31, 2023 that are material to an assessment of the Company’s short- and long-term cash requirements.
The Company has outstanding long-term debt of $600.0 million, none of which is contractually due in 2024. The remaining interest payments on the Company’s debt obligations are $73.4 million determined in reference to the contractual terms of such debt, of which $23.2 million is due in 2024. All of the Company’s long-term debt instruments have fixed interest rates, and, thus, are not impacted by fluctuations in interest rates, with the exception of the Company’s revolving credit facility, which did not have any outstanding borrowings as of December 31, 2023.
The Company’s acquisition related contingent consideration liability relates to acquisition related sub-bottling payments required in certain distribution territories under the CBA and totaled $669.3 million as of December 31, 2023. The future expected acquisition related sub-bottling payments extend through the life of the related distribution assets acquired in each distribution territory, which is generally 40 years. The Company’s short-term portion of the acquisition related contingent consideration liability was $64.5 million as of December 31, 2023 and was included within other accrued liabilities in the consolidated balance sheets.
The Company is obligated to purchase 17.5 million cases of finished product from SAC on an annual basis through June 2024. Based on information available as of December 31, 2023, the Company estimates this purchase obligation to be $71.1 million, all of which is expected to occur in 2024.
The Company has $146.9 million in total minimum operating lease obligations including interest, of which $29.9 million are due in 2024. The Company has $8.2 million in total minimum financing lease obligations including interest, of which $2.8 million are due in 2024.
As of December 31, 2023, the Company estimated obligations for its executive benefit plans to be $184.4 million, of which $30.9 million is expected to be paid in 2024.
The Company provides postretirement benefits for employees meeting specified qualifying criteria. The Company recognizes the cost of postretirement benefits, which consist principally of medical benefits, during employees’ periods of active service. The Company
32
does not prefund these benefits and has the right to modify or terminate certain of these benefits in the future. As of December 31, 2023, the Company had obligations related to its postretirement benefits plan of $63.8 million, of which $3.2 million is expected to be paid in 2024.
The Company is a shareholder of Southeastern Container (“Southeastern”), a plastic bottle manufacturing cooperative from which the Company is obligated to purchase at least 80% of its requirements of plastic bottles for certain designated territories. This obligation has no minimum purchase requirements; however, purchases from Southeastern were $146.9 million during 2023 and are expected to remain material in future foreseeable periods. See Note 20 to the consolidated financial statements for additional information related to Southeastern.
The Company participates in long-term marketing contractual arrangements with certain prestige properties, athletic venues and other locations. As of December 31, 2023, the future payments related to these contractual arrangements, which expire at various dates through 2033, amounted to $130.5 million, of which $30.0 million is expected to be paid in 2024.
On December 5, 2023, the Board of Directors of the Company declared a regular quarterly cash dividend of $0.50 per share, as well as a special cash dividend of $16.00 per share, on the Common Stock and the Class B Common Stock of the Company. Both dividends are payable on February 9, 2024 to stockholders of record of the Common Stock and the Class B Common Stock as of the close of business on January 26, 2024. As of December 31, 2023, dividends declared but not yet paid were $154.7 million.
Hedging Activities
The Company uses commodity derivative instruments to manage its exposure to fluctuations in certain commodity prices. Fees paid by the Company for commodity derivative instruments are amortized over the corresponding period of the instrument. The Company accounts for its commodity derivative instruments on a mark-to-market basis with any expense or income being reflected as an adjustment to cost of sales or SD&A expenses, consistent with the expense classification of the underlying hedged item.
The Company uses several different financial institutions for commodity derivative instruments to minimize the concentration of credit risk. The Company has master agreements with the counterparties to its commodity derivative instruments that provide for net settlement of derivative transactions. The net impact of the commodity derivative instruments on the consolidated statements of operations was as follows:
| Fiscal Year | ||||||||||||||
| (in thousands) | 2023 | 2022 | ||||||||||||
| Increase in cost of sales | $ | 1,656 | $ | 3,335 | ||||||||||
| Increase (decrease) in SD&A expenses | 5,928 | (16,390) | ||||||||||||
| Net impact | $ | 7,584 | $ | (13,055) | ||||||||||
Discussion of Critical Accounting Estimates
In the ordinary course of business, the Company has made a number of estimates and assumptions relating to the reporting of its results of operations and financial position in the preparation of its consolidated financial statements in conformity with GAAP. Actual results could differ significantly from those estimates under different assumptions and conditions. The Company believes the following discussion addresses the Company’s most critical accounting estimates, which are those the Company believes to be the most important to the portrayal of its financial condition and results of operations and require management’s most difficult, subjective and complex judgments, often as a result of the need to make estimates about the effect of matters that are inherently uncertain.
Any changes in critical accounting estimates are discussed with the Audit Committee of the Company’s Board of Directors during the quarter in which a change is contemplated and prior to making such change.
Revenue Recognition
The Company’s sales are divided into two main categories: (i) bottle/can sales and (ii) other sales. Bottle/can sales include products packaged primarily in plastic bottles and aluminum cans. Bottle/can net pricing is based on the invoice price charged to customers reduced by any promotional allowances. Bottle/can net pricing per unit is impacted by the price charged per package, the sales volume generated for each package and the channels in which those packages are sold. Other sales include sales to other Coca‑Cola bottlers, post-mix sales, transportation revenue and equipment maintenance revenue.
The Company’s contracts are derived from customer orders, including customer sales incentives, generated through an order processing and replenishment model. Generally, the Company’s service contracts and contracts related to the delivery of specifically
33
identifiable products have a single performance obligation. Revenues do not include sales or other taxes collected from customers. The Company has defined its performance obligations for its contracts as either at a point in time or over time. Bottle/can sales, sales to other Coca‑Cola bottlers and post-mix sales are recognized when control transfers to a customer, which is generally upon delivery and is considered a single point in time (“point in time”).
Other sales, which include revenue for service fees related to the repair of cold drink equipment and delivery fees for freight hauling and brokerage services, are recognized over time (“over time”). Revenues related to cold drink equipment repair are recognized as the respective services are completed using a cost-to-cost input method. Repair services are generally completed in less than one day but can extend up to one month. Revenues related to freight hauling and brokerage services are recognized as the delivery occurs using a miles driven output method. Generally, delivery occurs and freight charges are recognized in the same day. Over time sales orders open at the end of a financial period are not material to the consolidated financial statements.
The Company sells its products and extends credit, generally without requiring collateral, based on an ongoing evaluation of the customer’s business prospects and financial condition. The Company evaluates the collectability of its trade accounts receivable based on a number of factors, including the Company’s historic collections pattern and changes to a specific customer’s ability to meet its financial obligations. The Company typically collects payment from customers within 30 days from the date of sale.
The Company has established an allowance for doubtful accounts to adjust the recorded receivable to the estimated amount the Company believes will ultimately be collected. The Company’s allowance for doubtful accounts in the consolidated balance sheets includes a reserve for customer returns and an allowance for credit losses. The Company experiences customer returns primarily as a result of damaged or out-of-date product. At any given time, the Company estimates less than 1% of bottle/can sales and post-mix sales could be at risk for return by customers. Returned product is recognized as a reduction to net sales.
The Company estimates an allowance for credit losses, based on historic days’ sales outstanding trends, aged customer balances, previously written-off balances and expected recoveries up to balances previously written off, in order to present the net amount expected to be collected. Accounts receivable balances are written off when determined uncollectible and are recognized as a reduction to the allowance for credit losses.
Valuation of Long-Lived Assets, Goodwill and Other Intangibles
Management performs recoverability and impairment tests of long-lived assets, goodwill and other intangibles in accordance with GAAP, during which management makes numerous assumptions which involve a significant amount of judgment. When performing impairment tests, management estimates the fair values of the assets using its best assumptions, which management believes would be consistent with what a hypothetical marketplace participant would use. Estimates and assumptions used in these tests are evaluated and updated as appropriate. For certain assets, recoverability and/or impairment tests are required only when conditions exist that indicate the carrying value may not be recoverable. For other assets, impairment tests are required at least annually, or more frequently if events or circumstances indicate that an asset may be impaired.
The Company evaluates the recoverability of the carrying amount of its property, plant and equipment and other intangibles when events or circumstances indicate the carrying amount of an asset or asset group may not be recoverable. These evaluations are performed at a level where independent cash flows may be attributed to either an asset or an asset group. If the Company determines the carrying amount of an asset or asset group is not recoverable based upon the expected undiscounted future cash flows of the asset or asset group, an impairment loss is recorded equal to the excess of the carrying amounts over the estimated fair values of the long-lived assets. During 2023 and 2022, the Company performed periodic reviews of property, plant and equipment and other intangibles and determined no material impairment existed.
All business combinations are accounted for using the acquisition method. All of the Company’s goodwill resides within one reporting unit within the Nonalcoholic Beverages reportable segment and, therefore, the Company has determined it has one reporting unit for the purpose of assessing goodwill for potential impairment. The Company performs its annual goodwill impairment test as of the first day of the fourth quarter each year, and more frequently if facts and circumstances indicate such assets may be impaired, including significant declines in actual or future projected cash flows and significant deterioration of market conditions.
The Company uses its overall market capitalization as part of its estimate of fair value of the reporting unit and in assessing the reasonableness of the Company’s internal estimates of fair value. The Company’s goodwill impairment assessment includes a qualitative assessment to determine whether it is more likely than not that the fair value of the goodwill is below its carrying value, each year, and more often if there are significant changes in business conditions that could result in impairment. When a quantitative analysis is considered necessary for the annual impairment analysis of goodwill, the Company develops an estimated fair value for the reporting unit considering three different approaches: (i) market value, using the Company’s stock price plus outstanding debt; (ii) discounted cash flow analysis; and (iii) multiple of earnings before interest, taxes, depreciation and amortization based upon relevant industry data.
34
The estimated fair value of the reporting unit is then compared to its carrying amount, including goodwill. If the estimated fair value exceeds the carrying amount, goodwill is not considered impaired. If the carrying amount, including goodwill, exceeds its estimated fair value, any excess of the carrying value of goodwill of the reporting unit over its fair value is recorded as an impairment. The Company performed its annual impairment test of goodwill as of the first day of the fourth quarter during both 2023 and 2022 and determined there was no impairment of the carrying values of these assets. The Company has determined there has not been an interim impairment trigger since the first day of the fourth quarter of 2023 annual test date.
Acquisition Related Contingent Consideration Liability
The acquisition related contingent consideration liability consists of the estimated amounts due to The Coca‑Cola Company under the CBA with The Coca‑Cola Company and CCR over the useful life of the related distribution rights. Pursuant to the CBA, the Company is required to make quarterly acquisition related sub-bottling payments to CCR on a continuing basis in exchange for the grant of exclusive rights to distribute, promote, market and sell the authorized brands of The Coca‑Cola Company and related products in certain distribution territories the Company acquired from CCR. This acquisition related contingent consideration is valued using a probability weighted discounted cash flow model based on internal forecasts and the WACC derived from market data, which are considered Level 3 inputs.
Each reporting period, the Company adjusts its acquisition related contingent consideration liability related to the distribution territories subject to acquisition related sub-bottling payments to fair value by discounting future expected acquisition related sub-bottling payments required under the CBA using the Company’s estimated WACC. These future expected acquisition related sub-bottling payments extend through the life of the related distribution assets acquired in each distribution territory, which is generally 40 years. As a result, the fair value of the acquisition related contingent consideration liability is impacted by the Company’s WACC, management’s estimate of the acquisition related sub-bottling payments that will be made in the future under the CBA, and current acquisition related sub-bottling payments (all Level 3 inputs). Changes in any of these Level 3 inputs, particularly the underlying risk-free interest rate used to estimate the Company’s WACC, could result in material changes to the fair value of the acquisition related contingent consideration liability and could materially impact the amount of non-cash expense (or income) recorded each reporting period. The Company estimates a 10-basis point change in the underlying risk-free interest rate used to estimate the Company’s WACC would result in a change of approximately $6 million to the Company’s acquisition related contingent consideration liability.
Income Tax Estimates
Income taxes are accounted for under the asset and liability method. Deferred tax assets and liabilities are recognized for the future tax consequences attributable to operating losses and tax credit carryforwards, as well as the differences between the financial statement carrying amounts of existing assets and liabilities and their respective tax bases. The effect on deferred tax assets and liabilities of a change in tax rates is recognized in income in the period that includes the enactment date.
A valuation allowance will be provided against deferred tax assets if the Company determines it is more likely than not such assets will not ultimately be realized.
The Company does not recognize a tax benefit unless it concludes that it is more likely than not that the benefit will be sustained on audit by the taxing authority based solely on the technical merits of the associated tax position. If the recognition threshold is met, the Company recognizes a tax benefit measured at the largest amount of the tax benefit that, in the Company’s judgment, is greater than 50% likely to be realized. The Company records interest and penalties related to uncertain tax positions in income tax expense.
Pension and Postretirement Benefit Obligations
The Company has historically sponsored two pension plans. The Primary Plan was frozen as of June 30, 2006 and no benefits accrued to participants after that date. During 2023, the Primary Plan was fully settled, and the Company recognized a non-cash charge of $112.8 million related to the full settlement of the Primary Plan benefit liabilities, which was recorded as pension plan settlement expense in the consolidated statement of operations for that year. There were no remaining benefit liabilities or associated estimates related to the Primary Plan as of December 31, 2023. See Note 17 for additional discussion of the termination of the Primary Plan.
The second Company-sponsored pension plan (the “Bargaining Plan”) is for certain employees under collective bargaining agreements. Benefits under the Bargaining Plan are determined in accordance with negotiated formulas for the respective participants. Contributions to the Bargaining Plan are based on actuarially determined amounts and are limited to the amounts currently deductible for income tax purposes. The Company also sponsors a postretirement healthcare plan for employees meeting specified qualifying criteria.
35
Several statistical and other factors, which attempt to anticipate future events, are used in calculating the expense and liability related to the Bargaining Plan. These factors include assumptions about the discount rate, expected return on plan assets, employee turnover and age at retirement, as determined by the Company, within certain guidelines. In addition, the Company uses subjective factors such as mortality rates to estimate the projected benefit obligation. The actuarial assumptions used by the Company may differ materially from actual results due to changing market and economic conditions, higher or lower withdrawal rates or longer or shorter life spans of participants. These differences may result in a significant impact to the amount of net periodic pension cost recorded by the Company in future periods. See Note 17 to the consolidated financial statements for additional information.
The discount rate used in determining the actuarial present value of the projected benefit obligation for the Bargaining Plan was 5.16% in 2023 and 5.34% in 2022. The discount rate assumption is generally the estimate which can have the most significant impact on net periodic pension cost and the projected benefit obligation. The Company determines an appropriate discount rate annually for the Bargaining Plan based on the Aon AA Above Median yield curve as of the measurement date and reviews the discount rate assumption at the end of each year. See Note 17 to the consolidated financial statements for additional information.
Pension costs for the Bargaining Plan were $3.7 million in 2023 and $6.8 million in 2022.
A 0.25% increase or decrease in the discount rate assumption would have impacted the projected benefit obligation and the net periodic pension cost for the Bargaining Plan as follows:
| (in thousands) | 0.25% Increase | 0.25% Decrease | ||||||||||||
| Increase (decrease) in: | ||||||||||||||
| Projected benefit obligation at December 31, 2023 | $ | (1,996) | $ | 2,136 | ||||||||||
| Net periodic pension cost in 2023 | (194) | 206 | ||||||||||||
The weighted average expected long-term rate of return of plan assets used in computing net periodic pension cost for the Bargaining Plan was 7.00% in 2023 and 5.50% in 2022. These rates reflect an estimate of long-term future returns for the pension plan assets, and the estimate is primarily a function of the asset classes (equities versus fixed income) in which the Bargaining Plan assets are invested. This analysis includes expected long-term inflation and the risk premiums associated with equity and fixed income investments. See Note 17 to the consolidated financial statements for the details by asset type for the Bargaining Plan. The actual return on pension plan assets for the Bargaining Plan was a gain of 13.5% in 2023 and a loss of 24.6% in 2022.
The Company sponsors a postretirement healthcare plan for employees meeting specified qualifying criteria. Several statistical and other factors, which attempt to anticipate future events, are used in calculating the net periodic postretirement benefit cost and the postretirement benefit obligation for this plan. These factors include assumptions about the discount rate and the expected growth rate for the cost of healthcare benefits. In addition, the Company uses subjective factors such as withdrawal and mortality rates to estimate the projected liability under this plan. The actuarial assumptions used by the Company may differ materially from actual results due to changing market and economic conditions, higher or lower withdrawal rates or longer or shorter life spans of participants. The Company does not prefund its postretirement benefits and has the right to modify or terminate certain of these benefits in the future.
The discount rate assumption, the annual healthcare cost trend and the ultimate trend rate for healthcare costs are key estimates which can have a significant impact on the net periodic postretirement benefit cost and the postretirement benefit obligation in future periods. The Company annually determines the healthcare cost trend based on recent actual medical trend experience and projected experience for subsequent years.
The discount rate assumptions used to determine the postretirement benefit obligation are based on the annual yield on long-term corporate bonds as of the plan’s measurement date. The discount rate used in determining the postretirement benefit obligation was 5.02% in 2023 and 5.19% in 2022. The discount rate was derived using the Aon AA Above Median yield curve. Projected benefit payouts for the plan were matched to the Aon AA Above Median yield curve and an equivalent flat rate was derived.
A 0.25% increase or decrease in the discount rate assumption would have impacted the postretirement benefit obligation and the net periodic postretirement benefit cost for the Company’s postretirement healthcare plan as follows:
| (in thousands) | 0.25% Increase | 0.25% Decrease | ||||||||||||
| Increase (decrease) in: | ||||||||||||||
| Postretirement benefit obligation at December 31, 2023 | $ | (1,616) | $ | 1,692 | ||||||||||
| Net periodic postretirement benefit cost in 2023 | 25 | (26) | ||||||||||||
36
Cautionary Note Regarding Forward-Looking Statements
Certain statements made in this report, or in other public filings, press releases, or other written or oral communications made by the Company, which are not historical facts, are forward-looking statements subject to the safe harbor provisions of the Private Securities Litigation Reform Act of 1995. These forward-looking statements involve risks and uncertainties which we expect will or may occur in the future and may impact our business, financial condition and results of operations. The words “anticipate,” “believe,” “expect,” “intend,” “project,” “may,” “will,” “should,” “could” and similar expressions are intended to identify those forward-looking statements. These forward-looking statements reflect the Company’s best judgment based on current information, and, although we base these statements on circumstances that we believe to be reasonable when made, there can be no assurance that future events will not affect the accuracy of such forward-looking information. As such, the forward-looking statements are not guarantees of future performance, and actual results may vary materially from the projected results and expectations discussed in this report. Factors that might cause the Company’s actual results to differ materially from those anticipated in forward-looking statements include, but are not limited to: increased costs (including due to inflation), disruption of supply or unavailability or shortages of raw materials, fuel and other supplies; the reliance on purchased finished products from external sources; changes in public and consumer perception and preferences, including concerns related to product safety and sustainability, artificial ingredients, brand reputation and obesity; changes in government regulations related to nonalcoholic beverages, including regulations related to obesity, public health, artificial ingredients and product safety and sustainability; decreases from historic levels of marketing funding support provided to us by The Coca‑Cola Company and other beverage companies; material changes in the performance requirements for marketing funding support or our inability to meet such requirements; decreases from historic levels of advertising, marketing and product innovation spending by The Coca‑Cola Company and other beverage companies, or advertising campaigns that are negatively perceived by the public; any failure of the several Coca‑Cola system governance entities of which we are a participant to function efficiently or on our best behalf and any failure or delay of ours to receive anticipated benefits from these governance entities; provisions in our beverage distribution and manufacturing agreements with The Coca‑Cola Company that could delay or prevent a change in control of us or a sale of our Coca‑Cola distribution or manufacturing businesses; the concentration of our capital stock ownership; our inability to meet requirements under our beverage distribution and manufacturing agreements; changes in the inputs used to calculate our acquisition related contingent consideration liability; technology failures or cyberattacks on our information technology systems or our effective response to technology failures or cyberattacks on our customers’, suppliers’ or other third parties’ information technology systems; unfavorable changes in the general economy; the concentration risks among our customers and suppliers; lower than expected net pricing of our products resulting from continued and increased customer and competitor consolidations and marketplace competition; the effect of changes in our level of debt, borrowing costs and credit ratings on our access to capital and credit markets, operating flexibility and ability to obtain additional financing to fund future needs; the failure to attract, train and retain qualified employees while controlling labor costs, and other labor issues; the failure to maintain productive relationships with our employees covered by collective bargaining agreements, including failing to renegotiate collective bargaining agreements; changes in accounting standards; our use of estimates and assumptions; changes in tax laws, disagreements with tax authorities or additional tax liabilities; changes in legal contingencies; natural disasters, changing weather patterns and unfavorable weather; climate change or legislative or regulatory responses to such change; the impact of any pandemic or public health situation; and the risks discussed in “Item 1A. Risk Factors” of this report and elsewhere herein.
Caution should be taken not to place undue reliance on the forward-looking statements included in this report. The Company assumes no obligation to update any forward-looking statements, except as may be required by law. In evaluating forward-looking statements, these risks and uncertainties should be considered, together with the other risks described from time to time in the Company’s reports and other filings with the SEC.
Item 7A.Quantitative and Qualitative Disclosures About Market Risk.
The Company is subject to interest rate risk on its revolving credit facility and did not have any outstanding borrowings on its revolving credit facility as of December 31, 2023. As such, assuming no changes in the Company’s capital structure, if market interest rates average 1% more over the next 12 months than the interest rates as of December 31, 2023, there would be no change to interest expense for the next 12 months.
The Company’s acquisition related contingent consideration liability, which is adjusted to fair value each reporting period, is also impacted by changes in interest rates. The risk-free interest rate used to estimate the Company’s WACC is a component of the discount rate used to calculate the present value of future expected acquisition related sub-bottling payments due under the CBA. As a result, any changes in the underlying risk-free interest rate could result in material changes to the fair value of the acquisition related contingent consideration liability and could materially impact the amount of non-cash expense (or income) recorded each reporting period. The Company estimates a 10-basis point change in the underlying risk-free interest rate used to estimate the Company’s WACC would result in a change of approximately $6 million to the Company’s acquisition related contingent consideration liability.
37
The Company is exposed to certain market risks and commodity price risk that arise in the ordinary course of business. The Company may enter into commodity derivative instruments to manage or reduce market risk. The Company does not use commodity derivative instruments for trading or speculative purposes.
The Company is also subject to commodity price risk arising from price movements for certain commodities included as part of its raw materials. The Company manages this commodity price risk in some cases by entering into contracts with adjustable prices to hedge commodity purchases. The Company periodically uses commodity derivative instruments in the management of this risk. The Company estimates a 10% increase in the market prices of commodities included as part of its raw materials over the current market prices would cumulatively increase costs during the next 12 months by approximately $71 million assuming no change in volume.
Fees paid by the Company for agreements to hedge commodity purchases are amortized over the corresponding period of the agreement. The Company accounts for its commodity derivative instruments on a mark-to-market basis with any expense or income being reflected as an adjustment to cost of sales or SD&A expenses, consistent with the expense classification of the underlying hedged item.
The annual rate of inflation in the United States, as measured by year-over-year changes in the Consumer Price Index (the “CPI”), was 3.4% in 2023, 6.5% in 2022 and 7.0% in 2021. Inflation in the prices of those commodities important to the Company’s business is reflected in changes in the CPI.
The principal effect of inflation in both commodity and consumer prices on the Company’s operating results is to increase both cost of goods sold and SD&A expenses. Although the Company can offset these cost increases by increasing selling prices for its products, consumers may not have the buying power to cover these increased costs and may reduce their volume of purchases of those products. In that event, selling price increases may not be sufficient to offset completely the Company’s cost increases.
38
Item 8.Financial Statements and Supplementary Data.
COCA‑COLA CONSOLIDATED, INC.
CONSOLIDATED STATEMENTS OF OPERATIONS
| Fiscal Year | ||||||||||||||||||||
| (in thousands, except per share data) | 2023 | 2022 | 2021 | |||||||||||||||||
| Net sales | $ | $ | $ | |||||||||||||||||
| Cost of sales | ||||||||||||||||||||
| Gross profit | ||||||||||||||||||||
| Selling, delivery and administrative expenses | ||||||||||||||||||||
| Income from operations | ||||||||||||||||||||
| Interest (income) expense, net | ( | |||||||||||||||||||
| Mark-to-market on acquisition related contingent consideration | ||||||||||||||||||||
| Pension plan settlement expense | ||||||||||||||||||||
| Other expense, net | ||||||||||||||||||||
| Income before taxes | ||||||||||||||||||||
| Income tax expense | ||||||||||||||||||||
| Net income | $ | $ | $ | |||||||||||||||||
| Basic net income per share: | ||||||||||||||||||||
| Common Stock | $ | $ | $ | |||||||||||||||||
| Weighted average number of Common Stock shares outstanding | ||||||||||||||||||||
| Class B Common Stock | $ | $ | $ | |||||||||||||||||
| Weighted average number of Class B Common Stock shares outstanding | ||||||||||||||||||||
| Diluted net income per share: | ||||||||||||||||||||
| Common Stock | $ | $ | $ | |||||||||||||||||
| Weighted average number of Common Stock shares outstanding – assuming dilution | ||||||||||||||||||||
| Class B Common Stock | $ | $ | $ | |||||||||||||||||
| Weighted average number of Class B Common Stock shares outstanding – assuming dilution | ||||||||||||||||||||
See accompanying notes to consolidated financial statements.
39
COCA‑COLA CONSOLIDATED, INC.
CONSOLIDATED STATEMENTS OF COMPREHENSIVE INCOME
| Fiscal Year | ||||||||||||||||||||
| (in thousands) | 2023 | 2022 | 2021 | |||||||||||||||||
| Net income | $ | $ | $ | |||||||||||||||||
| Other comprehensive income, net of tax: | ||||||||||||||||||||
| Defined benefit plans reclassification including pension costs: | ||||||||||||||||||||
| Actuarial gain | ||||||||||||||||||||
| Prior service credits (costs) | ( | |||||||||||||||||||
| Pension plan settlement | ||||||||||||||||||||
| Postretirement benefits reclassification including benefit costs: | ||||||||||||||||||||
| Actuarial (loss) gain | ( | |||||||||||||||||||
| Interest rate swap | ||||||||||||||||||||
| Foreign currency translation adjustment | ( | |||||||||||||||||||
| Other comprehensive income, net of tax | ||||||||||||||||||||
| Comprehensive income | $ | $ | $ | |||||||||||||||||
See accompanying notes to consolidated financial statements.
40
COCA‑COLA CONSOLIDATED, INC.
CONSOLIDATED BALANCE SHEETS
| (in thousands, except share data) | December 31, 2023 | December 31, 2022 | ||||||||||||
| ASSETS | ||||||||||||||
| Current Assets: | ||||||||||||||
| Cash and cash equivalents | $ | $ | ||||||||||||
| Accounts receivable, trade | ||||||||||||||
| Allowance for doubtful accounts | ( | ( | ||||||||||||
| Accounts receivable from The Coca-Cola Company | ||||||||||||||
| Accounts receivable, other | ||||||||||||||
| Inventories | ||||||||||||||
| Prepaid expenses and other current assets | ||||||||||||||
| Total current assets | ||||||||||||||
| Property, plant and equipment, net | ||||||||||||||
| Right-of-use assets - operating leases | ||||||||||||||
| Leased property under financing leases, net | ||||||||||||||
| Other assets | ||||||||||||||
| Goodwill | ||||||||||||||
| Distribution agreements, net | ||||||||||||||
| Customer lists, net | ||||||||||||||
| Total assets | $ | $ | ||||||||||||
| LIABILITIES AND EQUITY | ||||||||||||||
| Current Liabilities: | ||||||||||||||
| Current portion of obligations under operating leases | $ | $ | ||||||||||||
| Current portion of obligations under financing leases | ||||||||||||||
| Accounts payable, trade | ||||||||||||||
| Accounts payable to The Coca-Cola Company | ||||||||||||||
| Other accrued liabilities | ||||||||||||||
| Accrued compensation | ||||||||||||||
| Dividends payable | ||||||||||||||
| Total current liabilities | ||||||||||||||
| Deferred income taxes | ||||||||||||||
| Pension and postretirement benefit obligations | ||||||||||||||
| Other liabilities | ||||||||||||||
| Noncurrent portion of obligations under operating leases | ||||||||||||||
| Noncurrent portion of obligations under financing leases | ||||||||||||||
| Long-term debt | ||||||||||||||
| Total liabilities | ||||||||||||||
| Commitments and Contingencies | ||||||||||||||
| Equity: | ||||||||||||||
Convertible Preferred Stock, $ | ||||||||||||||
Nonconvertible Preferred Stock, $ | ||||||||||||||
Preferred Stock, $ | ||||||||||||||
Common Stock, $ | ||||||||||||||
Class B Common Stock, $ | ||||||||||||||
Class C Common Stock, $ | ||||||||||||||
| Additional paid in capital | ||||||||||||||
| Retained earnings | ||||||||||||||
| Accumulated other comprehensive loss | ( | ( | ||||||||||||
Treasury stock, at cost: Common Stock - | ( | ( | ||||||||||||
Treasury stock, at cost: Class B Common Stock - | ( | ( | ||||||||||||
| Total equity | ||||||||||||||
| Total liabilities and equity | $ | $ | ||||||||||||
See accompanying notes to consolidated financial statements.
41
COCA-COLA CONSOLIDATED, INC.
CONSOLIDATED STATEMENTS OF CASH FLOWS
| Fiscal Year | ||||||||||||||||||||
| (in thousands) | 2023 | 2022 | 2021 | |||||||||||||||||
| Cash Flows from Operating Activities: | ||||||||||||||||||||
| Net income | $ | $ | $ | |||||||||||||||||
| Adjustments to reconcile net income to net cash provided by operating activities: | ||||||||||||||||||||
| Depreciation expense from property, plant and equipment and financing leases | ||||||||||||||||||||
| Amortization of intangible assets and deferred proceeds, net | ||||||||||||||||||||
| Fair value adjustment of acquisition related contingent consideration | ||||||||||||||||||||
| Pension plan settlement expense | ||||||||||||||||||||
| Deferred income taxes | ( | ( | ||||||||||||||||||
| Loss on sale of property, plant and equipment | ||||||||||||||||||||
| Amortization of debt costs | ||||||||||||||||||||
| Deferred payroll taxes under CARES Act | ( | ( | ||||||||||||||||||
| Impairment and abandonment of property, plant and equipment | ||||||||||||||||||||
| Change in current assets less current liabilities | ( | |||||||||||||||||||
| Change in other noncurrent assets | ||||||||||||||||||||
| Change in other noncurrent liabilities | ( | ( | ( | |||||||||||||||||
| Total adjustments | ||||||||||||||||||||
| Net cash provided by operating activities | $ | $ | $ | |||||||||||||||||
| Cash Flows from Investing Activities: | ||||||||||||||||||||
| Additions to property, plant and equipment | $ | ( | $ | ( | $ | ( | ||||||||||||||
| Investment in equity method investees | ( | ( | ( | |||||||||||||||||
| Proceeds from the sale of property, plant and equipment | ||||||||||||||||||||
| Acquisition of distribution rights | ( | ( | ||||||||||||||||||
| Net cash used in investing activities | $ | ( | $ | ( | $ | ( | ||||||||||||||
| Cash Flows from Financing Activities: | ||||||||||||||||||||
| Cash dividends paid | $ | ( | $ | ( | $ | ( | ||||||||||||||
| Payments of acquisition related contingent consideration | ( | ( | ( | |||||||||||||||||
| Payments on financing lease obligations | ( | ( | ( | |||||||||||||||||
| Debt issuance fees | ( | ( | ( | |||||||||||||||||
| Payments on term loan facility and senior notes | ( | ( | ||||||||||||||||||
| Borrowings under term loan facility | ||||||||||||||||||||
| Payments on revolving credit facility | ( | |||||||||||||||||||
| Borrowings under revolving credit facility | ||||||||||||||||||||
| Net cash used in financing activities | $ | ( | $ | ( | $ | ( | ||||||||||||||
| Net increase in cash | $ | $ | $ | |||||||||||||||||
| Cash at beginning of year | ||||||||||||||||||||
| Cash at end of year | $ | $ | $ | |||||||||||||||||
See accompanying notes to consolidated financial statements.
42
COCA-COLA CONSOLIDATED, INC.
CONSOLIDATED STATEMENTS OF CHANGES IN STOCKHOLDERS’ EQUITY
| (in thousands, except share data) | Common Stock | Class B Common Stock | Additional Paid-in Capital | Retained Earnings | Accumulated Other Comprehensive Loss | Treasury Stock - Common Stock | Treasury Stock - Class B Common Stock | Total Equity | ||||||||||||||||||||||||||||||||||||||||||
| Balance on December 31, 2020 | $ | $ | $ | $ | $ | ( | $ | ( | $ | ( | $ | |||||||||||||||||||||||||||||||||||||||
| Net income | — | — | — | — | — | — | ||||||||||||||||||||||||||||||||||||||||||||
| Other comprehensive income, net of tax | — | — | — | — | — | — | ||||||||||||||||||||||||||||||||||||||||||||
| Dividends declared: | ||||||||||||||||||||||||||||||||||||||||||||||||||
Common Stock ($ | — | — | — | ( | — | — | — | ( | ||||||||||||||||||||||||||||||||||||||||||
Class B Common Stock ($ | — | — | — | ( | — | — | — | ( | ||||||||||||||||||||||||||||||||||||||||||
| Balance on December 31, 2021 | $ | $ | $ | $ | $ | ( | $ | ( | $ | ( | $ | |||||||||||||||||||||||||||||||||||||||
| Net income | — | — | — | — | — | — | ||||||||||||||||||||||||||||||||||||||||||||
| Other comprehensive income, net of tax | — | — | — | — | — | — | ||||||||||||||||||||||||||||||||||||||||||||
| Dividends declared: | ||||||||||||||||||||||||||||||||||||||||||||||||||
Common Stock ($ | — | — | — | ( | — | — | — | ( | ||||||||||||||||||||||||||||||||||||||||||
Class B Common Stock ($ | — | — | — | ( | — | — | — | ( | ||||||||||||||||||||||||||||||||||||||||||
Conversion of | ( | — | — | — | — | — | ||||||||||||||||||||||||||||||||||||||||||||
| Balance on December 31, 2022 | $ | $ | $ | $ | $ | ( | $ | ( | $ | ( | $ | |||||||||||||||||||||||||||||||||||||||
| Net income | — | — | — | — | — | — | ||||||||||||||||||||||||||||||||||||||||||||
| Other comprehensive income, net of tax | — | — | — | — | — | — | ||||||||||||||||||||||||||||||||||||||||||||
| Dividends declared: | ||||||||||||||||||||||||||||||||||||||||||||||||||
Common Stock ($ | — | — | — | ( | — | — | — | ( | ||||||||||||||||||||||||||||||||||||||||||
Class B Common Stock ($ | — | — | — | ( | — | — | — | ( | ||||||||||||||||||||||||||||||||||||||||||
| Balance on December 31, 2023 | $ | $ | $ | $ | $ | ( | $ | ( | $ | ( | $ | |||||||||||||||||||||||||||||||||||||||
See accompanying notes to consolidated financial statements.
43
COCA-COLA CONSOLIDATED, INC.
NOTES TO CONSOLIDATED FINANCIAL STATEMENTS
1.Description of Business and Summary of Critical Accounting Policies
Description of Business
Coca‑Cola Consolidated, Inc. (the “Company”) distributes, markets and manufactures nonalcoholic beverages, primarily products of The Coca‑Cola Company, and is the largest Coca‑Cola bottler in the United States. Approximately 85 % of the Company’s total bottle/can sales volume to retail customers consists of products of The Coca‑Cola Company, which include some of the most recognized and popular beverage brands in the world. The Company also distributes products for several other beverage companies, including Keurig Dr Pepper Inc. and Monster Energy Company.
The Company offers a range of nonalcoholic beverage products and flavors, including both sparkling and still beverages, designed to meet the demands of its consumers. Sparkling beverages are carbonated beverages and the Company’s principal sparkling beverage is Coca‑Cola. Still beverages include energy products and noncarbonated beverages such as bottled water, ready to drink tea, ready to drink coffee, enhanced water, juices and sports drinks.
The Company’s products are sold and distributed in the United States through various channels, which include selling directly to customers, including grocery stores, mass merchandise stores, club stores, convenience stores and drug stores, selling to on-premise locations, where products are typically consumed immediately, such as restaurants, schools, amusement parks and recreational facilities, and selling through other channels such as vending machine outlets.
The Company manages its business on the basis of three operating segments. Nonalcoholic Beverages represents the vast majority of the Company’s consolidated net sales and income from operations. The additional two operating segments do not meet the quantitative thresholds for separate reporting, either individually or in the aggregate, and, therefore, have been combined into “All Other.”
Principles of Consolidation
The consolidated financial statements include the accounts and the consolidated operations of the Company and its majority-owned subsidiaries. All significant intercompany accounts and transactions have been eliminated.
Use of Estimates
The preparation of consolidated financial statements, in conformity with accounting principles generally accepted in the United States (“GAAP”), requires management to make estimates and assumptions that affect the reported amounts of assets and liabilities and the disclosure of contingent assets and liabilities at the date of the financial statements and the reported amounts of revenues and expenses during the reporting period. Actual results could differ from those estimates.
Cash and Cash Equivalents
Cash and cash equivalents include cash on hand, cash in banks and cash equivalents, which are highly liquid money market funds and debt instruments with maturities of 90 days or less. The Company maintains cash deposits with major banks, which may exceed federally insured limits. The Company periodically assesses the financial condition of the institutions and believes the risk of any loss is minimal. Investments in debt securities with maturities of 90 days or less that the Company has the positive intent and ability to hold to maturity are carried at amortized cost and classified as held-to-maturity. Investments in debt securities that are not classified as held-to-maturity are carried at fair value and classified as either trading or available-for-sale.
Accounts Receivable, Trade
The Company sells its products and extends credit, generally without requiring collateral, based on an ongoing evaluation of the customer’s business prospects and financial condition. The Company evaluates the collectability of its trade accounts receivable based on a number of factors, including the Company’s historic collections pattern and changes to a specific customer’s ability to meet its financial obligations. The Company typically collects payment from customers within 30 days from the date of sale.
Allowance for Doubtful Accounts
The Company has established an allowance for doubtful accounts to adjust the recorded receivable to the estimated amount the Company believes will ultimately be collected. The Company’s allowance for doubtful accounts in the consolidated balance sheets includes a reserve for customer returns and an allowance for credit losses. The Company experiences customer returns primarily as a
44
result of damaged or out-of-date product. At any given time, the Company estimates less than 1
The Company estimates an allowance for credit losses, based on historic days’ sales outstanding trends, aged customer balances, previously written-off balances and expected recoveries up to balances previously written off, in order to present the net amount expected to be collected. Accounts receivable balances are written off when determined uncollectible and are recognized as a reduction to the allowance for credit losses.
Inventories
Inventories are stated at the lower of cost or net realizable value. Cost is determined on the first-in, first-out method for finished products and manufacturing materials and on the average cost method for plastic shells, plastic pallets and other inventories.
Property, Plant and Equipment
Property, plant and equipment are recorded at cost, less accumulated depreciation. Depreciation is calculated using the straight-line method over the estimated useful lives of the assets. Leasehold improvements on operating leases are depreciated over the shorter of the estimated useful lives or the term of the lease, including renewal options the Company determines are reasonably assured. Additions and major replacements or betterments are added to the assets at cost. Maintenance and repair costs and minor replacements are charged to expense when incurred. When assets are replaced or otherwise disposed, the cost and accumulated depreciation are removed from the accounts and the gains or losses, if any, are reflected in the consolidated statements of operations. Gains or losses on the disposal of manufacturing equipment and manufacturing plants are included in cost of sales. Gains or losses on the disposal of all other property, plant and equipment are included in selling, delivery and administrative (“SD&A”) expenses.
The Company evaluates the recoverability of the carrying amount of its property, plant and equipment when events or circumstances indicate the carrying amount of an asset or asset group may not be recoverable. These evaluations are performed at a level where independent cash flows may be attributed to either an asset or an asset group. If the Company determines the carrying amount of an asset or asset group is not recoverable based upon the expected undiscounted future cash flows of the asset or asset group, an impairment loss is recorded equal to the excess of the carrying amounts over the estimated fair values of the long-lived assets.
Leases
The Company leases office and warehouse space, machinery and other equipment under noncancelable operating lease agreements and also leases certain warehouse space under financing lease agreements. The Company uses the following policies and assumptions to evaluate its leases:
•Determining a lease: The Company assesses contracts at inception to determine whether an arrangement is or includes a lease, which conveys the Company’s right to control the use of an identified asset for a period of time in exchange for consideration. Operating lease right-of-use assets and associated liabilities are recognized at the commencement date and initially measured based on the present value of lease payments over the defined lease term.
•Allocating lease and non-lease components: The Company has elected the practical expedient to not separate lease and non-lease components for certain classes of underlying assets. The Company has equipment and vehicle lease agreements, which generally have the lease and associated non-lease components accounted for as a single lease component. The Company has real estate lease agreements with lease and non-lease components, which are accounted for separately where applicable.
•Calculating the discount rate: The Company calculates the discount rate based on the discount rate implicit in the lease, or if the implicit rate is not readily determinable from the lease, then the Company calculates an incremental borrowing rate using a portfolio approach. The incremental borrowing rate is calculated using the contractual lease term and the Company’s borrowing rate.
•Recognizing leases: The Company does not recognize leases with a contractual term of less than 12 months on its consolidated balance sheets. Lease expense for these short-term leases is expensed on a straight-line basis over the lease term.
•Including rent increases or escalation clauses: Certain leases contain scheduled rent increases or escalation clauses, which can be based on the Consumer Price Index or other rates. The Company assesses each contract individually and applies the appropriate variable payments based on the terms of the agreement.
•Including renewal options and/or purchase options: Certain leases include renewal options to extend the lease term and/or purchase options to purchase the leased asset. The Company assesses these options using a threshold of reasonably certain, which is a high threshold and, therefore, the majority of the Company’s leases do not include renewal periods or purchase options for the measurement of the right-of-use asset and the associated lease liability. For leases the Company is reasonably certain to renew or purchase, those options are included within the lease term and, therefore, included in the measurement of the right-of-use asset and the associated lease liability.
45
•Including options to terminate: Certain leases include the option to terminate the lease prior to its scheduled expiration. This allows a contractually bound party to terminate its obligation under the lease contract, typically in return for an agreed-upon financial consideration. The terms and conditions of the termination options vary by contract.
•Including residual value guarantees, restrictions or covenants: The Company’s lease agreements do not contain residual value guarantees, restrictions or covenants.
Internal Use Software
The Company capitalizes costs incurred in the development or acquisition of internal use software. The Company expenses costs incurred in the preliminary project planning stage. Costs, such as maintenance and training, are also expensed as incurred. Capitalized costs are amortized over their estimated useful lives using the straight-line method. Amortization expense for internal use software, which is included in depreciation expense, was $1.7 million in 2023, $3.0 million in 2022 and $5.4 million in 2021.
Goodwill
All business combinations are accounted for using the acquisition method. Goodwill is tested for impairment annually, or more frequently if facts and circumstances indicate such assets may be impaired. The Company performs its annual goodwill impairment test, which includes a qualitative assessment to determine whether it is more likely than not that the fair value of the goodwill is below its carrying value, as of the first day of the fourth quarter each year, and more often if there are significant changes in business conditions that could result in impairment.
All of the Company’s goodwill resides within one reporting unit within the Nonalcoholic Beverages reportable segment and, therefore, the Company has determined it has one reporting unit for the purpose of assessing goodwill for potential impairment. The Company uses its overall market capitalization as part of its estimate of fair value of the reporting unit and in assessing the reasonableness of the Company’s internal estimates of fair value.
When a quantitative analysis is considered necessary for the annual impairment analysis of goodwill, the Company develops an estimated fair value for the reporting unit considering three different approaches:
•market value, using the Company’s stock price plus outstanding debt;
•discounted cash flow analysis; and
•multiple of earnings before interest, taxes, depreciation and amortization based upon relevant industry data.
The estimated fair value of the reporting unit is then compared to its carrying amount, including goodwill. If the estimated fair value exceeds the carrying amount, goodwill is not considered impaired. If the carrying amount, including goodwill, exceeds its estimated fair value, any excess of the carrying value of goodwill of the reporting unit over its fair value is recorded as an impairment.
To the extent the actual and projected cash flows decline in the future or if market conditions or market capitalization significantly deteriorate, the Company may be required to perform an interim impairment analysis that could result in an impairment of goodwill.
During 2023, 2022 and 2021, the Company performed its annual impairment test of goodwill and determined there was no
Distribution Agreements and Customer Lists
The Company’s definite-lived intangible assets consist of distribution agreements and customer lists, which have estimated useful lives of 20 to 40 years and to 12 years, respectively. These assets are amortized on a straight-line basis over their estimated useful lives.
Acquisition Related Contingent Consideration Liability
The acquisition related contingent consideration liability consists of the estimated amounts due to The Coca‑Cola Company under the Company’s comprehensive beverage agreements (collectively, the “CBA”) with The Coca‑Cola Company and Coca‑Cola Refreshments USA, Inc. (“CCR”), a wholly owned subsidiary of The Coca‑Cola Company, over the useful life of the related distribution rights. The CBA relates to a multi-year series of transactions, which were completed in October 2017, through which the Company acquired and exchanged distribution territories and manufacturing plants (the “System Transformation”). Pursuant to the CBA, the Company is required to make quarterly acquisition related sub-bottling payments to CCR on a continuing basis in exchange for the grant of exclusive rights to distribute, promote, market and sell the authorized brands of The Coca‑Cola Company and related products in certain distribution territories the Company acquired from CCR. This acquisition related contingent consideration is valued
46
using a probability weighted discounted cash flow model based on internal forecasts and the weighted average cost of capital (“WACC”) derived from market data, which are considered Level 3 inputs.
Each reporting period, the Company adjusts its acquisition related contingent consideration liability related to the distribution territories subject to acquisition related sub-bottling payments to fair value by discounting future expected acquisition related sub-bottling payments required under the CBA using the Company’s estimated WACC. These future expected acquisition related sub-bottling payments extend through the life of the related distribution assets acquired in each distribution territory, which is generally 40 years. As a result, the fair value of the acquisition related contingent consideration liability is impacted by the Company’s WACC, management’s estimate of the acquisition related sub-bottling payments that will be made in the future under the CBA, and current acquisition related sub-bottling payments (all Level 3 inputs). Changes in any of these Level 3 inputs, particularly the underlying risk-free interest rate used to estimate the Company’s WACC, could result in material changes to the fair value of the acquisition related contingent consideration liability and could materially impact the amount of non-cash expense (or income) recorded each reporting period.
Pension and Postretirement Benefit Plans
The Company has historically sponsored two pension plans. The primary Company-sponsored pension plan (the “Primary Plan”) was frozen as of June 30, 2006 and no benefits accrued to participants after that date. The second Company-sponsored pension plan (the “Bargaining Plan”) is for certain employees under collective bargaining agreements. Benefits under the Bargaining Plan are determined in accordance with negotiated formulas for the respective participants. Contributions to the plans are based on actuarially determined amounts and are limited to the amounts currently deductible for income tax purposes. The Company also sponsors a postretirement healthcare plan for employees meeting specified qualifying criteria.
The expense and liability amounts recorded for the benefit plans reflect estimates related to interest rates, investment returns, employee turnover and age at retirement, mortality rates and healthcare costs. The Primary Plan was fully settled in 2023. The Company recognized a non-cash charge related to the full settlement of the Primary Plan benefit liabilities, which was recorded as pension plan settlement expense in the consolidated statement of operations for 2023, and there are no remaining benefit liabilities related to the Primary Plan as of December 31, 2023. See Note 17 for additional discussion of the termination of the Primary Plan. The Company determines an appropriate discount rate annually for the Bargaining Plan and the postretirement healthcare plan based on the Aon AA Above Median yield curve as of the measurement date and reviews the discount rate assumption at the end of each year. The service cost components of the net periodic benefit cost of the plans are charged to current operations, and the non-service cost components of the net periodic benefit cost of the plans are classified as other expense, net. In addition, certain other union employees are covered by plans provided by their respective union organizations and the Company expenses amounts as paid in accordance with union agreements.
Income Taxes
Income taxes are accounted for under the asset and liability method. Deferred tax assets and liabilities are recognized for the future tax consequences attributable to operating losses and tax credit carryforwards, as well as the differences between the financial statement carrying amounts of existing assets and liabilities and their respective tax bases. The effect on deferred tax assets and liabilities of a change in tax rates is recognized in income in the period that includes the enactment date.
A valuation allowance will be provided against deferred tax assets if the Company determines it is more likely than not such assets will not ultimately be realized.
The Company does not recognize a tax benefit unless it concludes that it is more likely than not that the benefit will be sustained on audit by the taxing authority based solely on the technical merits of the associated tax position. If the recognition threshold is met, the Company recognizes a tax benefit measured at the largest amount of the tax benefit that, in the Company’s judgment, is greater than 50% likely to be realized. The Company records interest and penalties related to uncertain tax positions in income tax expense.
Revenue Recognition
The Company’s sales are divided into two main categories: (i) bottle/can sales and (ii) other sales. Bottle/can sales include products packaged primarily in plastic bottles and aluminum cans. Bottle/can net pricing is based on the invoice price charged to customers reduced by any promotional allowances. Bottle/can net pricing per unit is impacted by the price charged per package, the sales volume generated for each package and the channels in which those packages are sold. Other sales include sales to other Coca‑Cola bottlers, post-mix sales, transportation revenue and equipment maintenance revenue. Post-mix products are dispensed through equipment that mixes fountain syrups with carbonated or still water, enabling fountain retailers to sell finished products to consumers in cups or glasses.
47
The Company’s contracts are derived from customer orders, including customer sales incentives, generated through an order processing and replenishment model. Generally, the Company’s service contracts and contracts related to the delivery of specifically identifiable products have a single performance obligation. Revenues do not include sales or other taxes collected from customers. The Company has defined its performance obligations for its contracts as either at a point in time or over time. Bottle/can sales, sales to other Coca‑Cola bottlers and post-mix sales are recognized when control transfers to a customer, which is generally upon delivery and is considered a single point in time (“point in time”).
Other sales, which include revenue for service fees related to the repair of cold drink equipment and delivery fees for freight hauling and brokerage services, are recognized over time (“over time”). Revenues related to cold drink equipment repair are recognized as the respective services are completed using a cost-to-cost input method. Repair services are generally completed in less than one day but can extend up to one month . Revenues related to freight hauling and brokerage services are recognized as the delivery occurs using a miles driven output method. Generally, delivery occurs and freight charges are recognized in the same day. Over time sales orders open at the end of a financial period are not material to the consolidated financial statements.
Marketing Programs and Sales Incentives
The Company participates in various sales programs with The Coca‑Cola Company, other beverage companies and customers to increase the sale of its products. Programs negotiated with customers include arrangements under which allowances can be earned for attaining agreed-upon sales levels. The cost of these various sales incentives is not considered a separate performance obligation and is included as a deduction to net sales.
Allowance payments made to customers can be conditional on the achievement of volume targets and/or marketing commitments. Payments made in advance are recorded as prepayments and amortized in the consolidated statements of operations over the relevant period for which the customer commitment is made. In the event there is no separate identifiable benefit or the fair value of such benefit cannot be established, the amortization of the prepayment is included as a deduction to net sales.
The nature of the Company’s contracts gives rise to several types of variable consideration, including prospective and retrospective rebates. The Company accounts for its prospective and retrospective rebates using the expected value method, which estimates the net price to the customer based on the customer’s expected annual sales volume projections.
Marketing Funding Support
The Company receives marketing funding support payments in cash from The Coca‑Cola Company and other beverage companies. Payments to the Company for marketing programs to promote bottle/can sales volume and fountain syrup sales volume are recognized as a reduction to cost of sales, primarily on a per unit basis, as the product is sold. Payments for periodic programs are recognized in the period during which they are earned.
Cash consideration received by a customer from a vendor is presumed to be a reduction of the price of the vendor’s products or services. As such, the cash received is accounted for as a reduction to cost of sales unless it is a specific reimbursement of costs or payments for services. Payments the Company receives from The Coca‑Cola Company and other beverage companies for marketing funding support are classified as a reduction to cost of sales.
Commodity Derivative Instruments
The Company is subject to the risk of increased costs arising from adverse changes in certain commodity prices. In the normal course of business, the Company manages this risk through a variety of strategies, including the use of commodity derivative instruments. The Company does not use commodity derivative instruments for trading or speculative purposes. These commodity derivative instruments are not designated as hedging instruments under GAAP and are used as “economic hedges” to manage certain commodity price risk. The Company uses several different financial institutions for commodity derivative instruments to minimize the concentration of credit risk. While the Company would be exposed to credit loss in the event of nonperformance by these counterparties, the Company does not anticipate nonperformance by these counterparties.
Commodity derivative instruments held by the Company are marked to market on a quarterly basis and recognized in earnings consistent with the expense classification of the underlying hedged item. The Company generally pays a fee for these commodity derivative instruments, which is amortized over the corresponding period of each commodity derivative instrument. Settlements of commodity derivative instruments are included in cash flows from operating activities in the consolidated statements of cash flows.
All commodity derivative instruments are recorded at fair value as either assets or liabilities in the consolidated balance sheets. The Company has master agreements with the counterparties to its commodity derivative instruments that provide for net settlement of derivative transactions. Accordingly, the net amounts of derivative assets are recognized in either prepaid expenses and other current
48
assets or other assets in the consolidated balance sheets and the net amounts of derivative liabilities are recognized in either other accrued liabilities or other liabilities in the consolidated balance sheets.
Risk Management Programs
The Company uses various insurance structures to manage costs related to workers’ compensation, auto liability, medical and other insurable risks. These structures consist of retentions, deductibles, limits and a diverse group of insurers that serve to strategically finance, transfer and mitigate the financial impact of losses to the Company. Losses are accrued using assumptions and procedures followed in the insurance industry, then adjusted for company-specific history and expectations.
Cost of Sales
Inputs representing a substantial portion of the Company’s cost of sales include: (i) purchases of finished products, (ii) raw material costs, including aluminum cans, plastic bottles, carbon dioxide and sweetener, (iii) concentrate costs and (iv) manufacturing costs, including labor, overhead and warehouse costs. In addition, cost of sales includes shipping, handling and fuel costs related to the movement of finished products from manufacturing plants to distribution centers, amortization expense of distribution rights, distribution fees of certain products and marketing credits from brand companies.
Selling, Delivery and Administrative Expenses
SD&A expenses include the following: sales management labor costs, distribution costs resulting from transporting finished products from distribution centers to customer locations, distribution center overhead including depreciation expense, distribution center warehousing costs, delivery vehicles and cold drink equipment, point-of-sale expenses, advertising expenses, cold drink equipment repair costs, amortization of intangible assets and administrative support labor and operating costs.
Shipping and Handling Costs
Shipping and handling costs related to the movement of finished products from manufacturing plants to distribution centers are included in cost of sales. Shipping and handling costs directly related to the movement of finished products from distribution centers to customer locations, including distribution center warehousing costs, are included in SD&A expenses.
Stock Compensation
The Company has a long-term performance equity plan (the “Long-Term Performance Equity Plan”) under which awards are earned and granted to J. Frank Harrison, III, Chairman of the Board of Directors and Chief Executive Officer of the Company, based on the Company’s attainment during a performance period of performance measures specified by the Compensation Committee of the Company’s Board of Directors. Mr. Harrison may elect to have awards earned under the Long‑Term Performance Equity Plan settled in cash and/or shares of the Company’s Class B Common Stock. See Note 2 for additional information on the Long‑Term Performance Equity Plan.
Common Stock and Class B Common Stock
The Company has two classes of common stock outstanding, Common Stock and Class B Common Stock. The Common Stock is traded on The Nasdaq Global Select Market under the symbol “COKE.” There is no established public trading market for the Class B Common Stock. Shares of Class B Common Stock are convertible on a share-for-share basis into shares of Common Stock at any time at the option of the holder.
Each share of Common Stock is entitled to one vote per share and each share of Class B Common Stock is entitled to 20 votes per share at all meetings of the Company’s stockholders. Except as otherwise required by law, holders of the Common Stock and the Class B Common Stock vote together as a single class on all matters submitted to the Company’s stockholders, including the election of the Board of Directors. As a result, the holders of the Class B Common Stock control approximately 71 % of the total voting power of the stockholders of the Company and control the election of the Board of Directors. In the event of liquidation, there is no preference between the two classes of common stock.
Dividends
No cash dividend or dividend of property or stock other than stock of the Company, as specifically described in the Company’s Restated Certificate of Incorporation, as amended (the “Restated Certificate of Incorporation”), may be declared and paid on the Class B Common Stock unless an equal or greater dividend is declared and paid on the Common Stock. Under the Restated Certificate of Incorporation, the Board of Directors may declare dividends on the Common Stock without declaring equal or any dividends on the
49
Class B Common Stock. Notwithstanding this provision, the Class B Common Stock has voting and conversion rights that allow the Class B Common Stock to participate equally on a per share basis with the Common Stock.
The Company’s Board of Directors has declared, and the Company has paid, dividends on the Common Stock and the Class B Common Stock and each class of common stock has participated equally in all dividends declared by the Board of Directors and paid by the Company since 1994. During 2023, dividends of $18.00 5.00 16.50 4.50 1.00 1.00 46.9 million in 2023 and $9.4
Net Income Per Share
The Company applies the two-class method for calculating and presenting net income per share. The two-class method is an earnings allocation formula that determines earnings per share for each class of common stock according to dividends declared or accumulated and participation rights in undistributed earnings. Under this method:
(i)Income from continuing operations (“net income”) is reduced by the amount of dividends declared in the current period for each class of stock and by the contractual amount of dividends that must be paid for the current period.
(ii)The remaining earnings (“undistributed earnings”) are allocated to the Common Stock and the Class B Common Stock to the extent each security may share in earnings as if all the earnings for the period had been distributed. The total earnings allocated to each security is determined by adding together the amount allocated for dividends and the amount allocated for a participation feature.
(iii)The total earnings allocated to each security is then divided by the number of outstanding shares of the security to which the earnings are allocated to determine the earnings per share for the security.
(iv)Basic and diluted net income per share data are presented for each class of common stock.
In applying the two-class method, the Company determined undistributed earnings should be allocated equally on a per share basis between the Common Stock and the Class B Common Stock due to the aggregate participation rights of the Class B Common Stock (i.e., the voting and conversion rights) and the Company’s history of paying dividends equally on a per share basis on the Common Stock and the Class B Common Stock.
The Class B Common Stock conversion rights allow the Class B Common Stock to participate in dividends equally with the Common Stock. Class B Common Stock is convertible into Common Stock on a one -for-one per share basis at any time at the option of the holder. Accordingly, the holders of the Class B Common Stock can participate equally in any dividends declared on the Common Stock by exercising their conversion rights.
Basic net income per share excludes potential common shares that were dilutive and is computed by dividing net income available for common stockholders by the weighted average number of Common and Class B Common shares outstanding. Diluted net income per share for Common Stock and Class B Common Stock gives effect to all securities representing potential common shares that were dilutive and outstanding during the period. The Company does no
Recently Adopted Accounting Pronouncements
In September 2022, the Financial Accounting Standards Board (the “FASB”) issued Accounting Standards Update (“ASU”) 2022-04, “Liabilities-Supplier Finance Programs,” which requires additional quantitative and qualitative disclosures related to a company’s supply chain finance programs to enhance the transparency of these programs. The new guidance is effective for fiscal years beginning after December 15, 2022, including interim periods within those fiscal years, except for the amendment on rollforward information, which is effective for fiscal years beginning after December 15, 2023. The Company adopted ASU 2022-04 in the first quarter of 2023, with the exception of the amendment on rollforward information, and the adoption did not have a material impact on its consolidated financial statements. See Note 12 for disclosures related to the Company’s supply chain finance program.
Recently Issued Accounting Pronouncements
In November 2023, the FASB issued ASU 2023-07, “Segment Reporting (Topic 280): Improvements to Reportable Segment Disclosures,” which requires additional disclosure of significant segment expenses included in the reported measure of segment profit or loss and regularly provided to the Chief Operating Decision Maker (the “CODM”). It also requires disclosure and a description of the composition of other amounts by reportable segment, disclosure of a reportable segment’s profit or loss and assets currently
50
required by Topic 280 in interim periods and disclosure of the CODM’s title and process for assessing a reportable segment’s profit or loss. The new guidance is effective for fiscal years beginning after December 15, 2023, including interim periods within those fiscal years beginning after December 15, 2024. The Company evaluated the impact ASU 2023-07 will have on its consolidated financial statements and does not expect a material impact upon adoption.
In December 2023, the FASB issued ASU 2023-09, “Income Taxes (Topic 740): Improvements to Income Tax Disclosures,” which requires disclosure of specific categories in the rate reconciliation, including additional information for reconciling items that meet a quantitative threshold, and specific disaggregation of income taxes paid and tax expense. The amendment is effective for annual periods beginning after December 15, 2024. The Company has evaluated the impact ASU 2023-09 will have on its consolidated financial statements and does not expect a material impact upon adoption.
2.Related Party Transactions
The Coca‑Cola Company
The Company’s business consists primarily of the distribution, marketing and manufacture of nonalcoholic beverages of The Coca‑Cola Company, which is the sole owner of the formulas under which the primary components of the Company’s soft drink products, either concentrate or syrup, are manufactured.
As of December 31, 2023, J. Frank Harrison, III, Chairman of the Board of Directors and Chief Executive Officer of the Company, controlled 1,004,394 shares of the Company’s Class B Common Stock, which represented approximately 71 % of the total voting power of the Company’s outstanding Common Stock and Class B Common Stock on a consolidated basis.
As of December 31, 2023, The Coca‑Cola Company owned shares of the Company’s Common Stock representing approximately 9 % of the total voting power of the Company’s outstanding Common Stock and Class B Common Stock on a consolidated basis. The number of shares of the Company’s Common Stock currently held by The Coca‑Cola Company gives it the right to have a designee proposed by the Company for nomination to the Company’s Board of Directors in the Company’s annual proxy statement. J. Frank Harrison, III and the trustees of certain trusts established for the benefit of certain relatives of the late J. Frank Harrison, Jr. have agreed to vote the shares of the Company’s Common Stock and Class B Common Stock that they control in favor of such designee. The Coca‑Cola Company does not own any shares of the Company’s Class B Common Stock.
The following table summarizes the significant cash transactions between the Company and The Coca‑Cola Company:
| Fiscal Year | ||||||||||||||||||||
| (in thousands) | 2023 | 2022 | 2021 | |||||||||||||||||
Payments made by the Company to The Coca-Cola Company(1) | $ | $ | $ | |||||||||||||||||
| Payments made by The Coca-Cola Company to the Company | ||||||||||||||||||||
(1)This excludes acquisition related sub-bottling payments made by the Company to CCR, a wholly owned subsidiary of The Coca‑Cola Company, but includes the purchase price of certain additional BODYARMOR distribution rights, each as discussed below.
On January 1, 2022, the Company entered into an agreement to acquire $30.1 million of additional BODYARMOR distribution rights with an estimated useful life of 40 years.
More than 80 % of the payments made by the Company to The Coca‑Cola Company were for concentrate, syrup, sweetener and other finished goods products, which were recorded in cost of sales in the consolidated statements of operations and represent the primary components of the soft drink products the Company manufactures and distributes. Payments made by the Company to The Coca‑Cola Company also included payments for marketing programs associated with large, national customers managed by The Coca‑Cola Company on behalf of the Company, which were recorded as a reduction to net sales in the consolidated statements of operations. Other payments made by the Company to The Coca‑Cola Company related to cold drink equipment parts, fees associated with the rights to distribute certain brands and other customary items.
Payments made by The Coca‑Cola Company to the Company included annual funding in connection with the Company’s agreement to support certain business initiatives developed by The Coca‑Cola Company and funding associated with the delivery of post-mix products to various customers, both of which were recorded as a reduction to cost of sales in the consolidated statements of operations. Payments made by The Coca‑Cola Company to the Company also included fountain product delivery and equipment repair services performed by the Company on The Coca‑Cola Company’s equipment, all of which were recorded in net sales in the consolidated statements of operations.
51
Coca‑Cola Refreshments USA, Inc.
The CBA requires the Company to make quarterly acquisition related sub-bottling payments to CCR on a continuing basis in exchange for the grant of exclusive rights to distribute, promote, market and sell the authorized brands of The Coca‑Cola Company and related products in certain distribution territories the Company acquired from CCR. These acquisition related sub-bottling payments are based on gross profit derived from the Company’s sales of certain beverages and beverage products that are sold under the same trademarks that identify a covered beverage, a beverage product or certain cross-licensed brands applicable to the System Transformation.
Acquisition related sub-bottling payments to CCR were $28.2 million in 2023, $36.5 million in 2022 and $39.1 million in 2021. The following table summarizes the liability recorded by the Company to reflect the estimated fair value of contingent consideration related to future expected acquisition related sub‑bottling payments to CCR:
| (in thousands) | December 31, 2023 | December 31, 2022 | ||||||||||||
| Current portion of acquisition related contingent consideration | $ | $ | ||||||||||||
| Noncurrent portion of acquisition related contingent consideration | ||||||||||||||
| Total acquisition related contingent consideration | $ | $ | ||||||||||||
Southeastern Container (“Southeastern”)
The Company is a shareholder of Southeastern, a plastic bottle manufacturing cooperative. The Company accounts for Southeastern as an equity method investment. The Company’s investment in Southeastern, which was classified as other assets in the consolidated balance sheets, was $20.9 million as of December 31, 2023 and $21.2 million as of December 31, 2022.
South Atlantic Canners, Inc. (“SAC”)
The Company is a shareholder of SAC, a manufacturing cooperative located in Bishopville, South Carolina. All of SAC’s shareholders are Coca‑Cola bottlers and each has equal voting rights. The Company accounts for SAC as an equity method investment. The Company’s investment in SAC, which was classified as other assets in the consolidated balance sheets, was $17.2 million as of December 31, 2023 and $8.2 million as of December 31, 2022. The Company also guarantees a portion of SAC’s debt; see Note 20 for additional information.
The Company receives a fee for managing the day-to-day operations of SAC pursuant to a management agreement. Proceeds from management fees received from SAC, which were recorded as a reduction to cost of sales in the consolidated statements of operations, were $9.3 million in 2023, $8.9 million in 2022 and $8.7 million in 2021.
Coca‑Cola Bottlers’ Sales & Services Company LLC (“CCBSS”)
Along with all other Coca‑Cola bottlers in the United States and Canada, the Company is a member of CCBSS, a company formed to provide certain procurement and other services with the intention of enhancing the efficiency and competitiveness of the Coca‑Cola bottling system. The Company accounts for CCBSS as an equity method investment and its investment in CCBSS is not material.
CCBSS negotiates the procurement for the majority of the Company’s raw materials, excluding concentrate, and the Company receives a rebate from CCBSS for the purchase of these raw materials. The Company had rebates due from CCBSS of $14.3 million on December 31, 2023 and $25.7 million on December 31, 2022, which were classified as accounts receivable, other in the consolidated balance sheets. Changes in rebates receivable relate to volatility in raw material prices and the timing of cash receipts of rebates.
In addition, the Company pays an administrative fee to CCBSS for its services. The Company incurred administrative fees to CCBSS of $2.8 million in 2023, $2.4 million in 2022 and $2.9 million in 2021, which were classified as SD&A expenses in the consolidated statements of operations.
CONA Services LLC (“CONA”)
Along with certain other Coca‑Cola bottlers, the Company is a member of CONA, an entity formed to provide business process and information technology services to its members. The Company accounts for CONA as an equity method investment. The Company’s investment in CONA, which was classified as other assets in the consolidated balance sheets, was $22.1 million as of December 31, 2023 and $16.9 million as of December 31, 2022.
52
Pursuant to an amended and restated master services agreement with CONA, the Company is authorized to use the Coke One North America system (the “CONA System”), a uniform information technology system developed to promote operational efficiency and uniformity among North American Coca‑Cola bottlers. In exchange for the Company’s rights to use the CONA System and receive CONA-related services, it is charged service fees by CONA. The Company incurred service fees to CONA of $27.5 million in 2023, $25.7 million in 2022 and $24.1 million in 2021.
Related Party Leases
The Company leases its headquarters office facility and an adjacent office facility in Charlotte, North Carolina from Beacon Investment Corporation, of which J. Frank Harrison, III is the majority stockholder and Morgan H. Everett, Vice Chair of the Company’s Board of Directors, is a minority stockholder. The annual base rent the Company is obligated to pay under this lease is subject to an adjustment for an inflation factor and the lease expires on December 31, 2029. The principal balance outstanding under this lease was $22.5 million on December 31, 2023 and $25.5 million on December 31, 2022.
A summary of rental payments for related party leases for 2023, 2022 and 2021 is as follows:
| Fiscal Year | ||||||||||||||||||||
| (in thousands) | 2023 | 2022 | 2021 | |||||||||||||||||
| Company headquarters | $ | $ | $ | |||||||||||||||||
Snyder Production Center(1) | ||||||||||||||||||||
(1)The lease for the Snyder Production Center and an adjacent sales facility in Charlotte, North Carolina (together, the “Snyder Production Center”) was terminated during 2022 in connection with the purchase of the Snyder Production Center by CCBCC Operations, LLC, a wholly owned subsidiary of the Company.
Long-Term Performance Equity Plan
The Long-Term Performance Equity Plan compensates J. Frank Harrison, III based on the Company’s performance. Awards granted to Mr. Harrison under the Long-Term Performance Equity Plan are earned based on the Company’s attainment during a performance period of certain performance measures, each as specified by the Compensation Committee of the Company’s Board of Directors. These awards may be settled in cash and/or shares of the Company’s Class B Common Stock, based on the average of the closing prices of shares of the Company’s Common Stock during the last 20 trading days of the performance period. Compensation expense for the Long-Term Performance Equity Plan, which was included in SD&A expenses in the consolidated statements of operations, was $10.3 million in 2023, $10.1 million in 2022 and $9.8 million in 2021.
3.Revenue Recognition
The Company’s sales are divided into two main categories: (i) bottle/can sales and (ii) other sales. Bottle/can sales include products packaged primarily in plastic bottles and aluminum cans. Bottle/can net pricing is based on the invoice price charged to customers reduced by any promotional allowances. Bottle/can net pricing per unit is impacted by the price charged per package, the sales volume generated for each package and the channels in which those packages are sold. Other sales include sales to other Coca‑Cola bottlers, post-mix sales, transportation revenue and equipment maintenance revenue.
The Company’s contracts are derived from customer orders, including customer sales incentives, generated through an order processing and replenishment model. Generally, the Company’s service contracts and contracts related to the delivery of specifically identifiable products have a single performance obligation. Revenues do not include sales or other taxes collected from customers. The Company has defined its performance obligations for its contracts as either at a point in time or over time. Bottle/can sales, sales to other Coca‑Cola bottlers and post-mix sales are recognized when control transfers to a customer, which is generally upon delivery and is considered a single point in time. Point in time sales accounted for approximately 98 % of the Company’s net sales in 2023 and approximately 97
Other sales, which include revenue for service fees related to the repair of cold drink equipment and delivery fees for freight hauling and brokerage services, are recognized over time. Revenues related to cold drink equipment repair are recognized as the respective services are completed using a cost-to-cost input method. Repair services are generally completed in less than one day but can extend up to one month . Revenues related to freight hauling and brokerage services are recognized as the delivery occurs using a miles driven output method. Generally, delivery occurs and freight charges are recognized in the same day. Over time sales orders open at the end of a financial period are not material to the consolidated financial statements.
53
The following table represents a disaggregation of revenue from contracts with customers:
| Fiscal Year | ||||||||||||||||||||
| (in thousands) | 2023 | 2022 | 2021 | |||||||||||||||||
| Point in time net sales: | ||||||||||||||||||||
| Nonalcoholic Beverages - point in time | $ | $ | $ | |||||||||||||||||
| Total point in time net sales | $ | $ | $ | |||||||||||||||||
| Over time net sales: | ||||||||||||||||||||
| Nonalcoholic Beverages - over time | $ | $ | $ | |||||||||||||||||
| All Other - over time | ||||||||||||||||||||
| Total over time net sales | $ | $ | $ | |||||||||||||||||
| Total net sales | $ | $ | $ | |||||||||||||||||
The Company’s allowance for doubtful accounts in the consolidated balance sheets includes a reserve for customer returns and an allowance for credit losses. The Company experiences customer returns primarily as a result of damaged or out-of-date product. At any given time, the Company estimates less than 1 4.5 million as of December 31, 2023 and $3.0 million as of December 31, 2022.
The Company estimates an allowance for credit losses, based on historic days’ sales outstanding trends, aged customer balances, previously written-off balances and expected recoveries up to balances previously written off, in order to present the net amount expected to be collected. Accounts receivable balances are written off when determined uncollectible and are recognized as a reduction to the allowance for credit losses. Following is a summary of activity for the allowance for credit losses during 2023, 2022 and 2021:
| Fiscal Year | ||||||||||||||||||||
| (in thousands) | 2023 | 2022 | 2021 | |||||||||||||||||
| Beginning balance - allowance for credit losses | $ | $ | $ | |||||||||||||||||
| Additions charged to expenses and as a reduction to net sales | ||||||||||||||||||||
| Deductions | ( | ( | ( | |||||||||||||||||
| Ending balance - allowance for credit losses | $ | $ | $ | |||||||||||||||||
4.Segments
The Company evaluates segment reporting in accordance with FASB Accounting Standards Codification Topic 280, Segment Reporting, each reporting period, including evaluating the reporting package reviewed by the CODM. The Company has concluded the Chief Executive Officer, the Chief Operating Officer and the Chief Financial Officer, as a group, represent the CODM. Asset information is not provided to the CODM.
The Company believes three operating segments exist. Nonalcoholic Beverages represents the vast majority of the Company’s consolidated net sales and income from operations. The additional two operating segments do not meet the quantitative thresholds for separate reporting, either individually or in the aggregate, and, therefore, have been combined into “All Other.”
The Company’s segment results are as follows:
| Fiscal Year | ||||||||||||||||||||
| (in thousands) | 2023 | 2022 | 2021 | |||||||||||||||||
| Net sales: | ||||||||||||||||||||
| Nonalcoholic Beverages | $ | $ | $ | |||||||||||||||||
| All Other | ||||||||||||||||||||
Eliminations(1) | ( | ( | ( | |||||||||||||||||
| Consolidated net sales | $ | $ | $ | |||||||||||||||||
(1)The entire net sales elimination represents net sales from the All Other segment to the Nonalcoholic Beverages segment. Sales between these segments are recognized at either fair market value or cost depending on the nature of the transaction.
54
| Fiscal Year | ||||||||||||||||||||
| (in thousands) | 2023 | 2022 | 2021 | |||||||||||||||||
| Income from operations: | ||||||||||||||||||||
| Nonalcoholic Beverages | $ | $ | $ | |||||||||||||||||
| All Other | ( | ( | ||||||||||||||||||
| Consolidated income from operations | $ | $ | $ | |||||||||||||||||
| Depreciation and amortization: | ||||||||||||||||||||
| Nonalcoholic Beverages | $ | $ | $ | |||||||||||||||||
| All Other | ||||||||||||||||||||
| Consolidated depreciation and amortization | $ | $ | $ | |||||||||||||||||
5.Net Income Per Share
The following table sets forth the computation of basic net income per share and diluted net income per share under the two-class method. See Note 1 for additional information related to net income per share.
| Fiscal Year | ||||||||||||||||||||
| (in thousands, except per share data) | 2023 | 2022 | 2021 | |||||||||||||||||
| Numerator for basic and diluted net income per Common Stock and Class B Common Stock share: | ||||||||||||||||||||
| Net income | $ | $ | $ | |||||||||||||||||
| Less dividends: | ||||||||||||||||||||
| Common Stock | ||||||||||||||||||||
| Class B Common Stock | ||||||||||||||||||||
| Total undistributed earnings | $ | $ | $ | |||||||||||||||||
| Common Stock undistributed earnings – basic | $ | $ | $ | |||||||||||||||||
| Class B Common Stock undistributed earnings – basic | ||||||||||||||||||||
| Total undistributed earnings – basic | $ | $ | $ | |||||||||||||||||
| Common Stock undistributed earnings – diluted | $ | $ | $ | |||||||||||||||||
| Class B Common Stock undistributed earnings – diluted | ||||||||||||||||||||
| Total undistributed earnings – diluted | $ | $ | $ | |||||||||||||||||
| Numerator for basic net income per Common Stock share: | ||||||||||||||||||||
| Dividends on Common Stock | $ | $ | $ | |||||||||||||||||
| Common Stock undistributed earnings – basic | ||||||||||||||||||||
| Numerator for basic net income per Common Stock share | $ | $ | $ | |||||||||||||||||
| Numerator for basic net income per Class B Common Stock share: | ||||||||||||||||||||
| Dividends on Class B Common Stock | $ | $ | $ | |||||||||||||||||
| Class B Common Stock undistributed earnings – basic | ||||||||||||||||||||
| Numerator for basic net income per Class B Common Stock share | $ | $ | $ | |||||||||||||||||
| Numerator for diluted net income per Common Stock share: | ||||||||||||||||||||
| Dividends on Common Stock | $ | $ | $ | |||||||||||||||||
| Dividends on Class B Common Stock assumed converted to Common Stock | ||||||||||||||||||||
| Common Stock undistributed earnings – diluted | ||||||||||||||||||||
| Numerator for diluted net income per Common Stock share | $ | $ | $ | |||||||||||||||||
| Numerator for diluted net income per Class B Common Stock share: | ||||||||||||||||||||
| Dividends on Class B Common Stock | $ | $ | $ | |||||||||||||||||
| Class B Common Stock undistributed earnings – diluted | ||||||||||||||||||||
| Numerator for diluted net income per Class B Common Stock share | $ | $ | $ | |||||||||||||||||
55
| Fiscal Year | ||||||||||||||||||||
| (in thousands, except per share data) | 2023 | 2022 | 2021 | |||||||||||||||||
| Denominator for basic net income per Common Stock and Class B Common Stock share: | ||||||||||||||||||||
| Common Stock weighted average shares outstanding – basic | ||||||||||||||||||||
| Class B Common Stock weighted average shares outstanding – basic | ||||||||||||||||||||
| Denominator for diluted net income per Common Stock and Class B Common Stock share: | ||||||||||||||||||||
| Common Stock weighted average shares outstanding – diluted (assumes conversion of Class B Common Stock to Common Stock) | ||||||||||||||||||||
| Class B Common Stock weighted average shares outstanding – diluted | ||||||||||||||||||||
| Basic net income per share: | ||||||||||||||||||||
| Common Stock | $ | $ | $ | |||||||||||||||||
| Class B Common Stock | $ | $ | $ | |||||||||||||||||
| Diluted net income per share: | ||||||||||||||||||||
| Common Stock | $ | $ | $ | |||||||||||||||||
| Class B Common Stock | $ | $ | $ | |||||||||||||||||
NOTES TO TABLE
(1)For purposes of the diluted net income per share computation for Common Stock, all shares of Class B Common Stock are assumed to be converted; therefore, 100
(2)For purposes of the diluted net income per share computation for Class B Common Stock, weighted average shares of Class B Common Stock are assumed to be outstanding for the entire period and not converted.
(3)For periods presented during which the Company has net income, the denominator for diluted net income per share for Common Stock and Class B Common Stock includes the dilutive effect of shares relative to the Long-Term Performance Equity Plan. For periods presented during which the Company has net loss, the unvested performance units granted pursuant to the Long-Term Performance Equity Plan are excluded from the computation of diluted net loss per share, as the effect would have been anti-dilutive. See Note 2 for additional information on the Long-Term Performance Equity Plan.
(4)The Long-Term Performance Equity Plan awards may be settled in cash and/or shares of the Company’s Class B Common Stock. Once an election has been made to settle an award in cash, the dilutive effect of shares relative to such award is prospectively removed from the denominator in the computation of diluted net income per share.
(5)The Company did no
6.Inventories
Inventories consisted of the following:
| (in thousands) | December 31, 2023 | December 31, 2022 | ||||||||||||
| Finished products | $ | $ | ||||||||||||
| Manufacturing materials | ||||||||||||||
| Plastic shells, plastic pallets and other inventories | ||||||||||||||
| Total inventories | $ | $ | ||||||||||||
56
7.Prepaid Expenses and Other Current Assets
Prepaid expenses and other current assets consisted of the following:
| (in thousands) | December 31, 2023 | December 31, 2022 | ||||||||||||
| Repair parts | $ | $ | ||||||||||||
| Prepaid software | ||||||||||||||
| Prepaid taxes | ||||||||||||||
| Prepaid marketing | ||||||||||||||
| Commodity hedges at fair market value | ||||||||||||||
| Other prepaid expenses and other current assets | ||||||||||||||
| Total prepaid expenses and other current assets | $ | $ | ||||||||||||
8.Property, Plant and Equipment, Net
The principal categories and estimated useful lives of property, plant and equipment, net were as follows:
| (in thousands) | December 31, 2023 | December 31, 2022 | Estimated Useful Lives | |||||||||||||||||
| Land | $ | $ | ||||||||||||||||||
| Buildings | ||||||||||||||||||||
| Machinery and equipment | ||||||||||||||||||||
| Transportation equipment | ||||||||||||||||||||
| Furniture and fixtures | ||||||||||||||||||||
| Cold drink dispensing equipment | ||||||||||||||||||||
| Leasehold and land improvements | ||||||||||||||||||||
| Software for internal use | ||||||||||||||||||||
| Construction in progress | ||||||||||||||||||||
| Total property, plant and equipment, at cost | ||||||||||||||||||||
| Less: Accumulated depreciation and amortization | ||||||||||||||||||||
| Property, plant and equipment, net | $ | $ | ||||||||||||||||||
During 2023, 2022 and 2021, the Company performed periodic reviews of property, plant and equipment and determined no
9.Leases
Following is a summary of the weighted average remaining lease term and the weighted average discount rate for the Company’s leases:
| December 31, 2023 | December 31, 2022 | |||||||||||||
| Weighted average remaining lease term: | ||||||||||||||
| Operating leases | ||||||||||||||
| Financing leases | ||||||||||||||
| Weighted average discount rate: | ||||||||||||||
| Operating leases | % | % | ||||||||||||
| Financing leases | % | % | ||||||||||||
Following is a summary of the Company’s leases within the consolidated statements of operations:
| Fiscal Year | ||||||||||||||||||||
| (in thousands) | 2023 | 2022 | 2021 | |||||||||||||||||
| Operating lease costs | $ | $ | $ | |||||||||||||||||
| Short-term and variable leases | ||||||||||||||||||||
| Depreciation expense from financing leases | ||||||||||||||||||||
| Interest expense on financing lease obligations | ||||||||||||||||||||
| Total lease cost | $ | $ | $ | |||||||||||||||||
57
The future minimum lease payments related to the Company’s leases include renewal options the Company has determined to be reasonably certain and exclude payments to landlords for real estate taxes and common area maintenance. Following is a summary of future minimum lease payments for all noncancelable operating leases and financing leases as of December 31, 2023 :
| (in thousands) | Operating Leases | Financing Leases | ||||||||||||
| 2024 | $ | $ | ||||||||||||
| 2025 | ||||||||||||||
| 2026 | ||||||||||||||
| 2027 | ||||||||||||||
| 2028 | ||||||||||||||
| Thereafter | ||||||||||||||
| Total minimum lease payments including interest | $ | $ | ||||||||||||
| Less: Amounts representing interest | ||||||||||||||
| Present value of minimum lease principal payments | ||||||||||||||
| Less: Current portion of lease liabilities - operating and financing leases | ||||||||||||||
| Noncurrent portion of lease liabilities - operating and financing leases | $ | $ | ||||||||||||
Following is a summary of future minimum lease payments for all noncancelable operating leases and financing leases as of December 31, 2022:
| (in thousands) | Operating Leases | Financing Leases | ||||||||||||
| 2023 | $ | $ | ||||||||||||
| 2024 | ||||||||||||||
| 2025 | ||||||||||||||
| 2026 | ||||||||||||||
| 2027 | ||||||||||||||
| Thereafter | ||||||||||||||
| Total minimum lease payments including interest | $ | $ | ||||||||||||
| Less: Amounts representing interest | ||||||||||||||
| Present value of minimum lease principal payments | ||||||||||||||
| Less: Current portion of lease liabilities - operating and financing leases | ||||||||||||||
| Noncurrent portion of lease liabilities - operating and financing leases | $ | $ | ||||||||||||
Following is a summary of the Company’s leases within the consolidated statements of cash flows:
| Fiscal Year | ||||||||||||||||||||
| (in thousands) | 2023 | 2022 | 2021 | |||||||||||||||||
| Cash flows from operating activities impact: | ||||||||||||||||||||
| Operating leases | $ | $ | $ | |||||||||||||||||
| Interest payments on financing lease obligations | ||||||||||||||||||||
| Total cash flows from operating activities impact | $ | $ | $ | |||||||||||||||||
| Cash flows from financing activities impact: | ||||||||||||||||||||
| Principal payments on financing lease obligations | $ | $ | $ | |||||||||||||||||
| Total cash flows from financing activities impact | $ | $ | $ | |||||||||||||||||
58
10.Distribution Agreements, Net
Distribution agreements, net, which are amortized on a straight-line basis and have estimated useful lives of 20 to 40 years, consisted of the following:
| (in thousands) | December 31, 2023 | December 31, 2022 | ||||||||||||
| Distribution agreements at cost | $ | $ | ||||||||||||
| Less: Accumulated amortization | ||||||||||||||
| Distribution agreements, net | $ | $ | ||||||||||||
Following is a summary of activity for distribution agreements, net during 2023 and 2022:
| Fiscal Year | ||||||||||||||
| (in thousands) | 2023 | 2022 | ||||||||||||
| Beginning balance - distribution agreements, net | $ | $ | ||||||||||||
| Other distribution agreements | ||||||||||||||
| Additional accumulated amortization | ( | ( | ||||||||||||
| Ending balance - distribution agreements, net | $ | $ | ||||||||||||
Assuming no impairment of distribution agreements, net, amortization expense in future years based upon recorded amounts as of December 31, 2023 will be $24.9
11.Customer Lists, Net
Customer lists, net, which are amortized on a straight-line basis and have estimated useful lives of to 12 years, consisted of the following:
| (in thousands) | December 31, 2023 | December 31, 2022 | ||||||||||||
| Customer lists at cost | $ | $ | ||||||||||||
| Less: Accumulated amortization | ||||||||||||||
| Customer lists, net | $ | $ | ||||||||||||
Assuming no impairment of customer lists, net, amortization expense in future years based upon recorded amounts as of December 31, 2023 will, on average, be $1.4
12.Supply Chain Finance Program
The Company has an agreement with a third-party financial institution to facilitate a supply chain finance (“SCF”) program, which allows qualifying suppliers to sell their receivables from the Company to the financial institution. The participating suppliers negotiate their outstanding receivable arrangements and associated fees directly with the financial institution, and the Company is not party to those agreements. Once a qualifying supplier elects to participate in the SCF program and reaches an agreement with the financial institution, the supplier elects which individual Company invoices it sells to the financial institution. The supplier invoices that have been confirmed as valid under the SCF program require payment in full by the financial institution to the supplier by the original maturity date of the invoice, or discounted payment at an earlier date as agreed upon with the supplier. The Company’s obligations to its suppliers, including amounts due and scheduled payment terms, are not impacted by a supplier’s participation in the SCF program.
All outstanding amounts related to suppliers participating in the SCF program are recorded in accounts payable, trade in the consolidated balance sheets, and associated payments are included in operating activities in the consolidated statements of cash flows. The Company’s outstanding confirmed obligations included in in the consolidated balance sheets were $55.1 million as of December 31, 2023 and $44.2 million as of December 31, 2022.
59
13.Other Accrued Liabilities
Other accrued liabilities consisted of the following:
| (in thousands) | December 31, 2023 | December 31, 2022 | ||||||||||||
| Current portion of acquisition related contingent consideration | $ | $ | ||||||||||||
| Accrued marketing costs | ||||||||||||||
| Accrued insurance costs | ||||||||||||||
| Employee and retiree benefit plan accruals | ||||||||||||||
| Accrued taxes (other than income taxes) | ||||||||||||||
| Accrued interest payable | ||||||||||||||
| All other accrued expenses | ||||||||||||||
| Total other accrued liabilities | $ | $ | ||||||||||||
14.Commodity Derivative Instruments
The Company is subject to the risk of increased costs arising from adverse changes in certain commodity prices. In the normal course of business, the Company manages this risk through a variety of strategies, including the use of commodity derivative instruments. The Company does not use commodity derivative instruments for trading or speculative purposes. These commodity derivative instruments are not designated as hedging instruments under GAAP and are used as “economic hedges” to manage certain commodity price risk. The Company uses several different financial institutions for commodity derivative instruments to minimize the concentration of credit risk. While the Company would be exposed to credit loss in the event of nonperformance by these counterparties, the Company does not anticipate nonperformance by these counterparties.
Commodity derivative instruments held by the Company are marked to market on a quarterly basis and are recognized in earnings consistent with the expense classification of the underlying hedged item. The Company generally pays a fee for these commodity derivative instruments, which is amortized over the corresponding period of each commodity derivative instrument. Settlements of commodity derivative instruments are included in cash flows from operating activities in the consolidated statements of cash flows. The following table summarizes pre-tax changes in the fair values of the Company’s commodity derivative instruments and the classification of such changes in the consolidated statements of operations:
| Fiscal Year | ||||||||||||||||||||
| (in thousands) | 2023 | 2022 | 2021 | |||||||||||||||||
| Cost of sales | $ | $ | ( | $ | ||||||||||||||||
| Selling, delivery and administrative expenses | ( | |||||||||||||||||||
| Total (loss) gain | $ | ( | $ | ( | $ | |||||||||||||||
All commodity derivative instruments are recorded at fair value as either assets or liabilities in the consolidated balance sheets. The Company has master agreements with the counterparties to its commodity derivative instruments that provide for net settlement of derivative transactions. Accordingly, the net amounts of derivative assets are recognized in either prepaid expenses and other current assets or other assets in the consolidated balance sheets and the net amounts of derivative liabilities are recognized in either other accrued liabilities or other liabilities in the consolidated balance sheets. The following table summarizes the fair values of the Company’s commodity derivative instruments and the classification of such instruments in the consolidated balance sheets:
| (in thousands) | December 31, 2023 | December 31, 2022 | ||||||||||||
| Prepaid expenses and other current assets | $ | $ | ||||||||||||
| Total assets | $ | $ | ||||||||||||
The following table summarizes the Company’s gross commodity derivative instrument assets and gross commodity derivative instrument liabilities in the consolidated balance sheets:
| (in thousands) | December 31, 2023 | December 31, 2022 | ||||||||||||
| Gross commodity derivative instrument assets | $ | $ | ||||||||||||
| Gross commodity derivative instrument liabilities | ||||||||||||||
60
The following table summarizes the Company’s outstanding commodity derivative instruments:
| (in thousands) | December 31, 2023 | December 31, 2022 | ||||||||||||
| Notional amount of outstanding commodity derivative instruments | $ | $ | ||||||||||||
| Latest maturity date of outstanding commodity derivative instruments | December 2024 | December 2023 | ||||||||||||
15.Fair Values of Financial Instruments
GAAP requires assets and liabilities carried at fair value to be classified and disclosed in one of the following categories:
•Level 1: Quoted market prices in active markets for identical assets or liabilities.
•Level 2: Observable market-based inputs or unobservable inputs that are corroborated by market data.
•Level 3: Unobservable inputs that are not corroborated by market data.
The below methods and assumptions were used by the Company in estimating the fair values of its financial instruments. There were no transfers of assets or liabilities between levels in any period presented.
| Financial Instrument | Fair Value Level | Methods and Assumptions | ||||||||||||
| Deferred compensation plan assets and liabilities | Level 1 | The fair value of the Company’s nonqualified deferred compensation plan for certain executives and other highly compensated employees is based on the fair values of associated assets and liabilities, which are held in mutual funds and are based on the quoted market values of the securities held within the mutual funds. | ||||||||||||
| Pension plan assets | Level 1 | The fair values of the Company’s Level 1 pension plan assets, which are equity securities and fixed income investment vehicles, are valued using the quoted market prices of those securities which are actively traded on national exchanges. | ||||||||||||
| Pension plan assets | Level 2 | The fair values of the Company’s Level 2 pension plan assets, which are investments that are pooled with other investments in a commingled fund, are valued using the net asset value produced by the fund manager. The assets within the commingled funds have a readily determinable fair market value. | ||||||||||||
| Commodity derivative instruments | Level 2 | The fair values of the Company’s commodity derivative instruments are based on current settlement values at each balance sheet date, which represent the estimated amounts the Company would have received or paid upon termination of these instruments. The Company’s credit risk related to the commodity derivative instruments is managed by requiring high standards for its counterparties and periodic settlements. The Company considers nonperformance risk in determining the fair values of commodity derivative instruments. | ||||||||||||
| Long-term debt | Level 2 | The carrying amounts of the Company’s variable rate debt approximate the fair values due to variable interest rates with short reset periods. The fair values of the Company’s fixed rate debt are based on estimated current market prices. | ||||||||||||
| Acquisition related contingent consideration | Level 3 | The fair value of the Company’s acquisition related contingent consideration is based on internal forecasts and the WACC derived from market data. | ||||||||||||
The following tables summarize the carrying amounts and the fair values by level of the Company’s deferred compensation plan assets and liabilities, pension plan assets, commodity derivative instruments, long-term debt and acquisition related contingent consideration:
| December 31, 2023 | ||||||||||||||||||||||||||||||||
| (in thousands) | Carrying Amount | Total Fair Value | Fair Value Level 1 | Fair Value Level 2 | Fair Value Level 3 | |||||||||||||||||||||||||||
| Assets: | ||||||||||||||||||||||||||||||||
| Deferred compensation plan assets | $ | $ | $ | $ | $ | |||||||||||||||||||||||||||
| Pension plan assets | ||||||||||||||||||||||||||||||||
| Commodity derivative instruments | ||||||||||||||||||||||||||||||||
| Liabilities: | ||||||||||||||||||||||||||||||||
| Deferred compensation plan liabilities | ||||||||||||||||||||||||||||||||
| Long-term debt | ||||||||||||||||||||||||||||||||
| Acquisition related contingent consideration | ||||||||||||||||||||||||||||||||
61
| December 31, 2022 | ||||||||||||||||||||||||||||||||
| (in thousands) | Carrying Amount | Total Fair Value | Fair Value Level 1 | Fair Value Level 2 | Fair Value Level 3 | |||||||||||||||||||||||||||
| Assets: | ||||||||||||||||||||||||||||||||
| Deferred compensation plan assets | $ | $ | $ | $ | $ | |||||||||||||||||||||||||||
| Pension plan assets | ||||||||||||||||||||||||||||||||
| Commodity derivative instruments | ||||||||||||||||||||||||||||||||
| Liabilities: | ||||||||||||||||||||||||||||||||
| Deferred compensation plan liabilities | ||||||||||||||||||||||||||||||||
| Long-term debt | ||||||||||||||||||||||||||||||||
| Acquisition related contingent consideration | ||||||||||||||||||||||||||||||||
The acquisition related contingent consideration was valued using a probability weighted discounted cash flow model based on internal forecasts and the WACC derived from market data, which are considered Level 3 inputs. Each reporting period, the Company adjusts its acquisition related contingent consideration liability related to the distribution territories subject to acquisition related sub-bottling payments to fair value by discounting future expected acquisition related sub-bottling payments required under the CBA using the Company’s estimated WACC.
The future expected acquisition related sub-bottling payments extend through the life of the related distribution assets acquired in each distribution territory, which is generally 40 years. As a result, the fair value of the acquisition related contingent consideration liability is impacted by the Company’s WACC, management’s estimate of the acquisition related sub-bottling payments that will be made in the future under the CBA, and current acquisition related sub-bottling payments (all Level 3 inputs). Changes in any of these Level 3 inputs, particularly the underlying risk-free interest rate used to estimate the Company’s WACC, could result in material changes to the fair value of the acquisition related contingent consideration liability and could materially impact the amount of non-cash expense (or income) recorded each reporting period.
The acquisition related contingent consideration liability is the Company’s only Level 3 asset or liability. A summary of the Level 3 activity is as follows:
| Fiscal Year | ||||||||||||||
| (in thousands) | 2023 | 2022 | ||||||||||||
| Beginning balance - Level 3 liability | $ | $ | ||||||||||||
| Payments of acquisition related contingent consideration | ( | ( | ||||||||||||
| Reclassification to current payables | ( | |||||||||||||
| Increase in fair value | ||||||||||||||
| Ending balance - Level 3 liability | $ | $ | ||||||||||||
As of December 31, 2023 and December 31, 2022, discount rates of 8.5 % and 9.1 %, respectively, were utilized in the valuation of the Company’s acquisition related contingent consideration liability. The increase in the fair value of the acquisition related contingent consideration liability in 2023 was driven by higher projections of future cash flows in the distribution territories subject to acquisition related sub-bottling payments as well as a decrease in the discount rate used to calculate the fair value of the liability. This fair value adjustment was recorded in mark-to-market on acquisition related contingent consideration in the consolidated statement of operations for 2023.
For the next five years , the Company anticipates that the amount it could pay annually under the acquisition related contingent consideration arrangements for the distribution territories subject to acquisition related sub-bottling payments will be in the range of approximately $50 million to $70 million.
62
16.Income Taxes
The current income tax provision represents the estimated amount of income taxes paid or payable for the year, as well as changes in estimates from prior years. The deferred income tax (benefit) provision represents the change in deferred tax liabilities and assets. The following table presents the significant components of the provision for income taxes:
| Fiscal Year | ||||||||||||||||||||
| (in thousands) | 2023 | 2022 | 2021 | |||||||||||||||||
| Current: | ||||||||||||||||||||
| Federal | $ | $ | $ | |||||||||||||||||
| State | ||||||||||||||||||||
| Total current provision | $ | $ | $ | |||||||||||||||||
| Deferred: | ||||||||||||||||||||
| Federal | $ | ( | $ | $ | ( | |||||||||||||||
| State | ( | ( | ||||||||||||||||||
| Total deferred (benefit) provision | $ | ( | $ | $ | ( | |||||||||||||||
| Income tax expense | $ | $ | $ | |||||||||||||||||
The Company’s effective income tax rate was 26.7 % for 2023, 25.2 % for 2022 and 25.7 % for 2021. The following table provides a reconciliation of income tax expense at the statutory federal rate to actual income tax expense:
| Fiscal Year | ||||||||||||||||||||||||||||||||||||||
| 2023 | 2022 | 2021 | ||||||||||||||||||||||||||||||||||||
| (in thousands) | Income tax expense | % pre-tax income | Income tax expense | % pre-tax income | Income tax expense | % pre-tax income | ||||||||||||||||||||||||||||||||
| Statutory expense | $ | % | $ | % | $ | % | ||||||||||||||||||||||||||||||||
| State income taxes, net of federal benefit | ||||||||||||||||||||||||||||||||||||||
| Nondeductible compensation | ||||||||||||||||||||||||||||||||||||||
| Meals, entertainment and travel expense | ||||||||||||||||||||||||||||||||||||||
| Valuation allowance change | ( | ( | ( | ( | ||||||||||||||||||||||||||||||||||
| Adjustment for uncertain tax positions | ( | ( | ( | ( | ||||||||||||||||||||||||||||||||||
| Other, net | ( | ( | ( | ( | ( | ( | ||||||||||||||||||||||||||||||||
| Income tax expense | $ | % | $ | % | $ | % | ||||||||||||||||||||||||||||||||
The Company records liabilities for uncertain tax positions related to income tax positions. These liabilities reflect the Company’s best estimate of the ultimate income tax liability based on known facts and information. Material changes in facts or information, as well as the expiration of statutes of limitations and/or settlements with individual tax jurisdictions, may result in material adjustments to these estimates in the future.
The Company recognizes potential interest and penalties related to uncertain tax positions in income tax expense. During 2023, 2022 and 2021, the interest and penalties related to uncertain tax positions recognized in income tax expense were not material. In addition, the amount of interest and penalties accrued at December 31, 2023 and December 31, 2022 were not material.
The Company had uncertain tax positions, including accrued interest, of $0.4 0.3 no t expect such change would have a material impact on the consolidated financial statements.
63
A reconciliation of uncertain tax positions, excluding accrued interest, is as follows:
| Fiscal Year | ||||||||||||||||||||
| (in thousands) | 2023 | 2022 | 2021 | |||||||||||||||||
| Beginning balance - gross uncertain tax positions | $ | $ | $ | |||||||||||||||||
| Increase as a result of tax positions taken in the current year | ||||||||||||||||||||
| Increase as a result of tax positions taken in a prior year | ||||||||||||||||||||
| Reduction as a result of the expiration of the applicable statute of limitations | ( | ( | ( | |||||||||||||||||
| Ending balance - gross uncertain tax positions | $ | $ | $ | |||||||||||||||||
Deferred income taxes are recorded based upon temporary differences between the financial statement and tax bases of assets and liabilities and available net operating loss and tax credit carryforwards. Temporary differences and carryforwards that comprised deferred income tax assets and liabilities were as follows:
| (in thousands) | December 31, 2023 | December 31, 2022 | ||||||||||||
| Acquisition related contingent consideration | $ | $ | ||||||||||||
| Accrued liabilities | ||||||||||||||
| Operating lease liabilities | ||||||||||||||
| Deferred compensation | ||||||||||||||
| Deferred revenue | ||||||||||||||
| Postretirement benefits | ||||||||||||||
| Transactional costs | ||||||||||||||
| Financing lease agreements | ||||||||||||||
| Net operating loss carryforwards | ||||||||||||||
| Pension | ||||||||||||||
| Other | ||||||||||||||
| Deferred income tax assets | $ | $ | ||||||||||||
| Less: Valuation allowance for deferred tax assets | ||||||||||||||
| Net deferred income tax asset | $ | $ | ||||||||||||
| Depreciation | $ | ( | $ | ( | ||||||||||
| Intangible assets | ( | ( | ||||||||||||
| Right-of-use assets - operating leases | ( | ( | ||||||||||||
| Inventory | ( | ( | ||||||||||||
| Prepaid expenses | ( | ( | ||||||||||||
| Patronage dividend | ( | ( | ||||||||||||
| Deferred income tax liabilities | $ | ( | $ | ( | ||||||||||
| Net deferred income tax liability | $ | ( | $ | ( | ||||||||||
The Company’s deferred income tax assets and liabilities are subject to adjustment in future periods based on the Company’s ongoing evaluations of such deferred assets and liabilities and new information available to the Company.
Valuation allowances are recognized on deferred tax assets if the Company believes it is more likely than not that some or all of the deferred tax assets will not be realized. The Company believes the majority of the deferred tax assets will be realized due to the reversal of certain significant temporary differences and anticipated future taxable income from operations.
The valuation allowance of $4.1 million on December 31, 2023 and $3.4 million on December 31, 2022 was established primarily for certain loss carryforwards and deferred compensation.
As of December 31, 2023, the Company had no federal net operating losses and $10.1 million of state net operating losses available to reduce future income taxes, which expire in varying amounts through 2043.
Prior tax years beginning in year 2020 remain open to examination by the Internal Revenue Service, and various tax years beginning in year 2000 remain open to examination by certain state tax jurisdictions due to loss carryforwards.
64
17.Benefit Plans
Executive Benefit Plans
In addition to the Company’s Director Deferral Plan, the Company has four executive benefit plans: the Supplemental Savings Incentive Plan, the Long-Term Retention Plan, the Officer Retention Plan and the Long-Term Performance Plan. The Company also has a Long-Term Performance Equity Plan, as discussed in Note 2.
Pursuant to the Supplemental Savings Incentive Plan, as amended and restated effective November 1, 2011, and as further amended thereafter, eligible participants may elect to defer a portion of their annual salary and bonus. Participants are immediately vested in all deferred contributions they make and become fully vested in Company contributions upon completion of five years of service with the Company, termination of employment due to death or retirement or a change in control. Participant deferrals and Company contributions made in years prior to 2006 are invested in either a fixed benefit option or certain investment funds determined by the participant. Beginning in 2010, the Company may elect at its discretion to match up to 50 % of the first 6 % of salary, excluding bonuses, deferred by the participant. During 2023, 2022 and 2021, the Company matched 50 6
Under the Director Deferral Plan, as amended and restated effective January 1, 2014, non-employee directors may defer payment of all or a portion of their annual retainer and meeting fees. There is no Company matching contribution under the Director Deferral Plan. The liability under these two deferral plans was as follows:
| (in thousands) | December 31, 2023 | December 31, 2022 | ||||||||||||
| Current liabilities | $ | $ | ||||||||||||
| Noncurrent liabilities | ||||||||||||||
| Total liability - Supplemental Savings Incentive Plan and Director Deferral Plan | $ | $ | ||||||||||||
Under the Long-Term Retention Plan, effective March 5, 2014, and as amended thereafter, the Company accrues a defined amount each year for an eligible participant based upon an award schedule. Amounts awarded may earn an investment return based on certain investment funds specified by the Company. Accrued benefits under the Long-Term Retention Plan are 50 % vested until age 51 . Beginning at age 51 , the vesting percentage increases by 5 % each year until the accrued benefit is fully vested at age 60 . Participants receive payments from the plan upon retirement or, in certain instances, upon termination of employment. Payments are made in the form of monthly installments over a period of 10 , 15 or 20 years. The liability under this plan was as follows:
| (in thousands) | December 31, 2023 | December 31, 2022 | ||||||||||||
| Current liabilities | $ | $ | ||||||||||||
| Noncurrent liabilities | ||||||||||||||
| Total liability - Long-Term Retention Plan | $ | $ | ||||||||||||
Under the Officer Retention Plan, as amended and restated effective January 1, 2007, and as further amended thereafter, eligible participants may elect to receive an annuity payable in equal monthly installments over a 10 -, 15 - or 20 -year period commencing at retirement or, in certain instances, upon termination of employment. The benefits under the Officer Retention Plan increase with each year of participation as set forth in an agreement between the participant and the Company. Accrued benefits under the Officer Retention Plan are 50 % vested until age 51 . Beginning at age 51 , the vesting percentage increases by 5 % each year until the accrued benefit is fully vested at age 60 . The liability under this plan was as follows:
| (in thousands) | December 31, 2023 | December 31, 2022 | ||||||||||||
| Current liabilities | $ | $ | ||||||||||||
| Noncurrent liabilities | ||||||||||||||
| Total liability - Officer Retention Plan | $ | $ | ||||||||||||
Under the Long-Term Performance Plan, as amended and restated effective January 1, 2018, and as further amended thereafter, the Compensation Committee of the Company’s Board of Directors establishes dollar amounts to which a participant shall be entitled upon attainment of the applicable performance measures. Bonus awards under the Long-Term Performance Plan are made based on the relative achievement of performance measures in terms of the Company-sponsored objectives or objectives related to the
65
performance of the individual participant or of the subsidiary, division, department, region or function in which the participant is employed. The liability under this plan was as follows:
| (in thousands) | December 31, 2023 | December 31, 2022 | ||||||||||||
| Current liabilities | $ | $ | ||||||||||||
| Noncurrent liabilities | ||||||||||||||
| Total liability - Long-Term Performance Plan | $ | $ | ||||||||||||
Pension Plans
The Company has historically sponsored two pension plans. The Primary Plan was frozen as of June 30, 2006 and no benefits accrued to participants after that date. The Bargaining Plan is for certain employees under collective bargaining agreements. Benefits under the Bargaining Plan are determined in accordance with negotiated formulas for the respective participants. Contributions to the plans are based on actuarially determined amounts and are limited to the amounts currently deductible for income tax purposes. The Company updates its mortality assumptions used in the calculation of its pension liability each year using The Society of Actuaries’ latest mortality tables and mortality projection scales.
Primary Plan
In 2022, the Company began the process of terminating the Primary Plan. In connection with the termination process, the Company offered a lump sum benefit payout option to certain plan participants. The remaining assets of the Primary Plan were used to purchase a group annuity contract that transferred the remaining Primary Plan benefit liabilities to an insurance company. During 2023, the Company contributed $12.0 million to fund the termination of the Primary Plan. The Company recognized settlement expense of $112.8 million during 2023 in conjunction with the full settlement of the Primary Plan benefit liabilities, including final premium adjustments. This settlement expense related primarily to the reclassification of the gross actuarial losses associated with the Primary Plan out of accumulated other comprehensive loss and was recorded as pension plan settlement expense in the consolidated statement of operations for 2023.
As of December 31, 2023, there was no 231.0 million and $223.3 million, respectively. The projected benefit obligation and the accumulated benefit obligation for the Primary Plan were in excess of plan assets as of December 31, 2022. The net unfunded status of the Primary Plan as of December 31, 2022 was $7.7 million, which was classified as a noncurrent liability in the consolidated balance sheets.
Net Periodic Pension Cost
| Fiscal Year | ||||||||||||||||||||
| (in thousands) | 2023 | 2022 | 2021 | |||||||||||||||||
| Service cost | $ | $ | $ | |||||||||||||||||
| Interest cost | ||||||||||||||||||||
| Expected return on plan assets | ( | ( | ( | |||||||||||||||||
| Recognized net actuarial loss | ||||||||||||||||||||
| Net periodic pension cost - Primary Plan | ||||||||||||||||||||
| Settlement expense | ||||||||||||||||||||
| Total pension expense - Primary Plan | $ | $ | $ | |||||||||||||||||
66
Bargaining Plan
The following tables set forth pertinent information for the Bargaining Plan:
| Fiscal Year | ||||||||||||||
| (in thousands) | 2023 | 2022 | ||||||||||||
| Beginning balance - Bargaining Plan projected benefit obligation | $ | $ | ||||||||||||
| Service cost | ||||||||||||||
| Interest cost | ||||||||||||||
| Plan amendments | ||||||||||||||
| Actuarial loss (gain) | ( | |||||||||||||
| Benefits paid | ( | ( | ||||||||||||
| Ending balance - Bargaining Plan projected benefit obligation | $ | $ | ||||||||||||
Changes in Projected Benefit Obligation
The plan assets of the Bargaining Plan were in excess of the projected benefit obligation and the accumulated benefit obligation as of December 31, 2023. The projected benefit obligation and the accumulated benefit obligation for the Bargaining Plan were in excess of plan assets as of December 31, 2022. The accumulated benefit obligation associated with the Bargaining Plan was $46.1 million on December 31, 2023 and $39.2 million on December 31, 2022.
The decrease in the discount rate for the Bargaining Plan, as compared to the previous year, was the primary driver of the actuarial loss in 2023. The increase in the discount rate for the Bargaining Plan, as compared to the previous year, was the primary driver of the actuarial gain in 2022. The actuarial loss (gain), net of tax, was recorded in accumulated other comprehensive loss in the consolidated balance sheets.
Change in Plan Assets
| Fiscal Year | ||||||||||||||
| (in thousands) | 2023 | 2022 | ||||||||||||
| Beginning balance - Bargaining Plan assets at fair value | $ | $ | ||||||||||||
| Actual return on plan assets | ( | |||||||||||||
| Employer contributions | ||||||||||||||
| Benefits and expenses paid | ( | ( | ||||||||||||
| Ending balance - Bargaining Plan assets at fair value | $ | $ | ||||||||||||
Funded Status
| (in thousands) | December 31, 2023 | December 31, 2022 | ||||||||||||
| Projected benefit obligation | $ | ( | $ | ( | ||||||||||
| Plan assets at fair value | ||||||||||||||
| Net funded status - Bargaining Plan | $ | $ | ( | |||||||||||
Amounts Recognized in the Consolidated Balance Sheets
| (in thousands) | December 31, 2023 | December 31, 2022 | ||||||||||||
| Liabilities: | ||||||||||||||
| Current liabilities | $ | $ | ||||||||||||
| Noncurrent liabilities | ( | |||||||||||||
| Total liability - Bargaining Plan | $ | $ | ( | |||||||||||
| Assets: | ||||||||||||||
| Noncurrent assets | $ | $ | ||||||||||||
| Total asset - Bargaining Plan | $ | $ | ||||||||||||
67
Net Periodic Pension Cost
| Fiscal Year | ||||||||||||||||||||
| (in thousands) | 2023 | 2022 | 2021 | |||||||||||||||||
| Service cost | $ | $ | $ | |||||||||||||||||
| Interest cost | ||||||||||||||||||||
| Expected return on plan assets | ( | ( | ( | |||||||||||||||||
| Recognized net actuarial loss | ||||||||||||||||||||
| Amortization of prior service costs | ||||||||||||||||||||
| Net periodic pension cost - Bargaining Plan | $ | $ | $ | |||||||||||||||||
Significant Assumptions
| Fiscal Year | ||||||||||||||||||||
| 2023 | 2022 | 2021 | ||||||||||||||||||
| Projected benefit obligation at the measurement date: | ||||||||||||||||||||
| Discount rate - Bargaining Plan | % | % | % | |||||||||||||||||
| Weighted average rate of compensation increase | N/A | N/A | N/A | |||||||||||||||||
| Net periodic pension cost for the fiscal year: | ||||||||||||||||||||
| Discount rate - Bargaining Plan | % | % | % | |||||||||||||||||
Weighted average expected long-term rate of return of plan assets - Bargaining Plan(1) | % | % | % | |||||||||||||||||
| Weighted average rate of compensation increase | N/A | N/A | N/A | |||||||||||||||||
(1)The weighted average expected long-term rate of return assumption for the Bargaining Plan assets, which was used to compute net periodic pension cost, is based upon target asset allocation and is determined using forward-looking performance and duration assumptions set at the beginning of each fiscal year.
Cash Flows
The anticipated future pension benefit payments as of December 31, 2023 were as follows:
| (in thousands) | Anticipated Future Payment | |||||||
| 2024 | $ | |||||||
| 2025 | ||||||||
| 2026 | ||||||||
| 2027 | ||||||||
| 2028 | ||||||||
| 2029 - 2033 | ||||||||
All anticipated future pension benefit payments relate to the Bargaining Plan. The Company does not expect cash contributions to the Bargaining Plan to exceed $2 million during 2024.
Plan Assets
All assets in the Company’s Bargaining Plan are invested in institutional investment funds managed by professional investment advisors which hold U.S. equities, international equities and debt securities. The objective of the Company’s investment philosophy is to earn the plans’ targeted rate of return over longer periods without assuming excess investment risk. The weighted average expected long-term rate of return assumption for the Bargaining Plan assets, which will be used to compute 2024 net periodic pension cost, is based upon target asset allocation and is determined using forward-looking performance and duration assumptions in the context of historical returns and volatilities for each asset class. The Company evaluates the rate of return assumption on an annual basis.
68
The Company’s actual asset allocation at December 31, 2023 and December 31, 2022 and target asset allocation for 2024 by asset category for the Bargaining Plan were as follows:
| Percentage of Bargaining Plan Assets at Fiscal Year-End | Target Asset Allocation | |||||||||||||||||||
| 2023 | 2022 | 2024 | ||||||||||||||||||
| U.S. debt securities | % | % | % | |||||||||||||||||
| U.S. equity securities | % | % | % | |||||||||||||||||
| International debt securities | % | % | % | |||||||||||||||||
| International equity securities | % | % | % | |||||||||||||||||
| Cash and cash equivalents | % | % | % | |||||||||||||||||
| Total | % | % | % | |||||||||||||||||
The expected long-term rate of return on assets for the Bargaining Plan as of December 31, 2023 was 7.00 %.
Debt securities in the Bargaining Plan as of December 31, 2023 were comprised primarily of investments in government and corporate bonds with a weighted average maturity of approximately 19 years. U.S. equity securities in the Bargaining Plan as of December 31, 2023 included: (i) large-capitalization domestic equity funds as represented by the S&P 500 index, (ii) mid-capitalization domestic equity funds as represented by the Russell Mid Cap Growth and Value indexes, (iii) small-capitalization domestic equity funds as represented by the Russell Small Cap Growth and Value indexes and (iv) alternative investment funds as represented by the HFRX Global index and the MSCI US REIT index. International equity securities in the Bargaining Plan as of December 31, 2023 included companies from both developed and emerging markets outside the United States. Cash and cash equivalents have a weighted average duration of less than one year .
The following table summarizes the Company’s pension plan assets, which are classified as Level 1 and Level 2 for fair value measurement. As of December 31, 2023, the below values include Bargaining Plan assets only, as there were no remaining Primary Plan assets after the termination of the plan. As of December 31, 2022, the below values include both Bargaining Plan and Primary Plan assets. The Company does not have any Level 3 pension plan assets. See Note 15 for additional information.
| (in thousands) | December 31, 2023 | December 31, 2022 | ||||||||||||
| Pension plan assets - fixed income | $ | $ | ||||||||||||
| Pension plan assets - equity securities | ||||||||||||||
| Pension plan assets - cash and cash equivalents | ||||||||||||||
| Total pension plan assets | $ | $ | ||||||||||||
401(k) Savings Plan
The Company provides a 401(k) Savings Plan for substantially all of its employees who are not part of collective bargaining agreements and for certain employees under collective bargaining agreements. The Company’s matching contribution for employees who are not part of collective bargaining agreements is discretionary, with the option to match contributions for eligible participants up to 5 5 30.5 million in 2023, $26.8 million in 2022 and $24.8 million in 2021.
Postretirement Benefits
The Company provides postretirement benefits for employees meeting specified qualifying criteria. The Company recognizes the cost of postretirement benefits, which consist principally of medical benefits, during employees’ periods of active service. The Company does not prefund these benefits and has the right to modify or terminate certain of these benefits in the future.
69
The following tables set forth pertinent information for the Company’s postretirement benefit plan:
Reconciliation of Activity
| Fiscal Year | ||||||||||||||
| (in thousands) | 2023 | 2022 | ||||||||||||
| Benefit obligation at beginning of year | $ | $ | ||||||||||||
| Service cost | ||||||||||||||
| Interest cost | ||||||||||||||
| Plan participants’ contributions | ||||||||||||||
| Actuarial loss (gain) | ( | |||||||||||||
| Benefits paid | ( | ( | ||||||||||||
| Benefit obligation at end of year | $ | $ | ||||||||||||
The decrease in the discount rate for the postretirement benefit plan, as compared to the previous year, was the primary driver of the actuarial loss in 2023. The increase in the discount rate for the postretirement benefit plan, as compared to the previous year, was the primary driver of the actuarial gain in 2022. The actuarial loss (gain), net of tax, was recorded in accumulated other comprehensive loss in the consolidated balance sheets.
Reconciliation of Plan Assets Fair Value
| Fiscal Year | ||||||||||||||
| (in thousands) | 2023 | 2022 | ||||||||||||
| Fair value of plan assets at beginning of year | $ | $ | ||||||||||||
| Employer contributions | ||||||||||||||
| Plan participants’ contributions | ||||||||||||||
| Benefits paid | ( | ( | ||||||||||||
| Fair value of plan assets at end of year | $ | $ | ||||||||||||
Funded Status
| (in thousands) | December 31, 2023 | December 31, 2022 | ||||||||||||
| Current liabilities | $ | ( | $ | ( | ||||||||||
| Noncurrent liabilities | ( | ( | ||||||||||||
| Total liability - postretirement benefits | $ | ( | $ | ( | ||||||||||
Net Periodic Postretirement Benefit Cost
| Fiscal Year | ||||||||||||||||||||
| (in thousands) | 2023 | 2022 | 2021 | |||||||||||||||||
| Service cost | $ | $ | $ | |||||||||||||||||
| Interest cost | ||||||||||||||||||||
| Recognized net actuarial loss | ||||||||||||||||||||
| Net periodic postretirement benefit cost | $ | $ | $ | |||||||||||||||||
70
Significant Assumptions
| Fiscal Year | ||||||||||||||||||||
| 2023 | 2022 | 2021 | ||||||||||||||||||
| Benefit obligation at the measurement date: | ||||||||||||||||||||
| Weighted average healthcare cost trend rate - Pre-Medicare | % | % | % | |||||||||||||||||
| Weighted average healthcare cost trend rate - Post-Medicare | % | % | % | |||||||||||||||||
| Benefit obligation discount rate | % | % | % | |||||||||||||||||
| Net periodic postretirement benefit cost discount rate for fiscal year | % | % | % | |||||||||||||||||
| Postretirement benefit expense - Pre-Medicare: | ||||||||||||||||||||
| Weighted average healthcare cost trend rate | % | % | % | |||||||||||||||||
| Trend rate graded down to ultimate rate | % | % | % | |||||||||||||||||
| Ultimate rate year | 2032 | 2029 | 2029 | |||||||||||||||||
| Postretirement benefit expense - Post-Medicare: | ||||||||||||||||||||
| Weighted average healthcare cost trend rate | % | % | % | |||||||||||||||||
| Trend rate graded down to ultimate rate | % | % | % | |||||||||||||||||
| Ultimate rate year | 2032 | 2029 | 2029 | |||||||||||||||||
Cash Flows
The anticipated future postretirement benefit payments reflecting expected future service as of December 31, 2023 were as follows:
| (in thousands) | Anticipated Future Payment | |||||||
| 2024 | $ | |||||||
| 2025 | ||||||||
| 2026 | ||||||||
| 2027 | ||||||||
| 2028 | ||||||||
| 2029 - 2033 | ||||||||
Accumulated Other Comprehensive Loss
A reconciliation of the gross amounts in accumulated other comprehensive loss not yet recognized as components of net periodic benefit cost associated with the plans discussed above is as follows:
| (in thousands) | December 31, 2022 | Actuarial Gain (Loss) | Reclassification Adjustments | December 31, 2023 | ||||||||||||||||||||||
| Pension Plans: | ||||||||||||||||||||||||||
| Actuarial loss | $ | ( | $ | $ | $ | ( | ||||||||||||||||||||
| Prior service costs | ( | ( | ( | |||||||||||||||||||||||
| Pension plan settlement | ||||||||||||||||||||||||||
| Postretirement Medical: | ||||||||||||||||||||||||||
| Actuarial gain (loss) | ( | ( | ||||||||||||||||||||||||
| Total within accumulated other comprehensive loss | $ | ( | $ | ( | $ | $ | ( | |||||||||||||||||||
As of December 31, 2023, there were no gross actuarial losses included in accumulated other comprehensive loss associated with the Primary Plan. As of December 31, 2022, there were approximately $117 million of gross actuarial losses included in accumulated other comprehensive loss associated with the Primary Plan.
Multiemployer Pension Plans
Certain employees of the Company whose employment is covered under collective bargaining agreements participate in a multiemployer pension plan, the Employers-Teamsters Local Union Nos. 175 and 505 Pension Fund (the “Teamsters Plan”). The Company makes monthly contributions to the Teamsters Plan on behalf of such employees. The collective bargaining agreements covering the Teamsters Plan expire at various times through 2026. The Company expects these agreements will be re-negotiated.
71
Participating in the Teamsters Plan involves certain risks in addition to the risks associated with single employer pension plans, as contributed assets are pooled and may be used to provide benefits to employees of other participating employers. If a participating employer stops contributing to the Teamsters Plan, the unfunded obligations of the Teamsters Plan may be borne by the remaining participating employers. If the Company chooses to stop participating in the Teamsters Plan, the Company could be required to pay the Teamsters Plan a withdrawal liability based on the underfunded status of the Teamsters Plan. The Company does not anticipate withdrawing from the Teamsters Plan.
In 2015, the Company increased its contribution rates to the Teamsters Plan, with additional increases occurring annually, as part of a rehabilitation plan, which was incorporated into the renewal of collective bargaining agreements with the unions effective April 28, 2014 and adopted by the Company as a rehabilitation plan effective January 1, 2015. This is a result of the Teamsters Plan being certified by its actuary as being in “critical” status for the plan year beginning January 1, 2013.
The Company’s participation in the Teamsters Plan is outlined in the table below. A red zone represents less than 80 % funding and requires a financial improvement plan (“FIP”) or rehabilitation plan (“RP”).
| Fiscal Year | ||||||||||||||||||||
| (in thousands) | 2023 | 2022 | 2021 | |||||||||||||||||
| Pension Protection Act Zone Status | Red | Red | Red | |||||||||||||||||
| FIP or RP pending or implemented | Yes | Yes | Yes | |||||||||||||||||
| Surcharge imposed | Yes | Yes | Yes | |||||||||||||||||
| Contribution | $ | $ | $ | |||||||||||||||||
According to the Teamsters Plan’s Form 5500 for both the plan years ended December 31, 2022 and December 31, 2021, the Company was not listed as providing more than 5% of the total contributions. At the date these consolidated financial statements were issued, a Form 5500 was not available for the plan year ended December 31, 2023.
The Company has a liability recorded for withdrawing from a multiemployer pension plan in 2008 and is required to make payments of approximately $1 million to this multiemployer pension plan each year through 2028. As of December 31, 2023, the Company had $3.9 million remaining on this liability.
18.Other Liabilities
Other liabilities consisted of the following:
| (in thousands) | December 31, 2023 | December 31, 2022 | ||||||||||||
| Noncurrent portion of acquisition related contingent consideration | $ | $ | ||||||||||||
| Accruals for executive benefit plans | ||||||||||||||
| Noncurrent deferred proceeds from related parties | ||||||||||||||
| Other | ||||||||||||||
| Total other liabilities | $ | $ | ||||||||||||
In 2017, The Coca‑Cola Company agreed to provide the Company a fee to compensate the Company for the net economic impact of changes made by The Coca‑Cola Company to the authorized pricing on sales of covered beverages produced at certain manufacturing plants owned by the Company (the “Legacy Facilities Credit”), which was recorded as a deferred liability and will be amortized as a reduction to cost of sales over a period of 40 years.
Also in 2017, upon the conversion of the Company’s then-existing bottling agreements pursuant to the CBA, the Company received a fee from CCR (the “Territory Conversion Fee”), which was recorded as a deferred liability and will be amortized as a reduction to cost of sales over a period of 40 years. Together, the Legacy Facilities Credit and the Territory Conversion Fee are “deferred proceeds from related parties.”
72
19.Long-Term Debt
Following is a summary of the Company’s long-term debt:
| (in thousands) | Maturity Date | Interest Rate | Interest Paid | Public / Nonpublic | December 31, 2023 | December 31, 2022 | ||||||||||||||||||||||||||||||||
Senior bonds(1) | 11/25/2025 | Semi-annually | Public | $ | $ | |||||||||||||||||||||||||||||||||
Revolving credit facility(2)(3) | 7/9/2026 | Variable | Varies | Nonpublic | ||||||||||||||||||||||||||||||||||
| Senior notes | 10/10/2026 | Quarterly | Nonpublic | |||||||||||||||||||||||||||||||||||
| Senior notes | 3/21/2030 | Quarterly | Nonpublic | |||||||||||||||||||||||||||||||||||
Unamortized discount on senior bonds(1) | 11/25/2025 | ( | ( | |||||||||||||||||||||||||||||||||||
| Debt issuance costs | ( | ( | ||||||||||||||||||||||||||||||||||||
| Total long-term debt | $ | $ | ||||||||||||||||||||||||||||||||||||
(1)The senior bonds due in 2025 were issued at 99.975 % of par.
(2)The Company’s revolving credit facility has an aggregate maximum borrowing capacity of $500 million. The Company currently believes all banks participating in the revolving credit facility have the ability to and will meet any funding requests from the Company.
(3)During 2023, the Company amended its revolving credit facility to complete the transition of the interest rate index from the London InterBank Offered Rate (LIBOR) to the Secured Overnight Financing Rate (SOFR), as contemplated in the revolving credit facility.
The principal maturities of debt outstanding on December 31, 2023 were as follows:
| (in thousands) | Debt Maturities | |||||||
| 2024 | $ | |||||||
| 2025 | ||||||||
| 2026 | ||||||||
| 2027 | ||||||||
| 2028 | ||||||||
| Thereafter | ||||||||
| Long-term debt | $ | |||||||
The Company mitigates its financing risk by using multiple financial institutions and only entering into credit arrangements with institutions with investment grade credit ratings. The Company monitors counterparty credit ratings on an ongoing basis.
The indenture under which the Company’s senior bonds were issued does not include financial covenants, but does limit the incurrence of certain liens and encumbrances as well as indebtedness by the Company’s subsidiaries in excess of certain amounts. The agreements under which the Company’s nonpublic debt was issued include two financial covenants: a consolidated cash flow/fixed charges ratio and a consolidated funded indebtedness/cash flow ratio, each as defined in the respective agreement. The Company was in compliance with these covenants as of December 31, 2023. These covenants have not restricted, and are not expected to restrict, the Company’s liquidity or capital resources.
All outstanding long-term debt has been issued by the Company and none has been issued by any of its subsidiaries. There are no guarantees of the Company’s long-term debt.
20.Commitments and Contingencies
Manufacturing Cooperatives
The Company is obligated to purchase at least 80 % of its requirements of plastic bottles for certain designated territories from Southeastern. The Company is also obligated to purchase 17.5 million cases of finished product from SAC on an annual basis through June 2024. The Company purchased 25.3 million cases, 26.9 million cases and 28.0 million cases of finished product from SAC in 2023, 2022 and 2021, respectively.
73
The following table summarizes the Company’s purchases from these manufacturing cooperatives:
| Fiscal Year | ||||||||||||||||||||
| (in thousands) | 2023 | 2022 | 2021 | |||||||||||||||||
| Purchases from Southeastern | $ | $ | $ | |||||||||||||||||
| Purchases from SAC | ||||||||||||||||||||
| Total purchases from manufacturing cooperatives | $ | $ | $ | |||||||||||||||||
The Company guarantees a portion of SAC’s debt, which expires in 2028. The amount guaranteed was $9.5
The Company holds no assets as collateral against the SAC guarantee, the fair value of which is immaterial to the consolidated financial statements. The Company monitors its investment in SAC and would be required to write down its investment if an impairment, other than a temporary impairment, was identified. No impairment of the Company’s investment in SAC was identified as of December 31, 2023, and there was no
Other Commitments and Contingencies
The Company has standby letters of credit, primarily related to its property and casualty insurance programs. These letters of credit totaled $37.6
The Company participates in long-term marketing contractual arrangements with certain prestige properties, athletic venues and other locations. As of December 31, 2023, the future payments related to these contractual arrangements, which expire at various dates through 2033, amounted to $130.5 million.
The Company is involved in various claims and legal proceedings which have arisen in the ordinary course of its business. Although it is difficult to predict the ultimate outcome of these claims and legal proceedings, management believes the ultimate disposition of these matters will not have a material adverse effect on the financial condition, results of operations or cash flows of the Company. No material amount of loss in excess of recorded amounts is believed to be reasonably possible as a result of these claims and legal proceedings.
The Company is subject to audits by tax authorities in jurisdictions where it conducts business. These audits may result in assessments that are subsequently resolved with the authorities or potentially through the courts. Management believes the Company has adequately provided for any assessments likely to result from these audits; however, final assessments, if any, could be different than the amounts recorded in the consolidated financial statements.
21.Risks and Uncertainties
Approximately 85 % of the Company’s total bottle/can sales volume to retail customers consists of products of The Coca‑Cola Company, which is the sole supplier of these products or of the concentrates or syrups required to manufacture these products. The remaining bottle/can sales volume to retail customers consists of products of other beverage companies. The Company has beverage agreements with The Coca‑Cola Company and other beverage companies under which it has various requirements. Failure to meet the requirements of these beverage agreements could result in the loss of distribution rights for the respective products.
The Company faces concentration risks related to a few customers comprising a large portion of the Company’s annual sales volume and net sales. The following table summarizes the percentage of the Company’s total bottle/can sales volume to its largest customers,
74
as well as the percentage of the Company’s total net sales, which are included in the Nonalcoholic Beverages segment, that such volume represents. No other customer represented greater than 10% of the Company’s total net sales for any years presented.
| Fiscal Year | ||||||||||||||||||||
| 2023 | 2022 | 2021 | ||||||||||||||||||
| Approximate percent of the Company’s total bottle/can sales volume | ||||||||||||||||||||
| Wal-Mart Stores, Inc. | % | % | % | |||||||||||||||||
| The Kroger Company | % | % | % | |||||||||||||||||
| Total approximate percent of the Company’s total bottle/can sales volume | % | % | % | |||||||||||||||||
| Approximate percent of the Company’s total net sales | ||||||||||||||||||||
| Wal-Mart Stores, Inc. | % | % | % | |||||||||||||||||
| The Kroger Company | % | % | % | |||||||||||||||||
| Total approximate percent of the Company’s total net sales | % | % | % | |||||||||||||||||
The Company purchases all of the plastic bottles used in its manufacturing plants from Southeastern and Western Container, two manufacturing cooperatives the Company co-owns with several other Coca‑Cola bottlers, and all of its aluminum cans from two domestic suppliers. See Note 2 and Note 20 for additional information.
The Company is exposed to price risk on commodities such as aluminum, corn and PET resin (a petroleum- or plant-based product), which affects the cost of raw materials used in the production of its finished products. The Company both produces and procures these finished products. Examples of the raw materials affected are aluminum cans and plastic bottles used for packaging and high fructose corn syrup used as a product ingredient. Further, the Company is exposed to commodity price risk on crude oil, which impacts the Company’s cost of fuel used in the movement and delivery of the Company’s products. The Company participates in commodity hedging and risk mitigation programs, including programs administered by CCBSS and programs the Company administers.
Certain liabilities of the Company, including retirement benefit obligations and the Company’s pension liability, are subject to risk of changes in both long-term and short-term interest rates.
The Company’s acquisition related contingent consideration liability related to the distribution territories subject to acquisition related sub-bottling payments is subject to risk as a result of changes in the Company’s probability weighted discounted cash flow model, which is based on internal forecasts, and changes in the Company’s WACC, which is derived from market data.
Approximately 15 % of the Company’s workforce is covered by collective bargaining agreements. The Company’s collective bargaining agreements, which generally have - to five-year terms, expire at various dates through 2028. Terms and conditions of new labor union agreements could increase the Company’s exposure to work interruptions or stoppages.
22.Accumulated Other Comprehensive Income (Loss)
Accumulated other comprehensive income (loss) (“AOCI(L)”) is comprised of adjustments to the Company’s pension and postretirement medical benefit plans and the foreign currency translation for a subsidiary of the Company that performs data analysis and formerly provided consulting services outside the United States.
Following is a summary of AOCI(L) for 2023, 2022 and 2021:
| Gains (Losses) During the Period | Reclassification to Income | |||||||||||||||||||||||||||||||||||||
| (in thousands) | December 31, 2022 | Pre-tax Activity | Tax Effect | Pre-tax Activity | Tax Effect | December 31, 2023 | ||||||||||||||||||||||||||||||||
| Net pension activity: | ||||||||||||||||||||||||||||||||||||||
| Actuarial loss | $ | ( | $ | $ | ( | $ | $ | ( | $ | ( | ||||||||||||||||||||||||||||
| Prior service costs | ( | ( | ( | ( | ||||||||||||||||||||||||||||||||||
Pension plan settlement(1) | ( | |||||||||||||||||||||||||||||||||||||
| Net postretirement benefits activity: | ||||||||||||||||||||||||||||||||||||||
| Actuarial gain | ( | |||||||||||||||||||||||||||||||||||||
| Prior service costs | ( | ( | ||||||||||||||||||||||||||||||||||||
Reclassification of stranded tax effects(1) | ( | ( | ||||||||||||||||||||||||||||||||||||
| Total AOCI(L) | $ | ( | $ | ( | $ | $ | $ | ( | $ | ( | ||||||||||||||||||||||||||||
75
| Gains (Losses) During the Period | Reclassification to Income | |||||||||||||||||||||||||||||||||||||
| (in thousands) | December 31, 2021 | Pre-tax Activity | Tax Effect | Pre-tax Activity | Tax Effect | December 31, 2022 | ||||||||||||||||||||||||||||||||
| Net pension activity: | ||||||||||||||||||||||||||||||||||||||
| Actuarial loss | $ | ( | $ | $ | ( | $ | $ | ( | $ | ( | ||||||||||||||||||||||||||||
| Prior service credits (costs) | ( | ( | ||||||||||||||||||||||||||||||||||||
| Net postretirement benefits activity: | ||||||||||||||||||||||||||||||||||||||
| Actuarial (loss) gain | ( | ( | ( | |||||||||||||||||||||||||||||||||||
| Prior service costs | ( | ( | ||||||||||||||||||||||||||||||||||||
| Foreign currency translation adjustment | ( | ( | ||||||||||||||||||||||||||||||||||||
| Reclassification of stranded tax effects | ( | ( | ||||||||||||||||||||||||||||||||||||
| Total AOCI(L) | $ | ( | $ | $ | ( | $ | $ | ( | $ | ( | ||||||||||||||||||||||||||||
| Gains (Losses) During the Period | Reclassification to Income | |||||||||||||||||||||||||||||||||||||
| (in thousands) | December 31, 2020 | Pre-tax Activity | Tax Effect | Pre-tax Activity | Tax Effect | December 31, 2021 | ||||||||||||||||||||||||||||||||
| Net pension activity: | ||||||||||||||||||||||||||||||||||||||
| Actuarial loss | $ | ( | $ | $ | ( | $ | $ | ( | $ | ( | ||||||||||||||||||||||||||||
| Prior service credits | ||||||||||||||||||||||||||||||||||||||
| Net postretirement benefits activity: | ||||||||||||||||||||||||||||||||||||||
| Actuarial loss | ( | ( | ( | ( | ||||||||||||||||||||||||||||||||||
| Prior service costs | ( | ( | ||||||||||||||||||||||||||||||||||||
Interest rate swap(2) | ( | ( | ||||||||||||||||||||||||||||||||||||
| Foreign currency translation adjustment | ( | ( | ||||||||||||||||||||||||||||||||||||
| Reclassification of stranded tax effects | ( | ( | ||||||||||||||||||||||||||||||||||||
| Total AOCI(L) | $ | ( | $ | $ | ( | $ | $ | ( | $ | ( | ||||||||||||||||||||||||||||
(1)The stranded tax effect activity for 2023 is associated with the full settlement of the Primary Plan benefit liabilities.
(2)In 2019, the Company entered into a $100 million fixed rate swap to hedge a portion of the interest rate risk on its previous term loan facility, both of which matured on June 7, 2021. This interest rate swap was designated as a cash flow hedging instrument and changes in its fair value were not material to the consolidated balance sheets.
23.Supplemental Disclosures of Cash Flow Information
Changes in current assets and current liabilities affecting cash were as follows:
| Fiscal Year | ||||||||||||||||||||
| (in thousands) | 2023 | 2022 | 2021 | |||||||||||||||||
| Accounts receivable, trade | $ | ( | $ | ( | $ | ( | ||||||||||||||
| Allowance for doubtful accounts | ( | ( | ( | |||||||||||||||||
| Accounts receivable from The Coca-Cola Company | ( | ( | ||||||||||||||||||
| Accounts receivable, other | ( | ( | ||||||||||||||||||
| Inventories | ( | ( | ||||||||||||||||||
| Prepaid expenses and other current assets | ( | ( | ||||||||||||||||||
| Accounts payable, trade | ||||||||||||||||||||
| Accounts payable to The Coca-Cola Company | ( | |||||||||||||||||||
| Other accrued liabilities | ( | |||||||||||||||||||
| Accrued compensation | ||||||||||||||||||||
| Change in current assets less current liabilities | $ | $ | ( | $ | ||||||||||||||||
The change in other accrued liabilities includes fluctuations in accrued interest payable for all years presented.
76
The Company had the following net cash payments during the period for income taxes and interest:
| Fiscal Year | ||||||||||||||||||||
| (in thousands) | 2023 | 2022 | 2021 | |||||||||||||||||
| Income taxes | $ | $ | $ | |||||||||||||||||
| Interest | ||||||||||||||||||||
The Company had the following significant non-cash financing and investing activities:
| Fiscal Year | ||||||||||||||||||||
| (in thousands) | 2023 | 2022 | 2021 | |||||||||||||||||
| Dividends declared but not yet paid | $ | $ | $ | |||||||||||||||||
| Additions to property, plant and equipment accrued and recorded in accounts payable, trade | ||||||||||||||||||||
| Right-of-use assets obtained in exchange for operating lease obligations | ||||||||||||||||||||
| Reductions to leased property under financing leases | ||||||||||||||||||||
77
Management’s Report on Internal Control over Financial Reporting
Management of Coca-Cola Consolidated, Inc. (the “Company”) is responsible for establishing and maintaining adequate internal control over financial reporting as such term is defined in Rules 13a-15(f) and 15d-15(f) under the Securities Exchange Act of 1934, as amended. The Company’s internal control over financial reporting is a process designed under the supervision of the Company’s chief executive and chief financial officers to provide reasonable assurance regarding the reliability of financial reporting and the preparation of the Company’s consolidated financial statements for external purposes in accordance with accounting principles generally accepted in the United States. The Company’s internal control over financial reporting includes policies and procedures that:
(i)pertain to the maintenance of records that, in reasonable detail, accurately and fairly reflect transactions and dispositions of assets of the Company;
(ii)provide reasonable assurance that transactions are recorded as necessary to permit preparation of financial statements in accordance with U.S. generally accepted accounting principles, and that receipts and expenditures are being made only in accordance with authorizations of management and the directors of the Company; and
(iii)provide reasonable assurance regarding prevention or timely detection of unauthorized acquisition, use or disposition of the Company’s assets that could have a material effect on the Company’s financial statements.
Because of its inherent limitations, internal control over financial reporting may not prevent or detect all misstatements. Also, projections of any evaluation of effectiveness to future periods are subject to the risk that controls may become inadequate due to changes in conditions, or that the degree of compliance with the policies or procedures may deteriorate.
As of December 31, 2023, management assessed the effectiveness of the Company’s internal control over financial reporting based on the framework established in Internal Control – Integrated Framework (2013) issued by the Committee of Sponsoring Organizations of the Treadway Commission (COSO). Based on this assessment, management determined that the Company’s internal control over financial reporting as of December 31, 2023 was effective.
The effectiveness of the Company’s internal control over financial reporting as of December 31, 2023, has been audited by PricewaterhouseCoopers LLP (PCAOB ID 238 ), an independent registered public accounting firm, which is included in Item 8 of this report.
February 21, 2024
78
Report of Independent Registered Public Accounting Firm
To the Board of Directors and Stockholders of Coca‑Cola Consolidated, Inc.
Opinions on the Financial Statements and Internal Control over Financial Reporting
We have audited the accompanying consolidated balance sheets of Coca‑Cola Consolidated, Inc. and its subsidiaries (the “Company”) as of December 31, 2023 and 2022, and the related consolidated statements of operations, of comprehensive income, of changes in stockholders’ equity and of cash flows for each of the three years in the period ended December 31, 2023, including the related notes and schedule of valuation and qualifying accounts and reserves for each of the three years in the period ended December 31, 2023 appearing under Item 15(a)(2) (collectively referred to as the “consolidated financial statements”). We also have audited the Company’s internal control over financial reporting as of December 31, 2023, based on criteria established in Internal Control - Integrated Framework (2013) issued by the Committee of Sponsoring Organizations of the Treadway Commission (COSO).
In our opinion, the consolidated financial statements referred to above present fairly, in all material respects, the financial position of the Company as of December 31, 2023 and 2022, and the results of its operations and its cash flows for each of the three years in the period ended December 31, 2023 in conformity with accounting principles generally accepted in the United States of America. Also in our opinion, the Company maintained, in all material respects, effective internal control over financial reporting as of December 31, 2023, based on criteria established in Internal Control - Integrated Framework (2013) issued by the COSO.
Basis for Opinions
The Company’s management is responsible for these consolidated financial statements, for maintaining effective internal control over financial reporting, and for its assessment of the effectiveness of internal control over financial reporting, included in Management’s Report on Internal Control over Financial Reporting appearing under Item 8. Our responsibility is to express opinions on the Company’s consolidated financial statements and on the Company’s internal control over financial reporting based on our audits. We are a public accounting firm registered with the Public Company Accounting Oversight Board (United States) (PCAOB) and are required to be independent with respect to the Company in accordance with the U.S. federal securities laws and the applicable rules and regulations of the Securities and Exchange Commission and the PCAOB.
We conducted our audits in accordance with the standards of the PCAOB. Those standards require that we plan and perform the audits to obtain reasonable assurance about whether the consolidated financial statements are free of material misstatement, whether due to error or fraud, and whether effective internal control over financial reporting was maintained in all material respects.
Our audits of the consolidated financial statements included performing procedures to assess the risks of material misstatement of the consolidated financial statements, whether due to error or fraud, and performing procedures that respond to those risks. Such procedures included examining, on a test basis, evidence regarding the amounts and disclosures in the consolidated financial statements. Our audits also included evaluating the accounting principles used and significant estimates made by management, as well as evaluating the overall presentation of the consolidated financial statements. Our audit of internal control over financial reporting included obtaining an understanding of internal control over financial reporting, assessing the risk that a material weakness exists, and testing and evaluating the design and operating effectiveness of internal control based on the assessed risk. Our audits also included performing such other procedures as we considered necessary in the circumstances. We believe that our audits provide a reasonable basis for our opinions.
Definition and Limitations of Internal Control over Financial Reporting
A company’s internal control over financial reporting is a process designed to provide reasonable assurance regarding the reliability of financial reporting and the preparation of financial statements for external purposes in accordance with generally accepted accounting principles. A company’s internal control over financial reporting includes those policies and procedures that (i) pertain to the maintenance of records that, in reasonable detail, accurately and fairly reflect the transactions and dispositions of the assets of the company; (ii) provide reasonable assurance that transactions are recorded as necessary to permit preparation of financial statements in accordance with generally accepted accounting principles, and that receipts and expenditures of the company are being made only in accordance with authorizations of management and directors of the company; and (iii) provide reasonable assurance regarding prevention or timely detection of unauthorized acquisition, use, or disposition of the company’s assets that could have a material effect on the financial statements.
Because of its inherent limitations, internal control over financial reporting may not prevent or detect misstatements. Also, projections of any evaluation of effectiveness to future periods are subject to the risk that controls may become inadequate because of changes in conditions, or that the degree of compliance with the policies or procedures may deteriorate.
79
Critical Audit Matters
The critical audit matter communicated below is a matter arising from the current period audit of the consolidated financial statements that was communicated or required to be communicated to the audit committee and that (i) relates to accounts or disclosures that are material to the consolidated financial statements and (ii) involved our especially challenging, subjective, or complex judgments. The communication of critical audit matters does not alter in any way our opinion on the consolidated financial statements, taken as a whole, and we are not, by communicating the critical audit matter below, providing a separate opinion on the critical audit matter or on the accounts or disclosures to which it relates.
Acquisition Related Contingent Consideration Liability
As described in Notes 1, 2, and 15 to the consolidated financial statements, the fair value of the acquisition related contingent consideration liability was $669.3 million as of December 31, 2023, which consists of the estimated amounts due to The Coca‑Cola Company under the Company’s comprehensive beverage agreements (collectively, the “CBA”) with The Coca‑Cola Company and Coca‑Cola Refreshments USA, Inc. (“CCR”), a wholly owned subsidiary of The Coca‑Cola Company, over the useful life of the related distribution rights. The CBA relates to a multi-year series of transactions, which were completed in October 2017, through which the Company acquired and exchanged distribution territories and manufacturing plants. Pursuant to the CBA, the Company is required to make quarterly acquisition related sub-bottling payments to CCR on a continuing basis in exchange for the grant of exclusive rights to distribute, promote, market and sell the authorized brands of The Coca‑Cola Company and related products in certain distribution territories the Company acquired from CCR. Each reporting period, the Company adjusts its acquisition related contingent consideration liability related to the distribution territories subject to acquisition related sub-bottling payments to fair value by using a probability weighted discounted cash flow model and discounting future expected acquisition related sub-bottling payments required under the CBA using the Company’s estimated weighted average cost of capital (“WACC”). These future expected acquisition related sub-bottling payments extend through the life of the related distribution assets acquired in each distribution territory, which is generally forty years. As a result, the fair value of the acquisition related contingent consideration liability is impacted by the Company’s WACC, management’s estimate of the acquisition related sub-bottling payments that will be made in the future under the CBA, and current acquisition related sub-bottling payments.
The principal considerations for our determination that performing procedures relating to the acquisition related contingent consideration liability is a critical audit matter are (i) the significant judgment by management when estimating the fair value of the acquisition related contingent consideration liability, which in turn led to (ii) a high degree of auditor judgment, subjectivity, and effort in performing procedures and evaluating management’s significant assumptions related to the WACC and current and future acquisition related sub-bottling payments under the CBA, and (iii) the audit effort involved the use of professionals with specialized skill and knowledge.
Addressing the matter involved performing procedures and evaluating audit evidence in connection with forming our overall opinion on the consolidated financial statements. These procedures included testing the effectiveness of controls relating to the valuation of the acquisition related contingent consideration liability. These procedures also included, among others, testing management’s process for determining the fair value of the acquisition related contingent consideration liability; evaluating the appropriateness of the discounted cash flow model; testing the completeness and accuracy of the underlying data used in the model; and evaluating the reasonableness of the significant assumptions related to the WACC and current and future acquisition related sub-bottling payments under the CBA. Evaluating management’s assumptions related to the WACC and current and future acquisition related sub-bottling payments involved evaluating whether the assumptions used were reasonable considering (i) the current and past performance of the distribution territories acquired from CCR, (ii) relevant industry forecasts and macroeconomic conditions, (iii) management’s historical forecasting accuracy, and (iv) whether these assumptions were consistent with evidence obtained in other areas of the audit. Professionals with specialized skill and knowledge were used to assist in evaluating the appropriateness of the discounted cash flow model and evaluating the reasonableness of the WACC.
/s/ PricewaterhouseCoopers LLP
February 21, 2024
We have served as the Company’s auditor since at least 1972. We have not been able to determine the specific year we began serving as auditor of the Company.
80
The financial statement schedule required by Regulation S-X is set forth in response to Item 15 below.
Item 9.Changes in and Disagreements With Accountants on Accounting and Financial Disclosure.
None.
Item 9A.Controls and Procedures.
As of the end of the period covered by this report, the Company carried out an evaluation, under the supervision and with the participation of the Company’s management, including the Company’s Chief Executive Officer and Chief Financial Officer, of the effectiveness of the design and operation of the Company’s “disclosure controls and procedures” (as defined in Rule 13a-15(e) of the Securities Exchange Act of 1934, as amended (the “Exchange Act”)) pursuant to Rule 13a-15(b) of the Exchange Act. Based upon that evaluation, the Chief Executive Officer and the Chief Financial Officer concluded that the Company’s disclosure controls and procedures were effective as of December 31, 2023.
Management’s report on internal control over financial reporting required by Section 404 of the Sarbanes-Oxley Act of 2002 and the report of PricewaterhouseCoopers LLP, an independent registered public accounting firm, on the consolidated financial statements, and its opinion on the effectiveness of the Company’s internal control over financial reporting as of December 31, 2023 are included in Item 8 of this report.
There has been no change in the Company’s internal control over financial reporting during the quarter ended December 31, 2023 that has materially affected, or is reasonably likely to materially affect, the Company’s internal control over financial reporting.
Item 9B.Other Information.
Insider Trading Arrangements
During the quarter ended December 31, 2023, none of our directors or officers (as defined in Rule 16a-1(f) of the Exchange Act) adopted terminated
Item 9C.Disclosure Regarding Foreign Jurisdictions that Prevent Inspections.
Not applicable.
81
PART III
Item 10.Directors, Executive Officers and Corporate Governance.
For information with respect to the executive officers of the Company, see “Information About Our Executive Officers” included as a separate item at the end of Part I of this report, which is incorporated herein by reference. For information with respect to the directors of the Company, see “Proposal 1: Election of Directors” in the definitive proxy statement for the Company’s 2024 Annual Meeting of Stockholders (the “2024 Proxy Statement”), which is incorporated herein by reference. For information with respect to the Audit Committee of the Board of Directors, see the “Corporate Governance – Board Committees” section of the 2024 Proxy Statement, which is incorporated herein by reference.
The Company has adopted a Code of Ethics for Senior Financial Officers (the “Code of Ethics”), which is intended to qualify as a “code of ethics” within the meaning of Item 406 of Regulation S-K of the Exchange Act. The Code of Ethics applies to the Company’s principal executive officer, principal financial officer, principal accounting officer and persons performing similar functions. The Code of Ethics is available on the Company’s website at www.cokeconsolidated.com.
The Company will disclose information pertaining to any amendment to, or waiver from, the provisions of the Code of Ethics that apply to the Company’s principal executive officer, principal financial officer, principal accounting officer or persons performing similar functions and that relate to any element of the Code of Ethics enumerated in the SEC rules and regulations by posting this information on the Company’s website, www.cokeconsolidated.com. The information on the Company’s website or linked to or from the Company’s website is not incorporated by reference into, and does not constitute a part of, this report or any other documents the Company files with, or furnishes to, the SEC.
Item 11.Executive Compensation.
For information with respect to executive and director compensation, see the “Compensation Discussion and Analysis,” “Executive Compensation Tables,” “Consideration of Risk Related to Compensation Programs,” “Compensation Committee Interlocks and Insider Participation,” “Compensation Committee Report” and “Director Compensation” sections of the 2024 Proxy Statement, which are incorporated herein by reference.
Item 12.Security Ownership of Certain Beneficial Owners and Management and Related Stockholder Matters.
For information with respect to security ownership of certain beneficial owners and management, see the “Principal Stockholders” and “Security Ownership of Directors, Director Nominees and Executive Officers” sections of the 2024 Proxy Statement, which are incorporated herein by reference. For information with respect to securities authorized for issuance under the Company’s equity compensation plans, see the “Equity Compensation Plan Information” section of the 2024 Proxy Statement, which is incorporated herein by reference.
Item 13.Certain Relationships and Related Transactions, and Director Independence.
For information with respect to certain relationships and related transactions, see the “Corporate Governance – Policy for Review of Related Person Transactions” and “Corporate Governance – Related Person Transactions” sections of the 2024 Proxy Statement, which are incorporated herein by reference. For information with respect to director independence, see the “Corporate Governance – Director Independence” section of the 2024 Proxy Statement, which is incorporated herein by reference.
Item 14.Principal Accountant Fees and Services.
For information with respect to principal accountant fees and services, see “Proposal 2: Ratification of the Appointment of Independent Registered Public Accounting Firm” in the 2024 Proxy Statement, which is incorporated herein by reference.
82
PART IV
Item 15.Exhibits and Financial Statement Schedules.
(a)List of documents filed as part of this report.
1.Financial Statements
2.Financial Statement Schedule
The Financial Statement Schedule included under Item 15 hereof, as required for the years ended December 31, 2023, December 31, 2022 and December 31, 2021, consisted of the following:
All other financial statements and financial statement schedules not listed have been omitted because the required information is included in the consolidated financial statements or the notes thereto, or is not applicable or required.
3.Listing of Exhibits
The agreements included in the following exhibits to this report are included to provide information regarding their terms and are not intended to provide any other factual or disclosure information about the Company or the other parties to the agreements. Some of the agreements contain representations and warranties by each of the parties to the applicable agreements. These representations and warranties have been made solely for the benefit of the other parties to the applicable agreements and:
•should not in all instances be treated as categorical statements of fact, but rather as a way of allocating the risk to one of the parties if those statements prove to be inaccurate;
•may have been qualified by disclosures that were made to the other party in connection with the negotiation of the applicable agreement, which disclosures are not necessarily reflected in the agreement;
•may apply standards of materiality in a way that is different from what may be viewed as material to you or other investors; and
•were made only as of the date of the applicable agreement or such other date or dates as may be specified in the agreement and are subject to more recent developments.
Accordingly, these representations and warranties may not describe the actual state of affairs as of the date they were made or at any other time.
83
EXHIBIT INDEX
| Exhibit No. | Description | Incorporated by Reference or Filed/Furnished Herewith | ||||||||||||
| 3.1 | Exhibit 3.1 to the Company’s Quarterly Report on Form 10-Q for the quarter ended July 2, 2017 (File No. 0‑9286). | |||||||||||||
| 3.2 | Exhibit 3.1 to the Company’s Current Report on Form 8-K filed on January 2, 2019 (File No. 0-9286). | |||||||||||||
| 3.3 | Exhibit 3.3 to the Company’s Quarterly Report on Form 10-Q for the quarter ended June 30, 2023 (File No. 0-9286). | |||||||||||||
| 3.4 | Exhibit 3.2 to the Company’s Current Report on Form 8-K filed on January 2, 2019 (File No. 0-9286). | |||||||||||||
| 4.1 | Filed herewith. | |||||||||||||
| 4.2 | Exhibit 4.1 to the Company’s Current Report on Form 8-K filed on February 19, 2019 (File No. 0‑9286). | |||||||||||||
| 4.3 | Exhibit 4.2 to the Company’s Annual Report on Form 10-K for the fiscal year ended December 29, 2002 (File No. 0‑9286). | |||||||||||||
| 4.4 | Exhibit 4.1 to the Company’s Current Report on Form 8-K filed on November 25, 2015 (File No. 0‑9286). | |||||||||||||
| 4.5 | Exhibit 4.2 to the Company’s Current Report on Form 8-K filed on November 25, 2015 (File No. 0‑9286). | |||||||||||||
| 4.6 | Exhibit 4.4 to the Company’s Registration Statement on Form S-3 filed on December 15, 2020 (File No. 333-251358). | |||||||||||||
| 10.1 | Exhibit 10.1 to the Company’s Current Report on Form 8-K filed on July 13, 2021 (File No. 0-9286). | |||||||||||||
| 10.2 | Exhibit 10.2 to the Company’s Annual Report on Form 10-K for the fiscal year ended December 31, 2022 (File No. 0‑9286). | |||||||||||||
| 10.3 | Exhibit 10.2 to the Company’s Current Report on Form 8-K filed on July 13, 2021 (File No. 0-9286). | |||||||||||||
| 10.4 | Exhibit 10.1 to the Company’s Current Report on Form 8-K filed on January 20, 2017 (File No. 0‑9286). | |||||||||||||
| 10.5 | Exhibit 10.1 to the Company’s Current Report on Form 8-K filed on July 25, 2018 (File No. 0‑9286). | |||||||||||||
| 10.6 | Exhibit 10.1 to the Company’s Current Report on Form 8-K filed on March 14, 2018 (File No. 0‑9286). | |||||||||||||
| 10.7 | Exhibit 10.2 to the Company’s Current Report on Form 8-K filed on July 25, 2018 (File No. 0‑9286). | |||||||||||||
| 10.8 | Exhibit 10.1 to the Company’s Current Report on Form 8-K filed on February 5, 2019 (File No. 0‑9286). | |||||||||||||
| 10.9 | Exhibit 10.1 to the Company’s Current Report on Form 8-K filed on February 5, 2019 (File No. 0‑9286). | |||||||||||||
84
| Exhibit No. | Description | Incorporated by Reference or Filed/Furnished Herewith | ||||||||||||
| 10.10** | Exhibit 10.1 to the Company’s Current Report on Form 8-K filed on November 2, 2015 (File No. 0‑9286). | |||||||||||||
| 10.11** | Exhibit 10.17 to the Company’s Annual Report on Form 10-K for the fiscal year ended December 30, 2018 (File No. 0‑9286). | |||||||||||||
| 10.12** | Exhibit 10.2 to the Company’s Quarterly Report on Form 10-Q/A for the quarter ended July 3, 2016 (File No. 0‑9286). | |||||||||||||
| 10.13** | Exhibit 10.3 to the Company’s Quarterly Report on Form 10-Q/A for the quarter ended July 3, 2016 (File No. 0‑9286). | |||||||||||||
| 10.14** | Exhibit 10.4 to the Company’s Quarterly Report on Form 10-Q for the quarter ended April 2, 2017 (File No. 0‑9286). | |||||||||||||
| 10.15 | Exhibit 10.3 to the Company’s Quarterly Report on Form 10-Q for the quarter ended September 27, 2020 (File No. 0‑9286). | |||||||||||||
| 10.16** | Exhibit 10.71 to the Company’s Annual Report on Form 10-K for the fiscal year ended December 31, 2017 (File No. 0‑9286). | |||||||||||||
| 10.17 | Exhibit 10.1 to the Company’s Current Report on Form 8-K filed on April 4, 2017 (File No. 0‑9286). | |||||||||||||
| 10.18 | Exhibit 10.2 to the Company’s Current Report on Form 8-K filed on April 4, 2017 (File No. 0‑9286). | |||||||||||||
| 10.19** | Exhibit 10.5 to the Company’s Quarterly Report on Form 10-Q for the quarter ended April 2, 2017 (File No. 0‑9286). | |||||||||||||
| 10.20** | Exhibit 10.6 to the Company’s Quarterly Report on Form 10-Q for the quarter ended April 2, 2017 (File No. 0‑9286). | |||||||||||||
| 10.21** | Exhibit 10.1 to the Company’s Quarterly Report on Form 10-Q for the quarter ended July 2, 2017 (File No. 0‑9286). | |||||||||||||
| 10.22** | Exhibit 10.72 to the Company’s Annual Report on Form 10-K for the fiscal year ended December 31, 2017 (File No. 0‑9286). | |||||||||||||
| 10.23** | Exhibit 10.74 to the Company’s Annual Report on Form 10-K for the fiscal year ended December 31, 2017 (File No. 0‑9286). | |||||||||||||
| 10.24** | Exhibit 10.1 to the Company’s Quarterly Report on Form 10-Q for the quarter ended July 1, 2018 (File No. 0‑9286). | |||||||||||||
| 10.25** | Exhibit 10.5 to the Company’s Quarterly Report on Form 10-Q for the quarter ended September 30, 2018 (File No. 0‑9286). | |||||||||||||
| 10.26*** | Exhibit 10.3 to the Company’s Quarterly Report on Form 10-Q for the quarter ended September 29, 2019 (File No. 0‑9286). | |||||||||||||
85
| Exhibit No. | Description | Incorporated by Reference or Filed/Furnished Herewith | ||||||||||||
| 10.27 | Exhibit 10.30 to the Company’s Annual Report on Form 10-K for the fiscal year ended December 31, 2021 (File No. 0‑9286). | |||||||||||||
| 10.28** | Exhibit 10.7 to the Company’s Quarterly Report on Form 10-Q for the quarter ended April 2, 2017 (File No. 0‑9286). | |||||||||||||
| 10.29 | Exhibit 10.2 to the Company’s Quarterly Report on Form 10-Q for the quarter ended July 2, 2017 (File No. 0‑9286). | |||||||||||||
| 10.30 | Exhibit 10.73 to the Company’s Annual Report on Form 10-K for the fiscal year ended December 31, 2017 (File No. 0‑9286). | |||||||||||||
| 10.31 | Exhibit 10.1 to the Company’s Current Report on Form 8-K filed on February 19, 2009 (File No. 0‑9286). | |||||||||||||
| 10.32 | Exhibit 10.1 to the Company’s Current Report on Form 8-K filed on January 3, 2020 (File No. 0‑9286). | |||||||||||||
| 10.33+ | Exhibit 10.40 to the Company’s Annual Report on Form 10-K for the fiscal year ended December 29, 2019 (File No. 0‑9286). | |||||||||||||
| 10.34 | Exhibit 10.2 to the Company’s Current Report on Form 8-K filed on March 23, 2022 (File No. 0-9286). | |||||||||||||
| 10.35* | Exhibit 10.41 to the Company’s Annual Report on Form 10-K for the fiscal year ended December 29, 2019 (File No. 0‑9286). | |||||||||||||
| 10.36* | Exhibit 10.1 to the Company’s Quarterly Report on Form 10-Q for the quarter ended April 2, 2021 (File No. 0-9286). | |||||||||||||
| 10.37* | Exhibit 10.1 to the Company’s Quarterly Report on Form 10-Q for the quarter ended September 29, 2023 (File No. 0-9286). | |||||||||||||
| 10.38* | Exhibit 10.42 to the Company’s Annual Report on Form 10-K for the fiscal year ended December 29, 2019 (File No. 0‑9286). | |||||||||||||
| 10.39 * | Exhibit 10.2 to the Company’s Quarterly Report on Form 10-Q for the quarter ended September 29, 2023 (File No. 0-9286). | |||||||||||||
| 10.40* | Exhibit 10.2 to the Company’s Quarterly Report on Form 10-Q for the quarter ended July 4, 2010 (File No. 0‑9286). | |||||||||||||
| 10.41* | Exhibit 10.31 to the Company’s Annual Report on Form 10-K for the fiscal year ended January 1, 2012 (File No. 0‑9286). | |||||||||||||
| 10.42* | Exhibit 10.56 to the Company’s Annual Report on Form 10-K for the fiscal year ended December 30, 2018 (File No. 0‑9286). | |||||||||||||
| 10.43* | Exhibit 10.2 to the Company’s Quarterly Report on Form 10-Q for the quarter ended April 2, 2021 (File No. 0-9286). | |||||||||||||
86
| Exhibit No. | Description | Incorporated by Reference or Filed/Furnished Herewith | ||||||||||||
| 10.44* | Exhibit 10.2 to the Company’s Quarterly Report on Form 10-Q for the quarter ended April 1, 2022 (File No. 0‑9286). | |||||||||||||
| 10.45* | Exhibit 10.47 to the Company’s Annual Report on Form 10-K for the fiscal year ended December 31, 2021 (File No. 0‑9286). | |||||||||||||
| 10.46* | Exhibit 10.58 to the Company’s Annual Report on Form 10-K for the fiscal year ended December 30, 2018 (File No. 0‑9286). | |||||||||||||
| 10.47* | Exhibit 10.4 to the Company’s Quarterly Report on Form 10-Q for the quarter ended April 1, 2007 (File No. 0‑9286). | |||||||||||||
| 10.48* | Exhibit 10.32 to the Company’s Annual Report on Form 10-K for the fiscal year ended December 28, 2008 (File No. 0‑9286). | |||||||||||||
| 10.49* | Exhibit 10.1 to the Company’s Quarterly Report on Form 10-Q for the quarter ended March 30, 2014 (File No. 0‑9286). | |||||||||||||
| 10.50* | Exhibit 10.1 to the Company’s Quarterly Report on Form 10-Q for the quarter ended April 1, 2022 (File No. 0‑9286). | |||||||||||||
| 10.51* | Appendix A to the Company’s Definitive Proxy Statement on Schedule 14A filed on March 26, 2018 (File No. 0‑9286). | |||||||||||||
| 10.52* | Exhibit 10.3 to the Company’s Quarterly Report on Form 10-Q for the quarter ended September 29, 2023 (File No. 0-9286). | |||||||||||||
| 10.53* | Exhibit 10.1 to the Company’s Quarterly Report on Form 10-Q for the quarter ended September 29, 2019 (File No. 0‑9286). | |||||||||||||
| 10.54* | Exhibit 10.2 to the Company’s Quarterly Report on Form 10-Q for the quarter ended September 29, 2019 (File No. 0‑9286). | |||||||||||||
| 10.55* | Exhibit 10.24 to the Company’s Annual Report on Form 10-K for the fiscal year ended January 1, 2006 (File No. 0‑9286). | |||||||||||||
| 10.56* | Exhibit 10.1 to the Company’s Current Report on Form 8-K filed on March 6, 2020 (File No. 0‑9286). | |||||||||||||
| 10.57* | Exhibit 10.1 to the Company’s Quarterly Report on Form 10-Q for the quarter ended July 1, 2022 (File No. 0‑9286). | |||||||||||||
| 19 | Exhibit 99 to the Company’s Quarterly Report on Form 10-Q for the quarter ended September 29, 2023 (File No. 0-9286). | |||||||||||||
| 21 | Filed herewith. | |||||||||||||
| 23 | Filed herewith. | |||||||||||||
| 31.1 | Filed herewith. | |||||||||||||
| 31.2 | Filed herewith. | |||||||||||||
| 32 | Furnished herewith. | |||||||||||||
87
| Exhibit No. | Description | Incorporated by Reference or Filed/Furnished Herewith | ||||||||||||
| 97* | Exhibit 10.4 to the Company’s Quarterly Report on Form 10-Q for the quarter ended September 29, 2023 (File No. 0-9286). | |||||||||||||
| 101.INS | Inline XBRL Instance Document – the instance document does not appear in the Interactive Data File because its XBRL tags are embedded within the Inline XBRL document. | Filed herewith. | ||||||||||||
| 101.SCH | Inline XBRL Taxonomy Extension Schema Document. | Filed herewith. | ||||||||||||
| 101.CAL | Inline XBRL Taxonomy Extension Calculation Linkbase Document. | Filed herewith. | ||||||||||||
| 101.DEF | Inline XBRL Taxonomy Extension Definition Linkbase Document. | Filed herewith. | ||||||||||||
| 101.LAB | Inline XBRL Taxonomy Extension Label Linkbase Document. | Filed herewith. | ||||||||||||
| 101.PRE | Inline XBRL Taxonomy Extension Presentation Linkbase Document. | Filed herewith. | ||||||||||||
| 104 | Cover Page Interactive Data File – the cover page interactive data file does not appear in the Interactive Data File because its XBRL tags are embedded within the Inline XBRL document. | Filed herewith. | ||||||||||||
| * | Indicates a management contract or compensatory plan or arrangement. | ||||
| ** | Certain portions of this exhibit have been omitted pursuant to a request for confidential treatment filed with the SEC. | ||||
| *** | Certain confidential portions of this exhibit have been redacted in accordance with Item 601(b)(10) of Regulation S‑K. | ||||
| + | Certain schedules and similar supporting attachments to this agreement have been omitted, and the Company agrees to furnish supplemental copies of any such schedules and similar supporting attachments to the SEC upon request. | ||||
(b)Exhibits.
See Item 15(a)(3) above.
(c)Financial Statement Schedules.
See Item 15(a)(2) above.
Item 16.Form 10-K Summary.
None.
88
Schedule II
COCA-COLA CONSOLIDATED, INC.
VALUATION AND QUALIFYING ACCOUNTS AND RESERVES
Allowance for Doubtful Accounts
| Fiscal Year | ||||||||||||||||||||
| (in thousands) | 2023 | 2022 | 2021 | |||||||||||||||||
| Beginning balance - allowance for doubtful accounts | $ | $ | $ | |||||||||||||||||
| Additions charged to expenses and as a reduction to net sales | ||||||||||||||||||||
| Deductions | ( | ( | ( | |||||||||||||||||
| Ending balance - allowance for doubtful accounts | $ | $ | $ | |||||||||||||||||
Deferred Income Tax Valuation Allowance
| Fiscal Year | ||||||||||||||||||||
| (in thousands) | 2023 | 2022 | 2021 | |||||||||||||||||
| Beginning balance - valuation allowance for deferred tax assets | $ | $ | $ | |||||||||||||||||
| Additions charged to costs and expenses | ||||||||||||||||||||
| Deductions credited to expense | ( | ( | ||||||||||||||||||
| Ending balance - valuation allowance for deferred tax assets | $ | $ | $ | |||||||||||||||||
89
SIGNATURES
Pursuant to the requirements of Section 13 or 15(d) of the Securities Exchange Act of 1934, the registrant has duly caused this report to be signed on its behalf by the undersigned, thereunto duly authorized.
| COCA-COLA CONSOLIDATED, INC. (REGISTRANT) | ||||||||||||||
| Date: February 21, 2024 | By: | /s/ J. Frank Harrison, III | ||||||||||||
| J. Frank Harrison, III | ||||||||||||||
| Chairman of the Board of Directors | ||||||||||||||
| and Chief Executive Officer | ||||||||||||||
Pursuant to the requirements of the Securities Exchange Act of 1934, this report has been signed below by the following persons on behalf of the registrant and in the capacities and on the dates indicated.
| Signature | Title | Date | ||||||||||||||||||
| By: | /s/ J. Frank Harrison, III | Chairman of the Board of Directors and | February 21, 2024 | |||||||||||||||||
| J. Frank Harrison, III | Chief Executive Officer | |||||||||||||||||||
| (Principal Executive Officer) | ||||||||||||||||||||
| By: | /s/ F. Scott Anthony | Executive Vice President and Chief Financial Officer | February 21, 2024 | |||||||||||||||||
| F. Scott Anthony | (Principal Financial Officer) | |||||||||||||||||||
| By: | /s/ Matthew J. Blickley | Senior Vice President, Financial Planning and | February 21, 2024 | |||||||||||||||||
| Matthew J. Blickley | Chief Accounting Officer | |||||||||||||||||||
| (Principal Accounting Officer) | ||||||||||||||||||||
| By: | /s/ Elaine Bowers Coventry | Director | February 21, 2024 | |||||||||||||||||
| Elaine Bowers Coventry | ||||||||||||||||||||
| By: | /s/ Sharon A. Decker | Director | February 21, 2024 | |||||||||||||||||
| Sharon A. Decker | ||||||||||||||||||||
| By: | /s/ Morgan H. Everett | Vice Chair of the Board of Directors | February 21, 2024 | |||||||||||||||||
| Morgan H. Everett | ||||||||||||||||||||
| By: | /s/ James R. Helvey, III | Director | February 21, 2024 | |||||||||||||||||
| James R. Helvey, III | ||||||||||||||||||||
| By: | /s/ William H. Jones | Director | February 21, 2024 | |||||||||||||||||
| William H. Jones | ||||||||||||||||||||
| By: | /s/ Umesh M. Kasbekar | Non-Executive Vice Chairman of the Board of Directors | February 21, 2024 | |||||||||||||||||
| Umesh M. Kasbekar | ||||||||||||||||||||
| By: | /s/ David M. Katz | Director | February 21, 2024 | |||||||||||||||||
| David M. Katz | ||||||||||||||||||||
| By: | /s/ James H. Morgan | Director | February 21, 2024 | |||||||||||||||||
| James H. Morgan | ||||||||||||||||||||
| By: | /s/ Dennis A. Wicker | Lead Independent Director | February 21, 2024 | |||||||||||||||||
| Dennis A. Wicker | ||||||||||||||||||||
| By: | /s/ Richard T. Williams | Director | February 21, 2024 | |||||||||||||||||
| Richard T. Williams | ||||||||||||||||||||
90