UNITED STATES SECURITIES AND EXCHANGE COMMISSION
Washington, D.C. 20549
Form 10-K
| Annual Report Pursuant to Section 13 or 15(d) of the Securities Exchange Act of 1934 | |||||
or
| Transition report Pursuant to Section 13 or 15(d) of the Securities Exchange Act of 1934 | |||||
For the fiscal year ended | Commission file number: | |||||||

(Exact name of Registrant as specified in its charter)
| (State of Incorporation) | (I.R.S. Employer Identification No.) | |||||||
| (Zip Code) | ||||||||
| (Address of Principal Executive Offices) | ||||||||
Registrant’s telephone number, including area code:
Securities registered pursuant to Section 12(b) of the Act:
| Title of Each Class | Trading Symbol | Name of exchange on which registered | ||||||
Securities registered pursuant to Section 12(g) of the Act:
None
Indicate by check mark if the registrant is a well-known seasoned issuer, as defined in Rule 405 of the Securities Act. Yes ¨ No þ
Indicate by check mark if the registrant is not required to file reports pursuant to Section 13 or Schedule 15(d) of the Act. Yes ¨ No þ
Indicate by check mark whether the Registrant (1) has filed all reports required to be filed by Section 13 or 15(d) of the Securities Exchange Act of 1934 during the preceding 12 months (or for such shorter period that the registrant was required to file such reports), and (2) has been subject to such filing requirements for the past 90 days. Yes þ No ¨
Indicate by check mark whether the registrant has submitted electronically, every Interactive Data File required to be submitted pursuant to Rule 405 of Regulation S-T during the preceding 12 months (or for such shorter period that the registrant was required to submit and post such files). Yes þ No ¨
Indicate by check mark whether the registrant is a large accelerated filer, an accelerated filer, a non-accelerated filer, or a smaller reporting company. See the definitions of “large accelerated filer,” “accelerated filer,” and “smaller reporting company” in Rule 12b-2 of the Exchange Act. (Check one):
Large accelerated filer ¨ Accelerated filer þ Non-accelerated filer ¨ Smaller reporting company ☐ Emerging growth company ☐
If an emerging growth company, indicate by check mark if the registrant has elected not to use the extended transition period for complying with any new or revised financial accounting standards provided pursuant to Section 13(a) of the Exchange Act. ¨
Indicate by check mark whether the registrant has filed a report on and attestation to its management’s assessment of the effectiveness of its internal control over financial reporting under Section 404(b) of the Sarbanes-Oxley Act (15 U.S.C. 7262(b)) by the registered public accounting firm that prepared or issued its audit report. ☑
If securities are registered pursuant to Section 12(b) of the Act, indicate by check mark whether the financial statements of the registrant included in the filing reflect the correction of an error to previously issued financial statements. þ
Indicate by check mark whether any of those error corrections are restatements that required a recovery analysis of incentive-based compensation received by any of the registrant’s executive officers during the relevant recovery period pursuant to §240.10D-1(b). ☐
Indicate by check mark whether the registrant is a shell company (as defined in Rule 12b-2 of the Exchange Act). Yes ☐ No þ
The aggregate market value of the voting and non-voting common equity held by non-affiliates computed by reference to the price at which the common equity was last sold on June 30, 2023, was $367,332,211 .
As of March 12, 2024, 33,898,372 shares of Common Stock of the Registrant were outstanding.
Documents Incorporated by Reference
COMMERCIAL VEHICLE GROUP, INC.
Annual Report on Form 10-K
Table of Contents
| Page | ||||||||
| PART I | ||||||||
| Item 1. | ||||||||
| Item 1A. | ||||||||
| Item 1B. | ||||||||
Item 1C | ||||||||
| Item 2. | ||||||||
| Item 3. | ||||||||
| Item 4. | ||||||||
| PART II | ||||||||
| Item 5. | ||||||||
| Item 6. | ||||||||
| Item 7. | ||||||||
| Item 7A. | ||||||||
| Item 8. | ||||||||
| Item 9. | ||||||||
| Item 9A. | ||||||||
| Item 9B. | ||||||||
| Item 9C. | ||||||||
| PART III | ||||||||
| Item 10. | ||||||||
| Item 11. | ||||||||
| Item 12. | ||||||||
| Item 13. | ||||||||
| Item 14. | ||||||||
| PART IV | ||||||||
| Item 15. | ||||||||
| Item 16. | ||||||||
i
CERTAIN DEFINITIONS
All references in this Annual Report on Form 10-K to the “Company”, “Commercial Vehicle Group”, “CVG”, “we”, “us”, and “our” refer to Commercial Vehicle Group, Inc. and its consolidated subsidiaries (unless the context otherwise requires).
FORWARD-LOOKING INFORMATION
This Annual Report on Form 10-K contains forward-looking statements within the meaning of Section 21E of the Securities Exchange Act of 1934, as amended, and Section 27A of the Securities Act of 1933, as amended. For this purpose, any statements contained herein that are not statements of historical fact, including without limitation, certain statements under “Item 1 - Business” and “Item 7 - Management’s Discussion and Analysis of Financial Condition and Results of Operations” and located elsewhere herein regarding industry outlook, the Company’s expectations for future periods with respect to its plans to improve financial results, and the future of the Company’s end markets may be deemed to be forward-looking statements. We are subject to risks and uncertainties that may cause actual results to differ materially from those suggested by the forward-looking statements in this report. Factors that could cause or contribute to such differences include, but are not limited to global supply chain constraints, changes in the Class 8 and Class 5-7 North America truck build rates, performance of the global construction equipment business, the Company’s prospects in the electrical systems, industrial automation and electric vehicle markets, the Company’s initiatives to address customer needs, organic growth, the Company’s strategic plans and plans to focus on certain segments, competition faced by the Company, volatility in and disruption to the global economic environment, including inflation and labor shortages, financial covenant compliance, anticipated effects of acquisitions, production of new products, plans for capital expenditures and our results of operations or financial position and liquidity, may be deemed to be forward-looking statements. Without limiting the foregoing, the words “believe”, “anticipate”, “plan”, “expect”, “intend”, “will”, “should”, “could”, “would”, “project”, “continue”, “likely”, and similar expressions, as they relate to us, are intended to identify forward-looking statements. The important factors discussed in “Item 1A - Risk Factors”, among others, could cause actual results to differ materially from those indicated by forward-looking statements made herein and presented elsewhere by management from time to time. Such forward-looking statements represent management’s current expectations and are inherently uncertain. Investors are warned that actual results may differ from management’s expectations. Additionally, various economic and competitive factors could cause actual results to differ materially from those discussed in such forward-looking statements, including, but not limited to, factors which are outside our control.
Any forward-looking statement that we make in this report speaks only as of the date of such statement, and we undertake no obligation to update any forward-looking statement or to publicly announce the results of any revision to any of those statements to reflect future events or developments. Comparisons of results for current and any prior periods are not intended to express any future trends or indications of future performance, unless specifically expressed as such, and should only be viewed as historical data.
ii
PART I
Item 1. Business
COMPANY OVERVIEW
Commercial Vehicle Group, Inc. and its subsidiaries, is a global provider of systems, assemblies and components to the global commercial vehicle market, the electric vehicle market, and the industrial automation markets. We deliver real solutions to complex design, engineering and manufacturing problems while creating positive change for our customers, industries, and communities we serve. References herein to the "Company", "CVG", "we", "our", or "us" refer to Commercial Vehicle Group, Inc. and its subsidiaries.
We have manufacturing operations in the United States, Mexico, China, United Kingdom, Czech Republic, Ukraine, Morocco, Thailand, India and Australia. Our products are primarily sold in North America, Europe, and the Asia-Pacific region.
We primarily manufacture customized products to meet the requirements of our customer. We believe our products are used by a majority of the North American Commercial Truck manufacturers, many construction vehicle original equipment manufacturers ("OEMs"), parts and service dealers, distributors, as well as top e-commerce retailers.
Our Long-term Strategy
Refer to Item 7, Management's Discussion and Analysis of Financial Condition and Results of Operations.
SEGMENTS
Our segments offer various products which are sold into many end user markets such as internal combustion commercial vehicles, electric vehicles, construction equipment, power sports, industrial automation and military. Certain of our facilities manufacture and sell products through multiple business segments. The products produced by each of our segments are more specifically described below.
The Vehicle Solutions segment designs, manufactures and sells the following products:
•Commercial vehicle seats for the global commercial vehicle markets including heavy duty trucks, medium duty trucks, last mile delivery trucks and vans, construction and agriculture equipment in North America, Europe and Asia-Pacific. This segment includes a portion of the company’s activities in the electric vehicle market.
•Plastic & Trim components primarily for the North America commercial vehicle market and power sports markets; and Cab structures for the North American medium-duty/heavy-duty ("MD/HD") truck market.
The Electrical Systems segment designs, manufactures and sells the following products:
•Cable and harness assemblies for both high and low voltage applications, control boxes, dashboard assemblies and design and engineering for these applications.
•The end markets for these products are construction, agricultural, industrial, automotive (both internal combustion and electric vehicles), truck, mining, rail, marine, power generation and the military/ defense industries in North America, Europe and Asia-Pacific.
The Aftermarket & Accessories segment designs, manufactures and sells the following products:
•Seats and components sold into the commercial vehicle channels that provide repair and refurbishing. These channels include Original Equipment Service ("OES") centers and retail distributors, and are spread across North America, Europe and Asia-Pacific.
•Commercial vehicle accessories including wipers, mirrors, and sensors. These products are sold both as Original Equipment and as repair products.
•Office seats primarily sold into the commercial and home office furniture distribution channels in Europe and Asia-Pacific.
The Industrial Automation segment designs, manufactures and sells the following products:
•Warehouse automation subsystems including control panels, electro-mechanical assemblies, cable assemblies, and power and communication solutions.
•The end markets for these products primarily include e-commerce, warehouse integration, transportation and the military/defense industry.
1
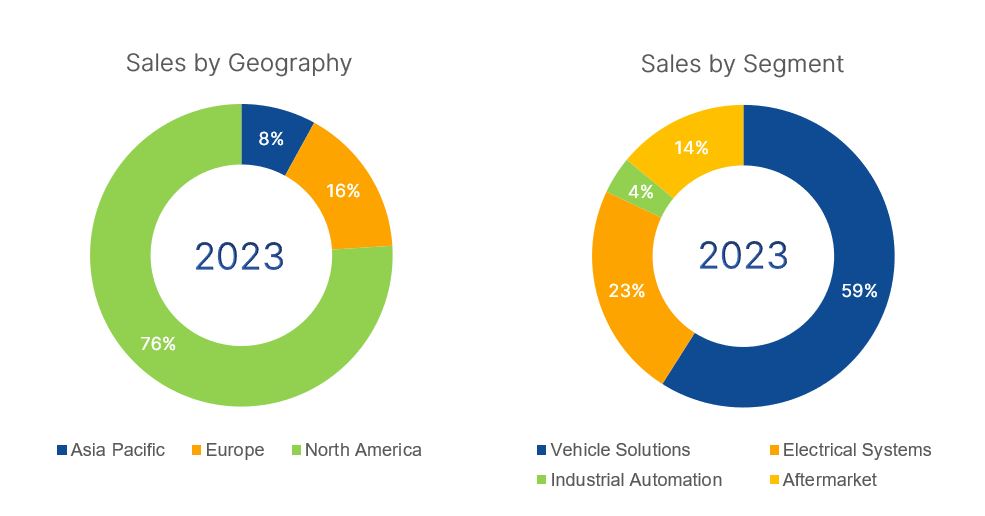
The charts below display CVG's net sales by segment and geography for the year ended December 31, 2023.
VEHICLE SOLUTIONS SEGMENT OVERVIEW
Vehicle Solutions Segment Products
Set forth below is a brief description of our products manufactured in the Vehicle Solutions Segment and their applications.
Seats and Seating Systems. We design, engineer and produce seats for MD/HD truck, bus, construction, agriculture and military markets. Our seats are primarily sold fully-assembled and ready for installation. We offer a wide range of seats that include mechanical and air suspension seats, static seats, bus seats and military seats. As a result of our product design and product technology, we believe we are a leader in designing seats with convenience and safety features. Our seats are designed to achieve a high level of operator comfort by adding a wide range of manual and power features such as lumbar support, cushion and back bolsters, and leg and thigh support. Our seats are built to meet customer requirements in low volumes and produced in numerous feature combinations to form a full-range product line with a wide range of price points.
Our seats are sold under multiple brands, including KAB Seating™, National Seating™, Bostrom Seating®, and Stratos™.
Plastic Assemblies and Components. We design, engineer and produce plastic components and assemblies for MD/HD, power sports vehicles, specialty vehicle applications, and diversified markets. We offer thermoformed products, injection molded products, reaction injection molded products (RIM), and decorated / hydrographic finished products. We also assemble components and fabrics to these formed plastic parts and deliver complete subassemblies in bulk and in sequence. Our principal products in this category include:
Molded Products. Our molded products include both large and small parts. Specific components include vinyl or cloth-covered appliqués ranging from a traditional cut and sew approach to a contemporary molded styling theme, armrests, map pocket compartments, and sound-reducing insulation.
Instrument Panels. We produce and assemble instrument panels that can be integrated with the rest of the interior trim. The instrument panel is a complex system of coverings and foam, plastic and metal parts designed to house various components and act as a safety device for the vehicle occupant.
Plastics Decorating and Finishing. We offer customers a wide variety of cost-effective finishes in paint, ultra violet, hard coating and customized industrial hydrographic films (simulated appearance of wood grain, carbon fiber, brushed metal, marbles, camouflage and custom patterns), and other interior and exterior finishes.
2
Cab Interiors. We design, manufacture and provide a variety of interior design products including armrests, grab handles, storage systems, floor coverings, floor mats, sleeper bunks, headliners, wall panels, and privacy curtains that can be part of the overall cab structure or standalone assemblies depending on the customer application.
Our plastic products are sold under several brand names including FinishTEK™ and AdvancTEK™. CVG sold its FinishTEK business effective January 31, 2024.
Cab Structures. We design, manufacture and assemble complete cab structures. Our cab structures, which are manufactured from both steel and aluminum, are delivered fully assembled and primed for paint.
ELECTRICAL SYSTEMS SEGMENT OVERVIEW
Electrical Systems Segment Products
Wire Harness Assemblies. We design, engineer and produce a wide range of high and low voltage electrical wire systems for vehicles and subsystems, which include, Ethernet, battery cables and power distribution boxes. Our electrical wire harness assemblies function as the primary electric current carrying devices used to provide electrical interconnections for gauges, lights, control functions, power circuits, powertrain and transmission sensors, emissions systems and other electronic applications on commercial and other vehicles. Our wire harnesses are customized to fit specific end-user requirements and can be complex. Our production capabilities include low and high volume serial production with low and high volume circuitry, RIM (reaction injection molding) and specialized testing. Our engineering and production capabilities include virtual wiring boards, automatic plug insertion stations, system architecture and schematic development and prototyping.
Our electrical systems segment products are sold into the construction, agriculture, industrial, e-commerce and electric vehicles, traditional automotive, mining, rail, military end markets, marine, power generation and the military/defense industries in North America, Europe and Asia-Pacific.
AFTERMARKET & ACCESSORIES SEGMENT OVERVIEW
Aftermarket & Accessories Segment Products
We design, manufacture, and provide a variety of seats, mirrors, wipers and wiper systems sold into the commercial MD/HD truck, military and specialty power sports vehicles, electric vehicle, office and home office markets. These products are sold under various brands including, Bostrom®, National Seating™, Moto Mirror®, KAB Seating™ (for both vehicles and Office markets), Sprague Devices® and RoadWatch®.
Our aftermarket products are primarily sold through the Original Equipment Service (OES) sales channel and direct into the retail aftermarket as replacements for original equipment in North America, Europe and Asia Pacific.
INDUSTRIAL AUTOMATION SEGMENT OVERVIEW
Industrial Automation Segment Products
Electrical Systems, Control Panel Assemblies, and Electro-Mechanical Assemblies. We offer a wide range of material handling equipment, electrical distribution systems, and related assemblies primarily for the e-commerce, warehouse integration, transportation and the military/defense markets. Our principal products in this category include:
Control Panel Assemblies. We offer integrated assemblies and cabinets that are installed in industrial machinery equipment and transportation vehicles and may be integrated with our wire harness assemblies. These components provide the user control over multiple operational functions and features.
Electro-Mechanical Assemblies. We offer electro-mechanical assemblies, including box builds, complex automated and robotic systems, and large multi-cabinet control cabinets with power distribution, communication and cabling. Our service includes mechanical assembly, wire and cable routing, automated wire preparation capabilities, complex configurations, test and custom palletizing and crating solutions.
3
OUR CONSOLIDATED OPERATIONS
Primary Industries Served
Commercial Vehicle Market. Commercial vehicles are used in a wide variety of end markets, including local and long-haul commercial trucking, bus, construction, mining, agricultural, military, industrial, municipal, off-road recreational and specialty vehicle markets. The commercial vehicle supply industry can generally be separated into two categories: (1) sales to OEMs, in which products are sold in relatively large quantities directly for use by OEMs in new commercial and construction vehicles; and (2) aftermarket sales, in which products are sold as replacements to a wide range of original equipment service organizations, wholesalers, retailers and installers. Additionally, we are seeing a trend toward alternate fuel and electric vehicles, middle-mile and last-mile vehicle models.
North American Commercial Truck Market. Purchasers of commercial trucks include fleet operators, owner operators, governmental agencies and industrial end users. Commercial vehicles used for local and long-haul commercial trucking are generally classified by gross vehicle weight. Class 8 vehicles are trucks with gross vehicle weight in excess of 33,000 lbs. and Classes 5 through 7 vehicles are trucks with gross vehicle weight from 16,001 lbs. to 33,000 lbs. Separately, we are seeing changes in e-commerce behaviors that are driving increased demand for middle-mile and last-mile vehicles.
The following describes the major markets within the commercial vehicle market in which the Vehicle Solutions Segment competes:
Class 8 Truck Market. The global Class 8 ("Class 8" or "heavy-duty") truck manufacturing market is concentrated in three primary regions: North America, Europe and Asia-Pacific. The global Class 8 truck market is localized in nature due to the following factors: (1) the prohibitive costs of shipping components from one region to another, (2) the high degree of customization to meet the region-specific demands of end-users, and (3) the ability to meet just-in-time delivery requirements. New Class 8 truck demand is cyclical and is particularly sensitive to economic factors that generate a significant portion of the freight tonnage hauled by commercial vehicles.
Class 5-7 Truck Market. North American Class 5-7 ("Class 5-7" or "medium-duty") includes recreational vehicles, buses and medium-duty trucks. We primarily participate in the Class 6 and 7 portion of the medium-duty truck market. The medium-duty truck market is influenced by overall economic conditions but has historically been less cyclical than the North American Class 8 truck market.
Commercial Truck Aftermarket. Demand for aftermarket products is driven by the quality of OEM parts, the number of vehicles in operation, the average age of the vehicle fleet, the content and value per vehicle, vehicle usage and the average useful life of vehicle parts. Aftermarket sales tend to be at a higher margin. The recurring nature of aftermarket revenue can be expected to provide some insulation to the overall cyclical nature of the industry as it tends to provide a more stable stream of revenues. Brand equity and the extent of a company’s distribution network also contribute to the level of aftermarket sales. We believe CVG has a widely recognized brand portfolio and participates in most retail sales channels including original equipment dealer networks and independent distributors.
Construction Equipment Market. New vehicle demand in the global construction equipment market generally follows certain economic conditions including gross domestic product, infrastructure investment, housing starts, business investment, oil and energy investment and industrial production around the world. Within the construction market, there are two classes of construction equipment markets: the medium and heavy construction equipment market (weighing over 12 metric tons) and the light construction equipment market (weighing below 12 metric tons). We primarily supply OEMs with our wire harness and seating products. Our construction equipment products are primarily used in the medium and heavy construction equipment markets. The platforms that we generally participate in include: cranes, pavers, planers and profilers, dozers, loaders, graders, haulers, tractors, excavators, backhoes, material handling and compactors. Demand in the medium and heavy construction equipment market is typically related to the level of larger-scale infrastructure development projects such as highways, dams, harbors, hospitals, airports and industrial development as well as activity in the mining, forestry and other commodities industries.
Purchasers of medium and heavy construction equipment include construction companies, municipalities, local governments, rental fleet owners, quarrying and mining companies and forestry related industries. Purchasers of light construction equipment include contractors, rental fleet owners, landscapers, logistics companies and farmers.
Military Equipment Market. We supply products for heavy- and medium-payload tactical vehicles and complex military communications equipment over multiple product lines that are used by various defense customers. Military equipment production is particularly sensitive to political and governmental budgetary considerations.
4
Industrial Automation Market. Shifting retailer behavior and consumer expectations are creating a significant need for incremental automation within warehouses and other industrial facilities. Given consumer demands for next-day (and same-day) delivery, there has been a surge in demand for “last mile” urban fulfillment centers, which are typically supported by very large distribution centers located in the outer ring of a city. Additionally, increased throughput volume, a greater variety of order and package types, and more frequent product returns by end consumers, all support the rationale for continued investment in automated solutions by warehouse operators. We supply material handling subsystems incorporated into automated warehouses.
Our Customer Contracts, and Sales and Marketing
Our customers generally source business to us pursuant to written contracts, purchase orders or other commitments (“Commercial Arrangements”) with terms of price, quality, technology, and delivery. Awarded business generally covers the supply of all or a portion of a customer’s production and service requirements for a particular product program rather than the supply of a specific quantity of products. In general, these Commercial Arrangements provide that the customer can terminate them if we do not meet specified quality, delivery and cost requirements. Although these Commercial Arrangements may be terminated at any time by our customers (but generally not by us without advance notice), such terminations have generally been minimal and have not had a material impact on our results of operations.
Our Commercial Arrangements with our OEM customers may provide for an annual prospective productivity price reduction. These productivity price reductions are generally calculated on an annual basis as a percentage of the previous year’s purchases by each customer. Historically, most of these price reductions have been offset by internal cost reductions and through the assistance of our supply base, although no assurances can be given that we will be able to achieve such reductions in the future. The cost reduction is achieved through engineering changes, material cost reductions, logistics savings, reductions in packaging cost, labor efficiencies and other productivity actions.
Our sales and marketing efforts are designed to create customer awareness of our engineering, design and manufacturing capabilities. Our sales and marketing staff work closely with our design and engineering personnel to prepare the materials used for bidding on new business, as well as to provide an interface between us and our key customers. We have sales and marketing personnel located in every major region in which we operate. From time to time, we participate in industry trade shows and advertise in industry publications.
Our Supply Agreements
Our supply agreements generally provide for fixed pricing but do not require us to purchase any specified quantities. Normally we do not carry inventories of raw materials or finished products in excess of what is reasonably required to meet production and shipping schedules, as well as service requirements. Steel, aluminum, petroleum-based products, copper, resin, foam, fabrics, wire and wire components comprise the most significant portion of our raw material costs. We typically purchase steel, copper and petroleum-based products at market prices that are fixed over varying periods of time. Due to the volatility in pricing, we use methods such as market index pricing and competitive bidding to assist in reducing our overall cost. We strive to align our customer pricing and material costs to minimize the impact of price fluctuations. Certain component purchases and suppliers are directed by our customers, so we generally will pass through directly to the customer cost changes from these components. We generally are not dependent on a single supplier or limited group of suppliers for our raw materials.
Competition
Within each of our principal product categories we compete with a variety of independent suppliers and with vertically integrated in-house operations, primarily on the basis of price, breadth of product offerings, product quality, technical expertise, development capability, product delivery and product service.
Manufacturing Processes
We utilize a wide range of manufacturing processes to produce our products. The end markets for our products can be highly specialized and our customers frequently request modified products in low volumes within an expedited delivery timeframe. As a result, we primarily utilize flexible manufacturing cells at our production facilities. Manufacturing cells are clusters of individual manufacturing operations and work stations. This provides flexibility by allowing efficient changes to the number of operations each operator performs. When compared to the more traditional, less flexible assembly line process, cell manufacturing allows us to better maintain our product output consistent with our OEM customers’ requirements and minimize the level of inventory.
5
We have systems in place that allow us to provide complete customized interior kits in returnable containers and disposable dunnage that are delivered in sequence. Several of our manufacturing facilities are strategically located near our customers’ assembly facilities, which facilitates this process and minimizes shipping costs.
We employ just-in-time manufacturing and sourcing in our operations to meet customer requirements for faster deliveries and to minimize our need to carry significant inventory levels. We utilize material systems to manage inventory levels and, in certain locations, we have inventory delivered as often as two times per day from a nearby facility based on the previous day’s order, which reduces the need to carry excess inventory at our facilities.
We strive to maintain a certain portion of temporary labor to improve our ability to flex our costs and throughput as required by fluctuating customer demand. We engage our core employees to assist in making our processes efficient.
Research and Development
Our research and development capabilities offer quality and technologically advanced products to our customers at competitive prices. We offer product styling, product design, specialized simulation and testing and evaluation services that are necessary in today’s global markets. Our capabilities in acoustics, thermal efficiency, benchmarking, multi-axis durability, biomechanics, comfort, prototyping and process prove-out allow us to provide complete integrated solutions.
We engage in global engineering, and research and development activities that improve the reliability, performance and cost-effectiveness of our existing products and support the design, development and testing of new products for existing and new applications. Generally, we work with our customers’ engineering and development teams at the beginning of the design process for new components and assemblies and systems, or the re-engineering process for existing components and assemblies, in order to leverage production efficiency and quality.
Research and development costs for the years ended December 31, 2023, 2022 and 2021 totaled $6.2 million, $7.1 million and $9.1 million, respectively.
Intellectual Property
Our major brands include CVG™, Sprague Devices®, Moto Mirror®, RoadWatch®, KAB Seating™, National Seating™, Bostrom Seating®, Stratos™, and AdvancTEK™. We believe that our brands are valuable but that our business is not dependent on any one brand. We own U.S. federal trademark registrations for several of our product brands.
Environmental
The Company is subject to changing federal, state, and local laws and regulations governing the protection of the environment and occupational health and safety, including laws regulating air emissions, wastewater discharges, generation, storage, handling, use and transportation of hazardous materials; the emission and discharge of hazardous materials into the soil, ground or air; and the health and safety of our colleagues. Stringent fines and penalties may be imposed for noncompliance with these laws. In addition, environmental laws could impose liability for costs associated with investigating and remediating contamination at the Company’s facilities or at third-party facilities at which the Company may arrange for the disposal treatment of hazardous materials.
The Company believes it is in compliance in all material respects, with all applicable environmental laws and the Company is not aware of any noncompliance or obligation to investigate or remediate contamination that could reasonably be expected to result in a material liability. Several of our facilities are either certified as, or are in the process of being certified as ISO 9001, 14000, 14001 or TS16949 (the international environmental management standard) compliant or are developing similar environmental management systems. We have made, and will continue to make, capital and other expenditures to implement such environmental programs and comply with environmental requirements.
The environmental laws continue to be amended and revised to impose stricter obligations, and compliance with future additional environmental requirements could necessitate capital outlays. However, the Company does not believe that these expenditures will ultimately result in a material adverse effect on its financial position or results of operations. The Company cannot predict the precise effect such future requirements, if enacted, would have on the Company. The Company believes that such regulations would be enacted over time and would affect the industry as a whole.
6
Human Capital, Environmental, Social and Governance
As of December 31, 2023, CVG employs approximately 8,200 employees of which 7,700 are permanent employees and 500 are temporary employees. Approximately 6,200 (81%) of the Company's permanent employees are located outside of the United States and 1,500 (19%) are located in the United States. It is customary for the Company to employ temporary employees to both flex up/down to demand rates. Of our permanent workforce, approximately 1,000 (13%) are salaried and the remainder are hourly. As of December 31, 2023, all of the Company's U.S. employees are non-union and a majority of the Company's personnel in Mexico are unionized. Approximately 74% of our European, Asian and Australian operations are represented by some form of shop steward committees.
The Company is committed to establishing and developing a workforce to support our long-term diversification and growth strategy through targeted external recruiting, and internal development and succession planning. We continue to develop our leaders and identify emerging leaders for targeted training opportunities and continue to leverage virtual learning platforms to make training more accessible for our global workforce.
Compensation and Benefits - Our compensation programs reinforce a pay-for-performance philosophy with market-based compensation and benefits that are competitive for the manufacturing sector. Specific programs vary worldwide based on regional practices and benchmarks.
Diversity, Equity and Inclusion - The Company is intentional in its commitment to diversity, equity and inclusion including ensuring a diverse Board of Directors and executive leadership team. Approximately one-third of our current Board is diverse by race or gender and one-fourth of our current executive team – including our President and Chief Executive Officer James Ray – is diverse by race or gender with others bringing diversity of experience, thought and perspective to their leadership roles. Among our global workforce, 49% is female, and among our domestic workforce, 32% is racially diverse.
The Company recognizes the importance of leveraging diversity, equity and inclusion in who we are and how we work. We continue to focus on expanding the diversity of our talent pipeline through our recruiting, development, communication, and retention. We will focus on the role our culture plays in creating the right environment for diverse thinking and inclusive approaches to work. During regular engagements with our leadership teams, we are highlighting how our organizational evolution benefits from a culture of diversity. We are also reestablishing the connection to the communities where our employees live and work, enabling our teams to grow both professionally and personally.
Safety - The safety of our workforce has always been a top priority and the Company is proud of our safety record, which includes three consecutive years of declining recordable incidents and five consecutive years of declining incident rates. Our 2023 full year incident rate of 0.37 is below the industry benchmarks and a 19% decrease year over year while working approximately 72,000 fewer hours.
CVG is committed to operating in an ethical and sustainable manner that benefits all our stakeholders including customers, employees, shareholders and the communities we serve. We have established company-wide environmental, human rights and labor rights policies that outline the Company’s standards for all business operations. More information on these policies can be found on our website under the caption “About Us - CVG Policies,” including highlights of our ongoing Environmental, Social and Governance (“ESG”) efforts related to safety, quality, environmental, community engagement and corporate governance.
AVAILABLE INFORMATION
We maintain a website on the Internet at www.cvgrp.com. We make available free of charge through our website, by way of a hyperlink to a third-party Securities Exchange Commission ("SEC") filing website, our Annual Reports on Form 10-K, quarterly reports on Form 10-Q, current reports on Form 8-K, including exhibits and amendments to those reports electronically filed or furnished pursuant to Section 13(a) or 15(d) of the Exchange Act of 1934. Such information is available as soon as such reports are filed with the SEC. Additionally, our Code of Ethics may be accessed within the Investor Relations section of our website. Information found on our website is not part of this Annual Report on Form 10-K or any other report filed with the SEC.
INFORMATION ABOUT OUR EXECUTIVE OFFICERS
See Item 10. Directors, Executive Officers and Corporate Governance" in Part III of this Annual Report on Form 10-K.
7
Item 1A.Risk Factors
You should carefully consider the risks described below before making an investment decision. These are not the only risks we face. If any of these risks and uncertainties were to actually occur, our business, financial condition or results of operations could be materially and adversely affected. In such case, the trading price of our common stock could decline and you may lose all or part of your investment.
Risks Related to Our Business and Industry
Our results of operations could be adversely affected by declines in new truck orders by fleets, freight tonnage hauled and in infrastructure development and other construction projects as a result of a downturn in the U.S. and/or global economy or other reasons.
Our results of operations are directly impacted by declines in freight tonnage hauled and in infrastructure development and other construction projects resulting from U.S. and/or other global economic conditions or other reasons because, among other things:
▪Demand for our MD/HD Truck products is generally dependent on the number of new MD/HD Truck commercial vehicles manufactured in North America. Historically, the demand for MD/HD Truck commercial vehicles has declined during periods of weakness in the North American economy.
▪Demand for our construction equipment products is dependent on vehicle demand for new commercial vehicles in the global construction equipment market.
▪Demand in the medium and heavy-construction vehicle market, which is where our products are primarily used, is typically related to the level of larger-scale infrastructure development projects.
If we experience periods of low demand for our products or there is volatility in the commercial vehicle market in the future, it could have an adverse effect on our revenues, operating results and financial position.
We face risks related to heightened inflation, recession, financial and credit market disruptions and other economic conditions.
Our financial results, operations and prospects depend significantly on worldwide economic and geopolitical conditions, the demand for our products, and the financial condition of our customers and suppliers. Economic weakness and geopolitical uncertainty have in the past resulted, and may result in the future, in reduced demand for products resulting in decreased sales, margins and earnings. In 2023, the countries in which we operate experienced heightened inflationary pressures. We may not be able to fully mitigate the impact of inflation through price increases, productivity initiatives and cost savings, which could have an adverse effect on our results of operations. In addition, if the U.S. economy enters a recession, we may experience sales declines which could have an adverse effect on our business, operating results and financial condition.
Similarly, disruptions in financial and/or credit markets have in the past impacted, and may in the future impact, our ability to manage normal commercial relationships with our customers, suppliers and creditors. Further, in the event of a recession or threat of a recession, our customers and suppliers may suffer their own financial and economic challenges and as a result they may demand pricing accommodations, delay payment, or become insolvent, which could harm our ability to meet our customer demands or collect revenue or otherwise could harm our business. An economic or credit crisis could occur and impair credit availability and our ability to raise capital when needed. A disruption in the financial markets could impair our banking or other business partners, on whom we rely for access to capital. In addition, changes in tax or interest rates in the U.S. or other nations, whether due to recession, economic disruptions or other reasons, could have an adverse effect on our operating results.
Economic weakness and geopolitical uncertainty may also lead us to impair assets, take restructuring actions or adjust our operating strategy and reduce expenses in response to decreased sales or margins. We may not be able to adequately adjust our cost structure in a timely fashion, which could have an adverse effect on our operating results and financial condition. Uncertainty about economic conditions may increase foreign currency volatility in markets in which we transact business, which could have an adverse effect on our operating results.
Volatility in and disruption to the global economic environment and changes in the regulatory and business environments in which we operate may have an adverse effect on our business, results of operations and financial condition.
The commercial vehicle industry as a whole has been more adversely affected by volatile economic conditions than many other industries, as the purchase or replacement of commercial vehicles, which are durable items, may be deferred for many reasons. Future changes in the regulatory and business environments in which we operate, including increased trade protectionism and
8
tariffs, may adversely affect our ability to sell our products or source materials needed to manufacture our products. Furthermore, financial instability or bankruptcy at any of our suppliers or customers could disrupt our ability to manufacture our products and impair our ability to collect receivables, any or all of which may have an adverse effect on our business, results of operations and financial condition. In addition, some of our customers and suppliers may experience serious cash flow problems and, thus, may find it difficult to obtain financing, if financing is available at all. Any inability of customers to pay us for our products and services, or any demands by suppliers for different payment terms, or inability of our suppliers to supply us may adversely affect our results of operations and financial condition. Furthermore, our suppliers may not be successful in generating sufficient sales, restarting or ramping up production or securing alternate financing arrangements, and therefore may no longer be able to supply goods and services to us. In that event, we would need to find alternate sources for these goods and services, and there is no assurance we would be able to find such alternate sources on favorable terms, if at all. Disruption in our supply chain has had and could continue to have an adverse effect on our ability to manufacture and deliver our products on a timely basis, and thereby affect our results of operations.
We may be unable to successfully implement our business strategy and, as a result, our businesses and financial position and results of operations could be adversely affected.
Our ability to achieve our business and financial objectives is subject to a variety of factors, many of which are beyond our control. For example, we may not be successful in implementing our strategy if unforeseen factors emerge diminishing the current levels or any future expected growth in the commercial vehicle or electric vehicle markets we supply or expect to penetrate, or we experience increased pressure on our margins. Any failure to successfully implement our business strategy could have an adverse effect on our business, results of operations and growth potential.
We may be unable to complete strategic acquisitions, or we may encounter unforeseen difficulties in integrating acquisitions.
We pursue acquisition targets that will allow us to continue to expand into new geographic markets, add new customers, provide new products, manufacturing and service capabilities and increase penetration with existing customers. However, we expect to face competition for acquisition candidates, which may limit the number of our acquisition opportunities and may lead to higher acquisition prices. Moreover, acquisition of businesses may require additional debt and/or equity financing, perhaps resulting in additional leverage and/or shareholder dilution. The covenants in our debt instruments further limit our ability to complete acquisitions. There can be no assurance we will find attractive acquisition candidates or successfully integrate acquired businesses into our existing business. If the expected synergies from acquisitions do not materialize or we fail to successfully integrate such new businesses into our existing businesses, our results of operations could be adversely affected.
Circumstances associated with our acquisition and divestiture strategy could adversely affect our results of operations and financial condition.
From time to time we evaluate the performance and strategic fit of our businesses and may decide to sell a business or product line based on such an evaluation. Any divestitures may result in significant write-offs, including those related to goodwill and other tangible and intangible assets, which could have an adverse effect on our results of operations and financial condition.
Our customer base is concentrated and the loss of business from a major customer or the discontinuation of particular commercial vehicle platforms could reduce our revenues.
Even though we may be selected as the supplier of a product by an OEM for a particular vehicle, our OEM customers issue blanket purchase orders, which generally provide for the supply of that customer’s annual requirements for that vehicle, rather than for a specific number of our products. If the OEM’s requirements are less than estimated, the number of products we sell to that OEM will be accordingly reduced. In addition, the OEM may terminate its purchase orders with us at any time. The loss of any of our large customers or the loss of significant business from any of these customers could have an adverse effect on our business, financial condition and results of operations.
Our profitability could be adversely affected if the actual production volumes for our customers’ vehicles are significantly lower than expected or our costs are higher than expected.
We incur costs and make capital expenditures based in part upon estimates of production volumes for our customers’ vehicles. While we attempt to establish a price for our components and systems that will compensate for variances in production volumes, when the actual production of these vehicles is significantly less than anticipated, our gross margin on these products is adversely affected. Our OEM customers have historically had a significant amount of leverage over us. We enter into agreements with our customers at the beginning of a given platform’s life to supply products for that platform. Once we enter into such agreements, fulfillment of the supply requirements is our obligation for the entire production life of the platform, with terms generally ranging from five to seven years, and we have limited provisions to terminate such contracts. We are committed
9
to supplying products to our customers at selling prices that may, with the benefit of hindsight, not be sufficient to cover the direct cost to produce such products, which may be as a result of among other factors, inflation or increased employment costs due to current labor markets or other factors, as we experienced in 2020, 2021, 2022 and 2023. We cannot predict our customers’ demands for our products. If customers representing a significant amount of our revenues were to purchase materially lower volumes than expected, or if we are unable to keep our commitment under the agreements, or if our costs are higher than anticipated, it would have an adverse effect on our business, financial condition and results of operations.
Additionally, we generally do not have clauses in our customer agreements that guarantee that we will recoup the design and development costs that we incurred to develop a product. In other cases, we share the design costs with the customer and thereby have some risk that not all the costs will be covered if the project does not go forward or if it is not as profitable as expected.
Many of our new and targeted customers are start-up or early-stage companies and these customers are at substantial risk that their businesses will not succeed.
Our success depends, in part, upon our ability to maintain or increase our market share. Many of our new business wins and targeted prospects are early-stage or start-up companies. Early-stage or start-up companies are at substantial risk that the company’s business will not succeed. If the customer’s business does not succeed or the customer experiences cash flow problems, the customer may not be able to find financing or may not be able to pay us for our products and services, which may adversely affect our results of operations and financial condition. In addition, our future estimates and projections contemplate a continued business relationship and sales to these early-stage or start-up companies. If one or more of these customers no longer purchase products or services from us in the future, our sales and revenue will be adversely effected. Finally, we may incur significant initial costs in order to meet the production demands of these new customers, and our ability to recoup those costs requires a longer-term business relationship with the customer. Therefore, a failure of an early-stage or start-up customer may result in our inability to recoup the initial costs we incurred to prepare for production of products for that customer, which could adversely affect our business, results of operations, growth prospects and financial condition.
We may be unable to successfully implement price increases to offset inflation and, as a result, our businesses and financial position and results of operations could be adversely affected.
Our ability to implement customer price increases where margin on product is not meeting profitability targets is subject to a variety of factors, such as fluctuations in our material, freight and labor costs, inflation or other competitive conditions, which are beyond our control. For example, customers may refuse to pay increased prices that meet our profitability targets, re-source from other suppliers, or not issue purchase orders to us with large volumes. Any failure to successfully implement price increases could have an adverse effect on our business, results of operations and growth potential.
Our inability to compete effectively in the highly competitive industrial automation industry could result in loss of market share and reduced gross margins, which could have an adverse effect on our revenues and operating results.
The industrial automation industry is highly competitive. Some of our competitors are companies that are larger and have greater financial and other resources than we do. Our products primarily compete on the basis of price, product quality, technical expertise, development capability, product delivery and product service. Increased competition may lead to price reductions or loss of business resulting in reduced gross margins and loss of market share.
We are subject to certain risks associated with our foreign operations.
We have operations in the Mexico, China, United Kingdom, Czech Republic, Morocco, Ukraine, Belgium, Australia, India and Thailand, which collectively accounted for approximately 24% of our total revenues for the year ended December 31, 2023. There are certain risks inherent in our international business activities including, but not limited to:
•the difficulty of enforcing agreements and collecting receivables through certain foreign legal systems;
•foreign customers, who may have longer payment cycles than customers in the U.S.;
•foreign currency exchange rate fluctuations affecting our ability to match revenue received with costs;
•tax rates in certain foreign countries, which may exceed those in the U.S., withholding requirements or the imposition of tariffs, exchange controls or other restrictions, including restrictions on repatriation, of foreign earnings;
•intellectual property protection difficulties;
•general economic and political conditions, along with major differences in business culture and practices, including the challenges of dealing with business practices that may impact the company’s compliance efforts, in countries where we operate;
10
•exposure to local social unrest, including any acts of war, terrorism or similar events;
•exposure to local minimum wage requirements;
•the difficulties associated with managing a large organization spread throughout various countries; and
•complications in complying with a variety of laws and regulations related to doing business with and in foreign countries, some of which may conflict with U.S. law or may be vague or difficult to comply with.
Additionally, our international business activities are also subject to risks arising from violations of U.S. laws such as the U.S. Foreign Corrupt Practices Act and similar anti-bribery laws in other jurisdictions, and various export control and trade embargo laws and regulations, including those which may require licenses or other authorizations for transactions relating to certain countries and/or with certain individuals identified by the U.S. government. If we fail to comply with applicable laws and regulations, we could suffer civil and criminal penalties that could have an adverse effect on our results of operations and financial condition.
The invasion of Ukraine by Russia and the retaliatory measures taken by the U.S., NATO and other countries, and the war in the Middle East, have created global security concerns and economic uncertainty that could have a lasting impact on regional and global economies. We cannot be certain that similar international tensions will not affect our facility in the Ukraine, including due to the Russian invasion of Ukraine, electrical outages, cyber-attacks and periodic battles with separatists closer to our facility. In addition, certain of our employees in Ukraine are routinely conscripted into the military and/or sent to fight in the ongoing conflict. Furthermore, most of our products manufactured in Ukraine are shipped across the border from Ukraine to the Czech Republic for further delivery to our customers. If that border crossing were to be closed or restricted for any reason, or if our customers decide to stop ordering from us or shift orders to our competitors, we would experience a loss of the use of our Ukrainian facility, which could have an adverse effect on our results of operations and financial condition.
Decreased availability or increased costs of materials could affect both our ability to produce products as well as the cost of producing our products.
We purchase raw materials, fabricated components, assemblies and services from a variety of suppliers. Steel, aluminum, petroleum-based products, copper, resin, foam, fabrics, wire and wire components, semiconductor chips, electronics and electrical components account for the most significant portion of our raw material costs. Although we currently maintain alternative sources for most raw materials, from time to time, however, the prices and availability of these materials fluctuate due to global market demands and other considerations, which could impair the Company's ability to procure necessary materials, or increase the cost of such materials. We may be assessed surcharges on certain purchases of steel, copper and other raw materials. Recently, there was a well-publicized global shortage of semiconductor chips and several of the raw materials we use. Inflationary and other increases in costs or shortages of the various materials that are needed for us to produce our products are currently having an impact on our business which may continue for the foreseeable future. In addition, freight costs associated with shipping and receiving product are impacted by fluctuations in freight tonnage, freight hauler availability or capacity and the cost of oil and gas. Recently, we experienced freight related delays through the Suez Canal due to the Israel-Hamas war and through the Panama canal due to drought. We are currently experiencing difficulty purchasing and obtaining timely delivery of certain raw materials required for our operations, which is having an adverse effect on our results of operations. In addition, to the extent we are unable to pass on the increased costs of raw materials, freight and labor to our customers, it could adversely affect our results of operations and financial condition.
We have invested substantial resources in markets where we expect growth and we may be unable to timely alter our strategies should such expectations not be realized.
Our future growth is dependent in part on us making the right investments at the right time in people, technology, product development, manufacturing capacity, and to expand into new markets including in electric vehicle markets. If we fail to realize expected rates of return on our investments, we may incur losses on such investments and be unable to timely redeploy the invested capital to take advantage of other markets, potentially resulting in lost market share to our competitors.
We cannot guarantee that we will be successful in leveraging our capabilities into new markets and thus, in meeting the needs of these new customers and competing favorably in these new markets.
Our inability to compete effectively in the highly competitive commercial vehicle component supply industry could result in lower prices for our products, loss of market share and reduced gross margins, which could have an adverse effect on our revenues and operating results.
The commercial vehicle component supply industry is highly competitive. Some of our competitors are companies that are larger and have greater financial and other resources than we do. In some cases, we compete with divisions of our OEM customers. Our products primarily compete on the basis of price, breadth of product offerings, product quality, technical
11
expertise, development capability, product delivery and product service. Increased competition may lead to price reductions resulting in reduced gross margins and loss of market share.
We may be unable to successfully introduce new products and, as a result, our business, and financial condition and results of operations could be adversely affected.
Product innovations have been and will continue to be a part of our business strategy. We believe it is important for us to continue to meet our customers’ demands for product innovation, improvement and enhancement, including the continued development of new-generation products, and design improvements and innovations that improve the quality and efficiency of our products including manufacturing seats with airbags, seatbelts and other safety devices and improvements. However, such development will require us to continue to invest in research and development and sales and marketing. Such investments are subject to the risks generally associated with product development, including difficulty in gaining market acceptance, delays in product development and failure of products to operate properly. Additionally, we have exposure to excess costs as we are engaged in multiple development programs for new electric vehicles, each with unique designs and timelines. These electric vehicle programs require the use of a higher level of technical expertise with increased costs and the incremental cost is variable depending on the pace and success rate of the innovation process, the prototyping and mule build process, the production tooling process and then production ramp-up. In addition, our competitors may develop new products before us or may produce similar products that compete with our new products. We may, as a result of these factors, be unable to meaningfully focus on product innovation as a strategy and may therefore be unable to meet our customers’ demands for product innovation, which could have an adverse effect on our business, operating results and financial condition.
We rely on third parties for raw materials, parts, and components.
We source a variety of systems, components, raw materials and parts, including but not limited to top covers, fabricated steel, semiconductor chips, chemicals, seat-foam, air bag, air bag inflators, seat belts, and other components from third parties. From time to time these third-party items do not meet the quality standards that we desire, which could harm our reputation, cause delays and cause us to incur significant costs. Furthermore, we may be unable to source third-party items in sufficient quantities or at acceptable prices. We have recently experienced and may in the future experience difficulty sourcing certain raw materials, parts and components required for our operations, which has had and may in the future have an adverse effect on our results of operations.
We could experience disruption in our supply or delivery chain, which could cause one or more of our customers to halt or delay production.
We, as with other component manufactures in the commercial vehicle industry, sometimes ship products to the customers throughout the world so they are delivered on a “just-in-time” basis in order to maintain low inventory levels. Our suppliers (external suppliers as well as our own production sites) also sometimes use a similar method. This just-in-time method makes the logistics supply chain in the industries we serve complex and vulnerable to disruptions.
The potential loss of one of our suppliers or our own production sites could be caused by a myriad of factors. Additionally, as we expand in growth markets, the risk for such disruptions is heightened. The lack of even a small single subcomponent necessary to manufacture one of our products, for whatever reason, could force us to cease production, possibly for a prolonged period. In the event of a reduction or stoppage in production at any of our facilities, even if only temporary, or if we experience delays as a result of events that are beyond our control, delivery times to our customers could be severely affected. Any significant delay in deliveries to our customers could lead to increased returns or cancellations. Similarly, a potential quality issue could force us to halt deliveries. Even where products are ready to be shipped or have been shipped, delays may arise before they reach our customer. Our customers may halt or delay their production for the same reason if one of their other suppliers fails to deliver necessary components. This may cause our customers to suspend their orders or instruct us to suspend delivery of our products, which may adversely affect our financial performance. When we cease timely deliveries, we have to absorb our own costs for identifying and solving the root cause problem as well as expeditiously producing replacement components or products. Generally, we must also carry the costs associated with “catching up,” such as overtime and premium freight.
Additionally, if we are the cause for a customer being forced to halt production the customer may seek to recoup all of its losses and expenses from us. These losses and expenses could include consequential losses such as lost profits. Thus, any supply chain disruption, however small, could potentially cause the complete shutdown of an assembly line of one of our customers, and any such shutdown could expose us to claims for compensation. Where a customer halts production because of another supplier failing to deliver on time, we may not be fully compensated, if at all, and therefore our business and financial results could be adversely affected.
12
During 2021, 2022 and to a lesser degree during 2023, we experienced supply chain disruptions (including longer lead-times to procure parts from China) that caused volatility on our customers' production schedules and had a negative impact on our results.
If we are unable to recruit or retain senior management and other skilled personnel, our business, operating results and financial condition could be adversely affected.
Our operations depend to a large extent on the efforts of our senior management team as well as our ability to attract, train, integrate and retain highly skilled personnel. We seek to develop and retain an effective management team through the proper positioning of existing key employees and the addition of new management personnel where necessary. Retaining personnel with the right skills at competitive wages can be difficult in certain markets in which we are doing business, particularly those locations that are seeing much inbound investment and have highly mobile workforces. Additionally, attracting sufficiently well-educated and talented management, especially middle-management employees, in certain markets can be challenging.
We may not be able to retain our current senior management and other skilled personnel or retain similarly skilled personnel in the future. If we lose senior management or the services of our skilled workforce, or if we are unable to attract, train, integrate and retain the highly skilled personnel we need, our business, operating results and financial condition could be adversely affected.
We may be adversely impacted by labor strikes, work stoppages and other matters.
As of December 31, 2023, a majority of employees based in Mexico are unionized. In addition, approximately 74% of our employees of our European, Asian and Australian operations were represented by a shop steward committee, which may limit our flexibility in our relationship with these employees. We may encounter future unionization efforts or other types of conflicts with labor unions or our employees.
Many of our OEM customers and their suppliers also have unionized work forces. Work stoppages or slow-downs experienced by OEMs or their other suppliers could result in slow-downs or closures of assembly plants where our products are included in assembled commercial vehicles. In the event that one or more of our customers or their suppliers experience a material work stoppage, such work stoppage could have an adverse effect on our business.
Additionally, the rapid recovery of certain COVID-19-impacted markets and locales and the low unemployment rate is causing spot shortages of labor. The Company has exposure to cost premiums as we use temporary labor during demand ramp-ups which carries with it a temporary premium cost. The Company is currently at high levels of temporary labor which could have an adverse effect on our business.
Our earnings may be adversely affected by changes to the carrying values of our tangible and intangible assets as a result of recording any impairment charges deemed necessary.
We are required to perform impairment tests whenever events and circumstances indicate the carrying value of certain assets may not be recoverable. We cannot accurately predict the amount and timing of any impairment of assets. A significant amount of judgment is involved in determining if an indication of impairment exists. Factors that may be considered in assessing whether goodwill or other long-lived assets may not be recoverable include a decline in our stock price or market capitalization, reduced estimates of future cash flows, the general economic environment, changes or downturns in our industry as a whole, termination of any of our customer contracts, restructuring efforts and general workforce reductions. A continued decline in our stock price may trigger an evaluation of the recoverability of the recorded goodwill and other long-lived assets. Any charge for impairment could adversely affect our reported net income and our stockholders’ equity.
We have taken, are taking, and may take future restructuring actions to realign and resize our production capacity and cost structure to meet current and projected operational and market requirements. Charges related to these actions or any further restructuring actions may have an adverse effect on our results of operations and financial condition. There can be no assurance that any current or future restructuring will be completed as planned or achieve the desired results. The failure to complete restructuring as planned could have an adverse effect our results of operations.
We have established and may establish in the future valuation allowances on deferred tax assets. These changes may have an adverse effect on our results of operations and financial position.
Additionally, from time to time in the past, we have recorded asset impairment losses relating to specific plants and operations. Generally, we record asset impairment losses when we determine that our estimates of the future undiscounted cash flows from an operation will not be sufficient to recover the carrying value of that facility’s building, fixed assets and production tooling. There can be no assurance that we will not incur charges in the future as changes in economic or operating conditions impacting
13
the estimates and assumptions could result in additional impairment. Any future impairments may adversely affect our results of operations.
Our inability to successfully achieve operational efficiencies could result in the incurrence of additional costs and expenses that could adversely affect our reported earnings.
As part of our business strategy, we continuously seek ways to lower costs, improve manufacturing efficiencies and increase productivity in our existing operations and intend to apply this strategy to those operations acquired through acquisitions. In addition, we incur restructuring charges periodically to close facilities, such as lease termination charges, severance charges and impairment charges of leasehold improvements and/or machinery and equipment, as we continue to evaluate our manufacturing footprint to improve our cost structure and remove excess, underperforming assets, or assets that no longer fit our goals. If we decide to close or consolidate facilities, we may face execution risks which could adversely affect our ability to serve our customers. Further, we may be unsuccessful in achieving these objectives which could adversely affect our operating results and financial condition.
The geographic profile of our taxable income could adversely impact our tax provision and therefore our results of operations.
Our future tax provision could be adversely affected by the geographic profile of our taxable income and by changes in the valuation of our deferred tax assets and liabilities. Our results could be adversely impacted by significant changes in our effective tax rate. Additionally, any changes to manufacturing activities could result in significant changes to our effective tax rate related to products manufactured either in the United States or in international jurisdictions. If the United States or another international jurisdiction implements a tax change related to products manufactured in a particular jurisdiction where we do business, our results could be adversely affected.
Exposure to currency exchange rate fluctuations on cross border transactions and translation of local currency results into United States dollars could adversely impact our results of operations.
Cross border transactions, both with external parties and intercompany relationships, result in increased exposure to foreign currency fluctuations. The strengthening or weakening of the United States dollar may result in favorable or unfavorable foreign currency translation effects in as much as the results of our foreign locations are translated into United States dollars. This could adversely impact our results of operations.
We have only limited protection for our proprietary rights in our intellectual property, which makes it difficult to prevent third parties from infringing upon our rights and our operations could be limited by the rights of others.
Our success depends to a certain degree on our ability to protect our intellectual property and to operate without infringing on the proprietary rights of third parties. While we have been issued patents and have registered trademarks with respect to many of our products, our competitors could independently develop similar or superior products or technologies, duplicate our designs, trademarks, processes or other intellectual property or design around any processes or designs on which we have or may obtain patents or trademark protection. In addition, it is possible third parties may have or acquire licenses for other technology or designs that we may use or desire to use, requiring us to acquire licenses to, or to contest the validity of, such patents or trademarks of third parties. Such licenses may not be made available to us on acceptable terms, if at all, or we may not prevail in contesting the validity of third party rights.
As we diversify and globalize our geographic footprint, we may encounter laws and practices in emerging markets that are not as stringent or enforceable as those present in developed markets, and thus incur a higher risk of intellectual property infringement, which could have an adverse effect on our results of operations.
Our products may be susceptible to claims by third parties that our products infringe upon their proprietary rights.
As the number of products in our target markets increases and the functionality of these products further overlaps, we may become increasingly subject to claims by a third party that our technology infringes such party’s proprietary rights. Regardless of their merit, any such claims could be time consuming and expensive to defend, may divert management’s attention and resources, could cause product shipment delays and could require us to enter into costly royalty or licensing agreements. If successful, a claim of infringement against us and our inability to license the infringed or similar technology and/or product could have an adverse effect on our business, operating results and financial condition.
14
We may be subject to product liability claims, recalls or warranty claims, which could be expensive, damage our reputation and result in a diversion of management resources.
As a supplier of products and systems, we face an inherent business risk of exposure to product liability claims in the event that our products, or the equipment into which our products are incorporated, malfunction and result in injury to person or property or death. Product liability claims could result in significant losses as a result of expenses incurred in defending claims or the award of damages.
In addition, we may be required to participate in recalls involving systems or components sold by us if any prove to be defective, or we may or our customers may voluntarily initiate a recall and we have to make payments related to such recalls as a result of various industry or business practices, contractual obligations or the need to maintain good customer relationships. Such a recall would result in a diversion of management resources. While we maintain product liability insurance generally with a self-insured retention amount, we cannot assure you that it will be sufficient to cover all product liability claims, that such claims will not exceed our insurance coverage limits or that such insurance will continue to be available on commercially reasonable terms, if at all. Any product liability claim brought against us could have an adverse effect on our results of operations.
We warrant the workmanship and materials of many of our products under limited warranties and have entered into warranty agreements with certain customers that warranty certain of our products in the hands of customers of our customers, in some cases for many years. From time to time, we receive product warranty claims from our customers, pursuant to which we have or may be required to bear costs of repair or replacement of certain of our products. Accordingly, we are subject to risk of warranty claims in the event that our products do not conform to our customers’ specifications or, in some cases in the event that our products do not conform to their customers’ expectations. It is possible for warranty claims to result in costly product recalls, significant repair costs and damage to our reputation, all of which could adversely affect our results of operations.
Our businesses are subject to statutory environmental and safety regulations in multiple jurisdictions, and the impact of any changes in regulation and/or the violation of any applicable laws and regulations by our businesses could result in an adverse effect on our financial condition and results of operations.
We are subject to foreign, federal, state, and local laws and regulations governing the protection of the environment and occupational health and safety, including laws regulating air emissions, wastewater discharges, generation, storage, handling, use and transportation of hazardous materials; the emission and discharge of hazardous materials into the soil, ground or air; and the health and safety of our colleagues. We are also required to obtain permits from governmental authorities for certain of our operations. We cannot assure you that we are, or have been, in complete compliance with such environmental and safety laws, and regulations. Certain of our operations generate hazardous substances and wastes. If a release of such substances or wastes occurs at or from our properties, or at or from any offsite disposal location to which substances or wastes from our current or former operations were taken, or if contamination is discovered at any of our current or former properties, we may be held liable for the costs of cleanup and for any other response by governmental authorities or private parties, together with any associated fines, penalties or damages. In most jurisdictions, this liability would arise whether or not we had complied with environmental laws governing the handling of hazardous substances or wastes.
Several of our facilities are either certified as, or are in the process of being certified as ISO 9001, 14000, 14001 or TS16949 (the international environmental management standard) compliant or are developing similar environmental management systems. We have made, and will continue to make, capital and other expenditures to implement such environmental programs and comply with environmental requirements.
The environmental laws to which we are subject have become more stringent over time, and we could incur material costs or expenses in the future to comply with environmental laws. If we violate or fail to comply with these laws and regulations or do not have the requisite permits, we could be fined or otherwise sanctioned by regulators. In some instances, such a fine or sanction could have an adverse effect on our financial condition and results of operations.
Risks Related to Our Indebtedness
The agreements governing our credit facilities contain covenants that may restrict our current and future operations, particularly our ability to respond to changes in our business or to take certain actions. If we are unable to comply with these covenants, our business, results of operations and liquidity could be adversely affected.
Our senior secured revolving and term loan credit facilities require us to maintain certain financial ratios and to comply with various operational and other covenants. If we do not comply with those covenants, we are precluded from borrowing under the senior secured revolving credit facility, which could have an adverse effect on our business, financial condition and liquidity. If
15
we are unable to borrow under our senior secured revolving credit facility, we will need to meet our capital requirements using other sources; however, alternative sources of liquidity may not be available on acceptable terms. In addition, if we fail to comply with the covenants set forth in our credit facilities, the lenders could declare an event of default and cause all amounts outstanding to be due and payable immediately. We cannot assure you that our assets or cash flow would be sufficient to fully repay borrowings under our outstanding credit facilities or other debt instruments we may have in place from time to time, either upon maturity or if accelerated, upon an event of default, or that we would be able to refinance or restructure the payments on the credit facilities or such other debt instruments on acceptable terms.
In addition, the agreements governing the senior secured revolving and term loan credit facilities contain covenants that, among other things, restrict our ability to:
•incur liens;
•incur or assume additional debt or guarantees or issue preferred stock;
•prepay, or make redemptions and repurchases of, subordinated debt;
•make loans and investments;
•engage in mergers, acquisitions, asset sales, sale/leaseback transactions and transactions with affiliates;
•place restrictions on the ability of subsidiaries to pay dividends or make other payments to the issuer;
•change the business conducted by us or our subsidiaries; and
•amend the terms of subordinated debt.
Our indebtedness may adversely affect our cash flow and our ability to operate our business, remain in compliance with debt covenants and make payments on our indebtedness.
Our indebtedness, combined with our lease and other financial obligations and contractual commitments could have other important consequences to our stockholders, including:
•making it more difficult for us to satisfy our obligations with respect to our indebtedness, including the revolving credit facility, term loan and our other debt instruments, and any failure to comply with the obligations of any of our debt instruments, including financial and other restrictive covenants, could result in an event of default under the revolving credit facility or term loan and the governing documents of our debt instruments;
•the possibility that we may be unable to generate cash sufficient to pay, when due, the principal of, interest on or other amounts due in respect of our indebtedness;
•making us more vulnerable to adverse changes in general economic, industry and competitive conditions;
•require us to dedicate a substantial portion of our cash flow from operations to payments on our indebtedness, thereby reducing the availability of our cash flows to fund working capital, capital expenditures, acquisitions and other general corporate purposes;
•limiting our flexibility in planning for, or reacting to, changes in our business and the industry in which we operate;
•placing us at a competitive disadvantage compared to our competitors that have less debt; and
•limiting our ability to borrow additional amounts for working capital, capital expenditures, acquisitions, debt service requirements, or execution of our business strategy or other purposes.
Any of these factors could have an adverse effect on our business, financial condition and results of operations. Our ability to make payments on our indebtedness depends on our ability to generate cash in the future. If we do not generate sufficient cash flow to meet our debt service and working capital requirements, we may need to seek additional financing or sell assets. This may make it more difficult for us to obtain financing on terms that are acceptable to us, or at all. Without any such financing, we could be forced to sell assets to make up for any shortfall in our payment obligations under unfavorable circumstances. If necessary, we may not be able to sell assets quickly enough or for sufficient amounts to enable us to meet our obligations.
16
Risks Related to Our Common Stock
Our operating results, revenues and expenses may fluctuate significantly from quarter-to-quarter or year-to-year, which could have an adverse effect on the market price of our common stock.
Our operating results, revenues and expenses have in the past varied and may in the future vary significantly from quarter-to-quarter or year-to-year. These fluctuations have in the past and could have in the future an adverse effect on the market price of our common stock.
We base our operating expense budgets in large part on expected revenue trends. However, certain of our expenses are relatively fixed and as such we may be unable to adjust expenses quickly enough to offset any unexpected revenue shortfall. Accordingly, any significant change in revenue may cause significant variation in operating results in any quarter or year.
It is possible that in one or more future quarters or years, our operating results may be below the expectations of public market analysts and investors and may result in changes in analysts’ estimates. In such events, the trading price of our common stock may be adversely affected.
Our common stock has historically had a low trading volume with limited analyst coverage and, as a result, any sale of a significant number of shares may depress the trading price of our stock; stockholders may be unable to sell their shares above the purchase price.
Our common stock is traded on the NASDAQ Global Select Market under the symbol “CVGI.” The trading volume and analyst coverage of our common stock has historically been limited as compared to common stock of an issuer that has a large and steady volume of trading activity that will generally support continuous sales without an adverse effect on share prices. Because of the limited trading volume, holders of our securities may not be able to sell quickly any significant number of such shares, and any attempted sale of a large number of our shares may have an adverse impact on the price of our common stock. Additionally, because of the limited number of shares being traded, and changes in stock market analyst recommendations regarding our common stock or lack of analyst coverage, the price per share of our common stock is subject to volatility and may continue to be subject to rapid price swings in the future that may result in stockholders’ inability to sell their common stock at or above purchase price.
Provisions in our charter documents and Delaware law could discourage potential acquisition proposals, could delay, deter or prevent a change in control and could limit the price certain investors might be willing to pay for our stock.
Certain provisions of our certificate of incorporation and by-laws may inhibit changes in control of our company not approved by our board of directors. These provisions include:
•a prohibition on stockholder action through written consents;
•a requirement that special meetings of stockholders be called only by the board of directors;
•advance notice requirements for stockholder proposals and director nominations;
•limitations on the ability of stockholders to amend, alter or repeal the by-laws; and
•the authority of the board of directors to issue, without stockholder approval, preferred stock and common stock with such terms as the board of directors may determine.
We are also afforded the protections of Section 203 of the Delaware General Corporation Law, which would prevent us from engaging in a business combination with a person who becomes a 15% or greater stockholder for a period of three years from the date such person acquired such status unless certain board or stockholder approvals were obtained. These provisions could limit the price that certain investors might be willing to pay in the future for shares of our common stock, discourage potential acquisition proposals and delay, deter or prevent a change in control.
Other Risk Factors
Security breaches and other disruptions could compromise our information systems and expose us to liability, which could cause our business and reputation to suffer.
We rely on technology for the operation of our business. Systems failures or outages could compromise our ability to conduct business and hurt our relationships with our business partners and customers. In the event of a disaster, such as a natural catastrophe, a pandemic, civil unrest, an industrial accident, a cyber-attack, a blackout, a terrorist attack (including conventional, nuclear, biological, chemical or radiological) or war, systems upon which we rely may be inaccessible to our employees for an extended period of time. While technology can streamline many business processes and ultimately reduce the
17
costs of operations, technology initiatives present short-term cost and also have implementation and operational risks. In addition, we may have inaccurate expense projections, implementation schedules or expectations regarding the effectiveness of the end product. These issues could escalate over time. If we were unable to find and retain associates with key technical knowledge, our ability to develop and deploy key technology solutions could be hampered.
In the ordinary course of our business, we collect and store sensitive data, including intellectual property, financial information, our proprietary business information and that of our customers, suppliers and business partners, and personally identifiable information of our customers and employees, in our data centers and on our networks. Threats to data security, including unauthorized access and cyberattacks, rapidly emerge and change, exposing us to additional costs for protection or remediation and competing time constraints to secure our data in accordance with customer expectations and statutory and regulatory requirements. The secure processing, maintenance and transmission of this information is critical to our operations and business strategy. Like most companies, our systems are under attack on a routine basis. Our systems have been, and will likely continue to be, subject to viruses or other malicious codes, unauthorized access, cyber attacks, cyber frauds or other computer related penetrations. While we take what we believe to be commercially reasonable measures to keep our systems and data secure, it is difficult or impossible to defend against every risk being posed by changing technologies as well as criminal and state-sponsored cybercrime and cyber threats. While we are not aware of having experienced a material breach of our cybersecurity systems in the recent past, administrative, internal accounting and technical controls as well as other preventative actions may be insufficient to prevent security breaches to our systems or those of third parties with whom we do business. Increasing sophistication of cyber criminals and terrorists make keeping up with new threats difficult and could result in a breach. Patching and other measures to protect existing systems and servers could be inadequate, especially on systems that are being retired. Controls employed by our U.S., off-shore and cloud vendors could prove inadequate. We could also experience a breach by intentional or negligent conduct on the part of associates or other internal sources. Our systems and those of our third-party vendors may become vulnerable to damage or disruption due to circumstances beyond our or their control, such as from catastrophic events, power anomalies or outages, natural disasters, network failures, and viruses, ransomware and malware. Any such access, disclosure or other loss of information could result in legal claims or proceedings, liability under laws that protect the privacy of personal information, regulatory penalties, disrupt our operations and the services we provide to customers, damage our reputation, and cause a loss of confidence in our products and services, which could adversely affect our business and our results of operations.
Our financial condition and results of operations have been and will continue to be adversely affected by the coronavirus pandemic and similar health crises.
The global spread of COVID-19 that was declared a pandemic by the World Health Organization and the preventative measures taken to contain or mitigate the outbreak caused significant volatility and uncertainty and economic disruptions. The outbreak resulted in governments around the world implementing increasingly stringent measures to contain or mitigate the spread of the virus, including quarantines, “shelter in place” and “stay at home” orders, travel restrictions, business curtailments, vaccine mandates and other measures.
The resulting financial impact of COVID-19 has adversely affected our business, supply chain, sales, results of operations, financial condition and cash flows. Even after the COVID-19 pandemic subsided, we continued to experience adverse impacts to our business due to resulting inflation and other economic conditions that impacted customer demand and the operations of our suppliers and customers. A significant outbreak of any other contagious diseases in the human population could result in a widespread health crisis that could adversely affect the economies and financial markets of many countries, resulting in an economic downturn that could affect demand for our products and adversely impact our operating results.
Item 1B.Unresolved Staff Comments
None.
Item 1C. Cybersecurity
Cybersecurity Risk Management and Strategy
We recognize the importance of assessing, identifying, and managing material risks associated with cybersecurity threats, as such term is defined in Item 106(a) of Regulation S-K. These risks include, among other things: operational risks, intellectual property theft, fraud, extortion, harm to employees or customers and violation of data privacy or security laws.
Identifying and assessing cybersecurity risk is integrated into our overall risk management systems and processes. Cybersecurity risks related to our business, technical operations, privacy and compliance issues are identified and addressed through a multi-faceted approach including third party assessments, internal IT Audit, IT security, governance, risk and compliance reviews. To defend, detect and respond to cybersecurity incidents, we, among other things: conduct proactive
18
privacy and cybersecurity reviews of systems and applications, audit applicable data policies, perform penetration testing using external third-party tools and techniques to test security controls, conduct employee training, monitor emerging laws and regulations related to data protection and information security and implement appropriate changes.
Security events and data incidents are evaluated, ranked by severity and prioritized for response and remediation. Incidents are evaluated to determine materiality as well as operational and business impact, and reviewed for privacy impact.
Cybersecurity risks are evaluated when determining the selection and oversight of applicable third-party service provider risks when handling and/or processing our employee, business or customer data. In addition to new vendor onboarding, we perform risk management during third-party cybersecurity compromise incidents to identify and mitigate risks to us from third-party incidents.
We describe whether and how risks from identified cybersecurity threats, including as a result of any previous cybersecurity incidents, have materially affected or are reasonably likely to materially affect us, including our business strategy, results of operations, or financial condition, under the heading “Security breaches and other disruptions could compromise our information systems and expose us to liability, which could cause our business and reputation to suffer” included as part of our risk factor disclosures at Item 1A of this Annual Report on Form 10-K.
Cybersecurity Governance
Cybersecurity is an important part of our risk management processes and an area of focus for our Board and management. Our Audit Committee is responsible for the oversight of risks from cybersecurity threats. Members of the Audit Committee receive updates periodically from senior management regarding matters of cybersecurity. This includes existing and new cybersecurity risks, status on how management is addressing and/or mitigating those risks, cybersecurity and data privacy incidents (if any) and status on key information security initiatives. Our Board members also engage in ad hoc conversations with management on cybersecurity-related news events and discuss any updates to our cybersecurity risk management and strategy programs.
Our cybersecurity risk management and strategy processes are overseen by our CFO and CLO. These individuals are informed about, and monitor the prevention, mitigation, detection and remediation of cybersecurity incidents through their management of, and participation in, the cybersecurity risk management and strategy processes described above, including the operation of our incident response plan, and report to the Audit Committee on any appropriate items.
Item 2.Properties
Our corporate office is located in New Albany, Ohio. Several of our facilities are located near our OEM customers to reduce distribution costs, reduce risk of interruptions in our delivery schedule, further improve customer service and provide our customers with reliable delivery of products and services. We have seven owned and 23 leased principal facilities. We consider our properties to generally be in good condition, well maintained, and suitable and adequate to meet our business requirements for the foreseeable future. We do not anticipate difficulty in renewing existing leases as they expire or in finding alternative facilities. Our owned domestic facilities are subject to liens securing our obligations under our revolving credit facility and term loan credit facility as described in Note 3, Debt, to our consolidated financial statements in Item 8 in this Annual Report on Form 10-K.
Utilization of our facilities varies with North American, European, Asian and Australian commercial vehicle production and general economic conditions in the regions. All locations are principally used for manufacturing, assembly, distribution or warehousing, except for our New Albany, Ohio and Chihuahua, Mexico facilities, which are principally administrative offices, and the research and development facility in Phoenix, AZ.
Item 3.Legal Proceedings
We are subject to various legal proceedings and claims arising in the ordinary course of business, including, but not limited to, product liability claims, customer and supplier disputes, service provider disputes, examinations by taxing authorities, employment disputes, workers’ compensation claims, unfair labor practice charges, OSHA investigations, intellectual property disputes and environmental claims arising out of the conduct of our businesses. Based upon the information available to management and discussions with legal counsel, it is the opinion of management that the ultimate outcome of the various legal actions and claims that are incidental to our business are not expected to have a material adverse impact on the consolidated financial position, results of operations, stockholders' equity or cash flows; however, such matters are subject to many uncertainties and the outcomes of individual matters are not predictable with any degree of assurance.
19
Item 4.Mine Safety Disclosures
Not applicable.
20
PART II
21
Item 5. Market for Registrant’s Common Equity, Related Stockholder Matters and Issuer Purchases of Equity Securities
Our common stock is traded on the NASDAQ Global Select Market under the symbol “CVGI.”
As of March 14, 2024, there were approximately 136 holders of record of our outstanding common stock.
We have not declared or paid any dividends to the holders of our common stock in the past and do not anticipate paying dividends in the foreseeable future. Any future payment of dividends is within the discretion of the Board of Directors and will depend upon, among other factors, the capital requirements, operating results and financial condition of CVG.
The following graph compares the cumulative five-year total return to holders of CVG’s common stock to the cumulative total returns of the NASDAQ Composite Index, our Legacy Peer Group, and New Peer Group. The composition of our Legacy Peer Group and our New Peer Group are discussed below. The graph assumes that the value of the investment in the Company’s common stock, in the legacy peer group, in the new peer group, and the index (including reinvestment of dividends) was $100 on December 31, 2018 and tracks it through December 31, 2023.
The legacy peer group includes Altra Industrial Motion Corp., American Railcar Industries Inc., ASTEC Industries Inc., Columbus McKinnon Corp., Dorman Products Inc., EnPro Industries, Federal Signal Corp., Freightcar America Inc., Gentherm Inc., L.B. Foster Company, LCI Industries, Modine Manufacturing, Shiloh Industries, Spartan Motors Inc., Standard Motor Products Inc., Stoneridge Inc., and Supreme Industries (the "Legacy Peer Group"). Supreme Industries was purchased by Wabash National Corporation and is reported as part of the peer group only through 2017. American Railcar Industries, Inc. was purchased by ITE Management and is reported as part of the peer group only through 2018. Shiloh Industries was purchased by MiddleGround Capital LLC and is reported as part of the peer group only through 2020.
The new peer group includes Altra Industrial Motion Corp., ASTEC Industries Inc., Blue Bird Corp., Columbus McKinnon Corp., Cooper-Standard Holdings Inc., EnPro Industries, Federal Signal Corp., Gentherm Inc., L.B. Foster Company, Modine Manufacturing, Motorcar Parts of America, Inc., Myers Industries, Inc., NN Inc., Standard Motor Products Inc., Stoneridge Inc., Superior Industries International Inc., The Shyft Group Inc., and Wabash National Corp (the "New Peer Group").
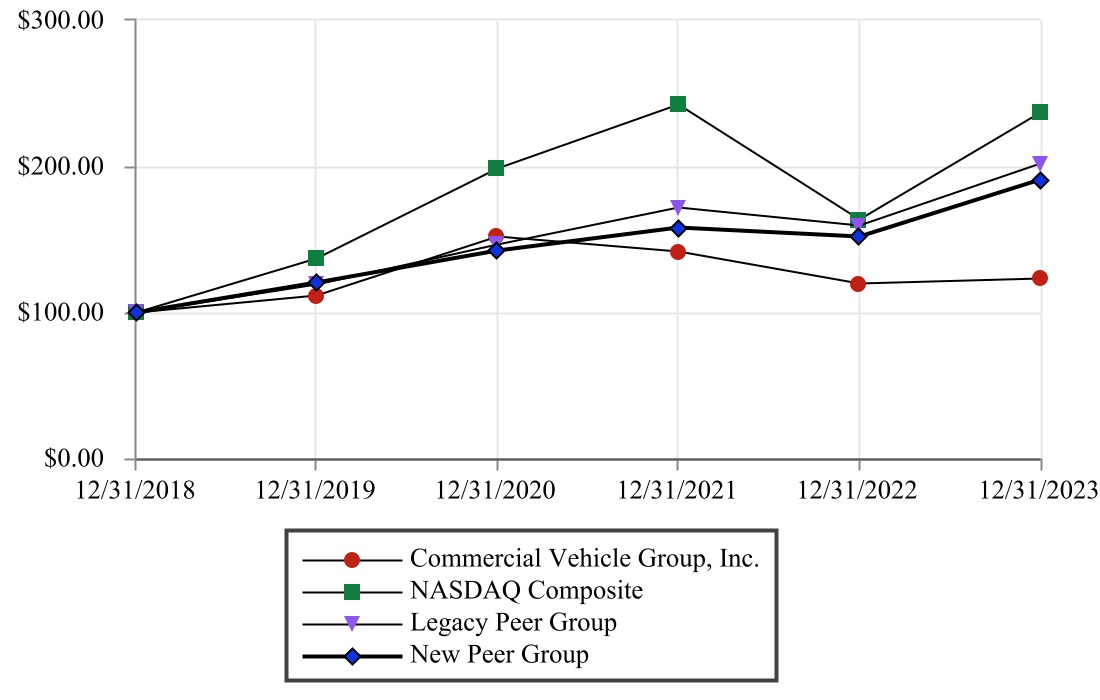
| 12/31/2018 | 12/31/2019 | 12/31/2020 | 12/31/2021 | 12/31/2022 | 12/31/2023 | |||||||||||||||
| Commercial Vehicle Group, Inc. | 100.00 | 111.40 | 151.63 | 141.28 | 119.32 | 122.83 | ||||||||||||||
| NASDAQ Composite | 100.00 | 136.73 | 198.33 | 242.38 | 163.58 | 236.70 | ||||||||||||||
| Legacy Peer Group | 100.00 | 118.80 | 146.04 | 171.30 | 159.30 | 201.39 | ||||||||||||||
| New Peer Group | 100.00 | 119.96 | 142.38 | 158.09 | 151.91 | 190.44 | ||||||||||||||
22
The information in the graph and table above is not “solicitation material”, is not deemed “filed” with the Securities and Exchange Commission and is not to be incorporated by reference in any of our filings under the Securities Act of 1933, as amended, or the Securities Exchange Act of 1934, as amended, whether made before or after the date of this annual report, except to the extent that we specifically incorporate such information by reference.
We did not repurchase any of our common stock on the open market during 2023. Our employees surrendered 234,608 shares of our common stock in 2023 to satisfy tax withholding obligations on the vesting of restricted stock awards issued under our 2014 Equity Incentive Plan and the 2020 Equity Incentive Plan. The following table sets forth information in connection with purchases made by, or on behalf of, us or any affiliated purchaser, of shares of our common stock during the period ended December 31, 2023:
| Total Number of Shares (or Units) Surrendered | Average Price Paid per Share (or Unit) | Total Number of Shares (or Units) Purchased as Part of Publicly Announced Plans or Programs | Maximum Number (or Approximate Dollar Value) of Shares (or Units) that May Yet Be Purchased Under the Plans or Programs | ||||||||||||||||||||
| January 1, 2023 through January 31, 2023 | 4,591 | $ | 7.48 | — | — | ||||||||||||||||||
| February 1, 2023 through February 28, 2023 | 1,429 | $ | 7.90 | — | — | ||||||||||||||||||
| March 1, 2023 through March 31, 2023 | 104,575 | $ | 6.98 | — | — | ||||||||||||||||||
| April 1, 2023 through April 30, 2023 | 242 | $ | 7.31 | — | — | ||||||||||||||||||
| September 1, 2023 through September 30, 2023 | 3,984 | $ | 7.80 | — | — | ||||||||||||||||||
| November 1, 2023 through November 30, 2023 | 20,047 | $ | 6.52 | — | — | ||||||||||||||||||
| December 1, 2023 through December 31, 2023 | 99,740 | $ | 6.88 | — | — | ||||||||||||||||||
No other shares were surrendered during the year ended December 31, 2023.
Unregistered Sales of Equity Securities
We did not sell any equity securities during 2023 that were not registered under the Securities Act of 1933, as amended.
Item 6.[Reserved]
23
Item 7.Management’s Discussion and Analysis of Financial Condition and Results of Operations
You should read the following discussion and analysis in conjunction with the information set forth in our consolidated financial statements and the notes thereto included in Item 8 in this Annual Report on Form 10-K. Discussion of 2022 results compared to 2021 results to the extent not included in this report can be found in Item 7 of our 2022 Annual Report on Form 10-K, which was filed with the Securities and Exchange Commission on March 6, 2023. The statements in this discussion regarding industry outlook, our long-term strategy, our expectations regarding our future performance, liquidity and capital resources and other non-historical statements in this discussion are forward-looking statements. See “Forward-Looking Information” on page ii of this Annual Report on Form 10-K. These forward-looking statements are subject to numerous risks and uncertainties, including, but not limited to, the risks and uncertainties described under “Item 1A - Risk Factors.” Our actual results may differ materially from those contained in or implied by any forward-looking statements.
Business Overview
CVG is a global provider of systems, assemblies and components to the global commercial vehicle market, the electric vehicle market, and the industrial automation markets. We deliver real solutions to complex design, engineering and manufacturing problems while creating positive change for our customers, industries, and communities we serve.
We have manufacturing operations in the United States, Mexico, China, United Kingdom, Czech Republic, Ukraine, Morocco, Thailand, India and Australia. Our products are primarily sold in North America, Europe, and the Asia-Pacific region.
We primarily manufacture customized products to meet the requirements of our customer. We believe our products are used by a majority of the North American Commercial Truck markets, many construction vehicle OEMs and top e-commerce retailers.
Commercial Trends in the Vehicle Solutions and Aftermarket & Accessories Segments
Demand for our products may be driven by preferences of the end-user of the vehicle, particularly with respect to heavy-duty trucks in North America. Heavy-duty truck OEMs generally dictate the specifications of component parts that will be used to manufacture the vehicle, including a wide variety of cab interior styles and colors, brand and type of seats, type of seat fabric and color, and interior styling. Certain of our products are only utilized in heavy-duty trucks, such as our storage systems, sleeper boxes and privacy curtains. To the extent that demand for higher content vehicles increases or decreases, our revenues and gross profit will be impacted positively or negatively.
Current trends include future adoption of electric vehicles in the commercial truck segment. Commercial truck makers are developing electric models of all classes of trucks and buses in their fleets. This has created an increased number of platform opportunities relative to historical trends of platform changes. The Company competes to retain its existing positions on platforms that are getting refreshed, competitively win new positions on platforms on which it is not the incumbent supplier, and gain first fit positions on new Electric Vehicle platforms. The global truck market is evolving to include many offerings aimed at low emissions and less impact on the environment.
In general, demand for our heavy-duty (or "Class 8") truck products is generally dependent on the number of new heavy-duty trucks manufactured in North America, which in turn is a function of general economic conditions, supply chain constraints, interest rates, changes in government regulations, consumer spending, fuel costs, freight costs, fleet operators' financial health and access to capital, used truck prices and our customers’ inventory levels. New heavy-duty truck demand has historically been cyclical and is particularly sensitive to the industrial sector of the economy, which generates a significant portion of the freight tonnage hauled by commercial vehicles.
North American heavy-duty truck production was 340,140 units in 2023. According to a February 2024 report by ACT Research, a publisher of industry market research, North American Class 8 production levels are expected to decrease to 285,000 units in 2024. ACT Research estimated that the average age of active North American Class 8 trucks was 5.7 years in 2023. As vehicles age, maintenance costs typically increase. ACT Research forecasts that the vehicle age will decline as aging fleets are replaced.
North American medium-duty (or "Class 5-7") truck production was 266,784 units in 2023. According to a February 2024 report by ACT Research, North American Class 5-7 truck production is expected to decrease to 237,000 units in 2024. We primarily participate in the class 6 and 7 portion of the medium-duty truck market.
Commercial Trends in the Electrical Systems Segment
Demand for our Electrical Systems products, such as wire harnesses, is primarily driven by construction equipment vehicle production. Demand for new vehicles in the global construction equipment market generally follows certain economic conditions around the world. Our products are primarily used in the medium- and heavy-duty construction equipment markets (vehicles weighing over 12 metric tons). Demand in the medium- and heavy-duty construction equipment market is typically
24
related to the level of large scale infrastructure development projects, such as highways, dams, harbors, hospitals, airports and industrial development, as well as activity in the mining, forestry and commodities industries.
Other Key Developments
During the quarter ended March 31, 2023, we established two new plant locations: one in Tangier, Morocco, and another in Aldama, Mexico. These plants are a cornerstone in our strategy of globally expanding our electrical systems business.
During the quarter ended December 31, 2023, management approved restructuring programs to align the Company’s cost structure to support margin expansion. The programs include workforce reductions and footprint optimization across segments. We incurred $1.1 million expense during the year ended December 31, 2023 related to this program and expect the cost to be between $3.0 million to $3.5 million for the entire program.
Our Long-term Strategy
The Company's long-term strategy is to increase our sales, profits and shareholder value by growing our Electrical Systems segment to be our largest business while financially optimizing its core legacy businesses, organically growing in targeted areas, strengthening our product portfolio, increasing our margins and adding to our businesses through a focused M&A program. The Company expects to diversify its revenue and profits by product, customer, platform, and end market with a goal of becoming less cyclical and less customer concentrated while strengthening / enhancing current positions, entering new markets, developing relationships with new customers, and enhancing service to our customers, leading to increased return to our stockholders. Our products include electrical wire harnesses, seating systems, plastic components, cab structures, industrial automation subsystems, mirrors, wipers and other accessories.
We have a long-term strategy to globally optimize our cost structure through manufacturing process enhancements, low cost footprint and global sourcing. We periodically evaluate our short-term and long-term strategies and may adjust actions in response to changes in our business environment and other factors including but not limited to, implementing restructuring as needed.
We are also supplementing our organic strategies by evaluating strategic acquisition and divestiture opportunities. The company has many opportunities to accomplish this type of business improvement and is being selective.
CONSOLIDATED RESULTS OF OPERATIONS
The table below sets forth certain operating data expressed as a percentage of revenues for the twelve months ended (dollars are in thousands):
| 2023 | 2022 | 2021 | |||||||||||||||||||||||||||||||||
| Revenues | $ | 994,679 | 100.0 | % | $ | 981,553 | 100.0 | % | $ | 971,578 | 100.0 | % | |||||||||||||||||||||||
| Cost of revenues | 860,956 | 86.6 | 895,048 | 91.2 | 852,591 | 87.8 | |||||||||||||||||||||||||||||
| Gross profit | 133,723 | 13.4 | 86,505 | 8.8 | 118,987 | 12.2 | |||||||||||||||||||||||||||||
| Selling, general and administrative expenses | 85,663 | 8.6 | 66,361 | 6.8 | 69,406 | 7.1 | |||||||||||||||||||||||||||||
| Operating income | 48,060 | 4.8 | 20,144 | 2.1 | 49,581 | 5.1 | |||||||||||||||||||||||||||||
| Other (income) expense | 1,195 | 0.1 | 10,463 | 1.1 | (878) | (0.1) | |||||||||||||||||||||||||||||
| Interest expense | 10,691 | 1.1 | 9,827 | 1.0 | 11,179 | 1.2 | |||||||||||||||||||||||||||||
| Loss on extinguishment of debt | — | — | 921 | 0.1 | 7,155 | 0.7 | |||||||||||||||||||||||||||||
| Income (loss) before provision for income taxes | 36,174 | 3.6 | (1,067) | (0.1) | 32,125 | 3.3 | |||||||||||||||||||||||||||||
| Provision (benefit) for income taxes | (13,237) | (1.3) | 20,904 | 2.1 | 8,393 | 0.9 | |||||||||||||||||||||||||||||
| Net income (loss) | $ | 49,411 | 5.0 | % | $ | (21,971) | (2.2) | % | $ | 23,732 | 2.4 | % | |||||||||||||||||||||||
25
Year Ended December 31, 2023 Compared to Year Ended December 31, 2022
Consolidated Results
The table below sets forth certain consolidated operating data for the twelve months ended indicated (dollars are in thousands):
| 2023 | 2022 | Dollar Change | % Change | ||||||||||||||||||||
| Revenues | $ | 994,679 | $ | 981,553 | $ | 13,126 | 1.3% | ||||||||||||||||
| Gross profit | 133,723 | 86,505 | 47,218 | 54.6 | |||||||||||||||||||
| Selling, general and administrative expenses | 85,663 | 66,361 | 19,302 | 29.1 | |||||||||||||||||||
| Other (income) expense | 1,195 | 10,463 | (9,268) | (88.6) | |||||||||||||||||||
| Interest expense | 10,691 | 9,827 | 864 | 8.8 | |||||||||||||||||||
| Loss on extinguishment of debt | — | 921 | (921) | (100.0) | |||||||||||||||||||
| Provision (benefit) for income taxes | (13,237) | 20,904 | (34,141) | NM 1 | |||||||||||||||||||
| Net income (loss) | 49,411 | (21,971) | 71,382 | NM 1 | |||||||||||||||||||
1.Not meaningful
Revenues. The increase in consolidated revenues resulted from:
•a $55.4 million, or 7.3%, increase in sales to OEM and other revenues;
•a $6.6 million, or 4.9%, increase in aftermarket and OES sales; and
•a $48.8 million, or 55.7%, decrease in industrial automation sales.
Twelve months ended December 31, 2023 revenues were favorably impacted by foreign currency exchange translation of $2.0 million, which is reflected in the change in revenues above. The increase in revenues was primarily driven by increased pricing and increased sales volume from the Electrical Systems business, offset by lower sales volume in the Industrial Automation and Vehicle Solutions segments.
Gross Profit. Included in gross profit is cost of revenues, which consists primarily of raw materials and purchased components for our products, wages and benefits for our employees and overhead expenses such as manufacturing supplies, facility rent and utilities costs related to our operations. The increase in gross profit is primarily attributable to price increases with customers and cost reduction initiatives. Cost of revenues decreased $34.1 million, or 3.8% as a result of a decrease in raw material and purchased component costs of $50.0 million, or 8.4%; an increase in wages and benefits of $4.6 million, or 5.9%; and an increase in overhead expenses of $11.3 million, or 5.0%. As a percentage of revenues, gross profit margin was 13.4% for the year ended December 31, 2023 compared to 8.8% for the year ended December 31, 2022.
Selling, General and Administrative Expenses. Selling, general and administrative ("SG&A") expenses consist primarily of wages and benefits and other expenses such as marketing, travel, legal, audit, rent and utilities costs, which are not directly or indirectly associated with the manufacturing of our products. SG&A expenses increased $19.3 million in the year ended December 31, 2023 as compared to the year ended December 31, 2022 primarily due to increased employee salaries, incentive compensation, recruitment costs, travel spending and professional services. As a percentage of revenues, SG&A expense was 8.6% for the twelve months ended December 31, 2023 compared to 6.8% for the twelve months ended December 31, 2022.
Other (Income) Expense. Other expense decreased $9.3 million in the year ended December 31, 2023 as compared to the year ended December 31, 2022 due primarily to the settlement of the Company's U.S. Pension Plan liabilities of $9.2 million completed during the year ended December 31, 2022.
Interest Expense. Interest associated with our debt was $10.7 million and $9.8 million for the years ended December 31, 2023 and 2022, respectively. The increase primarily related to higher interest rates on variable rate debt, offset by lower average debt balances during the respective comparative periods.
Loss on extinguishment of debt. On May 12, 2022, the Company refinanced its long-term debt, which resulted in a loss of $0.9 million, including a $0.6 million non-cash write off relating to deferred financing costs of the Term loan facility due 2026 and $0.3 million of other associated fees.
Provision (Benefit) for Income Taxes. Income tax benefit of $13.2 million and expense of $20.9 million were recorded for the years ended December 31, 2023 and 2022, respectively. The period over period change in income tax was primarily attributable to the reversal of $22.0 million valuation allowance on our U.S. deferred tax assets during 2023 versus the 2022 establishment
26
of a full valuation allowance on our U.S. deferred tax assets of $24.5 million, offset by the reversal of a $9.9 million valuation allowance on our United Kingdom (U.K.) deferred tax asset.
In 2021, as part of the Organization for Economic Co-operation and Development's ("OECD") Inclusive Framework, 140 member countries agreed to the implementation of the Pillar Two Global Minimum Tax ("Pillar Two") of 15%. The OECD continues to release additional guidance, including administrative guidance on how Pillar Two rules should be interpreted and applied by jurisdictions as they adopt Pillar Two. These changes, when enacted by various countries in which we do business, may increase our taxes in these countries. Changes to these and other areas in relation to international tax reform, including future actions taken by foreign governments in response to Pillar Two, could increase uncertainty and may adversely affect our tax rate and cash flow in future years. We continue to evaluate the potential impact on future periods of Pillar Two, pending legislative adoption by individual countries.
SEGMENT RESULTS OF OPERATIONS
Vehicle Solutions Segment Results
Year Ended December 31, 2023 Compared to Year Ended December 31, 2022
The table below sets forth certain Vehicle Solutions Segment operating data for the twelve months ended, (dollars are in thousands):
| 2023 | 2022 | Dollar Change | % Change | |||||||||||||||||||||||
| Revenues | $ | 587,119 | $ | 579,731 | $ | 7,388 | 1.3% | |||||||||||||||||||
| Gross profit | 68,129 | 45,979 | 22,150 | 48.2 | ||||||||||||||||||||||
| Selling, general & administrative expenses | 26,109 | 24,930 | 1,179 | 4.7 | ||||||||||||||||||||||
| Operating income (loss) | 42,020 | 21,049 | 20,971 | 99.6 | ||||||||||||||||||||||
Revenues. The increase in 2023 revenues of $7.4 million from 2022 primarily resulted from increased pricing which more than offset lower sales volume.
Gross Profit. The increase in 2023 gross profit of $22.2 million from 2022 was primarily due to price increases with customers, cost reduction initiatives, and a decrease in cost of revenues driven by a decrease in raw material and purchased component costs of $25.8 million, or 7.1%; offset by an increase in overhead expenses of $7.9 million, or 5.8%; and an increase in wages and benefits of $3.1 million, or 9.1%.
As a percentage of revenues, gross profit for the years ended December 31, 2023 and 2022, was 11.6% and 7.9%, respectively. The increase in gross profit in 2023 from 2022 was primarily due to price increases with customers and cost reduction initiatives including lower freight costs, lower startup costs, and improved manufacturing efficiencies.
Selling, General and Administrative Expenses. The increase in 2023 SG&A expenses of $1.2 million from 2022 was primarily due to an increase in system implementation costs and employee benefit costs including salaries and incentive compensation expenses.
27
Electrical Systems Segment Results
Year Ended December 31, 2023 Compared to Year Ended December 31, 2022
The table below sets forth certain Electrical Systems Segment operating data for the twelve months ended, (dollars are in thousands):
| 2023 | 2022 | Dollar Change | % Change | |||||||||||||||||||||||
| Revenues | $ | 228,424 | $ | 180,404 | $ | 48,020 | 26.6% | |||||||||||||||||||
| Gross profit | 35,397 | 23,993 | 11,404 | 47.5 | ||||||||||||||||||||||
| Selling, general & administrative expenses | 9,107 | 5,775 | 3,332 | 57.7 | ||||||||||||||||||||||
| Operating income | 26,290 | 18,218 | 8,072 | 44.3 | ||||||||||||||||||||||
Revenues. The increase in 2023 revenues of $48.0 million from 2022 is primarily attributable to sales volume and increased pricing to offset material cost pass-through and other inflationary items.
Gross Profit. The increase in 2023 gross profit of $11.4 million from 2022 was primarily attributable to volume leverage and increased pricing to offset material cost pass-through and other inflationary items. Cost of revenues increased in line with the sales increase of 26.6%, driven by an increase in raw material and purchased component costs of $19.1 million, or 21.8%; an increase in overhead expenses of $11.8 million, or 28.6%; and an increase in wages and benefits of $5.7 million, or 20.8%.
As a percentage of revenues, gross profit for the years ended December 31, 2023 and 2022, was 15.5% and 13.3%, respectively. The increase in 2023 gross profit margin was primarily due to volume leverage and increased pricing, more than offsetting inflationary items.
Selling, General and Administrative Expenses. 2023 SG&A expenses increased $3.3 million from 2022, primarily driven by increased headcount and incentive adjustments based on performance.
Aftermarket & Accessories Segment Results
Year Ended December 31, 2023 Compared to Year Ended December 31, 2022
The table below sets forth certain Aftermarket & Accessories Segment operating data for the twelve months ended, (dollars are in thousands):
| 2023 | 2022 | Dollar Change | % Change | |||||||||||||||||||||||
| Revenues | $ | 140,236 | $ | 133,671 | $6,565 | 4.9% | ||||||||||||||||||||
| Gross profit | 27,187 | 18,836 | 8,351 | 44.3 | ||||||||||||||||||||||
| Selling, general & administrative expenses | 8,144 | 6,925 | 1,219 | 17.6 | ||||||||||||||||||||||
| Operating income | 19,043 | 11,911 | 7,132 | 59.9 | ||||||||||||||||||||||
Revenues. The increase in 2023 revenues of $6.6 million from 2022 resulted from increased pricing to offset material cost pass-through and other inflationary items.
Gross Profit. The increase in 2023 gross profit of $8.4 million from 2022 is primarily due to increased pricing to offset material cost inflation and other inflationary items, cost reduction initiatives, and a decrease in cost of revenue driven by a decrease in wages and benefits of $2.5 million, or 23.4%; offset by an increase in raw material and purchased component costs of $0.6 million, or 0.9%; and an increase in overhead expenses of $0.2 million, or 0.5%.
As a percentage of revenues, gross profit for the years ended December 31, 2023 and 2022, was 19.4% and 14.1%, respectively. The increase in 2023 gross profit margin is primarily due to increased pricing offsetting moderating cost inflation and cost reduction initiatives including lower freight costs. The twelve months ended December 31, 2022 results include charges of $1.9 million associated with the restructuring program.
28
Selling, General and Administrative Expenses. The increase in 2023 SG&A expenses of $1.2 million from 2022, is primarily driven by commissions expense increase and is consistent with the prior year on a percent of sales basis.
Industrial Automation Segment Results
Year Ended December 31, 2023 Compared to Year Ended December 31, 2022
The table below sets forth certain Industrial Automation Segment operating data for the twelve months ended, (dollars are in thousands):
| 2023 | 2022 | Dollar Change | % Change | |||||||||||||||||||||||
| Revenues | $ | 38,900 | $ | 87,747 | $ | (48,847) | (55.7)% | |||||||||||||||||||
| Gross profit | 3,010 | (2,303) | 5,313 | NM 1 | ||||||||||||||||||||||
| Selling, general & administrative expenses | 4,392 | 5,564 | (1,172) | (21.1) | ||||||||||||||||||||||
| Operating income (loss) | (1,382) | (7,867) | 6,485 | (82.4) | ||||||||||||||||||||||
1.Not meaningful
Revenues. The decrease in 2023 revenues of $48.8 million from 2022 primarily resulted from lower sales volume due to decreased customer demand.
Gross Profit. The increase in 2023 gross profit of $5.3 million from 2022 was primarily attributable to the inclusion of a $10.4 million inventory charge in the 2022 results which did not recur in 2023, and $1.2 million less restructuring costs in 2023 versus 2022. Cost of revenues decreased in line with the sales decrease of 55.7%, driven by a decrease in raw material and purchased component costs of $43.7 million, or 61.8%; a decrease in overhead expenses of $8.7 million, or 55.8%; and a decrease in wages and benefits of $1.7 million, or 46.9%.
As a percentage of revenues, gross profit for the years ended December 31, 2023 and 2022, was 7.7% and (2.6)%, respectively. The increase in gross profit as a percentage of revenues in 2023 from 2022 was due to nonrecurring costs recognized in 2022, including a $10.4 million inventory charge.
Selling, General and Administrative Expenses. SG&A expenses decreased $1.2 million in 2023 compared to 2022, primarily driven by overhead reduction.
Liquidity and Capital Resources
At December 31, 2023, the Company had no borrowings under its revolving credit facility. At December 31, 2023, the Company had liquidity of $197.9 million, including $37.8 million of cash and $160.1 million availability from its U.S. and China credit facilities.
We intend to allocate resources consistent with the following priorities: (1) invest in growth; (2) invest in operational improvements; (3) manage working capital; (4) to reduce debt; and (5) other actions deemed appropriate by management to improve operational performance.
Our primary sources of liquidity during the year ended December 31, 2023 were operating income, cash and availability under our credit facility. We believe that these sources of liquidity will provide adequate funds for our working capital needs, capital expenditures and debt service throughout the next twelve months. However, no assurance can be given that this will be the case. We also rely on the timely collection of receivables as a source of liquidity. As of December 31, 2023, we had outstanding letters of credit of $1.2 million and borrowing availability of $160.1 million from our U.S. and China credit facilities.
As of December 31, 2023, cash of $37.8 million was held by foreign subsidiaries. The Company had a $0.5 million deferred tax liability as of December 31, 2023 for the expected future income tax implications of repatriating cash from the foreign subsidiaries for which indefinite reinvestment is not expected.
Covenants and Liquidity
On May 12, 2022, the Company entered into an amendment to increase its existing senior secured credit facilities to $325 million from $275 million consisting of a $175 million Term Loan A and a $150 million Revolving Credit Facility. The
29
amendment provides the Company with additional capital flexibility to execute upon its transformation and growth initiatives. As part of the amended terms of the agreement, the maturity date of the Senior Secured Credit Facilities has been extended by twelve months to May 12, 2027, the interest rate decreased by 50 bps at various leverage ratios based on SOFR, and the maximum consolidated total leverage ratio increased from 3.25x to 3.75x until December 31, 2022 with a quarterly step down of 25 bps to 3.00x leverage by September 30, 2023 and the maximum consolidated total leverage ratio will remain at this level thereafter. Further, separate from the Company’s annual $35 million capital spending cap, a one-time $45 million capital project basket was included in the amendment. All other key provisions, including the $75 million accordion, acquisition holiday, and other baskets remain unchanged.
Our ability to comply with the covenants in the Credit Agreement, as discussed in Note 3, Debt, may be affected by economic or business conditions beyond our control. Based on our current forecast, we believe that we will be able to maintain compliance with the financial maintenance covenants and the fixed charge coverage ratio covenant and other covenants in the Credit Agreement for the next twelve months; however, no assurances can be given that we will be able to comply. We base our forecasts on historical experience, industry forecasts and other assumptions that we believe are reasonable under the circumstances. If actual results are substantially different than our current forecast, we may not be able to comply with our financial covenants.
Cash Flows
| 2023 | 2022 | 2021 | |||||||||||||||
| (In thousands) | |||||||||||||||||
| Net cash provided (used) by operating activities | $ | 38,276 | $ | 68,947 | $ | (29,832) | |||||||||||
| Net cash used in investing activities | (19,696) | (19,710) | (17,566) | ||||||||||||||
| Net cash (used) provided in financing activities | (12,729) | (50,091) | 31,011 | ||||||||||||||
| Effect of currency exchange rate changes on cash | 172 | (2,279) | 842 | ||||||||||||||
Net increase (decrease) in cash | $ | 6,023 | $ | (3,133) | $ | (15,545) | |||||||||||
Operating activities. For the year ended December 31, 2023, net cash provided by operations was $38.3 million compared to $68.9 million for the year ended December 31, 2022. Net cash provided by operating activities is primarily attributable to an increase in working capital offset by the improved financial results during the year ended December 31, 2023 as compared to the prior year period.
Investing activities. Net cash used in investing activities was $19.7 million for the year ended December 31, 2023 and 2022. In 2024, we expect capital expenditures to be in the range of $25 million to $30 million.
Financing activities. For the year ended December 31, 2023, net cash used in financing activities was $12.7 million compared to $50.1 million for the year ended December 31, 2022. Net cash used in financing activities for the year ended December 31, 2023 is primarily attributable to $10.9 million of net repayments under our credit facilities compared to net repayments of $43.2 million in the prior year.
Debt and Credit Facilities
The debt and credit facility summaries described in Note 3, Debt, to our consolidated financial statements in Item 8 in this Annual Report on Form 10-K are incorporated in this section by reference.
30
Contractual Obligations and Commercial Commitments
The following table reflects our contractual obligations as of December 31, 2023 (in thousands):
| Payments Due by Period | |||||||||||||||||||||||||||||
| Total | 1 Year | 2-3 Years | 4-5 Years | More than 5 Years | |||||||||||||||||||||||||
| (In thousands) | |||||||||||||||||||||||||||||
| Debt obligations | $ | 141,563 | $ | 15,313 | $ | 43,750 | $ | 82,500 | $ | — | |||||||||||||||||||
| Estimated interest payments | 28,939 | 10,332 | 16,426 | 2,181 | — | ||||||||||||||||||||||||
| Leasing obligations | 48,271 | 10,517 | 16,394 | 6,761 | 14,599 | ||||||||||||||||||||||||
| Non-U.S. pension funding | 13,913 | 1,199 | 2,511 | 2,777 | 7,426 | ||||||||||||||||||||||||
| Total | $ | 232,686 | $ | 37,361 | $ | 79,081 | $ | 94,219 | $ | 22,025 | |||||||||||||||||||
We estimated future interest payments based on the effective interest rate as of December 31, 2023. Since December 31, 2023, there have been no material changes outside the ordinary course of business to our contractual obligations as set forth above.
Generally, we enter into agreements with our customers at the beginning of a given vehicle platform’s life to supply products for the entire life of that vehicle platform. These agreements generally provide for the supply of a customer’s production requirements for a particular platform rather than for the purchase of a specific quantity of products. The obligations under these agreements and regulations are not reflected in the contractual obligations table above.
As of December 31, 2023, we were not a party to significant purchase obligations for goods or services.
Critical Accounting Policies and Estimates
Our consolidated financial statements are prepared in conformity with accounting principles generally accepted in the United States of America (“U.S. GAAP”). For a comprehensive discussion of our significant accounting policies, see Note 1, Significant Accounting Policies, to our consolidated financial statements in Item 8 in this Annual Report on Form 10-K.
The preparation of our consolidated financial statements requires us to make estimates and assumptions that affect the reported amounts of assets and liabilities and disclosure of contingent assets and liabilities at the date of the financial statements and the reported amounts of revenues and expenses during the reporting period. We evaluate our estimates and assumptions on an ongoing basis, particularly relating to accounts receivable reserves, inventory reserves, goodwill, intangible and long-lived assets, income taxes, warranty reserves, litigation reserves and pension and other post-retirement benefit plans. We base our estimates on historical experience and other assumptions that we believe are reasonable under the circumstances, the results of which form the basis for making judgments about the carrying value of assets, liabilities and equity that are not readily apparent from other sources. Actual results and outcomes could differ materially from these estimates and assumptions. See Item 1A - Risk Factors in this Annual Report on Form 10-K for additional information regarding risk factors that may impact our estimates.
Revenue Recognition — We recognize revenue when our performance obligation has been satisfied and control of products has been transferred to a customer, which typically occurs upon shipment. Revenue is measured based on the amount of consideration we expect to receive in exchange for the transfer of goods or services. We enter into agreements with certain customers in the Vehicle Solutions segment at the beginning of a vehicle platform’s life to supply products for that vehicle platform. Once we enter into such agreements, fulfillment of our requirements is our obligation for the entire production life of the platform. Such contracts typically contain restrictive provisions related to termination. Management judgments and estimates must be made in estimating sales returns and allowances relating to revenue recognized in a given period.
Inventory — Inventories are valued at the lower of first-in, first-out cost or net realizable value. Cost includes applicable material, labor and overhead. We value our finished goods inventory at a standard cost that is periodically adjusted to approximate actual cost. Inventory quantities on-hand are regularly reviewed, and where necessary, provisions for excess and obsolete inventory are recorded based primarily on our estimated production requirements driven by expected market volumes.
Income Taxes — We recognize deferred tax assets and liabilities for the expected future tax consequences of events that have been included in our financial statements or tax returns. Deferred tax assets and liabilities are determined based on the difference between the financial statements and tax basis of assets and liabilities using enacted tax laws and rates expected to be in place when the deferred tax items are realized. We recognize tax positions initially in the financial statements when it is more likely than not the position will be sustained upon examination by the tax authorities. We provide a valuation allowance for deferred tax assets when it is more likely than not that a portion of such deferred tax assets will not be realized.
31
Item 7A.Quantitative and Qualitative Disclosures About Market Risk
We are exposed to various market risks, including changes in foreign currency exchange rates and interest rates. Market risk is the potential loss arising from adverse changes in market rates and prices, such as foreign currency exchange and interest rates. We do not enter into derivatives or other financial instruments for trading or speculative purposes. We enter into financial instruments, from time to time, to manage the impact of changes in foreign currency exchange rates and interest rates and to hedge a portion of future anticipated currency transactions. The counterparties are primarily major financial institutions.
Interest Rate Risk
We manage our interest rate risk by balancing the amount of our fixed rate and variable rate debt. To manage its exposure to variable interest rates in a cost-efficient manner, the Company enters into interest rate swaps in which the Company agrees to exchange, at specified intervals, the difference between fixed and variable interest amounts calculated by reference to an agreed-upon notional principal amount. The Company entered into an interest rate swap agreement to fix the interest rate on approximately 50% of the outstanding Term Loan Facility, which was an initial aggregate amount of $87.5 million thereby reducing exposure to interest rate changes. A change in our variable interest rate of 100 basis points for a full twelve-month period would have an approximate $1.4 million impact on interest expense assuming approximately 50% of our average fiscal 2023 variable-rate term loan debt had not been hedged via an interest rate swap agreement.
Foreign Currency Risk
A portion of our revenues during the year ended December 31, 2023 were derived from manufacturing operations outside of the U.S. The results of operations and the financial position of our operations in these other countries are primarily measured in their respective currency and translated into U.S. Dollars. A portion of the expenses incurred in these countries is in currencies different from which revenue is generated. As discussed above, from time to time, we enter into forward exchange contracts to mitigate a portion of this currency risk. The reported income of these operations will be higher or lower depending on a weakening or strengthening of the U.S. Dollar against the respective foreign currency.
A portion of our long-term assets and liabilities at December 31, 2023 are based in our foreign operations and are translated into U.S. Dollars at foreign currency exchange rates in effect as of the end of each period with the effect of such translation reflected as a separate component of stockholders’ equity. Accordingly, our stockholders’ investment will fluctuate depending upon the weakening or strengthening of the U.S. Dollar against the respective foreign currency. The principal currencies of exposure are the Mexican Peso, Chinese Yuan, British Pound, Euro, Czech Koruna, Australian Dollar, Indian Rupee, Thai Baht, Ukrainian Hryvnia and Moroccan Dirham.
Refer to Note 5, Fair Value Measurement, of the Notes to Consolidated Financial Statements included in this Form 10-K for discussion of these market risks and the derivatives used to manage these risks.
Effects of Inflation
Inflation potentially affects us in two principal ways. First, borrowings under our revolving credit facility are tied to prevailing short-term interest rates that may change as a result of inflation rates, translating into changes in interest expense. Second, general inflation can impact material purchases, labor, and pension liabilities. In many cases, we have limited ability to pass through inflation-related cost increases due to the competitive nature of the markets that we serve.
32
Item 8.Financial Statements and Supplementary Data
INDEX TO CONSOLIDATED FINANCIAL STATEMENTS
Documents Filed as Part of this Annual Report on Form 10-K
| Page | |||||
33
REPORT OF INDEPENDENT REGISTERED PUBLIC ACCOUNTING FIRM
To the Stockholders and Board of Directors
Commercial Vehicle Group, Inc.:
Opinion on the Consolidated Financial Statements
We have audited the accompanying consolidated balance sheets of Commercial Vehicle Group, Inc. and subsidiaries (the Company) as of December 31, 2023 and 2022, the related consolidated statements of operations, comprehensive income (loss), stockholders’ equity, and cash flows for each of the years in the three-year period ended December 31, 2023, and the related notes to the consolidated financial statements (collectively, the consolidated financial statements). In our opinion, the consolidated financial statements present fairly, in all material respects, the financial position of the Company as of December 31, 2023 and 2022, and the results of its operations and its cash flows for each of the years in the three-year period ended December 31, 2023, in conformity with U.S. generally accepted accounting principles.
We also have audited, in accordance with the standards of the Public Company Accounting Oversight Board (United States) (PCAOB), the Company’s internal control over financial reporting as of December 31, 2023, based on criteria established in
Internal Control – Integrated Framework (2013) issued by the Committee of Sponsoring Organizations of the Treadway Commission, and our report dated March 14, 2024 expressed an unqualified opinion on the effectiveness of the Company’s internal control over financial reporting.
Basis for Opinion
These consolidated financial statements are the responsibility of the Company’s management. Our responsibility is to express an opinion on these consolidated financial statements based on our audits. We are a public accounting firm registered with the PCAOB and are required to be independent with respect to the Company in accordance with the U.S. federal securities laws and the applicable rules and regulations of the Securities and Exchange Commission and the PCAOB.
We conducted our audits in accordance with the standards of the PCAOB. Those standards require that we plan and perform the audit to obtain reasonable assurance about whether the consolidated financial statements are free of material misstatement, whether due to error or fraud. Our audits included performing procedures to assess the risks of material misstatement of the consolidated financial statements, whether due to error or fraud, and performing procedures that respond to those risks. Such procedures included examining, on a test basis, evidence regarding the amounts and disclosures in the consolidated financial statements. Our audits also included evaluating the accounting principles used and significant estimates made by management, as well as evaluating the overall presentation of the consolidated financial statements. We believe that our audits provide a reasonable basis for our opinion.
Critical Audit Matter
The critical audit matter communicated below is a matter arising from the current period audit of the consolidated financial statements that was communicated or required to be communicated to the audit committee and that: (1) relates to accounts or disclosures that are material to the consolidated financial statements and (2) involved our especially challenging, subjective, or complex judgments. The communication of a critical audit matter does not alter in any way our opinion on the consolidated financial statements, taken as a whole, and we are not, by communicating the critical audit matter below, providing a separate opinion on the critical audit matter or on the accounts or disclosures to which it relates.
Testing of revenue
As discussed in Note 2 to the consolidated financial statements, revenue is recognized when a performance obligation has been satisfied and control of a product has been transferred to the customer, usually at a designated shipping point and in accordance with customer specifications. Revenue is measured based on the amount of consideration the Company expects to receive in exchange for the transfer of goods or services. For the year ended December 31, 2023, the Company recorded $994.7 million of revenue.
We identified the testing of revenue as a critical audit matter due to the large volume of data and the number and complexity of the revenue accounting systems. While revenues consist of a large number of similar, individually low value transactions, the processing and recording of revenue is reliant upon multiple information technology (IT) systems used to process large volumes of customer billing data. Specialized skills and knowledge were needed to test the IT systems used for the processing and recording of revenue.
34
The following are the primary procedures we performed to address this critical audit matter. We applied auditor judgment to determine the nature and extent of procedures to be performed over revenue. We evaluated the design and tested the operating effectiveness of certain internal controls related to the processing and recording of revenue. This included controls over the IT systems and automated and manual process level controls related to the processing and recording of revenue. We performed a software-assisted data analysis to assess certain relationships among revenue transactions. For a selection of transactions, we (1) compared the amount of revenue recorded to a combination of Company internal data, executed contracts, and/or other relevant and reliable third-party data, including cash received from customers and (2) evaluated the timing of revenue recognition based on the shipment date. In addition, we involved IT professionals with specialized skills and knowledge, who assisted in the identification and testing of certain IT systems used by the Company for the processing and recording of revenue. We evaluated the sufficiency of audit evidence obtained by assessing the results of procedures performed, including the appropriateness of the nature and extent of the audit effort.
/s/ KPMG LLP
We have served as the Company’s auditor since 2012.
March 14, 2024
35
COMMERCIAL VEHICLE GROUP, INC. AND SUBSIDIARIES
CONSOLIDATED STATEMENTS OF OPERATIONS
Years Ended December 31, 2023, 2022 and 2021
| 2023 | 2022 | 2021 | |||||||||||||||
| (In thousands, except per share amounts) | |||||||||||||||||
| Revenues | $ | $ | $ | ||||||||||||||
| Cost of revenues | |||||||||||||||||
| Gross profit | |||||||||||||||||
| Selling, general and administrative expenses | |||||||||||||||||
| Operating income | |||||||||||||||||
| Other (income) expense | ( | ||||||||||||||||
| Interest expense | |||||||||||||||||
| Loss on extinguishment of debt | |||||||||||||||||
| Income (loss) before provision for income taxes | ( | ||||||||||||||||
| Provision (benefit) for income taxes | ( | ||||||||||||||||
| Net income (loss) | $ | $ | ( | $ | |||||||||||||
| Earnings (loss) per common share | |||||||||||||||||
| Basic | $ | $ | ( | $ | |||||||||||||
| Diluted | $ | $ | ( | $ | |||||||||||||
| Weighted average shares outstanding | |||||||||||||||||
| Basic | |||||||||||||||||
| Diluted | |||||||||||||||||
The accompanying notes are an integral part of these consolidated financial statements.
36
COMMERCIAL VEHICLE GROUP, INC. AND SUBSIDIARIES
CONSOLIDATED STATEMENTS OF COMPREHENSIVE INCOME (LOSS)
Years Ended December 31, 2023, 2022 and 2021
| 2023 | 2022 | 2021 | ||||||||||||||||||
| (In thousands) | ||||||||||||||||||||
| Net income (loss) | $ | $ | ( | $ | ||||||||||||||||
| Other comprehensive income (loss): | ||||||||||||||||||||
| Foreign currency translation adjustments | ( | ( | ||||||||||||||||||
| Change in defined benefit plans, net of tax | ( | |||||||||||||||||||
| Derivative instruments, net of tax | ( | |||||||||||||||||||
| Other comprehensive income | ||||||||||||||||||||
| Comprehensive income (loss) | $ | $ | ( | $ | ||||||||||||||||
The accompanying notes are an integral part of these consolidated financial statements.
37
COMMERCIAL VEHICLE GROUP, INC. AND SUBSIDIARIES
CONSOLIDATED BALANCE SHEETS
December 31, 2023 and 2022
| 2023 | 2022 | ||||||||||
| ASSETS | (in thousands, except share and per share amounts) | ||||||||||
| Current assets: | |||||||||||
| Cash | $ | $ | |||||||||
Accounts receivable, net of allowances of $ | |||||||||||
| Inventories | |||||||||||
| Other current assets | |||||||||||
| Total current assets | |||||||||||
Property, plant and equipment, net of accumulated depreciation of $ | |||||||||||
| Operating lease right-of-use asset, net | |||||||||||
Intangible assets, net of accumulated amortization of $ | |||||||||||
| Deferred income taxes, net | |||||||||||
| Other assets | |||||||||||
| TOTAL ASSETS | $ | $ | |||||||||
| LIABILITIES AND STOCKHOLDERS’ EQUITY | |||||||||||
| Current liabilities: | |||||||||||
| Accounts payable | $ | $ | |||||||||
| Current operating lease liabilities | |||||||||||
| Accrued liabilities and other | |||||||||||
| Current portion of long-term debt | |||||||||||
| Total current liabilities | |||||||||||
| Long-term debt | |||||||||||
| Long-term operating lease liabilities | |||||||||||
| Pension and other post-retirement liabilities | |||||||||||
| Other long-term liabilities | |||||||||||
| Total liabilities | |||||||||||
Commitments and contingencies (Note 15) | |||||||||||
| Stockholders’ equity: | |||||||||||
Preferred stock, $ | |||||||||||
Common stock, $ | |||||||||||
Treasury stock, at cost: | ( | ( | |||||||||
| Additional paid-in capital | |||||||||||
| Retained deficit | ( | ( | |||||||||
| Accumulated other comprehensive loss | ( | ( | |||||||||
| Total stockholders’ equity | |||||||||||
| TOTAL LIABILITIES AND STOCKHOLDERS' EQUITY | $ | $ | |||||||||
The accompanying notes are an integral part of these consolidated financial statements.
38
COMMERCIAL VEHICLE GROUP, INC. AND SUBSIDIARIES
CONSOLIDATED STATEMENTS OF STOCKHOLDERS’ EQUITY
Years Ended December 31, 2023, 2022 and 2021
| Common Stock | Treasury Stock | Additional Paid-In Capital | Retained Deficit | Accumulated Other Comprehensive Loss | Total CVG Stockholders’ Equity | ||||||||||||||||||||||||||||||||||||
| Shares | Amount | ||||||||||||||||||||||||||||||||||||||||
| (In thousands, except share data ) | |||||||||||||||||||||||||||||||||||||||||
| Balance - December 31, 2020 | $ | $ | ( | $ | $ | ( | $ | ( | $ | ||||||||||||||||||||||||||||||||
| Issuance of restricted stock | — | — | — | — | |||||||||||||||||||||||||||||||||||||
| Surrender of common stock by employees | ( | — | ( | — | — | — | ( | ||||||||||||||||||||||||||||||||||
| Share-based compensation expense | — | — | — | — | — | ||||||||||||||||||||||||||||||||||||
| Total comprehensive income | — | — | — | — | |||||||||||||||||||||||||||||||||||||
| Balance - December 31, 2021 | $ | $ | ( | $ | $ | ( | $ | ( | $ | ||||||||||||||||||||||||||||||||
| Issuance of restricted stock | — | — | — | — | |||||||||||||||||||||||||||||||||||||
| Surrender of common stock by employees | ( | ( | ( | — | — | — | ( | ||||||||||||||||||||||||||||||||||
| Share-based compensation expense | — | — | — | — | — | ||||||||||||||||||||||||||||||||||||
| Total comprehensive income (loss) | — | — | — | — | ( | ( | |||||||||||||||||||||||||||||||||||
| Balance - December 31, 2022 | $ | $ | ( | $ | $ | ( | $ | ( | $ | ||||||||||||||||||||||||||||||||
| Issuance of restricted stock | — | — | — | — | |||||||||||||||||||||||||||||||||||||
| Surrender of common stock by employees | ( | ( | ( | — | — | — | ( | ||||||||||||||||||||||||||||||||||
| Share-based compensation expense | — | — | — | — | — | ||||||||||||||||||||||||||||||||||||
| Total comprehensive income | — | — | — | — | |||||||||||||||||||||||||||||||||||||
| Balance - December 31, 2023 | $ | $ | ( | $ | $ | ( | $ | ( | $ | ||||||||||||||||||||||||||||||||
The accompanying notes are an integral part of these consolidated financial statements.
39
COMMERCIAL VEHICLE GROUP, INC. AND SUBSIDIARIES
CONSOLIDATED STATEMENTS OF CASH FLOWS
Years Ended December 31, 2023, 2022 and 2021
| 2023 | 2022 | 2021 | |||||||||||||||
| (In thousands) | |||||||||||||||||
| CASH FLOWS FROM OPERATING ACTIVITIES: | |||||||||||||||||
| Net income (loss) | $ | $ | ( | $ | |||||||||||||
| Adjustments to reconcile net income to net cash provided by operating activities: | |||||||||||||||||
| Depreciation and amortization | |||||||||||||||||
| Noncash amortization of debt financing costs | |||||||||||||||||
| Pension plan settlement | |||||||||||||||||
| Payment in kind interest expense | |||||||||||||||||
| Shared-based compensation expense | |||||||||||||||||
| Deferred income taxes | ( | ||||||||||||||||
Noncash gain on forward exchange contracts | ( | ( | ( | ||||||||||||||
| Loss on extinguishment of debt | |||||||||||||||||
| Settlement of derivative contract | |||||||||||||||||
| Change in other operating items: | |||||||||||||||||
| Accounts receivable | ( | ||||||||||||||||
| Inventories | ( | ( | |||||||||||||||
| Prepaid expenses | ( | ( | |||||||||||||||
| Accounts payable | ( | ( | |||||||||||||||
| Accrued liabilities | ( | ||||||||||||||||
| Other operating activities, net | ( | ( | |||||||||||||||
Net cash provided by (used in) operating activities | ( | ||||||||||||||||
| CASH FLOWS FROM INVESTING ACTIVITIES: | |||||||||||||||||
| Purchases of property, plant and equipment | ( | ( | ( | ||||||||||||||
| Proceeds from disposal/sale of property, plant and equipment | |||||||||||||||||
| Net cash used in investing activities | ( | ( | ( | ||||||||||||||
| CASH FLOWS FROM FINANCING ACTIVITIES: | |||||||||||||||||
| Borrowings under term loan facility | |||||||||||||||||
| Repayment of term loan facility | ( | ( | ( | ||||||||||||||
| Repayment of 2023 term loan facility principal | ( | ||||||||||||||||
| Borrowings under revolving credit facility | |||||||||||||||||
| Repayment of revolving credit facility | ( | ( | ( | ||||||||||||||
| Borrowings under ABL revolving credit facility | |||||||||||||||||
| Repayment of ABL revolving credit facility | ( | ||||||||||||||||
Borrowings under China credit facility | |||||||||||||||||
| Repayment of China credit facility | ( | ||||||||||||||||
| Surrender of common stock by employees | ( | ( | ( | ||||||||||||||
| Debt extinguishment payments and early payment fees on debt | ( | ||||||||||||||||
| Debt issuance and amendment costs | ( | ( | |||||||||||||||
| Contingent consideration payment | ( | ( | |||||||||||||||
| Other financing activities, net | ( | ( | ( | ||||||||||||||
Net cash (used in) provided by financing activities | ( | ( | |||||||||||||||
| EFFECT OF CURRENCY EXCHANGE RATE CHANGES ON CASH | ( | ||||||||||||||||
| NET INCREASE (DECREASE) IN CASH | ( | ( | |||||||||||||||
| CASH: | |||||||||||||||||
| Beginning of period | |||||||||||||||||
| End of period | $ | $ | $ | ||||||||||||||
| SUPPLEMENTAL CASH FLOW INFORMATION: | |||||||||||||||||
| Cash paid for interest | $ | $ | $ | ||||||||||||||
| Cash paid for income taxes, net | $ | $ | $ | ||||||||||||||
| Unpaid purchases of property and equipment included in accounts payable | $ | $ | $ | ||||||||||||||
The accompanying notes are an integral part of these consolidated financial statements.
40
COMMERCIAL VEHICLE GROUP, INC. AND SUBSIDIARIES
NOTES TO CONSOLIDATED FINANCIAL STATEMENTS
Years Ended December 31, 2023, 2022 and 2021
1. Significant Accounting Policies
Organization - Commercial Vehicle Group, Inc. and its subsidiaries is a global provider of systems, assemblies and components to the global commercial vehicle market, the electric vehicle market, and the industrial automation markets. References herein to the "Company", "CVG", "we", "our", or "us" refer to Commercial Vehicle Group, Inc. and its subsidiaries.
We have manufacturing operations in the United States, Mexico, China, United Kingdom, Czech Republic, Ukraine, Morocco, Thailand, India and Australia. Our products are primarily sold in North America, Europe, and the Asia-Pacific region.
We primarily manufacture customized products to meet the requirements of our customer. We believe our products are used by a majority of the North American Commercial Truck manufacturers, many construction vehicle original equipment manufacturers ("OEMs"), parts and service dealers, distributors, as well as top e-commerce retailers.
We report our financial results by business segment; more specifically, Vehicle Solutions, Electrical Systems, Aftermarket & Accessories and Industrial Automation. The Company’s Chief Operating Decision Maker (“CODM”), its President and Chief Executive Officer, reviews financial information for these four reportable segments and makes decisions regarding the allocation of resources based on these segments. See Note 16, Segment Reporting, for more information.
Unless otherwise indicated, all amounts in the tables below are in thousands, except share and per share amounts.
Principles of Consolidation - The accompanying consolidated financial statements include the accounts of our wholly-owned or controlled subsidiaries. All intercompany accounts and transactions have been eliminated in consolidation.
Use of Estimates - The preparation of financial statements in conformity with accounting principles generally accepted in the United States of America (“U.S. GAAP”) requires management to make estimates and assumptions that affect the reported amounts of assets and liabilities and disclosure of contingent assets and liabilities at the date of the consolidated financial statements and the reported amounts of revenues and expenses during the reporting period. Actual results may differ materially from those estimates. Certain prior period amounts have been reclassified to conform to footnote presentation for the current year.
Cash - Cash consists of deposits with high credit-quality financial institutions.
Accounts Receivable - Trade accounts receivable are stated at current value less allowances, which approximates fair value. We review our receivables on an ongoing basis to ensure that they are properly valued and collectible.
The allowance for credit losses is used to record the estimated risk of loss related to our customers’ inability to pay. This allowance is maintained at a level that we consider appropriate based on factors that affect collectability, such as the financial health of our customers, historical trends of charge-offs and recoveries and current and expected economic market conditions. As we monitor our receivables, we identify customers that may have payment problems, and we adjust the allowance accordingly, with the offset to selling, general and administrative expense. Account balances are charged off against the allowance when recovery is considered remote.
41
Inventories consisted of the following as of December 31:
| 2023 | 2022 | ||||||||||
| Raw materials | $ | $ | |||||||||
| Work in process | |||||||||||
| Finished goods | |||||||||||
Total Inventories | $ | $ | |||||||||
Property, Plant and Equipment - Property, plant and equipment are stated at cost, net of accumulated depreciation.
Property, plant, and equipment, net consisted of the following as of December 31:
| 2023 | 2022 | ||||||||||
| Land and buildings | $ | $ | |||||||||
| Machinery and equipment | |||||||||||
| Construction in progress | |||||||||||
| Property, plant, and equipment, gross | |||||||||||
| Less accumulated depreciation | ( | ( | |||||||||
| Property, plant and equipment, net | $ | $ | |||||||||
For financial reporting purposes, depreciation is computed using the straight-line method over the estimated useful lives (generally 15 to 40 years for buildings and building improvements, to 20 years for machinery and equipment, to seven years for tools and dies, and to five years for computer hardware and software). Expenditures for maintenance and repairs are charged to expense as incurred. Expenditures for major betterments and renewals that extend the useful lives of property, plant and equipment are capitalized and depreciated over the remaining useful lives of the asset. When assets are retired or sold, the cost and related accumulated depreciation are removed from the accounts and any resulting gain or loss is recognized in the results of operations. Leasehold improvements are amortized using the straight-line method over the estimated useful lives of the improvements or the term of the lease, whichever is shorter. Accelerated depreciation methods are used for tax reporting purposes. Depreciation expense for property, plant and equipment for each of the years ended December 31, 2023, 2022 and 2021 was $14.2 million, $14.8 million and $15.1 million, respectively.
Leases - The Company determines if an arrangement is a lease at inception. Operating lease assets and liabilities are recognized at the commencement date of the lease based on the present value of lease payments over the lease term. Lease assets represent the Company’s right to use an underlying asset for the lease term and lease liabilities represent the Company’s obligation to make lease payments arising from the lease. As most leases do not provide an implicit interest rate, we use our incremental borrowing rate based on the information available at the lease commencement date in determining the present value of lease payments. The length of a lease term includes options to extend or terminate the lease when it is reasonably certain that the Company will exercise those options. The Company's accounting policy election is to not recognize lease assets or liabilities for leases with a term of 12 months or less. Additionally, when accounting for leases, the Company combines payments for leased assets, related services and other components of a lease.
Revenue Recognition - We recognize revenue when our performance obligation has been satisfied and control of products has been transferred to a customer, which typically occurs upon shipment. Revenue is measured based on the amount of consideration we expect to receive in exchange for the transfer of goods or services.
Refer to Note 2, Revenue Recognition, for our revenue recognition policies.
Income Taxes - We recognize deferred tax assets and liabilities for the expected future tax consequences of events that have been included in our financial statements or tax returns. Deferred tax assets and liabilities are determined based on the difference between the financial statements and tax basis of assets and liabilities based on enacted tax laws and rates expected to be in place when the deferred tax items are realized. In assessing the realizability of deferred tax assets, we consider whether it is more likely than not that a portion of the deferred tax assets will not be realized. We provide a valuation allowance for deferred tax assets when it is more likely than not that a portion of such deferred tax assets will not be realized.
42
We evaluate tax positions for recognition by determining, based on the weight of available evidence, whether it is more likely than not the position will be sustained upon audit. Any interest and penalties related to our uncertain tax positions are recognized in income tax expense.
Fair Value of Financial Instruments - The fair value framework requires the categorization of assets and liabilities into three levels based upon the assumptions (i.e., inputs) used to price the assets or liabilities. Level 1 provides the most reliable measure of fair value, whereas Level 3 generally requires significant management judgment. The three levels are defined as follows:
Level 1 - Unadjusted quoted prices in active markets for identical assets and liabilities.
Level 2 - Observable inputs other than those included in Level 1. For example, quoted prices for similar assets or liabilities in active markets and inactive markets.
Level 3 - Significant unobservable inputs reflecting management’s own assumptions about the inputs used in pricing the asset or liability.
Foreign Currency Translation - Our functional currency is the local currency. Accordingly, all assets and liabilities of our foreign subsidiaries are translated using exchange rates in effect at the end of the period; revenue and costs are translated using average exchange rates for the period. The related translation adjustments are reported in accumulated other comprehensive income (loss) in stockholders’ equity. Translation gains and losses arising from transactions denominated in a currency other than the functional currency of the entity are included in the results of operations.
Foreign Currency Forward Exchange Contracts - We use forward exchange contracts to hedge certain foreign currency transaction exposures. We estimate our projected revenues and purchases in certain foreign currencies or locations and hedge a portion of the anticipated long or short position. The contracts typically run from one month to eighteen months . All forward foreign exchange contracts that are not designated as hedging instruments have been marked-to-market and the fair value of contracts recorded in the Consolidated Balance Sheets with the offsetting non-cash gain or loss recorded in our Consolidated Statements of Operations. For forward contracts that are designated as hedging instruments, the gains and losses are recorded in accumulated other comprehensive income (loss) and recognized in the Consolidated Statement of Operations when the contracts are settled. We do not hold or issue foreign exchange options or forward contracts for trading purposes.
Recently Issued Accounting Pronouncements
In November 2023, the Financial Accounting Standards Board (“FASB”) issued ASU No. 2023-07, Improvements to Reportable Segment Disclosures (Topic 280). This ASU updates reportable segment disclosure requirements by requiring disclosures of significant reportable segment expenses that are regularly provided to the Chief Operating Decision Maker (“CODM”) and included within each reported measure of a segment's profit or loss. This ASU also requires disclosure of the title and position of the individual identified as the CODM and an explanation of how the CODM uses the reported measures of a segment’s profit or loss in assessing segment performance and deciding how to allocate resources. The ASU is effective for annual periods beginning after December 15, 2023, and interim periods within fiscal years beginning after December 15, 2024. Adoption of the ASU should be applied retrospectively to all prior periods presented in the financial statements. Early adoption
43
is also permitted. This ASU will likely result in us including the additional required disclosures when adopted. We are currently evaluating the provisions of this ASU and expect to adopt them for the year ending December 31, 2024.
In December 2023, the FASB issued ASU No. 2023-09, Improvements to Income Tax Disclosures (Topic 740). The ASU requires disaggregated information about a reporting entity’s effective tax rate reconciliation as well as additional information on income taxes paid. The ASU is effective on a prospective basis for annual periods beginning after December 15, 2024. Early adoption is also permitted for annual financial statements that have not yet been issued or made available for issuance. This ASU will result in the required additional disclosures being included in our consolidated financial statements, once adopted.
2. Revenue Recognition
Our products include seating systems, plastic components, cab structures, warehouse automation subsystems, electrical wire harnesses, mirrors, wipers and other accessories. We sell these products into multiple geographic regions including North America, Europe and Asia-Pacific and to multiple end markets. The nature, timing and uncertainty of recognition of revenue and associated cash flows across the varying product lines, geographic regions and customer end markets is substantially consistent.
Contractual Arrangements - Revenue is measured based on terms and conditions specified in contracts or purchase orders with customers. We have long-term contracts with some customers that govern overall terms and conditions which are accompanied by purchase orders that define specific order quantities and/or price. We have many customers with which we conduct business for which the terms and conditions are outlined in purchase orders without a long-term contract. We generally do not have customer contracts with minimum order quantity requirements.
Amount and Timing of Revenue Recognition - The transaction price is based on the consideration to which the Company will be entitled in exchange for transferring control of a product to the customer. This is defined in a purchase order or in a separate pricing arrangement and represents the stand-alone selling price. Our payment terms vary by customer. None of the Company's business arrangements as of December 31, 2023, contained a significant financing component. We typically do not have multiple performance obligations requiring us to allocate a transaction price.
Other Matters - Shipping and handling costs billed to customers are recorded in revenues and costs associated with outbound freight are generally accounted for as a fulfillment cost and are included in cost of revenues. We generally do not provide for extended warranties or material customer incentives. Our customers typically do not have a general right of return for our products.
We had outstanding customer accounts receivable, net of allowances, of $133.9 million as of December 31, 2023 and $152.6 million as of December 31, 2022. We generally do not have other assets or liabilities associated with customer arrangements.
Revenue Disaggregation - The following is the composition, by product category, of our revenues:
| Twelve Months Ended December 31, 2023 | |||||||||||||||||||||||||||||
| Vehicle Solutions | Electrical Systems | Aftermarket & Accessories | Industrial Automation | Total | |||||||||||||||||||||||||
| Seats | $ | $ | $ | $ | $ | ||||||||||||||||||||||||
| Electrical wire harnesses, panels and assemblies | |||||||||||||||||||||||||||||
| Plastic & Trim components | |||||||||||||||||||||||||||||
| Industrial Automation | |||||||||||||||||||||||||||||
| Cab structures | |||||||||||||||||||||||||||||
| Mirrors, wipers and controls | |||||||||||||||||||||||||||||
| Total | $ | $ | $ | $ | $ | ||||||||||||||||||||||||
44
| Twelve Months Ended December 31, 2022 | |||||||||||||||||||||||||||||
| Vehicle Solutions | Electrical Systems | Aftermarket & Accessories | Industrial Automation | Total | |||||||||||||||||||||||||
| Seats | $ | $ | $ | $ | $ | ||||||||||||||||||||||||
| Electrical wire harnesses, panels and assemblies | |||||||||||||||||||||||||||||
| Plastic & Trim components | |||||||||||||||||||||||||||||
| Industrial Automation | |||||||||||||||||||||||||||||
| Cab structures | |||||||||||||||||||||||||||||
| Mirrors, wipers and controls | |||||||||||||||||||||||||||||
| Total | $ | $ | $ | $ | $ | ||||||||||||||||||||||||
| Twelve Months Ended December 31, 2021 | |||||||||||||||||||||||||||||
| Vehicle Solutions | Electrical Systems | Aftermarket & Accessories | Industrial Automation | Total | |||||||||||||||||||||||||
| Seats | $ | $ | $ | $ | $ | ||||||||||||||||||||||||
| Electrical wire harnesses, panels and assemblies | |||||||||||||||||||||||||||||
| Plastic & Trim components | |||||||||||||||||||||||||||||
| Industrial Automation | |||||||||||||||||||||||||||||
| Cab structures | |||||||||||||||||||||||||||||
| Mirrors, wipers and controls | |||||||||||||||||||||||||||||
| Total | $ | $ | $ | $ | $ | ||||||||||||||||||||||||
3. Debt
Debt consisted of the following at December 31:
| 2023 | 2022 | ||||||||||
| Term loan facility | $ | $ | |||||||||
| Unamortized discount and issuance costs | ( | ( | |||||||||
| $ | $ | ||||||||||
| Less: current portion | ( | ( | |||||||||
| Total long-term debt, net of current portion | $ | $ | |||||||||
Credit Agreement
On April 30, 2021, the Company and certain of its subsidiaries entered into a credit agreement (the “Credit Agreement”) between, among others, Bank of America, N.A. as administrative agent (the “Administrative Agent”) and other lenders party thereto (the “Lenders”) pursuant to which the Lenders made available a $150 million Term Loan Facility (the “Term Loan Facility”) and a $125 million Revolving Credit Facility (the “Revolving Credit Facility” and together with the Term Loan Facility, the “Credit Facilities”). Subject to the terms of the Credit Agreement, the Revolving Credit Facility includes a $10 million swing line sublimit and a $10 million letter of credit sublimit. The Credit Agreement provides for an incremental term facility agreement and/or an increase of the Revolving Credit Facility (together, the “Incremental Facilities”), in a maximum aggregate amount of (a) up to the date of receipt of financial statements for the fiscal quarter ending June 30, 2022, $75 million, and (b) thereafter, (i) $75 million less the aggregate principal amount of Incremental Facilities incurred before such date, plus (ii) an unlimited amount if the pro forma consolidated total leverage ratio (assuming the Incremental Facilities are fully drawn) is less than 2.50 :1.0.
On May 12, 2022, the Company and certain of its subsidiaries entered into a second amendment (the “Amendment”) to its Credit Agreement pursuant to which the Lenders upsized the existing term loan facility to $175 million in aggregate principal amount and increased the revolving credit facility commitments by $25 million to an aggregate of $150 million in revolving credit facility commitments. The Revolving Credit Facility includes a $10 million swing line sublimit and a $10 million letter of credit sublimit. The amended Credit Agreement provides for an incremental term facility agreement and/or an increase of the Revolving Credit Facility (together, the “Incremental Facilities”), in a maximum aggregate amount of (a) up to the date of
45
receipt of financial statements for the fiscal quarter ending June 30, 2022, $75 million, and (b) thereafter, (i) $75 million less the aggregate principal amount of Incremental Facilities incurred before such date, plus (ii) an unlimited amount if the pro forma consolidated total leverage ratio (assuming the Incremental Facilities are fully drawn) is less than 2.50 :1.0. Further, separate from the Company’s annual $35 million capital spending cap, a one-time $45 million capital project basket was included in the Amendment. All other key provisions, including the $75 million accordion, acquisition holiday, and other baskets remain unchanged. The Credit Facilities mature on May 12, 2027 (the “Maturity Date”).
The Amendment resulted in a loss on extinguishment of debt of $0.9 million, including $0.6 million non-cash write off relating to deferred financing costs and unamortized discount of the Term Loan Facility and $0.3 million of other fees associated with the Amendment, recorded in our Consolidated Statements of Operations for the twelve months ended December 31, 2022.
The proceeds of the Credit Facilities will be used, together with cash on hand of the Company, to (a) pay transaction costs, fees and expenses incurred in connection therewith and in connection with the Amended Credit Agreement and (b) for working capital and other lawful corporate purposes of the Company and its subsidiaries.
At December 31, 2023 we had no borrowings under the Revolving Credit Facility, outstanding letters of credit of $1.2 million and availability of $148.8 million. Combined with availability under our China Credit Facility (described below) of approximately $11.3 million, total consolidated availability was $160.1 million at December 31, 2023. The unamortized deferred financing fees associated with the Revolving Credit Facility were $1.0 million and $1.3 million as of December 31, 2023 and December 31, 2022, respectively, and are being amortized over the remaining life of the Credit Agreement. At December 31, 2022, we had no borrowings under the Revolving Credit Facility and outstanding letters of credit of $1.2 million.
Interest rates and fees
Amounts outstanding under the Credit Facilities and the commitment fee payable in connection with the Credit Facilities accrue interest at a per annum rate equal to (at the Company’s option) the base rate or the Term Secured Overnight Financing Rate ("SOFR"), including a credit spread adjustment, plus a rate which will vary according to the Consolidated Total Leverage Ratio as set forth in the most recent compliance certificate received by the Administrative Agent, as set out in the following table:
| Pricing Tier | Consolidated Total Leverage Ratio | Commitment Fee | Letter of Credit Fee | Term SOFR Loans | Base Rate Loans | |||||||||||||||||||||||||||
| I | > | |||||||||||||||||||||||||||||||
| II | < > | |||||||||||||||||||||||||||||||
| III | < > | |||||||||||||||||||||||||||||||
| IV | < > | |||||||||||||||||||||||||||||||
| V | < | |||||||||||||||||||||||||||||||
Guarantee and Security
All obligations under the Credit Agreement and related documents are unconditionally guaranteed by each of the Company’s existing and future direct and indirect wholly owned material domestic subsidiaries, subject to certain exceptions (the “Guarantors”). All obligations of the Company under the Credit Agreement and the guarantees of those obligations are secured by a first priority pledge of substantially all of the assets of the Company and of the Guarantors, subject to certain exceptions. The property pledged by the Company and the Guarantors includes a first priority pledge of all of the equity interests owned by the Company and the Guarantors in their respective domestic subsidiaries and a first priority pledge of the equity interests owned by the Company and the Guarantors in certain foreign subsidiaries, in each case, subject to certain exceptions.
Covenants and other terms
The Credit Agreement contains customary restrictive covenants, including, without limitation, limitations on the ability of the Company and its subsidiaries to incur additional debt and guarantees; grant certain liens on assets; pay dividends or make certain other distributions; make certain investments or acquisitions; dispose of certain assets; make payments on certain indebtedness; merge, combine with any other person or liquidate; amend organizational documents; make material changes in accounting treatment or reporting practices; enter into certain restrictive agreements; enter into certain hedging agreements; engage in transactions with affiliates; enter into certain employee benefit plans; make acquisitions; and other matters customarily included in senior secured loan agreements.
The Credit Agreement also contains customary reporting and other affirmative covenants, as well as customary events of default, including, without limitation, nonpayment of obligations under the Credit Facilities when due; material inaccuracy of representations and warranties; violation of covenants in the Credit Agreement and certain other documents executed in connection therewith; breach or default of agreements related to material debt; revocation or attempted revocation of
46
guarantees; denial of the validity or enforceability of the loan documents or failure of the loan documents to be in full force and effect; certain material judgments; certain events of bankruptcy or insolvency; certain Employee Retirement Income Securities Act events; and a change in control of the Company. Certain of the defaults are subject to exceptions, materiality qualifiers, grace periods and baskets customary for credit facilities of this type.
The Credit Agreement includes (a) a minimum consolidated fixed charge coverage ratio of 1.20 :1.0, and (b) a maximum consolidated total leverage ratio of 3.75 :1.0 (which was subject to step-downs to 3.50 :1.0 at the end of the fiscal quarter ending March 31, 2023; to 3.25 :1.0 at the end of the fiscal quarter ending June 30, 2023; and to 3.00 :1.0 for each fiscal quarter on and after the fiscal quarter ending September 30, 2023).
We were in compliance with the covenants as of December 31, 2023.
Repayment and prepayment
The Credit Agreement requires the Company to make quarterly amortization payments to the Term Loan Facility at an annualized rate of the loans under the Term Loan Facility for every year as follows: 5.0 %, 7.5 %, 10.0 %, 12.5 % and 15.0 %. The Credit Agreement also requires all outstanding amounts under the Credit Facilities to be repaid in full on the Maturity Date.
The Credit Agreement requires mandatory prepayments from the receipt of proceeds of dispositions or debt issuance, subject to certain exceptions and the Company's ability to re-invest and use proceeds towards acquisitions permitted by the Credit Agreement.
Voluntary prepayments of amounts outstanding under the Credit Facilities are permitted at any time, without premium or penalty.
Foreign Facility
In the quarter ended March 31, 2023, we established a credit facility in China consisting of a line of credit which is subject to annual renewal (the "China Credit Facility"). China Credit Facility was renewed in the quarter ended December 31, 2023, with availability of approximately $11.3 million (denominated in the local currency). We utilize the China Credit Facility to meet local working capital demands, fund letters of credit and bank guarantees, and support other short-term cash requirements in our China operations. We had no 11.3 million of availability under the China Credit Facility.
4. Intangible Assets
Our definite-lived intangible assets were comprised of the following:
| December 31, 2023 | |||||||||||||||||||||||
| Weighted- Average Amortization Period | Gross Carrying Amount | Accumulated Amortization | Net Carrying Amount | ||||||||||||||||||||
| Definite-lived intangible assets: | |||||||||||||||||||||||
| Trademarks/tradenames | $ | $ | ( | $ | |||||||||||||||||||
| Customer relationships | ( | ||||||||||||||||||||||
| Technical know-how | ( | ||||||||||||||||||||||
| Covenant not to compete | ( | ||||||||||||||||||||||
| $ | $ | ( | $ | ||||||||||||||||||||
| December 31, 2022 | |||||||||||||||||||||||
| Weighted- Average Amortization Period | Gross Carrying Amount | Accumulated Amortization | Net Carrying Amount | ||||||||||||||||||||
| Definite-lived intangible assets: | |||||||||||||||||||||||
| Trademarks/tradenames | $ | $ | ( | $ | |||||||||||||||||||
| Customer relationships | ( | ||||||||||||||||||||||
| Technical know-how | ( | ||||||||||||||||||||||
| Covenant not to compete | ( | ||||||||||||||||||||||
| $ | $ | ( | $ | ||||||||||||||||||||
47
The aggregate intangible asset amortization expense was $3.4 2.9 million for the year ending December 31, 2024 and $1.4
5. Fair Value Measurement
Fair value is the price that would be received from selling an asset or paid to transfer a liability in an orderly transaction between market participants at the measurement date. Fair value is estimated by applying the following hierarchy, which prioritizes the inputs used to measure fair value into three levels, and bases the categorization within the hierarchy upon the lowest level of input that is available and significant to the fair value measurement:
Level 1 - Unadjusted quoted prices in active markets for identical assets and liabilities.
Level 2 - Observable inputs other than those included in Level 1. For example, quoted prices for similar assets or liabilities in active markets or quoted prices for identical assets or liabilities in inactive markets.
Level 3 - Significant unobservable inputs reflecting management’s own assumptions about the inputs used in pricing the asset or liability.
Our financial instruments consist of cash, accounts receivable, accounts payable, accrued liabilities, pension assets and liabilities. The carrying value of these instruments approximates fair value as a result of the short duration of such instruments or due to the variability of the interest cost associated with such instruments.
Recurring Measurements
Foreign Currency Forward Exchange Contracts. Our derivative assets and liabilities represent foreign exchange contracts that are measured at fair value using observable market inputs such as forward rates, interest rates, our own credit risk and counterparty credit risk. Based on the utilization of these inputs, the derivative assets and liabilities are classified as Level 2. To manage our risk for transactions denominated in Mexican Pesos, Czech Crown and Ukrainian Hryvnia, we have entered into forward exchange contracts that are designated as cash flow hedge instruments, which are recorded in the Consolidated Balance Sheets at fair value. The gains and losses as a result of the changes in fair value of the hedge contract for transactions denominated in Mexican Pesos are deferred in accumulated other comprehensive loss and recognized in cost of revenues in the period the related hedge transactions are settled. As of December 31, 2023, hedge contracts for transactions denominated Czech Crown were not designated as a hedging instruments; therefore, they are marked-to-market and the fair value of agreements is recorded in the Consolidated Balance Sheets with the offsetting gains and losses recognized in other (income) expense and recognized in cost of revenues in the period the related hedge transactions are settled in the Consolidated Statements of Operations.
Interest Rate Swaps. To manage our exposure to variable interest rates, we have entered into interest rate swaps to exchange, at a specified interval, the difference between fixed and variable interest amounts calculated by reference to an agreed upon notional principal amount. The interest rate swaps are intended to mitigate the impact of rising interest rates on the Company and covers 50 % of outstanding debt under the Term Loan Facility. Any changes in fair value are included in earnings or deferred through Accumulated other comprehensive loss, depending on the nature and effectiveness of the offset. Any ineffectiveness in a cash flow hedging relationship is recognized immediately in earnings in the consolidated statements of operations.
During the second quarter ended June 30, 2022, the Company entered into transactions to cash settle existing interest rate swaps ("Interest rate swap agreements settled in 2022") and received proceeds of $3.9 million. The gain on the swap settlement has been recorded in Other comprehensive income (loss) and will be recognized over the life of the settled swaps. Following the settlement of the existing interest rate swaps, we entered into a new interest rate swap agreement to align with the SOFR rate and maturity date of the Credit Agreement.
48
The fair values of our derivative assets and liabilities and Contingent Consideration measured on a recurring basis as of December 31 and are categorized as follows:
| December 31, 2023 | December 31, 2022 | |||||||||||||||||||||||||||||||||||||||||||||||||
| Total | Level 1 | Level 2 | Level 3 | Total | Level 1 | Level 2 | Level 3 | |||||||||||||||||||||||||||||||||||||||||||
| Assets: | ||||||||||||||||||||||||||||||||||||||||||||||||||
Foreign exchange contract designated as hedging instruments | $ | $ | $ | $ | $ | $ | $ | $ | ||||||||||||||||||||||||||||||||||||||||||
| Interest rate swap agreement | $ | $ | $ | $ | $ | $ | $ | $ | ||||||||||||||||||||||||||||||||||||||||||
| Liabilities: | ||||||||||||||||||||||||||||||||||||||||||||||||||
Foreign exchange contract designated as hedging instruments | $ | $ | $ | $ | $ | $ | $ | $ | ||||||||||||||||||||||||||||||||||||||||||
Foreign exchange contract not designated as hedging instruments | $ | $ | $ | $ | $ | $ | $ | $ | ||||||||||||||||||||||||||||||||||||||||||
The following table summarizes the notional amount of our open foreign exchange contracts at December 31:
| 2023 | 2022 | ||||||||||||||||||||||
| U.S. $ Equivalent | U.S. $ Equivalent Fair Value | U.S. $ Equivalent | U.S. $ Equivalent Fair Value | ||||||||||||||||||||
Commitments to buy or sell currencies - Foreign exchange contract designated as hedging instruments | $ | $ | $ | $ | |||||||||||||||||||
Commitments to buy or sell currencies - Foreign exchange contract not designated as hedging instruments | $ | $ | $ | $ | |||||||||||||||||||
We consider the impact of our credit risk on the fair value of the contracts, as well as the ability to execute obligations under the contract.
The following table summarizes the fair value and presentation of derivatives in the Consolidated Balance Sheets at December 31 :
| Derivative Asset | |||||||||||||||||
| Balance Sheet Location | Fair Value | ||||||||||||||||
| 2023 | 2022 | ||||||||||||||||
Foreign exchange contract designated as hedging instruments | Other current assets | $ | $ | ||||||||||||||
| Foreign exchange contract designated as hedging instruments | Other assets | $ | $ | ||||||||||||||
| Interest rate swap agreement | Other assets | $ | $ | ||||||||||||||
| Derivative Liability | |||||||||||||||||
| Balance Sheet Location | Fair Value | ||||||||||||||||
| 2023 | 2022 | ||||||||||||||||
Foreign exchange contract designated as hedging instruments | Accrued liabilities and other | $ | $ | ||||||||||||||
Foreign exchange contract not designated as hedging instruments | Accrued liabilities and other | $ | $ | ||||||||||||||
| Derivative Equity | |||||||||||||||||
| Balance Sheet Location | Fair Value | ||||||||||||||||
| 2023 | 2022 | ||||||||||||||||
| Foreign exchange contract designated as hedging instruments | Accumulated other comprehensive (loss) income | $ | $ | ( | |||||||||||||
| Interest rate swap agreements | Accumulated other comprehensive (loss) income | $ | $ | ||||||||||||||
49
The following table summarizes the effect of derivative instruments on the Consolidated Statements of Operations:
| 2023 | 2022 | ||||||||||||||||
| Location of Gain (Loss) Recognized on Derivatives | Amount of Gain (Loss) Recognized in Income on Derivatives | ||||||||||||||||
Foreign exchange contract designated as hedging instruments | Cost of revenues | $ | $ | ||||||||||||||
| Interest rate swap agreements | Interest expense | $ | $ | ( | |||||||||||||
Interest rate swap agreements settled in 2022 | Interest expense | $ | $ | ||||||||||||||
Foreign exchange contract not designated as hedging instruments | Other (income) expense | $ | ( | $ | ( | ||||||||||||
We consider the impact of our credit risk on the fair value of the contracts, as well as our ability to honor obligations under the contract.
Other Fair Value Measurements
The fair value of long-term debt obligations is based on a fair value model utilizing observable inputs. Based on these inputs, our long-term debt fair value as disclosed is classified as Level 2. The carrying amounts and fair values of our long-term debt obligations are as follows:
| December 31, 2023 | December 31, 2022 | ||||||||||||||||||||||
| Carrying Amount | Fair Value | Carrying Amount | Fair Value | ||||||||||||||||||||
Term loan and security agreement 1 | $ | $ | $ | $ | |||||||||||||||||||
1 Presented in the Consolidated Balance Sheets as the current portion of long-term debt of $15.3 million and long-term debt of $126.2 million as of December 31, 2023, and current portion of long-term debt of $10.9 million and long-term debt of $141.5 million as of December 31, 2022.
6. Leases
The Company leases office, warehouse and manufacturing space and certain equipment under non-cancelable operating lease agreements that generally require us to pay maintenance, insurance, taxes and other expenses in addition to annual rental fees. Our leases have remaining lease terms of one year to nineteen years , some of which include options to extend the leases for up to five years , and some of which include options to terminate the leases within one year .
The components of lease expense are as follows:
| Twelve Months Ended December 31, | |||||||||||
| 2023 | 2022 | ||||||||||
| Operating lease cost | $ | $ | |||||||||
| Finance lease cost: | |||||||||||
| Amortization of right-of-use assets | |||||||||||
| Interest on lease liabilities | |||||||||||
| Finance lease cost | $ | $ | |||||||||
Short-term lease cost 1 | |||||||||||
| Total lease expense | $ | $ | |||||||||
1.Includes variable lease costs, which are not significant.
50
Supplemental cash flow information related to leases is as follows:
| Twelve Months Ended December 31, 2023 | Twelve Months Ended December 31, 2022 | ||||||||||
| Cash paid for amounts included in the measurement of lease liabilities: | |||||||||||
| Operating cash flows from operating leases | $ | $ | |||||||||
| Financing cash flows from finance leases | $ | $ | |||||||||
Supplemental balance sheet information related to leases is as follows:
| Balance Sheet Location | December 31, 2023 | December 31, 2022 | ||||||||||||
| Operating Leases | ||||||||||||||
| Right-of-use assets, net | Operating lease right-of-use asset, net | $ | $ | |||||||||||
| Current liabilities | Current operating lease liabilities | |||||||||||||
| Non-current liabilities | Long-term operating lease liabilities | |||||||||||||
| Total operating lease liabilities | $ | $ | ||||||||||||
| Finance Leases | ||||||||||||||
| Right-of-use assets, net | $ | $ | ||||||||||||
| Current liabilities | ||||||||||||||
| Non-current liabilities | ||||||||||||||
| Total finance lease liabilities | $ | $ | ||||||||||||
| Weighted Average Remaining Lease Term | ||||||||||||||
| Operating leases | ||||||||||||||
| Finance leases | ||||||||||||||
| Weighted Average Discount Rate | ||||||||||||||
| Operating leases | % | % | ||||||||||||
| Finance leases | % | % | ||||||||||||
As most of our leases do not provide an implicit rate, we use our incremental borrowing rate based on the information available at the lease commencement date in determining the present value of the lease payments. We utilize an incremental borrowing rate, which is reflective of the specific term of the leases and economic environment of each geographic region, and apply a portfolio approach for certain machinery and equipment that have consistent terms in a specific geographic region.
Anticipated future lease costs, which are based in part on certain assumptions to approximate minimum annual rental commitments under non-cancelable leases, are as follows:
| Year Ending December 31, | Operating | Financing | Total | |||||||||||||||||
| 2024 | $ | $ | $ | |||||||||||||||||
| 2025 | ||||||||||||||||||||
| 2026 | ||||||||||||||||||||
| 2027 | ||||||||||||||||||||
| 2028 | ||||||||||||||||||||
| Thereafter | ||||||||||||||||||||
| Total lease payments | $ | $ | $ | |||||||||||||||||
| Less: Imputed interest | ( | ( | ( | |||||||||||||||||
| Present value of lease liabilities | $ | $ | $ | |||||||||||||||||
51
7. Income Taxes
Pre-tax income (loss) consisted of the following for the years ended December 31:
| 2023 | 2022 | 2021 | |||||||||||||||
| Domestic | $ | $ | ( | $ | |||||||||||||
| Foreign | |||||||||||||||||
| Total | $ | $ | ( | $ | |||||||||||||
A reconciliation of income taxes computed at the statutory rates to the reported income tax provision for the years ended December 31 follows:
| 2023 | 2022 | 2021 | |||||||||||||||
| Federal (benefit) provision at statutory rate | $ | $ | ( | $ | |||||||||||||
| U.S./Foreign tax rate differential | |||||||||||||||||
| Foreign non-deductible expenses | ( | ( | |||||||||||||||
| Foreign tax provision | |||||||||||||||||
| State taxes, net of federal benefit | ( | ||||||||||||||||
| State tax rate change, net of federal benefit | ( | ( | ( | ||||||||||||||
| Change in uncertain tax positions | |||||||||||||||||
| Change in valuation allowance | ( | ||||||||||||||||
| Tax credits | ( | ( | ( | ||||||||||||||
| Share-based compensation | ( | ( | ( | ||||||||||||||
| Executive compensation (IRC 162m) | |||||||||||||||||
| Repatriation of foreign earnings | |||||||||||||||||
| GILTI, net of related foreign tax credit | |||||||||||||||||
| Pension settlement | |||||||||||||||||
| Other | ( | ||||||||||||||||
| (Benefit) Provision for income taxes | $ | ( | $ | $ | |||||||||||||
The provision (benefit) for income taxes for the years ended December 31 follows:
| 2023 | 2022 | 2021 | |||||||||||||||||||||||||||||||||||||||||||||||||||
| Current | Deferred | Total | Current | Deferred | Total | Current | Deferred | Total | |||||||||||||||||||||||||||||||||||||||||||||
| Federal | $ | ( | $ | ( | $ | ( | $ | ( | $ | $ | $ | $ | $ | ||||||||||||||||||||||||||||||||||||||||
| State and local | ( | ( | ( | ( | |||||||||||||||||||||||||||||||||||||||||||||||||
| Foreign | ( | ||||||||||||||||||||||||||||||||||||||||||||||||||||
| Total | $ | $ | ( | $ | ( | $ | $ | $ | $ | $ | $ | ||||||||||||||||||||||||||||||||||||||||||
52
A summary of deferred income tax assets and liabilities as of December 31 follows:
| 2023 | 2022 | ||||||||||
| Noncurrent deferred tax assets: | |||||||||||
| Amortization and fixed assets | $ | $ | |||||||||
| Inventories | |||||||||||
| Pension obligations | |||||||||||
| Warranty obligations | |||||||||||
| Accrued benefits | |||||||||||
| Operating leases | |||||||||||
| Tax credit carryforwards | |||||||||||
| Net operating loss carryforwards | |||||||||||
| Other temporary differences | |||||||||||
| Total noncurrent deferred tax assets | $ | $ | |||||||||
| Valuation allowance | ( | ( | |||||||||
| Net noncurrent deferred tax assets | $ | $ | |||||||||
| Noncurrent deferred tax liabilities: | |||||||||||
| Amortization and fixed assets | $ | ( | $ | ( | |||||||
| Inventories | ( | ||||||||||
| Operating leases | ( | ( | |||||||||
| Other temporary differences | ( | ( | |||||||||
| Total noncurrent tax liabilities | ( | ( | |||||||||
| Net noncurrent deferred tax liabilities | $ | ( | $ | ( | |||||||
| Total net deferred tax asset | $ | $ | |||||||||
| Deferred taxes are reflected in the Consolidated Balance Sheet as follows: | |||||||||||
| Net non-current deferred tax assets | $ | $ | |||||||||
| Non-current deferred tax liabilities (included in Other long-term liabilities) | $ | ( | $ | ( | |||||||
| Total net deferred tax asset | $ | $ | |||||||||
We assess whether valuation allowances should be established against deferred tax assets based on consideration of all available evidence using a “more likely than not” standard. This assessment considers, among other matters, the nature, frequency and severity of recent losses, forecasts of future profitability, the duration of statutory carryforward periods, our experience with unused tax attributes expiring and tax planning alternatives. In making such judgments, significant weight is given to evidence that can be objectively verified. During 2022, (1) the Company established a valuation allowance on its U.S. deferred tax assets of $24.5 million due to significant negative evidence including severity of recent losses, and (2) reversed the valuation allowance on its U.K. deferred tax assets of $9.9 million based on the weight of positive evidence, including the cumulative income position in the three most recent years and forecasts for a sustained level of future taxable income. During 2023, the Company reversed the valuation allowance on its U.S. deferred tax assets of $22.0 million as it believes that the weight of the positive evidence, including the cumulative income position in the three most recent years and forecasts for a sustained level of future taxable income, was sufficient to overcome the weight of the negative evidence during the year ended December 31, 2023.
During 2023, we recorded an additional valuation allowance of $1.9 million primarily related to a $1.6 million increase in foreign tax credits. We expect to be able to realize the benefits of all of our deferred tax assets that are not currently offset by a valuation allowance, as discussed above. In the event that our actual results differ from our estimates or we adjust these estimates in future periods, the effects of these adjustments could materially impact our financial position and results of operations.
53
Activity for the years ended December 31 is as follows (in thousands):
| 2023 | 2022 | 2021 | |||||||||||||||
| Balance - Beginning of the year | $ | $ | $ | ||||||||||||||
| Provisions | |||||||||||||||||
| Utilizations and reversals | ( | ( | ( | ||||||||||||||
| Balance - End of the year | $ | $ | $ | ||||||||||||||
As of December 31, 2023, the Company had net operating loss carryforwards of $78.5 million, of which $36.5 million related to foreign jurisdictions and $42.0 million related to U.S. state jurisdictions, $4.8 million of U.S. foreign tax credit carryforwards, and $1.4 million of research and development tax credit carryforwards. The carryforward periods for these net operating losses range from five years to indefinite, foreign tax credits begin to expire in 2027, and research and development tax credits begin to expire in 2036. Utilization of these carryforwards is subject to the tax laws of the applicable tax jurisdiction and may be limited by the ability of certain subsidiaries to generate taxable income in the associated tax jurisdiction. We have established valuation allowance for certain U.S. foreign tax credits, State NOLs, and Foreign NOLs that we believe are more likely than not to expire before they can be utilized.
As of December 31, 2023, cash of $37.8 million was held by foreign subsidiaries. During the year ended December 31, 2023, $7.0 million was repatriated from the Company's foreign subsidiaries. The Company had a $0.5 million deferred tax liability as of December 31, 2023 for the expected future income tax implications of repatriating cash from the foreign subsidiaries for which indefinite reinvestment is not expected.
We file federal income tax returns in the U.S. and income tax returns in various states and foreign jurisdictions. In the U.S., we are generally no longer subject to tax assessment for tax years prior to 2018. In our major non-U.S. jurisdictions including China, Czech Republic, Mexico and the United Kingdom, tax years are typically subject to examination for three to five years.
As of December 31, 2023, and 2022, we provided a liability of $1.3 million and $1.1 million, respectively, for unrecognized tax benefits associated with our U.S. federal and state, and foreign jurisdictions. The majority of these unrecognized tax benefits are netted against their related non-current deferred tax assets.
We accrue interest and penalties related to unrecognized tax benefits through income tax expense. We had $1.2 million and $0.9 million accrued for the payment of interest and penalties as of December 31, 2023 and December 31, 2022, respectively. Accrued interest and penalties are included in the $1.3 million of unrecognized tax benefits.
A reconciliation of the beginning and ending amount of unrecognized tax benefits (including interest and penalties) at December 31 follows:
| 2023 | 2022 | 2021 | |||||||||||||||
| Balance - Beginning of the year | $ | $ | $ | ||||||||||||||
| Gross increase - tax positions in prior periods | |||||||||||||||||
| Gross decreases - tax positions in prior periods | |||||||||||||||||
| Gross increases - current period tax positions | |||||||||||||||||
| Lapse of statute of limitations | ( | ||||||||||||||||
| Currency translation adjustment | ( | ||||||||||||||||
| Balance - End of the year | $ | $ | $ | ||||||||||||||
54
8. Accrued and Other Liabilities
Accrued and other liabilities consisted of the following as of December 31:
| 2023 | 2022 | ||||||||||
| Compensation and benefits | $ | $ | |||||||||
| Taxes payable | |||||||||||
| Accrued freight | |||||||||||
| Accrued legal and professional fees | |||||||||||
| Warranty Costs | |||||||||||
| Other | |||||||||||
| $ | $ | ||||||||||
9. Defined Contribution Plan, Pension and Other Post-Retirement Benefit Plans
Defined Contribution Plan - We sponsor a defined contribution plan covering eligible employees. Eligible employees can contribute on a pre-tax basis to the plan. In accordance with the terms of the 401(k) plan, we elect to match a certain percentage of the participants’ contributions to the plan, as defined. We recognized expense associated with the plan of $4.8 million, $4.6 million and $4.0 million for the years ended December 31, 2023, 2022, and 2021, respectively.
Pension and Other Post-Retirement Benefit Plans - We sponsor pension and other post-retirement benefit plans that cover certain hourly and salaried employees in the U.S. and United Kingdom. Each of the plans are frozen to new participants and to additional service credits earned. Our policy is to make annual contributions to the plans to fund the minimum contributions, as required by local regulations.
As of December 31, 2022, the Company settled its U.S. Pension Plan liabilities through lump-sum payments and purchase of an annuity contract. The lump-sum payments of $4.4 million and the annuity contract totaling $25.2 million were paid out of plan assets and resulted in an $9.2 million non-cash settlement charge, which was recorded in Other comprehensive income in the Consolidated Statements of Comprehensive Income (Loss) during the year ended December 31, 2022.
The change in benefit obligation, plan assets and funded status as of December 31 is as follows:
| Non-U.S. Pension Plan | |||||||||||
| 2023 | 2022 | ||||||||||
| Change in benefit obligation: | |||||||||||
| Benefit obligation — Beginning of the year | $ | $ | |||||||||
| Interest cost | |||||||||||
| Benefits paid | ( | ( | |||||||||
| Actuarial (gain) loss | ( | ||||||||||
| Exchange rate changes | ( | ||||||||||
| Benefit obligation at end of the year | $ | $ | |||||||||
| Change in plan assets: | |||||||||||
| Fair value of plan assets — Beginning of the year | $ | $ | |||||||||
| Actual return on plan assets | ( | ||||||||||
| Employer contributions | |||||||||||
| Benefits paid | ( | ( | |||||||||
| Exchange rate changes | ( | ||||||||||
| Fair value of plan assets at end of the year | |||||||||||
| Funded status | $ | ( | $ | ( | |||||||
Actuarial Gain - The projected Non-U.S. benefit obligation includes a net loss of $1.1 million for the year ended December 31, 2023 driven primarily by a decrease in the discount rate assumption.
55
Amounts recognized in the Consolidated Balance Sheets at December 31 consisted of:
| Non-U.S. Pension Plan | |||||||||||
| 2023 | 2022 | ||||||||||
| Noncurrent liabilities | ( | ( | |||||||||
| Amount recognized | $ | ( | $ | ( | |||||||
The components of net periodic cost (benefit) for the years ended December 31 were as follows:
| U.S. Pension and Other Post-Retirement Benefit Plans | Non-U.S. Pension Plan | ||||||||||||||||||||||||||||||||||
| 2023 | 2022 | 2021 | 2023 | 2022 | 2021 | ||||||||||||||||||||||||||||||
| Interest cost | $ | $ | $ | $ | $ | $ | |||||||||||||||||||||||||||||
| Expected return on plan assets | ( | ( | ( | ( | ( | ||||||||||||||||||||||||||||||
Amortization of prior service cost 1 | |||||||||||||||||||||||||||||||||||
| Recognized actuarial loss | |||||||||||||||||||||||||||||||||||
| Net periodic cost (benefit) | $ | $ | $ | ( | $ | $ | $ | ||||||||||||||||||||||||||||
1 Includes $9.2 million non-cash settlement charge arising from the early payout of the U.S. defined benefit plan benefits in the year ended December 31, 2022.
Net periodic cost (benefit) components, not inclusive of service costs, are recognized in Other (income) expense within the Consolidated Statements of Operations.
Amounts Recognized in Other Comprehensive Income (Loss) - Amounts recognized in Other comprehensive income (loss), before taking into account income tax effects, at December 31 are as follows:
| U.S. Pension and Other Post-Retirement Benefit Plans | Non-U.S. Pension Plan | ||||||||||||||||||||||||||||||||||
| 2023 | 2022 | 2021 | 2023 | 2022 | 2021 | ||||||||||||||||||||||||||||||
| Net actuarial loss | $ | $ | ( | $ | $ | $ | $ | ||||||||||||||||||||||||||||
| Prior service cost | |||||||||||||||||||||||||||||||||||
| $ | $ | ( | $ | $ | $ | $ | |||||||||||||||||||||||||||||
Other Changes in Plan Assets and Benefit Obligations Recognized in Comprehensive Income (Loss) - Amounts recognized as other changes in plan assets and benefit obligations in comprehensive income (loss), before taking into account income tax effects, for the year ended December 31 are as follows:
| U.S. Pension and Other Post-Retirement Plans | Non-U.S. Pension Plan | ||||||||||||||||||||||
| 2023 | 2022 | 2023 | 2022 | ||||||||||||||||||||
| Actuarial (gain) loss | $ | $ | ( | $ | $ | ||||||||||||||||||
| Amortization of actuarial (loss) gain | ( | ( | ( | ||||||||||||||||||||
| Prior service credit | ( | ( | ( | ||||||||||||||||||||
| Total recognized in other comprehensive income (loss) | $ | $ | ( | $ | $ | ( | |||||||||||||||||
Weighted-average assumptions used to determine benefit obligations at December 31 were as follows:
| Non-U.S. Pension Plan | |||||||||||
| 2023 | 2022 | ||||||||||
| Discount rate | % | % | |||||||||
56
Weighted-average assumptions used to determine net periodic benefit cost at December 31 were as follows:
| Non-U.S. Pension Plan | |||||||||||||||||
| 2023 | 2022 | 2021 | |||||||||||||||
| Discount rate | % | % | % | ||||||||||||||
| Expected return on plan assets | % | % | % | ||||||||||||||
The rate of return assumptions are based on projected long-term market returns for the various asset classes in which the plans are invested, weighted by the target asset allocations. An incremental amount for active plan asset management and diversification, where appropriate, is included in the rate of return assumption. Our pension plan investment strategy is reviewed periodically, but no less frequently than annually.
We employ a total return investment approach whereby a mix of equities, fixed income and real estate investments are intended to maximize the long-term return of plan assets taking into consideration a prudent level of risk. The intent of this strategy is to minimize plan expenses by outperforming plan liabilities over the long run. Risk tolerance is established through consideration of plan liabilities, plan funded status and corporate financial condition. The investment portfolio contains a diversified blend of equity, balanced, fixed income and real estate investments. Furthermore, equity investments are diversified across U.S. and non-U.S. stocks, as well as growth, value and large and small capitalizations. Other assets, such as real estate, are used judiciously to perhaps enhance long-term returns and to improve portfolio diversification. Derivatives may be used to gain market exposure in an efficient and timely manner; however, derivatives may not be used to leverage the portfolio beyond the market value of the underlying investments. Investment risk is measured and monitored on an ongoing basis in light of annual liability measurements, periodic asset/liability studies and quarterly investment portfolio reviews. We expect to contribute approximately $1.1 million to our non-U.S. pension plan and our other post-retirement benefit plans in 2024.
Our investment allocation target for our non-U.S. pension plan for 2023 and our weighted-average asset allocations of our pension assets for the years ended December 31, by asset category, are as follows:
| Target Allocation % | Actual Allocations % | ||||||||||||||||||||||
| 2023 | 2022 | 2023 | 2022 | ||||||||||||||||||||
| Cash and cash equivalents | |||||||||||||||||||||||
| Equity/Balanced securities | |||||||||||||||||||||||
| Fixed income securities | |||||||||||||||||||||||
The non-U.S. pension plan assets are held in a pooled separate account which represents an insurance contract under which plan assets are administered through pooled funds. The contract portfolio includes cash and cash equivalents, equity/ balanced securities, and fixed income securities. The contract is valued daily based on the market value of the underlying net assets. The majority of the underlying net assets have observable Level 1 and/or 2 quoted pricing inputs which are used to determine the unit value of the contract, which is not publicly quoted and therefore classified as Level 2 of the fair value hierarchy. See Note 1, Significant Accounting Policies, for further detail on fair value hierarchy.
The assets within the insurance contract can be described as follows:
Equity Securities - Includes common stocks issued by U.S., United Kingdom and other international companies, equity funds that invest in common stocks and unit linked insurance policies. Equity investments generally allow near-term (within 90 days of the measurement date) liquidity and are held in issues that are actively traded to facilitate transactions at minimum cost.
Balanced Securities - Includes funds primarily invested in a mix of equity and fixed income securities where the allocations are at the discretion of the investment manager. Investments generally allow near-term (within 90 days of the measurement date) liquidity and are held in issues that are actively traded to facilitate transactions at minimum cost.
Fixed Income Securities - Includes U.S. dollar-denominated and United Kingdom and other international marketable bonds and convertible debt securities as well as fixed income funds that invest in these instruments. Investments generally allow near-term liquidity and are held in issues that are actively traded to facilitate transactions at minimum cost.
57
The fair values of our pension plan assets by asset category and by level as described in Note 1, Significant Accounting Policies, for the years ended December 31, 2023 and 2022 are as follows:
| December 31, 2023 | |||||||||||||||||||||||
| Quoted Prices in Active Markets for Identical Assets | Significant Observable Inputs | Significant Unobservable Inputs | |||||||||||||||||||||
| Total | Level 1 | Level 2 | Level 3 | ||||||||||||||||||||
| Insurance contracts and other | $ | $ | $ | $ | |||||||||||||||||||
| Total pension fund assets | $ | $ | $ | $ | |||||||||||||||||||
| December 31, 2022 | |||||||||||||||||||||||
| Quoted Prices in Active Markets for Identical Assets | Significant Observable Inputs 2 | Significant Unobservable Inputs | |||||||||||||||||||||
| Total | Level 1 | Level 2 | Level 3 | ||||||||||||||||||||
| Insurance contract and other | $ | $ | $ | $ | |||||||||||||||||||
Total pension fund assets 1 | $ | $ | $ | $ | |||||||||||||||||||
1.Not included in the table are the remaining $4.0 million of plan assets under the U.S. pension plan which has been invested in Cash and cash equivalents (NAV) as of December 31, 2022.
2.During 2023, the Company corrected an immaterial error in the presentation of asset category and level of the non-U.S. pension plan assets as of December 31, 2022. The assets were previously disclosed as Net Asset Value per share (NAV) rather than Level 2. Additionally, the asset category previously disclosed was the underlying assets of the insurance contract rather than the insurance contract itself. The correction had no impact on investment values and had no impact on the consolidated balance sheets, statements of operations or statements of cash flows.
The following table summarizes our expected future benefit payments of our pension and other post-retirement benefit plans:
| Year Ending December 31, | Pension Plans | ||||
| 2024 | $ | ||||
| 2025 | $ | ||||
| 2026 | $ | ||||
| 2027 | $ | ||||
| 2028 | $ | ||||
| 2029 to 2033 | $ | ||||
10. Performance Awards
In 2020, the Company made awards, defined as cash, shares or other awards, to employees under the Commercial Vehicle Group, Inc. 2014 Equity Incentive Plan (the “2014 EIP”) and the Commercial Vehicle Group, Inc. 2020 Equity Incentive Plan (the “2020 EIP”). Effective June 15, 2020, as part of the Company’s stockholders’ approval of the 2020 EIP, the Company agreed that no more awards will be made under the 2014 EIP.
Restricted Cash Awards – Restricted cash is a grant that is earned and payable in cash based upon the Company’s relative total shareholder return in terms of ranking as compared to the peer group and Return on Invested Capital ("ROIC") component established by the Compensation Committee of the Board of Directors.
Performance Stock Awards Settled in Cash – Performance-based stock award is a grant that is earned and payable in cash. The total amount payable as of the award's vesting date is determined based upon the number of shares allocated to a participant, the Company’s relative total shareholder return in terms of ranking which can fluctuate as compared to the peer group over the performance period, ROIC performance, and the share price of the Company's stock.
Total shareholder return is determined by the percentage change in value (positive or negative) over the applicable measurement period as measured by dividing (A) the sum of the cumulative value of dividends and other distributions paid on
58
the Common Stock for the applicable measurement period and the difference (positive or negative) between each such company’s starting stock price and ending stock price, by (B) the starting stock price. Performance targets are based on relative total shareholder return in terms of ranking as compared to the peer group over the performance period.
ROIC is defined as adjusted net income plus interest expense (net of tax), divided by total assets less current liabilities plus current debt. A five -point average is used to calculate the asset denominator.
These awards are payable at the end of the performance period in cash if the employee is employed through the end of the performance period. If the employee is not employed during the entire performance period, the award is forfeited. These grants are accounted for as cash settlement awards for which the fair value of the award fluctuates based on the change in total shareholder return in relation to the peer group.
The following table summarizes performance awards granted in the form of cash awards under the equity incentive plans:
| Amount | ||||||||
Adjusted Award Value at December 31, 2022 | $ | |||||||
| New grants | ||||||||
| Forfeitures | ( | |||||||
| Adjustments | ||||||||
| Payments | ( | |||||||
Adjusted Award Value at December 31, 2023 | $ | |||||||
The Company generally grants performance awards in the first quarter of each year. Unrecognized compensation expense was $1.6 million as of December 31, 2023.
11. Share-Based Compensation
The compensation expense for our share-based compensation arrangements (see Restricted Stock Awards below) was $3.8 million, $5.8 million and $6.3 million for the years ended December 31, 2023, 2022 and 2021, respectively. Share-based compensation expense is included in selling, general and administrative expenses in the Consolidated Statements of Operations.
Restricted Stock Awards - Restricted stock is a grant of shares of common stock that may not be sold, encumbered or disposed of and that may be forfeited in the event of certain terminations of employment or in the case of the board of directors, a separation for cause, prior to the end of a restricted period set by the compensation committee of the board of directors. Forfeitures are recorded as they occur. A participant granted restricted stock generally has all of the rights of a stockholder, unless the compensation committee determines otherwise. Time-based restricted stock awards generally vest over the three-year period following the date of grant, unless forfeited, and will be paid out in the form of stock at the end of the vesting period.
Performance Stock Awards Settled in Stock – Performance-based stock awards have similar restrictions as restricted stock. They vest over the specified period following the date of grant, unless forfeited, and will be paid out in the form of stock at the end of the vesting period if the Company meets the performance targets set at the time the award was granted. Performance targets are based on relative total shareholder return in terms of ranking as compared to the peer group over the performance period and ROIC performance.
As of December 31, 2023, there was approximately $3.8 million of unrecognized compensation expense related to non-vested share-based compensation arrangements granted under our equity incentive plans. This expense is subject to future adjustments and forfeitures and will be recognized on a straight-line basis over the remaining period listed above for each grant.
59
A summary of the status of our restricted stock awards as of December 31, 2023 and changes during the twelve-month period ending December 31, 2023, is presented below:
| 2023 | |||||||||||
| Shares (in thousands) | Weighted- Average Grant-Date Fair Value | ||||||||||
| Non-vested - beginning of year | $ | ||||||||||
| Granted | |||||||||||
| Vested | ( | ||||||||||
| Forfeited | ( | ||||||||||
| Non-vested - end of year | $ | ||||||||||
As of December 31, 2023, a total of 2.0 million shares were available for future grants from the shares authorized for award under our 2020 EIP, including cumulative forfeitures.
12. Stockholders’ Equity
Common Stock - Our authorized capital stock consists of 60,000,000 0.01 33,322,535 32,826,852
Preferred Stock - Our authorized capital stock includes preferred stock of 5,000,000 0.01 no
Earnings (Loss) Per Share - Basic earnings (loss) per share is determined by dividing net income by the weighted average number of common shares outstanding during the year. Diluted earnings (loss) per share presented is determined by dividing net income by the weighted average number of common shares and potential common shares outstanding during the period as determined by the treasury stock method. Potential common shares are included in the diluted earnings per share calculation when dilutive.
Diluted earnings (loss) per share for years ended December 31, 2023, 2022 and 2021 includes the effects of potential common shares when dilutive and is as follows:
| 2023 | 2022 | 2021 | |||||||||||||||
| Net income (loss) attributable to common stockholders | $ | $ | ( | $ | |||||||||||||
| Weighted average number of common shares outstanding | |||||||||||||||||
| Dilutive effect of restricted stock grants after application of the treasury stock method | |||||||||||||||||
| Dilutive shares outstanding | |||||||||||||||||
| Basic earnings (loss) per share attributable to common stockholders | $ | $ | ( | $ | |||||||||||||
| Diluted earnings (loss) per share attributable to common stockholders | $ | $ | ( | $ | |||||||||||||
There were no anti-dilutive shares for the year ended December 31, 2023. There were 113 thousand anti-dilutive shares for the year ended December 31, 2022. There were no anti-dilutive shares for the year ended December 31, 2021.
Dividends — We have not declared or paid any cash dividends in the past. The terms of our Credit Agreement restrict the payment or distribution of our cash or other assets, including cash dividend payments.
60
13. Other Comprehensive Income (Loss)
The activity for each item of accumulated other comprehensive income (loss) is as follows:
| Foreign currency items | Pension and Other Post-Retirement Benefit Plans | Derivative Instruments | Accumulated other comprehensive loss | ||||||||||||||||||||
| Balance - December 31, 2021 | $ | ( | $ | ( | $ | $ | ( | ||||||||||||||||
| Net current period change | ( | ||||||||||||||||||||||
| Amounts reclassified into earnings | ( | ( | |||||||||||||||||||||
| Balance - December 31, 2022 | $ | ( | $ | ( | $ | $ | ( | ||||||||||||||||
| Net current period change | $ | $ | ( | $ | $ | ||||||||||||||||||
| Amounts reclassified into earnings | ( | ( | ( | ||||||||||||||||||||
| Balance - December 31, 2023 | $ | ( | $ | ( | $ | $ | ( | ||||||||||||||||
The related tax effects allocated to each component of other comprehensive income (loss) for the years ended December 31, 2023 and 2022 are as follows:
| 2023 | Before Tax Amount | Tax Expense | After Tax Amount | ||||||||||||||
Net current period change | |||||||||||||||||
| Cumulative translation adjustment | $ | $ | $ | ||||||||||||||
Net actuarial gain and prior service credit | ( | ( | |||||||||||||||
Derivative instruments | ( | ||||||||||||||||
Net unrealized gain (loss) | ( | ||||||||||||||||
Amounts reclassified into earnings: | |||||||||||||||||
Actuarial loss and prior service cost | ( | ( | |||||||||||||||
Derivative instruments | ( | ( | |||||||||||||||
Net realized loss | ( | ( | |||||||||||||||
| Total other comprehensive income | $ | $ | $ | ||||||||||||||
| 2022 | Before Tax Amount | Tax Expense | After Tax Amount | ||||||||||||||
Net current period change | |||||||||||||||||
| Cumulative translation adjustment | $ | ( | $ | $ | ( | ||||||||||||
Net actuarial gain and prior service credit 1 | |||||||||||||||||
Derivative instruments | ( | ||||||||||||||||
Net unrealized gain (loss) | |||||||||||||||||
Amounts reclassified into earnings: | |||||||||||||||||
Actuarial loss and prior service cost | |||||||||||||||||
Derivative instruments | ( | ( | |||||||||||||||
Net realized loss | ( | ( | |||||||||||||||
| Total other comprehensive income | $ | $ | $ | ||||||||||||||
1 Included in Net actuarial gain and prior service credit is $9.2 million US pension non-cash settlement charge as of December 31, 2022. The Company reclassified to earnings all residual tax amounts relating to its pension liability during the year ended December 31, 2022 as a result of plan termination.
61
14. Cost Reduction and Manufacturing Capacity Rationalization
During the quarter ended December 31, 2023, management approved restructuring programs to align the Company’s cost structure to support margin expansion. The programs include workforce reductions and footprint optimization across segments. We incurred $1.1 million expense during the year ended December 31, 2023 related to this program and expect the cost to be between $3.0 million to $3.5 million for the entire program.
The changes in accrued restructuring balances are as follows:
| Vehicle Solutions | Electrical Systems | Aftermarket & Accessories | Industrial Automation | Corporate/Other | Total | ||||||||||||||||||||||||||||||
| December 31, 2022 | ( | ||||||||||||||||||||||||||||||||||
| New charges | |||||||||||||||||||||||||||||||||||
| Payments and other adjustments | ( | ( | ( | ( | |||||||||||||||||||||||||||||||
| December 31, 2023 | $ | $ | $ | $ | $ | $ | |||||||||||||||||||||||||||||
| Vehicle Solutions | Electrical Systems | Aftermarket & Accessories | Industrial Automation | Corporate/Other | Total | ||||||||||||||||||||||||||||||
| December 31, 2021 | ( | ||||||||||||||||||||||||||||||||||
| New charges | |||||||||||||||||||||||||||||||||||
| Payments and other adjustments | ( | ( | ( | ( | ( | ( | |||||||||||||||||||||||||||||
| December 31, 2022 | $ | ( | $ | $ | $ | $ | $ | ||||||||||||||||||||||||||||
Of the $2.3 million costs incurred in the twelve months ended December 31, 2023, $2.0 million primarily related to headcount reductions and $0.3 million related to facility exit and other costs. For the twelve months ended December 31, 2023, the Vehicle Solutions segment had new charges of $0.8 million related to headcount. The Industrial Automation segment had new charges of $0.2 million and $0.3 million related to headcount and facilities, respectively. Corporate had a new charge of $1.0 million related to headcount. Of the $2.3 million costs incurred, $1.3 million was recorded in cost of revenues and $1.0 million was recorded in selling, general and administrative expenses.
Of the $5.4 million costs incurred in the twelve months ended December 31, 2022, $2.5 million related to headcount reductions and $2.8 million related to facility exit and other costs. For the twelve months ended December 31, 2022, Vehicle Solutions segment had new charges of $0.5 million and $0.3 million related to headcount and facilities, respectively. The Electrical Systems segment had a new charges of $0.7 million related to headcount. The Aftermarket & Accessories segment had new charges of $0.6 million and $1.3 million related to headcount and facilities respectively. The Industrial Automation segment had new charges of $0.5 million and $1.2 million related to headcount and facilities, respectively. Corporate had a new charge of $0.3 million related to headcount. Of the $5.4 million costs incurred, $4.0 million was recorded in cost of revenues and $1.4 million was recorded in selling, general and administrative expenses.
15. Commitments and Contingencies
Leases - As disclosed in Note 6, Leases, we lease office, warehouse and manufacturing space and equipment under non-cancelable operating lease agreements that generally require us to pay maintenance, insurance, taxes and other expenses in addition to annual rental fees. As of December 31, 2023, our equipment leases did not provide for any material guarantee of a specified portion of residual values.
Guarantees - Costs associated with guarantees are accrued when it is probable that a liability has been incurred and the amount can be reasonably estimated. The most likely cost to be incurred is accrued based on an evaluation of available facts; where no amount within a range of estimates is more likely, the minimum is accrued. As of December 31, 2023 and 2022, we had no such guarantees.
Litigation - We are subject to various legal proceedings and claims arising in the ordinary course of business, including but not limited to product liability claims, customer and supplier disputes, service provider disputes, examinations by taxing authorities, employment disputes, workers’ compensation claims, unfair labor practice charges, OSHA investigations, intellectual property disputes and environmental claims arising out of the conduct of our businesses.
62
Management believes that the Company maintains adequate insurance and that we have established reserves for issues that are probable and estimable in amounts that are adequate to cover reasonable adverse judgments not covered by insurance. Based upon the information available to management and discussions with legal counsel, it is the opinion of management that the ultimate outcome of the various legal actions and claims that are incidental to our business are not expected to have a material adverse impact on the consolidated financial position, results of operations, equity or cash flows; however, such matters are subject to many uncertainties and the outcomes of individual matters are not predictable with any degree of assurance.
Warranty - We are subject to warranty claims for products that fail to perform as expected due to design or manufacturing deficiencies. Depending on the terms under which we supply products to our customers, a customer may hold us responsible for some or all of the repair or replacement costs of defective products when the product supplied did not perform as represented. Our policy is to record provisions for estimated future customer warranty costs based on historical trends and for specific claims. These amounts, as they relate to the years ended December 31, 2023 and 2022, are included within accrued liabilities and other in the accompanying Consolidated Balance Sheets.
On July 24, 2023, one of our customers issued a voluntary safety recall related to certain wiper system components supplied by us. To the extent a loss occurs that is attributed to us, we believe that we have reasonable levels of insurance coverage to mitigate recall exposure risk. It is reasonably possible that we will incur additional losses and fees above the amount accrued for warranty claims but we cannot estimate a range of such reasonably possible losses or fees related to these claims at this time. There are no assurances, however, that settlements reached and/or adverse judgments received, if any, will not exceed amounts normally accrued.
The following presents a summary of the warranty provision for the years ended December 31:
| 2023 | 2022 | ||||||||||
| Balance - beginning of the year | $ | $ | |||||||||
| Provision for warranty claims | |||||||||||
| Deduction for payments made and other adjustments | ( | ( | |||||||||
| Balance - end of year | $ | $ | |||||||||
Debt Payments - As disclosed in Note 3, Debt, the Credit Agreement requires the Company to repay a fixed amount of principal on a quarterly basis and make voluntary prepayments that coincide with certain events.
The following table provides future minimum principal payments due on long-term debt for the next five years. The existing long-term debt agreement matures in 2027; no payments are due thereafter:
| Year Ending December 31, | ||||||||
| 2024 | $ | |||||||
| 2025 | $ | |||||||
| 2026 | $ | |||||||
| 2027 | $ | |||||||
| 2028 | $ | |||||||
| Thereafter | $ | |||||||
16. Segment Reporting
Operating segments are defined as components of an enterprise that are evaluated regularly by the Company’s chief operating decision maker (“CODM”), which is our President and Chief Executive Officer. Each of these segments consists of a number of manufacturing facilities. Certain of our facilities manufacture and sell products through multiple segments. Our segments are more specifically described below.
The Vehicle Solutions segment designs, manufactures and sells the following products:
•Commercial vehicle seats for the global commercial vehicle markets including heavy duty trucks, medium duty trucks, last mile delivery trucks and vans, construction and agriculture equipment in North America, Europe and Asia-Pacific. This segment includes a portion of the company’s activities in the electric vehicle market.
•Plastic & Trim components primarily for the North America commercial vehicle market and power sports markets; and Cab structures for the North American MD/HD truck market.
63
The Electrical Systems segment designs, manufactures and sells the following products:
•Cable and harness assemblies for both high and low voltage applications, control boxes, dashboard assemblies and design and engineering for these applications.
•The end markets for these products are construction, agricultural, industrial, automotive (both internal combustion and electric vehicles), truck, mining, rail, marine, power generation and the military/defense industries in North America, Europe and Asia-Pacific.
The Aftermarket & Accessories segment designs, manufactures and sells the following products:
•Seats and components sold into the commercial vehicle channels that provide repair and refurbishing. These channels include OES centers and retail distributors, and are spread across North America, Europe and Asia-Pacific.
•Commercial vehicle accessories including wipers, mirrors, and sensors. These products are sold both as Original Equipment and as repair products.
•Office seats primarily sold into the commercial and home office furniture distribution channels in Europe and Asia-Pacific.
The Industrial Automation segment designs, manufactures and sells the following products:
•Warehouse automation subsystems including control panels, electro-mechanical assemblies, cable assemblies, and power and communication solutions.
•The end markets for these products primarily include e-commerce, warehouse integration, transportation and the military/defense industry.
Corporate expenses consist of certain overhead and shared costs that are not directly attributable to the operations of a segment. For purposes of business segment performance measurement, some of these costs that are for the benefit of the operations are allocated based on a combination of methodologies. The costs that are not allocated to a segment are considered stewardship costs and remain at corporate in our segment reporting.
The following tables present financial information for the Company's reportable segments for the periods indicated:
| For the year ended December 31, 2023 | |||||||||||||||||||||||||||||||||||
| Vehicle Solutions | Electrical Systems | Aftermarket & Accessories | Industrial Automation | Corporate/ Other | Total | ||||||||||||||||||||||||||||||
| Revenues | $ | $ | $ | $ | $ | $ | |||||||||||||||||||||||||||||
| Gross profit | $ | $ | $ | $ | $ | $ | |||||||||||||||||||||||||||||
| Selling, general & administrative expenses | — | ||||||||||||||||||||||||||||||||||
| Operating income (loss) | $ | $ | $ | $ | ( | $ | ( | $ | |||||||||||||||||||||||||||
| Capital expenditures and other items: | |||||||||||||||||||||||||||||||||||
| Capital expenditures | $ | $ | $ | $ | $ | $ | |||||||||||||||||||||||||||||
| Depreciation expense | $ | $ | $ | $ | $ | $ | |||||||||||||||||||||||||||||
| For the year ended December 31, 2022 | |||||||||||||||||||||||||||||||||||
| Vehicle Solutions | Electrical Systems | Aftermarket & Accessories | Industrial Automation | Corporate/ Other | Total | ||||||||||||||||||||||||||||||
| Revenues | $ | $ | $ | $ | $ | $ | |||||||||||||||||||||||||||||
| Gross profit | $ | $ | $ | $ | ( | $ | $ | ||||||||||||||||||||||||||||
Selling, general & administrative expenses | |||||||||||||||||||||||||||||||||||
| Operating income (loss) | $ | $ | $ | $ | ( | $ | ( | $ | |||||||||||||||||||||||||||
| Capital expenditures and depreciation expense: | |||||||||||||||||||||||||||||||||||
| Capital expenditures | $ | $ | $ | $ | $ | $ | |||||||||||||||||||||||||||||
| Depreciation expense | $ | $ | $ | $ | $ | $ | |||||||||||||||||||||||||||||
64
| For the year ended December 31, 2021 | |||||||||||||||||||||||||||||||||||
| Vehicle Solutions | Electrical Systems | Aftermarket & Accessories | Industrial Automation | Corporate/ Other | Total | ||||||||||||||||||||||||||||||
| Revenues | $ | $ | $ | $ | $ | $ | |||||||||||||||||||||||||||||
| Gross profit | $ | $ | $ | $ | $ | ( | $ | ||||||||||||||||||||||||||||
| Selling, general & administrative expenses | |||||||||||||||||||||||||||||||||||
| Operating income (loss) | $ | $ | $ | $ | $ | ( | $ | ||||||||||||||||||||||||||||
| Capital expenditures and depreciation expense: | |||||||||||||||||||||||||||||||||||
| Capital expenditures | $ | $ | $ | $ | $ | $ | |||||||||||||||||||||||||||||
| Depreciation expense | $ | $ | $ | $ | $ | $ | |||||||||||||||||||||||||||||
The following table presents revenues and long-lived assets for the geographic areas in which we operate:
| Years Ended December 31, | |||||||||||||||||||||||||||||||||||
| 2023 | 2022 | 2021 | |||||||||||||||||||||||||||||||||
| Revenues | Long-lived Assets | Revenues | Long-lived Assets | Revenues | Long-lived Assets | ||||||||||||||||||||||||||||||
| United States | $ | $ | $ | $ | $ | $ | |||||||||||||||||||||||||||||
| All other countries | |||||||||||||||||||||||||||||||||||
| $ | $ | $ | $ | $ | $ | ||||||||||||||||||||||||||||||
Sales to one of our customers was individually in excess of 10% of total Company revenues in each of the years ended December 31, 2023, 2022 and 2021, as noted in the table below. The following table presents revenue from the above mentioned customer as a percentage of total revenue:
| Years Ended December 31, | ||||||||||||||||||||
| Customer | Primary Segment | 2023 | 2022 | 2021 | ||||||||||||||||
| Customer A | Vehicle Solutions | % | % | % | ||||||||||||||||
Item 9.Changes in and Disagreements with Accountants on Accounting and Financial Disclosure
There were no disagreements with our independent accountants on matters of accounting and financial disclosures or reportable events.
Item 9A.Controls and Procedures
We maintain disclosure controls and procedures that are designed to provide reasonable assurance that information required to be disclosed in our Exchange Act reports is recorded, processed, summarized and reported within the time periods specified in the SEC’s rules and forms, and that such information is accumulated and communicated to our management, including our President and Chief Executive Officer and Chief Financial Officer, as appropriate, to allow timely decisions regarding required disclosure. Management necessarily applied its judgment in assessing the costs and benefits of such controls and procedures, which, by their nature, can provide only reasonable assurance regarding management’s disclosure control objectives.
Evaluation of Disclosure Controls and Procedures
We evaluated, with the participation of our principal executive officer and principal financial officer, the effectiveness of our disclosure controls and procedures (as defined in Rule 13a-15(e) under the Securities Exchange Act of 1934 (the “Exchange Act”)) as of December 31, 2023. Based on this evaluation, our principal executive officer and principal financial officer have concluded that our disclosure controls and procedures were effective as of December 31, 2023 to provide reasonable assurance
65
that information required to be disclosed in our reports under the Exchange Act is recorded, processed, summarized and reported within the time periods specified in the SEC rules and forms and that such information is accumulated and communicated to management as appropriate to allow timely decisions regarding required disclosure.
Management’s Report on Internal Control Over Financial Reporting
Management is responsible for establishing and maintaining adequate internal control over financial reporting as defined in Rule 13a-15(f) under the Exchange Act. Our internal control system is designed to provide reasonable assurance regarding the reliability of financial reporting and the preparation of financial statements for external purposes in accordance with generally accepted accounting principles. Because of its inherent limitations, internal control over financial reporting may not prevent or detect misstatements. Also, controls deemed effective now may become inadequate in the future because of changes in conditions, or because compliance with the policies or procedures has deteriorated or been circumvented. Management assessed the effectiveness of our internal control over financial reporting as of December 31, 2023. In making this assessment, management used the criteria established in the Internal Control-Integrated Framework issued by the Committee of Sponsoring Organizations of the Treadway Commission (2013 framework) (the “COSO criteria”). Based on management’s assessment and the COSO criteria, management believes that our internal control over financial reporting was effective as of December 31, 2023.
Our independent registered public accounting firm, KPMG LLP, has issued a report on our internal control over financial reporting. KPMG LLP’s report appears following Item 9A and expresses an unqualified opinion on the effectiveness of our internal control over financial reporting.
Changes in Internal Control over Financial Reporting
There were no changes during the quarter ended December 31, 2023 in our internal control over financial reporting that have materially affected, or are reasonably likely to materially affect, our internal control over financial reporting.
66
REPORT OF INDEPENDENT REGISTERED PUBLIC ACCOUNTING FIRM
To the Stockholders and Board of Directors
Commercial Vehicle Group, Inc.:
Opinion on Internal Control Over Financial Reporting
We have audited Commercial Vehicle Group, Inc. and subsidiaries' (the Company) internal control over financial reporting as of December 31, 2023, based on criteria established in Internal Control – Integrated Framework (2013) issued by the Committee of Sponsoring Organizations of the Treadway Commission. In our opinion, the Company maintained, in all material respects, effective internal control over financial reporting as of December 31, 2023, based on criteria established in Internal Control – Integrated Framework (2013) issued by the Committee of Sponsoring Organizations of the Treadway Commission.
We also have audited, in accordance with the standards of the Public Company Accounting Oversight Board (United States) (PCAOB), the consolidated balance sheets of the Company as of December 31, 2023 and 2022, the related consolidated statements of operations, comprehensive income (loss), stockholders’ equity, and cash flows for each of the years in the three-year period ended December 31, 2023, and the related notes to the consolidated financial statements (collectively, the consolidated financial statements), and our report dated March 14, 2024 expressed an unqualified opinion on those consolidated financial statements.
Basis for Opinion
The Company’s management is responsible for maintaining effective internal control over financial reporting and for its assessment of the effectiveness of internal control over financial reporting, included in the accompanying Management's Report on Internal Control Over Financial Reporting. Our responsibility is to express an opinion on the Company’s internal control over financial reporting based on our audit. We are a public accounting firm registered with the PCAOB and are required to be independent with respect to the Company in accordance with the U.S. federal securities laws and the applicable rules and regulations of the Securities and Exchange Commission and the PCAOB.
We conducted our audit in accordance with the standards of the PCAOB. Those standards require that we plan and perform the audit to obtain reasonable assurance about whether effective internal control over financial reporting was maintained in all material respects. Our audit of internal control over financial reporting included obtaining an understanding of internal control over financial reporting, assessing the risk that a material weakness exists, and testing and evaluating the design and operating effectiveness of internal control based on the assessed risk. Our audit also included performing such other procedures as we considered necessary in the circumstances. We believe that our audit provides a reasonable basis for our opinion.
Definition and Limitations of Internal Control Over Financial Reporting
A company’s internal control over financial reporting is a process designed to provide reasonable assurance regarding the reliability of financial reporting and the preparation of financial statements for external purposes in accordance with generally accepted accounting principles. A company’s internal control over financial reporting includes those policies and procedures that (1) pertain to the maintenance of records that, in reasonable detail, accurately and fairly reflect the transactions and dispositions of the assets of the company; (2) provide reasonable assurance that transactions are recorded as necessary to permit preparation of financial statements in accordance with generally accepted accounting principles, and that receipts and expenditures of the company are being made only in accordance with authorizations of management and directors of the company; and (3) provide reasonable assurance regarding prevention or timely detection of unauthorized acquisition, use, or disposition of the company’s assets that could have a material effect on the financial statements.
Because of its inherent limitations, internal control over financial reporting may not prevent or detect misstatements. Also, projections of any evaluation of effectiveness to future periods are subject to the risk that controls may become inadequate because of changes in conditions, or that the degree of compliance with the policies or procedures may deteriorate.
/s/ KPMG LLP
Columbus, Ohio
March 14, 2024
67
Item 9B.Other Information
None.
Item 9C.Disclosure Regarding Foreign Jurisdictions that Prevent Inspections
Not applicable.
68
PART III
Item 10.Directors, Executive Officers and Corporate Governance
A.Directors of the Registrant
The following table sets forth certain information with respect to our directors as of March 14, 2024:
| Name | Age | Principal Position(s) | ||||||||||||
| Robert C. Griffin | 76 | Chairman and Director | ||||||||||||
| James R. Ray, Jr. | 60 | President, Chief Executive Officer and Director | ||||||||||||
| Roger L. Fix | 69 | Director | ||||||||||||
| Wayne M. Rancourt | 61 | Director | ||||||||||||
| J. Michael Nauman | 61 | Director | ||||||||||||
| William C. Johnson | 60 | Director | ||||||||||||
| Ruth Gratzke | 52 | Director | ||||||||||||
| Melanie K. Cook | 51 | Director | ||||||||||||
The following biographies describe the business experience of our directors:
Background
Robert C. Griffin has served as a Director since July 2005, and was elected Chairman in 2019, and served as Interim President and CEO from May through December 2023. Mr. Griffin’s career spanned over 25 years in the financial sector until he retired from Barclays Capital, where from June 2000 to March 2002 he was Head of Investment Banking, Americas and a member of the Management Committee. Prior to joining Barclays Capital, Mr. Griffin was a member of the Executive Committee for the Montgomery Division of Banc of America Securities and held a number of positions with Bank of America, including Group Executive Vice President and Head of Global Debt Capital Raising and as a Senior Management Council Member. Since 2005, he has served on a number of boards, both public and private, including during the last five years, the board of Builders FirstSource, Inc. (ending in 2019).
Qualifications
Mr. Griffin has a broad understanding of the financial and investment world. He has over sixteen years of experience in senior and executive management positions with large corporations which included responsibility for determining and executing successful strategies. Mr. Griffin has also served as Chairman of the Board of Directors of another public company, been on numerous committees of each company where he has served as a Director and brings a depth of knowledge about corporate governance from those roles to his service on the Board of Commercial Vehicle Group. Mr. Griffin earned a Master of Business Administration degree from Northwestern University and a Bachelor of Science degree in Finance from Miami University.
Background
Mr. Ray has served as President and Chief Executive Officer since December 2023. He has also served as an Independent Director since March 2020 and currently serves as a Non-Independent Director. He also currently serves as an Independent Director on the Boards of Spirit AeroSystems, Inc. In addition to his Board roles, Mr. Ray has provided consulting services to Fortune 100 companies and private equity portfolio companies. Until November 2020, he served as President, Engineered Fastening at Stanley Black & Decker, Inc. where he held various global industrial P&L and operational leadership roles since 2013. Prior to Stanley Black & Decker, Mr. Ray spent more than 25 years in global P&L and engineering leadership roles at TE Connectivity, Delphi and GM.
Qualifications
Mr. Ray brings extensive expertise in electronics and electrical engineering within global industrial and automotive operations which is closely aligned with CVG’s long-term growth strategy. Mr. Ray earned a Master of Science degree in Manufacturing Management from Kettering University and a Bachelor of Science degree in Electrical and Electronics Engineering from Howard University.
Background
Roger L. Fix has served as a Director since June 2014. He served as a member of the Board of Directors of Standex International Corporation from 2001 until 2017, when he retired from the Standex board. He served as Non-Executive
69
Chairman from 2014 to 2016, and President and Chief Executive Officer of Standex from 2003 to 2014. He was Standex’s President and Chief Operating Officer from 2001 to 2003. Prior to joining Standex, Mr. Fix held a number of general management positions at Emerson Electric, the TI Group, plc and TRW over a period of more than 20 years. Mr. Fix served as a Director of Flowserve Corporation from 2006 until 2022 where he was Chairman of the Corporate Nominating and Governance Committee and a member of the Compensation, Finance and Audit Committees. Mr. Fix also served as the Non- Executive Chairman of the Board of Flowserve Corporation from 2017-2021. Mr. Fix retired from the Flowserve board after serving for 16 years. Mr. Fix currently serves as a Director of Thermon Holdings, where he serves as a member of the Compensation, Finance and Corporate Governance Committees.
Qualifications
Mr. Fix has broad operational, management and governance experience. He has over 35 years of experience in senior and executive management positions with multi-national corporations that served a broad mix of end user markets which included responsibility for determining and executing successful business strategies. Mr. Fix has significant international business experience and M&A experience. Mr. Fix has also served on several public company Boards and on Audit, Compensation, Finance and Governance Committees of Boards. Mr. Fix earned a Master’s degree in Mechanical Engineering from the University of Texas and a Bachelor of Science degree in Mechanical Engineering from the University of Nebraska.
Background
Wayne M. Rancourt has served as a Director since July 2016. In May 2021, Mr. Rancourt retired as Executive Vice President, Chief Financial Officer & Treasurer of Boise Cascade Company, a $5.5 billion in revenues North American based manufacturing and distribution company. He served in that role beginning in August 2009. Mr. Rancourt has over 30 years of experience in various finance roles including chief financial officer, treasurer, investor relations, strategic planning, as well as internal audit.
Qualifications
Mr. Rancourt brings strong financial expertise to the Board through his experience in various finance roles. He has over 30 years of experience in senior and executive management positions in the finance field which includes responsibility for determining and executing successful strategies. Mr. Rancourt received a Bachelor of Science degree in Accounting from Central Washington University.
Background
J. Michael Nauman had served on Brady Corporation’s Board of Directors and as the President and CEO of Brady Corporation from 2014 until 2022. Prior to joining Brady Corporation, Mr. Nauman spent 20 years at Molex Incorporated, where he led global businesses in the automotive, data communications, industrial, medical, military/aerospace and mobile sectors. In 2007, he became Molex's Senior Vice President leading its Global Integrated Products Division and was named Executive Vice President in 2009. Before joining Molex in 1994, Mr. Nauman was a tax accountant and auditor with Arthur Andersen and Controller and then President of Ohio Associated Enterprises, Inc.
Qualifications
Mr. Nauman brings more than 35 years of experience in commercial and operational leadership, strategy development, restructuring, and mergers and acquisitions. He is a board member of the Little Rock Museum of Discovery, the Quapaw Area Council of the Boy Scouts of America, and the Anthony School Board of Trustees. He holds a bachelor of science degree in management from Case Western Reserve University. Mr. Nauman is a certified public accountant and chartered global management accountant.
Background
William C. Johnson has served as a Director since December 2023. Since October 2022, Mr. Johnson has served as CEO and a member of the Board of Directors of Avail Infrastructure Solutions. From October 2018 to July 2022, Mr. Johnson served as the President and CEO of Welbilt, Inc. (WBT), and from July 2016 to June 2018, he served President and CEO and COO of Chart Industries, Inc. Prior to that he held multiple roles of increasing responsibility at Dover Refrigeration and Food Equipment, Hillphoenix, ABB and ESAB.
Qualifications
Mr. Johnson brings tremendous leadership experience to the CVG Board. He has served as the CEO of several public, private, and sponsor-backed companies in the industrial and manufacturing space. His proven record of success across various executive roles speaks to his exceptional capabilities. Mr. Johnson holds a bachelor's degree in ceramic engineering from Alfred
70
University and an MBA from Rollins College. He started his professional career as a nuclear engineer in the U.S. Navy aboard the submarine USS Stonewall Jackson.
Background
Ruth Gratzke has served as a Director since July 2021. Ms. Gratzke has served as President & CEO, Siemens Industry, Inc. and as President of Siemens Smart Infrastructure, United States, Siemens AG, since 2020, after rejoining the company in 2019. From 2017 to 2019, Ms. Gratzke was Divisional Vice President, Power Systems at Hubbell Incorporated, and from 2014 to 2017, Ms. Gratzke was General Manager and Global Product Line Lead, Industrial Breakers, Power Components at General Electric Company. Prior to joining GE, MS. Gratzke held a number of general management positions at Siemens AG over a period of 19 years.
Qualifications
Ms. Gratzke brings more than 25 years of commercial experienced and expertise on a multitude of topics including business development, industrial manufacturing operations, strategic planning, project management and international business operations. Ms. Gratzke earned her Master of Science degree in Electric Engineering from University of Erlangen-Nuremberg (Germany).
Background
Melanie K. Cook joined as Director in October 2023. She serves on the Audit and Compensation committees of the Board. Ms. Cook brings a wealth of leadership, operating experience and expertise in a multitude of business areas. She was Chief Operating Officer at GE Appliances from 2017 until her retirement in 2021. In that executive position, Melanie was responsible for full operations leadership for the multi-billion-dollar revenue business covering 15,000 employees globally.
Qualifications
Ms. Cook's nearly 30 years of global experience includes business unit leadership roles with full P&L responsibility, product lifecycle management, digitization, end-to-end supply chain, global sourcing, and finance/audit across multiple industries globally. Melanie has been an independent Director of Badger Meter, Inc. since February 2022, where she serves on the Audit and Compliance Committee of the Board. She holds a Bachelor of Science in Business Administration, with a specialty in Decision and Information Sciences from the University of Florida.
B.Executive Officers
The following table sets forth certain information with respect to our executive officers as of March 14, 2024:
| Name | Age | Principal Position(s) | ||||||||||||
| James R. Ray, Jr. | 60 | President, Chief Executive Officer and Director | ||||||||||||
| Andy Cheung | 49 | Executive Vice President and Chief Financial Officer | ||||||||||||
| Richard Tajer | 58 | President, Global Electrical Systems | ||||||||||||
| Aneezal H. Mohamed | 60 | Chief Legal Officer, Compliance Officer and Secretary | ||||||||||||
| Kristin Mathers | 49 | Chief Human Resources Officer | ||||||||||||
James R. Ray has served as President and Chief Executive Officer since December 2023. He has also served as an Independent Director since March 2020 and currently serves as a Non-Independent Director. He also currently serves as an Independent Director on the Board of Spirit AeroSystems, Inc. In addition to his Board role, Mr. Ray has provided consulting services to Fortune 100 companies and private equity portfolio companies. Until November 2020, he served as President, Engineered Fastening at Stanley Black & Decker, Inc. where he held various global industrial P&L and operational leadership roles since 2013. Prior to Stanley Black & Decker, Mr. Ray spent more than 25 years in global P&L and engineering leadership roles at TE Connectivity, Delphi and GM.
Andy Cheung joined CVG in October 2022. Prior to this appointment, Mr. Cheung spent more than 25 years at Johnson Controls, progressing through a variety of roles and departments, including positions in finance, general management, procurement, and corporate development. He has held several senior level positions throughout his career, and lived and worked in Japan, China, Belgium, and the United States during his tenure. Cheung is joining CVG directly from Johnson Controls where he was most recently serving as Vice President & Chief Financial Officer of Global Products. Mr. Cheung brings global business experience in the automotive and building industries. He also has extensive experience with acquisitions, joint ventures and partnerships which will prove valuable as CVG enters its next phase of profitable diversified growth. Mr. Cheung was born in Hong Kong and received his Bachelor of Business Administration in Accounting from Hong Kong
71
University of Science & Technology, and an MBA from the University of Chicago. Cheung is also a Certified Public Accountant.
Richard Tajer has served as President of Global Electrical Systems (with a title change from Senior Vice President to President) since January 2019. He also served as Chief Commercial Officer from 2021 to 2023 in addition to his role as President of Global Electrical Systems. Prior to joining CVG, Mr. Tajer spent 20 years with Yazaki North America, where he served most recently as Executive Vice President of Electronics, Instrumentation and Components with P&L responsibility for nine manufacturing facilities and $1 billion in sales. Prior to Yazaki, Mr. Tajer obtained relevant commercial and engineering experience from Alcoa Fujikura and United Technologies. Mr. Tajer is a graduate of the University of Michigan with a Bachelor of Science in Electrical and Computer Engineering. He also holds a Master of Business Administration from Wayne State University. He is an active member of SAE International, the International Institute of Connector and Interconnector Technology, and the MENTTIUM corporate mentoring program.
Aneezal H. Mohamed has served as Chief Legal Officer (with a title change from General Counsel), Compliance Officer and Secretary since February 2016 and prior to that, held positions of increasing responsibility since joining the company in November 2013. Mr. Mohamed was of counsel with Kegler Brown Hill & Ritter and served in several capacities at Cardinal Health, including Senior Counsel, Vice President & Associate General Counsel and Assistant General Counsel. Prior to that, Mr. Mohamed was in-house counsel to CMS Energy Corporation. Mr. Mohamed graduated from Cooley Law School at Western Michigan University with a Juris Doctorate in 1997. He has his Bachelor’s in Political Science and Economics from Towson State University, and he is licensed to practice law in Ohio and Michigan. He was formerly Chairman of the Board of Directors and is a current Board member of the Columbus Council on World Affairs and is a member of the Board of Directors of the Ohio Chamber of Commerce.
Kristin Mathers has served as Chief Human Resources Officer since September 2021. Prior to CVG, Ms. Mathers worked for Baker Hughes and its legacy parent, GE, since 2000. Ms. Mathers was Vice President of Talent Management at Baker Hughes and she held other positions of increasing responsibility such as Vice President of HR Transformation and other leadership positions in the HR function prior to those roles. Within GE, Ms. Mathers took on many broad experiences, across many businesses, including HR leadership assignments in GE’s transportation business, appliance business, lighting business and corporate headquarters. Ms. Mathers holds a Bachelor of Science in Mathematics with a specialization in Actuary Science from Slippery Rock University in Pennsylvania and an MBA from the University of Phoenix.
There are no family relationships between any of our directors or executive officers.
C.Section 16(a) Beneficial Ownership Reporting Compliance and Corporate Governance
The information required by Item 10 with respect to compliance with reporting requirements is incorporated herein by reference to the sections labeled “Section 16(a) Beneficial Ownership Reporting Compliance” and “Proposal No. 1 - Election of Directors - Corporate Governance,” which appear in CVG’s 2024 Proxy Statement.
Item 11.Executive Compensation
The information required by Item 11 is incorporated herein by reference to the sections labeled “Executive Compensation - 2022 Director Compensation Table”, “Executive Compensation”, "Pay Versus Performance" and “Proposal No. 1 - Election of Directors - Corporate Governance,” which appear in CVG’s 2024 Proxy Statement, including information under the heading “Compensation Discussion and Analysis.”
72
Item 12.Security Ownership of Certain Beneficial Owners and Management and Related Stockholder Matters
There are no outstanding options, warrants or rights associated with the Company's Equity Incentive Plans. The following table summarizes the number of securities remaining to be issued under the outstanding equity compensation plan as of December 31, 2023:
| Number of Securities to be Issued upon Exercise of Outstanding Options, Warrants and Rights | Weighted-average Exercise Price of Outstanding Options, Warrants and Rights | Number of Securities Remaining Available for Future Issuance Under Equity Compensation Plans | |||||||||||||||
| 2020 Equity Incentive Plan approved by security holders | — | $ | — | 2,012,213 | |||||||||||||
The information required by Item 12 is incorporated herein by reference to the section labeled “Security Ownership of Certain Beneficial Owners and Management,” which appears in CVG’s 2024 Proxy Statement.
Item 13 Certain Relationships, Related Transactions and Director Independence
The information required by Item 13 is incorporated herein by reference to the sections labeled “Certain Relationships and Related Transactions” and “Proposal No. 1 - Election of Directors - Corporate Governance,” which appear in CVG’s 2024 Proxy Statement.
Item 14.Principal Accountant Fees and Services
Our independent registered public accounting firm is KPMG LLP, Columbus, OH, Auditor Firm ID: 185
The information required by Item 14 is incorporated herein by reference to the section labeled “Independent Auditor Fees” which appears in CVG’s 2024 Proxy Statement.
73
PART IV
Item 15.Exhibits
LIST OF EXHIBITS
The following exhibits are either included in this report or incorporated herein by reference as indicated below:
74
EXHIBIT INDEX
| Exhibit No. | Description | |||||||
| Amended and Restated Certificate of Incorporation of the Company (incorporated by reference to the Company’s quarterly report on Form 10-Q (File No. 000-50890), filed on September 17, 2004). | ||||||||
| Certificate of Amendment to the Amended and Restated Certificate of Incorporation of the Company, dated as of May 12, 2011 (incorporated by reference to the Company’s current report on Form 8-K (File No. 001-34365), filed on May 13, 2011). | ||||||||
| Certificate of Amendment to the Amended and Restated Certificate of Incorporation of the Company, dated as of May 15, 2015 (incorporated by reference to the Company’s current report on Form 8-K (File No. 001-34365), filed on May 15, 2015). | ||||||||
| Certificate of Amendment to the Amended and Restated Certificate of Incorporation of the Company, dated as of May 17, 2018 (incorporated by reference to the Company’s current report on Form 8-K (File No. 001-34365), filed on May 18, 2018). | ||||||||
| Certificate of Designations of Series A Preferred Stock (included as Exhibit A to the Rights Agreement incorporated by reference to Exhibit 4.8) (incorporated by reference to the Company’s current report on Form 8-K (File No. 000-50890), filed on May 22, 2009. | ||||||||
Certificate of Designations, Preferences and Rights of Series B Junior Participating Preferred Stock (incorporated by reference to the Company’s Current Report (File No. 001-34365), filed on June 25, 2020). | ||||||||
| Amended and Restated By-Laws of the Company (incorporated by reference to Exhibit 3.1 to the Company’s Current Report on Form 8-K/A (File No. 001-34365), filed on February 2, 2023). | ||||||||
Description of Securities (incorporated by reference to the Company’s annual report on Form 10-K (File No. 001-34365), filed on March 16, 2020). | ||||||||
75
| Exhibit No. | Description | |||||||
| Term Loan Agreement, dated as of April 30, 2021, between, among others, the Company, Bank of America, N.A. as administrative agent and other lenders party thereto (incorporated by reference to Exhibit 10.1 to the Company’s current report on Form 8-K (File No. 001-34365), filed on May 4, 2021). | ||||||||
| Second Amendment dated May 12, 2022 to the Credit Agreement, dated as of April 30, 2021 between, among others, the Company, Bank of America, N.A. as administrative agent and other lenders party thereto (incorporated by reference to Exhibit 10.38 to the Company’s annual report on Form 10-K, filed on March 6, 2023). | ||||||||
| Commercial Vehicle Group, Inc. Annual Incentive Plan (incorporated by reference to the Company’s current report on Form 8-K (File No. 001-34365), filed on March 14, 2018). | ||||||||
| Amended and Restated Deferred Compensation Plan dated November 5, 2008 (incorporated by reference to the Company’s annual report on Form 10-K (File No. 000-50890), filed on March 16, 2009). | ||||||||
| Form of indemnification agreement with directors and executive officers (incorporated by reference to the Company’s annual report on Form 10-K (File No. 000-50890), filed on March 14, 2008). | ||||||||
| Offer letter, dated March 23, 2020, to Harold Bevis (incorporated by reference to Exhibit 10.1 to the Company’s current report on Form 8-K (File No. 001-34365), filed on March 26, 2020). | ||||||||
| Employment Agreement between Harold C. Bevis and Commercial Vehicle Group, Inc. dated as of September 9, 2020 (incorporated by reference to Exhibit 10.1 to the Company’s current report on Form 8-K (File No. 001-34365), filed on September 11, 2020). | ||||||||
| Offer letter, dated November 11, 2020, to Angela O’Leary (incorporated by reference to Exhibit 10.1 to the Company’s current report on Form 8-K (File No. 001-34365), filed on November 17, 2020). | ||||||||
| Change in Control & Non-Competition Agreement dated November 11, 2020 with Angela O’Leary (incorporated by reference to Exhibit 10.29 to the Company’s annual report on Form 10-K (File No. 001-34365), filed on March 9, 2021). | ||||||||
| Change in Control & Non-Competition Agreement dated October 27, 2014 with Aneezal Mohamed (incorporated by reference to Exhibit 10.34 to the Company’s annual report on Form 10-K (File No. 001-34365), filed on March 2, 2022). | ||||||||
| Change in Control & Non-Competition Agreement dated January 28, 2020 with Richard Tajer (incorporated by reference to Exhibit 10.35 to the Company’s annual report on Form 10-K (File No. 001-34365), filed on March 2, 2022). | ||||||||
| Offer letter, dated July 22, 2021, to Kristin Mathers (incorporated by reference to Exhibit 10.36 to the Company’s annual report on Form 10-K (File No. 001-34365), filed on March 2, 2022). | ||||||||
| Change in Control & Non-Competition Agreement dated December 31, 2021 with Kristin Mathers (incorporated by reference to Exhibit 10.37 to the Company’s annual report on Form 10-K (File No. 001-34365), filed on March 2, 2022). | ||||||||
| Andy Cheung Offer Letter dated September 8, 2022(incorporated by reference to Exhibit 10.1 to the Company’s current report on Form 8-K (File No. 001-34365), filed on September 14, 2022). | ||||||||
| Change in Control & Non-Competition Agreement dated December 7, 2022 with Andy Cheung. | ||||||||
| Offer Letter between the Company and Mr. Ray dated December 8, 2023 (incorporated by reference to Exhibit 10.1 to the Company’s current report on Form 8-K filed on December 11, 2023). | ||||||||
| Form of Change in Control Agreement between the Company and Mr. Ray (incorporated by reference to Exhibit 10.2 to the Company’s current report on Form 8-K filed on December 11, 2023). | ||||||||
| Form of 2023 Restricted Stock Agreement between the Company and Mr. Ray (incorporated by reference to Exhibit 10.3 to the Company’s current report on Form 8-K filed on December 11, 2023). | ||||||||
| Commercial Vehicle Group Incentive Compensation Clawback Policy approved December 1, 2023. | ||||||||
76
| Exhibit No. | Description | |||||||
| Subsidiaries of Commercial Vehicle Group, Inc. | ||||||||
| Consent of KPMG LLP. | ||||||||
| 302 Certification by James R. Ray, President and Chief Executive Officer. | ||||||||
| 302 Certification by Andy Cheung, Executive Vice President and Chief Financial Officer. | ||||||||
| 906 Certification by James R. Ray pursuant to 18 U.S.C. Section 1350, as adopted pursuant to the Sarbanes-Oxley Act of 2002. | ||||||||
| 906 Certification by Andy Cheung pursuant to 18 U.S.C. Section 1350, as adopted pursuant to the Sarbanes-Oxley Act of 2002. | ||||||||
| 101.INS | XBRL Instance Document | |||||||
| 101.SCH | XBRL Schema Document | |||||||
| 101.CAL | XBRL Calculation Linkbase Document | |||||||
| 101.LAB | XBRL Label Linkbase Document | |||||||
| 101.PRE | XBRL Presentation Linkbase Document | |||||||
| 101.DEF | XBRL Definition Linkbase Document | |||||||
| * | Management contract or compensatory plan or arrangement required to be filed as an exhibit to this annual report on Form 10-K. | ||||
All other items included in an Annual Report on Form 10-K are omitted because they are not applicable or the answers thereto are none.
Item 16.Form 10-K Summary
Not applicable.
77
SIGNATURES
Pursuant to the requirements of Section 13 of the Securities Exchange Act of 1934, the Registrant has duly caused this report to be signed on its behalf by the undersigned, thereunto duly authorized.
| COMMERCIAL VEHICLE GROUP, INC. | |||||
| By: | /s/ James R. Ray | ||||
| James R. Ray | |||||
| President and Chief Executive Officer | |||||
Date: March 14, 2024
Pursuant to the requirements of the Securities Act of 1934, this report has been signed below by the following persons on behalf of the Registrant and in the capacities indicated on March 14, 2024.
| Signature | Title | |||||||
/s/ Robert C. Griffin | Chairman and Director | |||||||
| Robert C. Griffin | ||||||||
/s/ James R. Ray | President, Chief Executive Officer | |||||||
| James R. Ray | (Principal Executive Officer) and Director | |||||||
/s/ Roger L. Fix | Director | |||||||
| Roger L. Fix | ||||||||
/s/ Wayne M. Rancourt | Director | |||||||
| Wayne M. Rancourt | ||||||||
/s/ J. Michael Nauman | Director | |||||||
| J. Michael Nauman | ||||||||
/s/ William C. Johnson | Director | |||||||
| William C. Johnson | ||||||||
/s/ Ruth Gratzke | Director | |||||||
| Ruth Gratzke | ||||||||
/s/ Melanie K. Cook | Director | |||||||
| Melanie K. Cook | ||||||||
/s/ Andy Cheung | Chief Financial Officer | |||||||
| Chung Kin Cheung ("Andy Cheung") | (Principal Financial Officer) | |||||||
/s/ Angela M. O'Leary | Chief Accounting Officer | |||||||
| Angela M. O'Leary | (Principal Accounting Officer) | |||||||
78